i Farmers' Management of Rice Genetic Diversity: A study on enhancing red rices in Bohol, Philippines A thesis submitted in partial fulfillment of the degree of Master of Science in Crop Science Submitted by Arma Raguindin Bertuso January 2000 Wageningen University The Netherlands Supervisors: Prof. Dr. Piet Stam Department of Plant Breeding Dr. Lisa M. Leimar Price Department of Gender Studies

Welcome message from author
This document is posted to help you gain knowledge. Please leave a comment to let me know what you think about it! Share it to your friends and learn new things together.
Transcript
i
Farmers' Management of Rice Genetic Diversity:A study on enhancing red rices in Bohol, Philippines
A thesissubmitted in partial fulfillment of the
degree of Master of Science in Crop Science
Submitted byArma Raguindin Bertuso
January 2000Wageningen University
The Netherlands
Supervisors:Prof. Dr. Piet Stam
Department of Plant Breeding
Dr. Lisa M. Leimar PriceDepartment of Gender Studies
ii
ACKNOWLEDGEMENT
This work will not be made possible without the help of various peopleand organizations who provided support in different ways. I would liketo express my sincerest gratitude to the following:
To the men and women farmers of Campagao, Bohol, especially to the21 family-respondents, for their hospitality and patience in furnishingthe information;
To the farmers of Barangay Villarcayo, Bantolinao, Poblacion Vieja,Kauswagan and Campagao who willingly provided the seeds of the ricevarieties;
To the Netherlands Fellowship Programme, the CommunityBiodiversity Development and Conservation (CBDC) programme thruthe Center for Genetic Resources (CGN) and the Development Fund ofNorway for the financial support;
To Prof. Dr. Piet Stam of the Plant Breeding Department of theWageningen University for his supervision, understanding andvaluable comments all throughout the study;
To Dr. Lisa Price of the Gender Studies Department of the WageningenUniversity for her valuable insights, critical review and encouragementfrom the start until the end of the research;
To Mrs. Teresita Borromeo who supervised the work during the datacollection, provided seeds of modern rice varieties and gave valuablesuggestions to improve the research;
To Dr. Rob van Treuren of the CGN for his patience and guidance inthe conduct of the molecular analysis;
To the staff of the CBDC-Bohol programme for allowing me to work intheir project site while generously assisting in the preparatory anddata collection phase;
To the staff and board members of the Southeast Asia RegionalInstitute for Community Education (SEARICE) for granting the studyleave;
To the staff and guest workers of the CGN for their assistance andfriendliness all through out my stay in the Netherlands;
To Dr. Fred van Eeuwijk for his help even at short notices in thestatistical analysis of the data;

iii
To Vicky Pailanan who patiently and enthusiastically worked with meduring the data collection;
To the officials of the Municipality of Bilar through their Mayor, Hon.Ester Galbreath and the Community of Campagao through theirBarangay Captain, Mr. Adelo Calamba for allowing me to conduct theresearch in the area;
To Roberto and Gertrudes Remedio for welcoming me to their homeduring the data collection;
To Cesinio and Reynilda Salces for allowing me to use their rice fieldfor the experiment and to rest at their house after hours of work in thefield;
To all my friends back home (too many to mention) for their unendingpatience in sending e-mails and writing snail mails that helped meovercome loneliness of being away from home;
To my Dutch friends who made my stay in Wageningen pleasant andmemorable, especially Hennie and Niek Janssen and the residence ofWolfswaard for warmly welcoming me into their home;
To my corridor mates at Haarweg 111 during the course work andRijnsteeg 5c during the last four months for their camaraderie;
To my co-students who shared the ups and downs of working for MScdegree especially to Amina, Corrie and Marla for the tea time sharingof stories and grievances;
To Bec and Betty for their company in Wageningen, moral support andprayers in times of uncertainty;
To my Filipino friends in Wageningen for their friendship andcompanionship;
To my parents, sisters Ging and Armie, and brothers Kuya Arnor andArnel for their understanding, support, prayers and faith that inspiredme to make it all the way.

iv
ABSTRACT
The study was conducted in an irrigated rice farming communityin Bohol, Philippines. The research studied the enhancement of redrices and the selection criteria and selection methods that were usedby the Boholano farmers. Moreover, the influence of gender and socio-economic status on farming families on rice production management,seed management, various selection criteria and methods wasdocumented. The information on the social aspect of the study weregathered using several research tools such as semi-structuredinterviews, focus group discussions, freelisting and time allocationstudy. Four red rice selections (RC 18selection, 66 puwa, 77 puwaand 36 puwa) were enhanced by from four modern varieties (RC 18, IR66, RC 10 and IR 36), respectively. These eight varieties werecharacterized through agro-morphological descriptions by farmers,standard descriptors by the researcher, and molecular analysis (AFLP).In general, results showed varying degrees of similarity between thefarmers’ selections and modern varieties. There was also high geneticvariation among the farmer’s varieties compared to the modernvarieties as shown by the molecular data. This indicated the possibilityof introgression between local varieties with red pericarp and themodern varieties which resulted to offtypes that farmers selected anddeveloped as new strains. Gender and socio-economic factors wereimportant consideration in management of diversity because of thevarying tasks, roles, needs and responsibilities of farmers. Selectioncriteria and selection methods were not greatly influenced by genderand socio-economic factors.

v
TABLE OF CONTENTS
1 INTRODUCTION 1
1.1 Background of the study 1
1.2 Research questions and objectives 3 1.2.1 Research questions 3 1.2.2 Research objectives 4 1.2.2.1 Meta objective 4 1.2.2.2 Specific objectives 4
1.3 Significance of the study 5
1.4 Limitations of the study 5
1.5 Organization of the paper 6
2 REVIEW OF LITERATURE 8
2.1 Farmers role in genetic diversity management 8
2.2 Gender and local crop development 10
2.3 Influence of farmers socio-economic status on local crop development 12
2.4 Relationship between gender, socio-economic status and farmers’ management of genetic diversity 14
3 RESEARCH METHODOLOGY 17
3.1 Research approach 17 3.1.1 Preparatory phase 18 3.1.2 Research phase 19 3.1.3 Post-research phase 19
3.2 Methodology 20 3.2.1 Sampling 20 3.2.2 Research tools 21 3.2.3 Field experimentation 25 3.2.4 Molecular analysis 26

vi
3.3 Data analysis 28 3.3.1 Qualitative analysis 28 3.3.2 Quantitative analysis 29
4 RESEARCH AREA AND RESPONDENTS 31
4.1 The country profile 31 4.1.1 Geographical location and topography 31 4.1.2 Climate 31 4.1.3 Population 33 4.1.4 Socio-economic status 33 4.1.5 Agricultural situation 33 4.1.6 Gender roles 35
4.2. The province of Bohol 36 4.2.1 Location and topography 36 4.2.2 Climate 36 4.2.3 Population 37 4.2.4 Agricultural situation 37 4.2.5 Socio-economic status 38
4.2 The community of Campagao, Bilar 38 4.3.1 Location and topography 38 4.3.2 Demography data 38 4.3.3 Social structure 39
4.3 Respondents profile 414.4.1 Basic information 41
4.4.2 Household information 43 4.4.3 Land ownership 44
5 RESULTS AND DISCUSSION 45
5.1 Farming system and genetic diversity 45 5.1.1 Crops and varieties 45 5.1.2 Rice production and management 47
5.2 Gender relations and local crop development 54 5.2.1 Gender and rice varieties 54 5.2.2 Gender and division of labor and tasks 60 5.2.2.1 Crop production and management 60 5.2.2.2 Seed management 65 5.2.3 Gender and decision-making 67 5.2.3.1 Crop production and management 67 5.2.3.2 Seed management 68

vii
5.3 Socio-economic status influence in crop management and development 71 5.3.1 Socio-economic status, resources and rice varieties 71
5.3.2 Influence of socio-economic status to crop production and management 71 5.3.3 Influence of socio-economic status on seed
management 77
5.4 Seed selection criteria and methods used by Boholano farmers 79 5.4.1 Farmer’s seed selection criteria 79
5.4.2 Farmer’s selection methods 88
5.5 Red rice diversity and the Boholano farmers 91 5.5.1 An overview of the importance of red rice and its diversity 91 5.5.1.1 Characterization data from farmers 92
5.5.1.2 Characterization data from researcher 94 5.5.1.3 Molecular data 96
5.5.2 Farmers knowledge and skills in enhancing red rices : three cases of farmer-selectors 104 5.5.2.1 Mang Bernardo 104 5.5.2.2 Mang Cesinio 105 5.5.2.3 Mang Margarito 106
5.6 Establishing the link between farmers’ management of genetic diversity, gender and socio-economic status 108
6 CONCLUSION AND RECOMMENDATIONS 113
REFERENCES 115

viii
List of Tables
Table 1. The respondent’s personal characteristics 41
Table 2. Sources of income of the respondents 43
Table 3. Household information 44
Table 4. Information on respondents agricultural land ownership 44
Table 5. List of crops and varieties planted by the respondents 46
Table 6. Number of varieties known and identified by men and women farmers during the focus group discussion 54
Table 7. Free-list salience index test results indicating the order and frequency of mention of rice varieties by women respondents 56
Table 8. Free-list salience index test results indicating the order and frequency of mention of rice varieties by men respondents 58
Table 9. Gender differentiated tasks in rice production and management according to 15 male respondents
during focus group discussion 62
Table 10. Gender differentiated tasks in rice production and management according to 17 female respondents
during focus group discussion 63
Table 11. Perception of men and women farmers on the percent labor contribution of household member and hired laborers in rice production and management 64
Table 12. Results of the focus group discussion on who was responsible in seed management among male and female farmers 66
Table 13. Perception of men and women farmers on who decided on what variety to plant 68
Table 14. Perception of men and women farmers on whodecided where to select the seeds from individualsemi-structured interviews 69
Table 15. Results of the focus group discussion on who decided in seed management among men and women farmers 69
Table 16. Number of varieties known and identified by the three socio-economic groups 71
Table 17. Gender differentiated tasks in rice production and management according to 8 low socio-economic group respondents during focus group discussion 73
ix
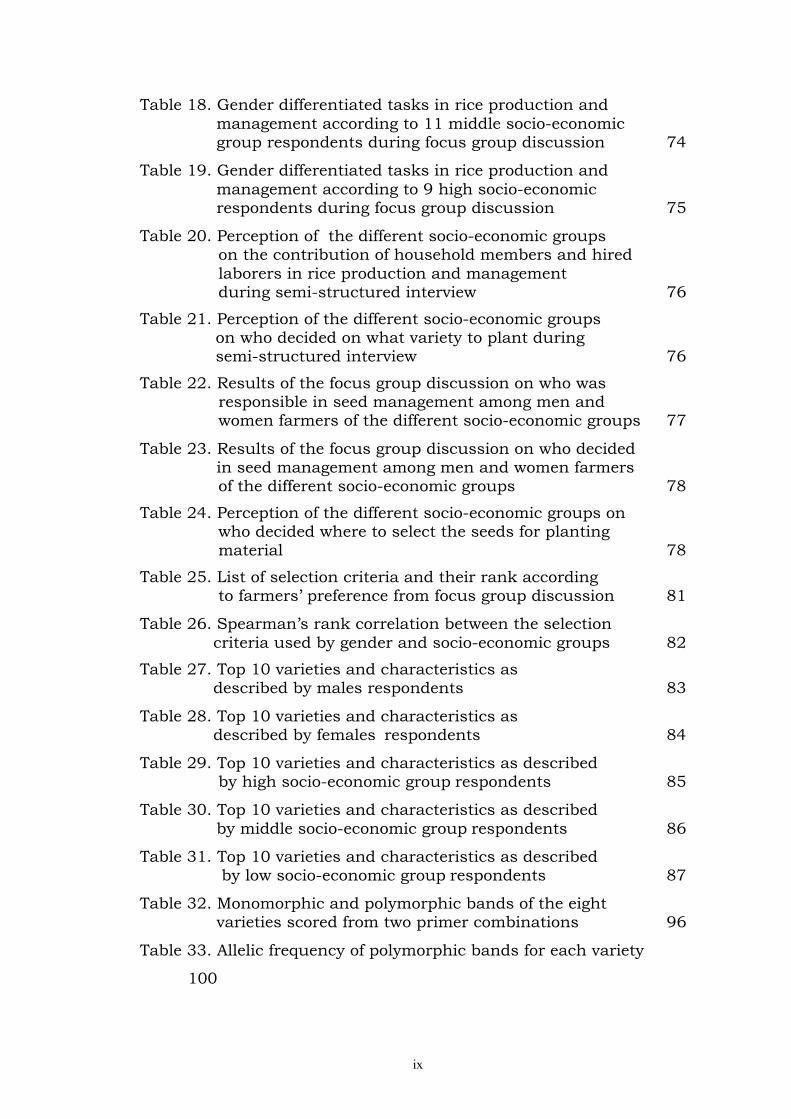
Table 18. Gender differentiated tasks in rice production and management according to 11 middle socio-economic group respondents during focus group discussion 74
Table 19. Gender differentiated tasks in rice production and management according to 9 high socio-economic respondents during focus group discussion 75
Table 20. Perception of the different socio-economic groups on the contribution of household members and hired
laborers in rice production and management during semi-structured interview 76
Table 21. Perception of the different socio-economic groupson who decided on what variety to plant duringsemi-structured interview 76
Table 22. Results of the focus group discussion on who was responsible in seed management among men and women farmers of the different socio-economic groups 77
Table 23. Results of the focus group discussion on who decided in seed management among men and women farmers
of the different socio-economic groups 78
Table 24. Perception of the different socio-economic groups on who decided where to select the seeds for planting
material 78
Table 25. List of selection criteria and their rank according to farmers’ preference from focus group discussion 81
Table 26. Spearman’s rank correlation between the selection criteria used by gender and socio-economic groups 82
Table 27. Top 10 varieties and characteristics as described by males respondents 83
Table 28. Top 10 varieties and characteristics as described by females respondents 84
Table 29. Top 10 varieties and characteristics as described by high socio-economic group respondents 85
Table 30. Top 10 varieties and characteristics as described by middle socio-economic group respondents 86
Table 31. Top 10 varieties and characteristics as described by low socio-economic group respondents 87
Table 32. Monomorphic and polymorphic bands of the eight varieties scored from two primer combinations 96
Table 33. Allelic frequency of polymorphic bands for each variety
100
x
Table 34. Correlation matrix of the three characterization data sets of male and female farmers, researcher and molecular analysis 101
Table 35. Characterization of IR 36 and 36 puwa according to Mang Bernardo during the semi-structured interview104
Table 36. Characterization of RC 18 and RC 18 selection by Mang Cesinio during the semi-structured interview 105
Table 37. Characterization of IR 66 and 66 puwa by Mang Margarito during the semi-structured interview 106
xi
List of Figures
Figure 1. The conceptual framework 16
Figure 2. The research approach 17
Figure 3. Map of the Philippines showing the research site 32
Figure 4. The resource map of the community according to the people of Campagao 40
Figure 5. The seasonal calendar prepared by farmers of Campagao during the PRA 50
Figure 6. Time allocated to rice production work per growing season according to 6 men and 6 women respondents 64
Figure 7. Time allocated to household work per day according to 6 men and 6 women respondents 65
Figure 8. Time allocated to seed management per growing season according to 6 men and 6 women respondents 67
Figure 9. Principal coordinate analysis scatter diagram for the 8 rice varieties using the agro-morphological characterization of male and female farmers 92
Figure 10. Cluster analysis depicting the eight varieties using the male and female farmer’s characterization data set 93
Figure 11. Principal coordinate analysis of the agro-morphological characterization of rice varieties using standard descriptors 94
Figure 12. Cluster analysis depicting the eight varieties using the standard descriptors’ list for rice characterization 95
Figure 13. Principal coordinate analysis of the eight rice varieties using the molecular data set 97
Figure 14. Cluster analysis depicting the molecular characterization of the eight varieties 98
Figure 15. Cluster analysis showing the level of variation between the nine individuals from each farmers’ selection and modern variety 99
xii
List of Photos
Photo 1. Plowing the rice field using a carabao during land Preparation 52
Photo 2. Growing of rice seedling using the “wetbed” method 52
Photo 3. Transplanting of rice 53
Photo 4. Foot-pedal manual thresher commonly used in the community 53
Photo 5. Woman raking rice seeds to dry evenly 70
Photo 6. Woman respondent showing the different panicles selected from their rice fields 70
Photo 7. The four red rice and their original variety used in the study 103
Photo 8. The farmer-selector of RC 18 selection in his rice field trial
107
Photo 9. Different rice panicles rogue off from several rice plants hanging in the kitchen waiting for planting in the next season and probably will become one of the new varieties in the community 107

xiii
Appendices
Appendix 1. Profile of the respondents sample form 122
Appendix 2. Guide questions for semi-structured interview 123
Appendix 3. Profile of the farmer selector and farmers’ selections (varieties) 125
Appendix 4. Time allocation study sample form 127
Appendix 5. List of farmer’s selection criteria 128
Appendix 6. Measurements of the agro-morphological characters based on the Standard Evaluation System for rice 129
Appendix 7. Characterization data of farmers 134
Appendix 8. Characterization data of researcher 135
1
1 INTRODUCTION
1.1 Background of the study
The wealth of plant genetic resources today is a product ofdomestication from the wild by natural and human selections. Thematerials utilized for crop development to feed humanity weredeveloped by farmers over thousands of years. In farmingcommunities, these crops and varieties exist as part of the dynamicprocess of cultivation to continually adapt to the changingenvironment and farmers’ needs. Varieties are being produced andreplaced by farmers from one season to another when varietalperformance declines. This is the dynamic conservation andutilization of plant genetic resources which is part of local cropdevelopment. De Boef et al. (1993) defined local crop development asthe continuous and dynamic process of maintenance, developmentand adaptation of germplasm to the environment, local agro-ecologicalproduction conditions, and specific household needs related to socialdifferentiation, gender and ethnicity.
Farmers’ selection concerns are not homogenous, and may varywith the different agro-ecological, socio-economic and culturalconditions they face. Rich and poor farmers in a productive regionprobably have very different concerns. Likewise, two poor farmers in amarginal area may differ in perspectives. Even in a farming household,there may not be similarities in male and female concerns (Bellon etal., 1997).
In all societies, men and women are assigned tasks, activities andresponsibilities according to their sex. The gender division of laborvaries from one society and culture to another, and changes withexternal circumstances within each culture and over time (March etal., 1999). This, therefore, results in different needs and preferences ofmen and women. In crop production, men and women have differentresponsibilities and tasks. Men are involved in land preparation whilewomen are in-charge of weeding, harvesting, and seed management.These concerns must be considered in technology development.

2
The Philippines, a country where rice is a staple food crop, hadapproximately 3500 traditional varieties prior to the Green Revolutionera. In the early 1970’s, Masagana 991 program was launched toencourage adoption of new high-yielding rice varieties to increase riceproduction. By 1975, more than 500,000 farmers participated in theprogram. In so doing, the program caused a shift in the use of varietiesso that most traditional varieties and landraces were replaced infarmer’s fields. The advent of this program contributed to thedisappearance and displacement of traditional varieties and landracesin farmers field. According to the Philippines Bureau of AgriculturalEconomics, 89 percent of irrigated rice land and 77 percent of rainfedwetland rice area in 1979-80 were planted to modern varieties (Herdtand Capule, 1983). As of 1986, the country’s irrigated rice fields wereplanted to only five to six sister lines of modern varieties of ricereleased by the Philippine Seed Board (Borromeo and Hernandez,1987). Farmers’ access to genetic resources became limited with theloss of these materials. They have to rely on whatever materials areavailable within the area and in nearby communities. However, thisscenario induced farmers to enhance and develop such materials tocontinually adapt to their changing environment, needs andpreferences. As a result, farmers’ fields are now rich with varietiesthat are produced from modern and traditional varieties through time.These are called “farmers selections”, varieties that are improved fromother varieties and with one or two favorable characteristics. Thesechanges in rice varieties in farmers field in Bohol, Philippines is thesubject of the research presented in this study.
Bohol was selected as a research site because of its crop diversityand the variability of its agro-ecosystems. But in particular, a previousstudy indicated that farmers were engaged in the enhancement anddevelopment of rice varieties with red pericarp. A survey of theCommunity Biodiversity Development and Conservation (CBDC)programme in 1995 identified a number of farmers’ selection of ricewith red seed coat (CBDC, 1999a). Further inquiry revealed that thesefarmers’ varieties were selected from the modern and traditionalvarieties that are cultivated in the area. The reason for such preferenceis that red rices provide suppression of hunger and higher marketprices. These two are examples of the criteria used by farmers in 1 The Masagana 99 program is the term used to refer to the Green Revolution program.
3
selecting and developing their rice varieties. This case showed thatlocal crop development existed in farming communities.
Farmers have a role in maintaining, developing and adaptingvarieties to the local environment and their specific needs. In view ofthese, this research explored the local crop development in a ricefarming community in Bohol to understand farmers selection criteriaand the selection methods used to develop red pericarp varieties, andto disaggregate such information by gender and socio-economicdifferences.
1.2 Research questions and objectives
1.2.1 Research questions
The interest in local crop development is increasing. There areseveral studies aimed at documenting and understanding farmers’contribution in conservation, development and management of theseresources (Dennis, 1987; Bellon, 1991; Bellon and Brush, 1994;Brush, 1995). But in spite of this, there is still limited knowledgeabout what this approach means, and even less understanding of itsvarious social, economic, cultural and genetic aspects (Bellon et al1997). The research therefore addresses this problem. The majorquestions posed by this study are as follows:
1. What are the tasks, labor division and decision making roles in riceproduction and management of Boholano farmers? Do gender andsocio-economic status influence these?
2. What are the seed management practices of farmers and do theycontribute to the genetic diversity of red rices? Are these practicesinfluenced by gender and socio-economic differences?
3. Do farmers have their own selection criteria and methods toimprove and maintain their varieties? What are these selectioncriteria and methods used by farmers? Do gender and socio-economic differences affect the criteria and methods applied?
4. How do the selection criteria and methods influence farmer’simprovement of varieties? Do the red pericarp varieties among ricefarmers in Bohol indicate farmers’ knowledge and skills indeveloping and enhancing varieties? And do these contribute togenetic diversity?
4
1.2.2 Research objectives
1.2.2.1 Meta objective
The general objective is to study and understand local cropdevelopment among rice farmers in Bohol, Philippines with a focus onthe farmers’ role in selecting and enhancing red pericarp varieties, andthe influence of gender and socio-economic status factors on farmersselection criteria and methods.
1.2.2.2 Specific objectives
1. To describe the tasks, labor division and decision making roles inrice production and management by gender and socio-economicdifferences.
2. To identify the rice varieties known by men and women farmers.3. To document the selection criteria and methods used by male and
female farmers.4. To document the selection criteria and methods used by socio-
economic grouping of farmers.5. To document the seed management practices of rice farmers.6. To verify the similarities and differences among farmers' selected
varieties and the original varieties based on agro-morphological andgenetic characterization.
7. To determine the process of selection and enhancement of the fourred rice varieties studied in the research.

5
1.3 Significance of the study
This research documents the local development of rice varietiesamong the farmers in the province of Bohol, Philippines. It alsoexamines the process of improvement and adaptation of red pericarpvarieties and the influence of gender and socio-economic differences oncrop development. Specifically, it studied farmers’ selection methodand criteria to improve and maintain varieties. Furthermore, theresearch examined whether gender and socio-economic differencesamong farmers influence their selection criteria and selection methods.
The study contributes to the understanding of how farmers’knowledge and skills can maintain, enhance and develop geneticresources that are adapted to local conditions and specific needs. Thedocumentation of how Boholano farmers contribute to theenhancement of red rice varieties provides valuable insights on theeffect of farmers’ selection pressure to increase genetic variation.
In addition, the research results contribute to the increasingdiscussion of on-farm conservation and management of rice diversity,and an understanding of farmers’ concerns and skills to appropriatelydesign a scientist and farmer collaboration in breeding and on-farmconservation programs.
1.4 Limitations of the study
The sample size of the study is limited to one community given thetime allotted for fieldwork (three months). Therefore, the conclusion ofthe study is particularly based on the experiences of farmers in thestudy site and may greatly vary with other communities within theprovince and in other parts of the country.
The study prefers the term “socio-economic” rather than economicgroupings because indigenous concepts of wealth categories were usedrather than an external classification of wealth (i.e. income andassets). The socio-economic group was determined based on the locallydefined concept of the people in the community. These criteria are thesufficiency of rice harvest to support the family’s need for food andhousehold expenses for the whole year, capacity of the family toprovide education to their children and other sources of income to

6
augment their rice harvest. Therefore, the parameters of the socio-economic status used in this study are statistically difficult to analyze.
The study focussed only on four farmers’ selections and theiroriginal varieties. It was originally planned to include more varietiesderived from both traditional and modern varieties. However, I decidedto use four varieties given the time and scope of the study.
1.5 Organization of the paper
This section outlines how the result of the research was presentedin the whole paper. It is organized in seven chapters. Chapter onepresents the introduction of the study which includes a briefbackground of the research and its significance, organization of thepaper and limitations encountered during the study. It also includesthe research questions and research objectives that guided the study.The research questions are posed based on the seven specific researchobjectives addressed during the study. Chapter two provides a reviewof literature discussing farmers role in genetic diversity management,the importance of gender in local crop development and the influenceof farmers socio-economic status of local crop development.Furthermore, this chapter presents the conceptual framework of thewhole research. In Chapter three the research design and methodologyare presented. This section elaborates the research process andmethods and the means of data analysis. Moreover, the sectionexplains the local definition of socio-economic status according to thecommunity people that is used in this study. Chapter four presentsthe information about the research site at the national, town andcommunity level. Additionally, the information on the respondentsinterviewed during the study is described in this section.
Chapter five discusses the results with focus on the sevenresearch objectives that are addressed by the study. The section isdivided into six sub-sections. These are (1) rice farming systems andgenetic diversity to briefly provide an understanding of the crops andvarieties utilized by farmers, and their crop production andmanagement practices in the community, (2) gender relations in cropmanagement and development to present, the influence of genderdifferences on knowledge in rice varieties, division of labor and tasks
7
and decision making in crop production and management and seedmanagement practices, (3) socio-economic influences in cropmanagement and crop development with a discussion on how varioussocio-economic status affected the know-how on rice varieties, cropproduction and management, and seed management of a community,(4) selection criteria and selection methods used by the Boholanofarmers to know the influence of gender and socio-economic status totheir selection criteria and methods and to present the cases of threefarmers who selected and enhanced the rice varieties used in theresearch, (5) red rice diversity analysis to show the importance of redrices and how farmers have contributed to the diversity, and (6)discussion of the link between farmers’ management of geneticdiversity, gender and socio-economic status.
Chapter six presents the conclusion of the paper based on theissues raised by the research. Recommendations were also presentedtowards the end of this chapter.

8
2 REVIEW OF LITERATURE
As defined earlier, local crop development encompasses thecontinuous and dynamic process of maintenance, development andadaptation of germplasm to the environment, local agro-ecologicalproduction conditions and specific household needs related to socialdifferentiation, gender and ethnicity (de Boef et al., 1993). Farmers’strategies for local crop development also involved and combinedbreeding, seed supply and conservation of genetic resources.
2 3 2.1 Farmers role in genetic diversity management
Several studies recognize farmers’ role in the management ofdiversity (Conklin, 1957; Dove, 1985; Dennis, 1987; Fujisaka et al.,1993; Bellon and Brush, 1994). In communities, the crops andvarieties that exist are part of an evolutionary process of cultivation byfarmers to continually adapt to the changing environment and theirneeds. This was a result of the interaction between people and theenvironment (Maurya, 1989; Soleri and Cleveland, 1993). In rice forexample, the thousand varieties stored at the International RiceResearch Institute (IRRI) genebank in the Philippines is an indicationof these diverse genetic resources. Farmers have created andmanaged the environment where plants could evolve under selectivepressure. Their farming systems, crops and varieties adapted todifferent environments, thus creating a diversity of crops, varieties andagro-ecosystems (Richards, 1985).
In farming communities, there are no distinctions betweenconservation and development. On-farm conservation of local varietiesis an existing strategy for food security. It is a potential strategy forgenetic conservation. By its very nature, on-farm conservation isdynamic because the varieties that farmers manage continue to evolvein response to natural and human selection (Bellon et al., 1997).
Mende rice farmers in Sierra Leone are successful in creating andmaintaining their rice varieties over the years. Their method ofharvesting, breaking off panicles one-by-one by hand, gives farmersthe option to reject off-types as they harvest. Panicle harvestingresults in the stabilization of the main seed types and also bringsabout a systematic grouping among off-types: early-ripening types will

9
be rogued as they ripen by farmers anxious to secure a little extra forconsumption in the hungry-season, and longer duration types will beleft in the field to the gleaners. This method of panicle selection hasresulted in the differentiation of Mende rice germplasm into threedistinct duration classes (Longley and Richards, 1993).
In Zimbabwe, small grain farmers carry out seed selection at pre-harvest and post-harvest stages. Pre-harvest seed selection is mostcommon among farmers where desirable plants are marked out in thefield and harvested separately. The criteria for selection include over-all agronomic and physical characteristics, disease and pestresistance, head shape and grain size. Post-harvest selection is carriedout at threshing places. The retained seeds are selected from harvestedheads (Mushita, 1993).
In Bohol, the evidence of many farmers’ selection in rice fieldindicates the continuing process of enhancing and maintaining ricevarieties to specifically fit their own needs and local conditions.Furthermore, these farmer selections were derived and enhanced byfarmers from both modern and traditional varieties to suit their localpreference for red rices (CBDC, 1999b).
Farmers’ knowledge and skills in enhancing and creating diversityis important to local crop development. In order to maintain andimprove genetic diversity, formal plant breeding and local cropdevelopment must be linked and built upon farmers’ knowledge(Hardon and de Boef, 1993; Cooper et al., 1992).
At present, there are on-going initiatives to decentralizeagricultural research by involving farmers at different stages of thebreeding process. These are broadly categorized into ParticipatoryVarietal Selection (PVS) and Participatory Plant Breeding (PPB) sincethey define two different approaches. PVS involves the selection byfarmers of non-segregating, characterized products from plantbreeding programmes such as released cultivars, varieties in advancedstages of testing and advanced non-segregating lines. In contrast, PPBinvolves farmers selecting the genotypes from genetically variable,segregating materials (Witcombe and Joshi, 1995). Examples of a PVSprogram is the work in Rwanda by Sperling et al. (1993) whoproceeded by involving farmers in the selection of bean varieties in on-station trials and then later grow them in their own fields. In therainfed areas of India, advance breeder’s lines were distributed to
10
farmers for on-farm trials (Maurya et al., 1988). Some PPB work wasalso done by Sthapit et al. (1995) in Nepal where segregating lines of F5
bulk families of cold-tolerant rice were distributed to farmers fordecentralized selection. In the Philippines, the MASIPAG programwhich is a farmer-scientist partnership has involved farmers incrossbreeding and distributed selections of segregating lines for testingin farmers’ field (Briones et al., 1989).
2.2 Gender and local crop development
In society, men and women play roles and have different tasks andresponsibilities and therefore have different needs and concerns.According to Boserup as cited by Moore (1988), in many societies inAfrica, men clear the land but women cultivate the crops. Insubsistence agriculture in the Indian Himalayas, women are burdenedwith most of the farming tasks since men are heavily involved in off-farm employment (Mehta, 1996). Rice farming systems in tidal andcoastal swamps in Kalimantan, Indonesia shows that women’sparticipation is important. Women’s tasks include seedbedpreparation, transplanting, harvesting and processing of rice,vegetable and other secondary crop cultivation (Watson, 1985). In thePhilippines, Ifugao women are mainly responsible for panicleharvesting because of their role are seed keepers (MRDC, 1995).
Women have traditionally played a silent role in the sustainableuse of biological resources and life-support systems (Shiva andDankelman, 1992). As part of the household, women play animportant role in crop production, seed management, post-harvestprocessing, marketing and food processing. There is ample evidencethat rural women in Asia contribute significantly not only to thephysical production process but also in decision making. The laborparticipation of women farmers varies considerably between countries.With the exception of Bangladesh, women generally supply the bulk oflabor for transplanting, weeding and harvesting, by providing between50 percent to 100 percent of the total labor for these operations (Paris,1988).
Women are knowledgeable on crop genetic diversity. In Sudan,women grow sorghum and millet and make from it about 30 differentproducts such as bread-type foods of discs, sheets and flakes shapes

11
(Badri and Badri, 1994). Women contribute as producers, processors,storers and marketers in crop production, thus their significantknowledge about these resources. Agricultural scientists oftenconsider women’s knowledge about seeds, plants, and productiontechniques irrelevant and backward. They argue that “scientificknowledge” must replace women’s ways of knowing. Although womenhave historically been the savers and storers of seeds, their knowledgeand seed stores have long been disregarded by plant geneticists andseed collectors. Plant geneticists have bred rice with littleconsideration for women’s knowledge, needs, and appreciation ofdiversity (Sachs, 1996).
Women’s role in seed selection is crucial to both agriculturalproduction and conservation and enhancement of genetic resources.There is a growing volume of documented examples of gender-specificvarietal preferences for seed, determined by the particular roles, tasksand responsibilities of men and women. Oosterhout (1993) notes thatin Zimbabwe certain varieties of sorghum are classified according togender roles. In Sierra Leone, Lipton et al (1988) documented thirteencriteria deemed to be important in gauging rice variety performance byhousehold members. They found that men tend to stress agronomicfactors including yield, whereas women are especially interested inprocessing characteristics, how much effort and fuel is needed to cookdifferent varieties, and how well different types keep both before andafter preparation (Richards and Ruivenkamp, 1997). The women ofthe Iban people of Sarawak, Malaysia are responsible for selectingseeds and storage of rice varieties. Women pick the most perfectlyformed panicles and stored it properly. Although men take part in theactual cultivation of rice, they do not have an accurate knowledge ofthe selection of the varieties (Freeman, 1955). Nazarea-Sandoval(1993) mentions than female farmers utilize a greater number ofcriteria than male farmers in the selection and cultivation of sweetpotato in Bukidnon, Philippines.
Despite this, women have not been perceived as farmers and farmlaborers, and historically the reference to farmers has always beenmale (Song, 1998). Consequently, women failed to becomebeneficiaries of technology, extension services, training and credit(Jiggins, 1986). Their access to and control over resources arediminishing with the introduction of modern technologies. Female

12
laborers in rice production in India are usually the first to bemarginalized with the mechanization of rice cultivation (Den Uyl,1995). Women’s concerns, skills and knowledge are an importantconsideration in local crop development.
2.3 Influence of farmers’ socio-economic status on local crop development
Several studies show that socio-economic differences of farmers isan important consideration for an effective adoption of technologies(Friis-Hansen, 1989; Brush et al, 1992; Nazarea-Sandoval, 1993).Farmers not only choose what varieties to plant or not to plant, orwhere and how to manage them, but also the seed to be planted thatwill be the basis for the next season. They also continually evaluateand improve varieties they have to adapt to their needs, agro-ecologicaland socio-economic conditions.
The introduction of high-yielding varieties during the GreenRevolution show that wealthier farmers adopted these varietiescompared to poor farmers who retained their traditional varieties.This may be due to the incapacity to purchase external inputs such aschemical fertilizers and pesticides necessary to cultivate the modernvarieties. This is specifically true for rice (Herdt and Capule, 1983) andcorn. In the study of Song (1998) which compared an extremely poorenvironment and relatively favorable farming environment, yieldbenefits from the introduction of CIMMYT related materials varyaccording to the farming systems. The introduction of uniform highyielding hybrid maize was widely adopted in favored areas and was notappealing to farmers in harsh environment. Rhoades (1989) finds outthat in potato farming communities, they grow native varieties formarket while poorer communities cultivate the higher yielding,improved varieties only for home consumption because they producedmore food per square meter.
Farmers choose varieties for a number of reasons such asgastronomic considerations, early maturity and other agronomiccriteria. These selection criteria are very much influenced by the socio-economic status of farmers.
In Rwanda, scientists from the International Center for TropicalAgriculture (CIAT) established a client-driven breeding program by

13
inviting bean farmers to the research station to assess cultivars andto select those they prefer for their plots. They also look at thedifferent selection criteria of women, poor and better-off farmers insubsistence bean production. The varieties that farmers choose ingeneral are often higher yielding on-farm and are retained longer byfarmers than those selected by the breeders. Poor farmers generallyprefer early maturing varieties. This may be due to the need for aregular and faster food supply for the family. Poor farmers alsoconsume leaves as well as fresh and dried grains so that the beangrowth cycle is a very important consideration in selection of thevarieties. Grain colors and other morphological characters are lessimportant to poor farmers (Sperling et al., 1993).
The breeding program of International Crop Research Institute forthe Semi-Arid Tropics (ICRISAT) in northern Namibia shows thatfarmers’ preferences in pearl millet varieties are early maturity,drought tolerance, large grains and good threshing characteristics.These characters are also related to the marginal condition of thefarmers (Monyo et al., 1998). In Zimbabwe, small-scale farmers favorsorghum varieties with consistent, reliable and stable yield rather thanhigh yields (Oosterhout, 1993). In the Philippines, gastronomiccriteria are used eight times more than morphological characters whenfarmers are asked to distinguish rice varieties (Nazarea-Sandoval,1991).
The selection criteria of farmers vary depending on their socio-economic and agro-ecological conditions. Also, it may vary withbreeders who most of the times look at yield as the main criteria forselection. In breeding programs, these diverse concerns are importantconsiderations to appropriately answer the needs and preferences offarmers.
2.4 RELATIONSHIP BETWEEN GENDER, SOCIO-ECONOMICSTATUS AND
The previous sections point out that farmers play a role indeveloping genetic resource diversity through their own managementand utilization. The existing diversity of crops and varieties in fields indeveloping countries are indicative of this effort. This still continues infarming communities until now. Figure 1 shows the conceptual

14
framework of this study. The diversity of red rices in farmers’ fields inBohol is an indication of the role of farmers in increasing geneticdiversity. This scenario is part of the local crop development infarming communities. It is affected and determined by farmers’selection criteria, selection methods and seed management.
Local crop development is further influenced by several factorssuch as the environment, local agro-ecological production conditionsand household needs which interface with gender, socialdifferentiation and ethnicity. Song’s (1998) study shows the favorableand unfavorable environment is one of the factors that dictate the typeof corn varieties that farmers grow. In rice cultivation, the supply andavailability of water is an important factor.
Household need is an important factor in crop development and isone of the main focus of the research. Household needs are furthercategorized by differences within households (gender) and betweenhouseholds (socio-economic status and ethnicity). As presented in theearlier sections, gender roles and responsibilities affect the tasks,decision-making and knowledge of men and women farmers. The sameis true for socio-economic differences between households. Ethnicity,however, is a factor that this study has not delved into since therespondents are ethically homogenous. All of them are Boholanos.These three factors, the environment, local agro-ecological productionconditions and household needs are internal influences within thecommunity.
Other influences, which are external, are the research andextension programs introduced by government and non-governmentinstitutions in communities that may directly or indirectly affect localcrop development. In this case, the supply of the type of rice varietiesdisseminated to the community contributes to the enhancement offarmers’ varieties by using their own selection criteria, selectionmethods and seed management.
In turn, plant breeders and extension workers should considerthese concerns in their agricultural programs to ensure that farmer-clients are well served. Assessment of farmers’ needs and preferencesand tapping farmer’s involvement at all stages of a breeding program isevidently beneficial. Farmers and plant breeders in some cases hadsimilar selection criteria but taking into account farmer’s concerns atearly stages ensures rapid and specific adoption of varieties.

15
Figure 1. The conceptual framework.
Red rice diversity infarmers’ field
� Selection criteria� Selection methods� Seed management
LOCAL CROP DEVELOPMENTConservation, Seed supply, Breeding
ENVIRONMENT LOCAL AGRO-ECOLOGICALPRODUCTION CONDITIONS
HOUSEHOLD NEEDS� Gender� Socio-economic differences� Ethnicity
Researchandextension

16
3 RESEARCH METHODOLOGY
3.1 Research approach
The research is divided into three phases, namely: preparatory,research, and post-research phase. Figure 2 shows the different stepsundertaken in the study from the conceptualization of the researchproblem until the completion and conclusion of study.
Preparatory Phase
SocialInterview, Workshops,Questionnaires, FocusGroup Discussions,Freelisting
TechnicalOn-farm
experimentation,Molecular Analysis
Research Phase
Post Research Phase
Research Problem
Objective Setting
Site Selection
Collection ofRice Materials
Data Collection
Sampling ofrespondents
Data Analysis
Write upConclusion and
Recommendation
Figure 2. The research approach.

17
The design of the research combines explorative research andexperimentation. Explorative research is qualitative research whileexperiment is quantitative data collecting (Lamers, 1994). Thequantitative research component documented the farmers’ role in andprocess of enhancement and development of red pericarp varieties inBohol while qualitative research focused on the influence of genderand socio-economic differences to local crop development.
Studying farmers’ role, knowledge and skills in local cropdevelopment encompasses understanding cultural behavior. Thisentails both the etic (outsider) and emic (insider) points of view (Peltoand Pelto, 1978). The research documented the knowledge of thepeople in the community (emic) and interpreted and analyzed thisinformation using scientific tools (etic).
Participation in this research meant the active involvement offarmers in all stages of the research. To conduct the research in thisway, the researcher integrated with the respondents during the datacollection phase by staying with one of the farmer families in thecommunity. This arrangement is advantageous as the researcher hadmore time to be a participant observer, had better accessibility andincreased rapport with the respondents. Secondly, the research toolsand methods used facilitated the gathering of information fromfarmers and relied more on farmers’ interpretation rather than theresearcher extracting and synthesizing the information. Several toolsare combined to collect the information.
3.1.1 Preparatory phase
This phase was comprised of activities necessary to thepreparation of the actual research. The preparatory phase wasimportant in order to know about the research site. In this case, theCommunity Biodiversity Development and Conservation (CBDC)2
programme staff assisted in and facilitated the selection of thecommunity site and identification of rice materials for the study.Another activity in the preparatory phase was the collection of the fourred rices.
2 CBDC is a global program working on the conservation and development of biodiversity with farmingcommunities. The Bohol project is one of its programs. The project works on the conservation anddevelopment of rice, corn and rootcrops in the province of Bohol, Philippines.

18
In the Philippines, collection of biological and genetic resourcesare bound by an Executive Order 247 on bioprospecting of biologicaland genetic resources. This Executive Order requires a prior informedconsent (PIC) before a collection of any biological and genetic resourcesfrom communities can be done. PIC activities need an academicresearch agreement (ARA) or commercial research agreement (CRA) tobe signed with a local university or a NGO working in the area, apublic notification and consultation with farmers. Therefore, amemorandum of agreement (MOA) between the CBDC-Boholprogramme, the Municipal Mayor and the researcher was signed. Thecommunity and surrounding areas were notified two-weeks prior tothe public consultation in which the purpose of the research and itsintentions in using the rice seeds were explained. A PIC certificate wassigned by the farmers from the communities.
3.1.2 Research phase
This phase consisted of fieldwork in the Philippines for a three-month data collection period. During this period, the social surveysincluding community meetings, workshops, semi-structured interview,freelisting and the field experimentation was conducted. A localassistant who spoke the dialect was hired to help in data collection.
3.1.3 Post-research phase
The activities in this stage included the molecular analysis, dataanalysis and writing of results. This was carried out in theNetherlands. Details of the molecular analysis and data analysisprocess was explained in the succeeding section of this chapter.
19
3.2 Methodology
3.2.1 Sampling
Stratified random sampling was used to select the respondents. Itis not practically possible to accommodate the whole population in theresearch thus sampling was done. Stratified sampling was done todivide the population into sub-groups based on the gender and socio-economic status of farmers in the area. Stratifying a population wasnecessary because the respondents in each subgroup were moresimilar with the persons in other sub groups. Random sampling gavean equal probability to every individual in the population to be selected(Bernard, 1995).
Selected people such as leaders and elder people in thecommunity acted as key informants. They were asked to define theirconcept of socio-economic status. They mentioned three bases ofsocio-economic status in the area, namely: (1) self-sufficiency of riceharvest for family food, (2) size of farm, and (3) level of education ofthe children. Thus, the following three groups were identified.
Group 1 – These households were small farmers whose rice yieldwas barely enough to feed the family. There was no surplus harvest ofrice to sell and therefore they cannot pay for other expenses of thefamily such as school fees of the children. So, most of their childrenreceived only elementary education. They usually did not ownagricultural fields, but if they did, these were small pieces of land (lessthan 0.5 ha). They also worked as laborers for other farmers within thecommunity to supplement their income. This group is categorized ashaving “low” socio-economic level.
Group 2 – These households were average farmers. Theiragricultural lands averaged 0.5 ha. They were either owner or tenantsof agricultural land. The rice yield was enough for daily consumptionof the family and some other household expenses such as sendingchildren to school. However, their children seldom reached the collegelevel. This group is referred to as “middle” socio-economic level.
Group 3 – These households were classified as better-off farmersin the community. Their farms were bigger than average size withinthe community. They were tenants and sometimes owned land. Inmost of cases, they had other sources of income (such as business,permanent jobs, support from children). They managed their farm and

20
had the capacity to hire labor for farming. Their children went toschool until college level. Some of their children were professionals.This group is referred to as having “high” socio-economic level.
Based on these definitions, the population was stratified with thehelp of the community leaders from the list of all households. Thestratified list was validated with two older and respectable persons inthe community and the CBDC project staff who worked in the studysite. Then using draw lots, the households were randomly selectedfrom the stratified list. The household, husband and wife in ahousehold, were the respondents of the study. There were 7households per socio-economic grouping.
3.2.2 Research tools
Several methods were combined and utilized by the researcher toensure that data were sufficiently and effectively collected. These toolswere:
3.2.2.1 Community meetings
Two community meetings were held at the beginning and end ofthe fieldwork. The purpose of the first community meeting was tointroduce the researcher and the research to members of thecommunity and to decide on the schedule of activities with therespondents. The last community meeting was done to validate thedata collected and share this information with the respondents andother members of the community. In both cases, the meeting wereassisted by the local assistant and CBDC programme staff.
3.2.2.2 Survey questionnaire
The survey questionnaire is the most commonly used method ofcollecting data. There are three methods for collecting surveyquestionnaire data: (a) personal interviews, (b) self-administeredquestionnaires, and (c) telephone interviews (Bernard, 1995). Thepersonal interviews were used in the research to gather basicinformation from each respondent. This method also facilitated themeeting and introduction to the respondents. The profile ofrespondents composed of basic information, land holdings, householdinformation and farm description were gathered (Appendix 1).

21
3.2.2.3 Semi-structured interview
Semi-structured interview is open-ended free-wheeling, and basedon the use of an interview guide. An interview guide is a written list ofquestions and topics that need to be covered in a particular order. Theinterviewer, in this case, still maintains discretion to follow leads, butthe interview guide is a set of clear instructions (Bernard, 1995). Thistechnique was used to gather information on the rice production andmanagement practices, list of selection criteria preferred by farmers,seed management practices, and selection methods (Appendix 2). Thecouples were interviewed separately and together.
The semi-structured interview was also applied to document theprocess that the farmers used to enhance the rice selections (Appendix3). Three out of the four farmers who did selection were visited andinterviewed.
3.2.2.4 Free listing
Free listing is one of the methods of structured interview whichinvolves exposing every informant in a sample to the same stimuli.Particularly, it is about how different people categorize things whichconstitute discrete domains of listable contents. It is commonly usedin studies of native taxonomies, that is, research on how differentcultures categories types of kin, animals, plants, diseases, foods, etc.(Bernard, 1995). Using this method, the list of varieties known byfarmers were identified. Men and women were asked to list all varietiesthey know in a specific time. Afterwards, the data were grouped into alist of varieties. The list of varieties provided information on thenumber of varieties known by the respondents and the importance ofvarieties to farmers.
3.2.2.5 Time allocation studies
Time allocation studies (TAS) are invaluable for carefullydocumenting what people actually do and for how long, providingdetailed data for comparisons between communities and betweenwomen and men. This method not only lays out time expenditure, butby doing so indicates something about people’s preferences andconstraints in time. Such detail is expensive but useful, whereassumptions about how women and men use their time need to bechallenged with quantitative data (Peirce-Colfer, 1994).

22
In this particular study, TAS was used to gather information onmen’s and women’s time allocation in rice production management perseason, seed management per season and household work per day(Appendix 4). A total of six households (2 per socio-economic groups)were selected. The researcher separately asked both male and femalefarmers on the amount of time they allocated on each task and whowere responsible for performing the major and minor load. A list oftasks were prepared by the researcher. The respondents identifiedtheir number of hours spent for each activity and the main and minorpersons responsible. The number of hours spent by each householdmember on the activity was totalled to provide the time allocated.
3.2.2.6 Focus group discussion
This interview technique is now widely used in basic and inapplied research. It does not replace surveys but rather complementsthem. It is a technique whereby a sample of people (as few as 6 and asmany as 30) are brought together for a joint interview session. Thefocus group should be homogenous and must be decided by theresearcher (Bernard, 1995). Five groups were categorized into focusgroups. Two were based on gender and three were from the socio-economic groupings. The information gathered using this techniquewere list of varieties, farmers’ selection criteria and selection methods,seed management, and rice production practices. The seedmanagement and rice production practices were disaggregated usingan activity calendar.
3.2.2.7 Ranking
Ranking is one of the participatory methods commonly used insocial studies whereby researchers can learn the way in which people’swealth, problems, opportunities etc. differ from one another (Nabasa etal, 1995 as cited by Ghezai, 1999). It is an effective method forobtaining information on farmers’ priorities. Farmers do theinvestigation and presentation of results while the researchers play afacilitating role. The ranking exercise in this study made use of the listof criteria identified through the semi-structured interview as an initialset of information. Farmers, grouped by gender and socio-economicdifferences, were asked to rank their criteria for choosing a varietybased on priority or importance.

23
3.2.2.8 Participatory rural appraisal
Participatory rural appraisal (PRA) is one of the tools used togather information from communities in a limited time but aimed atmaximizing farmers participation (Veldhuizen et al., 1997). Theoutsiders serve as facilitators. Several tools are available for PRA. Theresearch used seasonal calendar, mapping and venn diagram to gatherinformation on crop production practices, resource map, and socialstructures and credit and market and seed supply system,respectively.
3.2.2.9 Recording field notes
Field notes are records kept by the researcher from observations ofthings encountered in the field which are related to the subject of thestudy and from informal interviews done with key informants. In thisparticular research, the researcher recorded her observations anddiscussions with farmers. Two types of field notes were used:descriptive notes, jottings, and a log. Descriptive notes were producedfrom watching and listening. It recorded my observations of processes.Jottings were also found useful in informal interviews. Keeping a logmeant having a running account of how the researcher planned tospend time, how it is actually spent and how much money was spent(Bernard, 1995).
3.2.3 Field experimentation
The rice experiment was set up in a farmers’ field. Agro-morphological characterization of the four farmers’ selections and thefour original varieties was conducted by the researcher and farmers.These eight rice varieties were grown on a 200 sq. m. field from Juneto October 1999. The field layout was based on systematic plotarrangement design. Each variety was planted in eight rows of 6-meter length. The plants were spaced at 20 x 25 cm. Distance betweenplots was 0.5 meter. All cultural and management methods usedwere farmers' practices.

24
3.2.3.1 Farmers characterization
The list of farmers’ criteria to morphologically characterize thevarieties is presented in Appendix 5. These characteristics were listedand discussed during the first community meeting. The farmersvisited the experimental field individually for characterization of thevarieties. A group meeting was held after every field visit to facilitatediscussions and exchanges among the farmers.
3.2.3.2 Researcher’s characterization
The eight varieties were also evaluated based on the standardevaluation systems for rice developed by IRRI (IRRI, 1996). The list,description and measurements of the agro-morphological charactersare shown in Appendix 6.
3.2.4 Molecular analysis
The molecular analysis aimed (1) to determine the geneticsimilarities and differences of the farmers' selection and originalvarieties, and (2) to identify the origins of red pericarp color of thevarieties. The results might support the data gathered during theagro-morphological characterization and prove that farmers’ selectionswere derived from the original varieties as farmers claimed.
The molecular tool used for the study is amplified fragment lengthpolymorphism (AFLP). AFLP is a PCR-based method that is able togenerate complex banding patterns, DNA fingerprints of up to at 100DNA fragments in each reaction. AFLP is based on the selective PCRamplification of restriction fragments from a total digest of genomicDNA. The technique involves three steps, namely, restriction of theDNA and ligation of oligonucleotide adapters, selective amplification ofsets of restriction fragments, and gel analysis of the amplifiedfragments. PCR amplification of restriction fragments is achieved usingthe adapter and restriction site sequence as target sites for primerannealing. The selective amplification is achieved by the use of primersthat extend into the restriction fragments, amplifying those fragmentsin which the primer extensions match the nucleotides flanking therestriction sites. Using this method, sets of restriction fragments maybe visualized by PCR without knowledge of nucleotide sequence. Themethod allows the specific co-amplification of high numbers ofrestriction fragments (Vos et al., 1995). AFLP is a potential tool for

25
study of biological diversity, varietal identification and genetic mapping(Zhu et al., 1998). Briefly, these were the steps followed in theanalysis.
Plant materials. Plant materials were taken from the same seed lotused in the agro-morphological characterization. Farmers’ selectionand original varieties were also collected from farmer's field andresearch institute, respectively. Nine randomly selected individualswere sampled for each variety. These materials were deemed sufficientfor genetic analysis as rice cultivars have relatively homogenousnature. The seeds were grown in a glasshouse maintained at 20oCwith 80 % RH and 17-hour day length for 12 days (Parsons et al.,1997).
DNA extraction3. Young leaves (20 mg) were collected from all theindividuals for DNA extraction following the procedure designed byFulton et al. (1995).
AFLP's protocol4. The procedure used was based on the protocoldeveloped by Vos et al. (1995). Briefly, the general steps were:1. Restriction digestion of genomic DNA with Mse-1 and EcoR-1
enzymes2. Ligation of oligonucleotide adapters to fragment ends3. Pre-amplification with one selective nucleotide4. Amplification with the same selective nucleotide plus one or two
additional nucleotide5. Electrophoresis and autoradiography of amplified products with
radiolabelled primers.The Eco1/MseI enzyme combination was used to generate the
templates for AFLP reactions. Two combinations of three selectivenucleotides (i.e. +3) on the Mse primer and two selective nucleotides(+2) on the Eco primer were used. These were E13 for the Eco primerand M49 and M51 for the Mse primer.
3.3 Data analysis
The research data for both the social and technical aspectsunderwent qualitative and quantitative analyses. These methods were: 3 The appropriateness of the procedure was tested in rice from April to May 1999. Seedling age of 12,14 and 30 days were sampled for testing of the procedure. Results showed that sufficient DNAmaterials can be collected in all seedling ages. The 12 day-old seedlings were used in this study.

26
3.3.1 Qualitative analysis
3.3.1.1 Making use of quotes
This method depended heavily on the presentation of selectedanecdotes and comments from informants. These quotes would lendunderstanding the work quickly (Bernard, 1995). This research usedquotes from the information gathered during semi-structuredinterviews.
3.3.1.2 Matrices and tables
This method presented qualitative data by way of production of visualdisplays using table, matrix, charts and maps. The informationgathered from the survey questionnaire and semi-structuredinterviews were analyzed using this method. Specifically, gender andsocio-economic disaggregated data on rice production andmanagement, selection methods and seed management were subjectedto analysis using this method.
3.3.1.3 Ranking
The farmers listed the criteria they preferred in selecting varieties andranked them accordingly. The selection criteria were disaggregated bygender and socio-economic groups. This ranking method was used toorganize and analyze data.
3.3.2 Quantitative analysis
3.3.2.1 Free listing salience index
Free list salience of an item is a measure of salience, which is theresult of a combined effect of the two measures of frequency and orderof mention. An index of free list salience for each variety wascomputed, which was the gross mean percentile rank for each varietyacross all lists. Selected men and women informants were asked aquestion: What varieties do they know?. Their answers were used asbasic data to compute salience of index for each respondent.
3.3.2.2 Frequency counts
Frequency counts of activities are among the most useful ofresearch results. It is a simple, straight forward and inexpensive wayto analyze data of time allocation studies (Pierce-Colfer, 1994). For thisstudy, the time allotted per activity was summed up per household
4 The AFLP protocol was tested to determine its appropriateness to rice. The experiment was carried outon May 1999.

27
member. The frequencies were presented using simple bar graphs forcomparing categories.
3.3.2.3 Principal component and cluster analysis
The analysis of genetic relationships among the samples was thepurpose of the technical aspects of this research. A sample matrix wasconstructed specifying the character-state of each marker for eachsample. The AFLP data were scored according to presence (1) andabsence (0). While the agro-morphological data was standardizedaccording to the descriptors. A sample x sample matrix of pair-wisegenetic distances or similarities was constructed. Jaccard coefficientwas used to compute similarities between varieties. The two ways ofanalysis of resulting distance (or similarity) and displaying the resultswere by the principal component analysis (PCA) and cluster analysis.The PCA was used to produce 2 dimensional scatter plots of thesamples such that geometrical distances among the samples in theplot reflected the genetic distances among them with minimumdistortions. Aggregations of samples in such plot revealed sets ofgenetically similar material. The cluster analysis produced adendogram linking together cluster samples that were more geneticallysimilar to each other than to samples in other clusters. Clusters werelinked to each other at progressively lower levels of similarity until allthe samples being analyzed were included in a single cluster (Karp etal., 1997).
Statistical analysis programs were used to analyze these data.SPSS and GENSTAT were used for the social aspects and on-farmexperiment data and genetic analysis data, respectively.

28
4 RESEARCH AREA AND RESPONDENTS
4.1 The country profile
4.1.1 Geographical location and topography
The Philippines is an archipelago off the coast of Southeast Asiawith 7,100 islands. The total land area is 300,000 square kilometers.Topographically, the country is broken up by sea, which gives it one ofthe longest coastlines in the world. Only 1,000 of its islands arepopulated. Eleven islands composed of 94 percent of the Philippinelandmass. The three principal regions of the country are Luzon,Visayas and Mindanao (Figure 3).
Much of the country is characterized by hilly and mountainousareas known as uplands while the rest is lowlands. Narrow coastalstrips of all islands and the large swampy plains of Luzon andMindanao compose the lowlands.
4.1.2 Climate
The country has a tropical marine climate dominated by twoseasons, wet and dry. The summer monsoons bring heavy rains tomost of the archipelago from May to October, while the wintermonsoons bring cooler and drier air from December to February. ThePhilippines sits astride the typhoon belt and it suffers an annualonslaught of dangerous storms from July to October.
Four climatic types occur in the Philippines based on the rainfalldistribution. The average year-round temperature is 32oC. The climateis very well suited for agricultural production.

29
Figure 3. Map of the Philippines showing theresearch site.
30
4.1.3 Population
In 1990, the country’s population was more than 66 million. Theannual growth rate is 2.5 percent. The average population density is220 persons per square kilometer. More than half of its population areengaged in agriculture and agriculture-related activities. More thanhalf a million are working overseas but maintain Philippine residency(Dolan, 1991).
4.1.4 Socio-economic status
The Philippines is basically an agricultural country. It’s economyis struggling under a heavy foreign debt of US dollars 23 billion.Unemployment rate in mid-1991 is pegged at 10.3 percent. However,there is a large percent of overseas work force. Approximately 50percent of its population are below the poverty line. The situation ofhigh malnutrition rates, high infant mortality rate, poor health caresystem and high percent of out-of-school children are just somemanifestations of the poor socio-economic condition of the country.
4.1.5 Agricultural situation
In the late 1980s, nearly 8 million hectares were under cultivation.These are distributed to field crops and tree crops with 4.5 millionhectares and 3.2 million hectares, respectively. Population growthreduced the amount of arable land per person employed in agriculturefrom about 1 hectare during the 1950s to around 0.5 hectare in theearly 1980s. Growth in agriculture output had largely come frommulti-cropping and increasing yields. In 1988, double cropping andinter-cropping resulted to 13.4 million hectares of harvested areas, atotal that was considerably greater than the areas under cultivation.The main cereals widely grown in the country are rice and corn thataccounted for about half of the total crop area. Another 25 percent ofthe production was taken up by coconuts which is major export crop.Other important export earners, sugarcane, pineapples and“Cavendish” bananas accounted for only a relatively small portion ofthe cultivated area.
The percentage of the population living in rural areas declinedfrom 68 percent in the 1970 to 57 percent in 1990. The share of laborforce engaged in agriculture, forestry and fishing also decreased to lessthan 50 percent by the late 1980s. Roughly two-thirds of agriculture

31
households farmed their own land or were tenants. The others arelandless agricultural workers.
The government sometimes pursued contradictory goals inmaintaining cheap food and raw materials prices, high farm income,food security and stable prices at times through direct intervention inagricultural markets. Beginning the latter half of the 1970s, theMarcos regime gave increased attention to agriculture and the ruralsector in general, including agribusiness development. The Aquinogovernment continued that emphasis although its policy evolved froma commodity-specific orientation to a general crop diversificationapproach that relied more on market signals to guide crop choice.
Providing credit to the agricultural sector, particularly to small-sized and medium-sized farmers had been a government policy sincethe early 1950s. By the early 1980s, there were approximately 900privately owned rural banks, which were the principal implementors ofgovernment-sponsored credit schemes. Production loans were providedto farmers through the Masagana 99 program initiated in the early1970s to encourage adoption of new high-yielding rice varieties. By1985, however, the program expired because of high arrearage and thetight monetary policy instituted as part of an agreement with theInternational Monetary Fund (IMF). The program was revived in theAquino administration under the Medium-Term Development Plan.According to government report, however, by 1988 the program hadnot yet reached most of the intended beneficiaries (Dolan, 1991).

32
4.1.6 Gender roles
Women always enjoy equality in the Philippine society comparedto their counterpart in other parts of Southeast Asia. A woman’s rightto legal equality and to inherit family property have not beenquestioned. Education and literacy levels in 1990 were higher forwomen than for men. Furthermore, in the early 1990s women werefound in more than their proportionate share of many professions,although they predominated in domestic service (91 percent),professional and technical positions (59.4 percent). This favorableoccupational distribution does not mean that women are withouteconomic problems. Although women were eligible for high positions,men more often obtained these. In 1990, women represented 64percent of the graduate students but held only 16 percent of the topexecutive career positions in the civil service. In the private sector, onlyabout 15 percent of the top-level positions were held by women.According to observers, this is because men relegated household tasksto women. Employed women carried a double burden. In a Filipinofamily, the women/mothers are responsible for childcare andhousehold maintenance while men/husbands are primarily, the headof the households, ideally responsible for providing the material needs.Women’s involvement in economic activities is often viewed as asecondary responsibility and her relation to the labor market are assecondary earner because her primary duty to take care for her family.
Since the Spanish period, woman had acted as the familytreasurer, which at least to some degree gave her the power of purse.Nevertheless, the Spanish also established a tradition of subordinatingwomen, which is manifested in women’s generally submissive attitudesand in a double standard of sexual conduct. In rural areas, women’saccess to economic assets and resources is indirect and is mediatedthrough her husband. Women may have a direct relationship toeconomic assets and resources but not to the fruits of those assets;women in agriculture work as unpaid family labor (Eviota, 1986).
4.2 The province of Bohol
4.2.1 Location and topography

33
Bohol is an island province located centrally in the Philippinearchipelago (Figure 3). The province is specifically situated at northlatitude 9o30’00’ and 10 o 15’00’ and east longitude 124 o 30’00’’. Theneighboring provinces are Cebu in the northwest and Leyte in thenortheast. There are 47 municipalities and 1,109 barangays1(PPDO,1998).
The province is noted for its diversity in crops as well as variabilityin agro-ecosystems. It has predominantly rolling plains and hillytopography with large coastal areas. The central and northern part ofthe island are vast expanses of relatively rolling plains and flat lands.Bohol’s terrain is variable from nearly flat at the plains which aremostly utilized and planted by rice considering the thick layers ofprimary soils while the slightly rolling areas are planted to coconut,cassava and vegetables.
4.2.2 Climate
The climate of the province is classified as “Type 4” with evenrainfall distributed throughout the year. It is usually warm and dryalong the coasts while cold and humid in the interior. Typhoons arenot a frequent occurrence on the island.
1 Barangay is the smallest government unit in the Philippines. It is composed of sitios or purok(neighborhood). A neighborhood is composed of around 30 households. In most cases especially inrural areas, households in a purok are composed of relatives.

34
4.2.3 Population
The total population of Bohol is estimated at 994,440. The totalnumber of households is 191,657 (NSO, 1995). The majority of thepeople in Bohol live in the rural areas. Only 25 percent of thepopulation lives in urban areas (PPDO 1992). The people of Bohol arecalled Boholanos.
4.2.4 Agricultural situation
Bohol is an agricultural province where the majority in the ruralareas depend on agricultural related-activities. Out of the 411,726hectares land area, the agricultural land is estimated at 323,100hectares.
The farming system in the province is generally diversified and iscomprised mostly of small to medium-sized farms that combine bothtraditional and modern methods of cultivation under a wide range ofecological and soil conditions. Rice is the staple food crop of theBoholanos but they maintain a variety of other crops on their farmssuch as coconut, corn and various rootcrops. The province is popularfor its unique root crops diversity, especially yams. Coconut is itsprincipal cash crop covering 36 percent of the entire agricultural area.The cropland devoted to rice (including irrigated lowland, rainfedlowland and upland) is 48,818 hectares. The average yield per hectareof irrigated lowland rice, rainfed lowland rice and rainfed upland rice is4.02 metric tons, 2.33 metric tons and 1.5 metric tons, respectively.Farm products consist largely of rice and coconuts, with rootcrops,cacao and banana as minor crops (PPDO, 1992).
Agricultural products exported by the province are rice, banana,mangoes and copra. The province is touted as the rice granary ofCentral Visayas, however, it had imported rice over the years. Theestimated rice import is 8,489.94 metric tons (PPDO, 1998).
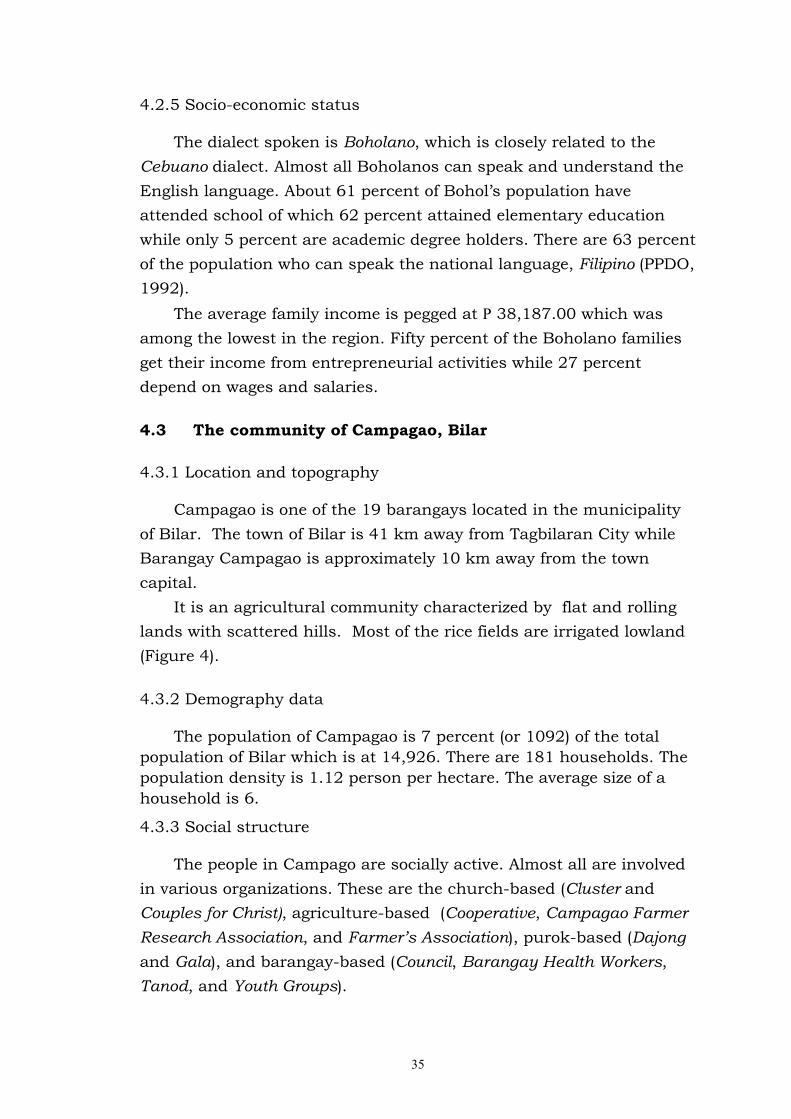
35
4.2.5 Socio-economic status
The dialect spoken is Boholano, which is closely related to theCebuano dialect. Almost all Boholanos can speak and understand theEnglish language. About 61 percent of Bohol’s population haveattended school of which 62 percent attained elementary educationwhile only 5 percent are academic degree holders. There are 63 percentof the population who can speak the national language, Filipino (PPDO,1992).
The average family income is pegged at � 38,187.00 which wasamong the lowest in the region. Fifty percent of the Boholano familiesget their income from entrepreneurial activities while 27 percentdepend on wages and salaries.
4.3 The community of Campagao, Bilar
4.3.1 Location and topography
Campagao is one of the 19 barangays located in the municipalityof Bilar. The town of Bilar is 41 km away from Tagbilaran City whileBarangay Campagao is approximately 10 km away from the towncapital.
It is an agricultural community characterized by flat and rollinglands with scattered hills. Most of the rice fields are irrigated lowland(Figure 4).
4.3.2 Demography data
The population of Campagao is 7 percent (or 1092) of the totalpopulation of Bilar which is at 14,926. There are 181 households. Thepopulation density is 1.12 person per hectare. The average size of ahousehold is 6.
4.3.3 Social structure
The people in Campago are socially active. Almost all are involvedin various organizations. These are the church-based (Cluster andCouples for Christ), agriculture-based (Cooperative, Campagao FarmerResearch Association, and Farmer’s Association), purok-based (Dajongand Gala), and barangay-based (Council, Barangay Health Workers,Tanod, and Youth Groups).
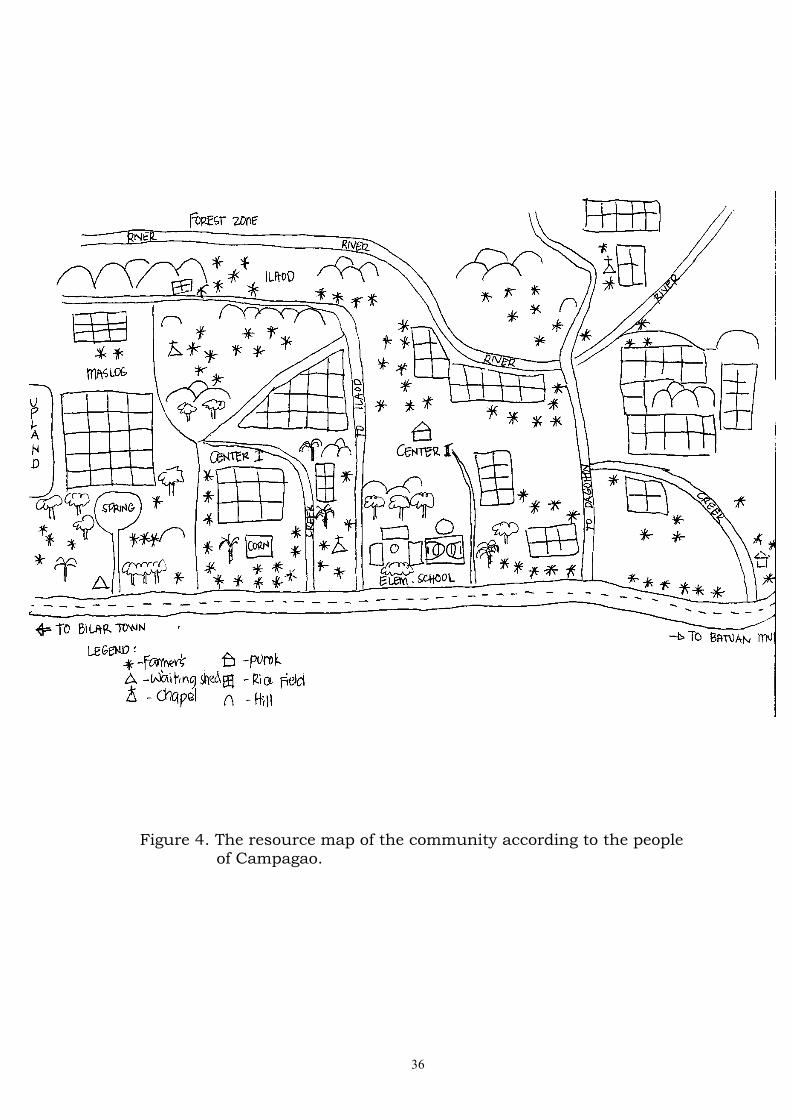
36
Figure 4. The resource map of the community according to the people of Campagao.

37
4.4 Respondents profile
4.4.1 Basic information
A total of 42 persons or 21 couples were selected as respondentsof the study. Table 1 shows the personal information about therespondents. The age ranges from 37 to 60 years old. Most of themhad long residence (an average of 30 years) in the community andinvolvement in farming (an average of 28 years). The majority of themstarted to help in minor farming activities at the age of 10 and theywere expected to contribute more when they reached 16 years of age.In terms of their educational attainment, most of the respondents hadelementary schooling. More male respondents (20 percent) hadreached college level compared to the female respondents (5 percent).Women respondents mostly attended elementary and high school.
Table 1.The respondent’s personal characteristics.
Mean Education level (%) Organizational involvement (%)Group Sex
Age Years infarming Elementar
yHigh
school
College
Morethan 3
andofficer
s
Morethan 3
andmember
s
Lessthan 3
andofficers
Lessthan 3
andmember
s
None
MeanYears in
community
Male 40 24 70 15 15 15 85 13Low
Female 37 21 60 40 100 19
Male 42 24 40 30 30 30 40 30 32Middle
Female 40 22 40 60 15 15 15 40 15 35
Male 60 44 60 25 15 40 60 41High
Female 58 38 60 25 15 15 40 15 30 37
Many respondents, both men and women, are actively involved invarious organizations in the community (Table 1). Almost all areinvolved in church groups such as Cluster2 and Couples for Christ3.Other organizations are farmer associations, cooperatives and socio-civic groups. Husbands are more active than their wives in terms ofnumber of and positions in organizations. Moreover, men from thehigher socio-economic level are more involved as officers oforganizations. But, women from the middle socio-economic level holdmore positions in an organization. Women from the low socio-economic levels participate in less than three organizations as
2 Clusters are small groups of family within a community organized by the parish church.3 Couples for Christ are also church groups involving husband and wife.
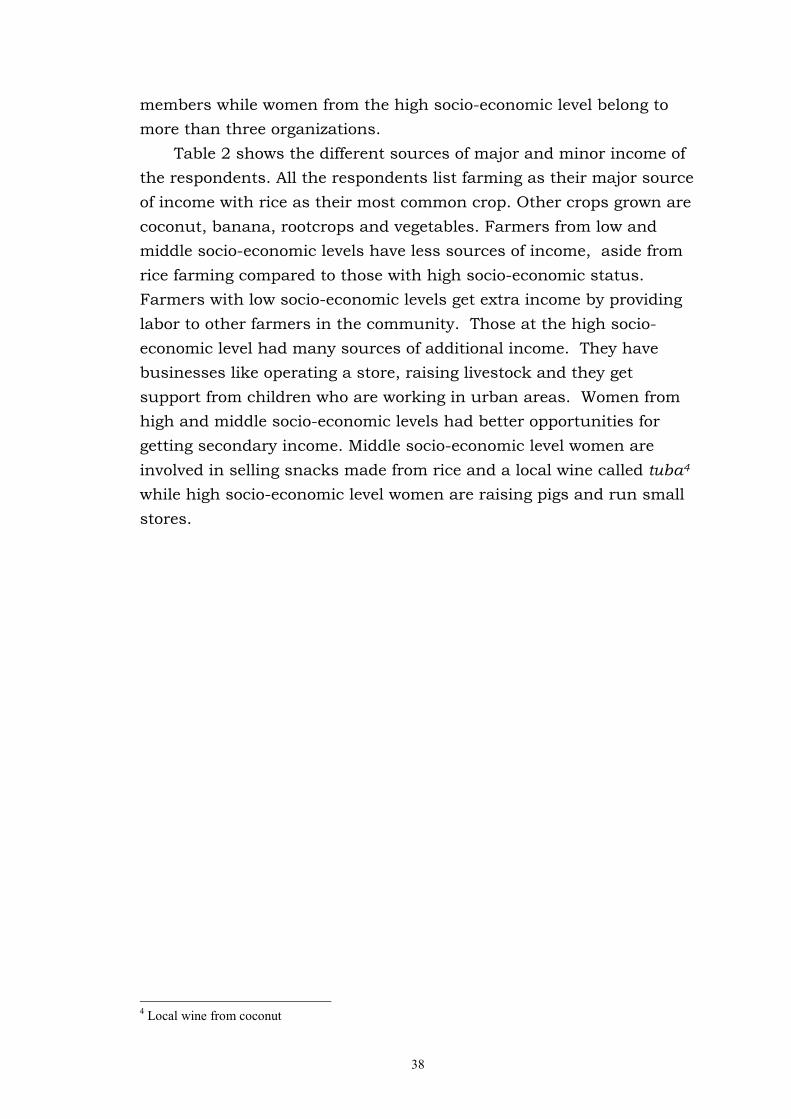
38
members while women from the high socio-economic level belong tomore than three organizations.
Table 2 shows the different sources of major and minor income ofthe respondents. All the respondents list farming as their major sourceof income with rice as their most common crop. Other crops grown arecoconut, banana, rootcrops and vegetables. Farmers from low andmiddle socio-economic levels have less sources of income, aside fromrice farming compared to those with high socio-economic status.Farmers with low socio-economic levels get extra income by providinglabor to other farmers in the community. Those at the high socio-economic level had many sources of additional income. They havebusinesses like operating a store, raising livestock and they getsupport from children who are working in urban areas. Women fromhigh and middle socio-economic levels had better opportunities forgetting secondary income. Middle socio-economic level women areinvolved in selling snacks made from rice and a local wine called tuba4
while high socio-economic level women are raising pigs and run smallstores.
4 Local wine from coconut

39
Table 2. Sources of income of the respondents.Major source (farming)Group Sex No.
and%
Rice Rice andCoconut
Rice,Coconut
andBanana
Rice,Banana
andRootcrops
Rice,Coconut,Banana
andRootcrops
Rice,Coconut,Banana
andVegetables
Minor source
No. 2 1 2 1 1Male
% 29 14 29 14 14
Farm labourer (3),
Raising pigs (2),
Tractor operator (1)
No. 2 1 2 1 1
Low
Female
% 29 14 29 14 14
None
No. 3 1 1 1 1Male
% 43 14 14 14 14
Transportation services(1), Selling snacks (1),
Selling coconut wine (1)
No. 3 1 1 1 1
Middle
Female
% 43 14 14 14 14
Selling snacks (1),
Selling coconut wine (1)
No. 1 3 3Male
% 14 43 43
Support from children (2),
Store (1), Carpentry(1),Retirement pay (1),
Raising pigs and chickens(1)
No. 1 3 3
High
Female
% 14 43 43
Support from children (2),
Store (1), Raising pigs andchickens (1),
Dressmaking (1)
4.4.2 Household information
The household in the community is composed of the nuclearfamily with father, mother and children. In some instances, otherrelatives such as parents, grandparents, and siblings join thehousehold if they are old or no other relatives can take care of them.Table 3 shows the information on number of people living within thehousehold. The average family size is 6. There are also particular caseswhere 2 families had non-relatives living with them. This is observedin families belonging to a high socio-economic level. The level ofeducation reached by the children also reflects the position of a familywithin the community. Data show that those who belong to a highsocio-economic level had higher percentage of children attendingcollege. It should be noted however, that most of the respondents inthe high socio-economic groups are older couples.

40
Table 3.Household information.Mean
ChildrenEducational level of children (%)
Elementary Highschool College
GroupNumber
ofhousehol
d
Total Livingwiththem
Notlivingwiththem
Othermembers ofhousehold
None
Preschool
100 25 50 75 100 25 50 75 100
Low 7 5 5 2 1 Father ofhusband,
1 Mother ofhusband,
1 Sister of wife
15 15 55 15
Middle 6 5 4 1 1Grandmother
and1 brother of
husband
30 40 15
15
High 5 6 3 4 1 Grandson,2 Neighbor, 1
Granddaughter1 Daughter-in-
law and 3grandchildren
15 15 15
15 40
4.4.3 Land ownership
There are different types of farmland that the respondentscultivated. These are rice, banana, coconut, rootcrops and vegetables.All the respondents manage rice fields of varying sizes, depending ontheir socio-economic status (Table 4). Farmers with higher socio-economic status own more land compared to the low and middlegroups. Most of them have banana and coconut farms together whilerootcrops are planted in small plots near their houses. Land ownershipof rice fields of all respondents is tenurial. However, most of thelandowners are living in the city or outside the country.
Table 4.Information on respondents agricultural land ownership.
Ricefield Banana, coconut andcassava field
Pastureland
Ownership Ownership Ownership
Group
Numberof
families
Size
(ha) Owned Tenant
Numberof
families
Size
(ha) Owned Tenant
Numberof
families
Size
(ha) Owned Tenant
Low 7 0.5 0 7 4 0.2 3 1 0 0 0 0
Middle 7 0.7 0 7 5 0.4 1 4 0 0 0 0
High 7 1.3 0 7 6 0.3 5 1 2 0.5 1 1

41
5 RESULTS AND DISCUSSION
5.1 Farming system and genetic diversity
5.1.1 Crops and varieties
The crops grown in Campagao, Bohol were rice, corn, coconut,banana, root crops and vegetables (Table 5). Rice, the staple foodcrop, was grown on most of the farms in the community. Three typesof rice were grown by the farmers. These are the modern varieties thatwere supplied by government extension office, farmer selections thatcame from farmers within and nearby communities and non-government organizations, and the traditional varieties from within ornearby communities. The traditional varieties retained in thecommunity were mostly the glutinous rice varieties that were used forrice cakes. Some farmers planted them for special occasions. Thepreferred varieties were early to medium maturing varieties.
According to the respondents, rice was grown mostly for familyconsumption and the market. Farmers allocated their rice harvest andensured that enough food were available for the family. The surplusproduce was sold in the nearby rice mill. Smaller amounts (less than10 kilos) were sold to another farmer within the community whobought seeds from fellow farmers. The sale from rice was used to meethousehold needs, pay schooling of children, or pay loans (if there wereany).
Another cereal grown in the community was corn. It was animportant staple food crop when rice was not available especially inlean months. Thus, corn was usually harvested a month prior to riceharvesting. It was mostly grown for food in small upland areas in thecommunity. Farmers planted corn during months with less work inthe rice field.
Banana was another important crop grown by farmers in thecommunity. It was mostly grown for food by the farmers interviewed.Sometimes if there was surplus, it was sold at the market in the localand nearby communities. Women who had time usually made snacksout of banana which they sold from house to house or in the school.

42
Varieties planted in the community were mostly traditional varieties.This may be attributed to the province lying on the center of origin ofbanana. Banana was planted at no specific month. Farmers grew themwhen they had extra time away from rice farming. Men were generallyinvolved in growing banana, however, women assisted in tasks such asweeding.
Coconut was also grown by farmers as a cash crop and for food. Itwas usually planted in the few upland areas in the community.Varieties grown were the traditional variety, which farmers called“Native” or “San Ramon” and the “Dwarf” variety which had beenintroduced by government extension workers. Planting coconut issporadic and according to the need of the farmers. Most farmersplanted them when they had less work in the ricefield. Men weremostly involved in growing coconut.
Table 5. List of crops and varieties planted by the respondents.
Crops Type VarietyRicea Modern Varietyb IR 36e, IR 64e, IR 66e, IR 77e, RC 4e, RC 18 e,
RC 28 e
Farmers Selectionc MS 2e, MS 13e, MS 32e, MBf, Japane,Vietname, Japan Selectionf, RC 18 selectionf,77 puwaf,MB selectionf , Los Banose, 08e
Traditional Variety Pilit tapoldg, Pilit puti de, Pilit puwadf
Ka emilf, Ka morof
Corn TiniguibBanana Duoy, Karanaba, Lakatan, Latundan, Saba,
Sarabya, Suay BagyoCoconut Dwarf, Native, San RamonRootCrops
Cassava Haba, Puti, Yellow
Sweet potato Mani-maniTaro San Fernando
Vegetables Bitter gourdChiliOnion
a Rice varieties grown by respondents during the 99 wet season.b Varieties bred and developed by formal institutionsc Varieties believed to be selected and developed by farmers from modern and traditional variety through selection.d Glutinous varietiese White seed coat varietyf Red seed coat varietyg Purple seed coat variety

43
Root crops such as cassava, sweet potato and taro were grown innearby plots in the house area. These served as an additional sourceof carbohydrates when boiled and eaten as supplement for rice and assnacks. There were limited varieties of rootcrops grown in thecommunity. Cassava (Manihot esculenta L.) varieties include Haba, Putiand Yellow. The cassava varieties were named and distinguished bythe color of its tubers. Sweet potato (Ipomea batatas) variety grownwas Mani-mani and taro (Colocassia sp.) planted was San Fernando.
Some farmers grew vegetables as a cash crop but the majority ofthem kept small plots in their backyard as a source of everyday food.A farmer who sold vegetable produce in the market usually grew bittergourd, chili and onion. Other vegetables grown in the community wereeggplant and string beans. Usually the farmers in the communitydirectly or indirectly sold the produce. Sometimes, middlemenmarketed vegetables in a nearby town for a better price. Vegetablesgrowing were largely dependent on the water availability and free timeof farmers from rice farming.
The crops and varieties grown by farmers primarily depended onits use and farmers’ preferences. Farmers grow crops mainly for familyconsumption. Rice and coconut were considered as the cash crop butfarmers marketed surplus produce only after the food supply wasensured. Vegetables were grown by limited farmers in the communityand sometimes sold in the market. Less varietal diversity of thesecondary crops like corn and rootcrops was observed. However, thevarietal diversity of rice in the community was wider compared to othercrops. In most cases, a farmer had an average of two or three varietiesplanted in the field during one season. Varietal diversity in rice wasimportant to farmers to spread the risk of crop losses thus ensuringharvest.
5.1.2 Rice production and management
Rice farming was the major cropping system in the community. Allthe farmers interviewed grew rice as their main crop. The average landsize planted to rice was 0.83 ha per farmer. Rice was grown twice ayear. The wet season is from May to October while dry season is fromNovember to March. The season was very much dependent on therainfall pattern in the community (Figure 5). The dominant ricegrowing ecology was irrigated lowland followed by rainfed lowland.

44
Rice growing was very labor-intensive. The general practice ofcultivation used by the farmers was the Green Revolution technology.This included a lot of external inputs such as chemical fertilizer andpesticides that were costly. Money was therefore needed to buy inputsas well as to hire labor during land preparation, planting andharvesting (Figure 5). Farmers usually took loans from small usurers,cooperatives and private institutions. If income from rice farming wasnot sufficient, farmers looked for other sources to augment theirincome. Families from low socio-economic status usually worked aslaborers on other farms. Those with higher socio-economic status hadbetter opportunities to take care of livestock, to run stores or hadsupport from children.
The growing season of rice begins at the onset of rain. Whenenough water is accumulated in the field, the land was plowed andharrowed using a carabao-drawn implement or hand tractor. This wasusually done by hired labor since most of them do not own a handtractor or carabao. Those who own a carabao prepare their own land.Other activities done during land preparation are the clearing of dikesfrom weeds and repairing the dikes. This is mostly done by the farm-owner while other men harrow or plow the field. After harrowing, thefield is leveled, usually done a day before transplanting.
Seedling preparation is done in a smaller plot in the rice field. The“wetbed” method is usually use by farmers in the community. Theseeds are soaked in water for 24 hours and then incubated for another24 hours to pre-germinate the seeds. Small plots in the prepared fieldare constructed for the seedlings. The same land preparation isfollowed for the seedbeds (plowed, harrowed and levelled). Usuallyseedbeds are constructed a day before sowing. The pre-germinatedseeds are broadcasted and sown in the constructed plots in the ricefield. The seedlings are kept to grow in the plots from 18 to 21 days.
Transplanting of seedlings is usually finished in one daydepending on the number of people on hand. The seedlings aregathered and bundled together and then transported to the rice field.The transplanting is usually done by a group of more than 10 mostlyhired people depending on the size of the field. Rice is plantedrandomly, with no definite distance or spacing between plants. Thefarmers use three to five seedlings per hill. Extra seedlings are kept inbundles along the alleyway for replanting in case of missing hills.

45
Two types of weeding are done during the whole growth cycle ofrice. The farmers ensure that dikes are free from weeds and dohandweeding. Clearing of dikes is done before panicle initiation orbooting stage. Handweeding is done three weeks after transplanting.Hired laborers usually perform handweeding. A farmer-respondentsometimes used ducks to weed their field during the land preparation.Farmers also used ducks to eat the snails (pests in rice). According tothe respondents during the semi-structure interview, women andchildren handpick the snails.
Water management is crucial to growing rice. The canals in thedikes are opened or closed depending on the growth stage, need andavailability of water for the rice plants. Farmers visit the rice field atleast twice per week from transplanting until the reproductive stage tocontrol the amount of irrigation water.
The farmers in the community apply two types of fertilizers. Theyuse organic fertilizers and inorganic (or chemical ) fertilizers. Organicfertilizers consist of chicken manure supplied by the CBDC program toits members of the farmers’ organization. These are usuallybroadcasted during harrowing. Other farmers broadcast chemicalfertilizers during transplanting and weeding. Contrary to theconventional farming technique of burning the rice straw, farmersscatter the rice straw in the field and let it decompose for additionalnutrients after harvesting.
Farmers in the community seldom use pesticides to control pestand diseases. They only use this as a last resort. The reason given byfarmers interviewed was the high cost of these chemicals and the badeffect on their health. The farmers observe their rice field throughoutthe growing season for incidence of pest and disease.
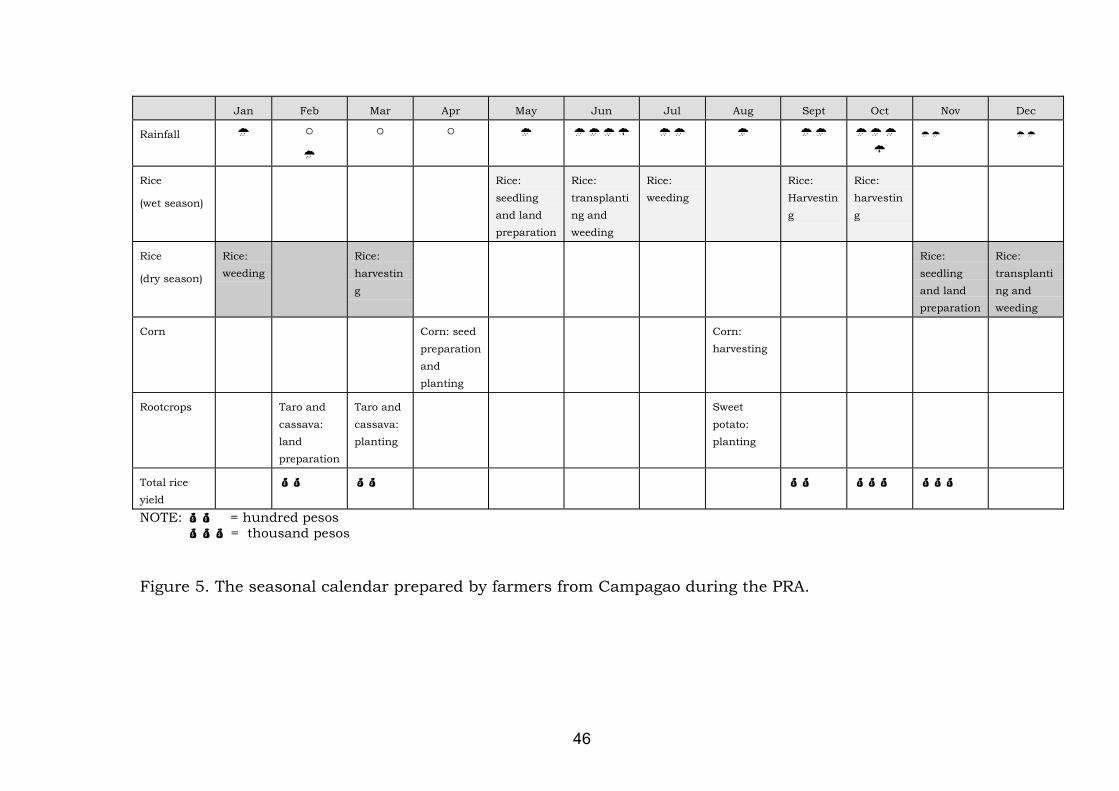
46
Jan Feb Mar Apr May Jun Jul Aug Sept Oct Nov Dec
Rainfall � �
�
� � � ���� �� � �� ���
�
�� ��
Rice
(wet season)
Rice:seedlingand landpreparation
Rice:transplanting andweeding
Rice:weeding
Rice:Harvesting
Rice:harvesting
Rice
(dry season)
Rice:weeding
Rice:harvesting
Rice:seedlingand landpreparation
Rice:transplanting andweeding
Corn Corn: seedpreparationandplanting
Corn:harvesting
Rootcrops Taro andcassava:landpreparation
Taro andcassava:planting
Sweetpotato:planting
Total riceyield
�� �� �� ��� ���
NOTE: �� = hundred pesos ��� = thousand pesos
Figure 5. The seasonal calendar prepared by farmers from Campagao during the PRA.
47
Seed selection is important to the farmers as they mostly usedtheir own seed for the next planting season. Farmers always look outfor favorable plants and paddies as source of seeds. The farmersthemselves or harvesters who are instructed by the owners wouldseparately harvest the selected rice plants. These seeds are threshedand dried separately.
Harvesting of rice is done manually by hired labor. Familymembers provide extra help in harvesting. The rice plants are cutusing a sickle (or “karet”). The cut panicles are left on the ground andgather by another person. The panicles are then kept in one place inthe rice field for threshing later. To facilitate threshing, the paniclesare arranged in a circle. Threshing is done using a manual thresherwith foot-powered pedal. A manual blower cleans the threshed seeds.The owner of the foot-pedal thresher and blower is paid usually byhaving a share in the rice harvest. The paying scheme is 6 to 1. Thismeans that for every seven sacks, the farmer gets six sacks and paysone sack to the owner of the blower and thresher.
Drying of seeds is done on cemented road or pavement. However,this has some problems because not all roads in the community werecemented. Some farmers dry their harvested seeds on mats laid on theground. Seeds are raked regularly to keep drying even. Drying is donefor some days depending on the weather.
The rice grains are usually sold depending on the need of a family.Dried grains are sold instead of wet grains because of their higherprice. Rice in sacks (around 40 kilos) are sold in the nearby rice milland used to pay debts or pay for big amount of household expenses.Also, some farmers sell small amount of grains on a daily basis to afarmer who buys seeds within the community. The money is used topay for daily needs of the family.

48
Photos 1 & 2

49
Photos 3 & 4
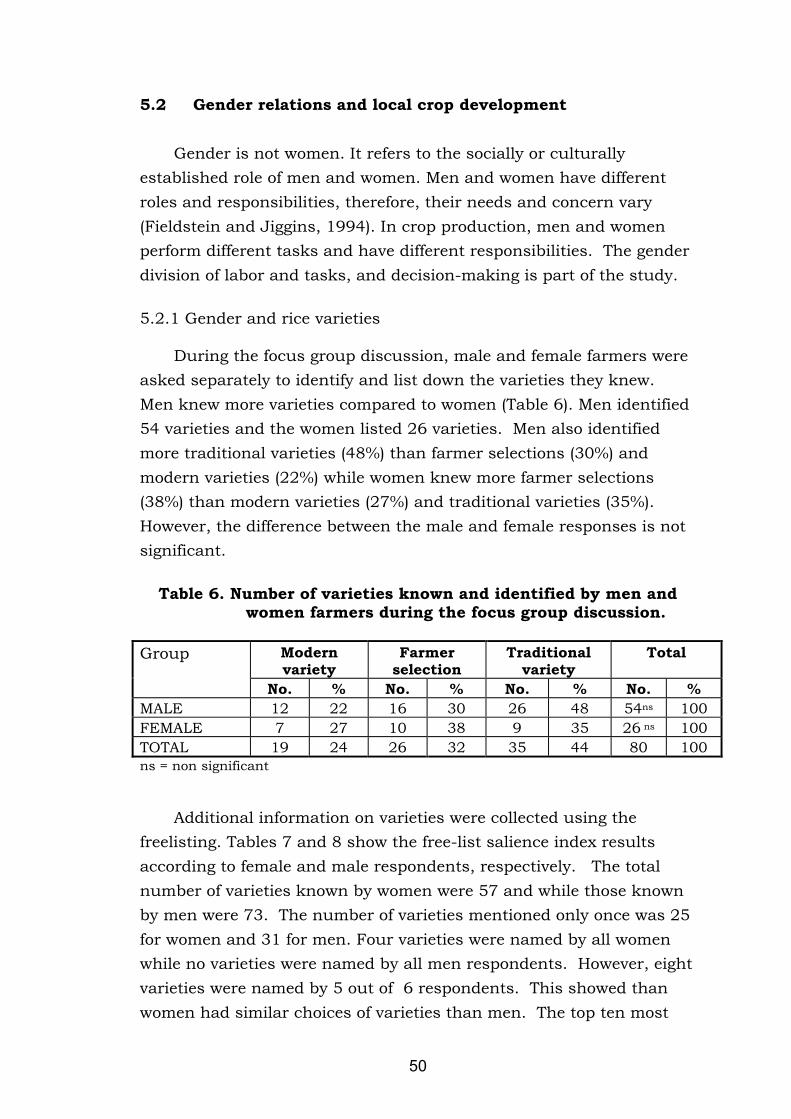
50
5.2 Gender relations and local crop development
Gender is not women. It refers to the socially or culturallyestablished role of men and women. Men and women have differentroles and responsibilities, therefore, their needs and concern vary(Fieldstein and Jiggins, 1994). In crop production, men and womenperform different tasks and have different responsibilities. The genderdivision of labor and tasks, and decision-making is part of the study.
5.2.1 Gender and rice varieties
During the focus group discussion, male and female farmers wereasked separately to identify and list down the varieties they knew.Men knew more varieties compared to women (Table 6). Men identified54 varieties and the women listed 26 varieties. Men also identifiedmore traditional varieties (48%) than farmer selections (30%) andmodern varieties (22%) while women knew more farmer selections(38%) than modern varieties (27%) and traditional varieties (35%).However, the difference between the male and female responses is notsignificant.
Table 6. Number of varieties known and identified by men and women farmers during the focus group discussion.
Modernvariety
Farmerselection
Traditionalvariety
TotalGroup
No. % No. % No. % No. %MALE 12 22 16 30 26 48 54ns 100FEMALE 7 27 10 38 9 35 26 ns 100TOTAL 19 24 26 32 35 44 80 100ns = non significant
Additional information on varieties were collected using thefreelisting. Tables 7 and 8 show the free-list salience index resultsaccording to female and male respondents, respectively. The totalnumber of varieties known by women were 57 and while those knownby men were 73. The number of varieties mentioned only once was 25for women and 31 for men. Four varieties were named by all womenwhile no varieties were named by all men respondents. However, eightvarieties were named by 5 out of 6 respondents. This showed thanwomen had similar choices of varieties than men. The top ten most

51
frequently mentioned varieties for women constituted 51.8 percent and51.3 percent for men. The highest index for women respondents was89 percent and 69 percent for the men. Men and women had 6varieties in common in their top ten list. These were 08, Japan, Kaemil, Kainte, Pilit puwa and Lubang. Women mentioned morefarmers selections (6 varieties) while men listed more traditionalvarieties (4 varieties). The top variety selected by women was 08 whilethe men’s top variety was Lubang.
Both results from focus group discussion and freelisting confirmedthat men knew more varieties than women. This difference can beattributed to the fact that men and women had different concerns,roles and responsibilities in rice farming that was influential in thevarieties they choose and knew.
Women listed down more farmers’ selections while men knewmore traditional varieties. It was also common to find certain varietiesselected by both men and women indicating the importance of thesevarieties to them. The traditional varieties Lubang and Kainte werefrequently mentioned by farmers in their top ten list. The same wastrue for a glutinous variety, Pilit puwa, which was also frequently citedby both men and women. Although the traditional variety was seldomplanted in the community, its preference by farmers of Lubang andKainte showed that the characteristics of these varieties were ideal tofarmers. Moreover, farmers in the community maintained varietiesthat had a special purpose such as glutinous rice. It was also notedthat farmers’ selections are quite diverse in the community thatindicated farmer’s preference on this type of varieties.

52
Table 7. Free-list salience index test results indicating the order and frequency of mention of rice varieties by women respondents.
Informants (n) = 6 women, items (yi) = 57 varieties, longest list = 39
Index Matrix dVarieties a Sequence b Frequencyc 1 e 2 3 4 5 6
Index f
O8g 0 6 100 100 100 67 67 100 89Japang 1 5 67 97 84 51 0 94 66Ka Emilh 2 6 58 17 96 62 78 75 64Lubangh 3 6 17 53 60 46 100 69 58Kainteh 4 6 8 57 80 5 89 56 49Masipag 2g 5 4 75 40 0 87 81 0 47RC 4g 6 3 42 0 100 95 0 0 40Los banosg 7 3 0 93 56 97 0 0 41MBh 8 3 0 10 0 100 0 88 33Pilit puwah 9 4 0 87 44 31 0 31 32RC 10g 10 4 50 0 12 92 0 38 32Hubahibg 11 3 0 0 88 54 0 50 32Panganahawg 12 3 0 0 36 49 0 63 25IR 66g 13 3 0 63 0 79 0 6 25Magsayag 14 2 0 77 68 0 0 0 24Abrag 15 2 0 73 0 72 0 0 2466 puwah 16 2 0 60 0 77 0 0 23MS 13g 17 2 0 47 0 85 0 0 22Pilit tapolI 18 3 0 83 16 28 0 0 21MS 29g 19 2 0 43 0 82 0 0 21Red sikith 20 2 0 70 0 44 0 0 197 tonnerg 21 2 83 33 0 0 0 0 19Bordagolg 22 2 33 0 0 74 0 0 18IR 42g 23 2 0 0 52 0 56 0 1877 puwah 24 2 0 0 0 59 0 44 17Dinoradoh 25 2 0 80 0 8 0 0 15RC 18g 26 2 0 27 0 64 0 0 15Pilit putig 27 1 0 90 0 0 0 0 15RC 12g 28 1 0 0 0 90 0 0 15IR 77g 29 1 92 0 0 0 0 0 15Pilit lubangh 30 2 0 0 40 0 44 0 14C4g 31 2 0 0 0 56 22 0 13Tongkingg 32 1 0 0 76 0 0 0 13Terimasg 33 1 0 0 72 0 0 0 12Red miracleh 34 2 0 23 0 41 0 0 11Red bordagolh 35 1 0 67 0 0 0 0 11a Varieties with highest index and frequency indicated most commonly known.b Sequence = the position of mention on a given varietyc Frequency = the number of individuals mentioning a particular varietyd Index matrix = count – sequence ------------------------ x 100 counte 1 –6 = informant’s individual indexf Index = group indexg White seed coat varietyh Red seed coat varietyI Purple seed coat variety
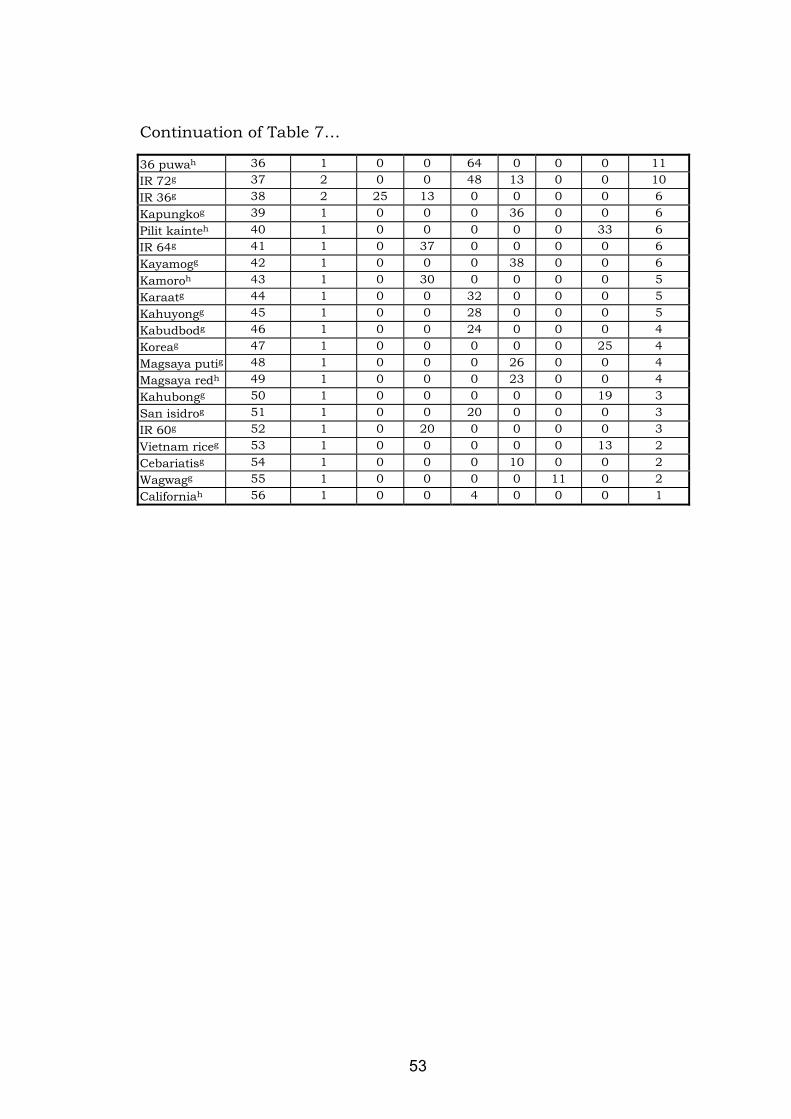
53
Continuation of Table 7…
36 puwah 36 1 0 0 64 0 0 0 11IR 72g 37 2 0 0 48 13 0 0 10IR 36g 38 2 25 13 0 0 0 0 6Kapungkog 39 1 0 0 0 36 0 0 6Pilit kainteh 40 1 0 0 0 0 0 33 6IR 64g 41 1 0 37 0 0 0 0 6Kayamogg 42 1 0 0 0 38 0 0 6Kamoroh 43 1 0 30 0 0 0 0 5Karaatg 44 1 0 0 32 0 0 0 5Kahuyongg 45 1 0 0 28 0 0 0 5Kabudbodg 46 1 0 0 24 0 0 0 4Koreag 47 1 0 0 0 0 0 25 4Magsaya putig 48 1 0 0 0 26 0 0 4Magsaya redh 49 1 0 0 0 23 0 0 4Kahubongg 50 1 0 0 0 0 0 19 3San isidrog 51 1 0 0 20 0 0 0 3IR 60g 52 1 0 20 0 0 0 0 3Vietnam riceg 53 1 0 0 0 0 0 13 2Cebariatisg 54 1 0 0 0 10 0 0 2Wagwagg 55 1 0 0 0 0 11 0 2Californiah 56 1 0 0 4 0 0 0 1

54
Table 8. Free-list salience index test results indicating the order and frequency of mention of rice by men respondents.
Informants (n) = 6 men, items (yi) = 73 varieties, longest list = 54
Index Matrix dVarieties a Sequence b Frequencyc 1 e 2 3 4 5 6
Index f
Lubangh 0 5 0 77 77 100 59 100 69Ka emilh 1 5 50 91 80 54 85 0 60Japang 2 5 31 100 100 59 32 0 54Kainteh 3 5 0 0 73 98 56 94 54Panganahawg 4 5 0 55 70 37 62 88 52IR 66g 5 5 0 73 0 69 97 69 51IR 72g 6 5 0 68 90 85 38 0 47O8g 7 4 25 95 97 57 0 0 46Pilit puwah 8 5 0 32 7 67 88 56 42IR 42g 9 4 44 45 40 0 35 75 40MS 13g 10 4 19 0 47 72 76 0 36RC 10g 11 3 0 86 87 39 0 0 35IR 64g 12 4 0 36 0 91 50 25 34MS 2g 13 4 0 0 43 70 79 13 3477 puwah 14 3 0 82 0 33 82 0 33Arbeling 15 4 0 0 13 87 94 0 32Magsayag 16 4 56 64 60 0 9 0 3236 puwah 17 3 81 0 0 28 0 63 29Kamuroh 18 2 0 0 83 0 91 0 29IR 77g 19 3 94 0 0 31 44 0 28Hubahibg 20 4 0 59 63 20 21 0 27RC 28g 21 3 0 23 57 80 0 0 27RC 18g 22 3 0 0 20 81 41 0 24IR 60g 23 2 75 0 0 0 65 0 23Kabudbod 24 2 88 50 0 0 0 0 23Bordagolg 25 4 69 5 10 48 0 0 22IR 36g 26 3 0 0 93 30 0 0 2166 putig 27 2 100 0 0 15 0 0 19MS 29g 28 2 0 0 27 74 0 0 17a Varieties with highest index and frequency indicated most commonly known.b Sequence = the position of mention on a given varietyc Frequency = the number of individuals mentioning a particular varietyd Index matrix = count – sequence ------------------------ x 100 counte 1 –6 = informant’s individual indexf Index = group indexg White seed coat varietyh Red seed coat varietyI Purple seed coat variety

55
Continuation of Table 8…MS 37g 29 1 0 0 0 0 100 0 17Pilit putig 30 2 0 27 0 0 68 0 16Margayah 31 1 0 0 0 96 0 0 16IR 8g 32 1 0 0 0 94 0 0 16IR 74g 33 1 0 0 0 93 0 0 16Agusang 34 2 0 0 0 35 53 0 15Ka jesusg 35 1 0 0 0 89 0 0 15Pilit chinag 36 2 0 0 0 61 24 0 14IR 44g 37 1 0 0 0 83 0 0 14Karaatg 38 1 0 0 0 0 0 81 14RC 5g 39 1 0 0 0 78 0 0 13Miracleg 40 2 0 0 67 7 0 0 12CC 13g 41 1 0 0 0 0 74 0 12Promisinglineg
42 1 0 0 0 0 71 0 12
MBh 43 3 6 14 0 48 0 0 117 tonnerg 44 1 63 0 0 0 0 0 11Pilit Arabong 45 1 0 0 0 63 0 0 11Los Banosg 46 2 0 0 0 46 15 0 10MS 35g 47 2 0 0 23 0 0 31 9Pilit tapolI 48 2 0 0 3 0 0 50 9Mestizag 49 1 0 0 0 56 0 0 9Californiah 50 1 0 0 0 52 0 0 9Red sikith 51 2 0 0 50 0 0 0 8IR 28g 52 1 0 0 0 0 47 0 8Italiang 53 1 0 0 0 50 0 0 8Pilitkaintihang
54 1 0 0 0 44 0 0 7
Pilit kagubag 55 1 0 0 0 43 0 0 7RC 22g 56 1 0 0 0 41 0 0 7Ka luisg 57 1 0 0 0 0 0 44 766 puwah 58 3 13 9 0 13 0 0 6Milagrosag 59 1 38 0 0 0 0 0 6Ilon-ilong 60 2 0 0 0 26 3 0 5Tongkingg 61 2 0 0 0 0 26 6 5IR 32g 62 1 0 0 30 0 0 0 5Dinoradoh 63 1 0 0 0 0 29 0 5RC 4g 64 2 0 0 0 2 0 19 4Sibilitish 65 1 0 0 0 22 0 0 4Ala 18g 66 1 0 18 0 0 0 0 3Karunsingh 67 1 0 0 17 0 0 0 3Kahubongg 68 1 0 0 0 19 0 0 3IR 22g 69 1 0 0 0 17 0 0 3San isidrog 70 1 0 0 0 0 18 0 3Tinimasg 71 1 0 0 0 6 0 0 1C4g 72 1 0 0 0 4 0 0 1

56
5.2.2 Gender and division of labor and tasks
Gender division of labor varies from one society and culture andover time. The type of work done by men and women can bedistinguished between productive work (production) and reproductivework (reproduction).
“Production includes the production of goods andservices for income and subsistence. It is … mainlyrecognized and valued as work by individuals andsocieties, and which is most commonly included innational economic statistics. Both women and menperform productive work, but not all of this is valued orrewarded the same way. Reproductive workencompasses the care and maintenance of thehousehold and its members, such as cooking, washing,cleaning, nursing, bearing children and looking afterthem, building and maintaining shelter. This work isnecessary, yet it is rarely considered of the same valueas productive work. It is normally unpaid and is notcounted in conventional economic statistics. It is mostlydone by women (March et al., 1999:p19)”.
5.2.2.1 Crop production and management
The definition of household adapted by this study describes it as asocial organization where people live together under one roof, eat fromone kitchen and share a common budget (United Nations, 1988). Thecomposition of a household was a male adult (husband), a femaleadult (wife) and children. Extended families were common whererelatives, more often parent of the husband or wife, lived in the samehousehold. Household members had certain roles and performed taskswhich were sometimes clearly delineated for certain tasks but moreoften overlapping with others.
Tables 9 and 10 show the varying tasks and responsibilities ofmen and women in rice production. Men were responsible in majorproduction activities from seedling preparation to marketing. Whilewomen had only two tasks that were of major responsibility, which arepicking up of golden snails during land preparation and keeping thefinancial resources. Women’s major contributions shared with theirhusbands were sowing seeds, transplanting, water management,

57
selecting and drying seeds, harvesting, storage and marketing. Mendid those tasks that required heavy physical work such as landpreparation. In activities where husband and wife equally worked, themen usually shouldered the heavy work. For example in drying ofseeds, men were assigned to carry the sacks to and from the housewhile women raked the seeds to dry evenly.
Rola (1995) in her study in the upland areas of the Philippinesobserved the same pattern in division of labor and tasks. Men wereespecially in-charge in tasks that requires heavy field work. Theirwork was comprised of land preparation, seedling preparation(construction of seedbeds), weeding, and fertilization. Women andchildren also made a considerable contribution to production ofagricultural commodities. Contrary to a man’s tasks, women wereexpected to perform lighter tasks. There were also many tasks thathusband and wife equally shared. Children also contributed to riceproduction on specific tasks. Male children were seen as doing thefather’s tasks when they are older. On the other hand, female childrenwere helping in a mother’s tasks. These showed how children at ayoung age were prepared and trained to do certain roles and performresponsibilities according to gender (Rola, 1995).

58
Table 9. Gender differentiated tasks in rice production and management according to 15 male respondents during focus
group discussion.
LaborTask ActivityHusband Wife Children Hired Labor
Preparing seeds **a *b
Constructing seedbed ** *Soaking seeds ** *Incubating the seeds **
1. Seedlingpreparation
Sowing seeds at seedbed ** **Plowing ** **Harrowing **Leveling **Clearing the dikes ** * **Filling-up and fixing dikes ** *
2. Landpreparation
Picking-up golden snails * **Pulling out seedlings ** *3. PlantingTransplanting ** ** ** **Clearing dikes ** ** **4. Weed
management Weeding rice paddies ** **Irrigating before weeding ** **5. Water
management Irrigating after weeding ** **6. Soil fertilitymanagement
Broadcasting inorganic beforetransplanting
**
Broadcasting organic duringharrowing
** *
7. Pest anddiseasemanagement
** *
Observing rice field ** *Rogueing off types **Harvesting seeds separately **
8. Seed selection
Drying seeds separately ** *Cutting of panicles ** ** ** **9. HarvestingBundling and collectingpanicles
** * ** **
Threshing ** * ** **Blower ** * ** **
10. Post harvesthandling
Storage ** ** **Allocation of harvest ** *Selling of harvest ** *
11. Marketing
Keeping financial resources **Spreading rice straw ** **Repairing canal for damage **
12. Other postharvest activities
Checking rice field if ready fornext planting season
**
a ** Majorb * Minor
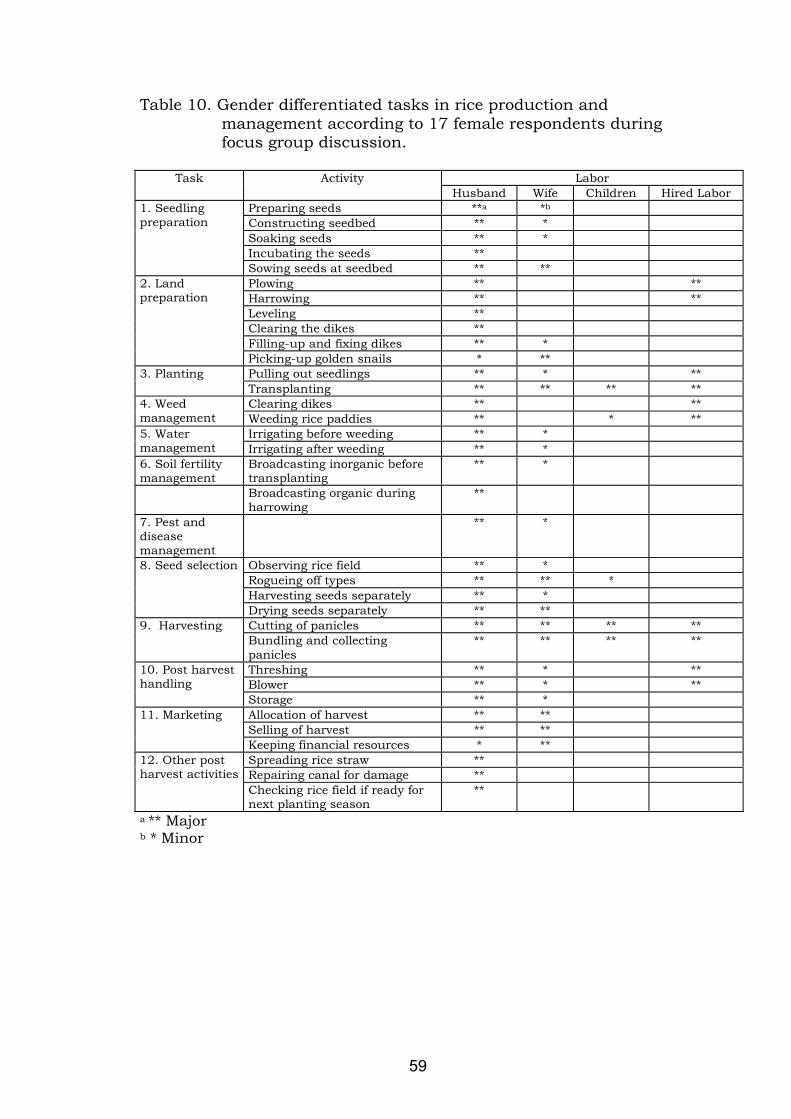
59
Table 10. Gender differentiated tasks in rice production and management according to 17 female respondents during focus group discussion.
LaborTask ActivityHusband Wife Children Hired Labor
Preparing seeds **a *b
Constructing seedbed ** *Soaking seeds ** *Incubating the seeds **
1. Seedlingpreparation
Sowing seeds at seedbed ** **Plowing ** **Harrowing ** **Leveling **Clearing the dikes **Filling-up and fixing dikes ** *
2. Landpreparation
Picking-up golden snails * **Pulling out seedlings ** * **3. PlantingTransplanting ** ** ** **Clearing dikes ** **4. Weed
management Weeding rice paddies ** * **Irrigating before weeding ** *5. Water
management Irrigating after weeding ** *6. Soil fertilitymanagement
Broadcasting inorganic beforetransplanting
** *
Broadcasting organic duringharrowing
**
7. Pest anddiseasemanagement
** *
Observing rice field ** *Rogueing off types ** ** *Harvesting seeds separately ** *
8. Seed selection
Drying seeds separately ** **Cutting of panicles ** ** ** **9. HarvestingBundling and collectingpanicles
** ** ** **
Threshing ** * **Blower ** * **
10. Post harvesthandling
Storage ** *Allocation of harvest ** **Selling of harvest ** **
11. Marketing
Keeping financial resources * **Spreading rice straw **Repairing canal for damage **
12. Other postharvest activities
Checking rice field if ready fornext planting season
**
a ** Majorb * Minor

60
Men said the contribution of women was lesser compared to hiscontribution. This opinion was also shared by the women (Table 11).However in specific tasks, women respondents viewed seed selectionand marketing were major contribution that the wife shared with thehusband but the men respondents thought differently. This situationwas also observed by Res (1983) in a rainfed lowland rice growing areain another province in the Philippines. Men valued their owncontribution more than women’s work.
Table 11. Perception of men and women farmers on the percent labor contribution of household member and hired laborers in rice production and management.
Labor Men (%) Women (%)
Husband 59 58Wife 15 15Children 6 7Hired 19 17Grandmother/Mother 1 3
Furthermore, the time allocation study on rice production showedhusbands provided more time than their wife and children (Figure 6).However, hired laborers took considerably more time doing the landpreparation, weed management and harvesting.
Figure 6. Time allocated to rice production work per rice growing season according to 6 men and 6 women respondents.
Productive work in rice farming was considered a male role. It wascustomary for men to do the heavy workload for practical reasons.Social norms and values may also have an indirect bearing on this, as
0.00100.00200.00300.00400.00500.00
Husband Wife Male Child FemaleChild
Hired
Labor
No.
of H
ours

61
families who allowed their women to perform heavy work such asplowing or weeding may be frowned upon.
However, reproductive work was seen as a woman’s domain. Thewife spent a lot of time in household work (Figure 7). During landpreparation, transplanting, and harvesting women assisted only iflabor was not sufficient. Otherwise, she would be responsible forfeeding the husband and hired workers. Among young couples, thewife spent more time at home doing more household work and rearingchildren. Women performed multiple tasks at home daily. For example,she prepared and cooked food while she also took care of the childrenor washed the laundry. Husbands when not busy with rice farminghelped in taking care of the children and occasionally performed houserepairs and maintenance.
Figure 7. Time allocated to household work per day according to 6 men and 6 women respondents.
5.2.2.2 Seed management
Seed management was important to farmers since most of themused their own seeds for the next planting season. Varieties would beplanted in the same field at least three seasons before it was replacedby farmers. When asked why they replace the variety after threeseasons, the reason given was that they observed that performance interms of yield and pest resistance declined after some period. If newvarieties were needed, then they procure these from fellow farmers inthe community or nearby community. To choose the next variety, they
0.002.004.006.008.00
10.00
Husband Wife Male Child FemaleChild
Household Members
No.
of H
ours
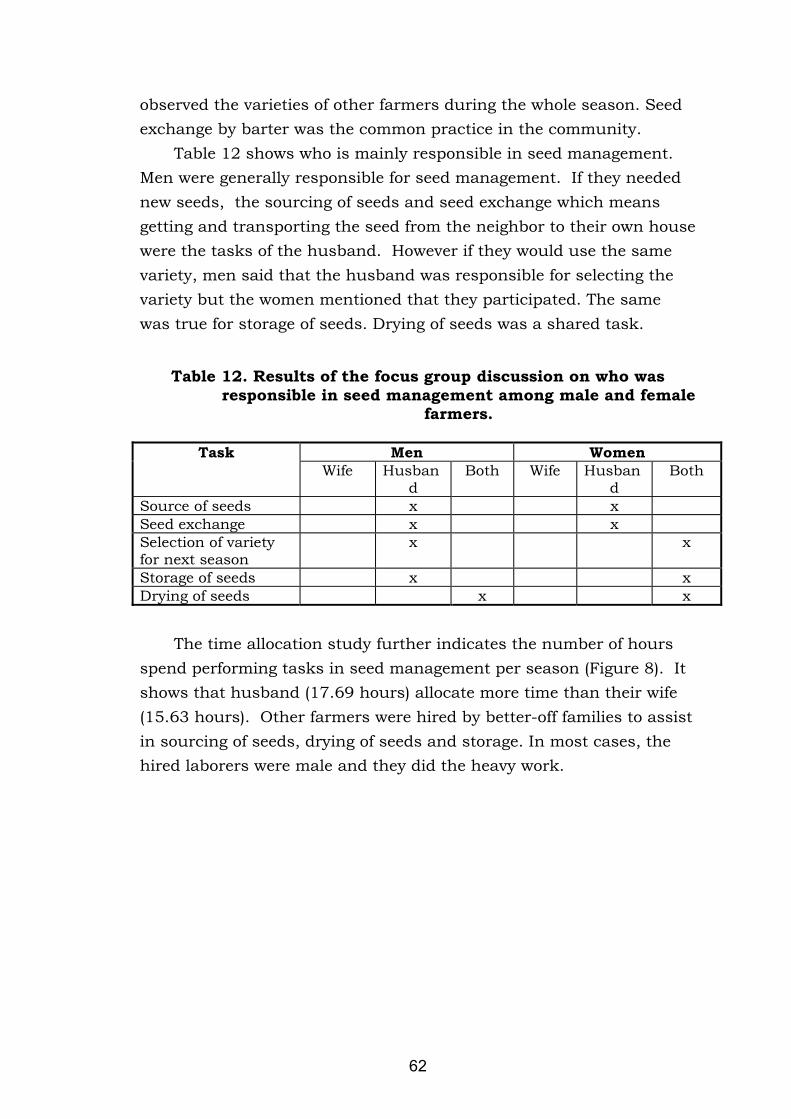
62
observed the varieties of other farmers during the whole season. Seedexchange by barter was the common practice in the community.
Table 12 shows who is mainly responsible in seed management.Men were generally responsible for seed management. If they needednew seeds, the sourcing of seeds and seed exchange which meansgetting and transporting the seed from the neighbor to their own housewere the tasks of the husband. However if they would use the samevariety, men said that the husband was responsible for selecting thevariety but the women mentioned that they participated. The samewas true for storage of seeds. Drying of seeds was a shared task.
Table 12. Results of the focus group discussion on who was responsible in seed management among male and female
farmers.
Men WomenTaskWife Husban
dBoth Wife Husban
dBoth
Source of seeds x xSeed exchange x xSelection of varietyfor next season
x x
Storage of seeds x xDrying of seeds x x
The time allocation study further indicates the number of hoursspend performing tasks in seed management per season (Figure 8). Itshows that husband (17.69 hours) allocate more time than their wife(15.63 hours). Other farmers were hired by better-off families to assistin sourcing of seeds, drying of seeds and storage. In most cases, thehired laborers were male and they did the heavy work.

63
Figure 8. Time allocated to seed management per rice growing season according to 6 men and 6 women respondents.
5.2.3. Gender and decision-making
Decision-making is an important in access to and control ofresources. In a household, decision-making matters are participatedby its household members. In most cases, it is the husband and wife.Although, it greatly varies depending upon ethnicity, class and society.
5.2.3.1 Crop production and management
According to the respondents, decisions related to agriculturalmatters were generally reached by consensus between husband andwife. For instance, decisions on what variety to plant for the nextseason was discussed by the husband and wife. Although, some ofthem mentioned that husbands took the lead in the discussionespecially when the wife was not so involved with the productionactivities. There were also specific activities that a husband and wifeequally decided on such as allocating and marketing of their produce.
However, in daily household activities the wife took the majorresponsibility in decision matters. The husband and wife equallydecided on matters affecting their children such as schooling.
Table 13 shows an example of the decision-making betweenhusband and wife. This was the view of men and women farmers onwho decided on what variety to plant. In general, both men andwomen respondents agreed that the decision was shared by thehusband and wife. However, higher percentage (19%) of husbands
0.00
5.00
10.00
15.00
20.00
Husband Wife Male Child FemaleChild
Hired
Labor
No.
of H
ours

64
solely decided according to the male respondents. While, womenthought differently and listed a consensus decision instead.
Table 13. Perception of men and women farmers on who decided on what variety to plant.
Decision-maker Men (%) Women (%)Husband only 19 14Husband and Wife 67 76Husband, Wife, Children,Grandmother andmother
14 5
Husband andGrandmother
0 5
When asked why a high percentage of shared decision-making byhusband and wife, all agreed that avoiding conflict between them wasthe main reason. Moreover, since rice was the major source of incomeof the family, then decisions must be made by the two of them.
5.2.3.2 Seed management
Decision-making in seed management exhibited the same trend ascrop production and management. Husband and wife shareddecisions.
Table 14 shows that both husband and wife decide on where toselect the seeds in their rice paddies if their own seeds would be usedfor the next planting season. It also showed that men viewedhusbands as making the major decisions alone more than the womenrespondents did. Women respondents more often listed shareddecision making in selecting the seeds.

65
Table 14. Perception of men and women farmers on who decided where to select the seeds from individual semi- structured interviews.
Who Men (%) Women (%)
Husband only 19 14Husband and Wife 71 76Husband, Wife, Children,Grandmother and Mother
10 5
Husband and Grandmother 0 5
During the focus group discussion, men and women unanimouslyagreed that decision-making in seed management was equally madeby husband and wife. The reason given was to avoid blaming one partywhen the crop or variety fails. Table 15 shows that equal responsibilityin decision-making at aspects of seed management was preferred byall the respondents. For instance the source of seeds, whether to usetheir own seed or change it would be discussed between the two ofthem. The majority of the couples usually took turns to visit the ricefield to observe the performance of the rice plants that would behelpful in the discussion later on.
Table 15. Results of the focus group discussion on who decided in seed management among men and women farmers.
Men WomenTaskWife Husban
dBoth Wife Husban
dBoth
Source of seeds x xSeed selection x xStorage of seeds x xDrying of seeds x xSelection of varietyfor next season
x x
Seed exchange x x
Decisions were equally shared between husband and wifeespecially when it was related and important to their food concern,family matters and survival.
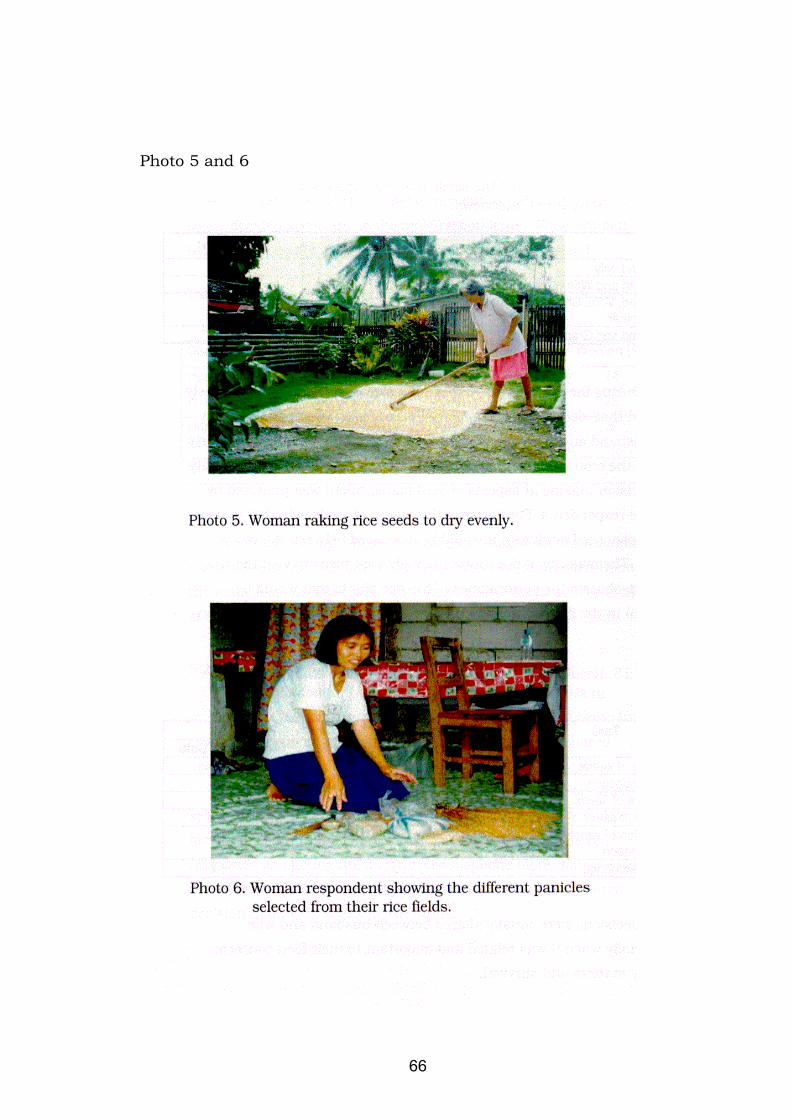
66
Photo 5 and 6

67
5.3 Socio-economic influence in crop management and development
5.3.1 Socio-economic status, resources and rice varieties
Table 16 indicates the number of rice varieties identified by thethree socio-economic groups during the focus group discussion. Thisshowed that the middle socio-economic group listed the most numberof varieties. It further indicated that traditional variety (56%) top theirlist compared to modern variety (20%) and farmers selection (24%).The same trend was noted with the low and high socio-economicgroups. However, the data from various socio-economic groups werestatistically not significant.
Table 16. Number of varieties known and identified by the three socio-economic groups.
Modernvariety
Farmerselection
Traditionalvariety
TotalGroup
No. % No. % No. % No. %Low 7 19 13 34 18 47 38ns 100Middle 9 20 11 24 26 56 46 ns 100High 7 18 13 33 19 49 39 ns 100Total 23 19 37 30 63 51 123 100ns = non significant
The number of varieties known by the different socio-economicgroups could be an indicator of how farmers were involved inproduction practices. In general, the results indicated that middlefarmers were more knowledgeable about rice varieties compared to theother two socio-economic groups.
5.3.2 Influence of socio-economic status to crop production and management
The level of socio-economic status was influential in determiningthe division of labor and tasks of men and women farmers in riceproduction. During the focus group discussion, the respondents wereasked to identify their major and minor contribution to various tasksand activities of rice production. Tables 17, 18 and 19 shows the
68
results of their contribution to specific tasks in rice production by low,middle and high socio-economic groups, respectively.
It was observed that women in low socio-economic groupsparticipated more in rice production compared to its counterpart in themiddle and high socio-economic groups. They were more involved ontransplanting and harvesting. They are also part of the hired labor.Women’s major responsibility to pick up golden snails and to keepfinancial resources were similar at all socio-economic groups. Othertasks that husband and wife equally shared were sowing of seeds,transplanting, harvesting, marketing and storage.
Men in the three socio-economic groups had major responsibilityin rice production. However, there was varying participation dependingon the socio-economic level. Men from the low and middle groups werecontributing more in specific activities while hired labor were muchmore used in high socio-economic groups. This was attributed to thecapacity of high socio-economic group to pay for hired laborers.
Furthermore, family labor including children and women weredominant in low socio-economic groups especially in tasks such asland preparation, transplanting, weeding and harvesting. Table 20supports the observation that low socio-economic groups used morefamily labor than middle and high socio-economic groups. Hired laborwas commonly used by high socio-economic groups.
In terms of decision-making, a consensus between husband andwife was the most common pattern in all the three socio-economicgroups. But, husbands in low socio-economic groups dominated morethe discussion than in the middle and high socio-economic groups(Table 20). Table 21 indicates the same observation on decision-making by family members on what variety to plant for the nextseason.

69
Table 17. Gender differentiated tasks in rice production and management according to 8 low socio-economic group respondents during focus group discussion.
LaborTask ActivityHusband Wife Children Hired Labor
Preparing seeds **a *b
Constructing seedbed ** *Soaking seeds **Incubating the seeds **
1. Seedlingpreparation
Sowing seeds at seedbed ** **Plowing ** ** **Harrowing ** ** **Leveling ** ** **Clearing the dikes **Filling-up and fixing dikes **
2. Landpreparation
Picking-up golden snails * **Pulling out seedlings ** **3. PlantingTransplanting ** ** ** **Clearing dikes ** **4. Weed
management Weeding rice paddies ** **Irrigating before weeding ** *5. Water
management Irrigating after weeding ** *6. Soil fertilitymanagement
Broadcasting inorganic beforetransplanting
**
Broadcasting organic duringharrowing
**
7. Pest anddiseasemanagement
** *
Observing rice field ** *Rogueing off types ** *Harvesting seeds separately ** *
8. Seed selection
Drying seeds separately ** *Cutting of panicles ** ** ** **9. HarvestingBundling and collecting panicles ** * ** **Threshing ** * ** **Blower ** * ** **
10. Post harvesthandling
Storage ** **Allocation of harvest ** **Selling of harvest ** **
11. Marketing
Keeping financial resources * **Spreading rice straw **Repairing canal for damage **
12. Other postharvest activities
Checking rice field if ready for nextplanting season
**
a ** Majorb * Minor
Table 18. Gender differentiated tasks in rice production and management according to 11 middle socio-economic group respondents during focus group discussion.
LaborTask ActivityHusband Wife Children Hired Labor
1. Seedlingpreparation
Preparing seeds **a *b

70
Constructing seedbed ** **Soaking seeds ** *Incubating the seeds **Sowing seeds at seedbed ** *Plowing ** ** **Harrowing ** **Leveling **Clearing the dikes ** ** **Filling-up and fixing dikes ** **
2. Landpreparation
Picking-up golden snails * **Pulling out seedlings ** **3. PlantingTransplanting ** ** ** **Clearing dikes **4. Weed
management Weeding rice paddies ** **Irrigating before weeding ** **5. Water
management Irrigating after weeding ** **6. Soil fertilitymanagement
Broadcasting inorganic beforetransplanting
** **
Broadcasting organic duringharrowing
** **
7. Pest anddiseasemanagement
** *
Observing rice field ** *Rogueing off types ** *Harvesting seeds separately ** *
8. Seed selection
Drying seeds separately ** **Cutting of panicles ** ** ** **9. HarvestingBundling and collecting panicles ** * ** **Threshing ** * ** **Blower ** * ** **
10. Post harvesthandling
Storage ** *Allocation of harvest ** **Selling of harvest ** **
11. Marketing
Keeping financial resources * **Spreading rice straw ** **Repairing canal for damage **
12. Other postharvest activities
Checking rice field if ready for nextplanting season
**
a ** Majorb * Minor
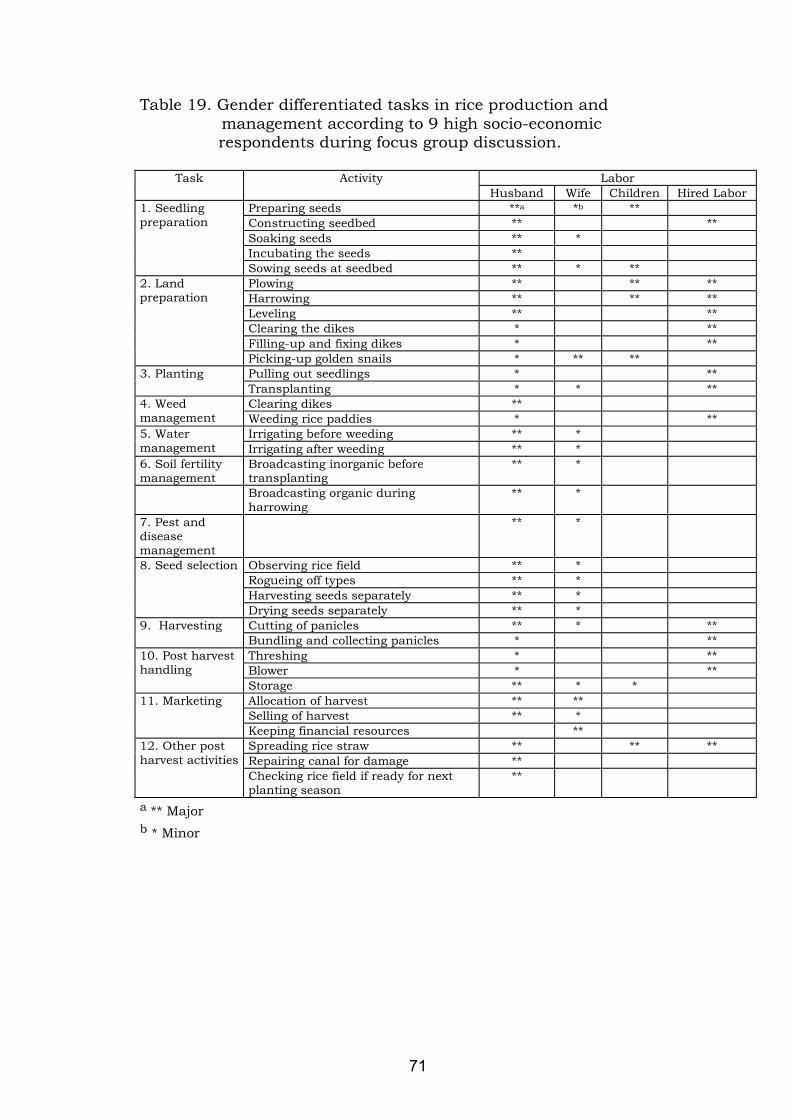
71
Table 19. Gender differentiated tasks in rice production and management according to 9 high socio-economic
respondents during focus group discussion.
LaborTask ActivityHusband Wife Children Hired Labor
Preparing seeds **a *b **Constructing seedbed ** **Soaking seeds ** *Incubating the seeds **
1. Seedlingpreparation
Sowing seeds at seedbed ** * **Plowing ** ** **Harrowing ** ** **Leveling ** **Clearing the dikes * **Filling-up and fixing dikes * **
2. Landpreparation
Picking-up golden snails * ** **Pulling out seedlings * **3. PlantingTransplanting * * **Clearing dikes **4. Weed
management Weeding rice paddies * **Irrigating before weeding ** *5. Water
management Irrigating after weeding ** *6. Soil fertilitymanagement
Broadcasting inorganic beforetransplanting
** *
Broadcasting organic duringharrowing
** *
7. Pest anddiseasemanagement
** *
Observing rice field ** *Rogueing off types ** *Harvesting seeds separately ** *
8. Seed selection
Drying seeds separately ** *Cutting of panicles ** * **9. HarvestingBundling and collecting panicles * **Threshing * **Blower * **
10. Post harvesthandling
Storage ** * *Allocation of harvest ** **Selling of harvest ** *
11. Marketing
Keeping financial resources **Spreading rice straw ** ** **Repairing canal for damage **
12. Other postharvest activities
Checking rice field if ready for nextplanting season
**
a ** Majorb * Minor
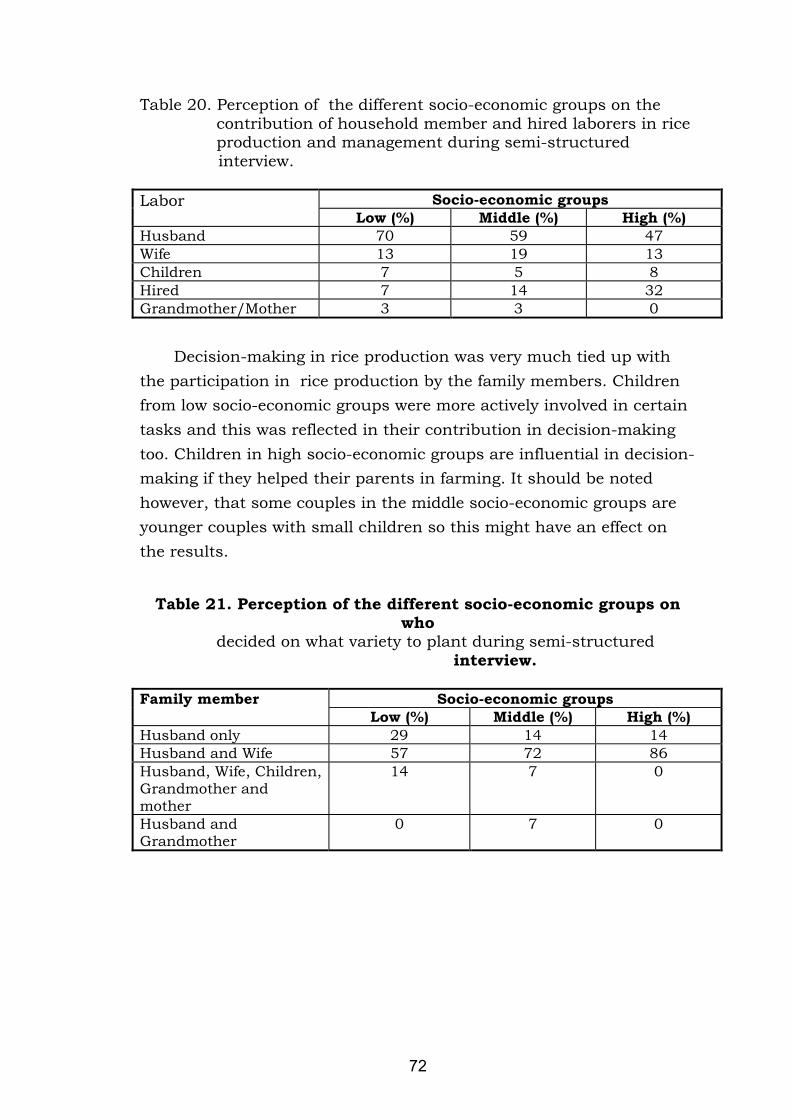
72
Table 20. Perception of the different socio-economic groups on the contribution of household member and hired laborers in rice production and management during semi-structured
interview.
Socio-economic groupsLaborLow (%) Middle (%) High (%)
Husband 70 59 47Wife 13 19 13Children 7 5 8Hired 7 14 32Grandmother/Mother 3 3 0
Decision-making in rice production was very much tied up withthe participation in rice production by the family members. Childrenfrom low socio-economic groups were more actively involved in certaintasks and this was reflected in their contribution in decision-makingtoo. Children in high socio-economic groups are influential in decision-making if they helped their parents in farming. It should be notedhowever, that some couples in the middle socio-economic groups areyounger couples with small children so this might have an effect onthe results.
Table 21. Perception of the different socio-economic groups onwho
decided on what variety to plant during semi-structured interview.
Socio-economic groupsFamily memberLow (%) Middle (%) High (%)
Husband only 29 14 14Husband and Wife 57 72 86Husband, Wife, Children,Grandmother andmother
14 7 0
Husband andGrandmother
0 7 0

73
5.3.3 Influence of socio-economic status on seed management
Contributions to seed management by household members varieddepending on the socio-economic groups. Table 22 indicates theresponsibility of the husband and wife according to the respondents.In most tasks, both husband and wife were in-charge in theperforming the activities. These were storage of seeds, drying of seedsand selection of variety for next season. Moreover, the husbands wereresponsible for source of seeds, seed selection and seed exchange.Women had no sole tasks in seed management.
Table 22. Results of the focus group discussion on who was responsible in seed management among men and women
farmers of the different socio-economic groups.
Socio-economic groupLow Middle High
Task
Wif
e
Hus
band
Bot
h
Wif
e
Hus
band
Bot
h
Wif
e
Hus
band
Bot
h
Source of seeds x x xSeed selection x x xStorage of seeds x x xDrying of seeds x x xSelection ofvariety for nextseason
x x x
Seed exchange x x x
High socio-economic group had more number of tasks sharedbetween husband and wife compared to low and middle socio-economic groups. These tasks were seed selection, storage of seeds,drying of seeds selection of variety for next season and seed exchange.This might be attributed to the amount of time available for the womenof the different socio-economic groups. Women of high socio-economicgroups were older compared to the low and middle groups thereforethey had less household work and no children to rear.
Decision-making in seed management concerns were consensusbetween husband and wife in the three socio-economic groups (Table23). Family members were also part of the decision-making in seedmanagement. Table 24 shows an example on who decides in selectinga variety. The same trend was observed in terms of decision-making

74
with crop production and management. The high socio-economicgroups had higher percentage of decision-making consensus of thehusband and wife in seed management than low and middle socio-economic groups.
Table 23. Results of the focus group discussion on who decided in seed management among men and women farmers of the different socio-economic groups.
Socio-economic groupLow Middle High
TaskW
ife
Hus
band
Bot
h
Wif
e
Hus
band
Bot
h
Wif
e
Hus
band
Bot
h
Source of seeds x x xSeed selection x x xStorage of seeds x x xDrying of seeds x x xSelection ofvariety for nextseason
x x x
Seed exchange x x x
Table 24. Perception of the different socio-economic groups on who decided on what part of the rice field to select the seeds for planting material.
Socio-economic groupFamily memberLow (%) Middle (%) High (%)
Husband only 21 14 14Husband and Wife 65 72 86Husband, Wife, Children,Grandmother andmother
14 7 0
Husband andGrandmother
0 7 0
Moreover, the husbands in low socio-economic group took majorresponsibility in decision-making. Husbands and wives shareddecisions in the middle and high socio-economic groups.
75
5.4 Seed selection criteria and methods used by Boholano farmers
5.4.1 Farmer’s selection criteria
As mentioned earlier, selection criteria were crucial to farmers forincreasing genetic diversity in farmers’ field. The respondents duringthe focus group discussions were asked to list down their selectioncriteria. Afterwards, they were asked to rank them according to itsimportance and preference. Table 25 shows the list of selectioncriteria preferred by gender and socio-economic groupings. Moreover,Table 26 shows the Spearman’s rank correlation between the selectioncriteria of farmers across all groups that indicated high significance. Ahigh degree of similarity between the selection criteria of farmers wasobserved.
Nazarea- Sandoval (1995) developed the plant identification andclassification using the criteria commonly used by farmers indiscriminating among commonly known plants9.
“1. Morphological: basic structure or appearancewithout any reference to use or cultivationrequirements, for example, size and texture of leaves,length and color of stem; 2. Life habit: physiological andecological adaptations of the particular plant, forexample, where it usually grows, whether it creeps orstands erect; 3. Agronomic: properties that have abearing on cultivation requirements, for example,whether it is prone to lodging, whether it is preferred bybirds and rats; 4. Functional: use value attached by thelocal population to the particular plant, for example, forshelter, medicine, animal feed, decoration, or humanconsumption; 5. Gastronomic: evaluation of palatabilityor desirability of the plant or its parts as food, forexample, aromatic or flavorless, soft or hard, fit forguests and special occasions or good only for familymembers and for daily use; 6. Economic: commercialvalue or potential of the plant or its parts, for example,commands high or low price in the market, whether thegrains or the flowers can be sold; 7. Combination: theuse of two or more criteria together… (p. 113-114)”.
9 Nazarea-Sandoval classification was used for both cultivated and non-cultivated plants, however, inthis study focussed on rice and used the agronomic, morphological and gastronomic characteristics.
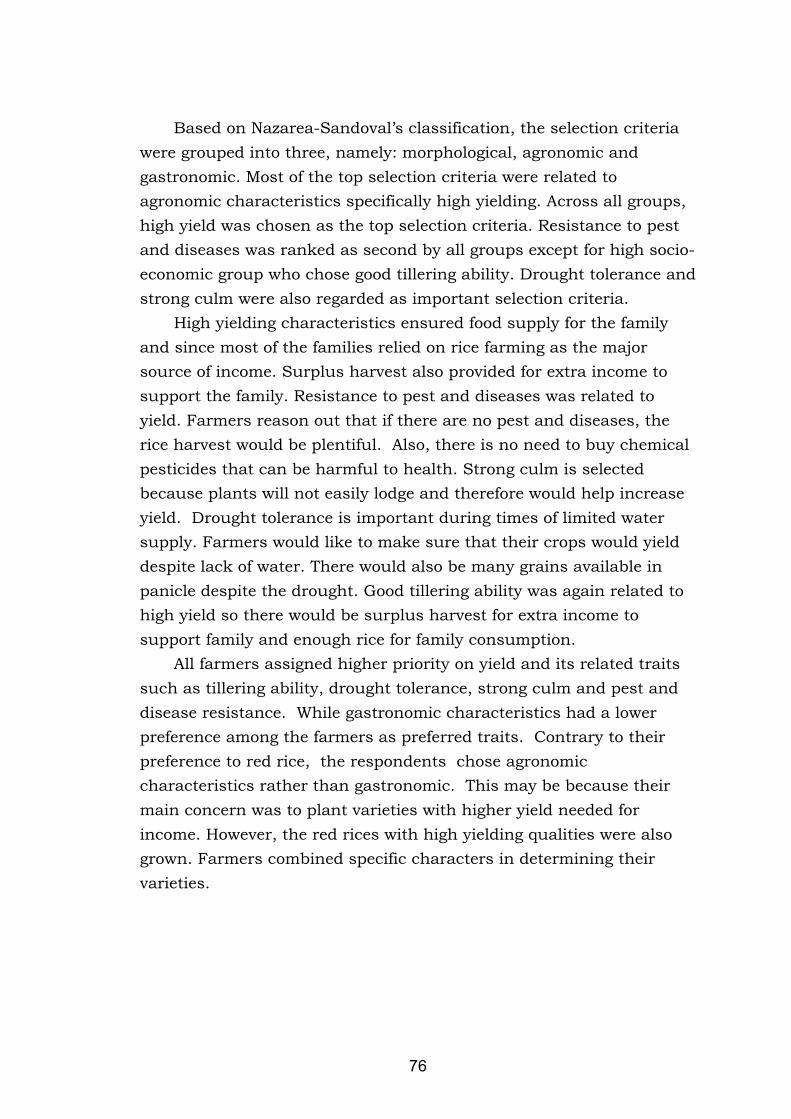
76
Based on Nazarea-Sandoval’s classification, the selection criteriawere grouped into three, namely: morphological, agronomic andgastronomic. Most of the top selection criteria were related toagronomic characteristics specifically high yielding. Across all groups,high yield was chosen as the top selection criteria. Resistance to pestand diseases was ranked as second by all groups except for high socio-economic group who chose good tillering ability. Drought tolerance andstrong culm were also regarded as important selection criteria.
High yielding characteristics ensured food supply for the familyand since most of the families relied on rice farming as the majorsource of income. Surplus harvest also provided for extra income tosupport the family. Resistance to pest and diseases was related toyield. Farmers reason out that if there are no pest and diseases, therice harvest would be plentiful. Also, there is no need to buy chemicalpesticides that can be harmful to health. Strong culm is selectedbecause plants will not easily lodge and therefore would help increaseyield. Drought tolerance is important during times of limited watersupply. Farmers would like to make sure that their crops would yielddespite lack of water. There would also be many grains available inpanicle despite the drought. Good tillering ability was again related tohigh yield so there would be surplus harvest for extra income tosupport family and enough rice for family consumption.
All farmers assigned higher priority on yield and its related traitssuch as tillering ability, drought tolerance, strong culm and pest anddisease resistance. While gastronomic characteristics had a lowerpreference among the farmers as preferred traits. Contrary to theirpreference to red rice, the respondents chose agronomiccharacteristics rather than gastronomic. This may be because theirmain concern was to plant varieties with higher yield needed forincome. However, the red rices with high yielding qualities were alsogrown. Farmers combined specific characters in determining theirvarieties.

77
Table 25. List of selection criteria and their rank according to farmers’ preference from focus group discussion.
Gender Socio-economic statusSelection CriteriaMale Female Low Middle High
High yielding 1 1 1 1 1Resistant to pest and diseases 2 2 2 2 3Good tillering ability 3 4 4 4 2Strong culm 13 5 3 8 8Drought tolerance 7 3 8 3 6High spikelet fertility 6 9 13 13 4Long panicle 5 8 11 6 5Low panicle shattering 14 6 7 7 7Plants do not need too muchfertilizer
9 13 6 10 9
Early maturity 8 11 12 11 10Short plant height 12 12 9 14 11Good cooking quality 11 14 14 5 12Good eating quality 11 14 14 17 12Heavy grains 4 7 5 15 13Good grain quality 10 10 10 9 14Big grains 16 18 15 12 15Red rice 17 17 16 19 16White rice 17 17 16 16 16Filling to the stomach 15 16 nia 18 17
TOTAL number ofcharacteristics
17 18 16 19 17
a ni = not included as selection criteria

78
Table 26. Spearman’s rank correlation between the selection criteria used by gender and socio-economic groups.
Gender Socio-economic groupsMale Female Low Middle High
Male 1.00 --- --- --- ---
Female 0.735** 1.00 --- --- ---Low 0.657** 0.872** 1.00 --- ---Middle 0.596** 0.742** 0.656** 1.00 ---High 0.750** 0.830** 0.708** 0.753** 1.00** significant at p< 0.01
Furthermore, the respondents were asked to list down thevarieties they knew with description to validate the preferred selectioncriteria. The top ten varieties according to the different groups weredescribed in Tables 27, 28, 29, 30 and 31. Across all groups,agronomic characteristics such as high yield, resistance to pest anddiseases, strong culm, tillering ability, drought tolerance, earlymaturity and heavy grain weight were the selection criteria used byfarmers in choosing the seeds and varieties. Male farmers describedthe varieties using agronomic, morphological and gastronomiccharacteristics compared to women who used agronomic andgastronomic characteristics for description. There were no differencesamong the socio-economic groups. The farmers used agronomic,morphological and gastronomic characteristics to describe theirvarieties.
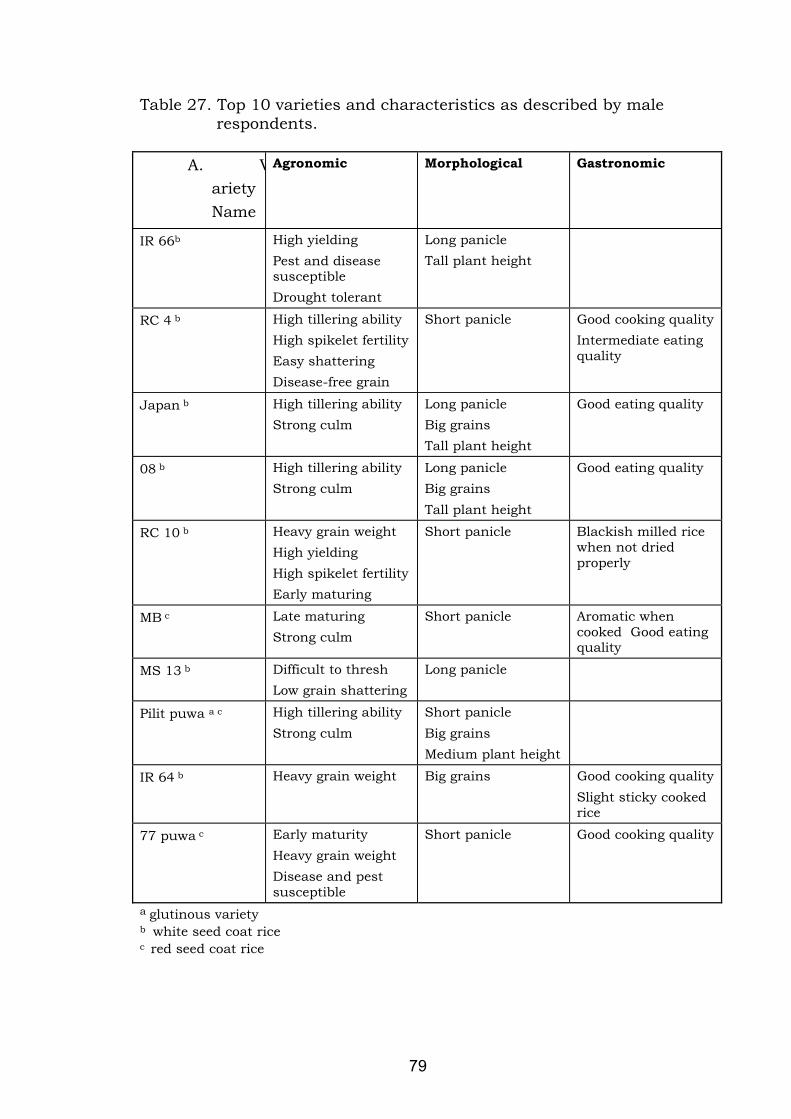
79
Table 27. Top 10 varieties and characteristics as described by male respondents.
A. VarietyName
Agronomic Morphological Gastronomic
IR 66b High yieldingPest and diseasesusceptibleDrought tolerant
Long panicleTall plant height
RC 4 b High tillering abilityHigh spikelet fertilityEasy shatteringDisease-free grain
Short panicle Good cooking qualityIntermediate eatingquality
Japan b High tillering abilityStrong culm
Long panicleBig grainsTall plant height
Good eating quality
08 b High tillering abilityStrong culm
Long panicleBig grainsTall plant height
Good eating quality
RC 10 b Heavy grain weightHigh yieldingHigh spikelet fertilityEarly maturing
Short panicle Blackish milled ricewhen not driedproperly
MB c Late maturingStrong culm
Short panicle Aromatic whencooked Good eatingquality
MS 13 b Difficult to threshLow grain shattering
Long panicle
Pilit puwa a c High tillering abilityStrong culm
Short panicleBig grainsMedium plant height
IR 64 b Heavy grain weight Big grains Good cooking qualitySlight sticky cookedrice
77 puwa c Early maturityHeavy grain weightDisease and pestsusceptible
Short panicle Good cooking quality
a glutinous varietyb white seed coat ricec red seed coat rice

80
Table 28. Top 10 varieties and characteristics as described female respondents.
Variety Name Agronomic Morphological GastronomicMS 13 b Disease-free grains
Strong culm
08 b Strong culmDisease-free grainsHeavy grain weightHigh yieldingHigh tillering ability
Good cooking quality
MS 29 b High tillering abilityStrong culm
MS 2 b High tillering abilityStrong culmHigh yieldingDisease-free grainsHeavy grain weight
Good cooking quality
MB (puwa) c Strong culmPest and diseaseresistant
AromaticGood cooking quality
IR 66 b Drought sensitiveHigh tillering abilityDisease-free grains
Good eating quality
Japan(puti) b Strong culmHeavy grain weightHigh tillering abilityDisease-free grains
Big grains Leftover rice easilygets spoiledSlight sticky cookedrice
RC 4 b Disease-free grainsLow tillering abilityEarly maturity
Good cooking quality
Pilit puwaa c High tillering ability Very sticky cookedriceHigh milling recovery
36 puwa c Heavy grain weightEarly maturity
Good cooking quality
a glutinous varietyb white seed coat ricec red seed coat rice
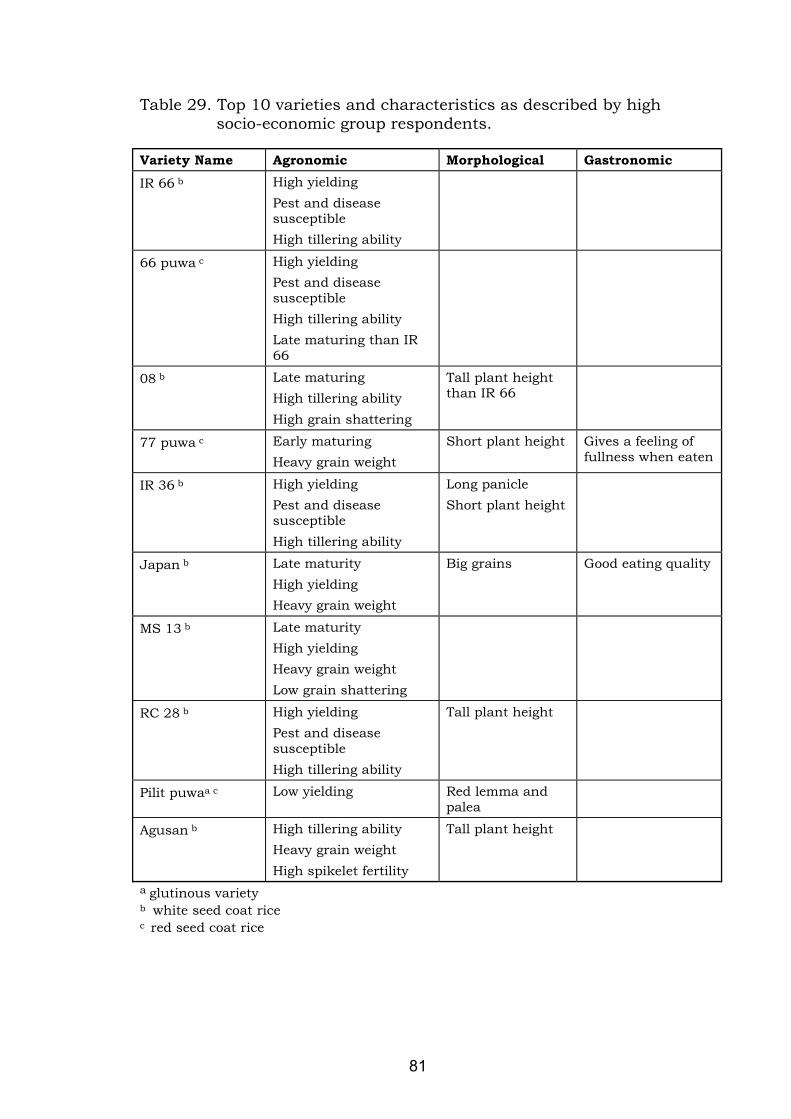
81
Table 29. Top 10 varieties and characteristics as described by high socio-economic group respondents.
Variety Name Agronomic Morphological GastronomicIR 66 b High yielding
Pest and diseasesusceptibleHigh tillering ability
66 puwa c High yieldingPest and diseasesusceptibleHigh tillering abilityLate maturing than IR66
08 b Late maturingHigh tillering abilityHigh grain shattering
Tall plant heightthan IR 66
77 puwa c Early maturingHeavy grain weight
Short plant height Gives a feeling offullness when eaten
IR 36 b High yieldingPest and diseasesusceptibleHigh tillering ability
Long panicleShort plant height
Japan b Late maturityHigh yieldingHeavy grain weight
Big grains Good eating quality
MS 13 b Late maturityHigh yieldingHeavy grain weightLow grain shattering
RC 28 b High yieldingPest and diseasesusceptibleHigh tillering ability
Tall plant height
Pilit puwaa c Low yielding Red lemma andpalea
Agusan b High tillering abilityHeavy grain weightHigh spikelet fertility
Tall plant height
a glutinous varietyb white seed coat ricec red seed coat rice

82
Table 30. Top 10 varieties and characteristics as described by middle socio-economic group respondents.
Variety Name Agronomic Morphological Gastronomic
IR 66 a Early maturingPest and diseasesusceptibleHigh tillering ability
Short plant height Good cookingqualities
Japan a Strong culmHeavy grain weightLate maturing
Long paniclesBig grains
Good eating qualitySlightly stickycooked rice
08 a Strong culmHeavy grain weightLate maturing
Long paniclesBig grains
Good eating qualitySlightly stickycooked rice
MS 2 a High tillering abilityEarly maturingLodging resistantHigh yielding
Slightly stickycooked rice butgood eating quality
RC 4 a Low tillering abilityHeavy grain weightStrong culmDisease-free grain
Good eating qualitySlightly stickycooked rice
IR 64 a Drought resistantHeavy grain weight
Long panicle Slightly stickycooked rice
77 puwa b Early maturingHigh tillering abilityHeavy grain weightLow yielding
Small grains Good cookingqualityLeftover rice easilyhardens aftercooking
RC 10 a Early maturingHeavy grain weightHigh tilleringHigh spikelet fertilityDrought tolerant
Short panicle
Los Banos a High spikelet fertilityHigh yielding
Long panicleTall plant height
Good cookingquality
MB b High tillering abilityHigh yielding
Good cookingquality
a white seed coat riceb red seed coat rice
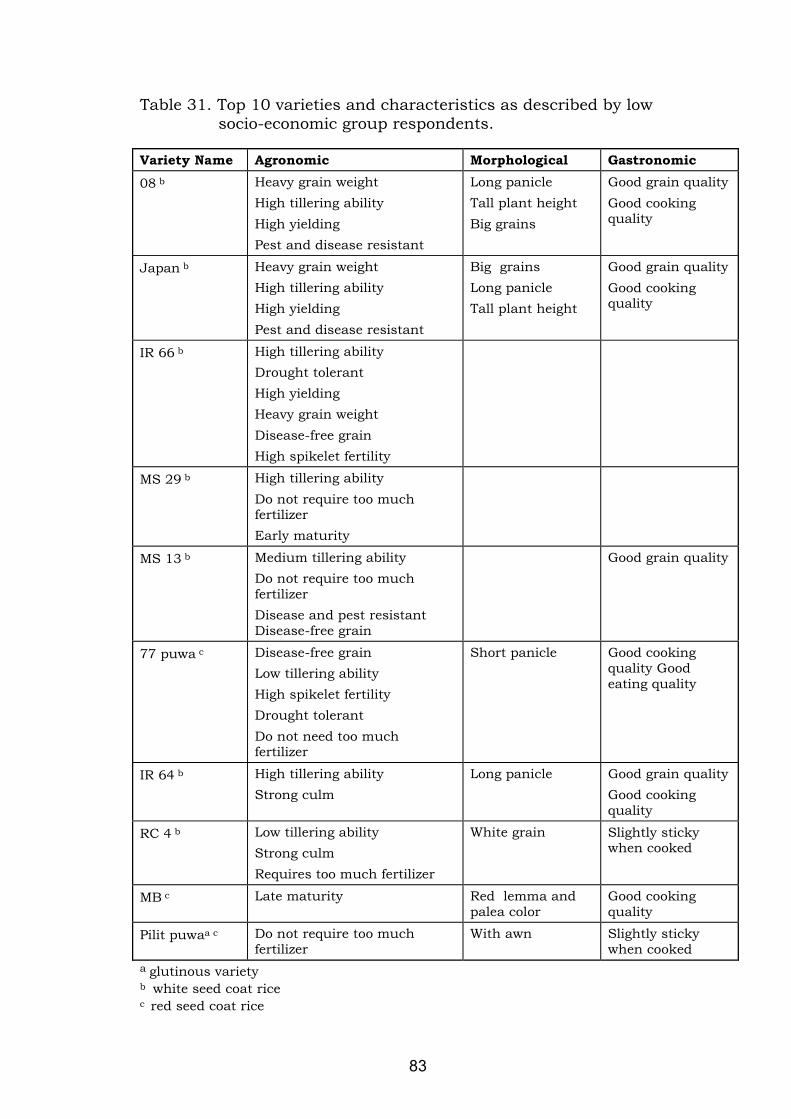
83
Table 31. Top 10 varieties and characteristics as described by low socio-economic group respondents.
Variety Name Agronomic Morphological Gastronomic08 b Heavy grain weight
High tillering abilityHigh yieldingPest and disease resistant
Long panicleTall plant heightBig grains
Good grain qualityGood cookingquality
Japan b Heavy grain weightHigh tillering abilityHigh yieldingPest and disease resistant
Big grainsLong panicleTall plant height
Good grain qualityGood cookingquality
IR 66 b High tillering abilityDrought tolerantHigh yieldingHeavy grain weightDisease-free grainHigh spikelet fertility
MS 29 b High tillering abilityDo not require too muchfertilizerEarly maturity
MS 13 b Medium tillering abilityDo not require too muchfertilizerDisease and pest resistantDisease-free grain
Good grain quality
77 puwa c Disease-free grainLow tillering abilityHigh spikelet fertilityDrought tolerantDo not need too muchfertilizer
Short panicle Good cookingquality Goodeating quality
IR 64 b High tillering abilityStrong culm
Long panicle Good grain qualityGood cookingquality
RC 4 b Low tillering abilityStrong culmRequires too much fertilizer
White grain Slightly stickywhen cooked
MB c Late maturity Red lemma andpalea color
Good cookingquality
Pilit puwaa c Do not require too muchfertilizer
With awn Slightly stickywhen cooked
a glutinous varietyb white seed coat ricec red seed coat rice

84
In general, the results indicated that selection criteria were notgreatly influenced by gender and socio-economic status since most ofthem preferred high yielding characteristics. However, the malerespondents described varieties with agronomic and morphologicalcharacteristics while females used more agronomic and gastronomiccharacters. Therefore, gender roles are related to characteristics ofmales and females and appeared to reflect women’s secondaryinvolvement in rice production at the field level coupled with theirprimary responsibility in food processing. The difference between menand women’s use of morphological characteristics may also be relatedto the predominance of men in the work of field observation.
5.4.2 Farmer’s selection methods
There were two types of seed source common within thecommunity. These were seeds from their own farm and seeds fromneighbors. Most of the farmers planted their own seeds for threeseasons before replacing it with a variety from the neighbor. Newvarieties and seeds from government extension seldom reached thecommunity. If farmers wanted new varieties, they had to travel to theformal research institutions to access seeds. Farmers used two typesof selection methods for producing seeds and new varieties whichwere related to the manner of harvesting. These were panicle selectionand mass selection. The mass selection method was commonly usedby farmers to select the seeds of the variety for next planting season.Panicle selection was used by farmers to select one or two panicles forcreating new varieties.
According to the respondents, almost all of the families used massselection by bulk harvesting in choosing the seeds. Seeds for plantingmaterial were harvested before the food grain. The farmers observedthe performance of rice plants during all growth stages. In most of thetimes, the rice paddies with enough sunlight and good quality seedswere selected as the source of seeds for next planting. Center ricepaddies had an advantage because of less damage and disturbance bypests such as ants and people passing by the rice paddies.Disturbance was attributed by farmers to affect the pollination ofseeds which resulted to poor seed quality. Farmers removed the off-

85
types to make the seeds uniform. Selected plants were then harvestedin bulk.
Few farmers did panicle selection. The purpose of panicle selectionwas to experiment and create new varieties. It was usually done byharvesting panicles of off types from the rice field as source of newmaterials. Families who did not perform panicle selection believedthat this process was laborious. Males were mostly doing panicleselection. Farmers harvested off-types panicles favored by them. Thesewere usually long panicle, low shattering, big grains, and red grains iffrom white grains. One panicle with the described characters per plantwas usually harvested per plant. However, if some panicles looksimilar, it will be bundled together. The panicles were air dried andhung in the kitchen where it was drier. Each panicle was separatelygrown the following season for observation and multiplication. Oneseed was usually planted per hill. The seeds of these plants from onepanicle would be harvested together. This would be grown for threeseasons by bulking the seeds until such time that sufficient seedswere available for large areas.
Special care was given to seeds. The planting materials wereseparately processed from the food grains. They were usuallythreshed, dried and placed in a sack for storage in a warm place at thehouse.
The practice of farmers to a limited degree was similar to the massselection technique used by plant breeders. Mass selection is theidentification of superior plants from a population and the bulking ofseeds to form the next generation (Welsh, 1990 as cited by Jusu,1999). Farmers selected the best plants, harvested and bulked theseeds for the next season. Such methods could lead to improvement ofdesirable characteristics by farmers. For instance, new populations ofrice varieties with red pericarp could be generated in several seasonsbecause of the continuous selection and removal of unwanted offtypes by farmers.
Jusu’s (1999) work with rice in Sierra Leone discussed positiveand negative mass selection performed by farmers. He referred topositive mass selection when farmers selected and maintained paniclesof desirable plants and developed them into a new variety. Most of thepanicles of the varieties were discarded in favor of positive newcharacteristics of the few panicles. Negative mass selection referred to

86
rogueing of the off-types by farmers to maintain uniformity. The sameobservation held true with this research. Boholano farmers whocreated new varieties performed positive selection while othersmaintain the characteristic of their varieties conducted negative massselection. Furthermore, it could be said that the enhancement of redrices was positive mass selection towards their own selection criteria.

87
5.5 Red rice diversity and the Boholano farmers
5.5.1 An overview of the importance of red rice and its diversity
Farmer selections were abundantly grown in the community ofCampagao (Table 5). Some of these varieties were red rices. TheBoholanos preferred red rices because of its better eating qualities.Male and female farmers planted these varieties as it fits with theirpreferences. Farmers planted them because of its higher market valueand longer suppression of hunger (CBDC, 1999b). This feeling offullness was an important criteria farmers consider in a variety. Therewere some popular beliefs in other countries of the medicinalproperties of rices because of compounds in pigmentation. Forexample in China, the “black rice” is believed to have “bodystrengthening” value. This was correlated to presence of vitamin C,riboflavin, iron, calcium and phosphorous of pigment rice compared tonon-pigmented rice. According to Srinivasa Rao (1976) as cited byJuliano (1983) milled red rices in India were found to have lowercarbohydrates and starch contents. This was probably because of thehigher protein content and residual phenolics than non-pigmentedmilled rice.
Male and female farmers given their preference for red ricescontinually create new varieties that fit their own criteria from limitedmaterials available in the community. Traditional and modern varietiesare used as the source of variability. Diverse red rices were found inthe rice-growing areas of the province (CBDC, 1999a). The fourfarmers’ selections in Bohol, namely, RC 18 selection, 66 puwa, 77puwa and 36 red were examples of farmer’s innovations.
Principal component analysis (PCA) and cluster analysis wereused to analyze the characterization data of the eight rice varietiesfrom farmers, researchers and molecular analysis. PCA presents ascatter plot diagram reflecting the genetic similarities and differencesof the rice samples while cluster analysis is a dendogram that linktogether in clusters more similar rice samples.
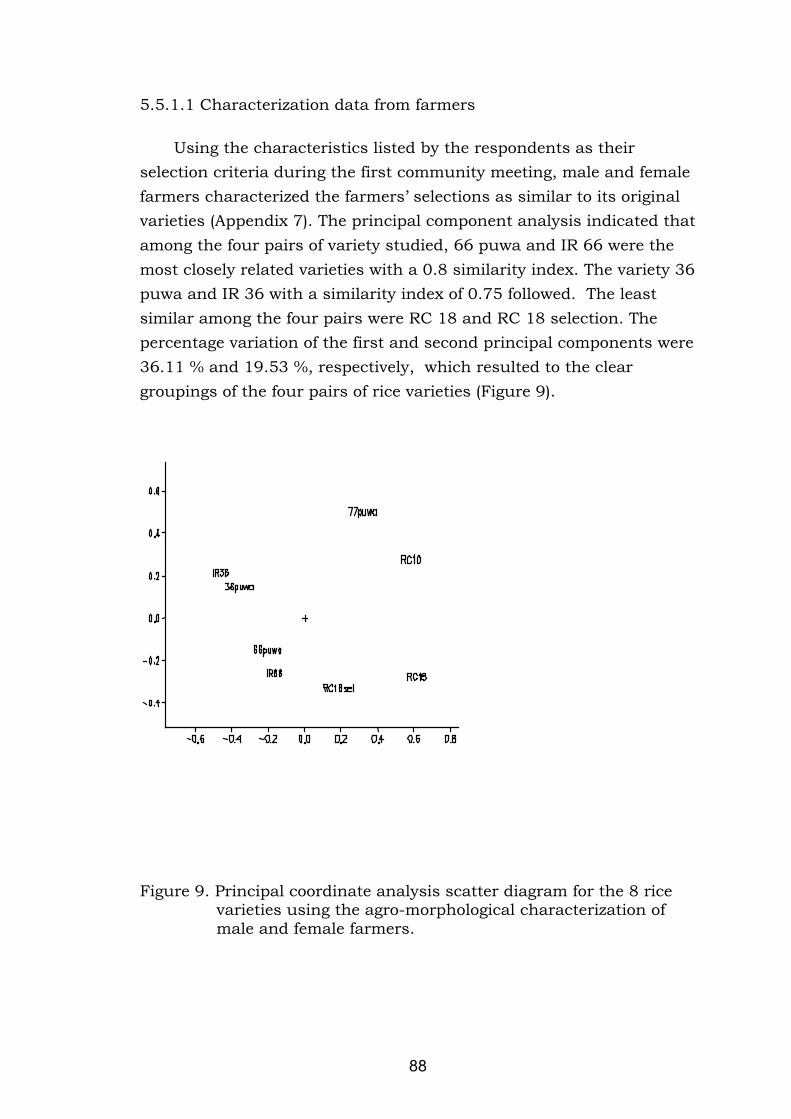
88
5.5.1.1 Characterization data from farmers
Using the characteristics listed by the respondents as theirselection criteria during the first community meeting, male and femalefarmers characterized the farmers’ selections as similar to its originalvarieties (Appendix 7). The principal component analysis indicated thatamong the four pairs of variety studied, 66 puwa and IR 66 were themost closely related varieties with a 0.8 similarity index. The variety 36puwa and IR 36 with a similarity index of 0.75 followed. The leastsimilar among the four pairs were RC 18 and RC 18 selection. Thepercentage variation of the first and second principal components were36.11 % and 19.53 %, respectively, which resulted to the cleargroupings of the four pairs of rice varieties (Figure 9).
Figure 9. Principal coordinate analysis scatter diagram for the 8 rice varieties using the agro-morphological characterization of male and female farmers.

89
Furthermore, cluster analysis showed the pairs of 66 puwa and IR66, 36 puwa and IR 36, and RC 18 and RC 18 selection were closelylinked together. Moreover, 66 puwa and IR 66 exhibited a highclustering than other varieties (Figure 10).
Figure 10. Cluster analysis depicting the eight varieties using the male and female farmer’s characterization data set.
Appendix 7 shows the agro-morphological characterizationaccording to farmer’s descriptions. The varieties 66 puwa and IR 66had only two characteristics, namely, spikelet fertility and seed coatcolor, as different. The farthest related varieties 77 puwa and RC 10had seven different characteristics.

90
5.5.1.2 Characterization data from researcher
Agro-morphological characterization of the eight varieties using 34qualitative and quantitative characteristics based on the standarddescriptors list of IRRI shows the level of similarity and differencesbetween the farmers’ selections and original varieties (Appendix 8).Seed coat color, culm and panicle characteristics of farmers’ selectionand original variety differed.
The PCA scatter diagram shows grouping of farmers’ selectionagainst the original varieties with the exception of 66 puwa and IR 66which grouped together. The percentage variation of the first andsecond principal components was 24.02 % and 23.45 %, respectively.The matrix further showed a high similarity of 0.82 between 66 puwaand IR 66 compared to the other pair of varieties that range from 0.40to 0.63.
Figure 11. Principal coordinate analysis of the agro-morphological characterization of rice varieties using standard descriptors.
Figure 12. Cluster analysis depicting the eight varieties using the standard descriptors’ list for rice characterization.

91
The cluster analysis revealed results similar to the PCA. Farmers’selections and original varieties were clearly separated in thedendogram. The farmer selections clustered together on top while theoriginal varieties were located on the bottom of the dendogram. 66puwa and IR 66 were the only exception with also the highest geneticsimilarity. This indicated that 66 puwa and IR 66 were closely relatedcompared to the other varieties.
5.5.1.3 Molecular data
Two primer combinations produced a total of 116 monomorphicand polymorphic bands. Results revealed that farmers’ selections weremore polymorphic than the original variety in all the four pairs (Table32). This indicated that farmers’ selection had higher genetic variationthan the original varieties.
Table 32. Monomorphic and polymorphic bands of the eight varieties scored from two primer combinations.
Number of bandsVarietiesMonomorphic Polymorphic
RC 18 111 5RC 18 selection 104 12IR 66 113 366 puwa 98 18RC 10 115 177 puwa 102 14

92
IR 36 114 236 puwa 94 22
PCA diagram shows that farmers selections and original varietiesare separately grouped from one another (Figure 13). The first andsecond principal components indicated a 31.78 % and 18.48 %variation, respectively. However, RC 18 selection were farthest amongthe eight varieties was an exception. Moreover, 66 puwa and IR 66were closely grouped among the four pairs of varieties. The similarityindex of this pair was highest at 0.85 followed by 36 puwa and IR 36with 0.75.
Figure 13. Principal coordinate analysis of the eight rice varieties using the molecular data set.
Further analysis of the molecular data using cluster analysisshowed farmer selections were grouped together while original varietieswere clustered (Figure 14). Varieties 66 puwa and IR 66 had the

93
highest genetic distance among the farmers’ selection and originalvariety pairs. Moreover, RC 18 and RC 10 had a high genetic distanceof 0.89 indicating their close relatedness. Similar with the PCA, thelowest genetic distance was seen with RC 18 selection with 0.50.
Figure 14. Cluster analysis depicting the molecular characterization of
the eight varieties.
Additionally, cluster analysis of the nine individuals per accessionshowed that original varieties were more homogenous than the farmerselections (Figure 15). Majority of the individuals of farmer selectionswere more scattered in the dendogram than modern varieties whichwere grouped together.
Furthermore, the computed allele frequency of the polymorphicbands showed that some of the farmers’ selections had presence ofbands that were absent in their respective original variety (Table 33).These are band numbers 4 and 17 for all pair of varieties. Thesefarmers’ selection in certain loci contains similar alleles. This allelefound in farmers’ selection might be linked with the red pericarp.However, the data should be further substantiated with genetic studies

94
to confirm this hypothesis. The presence of similar alleles on specificloci indicated that farmers are keen on observing change within apopulation. They are conscious that even small change in allelefrequency can be tapped to develop new materials.
Figure 15. Cluster analysis showing the level of variation between the nine individuals from each farmers’ selection and modern variety.

100
Table 33. Allelic frequency of polymorphic bands for each variety.
Band numberB. ariety
1 2 3 4 5 6 7 8 9 10 11 12 13 14 15 16 17 18 19 20
RC 18 0.00 1.00 0.00 0.00 0.89 0.00 0.11 0.11 0.89 0.00 1.00 0.00 1.00 1.00 0.00 0.00 0.00 0.11 0.00 0.00RC 18 selection 0.00 1.00 0.22 0.22 0.11 1.00 1.00 1.00 1.00 0.00 0.22 1.00 1.00 0.11 1.00 1.00 0.89 0.00 0.22 0.00
IR66 0.00 1.00 0.00 0.00 0.00 1.00 1.00 1.00 1.00 0.00 1.00 1.00 1.00 1.00 0.00 1.00 0.00 0.00 0.00 0.0066puwa 0.50 1.00 0.00 0.13 0.38 1.00 0.63 0.63 0.75 0.00 1.00 0.75 1.00 0.50 0.50 1.00 0.13 0.00 0.00 0.13
RC10 0.00 1.00 0.00 0.00 1.00 0.00 0.00 0.00 1.00 0.00 1.00 0.00 1.00 1.00 0.00 0.00 0.00 1.00 0.00 0.0077puwa 1.00 1.00 0.00 0.22 0.67 1.00 0.11 0.11 0.00 0.11 1.00 0.67 1.00 1.00 0.00 0.67 1.00 0.00 0.00 0.00
IR36 0.00 1.00 0.00 0.00 0.00 1.00 0.00 0.00 1.00 0.00 1.00 0.00 0.00 1.00 0.00 1.00 0.00 0.78 0.00 0.0036puwa 0.22 0.89 0.00 0.11 0.67 1.00 0.22 0.22 0.78 0.67 0.89 0.22 0.67 0.78 0.11 0.89 0.89 0.22 0.00 0.00
Band numberC. ariet
y21 22 23 24 25 26 27 28 29 30 31 32 33 34 35 36 37 38 39 40 41 42
D.
RC 18 0.00 1.00 0.00 0.00 1.00 1.00 0.11 1.00 0.00 0.00 0.11 1.00 1.00 0.00 1.00 0.00 0.00 0.00 0.00 0.00 0.00 0.00RC 18 selection 0.00 0.11 1.00 0.00 1.00 1.00 0.00 1.00 1.00 0.00 0.00 1.00 0.00 1.00 0.11 0.33 0.00 0.11 0.00 0.00 0.00 0.22
IR66 0.00 1.00 0.89 0.00 1.00 1.00 0.00 1.00 0.00 0.00 0.11 0.00 1.00 0.00 1.00 0.00 0.00 0.00 1.00 0.11 0.00 0.0066puwa 0.00 1.00 1.00 0.00 0.88 0.88 0.00 1.00 0.00 0.25 0.13 0.13 0.75 0.13 1.00 0.00 0.00 0.00 0.50 0.00 0.00 0.00
RC10 0.00 1.00 1.00 0.11 1.00 1.00 0.00 1.00 1.00 0.00 0.00 0.00 1.00 0.00 1.00 0.00 0.00 0.00 0.00 0.00 0.00 0.0077puwa 0.00 0.44 0.78 0.11 1.00 1.00 0.78 1.00 0.11 0.67 0.00 0.00 0.00 0.00 0.89 0.00 0.11 0.00 0.00 0.00 0.00 0.00
IR36 1.00 0.00 1.00 0.00 1.00 1.00 1.00 0.11 0.00 0.00 1.00 0.00 1.00 0.00 1.00 0.00 0.00 0.00 0.00 0.00 0.00 0.0036puwa 0.22 1.00 1.00 0.00 0.89 0.89 0.89 0.78 0.11 0.00 0.67 0.00 0.11 0.00 1.00 0.00 0.00 0.00 0.33 0.00 0.11 0.00
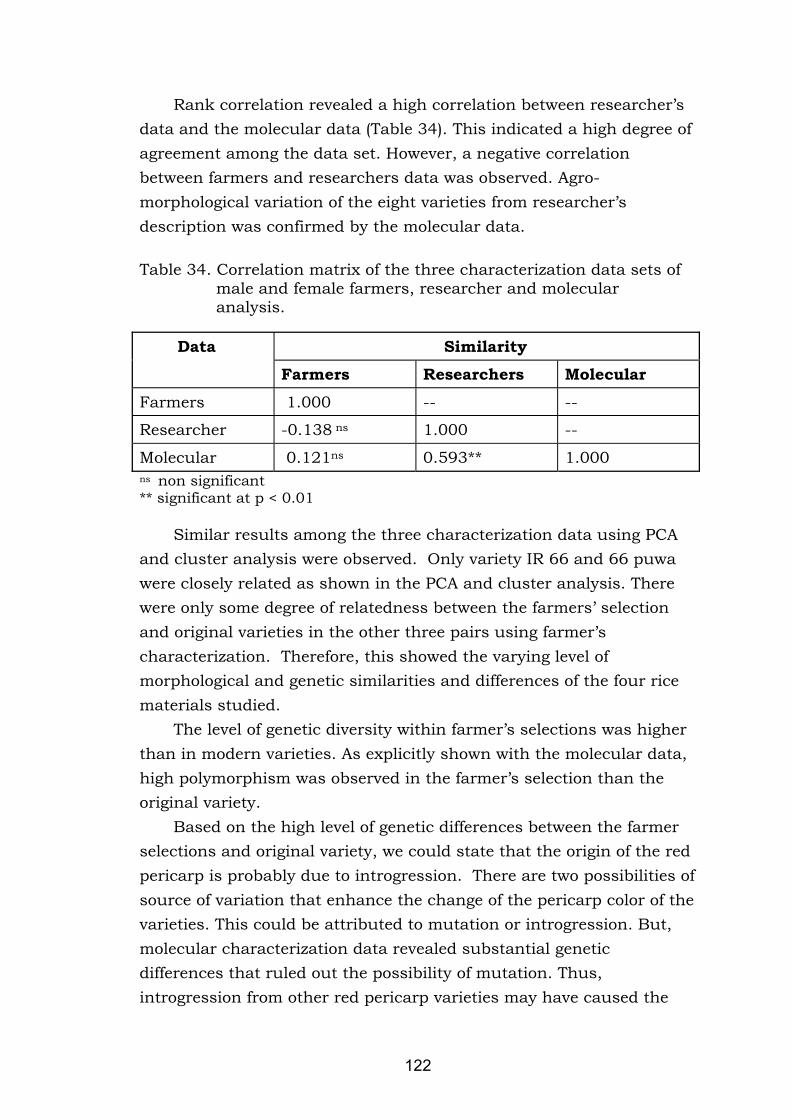
122
Rank correlation revealed a high correlation between researcher’sdata and the molecular data (Table 34). This indicated a high degree ofagreement among the data set. However, a negative correlationbetween farmers and researchers data was observed. Agro-morphological variation of the eight varieties from researcher’sdescription was confirmed by the molecular data.
Table 34. Correlation matrix of the three characterization data sets of male and female farmers, researcher and molecular analysis.
Similarity DataFarmers Researchers Molecular
Farmers 1.000 -- --
Researcher -0.138 ns 1.000 --
Molecular 0.121ns 0.593** 1.000 ns non significant
** significant at p < 0.01
Similar results among the three characterization data using PCAand cluster analysis were observed. Only variety IR 66 and 66 puwawere closely related as shown in the PCA and cluster analysis. Therewere only some degree of relatedness between the farmers’ selectionand original varieties in the other three pairs using farmer’scharacterization. Therefore, this showed the varying level ofmorphological and genetic similarities and differences of the four ricematerials studied.
The level of genetic diversity within farmer’s selections was higherthan in modern varieties. As explicitly shown with the molecular data,high polymorphism was observed in the farmer’s selection than theoriginal variety.
Based on the high level of genetic differences between the farmerselections and original variety, we could state that the origin of the redpericarp is probably due to introgression. There are two possibilities ofsource of variation that enhance the change of the pericarp color of thevarieties. This could be attributed to mutation or introgression. But,molecular characterization data revealed substantial geneticdifferences that ruled out the possibility of mutation. Thus,introgression from other red pericarp varieties may have caused the

123
change in pericarp color of the white pericarp modern varieties. Thepresence of red rice varieties in the community of Campagao may havecontributed to these changes. Farmers are consciously planting redrices and this might have cross-pollinated the modern varieties whenintroduced in the community. Through time and farmers selectionpressure, new varieties with red pericarp were selected and enhanced.
Furthermore, the selection pressure of farmers to develop newmaterials contributed to the increasing diversity of red rices. Becauseof their preferences for red rices, farmers looked out for uniquevarieties in rice fields every season. Some innovative farmers pickedout off-types from their rice fields to experiment with and grow thenext season.
The importance and diversity of red rices existing in thecommunity had created and enhanced the diversity of rice varieties.This had ensured the dynamic evolution of varieties in the farmingcommunity through utilization.

124
Photo 7.

125
5.5.2 Farmer’s knowledge and skills in enhancing red rices : threecases of farmer-selectors
This section will look at specific cases of the three farmers whoselected the farmers selections used in the study. Innovative farmerscontinue to select and experiment on different rice varieties that leadto new varieties and more genetic variability.
5.5.2.1 Mang Bernardo
Mang Bernardo was the farmer selector of 36 puwa variety. Hewas well-known in his community as a farmer selector. In fact, anaverage of five farmers asked for his variety as planting material perseason. In 1990, he harvested three panicles of an off-type from his IR36 ricefield. He had particular interest in this offtype because it hadlonger panicles, high spikelet fertility and red seed coat. The off-typeswere grown for the next three seasons by bulking the seeds of selectedplants. When a sufficient amount of seeds were available, he used thisas his planting material in a bigger area. He named the variety 36puwa since it was selected from IR 36 and puwa means red in the localdialect. The 36 puwa had the following characteristics such as goodmilling quality, round and long grain, thin husk (lemma and palea),medium tillering ability, awnless, strong lodging resistance, earlymaturity and good eating quality.
Table 35. Characterization of IR 36 and 36 puwa according to Mang Bernardo during the semi-structured interview.
Characteristics IR 36 36 puwaTillering ability High High (lesser than
IR 36)Lodging resistance Very strong StrongPlant height Normal Shorter than IR 36Maturity 3 months after
transplantingSame
Yield 60-80 cavans /ha(depending on input)
Same
Resistance to pest anddiseases
Resistant Same
Drought tolerance Tolerant SameGrain color White Red
5.5.2.2 Mang Cesinio
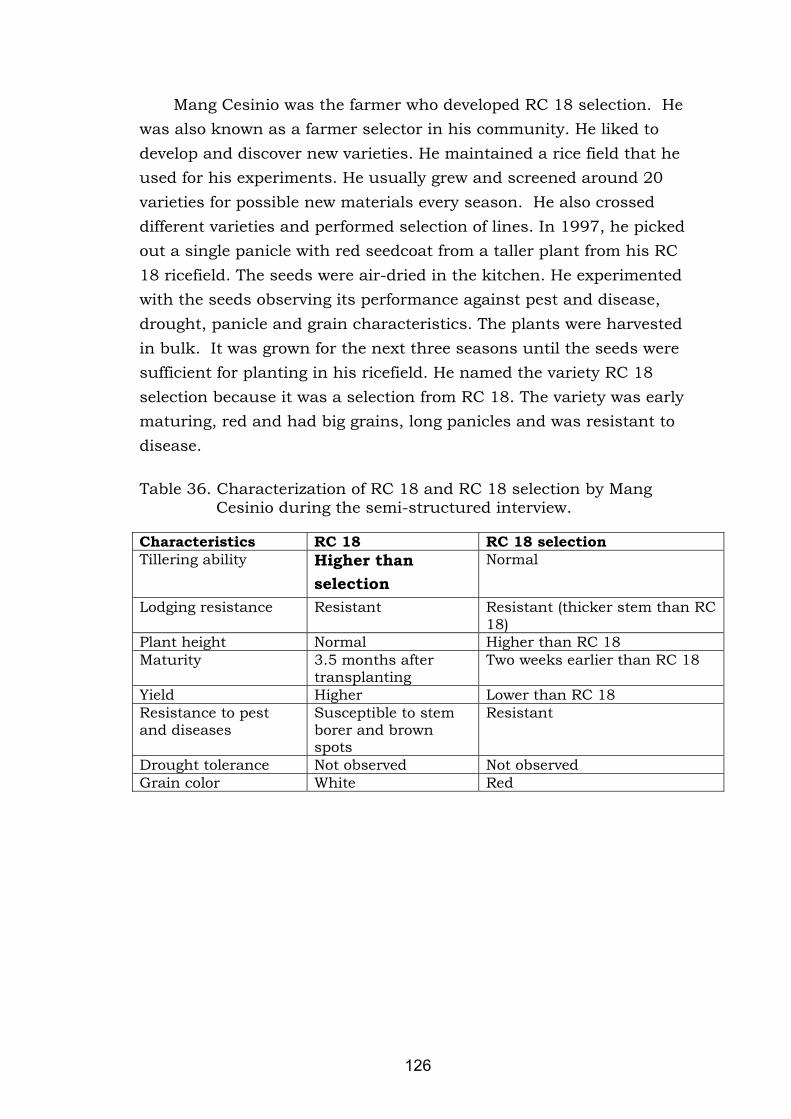
126
Mang Cesinio was the farmer who developed RC 18 selection. Hewas also known as a farmer selector in his community. He liked todevelop and discover new varieties. He maintained a rice field that heused for his experiments. He usually grew and screened around 20varieties for possible new materials every season. He also crosseddifferent varieties and performed selection of lines. In 1997, he pickedout a single panicle with red seedcoat from a taller plant from his RC18 ricefield. The seeds were air-dried in the kitchen. He experimentedwith the seeds observing its performance against pest and disease,drought, panicle and grain characteristics. The plants were harvestedin bulk. It was grown for the next three seasons until the seeds weresufficient for planting in his ricefield. He named the variety RC 18selection because it was a selection from RC 18. The variety was earlymaturing, red and had big grains, long panicles and was resistant todisease.
Table 36. Characterization of RC 18 and RC 18 selection by Mang Cesinio during the semi-structured interview.
Characteristics RC 18 RC 18 selectionTillering ability Higher than
selectionNormal
Lodging resistance Resistant Resistant (thicker stem than RC18)
Plant height Normal Higher than RC 18Maturity 3.5 months after
transplantingTwo weeks earlier than RC 18
Yield Higher Lower than RC 18Resistance to pestand diseases
Susceptible to stemborer and brownspots
Resistant
Drought tolerance Not observed Not observedGrain color White Red

127
5.5.2.3 Mang Margarito
Mang Margarito was the selector of 66 puwa. He selected it fromIR 66 in 1989. It instantly became famous in the community and mostof his fellow farmers requested seeds while it was still on his trial field.He selected the new variety from his IR 66 field and puwa means red inBoholano dialect, thus the name 66 puwa. Three panicles from a redpericarp offtype were harvested and experimented with for the nextthree seasons. He maintained the other characteristics of IR 66 exceptfor the red seed coat. Variety 66 puwa had red grains, long panicle andhigh milling recovery.
Table 37. Characterization of IR 66 and 66 puwa by Mang Margarito during the semi-structured interview.
Characteristics IR 66 66 puwaTillering ability Good (30 tillers) Good (30 tillers)
Lodging resistance Resistant ResistantPlant height Short ShortMaturity Early(3 months after
transplanting)Early
Yield Less than 66 puwa HighResistance to pestand diseases
Resistant Resistant
Drought tolerance Not observed Not observedGrain color White Red
These three farmers who were living in different communities hadone thing in common. They liked to experiment with their ricevarieties. They selected new varieties that would suit their preferences.They had keen eyes on new sources of materials that could bedeveloped into new varieties.
Their cases further showed that strong selection pressure offarmers was instrumental in creating new varieties and consequentlyto increasing genetic diversity.

128
Photos 8 & 9

129
5.6 Establishing the link between farmers’ management of geneticdiversity, gender and socio-economic status
Farmer’s management of genetic diversity is not only about the setof varieties and crops. It involves the management processes of thesevarieties and the knowledge of farmers (Bellon, 1996). This researchfocussed on studying the continuous and dynamic process ofmaintenance, development and adaptation of red rice varieties to thespecific environment as influenced by social factors such as householdneeds.
The presence of different types of rice varieties showed the existinggenetic diversity that continued to evolve in the community. Theavailability of red rices and their diversity were indicative of farmer’smanagement, enhancement and development of genetic diversity.Because of farmers’ conscious effort to come up with red rices throughtheir own selection methods, they continued to select and experimenton off-types from the rice field to develop as planting materials. Thecase of the three farmer selectors in different communities showed howspecial and experienced farmers continually evaluate their materials assource of new varieties. The agro-morphological and geneticcharacterization in this study proved the similarities and differencesbetween the farmer’s selections and original variety. There was a highsimilarity observed among the four pairs of varieties studied usingfarmer’s, researcher's and molecular analysis characterization. It isusually assumed that intensive selection within a population leads tothe reduction of genetic variability and ultimately to erosion of thebasis for selection responses (Berg, 1993). However, the study showedthat farmers’ selection from modern varieties had high variation ascompared to the modern varieties. This showed the continuous anddynamic process of varietal development existing in farmer’s field asinfluenced by the selection pressure of farmers so that varieties aresuited to environmental changes and farmer’s objectives.
Furthermore, it could be stated that red rices originated fromthree possible sources: mutation, introgression with local and/ortraditional red varieties, and contamination of seeds. The results of thegenetic and agro-morphological characterization showed possibility ofintrogression from red rices. It was substantiated by the presence ofred rices grown in several farmers' field in the community. Thevarieties planted in the surrounding farmer’s fields were probable
130
sources of genes that contributed to the presence of new red pericarpofftypes in a population. The process of seed selection, where aharvester may single out seed or plants in an attempt to originate anew strain, may be very important to increase diversity in self-pollinated crops where hybrids between varieties occur at low rates(Bellon, 1996).
Red rices were examples of the farmers’ selections but both whiteand red varieties existed in the community. Farmer’s selection criteriawere according to their preferences and needs. These were groupedinto three: agronomic, morphological and gastronomic traits. Resultsshowed that farmers generally prioritized agronomic characteristicsrelated to high yield more than morphological and gastronomic traits.This may be attributed to the following reasons: (1) Farmers areproducing both for consumption and income generation. Given theirlimited land size, an average of 0.83 ha, farmers were in extremepressure to produce enough food and surplus to defray otherhousehold expenses. Therefore, they would prioritize characteristicswhich would lead toward this goal. (2) Farmers had multiple criteria inselecting what varieties to plant. Despite preference for high yieldtraits, other traits such as grain color were also be considered.Farmer’s decision on what varieties to plant depended on severalcombined traits such as high yield, pest and disease resistance, graincolor, eating quality, etc.
Farmers used two selection methods that were related to thepurpose of the seeds and manner of harvesting. These were panicleselection and mass selection. The mass selection was the commonlyused method by farmers to select the seeds of the variety that will beplanted for next season. Farmers select the best plants in the paddyand then bulk the seeds. Panicle selection was used by the farmers toselect one or two panicles of offtypes to create new varieties. Farmerspicked out unique panicle or panicles of offtypes and grow them forevaluation. Seeds from better performing plants were harvested in bulkand until sufficient volume was obtained. Only few and experiencedfarmers in communities did panicle selection while most farmersemployed mass selection to produce their own seeds. These selectionmethods were very useful in farmers' management of genetic diversity.
Studying farmer’s management not only entailed looking at theagro-ecological conditions but also included other components such as

131
social, cultural and economic aspects. Households were very muchdetermined by gender, socio-economic differences and ethnicity.Therefore, gender as one of the important factors within a householdwas necessarily studied in this research. Men and women concernsvaried according to their roles and positions, responsibilities andtasks. The dominant view of gender role between men and women, wifeas caretakers of the family while husbands as the breadwinner andtherefore head of the household, was observed in the study site. Menwere mainly responsible for farming activities as this was consideredas the major source of income of the family. Women had secondaryinvolvement in rice production and management because they wereresponsible and burdened by reproductive work. However, women andchildren as part of family labor were important in times of majorproduction activities (i.e. transplanting, harvesting) so they helped out.Women who were less burdened by reproductive work, had more timeto spend in farming activities. This also showed that the life cycle of afamily is influential in determining men and women contribution torice farming activities. Women with small children to rear were seenless involved in fieldwork compared to older women who had grown upchildren. Ramcharan-Nilsen (1997) found in a rice growing area in thesouth of the Philippines similar observation that the number and ageof children in a household most affected women's participation in ricefarming activities while men's involvement did not seem to be affected.Also, households in which there were older children to look after theyounger ones had slightly higher women participation in productionactivities.
Seed management was an important aspect of the rice farming inthe community since farmers used their own seed as plantingmaterials. Seeds were freely exchanged within and outside thecommunity. Farmers were replacing varieties for better ones everythree season to ensure good harvest. There was a need for morematerials in the community given this dynamic seed system. Theinformal seed sources were therefore crucial to the enhancement ofgenetic diversity. In the study, it was found out that men dominatedthe activities in seed management such as selection of seeds and seedexchange. However, seed drying and storage were shared betweenhusbands and wives. Also, women contributed in decision making onwhat varieties to be planted for the next season. Decision-making was

132
important to avoid conflicts in households. Major decisions related tohousehold’s sustenance and survival were made by husband and wife.Children, depending on their age and contribution to rice farming,shared some areas in decision-making. The study showed the effectof gender roles on production activities, seed management anddecision-making are important consideration in farmer’s managementof genetic diversity.
Socio-economic status of farmers was another factor found ofimportance in the management of genetic diversity. It was found outthat middle socio-economic group was the most actively involved in allproduction processes in their farms because they had more time toallocate to their fields. Farmers in the high socio-economic group hadsufficient resources to hire laborers in some specific productionactivities while those who belong to the low socio-economic group hadto work as laborers in other farmer’s field. Family labor dominated lowsocio-economic groups. In most cases, males from the low socio-economic group worked as hired laborers to augment their income andwives provided additional time and labor to look after their own farms.Therefore, women from low socio-economic groups were more active inrice production activities compared to the middle and high socio-economic groups. However in seed management, husbands and wivesfrom high socio-economic had more shared tasks while husbands fromlow and middle socio-economic groups dominated most of the tasks.These may be attributed to the time available for women of high socio-economic groups who were least burdened with household tasks, childrearing and fieldwork in rice production.
Selection criteria, in this study, were not greatly influenced bygender and socio-economic groupings. The study showed homogenouschoices by men and women of the three socio-economic groups. Highyield capacity was the most important criteria of farmers because itwas related to their major source of income. However, farmers not onlyrelied on one criteria but was always combinations of agronomic,morphological and gastronomic traits. Women tended to usegastronomic traits such as cooking and eating quality to identifyvarieties. On the other hand, men preferred agronomic andmorphological characteristics.
In general, the study showed that the presence of high geneticdiversity among farmers selection in the community of Campagao is
133
the result of farmers' continuous and dynamic management of theircrops and varieties to adapt to environment, their preferences, concersand needs. It further indicated that gender and socio-economic statuswere important factors affecting farmer’s handling of the diverse ricegenetic resources. It is therefore, crucial to consider these differencesamong men and women within and between households.

134
6 CONCLUSION AND RECOMMENDATIONS
The increasing recognition and need to know more about farmers’knowledge and skills in management of genetic diversity prompted thestudy. Thus, this thesis documented the enhancement anddevelopment of red rices among farmers in Bohol. The conclusionsdrawn from the research are as follows:
The evidence of the existing genetic diversity among of farmers’ redrice selections in the community of Campagao indicated the farmer’scontribution to the continuous development and adaptation ofvarieties to the farming systems. Crops that were closely related to thesustenance and survival of households were more diverse compared toless minor crops. In this case, the different types of rice varieties weregrown in abundance in the community. Varieties were kept by farmersif they were useful, valuable and adapted to the local environment.Selection pressures of farmers were a major determinant in local cropdevelopment.
The need for new materials influenced farmers to continually lookfor better varieties, depending on their needs and preferences. Theevidence of farmers selecting off types from their rice populationsproved that farmers were capable of creating new variation, thus,contributing to the increase of genetic diversity in communities. Infarming communities, new materials may develop because ofintrogression between varieties. This is the case for the red riceofftypes in a white rice population.
Farmer’s selection methods- panicle and mass selections, wereuseful in increasing and developing the genetic diversity in thecommunity.
Gender roles affected the tasks, division of labor, contribution anddecision making of men and women in crop production managementand seed management. Men dominated in performing these activitiesbut women also provided considerable contribution. However, the ageand number of children determined the contribution of women.
The socio-economic status of households was another importantfactor that influenced crop production and seed management. Thetime allotted in rice production activities by husbands and wivesdepended on their socio-economic standing. Better-off farmers hadmore time for seed management and other activities because other
135
laborers could be hired to perform tasks in rice cultivation. Men andwomen in low socio-economic group were more burdened with otherwork to augment their income.
Selection criteria were homogenous among gender and socio-economic groups. In general, agronomic characteristics were preferredby farmers rather than gastronomic and morphological. However, menused more agronomic characteristics and women combined these withgastronomic traits in describing their varieties. This may be becausemen spent more time in fieldwork and women in food processing andpost harvest activities.
Decision making was always a consensus between husbandsand wives to avoid conflict within the household especially on mattersrelated to their sustenance and survival.
In view of these conclusions, the research offers the followingrecommendations:� Tap farmers' knowledge and skills in planning and implementing
breeding programs;� make use of the highly diverse genetic resources in farming
communities for crop conservation and improvement;� provide diverse materials to farmers from breeding programs to
enhance and diversify the local genepool of farmer's varieties;� consider socio-economic and gender-related factors in initiating and
implementing a more comprehensive and workable research anddevelopment programs in general and specifically conservation andbreeding programs; and
� study further the agro-morphological and genetic characters ofother red rice varieties in the community to validate the hypothesisof introgression among them.

136
REFERENCES
Badri, B. and A. Badri. 1994. Women and biodiversity. Development,Journal of SID, 1; 67-71.
Bellon, M. 1991. The ethnoecology of maize variety management, acase study from Mexico. Human Ecology, 19; 389-418.
Bellon, M. and S. Brush. 1994. Keepers of maize in Chiapas, Mexico.Economic Botany, 48; 196-209.
Bellon, M. 1996. On farm-conservation as a process: an analysis of itscomponents. In : Sperling, L. and M. Leovinhson (eds.). Using diversity:enhancing and maintaining genetic resources on-farm : proceedings ofa workshop. June 1995. IDRC. India.
Bellon, M., Pham, J. and M. Jackson. 1997. Genetic conservation : arole for rice farmers. In : Maxted, N., Ford-Lloyd, B.V. and J.G. Hawkes(eds.). Plant Genetic Conservation. Chapman and Hall. USA.
Berg, T.1993. The science of plant breeding – support or alternative totraditional practices?. In : Boef, W. de, Amanor, A., Wellard, K. and A.Bebbington. (eds.). Cultivating knowledge: genetic diversity, farmerexperimentation and crop research. Intermediate TechnologyPublication. United Kingdom.
Bernard, H. 1995. Research methods in anthropology: qualitative andquantitative approaches. Altamira Press. USA.
Boef, W. de, Amanor, A., Wellard, K. and A. Bebbington. 1993.Cultivating knowledge: genetic diversity, farmer experimentation andcrop research. Intermediate Technology Publication. United Kingdom.
Borromeo, T. and J. Hernandez. 1987. Philippine rice geneticresources: status, problems and prospects. Paper presented in thenational conference on genetic resources and development. September1987. Tagaytay, Philippines.
Briones, A., Cayaban, E., Vicente, P. and R. Aspiras. 1989. Farmer-based research for sustainable rice farming. ILEIA Newsletter,December; pp-24-25.
Brush, S. 1995. In situ conservation of landraces in centers of cropdiversity. Crop Science, 35; 346-354.
Brush, S., Taylor, J. and M. Bellon. 1992. Technology adoption andbiological diversity in Andean potato agriculture. Journal ofDevelopment Economic, 38; 365-387.

137
Cooper, D., Vellve, R. and H. Hobbelink. 1992. Growing diversity:genetic resources and local food security. Intermediate TechnologyPublications. London.
Community Biodiversity Development and Conservation. 1999a. Astudy on the plant genetic resources diversity and seed supply systemof Bohol Island, Philippines. Technical Report. Unpublished.
Community Biodiversity Development and Conservation. 1999b.Development of rice farmer’s selection in Bohol, Philippines. TechnicalReport. Unpublished.
Conklin, H.C. 1957. Hanunoo Agriculture in the Philippines. ForestryDevelopment Paper, 12. Food and Agriculture Organization of theUnited Nations, Rome.
Dennis, J. 1987. Farmer management of rice variety diversity innorthern Thailand. Unpublished PhD dissertation. Cornell University.Michigan University. Microfilms.
Den Uyl, M., 1995. Gender and the division of labour in ricecultivation. p 225-246. In: M. Den Uyl (ed.). Invisible barriers: gender,caste and kinship in a southern Indian village. International Books.Utrecht.
Dolan, R. 1991. Philippines- a country study. Federal ResearchDivision. Library of Congress. USA.Source from: http://Icweb2.loc.gov/frd/cs/photo.html#0000
Dove, M.R. 1985. Swidden agriculture in Indonesia, the subsistencestrategies of the Kalimantu Kantu. Studies in the social sciences, 43.Mouton Publishers, Berlin, New Babylon.
Economic and social commissions for Asia and the Pacific. 1982.Participation of women in paddy production and processing. UnitedNations. Bangkok, Thailand.
Eviota, E. 1986. The articulation of gender and class in thePhilippines. In : Leacock, E., Safa, H. and contributors (eds.). Women’swork, development and the division of labor by gender. Bergin andGarvey Publishers. Massachusetts, USA.
Fieldstein, H. and J. Jiggins. 1994. Tools for the field: methodologieshandbook for gender analysis in agriculture. Kumarian Press.Connecticut, USA.

138
Freeman, J.D. 1955. Iban Agriculture: a report on the shiftingcultivation of hill rice by the Iban of Sarawak. Colonial ResearchStation Paper, 18. Her Majesty’s Stationary Office, London.
Friis-Hansen, E. 1989. Seeds of wealth – seeds of risk, the vulnerabilityof hybrid maize production in the Southern Highlands of Tanzania.Centre for Development Research. Copenhagen.
Fujisaka, S., Elliot, P., Jayson, E. and A. Dapusala. 1993. Where hasbeen no Green Revolution, farmers’ upland rices and relatedknowledge in Mindanao, Philippines. p. 96-110. In : InternationalInstitute for Rural Reconstruction (ed.). Indigenous Knowledge andSustainable Development. Philippines.
Fulton, T., Chumuongse, J. and S., Tanksley. 1995. Microprepprotocol for extraction of DNA from tomato and other herbaceousplants. Plant Molecular Biology Reporter, 13; 3, 207-209.
Ghezai, I. 1999. Gender differentiated management of sorghum geneticdiversity: an exploratory study conducted among the Kunama in thesouth western lowland zone of Eritrea. MSc Thesis. WAU, theNetherlands. Unpublished.
Hardon, J. and W. de Boef. 1993. Linking farmers and plant breedersin local crop development. In : Boef, W. de, Amanor, A., Wellard, K.and A. Bebbington. (eds.). Cultivating knowledge: genetic diversity,farmer experimentation and crop research. Intermediate TechnologyPublication. United Kingdom.
Herdt, R.W. and C. A. Capule. 1983. Adoption, spread and productionimpact of modern rice varieties in Asia. International Rice ResearchInstitute. Philippines.
IRRI. 1996. Standard evaluation system for rice. IRRI. Philippines.
Jiggins, J. 1986. Gender-related impacts and the work of theInternational Agricultural Research Centers. CGIAR study paper no. 17.Consultative Group on International Agricultural Research, WorldBank.
Juliano, B.O. 1993. Rice in human nutrition. IRRI, Philippines andFAO, Rome.
Jusu, M. 1999. Management of genetic variability in rice (Oryza sativaL. and O. glaberrima steud.) by breeders and farmers in Sierra Leone.PhD Thesis. Wageningen Agricultural University. The Netherlands.
139
Karp, A., Kresovich, S., Bhat K., Ayad w. and T. Hodgkin. 1997.Molecular tools in plant genetic resources conservation: a guide to thetechnologies. IPGRI Technical Bulletin, 2. IPGRI. Rome.
Lamers, H. 1994. Report writing for science, technology andmanagement. Wageningen Agricultural University. The Netherlands.
Longley, C. and R. Richards. 1993. Selection strategies of rice farmersin Sierra Leone. In : Boef, W. de, Amanor, A., Wellard, K. and A.Bebbington. (eds.). Cultivating knowledge: genetic diversity, farmerexperimentation and crop research. Intermediate TechnologyPublication. United Kingdom.
March, C., Smyth, I. and M. Mukhopadhyay. 1999. A guide to gender-analysis frameworks. An Oxfam publication. Great Britain.
Maurya, D.M. 1989. The innovative approach of Indian farmers. p. 9-13. In : R. Chambers, A. Pacey and L.A. Thrupp. (eds.). Farmer first,farmer innovation and agricultural research. Intermediate TechnologyPublications. London.
Maurya, D., Botrall A. and J. Farrington. 1988. Improved livelihoods,genetic diversity and farmer participation: a strategy for rice breedingin rainfed areas in India. Experimental Agriculture 24, 3; 311-320.
Mehta, M. 1996. Our lives are no different from that of our buffaloes:agricultural change and gendered spaces in a central Himalayanvalley. p. 180-208. In : Rocheleau, D., Thomas-Slayter, A. and E.Wangari. (eds.). Feminist political ecology. Routledge, London and NewYork.
Montanosa Research Development Center. 1995. Indigenous seedselection, storage and breeding techniques for rice and legumes inCordillera. SIBAT. Philippines.
Monyo, E., Ipinge, S, Heinrich, G. and E. Chinhema. 1998.Participatory breeding: does it make a difference – lessons fromNamibian pearl millet farmers. Paper presented to the 2nd InternationalSeminar/Workshop on “Assessing the Impact of Participatory Researchand Gender Analysis. September 1998. Quito, Ecuador.
Moore, H. 1988. Gender and status: explaining the position of women.p 12-14. In: H. Moore (ed.). Feminism and anthropology. Polity Press.Cambridge.
140
Mushita, A. 1993. Strengthening the informal seed supply system incommunal areas of Zimbabwe. In: Boef, W. de, Amanor, A., Wellard, K.and A. Bebbington. (eds.). Cultivating knowledge: genetic diversity,farmer experimentation and crop research. Intermediate TechnologyPublication. United Kingdom.
National Statistics Office. 1995. Philippines.
Nazarea-Sandoval, V. 1991. ‘If the shoe fits: local criteria for varietalselection and certain implications for agricultural research anddevelopment. Paper presented for the UPWARD for the InternationalPotato Center, The Philippines.
Nazarea-Sandoval, V. 1993. Of memories and varieties:complementarity between cultural and genetic diversity. Paperpresented at the workshop on the Human Socio-economic andCultural Aspects of the Plant Genetic Resource Conservation, IPGRI,Rome. April-May, 1993.
Nazarea-Sandoval, V. 1995. Local knowledge and agricultural decisionmaking in the Philippines: class, gender and resistance. CornellUniversity Press. USA.
Oosterhout, S. van. 1993. Sorghum genetic resources of small-scalefarmers in Zimbabwe. In: Boef, W. de, Amanor, A., Wellard, K. and A.Bebbington. (eds.). Cultivating knowledge: genetic diversity, farmerexperimentation and crop research. Intermediate TechnologyPublication. United Kingdom.
Paris, T. 1988. Women in rice farming systems: a preliminary report ofan action research program in Sta. Barbara, Pangasinan. In: IRRI(ed.). Filipino women in rice farming systems. Philippines.
Parsons, B., Newbury, H., Jackson, M., and Ford-Lloyd, B. 1997.Contrasting genetic diversity relationships are revealed in rice (Oryzasativa L.) using different marker types. Molecular Breeding 3; 115-125
Pelto, P. and G. Pelto. 1978. Anthropological research: the structure ofinquiry. Cambridge University Press. United Kingdom.
Pierce-Colfer. 1994. Time allocation studies: a methodological notes.In: Feldstein, H. and J. Jiggins (eds.). Tools for the field: methodologieshandbook for gender analysis in agriculture. Kumarian Press. USA.
Provincial Planning and Development Office. 1992. Bohol ProvincialProfile. Tagbilaran, Philippines.
Provincial Planning and Development Office. 1998. Bohol Area Profile,excerpts. Tagbilaran, Philippines.

141
Ramcharan-Nilsen, L. 1997. Gender roles in plant genetic resourcesconservation: a comparative study of intensive and organic lowland ricefarming systems in Mindanao, Philippines. MSc thesis. NORAGRIC.Agricultural University of Norway. Norway. Unpublished.
Res, L. 1983. Changing labor allocation patterns of women in rice farmhouseholds: A rainfed rice village in Iloilo province in Philippines.Wageningen Agricultural University. The Netherlands. A paperprepared for the conference on women in rice farming systems. IRRI.Philippines.
Res, L. 1986. Households, women, labor and change: A study in aPhilippine rainfed rice village. Wageningen Agricultural University.The Netherlands.
Richards, P. 1985. Indigenous agricultural revolution : ecology and foodproduction in West Africa. Hutchinson, London.
Richards, P. and G. Ruivenkamp. 1997. Seeds and survival: cropgenetic resources in war and reconstruction in Africa. InternationalPlant Genetic Resources Institute. Rome, Italy.
Rhoades, R. 1989. The role of farming in the creation of agriculturaltechnology. In: Chambers, R., Pacey, A., and L.A. Thrupp. (eds.).Farmer first: farmers innovation and agricultural research. IntermediateTechnology Publications. London.
Rola. M. F. 1995. The role of women in upland farming systems: a casestudy of a Philippine village. In: Women in upland agriculture in Asia,proceedings of a workshop. 1995. Chiang Mai, Thailand.
Sachs, C. 1996. Gendered fields: rural women, agriculture andenvironment. Westview Press. USA.
Sthapit. B., K. Joshi and J. Witcombe.1995. Farmers participatoryhigh altitude rice breeding in Nepal: providing choice and utilizingfarmers’ expertise. In: Sperling, L. and M. Leovinhson. (eds.). Usingdiversity: enhancing and maintaining genetic resources on-farm,proceedings of a workshop. June 1995. IDRC. India.
Shiva, V. and I. Dankelman. 1992. Women and biological diversity:lessons from the Indian Himalayas. In: Cooper, D., Vellve, R. and H.Hobbelink. (eds.). Growing diversity, genetic resources and local foodsecurity. Intermediate Technology Publication. London.
Soleri, D. and D. Cleveland. 1993. Hopi crop diversity and change.Journal of Ethnobiology 13, 2; 203-231.
142
Song. Y. 1999. New seeds in Old China: Impact of CIMMYT collaborativeProgramme on Maize Breeding in South-western China. PhD Thesis.Wageningen Agricultural University. The Netherlands.
Sperling, L., Leovinhson, M., and B. Ntabomvura. 1993. Rethinkingthe farmers role in plant breeding: local bean experts and on-stationselection in Rwanda. Experimental Agriculture 29; 509-519
United Nations. 1988. Improving statistics and indicators on womenusing households surveys studies in methods. Series No. 48.Department of International Economics and Social Affairs. StatisticalOffice and International Training Institute for the Advancement ofWomen. New York. United Nations.
Veldhuizen, L. van., Waters-Bayers, A., and H. de Zeeuw. 1997.Developing technology with farmers: trainer’s guide for participatorylearning. Zed Book. London.
Vos, P., Hogers, R., Bleeker, M., Reijans, M., Lee T. van de., Hornes,M., Frijters, A., Pot J., Peleman, J, Kuiper M., and M. Zabeau. 1995.AFLP: a new technique for DNA fingerprinting. Nucleic Acid Research23, 21; 4407-4414.
Watson, G. 1985. Women’s role in the improvement of rice farmingsystems in coastal swamplands. In: Women in rice farming,proceedings of a conference on women in rice farming system.September 1993. IRRI. Philippines
Witcombe, J. and A. Joshi. 1996. The impact of farmer participatoryresearch on biodiversity of crops. In: Sperling, L. and M. Leovinhson.(eds.). Using diversity: enhancing and maintaining genetic resources on-farm, proceedings of a workshop. June 1995. IDRC. India.
Zhu, J., Gale, M., Quarrie, M., Jackson, M., and G. Bryan. 1998. AFLPmarkers for the study of rice diversity. Theoretical Applied Genetics 96;602-611.

143
APPENDIX
Appendix 1. Profile of the respondents sample form.
Personal data Name: ____________________________________ Sex: ______ Age: _____yearsAddress: __________________________________ Ethnicity: ______________________Level of education: _____ Elementary _______ Grade level
_____ Highschool _______ Year level _____ College _______ Year level ___________ Course ____________________________ Others, specify
Number of years in farming: ______________________Sources of income: Major: ____________________ Minor: _____________________
Household informationNumber of household members: ___________________________________Number of children: ________living with them ________ not living with themAge of children: ____________________________________________________Educational attainment of children: _____________________________________Other relatives living with family: _________________________________________
Organizational involvementWhat? ____________ Membership? _____________ Since When?______________Number of years in living in community:___________________________________House ownership :__owned ___rented/___ how much __Others, specify _____Equipment owned: at house, please enumerate? __________________________At farm, Please enumerate? ________________________________________________
Land holdings:Area of house : Owned_______________ Size_________
Rented ______________ Size _________ Others ______________ Size __________
Agricultural area: (example : lowland rainfed rice, upland rice, etc.)What? ___________ How much? _____(has) Tenurial status ___________
Crops grown:What? ___________ How much? _________________ (has)
Varieties grown:Crop name ______________Variety Name __________________________
Purpose produce of each parcels: (cash, food, etc.)Variety Name _______________For what? ___________________________
Description of farm: (by parcel)What? ___________________________ Location: __________________________Topography: _______________________ Soil properties: ____________________
Other information:
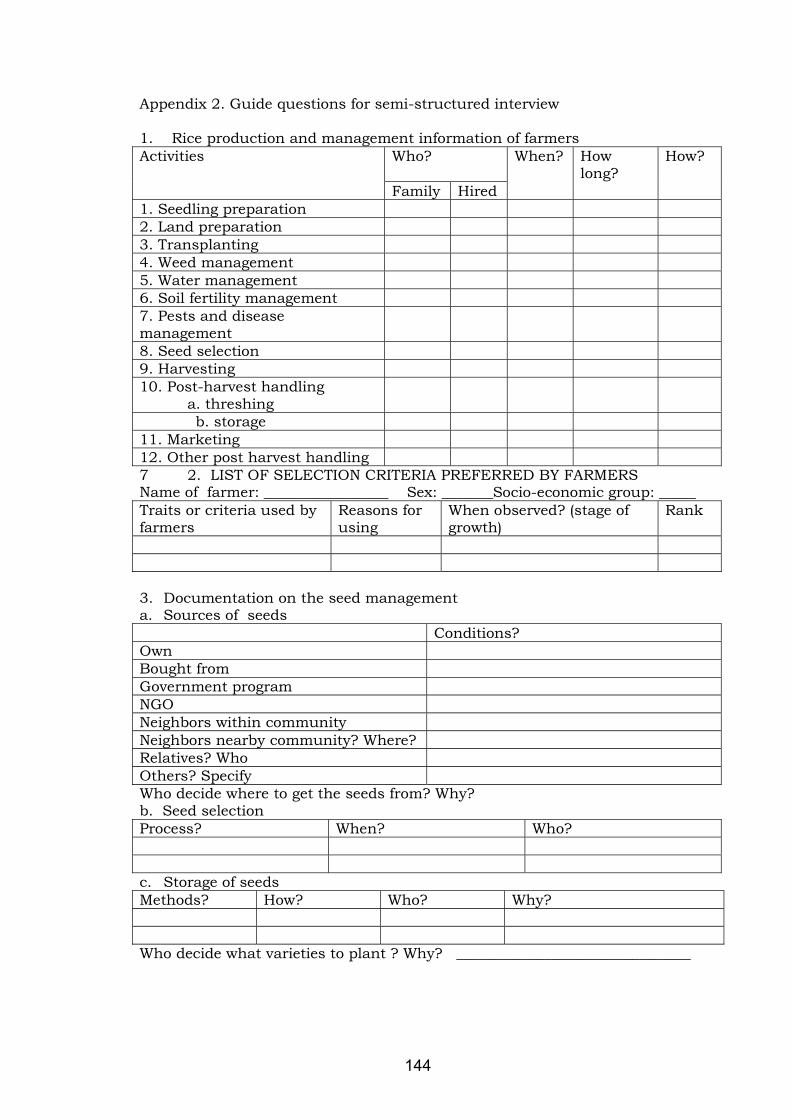
144
Appendix 2. Guide questions for semi-structured interview
1. Rice production and management information of farmersWho?Activities
Family Hired
When? Howlong?
How?
1. Seedling preparation2. Land preparation3. Transplanting4. Weed management5. Water management6. Soil fertility management7. Pests and diseasemanagement8. Seed selection9. Harvesting10. Post-harvest handling
a. threshing b. storage11. Marketing12. Other post harvest handling7 2. LIST OF SELECTION CRITERIA PREFERRED BY FARMERSName of farmer: _________________ Sex: _______Socio-economic group: _____Traits or criteria used byfarmers
Reasons forusing
When observed? (stage ofgrowth)
Rank
3. Documentation on the seed managementa. Sources of seeds
Conditions?OwnBought fromGovernment programNGONeighbors within communityNeighbors nearby community? Where?Relatives? WhoOthers? SpecifyWho decide where to get the seeds from? Why?b. Seed selectionProcess? When? Who?
c. Storage of seedsMethods? How? Who? Why?
Who decide what varieties to plant ? Why? ________________________________

145
4. List of selection methods
a. Panicle selectionWhen? How? Who? Why?
b. Bulk methodWhen? How? Who? Why?
c. Other methodsWhen? How? Who? Why?
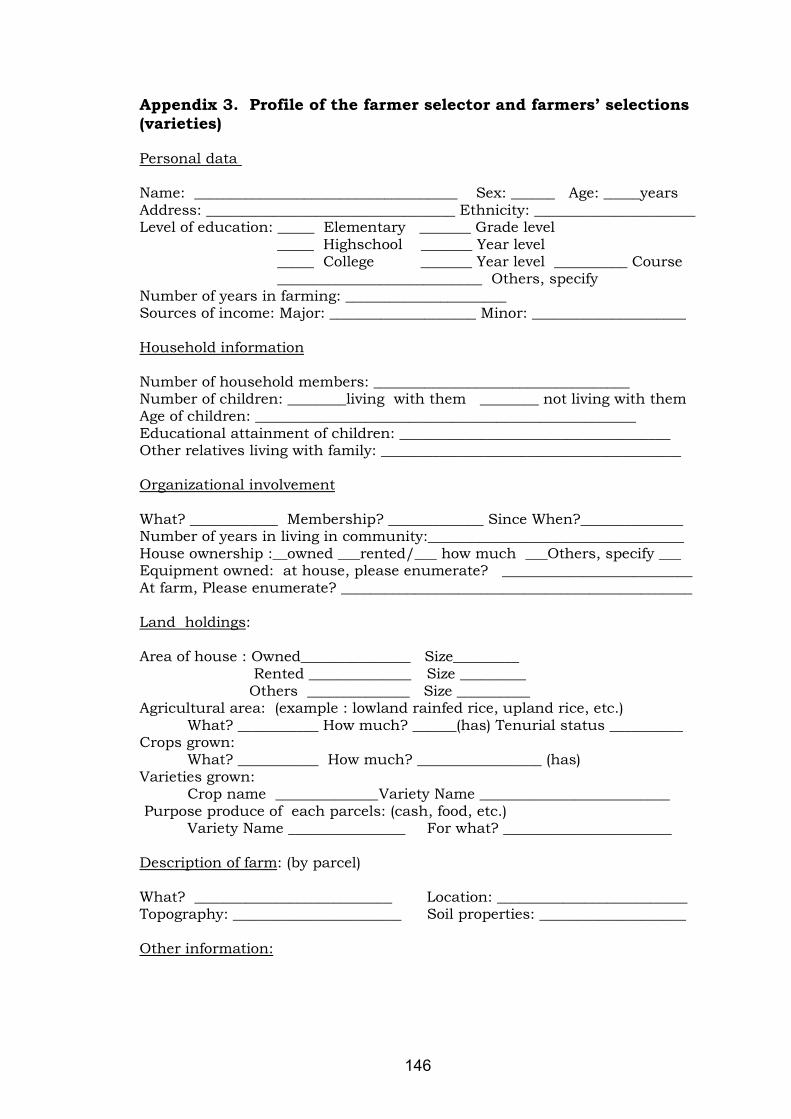
146
Appendix 3. Profile of the farmer selector and farmers’ selections(varieties)
Personal data
Name: ____________________________________ Sex: ______ Age: _____yearsAddress: __________________________________ Ethnicity: ______________________Level of education: _____ Elementary _______ Grade level
_____ Highschool _______ Year level _____ College _______ Year level __________ Course ____________________________ Others, specify
Number of years in farming: ______________________Sources of income: Major: ____________________ Minor: _____________________
Household information
Number of household members: ___________________________________Number of children: ________living with them ________ not living with themAge of children: ____________________________________________________Educational attainment of children: _____________________________________Other relatives living with family: _________________________________________
Organizational involvement
What? ____________ Membership? _____________ Since When?______________Number of years in living in community:___________________________________House ownership :__owned ___rented/___ how much ___Others, specify ___Equipment owned: at house, please enumerate? __________________________At farm, Please enumerate? ________________________________________________
Land holdings:
Area of house : Owned_______________ Size_________ Rented ______________ Size _________ Others ______________ Size __________
Agricultural area: (example : lowland rainfed rice, upland rice, etc.)What? ___________ How much? ______(has) Tenurial status __________
Crops grown:What? ___________ How much? _________________ (has)
Varieties grown:Crop name ______________Variety Name __________________________
Purpose produce of each parcels: (cash, food, etc.)Variety Name ________________ For what? _______________________
Description of farm: (by parcel)
What? ___________________________ Location: __________________________Topography: _______________________ Soil properties: ____________________
Other information:

147
About the variety
Name of variety : ___________________________________Description of the characters (as characterize by farmer) :_____________________Original parent (variety name): ____________ From where? )______________
When selected: _________________________Reason for selecting the variety: ________________________________________Distinct feature of the variety for interest: _______________________________Other remarks: _________________________________________________________Selection method
Describe in details the selection procedure1. panicle selection ________________________________________________________2. bulk selection __________________________________________________________3. Others _________________________________________________________________
Any experiment done on the variety to test it? What? How long? Why?Other information
Other varieties planted in the vicinity of the variety when selected:
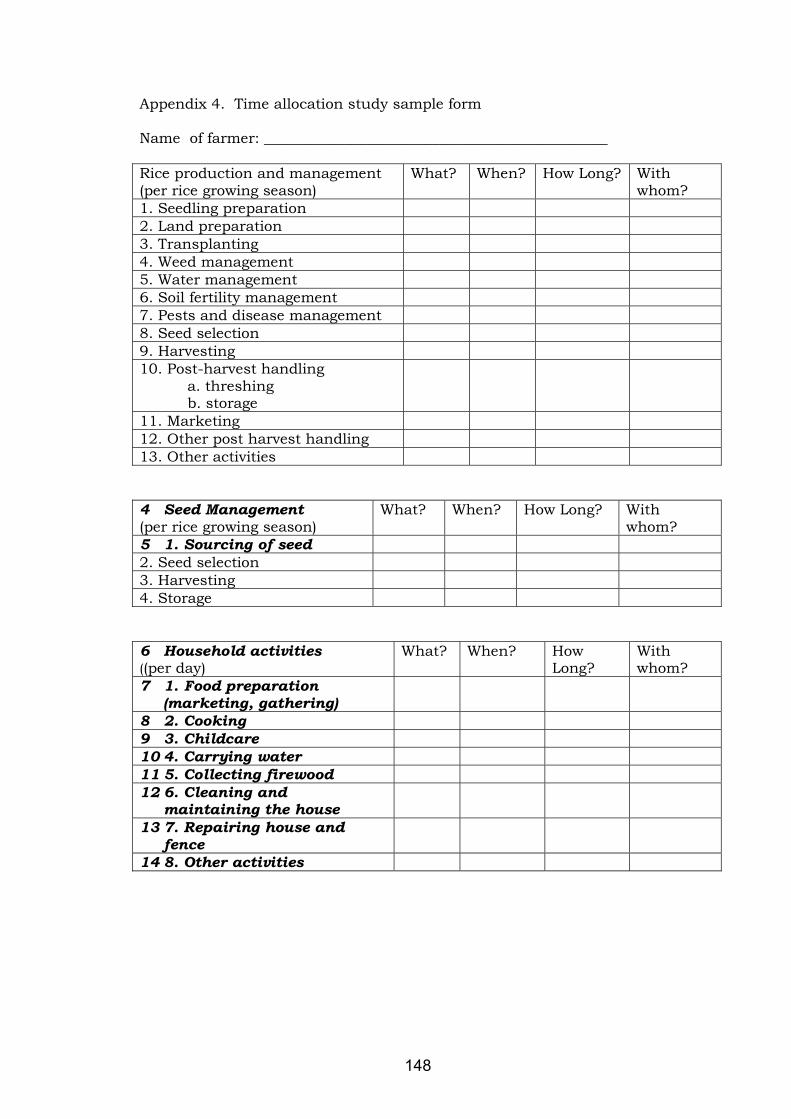
148
Appendix 4. Time allocation study sample form
Name of farmer: _______________________________________________
Rice production and management(per rice growing season)
What? When? How Long? Withwhom?
1. Seedling preparation2. Land preparation3. Transplanting4. Weed management5. Water management6. Soil fertility management7. Pests and disease management8. Seed selection9. Harvesting10. Post-harvest handling
a. threshingb. storage
11. Marketing12. Other post harvest handling13. Other activities
4 Seed Management(per rice growing season)
What? When? How Long? Withwhom?
5 1. Sourcing of seed2. Seed selection3. Harvesting4. Storage
6 Household activities((per day)
What? When? HowLong?
Withwhom?
7 1. Food preparation(marketing, gathering)
8 2. Cooking9 3. Childcare10 4. Carrying water11 5. Collecting firewood12 6. Cleaning and
maintaining the house13 7. Repairing house and
fence14 8. Other activities

149
Appendix 5. List of farmer’s selection criteria
Characteristics Growth stage Measurement1. High number of tillers Booting stage (3 weeks
after transplanting)Count the tillers
2. Maturity 40 days aftertransplanting (atmaturity)
Count the number ofdays from transplantingto full heading
3. Resistance to pest anddiseases
Early vegetative stage toreproductive stage
Observe the performanceof plants
4. Heavy grain weight After harvesting (atmaturity)
Weighing (must exceedthan the regular 40 kilosper sack
5. Good cooking quality (good eating quality –delicious) (aromatic whencooked)
After harvest (duringcooking and eating)
By cooking (taste test)
6. High yield Harvest period Comparison withprevious harvest andshould be more than theminimum harvest perseason
7. Seed coat color (redand white)
At maturity Unhusking the seeds
8. Plant height (short) After flowering Measure plant height(use of measuring tool)
9. Lodging resistant(strong culm)
After flowering up tomaturity
Observation and bypushing the culm by foot
10. Panicle length (long) Near maturity Grain count11. Drought resistant Early to late vegetative
stageCapable of producinggrain after drought orstrong heat (lack ofwater)
12. Panicle shattering(low)
At maturity (duringharvesting)
Shaking the panicles inthe tillers
13. Volume expansion ofcooked rice
After harvest (Cooking ) Large amount of cookedrice and large amount ofwater that can be usedwhen cooking
14. High spikelet fertility At maturity (ripepanicles)
Plenty of seeds inpanicle, clean anddisease-free grains, andno dark spots in grains

150
Appendix 6. Measurements of the agro-morphological characters based onthe Standard Evaluation System for Rice.
A. Agronomic traits
Growth stage Scales1. Tillering ability
The score must representmost plants within the plot.
Booting 1 Very high (more than 25 tillers/plant)3 Good (20-25 tillers/plant)5 Medium (10-19 tillers/plant)7 Low (5-9 tillers/plant)9 Very low (less than 5 tillers/plant)
2. Culm strengthThis is first rated afterheading by gently pushingthe tillers back and forth afew times. Final observationat maturity is made to recordstanding position of plants
Dough stageto maturegrain
1 Strong (no bending)3 Moderately strong (most plants
bending)5 Intermediate (most plants moderately bending)7 Weak (most plants nearly flat)9 Very weak (all plants flat)
3. Plant heightUse actual measurement (cm)from soil surface to the tip ofthe tallest panicle (awnsexcluded). For heightmeasurements at othergrowth stages, specify thestage. Record in wholenumbers (do not usedecimals).
Milk stage tomature grain
1 Semidwarf (lowland is less than110 cm and upland is less than 90cm)
5 Intermediate (lowland is less than110–130 cm upland is less than 90– 125 cm)
9 Tall (lowland more than 130 cmandUpland more 125 cm)
4. Leaf senescenceThe leaves below the flag leafare observed at the time ofharvest for their retention ofgreenness.
Mature grain 1 Late and slow (leaves have naturalgreencolor)
5 Intermediate (upper leaves yellowing)9 Early and fast (all leaves yellow or dead)
5. Panicle exsertionThe exsertion of the panicleabove the flagleaf sheath afteranthesis. Rating is based onthe majority of plants in theplot.
Milk stage tomature grain
1 Well exserted (the panicle baseappears way above the collar of theflag leaf blade)
2 Moderately well exserted (thepanicle base is above the collar ofthe flag leaf)
5 Just exserted (the panicle coincideswith the collar of the flag leaf)
7 Partly exserted (the panicle base isslightlyBeneath the collar of the flag leafblade)
9 Enclosed (the panicle is partly or entirely enclosed within the leaf sheath of the flag leaf.

151
6. Panicle threshability The matured panicle is firmly grasped by the hand and a slight rolling pressure is applied with the palm and the fingers. Estimate the percentage of shattered grains.
Mature grain 1 Difficult (less than 1 %)3 Moderately difficult (1-5%)5 Intermediate (6-25%)7 Loose (26-50%)9 Easy (51-100%)
7. Spikelet fertilityIdentify the fertile spikelets bypressing the spikelets withthe fingers and noting thosethat have no grains.Readings are obtained fromcounts of well-developedspikelets in proportion tototal number of spikelets onfive panicles.
Mature grain 1 Highly fertile ( >90%)3 Fertile (75-89%)5 Partly sterile (50-74%)7 Highly sterile (<50% to trace)9 completely sterile (0%)
8. Maturity Use the number of days from seeding to grain ripening (85% of grains on panicle are mature)
Mature grain Actual number of days
B. Morphological charactersGrowth stage Scales
9. Leaf lengthEnter actual measurements,in centimeters of the leaf justbelow the flag leafSample size = 5
Heading Centimeters
10. Leaf widthEnter actual measurements,in centimeters of the widestportion of the leaf blade justbelow the flag leafSample size = 5
Heading Centimeters
11. Leaf blade pubescenceAside from ocular inspection,rub fingers from the tip downon the leaf surface. Presenceof hairs on the blade surfaceare classified.Sample size = 5
Booting toheading
1 Glabrous2 Intermediate3 Pubescent
12. Leaf blade colorOcular inspection of color
Stem elongationto heading
1 Light green2 Green3 Dark green4 Purple tips5 Purple margins6 Purple blotch (purple mixed with
green)7 Purple
13. Basal leaf sheath color Ocular inspection of color
Tillering tobooting
1 Green2 Purple lines3 Light purple4 Purple
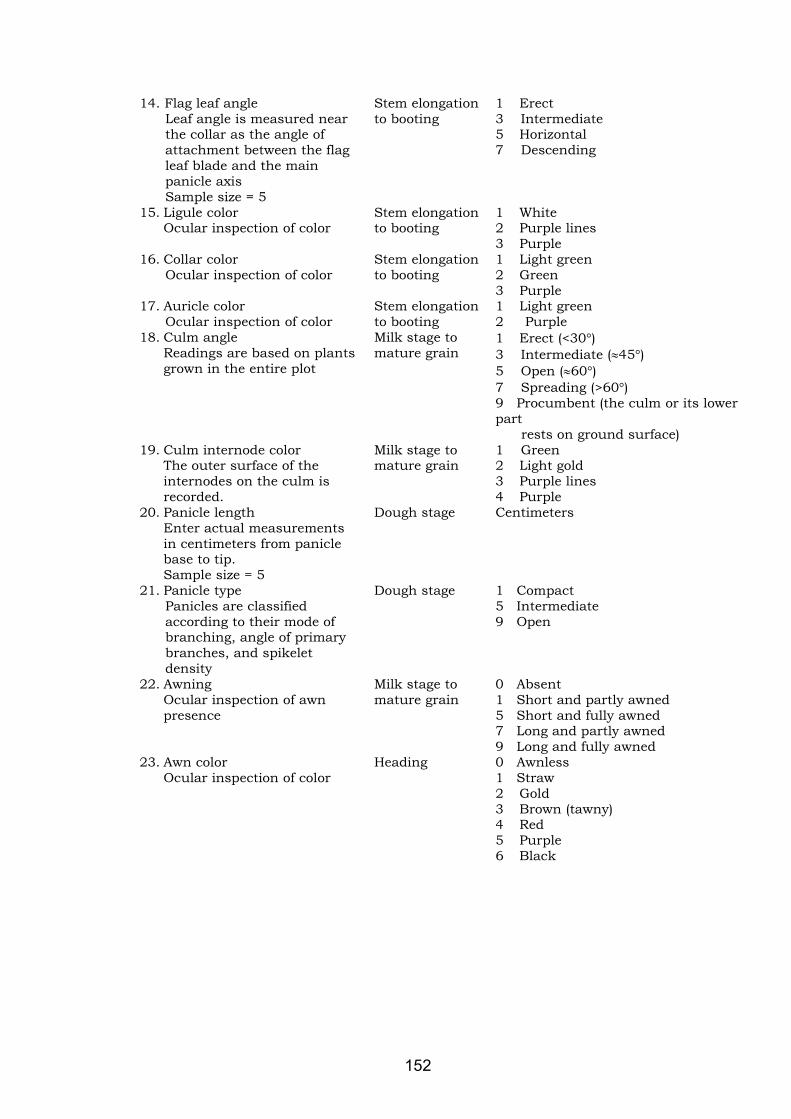
152
14. Flag leaf angle Leaf angle is measured near the collar as the angle of attachment between the flag leaf blade and the main panicle axis Sample size = 5
Stem elongationto booting
1 Erect3 Intermediate5 Horizontal7 Descending
15. Ligule colorOcular inspection of color
Stem elongationto booting
1 White2 Purple lines3 Purple
16. Collar color Ocular inspection of color
Stem elongationto booting
1 Light green2 Green3 Purple
17. Auricle color Ocular inspection of color
Stem elongationto booting
1 Light green2 Purple
18. Culm angleReadings are based on plantsgrown in the entire plot
Milk stage tomature grain
1 Erect (<30�)3 Intermediate (�45�)5 Open (�60�)7 Spreading (>60�)9 Procumbent (the culm or its lowerpart rests on ground surface)
19. Culm internode colorThe outer surface of theinternodes on the culm isrecorded.
Milk stage tomature grain
1 Green2 Light gold3 Purple lines4 Purple
20. Panicle lengthEnter actual measurementsin centimeters from paniclebase to tip.Sample size = 5
Dough stage Centimeters
21. Panicle type Panicles are classified according to their mode of branching, angle of primary branches, and spikelet density
Dough stage 1 Compact5 Intermediate9 Open
22. AwningOcular inspection of awnpresence
Milk stage tomature grain
0 Absent1 Short and partly awned5 Short and fully awned7 Long and partly awned9 Long and fully awned
23. Awn colorOcular inspection of color
Heading 0 Awnless1 Straw2 Gold3 Brown (tawny)4 Red5 Purple6 Black

153
24. Apiculus colorOcular inspection of color
Milk stage tomature grain
1 White2 Straw3 Brown (tawny)4 Red5 Red apex6 Purple7 Purple apex
25. Stigma colorStigma color is determinedfrom blooming spikelets(between 9 a.m. to 2 p.m.)with the aid of a hand less)
Heading 1 White2 Light green3 Yellow4 Light purple5 Purple
26. Lemma and palea colorOcular inspection of color
Mature grain 0 Straw1 Gold and gold furrows on straw
background2 Brown spots on straw3 Brown furrows on straw4 Tawny5 Reddish to light purple6 Purple spots on straw7 Purple furrows on straw8 Purple9 Black10 White
27. Lemma and palea pubescenceFingers are rub on the grains
Mature grain 1 Glabrous2 Hairs on lemma keel3 Hairs in upper portion4 Short hairs5 Long hairs (velvety)
28. Sterile lemma colorReadings are made when thespikelets are approachingmaturity
Mature grain 1 Straw (yellow)2 Gold3 Red4 Purple
29. Seed coat colorReadings are made ondehulled rice
Mature grain 1 White2 Light brown3 Speckled brown4 Brown5 Red6 Variable purple7 Purple
30. Endosperm typeReadings are made onstarchy endosperm of thegrains
Mature grain 1 Non glutinous (non-waxy)2 Glutinous (waxy)3 Indeterminate
31. ScentScent can be determined atflowering time or from cookedkernels
Heading tomature grain
0 Non scented1 Lightly scented2 Scented
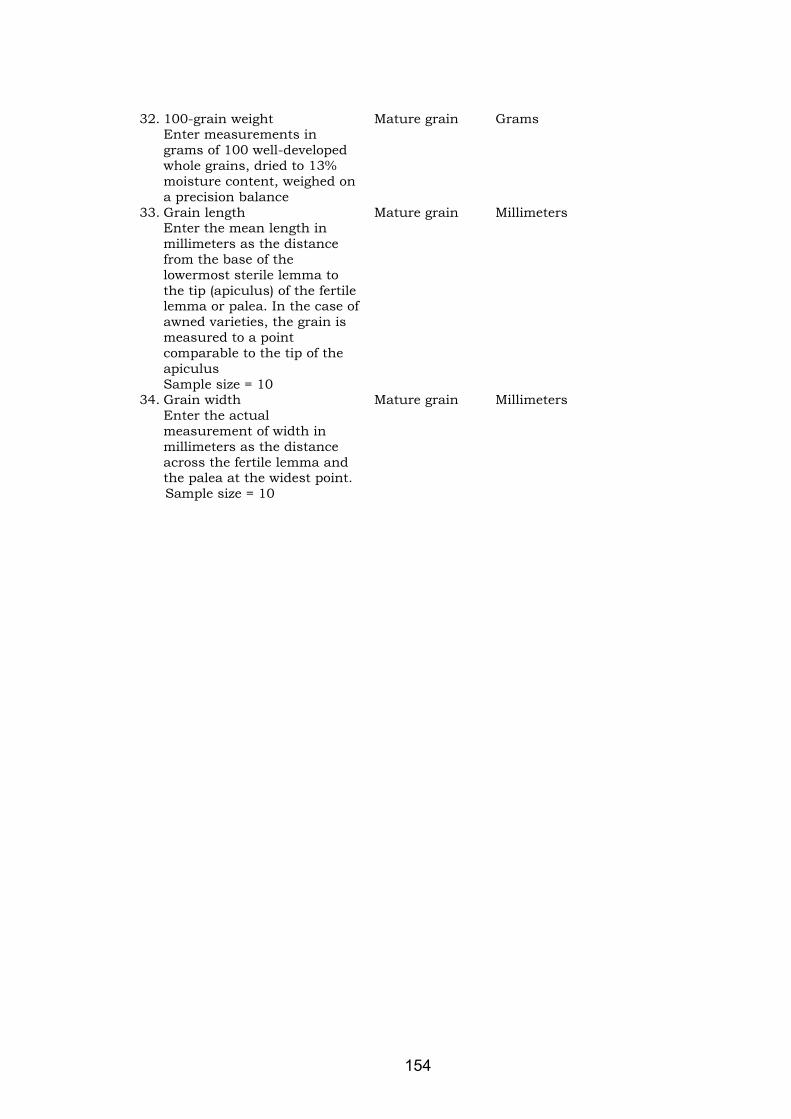
154
32. 100-grain weightEnter measurements ingrams of 100 well-developedwhole grains, dried to 13%moisture content, weighed ona precision balance
Mature grain Grams
33. Grain lengthEnter the mean length inmillimeters as the distancefrom the base of thelowermost sterile lemma tothe tip (apiculus) of the fertilelemma or palea. In the case ofawned varieties, the grain ismeasured to a pointcomparable to the tip of theapiculusSample size = 10
Mature grain Millimeters
34. Grain widthEnter the actualmeasurement of width inmillimeters as the distanceacross the fertile lemma andthe palea at the widest point.
Sample size = 10
Mature grain Millimeters

1
Appendix 7. Characterization data of farmers
AGRONOMICVariety Name Pest &
Diseaseresistance
Maturity Highnumberof tillers
Highyield
Plantheight(short)
Lodgingresistant(strong culm)
Highspikeletfertility
Drought resistant Panicleshattering(low)
Heavy grainweight
RC 18 resistant late 15 high medium strong high tolerant high highRC 18 selection resistant medium 13 high tall strong high tolerant high highIR 66 resistant medium 17 high short strong high tolerant low moderate66 puwa resistant medium 15 high short strong low tolerant low moderateRC 10 resistant early 11 high short strong low tolerant high high77 puwa resistant early 14 high short strong high tolerant low highIR 36 resistant medium 15 moderate short strong moderate tolerant low high36 puwa resistant medium 9 moderate short strong moderate moderately tolerant low high
MORPHOLOGICAL GASTRONOMICVariety Name Panicle length (long) Seed coat color
(red and white)Good eatingquality (delicious)
Good cooking quality(aromatic)
Volume expansion of cooked rice
RC 18 long White yes no moderateRC 18 selection long Red yes no moderateIR 66 medium White yes no low66 puwa long Red yes no moderateRC 10 short White no no low77 puwa short Red yes yes highIR 36 medium white yes no moderate36 puwa long Red yes no moderate

2
Appendix 8. Characterization data of researcher
Variety Name Leaf Bladepubescence
Leaf Bladecolor
BasalLeafSheathcolor
Leaf Bladecolor
Collar color Auricle color Leaflength
Leafwidth
Culmlength
Culmnumber
RC 18 Pubescent Green Green Light green Light green Light green 44.00 1.08 73.60 12RC 18 selection Pubescent Green Green Light green Light green Light green 40.20 1.04 108.20 9IR 66 Pubescent Light green Green Light green Light green Light green 35.60 1.10 64.60 1166 puwa Pubescent Light green Green Light green Light green Light green 34.40 1.02 70.20 11RC 10 Pubescent Green Green Light green Light green Light green 35.60 0.96 58.40 1177 puwa Pubescent Green Green Light green Light green Light green 40.20 1.00 69.80 8IR 36 Pubescent Green Green Light green Light green Light green 36.80 0.98 58.60 1236 puwa Pubescent Green Green Light green Light green Light green 38.80 1.04 76.60 8
Variety Name Culm angle Culm Internodecolor
Culm strength Awning Lemma and Paleapubescence
Scent Flag Leaf angle
RC 18 Erect Green Strong Awnless Short hairs Non scented ErectRC 18 selection Erect Green Moderately strong Awnless Short hairs Non scented ErectIR 66 Erect Green Strong Awnless Short hairs Non scented Erect66 puwa Erect Green Strong Awnless Short hairs Non scented ErectRC 10 Erect Green Strong Awnless Short hairs Non scented Erect77 puwa Erect Green Strong Awnless Short hairs Lightly scented ErectIR 36 Erect Green Strong Awnless Short hairs Non scented Erect36 puwa Erect Green Strong Awnless Short hairs Non scented Erect

3
Variety Name Paniclelength
Panicle type Panicle exsertion Paniclethreshability
Awn color Apiculuscolor
Stigmacolor
Lemma andPalea color
SterileLemmacolor
Spikeletfertility
RC 18 24.92 Intermediate Moderately wellexserted
Intermediate Awnless Straw White Straw Straw Fertile
RC 18 selection 23.94 Intermediate Well exserted Intermediate Awnless Straw White Straw Straw Highlyfertile
IR 66 21.00 Intermediate Moderately wellexserted
Intermediate Awnless Straw White Straw Straw Highlyfertile
66 puwa 23.02 Intermediate Moderately wellexserted
Intermediate Awnless Straw White Straw Straw Highlyfertile
RC 10 22.00 Compact Moderately wellexserted
Intermediate Awnless Straw White Straw Straw Highlyfertile
77 puwa 23.14 Compact Moderately wellexserted
Intermediate Awnless Straw White Brown furrowson straw
Straw Highlyfertile
IR 36 19.82 Compact Just exserted Intermediate Awnless Straw White Straw Straw Fertile36 puwa 23.36 Intermediate Moderately well
exsertedLoose Awnless Straw White Brown furrows
on strawStraw Highly
fertile
Variety Name 100grainweight
Grain length Grain width Seed coat color Endosperm type Leaf senescence Maturity (days)
RC 18 3.50 9.5 3.0 White Non-glutinous Early and fast 130RC 18 selection 3.00 9.3 3.0 Red Non-glutinous Intermediate 114IR 66 2.40 8.8 3.0 White Non-glutinous Intermediate 11566 puwa 2.60 9.9 3.0 Red Non-glutinous Intermediate 115RC 10 2.70 9.5 3.0 White Non-glutinous Early and fast 10577 puwa 2.70 8.7 3.0 Red Non-glutinous Early and fast 100IR 36 2.40 9.7 3.0 White Non-glutinous Early and fast 11436 puwa 2.90 9.9 3.0 Red Non-glutinous Early and fast 117
Related Documents