Farm Balance Sheet Farm Balance Sheet Analysis Analysis AAE 320 AAE 320 Paul D. Mitchell Paul D. Mitchell

Welcome message from author
This document is posted to help you gain knowledge. Please leave a comment to let me know what you think about it! Share it to your friends and learn new things together.
Transcript

Farm Balance Sheet Farm Balance Sheet AnalysisAnalysis
AAE 320AAE 320
Paul D. MitchellPaul D. Mitchell

GoalGoal
Overview accounting balance sheet Overview accounting balance sheet as it pertains to agricultural as it pertains to agricultural operationsoperations
How to prepare and/or read oneHow to prepare and/or read one How to use one (financial ratios)How to use one (financial ratios)

Balance SheetBalance Sheet Systematic listing of everything owned Systematic listing of everything owned
and owed by a business/individualand owed by a business/individual Gives statement of owner equity at a Gives statement of owner equity at a
point in timepoint in time Typically for end of accounting period, Typically for end of accounting period,
such as end of year for taxessuch as end of year for taxes Interim balance sheets often Interim balance sheets often
used/needed for loan applicationsused/needed for loan applications
Balance SheetBalance Sheet
Balance sheet: Everything must balanceBalance sheet: Everything must balance Asset: anything ownedAsset: anything owned Liability: debt or financial obligation Liability: debt or financial obligation
owedowed The Basic Accounting Identity must holdThe Basic Accounting Identity must hold
Assets = Liabilities + Owner EquityAssets = Liabilities + Owner Equity
Owner Equity = Assets – LiabilitiesOwner Equity = Assets – Liabilities Equity is what’s left, the residualEquity is what’s left, the residual

Uses of Balance SheetUses of Balance Sheet
Measures financial position of firm, Measures financial position of firm, focusing on long and short run measuresfocusing on long and short run measures
SolvencySolvency: measures relative relationships : measures relative relationships among assets, liabilities and equity to among assets, liabilities and equity to assess “health” of firm (financial ratios)assess “health” of firm (financial ratios)
LiquidityLiquidity: measures ability to meet : measures ability to meet current financial obligations as they come current financial obligations as they come due without disrupting normal business—due without disrupting normal business—ability to generate cash on short-term ability to generate cash on short-term
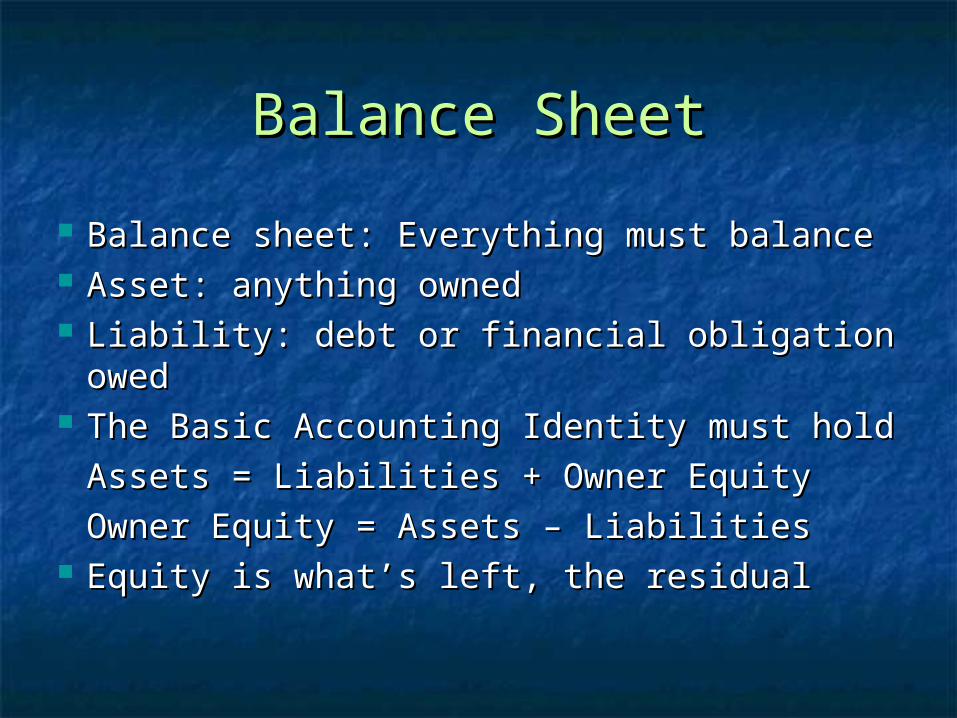
Balance Sheet FormatBalance Sheet Format
AssetsAssets LiabilitiesLiabilities
Current AssetsCurrent Assets $10$1000
Current LiabilitiesCurrent Liabilities $50$50
Non-Current Non-Current AssetsAssets
$15$1500
Non-Current Non-Current LiabilitiesLiabilities
$10$1000
Owner EquityOwner Equity $10$1000
Total AssetsTotal Assets $25$2500
Total Liability and Total Liability and EquityEquity
$25$2500

AssetsAssets
Anything the firm owns that has Anything the firm owns that has value because can sell it and/or use value because can sell it and/or use it to produce sellable goodsit to produce sellable goods
Liquid assets: easy to sell, ready Liquid assets: easy to sell, ready market for them (grain, feeder market for them (grain, feeder livestock)livestock)
Illiquid assets: hard to sell quickly at Illiquid assets: hard to sell quickly at full value (machinery, land, breeding full value (machinery, land, breeding livestock)livestock)

Assets on Balance SheetAssets on Balance Sheet
Current AssetsCurrent Assets Cash, bank accounts, marketable funds, Cash, bank accounts, marketable funds,
accounts receivable (money owed to accounts receivable (money owed to you), inventories of liquid assets: grain, you), inventories of liquid assets: grain, feed, supplies, feeder livestockfeed, supplies, feeder livestock
Non-Current AssetsNon-Current Assets Everything else: machinery, equipment, Everything else: machinery, equipment,
breeding livestock, buildings, landbreeding livestock, buildings, land

Liabilities on Balance SheetLiabilities on Balance Sheet Obligations or debts owed; any outside Obligations or debts owed; any outside
claims against one or more of your assetsclaims against one or more of your assets Current LiabilitiesCurrent Liabilities
Financial obligations due within 1 yearFinancial obligations due within 1 year Accounts at suppliers, farm store, etc.Accounts at suppliers, farm store, etc. Interest & principle on operating and long-term Interest & principle on operating and long-term
loansloans Accrued expenses: property and income taxesAccrued expenses: property and income taxes
Non-Current LiabilitiesNon-Current Liabilities Everything else not due in the next yearEverything else not due in the next year Remaining balance on long-term debts Remaining balance on long-term debts afterafter
deducting the current year’s paymentsdeducting the current year’s payments
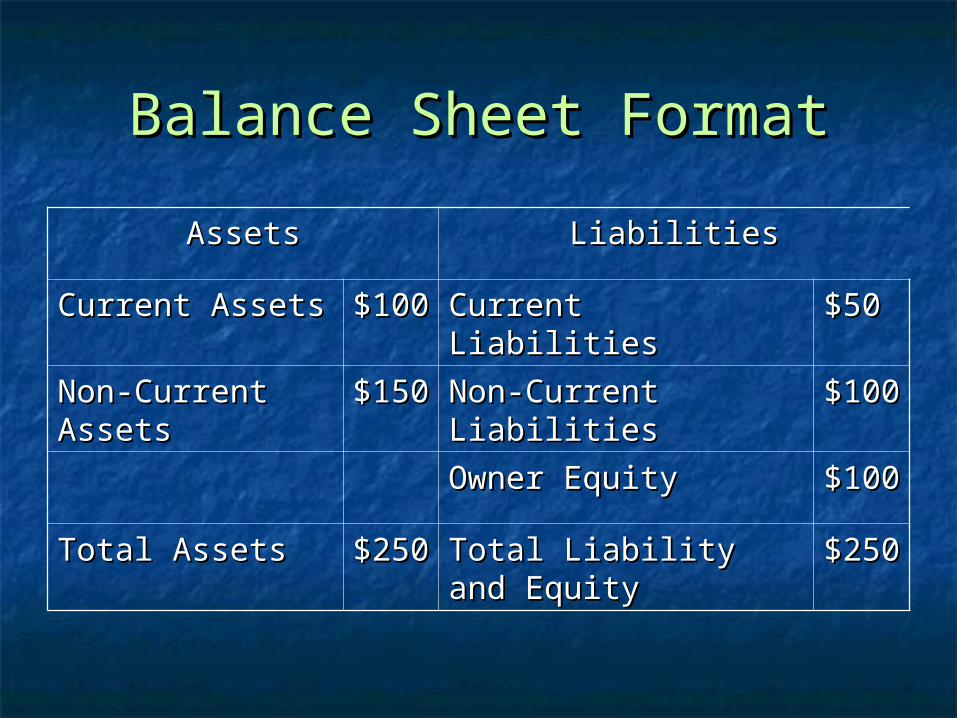
Alternative Balance Sheet Alternative Balance Sheet FormatsFormats
Traditional farm balance sheets used Traditional farm balance sheets used other categories, but use decreasingother categories, but use decreasing
Intermediate Asset: less liquid with life Intermediate Asset: less liquid with life 1 to 10 years (machinery, equipment, 1 to 10 years (machinery, equipment, perennial crops, breeding livestock)perennial crops, breeding livestock)
Fixed Asset: > 10 year life: land, Fixed Asset: > 10 year life: land, buildingsbuildings
Intermediate Liability: 1 – 10 year loansIntermediate Liability: 1 – 10 year loans Long-term Liabilities: > 10 year loansLong-term Liabilities: > 10 year loans

Owner Equity = Net WorthOwner Equity = Net Worth Value left after assets are used to cover Value left after assets are used to cover
all liabilities, what you “own” in the farmall liabilities, what you “own” in the farm Your current investment in the farmYour current investment in the farm Equity changes for many reasonsEquity changes for many reasons
Profits/losses from production activitiesProfits/losses from production activities Sell assets for different values than on sheetSell assets for different values than on sheet Add/withdraw capital from the farmAdd/withdraw capital from the farm Asset value changes if use market prices for Asset value changes if use market prices for
asset valuation, e.g., land value increasesasset valuation, e.g., land value increases

Owner Equity = Net WorthOwner Equity = Net Worth
Business transactions only change the mix Business transactions only change the mix of assets/liabilities, not owner equityof assets/liabilities, not owner equity
Buying a $10,000 piece of machinery does Buying a $10,000 piece of machinery does not change your equitynot change your equity If cash purchase, current assets drop $10,000 If cash purchase, current assets drop $10,000
and non-current assets increase $10,000and non-current assets increase $10,000 If borrow $10,000, liability increases $10,000 If borrow $10,000, liability increases $10,000
and non-current assets increase $10,000and non-current assets increase $10,000 Equity only changes due to business Equity only changes due to business
profit/loss, if you put money in/pull it out, profit/loss, if you put money in/pull it out, and/or (in some cases) if asset values and/or (in some cases) if asset values change change

Asset Valuation ProblemAsset Valuation Problem
How do you value assets when How do you value assets when developing a balance sheet, Cost or developing a balance sheet, Cost or Market BasisMarket Basis
Basic accounting says use cost basis, Basic accounting says use cost basis, but not always right in agriculturebut not always right in agriculture
Cost Basis: value = purchase cost minus Cost Basis: value = purchase cost minus depreciation, or = farm production costdepreciation, or = farm production cost
Market Basis: value = current market Market Basis: value = current market value minus selling costsvalue minus selling costs
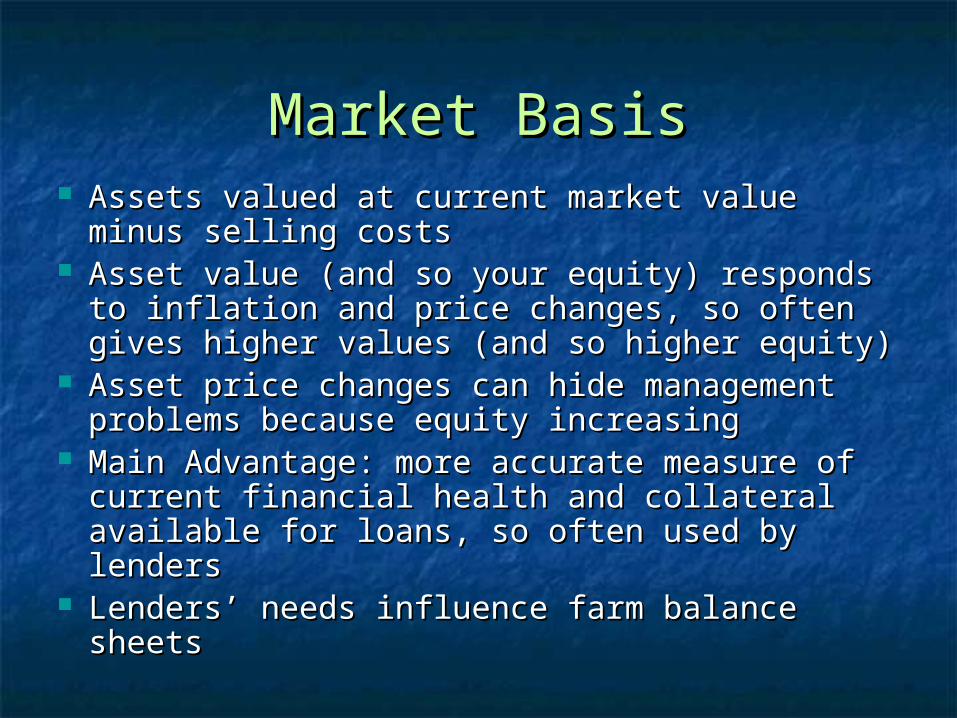
Market BasisMarket Basis Assets valued at current market value Assets valued at current market value
minus selling costsminus selling costs Asset value (and so your equity) responds Asset value (and so your equity) responds
to inflation and price changes, so often to inflation and price changes, so often gives higher values (and so higher equity)gives higher values (and so higher equity)
Asset price changes can hide management Asset price changes can hide management problems because equity increasingproblems because equity increasing
Main Advantage: more accurate measure of Main Advantage: more accurate measure of current financial health and collateral current financial health and collateral available for loans, so often used by lendersavailable for loans, so often used by lenders
Lenders’ needs influence farm balance Lenders’ needs influence farm balance sheetssheets
Cost BasisCost Basis
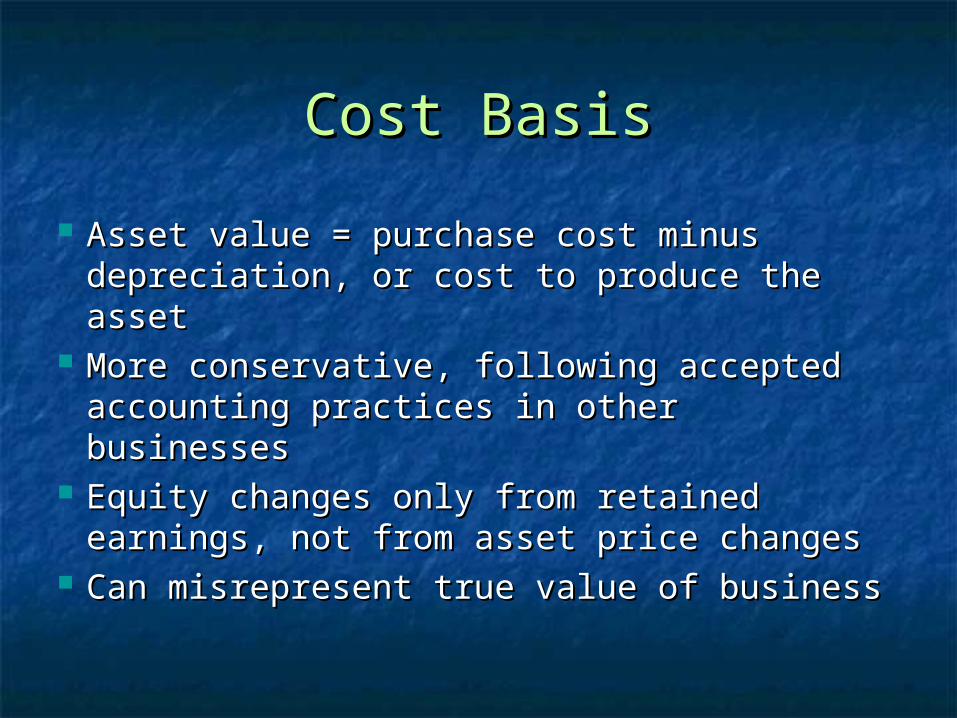
Asset value = purchase cost minus Asset value = purchase cost minus depreciation, or cost to produce the assetdepreciation, or cost to produce the asset
More conservative, following accepted More conservative, following accepted accounting practices in other businessesaccounting practices in other businesses
Equity changes only from retained Equity changes only from retained earnings, not from asset price changesearnings, not from asset price changes
Can misrepresent true value of businessCan misrepresent true value of business
Farm Financial Standard Farm Financial Standard CommitteeCommittee
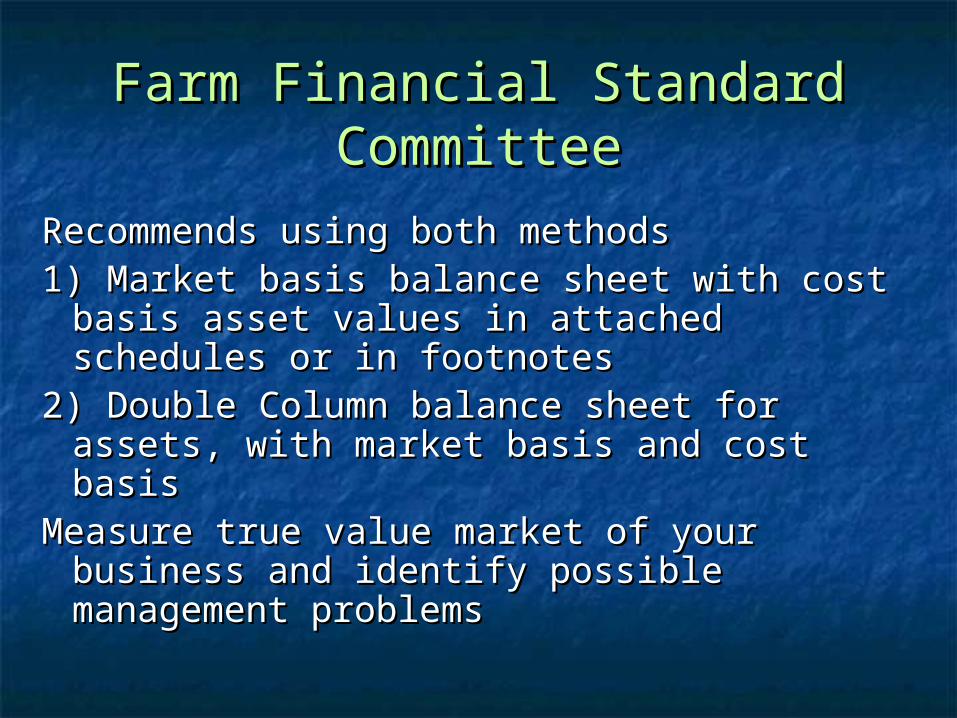
Recommends using both methodsRecommends using both methods1) Market basis balance sheet with cost 1) Market basis balance sheet with cost
basis asset values in attached schedules basis asset values in attached schedules or in footnotesor in footnotes
2) Double Column balance sheet for assets, 2) Double Column balance sheet for assets, with market basis and cost basiswith market basis and cost basis
Measure true value market of your business Measure true value market of your business and identify possible management and identify possible management problemsproblems
Both Methods use Both Both Methods use Both MethodsMethods
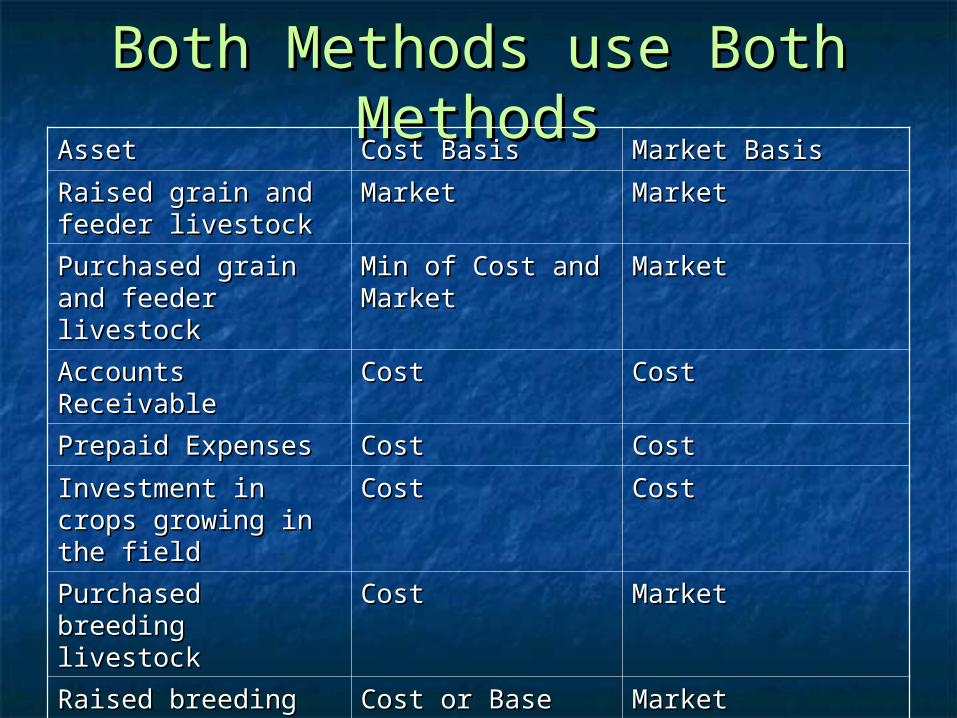
AssetAsset Cost BasisCost Basis Market BasisMarket Basis
Raised grain and Raised grain and feeder livestockfeeder livestock
MarketMarket MarketMarket
Purchased grain and Purchased grain and feeder livestockfeeder livestock
Min of Cost and Min of Cost and MarketMarket
MarketMarket
Accounts ReceivableAccounts Receivable CostCost CostCost
Prepaid ExpensesPrepaid Expenses CostCost CostCost
Investment in crops Investment in crops growing in the fieldgrowing in the field
CostCost CostCost
Purchased breeding Purchased breeding livestocklivestock
CostCost MarketMarket
Raised breeding Raised breeding livestocklivestock
Cost or Base ValueCost or Base Value MarketMarket
Machinery, Machinery, equipment, equipment, buildings, landbuildings, land
CostCost MarketMarket

Grain/Livestock Inventories Grain/Livestock Inventories and Crops in the Fieldsand Crops in the Fields
Grain in the bin, animals on the lot ready Grain in the bin, animals on the lot ready to go, use market basisto go, use market basis Exception: Purchased grain/livestock that Exception: Purchased grain/livestock that
has gone up in value, use cost if on a cost has gone up in value, use cost if on a cost basisbasis
Crops still growing in the field, use cost, Crops still growing in the field, use cost, since still subject to production riskssince still subject to production risks ““Don’t count your chickens before the eggs hatch”Don’t count your chickens before the eggs hatch”

Raised Breeding LivestockRaised Breeding Livestock Cost basis: supposed to accumulate all Cost basis: supposed to accumulate all
costs to get the animal from birth to costs to get the animal from birth to productive age (and not include these productive age (and not include these in the income statement), then in the income statement), then depreciate this total cost over its depreciate this total cost over its useful lifetime just as though useful lifetime just as though purchased it at this pricepurchased it at this price
Alternative: a fixed base value for each Alternative: a fixed base value for each age/type of animal to approximate this age/type of animal to approximate this cost and its depreciation, won’t change cost and its depreciation, won’t change with asset market priceswith asset market prices
DepreciationDepreciation
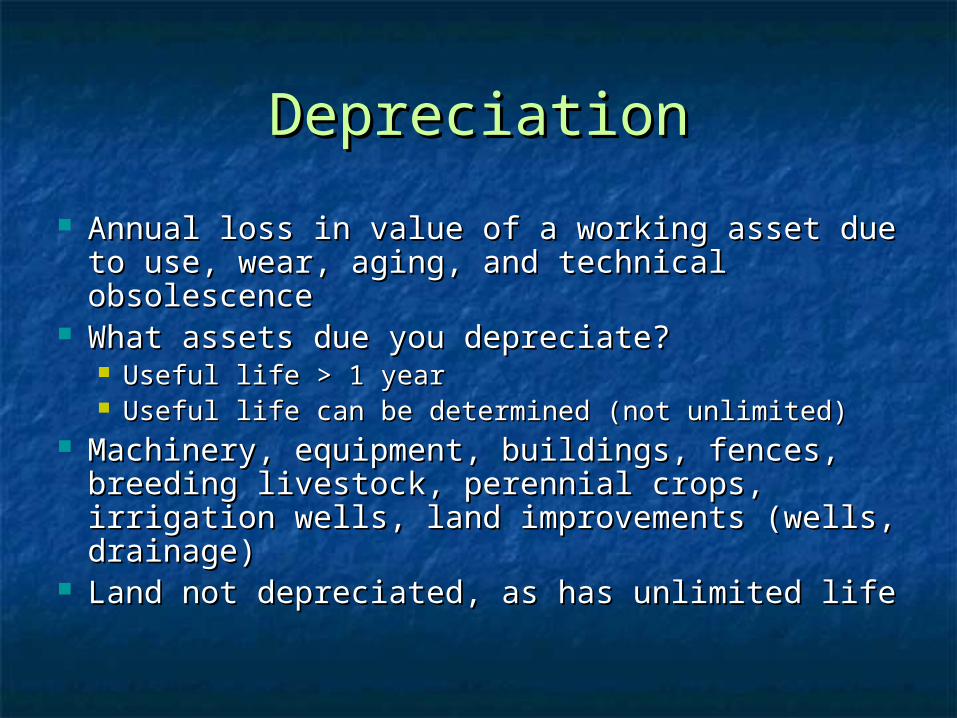
Annual loss in value of a working asset due to Annual loss in value of a working asset due to use, wear, aging, and technical obsolescenceuse, wear, aging, and technical obsolescence
What assets due you depreciate?What assets due you depreciate? Useful life > 1 yearUseful life > 1 year Useful life can be determined (not unlimited)Useful life can be determined (not unlimited)
Machinery, equipment, buildings, fences, Machinery, equipment, buildings, fences, breeding livestock, perennial crops, irrigation breeding livestock, perennial crops, irrigation wells, land improvements (wells, drainage)wells, land improvements (wells, drainage)
Land not depreciated, as has unlimited lifeLand not depreciated, as has unlimited life

Depreciation DefinitionsDepreciation Definitions CostCost: All costs paid for the asset, : All costs paid for the asset,
including price, taxes, delivery and including price, taxes, delivery and installation fees, expenses to get the installation fees, expenses to get the asset into useasset into use
Useful LifeUseful Life: Number of years you expect : Number of years you expect to use the asset in your businessto use the asset in your business
Salvage ValueSalvage Value: Expected market value : Expected market value at end of useful you assigned; zero if at end of useful you assigned; zero if you will use it until worn out and has no you will use it until worn out and has no scrap or junk value at endscrap or junk value at end

Depreciation IntuitionDepreciation Intuition
Want to allocate the initial cost of long Want to allocate the initial cost of long term asset across the useful life you give term asset across the useful life you give itit
Cost – Salvage Value is asset’s total Cost – Salvage Value is asset’s total depreciation over its Useful Life—How depreciation over its Useful Life—How much do you assign to each year?much do you assign to each year?
Several formulas make Several formulas make assumptionsassumptions and and estimateestimate annual depreciation, none is annual depreciation, none is correct for all assets in all situationscorrect for all assets in all situations

Graphics of DepreciationGraphics of Depreciation
Time Time (Years)(Years)
Valu
e (
$)
Valu
e (
$)
Initial Initial CostCost
Salvage Salvage ValueValue
Useful Useful LifeLife
Total Total DepreciatiDepreciation to on to AllocateAllocate

Graphics of DepreciationGraphics of Depreciation
Time Time (Years)(Years)
Valu
e (
$)
Valu
e (
$)
BB
AA
Use a mathematical formula to describe Use a mathematical formula to describe how to get from Point A to Point Bhow to get from Point A to Point B
Slope of the line between any two years Slope of the line between any two years is the annual depreciation during that is the annual depreciation during that yearyear
Depreciation = Depreciation = Value/Value/tt
One YearOne Year
t = 1t = 1
VV
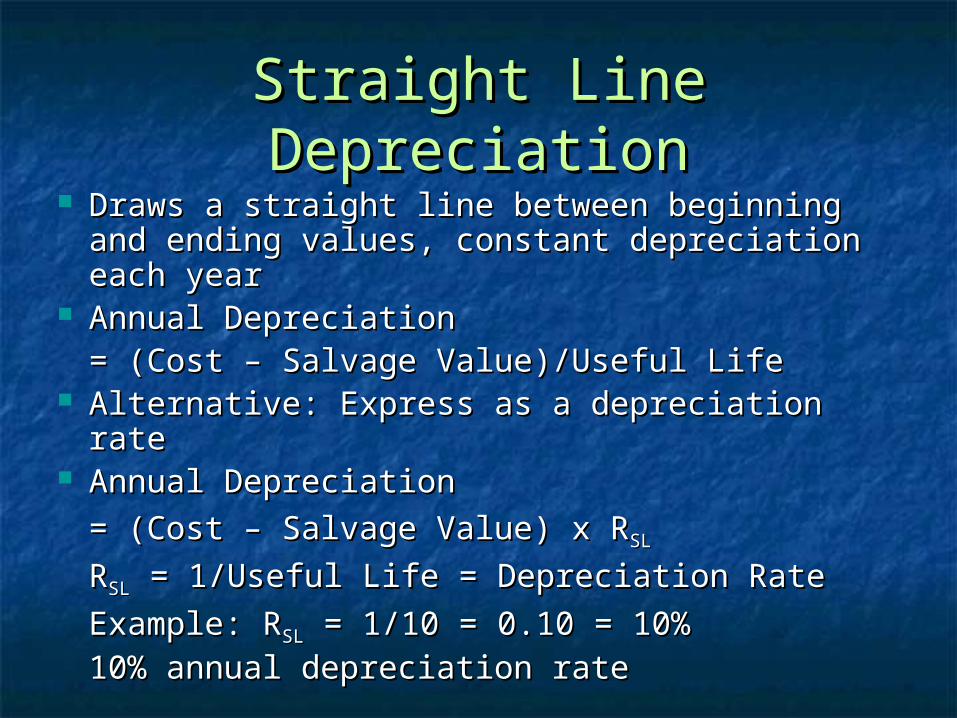
Straight Line DepreciationStraight Line Depreciation Draws a straight line between beginning and Draws a straight line between beginning and
ending values, constant depreciation each ending values, constant depreciation each yearyear
Annual Depreciation Annual Depreciation = (Cost – Salvage Value)/Useful Life= (Cost – Salvage Value)/Useful Life
Alternative: Express as a depreciation rateAlternative: Express as a depreciation rate Annual Depreciation Annual Depreciation
= (Cost – Salvage Value) x R= (Cost – Salvage Value) x RSLSL
RRSLSL = 1/Useful Life = Depreciation Rate = 1/Useful Life = Depreciation Rate
Example: RExample: RSLSL = 1/10 = 0.10 = 10% = 1/10 = 0.10 = 10%10% annual depreciation rate10% annual depreciation rate

Straight Line Depreciation Straight Line Depreciation ExampleExample
$100,000 machine, use for 6 years and $100,000 machine, use for 6 years and expected salvage value of $40,000expected salvage value of $40,000
Annual Depreciation = Annual Depreciation =
($100,000 – $40,000)/6 = $10,000($100,000 – $40,000)/6 = $10,000 RRSLSL = 1/6 = 0.167 = 16.7% = 1/6 = 0.167 = 16.7% Annual Depreciation = Annual Depreciation =
($100,000 – $40,000) x 16.7% = ($100,000 – $40,000) x 16.7% = $10,020$10,020

Straight Line Depreciation Straight Line Depreciation ExampleExample
Value AtValue At
Year StartYear StartValue AtValue At
Year EndYear End
YearYear Beginning Beginning BasisBasis
DepreciatioDepreciatio
nn
Ending Ending BasisBasis
11 100,000100,000 10,00010,000 90,00090,000
22 90,00090,000 10,00010,000 80,00080,000
33 80,00080,000 10,00010,000 70,00070,000
44 70,00070,000 10,00010,000 60,00060,000
55 60,00060,000 10,00010,000 50,00050,000
66 50,00050,000 10,00010,000 40,00040,000

0
20,000
40,000
60,000
80,000
100,000
120,000
0 1 2 3 4 5 6
Year
Val
ue a
t Y
ear
Sta
rt

Sum of the Year’s DigitsSum of the Year’s DigitsAnnual Depreciation = Annual Depreciation =
(Cost – Salvage Value) x RUL/SOYD(Cost – Salvage Value) x RUL/SOYD
RUL = Remaining Useful Life at RUL = Remaining Useful Life at STARTSTART of year of year
SOYD = sum of the year’s digits from 1 to Useful SOYD = sum of the year’s digits from 1 to Useful LifeLife
Example: Useful Life = 6 years, then Example: Useful Life = 6 years, then
SOYD = 1 + 2 + 3 + 4 + 5 + 6 = 21SOYD = 1 + 2 + 3 + 4 + 5 + 6 = 21
SOYD = n(n +1)/2, where n = Useful LifeSOYD = n(n +1)/2, where n = Useful Life
Largest depreciation in first year, constant Largest depreciation in first year, constant decrease in depreciation for each year after thatdecrease in depreciation for each year after that

Sum of the Year’s Digits Sum of the Year’s Digits Depreciation ExampleDepreciation Example
$100,000 machine, use for 6 years and $100,000 machine, use for 6 years and expected salvage value of $40,000expected salvage value of $40,000
SOYD’s = 1 + 2 + 3 + 4 + 5 + 6 = 21SOYD’s = 1 + 2 + 3 + 4 + 5 + 6 = 21 Annual Depreciation = Annual Depreciation =
(Cost – Salvage Value) x RUL/SOYD(Cost – Salvage Value) x RUL/SOYD 11stst Year (RUL at start = 6) Year (RUL at start = 6)
($100,000 – $40,000) x (6 – 0)/21 = $17,143($100,000 – $40,000) x (6 – 0)/21 = $17,143 22ndnd Year (RUL at start = 5) Year (RUL at start = 5)
($100,000 – $40,000) x (6 – 1)/21 = $14,286($100,000 – $40,000) x (6 – 1)/21 = $14,286

SOYD Depreciation ExampleSOYD Depreciation Example
YeaYearr
DepreciationDepreciation
11 (100,000 – 40,000) x (6 – 0)/21 = (100,000 – 40,000) x (6 – 0)/21 = 17,14317,143
22 (100,000 – 40,000) x (6 – 1)/21 = (100,000 – 40,000) x (6 – 1)/21 = 14,28614,286
33 (100,000 – 40,000) x (6 – 2)/21 = (100,000 – 40,000) x (6 – 2)/21 = 11,42911,429
44 (100,000 – 40,000) x (6 – 3)/21 = (100,000 – 40,000) x (6 – 3)/21 = 8,5718,571
55 (100,000 – 40,000) x (6 – 4)/21 = (100,000 – 40,000) x (6 – 4)/21 = 5,7145,714
66 (100,000 – 40,000) x (6 – 5)/21 = (100,000 – 40,000) x (6 – 5)/21 = 2,8572,857
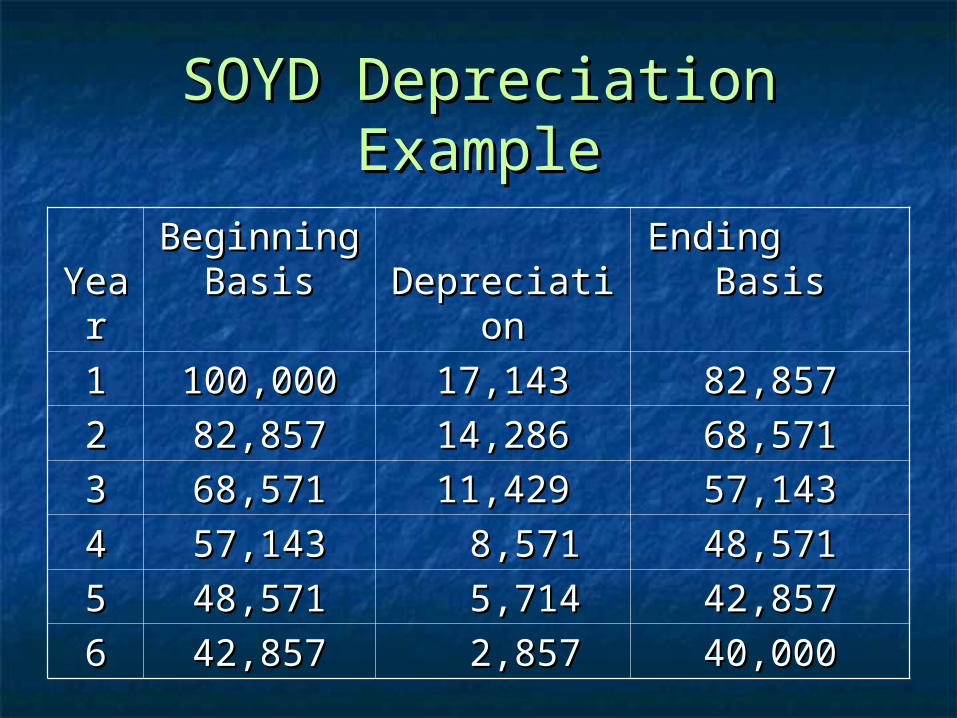
SOYD Depreciation ExampleSOYD Depreciation Example
YeaYea
rr
Beginning Beginning BasisBasis
DepreciatioDepreciatio
nn
Ending Ending BasisBasis
11 100,000100,000 17,14317,143 82,85782,857
22 82,85782,857 14,28614,286 68,57168,571
33 68,57168,571 11,42911,429 57,14357,143
44 57,14357,143 8,5718,571 48,57148,571
55 48,57148,571 5,7145,714 42,85742,857
66 42,85742,857 2,8572,857 40,00040,000

0
20,000
40,000
60,000
80,000
100,000
120,000
0 1 2 3 4 5 6
Year
Val
ue a
t Y
ear
Sta
rt
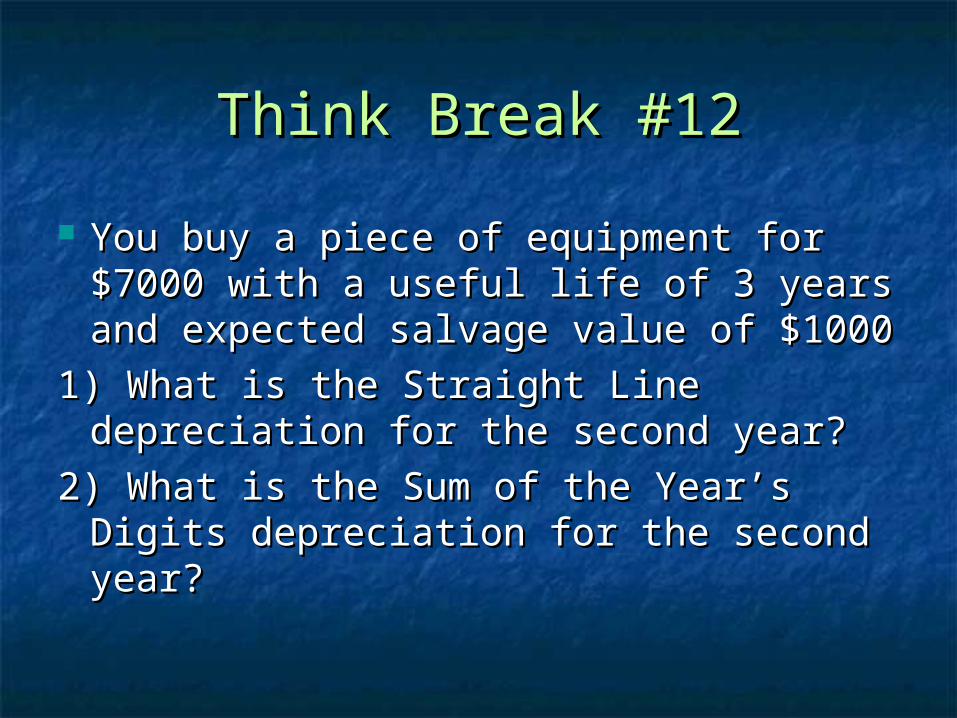
Think Break #12Think Break #12
You buy a piece of equipment for You buy a piece of equipment for $7000 with a useful life of 3 years $7000 with a useful life of 3 years and expected salvage value of $1000and expected salvage value of $1000
1) What is the Straight Line 1) What is the Straight Line depreciation for the second year?depreciation for the second year?
2) What is the Sum of the Year’s Digits 2) What is the Sum of the Year’s Digits depreciation for the second year?depreciation for the second year?
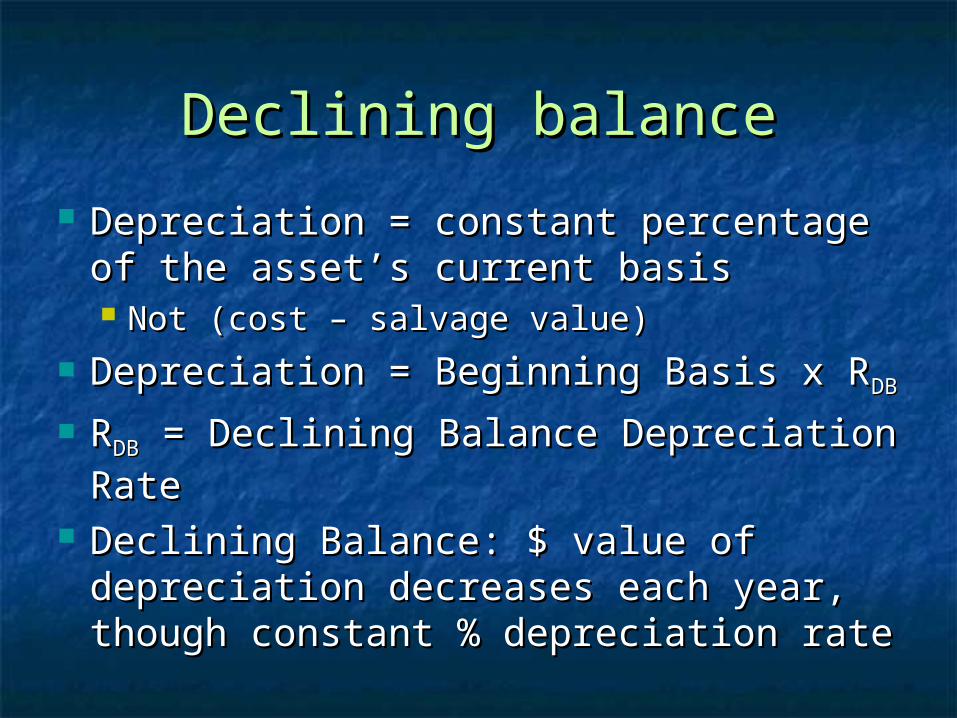
Declining balanceDeclining balance
Depreciation = constant percentage Depreciation = constant percentage of the asset’s current basisof the asset’s current basis Not (cost – salvage value)Not (cost – salvage value)
Depreciation = Beginning Basis x RDepreciation = Beginning Basis x RDBDB
RRDBDB = Declining Balance Depreciation = Declining Balance Depreciation RateRate
Declining Balance: $ value of Declining Balance: $ value of depreciation decreases each year, depreciation decreases each year, though constant % depreciation ratethough constant % depreciation rate

Declining BalanceDeclining Balance
Declining Balance Depreciation Rate RDeclining Balance Depreciation Rate RDBDB usually a multiple of the Straight Line usually a multiple of the Straight Line Depreciation Rate RDepreciation Rate RSLSL = 1/Useful Life = 1/Useful Life
RRDBDB = 2 x R = 2 x RSLSL, is Double Declining , is Double Declining Balance or 200% Declining BalanceBalance or 200% Declining Balance
Also see 1.75/175%, 1.50/150% and Also see 1.75/175%, 1.50/150% and 1.25/125% declining balance1.25/125% declining balance
Depreciation for taxes uses declining Depreciation for taxes uses declining balancebalance
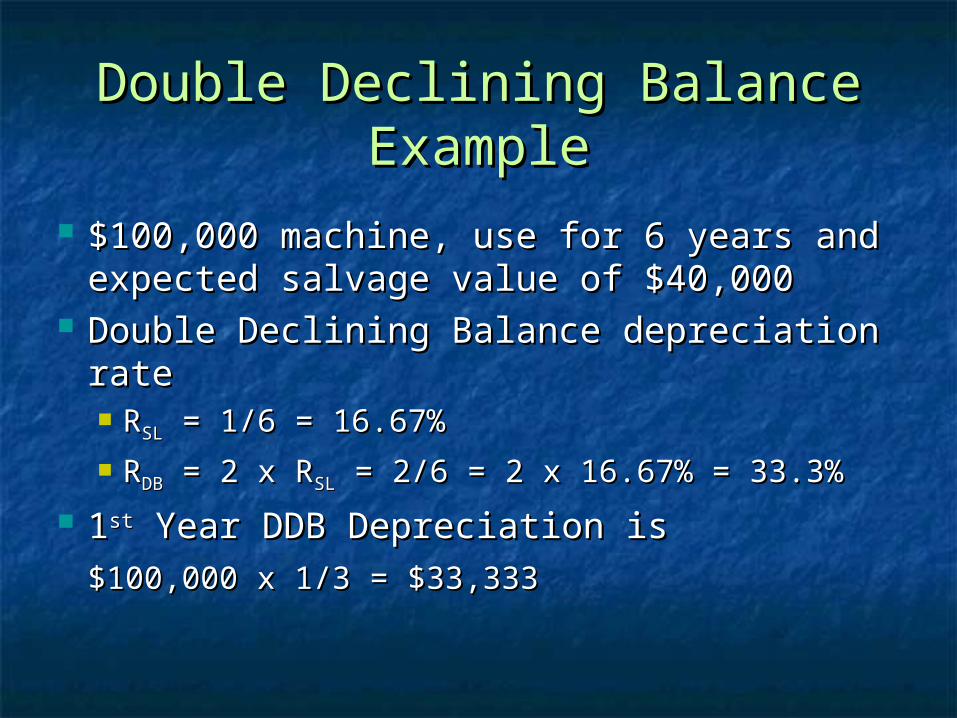
Double Declining Balance Double Declining Balance ExampleExample
$100,000 machine, use for 6 years and $100,000 machine, use for 6 years and expected salvage value of $40,000expected salvage value of $40,000
Double Declining Balance depreciation Double Declining Balance depreciation raterate RRSLSL = 1/6 = 16.67% = 1/6 = 16.67% RRDBDB = 2 x R = 2 x RSLSL = 2/6 = 2 x 16.67% = 33.3% = 2/6 = 2 x 16.67% = 33.3%
11stst Year DDB Depreciation is Year DDB Depreciation is
$100,000 x 1/3 = $33,333$100,000 x 1/3 = $33,333

Double Declining Balance Double Declining Balance ExampleExample
YeaYearr
BeginniBeginningng
BasisBasisCalculationCalculation DepreciatiDepreciati
onon
EndinEndingg
BasisBasis
11 100,000100,000 100,000 x 100,000 x 33%33%
33,33333,333 66,6666,6677
22 66,66766,667 66,667 x 66,667 x 33%33%
22,22222,222 44,4444,4444
33 44,44444,444 44,444 x 44,444 x 33%33%
14,81514,815 29,6329,6300
44 29,63029,630 29,630 x 29,630 x 33%33%
9,8779,877 19,7519,7533
55 19,75319,753 19,753 x 19,753 x 33%33%
6,5846,584 13,1613,1699
66 13,16913,169 13,169 x 13,169 x 33%33%
4,3904,390 8,7798,779

Double Declining Balance Double Declining Balance ExampleExample
YeaYearr
Beginning Beginning BasisBasis
DepreciatioDepreciationn
Ending Ending BasisBasis
11 100,000100,000 33,33333,333 66,66766,667
22 66,66766,667 22,22222,222 44,44444,444
33 44,44444,444 14,81514,815 29,63029,630
44 29,63029,630 9,8779,877 19,75319,753
55 19,75319,753 6,5846,584 13,16913,169
66 13,16913,169 4,3904,390 8,7798,779Problem: Basis can fall below salvage Problem: Basis can fall below salvage valuevalue

Potential Problems with Potential Problems with Double Declining BalanceDouble Declining Balance
Assets with Assets with positivepositive salvage value, salvage value, basis can fall below salvage valuebasis can fall below salvage value Stop depreciation at salvage valueStop depreciation at salvage value
Assets with Assets with zerozero salvage value, basis salvage value, basis never reaches zeronever reaches zero Switch to straight line after some set Switch to straight line after some set
timetime Take remaining value in last yearTake remaining value in last year

Double Declining Balance Double Declining Balance ExampleExample
(Salvage value = $40,000)(Salvage value = $40,000)YeaYea
rrBeginning Beginning
BasisBasisDepreciatioDepreciatio
nnEnding Ending BasisBasis
11 100,000100,000 33,33333,333 66,66766,667
22 66,66766,667 22,22222,222 44,44444,444
33 44,44444,444 4,4444,444 40,00040,000
44 40,00040,000 00 40,00040,000
55 40,00040,000 00 40,00040,000
66 40,00040,000 00 40,00040,000

0
20,000
40,000
60,000
80,000
100,000
120,000
0 1 2 3 4 5 6
Year
Val
ue a
t Y
ear
Sta
rt

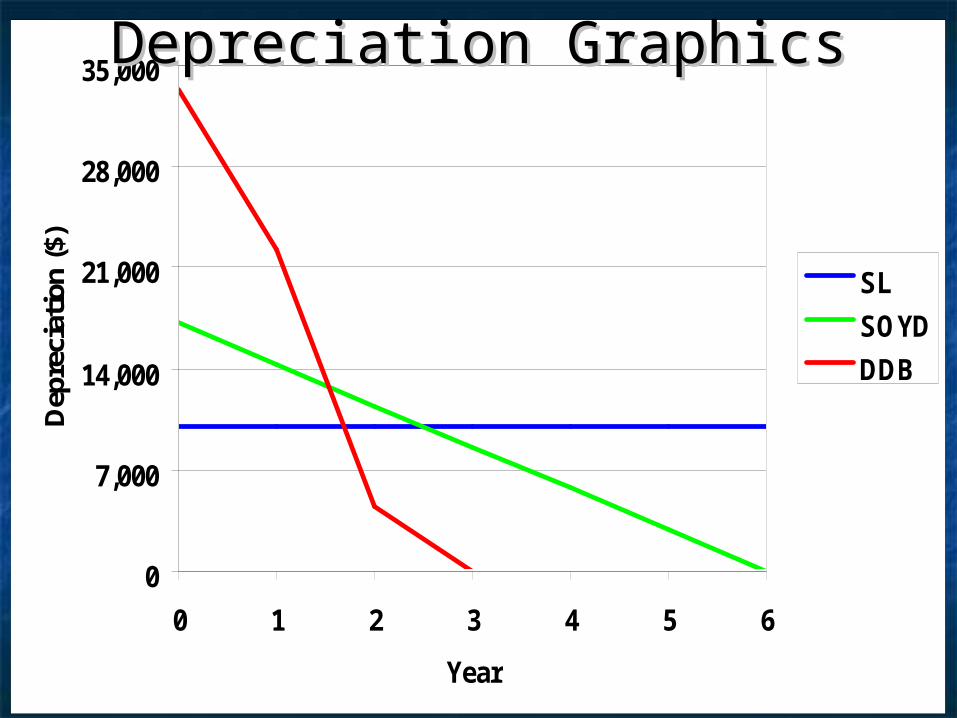
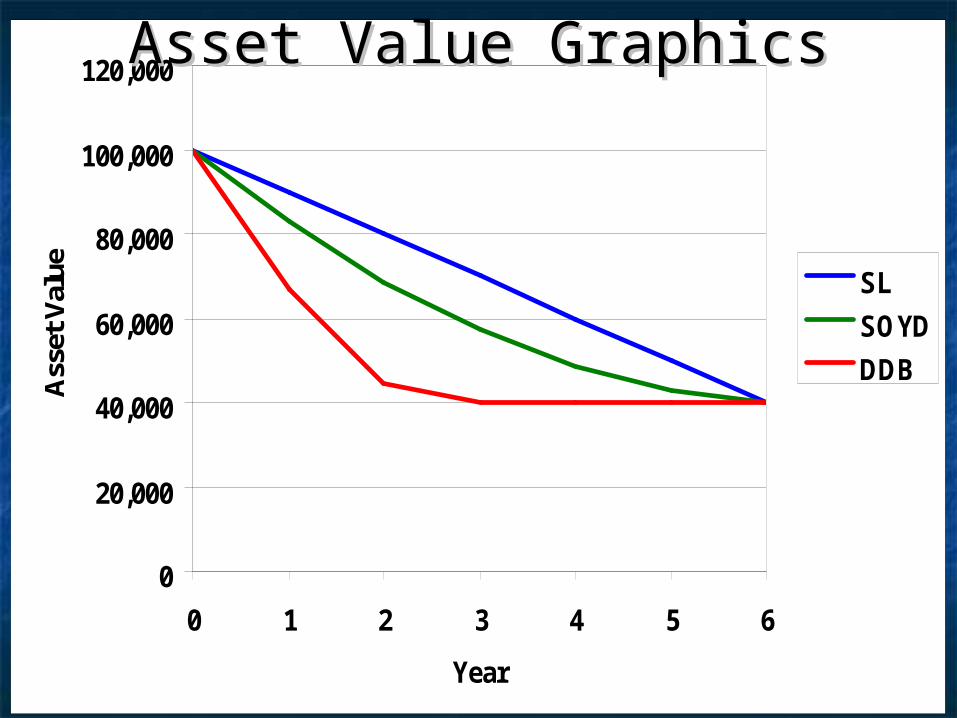
Compare the ThreeCompare the Three Straight Line DepreciationStraight Line Depreciation
Slowest depreciation; Finishes at the Slowest depreciation; Finishes at the salvage value without any adjustmentssalvage value without any adjustments
Sum of the Year’s DigitsSum of the Year’s Digits Medium rate of depreciation; Finishes at the Medium rate of depreciation; Finishes at the
salvage value without any adjustmentssalvage value without any adjustments Declining BalanceDeclining Balance
Typically fastest (specially DDB); Often has Typically fastest (specially DDB); Often has to be adjusted to finish at the salvage valueto be adjusted to finish at the salvage value
0
7,000
14,000
21,000
28,000
35,000
0 1 2 3 4 5 6
Year
Dep
reci
atio
n ($
)
SL
SOYD
DDB
Depreciation GraphicsDepreciation Graphics
0
20,000
40,000
60,000
80,000
100,000
120,000
0 1 2 3 4 5 6
Year
Ass
et V
alue SL
SOYD
DDB
Asset Value GraphicsAsset Value Graphics
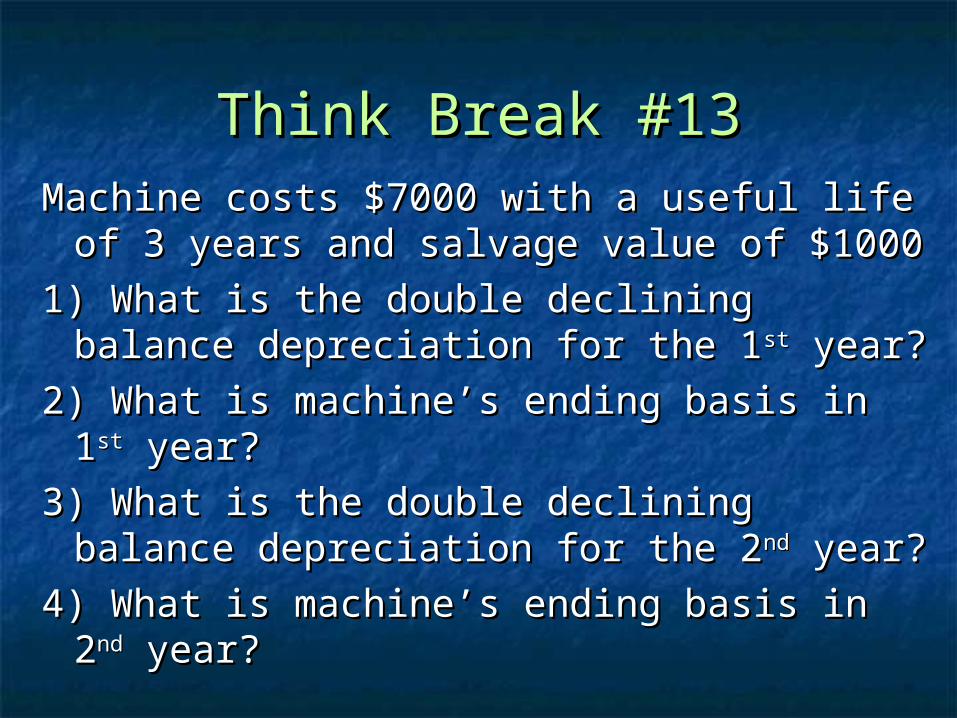
Think Break #13Think Break #13Machine costs $7000 with a useful life of 3 Machine costs $7000 with a useful life of 3
years and salvage value of $1000years and salvage value of $1000
1) What is the double declining balance 1) What is the double declining balance depreciation for the 1depreciation for the 1stst year? year?
2) What is machine’s ending basis in 12) What is machine’s ending basis in 1stst year?year?
3) What is the double declining balance 3) What is the double declining balance depreciation for the 2depreciation for the 2ndnd year? year?
4) What is machine’s ending basis in 24) What is machine’s ending basis in 2ndnd year?year?

Depreciation and TaxesDepreciation and Taxes US tax code has rules and options for US tax code has rules and options for
depreciating business assets, depreciating business assets, including those used by farmersincluding those used by farmers
MACRS: Modified Accelerated Cost MACRS: Modified Accelerated Cost Recovery SystemRecovery System
Three methods used: 200% DB, Three methods used: 200% DB, 150% DB, and Straight Line150% DB, and Straight Line Depends on asset typeDepends on asset type Sometime you get to chooseSometime you get to choose
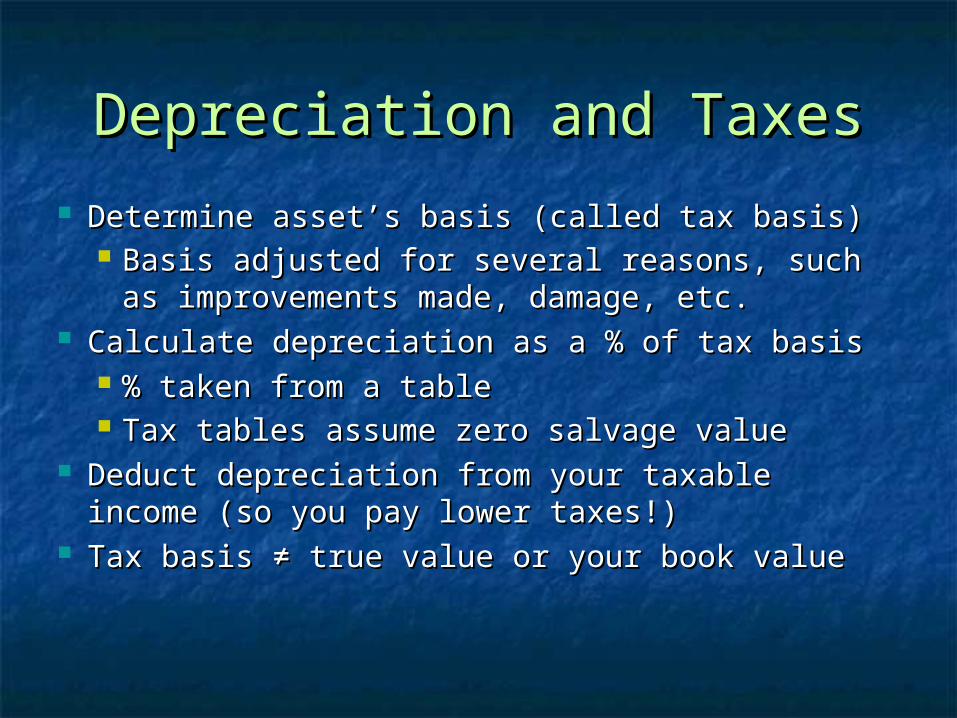
Depreciation and TaxesDepreciation and Taxes
Determine asset’s basis (called tax basis)Determine asset’s basis (called tax basis) Basis adjusted for several reasons, such Basis adjusted for several reasons, such
as improvements made, damage, etc.as improvements made, damage, etc. Calculate depreciation as a % of tax basisCalculate depreciation as a % of tax basis
% taken from a table% taken from a table Tax tables assume zero salvage valueTax tables assume zero salvage value
Deduct depreciation from your taxable Deduct depreciation from your taxable income (so you pay lower taxes!)income (so you pay lower taxes!)
Tax basis ≠ true value or your book valueTax basis ≠ true value or your book value

Depreciation and TaxesDepreciation and Taxes
Section 179: Allows taking a large amount Section 179: Allows taking a large amount of depreciation in year purchase assetof depreciation in year purchase asset Way to really reduce income (and so taxes)Way to really reduce income (and so taxes) Buy equipment/building and write Buy equipment/building and write fullfull cost off cost off
as a cost of business in that yearas a cost of business in that year The ending basis of asset is zero in first yearThe ending basis of asset is zero in first year
Many farmers do this in years they make Many farmers do this in years they make more money than usualmore money than usual
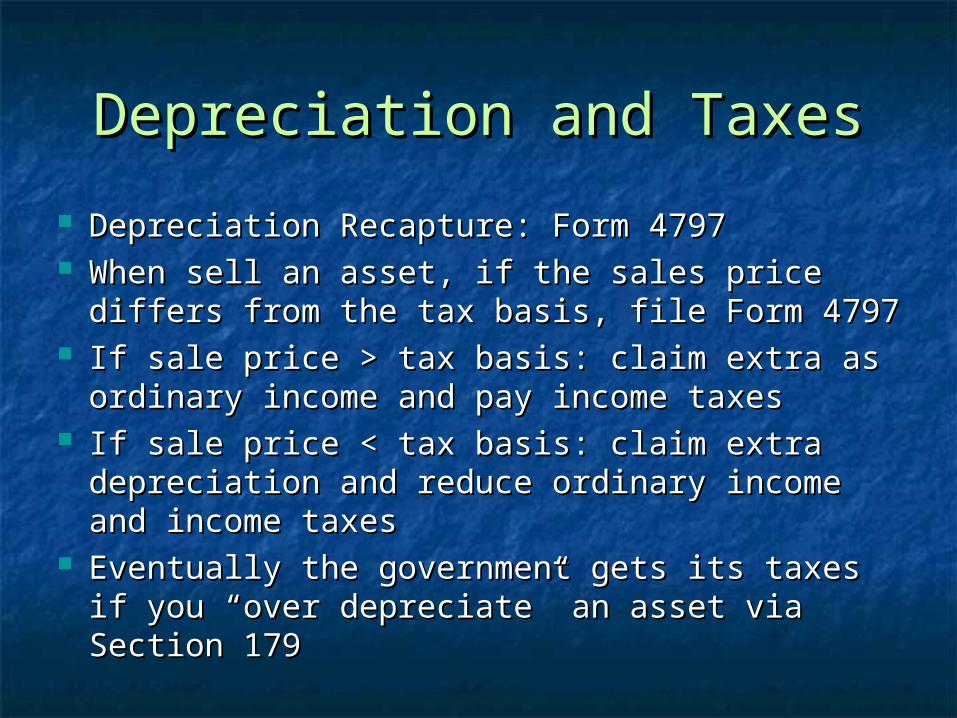
Depreciation and TaxesDepreciation and Taxes
Depreciation Recapture: Form 4797Depreciation Recapture: Form 4797 When sell an asset, if the sales price differs When sell an asset, if the sales price differs
from the tax basis, file Form 4797from the tax basis, file Form 4797 If sale price > tax basis: claim extra as If sale price > tax basis: claim extra as
ordinary income and pay income taxesordinary income and pay income taxes If sale price < tax basis: claim extra If sale price < tax basis: claim extra
depreciation and reduce ordinary income and depreciation and reduce ordinary income and income taxesincome taxes
Eventually the government gets its taxes if Eventually the government gets its taxes if you “over depreciate” an asset via Section you “over depreciate” an asset via Section 179179
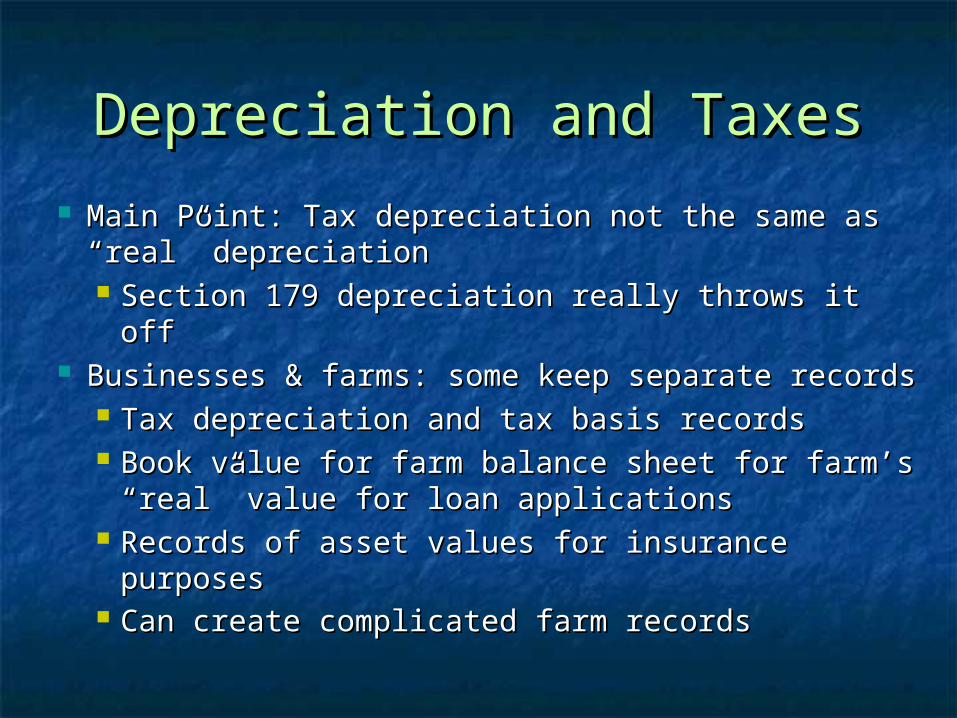
Depreciation and TaxesDepreciation and Taxes
Main Point: Tax depreciation not the same as Main Point: Tax depreciation not the same as “real” depreciation“real” depreciation Section 179 depreciation really throws it offSection 179 depreciation really throws it off
Businesses & farms: some keep separate recordsBusinesses & farms: some keep separate records Tax depreciation and tax basis recordsTax depreciation and tax basis records Book value for farm balance sheet for farm’s Book value for farm balance sheet for farm’s
“real” value for loan applications“real” value for loan applications Records of asset values for insurance purposesRecords of asset values for insurance purposes Can create complicated farm recordsCan create complicated farm records

Summary Thus FarSummary Thus Far Explained concept of a balance sheetExplained concept of a balance sheet
Current and Non-current AssetsCurrent and Non-current Assets Current and Non-current LiabilitiesCurrent and Non-current Liabilities Equity: what balances the sheetEquity: what balances the sheet
How value Assets: cost or market basisHow value Assets: cost or market basis How depreciate assets: straight line, sum of How depreciate assets: straight line, sum of
year’s digits, double declining balanceyear’s digits, double declining balance Taxes and depreciationTaxes and depreciation What do you do with a balance What do you do with a balance
sheet??????sheet??????

What use is a Balance What use is a Balance Sheet?Sheet?
Can see where assets and liabilities are Can see where assets and liabilities are and their relative sizesand their relative sizes
Can look at changes if have balance sheets Can look at changes if have balance sheets from previous years—see if you’re gainingfrom previous years—see if you’re gaining
Typically focus on ratios to look at Typically focus on ratios to look at LiquidityLiquidity and and SolvencySolvency of the business of the business
Ratios control for differences in business Ratios control for differences in business sizesize

Current Ratio and LiquidityCurrent Ratio and Liquidity
Measures ability to meet current Measures ability to meet current financial obligations as they come due financial obligations as they come due without disrupting normal business—without disrupting normal business—ability to generate cash on short-termability to generate cash on short-term
Current Ratio = Current Ratio =
Current Assets/Current LiabilitiesCurrent Assets/Current Liabilities Example: 1.4 or 40%Example: 1.4 or 40%

Current RatioCurrent Ratio
Too low: cash flow problems, if asset prices Too low: cash flow problems, if asset prices change or costs suddenly arise (repairs), can change or costs suddenly arise (repairs), can have trouble meeting current liabilitieshave trouble meeting current liabilities Don’t want to sell 10 acres to put new roof on barnDon’t want to sell 10 acres to put new roof on barn
Too high: holding too much cash, current Too high: holding too much cash, current assets typically have lower return than if put assets typically have lower return than if put capital into other longer term assets or capital into other longer term assets or marketmarket Income lost by keeping cash “under the mattress” Income lost by keeping cash “under the mattress” Parable of the talents: buried gold in groundParable of the talents: buried gold in ground

What are typical current What are typical current ratios?ratios?
IL Farm Business Farm Management IL Farm Business Farm Management Program of 2,166 IL farms in 1996Program of 2,166 IL farms in 1996
Fairly typical by farm typesFairly typical by farm types Farm TypeFarm Type Median Current RatioMedian Current Ratio
HogsHogs 2.03 2.03GrainGrain 1.81 1.81BeefBeef 1.57 1.57DairyDairy 1.33 1.33

What’s a good Current What’s a good Current Ratio?Ratio?
Iowa State University ExtensionIowa State University Extension: : Typically farms with adequate liquidity have Typically farms with adequate liquidity have
current ratios > 2.0current ratios > 2.0 Farms with continuous sales (dairy) often Farms with continuous sales (dairy) often
have current ratio as low as 1.5have current ratio as low as 1.5 Beef feeding farms have low current ratiosBeef feeding farms have low current ratios Farms with concentrated sales (cash grain) Farms with concentrated sales (cash grain)
need current ratio as high as 3.0 early in yearneed current ratio as high as 3.0 early in year Ohio State University ExtensionOhio State University Extension: Measures of : Measures of
Dairy Farm Competitiveness: 1.3 is competitiveDairy Farm Competitiveness: 1.3 is competitive

Working Capital vs Current Working Capital vs Current RatioRatio
““Working Capital” older term used by some Working Capital” older term used by some Working Capital = Working Capital =
Current Assets – Current LiabilitiesCurrent Assets – Current Liabilities Measures the margin of safety in dollars Measures the margin of safety in dollars
(not ratio or %) to meet short-term liabilities(not ratio or %) to meet short-term liabilities Must relate it to size of business, that’s why Must relate it to size of business, that’s why
we use current ratio!we use current ratio! $10,000 not much for a 5000 acre farm, but may $10,000 not much for a 5000 acre farm, but may
be more than enough for a 20 cow dairybe more than enough for a 20 cow dairy This why most use current ratioThis why most use current ratio

SolvencySolvency Measures relative relationships among assets, Measures relative relationships among assets,
liabilities, and equity to assess “health” of firmliabilities, and equity to assess “health” of firm Could the farm debt be paid off if foreclosed?Could the farm debt be paid off if foreclosed?
Requires Assets > LiabilitiesRequires Assets > Liabilities Measured by three ratiosMeasured by three ratios
Debt to Asset RatioDebt to Asset Ratio Equity to Asset RatioEquity to Asset Ratio Debt to Equity RatioDebt to Equity Ratio
Given any one ratio, you can derive the others, Given any one ratio, you can derive the others, so each is a different way to look at Solvencyso each is a different way to look at Solvency
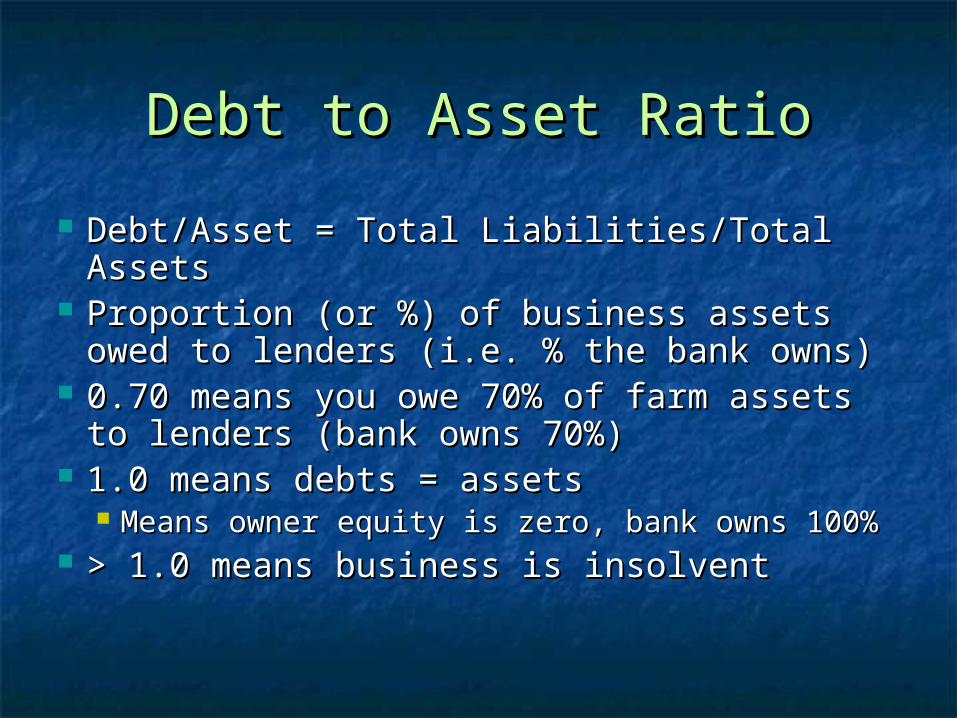
Debt to Asset RatioDebt to Asset Ratio
Debt/Asset = Total Liabilities/Total AssetsDebt/Asset = Total Liabilities/Total Assets Proportion (or %) of business assets owed Proportion (or %) of business assets owed
to lenders (i.e. % the bank owns)to lenders (i.e. % the bank owns) 0.70 means you owe 70% of farm assets 0.70 means you owe 70% of farm assets
to lenders (bank owns 70%)to lenders (bank owns 70%) 1.0 means debts = assets1.0 means debts = assets
Means owner equity is zero, bank owns 100%Means owner equity is zero, bank owns 100% > 1.0 means business is insolvent> 1.0 means business is insolvent

Equity to Asset RatioEquity to Asset Ratio
Equity/Asset = Total Equity/Total AssetsEquity/Asset = Total Equity/Total Assets Proportion (or %) of assets ownedProportion (or %) of assets owned 0.45 means you own 45% of farm0.45 means you own 45% of farm 1.0 means equity = assets so owner has 1.0 means equity = assets so owner has
no liabilities (he/she owns all equity)no liabilities (he/she owns all equity) Own 100% of the farmOwn 100% of the farm
< 0 means business is insolvent—has no < 0 means business is insolvent—has no or negative equityor negative equity
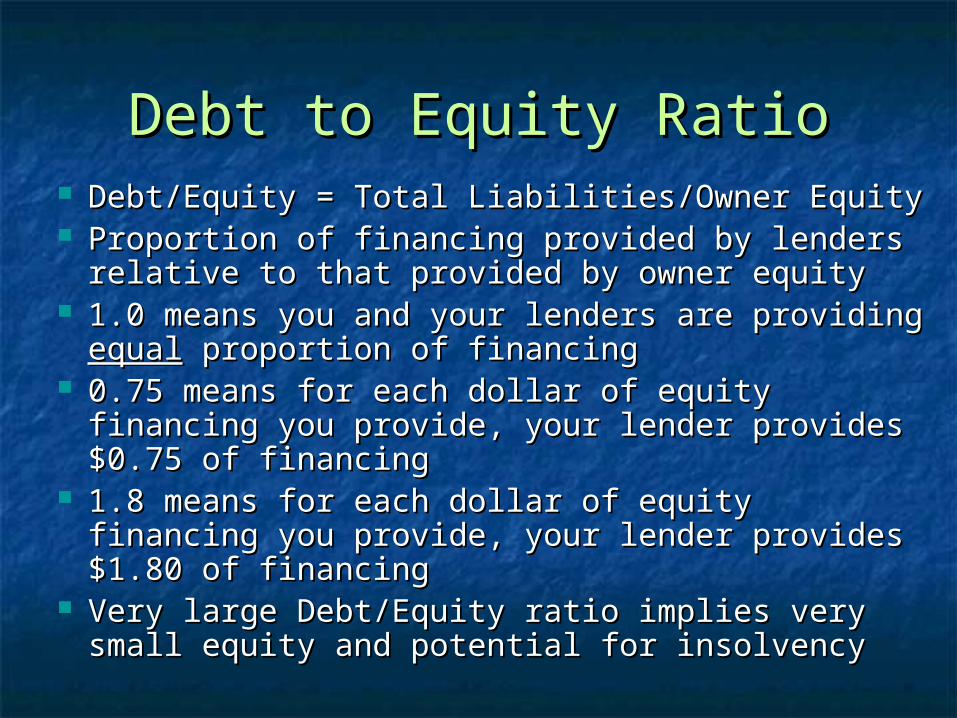
Debt to Equity RatioDebt to Equity Ratio Debt/Equity = Total Liabilities/Owner EquityDebt/Equity = Total Liabilities/Owner Equity Proportion of financing provided by lenders Proportion of financing provided by lenders
relative to that provided by owner equityrelative to that provided by owner equity 1.0 means you and your lenders are providing 1.0 means you and your lenders are providing
equalequal proportion of financing proportion of financing 0.75 means for each dollar of equity financing 0.75 means for each dollar of equity financing
you provide, your lender provides $0.75 of you provide, your lender provides $0.75 of financingfinancing
1.8 means for each dollar of equity financing you 1.8 means for each dollar of equity financing you provide, your lender provides $1.80 of financingprovide, your lender provides $1.80 of financing
Very large Debt/Equity ratio implies very small Very large Debt/Equity ratio implies very small equity and potential for insolvencyequity and potential for insolvency

Relation between RatiosRelation between Ratios Given any of these three financial Given any of these three financial
ratios, you can derive the othersratios, you can derive the others Basic Accounting Identity must holdBasic Accounting Identity must hold
Assets = Liabilities + EquityAssets = Liabilities + EquityAssets = Debts + EquityAssets = Debts + Equity
Notation: A = D + ENotation: A = D + E Debt/Asset = D/ADebt/Asset = D/A Equity/Asset = E/AEquity/Asset = E/A Debt/Equity = D/EDebt/Equity = D/E

A = D + EA = D + E Divide by A: 1 = D/A + E/ADivide by A: 1 = D/A + E/A Debt/Asset + Equity/Asset = 1, orDebt/Asset + Equity/Asset = 1, or Equity/Asset = 1 – Debt/AssetEquity/Asset = 1 – Debt/Asset Debt/Asset = 1 – Equity/AssetDebt/Asset = 1 – Equity/Asset
(D/A)/(E/A) = D/E, or(D/A)/(E/A) = D/E, or Debt/Equity = Debt-to-Asset/Equity-to-AssetDebt/Equity = Debt-to-Asset/Equity-to-Asset
Rearrange and use D/A and D/E connectionRearrange and use D/A and D/E connection Debt/Asset = Debt/Equity/(1 + Debt/Equity)Debt/Asset = Debt/Equity/(1 + Debt/Equity) Equity/Asset = 1/(1 + Debt/Equity)Equity/Asset = 1/(1 + Debt/Equity)
Relation between RatiosRelation between Ratios

Typical Solvency RatiosTypical Solvency Ratios
IL Farm Business Farm Management IL Farm Business Farm Management Program of 2,166 IL farms in 1996Program of 2,166 IL farms in 1996 Debt to Asset RatiosDebt to Asset Ratios
Farm TypeFarm Type upper 25% Median lower upper 25% Median lower 25%25%
HogsHogs 0.440.44 0.300.30 0.160.16GrainGrain 0.460.46 0.290.29 0.150.15BeefBeef 0.520.52 0.310.31 0.170.17DairyDairy 0.500.50 0.360.36 0.230.23

WI Center for Dairy ProfitabilityWI Center for Dairy Profitability WI Dairy Balance Sheet for 2000WI Dairy Balance Sheet for 2000
Size (cows)Size (cows) Debt/AssetDebt/Asset Equity/AssetEquity/Asset Debt/EquityDebt/Equity
< 50< 50 22.8%22.8% 77.2%77.2% 29.6%29.6%
51-7551-75 24.3%24.3% 75.7%75.7% 32.1%32.1%
76-10076-100 29.0%29.0% 71.0%71.0% 40.8%40.8%
101-150101-150 31.1%31.1% 68.9%68.9% 45.2%45.2%
151-250151-250 48.8%48.8% 51.2%51.2% 95.2%95.2%
> 250> 250 52.7%52.7% 47.3%47.3% 111.6%111.6%

More InformationMore Information
Provide a quick list/overview of what Provide a quick list/overview of what sort of information is available on sort of information is available on farm financefarm finance
Farm Financial Standards CouncilFarm Financial Standards Council University Extension: UW and other University Extension: UW and other
statesstates UW Center for Dairy ProfitabilityUW Center for Dairy Profitability

Farm Financial Standards Farm Financial Standards CouncilCouncil
Home page: Home page: http://www.ffsc.org/index.htmlhttp://www.ffsc.org/index.html Mission: “To provide education and a national forum to Mission: “To provide education and a national forum to
facilitate the development, review, communication and facilitate the development, review, communication and promotion of uniformity and integrity in both financial promotion of uniformity and integrity in both financial reporting and the analytic techniques useful for effective reporting and the analytic techniques useful for effective and realistic measurement of the financial position and and realistic measurement of the financial position and the financial performance of agricultural producers.”the financial performance of agricultural producers.”
Financial Guidelines for Agricultural ProducersFinancial Guidelines for Agricultural Producers http://www.ffsc.org/html/guidelin.htmhttp://www.ffsc.org/html/guidelin.htm
Recommendations of how to prepare Farm Recommendations of how to prepare Farm Financial Balance Sheet with several examplesFinancial Balance Sheet with several examples
TheThe source for this sort of information source for this sort of information

UW-ExtensionUW-Extension
Bruce Jones (AAE, UW-Madison) Focuses on Bruce Jones (AAE, UW-Madison) Focuses on dairy farm management and land valuationdairy farm management and land valuation
See his home page for most recent papers and See his home page for most recent papers and
presentations: presentations: http://www.aae.wisc.edu/jones/http://www.aae.wisc.edu/jones/ Gregg Hadley (Ag Econ, UW-Riverfalls) focuses Gregg Hadley (Ag Econ, UW-Riverfalls) focuses
on dairy farm management profitability and on dairy farm management profitability and financefinance
http://www.uwrf.edu/extension/GreggH.htmhttp://www.uwrf.edu/extension/GreggH.htm Both work with UW Center for Dairy ProfitabilityBoth work with UW Center for Dairy Profitability
UW Center for Dairy UW Center for Dairy ProfitabilityProfitability
Homepage: Homepage: http://www.cdp.wisc.edu/http://www.cdp.wisc.edu/ Focuses mostly (not exclusively) on dairyFocuses mostly (not exclusively) on dairy Lots of materials, some financialLots of materials, some financial WI dairy data as Farm Balance Sheets for WI dairy data as Farm Balance Sheets for
comparison and benchmarkingcomparison and benchmarkinghttp://www.cdp.wisc.edu/Financial%20Benchmarks.htmhttp://www.cdp.wisc.edu/Financial%20Benchmarks.htm

Neighboring StatesNeighboring States
Center for Farm Financial Center for Farm Financial ManagementManagement
http://http://www.cffm.umn.eduwww.cffm.umn.edu// Sell/Support FINPACK: “The most Sell/Support FINPACK: “The most
comprehensive computerized farm comprehensive computerized farm financial planning and analysis financial planning and analysis system available“system available“

Neighboring StatesNeighboring States
Iowa State University: AgDecision MakerIowa State University: AgDecision Makerhttp://http://www.extension.iastate.edu/agdm/homepage.htmlwww.extension.iastate.edu/agdm/homepage.html
University of Illinois: FarmDocUniversity of Illinois: FarmDoc
http://www.farmdoc.uiuc.edu/http://www.farmdoc.uiuc.edu/ Both have sections on Farm Finance with Both have sections on Farm Finance with
several publications and decision aidsseveral publications and decision aids

Non-Neighboring StatesNon-Neighboring States
Oklahoma State UniversityOklahoma State University Damona Doye’s web pageDamona Doye’s web page
http://http://agecon.okstate.edu/faculty/profile.asp?idagecon.okstate.edu/faculty/profile.asp?id==ddoyeddoye
Farm Financial Management ResourcesFarm Financial Management Resources
http://agecon.okstate.edu/faculty/ffmr.ashttp://agecon.okstate.edu/faculty/ffmr.aspp
Farm and Ranch Account BookFarm and Ranch Account Book
http://agecon.okstate.edu/farmbook/http://agecon.okstate.edu/farmbook/

SummarySummary Explained balance sheetExplained balance sheet
assets, liabilities, equityassets, liabilities, equity How to value Assets: cost or market How to value Assets: cost or market
basisbasis How to depreciate Assets: straight line, How to depreciate Assets: straight line,
sum of year’s digits, declining balancesum of year’s digits, declining balance Ratios: Current Ratio, Debt:Asset, etc.Ratios: Current Ratio, Debt:Asset, etc.
How to construct and interpretHow to construct and interpret Typical values by farm typeTypical values by farm type
Where to go for more informationWhere to go for more information
Related Documents