Fare Equity Analysis In compliance with Title VI of the Civil Rights Act of 1964 and the Federal Transit Administration Circular 4702.1B, Chapter V November 2014 Capital District Transportation Authority 110 Watervliet Avenue Albany, NY 12206

Welcome message from author
This document is posted to help you gain knowledge. Please leave a comment to let me know what you think about it! Share it to your friends and learn new things together.
Transcript
Fare Equity Analysis
In compliance with Title VI of the Civil Rights Act of 1964 and
the Federal Transit Administration Circular 4702.1B, Chapter V
November 2014 Capital District Transportation Authority 110 Watervliet Avenue Albany, NY 12206
CDTA Fare Equity Analysis – November 2014 Page | 2
Table of Contents Introduction .................................................................................................................................... 4
Title VI Regulatory Requirements ................................................................................................... 4
Agency Overview ............................................................................................................................ 4
Project Overview ............................................................................................................................. 5
Methodology ................................................................................................................................... 7
Current and Proposed Fare Structure ............................................................................................. 8
Current and Proposed Fare Types ............................................................................................. 10
Regional Demographics, Ridership, and Fare Profile ................................................................... 10
Regional Demographics and Ridership Data.............................................................................. 11
Proposed Title VI Fare Equity Policies ........................................................................................... 17
Population Definitions ............................................................................................................... 17
Proposed Fare Change Policies .................................................................................................. 17
Fare Equity Analysis ...................................................................................................................... 19
Impacts to Minority Ridership ................................................................................................... 19
Impacts to Low-Income Ridership ............................................................................................. 20
Public Outreach ............................................................................................................................. 23
Goals and Measures ................................................................................................................... 23
Communication Methods .......................................................................................................... 23
Minority, Low-Income, and Limited English Proficiency Populations ....................................... 26
Public Comments ....................................................................................................................... 27
Impacts .......................................................................................................................................... 29
Alternatives and Mitigation Measures ......................................................................................... 29
Summary ....................................................................................................................................... 31
Conclusion ..................................................................................................................................... 32
References .................................................................................................................................... 34
Appendix A – Demographic Data .................................................................................................. 35
Identification of Minority Census Tracts in CDTA Service Area by County ............................... 36
Identification of Low-Income Census Tracts in CDTA Service Area by County .......................... 44
Matrix: ACS Poverty Thresholds for 2013 by Size of Family and Number of Related Children Under 18 Years ........................................................................................................................... 52
2013 CDTA Fare Collection System Report Charts .................................................................... 53
Appendix B – Public Outreach Materials ...................................................................................... 54
Public Participation Plan (PPP) ................................................................................................... 55
Smart Card and Mobile Ticketing Public Outreach Locations ................................................... 59
Smart Card and Mobile Ticketing Public Outreach Locations ................................................... 59
2014 CDTA Customer Survey on Fare Payment Methods - Response Summary ...................... 62
Demographic Ridership Profile from CDTA Monthly On-Board Rider Evaluation Survey Form 64
Smart Card & Mobile Ticket Fare Product Public Meeting/Outreach Schedule (English) ......... 65
Smart Card & Mobile Ticket Fare Product Public Meeting/Outreach Schedule (Spanish)........ 66
Smart Card & Mobile Ticket Fare Product Public Hearing Schedule (English) .......................... 67
Smart Card & Mobile Ticket Fare Product Public Hearing Schedule (Spanish) ......................... 68
CDTA Fare Equity Analysis – November 2014 Page | 3
Meeting and Hearing Materials ................................................................................................. 69
Public Outreach Comment Response Summary ........................................................................ 76
Sample Completed Public Comment Forms and Sign-in Sheets ............................................... 77
CDTA Fare Equity Analysis – November 2014 Page | 4
Introduction The Capital District Transportation Authority (CDTA) is conducting a Fare Equity Analysis (FEA) to evaluate a proposal to implement a New Fare Collection System (NFCS) that will introduce the use of smart cards and mobile ticketing technology which will go into effect in 2015. The Fare Equity Analysis will assess if the associated proposed fare adjustments will have disparate impacts on minority and low-income populations and if low-income populations will bear a disproportionate burden of the fare adjustments. If impacts are identified, mitigation strategies will be considered in an effort to reduce negative impacts. In an effort to engage affected Title VI rider populations, a public outreach effort was implemented.
Title VI Regulatory Requirements This analysis was conducted in compliance with the Federal Transit administration (FTA) Circular 4702.1B, which requires that under the Title VI of the Civil Rights Act of 1964, transit agencies receiving federal funding evaluate significant system-wide service and fare changes and proposed improvements at the planning stages and programming stages to determine whether those changes have a discriminatory impact on minority and low-income populations. Title VI is a section of the Civil Rights Act of 1964 requiring that “No person in the United States shall on the grounds of race, color or national origin, be excluded from participation in, be denied the benefits of, or be subjected to discrimination under any program or activity receiving federal financial assistance.” The principles of Title VI are already used by CDTA to ensure that appropriate consideration is given to all stakeholders when major operational decisions are made. CDTA fully supports the objectives of Title VI, which seek to:
Ensure the level and quality of transit service is provided in a nondiscriminatory manner;
Promote full and fair participation in decision-making without regard to race, color, or national origin; and
Ensure meaningful access by persons with Limited English Proficiency (LEP).
Agency Overview CDTA is New York State’s Capital Region mobility company with an annual ridership of over 16 million. CDTA operates 270 buses from three facilities in Albany, Schenectady, and Troy. CDTA also owns and operates the rail stations in Saratoga Springs and Rensselaer. CDTA serves a metropolitan area of 841,667 people and has a workforce of 630. CDTA plans, finances, implements, and delivers transit services that take people where they want to go in the Capital Region safely, efficiently, and at a reasonable cost. CDTA works to accomplish this mission by:
Continually identifying ways to increase transit ridership and revenue
Taking a leadership role to help mold regional growth and improve the transportation network
Balancing regional needs for social service, congestion relief, and basic access
CDTA Fare Equity Analysis – November 2014 Page | 5
Delivering a range of transportation services that meets a diversity of markets and customers
Developing innovative ways to attract and retain a high quality workforce
Identifying appropriate funding sources to meet the region’s transportation needs
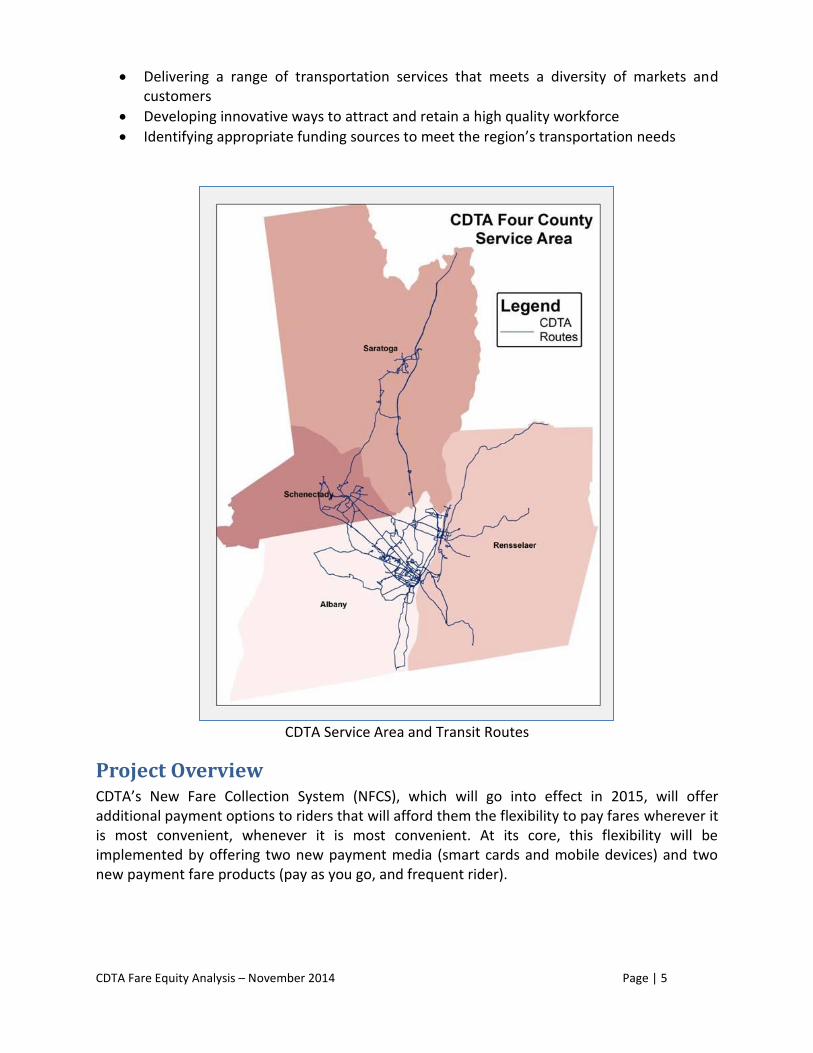
CDTA Service Area and Transit Routes
Project Overview CDTA’s New Fare Collection System (NFCS), which will go into effect in 2015, will offer additional payment options to riders that will afford them the flexibility to pay fares wherever it is most convenient, whenever it is most convenient. At its core, this flexibility will be implemented by offering two new payment media (smart cards and mobile devices) and two new payment fare products (pay as you go, and frequent rider).
CDTA Fare Equity Analysis – November 2014 Page | 6
Two payment options in addition to the standard cash fare payment option are being proposed:
“Pay As You Go” – Pay as you go is a stored value debit product that deducts value (dollars) from the rider’s registered account based on how many rides they take. The rider can load value on the card by:
o Visiting a CDTA sales outlet and paying with cash, credit, or debit card to place value on the account
o Visiting a retail point of sale outlet and paying with cash, credit, or debit card to place value on the account
o Visiting the CDTA website and paying with a credit or debit card to place value on the smart card (which can be done automatically by tying the smart card holder’s account to a bank account)
o Using a smart phone to place value on the account
“Frequent Rider” – Frequent rider is a period pass for riders who opt to purchase the option to ride for a specific period of time (i.e. a 31-day option). The rider can purchase Frequent Rider products using the same mechanisms as those used for Pay As You Go.
Pay As You Go and Frequent Rider products can both be placed on the same account at the same time. The associated smart phone application will be made available free of charge from the Apple iTunes and Google Play app stores. Smart cards can be considered the new and improved magnetic media that CDTA has been using for 20 years, pay as you go can be considered the new and improved version of paying with cash (which is not being eliminated), and frequent rider can be considered the new and improved version of CDTA’s “Swiper” rolling pass product. The proposed fare adjustments will not result in a fare increase for riders (including base cash fare, BusPlus, STAR, and NX riders) and the availability of new payment options it will provide is expected to improve rider experience in the following ways:
There will be an increase in fare payment options.
In most cases, there will be a reduced fare cost for those choosing to use the new media, and in the remainder of cases the cost will stay the same.
The automated nature of these products will result in reduced transaction time and expedited service at the fare box.
There will be increased security features for those who choose to use the new technologies.
The convenience of autoload, lost card protection, and rider incentives and discounts will encourage people to ride.
One change being proposed as part of the fare adjustments is that 12-18 months after launch, CDTA will phase out the ability to purchase a paper day pass on the bus. Regardless of whether the percentage of the minority or low-income ridership that use the day pass surpasses disparate impact or disproportionate burden thresholds, CDTA will still mitigate the impacts that will be experienced by current day pass users who purchase on the bus.
CDTA Fare Equity Analysis – November 2014 Page | 7
Methodology The main steps in completing this Fare Equity Analysis include:
Determining the number and percent of users of each payment media being changed
Reviewing fares before and after the change
Reviewing changes unrelated to fare change, such as availability of new payment media and access to locations for re-loading dollars onto new payment media
Comparing the difference in usage of each payment media between minority, low-income, and overall riders
Assessing the proposed fare change and non-fare change impacts on minority and low-income riders.
With regard to the fare changes, using CDTA’s minority disparate impact and low-income disproportionate burden policies, which were developed as part of a previous public outreach effort
Engaging the public in assessing the potential disparate impacts and/or disproportionate burdens and developing mitigation measures
Modifying the proposal if disparate impacts and/or disproportionate burdens are identified in order to avoid, minimize, or mitigate them and reanalyzing the proposed changes to determine whether the modifications remove potential impacts and/or burdens
Alternatively, providing justification for the proposed change showing that there are no alternatives that would have a less disparate impact or disproportionate burden but would still accomplish CDTA’s program goals
Demographic data for the counties and census tracts in CDTA’s service area was compiled in order to present a regional demographic context for survey and farebox collection data collected by CDTA. Data on race/ethnicity, was compiled from the 2010 US Census and data on income and ability to speak English was compiled from the 2008-2012 American Community Survey (ACS) 5-Year Estimates -- tables S1901: Income in the past 12 months (in 2012 inflation-adjusted dollars) and B16001: Language spoken at home by ability to speak English for the population 5 years and over, respectively. Onboard survey data was collected by CDTA in order to assess ridership characteristics. Data was collected on gender, age, race, income, number of people per household, languages spoken at home other than English, ridership frequency, method of fare payment, type of payment media used, where fare is typically purchased, method of Internet access, likelihood of using new proposed payment media, likely ridership frequency after introduction of new proposed payment media and fare products, and likely method of fare payment with new payment media. This data was collected from 24 months of CDTA Monthly On-Board Rider Evaluation Survey responses and from the 2014 CDTA Rider Customer Survey on Fare Payment Methods. Both the surveys as well as their respective response summaries are included in Appendix B. Additional data is provided from the 2013 CDTA Fare Collection System Report (see
CDTA Fare Equity Analysis – November 2014 Page | 8
CDTA Fare Products Usage Chart in Appendix A). This data on ridership distribution across fare types was collected by automated on-bus fare counters and shows the number and percent of users of each payment media. This survey and farebox data was evaluated along with demographic data and the proposed fare adjustments to determine whether the proposal will create a disparate impact or a disproportionate burden on TVI populations. The Title VI guidelines identify disparate impacts as impacts to the minority population, while disproportionate burdens refer to impacts on low-income populations. Threshold percentages are proposed for both disparate impact as it relates to minority populations and disproportionate burden as it relates to low-income populations. Alternatives available to offset impacts from the fare adjustments were reviewed. Potential mitigation measures are discussed to allow CDTA to further limit the disparate impact and disproportionate burden of the proposed fare adjustments on Title VI populations.
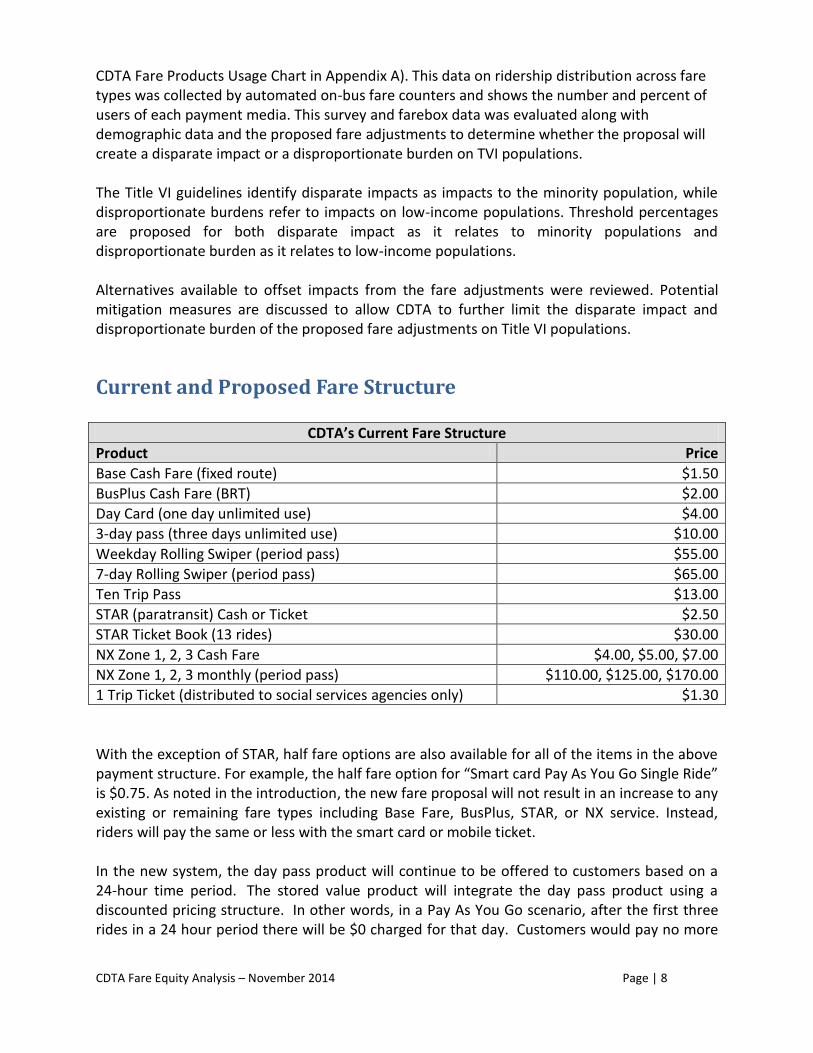
Current and Proposed Fare Structure
CDTA’s Current Fare Structure
Product Price
Base Cash Fare (fixed route) $1.50
BusPlus Cash Fare (BRT) $2.00
Day Card (one day unlimited use) $4.00
3-day pass (three days unlimited use) $10.00
Weekday Rolling Swiper (period pass) $55.00
7-day Rolling Swiper (period pass) $65.00
Ten Trip Pass $13.00
STAR (paratransit) Cash or Ticket $2.50
STAR Ticket Book (13 rides) $30.00
NX Zone 1, 2, 3 Cash Fare $4.00, $5.00, $7.00
NX Zone 1, 2, 3 monthly (period pass) $110.00, $125.00, $170.00
1 Trip Ticket (distributed to social services agencies only) $1.30
With the exception of STAR, half fare options are also available for all of the items in the above payment structure. For example, the half fare option for “Smart card Pay As You Go Single Ride” is $0.75. As noted in the introduction, the new fare proposal will not result in an increase to any existing or remaining fare types including Base Fare, BusPlus, STAR, or NX service. Instead, riders will pay the same or less with the smart card or mobile ticket. In the new system, the day pass product will continue to be offered to customers based on a 24-hour time period. The stored value product will integrate the day pass product using a discounted pricing structure. In other words, in a Pay As You Go scenario, after the first three rides in a 24 hour period there will be $0 charged for that day. Customers would pay no more
CDTA Fare Equity Analysis – November 2014 Page | 9
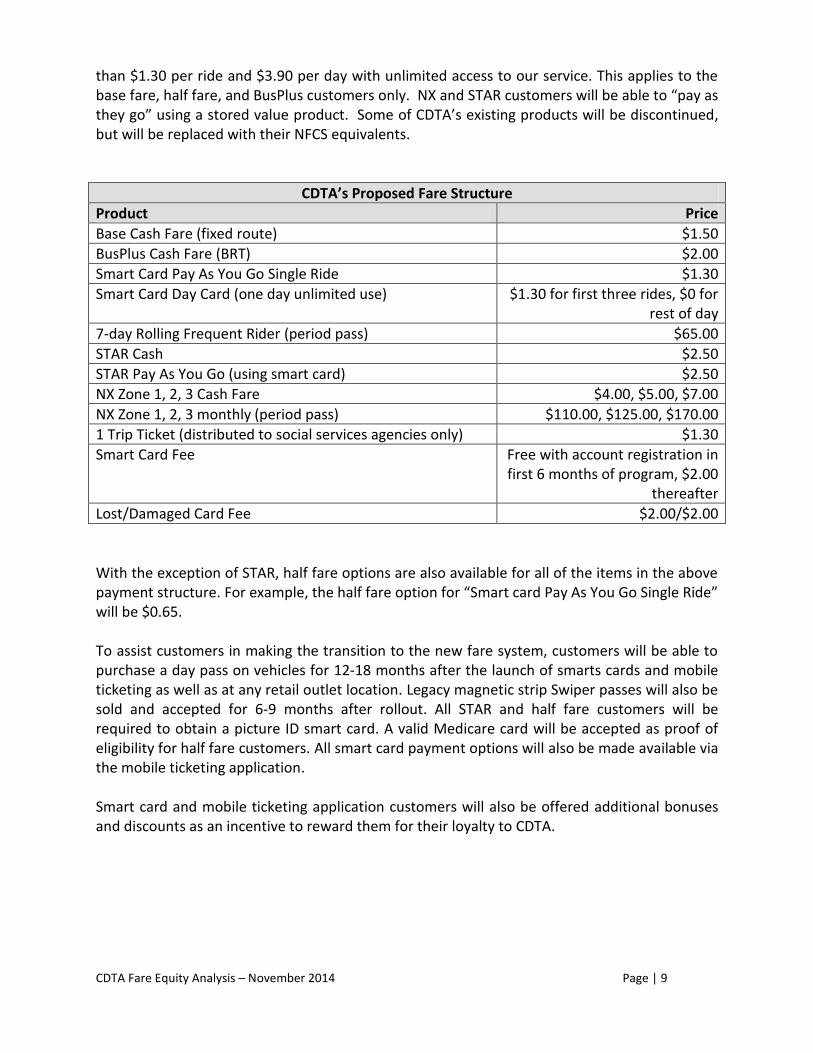
than $1.30 per ride and $3.90 per day with unlimited access to our service. This applies to the base fare, half fare, and BusPlus customers only. NX and STAR customers will be able to “pay as they go” using a stored value product. Some of CDTA’s existing products will be discontinued, but will be replaced with their NFCS equivalents.
CDTA’s Proposed Fare Structure
Product Price
Base Cash Fare (fixed route) $1.50
BusPlus Cash Fare (BRT) $2.00
Smart Card Pay As You Go Single Ride $1.30
Smart Card Day Card (one day unlimited use) $1.30 for first three rides, $0 for rest of day
7-day Rolling Frequent Rider (period pass) $65.00
STAR Cash $2.50
STAR Pay As You Go (using smart card) $2.50
NX Zone 1, 2, 3 Cash Fare $4.00, $5.00, $7.00
NX Zone 1, 2, 3 monthly (period pass) $110.00, $125.00, $170.00
1 Trip Ticket (distributed to social services agencies only) $1.30
Smart Card Fee Free with account registration in first 6 months of program, $2.00
thereafter
Lost/Damaged Card Fee $2.00/$2.00
With the exception of STAR, half fare options are also available for all of the items in the above payment structure. For example, the half fare option for “Smart card Pay As You Go Single Ride” will be $0.65. To assist customers in making the transition to the new fare system, customers will be able to purchase a day pass on vehicles for 12-18 months after the launch of smarts cards and mobile ticketing as well as at any retail outlet location. Legacy magnetic strip Swiper passes will also be sold and accepted for 6-9 months after rollout. All STAR and half fare customers will be required to obtain a picture ID smart card. A valid Medicare card will be accepted as proof of eligibility for half fare customers. All smart card payment options will also be made available via the mobile ticketing application. Smart card and mobile ticketing application customers will also be offered additional bonuses and discounts as an incentive to reward them for their loyalty to CDTA.
CDTA Fare Equity Analysis – November 2014 Page | 10
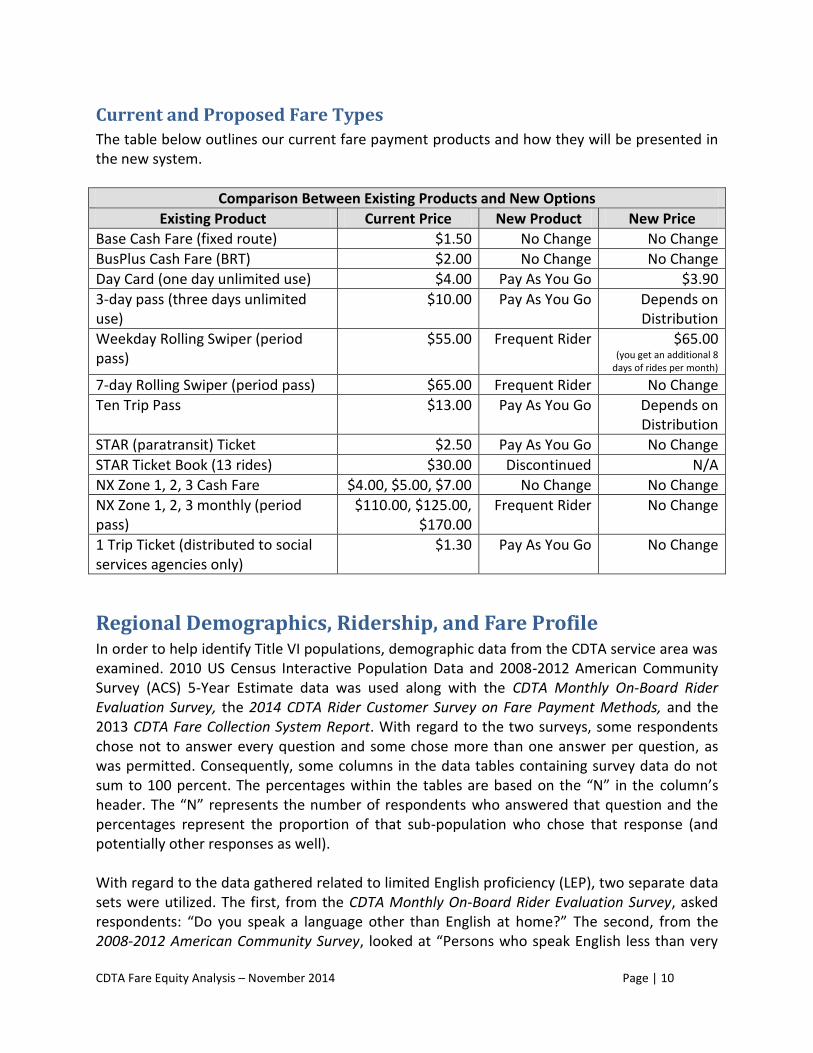
Current and Proposed Fare Types
The table below outlines our current fare payment products and how they will be presented in the new system.
Comparison Between Existing Products and New Options
Existing Product Current Price New Product New Price
Base Cash Fare (fixed route) $1.50 No Change No Change
BusPlus Cash Fare (BRT) $2.00 No Change No Change
Day Card (one day unlimited use) $4.00 Pay As You Go $3.90
3-day pass (three days unlimited use)
$10.00 Pay As You Go Depends on Distribution
Weekday Rolling Swiper (period pass)
$55.00 Frequent Rider $65.00 (you get an additional 8
days of rides per month)
7-day Rolling Swiper (period pass) $65.00 Frequent Rider No Change
Ten Trip Pass $13.00 Pay As You Go Depends on Distribution
STAR (paratransit) Ticket $2.50 Pay As You Go No Change
STAR Ticket Book (13 rides) $30.00 Discontinued N/A
NX Zone 1, 2, 3 Cash Fare $4.00, $5.00, $7.00 No Change No Change
NX Zone 1, 2, 3 monthly (period pass)
$110.00, $125.00, $170.00
Frequent Rider No Change
1 Trip Ticket (distributed to social services agencies only)
$1.30 Pay As You Go No Change
Regional Demographics, Ridership, and Fare Profile In order to help identify Title VI populations, demographic data from the CDTA service area was examined. 2010 US Census Interactive Population Data and 2008-2012 American Community Survey (ACS) 5-Year Estimate data was used along with the CDTA Monthly On-Board Rider Evaluation Survey, the 2014 CDTA Rider Customer Survey on Fare Payment Methods, and the 2013 CDTA Fare Collection System Report. With regard to the two surveys, some respondents chose not to answer every question and some chose more than one answer per question, as was permitted. Consequently, some columns in the data tables containing survey data do not sum to 100 percent. The percentages within the tables are based on the “N” in the column’s header. The “N” represents the number of respondents who answered that question and the percentages represent the proportion of that sub-population who chose that response (and potentially other responses as well). With regard to the data gathered related to limited English proficiency (LEP), two separate data sets were utilized. The first, from the CDTA Monthly On-Board Rider Evaluation Survey, asked respondents: “Do you speak a language other than English at home?” The second, from the 2008-2012 American Community Survey, looked at “Persons who speak English less than very
CDTA Fare Equity Analysis – November 2014 Page | 11
well (18 and over).” Both of these approaches are used by the American Community Survey to determine whether an individual would qualify as LEP, which is defined as a person who struggles to read, write, speak, or understand English. While both approaches are deemed valid in determining limited English proficiency, the question that assesses language use at home (used in the CDTA Monthly On-Board Rider Evaluation Survey) is likely a less exact determination of LEP than the question determining whether the respondent views themselves as speaking English less than very well because the former does not question English language proficiency as directly.
Regional Demographics and Ridership Data
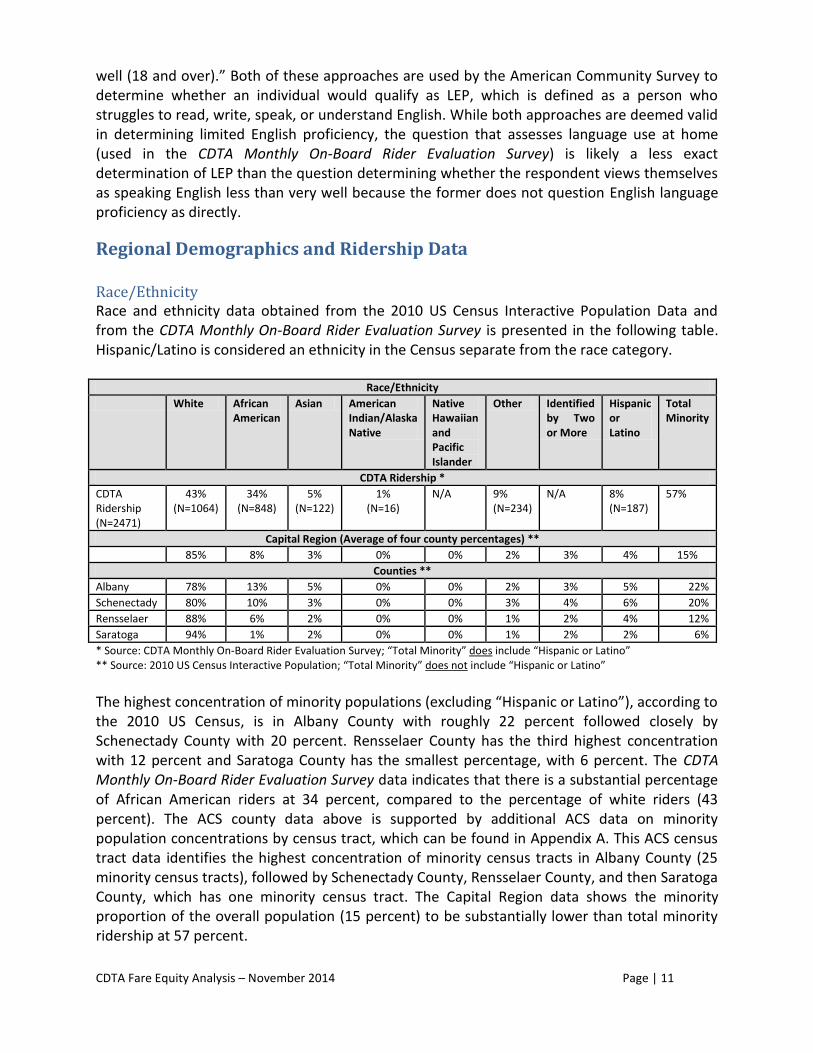
Race/Ethnicity Race and ethnicity data obtained from the 2010 US Census Interactive Population Data and from the CDTA Monthly On-Board Rider Evaluation Survey is presented in the following table. Hispanic/Latino is considered an ethnicity in the Census separate from the race category.
Race/Ethnicity
White African American
Asian American Indian/Alaska Native
Native Hawaiian and Pacific Islander
Other Identified by Two or More
Hispanic or Latino
Total Minority
CDTA Ridership *
CDTA Ridership (N=2471)
43% (N=1064)
34% (N=848)
5% (N=122)
1% (N=16)
N/A 9% (N=234)
N/A 8% (N=187)
57%
Capital Region (Average of four county percentages) **
85% 8% 3% 0% 0% 2% 3% 4% 15%
Counties **
Albany 78% 13% 5% 0% 0% 2% 3% 5% 22%
Schenectady 80% 10% 3% 0% 0% 3% 4% 6% 20%
Rensselaer 88% 6% 2% 0% 0% 1% 2% 4% 12%
Saratoga 94% 1% 2% 0% 0% 1% 2% 2% 6%
* Source: CDTA Monthly On-Board Rider Evaluation Survey; “Total Minority” does include “Hispanic or Latino” ** Source: 2010 US Census Interactive Population; “Total Minority” does not include “Hispanic or Latino”
The highest concentration of minority populations (excluding “Hispanic or Latino”), according to the 2010 US Census, is in Albany County with roughly 22 percent followed closely by Schenectady County with 20 percent. Rensselaer County has the third highest concentration with 12 percent and Saratoga County has the smallest percentage, with 6 percent. The CDTA Monthly On-Board Rider Evaluation Survey data indicates that there is a substantial percentage of African American riders at 34 percent, compared to the percentage of white riders (43 percent). The ACS county data above is supported by additional ACS data on minority population concentrations by census tract, which can be found in Appendix A. This ACS census tract data identifies the highest concentration of minority census tracts in Albany County (25 minority census tracts), followed by Schenectady County, Rensselaer County, and then Saratoga County, which has one minority census tract. The Capital Region data shows the minority proportion of the overall population (15 percent) to be substantially lower than total minority ridership at 57 percent.
CDTA Fare Equity Analysis – November 2014 Page | 12
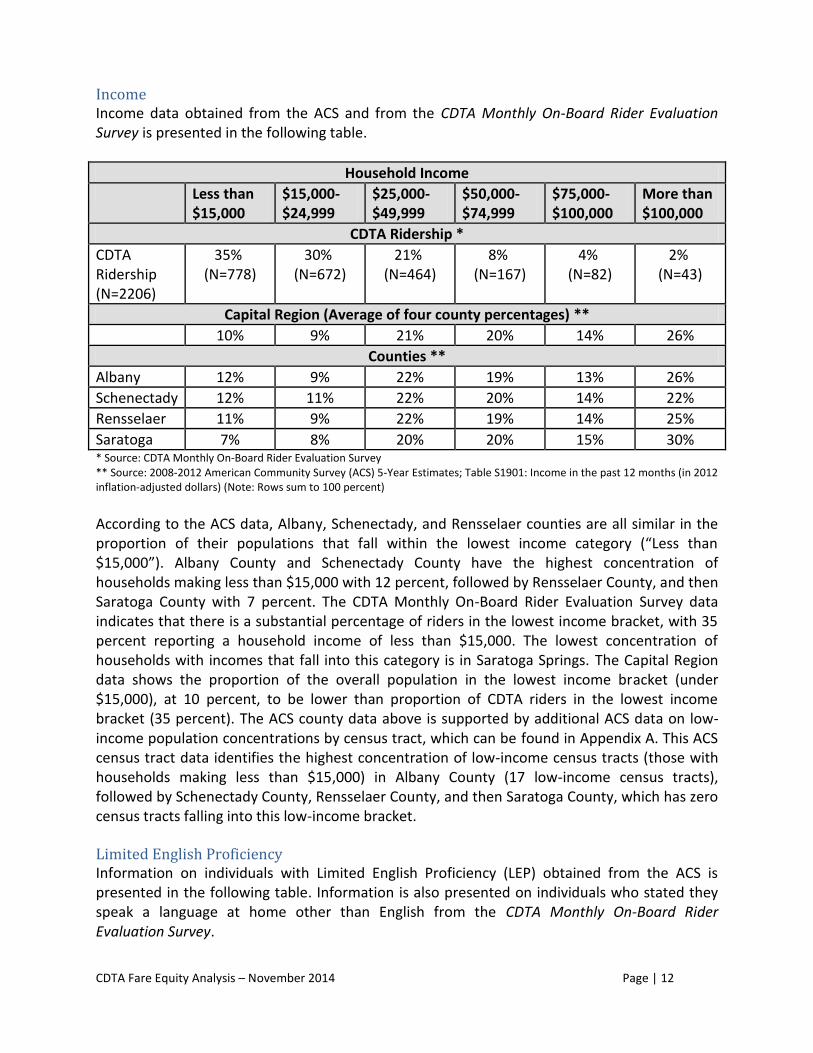
Income Income data obtained from the ACS and from the CDTA Monthly On-Board Rider Evaluation Survey is presented in the following table.
Household Income
Less than $15,000
$15,000-$24,999
$25,000-$49,999
$50,000-$74,999
$75,000-$100,000
More than $100,000
CDTA Ridership *
CDTA Ridership (N=2206)
35% (N=778)
30% (N=672)
21% (N=464)
8% (N=167)
4% (N=82)
2% (N=43)
Capital Region (Average of four county percentages) **
10% 9% 21% 20% 14% 26%
Counties **
Albany 12% 9% 22% 19% 13% 26%
Schenectady 12% 11% 22% 20% 14% 22%
Rensselaer 11% 9% 22% 19% 14% 25%
Saratoga 7% 8% 20% 20% 15% 30% * Source: CDTA Monthly On-Board Rider Evaluation Survey ** Source: 2008-2012 American Community Survey (ACS) 5-Year Estimates; Table S1901: Income in the past 12 months (in 2012 inflation-adjusted dollars) (Note: Rows sum to 100 percent)
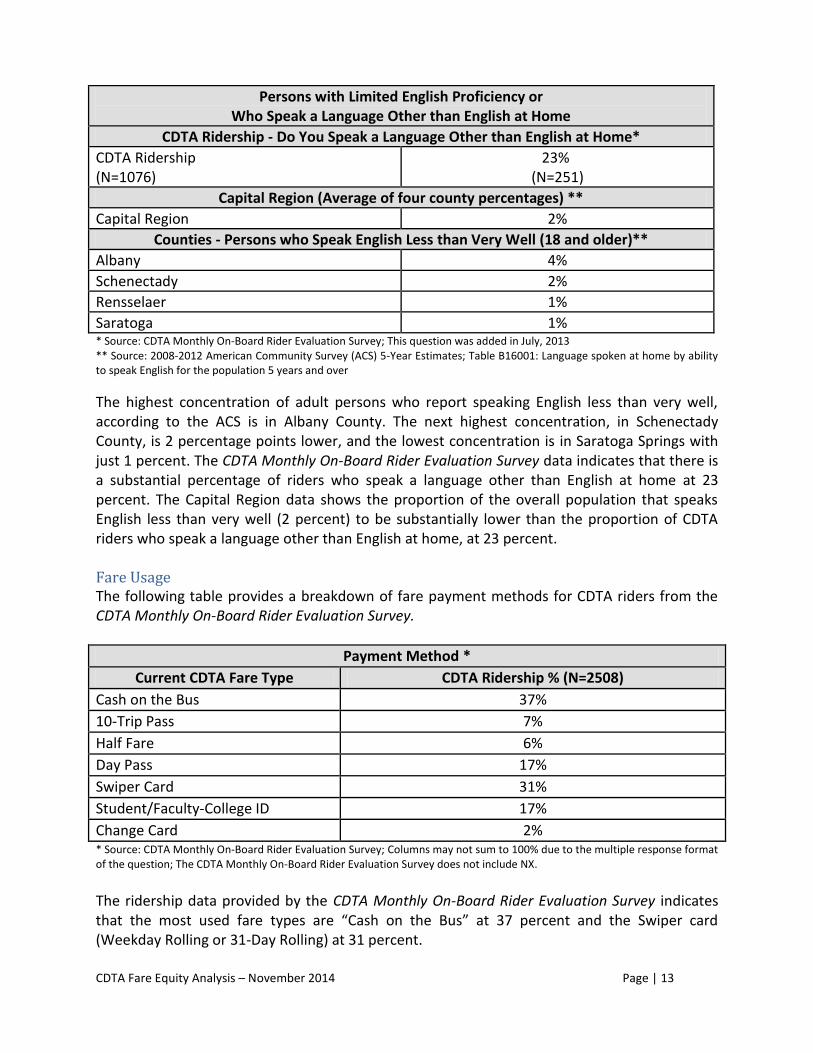
According to the ACS data, Albany, Schenectady, and Rensselaer counties are all similar in the proportion of their populations that fall within the lowest income category (“Less than $15,000”). Albany County and Schenectady County have the highest concentration of households making less than $15,000 with 12 percent, followed by Rensselaer County, and then Saratoga County with 7 percent. The CDTA Monthly On-Board Rider Evaluation Survey data indicates that there is a substantial percentage of riders in the lowest income bracket, with 35 percent reporting a household income of less than $15,000. The lowest concentration of households with incomes that fall into this category is in Saratoga Springs. The Capital Region data shows the proportion of the overall population in the lowest income bracket (under $15,000), at 10 percent, to be lower than proportion of CDTA riders in the lowest income bracket (35 percent). The ACS county data above is supported by additional ACS data on low-income population concentrations by census tract, which can be found in Appendix A. This ACS census tract data identifies the highest concentration of low-income census tracts (those with households making less than $15,000) in Albany County (17 low-income census tracts), followed by Schenectady County, Rensselaer County, and then Saratoga County, which has zero census tracts falling into this low-income bracket. Limited English Proficiency Information on individuals with Limited English Proficiency (LEP) obtained from the ACS is presented in the following table. Information is also presented on individuals who stated they speak a language at home other than English from the CDTA Monthly On-Board Rider Evaluation Survey.
CDTA Fare Equity Analysis – November 2014 Page | 13
Persons with Limited English Proficiency or Who Speak a Language Other than English at Home
CDTA Ridership - Do You Speak a Language Other than English at Home*
CDTA Ridership (N=1076)
23% (N=251)
Capital Region (Average of four county percentages) **
Capital Region 2%
Counties - Persons who Speak English Less than Very Well (18 and older)**
Albany 4%
Schenectady 2%
Rensselaer 1%
Saratoga 1% * Source: CDTA Monthly On-Board Rider Evaluation Survey; This question was added in July, 2013 ** Source: 2008-2012 American Community Survey (ACS) 5-Year Estimates; Table B16001: Language spoken at home by ability to speak English for the population 5 years and over
The highest concentration of adult persons who report speaking English less than very well, according to the ACS is in Albany County. The next highest concentration, in Schenectady County, is 2 percentage points lower, and the lowest concentration is in Saratoga Springs with just 1 percent. The CDTA Monthly On-Board Rider Evaluation Survey data indicates that there is a substantial percentage of riders who speak a language other than English at home at 23 percent. The Capital Region data shows the proportion of the overall population that speaks English less than very well (2 percent) to be substantially lower than the proportion of CDTA riders who speak a language other than English at home, at 23 percent. Fare Usage The following table provides a breakdown of fare payment methods for CDTA riders from the CDTA Monthly On-Board Rider Evaluation Survey.
Payment Method *
Current CDTA Fare Type CDTA Ridership % (N=2508)
Cash on the Bus 37%
10-Trip Pass 7%
Half Fare 6%
Day Pass 17%
Swiper Card 31%
Student/Faculty-College ID 17%
Change Card 2% * Source: CDTA Monthly On-Board Rider Evaluation Survey; Columns may not sum to 100% due to the multiple response format of the question; The CDTA Monthly On-Board Rider Evaluation Survey does not include NX.
The ridership data provided by the CDTA Monthly On-Board Rider Evaluation Survey indicates that the most used fare types are “Cash on the Bus” at 37 percent and the Swiper card (Weekday Rolling or 31-Day Rolling) at 31 percent.
CDTA Fare Equity Analysis – November 2014 Page | 14
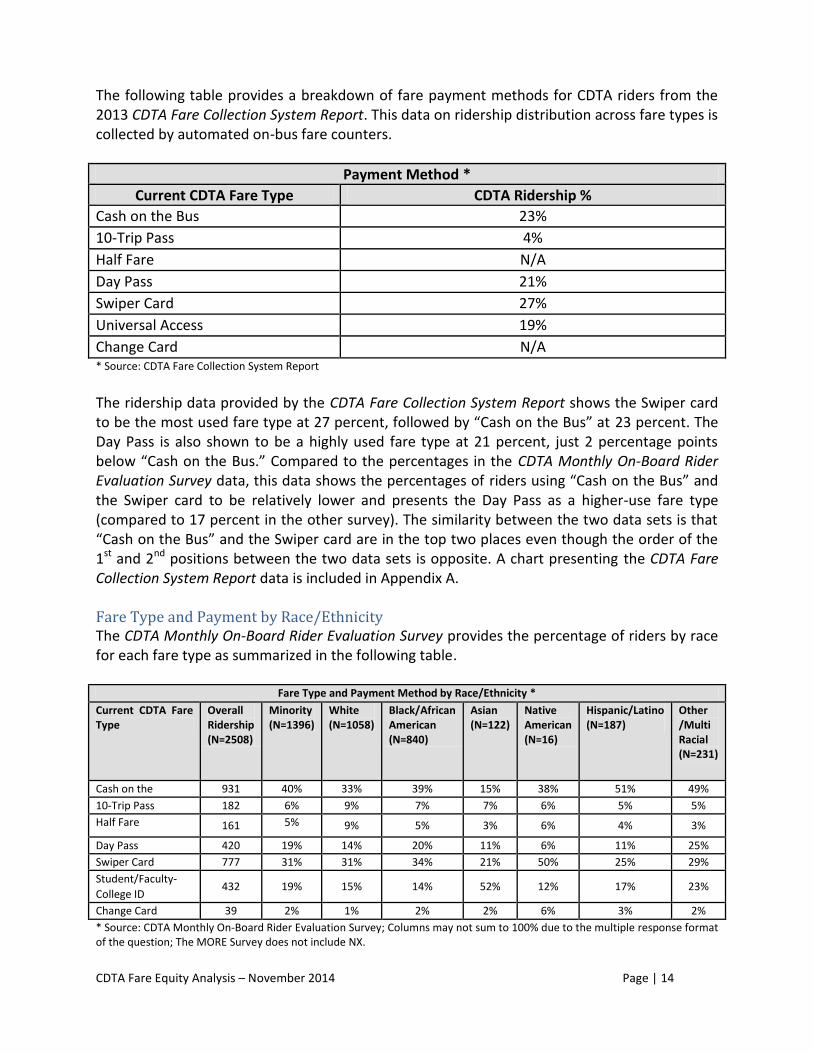
The following table provides a breakdown of fare payment methods for CDTA riders from the 2013 CDTA Fare Collection System Report. This data on ridership distribution across fare types is collected by automated on-bus fare counters.
Payment Method *
Current CDTA Fare Type CDTA Ridership %
Cash on the Bus 23%
10-Trip Pass 4%
Half Fare N/A
Day Pass 21%
Swiper Card 27%
Universal Access 19%
Change Card N/A * Source: CDTA Fare Collection System Report
The ridership data provided by the CDTA Fare Collection System Report shows the Swiper card to be the most used fare type at 27 percent, followed by “Cash on the Bus” at 23 percent. The Day Pass is also shown to be a highly used fare type at 21 percent, just 2 percentage points below “Cash on the Bus.” Compared to the percentages in the CDTA Monthly On-Board Rider Evaluation Survey data, this data shows the percentages of riders using “Cash on the Bus” and the Swiper card to be relatively lower and presents the Day Pass as a higher-use fare type (compared to 17 percent in the other survey). The similarity between the two data sets is that “Cash on the Bus” and the Swiper card are in the top two places even though the order of the 1st and 2nd positions between the two data sets is opposite. A chart presenting the CDTA Fare Collection System Report data is included in Appendix A. Fare Type and Payment by Race/Ethnicity The CDTA Monthly On-Board Rider Evaluation Survey provides the percentage of riders by race for each fare type as summarized in the following table.
Fare Type and Payment Method by Race/Ethnicity *
Current CDTA Fare Type
Overall Ridership (N=2508)
Minority (N=1396)
White (N=1058)
Black/African American (N=840)
Asian (N=122)
Native American (N=16)
Hispanic/Latino (N=187)
Other /Multi Racial (N=231)
Cash on the 931 40% 33% 39% 15% 38% 51% 49%
10-Trip Pass 182 6% 9% 7% 7% 6% 5% 5%
Half Fare 161 5% 9% 5% 3% 6% 4% 3%
Day Pass 420 19% 14% 20% 11% 6% 11% 25%
Swiper Card 777 31% 31% 34% 21% 50% 25% 29%
Student/Faculty-
College ID 432 19% 15% 14% 52% 12% 17% 23%
Change Card 39 2% 1% 2% 2% 6% 3% 2%
* Source: CDTA Monthly On-Board Rider Evaluation Survey; Columns may not sum to 100% due to the multiple response format of the question; The MORE Survey does not include NX.
CDTA Fare Equity Analysis – November 2014 Page | 15
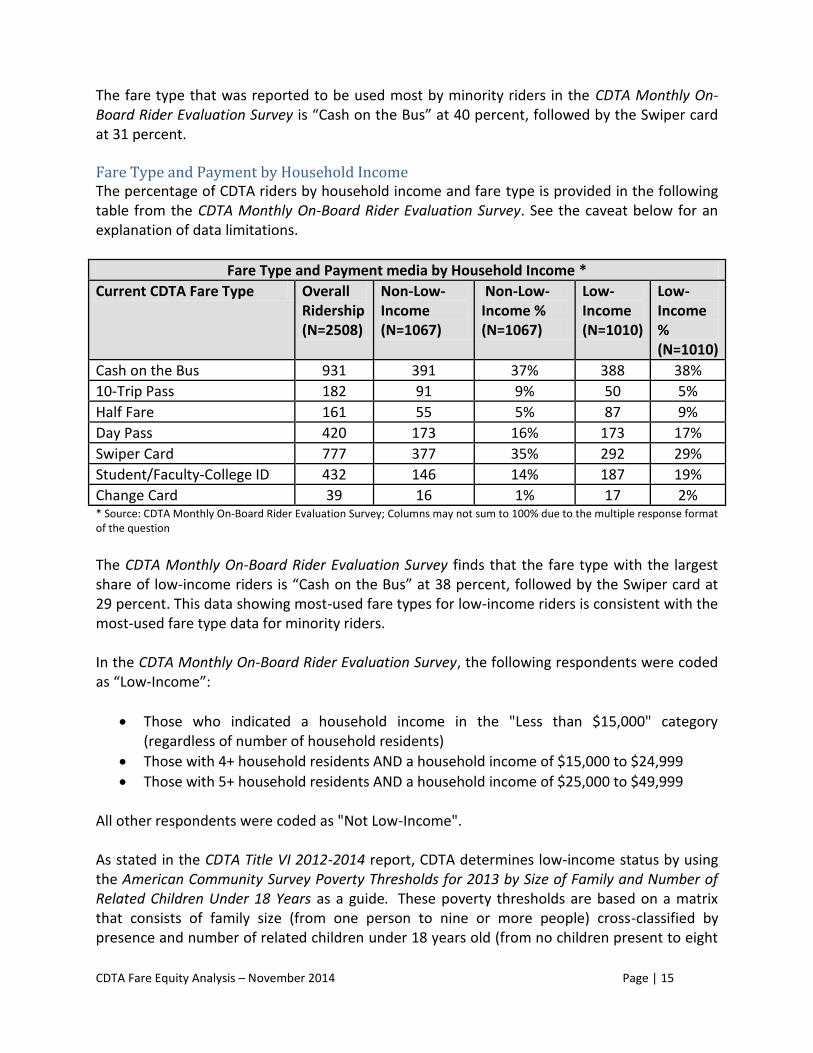
The fare type that was reported to be used most by minority riders in the CDTA Monthly On-Board Rider Evaluation Survey is “Cash on the Bus” at 40 percent, followed by the Swiper card at 31 percent. Fare Type and Payment by Household Income The percentage of CDTA riders by household income and fare type is provided in the following table from the CDTA Monthly On-Board Rider Evaluation Survey. See the caveat below for an explanation of data limitations.
Fare Type and Payment media by Household Income *
Current CDTA Fare Type Overall Ridership (N=2508)
Non-Low-Income (N=1067)
Non-Low-Income % (N=1067)
Low-Income (N=1010)
Low-Income % (N=1010)
Cash on the Bus 931 391 37% 388 38%
10-Trip Pass 182 91 9% 50 5%
Half Fare 161 55 5% 87 9%
Day Pass 420 173 16% 173 17%
Swiper Card 777 377 35% 292 29%
Student/Faculty-College ID 432 146 14% 187 19%
Change Card 39 16 1% 17 2% * Source: CDTA Monthly On-Board Rider Evaluation Survey; Columns may not sum to 100% due to the multiple response format of the question
The CDTA Monthly On-Board Rider Evaluation Survey finds that the fare type with the largest share of low-income riders is “Cash on the Bus” at 38 percent, followed by the Swiper card at 29 percent. This data showing most-used fare types for low-income riders is consistent with the most-used fare type data for minority riders. In the CDTA Monthly On-Board Rider Evaluation Survey, the following respondents were coded as “Low-Income”:
Those who indicated a household income in the "Less than $15,000" category (regardless of number of household residents)
Those with 4+ household residents AND a household income of $15,000 to $24,999
Those with 5+ household residents AND a household income of $25,000 to $49,999
All other respondents were coded as "Not Low-Income". As stated in the CDTA Title VI 2012-2014 report, CDTA determines low-income status by using the American Community Survey Poverty Thresholds for 2013 by Size of Family and Number of Related Children Under 18 Years as a guide. These poverty thresholds are based on a matrix that consists of family size (from one person to nine or more people) cross-classified by presence and number of related children under 18 years old (from no children present to eight
CDTA Fare Equity Analysis – November 2014 Page | 16
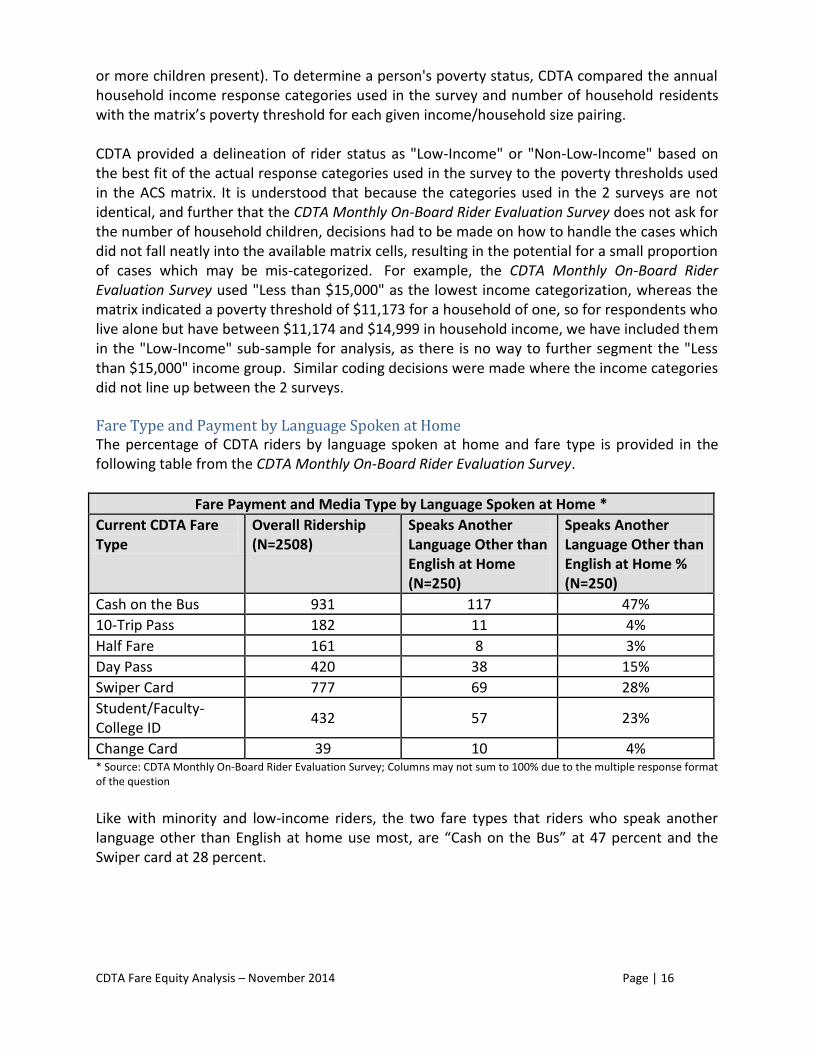
or more children present). To determine a person's poverty status, CDTA compared the annual household income response categories used in the survey and number of household residents with the matrix’s poverty threshold for each given income/household size pairing. CDTA provided a delineation of rider status as "Low-Income" or "Non-Low-Income" based on the best fit of the actual response categories used in the survey to the poverty thresholds used in the ACS matrix. It is understood that because the categories used in the 2 surveys are not identical, and further that the CDTA Monthly On-Board Rider Evaluation Survey does not ask for the number of household children, decisions had to be made on how to handle the cases which did not fall neatly into the available matrix cells, resulting in the potential for a small proportion of cases which may be mis-categorized. For example, the CDTA Monthly On-Board Rider Evaluation Survey used "Less than $15,000" as the lowest income categorization, whereas the matrix indicated a poverty threshold of $11,173 for a household of one, so for respondents who live alone but have between $11,174 and $14,999 in household income, we have included them in the "Low-Income" sub-sample for analysis, as there is no way to further segment the "Less than $15,000" income group. Similar coding decisions were made where the income categories did not line up between the 2 surveys. Fare Type and Payment by Language Spoken at Home The percentage of CDTA riders by language spoken at home and fare type is provided in the following table from the CDTA Monthly On-Board Rider Evaluation Survey.
Fare Payment and Media Type by Language Spoken at Home *
Current CDTA Fare Type
Overall Ridership (N=2508)
Speaks Another Language Other than English at Home (N=250)
Speaks Another Language Other than English at Home % (N=250)
Cash on the Bus 931 117 47%
10-Trip Pass 182 11 4%
Half Fare 161 8 3%
Day Pass 420 38 15%
Swiper Card 777 69 28%
Student/Faculty-College ID
432 57 23%
Change Card 39 10 4% * Source: CDTA Monthly On-Board Rider Evaluation Survey; Columns may not sum to 100% due to the multiple response format of the question
Like with minority and low-income riders, the two fare types that riders who speak another language other than English at home use most, are “Cash on the Bus” at 47 percent and the Swiper card at 28 percent.
CDTA Fare Equity Analysis – November 2014 Page | 17
Proposed Title VI Fare Equity Policies In accordance with guidance from the FTA Circular 4702.1B, CDTA developed policies with respect to evaluating impacts of fare changes. The following sections provide definitions and proposed policy thresholds for CDTA fare changes.
Population Definitions
Minority Persons and Populations According to FTA Circular 4702.1B, a minority person is defined as an individual identifying as: American Indian and Alaska Native, Asian, Black or African American, Hispanic or Latino, and Native Hawaiian or Other Pacific Islander. Minority populations are defined by FTA as any readily identifiable group of minority persons who live in geographic proximity, or who may be geographically dispersed, but who may be similarly affected by a proposed action. Ridership data on minority populations is to be obtained from the transit agency ridership surveys. Low-Income Persons and Populations The FTA circular on Title VI compliance states that while low-income populations are not a protected class under Title VI there is an "…inherent overlap of environmental justice principles in this area, and because it is important to evaluate the impacts of service and fare changes on passengers who are transit-dependent, FTA requires transit providers to evaluate proposed service and fare changes to determine whether low-income populations will bear a disproportionate burden of the changes." According to the FTA circular, “Low-income” means a person whose median household income is at or below the U.S. Department of Health and Human Services poverty guidelines or within a locally developed income threshold that is at least as inclusive as these guidelines. Low-income population is defined by FTA as any readily identifiable group of low-income persons who live in geographic proximity or who may be geographically dispersed, but who may be similarly affected by a proposed action. As stated above, determination of low-income was arrived at based on the guidelines provided by the American Community Survey Poverty Thresholds for 2013 by Size of Family and Number of Related Children Under 18 Years, which was derived from the U.S. Census Bureau, Current Population Survey, 2013 Annual Social and Economic Supplement. This matrix provides weighted average poverty thresholds based on household income, number of persons in household, and number of related children under 18 (see matrix in Appendix A).
Proposed Fare Change Policies FTA guidelines require that impacts to Title VI and low-income populations be evaluated for all fare changes regardless of the amount of increase or decrease.
CDTA Fare Equity Analysis – November 2014 Page | 18
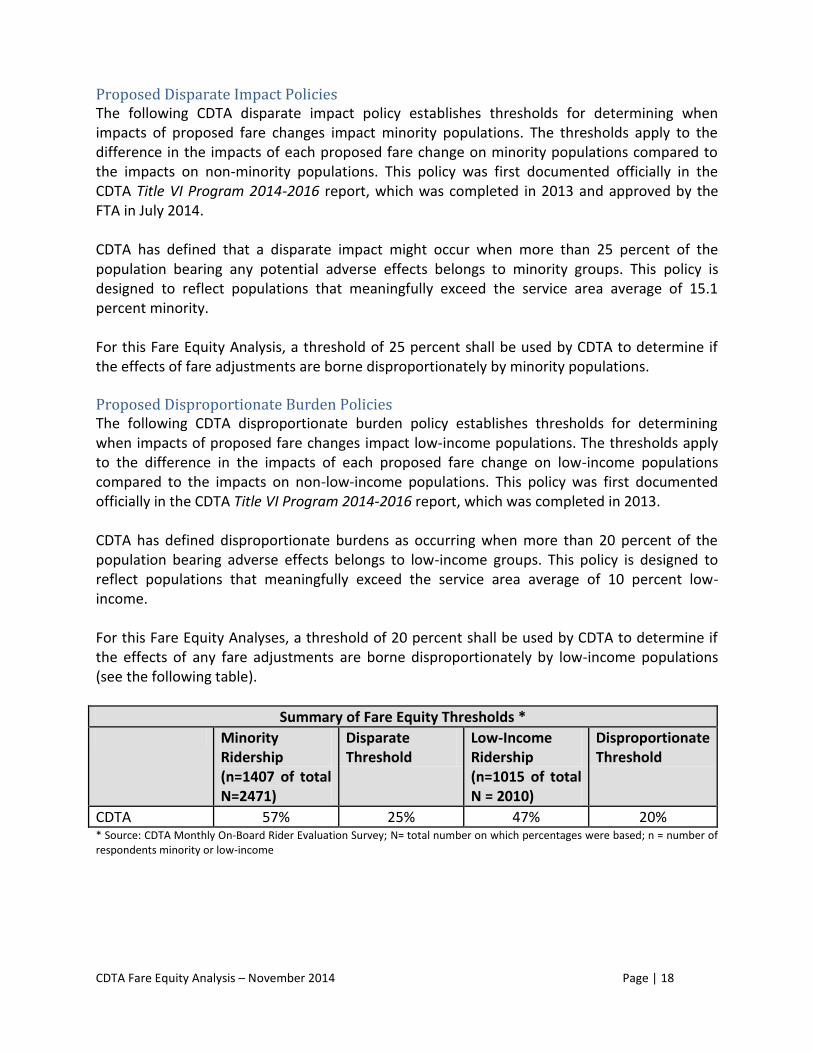
Proposed Disparate Impact Policies The following CDTA disparate impact policy establishes thresholds for determining when impacts of proposed fare changes impact minority populations. The thresholds apply to the difference in the impacts of each proposed fare change on minority populations compared to the impacts on non-minority populations. This policy was first documented officially in the CDTA Title VI Program 2014-2016 report, which was completed in 2013 and approved by the FTA in July 2014. CDTA has defined that a disparate impact might occur when more than 25 percent of the population bearing any potential adverse effects belongs to minority groups. This policy is designed to reflect populations that meaningfully exceed the service area average of 15.1 percent minority. For this Fare Equity Analysis, a threshold of 25 percent shall be used by CDTA to determine if the effects of fare adjustments are borne disproportionately by minority populations. Proposed Disproportionate Burden Policies The following CDTA disproportionate burden policy establishes thresholds for determining when impacts of proposed fare changes impact low-income populations. The thresholds apply to the difference in the impacts of each proposed fare change on low-income populations compared to the impacts on non-low-income populations. This policy was first documented officially in the CDTA Title VI Program 2014-2016 report, which was completed in 2013. CDTA has defined disproportionate burdens as occurring when more than 20 percent of the population bearing adverse effects belongs to low-income groups. This policy is designed to reflect populations that meaningfully exceed the service area average of 10 percent low-income. For this Fare Equity Analyses, a threshold of 20 percent shall be used by CDTA to determine if the effects of any fare adjustments are borne disproportionately by low-income populations (see the following table).
Summary of Fare Equity Thresholds *
Minority Ridership (n=1407 of total N=2471)
Disparate Threshold
Low-Income Ridership (n=1015 of total N = 2010)
Disproportionate Threshold
CDTA 57% 25% 47% 20% * Source: CDTA Monthly On-Board Rider Evaluation Survey; N= total number on which percentages were based; n = number of respondents minority or low-income
CDTA Fare Equity Analysis – November 2014 Page | 19
Fare Equity Analysis
To determine disparate impacts and disproportionate burdens, the following percentages were identified:
Percentage of minority and low-income riders overall
Percentage of minority and low-income riders by fare type Both of these sets of percentages were obtained from the CDTA Monthly On-Board Rider Evaluation Survey. If the percentages exceed CDTA’s established thresholds for disparate impact or disproportionate burden, the proposed fare adjustments would need to be re-evaluated to determine what alternatives and mitigation measures should be considered to reduce the impacts to these protected populations. To determine impacts on minority and low-income populations unrelated to disparate impact and disproportionate burden, data was reviewed from the 2014 CDTA Rider Customer Survey on Fare Payment Methods that addressed the following topic areas:
Interest in New CDTA Bus Fare Payment Options
Ways Likely to Pre-load CDTA’s New Smart Card
CDTA Riders Online Behaviors
CDTA Rider Behavior and Anticipated Change in Ridership if New Payment Options Offered
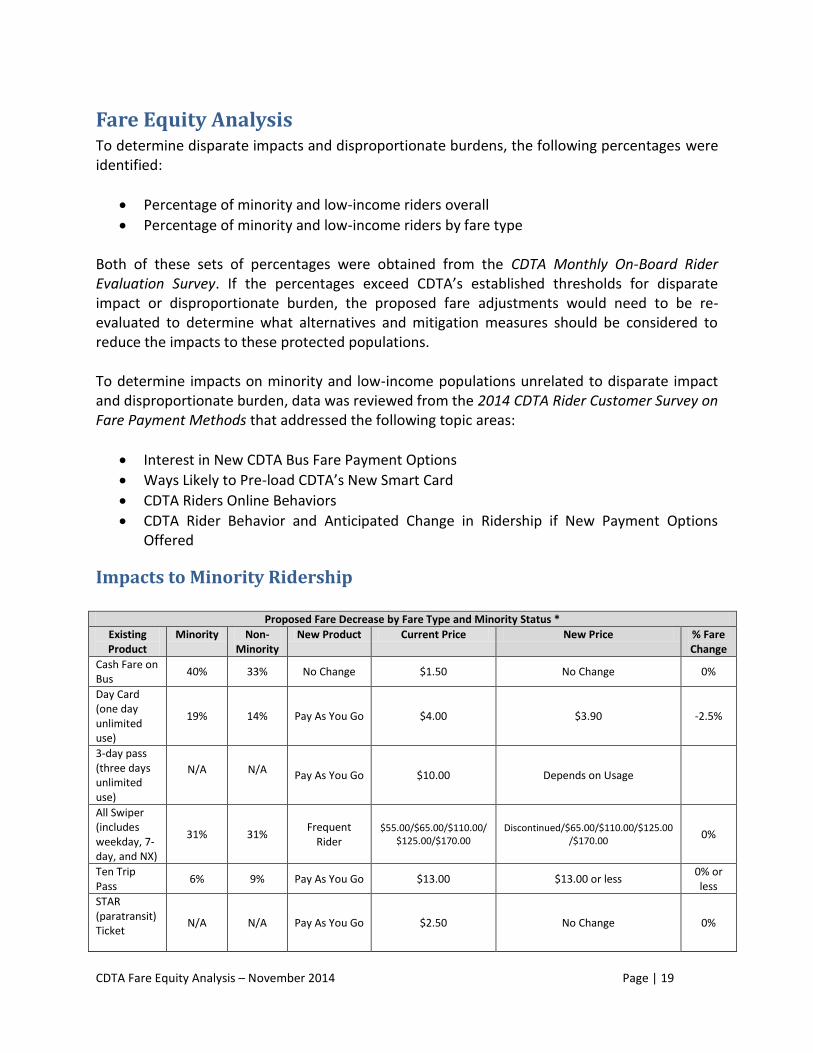
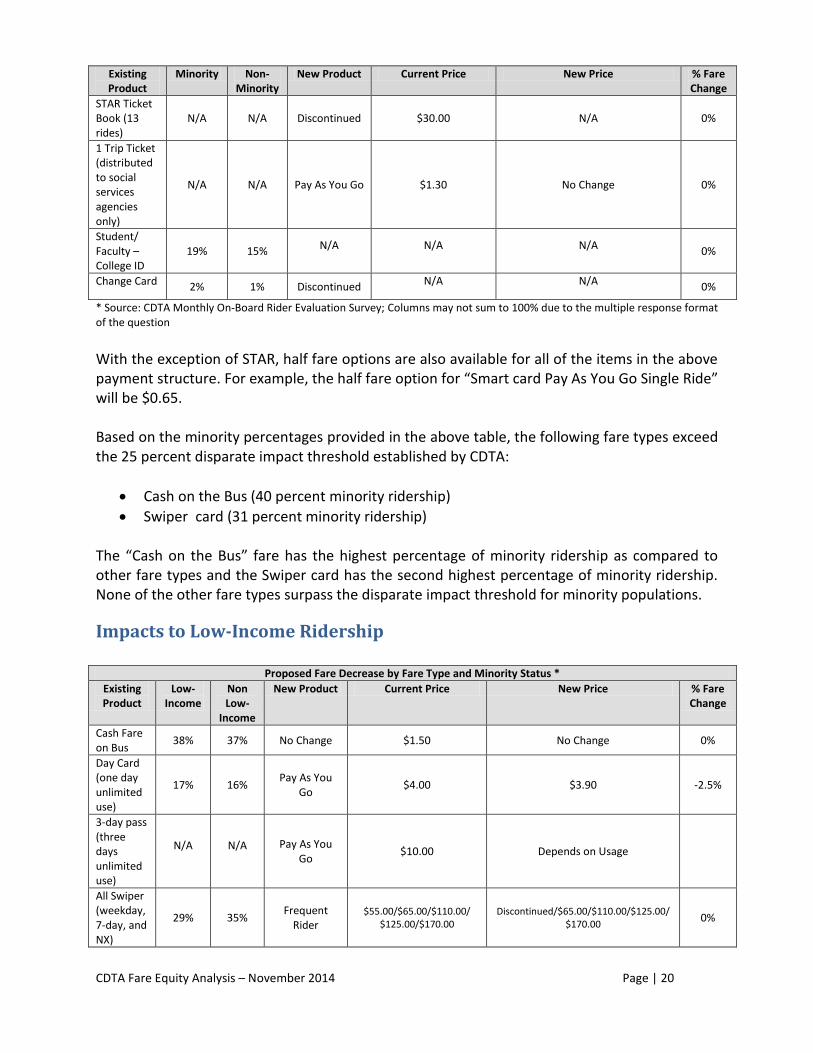
Impacts to Minority Ridership
Proposed Fare Decrease by Fare Type and Minority Status *
Existing Product
Minority Non-Minority
New Product Current Price New Price % Fare Change
Cash Fare on Bus
40% 33% No Change $1.50 No Change 0%
Day Card (one day unlimited use)
19% 14% Pay As You Go $4.00 $3.90 -2.5%
3-day pass (three days unlimited use)
N/A N/A Pay As You Go $10.00 Depends on Usage
All Swiper (includes weekday, 7-day, and NX)
31% 31% Frequent
Rider $55.00/$65.00/$110.00/
$125.00/$170.00 Discontinued/$65.00/$110.00/$125.00
/$170.00 0%
Ten Trip Pass
6% 9% Pay As You Go $13.00 $13.00 or less 0% or less
STAR (paratransit) Ticket
N/A N/A Pay As You Go $2.50 No Change 0%
CDTA Fare Equity Analysis – November 2014 Page | 20
Existing Product
Minority Non-Minority
New Product Current Price New Price % Fare Change
STAR Ticket Book (13 rides)
N/A N/A Discontinued $30.00 N/A 0%
1 Trip Ticket (distributed to social services agencies only)
N/A N/A Pay As You Go $1.30 No Change 0%
Student/ Faculty – College ID
19% 15% N/A N/A N/A 0%
Change Card 2% 1% Discontinued N/A N/A 0%
* Source: CDTA Monthly On-Board Rider Evaluation Survey; Columns may not sum to 100% due to the multiple response format of the question
With the exception of STAR, half fare options are also available for all of the items in the above payment structure. For example, the half fare option for “Smart card Pay As You Go Single Ride” will be $0.65. Based on the minority percentages provided in the above table, the following fare types exceed the 25 percent disparate impact threshold established by CDTA:
Cash on the Bus (40 percent minority ridership)
Swiper card (31 percent minority ridership) The “Cash on the Bus” fare has the highest percentage of minority ridership as compared to other fare types and the Swiper card has the second highest percentage of minority ridership. None of the other fare types surpass the disparate impact threshold for minority populations.
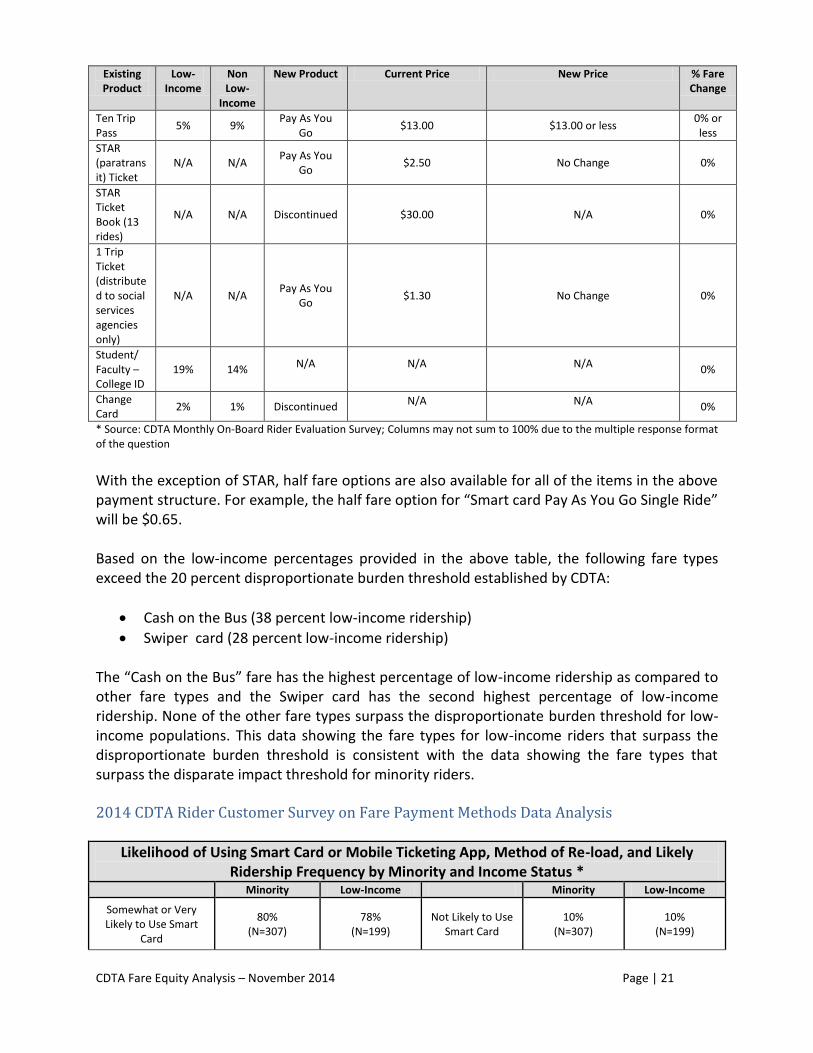
Impacts to Low-Income Ridership
Proposed Fare Decrease by Fare Type and Minority Status *
Existing Product
Low-Income
Non Low-
Income
New Product Current Price New Price % Fare Change
Cash Fare on Bus
38% 37% No Change $1.50 No Change 0%
Day Card (one day unlimited use)
17% 16% Pay As You
Go $4.00 $3.90 -2.5%
3-day pass (three days unlimited use)
N/A N/A Pay As You Go
$10.00 Depends on Usage
All Swiper (weekday, 7-day, and NX)
29% 35% Frequent
Rider $55.00/$65.00/$110.00/
$125.00/$170.00 Discontinued/$65.00/$110.00/$125.00/
$170.00 0%
CDTA Fare Equity Analysis – November 2014 Page | 21
Existing Product
Low-Income
Non Low-
Income
New Product Current Price New Price % Fare Change
Ten Trip Pass
5% 9% Pay As You
Go $13.00 $13.00 or less
0% or less
STAR (paratransit) Ticket
N/A N/A Pay As You
Go $2.50 No Change 0%
STAR Ticket Book (13 rides)
N/A N/A Discontinued $30.00 N/A 0%
1 Trip Ticket (distributed to social services agencies only)
N/A N/A Pay As You
Go $1.30 No Change 0%
Student/ Faculty – College ID
19% 14% N/A N/A N/A 0%
Change Card
2% 1% Discontinued N/A N/A 0%
* Source: CDTA Monthly On-Board Rider Evaluation Survey; Columns may not sum to 100% due to the multiple response format of the question
With the exception of STAR, half fare options are also available for all of the items in the above payment structure. For example, the half fare option for “Smart card Pay As You Go Single Ride” will be $0.65. Based on the low-income percentages provided in the above table, the following fare types exceed the 20 percent disproportionate burden threshold established by CDTA:
Cash on the Bus (38 percent low-income ridership)
Swiper card (28 percent low-income ridership) The “Cash on the Bus” fare has the highest percentage of low-income ridership as compared to other fare types and the Swiper card has the second highest percentage of low-income ridership. None of the other fare types surpass the disproportionate burden threshold for low-income populations. This data showing the fare types for low-income riders that surpass the disproportionate burden threshold is consistent with the data showing the fare types that surpass the disparate impact threshold for minority riders. 2014 CDTA Rider Customer Survey on Fare Payment Methods Data Analysis
Likelihood of Using Smart Card or Mobile Ticketing App, Method of Re-load, and Likely Ridership Frequency by Minority and Income Status *
Minority Low-Income Minority Low-Income
Somewhat or Very Likely to Use Smart
Card
80% (N=307)
78% (N=199)
Not Likely to Use Smart Card
10% (N=307)
10% (N=199)
CDTA Fare Equity Analysis – November 2014 Page | 22
Minority Low-Income
Minority Low-Income
Somewhat or Very Likely to Use Mobile
Ticketing App
68% (N=307)
63% (N=199)
Not Likely to Use Mobile Ticketing
App
15% (N=307)
16% (N=199)
Would re-load Smart Card with credit/debit
card
56% (N=285)
58% (N=189)
Would re-load Smart Card with
Cash at POS
28% (N=285)
31% (N=189)
Would ride the same or more with Smart
Card
88% (N=301)
87% (N=194)
Would ride less often with Smart
Card
2% (N=301)
1% (N=194)
Would ride the same or more with Mobile
Ticket
87% (N=296)
84% (N=193)
Would ride less often with
Mobile Ticket
2% (N=296)
2% (N=193)
* Source: 2014 CDTA Rider Customer Survey on Fare Payment Methods
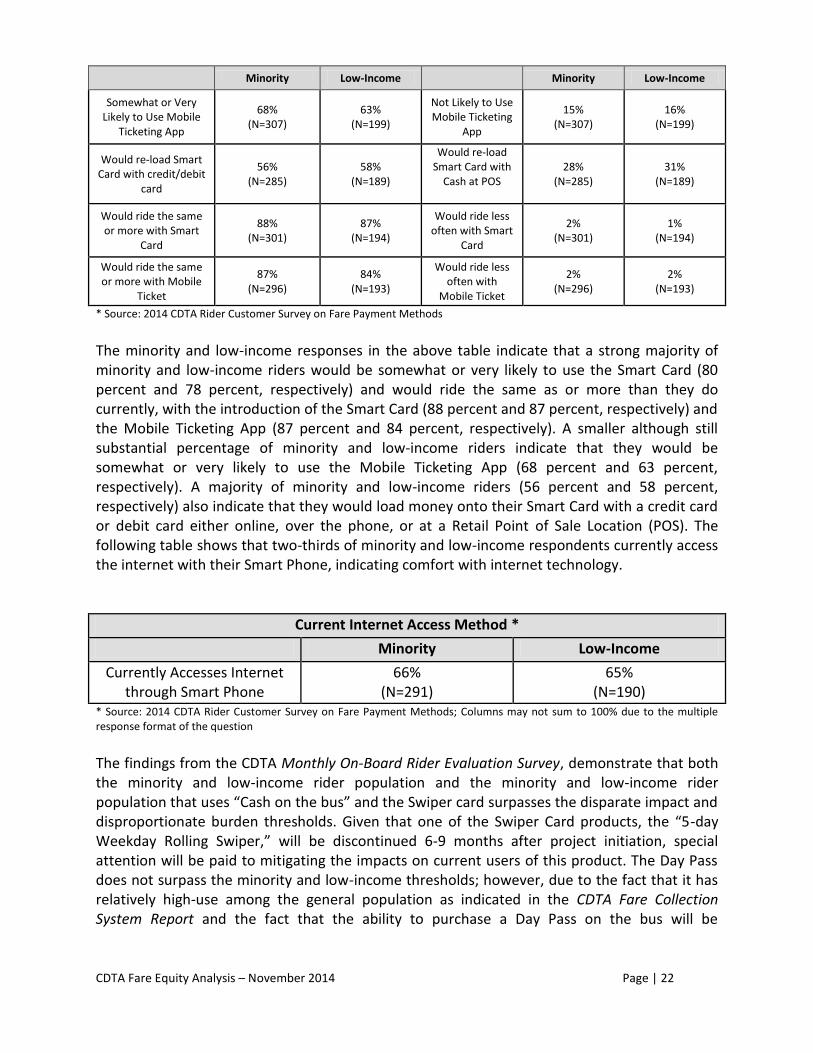
The minority and low-income responses in the above table indicate that a strong majority of minority and low-income riders would be somewhat or very likely to use the Smart Card (80 percent and 78 percent, respectively) and would ride the same as or more than they do currently, with the introduction of the Smart Card (88 percent and 87 percent, respectively) and the Mobile Ticketing App (87 percent and 84 percent, respectively). A smaller although still substantial percentage of minority and low-income riders indicate that they would be somewhat or very likely to use the Mobile Ticketing App (68 percent and 63 percent, respectively). A majority of minority and low-income riders (56 percent and 58 percent, respectively) also indicate that they would load money onto their Smart Card with a credit card or debit card either online, over the phone, or at a Retail Point of Sale Location (POS). The following table shows that two-thirds of minority and low-income respondents currently access the internet with their Smart Phone, indicating comfort with internet technology.
Current Internet Access Method *
Minority Low-Income
Currently Accesses Internet through Smart Phone
66% (N=291)
65% (N=190)
* Source: 2014 CDTA Rider Customer Survey on Fare Payment Methods; Columns may not sum to 100% due to the multiple response format of the question
The findings from the CDTA Monthly On-Board Rider Evaluation Survey, demonstrate that both the minority and low-income rider population and the minority and low-income rider population that uses “Cash on the bus” and the Swiper card surpasses the disparate impact and disproportionate burden thresholds. Given that one of the Swiper Card products, the “5-day Weekday Rolling Swiper,” will be discontinued 6-9 months after project initiation, special attention will be paid to mitigating the impacts on current users of this product. The Day Pass does not surpass the minority and low-income thresholds; however, due to the fact that it has relatively high-use among the general population as indicated in the CDTA Fare Collection System Report and the fact that the ability to purchase a Day Pass on the bus will be
CDTA Fare Equity Analysis – November 2014 Page | 23
discontinued 12-18 months after project initiation, CDTA will mitigate impacts to current Day Pass users who purchase on the bus. Further, the 2014 CDTA Rider Customer Survey on Fare Payment Methods demonstrates likely rider receptivity to using the Smart Card or Mobile Ticketing App, loading money with a credit or debit card, and using Smart Phone technology in general. These findings and their implications will be reflected below in the Impacts section as well as the Alternatives and Mitigation Measures section.
Public Outreach The Title VI guidelines recommend the public be included in the decision-making process for determining the disparate impact thresholds for fare equity review. The guidelines for general Title VI program public involvement are broad and allow transit providers to choose specific strategies that will meet the needs of their riders. The guidelines also require a public participation plan to outline strategies for engaging minority, low-income, and LEP populations. A detailed plan was drafted for the proposed fare structure and included below is a summary of the strategies. The CDTA Planning Board-approved Public Participation Plan is found in Appendix B.
Goals and Measures
The overall goal of this process was to disseminate information and to solicit and respond to public comment on the development of a fare structure that will result in the ability to pay with smart cards and mobile devices. The plan provides proactive and continuing public participation for projects, programs, and decision-making to ensure programs reflect community values and benefit all segments of the community equally.
Communication Methods
A variety of public participation methods were used to facilitate public involvement throughout the TVI Fare Equity Analysis. Public outreach included: CDTA internal coordination meetings, a project-specific rider survey, public meetings, public hearings, informational handouts in English and in Spanish available at the meetings and hearings, project and meeting/hearing notifications sent via email and the website, news releases, and general website coverage, and social media outreach. The notifications were sent out via email to low-income, minority, and LEP organizations. The following section describes these methods for engaging the target audiences. The purpose of these efforts was to include CDTA staff and Planning Committee and Board of Directors as well as the public, especially minority, low-income, and LEP populations, in project planning.
CDTA Internal Communication Methods Coordinating with the CDTA Planning and Stakeholders Relations Committee and the CDTA Board of Directors provided CDTA staff the opportunity to obtain input and review of project information at key milestones. Project staff presented details of the project at the following meetings:
CDTA Fare Equity Analysis – November 2014 Page | 24
CDTA Planning and Stakeholders Relations Committee Meetings o Thursday, October 24, 2013 o Thursday, January 23, 2104 o Thursday, February 20, 2104 o Thursday, March 20, 2104 o Thursday, April 24, 2104 o Thursday, May 22, 2014 o Thursday, June 19, 2014 o Thursday, October 23, 2014
CDTA Performance Oversight Committee Meetings o Friday, July 26, 2013 o Friday, October 25, 2013
CDTA Board of Directors Meetings o Wednesday, July 31, 2013 o Wednesday, October 30, 2013 o Wednesday, January 29, 2014 o Wednesday, February 26, 2014 o Wednesday, March 26, 2014 o Wednesday, April 30, 2014 o Wednesday, May 28, 2014 o Wednesday, June 25, 2014 o Wednesday, October 29, 2014
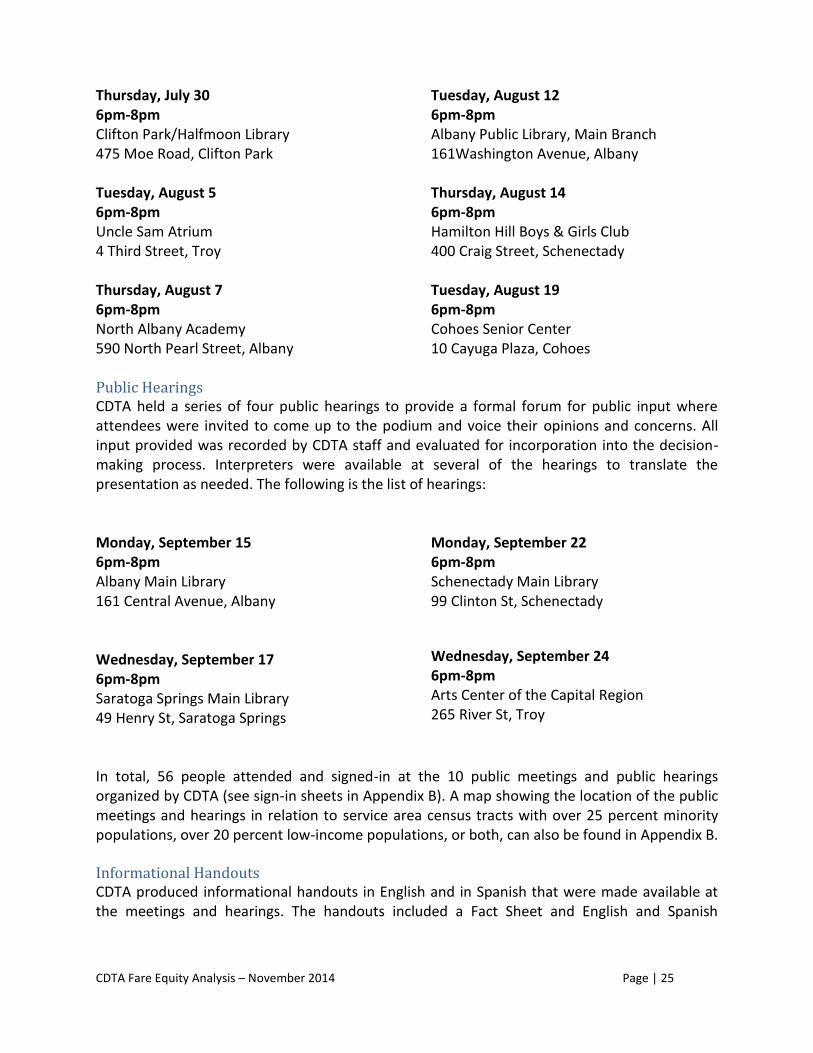
Fare Structure Rider Survey CDTA contracted Albany, NY-based market research firm, Fact Finders, Inc., to administer the 2014 CDTA Fare Change TVI Survey Questionnaire in July and August of 2014. CDTA worked closely with Fact Finders to develop the content for the survey. The primary research objective was to understand rider receptivity and perceived barriers to the new fare collection system. Measurements included selected rider behavior assessment (days per week and fare payment method), demographic measurements (including age, gender, ethnicity, and income status), likelihood to use each of the proposed payment methods, and reasons behind stated likelihood (using an open ended question to assess perceived motivators / barriers to each). The results of this research were used to inform planning and decision making. CDTA employed this quantitative assessment of rider attitudes across a range of routes, stratified as a "Target" sample and a "Control" group. A summary of rider comments provided by FactFinders is included in Appendix B. Public Meetings CDTA held a series of six public meetings to gather feedback on proposed fare products as part of its New Fare Collection System that will feature smart card and mobile ticket technology. Interpreters were available at several of the meetings to translate the presentation as needed. The following is the list of meetings:
CDTA Fare Equity Analysis – November 2014 Page | 25
Thursday, July 30 6pm-8pm Clifton Park/Halfmoon Library 475 Moe Road, Clifton Park Tuesday, August 5 6pm-8pm Uncle Sam Atrium 4 Third Street, Troy Thursday, August 7 6pm-8pm North Albany Academy 590 North Pearl Street, Albany
Tuesday, August 12 6pm-8pm Albany Public Library, Main Branch 161Washington Avenue, Albany Thursday, August 14
6pm-8pm Hamilton Hill Boys & Girls Club 400 Craig Street, Schenectady Tuesday, August 19
6pm-8pm Cohoes Senior Center 10 Cayuga Plaza, Cohoes
Public Hearings CDTA held a series of four public hearings to provide a formal forum for public input where attendees were invited to come up to the podium and voice their opinions and concerns. All input provided was recorded by CDTA staff and evaluated for incorporation into the decision-making process. Interpreters were available at several of the hearings to translate the presentation as needed. The following is the list of hearings: Monday, September 15 6pm-8pm Albany Main Library 161 Central Avenue, Albany Wednesday, September 17 6pm-8pm Saratoga Springs Main Library 49 Henry St, Saratoga Springs
Monday, September 22 6pm-8pm Schenectady Main Library 99 Clinton St, Schenectady
Wednesday, September 24 6pm-8pm Arts Center of the Capital Region 265 River St, Troy
In total, 56 people attended and signed-in at the 10 public meetings and public hearings organized by CDTA (see sign-in sheets in Appendix B). A map showing the location of the public meetings and hearings in relation to service area census tracts with over 25 percent minority populations, over 20 percent low-income populations, or both, can also be found in Appendix B. Informational Handouts CDTA produced informational handouts in English and in Spanish that were made available at the meetings and hearings. The handouts included a Fact Sheet and English and Spanish
CDTA Fare Equity Analysis – November 2014 Page | 26
versions of the PowerPoint presentation and the comment forms. Copies of this Fact Sheet and presentations can be found in Appendix B. Notifications Several notification strategies were implemented to ensure public awareness of upcoming opportunities to engage in the study. Public notices, written in English and in Spanish, were distributed via email including to low-income, minority, and LEP organizations. Notification materials were translated in Spanish to reach LEP populations. Copies of these notifications can be found in Appendix B. Website Coverage Web-based communications and social media outreach was another portion of the public outreach strategies that was a highly effective tool in providing information to target audiences. Project updates, announcements and links to project information were included on the CDTA web page. News Releases News releases were sent out to provide information about public meetings and public hearings. News releases were provided to the following media outlets:
Times Union
The Daily Gazette
The Record
The Saratogian
Minority, Low-Income, and Limited English Proficiency Populations
The CDTA Monthly On-Board Rider Evaluation Survey identified a high proportion of minority (57 percent) and low-income (46.6 percent) riders as well as a lower but still substantial percentage of riders who speak a language other than English at home (23 percent). The following public involvement and outreach tools were used to engage minority, low-income and LEP populations:
Public meetings were held in locations convenient to minority, low-income, and LEP populations (these locations were targeted based on ACS data).
Vital materials including project handouts, comment forms, and notifications were translated into Spanish and made available at meetings and hearings.
Interpreters were present at targeted public meetings and hearings.
Notifications and announcements distributed to organizations that serve minority, low-income, and LEP populations, including:
o P.A.L. Police Athletic League o Northeast Career Planning o AIM Support Services (Saratoga County) o Department of Social Services (Albany) o U.S. Committee for Refugees and Immigrants o Clear View Center (Equinox) o The Albany Damien Center
CDTA Fare Equity Analysis – November 2014 Page | 27
o Living Resources o Homeless and Travelers Aid Society o NYS Office for People with Developmental Disabilities o AIDS Council o Northeast Association of the Blind at Albany o St. Anne’s Institute o Access-VR Adult Career and Continuing Education Services o Guilderland H.S. o Albany School of Humanities o Capital City Rescue Mission o Albany Law School o Albany Housing Coalition o Mental Health Association o 15 Love o Capital Region Boces o Cohoes H.S.
Public Comments Public comments were collected through comment forms at all public meetings and public hearings and through the 2014 CDTA Rider Customer Survey on Fare Payment Methods. Additional comments were collected through fax, mail, and email. The phone number and mailing and email addresses for public comments were provided on the comment forms. Information on name, address, email, stakeholder type, voluntary demographic data, transit system patronized, issues noted and specific comments were entered into a comment database. Comments collected, which totaled 11 (9 comment forms filled out at meetings and hearings and two comments submitted via email) , fell into the following categories: Concerns
Concern about the day pass no longer being available for purchase on the bus after the 12-18 month transition period
Concern about not being able to remotely load money onto the Smart Card or Mobile Ticket App without a credit card, internet access, or a bank account
Concern about out-of-town visitors without a Smart Card or Mobile Ticketing App not being able to use the system beyond purchasing a single ride with cash on the bus
Concern about half-fare customers being required to obtain photo identification for their Smart Card and having to spend money and travel to obtain the photograph
Concern that commuters who use 31-Day Rolling Swiper cards, pay with a payroll deduction, and have cards mailed to them each month will find their card procurement process to be more difficult
Concern about lack of knowledge of how to board with the new technology
Concern about how secure the collected personal rider information will be
Concern about it being difficult to understand and inconvenient to load money onto the Smart Card
CDTA Fare Equity Analysis – November 2014 Page | 28
Concern about discontinuation of the 5-day Weekday Rolling Swiper as it is used by workers who do not want to pay more for a 31-day Rolling Swiper that they can also use on the weekend
Concern over the inconvenience for a rider who loses their Smart Card and has to register again
Concern that half-fare riders will not be able to allow other riders to use their Smart Card
Concern over having to wait the 48 hours for a replacement card to be issued if a card is stolen
Support
Support for the reduction in boarding time it will bring
Support for the incorporation of new technology that will inform riders when they are reaching the end of their 31-day ride period or automatically re-load their card
Support for the slight reduction in fare cost
Support for the Smart Card’s pay as you go option, which will remove the possibility of a situation in which the rider purchases a day pass, does not use it on the return trip, and thereby wastes money
Support for the Smart Card feature that allows replenishment of funds in the event of a lost Smart Card
Support for the Smart Card and Mobile Ticketing App as they will remove the burden of having to provide cash
Support for the Smart Card being made of less flimsy material that will withstand rain In addition to responses to the proposed fare increases, some respondents provided suggestions for mitigation to help off-set the new fare system changes. Suggestions provided in the public comments include:
Provide an emergency replacement Smart Card for the rider to use on the bus while waiting for their replacement card to arrive.
Provide Smart Card re-load options at multiple stores and at ticket vending machines across the region, especially in areas that cater to half-fare customers.
Implement an education campaign that includes broadcasting on public radio and Time Warner Public Service channel to reach the maximum number of people.
Do not require senior citizens to provide birth certificates to qualify for half-fare; the date of birth on their licenses or non-driver identification cards should be sufficient. Many senior citizens do not have their certificates and to get a new one would be cost prohibitive.
For riders under the age of 65 who request half fare, do not require a special physical exam because some health insurance plans do not cover such exams.
Send CDTA staff to sites that cater to half-fare customers to take their photographs. Do not require riders, especially those with mental disabilities to go to the CDTA headquarters.
Give drivers pamphlets to hand out that list the locations where the Smart Card can be re-loaded.
CDTA Fare Equity Analysis – November 2014 Page | 29
Distribute the Smart Card, register users, and take identification photographs at community gathering spots such as libraries, local banks, colleges, K-12 schools, supermarkets, BusPlus shelters, and at the Community Living Summit.
Provide NX riders with an incentive to switch to Smart Card and Mobile Ticketing such as free downtown parking for a certain number of days per week
Do not discontinue the 5-day Weekday Rolling Swiper
A comment summary is available in Appendix B along with scanned comment forms and sign-in sheets.
Impacts
Potential impacts were identified through internal agency discussions; public input provided via surveys, comment forms, and email; a comprehensive review of peer agencies’ fare equity analyses; and a series of peer interviews. The potential impacts identified include the following:
1) Fare decrease of 2.5 percent for users of the Day Pass who use the Smart Card or Mobile Ticketing (Positive impact – no mitigation measure required)
2) Discontinuation of 5-day Weekday Rolling Swiper (Positive impact in 56% of cases, customers can opt for pay as you go– no mitigation measure required)
3) Missed opportunity to benefit from lower fares, free rides and discounts for riders who do not use the Smart Card or Mobile Ticketing (5, 6, 7, 8, 9)
4) Missed opportunity to benefit from ability to remotely load funds onto the Smart Card or Mobile Ticketing App for those riders without a Smart Phone, internet access, or a bank account or credit card (8, 9, 13)
5) Discontinuation of Day Pass for purchase on the bus, and of Weekday Rolling Swiper, Change Card, and STAR Ticket Book (1, 3)
6) Requirement that riders without a Smart Phone, internet access, or a bank account or credit card travel to the CDTA headquarters or to designated retail point of sale locations to load the Smart Card (2, 8, 9)
7) Requirement that half-fare customers obtain photographic identification for their Smart Card (10)
8) Inability of out-of-town visitors to easily use the CDTA services without having pre-purchased a Smart Card or downloaded the Mobile Ticketing App (2)
Alternatives and Mitigation Measures
Under Title VI regulations, CDTA is required to consider available to alternatives in order to offset impacts from the fare adjustments. These alternatives that would have a less disparate impact or disproportionate burden would still have to accomplish CDTA’s stated program goals, which include improving rider experience in the following ways: more fare payment options, reduced fare cost, reduced transaction time and expedited service, increased security and payment flexibility, the convenience of autoload, lost card protection, and the possibility of rider incentives and discounts. Alternatives considered include the following:
CDTA Fare Equity Analysis – November 2014 Page | 30
1) Do Nothing. This option is not recommended because it does not accomplish project goals.
2) Continue to provide the same fare type and payment method options as currently exist in addition to implementing the Smart Card and Mobile Ticketing program. This alternative is not considered acceptable because it would not allow CDTA to accomplish the stated program goals.
3) Implement program as planned with additional off-board ticketing options such as ticket vending machines at bus stops throughout the four-county service area. This alternative would be cost prohibitive due to the large number of bus stops that would require ticket vending machine installation.
To offset the impacts of the proposed fare adjustments, certain mitigation measures are in place or can be put into place. The following section discusses existing and potential mitigation measures for riders.
1) Phased Timing of Smart Card Rollout – Existing fare types will be transitioned to Smart Card and Mobile Ticketing but will remain in place for 6-9 months to ease transition.
2) Expand Point of Sale Retail Locations – The number (and more importantly, location) of point of sale retail locations will be targeted to ensure that low-income and minority neighborhoods are served, and/or those locations are made as accessible as possible through the transit network. That is, point of sale locations should be located in areas that are well served by CDTA’s route network.
3) Retain ability to use a full- and half-fare on the bus – Riders will be allowed to continue using full- and half-fare products on the bus for 12-18 months to ease transition.
4) Direct 5-day Weekday Rolling Swiper Users to Correct Product – The majority (56%) of 5-day Weekday Rolling Swiper riders ride 0-2 times per day. These customers will end up paying less by using the proposed Pay As You Go fare product instead.
5) Distribute smart cards at no charge – Free Smart Cards will be disseminated to assist riders through 6-12 month transition period. This would reduce burden on low-income riders in particular.
6) Provide the first replacement Smart Card free of charge – Riders who lose or damage their Smart Card will be provided with a new card free of charge for the first replacement.
7) Ongoing distribution of smart cards at no charge through social service agencies – Smart Cards will be disseminated to low-income riders in coordination with social service organizations beyond the initial 6-12 month period.
8) Allow use of pre-paid visa debit card to load money onto Smart Card – Permit use of pre-paid debit card for money-loading onto the Smart Card at all point of sale retail locations for those riders without credit or debit cards.
9) Allow use of cash to load money onto Smart Card at retail point of sale location - Permit use of cash for money-loading onto the Smart Card at all point of sale retail locations for those riders without credit or debit cards.
10) Visit social service organizations or residential communities to take half-fare Smart Card identification photographs – CDTA Travel Trainers will visit sites that cater to half-fare riders to take their identification photograph, required for participation in the
CDTA Fare Equity Analysis – November 2014 Page | 31
Smart Card Half-Fare program, and remove the burden of their having to come to the CDTA office to do so.
11) Allow transfer of existing pass values onto Smart Card – Riders with existing passes (i.e. change card, Monthly Swiper, 10-ride etc.) will be allowed to transfer the value on those passes over to the Smart Card (not Mobile Ticket) for 6-9 months.
12) Provision of bonuses and discounts – Smart Card and Mobile Ticket riders will be eligible for bonuses (i.e. a free birthday-ride) and discounts (in partnership with local businesses).
13) Ability to use Smart Card without being registered – Riders who opt not to register for their Smart Card will still be able to use the Smart Card and receive bonuses and discounts.
Summary The fare equity analysis has shown that according to the CDTA Monthly On-Board Rider Evaluation Survey, the majority of riders are minorities (57 percent) and nearly half are low-income (47 percent). As stated above, disparate impact occurs when more than 25 percent of the population bearing adverse effects is minority, and disproportionate burden occurs when more than 20 percent of the population bearing adverse effects is low-income. For both the minority and the low-income populations, this threshold is surpassed. It was also noted that the counties with the highest concentration of minority populations are Albany and Schenectady, and that Saratoga County has the lowest concentration of low-income populations. Albany, Schenectady, and Rensselaer counties are 3-4 percentage points higher than Saratoga County. Further, it was determined that 23 percent of survey respondents speak a language other than English at home and that the largest concentration of persons who speak English less than very well is in Albany County. Additionally, it was noted that the percentage of the Capital Region population that identifies as minority, falls within the lowest income bracket, or speaks English less than very well (15, 10, and 2 percent respectively), is substantially lower than the percentage of riders who identify as minority, who fall within the lowest income bracket, or speak another language other than English, (57, 35, and 23 percent respectively). According to the CDTA Monthly On-Board Rider Evaluation Survey, “Cash on the Bus” is the most used fare type overall at 37 percent followed by the Swiper card at 31 percent. The findings were similar for the minority and low-income respondents of this survey, 40 and 38 percent of which reported that they use cash on the bus most, whereas 31 and 35 percent, respectively, reported they use the Swiper card most. These percentages surpass the disparate impact and disproportionate burden thresholds and as such require consideration of alternatives and mitigation measures. Similarly, 47 percent of the survey’s respondents who speak another language other than English at home reported using cash on the bus most and 28 percent reported using the Swiper card most. The ridership data provided by the CDTA Fare Collection System Report shows the Swiper card to be the most used fare type at 27 percent, followed by “Cash on the Bus” at 23 percent. The Day Pass is also shown to be a highly used fare type at 21 percent, just 2 percentage points below “Cash on the Bus.” Compared to the percentages in the CDTA Monthly On-Board Rider
CDTA Fare Equity Analysis – November 2014 Page | 32
Evaluation Survey data, this data shows the percentages of riders using “Cash on the Bus” and the Swiper card to be lower and presents the Day Pass as a higher-use fare type (compared to 17 percent in the other survey). The similarity between the two data sets is that “Cash on the Bus” and the Swiper card are in the top two places even though the order of the 1st and 2nd positions between the two data sets is opposite. Further, the 2014 CDTA Rider Customer Survey on Fare Payment Methods findings suggest a relatively smooth transition for the majority of minority and low-income riders. Data shows that a large majority of minority and low-income riders would be somewhat or very likely to use the Smart Card and would ride the same or more than they do currently, with slightly lower percentages for the Mobile Ticketing App. Further, two-thirds of minority and low-income riders currently access the internet through their Smart Phone suggesting a level of comfort with the internet that is conducive to being able to understand and utilize the proposed Smart Card and Mobile Ticketing program.
Conclusion After conducting an in-depth Fare Equity Analysis, CDTA has concluded that mitigation measures are justified based on potential impacts identified on minority and low-income riders and will be put into place to mitigate those impacts. Particular attention will be paid to mitigating impacts on minority and low-income riders who pay for their fare with cash on the bus and/or a Swiper card. With regard to the Swiper card, because one of the Swiper card products, the 5-day Weekday Rolling Swiper, will be discontinued, special attention will also be paid to mitigating any impacts of this change to Swiper card users. Further, as one of the largest changes being brought about by the fare adjustments is the discontinuation of the Day Pass for purchase on the bus, despite the fact that the percentage of minority and low-income riders who use it does not pass the disparate impact and disproportionate burden thresholds respectively, mitigation measures will be implemented to address any of the potential impacts of this change. Mitigation efforts will be concentrated in Albany County, Schenectady County, and to a lesser degree Rensselaer County due to the higher concentration of minority and low-income riders in those counties. Further, the existence of an LEP population both in the service area and using cash on the bus and the Swiper card the majority of the time has justified CDTA’s commitment to engaging LEP populations in the public outreach process. In addition, CDTA will ensure that it continues to engage LEP populations as part of its continued public outreach efforts and as part of mitigation efforts. As included above, the mitigation measures that exist or will be put in place to mitigate identified disparate impacts and/or disproportionate burdens on minority and low-income populations include: phased timing of the smart card / mobile ticketing rollout, expansion of point of sale retail locations, retention of the ability to use a full- and half-fare on the bus, directing 5-day Weekday Rolling Swiper Users to the Pay As You Go product, distribution of smart cards at no charge, provision of the first replacement smart card free of charge, ongoing distribution of smart cards at no charge through social service agencies, allowed use of a pre-paid visa debit card to load money onto the Smart Card, allowed use of cash to load money onto smart card at retail point of sale locations, dedication of CDTA staff to taking half-fare smart card identification photographs at social service organizations or residential
CDTA Fare Equity Analysis – November 2014 Page | 33
communities, allowed transfer of existing pass values onto the Smart Card, provision of bonuses and discounts, and allowed use of the Smart Card without having registered.
CDTA Fare Equity Analysis – November 2014 Page | 34
References
1. 2010 Census Interactive Population. 2010 Census Data. United States Census 2010. Retrieved from: http://www.census.gov/2010census/popmap/ipmtext.php?fl=36:36001
2. American Community Survey (ACS) 5-Year Estimates; Table S1901: Income in the past 12 months (in 2012 inflation-adjusted dollars). (2008-2012). American Community Survey. Retrieved from: http://factfinder2.census.gov/faces/nav/jsf/pages/index.xhtml.
3. American Community Survey (ACS) 5-Year Estimates; Table B16001: Language spoken at
home by ability to speak English for the population 5 years and over. (2008-2012). American Community Survey. Retrieved from: http://factfinder2.census.gov/faces/nav/jsf/pages/index.xhtml.
4. American Community Survey Poverty Thresholds for 2013 by Size of Family and Number
of Related Children Under 18 Years. Current Population Survey (CPS) A joint effort between the Bureau of Labor Statistics and the Census Bureau. 2013 Annual Social and Economic (ASEC) Supplement. Retrieved from: https://www.census.gov/hhes/www/cpstables/032013/pov/toc.htm
5. Capital District Transportation Authority. (2011). Title VI Fare Equity Analysis. Albany,
NY.
6. Capital District Transportation Authority. (2013). Title VI Program 2014 - 2016. Albany, NY.
7. Capital District Transportation Authority. (2014). 2014 CDTA Rider Customer Survey on
Fare Payment Methods. Albany, NY. Fact Finders Marketing and Opinion Research
8. Capital District Transportation Authority. (2014). CDTA Monthly On-Board Rider Evaluation Survey. Albany, NY. Fact Finders Marketing and Opinion Research
9. Capital District Transportation Authority. (2013). CDTA Public Participation Plan. Albany,
NY.
10. Federal Transit Administration. (2012). Circular 4702.1B Title VI Requirements and Guidelines for Federal Transit Administration Recipients. Washington, D.C. Retrieved from: http://www.fta.dot.gov/documents/FTA_Title_VI_FINAL.pdf.
CDTA Fare Equity Analysis – November 2014 Page | 35
Appendix A – Demographic Data
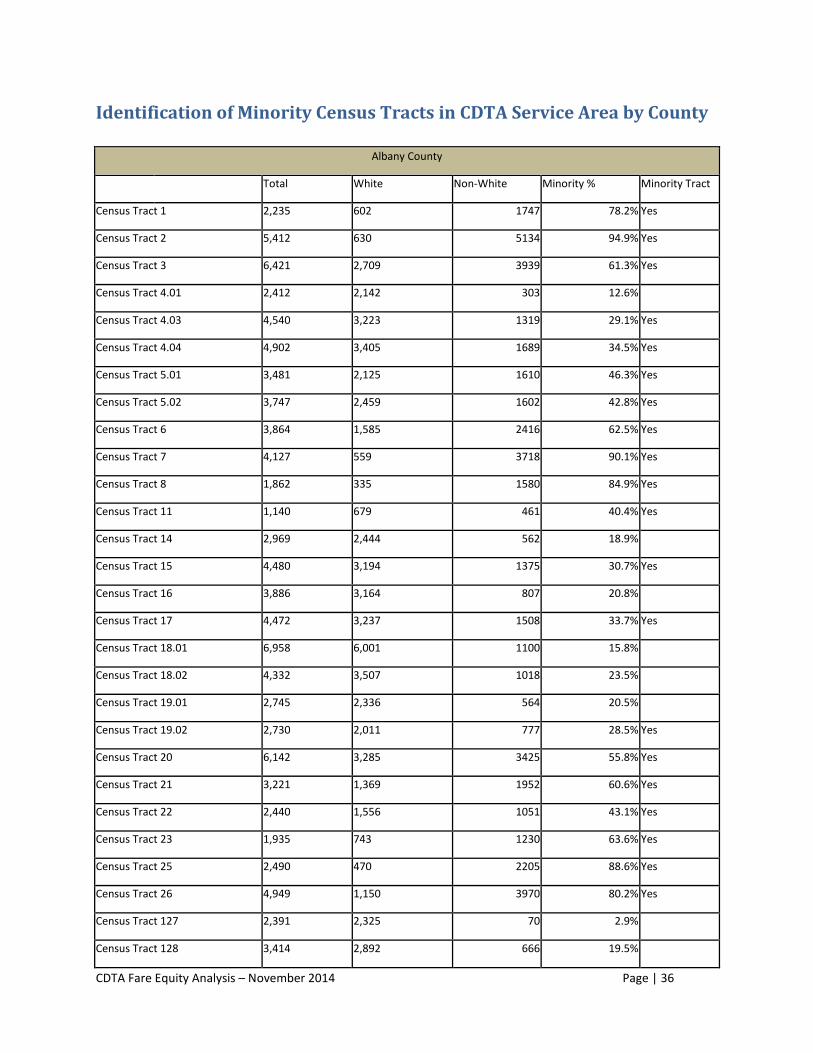
CDTA Fare Equity Analysis – November 2014 Page | 36
Identification of Minority Census Tracts in CDTA Service Area by County
Albany County
Total White Non-White Minority % Minority Tract
Census Tract 1 2,235 602 1747 78.2% Yes
Census Tract 2 5,412 630 5134 94.9% Yes
Census Tract 3 6,421 2,709 3939 61.3% Yes
Census Tract 4.01 2,412 2,142 303 12.6%
Census Tract 4.03 4,540 3,223 1319 29.1% Yes
Census Tract 4.04 4,902 3,405 1689 34.5% Yes
Census Tract 5.01 3,481 2,125 1610 46.3% Yes
Census Tract 5.02 3,747 2,459 1602 42.8% Yes
Census Tract 6 3,864 1,585 2416 62.5% Yes
Census Tract 7 4,127 559 3718 90.1% Yes
Census Tract 8 1,862 335 1580 84.9% Yes
Census Tract 11 1,140 679 461 40.4% Yes
Census Tract 14 2,969 2,444 562 18.9%
Census Tract 15 4,480 3,194 1375 30.7% Yes
Census Tract 16 3,886 3,164 807 20.8%
Census Tract 17 4,472 3,237 1508 33.7% Yes
Census Tract 18.01 6,958 6,001 1100 15.8%
Census Tract 18.02 4,332 3,507 1018 23.5%
Census Tract 19.01 2,745 2,336 564 20.5%
Census Tract 19.02 2,730 2,011 777 28.5% Yes
Census Tract 20 6,142 3,285 3425 55.8% Yes
Census Tract 21 3,221 1,369 1952 60.6% Yes
Census Tract 22 2,440 1,556 1051 43.1% Yes
Census Tract 23 1,935 743 1230 63.6% Yes
Census Tract 25 2,490 470 2205 88.6% Yes
Census Tract 26 4,949 1,150 3970 80.2% Yes
Census Tract 127 2,391 2,325 70 2.9%
Census Tract 128 3,414 2,892 666 19.5%
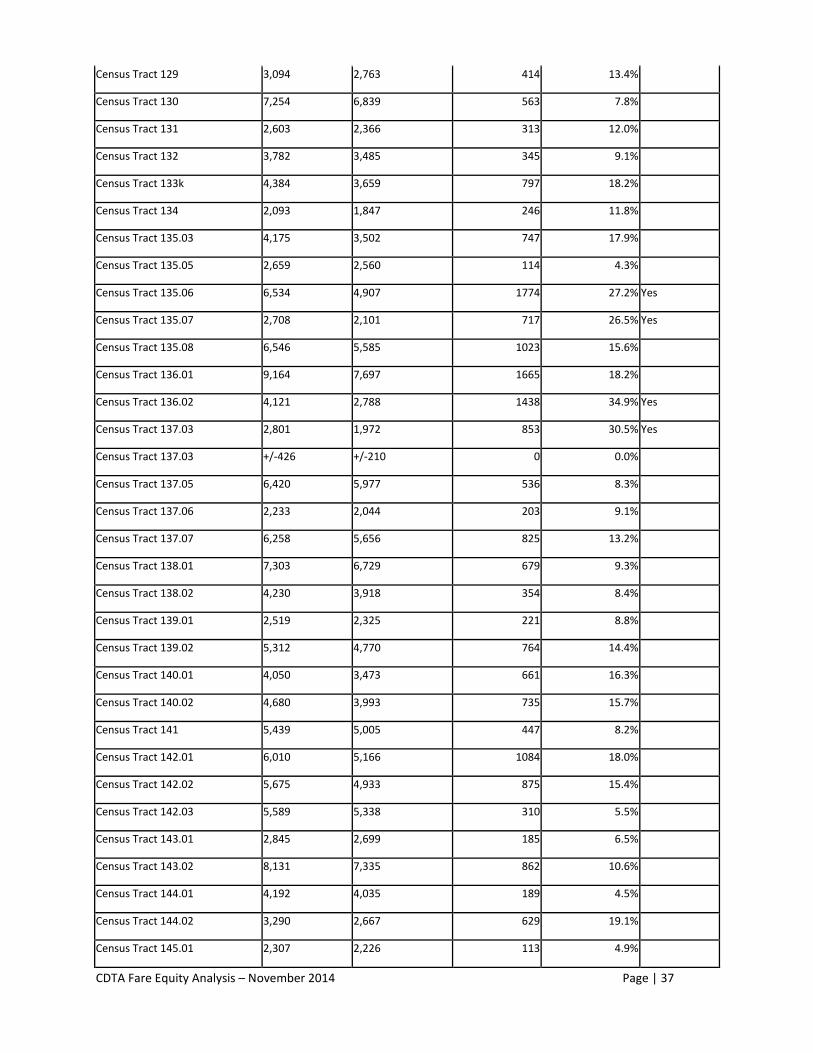
CDTA Fare Equity Analysis – November 2014 Page | 37
Census Tract 129 3,094 2,763 414 13.4%
Census Tract 130 7,254 6,839 563 7.8%
Census Tract 131 2,603 2,366 313 12.0%
Census Tract 132 3,782 3,485 345 9.1%
Census Tract 133k 4,384 3,659 797 18.2%
Census Tract 134 2,093 1,847 246 11.8%
Census Tract 135.03 4,175 3,502 747 17.9%
Census Tract 135.05 2,659 2,560 114 4.3%
Census Tract 135.06 6,534 4,907 1774 27.2% Yes
Census Tract 135.07 2,708 2,101 717 26.5% Yes
Census Tract 135.08 6,546 5,585 1023 15.6%
Census Tract 136.01 9,164 7,697 1665 18.2%
Census Tract 136.02 4,121 2,788 1438 34.9% Yes
Census Tract 137.03 2,801 1,972 853 30.5% Yes
Census Tract 137.03 +/-426 +/-210 0 0.0%
Census Tract 137.05 6,420 5,977 536 8.3%
Census Tract 137.06 2,233 2,044 203 9.1%
Census Tract 137.07 6,258 5,656 825 13.2%
Census Tract 138.01 7,303 6,729 679 9.3%
Census Tract 138.02 4,230 3,918 354 8.4%
Census Tract 139.01 2,519 2,325 221 8.8%
Census Tract 139.02 5,312 4,770 764 14.4%
Census Tract 140.01 4,050 3,473 661 16.3%
Census Tract 140.02 4,680 3,993 735 15.7%
Census Tract 141 5,439 5,005 447 8.2%
Census Tract 142.01 6,010 5,166 1084 18.0%
Census Tract 142.02 5,675 4,933 875 15.4%
Census Tract 142.03 5,589 5,338 310 5.5%
Census Tract 143.01 2,845 2,699 185 6.5%
Census Tract 143.02 8,131 7,335 862 10.6%
Census Tract 144.01 4,192 4,035 189 4.5%
Census Tract 144.02 3,290 2,667 629 19.1%
Census Tract 145.01 2,307 2,226 113 4.9%
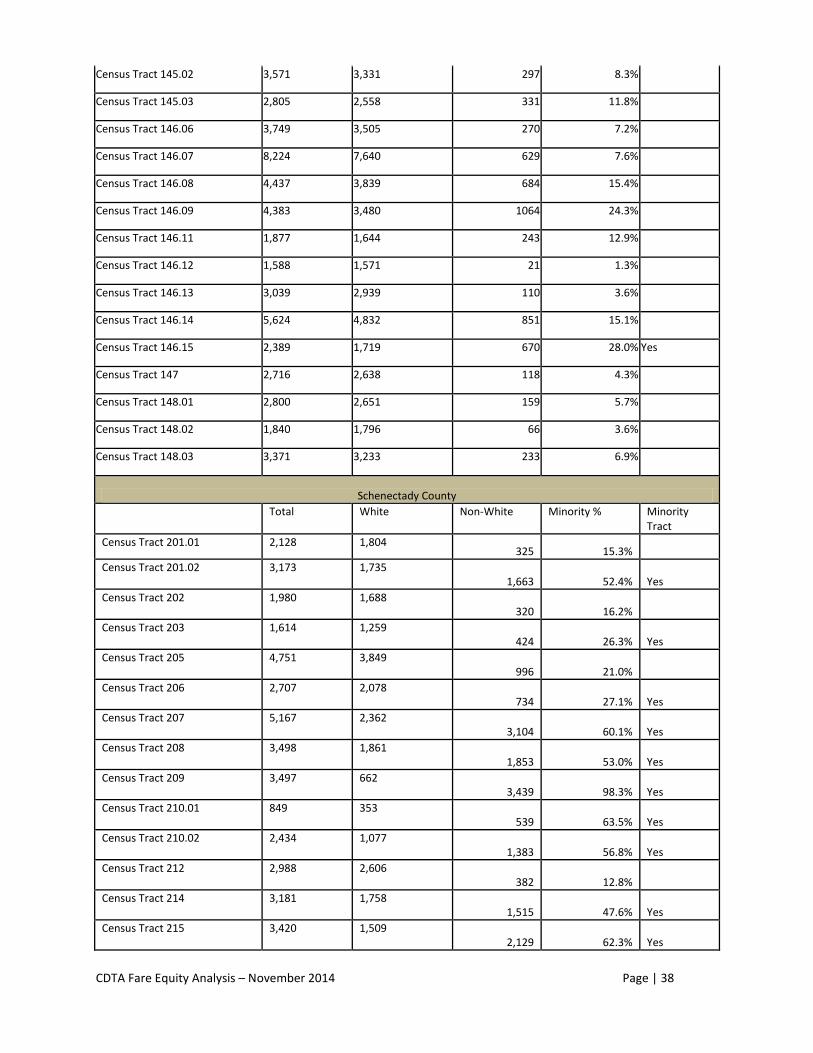
CDTA Fare Equity Analysis – November 2014 Page | 38
Census Tract 145.02 3,571 3,331 297 8.3%
Census Tract 145.03 2,805 2,558 331 11.8%
Census Tract 146.06 3,749 3,505 270 7.2%
Census Tract 146.07 8,224 7,640 629 7.6%
Census Tract 146.08 4,437 3,839 684 15.4%
Census Tract 146.09 4,383 3,480 1064 24.3%
Census Tract 146.11 1,877 1,644 243 12.9%
Census Tract 146.12 1,588 1,571 21 1.3%
Census Tract 146.13 3,039 2,939 110 3.6%
Census Tract 146.14 5,624 4,832 851 15.1%
Census Tract 146.15 2,389 1,719 670 28.0% Yes
Census Tract 147 2,716 2,638 118 4.3%
Census Tract 148.01 2,800 2,651 159 5.7%
Census Tract 148.02 1,840 1,796 66 3.6%
Census Tract 148.03 3,371 3,233 233 6.9%
Schenectady County
Total White Non-White Minority % Minority Tract
Census Tract 201.01 2,128 1,804 325 15.3%
Census Tract 201.02 3,173 1,735 1,663 52.4% Yes
Census Tract 202 1,980 1,688 320 16.2%
Census Tract 203 1,614 1,259 424 26.3% Yes
Census Tract 205 4,751 3,849 996 21.0%
Census Tract 206 2,707 2,078 734 27.1% Yes
Census Tract 207 5,167 2,362 3,104 60.1% Yes
Census Tract 208 3,498 1,861 1,853 53.0% Yes
Census Tract 209 3,497 662 3,439 98.3% Yes
Census Tract 210.01 849 353 539 63.5% Yes
Census Tract 210.02 2,434 1,077 1,383 56.8% Yes
Census Tract 212 2,988 2,606 382 12.8%
Census Tract 214 3,181 1,758 1,515 47.6% Yes
Census Tract 215 3,420 1,509 2,129 62.3% Yes
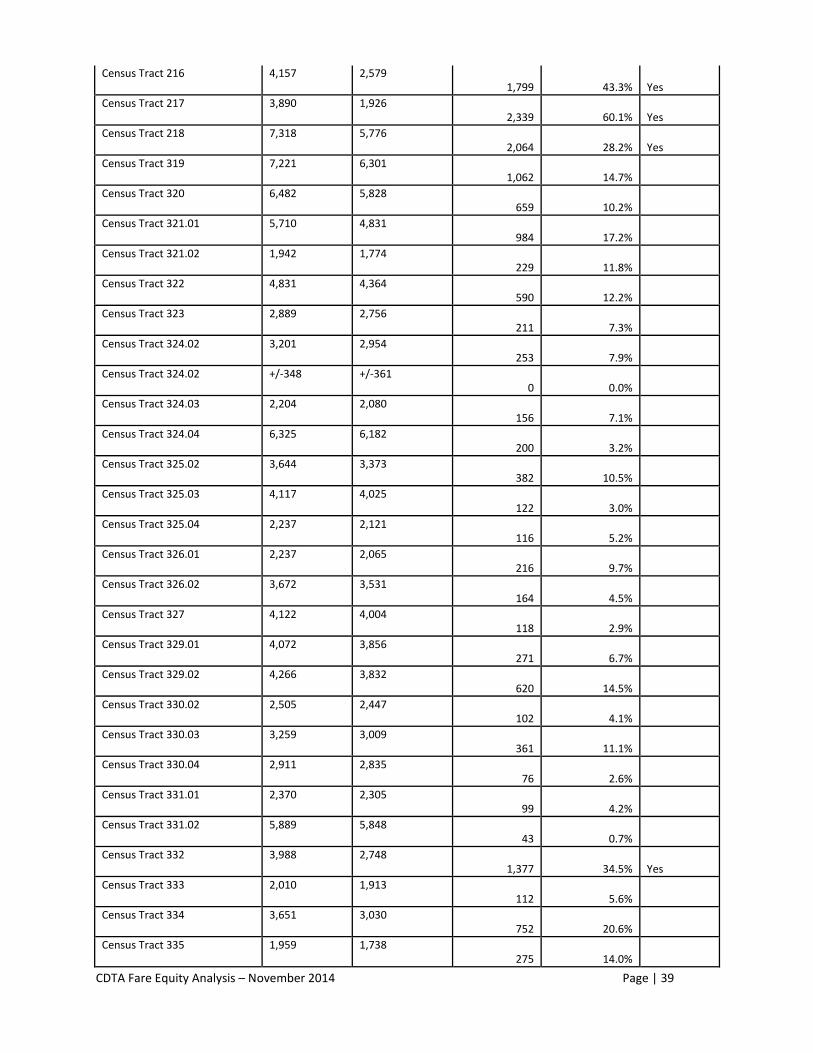
CDTA Fare Equity Analysis – November 2014 Page | 39
Census Tract 216 4,157 2,579 1,799 43.3% Yes
Census Tract 217 3,890 1,926 2,339 60.1% Yes
Census Tract 218 7,318 5,776 2,064 28.2% Yes
Census Tract 319 7,221 6,301 1,062 14.7%
Census Tract 320 6,482 5,828 659 10.2%
Census Tract 321.01 5,710 4,831 984 17.2%
Census Tract 321.02 1,942 1,774 229 11.8%
Census Tract 322 4,831 4,364 590 12.2%
Census Tract 323 2,889 2,756 211 7.3%
Census Tract 324.02 3,201 2,954 253 7.9%
Census Tract 324.02 +/-348 +/-361 0 0.0%
Census Tract 324.03 2,204 2,080 156 7.1%
Census Tract 324.04 6,325 6,182 200 3.2%
Census Tract 325.02 3,644 3,373 382 10.5%
Census Tract 325.03 4,117 4,025 122 3.0%
Census Tract 325.04 2,237 2,121 116 5.2%
Census Tract 326.01 2,237 2,065 216 9.7%
Census Tract 326.02 3,672 3,531 164 4.5%
Census Tract 327 4,122 4,004 118 2.9%
Census Tract 329.01 4,072 3,856 271 6.7%
Census Tract 329.02 4,266 3,832 620 14.5%
Census Tract 330.02 2,505 2,447 102 4.1%
Census Tract 330.03 3,259 3,009 361 11.1%
Census Tract 330.04 2,911 2,835 76 2.6%
Census Tract 331.01 2,370 2,305 99 4.2%
Census Tract 331.02 5,889 5,848 43 0.7%
Census Tract 332 3,988 2,748 1,377 34.5% Yes
Census Tract 333 2,010 1,913 112 5.6%
Census Tract 334 3,651 3,030 752 20.6%
Census Tract 335 1,959 1,738 275 14.0%
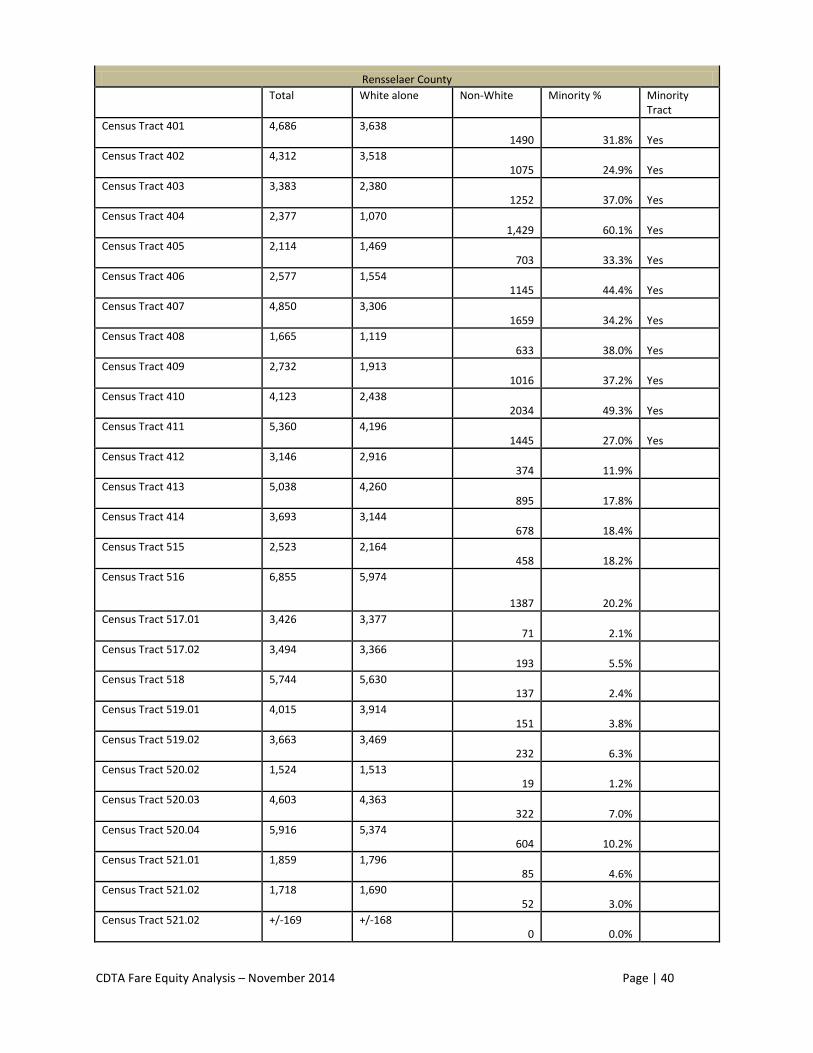
CDTA Fare Equity Analysis – November 2014 Page | 40
Rensselaer County
Total White alone Non-White Minority % Minority Tract
Census Tract 401 4,686 3,638 1490 31.8% Yes
Census Tract 402 4,312 3,518 1075 24.9% Yes
Census Tract 403 3,383 2,380 1252 37.0% Yes
Census Tract 404 2,377 1,070 1,429 60.1% Yes
Census Tract 405 2,114 1,469 703 33.3% Yes
Census Tract 406 2,577 1,554 1145 44.4% Yes
Census Tract 407 4,850 3,306 1659 34.2% Yes
Census Tract 408 1,665 1,119 633 38.0% Yes
Census Tract 409 2,732 1,913 1016 37.2% Yes
Census Tract 410 4,123 2,438 2034 49.3% Yes
Census Tract 411 5,360 4,196 1445 27.0% Yes
Census Tract 412 3,146 2,916 374 11.9%
Census Tract 413 5,038 4,260 895 17.8%
Census Tract 414 3,693 3,144 678 18.4%
Census Tract 515 2,523 2,164 458 18.2%
Census Tract 516 6,855 5,974
1387 20.2%
Census Tract 517.01 3,426 3,377 71 2.1%
Census Tract 517.02 3,494 3,366 193 5.5%
Census Tract 518 5,744 5,630 137 2.4%
Census Tract 519.01 4,015 3,914 151 3.8%
Census Tract 519.02 3,663 3,469 232 6.3%
Census Tract 520.02 1,524 1,513 19 1.2%
Census Tract 520.03 4,603 4,363 322 7.0%
Census Tract 520.04 5,916 5,374 604 10.2%
Census Tract 521.01 1,859 1,796 85 4.6%
Census Tract 521.02 1,718 1,690 52 3.0%
Census Tract 521.02 +/-169 +/-168 0 0.0%
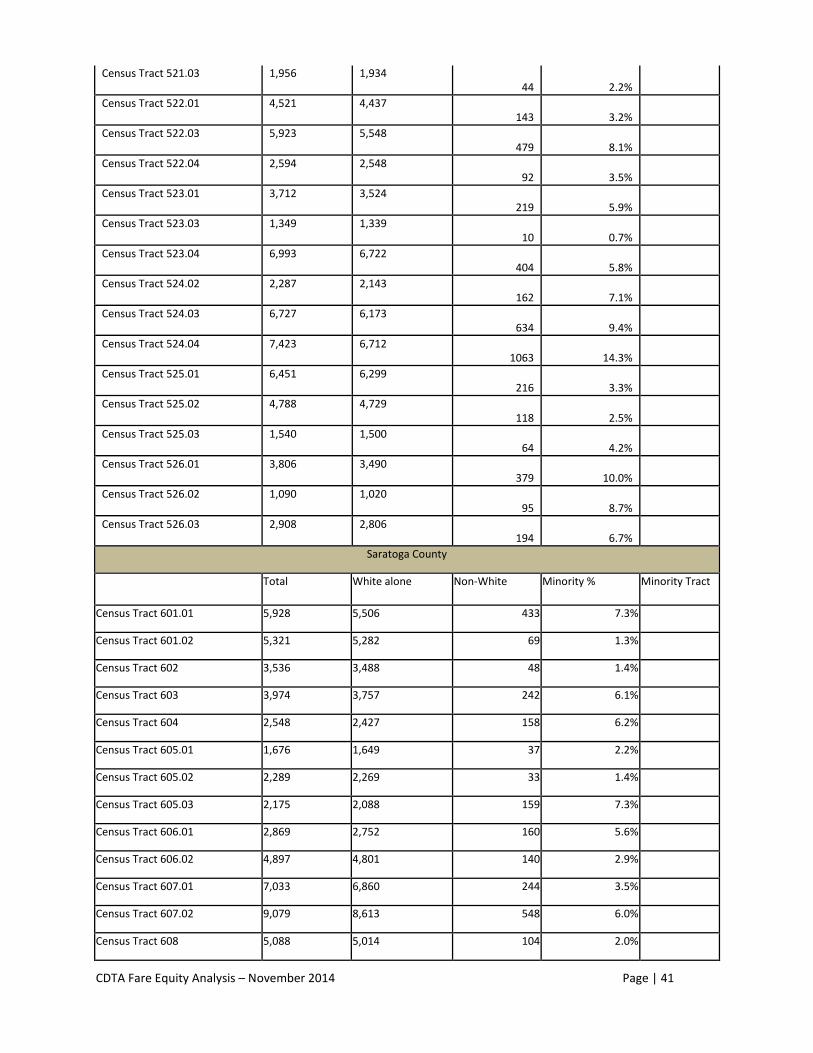
CDTA Fare Equity Analysis – November 2014 Page | 41
Census Tract 521.03 1,956 1,934 44 2.2%
Census Tract 522.01 4,521 4,437 143 3.2%
Census Tract 522.03 5,923 5,548 479 8.1%
Census Tract 522.04 2,594 2,548 92 3.5%
Census Tract 523.01 3,712 3,524 219 5.9%
Census Tract 523.03 1,349 1,339 10 0.7%
Census Tract 523.04 6,993 6,722 404 5.8%
Census Tract 524.02 2,287 2,143 162 7.1%
Census Tract 524.03 6,727 6,173 634 9.4%
Census Tract 524.04 7,423 6,712 1063 14.3%
Census Tract 525.01 6,451 6,299 216 3.3%
Census Tract 525.02 4,788 4,729 118 2.5%
Census Tract 525.03 1,540 1,500 64 4.2%
Census Tract 526.01 3,806 3,490 379 10.0%
Census Tract 526.02 1,090 1,020 95 8.7%
Census Tract 526.03 2,908 2,806 194 6.7%
Saratoga County
Total White alone Non-White Minority % Minority Tract
Census Tract 601.01 5,928 5,506 433 7.3%
Census Tract 601.02 5,321 5,282 69 1.3%
Census Tract 602 3,536 3,488 48 1.4%
Census Tract 603 3,974 3,757 242 6.1%
Census Tract 604 2,548 2,427 158 6.2%
Census Tract 605.01 1,676 1,649 37 2.2%
Census Tract 605.02 2,289 2,269 33 1.4%
Census Tract 605.03 2,175 2,088 159 7.3%
Census Tract 606.01 2,869 2,752 160 5.6%
Census Tract 606.02 4,897 4,801 140 2.9%
Census Tract 607.01 7,033 6,860 244 3.5%
Census Tract 607.02 9,079 8,613 548 6.0%
Census Tract 608 5,088 5,014 104 2.0%
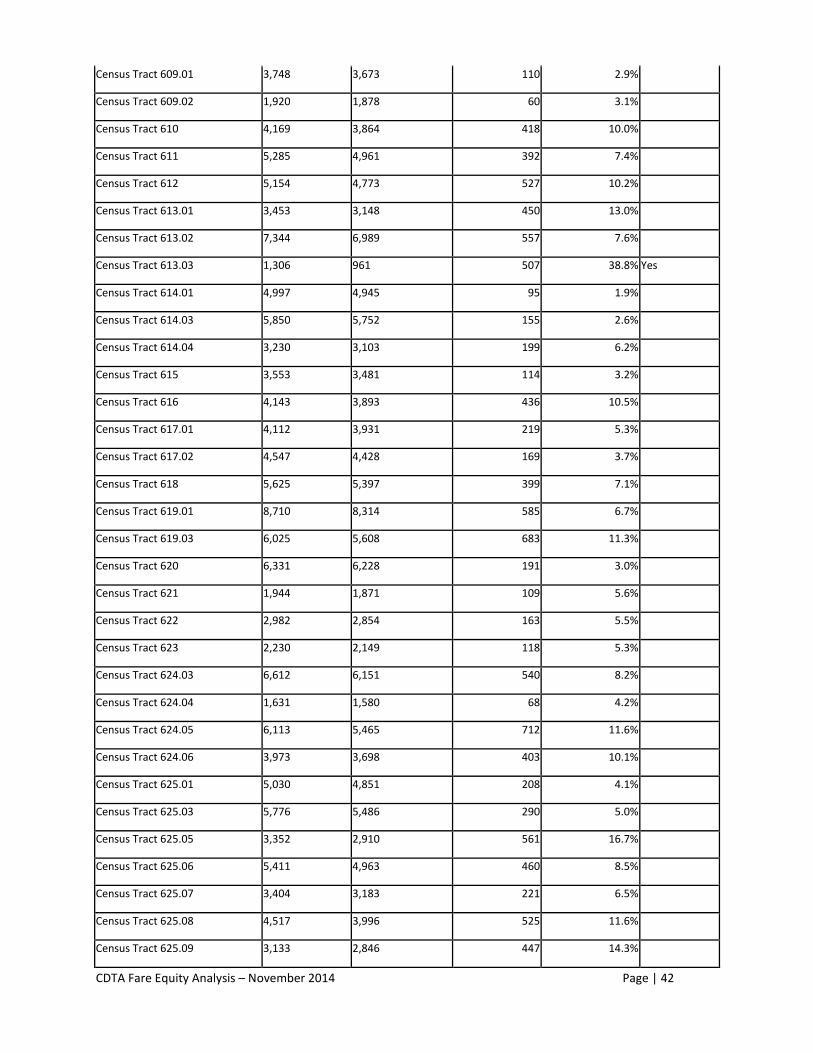
CDTA Fare Equity Analysis – November 2014 Page | 42
Census Tract 609.01 3,748 3,673 110 2.9%
Census Tract 609.02 1,920 1,878 60 3.1%
Census Tract 610 4,169 3,864 418 10.0%
Census Tract 611 5,285 4,961 392 7.4%
Census Tract 612 5,154 4,773 527 10.2%
Census Tract 613.01 3,453 3,148 450 13.0%
Census Tract 613.02 7,344 6,989 557 7.6%
Census Tract 613.03 1,306 961 507 38.8% Yes
Census Tract 614.01 4,997 4,945 95 1.9%
Census Tract 614.03 5,850 5,752 155 2.6%
Census Tract 614.04 3,230 3,103 199 6.2%
Census Tract 615 3,553 3,481 114 3.2%
Census Tract 616 4,143 3,893 436 10.5%
Census Tract 617.01 4,112 3,931 219 5.3%
Census Tract 617.02 4,547 4,428 169 3.7%
Census Tract 618 5,625 5,397 399 7.1%
Census Tract 619.01 8,710 8,314 585 6.7%
Census Tract 619.03 6,025 5,608 683 11.3%
Census Tract 620 6,331 6,228 191 3.0%
Census Tract 621 1,944 1,871 109 5.6%
Census Tract 622 2,982 2,854 163 5.5%
Census Tract 623 2,230 2,149 118 5.3%
Census Tract 624.03 6,612 6,151 540 8.2%
Census Tract 624.04 1,631 1,580 68 4.2%
Census Tract 624.05 6,113 5,465 712 11.6%
Census Tract 624.06 3,973 3,698 403 10.1%
Census Tract 625.01 5,030 4,851 208 4.1%
Census Tract 625.03 5,776 5,486 290 5.0%
Census Tract 625.05 3,352 2,910 561 16.7%
Census Tract 625.06 5,411 4,963 460 8.5%
Census Tract 625.07 3,404 3,183 221 6.5%
Census Tract 625.08 4,517 3,996 525 11.6%
Census Tract 625.09 3,133 2,846 447 14.3%
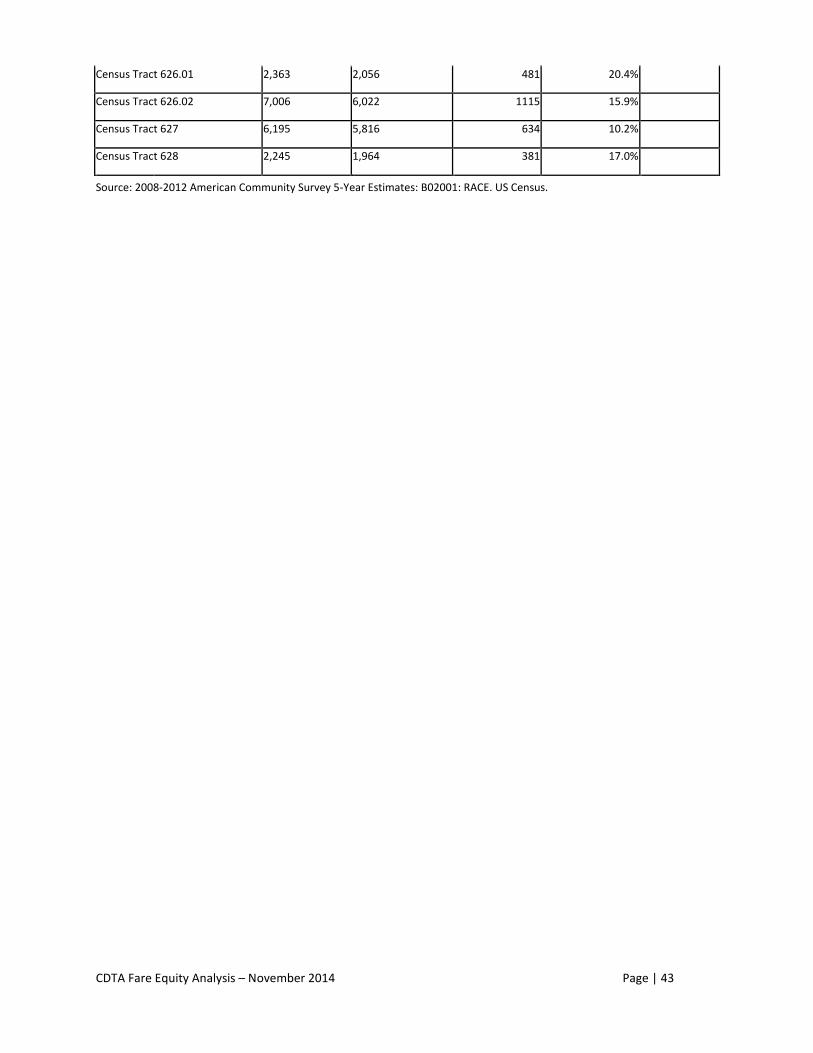
CDTA Fare Equity Analysis – November 2014 Page | 43
Census Tract 626.01 2,363 2,056 481 20.4%
Census Tract 626.02 7,006 6,022 1115 15.9%
Census Tract 627 6,195 5,816 634 10.2%
Census Tract 628 2,245 1,964 381 17.0%
Source: 2008-2012 American Community Survey 5-Year Estimates: B02001: RACE. US Census.
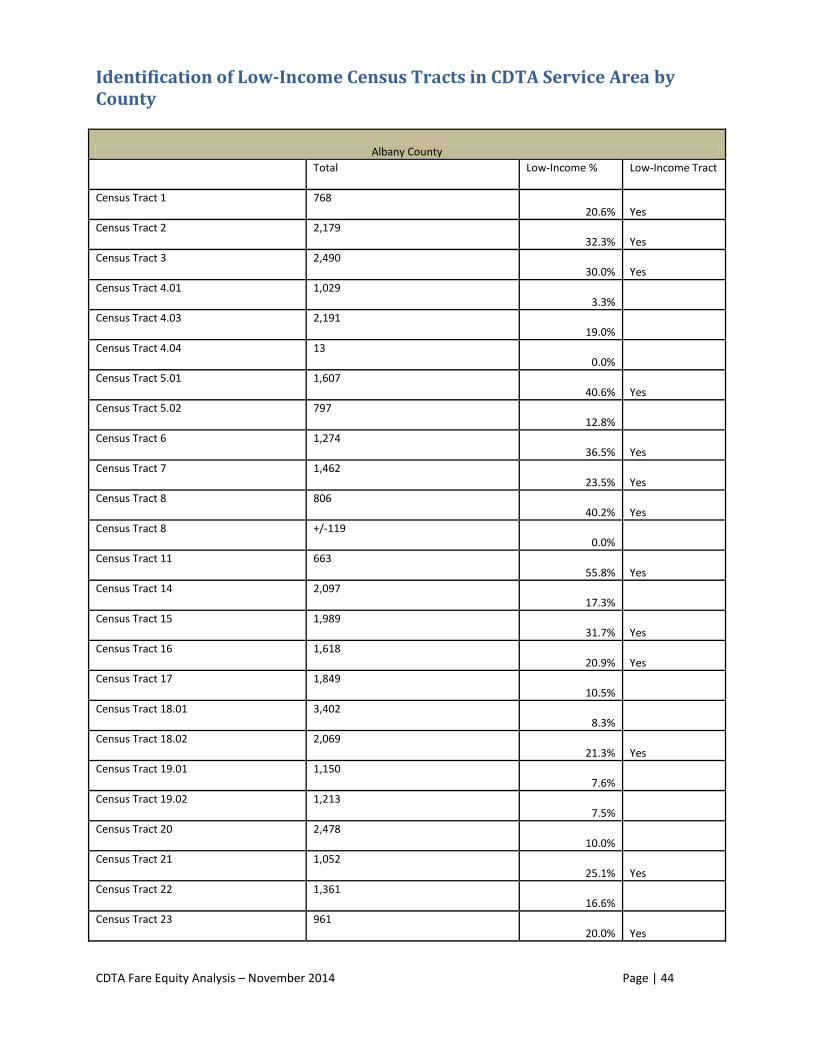
CDTA Fare Equity Analysis – November 2014 Page | 44
Identification of Low-Income Census Tracts in CDTA Service Area by County
Albany County
Total Low-Income % Low-Income Tract
Census Tract 1 768 20.6% Yes
Census Tract 2 2,179 32.3% Yes
Census Tract 3 2,490 30.0% Yes
Census Tract 4.01 1,029 3.3%
Census Tract 4.03 2,191 19.0%
Census Tract 4.04 13 0.0%
Census Tract 5.01 1,607 40.6% Yes
Census Tract 5.02 797 12.8%
Census Tract 6 1,274 36.5% Yes
Census Tract 7 1,462 23.5% Yes
Census Tract 8 806 40.2% Yes
Census Tract 8 +/-119 0.0%
Census Tract 11 663 55.8% Yes
Census Tract 14 2,097 17.3%
Census Tract 15 1,989 31.7% Yes
Census Tract 16 1,618 20.9% Yes
Census Tract 17 1,849 10.5%
Census Tract 18.01 3,402 8.3%
Census Tract 18.02 2,069 21.3% Yes
Census Tract 19.01 1,150 7.6%
Census Tract 19.02 1,213 7.5%
Census Tract 20 2,478 10.0%
Census Tract 21 1,052 25.1% Yes
Census Tract 22 1,361 16.6%
Census Tract 23 961 20.0% Yes
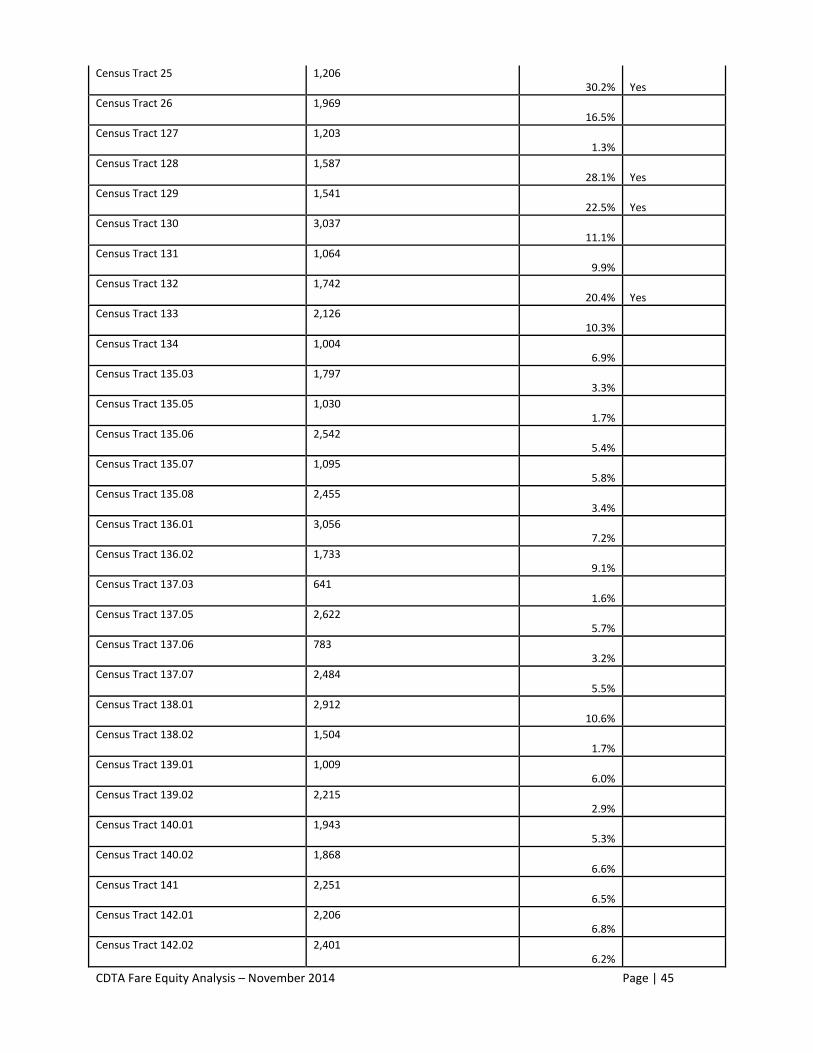
CDTA Fare Equity Analysis – November 2014 Page | 45
Census Tract 25 1,206 30.2% Yes
Census Tract 26 1,969 16.5%
Census Tract 127 1,203 1.3%
Census Tract 128 1,587 28.1% Yes
Census Tract 129 1,541 22.5% Yes
Census Tract 130 3,037 11.1%
Census Tract 131 1,064 9.9%
Census Tract 132 1,742 20.4% Yes
Census Tract 133 2,126 10.3%
Census Tract 134 1,004 6.9%
Census Tract 135.03 1,797 3.3%
Census Tract 135.05 1,030 1.7%
Census Tract 135.06 2,542 5.4%
Census Tract 135.07 1,095 5.8%
Census Tract 135.08 2,455 3.4%
Census Tract 136.01 3,056 7.2%
Census Tract 136.02 1,733 9.1%
Census Tract 137.03 641 1.6%
Census Tract 137.05 2,622 5.7%
Census Tract 137.06 783 3.2%
Census Tract 137.07 2,484 5.5%
Census Tract 138.01 2,912 10.6%
Census Tract 138.02 1,504 1.7%
Census Tract 139.01 1,009 6.0%
Census Tract 139.02 2,215 2.9%
Census Tract 140.01 1,943 5.3%
Census Tract 140.02 1,868 6.6%
Census Tract 141 2,251 6.5%
Census Tract 142.01 2,206 6.8%
Census Tract 142.02 2,401 6.2%
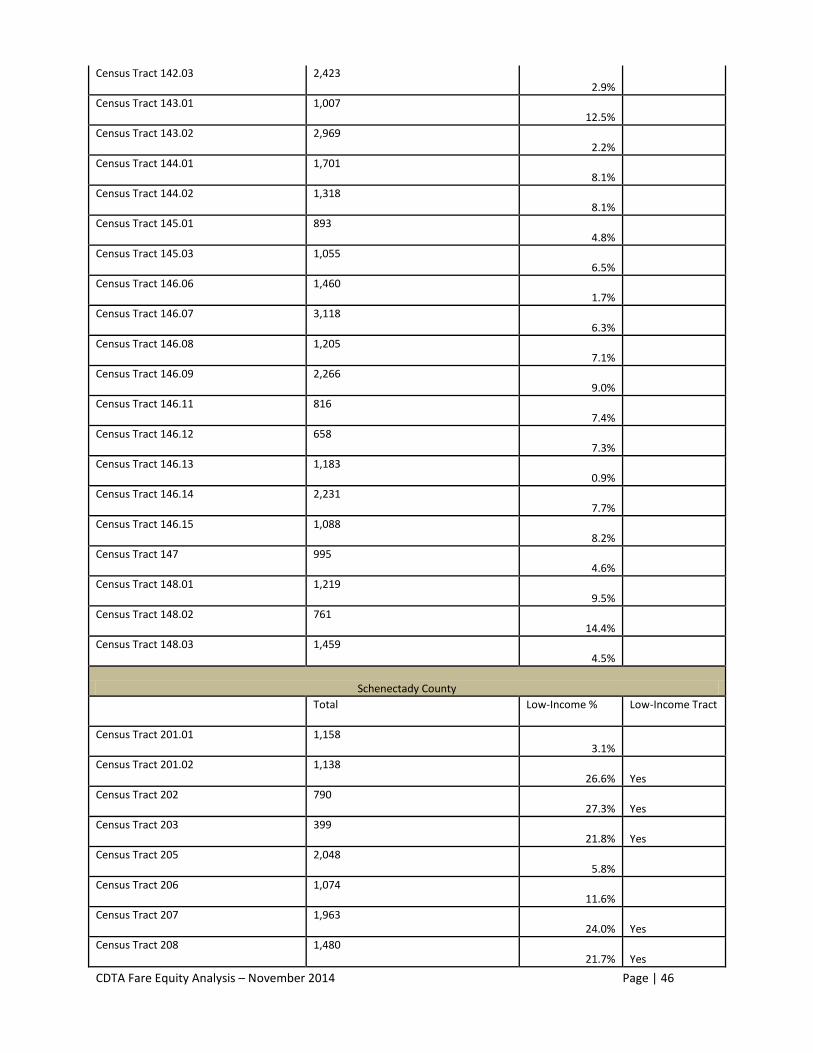
CDTA Fare Equity Analysis – November 2014 Page | 46
Census Tract 142.03 2,423 2.9%
Census Tract 143.01 1,007 12.5%
Census Tract 143.02 2,969 2.2%
Census Tract 144.01 1,701 8.1%
Census Tract 144.02 1,318 8.1%
Census Tract 145.01 893 4.8%
Census Tract 145.03 1,055 6.5%
Census Tract 146.06 1,460 1.7%
Census Tract 146.07 3,118 6.3%
Census Tract 146.08 1,205 7.1%
Census Tract 146.09 2,266 9.0%
Census Tract 146.11 816 7.4%
Census Tract 146.12 658 7.3%
Census Tract 146.13 1,183 0.9%
Census Tract 146.14 2,231 7.7%
Census Tract 146.15 1,088 8.2%
Census Tract 147 995 4.6%
Census Tract 148.01 1,219 9.5%
Census Tract 148.02 761 14.4%
Census Tract 148.03 1,459 4.5%
Schenectady County
Total Low-Income % Low-Income Tract
Census Tract 201.01 1,158 3.1%
Census Tract 201.02 1,138 26.6% Yes
Census Tract 202 790 27.3% Yes
Census Tract 203 399 21.8% Yes
Census Tract 205 2,048 5.8%
Census Tract 206 1,074 11.6%
Census Tract 207 1,963 24.0% Yes
Census Tract 208 1,480 21.7% Yes
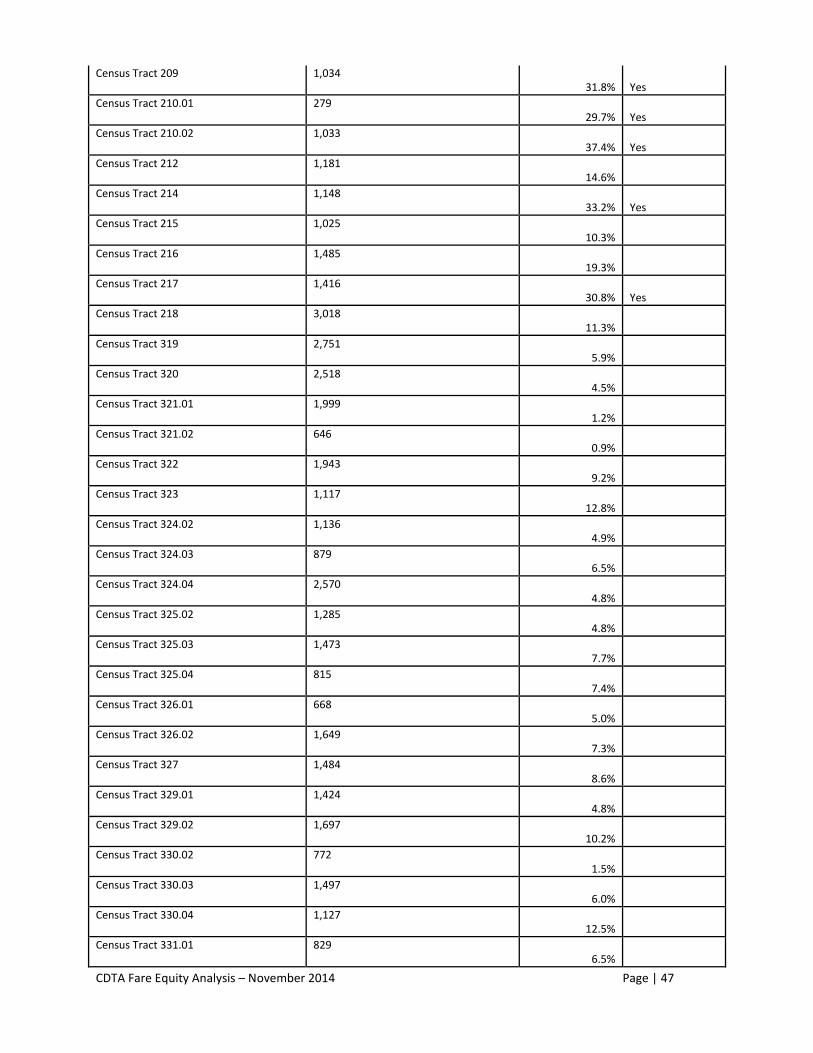
CDTA Fare Equity Analysis – November 2014 Page | 47
Census Tract 209 1,034 31.8% Yes
Census Tract 210.01 279 29.7% Yes
Census Tract 210.02 1,033 37.4% Yes
Census Tract 212 1,181 14.6%
Census Tract 214 1,148 33.2% Yes
Census Tract 215 1,025 10.3%
Census Tract 216 1,485 19.3%
Census Tract 217 1,416 30.8% Yes
Census Tract 218 3,018 11.3%
Census Tract 319 2,751 5.9%
Census Tract 320 2,518 4.5%
Census Tract 321.01 1,999 1.2%
Census Tract 321.02 646 0.9%
Census Tract 322 1,943 9.2%
Census Tract 323 1,117 12.8%
Census Tract 324.02 1,136 4.9%
Census Tract 324.03 879 6.5%
Census Tract 324.04 2,570 4.8%
Census Tract 325.02 1,285 4.8%
Census Tract 325.03 1,473 7.7%
Census Tract 325.04 815 7.4%
Census Tract 326.01 668 5.0%
Census Tract 326.02 1,649 7.3%
Census Tract 327 1,484 8.6%
Census Tract 329.01 1,424 4.8%
Census Tract 329.02 1,697 10.2%
Census Tract 330.02 772 1.5%
Census Tract 330.03 1,497 6.0%
Census Tract 330.04 1,127 12.5%
Census Tract 331.01 829 6.5%
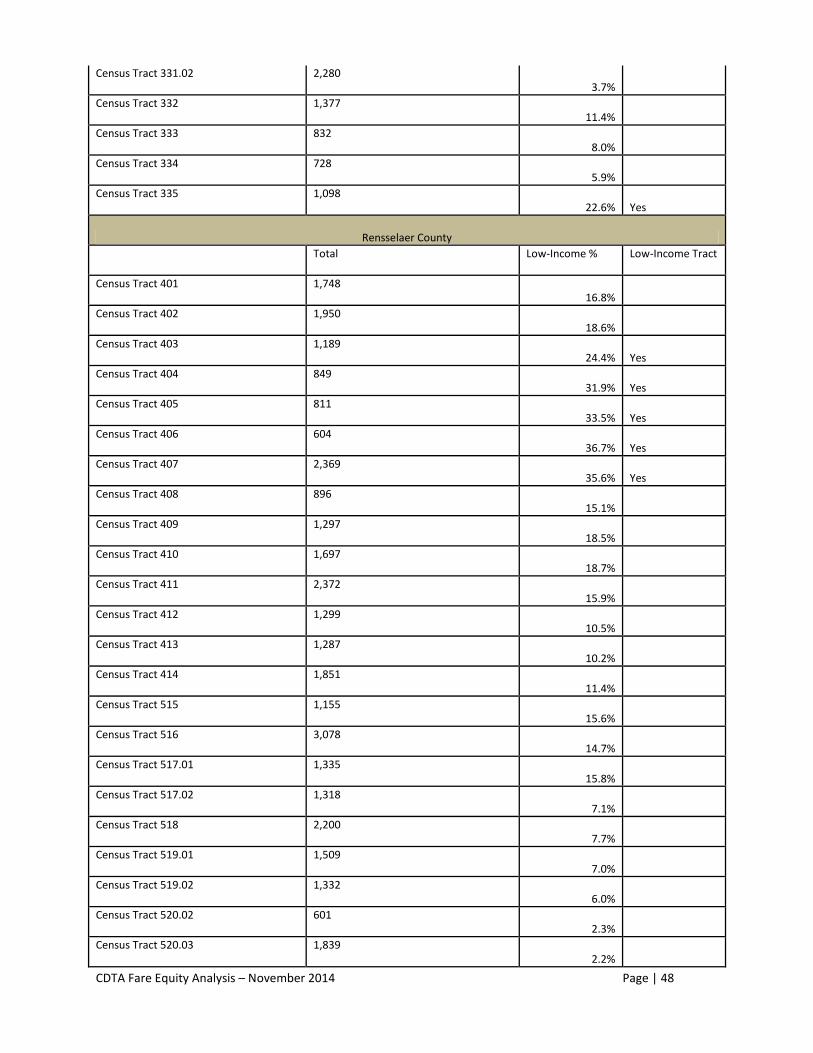
CDTA Fare Equity Analysis – November 2014 Page | 48
Census Tract 331.02 2,280 3.7%
Census Tract 332 1,377 11.4%
Census Tract 333 832 8.0%
Census Tract 334 728 5.9%
Census Tract 335 1,098 22.6% Yes
Rensselaer County
Total Low-Income % Low-Income Tract
Census Tract 401 1,748 16.8%
Census Tract 402 1,950 18.6%
Census Tract 403 1,189 24.4% Yes
Census Tract 404 849 31.9% Yes
Census Tract 405 811 33.5% Yes
Census Tract 406 604 36.7% Yes
Census Tract 407 2,369 35.6% Yes
Census Tract 408 896 15.1%
Census Tract 409 1,297 18.5%
Census Tract 410 1,697 18.7%
Census Tract 411 2,372 15.9%
Census Tract 412 1,299 10.5%
Census Tract 413 1,287 10.2%
Census Tract 414 1,851 11.4%
Census Tract 515 1,155 15.6%
Census Tract 516 3,078 14.7%
Census Tract 517.01 1,335 15.8%
Census Tract 517.02 1,318 7.1%
Census Tract 518 2,200 7.7%
Census Tract 519.01 1,509 7.0%
Census Tract 519.02 1,332 6.0%
Census Tract 520.02 601 2.3%
Census Tract 520.03 1,839 2.2%
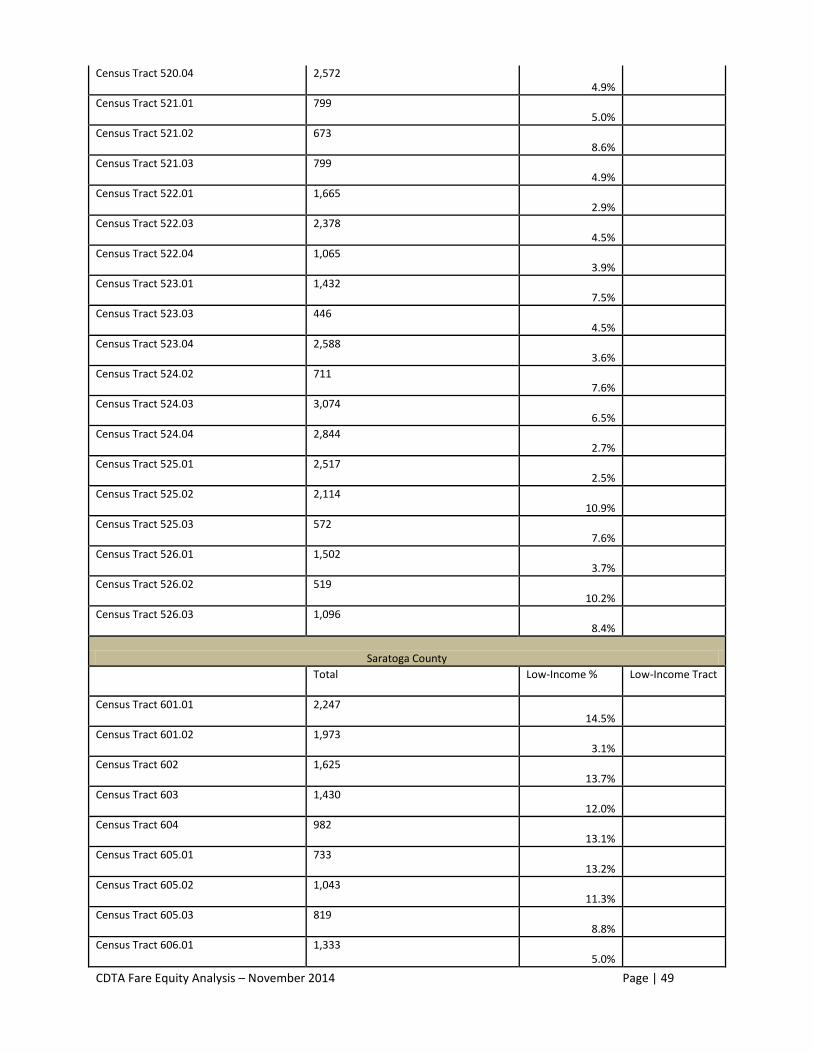
CDTA Fare Equity Analysis – November 2014 Page | 49
Census Tract 520.04 2,572 4.9%
Census Tract 521.01 799 5.0%
Census Tract 521.02 673 8.6%
Census Tract 521.03 799 4.9%
Census Tract 522.01 1,665 2.9%
Census Tract 522.03 2,378 4.5%
Census Tract 522.04 1,065 3.9%
Census Tract 523.01 1,432 7.5%
Census Tract 523.03 446 4.5%
Census Tract 523.04 2,588 3.6%
Census Tract 524.02 711 7.6%
Census Tract 524.03 3,074 6.5%
Census Tract 524.04 2,844 2.7%
Census Tract 525.01 2,517 2.5%
Census Tract 525.02 2,114 10.9%
Census Tract 525.03 572 7.6%
Census Tract 526.01 1,502 3.7%
Census Tract 526.02 519 10.2%
Census Tract 526.03 1,096 8.4%
Saratoga County
Total Low-Income % Low-Income Tract
Census Tract 601.01 2,247 14.5%
Census Tract 601.02 1,973 3.1%
Census Tract 602 1,625 13.7%
Census Tract 603 1,430 12.0%
Census Tract 604 982 13.1%
Census Tract 605.01 733 13.2%
Census Tract 605.02 1,043 11.3%
Census Tract 605.03 819 8.8%
Census Tract 606.01 1,333 5.0%
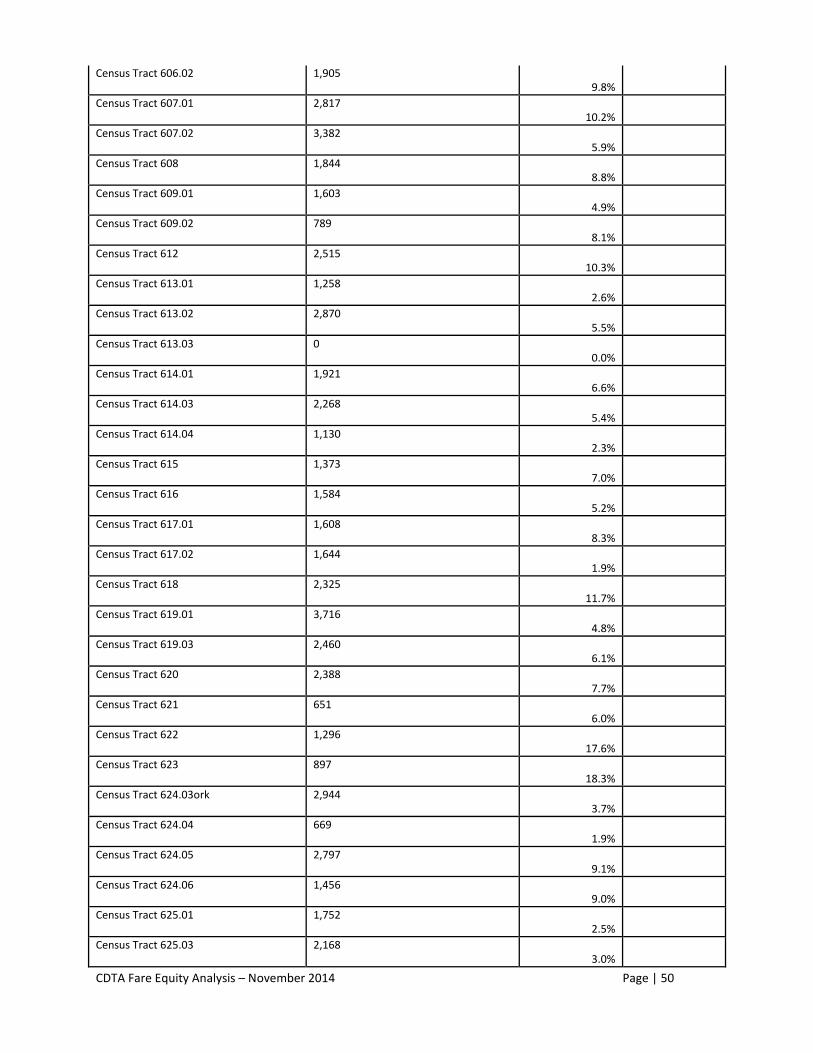
CDTA Fare Equity Analysis – November 2014 Page | 50
Census Tract 606.02 1,905 9.8%
Census Tract 607.01 2,817 10.2%
Census Tract 607.02 3,382 5.9%
Census Tract 608 1,844 8.8%
Census Tract 609.01 1,603 4.9%
Census Tract 609.02 789 8.1%
Census Tract 612 2,515 10.3%
Census Tract 613.01 1,258 2.6%
Census Tract 613.02 2,870 5.5%
Census Tract 613.03 0 0.0%
Census Tract 614.01 1,921 6.6%
Census Tract 614.03 2,268 5.4%
Census Tract 614.04 1,130 2.3%
Census Tract 615 1,373 7.0%
Census Tract 616 1,584 5.2%
Census Tract 617.01 1,608 8.3%
Census Tract 617.02 1,644 1.9%
Census Tract 618 2,325 11.7%
Census Tract 619.01 3,716 4.8%
Census Tract 619.03 2,460 6.1%
Census Tract 620 2,388 7.7%
Census Tract 621 651 6.0%
Census Tract 622 1,296 17.6%
Census Tract 623 897 18.3%
Census Tract 624.03ork 2,944 3.7%
Census Tract 624.04 669 1.9%
Census Tract 624.05 2,797 9.1%
Census Tract 624.06 1,456 9.0%
Census Tract 625.01 1,752 2.5%
Census Tract 625.03 2,168 3.0%
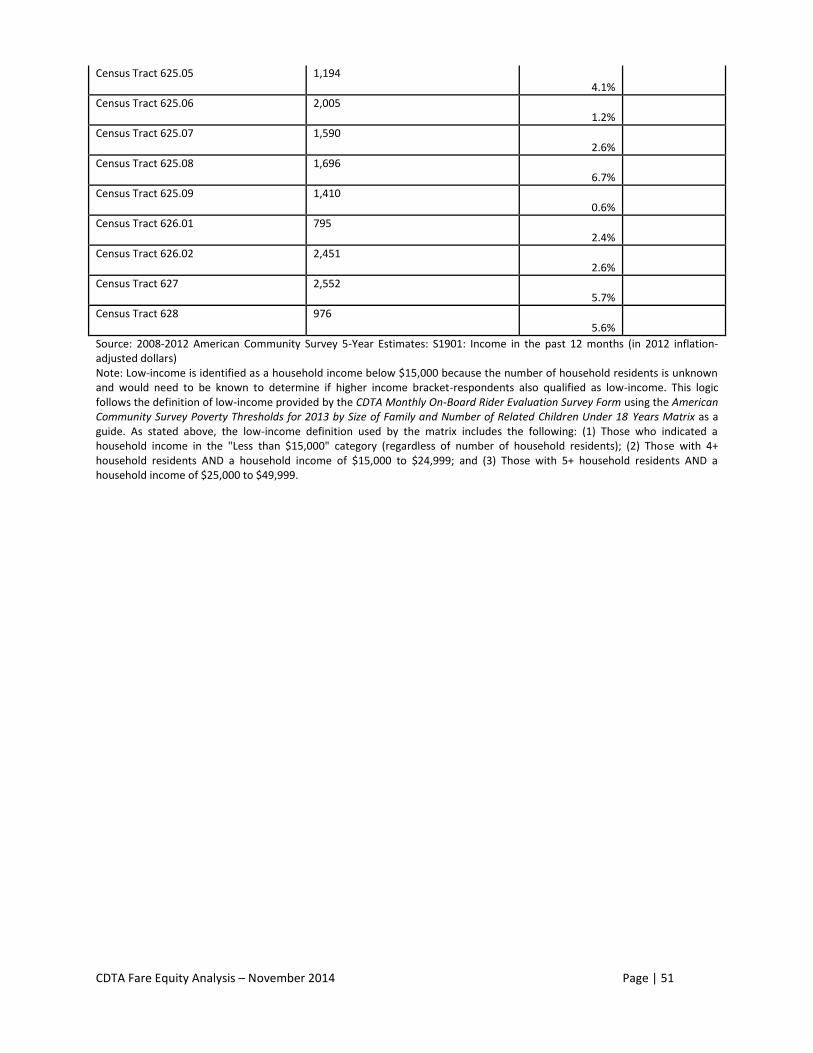
CDTA Fare Equity Analysis – November 2014 Page | 51
Census Tract 625.05 1,194 4.1%
Census Tract 625.06 2,005 1.2%
Census Tract 625.07 1,590 2.6%
Census Tract 625.08 1,696 6.7%
Census Tract 625.09 1,410 0.6%
Census Tract 626.01 795 2.4%
Census Tract 626.02 2,451 2.6%
Census Tract 627 2,552 5.7%
Census Tract 628 976 5.6%
Source: 2008-2012 American Community Survey 5-Year Estimates: S1901: Income in the past 12 months (in 2012 inflation-adjusted dollars) Note: Low-income is identified as a household income below $15,000 because the number of household residents is unknown and would need to be known to determine if higher income bracket-respondents also qualified as low-income. This logic follows the definition of low-income provided by the CDTA Monthly On-Board Rider Evaluation Survey Form using the American Community Survey Poverty Thresholds for 2013 by Size of Family and Number of Related Children Under 18 Years Matrix as a guide. As stated above, the low-income definition used by the matrix includes the following: (1) Those who indicated a household income in the "Less than $15,000" category (regardless of number of household residents); (2) Those with 4+ household residents AND a household income of $15,000 to $24,999; and (3) Those with 5+ household residents AND a household income of $25,000 to $49,999.
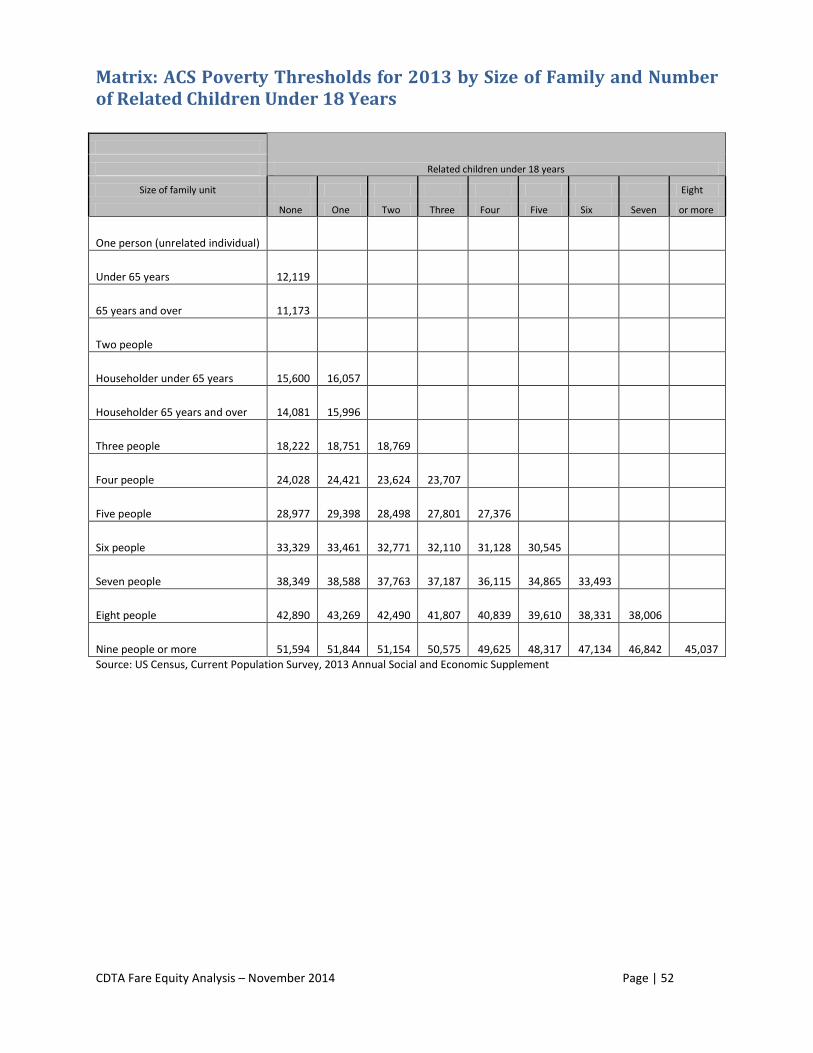
CDTA Fare Equity Analysis – November 2014 Page | 52
Matrix: ACS Poverty Thresholds for 2013 by Size of Family and Number of Related Children Under 18 Years
Related children under 18 years
Size of family unit Eight
None One Two Three Four Five Six Seven or more
One person (unrelated individual)
Under 65 years 12,119
65 years and over 11,173
Two people
Householder under 65 years 15,600 16,057
Householder 65 years and over 14,081 15,996
Three people 18,222 18,751 18,769
Four people 24,028 24,421 23,624 23,707
Five people 28,977 29,398 28,498 27,801 27,376
Six people 33,329 33,461 32,771 32,110 31,128 30,545
Seven people 38,349 38,588 37,763 37,187 36,115 34,865 33,493
Eight people 42,890 43,269 42,490 41,807 40,839 39,610 38,331 38,006
Nine people or more 51,594 51,844 51,154 50,575 49,625 48,317 47,134 46,842 45,037
Source: US Census, Current Population Survey, 2013 Annual Social and Economic Supplement
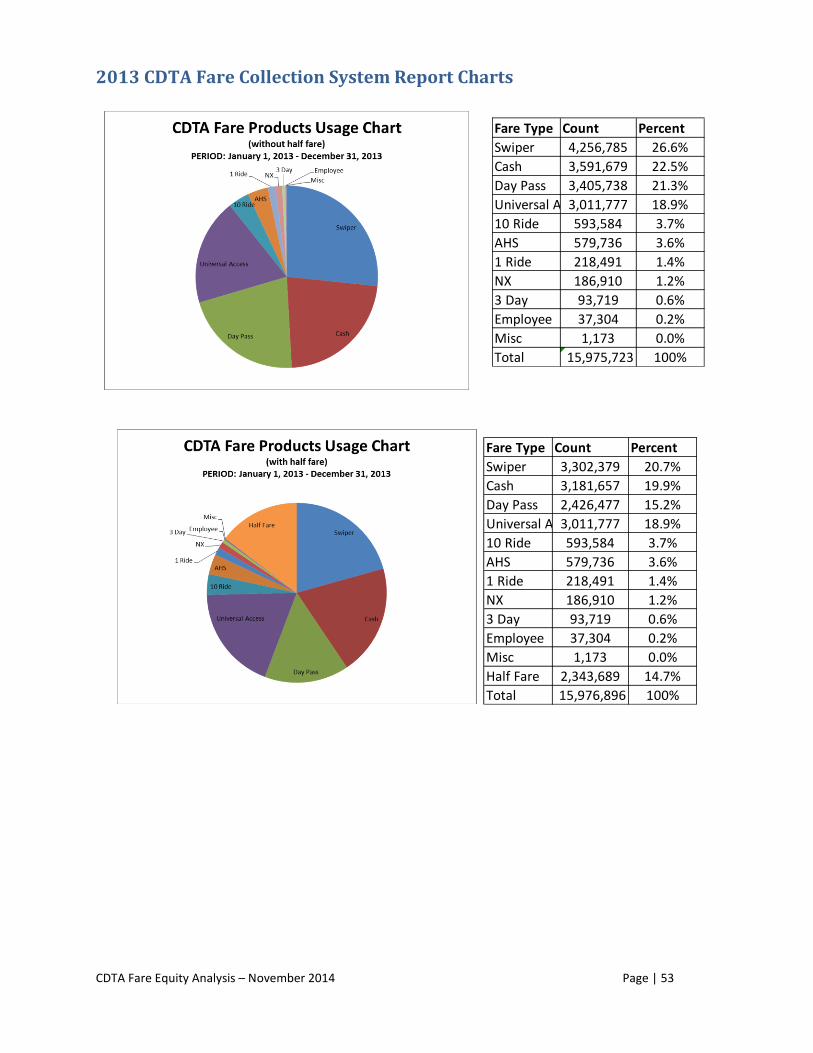
CDTA Fare Equity Analysis – November 2014 Page | 53
2013 CDTA Fare Collection System Report Charts
Fare Type Count Percent
Swiper 3,302,379 20.7%
Cash 3,181,657 19.9%
Day Pass 2,426,477 15.2%
Universal Access3,011,777 18.9%
10 Ride 593,584 3.7%
AHS 579,736 3.6%
1 Ride 218,491 1.4%
NX 186,910 1.2%
3 Day 93,719 0.6%
Employee 37,304 0.2%
Misc 1,173 0.0%
Half Fare 2,343,689 14.7%
Total 15,976,896 100%
Fare Type Count Percent
Swiper 4,256,785 26.6%
Cash 3,591,679 22.5%
Day Pass 3,405,738 21.3%
Universal Access3,011,777 18.9%
10 Ride 593,584 3.7%
AHS 579,736 3.6%
1 Ride 218,491 1.4%
NX 186,910 1.2%
3 Day 93,719 0.6%
Employee 37,304 0.2%
Misc 1,173 0.0%
Total 15,975,723 100%

CDTA Fare Equity Analysis – November 2014 Page | 54
Appendix B – Public Outreach Materials
CDTA Fare Equity Analysis – November 2014 Page | 55
Public Participation Plan (PPP) Goals and Objectives CDTA's Public Participation Plan is designed to disseminate information and to solicit and respond to public comment on the development of programs and projects. The plan provides proactive and continuing public participation for projects, programs, and decision-making to ensure programs reflect community values and benefit all segments of the community equally. Our plan fulfills federal obligations that say grant recipients are required to comply with the public participation requirements of 49 USC Section 5307(b) – requires programs of projects to be developed with public participation and 5307(c)(1)(I) – requires a locally developed process to consider public comment before raising a fare or carrying out a major reduction in transportation service. It also fulfills CDTA's state obligation under the NYS Public Authorities Law, which requires a public hearing for establishing or changing (increase or decrease) fares, tolls, rentals, rates, charges or other fees for the transportation of passengers. CDTA's Public Participation Plan: • Provides opportunities for public comment as required by law. • Provides opportunities for public and stakeholder input during planning of projects. • Provides opportunities for the inclusion of minority, low-income, and LEP populations through public workshops and information meetings. Public Participation as Required by Law FTA Program-of-Projects Requirements and Section 5307 Grant Program While a Federal Transit Administration grant applicant may choose to maintain a separate approach for complying with the public participation requirements of 49 U.S.C. Section 5307(c)(1) through (c)(7) concerning the applicant's proposed Section 5307 grant program, the grant applicant is encouraged to integrate compliance with these requirements with the locally adopted public involvement process associated with the TIP. Grantees that choose to integrate the two should coordinate with the MPO and ensure that the public is aware that the TIP development process is being used to satisfy the public hearing requirements of Section 5307(c). The grant applicant must explicitly state that public notice of public involvement activities and time established for public review and comment on the TIP will satisfy the program-of-projects requirements of the Urbanized Area Formula Program. A project that requires an environmental assessment or an environmental impact statement will involve additional public involvement, as presented in joint FHWA/FTA environmental regulations, "Environmental Impact and Related Procedures," 23 C.F.R. Part 771.
CDTA Fare Equity Analysis – November 2014 Page | 56
CDTA works directly with the MPO, the Capital District Transportation Committee, to develop the TIP. The public involvement activities and the time established for public review and comment on the TIP satisfies the program-of-projects requirements of the Urbanized Area Formula Program. Americans with Disabilities Act (ADA) The Americans with Disabilities Act (ADA) of 1990 encourages the involvement of people with disabilities in the development and improvement of transportation and paratransit services. In accordance with ADA guidelines, all meetings conducted by CDTA take place in locations that are accessible to persons with mobility limitations. When necessary to ensure effective communication, auxiliary aids and services are furnished to allow a person with a disability to participate, unless an undue burden or fundamental alteration would result. “Auxiliary aids” include such services or devices as qualified interpreters, assistive listening headsets, television captioning and decoders, telecommunication devices for deaf persons (TDDs), videotext displays, readers taped text, brailed materials, and larger print materials. CDTA public meeting notices specify that special accommodations will be provided upon request. Service Restructuring / Fare Changes CDTA undertakes a comprehensive and inclusive public participation and outreach process for major service or fare changes. During the public outreach period, CDTA posts information and accepts comments regarding the proposed changes in person (written or verbal), on its website and via the USPS mail. Prior to hosting formal public hearings on the proposed change, CDTA will hold multiple public information meetings in affected communities, hold stakeholder group meetings, and will present changes to elected government officials. CDTA will consider the population likely to be affected and the resources available to determine how best to enhance participation by affected minority, low-income, and/or LEP persons. The purpose of these efforts is to include minority, low-income, and LEP populations in the planning stages. Policy for the Soliciting of Public Comment CDTA policy is to disseminate information and to solicit and respond to public comment on transit service and fare changes to the extent reasonable and practical. Except when impossible because of an emergency condition, advance notice of not less than two weeks will be given to the affected public of minor route and schedule changes. Methods of providing such notice include but are not limited to: distribution of revised timetables, handouts, posted notices and/or media releases. In addition, one month's advance notice of any permanent route change will be provided to the elected officials representing any affected local government entity. Fare changes or major service changes are submitted to the CDTA Board of Directors upon an initial round of public discussion.
CDTA Fare Equity Analysis – November 2014 Page | 57
If a major service change involves a reduction in service, or a change in fares is proposed, the CDTA Board of Directors will authorize formal solicitation of public commentary. A notice of the proposed change(s) will be published in newspapers of general circulation and, if applicable, in newspapers oriented to the specific groups or communities affected and in buses. Such published notices will include the date, time and location of any public hearings. Not sooner than thirty days after the notices are published and posted at least one public hearing shall be held. Special promotional fares are not included in the requirements of this section. CDTA will translate materials into, and provide translation services for, the language of any LEP language group as specified in the Language Assistance Plan. A report of all public comments received and any responses will be provided to the Board of Directors. Recommended changes in the proposal as a result of public comment may also be presented. Following completion of this process, the Board of Directors may authorize the implementation of the changes or may direct other action. Final public notice of major changes in service or any changes in the fare structure will be given via the methods stated above. Ongoing Public Participation Opportunities CDTA utilizes a variety of media and methods to provide interested individuals, groups, and organizations with timely information about transportation issues. • CDTA website o The CDTA website (cdta.org) provides basic information about CDTA, including the most up to date information regarding fares, schedules, events, programs and news. All public workshops, information meetings and hearings are advertised on the CDTA website. The website is also used as a medium in which riders and the public can provide comments during a study. • Social Media o CDTA uses social media to interact with individuals, groups, businesses and strategic partners to improve customer satisfaction. Social media is used as a direct method of public participation not to mention information sharing and gathering. We have dialogue on individual sites and drive more detailed analysis to our Customer Service Center. • CDTA Public Meetings, Workshops, Information Meetings, and Public Hearings o Examples include: public hearings before fare changes and major service changes; workshops and information meetings held prior to formal public hearings on the above topics. The meetings are held at multiple locations within the affected municipality to ensure all stakeholders have the opportunity to comment. • Rider Alerts, Newspaper Advertisements, News Releases o To solicit participation, these media are used to advertise changes in fares and service, as well as the meetings and hearings associated with such changes. These mediums are also used to advertise and dissemination information about CDTA that at times may be strictly informational only and may not require public participation.
CDTA Fare Equity Analysis – November 2014 Page | 58
Monitoring and Evaluation CDTA continuously monitors, evaluates and improves its public participation process. Regular review is completed through the methods below: • Tracking website usage and activity including how users arrive at the CDTA website and which pages are most visited along with other statistics. • Tracking the number of individuals on CDTA contact lists that receive newsletters, meeting notices and agendas, and other related materials. • Strongly encouraging people to provide comments and suggestions to the CDTA through various customer-facing channels. • Discussions with community advocacy groups. CDTA is actively involved in
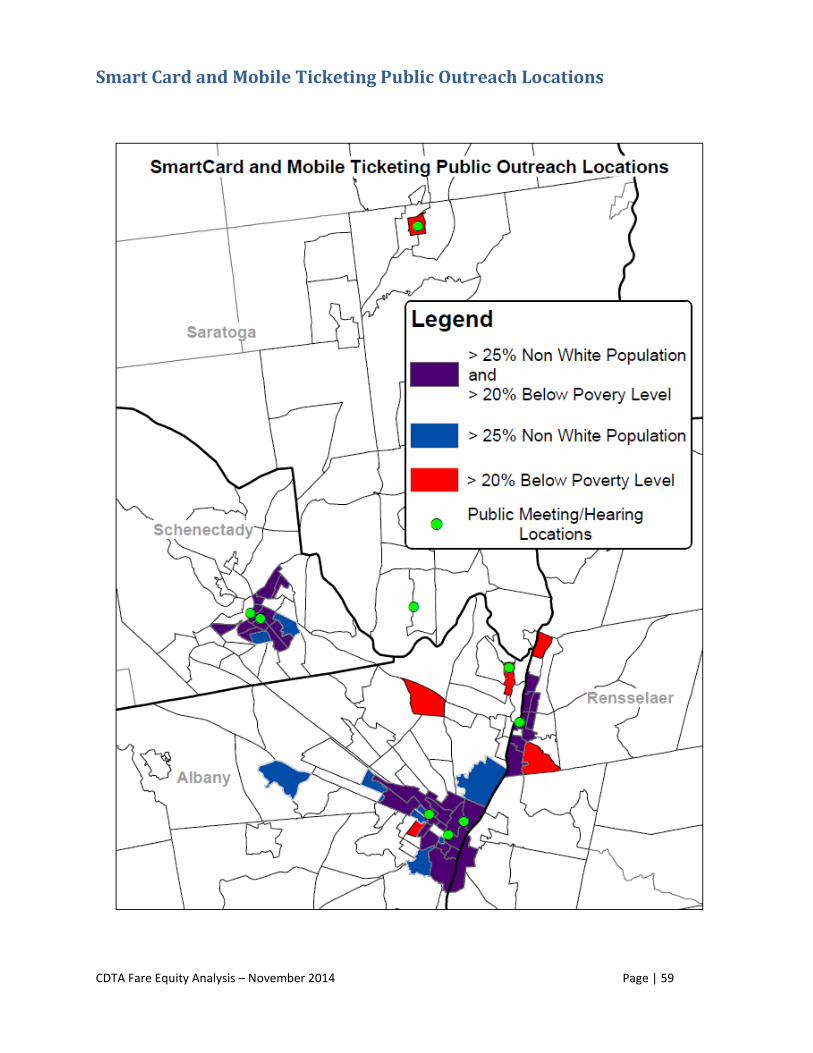
CDTA Fare Equity Analysis – November 2014 Page | 59
Smart Card and Mobile Ticketing Public Outreach Locations
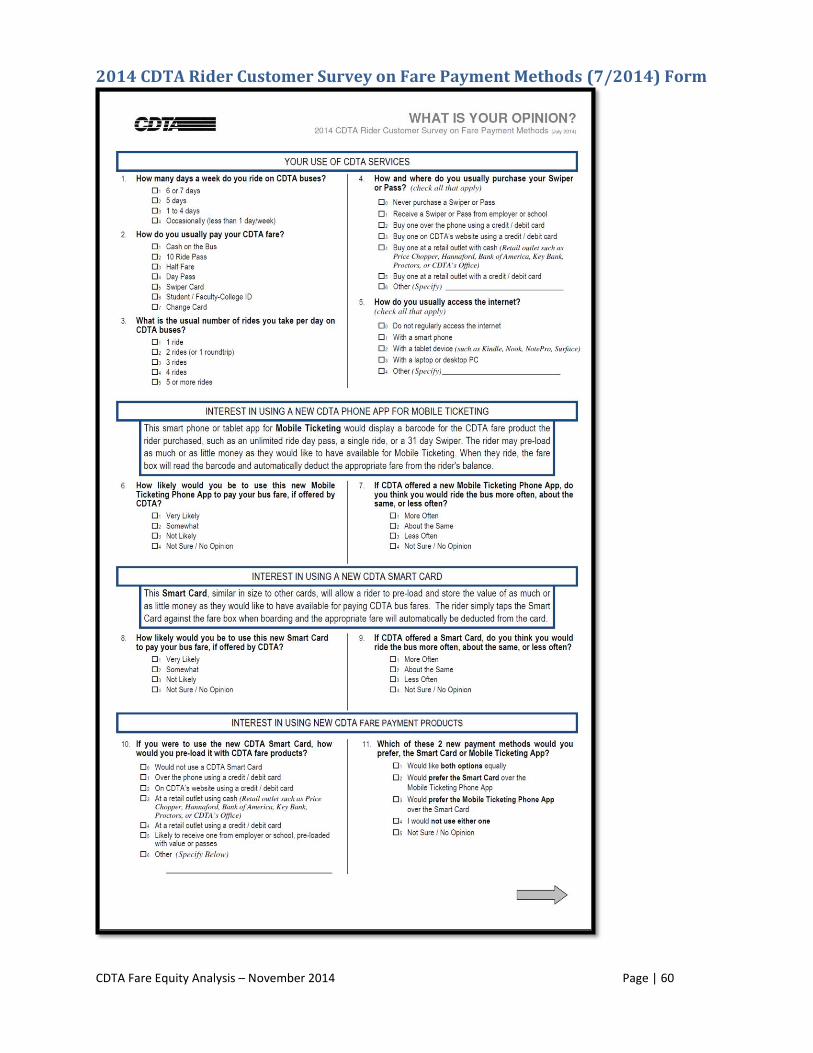
CDTA Fare Equity Analysis – November 2014 Page | 60
2014 CDTA Rider Customer Survey on Fare Payment Methods (7/2014) Form
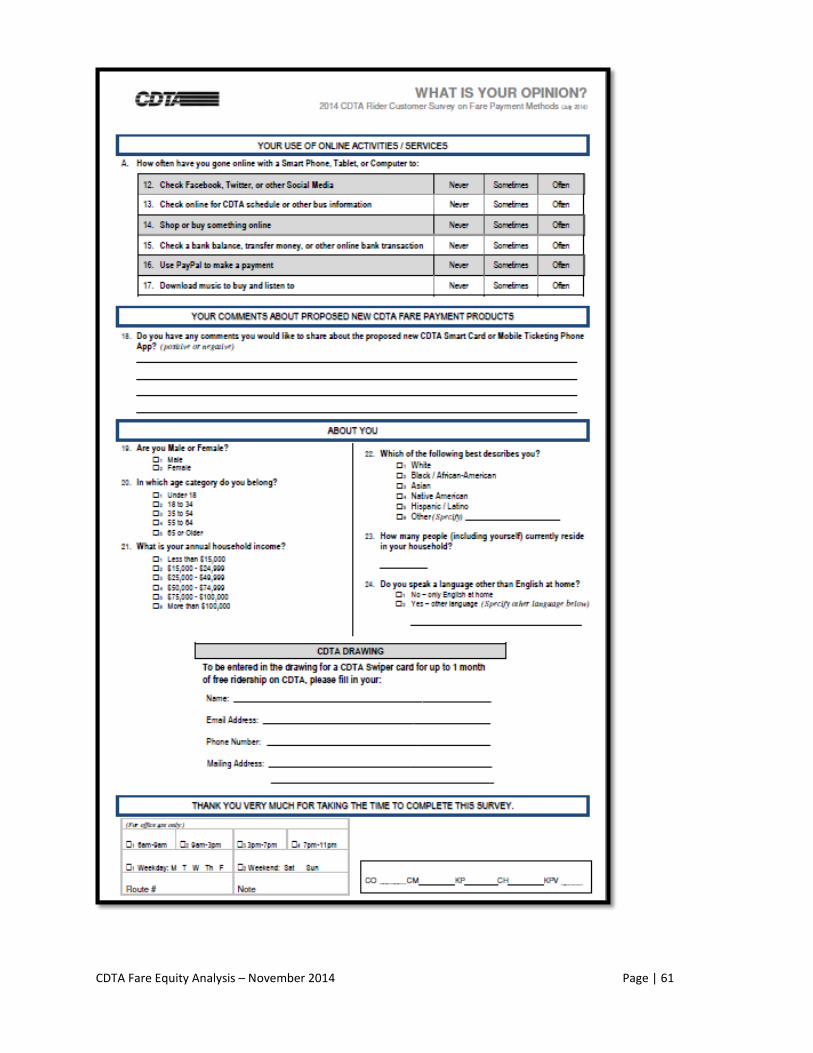
CDTA Fare Equity Analysis – November 2014 Page | 61
CDTA Fare Equity Analysis – November 2014 Page | 62
2014 CDTA Customer Survey on Fare Payment Methods - Response Summary
Research Overview
This 2014 survey of CDTA Fare Change / Title VI has been designed and conducted by Fact Finders, Inc. to help CDTA understand rider receptivity to and perceived barriers to 2 new fare collection methods CDTA is working on implementing: a Smart Card and Mobile Ticketing via an app on a rider’s smart phone. Fact Finders worked in conjunction with CDTA to design the questionnaire to efficiently measure and assess riders' attitudes for evaluation and planning purposes. The research was designed to include a total of N=500 intercept interviews across a range of routes, stratified as a "Target" sample and a "Control" group. The Target sample focused on selected routes in each operational division (using routes 80, 289, 353, 355, 100, 6, 7 and 1). The remaining CDTA routes were used for the Control group. Interviews were conducted between June 30 and August 14, 2014.
Descriptions of the New CDTA Bus Fare Payment Options
New CDTA Phone App for Mobile Ticketing: This smart phone or tablet app for Mobile Ticketing would display a barcode for the CDTA fare product the rider purchased, such as an unlimited ride day pass, a single ride, or a 31 day Swiper. The rider may pre-load as much or as little money as they would like to have available for Mobile Ticketing. When they ride, the fare box will read the barcode and automatically deduct the appropriate fare from the rider's balance.
New CDTA Smart Card: This Smart Card, similar in size to other cards, will allow a rider to pre-load and store the value of as much or as little money as they would like to have available for paying CDTA bus fares. The rider simply taps the Smart Card against the fare box when boarding and the appropriate fare will automatically be deducted from the card.
Top 3 Insights
CDTA riders are very receptive to both the Smart Card and Mobile Ticketing App bus fare payment options tested, with most saying they are likely to use if offered by CDTA. Overall, riders are slightly more interested in the Smart Card relative to the Mobile Ticketing App. Although Target and Control route riders are very similar in most ways (i.e., characteristics and online and ridership behaviors), Target route riders say they are very likely to use a Smart Card in a slightly higher proportion than riders from the Control routes.
Riders say they are likely to use the 2 new bus fare payment options regardless of most demographic characteristics, however those identifying themselves as "minority" are slightly more likely to use and anticipate they would ride more often if the Smart Card is offered by CDTA. Analytically, being from a "low income household" does not differentiate likelihood of use for either payment option, however slightly more “low income” riders anticipate riding CDTA buses more often, relative to “not low income” riders, if the Smart Card is offered by CDTA.
Most riders (61%) access the internet via their smart phone. Riders have a great deal of online behavior: 80% check social media or bus information at least "sometimes" and half say they do so "often". Seven in 10 download music, shop, and/or bank online.
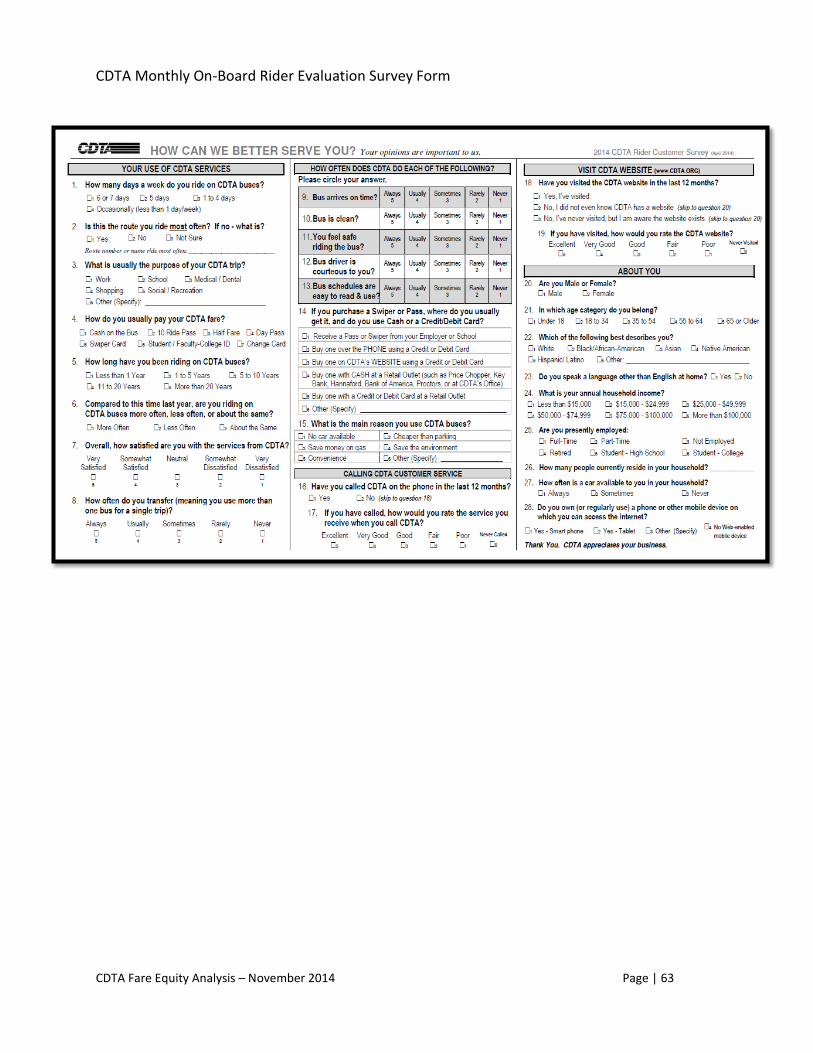
CDTA Fare Equity Analysis – November 2014 Page | 63
CDTA Monthly On-Board Rider Evaluation Survey Form
CDTA Fare Equity Analysis – November 2014 Page | 64
Demographic Ridership Profile from CDTA Monthly On-Board Rider Evaluation Survey Form
EXECUTIVE SUMMARY
OVERVIEW OF THE RESEARCH Presented in this summary report are findings from 24 months of the Monthly On-Board Rider Evaluation (MORE) Research Program (June 2012 – May 2014). Each month Fact Finders professional interviewers conduct on-board interviews with approximately 100 randomly selected riders across CDTA’s regular routes. The number of interviews conducted on each CDTA route are proportionate to that route’s total ridership relative to all riders on regular routes in the CDTA system. During the 24 months included in this report, a total of 2525 riders were interviewed. The questionnaire employed in surveying riders comprises 30 independent measurements and averaged 4-5 minutes to complete. From this survey, a set of core metrics are tracked and reported each month to CDTA. Following are some of the key findings from this survey.
OVERALL SATISFACTION WITH CDTA SERVICES Overall satisfaction with the services provided by CDTA to its riders remains consistently high with four in 10 (44%) riders reporting they are “very satisfied” (top box rating category). Overall satisfaction has not changed significantly over the 24 months of interviewing, however there is slight variation by route. A graph (page 5) shows rider satisfaction by those routes where the sub-sample size was 25 respondents or greater. Although, the variation in satisfaction is interesting to view, the mean score differences of satisfaction by route, are not statistically significant.
CORE SERVICE FACTORS OF CDTA SERVICE Five core service factors are tracked in this research, including specific ratings on key aspects of service provided to riders by CDTA. Highest ratings by riders are given for: Bus Safety (rating average is 4.4 out of 5, and 54% top box rating); Ease of Use of Bus Schedules (rating average 4.3 out of 5, and 51% top box rating); and Bus Driver Courtesy (rating average 4.3 out of 5 and 50% top box rating). Slightly lower ratings by riders are given for: Bus Cleanliness (rating average 4.1 out of 5, and 31% top box rating); and Bus Timeliness (bus arrives on time) (rating average 3.9 out of 5, and 20% top box rating).
CDTA COMMUNICATIONS Call Center. Half (47%) of CDTA regular route riders report having called CDTA in the last 12 months. Among riders who called, they rated the service they received, on average, as 3.8 out of 5, with nearly two-thirds (65%) giving a positive rating ("Excellent" or "Very Good") and one-third (31%) using the top box rating category of "Excellent". One in 10 riders who have called CDTA (11%) rate the service they received negatively (“Fair” or “Poor”). Website. Nearly 9 in 10 (87%) riders are aware of CDTA's website and 6 in 10 (62%) have visited. These riders rate the CDTA website, on average, as 3.9 out of 5, with nearly 7 in 10 (68%) giving a positive rating ("Excellent" or "Very Good") and 28% using the top box rating category of "Excellent".
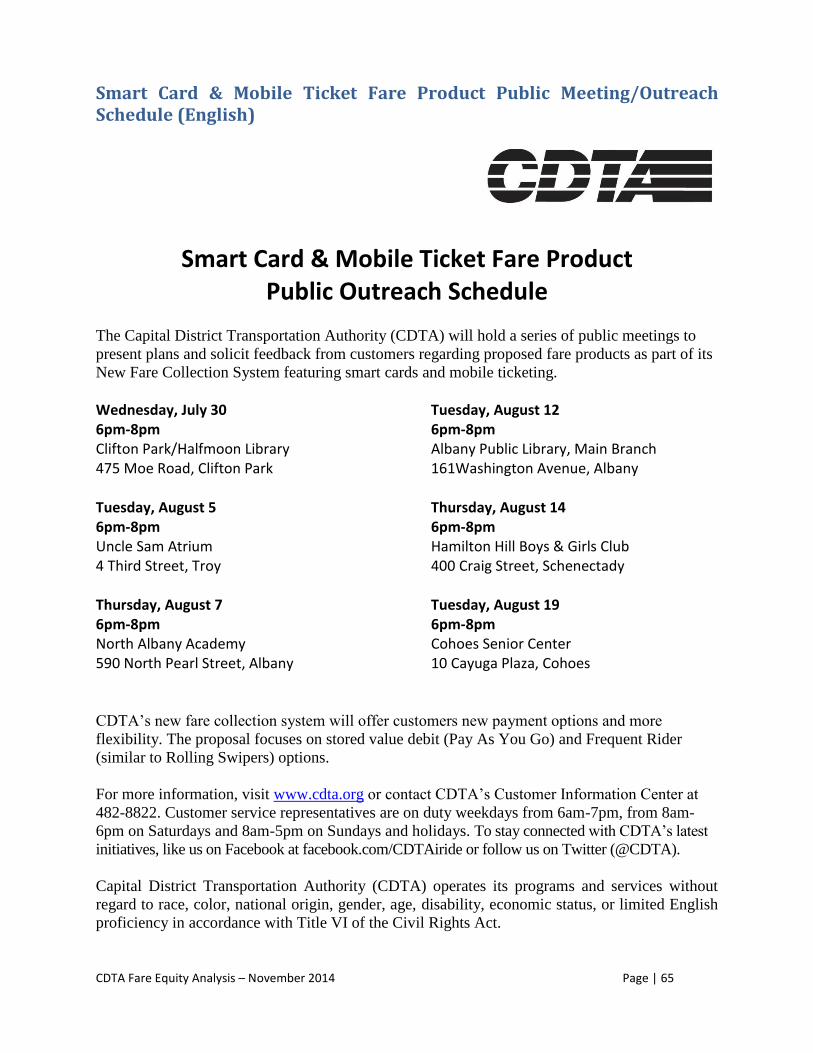
CDTA Fare Equity Analysis – November 2014 Page | 65
Smart Card & Mobile Ticket Fare Product Public Meeting/Outreach Schedule (English)
Smart Card & Mobile Ticket Fare Product Public Outreach Schedule
The Capital District Transportation Authority (CDTA) will hold a series of public meetings to
present plans and solicit feedback from customers regarding proposed fare products as part of its
New Fare Collection System featuring smart cards and mobile ticketing.
Wednesday, July 30 6pm-8pm Clifton Park/Halfmoon Library 475 Moe Road, Clifton Park Tuesday, August 5 6pm-8pm Uncle Sam Atrium 4 Third Street, Troy Thursday, August 7 6pm-8pm North Albany Academy 590 North Pearl Street, Albany
Tuesday, August 12 6pm-8pm Albany Public Library, Main Branch 161Washington Avenue, Albany Thursday, August 14
6pm-8pm Hamilton Hill Boys & Girls Club 400 Craig Street, Schenectady Tuesday, August 19
6pm-8pm Cohoes Senior Center 10 Cayuga Plaza, Cohoes
CDTA’s new fare collection system will offer customers new payment options and more
flexibility. The proposal focuses on stored value debit (Pay As You Go) and Frequent Rider
(similar to Rolling Swipers) options.
For more information, visit www.cdta.org or contact CDTA’s Customer Information Center at
482-8822. Customer service representatives are on duty weekdays from 6am-7pm, from 8am-
6pm on Saturdays and 8am-5pm on Sundays and holidays. To stay connected with CDTA’s latest
initiatives, like us on Facebook at facebook.com/CDTAiride or follow us on Twitter (@CDTA).
Capital District Transportation Authority (CDTA) operates its programs and services without
regard to race, color, national origin, gender, age, disability, economic status, or limited English
proficiency in accordance with Title VI of the Civil Rights Act.
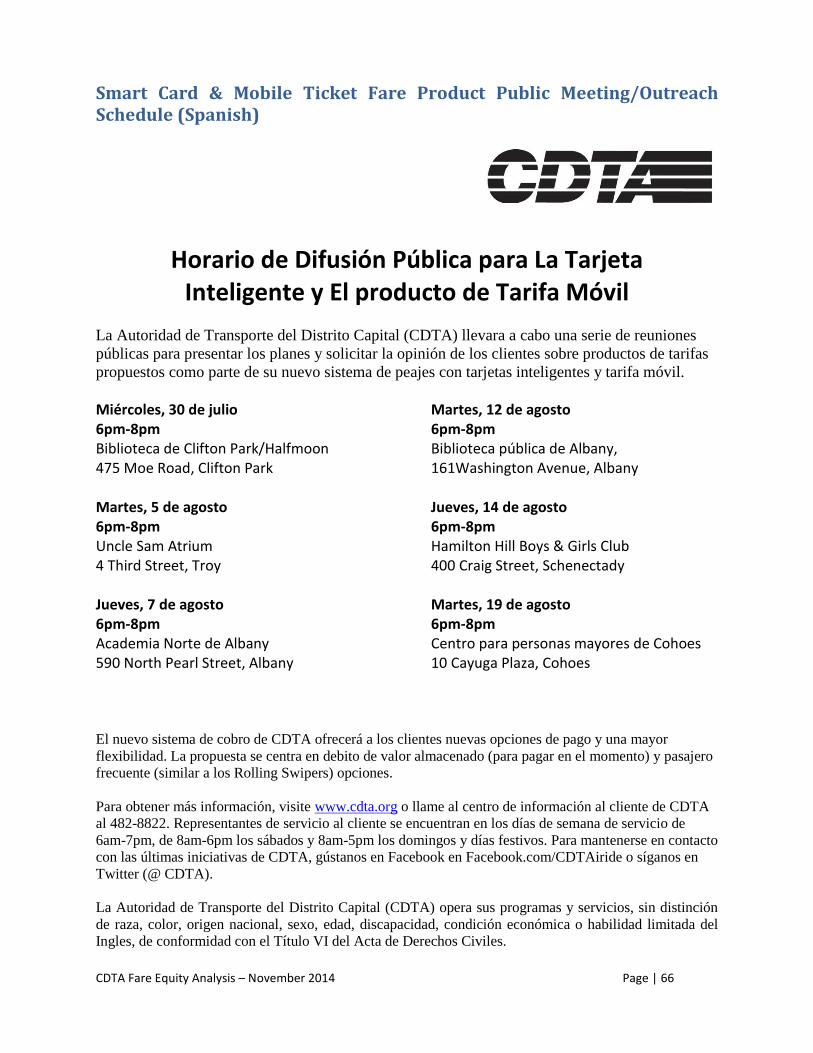
CDTA Fare Equity Analysis – November 2014 Page | 66
Smart Card & Mobile Ticket Fare Product Public Meeting/Outreach Schedule (Spanish)
Horario de Difusión Pública para La Tarjeta Inteligente y El producto de Tarifa Móvil
La Autoridad de Transporte del Distrito Capital (CDTA) llevara a cabo una serie de reuniones
públicas para presentar los planes y solicitar la opinión de los clientes sobre productos de tarifas
propuestos como parte de su nuevo sistema de peajes con tarjetas inteligentes y tarifa móvil.
Miércoles, 30 de julio 6pm-8pm Biblioteca de Clifton Park/Halfmoon 475 Moe Road, Clifton Park Martes, 5 de agosto 6pm-8pm Uncle Sam Atrium 4 Third Street, Troy Jueves, 7 de agosto 6pm-8pm Academia Norte de Albany 590 North Pearl Street, Albany
Martes, 12 de agosto 6pm-8pm Biblioteca pública de Albany, 161Washington Avenue, Albany Jueves, 14 de agosto
6pm-8pm Hamilton Hill Boys & Girls Club 400 Craig Street, Schenectady Martes, 19 de agosto
6pm-8pm Centro para personas mayores de Cohoes 10 Cayuga Plaza, Cohoes
El nuevo sistema de cobro de CDTA ofrecerá a los clientes nuevas opciones de pago y una mayor
flexibilidad. La propuesta se centra en debito de valor almacenado (para pagar en el momento) y pasajero
frecuente (similar a los Rolling Swipers) opciones.
Para obtener más información, visite www.cdta.org o llame al centro de información al cliente de CDTA
al 482-8822. Representantes de servicio al cliente se encuentran en los días de semana de servicio de
6am-7pm, de 8am-6pm los sábados y 8am-5pm los domingos y días festivos. Para mantenerse en contacto
con las últimas iniciativas de CDTA, gústanos en Facebook en Facebook.com/CDTAiride o síganos en
Twitter (@ CDTA).
La Autoridad de Transporte del Distrito Capital (CDTA) opera sus programas y servicios, sin distinción
de raza, color, origen nacional, sexo, edad, discapacidad, condición económica o habilidad limitada del
Ingles, de conformidad con el Título VI del Acta de Derechos Civiles.
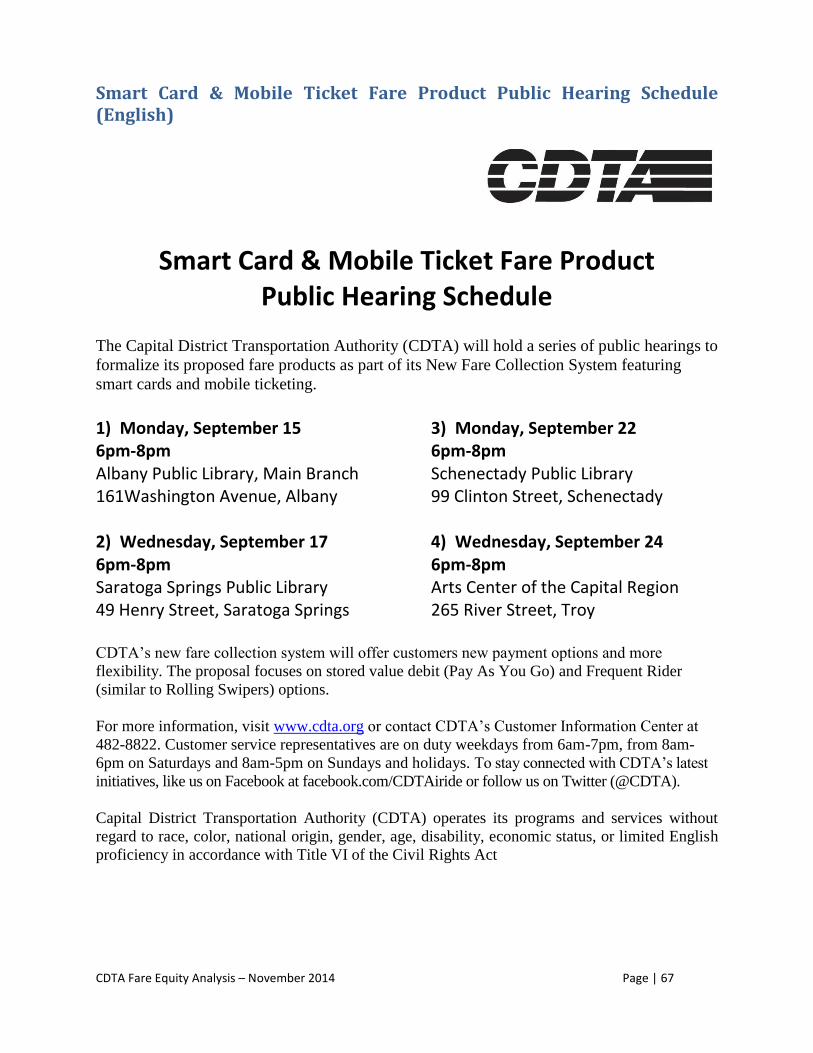
CDTA Fare Equity Analysis – November 2014 Page | 67
Smart Card & Mobile Ticket Fare Product Public Hearing Schedule (English)
Smart Card & Mobile Ticket Fare Product Public Hearing Schedule
The Capital District Transportation Authority (CDTA) will hold a series of public hearings to
formalize its proposed fare products as part of its New Fare Collection System featuring
smart cards and mobile ticketing.
1) Monday, September 15 6pm-8pm Albany Public Library, Main Branch 161Washington Avenue, Albany 2) Wednesday, September 17 6pm-8pm Saratoga Springs Public Library 49 Henry Street, Saratoga Springs
3) Monday, September 22 6pm-8pm Schenectady Public Library 99 Clinton Street, Schenectady 4) Wednesday, September 24 6pm-8pm Arts Center of the Capital Region 265 River Street, Troy
CDTA’s new fare collection system will offer customers new payment options and more
flexibility. The proposal focuses on stored value debit (Pay As You Go) and Frequent Rider
(similar to Rolling Swipers) options.
For more information, visit www.cdta.org or contact CDTA’s Customer Information Center at
482-8822. Customer service representatives are on duty weekdays from 6am-7pm, from 8am-
6pm on Saturdays and 8am-5pm on Sundays and holidays. To stay connected with CDTA’s latest
initiatives, like us on Facebook at facebook.com/CDTAiride or follow us on Twitter (@CDTA).
Capital District Transportation Authority (CDTA) operates its programs and services without
regard to race, color, national origin, gender, age, disability, economic status, or limited English
proficiency in accordance with Title VI of the Civil Rights Act
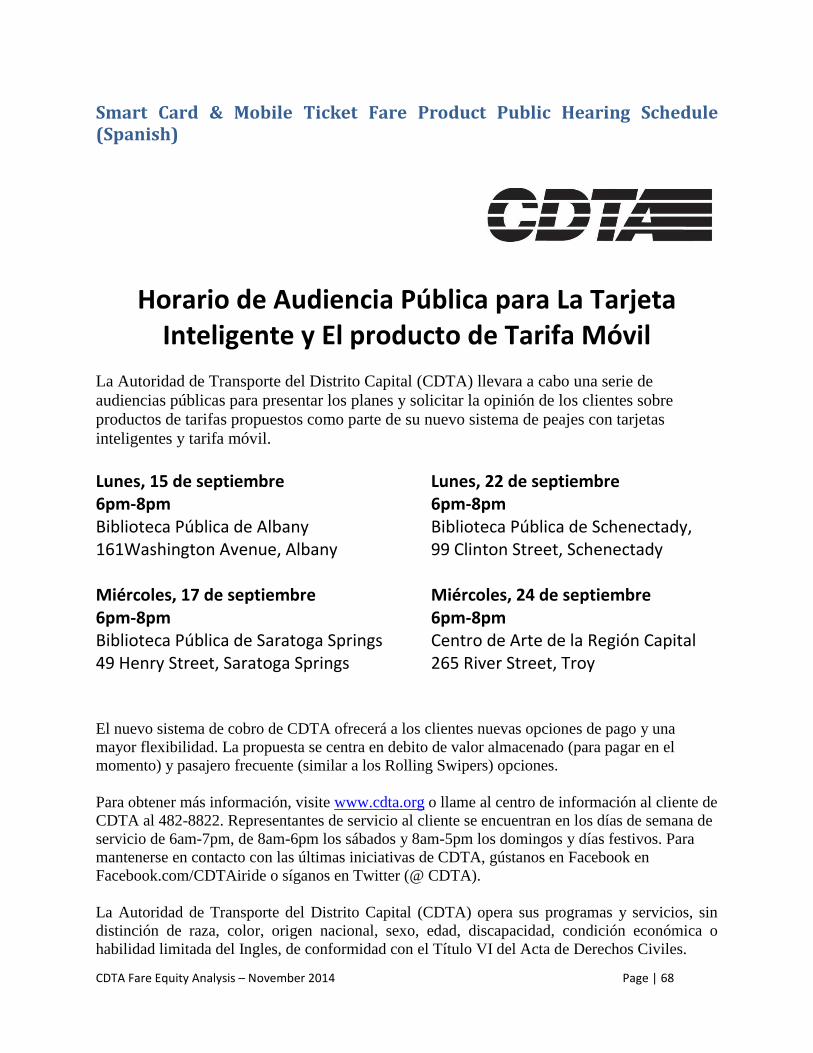
CDTA Fare Equity Analysis – November 2014 Page | 68
Smart Card & Mobile Ticket Fare Product Public Hearing Schedule (Spanish)
Horario de Audiencia Pública para La Tarjeta Inteligente y El producto de Tarifa Móvil
La Autoridad de Transporte del Distrito Capital (CDTA) llevara a cabo una serie de
audiencias públicas para presentar los planes y solicitar la opinión de los clientes sobre
productos de tarifas propuestos como parte de su nuevo sistema de peajes con tarjetas
inteligentes y tarifa móvil.
Lunes, 15 de septiembre 6pm-8pm Biblioteca Pública de Albany 161Washington Avenue, Albany Miércoles, 17 de septiembre 6pm-8pm Biblioteca Pública de Saratoga Springs 49 Henry Street, Saratoga Springs
Lunes, 22 de septiembre 6pm-8pm Biblioteca Pública de Schenectady, 99 Clinton Street, Schenectady Miércoles, 24 de septiembre
6pm-8pm Centro de Arte de la Región Capital 265 River Street, Troy
El nuevo sistema de cobro de CDTA ofrecerá a los clientes nuevas opciones de pago y una
mayor flexibilidad. La propuesta se centra en debito de valor almacenado (para pagar en el
momento) y pasajero frecuente (similar a los Rolling Swipers) opciones.
Para obtener más información, visite www.cdta.org o llame al centro de información al cliente de
CDTA al 482-8822. Representantes de servicio al cliente se encuentran en los días de semana de
servicio de 6am-7pm, de 8am-6pm los sábados y 8am-5pm los domingos y días festivos. Para
mantenerse en contacto con las últimas iniciativas de CDTA, gústanos en Facebook en
Facebook.com/CDTAiride o síganos en Twitter (@ CDTA).
La Autoridad de Transporte del Distrito Capital (CDTA) opera sus programas y servicios, sin
distinción de raza, color, origen nacional, sexo, edad, discapacidad, condición económica o
habilidad limitada del Ingles, de conformidad con el Título VI del Acta de Derechos Civiles.
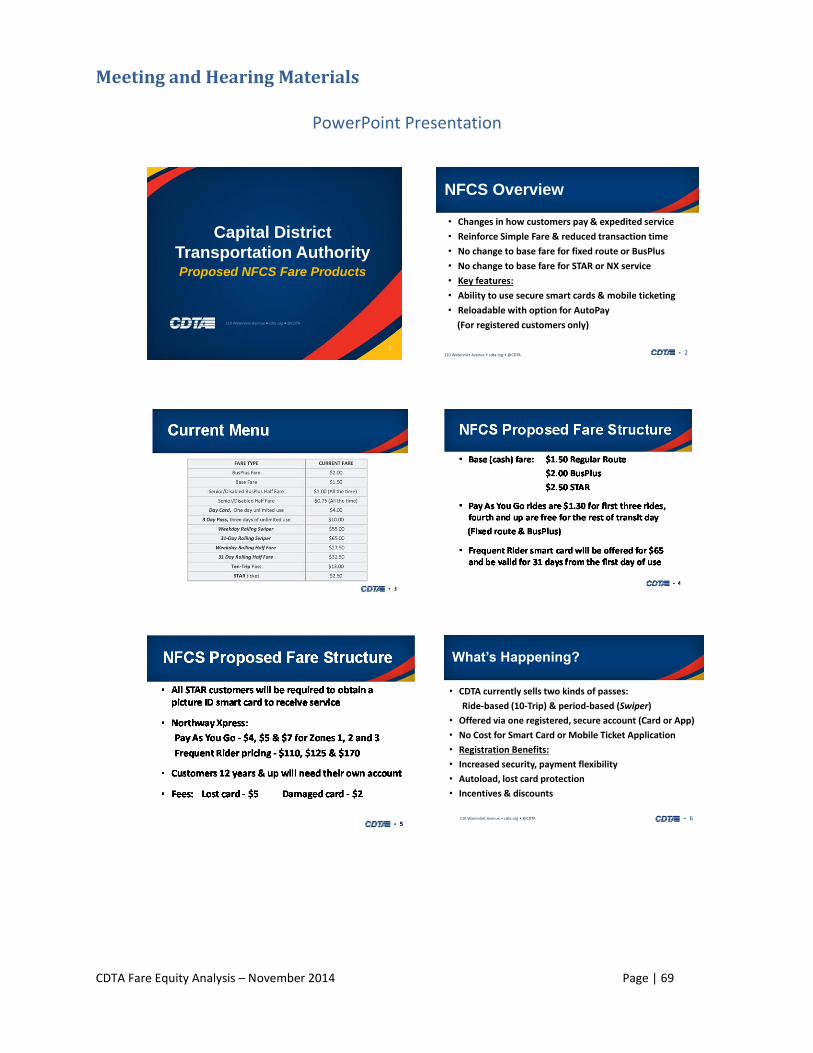
CDTA Fare Equity Analysis – November 2014 Page | 69
Meeting and Hearing Materials
PowerPoint Presentation
Capital District
Transportation AuthorityProposed NFCS Fare Products
110 Watervliet Avenue • cdta.org • @CDTA
1
NFCS Overview
2•110 Watervliet Avenue • cdta.org • @CDTA
• Changes in how customers pay & expedited service
• Reinforce Simple Fare & reduced transaction time
• No change to base fare for fixed route or BusPlus
• No change to base fare for STAR or NX service
• Key features:
• Ability to use secure smart cards & mobile ticketing
• Reloadable with option for AutoPay
(For registered customers only)
What’s Happening?
6•110 Watervliet Avenue • cdta.org • @CDTA
• CDTA currently sells two kinds of passes:
Ride-based (10-Trip) & period-based (Swiper)
• Offered via one registered, secure account (Card or App)
• No Cost for Smart Card or Mobile Ticket Application
• Registration Benefits:
• Increased security, payment flexibility
• Autoload, lost card protection
• Incentives & discounts
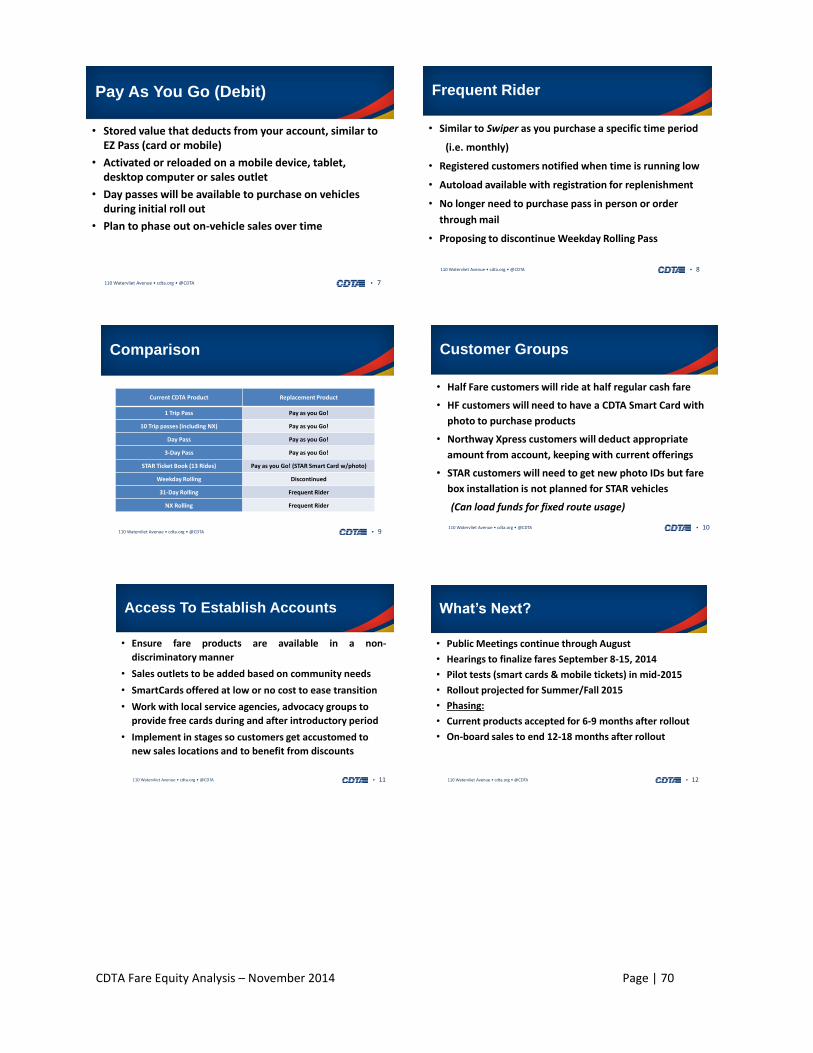
CDTA Fare Equity Analysis – November 2014 Page | 70
Pay As You Go (Debit)
7•110 Watervliet Avenue • cdta.org • @CDTA
• Stored value that deducts from your account, similar to EZ Pass (card or mobile)
• Activated or reloaded on a mobile device, tablet, desktop computer or sales outlet
• Day passes will be available to purchase on vehicles during initial roll out
• Plan to phase out on-vehicle sales over time
Frequent Rider
8•110 Watervliet Avenue • cdta.org • @CDTA
• Similar to Swiper as you purchase a specific time period
(i.e. monthly)
• Registered customers notified when time is running low
• Autoload available with registration for replenishment
• No longer need to purchase pass in person or order
through mail
• Proposing to discontinue Weekday Rolling Pass
Comparison
9•110 Watervliet Avenue • cdta.org • @CDTA
Current CDTA Product Replacement Product
1 Trip Pass Pay as you Go!
10 Trip passes (including NX) Pay as you Go!
Day Pass Pay as you Go!
3-Day Pass Pay as you Go!
STAR Ticket Book (13 Rides) Pay as you Go! (STAR Smart Card w/photo)
Weekday Rolling Discontinued
31-Day Rolling Frequent Rider
NX Rolling Frequent Rider
Customer Groups
10•110 Watervliet Avenue • cdta.org • @CDTA
• Half Fare customers will ride at half regular cash fare
• HF customers will need to have a CDTA Smart Card with
photo to purchase products
• Northway Xpress customers will deduct appropriate
amount from account, keeping with current offerings
• STAR customers will need to get new photo IDs but fare
box installation is not planned for STAR vehicles
(Can load funds for fixed route usage)
Access To Establish Accounts
11•110 Watervliet Avenue • cdta.org • @CDTA
• Ensure fare products are available in a non-
discriminatory manner
• Sales outlets to be added based on community needs
• SmartCards offered at low or no cost to ease transition
• Work with local service agencies, advocacy groups to
provide free cards during and after introductory period
• Implement in stages so customers get accustomed to
new sales locations and to benefit from discounts
What’s Next?
12•110 Watervliet Avenue • cdta.org • @CDTA
• Public Meetings continue through August
• Hearings to finalize fares September 8-15, 2014
• Pilot tests (smart cards & mobile tickets) in mid-2015
• Rollout projected for Summer/Fall 2015
• Phasing:
• Current products accepted for 6-9 months after rollout
• On-board sales to end 12-18 months after rollout
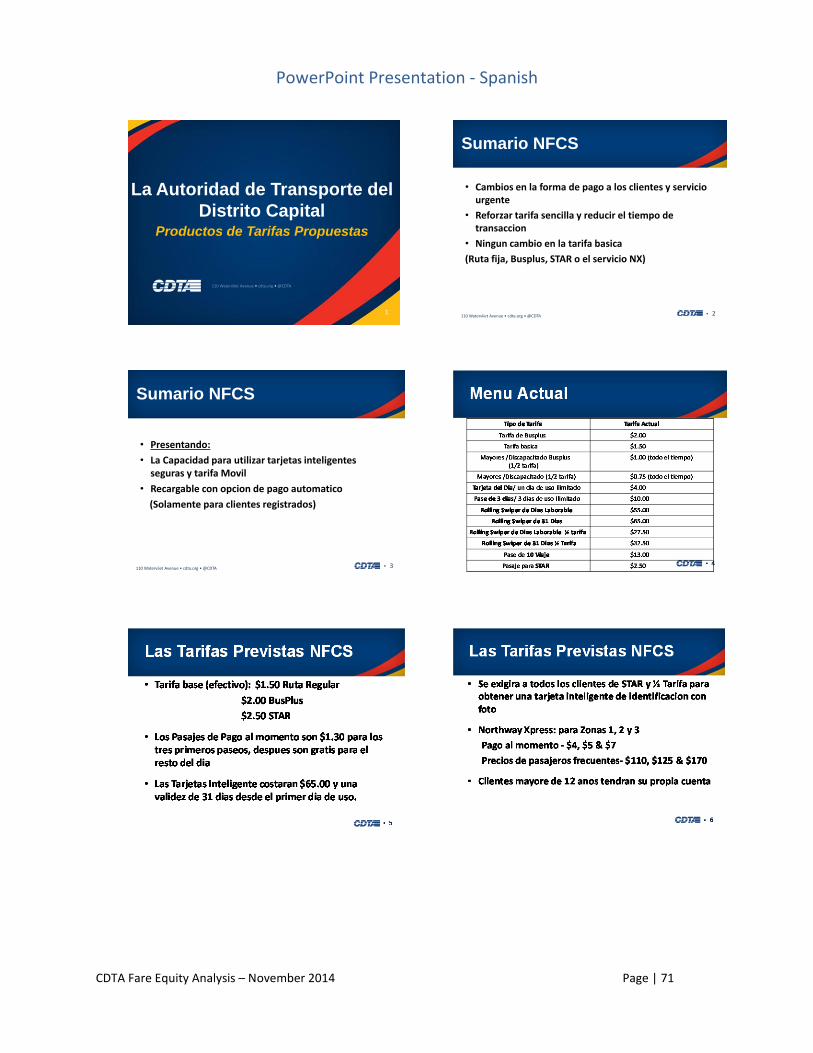
CDTA Fare Equity Analysis – November 2014 Page | 71
PowerPoint Presentation - Spanish
La Autoridad de Transporte del
Distrito CapitalProductos de Tarifas Propuestas
110 Watervliet Avenue • cdta.org • @CDTA
1
Sumario NFCS
2•110 Watervliet Avenue • cdta.org • @CDTA
• Cambios en la forma de pago a los clientes y servicio urgente
• Reforzar tarifa sencilla y reducir el tiempo de transaccion
• Ningun cambio en la tarifa basica
(Ruta fija, Busplus, STAR o el servicio NX)
Sumario NFCS
3•110 Watervliet Avenue • cdta.org • @CDTA
• Presentando:
• La Capacidad para utilizar tarjetas inteligentes seguras y tarifa Movil
• Recargable con opcion de pago automatico
(Solamente para clientes registrados)
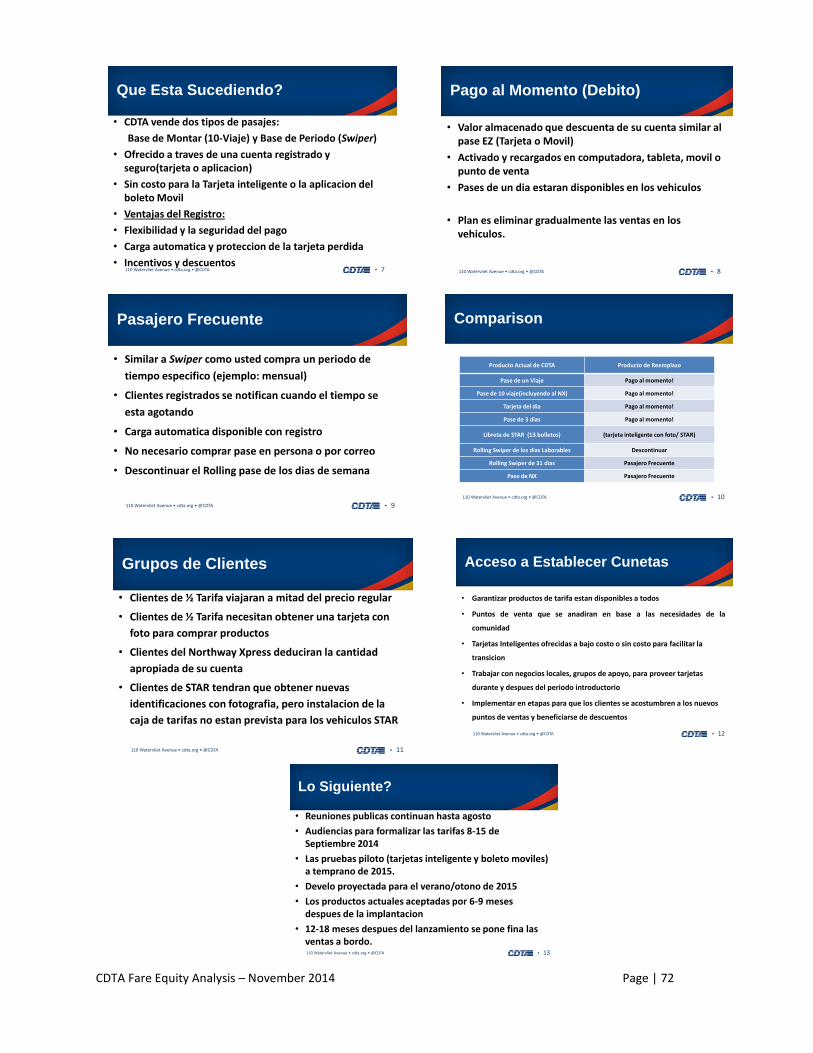
CDTA Fare Equity Analysis – November 2014 Page | 72
Que Esta Sucediendo?
7•110 Watervliet Avenue • cdta.org • @CDTA
• CDTA vende dos tipos de pasajes:
Base de Montar (10-Viaje) y Base de Periodo (Swiper)
• Ofrecido a traves de una cuenta registrado y seguro(tarjeta o aplicacion)
• Sin costo para la Tarjeta inteligente o la aplicacion del boleto Movil
• Ventajas del Registro:
• Flexibilidad y la seguridad del pago
• Carga automatica y proteccion de la tarjeta perdida
• Incentivos y descuentos
Pago al Momento (Debito)
8•110 Watervliet Avenue • cdta.org • @CDTA
• Valor almacenado que descuenta de su cuenta similar al pase EZ (Tarjeta o Movil)
• Activado y recargados en computadora, tableta, movil o punto de venta
• Pases de un dia estaran disponibles en los vehiculos
• Plan es eliminar gradualmente las ventas en los vehiculos.
Pasajero Frecuente
9•110 Watervliet Avenue • cdta.org • @CDTA
• Similar a Swiper como usted compra un periodo de
tiempo especifico (ejemplo: mensual)
• Clientes registrados se notifican cuando el tiempo se
esta agotando
• Carga automatica disponible con registro
• No necesario comprar pase en persona o por correo
• Descontinuar el Rolling pase de los dias de semana
Comparison
10•110 Watervliet Avenue • cdta.org • @CDTA
Producto Actual de CDTA Producto de Reemplazo
Pase de un Viaje Pago al momento!
Pase de 10 viaje(incluyendo al NX) Pago al momento!
Tarjeta del dia Pago al momento!
Pase de 3 dias Pago al momento!
Libreta de STAR (13 bolletos) (tarjeta inteligente con foto/ STAR)
Rolling Swiper de los dias Laborables Descontinuar
Rolling Swiper de 31 dias Pasajero Frecuente
Pase de NX Pasajero Frecuente
Grupos de Clientes
11•110 Watervliet Avenue • cdta.org • @CDTA
• Clientes de ½ Tarifa viajaran a mitad del precio regular
• Clientes de ½ Tarifa necesitan obtener una tarjeta con
foto para comprar productos
• Clientes del Northway Xpress deduciran la cantidad
apropiada de su cuenta
• Clientes de STAR tendran que obtener nuevas
identificaciones con fotografia, pero instalacion de la
caja de tarifas no estan prevista para los vehiculos STAR
Acceso a Establecer Cunetas
12•110 Watervliet Avenue • cdta.org • @CDTA
• Garantizar productos de tarifa estan disponibles a todos
• Puntos de venta que se anadiran en base a las necesidades de la
comunidad
• Tarjetas Inteligentes ofrecidas a bajo costo o sin costo para facilitar la
transicion
• Trabajar con negocios locales, grupos de apoyo, para proveer tarjetas
durante y despues del periodo introductorio
• Implementar en etapas para que los clientes se acostumbren a los nuevos
puntos de ventas y beneficiarse de descuentos
Lo Siguiente?
13•110 Watervliet Avenue • cdta.org • @CDTA
• Reuniones publicas continuan hasta agosto
• Audiencias para formalizar las tarifas 8-15 de Septiembre 2014
• Las pruebas piloto (tarjetas inteligente y boleto moviles) a temprano de 2015.
• Develo proyectada para el verano/otono de 2015
• Los productos actuales aceptadas por 6-9 meses despues de la implantacion
• 12-18 meses despues del lanzamiento se pone fina las ventas a bordo.
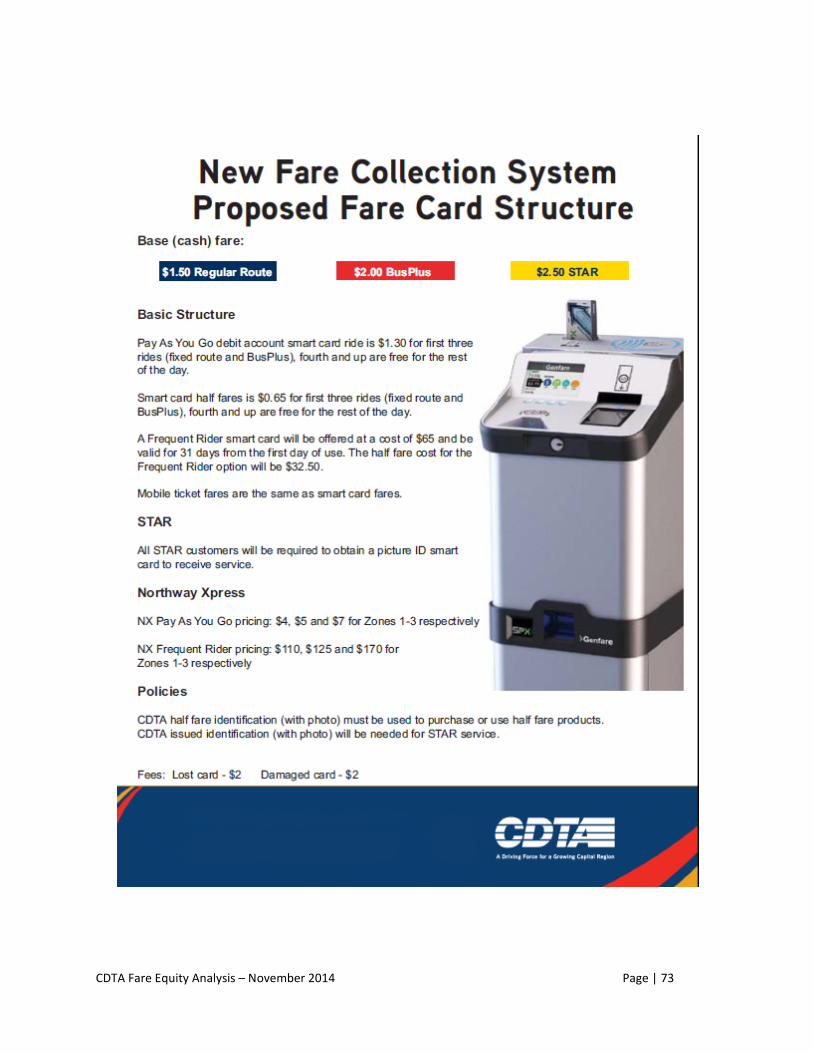
CDTA Fare Equity Analysis – November 2014 Page | 73
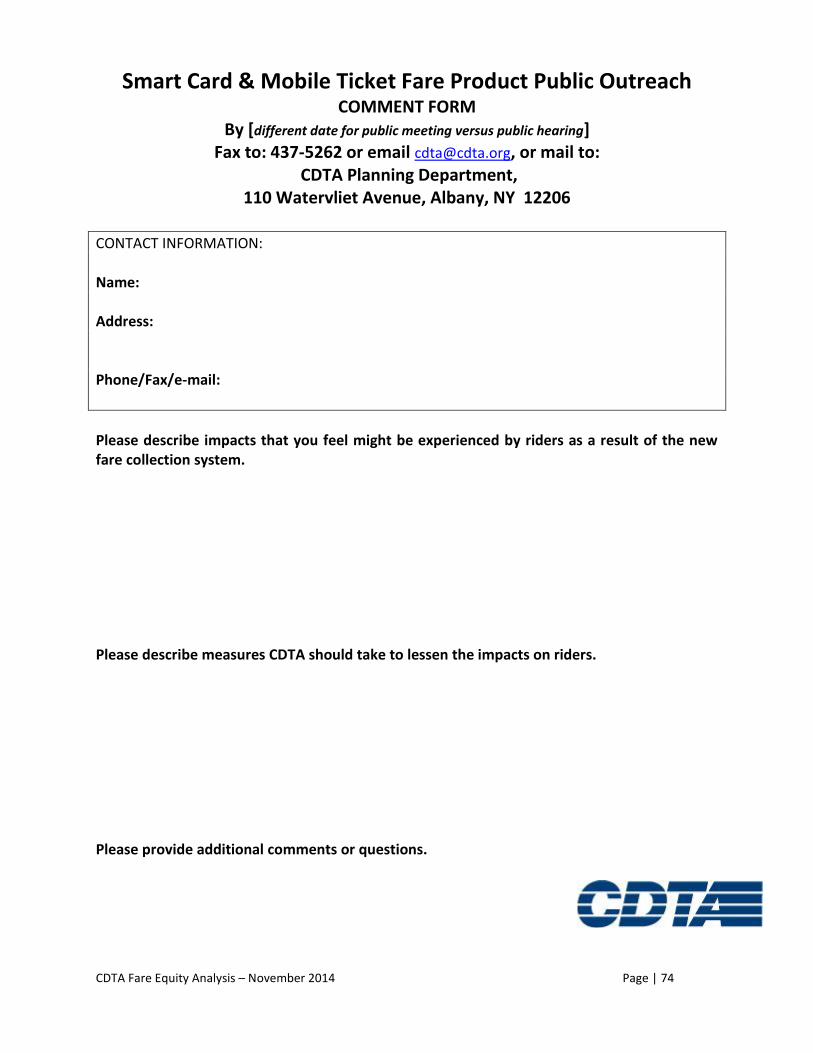
CDTA Fare Equity Analysis – November 2014 Page | 74
Smart Card & Mobile Ticket Fare Product Public Outreach COMMENT FORM
By [different date for public meeting versus public hearing] Fax to: 437-5262 or email [email protected], or mail to:
CDTA Planning Department, 110 Watervliet Avenue, Albany, NY 12206
CONTACT INFORMATION: Name: Address: Phone/Fax/e-mail:
Please describe impacts that you feel might be experienced by riders as a result of the new fare collection system. Please describe measures CDTA should take to lessen the impacts on riders. Please provide additional comments or questions.
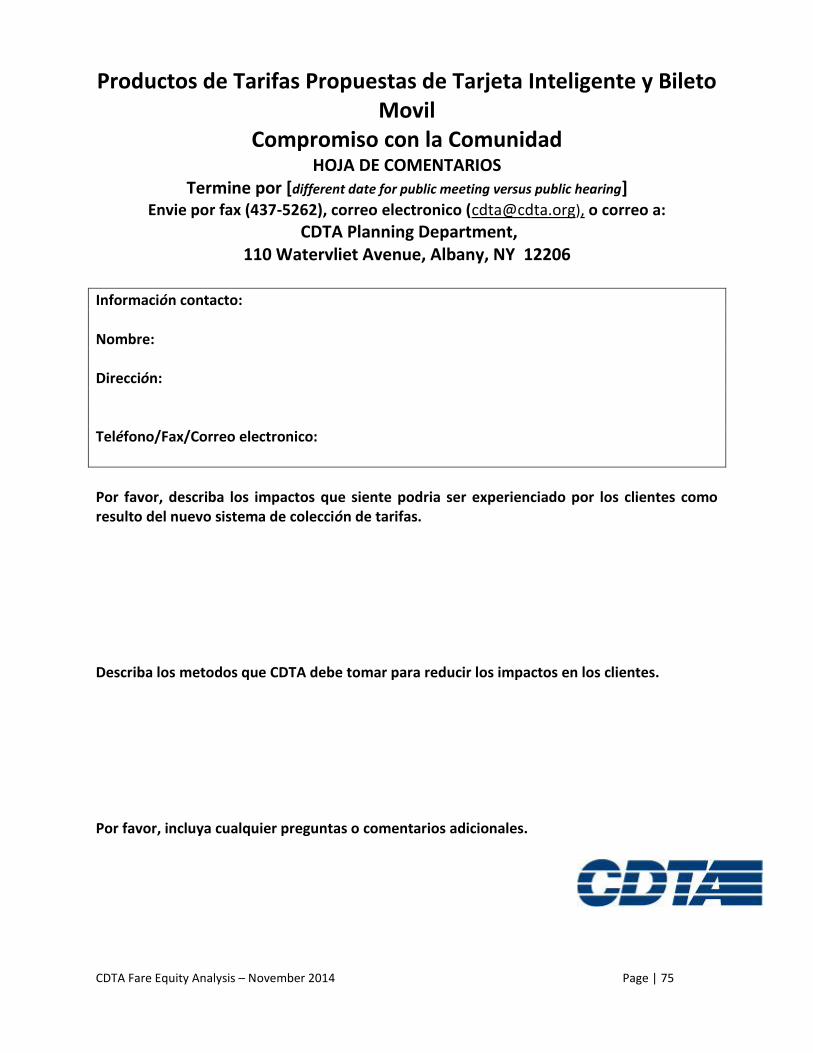
CDTA Fare Equity Analysis – November 2014 Page | 75
Productos de Tarifas Propuestas de Tarjeta Inteligente y Bileto Movil
Compromiso con la Comunidad HOJA DE COMENTARIOS
Termine por [different date for public meeting versus public hearing] Envie por fax (437-5262), correo electronico ([email protected]), o correo a:
CDTA Planning Department, 110 Watervliet Avenue, Albany, NY 12206
Información contacto: Nombre: Dirección: Teléfono/Fax/Correo electronico:
Por favor, describa los impactos que siente podria ser experienciado por los clientes como resulto del nuevo sistema de colección de tarifas. Describa los metodos que CDTA debe tomar para reducir los impactos en los clientes. Por favor, incluya cualquier preguntas o comentarios adicionales.
CDTA Fare Equity Analysis – November 2014 Page | 76
Public Outreach Comment Response Summary The following is a summary of public comments received during a three-month comment period from July 17th – October 8th, 2014. Respondents were able to provide comments via a Comment Form provided in English and Spanish at each of the six public meetings and four public hearings. Comments could also be submitted via fax, mail, and email, the number and addresses of which were posted on the CDTA web site and comment forms. Overall, respondents were concerned about half-fare customers having to travel to CDTA offices to have their photograph taken and having to take a physical exam not covered by health care plans to demonstrate a disability as well as about senior citizen half-fare customers having to provide birth certificates to demonstrate senior status. The comments also suggested concern regarding a lack of sufficient education about the changes being planned for, an insufficient number of locations around the region where riders would be able to purchase smart cards or load money onto smart cards, the loss of the ability to purchase a Day Pass with cash on the bus or a 7-day Weekday Swiper, not being able to use the Smart Card or Mobile Ticketing without a credit card or bank account, the inconvenience of having to learn how to use a new payment system, and the inability of out-of-town visitors to use the system without having purchased a Smart Card or downloaded a Mobile Ticketing App beforehand. There were also comments in support of the proposed fare improvements including support for reduction in boarding time and cost, removal of the burden of running out of cash on a purchased card without realizing it, the ability of the rider to have the money on their Smart Card reimbursed should they lose it, and it being a more durable product able to withstand weather.
CDTA Fare Equity Analysis – November 2014 Page | 77
Sample Completed Public Comment Forms and Sign-in Sheets
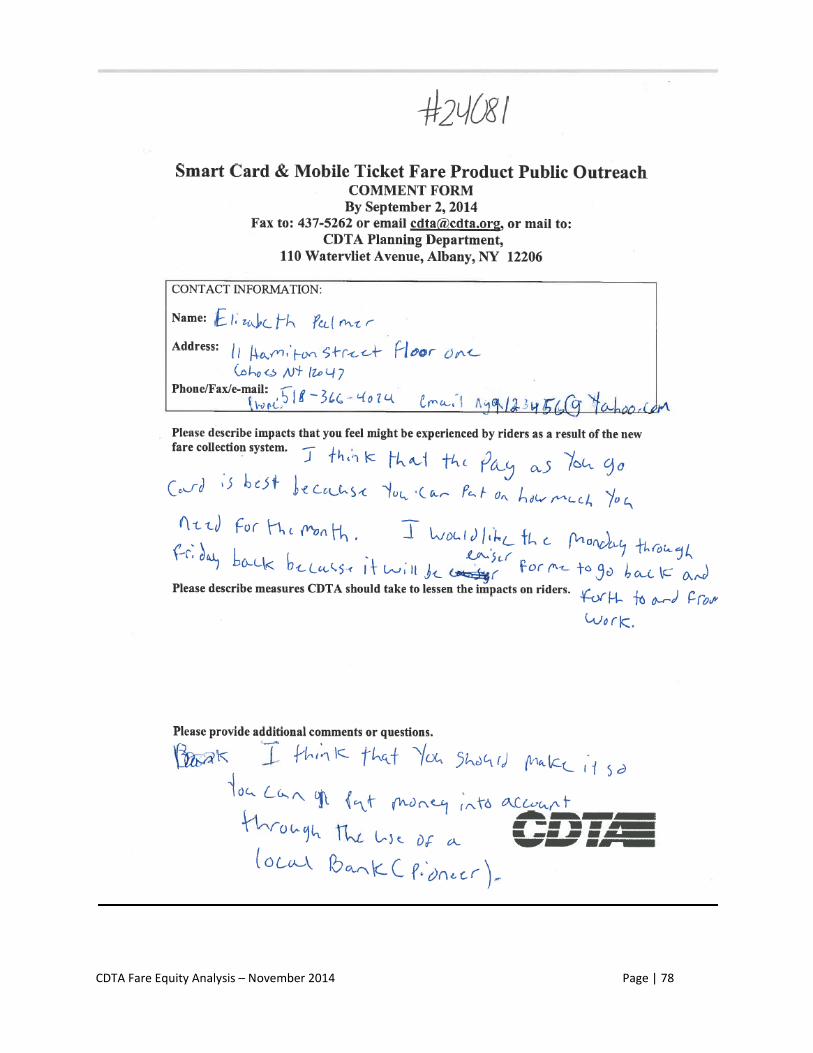
CDTA Fare Equity Analysis – November 2014 Page | 78
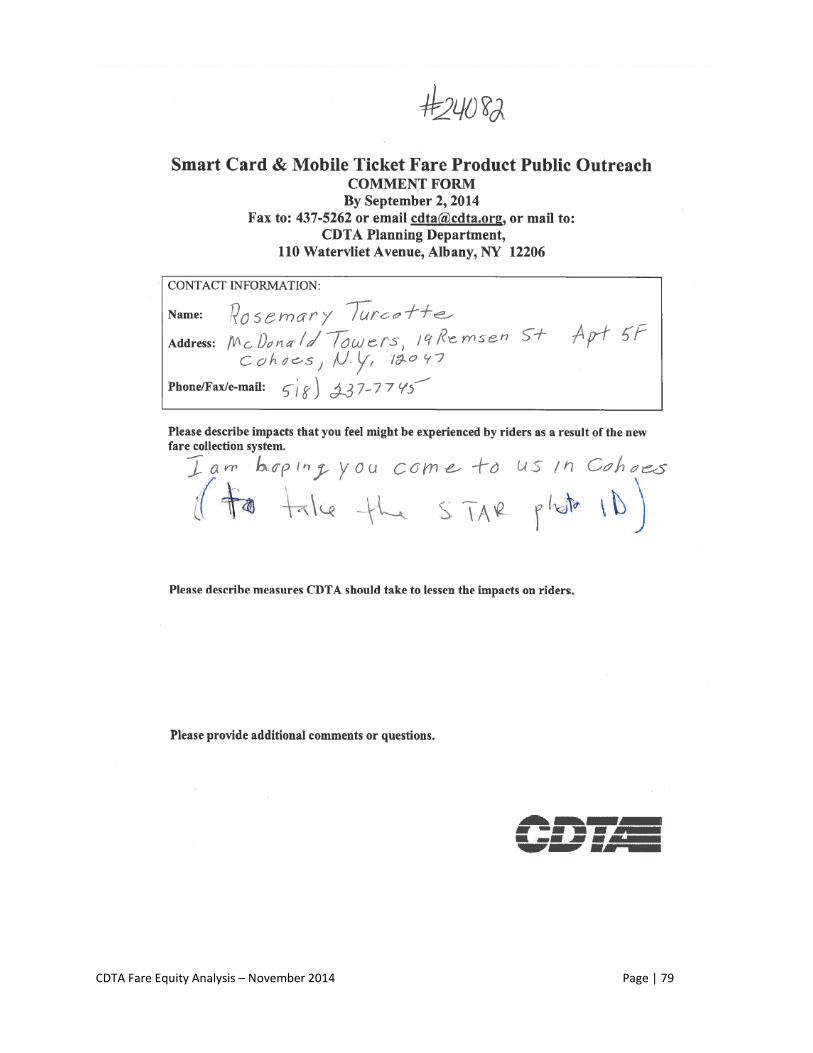
CDTA Fare Equity Analysis – November 2014 Page | 79
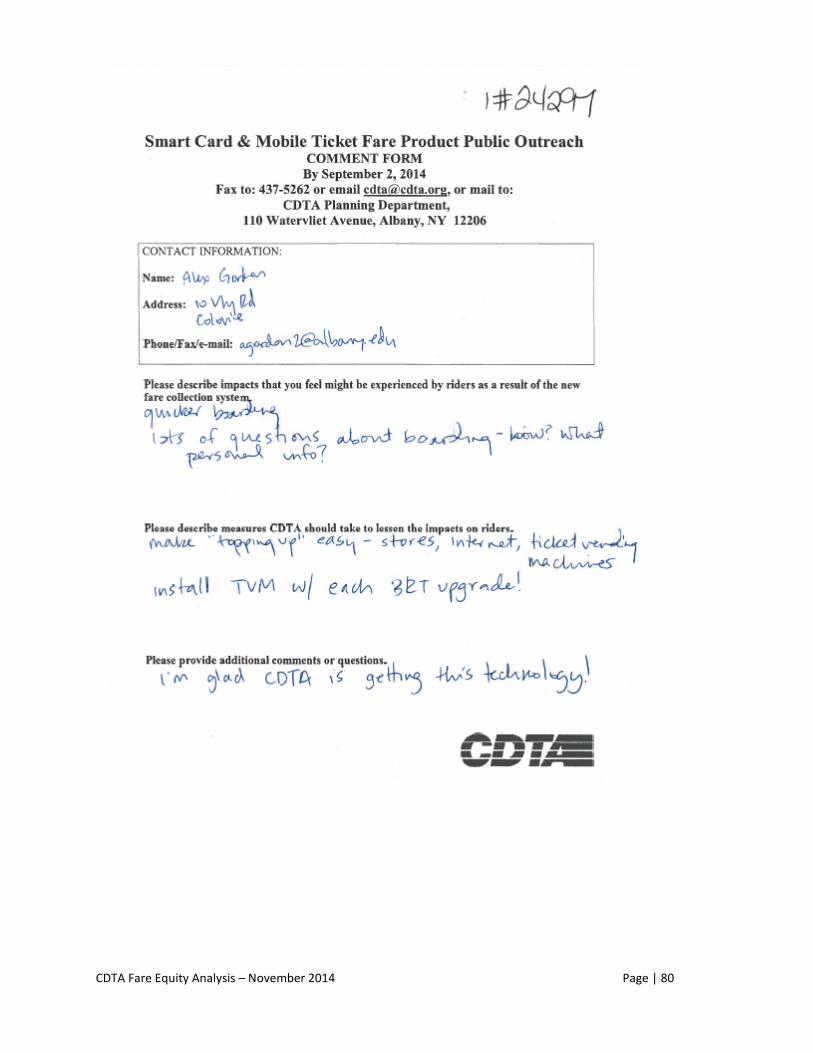
CDTA Fare Equity Analysis – November 2014 Page | 80
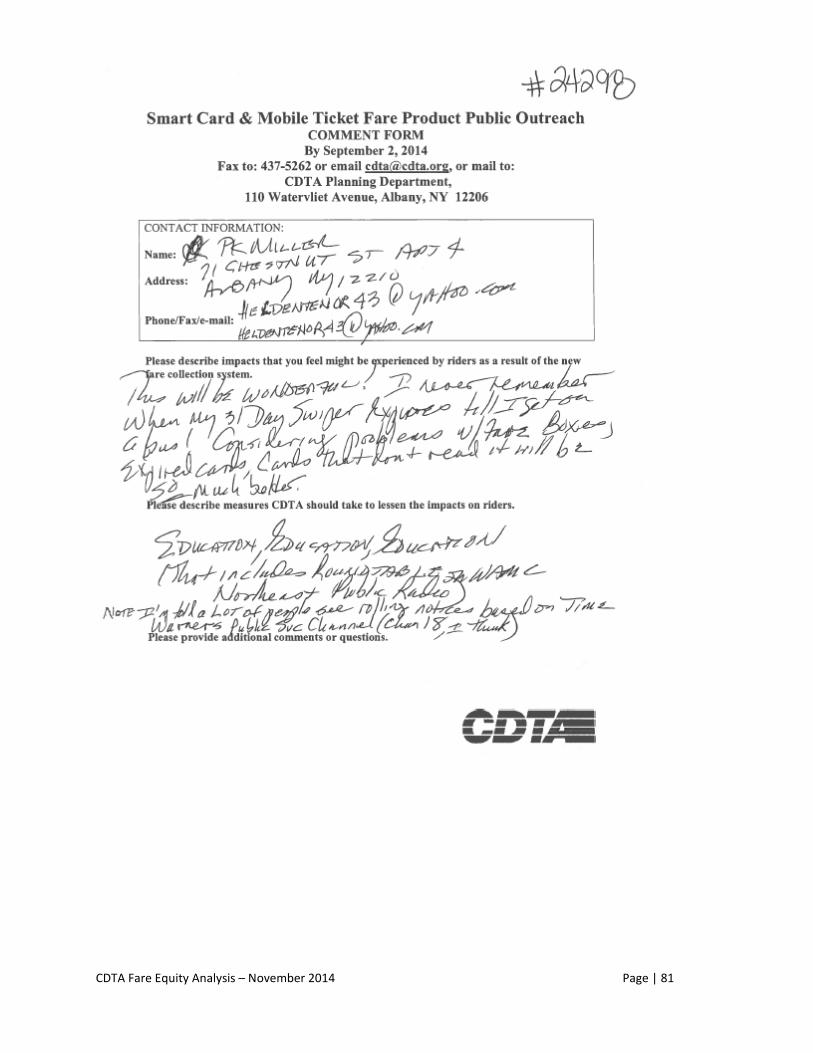
CDTA Fare Equity Analysis – November 2014 Page | 81
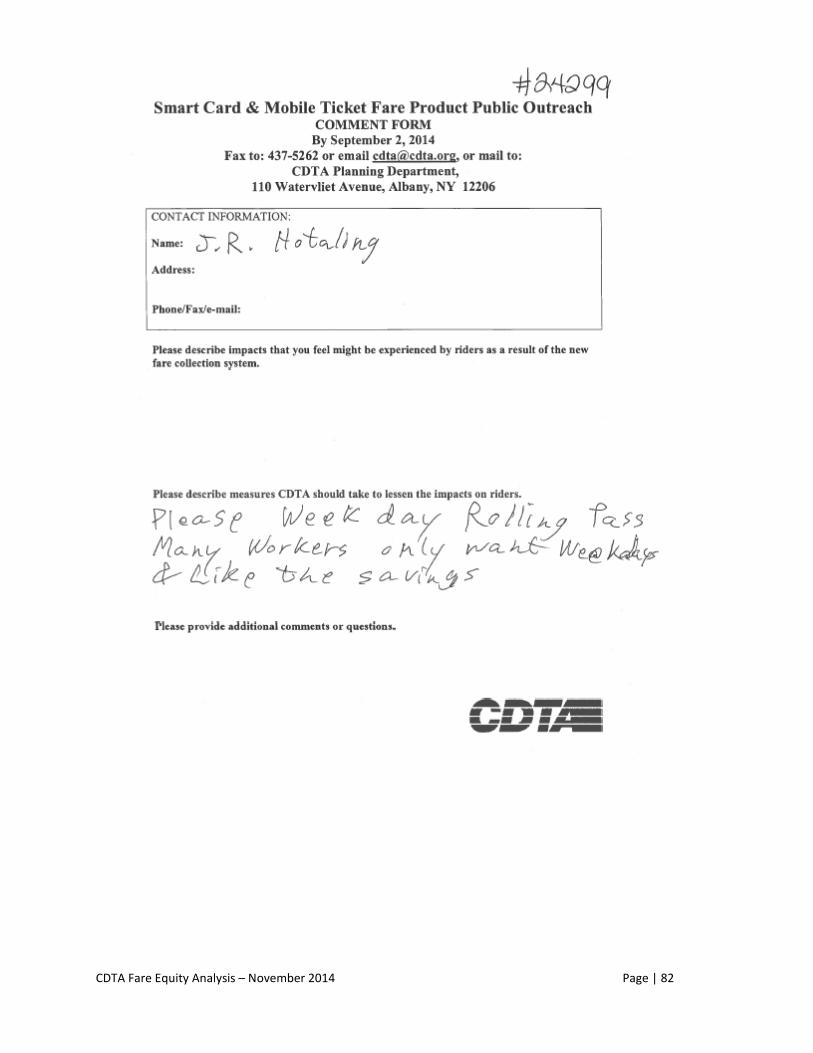
CDTA Fare Equity Analysis – November 2014 Page | 82
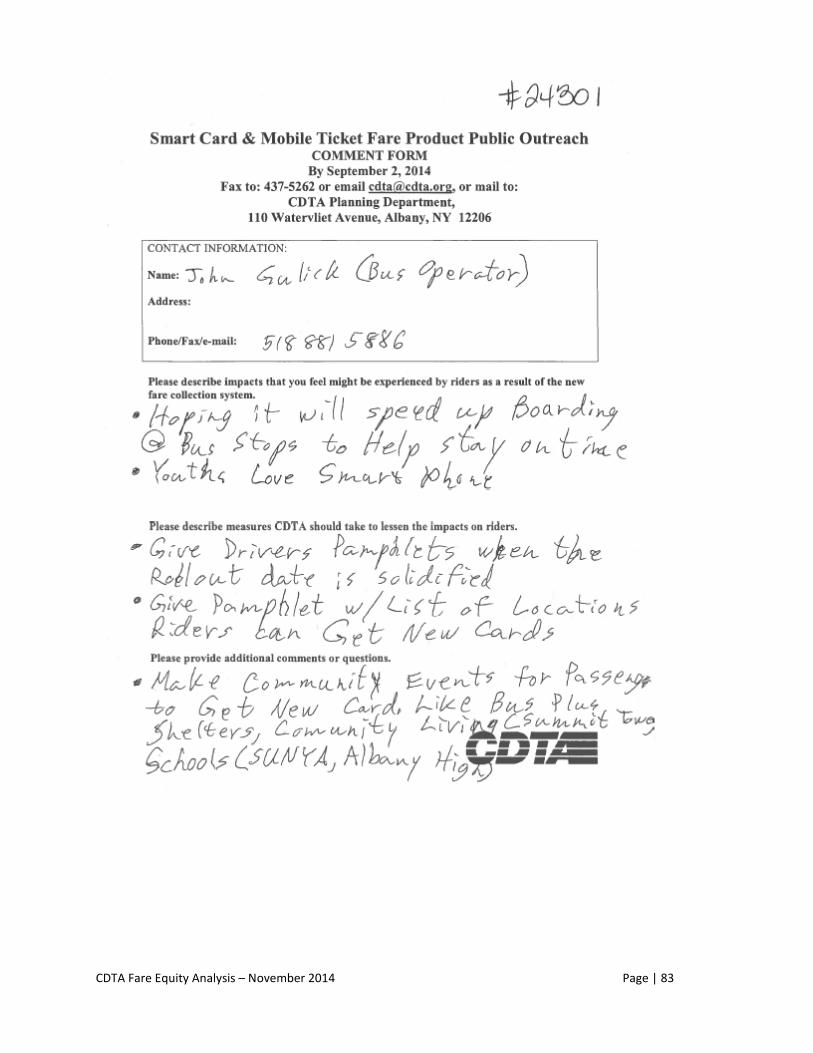
CDTA Fare Equity Analysis – November 2014 Page | 83
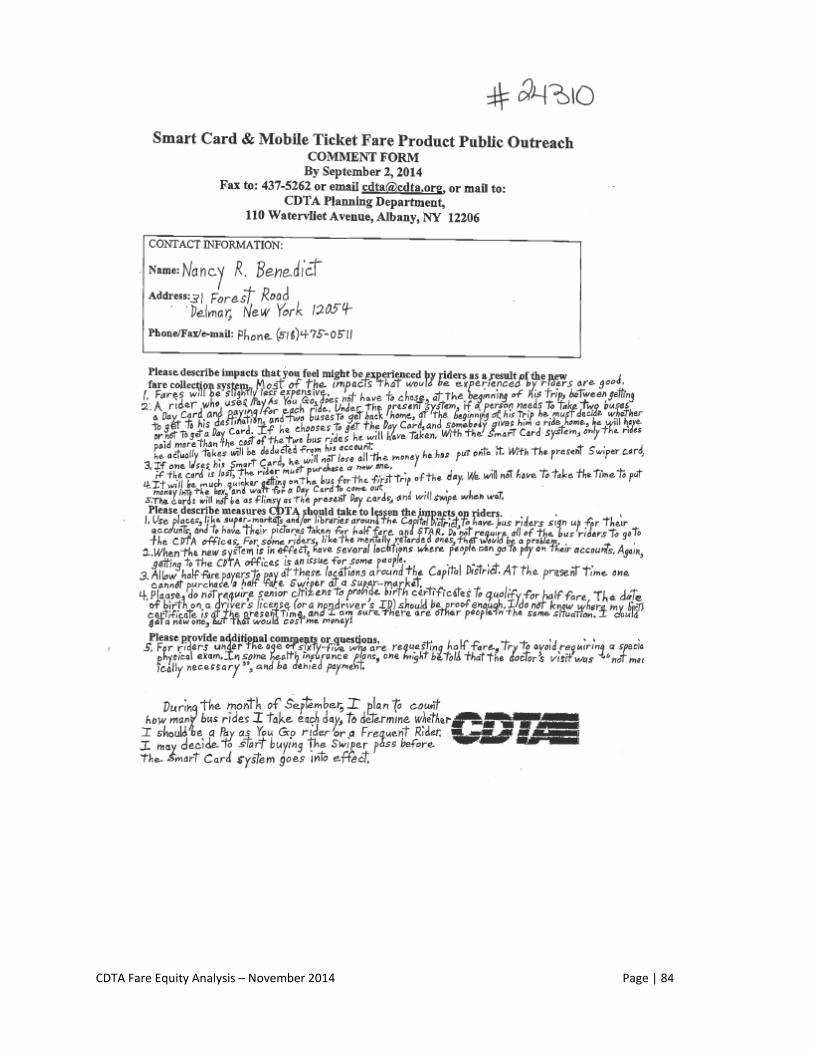
CDTA Fare Equity Analysis – November 2014 Page | 84
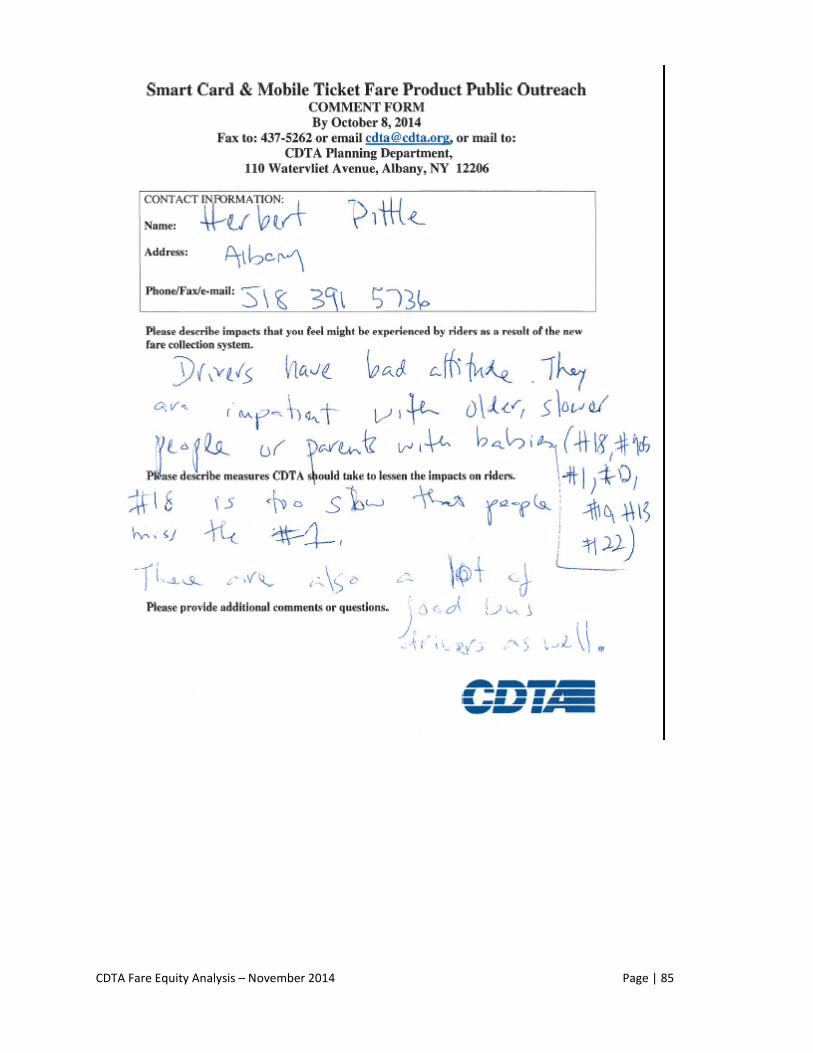
CDTA Fare Equity Analysis – November 2014 Page | 85
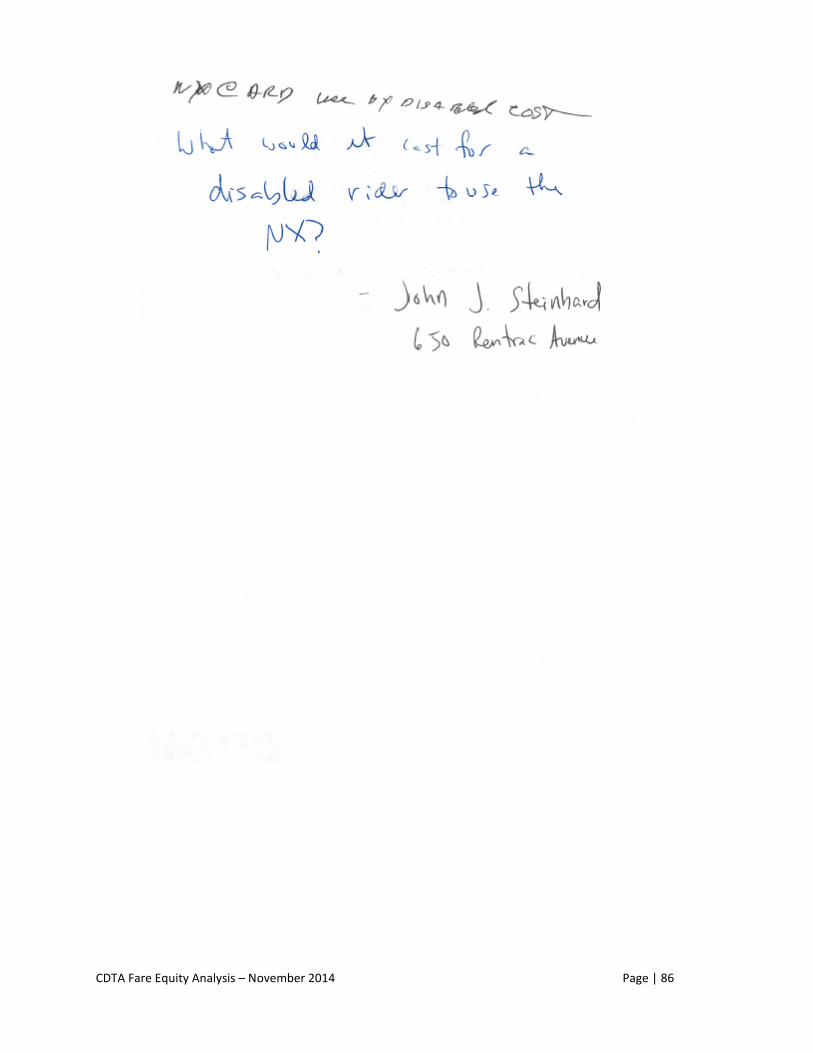
CDTA Fare Equity Analysis – November 2014 Page | 86
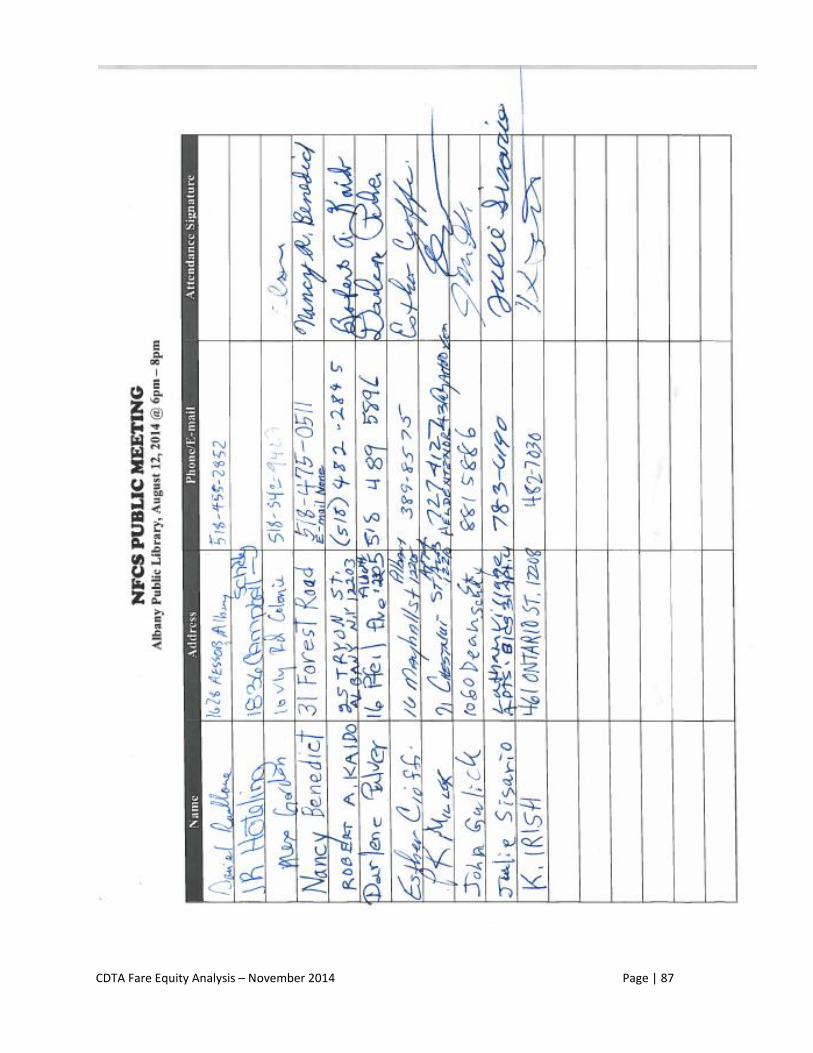
CDTA Fare Equity Analysis – November 2014 Page | 87
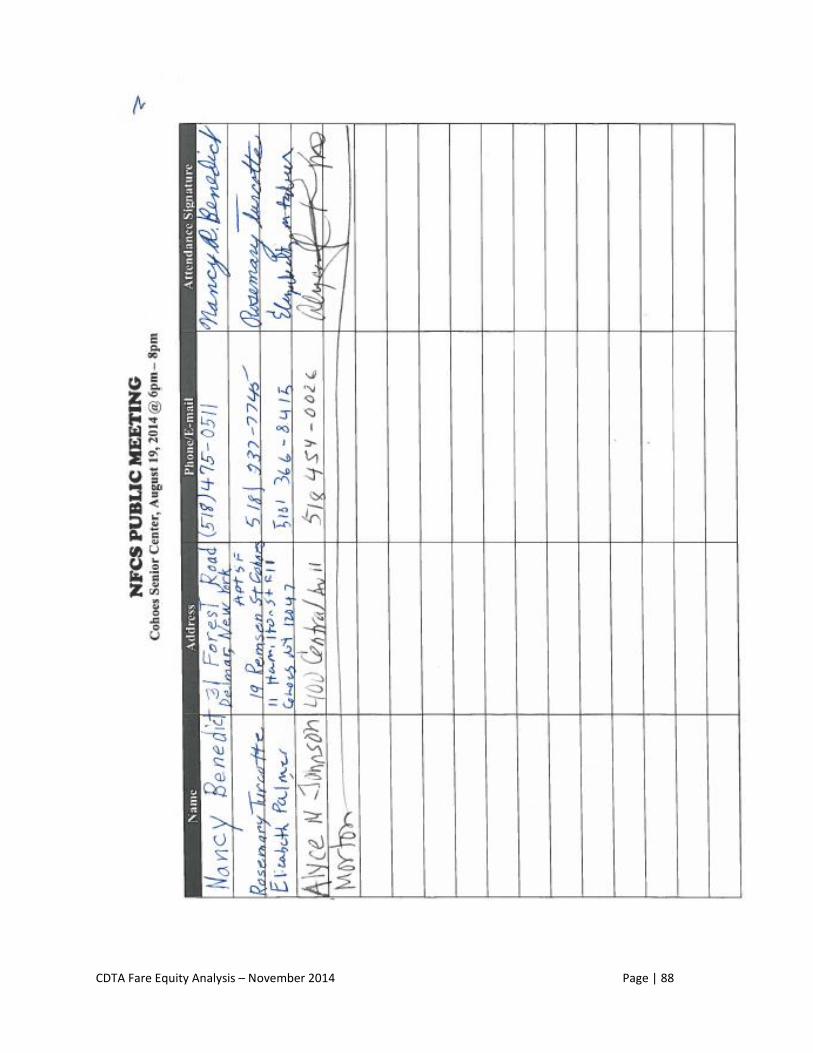
CDTA Fare Equity Analysis – November 2014 Page | 88
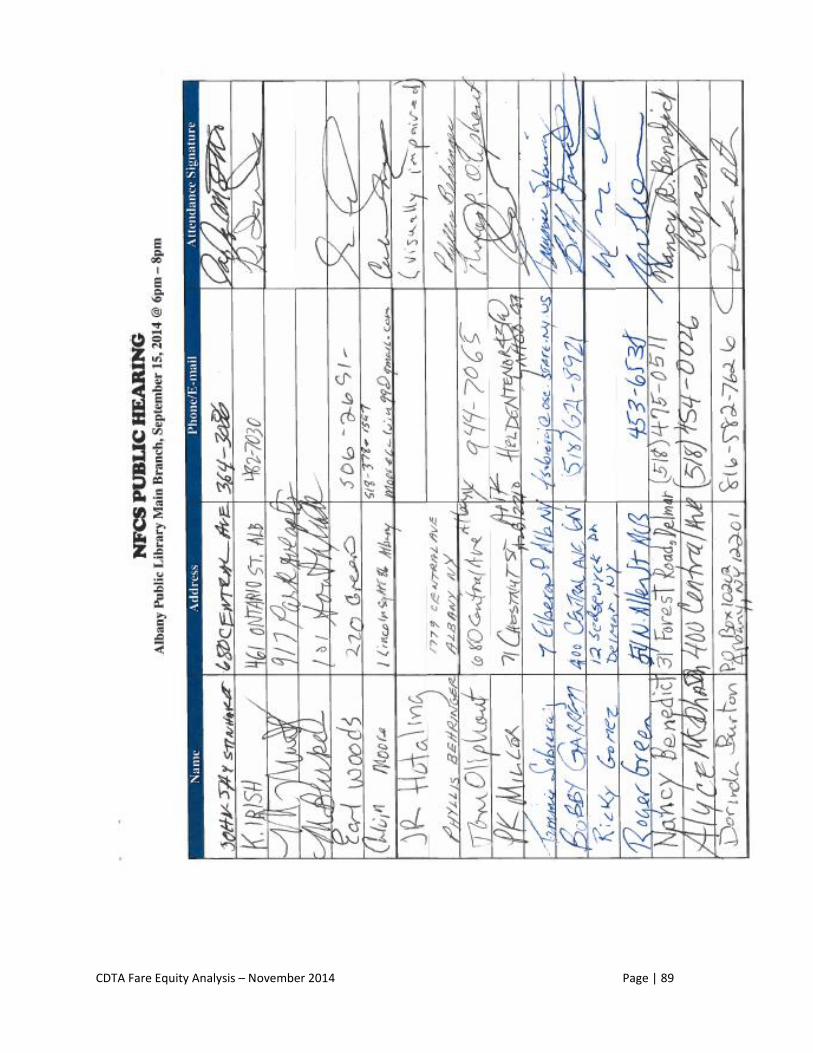
CDTA Fare Equity Analysis – November 2014 Page | 89
CDTA Fare Equity Analysis – November 2014 Page | 90
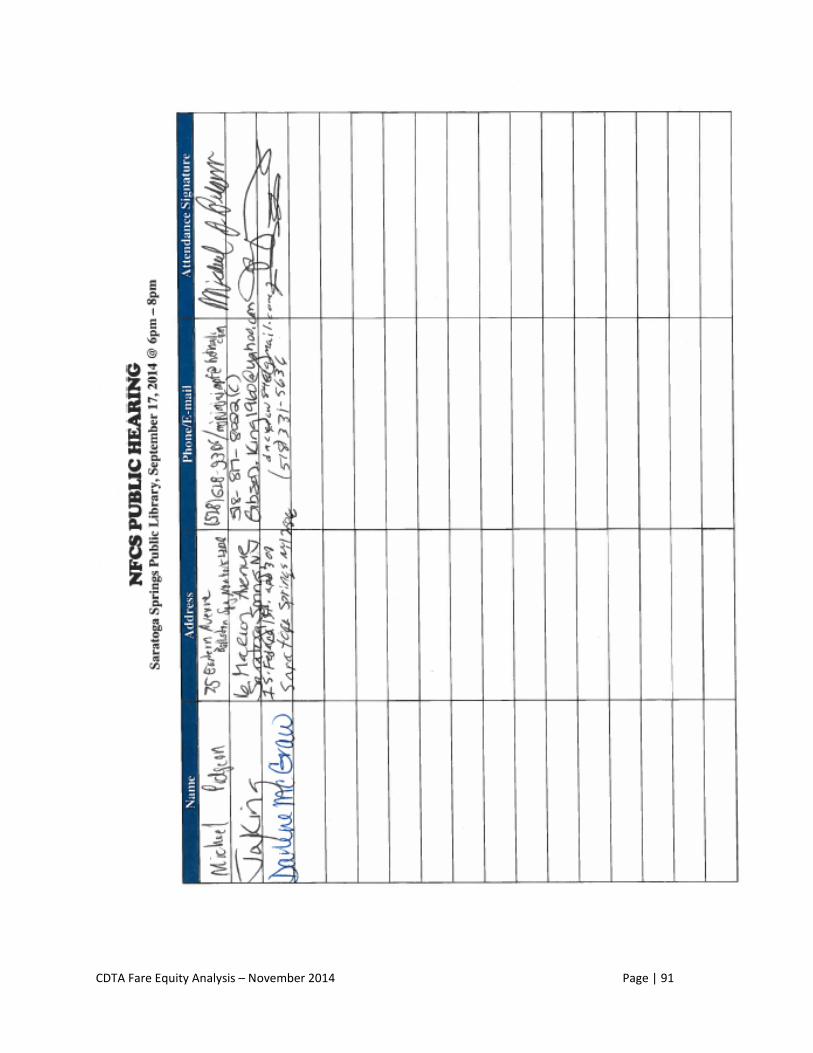
CDTA Fare Equity Analysis – November 2014 Page | 91
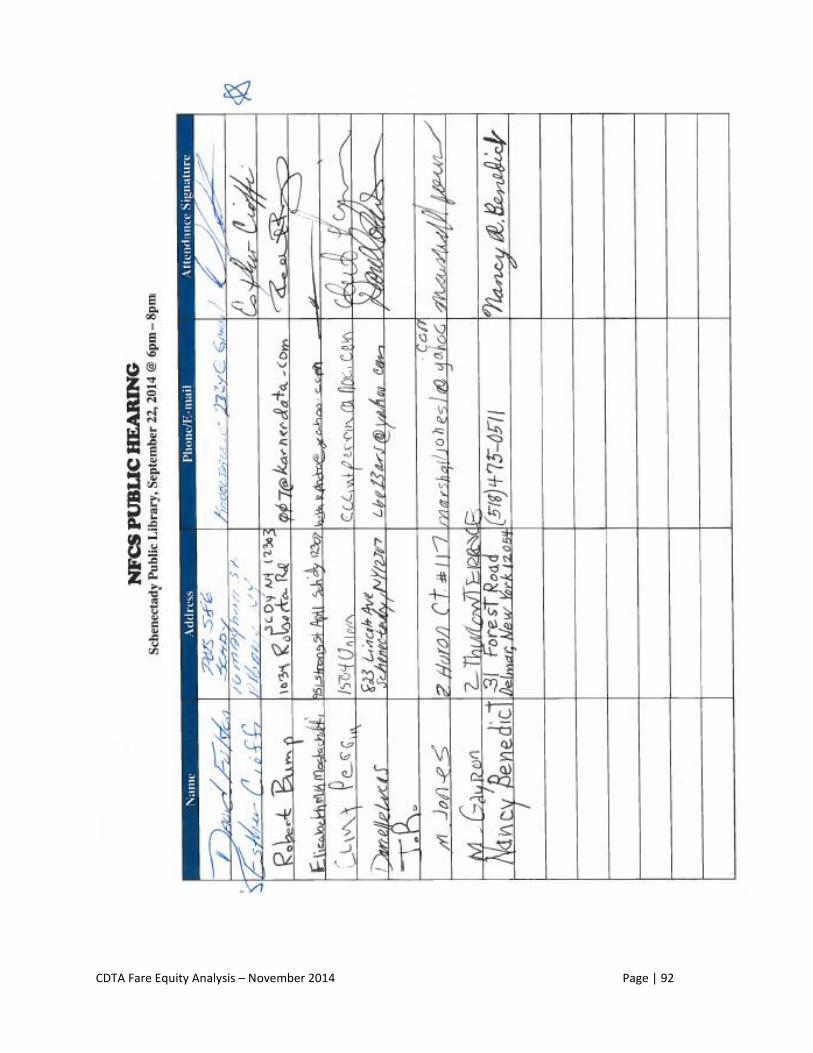
CDTA Fare Equity Analysis – November 2014 Page | 92
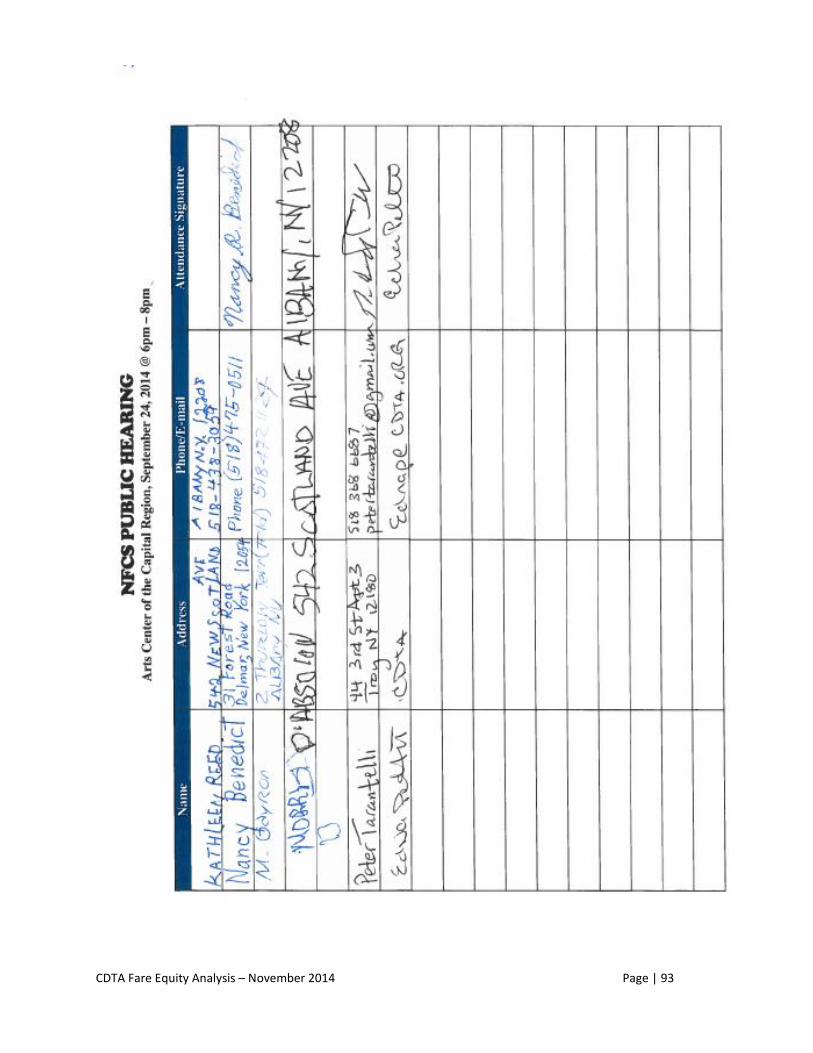
CDTA Fare Equity Analysis – November 2014 Page | 93
Related Documents