Mon. Not. R. Astron. Soc. 355, 1315–1326 (2004) doi:10.1111/j.1365-2966.2004.08414.x Far-infrared and submillimetre observations of the Crab nebula D. A. Green, 1 R. J. Tuffs 2 and C. C. Popescu 2,3 1 Mullard Radio Astronomy Observatory, Cavendish Laboratory, Madingley Road, Cambridge CB3 0HE 2 Max-Planck-Institut f¨ ur Kernphysik, Saupfercheckweg 1, D-69117 Heidelberg, Germany 3 The Astronomical Institute of the Romanian Academy, Str. Cut ¸itul de Argint 5, 752121 Bucharest, Romania Accepted 2004 September 14. Received 2004 September 12; in original form 2004 July 5 ABSTRACT We present far-infrared (FIR) and submillimetre images of the Crab nebula, taken with the ISOPHOT instrument onboard the Infrared Space Observatory (ISO) and with the Submil- limetre Common-User Bolometer Array (SCUBA) on the James Clerk Maxwell Telescope. The ISOPHOT observations were made in the bands centred at 60, 100 and 170 µm, with FWHM of equivalent area Gaussian beams of 44, 47 and 93 arcsec, respectively. The 850-µm SCUBA image was processed using a maximum-entropy method algorithm and has a Gaussian FWHM of 17 arcsec. The 60- and 100-µm images show clear excess of emission, above that expected from an extrapolation of the synchrotron spectrum of the Crab nebula from lower frequencies, as previously seen from IRAS observations. The superior angular resolution of the ISOPHOT images reveal that about half this excess is attributable to two peaks, separated by ≈80 arcsec. We also present spectra taken using the Long-wavelength Spectrometer onboard ISO, which show that the FIR excess is not due to line emission. The lower-resolution 170-µm image does not show any excess emission, but is possibly fainter, particularly in the NW, than expected from an extrapolation of the lower-frequency synchrotron emission. These findings are consistent with a picture in which the FIR excess is due to emission from a small amount of warm dust (in the ranges 0.01–0.07 and 0.003–0.02 M for astronomical silicate and graphite, respectively) which radiates predominantly at 60 and 100 µm but not at 170 µm, and which is superimposed on a synchrotron spectrum that gradually steepens towards shorter wavelengths throughout the far and medium infrared spectral range. The dust geometry is consistent with a torus of diameter ≈0.8 pc created by the (red supergiant) supernova progenitor prior to its explosion, superimposed upon a broadly distributed component which may be supernova con- densates in the filaments. The dust-to-gas ratio in the filaments is comparable to the interstellar value. Therefore, even if the condensates seen at the present epoch could ultimately escape the remnant without being destroyed, the surrounding interstellar medium will not be significantly enriched in dust. Our upper limit of ≈0.02 M on the total mass of carbon in the form of graphite is consistent with the inference from the gas-phase carbon abundances that there has been no significant enrichment of the filaments in carbon nucleosynthesis products from the progenitor. To study spectral index variations in the radio synchrotron emission we compared the 850-µm image with a 20-cm Very Large Array (VLA) image. These images are very similar, implying that there is little variation in spectral index across the face of the remnant between these wavelengths. As seen previously, there are some spectral variations near the centre of the remnant. However, given the good agreement between the integrated flux density at 850 µm and the extrapolated synchrotron spectrum, together with the different epochs of the 850-µm and 20-cm images, we do not see the need for the second radio synchrotron component from the remnant, which has previously been proposed. Key words: dust, extinction – ISM: individual: Crab nebula – supernova remnants – infrared: ISM – radio continuum: ISM – submillimetre. E-mail: [email protected] C 2004 RAS

Welcome message from author
This document is posted to help you gain knowledge. Please leave a comment to let me know what you think about it! Share it to your friends and learn new things together.
Transcript

Mon. Not. R. Astron. Soc. 355, 1315–1326 (2004) doi:10.1111/j.1365-2966.2004.08414.x
Far-infrared and submillimetre observations of the Crab nebula
D. A. Green,1� R. J. Tuffs2 and C. C. Popescu2,3
1Mullard Radio Astronomy Observatory, Cavendish Laboratory, Madingley Road, Cambridge CB3 0HE2Max-Planck-Institut fur Kernphysik, Saupfercheckweg 1, D-69117 Heidelberg, Germany3The Astronomical Institute of the Romanian Academy, Str. Cutitul de Argint 5, 752121 Bucharest, Romania
Accepted 2004 September 14. Received 2004 September 12; in original form 2004 July 5
ABSTRACTWe present far-infrared (FIR) and submillimetre images of the Crab nebula, taken with theISOPHOT instrument onboard the Infrared Space Observatory (ISO) and with the Submil-limetre Common-User Bolometer Array (SCUBA) on the James Clerk Maxwell Telescope.The ISOPHOT observations were made in the bands centred at 60, 100 and 170 µm, withFWHM of equivalent area Gaussian beams of 44, 47 and 93 arcsec, respectively. The 850-µmSCUBA image was processed using a maximum-entropy method algorithm and has a GaussianFWHM of 17 arcsec. The 60- and 100-µm images show clear excess of emission, above thatexpected from an extrapolation of the synchrotron spectrum of the Crab nebula from lowerfrequencies, as previously seen from IRAS observations. The superior angular resolution of theISOPHOT images reveal that about half this excess is attributable to two peaks, separated by≈80 arcsec. We also present spectra taken using the Long-wavelength Spectrometer onboardISO, which show that the FIR excess is not due to line emission. The lower-resolution 170-µmimage does not show any excess emission, but is possibly fainter, particularly in the NW, thanexpected from an extrapolation of the lower-frequency synchrotron emission. These findingsare consistent with a picture in which the FIR excess is due to emission from a small amount ofwarm dust (in the ranges 0.01–0.07 and 0.003–0.02 M� for astronomical silicate and graphite,respectively) which radiates predominantly at 60 and 100 µm but not at 170 µm, and which issuperimposed on a synchrotron spectrum that gradually steepens towards shorter wavelengthsthroughout the far and medium infrared spectral range. The dust geometry is consistent witha torus of diameter ≈0.8 pc created by the (red supergiant) supernova progenitor prior to itsexplosion, superimposed upon a broadly distributed component which may be supernova con-densates in the filaments. The dust-to-gas ratio in the filaments is comparable to the interstellarvalue. Therefore, even if the condensates seen at the present epoch could ultimately escape theremnant without being destroyed, the surrounding interstellar medium will not be significantlyenriched in dust. Our upper limit of ≈0.02 M� on the total mass of carbon in the form ofgraphite is consistent with the inference from the gas-phase carbon abundances that there hasbeen no significant enrichment of the filaments in carbon nucleosynthesis products from theprogenitor. To study spectral index variations in the radio synchrotron emission we comparedthe 850-µm image with a 20-cm Very Large Array (VLA) image. These images are very similar,implying that there is little variation in spectral index across the face of the remnant betweenthese wavelengths. As seen previously, there are some spectral variations near the centre of theremnant. However, given the good agreement between the integrated flux density at 850 µmand the extrapolated synchrotron spectrum, together with the different epochs of the 850-µmand 20-cm images, we do not see the need for the second radio synchrotron component fromthe remnant, which has previously been proposed.
Key words: dust, extinction – ISM: individual: Crab nebula – supernova remnants – infrared:ISM – radio continuum: ISM – submillimetre.
�E-mail: [email protected]
C© 2004 RAS

1316 D. A. Green, R. J. Tuffs and C. C. Popescu
1 I N T RO D U C T I O N
The Crab nebula (=G184.6−5.8), the remnant of the supernovaof AD 1054 (e.g. Stephenson & Green 2002), shows a centrallybrightened morphology, and it is the best known of the class of‘filled-centre’ supernova remnants (or ‘plerions’). It is powered byits central pulsar, and emits synchrotron emission with a relativelyflat spectral index at radio wavelengths, with a spectral index α heredefined in the sense that the flux density S scales with frequency ν
as S ∝ ν−α , of ≈ 0.30 (Baars et al. 1977). The integrated spectrumof the Crab nebula steepens at higher frequencies, with a breakwavelength in the mid-infrared (MIR, e.g. Marsden et al. 1984;Woltjer 1987), which is at much higher frequencies than for otherfilled-centre remnants such as 3C58 (= G130.7 + 3.1; (see Green& Scheuer 1992), which is consistent with the central pulsar in theCrab still being active.
In addition to the evidence for a break in the mid-infrared syn-chrotron spectrum, IRAS observations (Marsden et al.) also revealedthe existence of a far-infrared (FIR) excess in the integrated measure-ments over the extrapolation of the radio–submillimetre synchrotronspectrum. It has been suggested that this excess could have one or amixture of two distinct physical origins – warm (∼45 K) dust emis-sion (Marsden et al. 1984; Mezger et al. 1986; Strom & Greidanus1992) and synchrotron emission arising from a bump in the relativis-tic electron energy spectrum around the energy corresponding to thesynchrotron break wavelength (Mezger et al. 1986). Furthermore,Fesen & Blair (1990) suggested the existence of grains in the nebulaon the basis of optical measurements. Their study of various opticalimages revealed numerous dark spots, ranging up to 5 arcsec in size,which they attributed to patches of obscuration. Evidence was alsofound for an extended component of the obscuration. However, theattributes of prime significance – the mass, composition and tem-perature of the grains – could not be addressed by this investigation,nor by the subsequent analysis using images from the Hubble SpaceTelescope (HST) by Blair et al. (1997). In a separate study, Fesen& Blair (1990) made a case that the bays seen prominently in op-tical continuum images at the E and W extremities of the remnantrepresent the projection of a toroid of pre-existing material createdby a (red giant) progenitor wind (see also Li & Begelman 1992).They supposed that this disc could account for some of the high he-lium abundances seen in the remnant and could be dusty. Douvionet al. (2001) presented some infrared observations of the Crab neb-ula, made with the ISOCAM instrument onboard the ISO satellite.These observations, which were made at 6–16 µm (i.e. wavelengthsjust shortwards of the mid-infrared break), did not detect any dustemission, but only synchrotron emission, which showed a steepen-ing of the mid-infrared spectral index away from the central pulsar. Itis important to search for cold grains at longer wavelengths, since itnot known whether significant quantities of dust are produced by theprogenitor star of the type that produced the Crab nebula, either in astellar wind prior to the outburst or as condensates in the metal-richsupernova ejecta. From observed elemental abundances, Nomotoet al. (1982) concludes that the progenitor of the Crab nebula musthave been � 13 M�, with a mass of ∼9 M� being preferred. Recentsubmillimetre observations (Dunne et al. 2003; Morgan et al. 2003)suggest that there are large amounts of cold dust – of the order ofa solar mass – in the supernova remnants Cassiopeia A and that ofKepler’s supernova of AD 1604 (although an alternative explana-tion for the submillimetre emission from Cas A has been proposedby Dwek 2004). Sources of dust production are important for un-derstanding dust high-redshift galaxies (e.g. Morgan & Edmunds
2003), and in this context further investigations of the dust contentof Galactic supernova remnants are useful.
Concerning the synchrotron emission, although there have beenclaims of variations in spectral index across the Crab nebula at radiowavelengths (e.g. between the filaments and the diffuse interfila-ment regions, and a systematic steepening of the spectrum towardsthe edge of the remnant), these were not confirmed by the detailedstudy of Bietenholz et al. (1997). The spectral variations that weredetected were: (i) within about an arcmin of the pulsar, due to movingfeatures in the radio emission (see also Bietenholz, Frail & Hester2001; Bietenholz, Frail & Hester 2004), and the different epochsof the images compared, and (ii) some absorption at low frequen-cies (below about 300 MHz), due to thermal material in the Crabnebula’s filaments. More recent comparisons by Bietenholz et al.(2001) show that radio observations of the Crab nebula taken abouta year and half apart indeed show changes in the structure of theemission from the Crab nebula close to its central pulsar. However,any spectral variations are difficult to detect over a narrow range ofwavelengths, and may be more easily detectable if a good millime-tre or submillimetre image of the Crab nebula were available forcomparison with longer-wavelength radio observations. Bandiera,Neri & Cesaroni (2002) presented a 240-GHz (i.e. 1.3-mm) imageof the Crab nebula, and compared it with a 20-cm image for spec-tral index studies, from which they proposed a second synchrotroncomponent to the emission from the remnant.
In this paper we present images of the nebula in both the FIR(ISOPHOT images at 60, 100 and 170 µm) and the submillimetrerange (a SCUBA image at 850 µm), as well as four FIR spec-tra taken with the LWS instrument onboard ISO. (A preliminaryanalysis of the submillimetre observations was presented by Green2002.) These allow us to spatially and spectrophotometrically dis-tinguish between synchrotron, dust and line emission, to determinethe amount and distribution of cold dust in the nebula, and to in-vestigate further the radio to submillimetre spectral index acrossthe remnant. J2000.0 coordinates are used throughout this paper,and we take the distance to the Crab nebula to be ≈2 kpc (Trim-ble 1973). The FIR and submillimetre observations are described inSections 2 and 3, respectively. These observations are discussed inSection 4, and our conclusions summarized in Section 5.
2 I S O DATA R E D U C T I O N A N D R E S U LT S
2.1 ISOPHOT images
Details of the FIR observations of the Crab nebula made with theISOPHOT instrument of the Infra-Red Space Observatory (ISO; seeKessler et al. 1996 for details concerning ISO, and Lemke et al. 1996for details of ISOPHOT) are given in Table 1. These were made usingthe ISOPHOT-C100 3 × 3 pixel array with the C60 and C100 filtersand the ISOPHOT-C200 2 × 2 pixel array with the C160 filter. Thepassbands of the C60, C100 and C160 filters are between 48–73,82–124 and 130–218 µm, and have effective central wavelengthsnear 60, 100 and 170 µm, respectively. (Note that the name of theC160 filter does not correspond to the central wavelength, unlikethe case of the C60 and C100 filters.) The ‘P32’ mapping mode wasused to provide near-Nyquist sampling over an area encompassingthe nebula, as well as the surrounding background. The total expo-sure was 50 min, corresponding to exposures per image pixel expo-sure of 4.7 s at both 60 and 100 µm, and 18.8 s at 170 µm. The area ofthe beam covers about six independent pixels in each filter, so thatthe effective exposure time per beam is about six times longer in each
C© 2004 RAS, MNRAS 355, 1315–1326

FIR and submm observations of the Crab nebula 1317
Table 1. Details of the ISOPHOT observations of the Crab nebula.
Filter Effective TDTa Image Centre (J2000.0) PAb Image samplingc Image size Background FWHMd Integratedwavelength RA Dec. Y × Z flux densitye
(µm) (h m s) (◦ ′ ′′) (◦) (arcsec2) (arcsec2) (MJy sr−1) (arcsec) (Jy)
C60 60 82301720 05 34 32.44 +22 01 14.5 356.80 15.32 × 23.00 570 × 520 25.6 44 140.7 ± 11 per centC100 100 82301720 05 34 32.44 +22 01 14.5 356.81 15.32 × 23.00 570 × 520 28.9 47 128.2 ± 11 per centC160 170 82401805 05 34 31.70 +22 00 48.2 356.84 30.65 × 46.00 766 × 506 52.0 93 83.2 ± 12 per cent
Notes: aTarget dedicated time identifier. The first three digits give the orbit identifier, which is also the epoch of the observation in days after 1995 November17. bPositive Y direction (the direction of the chopper sweep), degrees E from N. cSpacecraft coordinates. dFWHM of the equivalent area circular Gaussian.eThe uncertainties are a combination of those due to the uncertainty in the spectrum of the absolute calibrators (10 per cent in each band) and long-termvariations in detector responsivity (determined from the dispersion in the response of individual pixels to the background to be 3 per cent at 60 and 100 µmand 6 per cent at 170 µm). The systematic uncertainties dominate the random uncertainties, which at 60 and 100 µm are mainly due to residual glitches in thedetector signal response – at a level of ≈1 per cent – and at 170 µm are mainly due to the shot noise induced by the illumination of the target and background– at a level of ≈2 per cent.
Figure 1. ISOPHOT images of the Crab nebula at 60 and 100 µm, with resolutions of 43.5 and 46.8 arcsec, respectively. The contours are every 25 MJy sr−1
at 60 µm, and every 18 MJy sr−1 at 100 µm, and the dashed rectangles indicate the regions observed. The circles at the lower left-hand side indi-cate the resolution of the observations. The labelled crosses on the 100-µm image indicate where LWS spectra were obtained (see Section 2.2 andTable 2).
case. The data for each wavelength were separately processed us-ing the latest P32 reduction package (Tuffs & Gabriel 2003), whichcorrects for the transient response of the detector pixels. A time-dependent flat-field correction was made for each image, by fittinga quadratic function to the response of the detector pixels to thebackground. Calibration was made using V8.1 of the ISOPHOTInteractive Analysis (PIA) Package (Gabriel et al. 1997), which isbased on the onboard calibration source (which was periodicallychecked with respect to the primary celestial calibrators). Althoughthe images are oversampled, independent data contribute to eachimage pixel. Finally, the background was removed by subtractinga tilted plane obtained from a fit to the extremities of the image(external to the extent of the nebula). The derived images at 60, 100and 170 µm are shown in Figs 1 and 2.
The integrated flux densities of the nebula at the 60 100 and170 µm, together with the backgrounds, are given in Table 1. TheISO backgrounds are consistent with the backgrounds measuredfrom COBE/DIRBE to within about 15 per cent in C160 and towithin about 10 per cent at 100 and at 60 µm. These accuracies arelimited by the background dust emission from the Milky Way in
the COBE 40-arcmin beams. Even though the ISOPHOT data havebeen corrected for signal losses due to the transient response of thedetectors, the integrated flux densities at 60 and 100 µm are lowerby about 30 per cent compared with those found by IRAS in thecorresponding bands. This seems to be a general phenomenon, andnot just restricted to data sets considered in this paper. The discrep-ancies seem to be larger for extended sources than for point-likesources (see Tuffs et al. 2002; Tuffs & Gabriel 2003). This differ-ence between ISO and IRAS photometry of extended sources maybe due to the fact that a single correction factor is used to correct forsignal losses due to the transient response of the IRAS detectors (seethe IRAS Explanatory Supplement, Beichman et al. 1988), whereasthe corrections for the ISOPHOT data self-consistently take intoaccount the source structure. As the IRAS correction factor was de-rived from measurements of point source primary calibrators, andit is inherent to the transient response of the Ge:Ga detectors thatthe shortfall in signal will be greater for point sources than for ex-tended sources, this may explain the higher integrated flux densitiesobtained for IRAS observations of extended sources in the 60- and100-µm bands compared with ISOPHOT.
C© 2004 RAS, MNRAS 355, 1315–1326

1318 D. A. Green, R. J. Tuffs and C. C. Popescu
Figure 2. ISOPHOT images of the Crab nebula at 170 µm, with a resolutionof 92.6 arcsec. The contours are every 5 MJy sr−1, and the dashed rectangleindicates the region observed. The circle at the lower left-hand side indicatesthe resolution of the observations.
2.2 LWS spectra
Spectroscopic observations were made towards four directions inthe nebula (marked by crosses superimposed on the 100 µm im-age of Fig. 1) with the Long-wavelength Spectrometer (LWS)
Table 2. Details of LWS spectra observed towards the Crab nebula, and the measured contributions of the detected line emission to theISOPHOT and IRAS 60- and 100-µm images.
Label Position PHT measureda line line power Equivalent in-filter continuum brightnessb
(J2000.0) C60 C100 (10−14 W m−2) PHT-C60 PHT-C100 IRAS-60 µm IRAS-100 µm(MJy sr−1) (MJy sr−1) (MJy sr−1) (MJy sr−1) (MJy sr−1) (MJy sr−1)
LWS1 05 34 34.2 195 181 [O III] 52 µm 4.1 8 – 7 –+22 01 02.3 [O I] 63 µm 1.2 5 – 3 –
[O III] 88 µm 3.2 – 13 – 13Total 13 13 10 13
LWS2 05 34 31.9 90 76 [O III] 52 µm 2.1 4 – 4 –+22 02 04.8 [O I] 63 µm 1.1 4 – 3 –
[O III] 88 µm 1.7 – 2 – 3Total 8 2 7 3
LWS3 05 34 29.3 216 161 [O III] 52 µm 7.1 13 – 12 –+22 00 37.0 [O I] 63 µm 2.0 8 – 5 –
[O III] 88 µm 4.4 – 17 – 18Total 21 17 17 18
LWS4 05 34 34.1 132 121 [O III] 52 µm 2.7 5 – 5 –+21 59 54.6 [O I] 63 µm 1.5 6 – 4 –
[O III] 88 µm 1.9 – 8 – 8Total 11 8 9 8
Notes: aAfter convolution to a Gaussian approximation (FWHM 68 arcsec) to the LWS beams measured by Lloyd (2003). bThe equivalentbrightness of the diffuse continuum emission which would give rise to the same power received by the ISOPHOT or IRAS detectors asreceived by the LWS from the emission lines.
instrument onboard ISO (see Clegg et al. 1996). These spec-tra show the presence of strong emission from all the [O I] and[O III] lines. Details of these spectra, and the results, are given inTable 2, and the spectra are shown in Fig. 3. The spectra arestandard pipeline products (OLP Version 10), taken from the ISOarchive (from a program of D. Pequignot), and include some spikesdue to cosmic rays. Two of the positions observed (LWS1 andLWS3) were close to the two FIR peaks seen on the ISOPHOT60- and 100-µm image, near to the centre of the Crab nebula (seeFig. 1), with the other two positions being nearer the edge of thenebula.
3 J C M T DATA R E D U C T I O N A N D R E S U LT S
The Crab nebula was observed with the Submillimetre Common-User Bolometer Array (SCUBA) (Holland et al. 1999) using the‘850-µm’ filter on the James Clerk Maxwell Telescope (JCMT) on1999 September 19. SCUBA operates at both 850 and 450 µm si-multaneously, but since the surface of the telescope was not well setwhen the observations were made, only the results at 850 µm arepresented. The 850-µm SCUBA filter is actually centred at 863 µm(i.e. 347 GHz). At this wavelength SCUBA has 37 bolometers, eachwith an ideal resolution of 13 arcsec, covering a field of view of≈2 arcmin. As the Crab nebula is significantly larger than theSCUBA field of view, the observations were made in the scan–map mode, where the array scans across the source with the tele-scope continuously ‘chopping’ in a particular direction. A varietyof chop-throw and scanning directions were observed, in order tosample structure well in all directions, and on scales missed by anysingle chop throw. In total six chop throws were used (30, 44 and68 arcsec in both RA and Dec.), each for three different scanningdirections (at position angles, PAs, of 15.◦5, 75.◦5 and 135.◦5). A re-gion of 9 × 7 arcmin2, at a PA of 45◦, was observed in order toensure a clear emission-free region around the Crab nebula wascovered. The observations were made in two sessions, over about4.5 h, at elevations of between ≈60◦ and ≈80◦. Each session was
C© 2004 RAS, MNRAS 355, 1315–1326

FIR and submm observations of the Crab nebula 1319
Figure 3. LWS spectrum from four positions towards the Crab nebula, at points indicated on the 100-µm image in Fig. 1.
preceded by observations of the standard source CRL 618, and waspreceded and followed by a sky-dip calibration. The observing con-ditions varied little, as indicated by both the sky-dip observations,and the Caltech Submillimeter Observatory ‘tau-meter’ readings at225 GHz (which varied between 0.048 and 0.065 for the Crab nebulaobservations).
The data were reduced using a series of standard procedures fromthe SCUBA User Reduction Facility (SURF) package (see Jenness& Lightfoot 2000). This processing included corrections for theextinction at 850 µm, as measured by sky-dip observations (theobserved optical depths varied between 0.19 and 0.21); removal ofspikes in the data, both manually and automatically; removal of sixpoorly performing bolometers (four of which were at the edge ofthe bolometer array); removal of linear baselines; and removal ofsky contributions. Finally, the data were restored to an image usinga MEM algorithm (Pierce-Price 2001).
The flux density scale was set by the observations of the cali-brator source CRL 618 (with an assumed flux density of 4.56 Jy at
850 µm, from the JCMT calibrator webpages,1 see also Sandell1994). The scaling factor used was the average of those determinedfrom the two available observations of CRL 618, which differedby only ±2 per cent from their mean (with this flux scale, the in-tegrated flux density of the Crab nebula is in good agreement withthat expected from extrapolation of data from lower frequencies, seebelow). From the CRL 618 observations the beam was fitted with aGaussian of HPBW of 16 arcsec.
Fig. 4 shows the emission from the Crab nebula at 850 µm fromthese observations, smoothed slightly to a resolution of 17 arcsec.The noise on this image, in small regions away from the Crab neb-ula, is ≈0.017 Jy beam−1, with variations in the local baselevel awayfrom the Crab nebula, up to ≈0.05 Jy beam−1. This image has con-siderably higher dynamic range than the 1.3-mm image of Bandieraet al., although it does have slightly poorer resolution.
1 See http://www.jach.hawaii.edu/
C© 2004 RAS, MNRAS 355, 1315–1326
1320 D. A. Green, R. J. Tuffs and C. C. Popescu
Figure 4. The Crab nebula at 850 µm (347 GHz) from the JCMTSCUBA observations, with a resolution of 17 arcsec. Contours are every0.08 Jy beam−1.
The integrated flux density of the Crab nebula from the SCUBA850-µm observations is ≈190 Jy. This was determined by inte-grating within polygons drawn beyond to the boundary of emis-sion from the remnant. The flux density obtained varied by up to≈2 per cent, depending on where an individual polygon was drawn.We conservatively take the uncertainty in the integrated flux densityto be 10 per cent, to include the uncertainties in choice of polygonto integrate over the small change in amplitude scaling seen fromthe observations of CRL 618 above, and any uncertainty in the as-sumed flux density for CRL 618. As discussed below, this is in goodagreement with the prediction of the expected flux density from theextrapolation of the synchrotron spectrum of the Crab nebula atlower frequencies.
4 D I S C U S S I O N
4.1 Submillimetre/infrared spectrum
The integrated spectrum of the Crab nebula is shown in Fig. 5, to-gether with an extrapolation of the synchrotron spectrum into theinfrared domain from the ultraviolet (UV)/optical domain (fromWoltjer 1987) and from the radio domain (from Baars et al. 1977).In making the extrapolation from the radio domain we took intoaccount the fact that Baars et al. give a fitted spectrum for thesynchrotron emission from the Crab nebula for frequencies up to35 GHz, from observations predominantly made in the late 1960s.As the Crab nebula is known to be fading at a rate of 0.167 ±0.015 per cent yr−1 at 8 GHz (Aller & Reynolds 1985), the ex-trapolated spectrum shown in Fig. 5 has decreased by 5.5 per cent(i.e. corresponding to a period of 33 yr, the difference mean dateof the observations used by Baars et al. and our observations). Theuncertainties in the extrapolation of the Baars et al. spectrum are:(i) the overall uncertainty in amplitude scale (which is 10±0.031, i.e.≈7.4 per cent); (ii) a frequency-dependent uncertainty due to theuncertainty in the spectral index [which is (ν/ν 0)±0.009]; (iii) anyuncertainty if the fading at higher frequencies is different from thatmeasured by Aller & Reynolds at 8 GHz, which is as yet unknown.
The uncertainty in the spectral index – using a reference frequencyof 7 GHz, which is close to the centre of the frequencies of theobservations used by Baars et al. – corresponds to uncertainties of≈3.5 per cent at 850 µm, increasing to ≈6.2 per cent at 60 µm.Adding the uncertainties due to the overall amplitude scale of thefitted spectrum and the spectral index in quadrature gives an un-certainty in the extrapolated spectrum of ≈8.2 per cent at 850 µm,increasing to ≈9.7 per cent at 60 µm, as is indicated by the dashedlines at λ < 100 µm in Fig. 5. We note the following.
(i) The ISOPHOT 170-µm flux density is somewhat low com-pared with the extrapolated Baars et al. spectrum, although this isnot highly significant (see the further discussion below).
(ii) Both the 100- and 60-µm flux densities show clear evidencefor an excess above the extrapolated synchrotron spectrum (see Sec-tion 4.2 for a further discussion), albeit at a somewhat lower levelthan has been seen previously from IRAS observations (e.g. Strom& Greidanus). This excess covers a range of frequencies that istoo narrow for it to be synchrotron emission. Further evidence thatthe FIR excess is thermal is provided by the polarization measure-ments of Klaas et al. (1999), which show that the excess emission isunpolarized.
(iii) The 850-µm flux density is consistent with the extrapolatedBaars et al. spectrum, unlike the 1.2-mm flux density from Bandieraet al. (see the further discussion in Section 4.5).
The expected flux density from the extrapolation of the Baars et al.spectrum at 170 µm is 105.5 ± 9.5 Jy, whereas the 170-µm in-tegrated flux density is 83.2 ± 9.8 Jy (see Table 1). The differ-ence in these values is 22 ± 14 Jy, which is not highly signifi-cant. If this deficit is real, it could be indicative of spectral turnoverbetween 850 and 170 µm. Further evidence for a steepening ofthe FIR synchrotron spectrum at these wavelengths is provided bythe differences in the surface brightness distributions at 850 and170 µm (see the further discussion in Section 4.3). Overall, our dataare more consistent with a gradual transition between the ν−0.3 radiospectrum and the ν−0.85 UV–optical spectrum (Woltjer 1987) span-ning the whole of the FIR–near-IR, rather than a sharp break in themid-IR. Support for a gradual turnover in the infrared synchrotronemission is provided by the ISOCAM CVF measurements ofDouvion et al. (2001), which had sufficient spectral resolution to sep-arate the continuum and line components. Douvion et al. found thatthe continuum emission between 6.5 and 16 µm is well described bya ν−1/2 power law; i.e. with a slope intermediate between the slopesof the radio and the UV–optical power laws. We have also plotted theMIR continuum spectrum of Douvion et al. in Fig. 5, multiplied bya correction factor of 1.29 to compensate for the fact that Douvionet al. did not image the whole of the Crab nebula. This correctionfactor was determined from an image of the 2.26-µm continuumemission of the nebula by measuring the ratio of the flux densityintegrated over the whole source to the flux density integrated overa synthetic 192 × 192 arcsec2 aperture representing the ISOCAMfield of view. Also shown in Fig. 5 is the integrated continuum fluxdensity found from an image (Gallant & Tuffs 2002) in photometricconditions in 1997 using the Calar Alto 3.5-m telescope in a narrowband (�λ/λ = 0.03) filter centred at 2.26 µm. The intrinsic contin-uum flux density at 2.26 µm of the nebula is 9.6 ± 0.7 Jy, which isthe measured flux density (after star subtraction) of 8.08 ± 0.03 Jy,divided by 0.839 to correct for extinction, following the extinctionlaw found for stars in the field of the nebula by Wu (1981). Theextrapolation to shorter wavelengths of the Douvion et al. powerlaw (scaled to the integrated emission from the nebula) passes closeto the 2.26-µm point, and the extrapolation to longer wavelengths
C© 2004 RAS, MNRAS 355, 1315–1326

FIR and submm observations of the Crab nebula 1321
Figure 5. The submillimetre/infrared spectrum of the Crab nebula. The filled circles are from the JCMT (850-µm) and ISO (170-, 100- and 60-µm) observationsreported here. The open circles are flux densities: (a) at 1.2 mm from Bandiera et al. (2002); (b) from IRAS at 100, 60, 25 and 12 µm from Strom & Greidanus(1992) – see Section 2.1 for a discussion of the discrepancy between the IRAS and ISO photometry at 60 and 100 µm; (c) a scaled pure continuum flux densityat 16 µm from Douvion et al. (2001) – see the text for details of the scaling – together with a pure continuum spectrum through this point with α = 0.50(dotted line); (d) a pure continuum flux density at 2.26 µm – see the text for details. The open triangle is an additional 1.2-mm flux density from Mezger et al.(1986). The range of frequencies covered is indicated for the broad-band IRAS and ISO observations. The solid line at lower frequencies is an extrapolationof the synchrotron spectrum from radio frequencies from Baars et al. (1977), with errors shown as dashed lines. The dashed line at higher frequencies is anextrapolation of the S = 12.9(ν/105 GHz)−0.85 Jy optical/UV spectrum from Woltjer (1987). The vertical lines at the bottom of the plot mark the positions oflines at 12.8, 15.5, 26, 52, 63 and 88 µm.
intersects with the extrapolation of the radio spectrum at around400 µm.
4.2 ISOPHOT 60- and 100-µm images
At all three FIR wavelengths the smooth synchrotron emissionseen at longer wavelengths is clearly evident. For comparison, the
Figure 6. 850-µm image of the Crab nebula smoothed to resolutions of47 arcsec to match the resolution of the ISOPHOT images at 100 µm shownin Fig. 1. The contours are linearly spaced.
SCUBA 850-µm image has been convolved to the ISOPHOT beamat 100 µm, see Fig. 6. However, at 60 and 100 µm two prominentfeatures, separated by ≈80 arcsec and connected by a ridge run-ning almost east–west. To a precision of 10 arcsec the positionsof the peaks (J2000) are 05h 34m 28.s7, +22◦ 00′ 30′′ for the west-ern peak and 05h 34m 34.s1, +22◦ 00′ 45′′ for the eastern peak. Thecorresponding offsets from the current position of the pulsar are:45 arcsec W, 22 arcsec S and 30 arcsec E and 7 arcsec S, respec-tively, and the corresponding offsets from Star 16 of Wyckoff &Murray (1977) are 48 arcsec W, 25 arcsec S and 27 arcsec E and10 arcsec S. These features are close to the peaks in the image ofthe [O III] line emission, from Lawrence et al. (1995), convolved tothe resolution of the ISOPHOT 100-µm image, which is shown inFig. 7. Within the positional uncertainties, the eastern and westernpeaks coincide with absorption spots 3C and 1D, respectively, ofFesen & Blair (1990). Part of the eastern peak was imaged by theHST by Blair et al. (1997). The prominent sinuous dust shadowof extent 25 arcsec seen on the HST images lies within 15 arcsecof the FIR emission peak which (like its western counterpart) ap-pears slightly resolved in the ISOPHOT images. We have scaled the850-µm image, assuming a power-law extrapolation to 100 µm(with a spectral index of 0.30), and removed this from the observed100-µm image. Fig. 7 also shows this synchrotron-removed 100-µm image. The fact that there is evidently less extended emission
C© 2004 RAS, MNRAS 355, 1315–1326

1322 D. A. Green, R. J. Tuffs and C. C. Popescu
Figure 7. Top: [O III] image of the Crab nebula smoothed to resolutions of47 arcsec to match the resolution of the ISOPHOT image at 100 µm shownin Fig. 1 (bottom) ISOPHOT image of the Crab nebula at 100 µm, with ascaled version of the 850 µm removed. The contours are linearly spaced ineach case. The crosses indicate the position of the Crab pulsar at AD 1054and 2000.
in the NW at 100 µm than is expected from a power-law extrapo-lation from lower frequencies is consistent with the discussion inSection 4.3, that is a spectral turnover between 850 and 170 µm.
The correspondence between the 60- and 100-µm peaks, andthe smoothed [O III] emission image, together with the absence ofcorresponding peaks of synchrotron emission at 850 µm, suggeststhat these FIR features are produced through a thermal emissionmechanism. The excess emission could potentially arise from dust(either in the ejecta or a circumprogenitor medium), or could beFIR fine-structure line emission (also either from ejecta or from acircumprogenitor medium). In order to determine whether the FIRexcess could be due to line emission, we compared the ISOPHOTsurface brightnesses in the principal lines with the ISOPHOT sur-face brightnesses seen at the same positions on maps convolvedwith the LWS beam (see Table 2). We considered the principal linesseen in the spectral range covered by the C60 and C100 ISOPHOTfilters, which are [O III] 52 µm, [O I] 63 µm and [O III] 88 µm. In allpositions at most 11 per cent of the emission seen in the C100 andC60 filters can be attributed to line emission. In addition, this per-centage seems to be independent of position in the nebula. Therefore,it appears that the ‘FIR bump’ in the integrated spectra is not due toline emission, and furthermore that the two compact sources seenon the ISOPHOT 60- and 100-µm images are also not due to lineemission. Essentially none of the emission seen in the C160 filter isdue to line emission.
We conclude that the excess emission in the FIR bump (and whichis most prominently in the peaks seen in Fig. 7) is primarily due todust emission. The difference between the relative brightness of
these peaks; i.e. at 100 µm, the eastern peak is brighter, whereas at60 µm, the western peak is brighter – would then reflect differentdust temperatures in the peaks, caused by differences in the strengthand/or colour of the local radiation field. To estimate the mass ofgrains needed to account for the FIR bump we nevertheless approx-imate the integrated emission in the bump as arising from eithersilicate or graphite grains at a single temperature, with optical prop-erties given by Laor & Draine (1993). The FIR dust emission 60and 100 µm was calculated (see Table 3) by subtracting from theobserved flux densities the contributions due to line emission (cal-culated from an average of the entries in Table 2 to be a fraction of0.08 and 0.07 of the total emission in the C60 and C100 filters, re-spectively) and an extrapolation of the MIR pure synchrotron powerlaw [25.9 (ν/18.7 THz)−1/2 Jy, as derived from the ISOCAM mea-surements of Douvion et al. in Section 4.1]. The uncertainties inthe derived dust flux densities are dominated by the uncertaintiesin the measured flux densities. Table 3 also includes estimates ofthe synchrotron and dust emission at 170 µm. The dust emissionat 60 and 100 µm is consistent with a small amount of warm dust(0.01–0.07 M� of silicate at temperatures around 45 K or 0.003–0.02 M� of graphite at temperatures around 50 K). The geometryof this warm dust emission is consistent with a torus of diameter≈0.8 pc, presumably created by the supernova progenitor. There isno evidence for dust emission towards the dark bays in the opticalemission from the remnant in the east and west (Fesen, Martin &Shull 1992).
It should be emphasized that the main reason that the FIR bumpcan be accounted for by such a moderate quantity of grains is thelack of any evidence for emission from cold dust in the 170-µmband of ISOPHOT, which is the most sensitive of our measuredbands for detecting grains with temperatures in the 10–20 K range.Our nominal estimate for the integrated flux density of the total dustemission at 170 µm is −22 ± 13 Jy, a number obtained by sub-tracting a synchrotron flux density estimated from an extrapolationof the long-wavelength radio spectrum from the total measured fluxdensity, and assuming line emission can be neglected in this band(see Table 2). At 170 µm, the Rayleigh–Jeans tail of the warm dustemission detected at 60 and 100 µm is expected to contribute upto 14 Jy, implying only ∼ −36 ± 13 Jy might be attributable tocold dust, i.e. at nearly the 3σ level, our observations are consistentwith there being no cold dust in the nebula. A limit from any colddust component of 3 Jy at 170 µm, assuming a grain temperatureof 15 K, would correspond to upper limits of ∼0.1 and ∼0.4 M�from cold dust in the form of graphite and silicate, respectively (fora distance of 2 kpc). These upper limits are, however, very crude,since the grain temperature of any cold dust is not well constrainedby our data. Moreover, if the synchrotron spectrum is turning over
Table 3. Estimated contributions to the measured integrated flux den-sity from synchrotron, line and dust emission at the observed ISO wave-lengths.
Flux densityWavelength Measured Synchrotron Line Dust
(µm) (Jy) (Jy) (Jy) (Jy)
170 83 ± 10 105 ± 9a – −22 ± 13100 128 ± 14 65 ± 7b 9 54 ± 1660 141 ± 15 50 ± 5b 11 80 ± 16
Notes: aExtrapolated from the radio spectrum of Baars et al. (1977)corrected for secular changes (see Section 4.1). bExtrapolated from theMIR pure synchrotron spectrum of Douvion et al. (see Section 4.1),with a nominal uncertainty of 10 per cent.
C© 2004 RAS, MNRAS 355, 1315–1326

FIR and submm observations of the Crab nebula 1323
Figure 8. The Crab nebula at 20 cm (1515 MHz) from VLA observationsmade by Michael Bietenholz, with a resolution of 17 arcsec for comparisonwith Fig. 4. Contours are every 0.4 Jy beam−1.
at 170 µm – as is suggested in Section 4.3 below – then the simpleextrapolation of the synchrotron emission from larger wavelengthsis likely to overestimate the synchrotron emission somewhat. A con-straint on any cold dust arising from the positions of the warm dustemission peaks is provided by the almost identical morphology seenat 850 µm and the 20-cm pure synchrotron image (Figs 4 and 8).This suggests that at most ∼0.1 Jy of the 850-µm emission canarise from cold dust at each peak, which corresponds to respectiveupper limits of ∼0.04 M� and ∼0.15 M� of graphite and silicateassuming a grain temperature of 15 K.
4.3 Comparison of 170- and 850-µm images
The ISOPHOT 170-µm image shows a centrally brightened struc-ture reminiscent of that seen at longer wavelengths (i.e. syn-chrotron emission), with no indication of the peaks seen at 100 and60 µm. However, a detailed comparison of the 170-µm image withthe JCMT 850-µm image, which we take to be synchrotron emis-sion, does reveal differences in the details of the emission struc-ture at these two wavelengths. Fig. 9 shows the 850-µm imagesmoothed to the resolution of the ISOPHOT 170-µm image. Com-parison with Fig. 2 shows that the peak of the 170-µm emission(near 5h 34m 31.s7, +21◦ 0′ 30′′), is displaced by about 40 arcsecto the south of the 850-µm peak (near 5h 34m 30.s9, +21◦ 1′ 10′′),which is much larger than any expected uncertainties in the posi-tional accuracy of the images. Moreover, the 170-µm emission isrelatively fainter in the NW compared with the expected extrapo-lation of the synchrotron emission from 850 µm (see Fig. 7). Oneexplanation of this, which would also explain the ISOPHOT 170-µmflux density being low, is that the effect of a break in the synchrotronspectrum is becoming evident, but predominantly in the NW of theremnant, at wavelengths between 850 and 170 µm. We note thatthe optical extent of the Crab nebula agrees well with the radio ex-tent of the remnant everywhere except in the NW (see Velusamy1984), where the cm-wavelength radio emission extends beyondthe optical emission. Sankrit & Hester (1997) note that there is no
Figure 9. Comparison of the ISOPHOT 170-µm image of the Crab nebula(dashed contours), with the JCMT 850-µm image smoothed to the sameresolution (solid contours). Both sets of contours are linearly spaced.
[O III] ‘skin’ in the N and NW where the radio emission extends be-yond the optical range. Generally it has long been recognized (e.g.Woltjer 1987) that the extent of the synchrotron emission decreaseswith increasing frequency (i.e. energy), due to the smaller lifetime ofthe more energetic particles responsible for the higher-energy emis-sion. However, it is not clear how one should relate the deficit of theoptical, thermal, emission to a spectral turnover at lower frequenciesfor the non-thermal synchrotron emission in the NW.
4.4 Dust in the remnant
One of the important results of this investigation is the discoverythat the dust in the Crab nebula is preferentially associated with theeast–west chain of filaments seen predominantly in [O III], lying justsouth of the position of the pulsar. This bears some resemblance tothe situation in Cas A, where MIR emission from dust is seen fromthe [O III]-emitting fast optical filaments (Lagage et al. 1996), butcontrasts with the situation in Kepler’s supernova remnant, wherethe MIR emission appears to be associated with circumstellar dust(Douvion et al. 2001). These filaments are also helium-rich and havepreviously been hypothesized to be associated with circumstellarmaterial responsible for the asymmetry in the north–south expan-sion of the nebula (MacAlpine et al. 1989; Lawrence et al. 1995;Fesen, Shull & Hurford 1997). Thus, the dust associated with thesefilaments may well also be of circumstellar origin. The ISOPHOT60- and 100-µm images reveal the extent and geometry of the dust-rich circumstellar matter in the nebula, showing it to be consistentwith a torus of diameter ≈80 arcsec (or 0.8 pc for a distance of2 kpc). This can be compared with the circumstellar ring aroundSN 1987A, which has also been shown to be a dust emission source(Fischera, Tuffs & Volk 2002a), and which has a diameter of 1.3 pc.Unlike the Crab, which is thought to have had a red supergiant pro-genitor, the progenitor of SN 1987A was a blue supergiant star andleft no detectable pulsar-powered nebula behind. The occurrence ofquite similar structures associated with such different progenitorssuggests that dusty circumstellar rings may be commonly associatedwith supernovae (see also Pozzo et al. 2004, who show evidence forcircumstellar dust around SN 1998S).
About half of the dust emission in the Crab nebula can be at-tributed to the dust torus, and assuming that radiation fields illu-minating the grains in the filaments are not strongly dependent onposition within the nebula or on the chemical composition of thefilament, about half of the total dust mass might be circumstellar in
C© 2004 RAS, MNRAS 355, 1315–1326

1324 D. A. Green, R. J. Tuffs and C. C. Popescu
origin. We note, however, that, as in case of SN 1987A, the massof dust in the circumstellar medium measured today could be muchlower than that present prior to AD 1054, due to evaporation ofgrains by the ultraviolet-flash from the supernova outburst and sub-sequent sputtering when the blast wave reached the circumstellarmedium (Fischera, Tuffs & Volk 2002b). This would also modifythe grain size distribution by reducing the abundance of small grainsin relation to large grains. Tentative evidence for large grains sizes incomparison with typical interstellar grains is indeed provided froma comparison of the near-UV and optical obscuration in HST images(Blair et al. 1997), which shows that the extinction curve is ratherflat.
The remaining ≈50 per cent of the dust emission can plausibly beidentified as emanating from supernova condensates in the broadlydistributed filaments distributed over the face of the nebula. How-ever, the total mass of grains in condensates which can be inferredfrom our data is at most a few hundredths of a solar mass. Com-parison with the total mass of filaments of 4.6 ± 1.8 M� (mainlyin the form of helium) in the nebula (Fesen et al. 1997) indicatesthat the total dust-to-gas ratio in the nebula is in fact at most onlyof the same order as the interstellar value of ≈0.0075. Thus, even ifthe condensates seen at the present epoch could ultimately escapethe remnant without being destroyed, the surrounding ISM will notbe significantly enriched in dust. In fact, the supernova remnant mayhave the opposite effect; i.e. to dilute the surrounding ISM of grains.We conclude, therefore, that the progenitors of events like that ofAD 1054 are not significant sources of interstellar dust.
Our observations provide meaningful upper limits on the amountof carbon that can be ‘hidden’ in grains in the nebula. The carbonabundance in the nebula is of particular importance to our under-standing of the progenitor. Carbon abundances in the gas phase showthat the ejecta is helium-rich, but not carbon-rich, which places anupper limit2 on the progenitor mass of ≈8 M� when it was on themain sequence (Davidson et al. 1982). However, this estimate as-sumes that all the carbon is in the gas phase. In the extreme casethat all the grains are made of graphite, we infer a maximum massof solid-state carbon of ≈0.02 M�. This can be compared withthe maximum possible amount of carbon present in the filamentsif they had not been significantly enriched in carbon produced bynucleosynthesis in the star. Assuming solar abundances (Anders &Grevesse 1989) this is a fraction 0.0022 of the 4.6 ± 1.8 M� massof the filaments, which is 0.010 ± 0.004 M�. This mass is veryclose to our upper limit on the carbon mass of ≈0.02 M� whichcan be in the form of graphite. We therefore conclude that for theCrab nebula we have found no evidence for a substantial boosting ofthe mass of carbon in the filaments through the presence of carbonin the solid state.
4.5 Synchrotron spectral index variations:centimetre to submillimetre
For a spectral index study of the synchrotron emission from theremnant, the SCUBA image was compared with a Very Large Ar-ray (VLA) image at 20 cm (1515 MHz), which was kindly suppliedby Michael Bietenholz. The VLA image is made from four arraysof VLA data observed in 1987 (see Bietenholz & Kronberg 1991;Bietenholz et al. 1997). For comparison with the SCUBA image,
2 Stars more massive than 8 M� are expected to dredge up freshly synthe-sized carbon from the core regions into the He-rich zone, e.g. Nomoto et al.(1982).
the VLA image was: (i) scaled by 1.6 per cent in size, as is ap-propriate for a convergence epoch of AD 1233 for the expansionof the Crab nebula (Bietenholz et al. 1991) and the difference inepochs of the 850-µm and 20-cm observations and (ii) smoothed toa resolution of 17 arcsec to match that of the SCUBA image, seeFig. 8. [The flux density scale of the VLA image was not changed,as the expected secular change between 1987 and 1999 is small(≈2 per cent) compared with the overall uncertainty in the flux den-sity scales of the observations.] The contour levels in Figs 4 and 8have been chosen to be at similar relative levels. The 20-cm imageis of higher quality, both in terms of its lower noise and the accuracyof the local baselevels. The close similarity between these images –which are at wavelengths that differ by a factor of over 200 – showthat there is no strong spectral index variation across the remnant.Hence, these results show that the particle populations responsiblefor the radio and submillimetre synchrotron emission are distributedvery similarly within the Crab nebula.
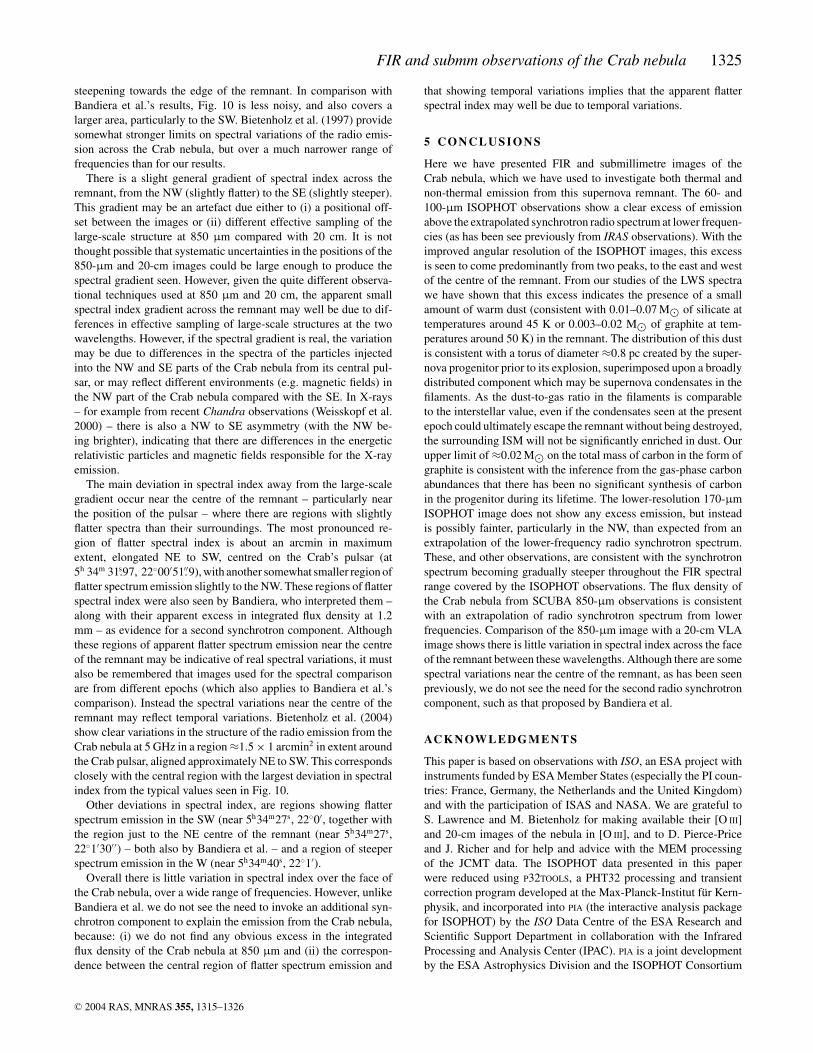
An image of the spectral index between 20 cm and 850 µm, isshown in Fig. 10. The spectral index, α, has been calculated wherethe 850-µm emission exceeds 0.17 Jy beam−1. The random uncer-tainties in the derived spectral indices are dominated by the uncer-tainties in the 850-µm image, not the 20-cm image. Consequentlya 850-µm contour at 0.43 Jy beam−1 is also shown in Fig. 10 (i.e.at approximately eight times the variation in the background levelof the SCUBA image, so the uncertainty in the derived spectral in-dex is less than 0.02 inside this contour). These spectral indices arenot absolute, as the flux density scales of the images are not them-selves correct in an absolute sense; a 10 per cent systematic shift ineither of the flux density scales corresponds to a constant shift by0.018 in the derived flux density. The spectral index over most of theCrab nebula, particularly in regions of the brighter emission, showsvery little variation, with the spectral index being typically between0.29 and 0.33, with no obvious systematic indication of spectral
Figure 10. The spectral index, α, of the Crab nebula between 20 cm and850 µm (see Figs 4 and 8). Contours, and discrete changes in the shading, areat 0.23 to 0.37 in steps of 0.02 (with the higher spectral index values beingdarker). The spectral index is calculated only where the 850-µm emissionexceeds 0.17 Jy beam−1. Also shown is a single thick, black and whitedashed contour of the 850-µm emission, at 0.43 Jy beam−1.
C© 2004 RAS, MNRAS 355, 1315–1326
FIR and submm observations of the Crab nebula 1325
steepening towards the edge of the remnant. In comparison withBandiera et al.’s results, Fig. 10 is less noisy, and also covers alarger area, particularly to the SW. Bietenholz et al. (1997) providesomewhat stronger limits on spectral variations of the radio emis-sion across the Crab nebula, but over a much narrower range offrequencies than for our results.
There is a slight general gradient of spectral index across theremnant, from the NW (slightly flatter) to the SE (slightly steeper).This gradient may be an artefact due either to (i) a positional off-set between the images or (ii) different effective sampling of thelarge-scale structure at 850 µm compared with 20 cm. It is notthought possible that systematic uncertainties in the positions of the850-µm and 20-cm images could be large enough to produce thespectral gradient seen. However, given the quite different observa-tional techniques used at 850 µm and 20 cm, the apparent smallspectral index gradient across the remnant may well be due to dif-ferences in effective sampling of large-scale structures at the twowavelengths. However, if the spectral gradient is real, the variationmay be due to differences in the spectra of the particles injectedinto the NW and SE parts of the Crab nebula from its central pul-sar, or may reflect different environments (e.g. magnetic fields) inthe NW part of the Crab nebula compared with the SE. In X-rays– for example from recent Chandra observations (Weisskopf et al.2000) – there is also a NW to SE asymmetry (with the NW be-ing brighter), indicating that there are differences in the energeticrelativistic particles and magnetic fields responsible for the X-rayemission.
The main deviation in spectral index away from the large-scalegradient occur near the centre of the remnant – particularly nearthe position of the pulsar – where there are regions with slightlyflatter spectra than their surroundings. The most pronounced re-gion of flatter spectral index is about an arcmin in maximumextent, elongated NE to SW, centred on the Crab’s pulsar (at5h 34m 31.s97, 22◦00′51.′′9), with another somewhat smaller region offlatter spectrum emission slightly to the NW. These regions of flatterspectral index were also seen by Bandiera, who interpreted them –along with their apparent excess in integrated flux density at 1.2mm – as evidence for a second synchrotron component. Althoughthese regions of apparent flatter spectrum emission near the centreof the remnant may be indicative of real spectral variations, it mustalso be remembered that images used for the spectral comparisonare from different epochs (which also applies to Bandiera et al.’scomparison). Instead the spectral variations near the centre of theremnant may reflect temporal variations. Bietenholz et al. (2004)show clear variations in the structure of the radio emission from theCrab nebula at 5 GHz in a region ≈1.5 × 1 arcmin2 in extent aroundthe Crab pulsar, aligned approximately NE to SW. This correspondsclosely with the central region with the largest deviation in spectralindex from the typical values seen in Fig. 10.
Other deviations in spectral index, are regions showing flatterspectrum emission in the SW (near 5h34m27s, 22◦0′, together withthe region just to the NE centre of the remnant (near 5h34m27s,22◦1′30′ ′) – both also by Bandiera et al. – and a region of steeperspectrum emission in the W (near 5h34m40s, 22◦1′).
Overall there is little variation in spectral index over the face ofthe Crab nebula, over a wide range of frequencies. However, unlikeBandiera et al. we do not see the need to invoke an additional syn-chrotron component to explain the emission from the Crab nebula,because: (i) we do not find any obvious excess in the integratedflux density of the Crab nebula at 850 µm and (ii) the correspon-dence between the central region of flatter spectrum emission and
that showing temporal variations implies that the apparent flatterspectral index may well be due to temporal variations.
5 C O N C L U S I O N S
Here we have presented FIR and submillimetre images of theCrab nebula, which we have used to investigate both thermal andnon-thermal emission from this supernova remnant. The 60- and100-µm ISOPHOT observations show a clear excess of emissionabove the extrapolated synchrotron radio spectrum at lower frequen-cies (as has been see previously from IRAS observations). With theimproved angular resolution of the ISOPHOT images, this excessis seen to come predominantly from two peaks, to the east and westof the centre of the remnant. From our studies of the LWS spectrawe have shown that this excess indicates the presence of a smallamount of warm dust (consistent with 0.01–0.07 M� of silicate attemperatures around 45 K or 0.003–0.02 M� of graphite at tem-peratures around 50 K) in the remnant. The distribution of this dustis consistent with a torus of diameter ≈0.8 pc created by the super-nova progenitor prior to its explosion, superimposed upon a broadlydistributed component which may be supernova condensates in thefilaments. As the dust-to-gas ratio in the filaments is comparableto the interstellar value, even if the condensates seen at the presentepoch could ultimately escape the remnant without being destroyed,the surrounding ISM will not be significantly enriched in dust. Ourupper limit of ≈0.02 M� on the total mass of carbon in the form ofgraphite is consistent with the inference from the gas-phase carbonabundances that there has been no significant synthesis of carbonin the progenitor during its lifetime. The lower-resolution 170-µmISOPHOT image does not show any excess emission, but insteadis possibly fainter, particularly in the NW, than expected from anextrapolation of the lower-frequency radio synchrotron spectrum.These, and other observations, are consistent with the synchrotronspectrum becoming gradually steeper throughout the FIR spectralrange covered by the ISOPHOT observations. The flux density ofthe Crab nebula from SCUBA 850-µm observations is consistentwith an extrapolation of radio synchrotron spectrum from lowerfrequencies. Comparison of the 850-µm image with a 20-cm VLAimage shows there is little variation in spectral index across the faceof the remnant between these wavelengths. Although there are somespectral variations near the centre of the remnant, as has been seenpreviously, we do not see the need for the second radio synchrotroncomponent, such as that proposed by Bandiera et al.
AC K N OW L E D G M E N T S
This paper is based on observations with ISO, an ESA project withinstruments funded by ESA Member States (especially the PI coun-tries: France, Germany, the Netherlands and the United Kingdom)and with the participation of ISAS and NASA. We are grateful toS. Lawrence and M. Bietenholz for making available their [O III]and 20-cm images of the nebula in [O III], and to D. Pierce-Priceand J. Richer and for help and advice with the MEM processingof the JCMT data. The ISOPHOT data presented in this paperwere reduced using P32TOOLS, a PHT32 processing and transientcorrection program developed at the Max-Planck-Institut fur Kern-physik, and incorporated into PIA (the interactive analysis packagefor ISOPHOT) by the ISO Data Centre of the ESA Research andScientific Support Department in collaboration with the InfraredProcessing and Analysis Center (IPAC). PIA is a joint developmentby the ESA Astrophysics Division and the ISOPHOT Consortium
C© 2004 RAS, MNRAS 355, 1315–1326

1326 D. A. Green, R. J. Tuffs and C. C. Popescu
with the collaboration of IPAC. Contributing ISOPHOT consortiuminstitutes are the Dublin Institute for Advances Studies, the Ruther-ford Appleton Laboratory, the Astrophysics Institute Potsdam, theMax-Planck-Institut fur Kernphysik, and the Max-Planck-Institutfur Astronomy. The JCMT is operated by the Joint Astronomy Cen-tre in Hilo, Hawaii on behalf of the parent organizations ParticlePhysics and Astronomy Research Council in the United Kingdom,the National Research Council of Canada and The Netherlands Or-ganization for Scientific Research.
R E F E R E N C E S
Aller H. D., Reynolds S. P., 1985, ApJ, 293, L73Anders E., Grevesse N., 1989, Geochim. Cosmochim. Acta, 53, 197Baars J. W. M., Genzel R., Pauliny-Toth I. I. K., Witzel A., 1977, A&A, 61,
99Bandiera R., Neri R., Cesaroni R., 2002, A&A, 386, 1044Beichman C., Neugebauer G., Habing H. J., Clegg P. E., Chester T. J., 1988,
Infrared Astronomical Satellite (IRAS) Explanatory Supplement, NASA,RP-1190
Bietenholz M. F., Kronberg P. P., 1991, ApJ, 368, 231Bietenholz M. F., Kronberg P. P., Hogg D. E., Wilson A. S., 1991, ApJ, 373,
L59Bietenholz M. F., Kassim N., Frail D. A., Perley R. A., Erickson W. C.,
Hajian A. R., 1997, ApJ, 490, 291Bietenholz M. F., Frail D. A., Hester J. J., 2001, ApJ, 560, 254Bietenholz M. F., Frail D. A., Hester J. J., 2004, ApJ, in pressBlair W. P., Davidson K., Fesen R. A., Uomoto A., MacAlpine G. M., Henry
R. B. C., 1997, ApJS, 109, 473Caraveo P. A., Mignani R. P., 1999, A&A, 344, 367Clegg P. E. et al., 1996, A&A, 315, L38Davidson K. et al., 1982, ApJ, 253, 696Douvion T., Lagage P. O., Cesarsky C. J., Dwek E., 2001, A&A, 373, 281Dunne L., Eales S., Ivison R., Morgan H., Edmunds M., 2003, Nat, 424, 285Dwek E., 2004, ApJS, 607, 848Fesen R. A., Blair W. P., 1990, ApJ, 351, L45Fesen R. A., Martin C. L., Shull J. M., 1992, ApJ, 399, 599Fesen R. A., Shull M. J., Hurford A. P., 1997, AJ, 113, 354Fischera Jg., Tuffs R. J., Volk H. J., 2002a, A&A, 386, 517Fischera Jg., Tuffs R. J., Volk H. J., 2002b, A&A, 395, 189Gabriel C., Acosta-Pulido J., Heinrichsen I., Morris H., Tai W.-M., 1997, in
Hunt G., Payne H. E., eds, ASP Conf. Ser., Vol. 125, Astronomical DataAnalysis Software and Systems VI. Astron. Soc. Pac., San Francisco,p. 108
Gallant Y. A., Tuffs R. J., 2002, in Slane P. O., Gaensler B. M., eds, ASPConf. Ser. Vol. 271, Neutron Stars in Supernova Remnants. Astron. Soc.Pac., San Francisco, p. 161
Green D. A., 2002, in Slane P. O., Gaensler B. M., eds, Neutron Stars inSupernova Remnants, ASP Conf. Series, Vol. 271. Astron. Soc. Pac.,San Francisco, p. 153
Green D. A., Scheuer P. A. G., 1992, MNRAS, 254, 686Holland W. S. et al., 1999, MNRAS, 303, 659Jenness T., Lightfoot J. F., 2000, SURF – SCUBA User Reduction Facility,
Starlink User Note 216. 7, Joint Astronomy Centre, Hilo, HawaiiKessler M. F. et al., 1996, A&A, 315, L27–L31Klaas U. et al., 1999, in Cox P., Kessler M. P., eds, The Universe as Seen by
ISO. ESA-SP 427, p. 77Lagage P. O., Claret A., Ballet J., Boulanger F., Cesarsky C. J., Cesarsky D.,
Fransson C., Pollock A., 1996, A&A, 315, L273Laor A., Draine B. T., 1993, ApJ, 402, 441Lawrence S. S., MacAlpine G. M., Uomoto A., Woodgate B. E., Brown
L. W., Oliversen R. J., Lowenthal J. D., Liu C., 1995, AJ, 109, 2635Lemke D. et al., 1996, A&A, 315, L64Li Z.-Y., Begelman M. C., 1992, ApJ, 400, 186Lloyd C., 2003, in Metcalfe L., Salama A., Peschke S. B., Kessler M. F.,
eds, The calibration legacy of the ISO Mission. European Space Agency,ESA SP-481, p. 399
MacAlpine G. M., McGaugh S. S., Mazzarella J. M., Uomoto A., 1989, ApJ,342, 364
Marsden P. L., Gillett F. C., Jennings R. E., Emerson J. P., de Jong T., OlnonF. M., 1984, ApJ, 278, L29
Mezger P. G., Tuffs R. J., Chini E., Kreysa E., Gemund H.-P., 1986, A&A,167, 145
Morgan H. L., Edmunds M. G., 2003, MNRAS, 343, 427Morgan H. L., Dunne L., Eales S., Ivison R., Edmunds M., 2003, ApJ, 597,
L33Nomoto K., Sugimoto D., Sparks W. M., Fesen R. A., Gull T. R., Miyaji S.,
1982, Nat, 299, 803Pierce-Price D. P. I., 2001, PhD thesis, Univ. of CambridgePozzo M., Meikle W. P. S., Fassia A., Geballe T., Lundqvist P., Chugai
N. N., Sollerman J., 2004, MNRAS, 352, 457Sandell G., 1994, MNRAS, 271, 75Sankrit R., Hester J. J., 1997, ApJ, 491, 796Stephenson F. R., Green D. A., 2002, Historical Supernovae and their Rem-
nants. Oxford Univ. Press, OxfordStrom R. G., Greidanus H., 1992, Nat, 358, 654Trimble V., 1973, PASP, 85, 579Tuffs R. J., Gabriel C., 2003, A&A, 410, 1075Tuffs R. J., Popescu C. C., Pierini D., Volk H. J., Hippelein H., Leech K.,
Metcalfe L., Heinrichsen I., Xu C., 2002, ApJS, 139, 37Velusamy T., 1984, Nat, 308, 251Weisskopf M. C. et al., 2000, ApJ, 536, L81Woltjer L., 1987, in Pacini F., ed., High Energy Phenomena Around Col-
lapsed Stars. Reidel, Dordrecht, p. 209Wu C.-C., 1981, ApJ, 245, 581Wyckoff S., Murray C. A., 1977, MNRAS, 180, 717
This paper has been typeset from a TEX/LATEX file prepared by the author.
C© 2004 RAS, MNRAS 355, 1315–1326
Related Documents