FAO Regional Office for Europe and Central Asia Policy Studies on Rural Transition No. 2015-7 Ukraine’s agricultural sector after accession to the WTO This country study is a part of the FAO series of case studies on assessing the impact of the WTO accession on agriculture in countries of the region Kobuta Iryna, Vitaliy Zhygadlo, Aleksandr Sikachyna 2015

Welcome message from author
This document is posted to help you gain knowledge. Please leave a comment to let me know what you think about it! Share it to your friends and learn new things together.
Transcript

FAO Regional Office for Europe and Central Asia
Policy Studies on Rural Transition No. 2015-7
Ukraine’s agricultural sector after accession to the WTO
This country study is a part of the FAO series of case studies on assessing the impact
of the WTO accession on agriculture in countries of the region
Kobuta Iryna, Vitaliy Zhygadlo, Aleksandr Sikachyna
2015

2
The Regional Office for Europe and Central Asia of the Food and Agriculture Organization
distributes this policy study to disseminate findings of work in progress and to encourage the
exchange of ideas within FAO and all others interested in development issues. This paper
carries the name of the authors and should be used and cited accordingly. The findings,
interpretations and conclusions are the authors’ own and should not be attributed to the Food
and Agriculture Organization of the UN, its management, or any member countries.
Authors:
Kobuta Iryna - Agricultural Trade and Commodity Policy Economist, PhD in Economics
(FAO)
Vitaliy Zhygadlo, Aleksandr Sikachyna - Agricultural Analysts with more than ten-year
working experience with international organizations and technical support projects (USAID,
UNDP, World Bank, TACIS) in Ukraine

3
Contents
Contents ................................................................................................................................ 3
Figures .................................................................................................................................. 4
Tables .................................................................................................................................... 4
A. Changes in Ukraine’s agricultural trade policy after accession to the WTO ................... 5
B. Developments in Ukraine’s agriculture and foreign trade of agricultural goods in 2008-
2014 years .................................................................................................................... 8
1. Transformation of the commodity pattern of foreign trade in agricultural products ...10
2. Changes in foreign trade geography ..........................................................................15
3. Trends of Ukrainian agricultural development after accession to the WTO ...............17
4. Changes in Ukraine’s food balances before and after accession to the WTO. ............18
C. Improving the agrarian support policy of domestic producers in compliance with WTO
....................................................................................................................................24
D. Using the WTO membership status for support of agricultural sector in Ukraine .........26
Conclusions ..........................................................................................................................28

4
Figures
Figure 1. Ukraine’s foreign trade in agricultural products ......................................................9
Figure 2. Ukraine’s export-import of agricultural products.................................................... 10
Figure 3. Exports of UKTZED group 10 Grain crops ............................................................ 11
Figure 4. Exports of UKTZED group 12 Oil seeds ................................................................ 12
Figure 5. Exports of UKTZED group 12 Vegetable and animal fats and oils ......................... 12
Figure 6. Exports of UKTZED group 04 Milk and milk products, eggs; honey ..................... 13
Figure 7. Exports of UKTZED group 02 Meat and byproducts ............................................. 14
Figure 8. Time history of gross agricultural output, percent .................................................. 17
Figure 9. Ukraine: self-sufficiency ratio (SSR), 2007-2013, percent...................................... 24
Tables
Table 1. MFN import duty rates for Ukrainian agricultural goods after accession to the WTO 5
Table 2. Transformation of Ukrainian export duty rates after the accession to the WTO .........6
Table 3. Geographical pattern of agricultural product exports from Ukraine ......................... 16
Table 4. Geographical pattern of agricultural product imports into Ukraine .......................... 17
Table 5. Structure of the gross agricultural output in Ukraine, percent, 2000-2014 ................ 18
Table 6. Balance indicators of the grain crops, thousand tons ................................................ 19
Table 7. Balance indicators of the meat and meat products, thousand tons ............................ 20
Table 8. Balance indicators of the milk and dairy products domestic market, thousand tons .. 21
Table 9. Balance indicators of the domestic market of fruits, berries and grapes, thousand tons
..................................................................................................................................... 22
Table 10. Balance indicators of the domestic market of vegetables, thousand tons ................ 22
Table 11. Balance indicators of the domestic market of vegetable oils, thousand tons ........... 23

5
A. Changes in Ukraine’s agricultural trade policy after
accession to the WTO
Ukraine became an official WTO member on 16 May 2008. Upon Ukraine’s accession to the
WTO, the Verkhovna Rada of Ukraine passed a series of laws elaborated by the Cabinet of
Ministers of Ukraine (CMU) to bring the Ukrainian legislation in line with the WTO
accession commitments.
Import duties when importing goods into the customs territory of Ukraine are levied
according to the Law of Ukraine on the Customs Tariff of Ukraine, No. 584-VII of
19.09.2013. The new wording of the Customs Tariff adapts Ukraine’s statistical system to the
international methods, standards and classification as well as brings import duty rates on
goods into conformity with the rates determined for goods in Annex 1 to the Protocol ratified
by the Law of Ukraine on Ratification of the Protocol of Accession of Ukraine to the WTO,
No. 250 of 10.04.2008.
Upon expiry of the transformation period1, the average arithmetic rate of the final bound tariff
is 10.1 percent for agricultural goods and 4.85 percent for industrial goods.
Commitments on the reduction of import tariff rates have been fully complied with by
Ukraine in accordance with an adopted tariff reduction schedule.
Table 1. MFN import duty rates for Ukrainian agricultural goods after accession to the
WTO Indicators Tariff rates, final level (2013)
Tariff lines with a zero rate (% of all tariff lines) 10.0
Tariff lines with an ad valorem rate (% of all tariff lines) 95.5
Average arithmetic rate of import tariffs, % 10.1
Maximum rate, % (only for ad valorem rates) 50.0
The highest import duty rate (50 percent) applied by Ukraine is that applied on imports of
white and raw cane sugar.2 In the course of a difficult negotiation process, the parties
endorsed the Ukrainian party’s proposal on the introduction of an annual tariff quota in the
amount of 267 800 tons (some influential WTO member states insisted on the amount of
480 000 tons) with a 2 percent import duty rate within the quota for the raw cane sugar, which
is an optimal amount to protect the market, ensure competition and establish an insurance
fund for a possible sugar beet yield failure.
However, the quota has remained virtually unused since 2012 due to high carryover stocks.
1 For Ukraine 2013 year 2The most significant debate in the process of Ukraine’s accession to the WTO was caused by the question about
access to the domestic market of raw cane sugar. It concerned the need to ensure minimum access to Ukraine’s domestic market in accordance with the WTO rules (not less than 5 percent of domestic consumption). The tariff
for sugar and raw cane sugar at the level of 50 percent but not less than EUR 300 per ton meant actual closure of
the market, which was unacceptable not only to the WTO members but to the Ukrainian consumers as well. For
a few last years prior to its accession to the WTO introduced additional quotas for preferential import of raw
cane sugar on an annual basis. The annual tariff quota in the amount of 267 000 tons was agreed for the raw cane
sugar. At the same time outside the tariff quota, the Ukrainian party managed to defend the protective import
tariff with a 50 percent rate.
6
In February 2015, Ukraine used GATT provisions that permit special measures to stabilize
balance of payments. A 5 percent import tariff surcharge on industrial goods and 10 percent
import tariff surcharge on agricultural goods were introduced on all imports to Ukraine for a
period of twelve months. The maximum rate of 10 percent is applied to all agro-food imports
(HS 01-24). Although the majority of WTO members acknowledged the deterioration of
Ukraine's balance of payments, they claim that the surcharges are causing a burden on their
exporters and urged Ukraine to remove the measure no later than the end of 2015.
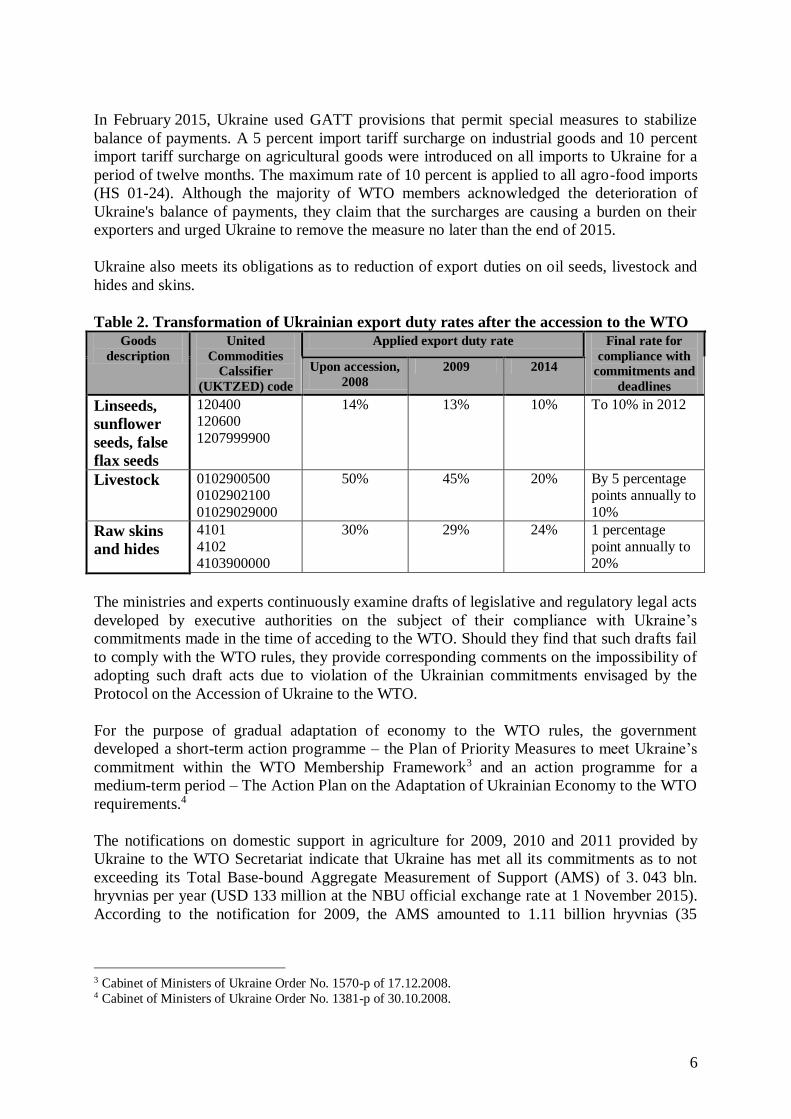
Ukraine also meets its obligations as to reduction of export duties on oil seeds, livestock and
hides and skins.
Table 2. Transformation of Ukrainian export duty rates after the accession to the WTO
Goods
description
United
Commodities
Calssifier
(UKTZED) code
Applied export duty rate Final rate for
compliance with
commitments and
deadlines
Upon accession,
2008
2009 2014
Linseeds,
sunflower
seeds, false
flax seeds
120400 120600
1207999900
14% 13% 10% To 10% in 2012
Livestock 0102900500 0102902100
01029029000
50% 45% 20% By 5 percentage points annually to
10%
Raw skins
and hides
4101
4102 4103900000
30% 29% 24% 1 percentage
point annually to 20%
The ministries and experts continuously examine drafts of legislative and regulatory legal acts
developed by executive authorities on the subject of their compliance with Ukraine’s
commitments made in the time of acceding to the WTO. Should they find that such drafts fail
to comply with the WTO rules, they provide corresponding comments on the impossibility of
adopting such draft acts due to violation of the Ukrainian commitments envisaged by the
Protocol on the Accession of Ukraine to the WTO.
For the purpose of gradual adaptation of economy to the WTO rules, the government
developed a short-term action programme – the Plan of Priority Measures to meet Ukraine’s
commitment within the WTO Membership Framework3 and an action programme for a
medium-term period – The Action Plan on the Adaptation of Ukrainian Economy to the WTO
requirements.4
The notifications on domestic support in agriculture for 2009, 2010 and 2011 provided by
Ukraine to the WTO Secretariat indicate that Ukraine has met all its commitments as to not
exceeding its Total Base-bound Aggregate Measurement of Support (AMS) of 3. 043 bln.
hryvnias per year (USD 133 million at the NBU official exchange rate at 1 November 2015).
According to the notification for 2009, the AMS amounted to 1.11 billion hryvnias (35
3 Cabinet of Ministers of Ukraine Order No. 1570-p of 17.12.2008. 4 Cabinet of Ministers of Ukraine Order No. 1381-p of 30.10.2008.

7
percent of the base level); in 2010, it was 2.18 billion hryvnias (72 percent of the base level),
and in 2011 current AMS support was 73 percent of its base AMS.
Ukraine’s WTO membership and commitments assumed call for new approaches to the
forming of a government agricultural support policy. The Programme of Economic Reforms
for 2010-2014 in Ukraine stated that transformation of the government agricultural support
policy should proceed towards improvement of the system of subsidies to raise
competitiveness of the sector according to the WTO Agreement on Agriculture and towards
retargeting of subsidies to the "green box" measures in line with the WTO provisions.
During the analyzed period after the accession of Ukraine to the WTO there were no new
"green box" programs for domestic support of agricultural producers developed and
established. Traditional support programs were being used although the Ministry of Agrarian
Policy and Food of Ukraine was having discussions of various ideas for new "green box"
programs.
Export quotas. As a WTO member, Ukraine made a commitment not to apply quantitative
export restrictions, unless there was a critical-level shortage of food products essential to the
exporting country. Ukraine also pledged to cancel the grain export restrictions existing as of
its accession date.
Prior to its accession to the WTO, export quotas for grain and oil crops in Ukraine used to be
introduced as a way of mitigating any impacts of a grain crop failure on growth of food prices.
During 2006-2008, wheat export quotas were introduced in the country five times. The grain
export quota valid from July through December 2007 amounted only to 12 000 tons (3 000
tons for each of wheat, barley, rye and corn), which actually meant an export ban. Between
January and March 2008, quotas were increased to 1 203 000 tons (600 000 tons of corn,
400 000 tons of barley, 200 000 tons of wheat, and 3 000 tons of rye). Since April, the quotas
were extended to 1 July 2008 whereas quotas for wheat and barley were raised to 1,200 and
900 000 tons, respectively, and corn export restrictions were cancelled.
On 23 May 2008, the Cabinet of Ministers of Ukraine Resolution No. 470 on abolition of
grain export quotas came into force.
Soon after the country’s accession to the WTO (in 2008), a sunflower oil export quota
(300 000 tons) and an export quota for sunflower seeds (1 000 tons) were introduced for a
short period of time. That decision was cancelled by the President of Ukraine due to not being
in compliance with Ukraine’s commitments to the WTO.
In 2009, the government abstained from introduction of any quantitative export restrictions. In
2010, however, it re-introduced grain export quotas. Export quotas were set for five grain
crops (wheat, corn, barley, rye, and buckwheat).
This time, the export quota was introduced because of an excessively hot summer in 2010 that
entailed a drought. The unfavorable weather conditions caused a relatively low production of
grain crops: 32.2 Mt in 2010 against 46.0 Mt in 2009. These circumstances reinforced
expectations of price growth in the grain market. Prices of grain crops demonstrated an active
growth tendency in recent years, both in Ukraine and globally. Taken together, these factors
could influence growth of food product prices, first of all for bread and bakery products, as
well as decrease accessibility of forage grain for the animal husbandry sector – both due to

8
high prices and because of insufficient domestic supply volumes. As a result, the authorities
adopted the simplest instrument of control over the grain balance under the given
circumstances, namely introduction of grain export quotas.
However, just as the experts predicted, the export quotas resulted in losses for grain exporters
and producers. Also, the question was raised about Ukraine’s violation of the relevant WTO
provisions. These restrictive measures also had no substantial influence on the level of retail
food prices.
Another adverse consequence of the quota introduction consists of their non-transparent
allocation. For technical reasons, the Ministry of Agrarian Policy of Ukraine failed to timely
issue some companies documents confirming that they have the declared export volumes of
grain available. For this reason, some companies were not allowed to take part in allocation of
quotas, including well-established international grain traders such as Cargill, Louis Dreyfus
Commodities and others.
On 7 April 2011, the Verkhovna Rada of Ukraine adopted the draft law № 8324 on quota
auctioning. In early May, the President of Ukraine vetoed the law. One of the reasons for the
vetoing was that quota auctioning was not in compliance with Ukraine’s WTO commitments,
namely Article VIII of the GATT 1994.
Export duties. In 2000-2010, no export duties were applied in Ukraine to any grain crop.
Since 1 July 2011, the government introduced export duties to regulate supplies of some grain
crops for export: wheat – 9 percent but not less than 17 EUR per ton, barley – 14 percent but
not less than 23 EUR per ton, corn – 12 percent but not less than 20 EUR per ton.
As a result of this measure, grain exports dropped to their lowest levels in the marketing year,
and domestic grain stocks increased, which, given shortage of modern storage capacities, led
to a loss of the grain’s quality characteristics. As a consequence, the export duties for wheat
and corn were abolished as soon as early October 2011 whereas the export duty for barley
remained unchanged and valid until 1 January 2012 to be cancelled as from that date.
After 1 January 2012 export duties and export bans on grain exports have not been applied in
Ukraine.
B. Developments in Ukraine’s agriculture and foreign trade of
agricultural goods in 2008-2014 years
This chapter analyses the trends in foreign trade (subchapters 1-0) and in the development of
agricultural sector (subchapter 3) after Ukraine’s accession to the WTO.
Before and after WTO accession, the balance of Ukraine’s foreign trade in agricultural
products was positive, unlike its foreign trade balance for industrial commodities which was
negative. A positive balance remained even amid the global financial crisis when demand in
global commodity markets slumped. In 2009, world trade shrank by 12 percent and dropped
to the 2006 level. This fact indicates high competitiveness of Ukrainian agricultural products
in world markets (Figure 1).

9
Figure 1. Ukraine’s foreign trade in agricultural products 5
Source: State Statistics Service of Ukraine
The positive results of the agricultural sector’s foreign trade activity became possible largely
due to successful export operations. Strong support was provided to Ukrainian agricultural
product trade by two significant factors: first, global trends of growing food demand, and,
second, Ukraine’s integration into the world economy.
Upon Ukraine’s accession to the WTO, development of agricultural product exports acquired
a new momentum. In 2008, the share of agricultural product exports in overall commodity
exports from Ukraine was 16.2 percent; it was 24.1 percent in 2009, 26.9 percent in 2013 and
30.9 percent in 2014.
The export value of agricultural goods in 2014 reached USD 16.7 billion. It should be noted
that this build-up of export supplies has a number of reasons: favorable price conditions for
key agricultural goods of Ukrainian exports; growing demand for food in the Asian countries;
increasing competitiveness of Ukrainian goods due to hryvnia devaluation; accession to the
WTO.
While value of agricultural product imports into Ukraine also increased since 2009, their
growth rates markedly yield to those of export supplies (Figure 2).
5 Products in product groups 01-24 of the UKTZED - Ukrainian Foreign Economic Activity Commodity
Classification

10
Figure 2. Ukraine’s export-import of agricultural products
Source: State Statistics Service of Ukraine
1. Transformation of the commodity pattern of foreign trade in
agricultural products
Exports
In 2008-2014, value of export of agricultural goods from Ukraine increased almost in all
product groups. Cumulatively, export supplies of agricultural products reached USD 16.7
billion by 2014, that is 53.3 percent greater than the level of 2008. However, the basis of
Ukrainian agricultural exports is formed by products with low and medium processing
degrees such as grain crops, oil crops and sunflower oil. Therewith, the share of the above-
mentioned commodity items has been growing dynamically: for example, their total
proportion was 65 percent in 2008 but it increased to 72 percent during 2014.
Grain crops provide a basis of the Ukrainian exports. Their supplies are traditional leaders in
the ranking of export-oriented products. On the other hand, grain crops are a strategic product
also in the domestic market for use both as food and forage. That’s why exports of these crops
were repeatedly subjected to regulation by public authorities. In 2010, the government
introduced quotas for grain exports, replacing the export quotas with export duties in 2011. To
a greater extent, export restrictions were applied to wheat, Ukraine’s key grain crop. As a
result, the pattern of export grain supplies changed in 2011-2012, with corn taking the lead in
Ukraine (Figure 3).

11
Figure 3. Exports of UKTZED group 10 Grain crops
Source: State Statistics Service of Ukraine
Oil crops
Export supplies of oil crops were notable for their considerable volatility between 2008 and
2014, which is mainly explained by the decrease in rape exports.
Producers’ declining interest in rape growing was also influenced by the need to certify
Ukrainian products for exportation to the EU countries. For example, Directive 2009/28/EC of
23 April 2009 on the promotion of the use of energy from renewable sources introduced new
rules concerning raw materials for biofuel production, including rape.
At the same time, export supplies of sunflower seeds increased, which was a direct
consequence of Ukraine’s commitments to the WTO as to reduction of export duties for
sunflower seeds.
Soy became the oil crop that offset the rape export volumes. The main reason for this
circumstance is the world market’s high interest in the Ukrainian-grown soybeans, which
urges the domestic producers to enlarge planted areas for this crop. In particular, the value of
soy exports grew 9.7 times from 2008 to 2014 (Figure 4).
Vegetable and animal fats and oils
Ukraine’s natural resources allow farmers to engage in sunflower cultivation successfully.
The active development of the oil-extracting industry and modern processing capacities let
Ukraine hold the leading position in sunflower oil exports globally.
Currently, there is a situation in Ukraine when the processing sector’s capacities exceed
sunflower seed production. Therefore, reducing export duties on sunflower seeds under
Ukraine’s commitments to the WTO promoted stronger competition for raw sunflower seeds
among processors. In 2012, the sunflower seed export duty was decreased to 10 percent.
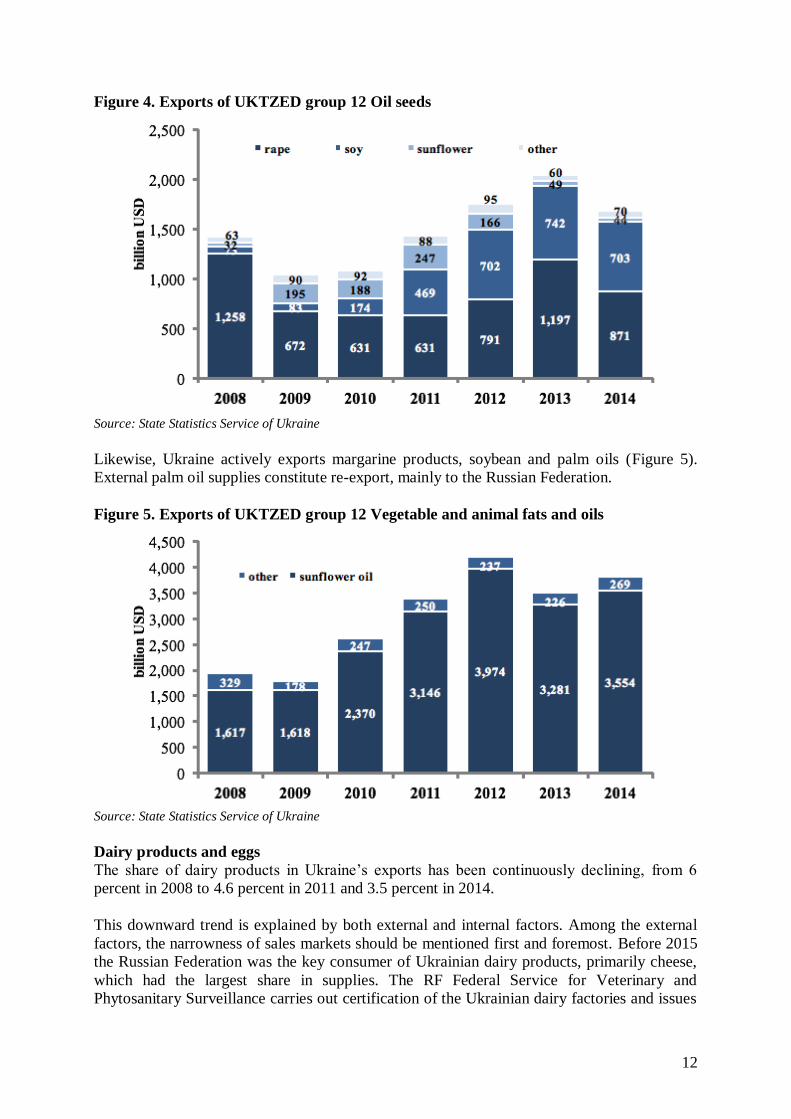
12
Figure 4. Exports of UKTZED group 12 Oil seeds
Source: State Statistics Service of Ukraine
Likewise, Ukraine actively exports margarine products, soybean and palm oils (Figure 5).
External palm oil supplies constitute re-export, mainly to the Russian Federation.
Figure 5. Exports of UKTZED group 12 Vegetable and animal fats and oils
Source: State Statistics Service of Ukraine
Dairy products and eggs
The share of dairy products in Ukraine’s exports has been continuously declining, from 6
percent in 2008 to 4.6 percent in 2011 and 3.5 percent in 2014.
This downward trend is explained by both external and internal factors. Among the external
factors, the narrowness of sales markets should be mentioned first and foremost. Before 2015
the Russian Federation was the key consumer of Ukrainian dairy products, primarily cheese,
which had the largest share in supplies. The RF Federal Service for Veterinary and
Phytosanitary Surveillance carries out certification of the Ukrainian dairy factories and issues

13
a permit for exportation of their products to Russia. The results of such inspections are often
prohibitive and based on political relations between the two countries. As a consequence,
cheese supplies from Ukraine to the Russian Federation fell by 4.2 times between 2008 and
2014.
As to internal difficulties hindering export supplies, we should mention the low quality of raw
milk and seasonal supply fluctuations. The main reason for this is small scale of production.
In the last two years, some positive tendencies have emerged in terms of the organization of
large-scale production and the big businesses interest in investing in the dairy industry.
Continuously growing energy carrier costs pose another major problem. Dairy factories
consume large quantities of electricity and natural gas to maintain production processes:
heating, evaporation and drying, cooling, freezing as well as pressurized air production
systems. Under such conditions, production of some dairy product types becomes
economically unprofitable.
Such a situation results in a dramatic drop in exports of certain dairy product types: for
example, powdered milk export have declined from USD 208 million to 121 million between
2008 and 2014 (Figure 6). Back in 2008, milk powder was one of the main export products,
with 32 percent in the dairy product supply structure, but in 2014 it had only 21 percent.
Losing export positions in the milk powder segment will have an adverse implication for
Ukrainian dairy enterprises. This commodity segment is of special importance because of a
broader sales market geography, unlike cheese and butter, which were mainly consumed by
Russia.
Progress in exports of eggs and egg products as well as honey should be highlighted. Egg
exports have increased 5.4 times between 2008 and 2014. The massive export supplies of eggs
and egg products are attributed to the industry consolidation processes. There has been formed
a range of enterprises that are able to promote their products in external markets actively.
Agroholding Avangard is an undoubted leader in Ukraine.
Figure 6. Exports of UKTZED group 04 Milk and milk products, eggs; honey
Source: State Statistics Service of Ukraine

14
Meat and by-products
During years of the WTO membership, export supplies of meat products in Ukraine have been
developing more actively as compared to dairy products. Most important are exports of pork
and poultry, which is explained by a high degree of consolidation in these sectors and, as a
consequence, producers’ greater interest in exports. Dynamic growth is taking place against
the backdrop of a limited sales markets: the most solvent EU market is closed for meat
products except for poultry meat, due to the non-compliance of Ukrainian products with the
EU requirements to food safety; the situation with supplies to the Russian Federation is
similar to dairy product exports.
Poultry meat exports increased by 25 times between 2008 and 2014. At the same time, exports
of pork increased compared with 2008, but declined sharply in 2013-14. This is connected to
the almost complete closure of the main market for Ukrainian meat export - the Russian
Federation (Figure 7).
Beef export supplies are stagnating because of domestic production problems, nevertheless,
some minor increase can still be seen in two recent years.
Figure 7. Exports of UKTZED group 02 Meat and byproducts
Source: State Statistics Service of Ukraine
Imports
Increase of agro-food import supplies to Ukraine in 2008-2014 was determined by the
following factors:
decrease in import tariffs after accession to the WTO in May 2008;
consumer demand recovery in Ukraine.
At the same time import supplies of agricultural goods to Ukraine were negatively impacted
by the following factors:
the global financial crisis in late 2008 and early 2009;
devaluation in 2014, when the Ukrainian national currency (hryvnia) fell against the
dollar by almost three times.
15
No massive imports of food products occurred, due to customs regime liberalization as a
result of the WTO membership. On the contrary, import supplies in 2009 decreased by 24
percent year-on-year, and only in 2011 the value of imports approached their 2008 figure.
The product groups in which continuous growth of import supplies was observed include:
meat and by-products; vegetables and root crops; edible fruits; grain and oil seeds; sugar and
confectionery.
In 2008 (Ukraine’s first WTO membership year), imports of meat and meat products
increased considerably. The main reasons of the increase included domestic market disparities
between production and consumption, as well as a several-fold reduction of import duties.
This way, pork import duty rates dropped by four times on average whereas the decrease for
poultry meat was between two and six times depending on the product code.
In the following three years (2009-2011), there was a steady tendency towards decreasing
import supplies because of growth of in-country poultry meat and pork production, which was
explained by structural changes in poultry farming and swine breeding. The structural changes
mean that production is ramped up at large enterprises that are structural units of large
holdings rather than in households. It was build-up of industrial-scale production of meat in
large vertically-integrated structures that furthered meat import substitution. In 2012,
however, meat product imports were stepped up again, which was caused by a price
difference between imported and Ukrainian-produced products in the segment for meat
processing enterprises.
Building up industrial-scale production of grain and oil crops, first of all corn, sunflower, soy
and rape, requires adequate provision with seeds for planting. In the context of surging
intensification, importation of foreign-selected seeds into Ukraine is the optimal alternative.
After Ukraine’s accession to the WTO, imports of fresh vegetables and fruits continued to
show a growing trend. The reasons for this include: high domestic demand for vegetables and
fruits, especially in winter and spring; an insufficient number of storage locations for
Ukrainian-produced products; increased availability of the vegetables and fruits not grown in
Ukraine due to natural and climatic conditions, caused by the reduction of import tariff rates
upon accession to the WTO.
Increase in imports of the UKTZED group 17 (sugar and confectionery made thereof) was
caused by a domestic shortage and by growing world prices of sugar. To meet domestic
demand and fill the sugar shortage, both white sugar and raw cane sugar were imported within
the import tariff quota for subsequent processing.
2. Changes in foreign trade geography
Exports
The geographical pattern of Ukrainian agricultural product exports underwent a series of
transformations in 2008-2014. WTO membership and reduction of freight rates because of the
global financial crisis promoted penetration of Ukrainian-produced products into new markets
and stronger positions in their traditional markets. First of all, it concerns exports of grain
crops and oil crops as well as sunflower oil.

16
Exports to the Middle East and North Africa (MENA) increased substantially: while the share
of supplies to these countries was about 29 percent in 2008, it went up to reach 32 percent by
2014 (Table 3).
We should also point out larger supplies to the countries of South and Southeast Asia, Sub-
Saharan Africa, and East Asia.
At the same time, a sharp fall was observed in exports to the EU countries in 2009 and 2010,
which was caused by export restrictions introduced in Ukraine for grain crops.
Table 3. Geographical pattern of agricultural product exports from Ukraine 2008 2009 2010 2011 2012 2013 2014
m $ % m $ % m $ % m $ % m $ % m $ % m $ %
Total 10 877 100 9 549 100 9 984 100 12 869 100 17 900 100 17 024 100 16 671 100
Middle East and
North Africa
(MENA)
3 203 29 3 055 32 3 311 33 4 177 32 6 574 37 5 199 31 5 313 32
EU 3 186 29 2 085 22 1 947 19 3 197 25 4 924 28 4 476 26 4 763 29
Former USSR 3 694 34 2 653 28 3 466 35 3 947 31 3 806 21 3 834 23 2 705 16
South and
Southeast Asia
282 3 1 039 11 791 8 1 065 8 1 398 8 1 739 10 2 171 13
East Asia 188 2 361 4 168 2 207 2 615 3 1 140 7 1 230 7
Sub-Saharan
Africa
61 1 179 2 134 1 71 1 324 2 357 2 279 2
Other 174 2 123 1 127 1 169 1 206 1 209 1 139 1
The Americas 89 1 54 1 40 0 37 0 53 0 71 0 70 0
Source: State Statistics Service of Ukraine
Export value to all regions of the world increased, except in those American countries that are
themselves the world’s largest centers of agricultural production. This increase was driven not
only by increase in supplies in natural terms but also by a favorable price situation.
Countries of the Middle East and North Africa (MENA) are Ukraine’s strategic trade partners,
which is explained by their logistic proximity, large populations, and the impossibility of
active build-up of food production outputs because of their difficult climatic conditions.
The bulk of exports to the MENA countries is formed by grain crops, both for food and forage
use. Their supply volumes depend not so much on demand in that region as on internal
reasons in Ukraine.
Sunflower oil export supplies are developing actively in Ukraine. At the same time, some
decrease in dairy product supplies can be seen, which draws particular attention because the
region was a traditional sales market for such products.
The EU market is a priority for Ukrainian exporters in many commodity items but
development of trade is hindered by SPS regulations imposed by the EU countries. This
reason makes supplies of actually all animal product categories impossible. Therefore, the
largest share in Ukrainian exports to the EU belongs to raw commodities – grain crops,
rapeseeds and sunflower oil.
Supplies to the post-soviet countries, especially to the Russian Federation, are of strategic
importance to Ukraine, not only because of their territorial proximity and close economic ties
but also due to similar quality standards and consumer preferences. These factors position

17
Ukraine as a supplier of high value-added products: dairy products, confectionery, alcohol
beverages, etc.
Imports
The evolution of the geographical pattern of agricultural product imports into Ukraine in
2008-2014 was determined by the factor of greater imports of certain product groups such as
vegetables, fruits, meat and meat products. Therefore, import supplies also shifted to the
regions that increased import supplies of such commodities into Ukraine, namely the EU and
the American countries, and primarily Brazil and the US (Table 4).
Table 4. Geographical pattern of agricultural product imports into Ukraine
2008 2009 2010 2011 2012 2013 2014
m $ % m $ % m $ % m $ % m $ % m $ % m $ %
Total 6 457 100 4 936 100 5 762 100 6 346 100 7 500 100 8 184 100 6 052 100
Middle East and
North Africa
(MENA)
2 512 39 1 832 37 2 122 37 2 449 39 2 968 40 3 073 38 2 470 41
EU 1 085 17 894 18 1 003 17 963 15 1 330 18 1 486 18 860 14
Former USSR 1 070 17 789 16 880 15 1 007 16 1 016 14 1 191 15 811 13
South and
Southeast Asia
337 5 333 7 405 7 436 7 610 8 770 9 516 9
East Asia 761 12 470 10 603 10 643 10 606 8 627 8 543 9
Other 353 5 318 6 342 6 355 6 476 6 571 7 443 7
Sub-Saharan
Africa
154 2 175 4 260 5 303 5 304 4 264 3 236 4
The Americas 184 3 124 3 146 3 190 3 190 3 202 2 172 3
Source: State Statistics Service of Ukraine
In some regions of the world, there was observed a decrease of agricultural product imports
into Ukraine.
3. Trends of Ukrainian agricultural development after accession to the
WTO
Ukraine’s agriculture is of paramount importance, being one of the top-priority and vital
economic sectors, first of all in the field of ensuring the country’s food security.
Figure 8. Time history of gross agricultural output, percent
Source: State Statistics Service of Ukraine

18
Although the global financial crisis 2008-2010 years entailed a demand contraction and
greater volatility of agricultural product prices, a positive tendency towards production output
increase was maintained in the Ukrainian agricultural sector. This way, gross agricultural
product output increased by 15.8 percent on average during 2008-2011 as compared to the
2004-2007 figure. In particular, crop product output went up by 21.7 percent while animal
product output increased by 5.4 percent (Figure 8).
In the agricultural production structure by producer category, we should undoubtedly point
out a sustained downward trend in the share of households.6 In 2011, agricultural enterprises7
established themselves as a leader for the first time during recent 15 years, by manufacturing
51.8 percent of the total gross agricultural output. While the share of agricultural enterprises
in production of animal products was about 20-25 percent before, in 2011 it was as high as
40.6 percent. In 2014 the share of agricultural enterprises in the total gross agricultural output
reached 55 percent, and in production of animal products – 45 percent.
Table 5. Structure of the gross agricultural output in Ukraine, percent, 2000-2014 Years Total gross agricultural output Crop production Animal production
agricultural
enterprises
households agricultural
enterprises
households agricultural
enterprises
households
2000 38.4 61.6 49.3 50.7 21.0 79.0
2005 40.5 59.5 48.6 51.4 26.2 73.8
2007 43.2 56.8 50.1 49.9 32.3 67.7
2008 50.3 49.7 58.0 42.0 34.4 65.6
2009 48.6 51.4 54.9 45.1 36.7 63.3
2010 48.3 51.7 53.6 46.4 38.8 61.2
2011 51.8 48.2 56.7 43.3 40.6 59.4
2012 50.7 49.3 55.0 45.0 41.8 58.2
2013 54.0 46.0 58.6 41.4 43.5 56.5
2014 55.0 45.0 59.3 40.7 44.9 55.1
Agricultural production development during the 2008-2014 period allowed not only to expand
agricultural product outputs but also to build up the agribusiness’ share in Ukraine’s GDP.
The analysis of food balances and the capacity of internal agricultural markets allows to
estimate an impact of import liberalization after Ukraine’s accession to the WTO on domestic
agricultural production and on import dependence / food self-sufficiency.
4. Changes in Ukraine’s food balances before and after accession to the
WTO.
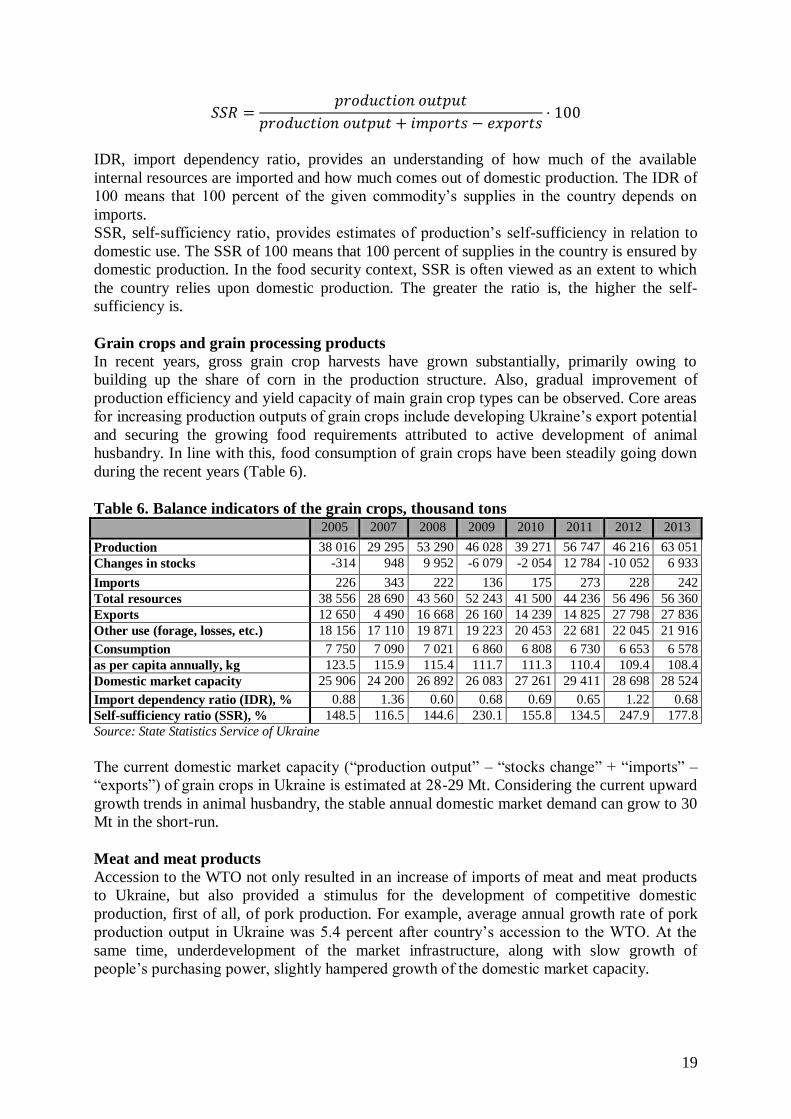
According to the FAO’s methodology, analysis of the country’s food situation assumes
evaluating it with two indicators: IDR (import dependency ratio) and SSR (self-sufficiency
ratio). Namely:
𝐼𝐷𝑅 =𝑖𝑚𝑝𝑜𝑟𝑡𝑠
𝑝𝑟𝑜𝑑𝑢𝑐𝑡𝑖𝑜𝑛 𝑜𝑢𝑡𝑝𝑢𝑡 + 𝑖𝑚𝑝𝑜𝑟𝑡𝑠 − 𝑒𝑥𝑝𝑜𝑟𝑡𝑠⋅ 100
6 Households – producers executing their economic activity for both purposes – self-sufficiency by foodstuff and
production of agricultural produce for sale. This category of producers also includes persons who are
entrepreneurs working in the agriculture. 7 An agricultural enterprise is defined as independent business entities which has legal right and carries out
productive activity on agriculture. The structure of agricultural enterprises includes private farms also.
19
𝑆𝑆𝑅 =𝑝𝑟𝑜𝑑𝑢𝑐𝑡𝑖𝑜𝑛 𝑜𝑢𝑡𝑝𝑢𝑡
𝑝𝑟𝑜𝑑𝑢𝑐𝑡𝑖𝑜𝑛 𝑜𝑢𝑡𝑝𝑢𝑡 + 𝑖𝑚𝑝𝑜𝑟𝑡𝑠 − 𝑒𝑥𝑝𝑜𝑟𝑡𝑠⋅ 100
IDR, import dependency ratio, provides an understanding of how much of the available
internal resources are imported and how much comes out of domestic production. The IDR of
100 means that 100 percent of the given commodity’s supplies in the country depends on
imports.
SSR, self-sufficiency ratio, provides estimates of production’s self-sufficiency in relation to
domestic use. The SSR of 100 means that 100 percent of supplies in the country is ensured by
domestic production. In the food security context, SSR is often viewed as an extent to which
the country relies upon domestic production. The greater the ratio is, the higher the self-
sufficiency is.
Grain crops and grain processing products
In recent years, gross grain crop harvests have grown substantially, primarily owing to
building up the share of corn in the production structure. Also, gradual improvement of
production efficiency and yield capacity of main grain crop types can be observed. Core areas
for increasing production outputs of grain crops include developing Ukraine’s export potential
and securing the growing food requirements attributed to active development of animal
husbandry. In line with this, food consumption of grain crops have been steadily going down
during the recent years (Table 6).
Table 6. Balance indicators of the grain crops, thousand tons
2005 2007 2008 2009 2010 2011 2012 2013
Production 38 016 29 295 53 290 46 028 39 271 56 747 46 216 63 051
Changes in stocks -314 948 9 952 -6 079 -2 054 12 784 -10 052 6 933
Imports 226 343 222 136 175 273 228 242
Total resources 38 556 28 690 43 560 52 243 41 500 44 236 56 496 56 360
Exports 12 650 4 490 16 668 26 160 14 239 14 825 27 798 27 836
Other use (forage, losses, etc.) 18 156 17 110 19 871 19 223 20 453 22 681 22 045 21 916
Consumption 7 750 7 090 7 021 6 860 6 808 6 730 6 653 6 578
as per capita annually, kg 123.5 115.9 115.4 111.7 111.3 110.4 109.4 108.4
Domestic market capacity 25 906 24 200 26 892 26 083 27 261 29 411 28 698 28 524
Import dependency ratio (IDR), % 0.88 1.36 0.60 0.68 0.69 0.65 1.22 0.68
Self-sufficiency ratio (SSR), % 148.5 116.5 144.6 230.1 155.8 134.5 247.9 177.8
Source: State Statistics Service of Ukraine
The current domestic market capacity (“production output” – “stocks change” + “imports” –
“exports”) of grain crops in Ukraine is estimated at 28-29 Mt. Considering the current upward
growth trends in animal husbandry, the stable annual domestic market demand can grow to 30
Mt in the short-run.
Meat and meat products
Accession to the WTO not only resulted in an increase of imports of meat and meat products
to Ukraine, but also provided a stimulus for the development of competitive domestic
production, first of all, of pork production. For example, average annual growth rate of pork
production output in Ukraine was 5.4 percent after country’s accession to the WTO. At the
same time, underdevelopment of the market infrastructure, along with slow growth of
people’s purchasing power, slightly hampered growth of the domestic market capacity.

20
Most producers of meat and meat products associate further increases in domestic meat
production with the prospect of development of export markets, along with product range
expansion of high-processing-degree meat products (finished meat byproducts) and active
development of the HoReCa segment.8
Table 7. Balance indicators of the meat and meat products, thousand tons 2005 2007 2008 2009 2010 2011 2012 2013
Production 1 597 1 912 1 906 1 917 2 059 2 144 2 210 2 389
Changes in stocks -11 -20 76 16 -3 -37 23 -20
Imports 325 245 550 439 378 244 423 332
Total resources 1 933 2 177 2 380 2 340 2 440 2 425 2 610 2 741
Exports 82 45 28 40 48 79 125 182
Other use (forage, losses, etc.) 7 7 12 10 8 7 7 9
Consumption 1 844 2 125 2 340 2 290 2 384 2 339 2 478 2 550
as per capita annually, kg 39.1 45.7 50.6 49.7 52 51.2 54.4 56.1
Domestic market capacity 1 851 2 132 2 352 2 300 2 392 2 346 2 485 2 559
Import dependency ratio (IDR), % 17.7 11.6 22.7 19.0 15.8 10.6 16.9 13.1
Self-sufficiency ratio (SSR), % 86.8 90.5 78.5 82.8 86.2 92.9 88.1 94.1
Source: State Statistics Service of Ukraine
The current capacity of Ukraine’s domestic market of meat and meat products is estimated at
2.35-2.40 Mt (Table 7). With account of existing investment projects in poultry farming and
swine breeding, along with gradual substitution of imported volumes with domestic produced
products, the domestic market capacity can grow to 2.50-2.55 Mt in the short-run.
Pork
The pork market has recently been one of the fastest growing segments of animal husbandry
in Ukraine. Compared to 2008, pork output has increased by 27 percent in 2013.
It should be noted that pork producers took the road of not only ensuring demand from the
domestic market but also of actively developing export sales markets. In light of this,
maintenance of sufficiently large volumes of import pork supplies to Ukraine is related to the
specifics of the current trends in domestic pork production. In particular, industrial-scale
production of meat-breed pigs is being built up in Ukraine but the lard-breed niche remains
not filled while demand for lard breeds is formed by meat-processing plants using pork fat for
manufacture of sausage products. And it is pork fat and pork byproducts that shape a
considerable import supplies to Ukraine.
The current capacity of Ukraine’s domestic pork market is estimated at 0.85-0.86 Mt. In the
short-run, the capacity of this market can grow to no less than 0.90-0.93 Mt. Consequently,
we can expect a reduction of import dependency to 12-15 percent due to restoring the
production of lard-breed pigs.
Beef and veal
A protracted crisis in cattle breeding resulted in a considerable production decline, thereby
strengthening the general negative downward trend in domestic consumption of beef and
milk, both by individuals and processors. In the beef cattle breeding segment, the situation
was also aggravated by processes of active substitution of beef, as a raw material for the meat-
processing industry, with more affordable poultry meat and pork. It was also furthered by
8 Horeca refers to the hotels, restaurants and catering segment of the food service business.

21
foreign trade liberalization in the framework of Ukraine’s accession to the WTO. The current
capacity of Ukraine’s domestic beef market is estimated at 0.41-0.42 Mt. Considering the
current tendencies in dairy cattle breeding development, the domestic market capacity can
grow to 0.45-0.47 Mt.
Poultry meat
The poultry market is 75 percent shaped by industrial production of broiler chicken meat,
while more than a half of the entire production output is provided by three companies, which
indicates a high degree of market concentration.
Active build-up of production outputs has been slightly hampered in recent two years, which
was caused by the saturation of Ukraine’s domestic market with chicken meat. In the current
situation, producers are trying to develop export sales market actively and to encourage
increase of domestic consumption of chicken meat through the HoReCa segment as well as by
expanding the range of finished and prepared food products.
The current capacity of the domestic poultry meat market in Ukraine is estimated at 1.05-1.07
Mt. In the short-run the poultry meat market can be expected to grow to 1.10-1.12 Mt.
Milk
Despite a traditionally high demand for dairy products from the Ukrainian domestic market, a
gradual decrease in the number of cows and in raw milk production resulted in a substantial
increase in dairy product prices, which in turn provoked a tangible decline of consumption of
these products. For example, consumption of dairy products in Ukraine in 2010-2011
decreased to the lowest levels in almost fifty years.
The current level of demand for raw milk is estimated at 4.9-5.1 Mt. Although these quantities
correspond to only 41-43 percent of total milk production output, availability of these
quantities for milk-processing enterprises is limited. This is due to great fragmentation of raw
supply streams, considering that milk production is basically concentrated in households.
The current capacity of Ukraine’s domestic milk market is estimated at 10.8-11.3 Mt. In 2013,
the capacity of the domestic milk market decreased by 3.5 percent as compared to 2008.
Table 8. Balance indicators of the milk and dairy products domestic market, thousand
tons 2005 2007 2008 2009 2010 2011 2012 2013
Production 13 714 12 262 11 761 11 610 11 249 11 086 11 378 11 488
Changes in stocks 27 -72 -78 230 -11 -9 90 -45
Imports 112 199 234 455 273 257 410 548
Total resources 13 799 12 533 12 073 11 835 11 533 11 352 11 698 12 081
Exports 1 901 939 1 140 919 956 964 820 769
Other use (forage, losses, etc.) 1 273 1 146 1 043 1 136 1 107 1 025 1 072 1 262
Consumption 10 625 10 448 9 890 9 780 9 470 9 363 9 797 10 050
as per capita annually, kg 225.6 224.6 213.8 212.4 206.4 204.9 214.9 220.9
Domestic market capacity 11 898 11 594 10 933 10 916 10 577 10 388 10 878 11 312
Import dependency ratio (IDR), % 0.9 1.7 2.2 4.1 2.6 2.5 3.7 4.8
Self-sufficiency ratio (SSR), % 115.0 106.4 108.3 104.2 106.5 106.8 103.7 102
Source: State Statistics Service of Ukraine
Over the last few years, building up milk production has been one of the top priorities in
Ukraine’s agricultural policy; it includes active stimulation development of the large-

22
commodity production segment as well as of small farming production. As a result, milk
production output in Ukraine in 2013 increased by 3.6 percent year-on-year. In the short run,
the milk and dairy products market will maintain a positive growth trend, which allows
expecting the domestic market capacity to go up to 11.5-11.7 Mt (Table 8).
Fruits, berries and grapes
The market of fruit and berry crops and grapes demonstrated stable growth tendency during
2008-2013, mainly due to an increase in the yields of apples and table grapes. These two
crops form almost 78 percent of the overall yield of fruits, berries and grapes.
Steadily large volumes of fruit imports are also related to the culture of consumption of
considerable quantities of citrus fruits and bananas in Ukraine. Besides, imported fruit and
berry products enjoy great popularity in the winter period.
Table 9. Balance indicators of the domestic market of fruits, berries and grapes,
thousand tons 2005 2007 2008 2009 2010 2011 2012 2013
Production 2 133 1 829 1 919 2 087 2 154 2 418 2 465 2 871
Changes in stocks 297 52 245 131 10 76 8 105
Imports 860 1 254 1 235 1 139 1 130 1 163 1 171 1 172
Total resources 2 696 3 031 2 909 3 095 3 274 3 505 3 628 3 938
Exports 305 370 252 284 353 239 351 392
Other use (forage, losses, etc.) 641 703 647 710 718 861 845 986
Consumption 1 750 1 958 2 010 2 101 2 203 2 405 2 432 2 560
as per capita annually, kg 37.1 42.1 43.5 45.6 48.0 52.6 53.3 56.3
Domestic market capacity 2 391 2 661 2 657 2 811 2 921 3 266 3 277 3 546
Import dependency ratio (IDR), % 32.0 46.2 42.6 38.7 38.6 34.8 35.6 33.0
Self-sufficiency ratio (SSR), % 79.4 67.4 66.1 70.9 73.5 72.4 75.0 81.0
Source: State Statistics Service of Ukraine
The 50 percent rise in production of fruit and berry crops and grapes between 2008 and 2013
entailed an almost equivalent increase in the domestic market capacity, that being 3.2-3.5 Mt
in recent years (Table 9).
Note also that the market of fruit and berry crops features the lowest self-sufficiency ratio
(SSR) as compared to other products.
Vegetables
Vegetables are another type of agricultural crop that are mainly (about 85 percent) produced
by households in Ukraine. In recent years, agricultural enterprises have also gradually started
developing production of vegetables but for the most part in greenhouses – mainly tomatoes,
cucumbers, and greens.
Table 10. Balance indicators of the domestic market of vegetables, thousand tons
2005 2007 2008 2009 2010 2011 2012 2013
Production 7 606 7 317 8 489 8 976 8 873 10 562 10 815 10 668
Changes in stocks 196 -85 689 534 -22 514 458 -13
Imports 100 158 356 232 311 285 213 237
Total resources 7 510 7 560 8 156 8 674 9 206 10 333 10 570 10 918
Exports 150 298 251 347 335 303 346 379
Other expenses (forage, losses, etc.) 1 697 1 753 1 930 2 015 2 290 2 590 2 772 3 108
Consumption 5 663 5 509 5 975 6 312 6 581 7 440 7 452 7 431
as per capita annually, kg 120.2 118.4 129.2 137.1 143.5 162.8 163.4 163.3

23
Domestic market capacity 7 360 7 262 7 905 8 327 8 871 10 030 10 224 10 539
Import dependency ratio (IDR), % 1.3 2.2 4.1 2.6 3.5 2.7 2.0 2.2
Self-sufficiency ratio (SSR), % 100.7 102.0 98.8 101.3 100.3 100.2 101.2 101.2
Source: State Statistics Service of Ukraine
Vegetable production growth over the recent five years has resulted in the vegetable market
capacity of 10.0-10.5 Mt (Table 10).
Vegetable oils
Sunflower oil is Ukraine’s second export-oriented agricultural product in terms of
significance. In 2014, proceeds of the sales of sunflower oil in the foreign market has
amounted to about 21 percent of the value of all agricultural goods export.
Steadily high consumer demand from the global market has given rise to boosting of
production outputs of vegetable oils in Ukraine. After Ukraine’s accession to the WTO
production output of vegetable oils and their exports in Ukraine doubled (Table 11).
Table 11. Balance indicators of the domestic market of vegetable oils, thousand tons
2005 2007 2008 2009 2010 2011 2012 2013
Production 1 437 2 294 1 966 2 899 3 101 3 268 4 067 3 712
Changes in stocks 114 -150 117 -30 -151 33 -75 10
Imports 264 410 480 316 319 249 231 296
Total resources 1 587 2 854 2 329 3 245 3 571 3 484 4 373 3 998
Exports 900 2 140 1 590 2 483 2 850 2 814 3 742 3 353
Other use (forage, losses, etc.) 52 50 45 51 41 45 40 41
Consumption 635 664 694 711 680 625 591 604
as per capita annually, kg 13.5 14.3 15.0 15.4 14.8 13.7 13.0 13.3
Domestic market capacity 687 714 739 762 721 670 631 645
Import dependency ratio (IDR), % 33.0 72.7 56.1 43.2 56.0 35.4 41.5 45.9
Self-sufficiency ratio (SSR), % 179.4 406.7 229.7 396.0 544.0 464.9 731.5 575.5
Source: State Statistics Service of Ukraine
As regards the Ukrainian domestic market capacity, it amounts to 0.6-0.7 Mt, where 40-45
percent accounts for imported vegetable oils, mainly palm and coconut oils imported for the
use in food industry.
Analysis of the capacity of Ukraine’s main food markets before and after its accession to
the WTO has shown that the self-sufficiency ratio of Ukraine’s domestic market remains
very high (Figure 9).
In most food products, the self-sufficiency ratio is much higher than 100 percent: for example,
247.8 percent (2012) for grain, or 735 percent (2012) for vegetable oil. Even for such import-
dependent markets as those of vegetables and fruits, the self-sufficiency ratio is at least 70
percent; besides, during Ukraine’s WTO membership period, the ratio for fruits has been
going up steadily – from 66 percent (2008) to 81 percent (2013). Despite an increase in meat
imports into Ukraine, the self-sufficiency ratio for meat has also been growing – from 78.5
percent in 2008 to 94.1 percent in 2013. This goes to prove that increase in imports did not
have any destructive impact on domestic agricultural production and food self-
sufficiency. Besides, predictive evaluation of Ukraine’s key agricultural markets has shown
that domestic production of these commodities will be increasing.

24
Figure 9. Ukraine: self-sufficiency ratio (SSR), 2007-2013, percent
C. Improving the agrarian support policy of domestic
producers in compliance with WTO
The notifications on domestic support in agriculture for 2009, 2010 and 2011 provided by
Ukraine to the WTO Secretariat indicate that Ukraine has met all its commitments as to not
exceeding its Bound Total Aggregate Measurement of Support (AMS) of 3.043 billion
hryvnias per year (USD 133 million at the NBU official exchange rate at 1 November 2015).
According to the notification for 2009, the AMS amounted to 1.11 billion hryvnias (35
percent of the base level); in 2010, it was 2.18 billion hryvnias (72 percent of the base level),
and in 2011 current AMS support was 73 percent of its base AMS.
According to the draft modalities for agriculture negotiated in the WTO Doha Round,
Ukraine’s assumed commitments concerning its bound domestic support and import tariff
rates will remain unchanged. In particular, Ukraine, as a very recently acceded WTO member,
will not be required to assume new obligations on the final Bound Total AMS, i.e. it is
entitled to the annual AMS of UAH 3.043 billion without any reduction. Moreover, Ukraine,
as a country from the VRAM (very recently acceded members) group, will have the right to
use a de minimis support with no decrease, amounting to 5 percent plus 5 percent. In addition,
Ukraine will not be required to decrease its final bound tariffs.
After accession to the WTO, the state policy of domestic support must be more focused on
efficiency of budget support programmes and on clear definition of indicators for evaluation
of performance of each budget programme. A core principle of state support for agriculture
should consist of the concentration of budget funds on addressing concrete tasks that are
topical for the next few years as well as of the efficiency of the use of limited state financial
resources.

25
Developing and implementing new “green box” programmes should become one of the
determining directions of the state support policy for agriculture after Ukraine’s accession to
the WTO. In Ukraine, most budget funds under the green box programmes are used to finance
so-called general services (about 95 percent) including: research; pest and disease control;
training and retraining services; vocational higher and technical education, and material
support for the training process; general inspection services, including inspection of
agricultural and food products.
New conditions of doing agricultural business in a competitive environment, which emerge
after accession to the WTO, require transformation of the state policy of general services
provision in order to reduce operational expenses of market entities. This will in turn allow
more competitive goods to be supplied to Ukrainian consumers than to their foreign
analogues.
The most urgent tasks on development of animal can be addressed by using the “green box”
budget programs, for example through the development and implementation of such
programmes as structural adjustment assistance provided through investment aids, or regional
assistance to agricultural producers doing business in disadvantaged regions, for example,
with adverse climatic conditions, which can be directed exactly to support for animal
husbandry.
The Ministry of Agricultural Policy and Food of Ukraine can consider using “blue box”
measures; i.e. transferring some support programmes from the amber box into the blue box by
means of retargeting budget funds to eliminate surplus capacities in some sectors (for example
sugar plants) or merging inefficient small landholdings. At the same time, programmes of
social support and retraining, belonging to the green box measures can be developed for
former agricultural workers.
A solution is required for the issue of transformation of domestic support provided to
agricultural producers via the special VAT regime (the VAT accumulation by agricultural
producers according to Article 209, Chapter V, Tax Code of Ukraine), in order to prevent
non-fulfillment of the commitments assumed by Ukraine when acceding to the WTO. The
base period AMS (2004-2006) can be exceeded because of considerable dependency of the
support, accumulated via the special VAT mechanisms, on actual selling prices. The latter
feature a steady upward trend.
After Ukraine’s accession to the WTO, price support for agricultural commodities, along with
other amber box programmes, is possible but without exceeding its Base bound AMS. The
system of setting minimum prices and intervention purchases may result in domestic prices
exceeding world prices, thereby undermining Ukrainian goods competitiveness in global
markets.
To prevent any temporary supply shortage and mitigate price fluctuations in agricultural
product and food markets and to ensure food security, the government should pursue a
predictable, timely and transparent policy of either public procurement for the State Reserve
or intervention purchases by the Agricultural Fund. If food purchases by the government are
made at current market prices and sales from food security stocks are made at no less than the
current domestic market prices for the product and quality in question, then these measures
will not be included in the amber box (or the AMS). As another mandatory condition for this,

26
agricultural products from food security stocks must be sold only provided that the world
price covers the purchase price and marketing costs. Therefore, one would manage to avoid
export subsidies for these agricultural goods.
The minimum prices of sugar beets supplied for sugar production under the A quota are set to
ensure unprofitable business in the sector. The calculation of Ukraine’s AMS includes the
sum of market price support for sugar. It is calculated by taking the difference between the
minimum purchase price and the fixed reference price of white sugar and multiplying the
price difference by the domestic production of sugar from sugar beets in Ukraine. The market
price support for sugar amounted to about 700 million hryvnias on average in 2004-2006, but
in recent years it has increased to 2 bln hryvnias, thereby reaching as much as 72 percent of
the base bound AMS. It is connected with the fact that the Cabinet of Ministers of Ukraine
rises minimum sugar prices on the yearly basis because of inflationary developments in the
country.
Having abandoned setting minimum selling prices of sugar in the domestic market, the
government can use a considerable AMS amount for direct budget payments to producers of
sugar beets or other agricultural products.
In order to preserve the natural potential and improve quality of the use of natural resources,
agricultural producers should receive budget support that conforms with certain ecological
standards. The government should encourage application of resource-saving and
environmentally safe production technologies in animal husbandry, expand areas of budget
support for protection and improvement of soil fertility, and consider a possibility of
withdrawal of agricultural land from processing in exchange for per-hectare payments in the
territories with critical environmental conditions.
For the purpose of ensuring food security at household level, it is reasonable to practice
targeted subsidies to the extremely poor population groups. According to the WTO
provisions, such governmental measures are included in the “green box” state support
category because granting of targeted subsidies to the population actually guarantees sales of
a certain part of agricultural product output, which undoubtedly has the effect of supporting a
certain part of agricultural production in the country.
D. Using the WTO membership status for support of
agricultural sector in Ukraine
Adoption of the internationally recognized rules and standards used by the WTO member
countries is taking place in Ukraine by means of implementing the Protocol on the Accession
of Ukraine to the WTO. An important benefit of a country’s membership is that it is possible
to participate in the work of the Organization’s bodies, various committees, ministerial
conferences, and the Doha Development Round of multilateral negotiations for the purpose of
influencing other countries’ trade policy.
Taking part in the work of the committees and other WTO bodies, Ukraine can raise specific
questions and voice its stance concerning certain aspects of other countries’ trade policy. As a
rule, to protect its interests in the WTO framework, a country joins a certain group of
countries because it is easier to express its viewpoint by relying upon the group’s stand.
Ukraine is a member of the VRAM (very recently acceded members) group.
27
As a WTO member, Ukraine has already used the WTO trade dispute settlement procedure
several times.
In 2009, the dispute with Georgia regarding the excise duty on imported tobacco products was
settled. A Ukrainian tobacco product manufacturer approached the government concerning a
discriminatory excise duty rate set by Georgia for imported products. The dispute was settled
already in the stage of consultations between the two governments, without referring to the
Dispute Settlement Body (DSB). In 2010, a dispute with Armenia was settled after Ukraine
had approached the DSB to establish an expert review group to consider a number of
Armenia’s discriminatory measures concerning alcohol and tobacco products: the applied
import duty rates were higher than the bound ones; internal taxes on imported tobacco
products were higher than on domestic products; excise duties were also higher. In 2011, a
procedure of consideration of a trade dispute between Ukraine and Moldova began (an expert
review group established) concerning a discriminatory ecological fee that adversely affects
Ukrainian beer and juice producers in the sales in Moldova’s market.
In view of these processes, the government has started cooperating more actively with
business associations on foreign trade issues. It is also important to involve business to
participate in the events held within the WTO. The WTO organizes the Public Forum for
public non-governmental organizations on a yearly basis. Non-governmental organizations
may attend plenary sessions of ministerial conferences and regularly receive brief information
from the WTO Secretariat on conference working meetings.
Based on the information received through the WTO Secretariat, the division for processing
of requests, notifications and information support within the Ministry of Economic
Development and Trade of Ukraine (MERT) prepares information letters on the measures
taken by the WTO member countries that can be quite important to Ukrainian companies and
are an essential element in their corresponding business decision-making. The above-
mentioned information is regularly placed on the official MERT website
(http://www.me.gov.ua/Documents/MoreDetails?lang=uk-
UA&title=ObrobkaZapitivINotifikatsiiSot) and systematically circulated to commodity
producers’ associations for reference and use in their work.
At the same time, despite all the positive sides of accession to the WTO, it should be stated
that the global financial crisis has adversely affected most sectors of Ukraine’s economy. The
government of Ukraine received requests from certain industry associations and domestic
business representatives asking to take adequate measures to protect the domestic market, in
particular to modify Ukraine’s tariff commitments in the WTO. Guided by paragraph 5 of
Article XXVIII of the General Agreement on Tariffs and Trade 1994, for the first time
Ukraine on 27 October 2011 reserved the right to modify Ukraine’s schedule CLXII for the
duration of the next three-year period beginning on 1 January 2012. The working group for
modification of tariff commitments under the MERT was taking active measures to examine
the possibility and reasonability of revision of Ukraine’s tariff commitments in WTO, but
there was no need to modify the tariff schedule.
For the second time Ukraine reserves its right under Article XXVIII:5 of the GATT 1994 to
modify its schedule CLXII during the three-year period commencing 1 January 2015. Ukraine
informed the WTO Committee on Market Access 23 December 2014 (Ukraine’s notification
G/MA/318). The above-mentioned reservation allows Ukraine, in case of economic
reasonability and given a relevant decision made by the Government, to commence

28
negotiations with the relevant WTO member-countries on modification of bound import duty
rates.
After accession to the WTO, the Ukrainian government has been conducting active bilateral
talks with the WTO member countries to ensure greater openness of their markets for
Ukrainian exports within the framework of free trade agreements. On 24 June 2010, the Free
Trade Agreement between Ukraine and the European Free Trade Association (EFTA) was
signed. Consultations and negotiations are underway concerning future free trade agreements
with Canada, Israel, Morocco, Serbia, Singapore, and Turkey.
WTO membership status has allowed Ukraine to hold and complete negotiations on the
establishment of a free trade area between Ukraine and the European Union. In the course of
the talks, the Ukrainian negotiators managed to achieve certain concessions from the EU and
mitigate certain commitments assumed by the country when acceding to the WTO. For
example, the EU offered a duty-free access within import tariff quotas and gave up
application of export subsidies for agricultural goods when exporting to Ukraine. The
Ukrainian party, equally with partial liberalization of the import regime for agricultural goods,
secured the right to use safeguard measures and additional trade conditions; e.g. application of
a input prices system.
On 16 September 2014, the Association Agreement between Ukraine and the European
Union, including free trade area provisions, was simultaneously ratified by the Ukrainian
Parliament and the European Parliament.
Conclusions
The WTO membership provided a strong impetus for reforming the trade regime, and allowed
the expansion of export markets and an increase in Ukrainian agricultural goods export.
During seven years of the WTO membership, Ukraine’s foreign trade in agricultural goods
has shown a positive trend, with a USD 7 billion positive annual balance (for 2008-2014 on
average), while the overall balance for all goods is minus USD 11 billion. Ukrainian
agricultural product exports have substantially grown during the years after the entry into
WTO – from USD 6.2 to 17.0 billion. It was ensured due to global price growth resulting
from the world food crisis, good grain harvest, and hryvnia devaluation in 2008-2009 and
2014 that improved competitiveness of the Ukrainian-made goods. Upon Ukraine’s accession
to the WTO, the share of agricultural goods in the total exports of goods increased up to 26
percent (prior to the accession – 12 percent).
Analysis of capacity of main Ukrainian food markets before and after the accession showed
that the food self-sufficiency ratio of Ukraine’s internal market is very high. For most
agricultural products, the self-sufficiency ratio is much higher than 100 percent, for example
247.8 percent (2012) for grain, and 735 percent (2012) for vegetable oil.
At the same time, a considerable share of raw products and products with an incomplete
processing cycle in the structure of agricultural export supplies from Ukraine cannot but raise
concerns. These commodities are sensitive to a foreign economic climate and feature strong
price volatility. Generally, world commodity markets of high value-added products have a
highly competitive environment; hence state authorities need to pay special attention to
measures for promotion of Ukrainian-produced products to external markets. It is necessary to

29
elaborate a new, more efficient model of Ukrainian diplomatic missions’ work for supporting
exports of Ukrainian goods in other countries.
Although Ukraine’s accession to the WTO did not entail any massive growth of import of
agricultural goods, some goods lines demonstrated their considerable increase. First and
foremost, it concerned fruits, vegetables, meat and meat products. However, despite an
increase in meat imports into Ukraine, the self-sufficiency ratio for this product has grown –
from 78.5 percent in 2008 to 94.1 in 2013. The self-sufficiency ratio for vegetables and fruits
is at least 70 percent; besides, its steady growth for fruits can be seen throughout the period of
Ukraine’s WTO membership – from 66 percent (2008) to 81 percent (2013).
This goes to prove that increase in imports did not have any destructive impact on domestic
agricultural production and food self-sufficiency. Apart from that, predictive evaluation of
Ukraine’s main agricultural markets shows that domestic production of these commodities
will be increasing.
It is a positive fact that considerable subsidies were directed during two recent years into
construction of pig-breeding complexes; current priorities of budget support included meat
and dairy cattle breeding, and construction of wholesale agricultural product markets and
vegetable storages.
To achieve a positive trade balance in these commodity items, it is necessary to pay greater
attention to efficiency of budget subsidy programmes for these areas further on.
Subsequent prospects of agricultural goods export from Ukraine largely lie in the realm of
developing new sales markets. State authorities must take an active stand in this aspect by
working towards the creation and reformation of a proper legislative framework on SPS
requirements and food safety.
A promising area for Ukraine consists of development of large-commodity production in meat
and milk sectors. It would allow the country to rectify an internal imbalance between
agricultural production and consumption and to develop promising export segments. A
positive example is provided by experience of the Ukrainian poultry meat producers who
almost drove imported products out of the domestic market in the fresh or chilled poultry
meat segment, and commenced large-commodity export supplies since 2008, nearly doubling
them annually.
It is important to raise awareness of the public, domestic consumers on the national system of
food safety control, that is a major component of domestic agricultural goods’
competitiveness compared to similar imported goods.

30
FAO Regional Office for Europe and Central Asia
Policy Studies on Rural Transition
2014-5 Attitudes toward the Lifting of the Moratorium on Land Sales and the Development
of Land Markets in Ukraine
Zvi Lerman
2014-4 The Eurasian Economic Commission and the Unified Market for Agricultural
Commodities within the Customs Union
Seminar Background Studies “Experiences of the European Union in Creating a
Single Agricultural Market”
2014-3 Agricultural Cooperatives in Eurasia
Zvi Lerman and David Sedik
2014-2 Cooperatives in the CIS and Georgia: Overview of Legislation
Zvi Lerman and David Sedik
2014-1 Agri-Food Systems for Better Nutrition in Europe and Central Asia
Mario Mazzocchi, Sara Capacci, Bhavani Shankar, Bruce Traill
2013-8 Effects of Russia`s WTO Accession on Agriculture and Food Sector
Sergey Kiselev
2013-8 Влияние вступления в ВТО на сельское хозяйство и продовольственный
сектор в России
Сергей Киселев
2013-7 The triple burden of malnutrition in Europe and Central Asia: a multivariate
analysis
Sara Capacci, Mario Mazzocchi, Bhavani Shankar, Bruce Traill
2013-6 Сельскохозяйственная обслуживающая кооперация в Украине
Роман Коринец
2013-5 Agricultural cooperatives in Israel
Gadi Rosenthal and Hadas Eiges
2013-4 Cooperative development in Central Asia
Zvi Lerman
2013-3 An overview of cooperatives in Turkey
Nedret Durutan Okan and Cüneyt Okan
2013-2 Agriculture and Rural Cooperation - Examples from Armenia, Georgia and
Moldova
John Millns
2013-1 Association of farmers in the Western Balkan countries
Goran Zivkov
2012-6 Экономика экспорта зерновых в Казахстане: Перспективы и анализ
экспорта пшеницы
Ошакбаев, Рахим
2012-5 Экономика экспорта пшеницы в Украине
Ирина Кобута, Александр Сикачина и Виталий Жигадло
2012-4 Wheat Export Economy in Ukraine
Iryna Kobuta, Oleksandr Sikachyna, Vitaly Zhygadlo
2012-3 Issues Affecting the Future of Agriculture and Food Security for Europe and
Central Asia
William H. Meyers; Jadwiga R. Ziolkowska; Monika Tothova and Kateryna
Goychuk

31
2012-2 Агрохолдинги России и их роль в производстве зерна
Узун В.Я. , д.э.н., проф., Шагайда Н.И., д.э.н., Сарайкин В.А., к.э.н.
2012-1 Europe and Central Asian Agriculture Towards 2030 and 2050
Jelle Bruinsma
2011-1 Потенциал роста доходов сельского населения Туркменистана на основе
альтернативных сельскохозяйственных культур
Иван Станчин, Цви Лерман и Дэвид Седик
2010-1 The Feed-Livestock Nexus in Tajikistan: Livestock Development Policy in
Transition (revised version).
David Sedik
2009-5 Sources of Agricultural Productivity Growth in Central Asia: The Case of
Tajikistan and Uzbekistan
Zvi Lerman and David Sedik
2009-4 The Diversity of Effects of EU Membership on Agriculture in New Member States
Csaba Csaki and Attila Jambor
2009-3 Agricultural Recovery and Individual Land Tenure: Lessons from Central Asia.
Zvi Lerman and David Sedik
2009-2 The Feed-Livestock Nexus in Tajikistan: Livestock Development Policy in
Transition.
David Sedik
2009-1 Agrarian Reform in Kyrgyzstan: Achievements and the Unfinished Agenda.
Zvi Lerman and David Sedik
2008-1 The Economic Effects of Land Reform in Tajikistan.
Zvi Lerman and David Sedik
Related Documents


![FAO Presentation 19 July.ppt [Read-Only]httpAssets)/1DF81CFC0F663… · FAO Headquarters in Rome 187 members plus European Union Decentralised FAO Five Regional Offices for Africa,](https://static.cupdf.com/doc/110x72/5b6e2c4e7f8b9a3b388deac2/fao-presentation-19-julyppt-read-only-httpassets1df81cfc0f663-fao-headquarters.jpg)