May 2015 Food Outlook BIANNUAL REPORT ON GLOBAL FOOD MARKETS ISSN 0251-1959

Welcome message from author
This document is posted to help you gain knowledge. Please leave a comment to let me know what you think about it! Share it to your friends and learn new things together.
Transcript
May 2015
Food Outlook B IANNUAL REPORT ON GLOBAL FOOD MARKETS
ISSN 0251-1959
The Food Outlook report is a product of the FAO Trade and Markets Division. This report is prepared under the overall guidance of Boubaker Ben-Belhassen, Director,
Concepcion Calpe and Abdolreza Abbassian, Senior Economists. It is written by a team of economists, whose names and email contacts appear under their respective market summary contributions. The report benefited from research support by many staff, namely, David Bedford, Claudio Cerquiglini, Julie Claro, Grace Karumathy, David Mancini, Emanuele Marocco, Patrizia Mascianá, Marta Michetti, Marco Milo, Mauro Pace and the fisheries statistical team.
Special thanks go to Rita Ashton for compiling the report and overall administrative support, as well as to Claudio Cerquiglini, for preparing the charts and statistical tables. Additionally, the team is grateful to Nancy Hart for her editorial assistance.
ACKNOWLEDGEMENTS
The designations employed and the presentation of material in this information product do not imply the expression of any opinion whatsoever on the part of the Food and Agriculture Organization of the United Nations (FAO) concerning the legal or development status of any country, territory, city or area or of its authorities, or concerning the delimitation of its frontiers or boundaries. The mention of specific companies or products of manufacturers, whether or not these have been patented, does not imply that these have been endorsed or recommended by FAO in preference to others of a similar nature that are not mentioned.
ISSN: 0251-1959 (print)ISSN 1560-8182 (Online)
© FAO 2015
FAO encourages the use, reproduction and dissemination of material in this information product. Except where otherwise indicated, material may be copied, downloaded and printed for private study, research and teaching purposes, or for use in non-commercial products or services, provided that appropriate acknowledgement of FAO as the source and copyright holder is given and that FAO’s endorsement of users’ views, products or services is not implied in any way.
All requests for translation and adaptation rights, and for resale and other commercial use rights should be made via www.fao.org/contact-us/licencerequest
or addressed to [email protected].
FAO information products are available on the FAO website (www.fao.org/publications) and can be purchased through [email protected]

A prolonged period of low international
rice prices is prompting governments,
especially in exporting countries, to shift
to less supportive rice production policies,
while also trimming public rice inventories, a
stance that may dampen global production
growth in 2015 and keep world trade in
2015 at near record levels.
RICE
World production of coarse grains in 2015 is
forecast to fall below the 2014 record level.
Total coarse grains inventories are likely to be
drawn down to meet the expected utilization
in 2015/16. Given ample inventories to be
carried over from the current season, coarse
grain markets are expected to remain well
supplied in the new season.
COARSE GRAINS
World sugar production is forecast to increase
marginally in 2014/15, and will still exceed
global consumption for the fifth consecutive
year, resulting in yet another, albeit
small, increase in world sugar inventories.
International trade in sugar is anticipated
to remain relatively unchanged from last
season, as a result of ample availabilities in
traditional sugar importing countries.
SUGARA further significant easing of oil and meal
market fundamentals is expected in 2014/15,
thanks to a record-high soybean production.
Combined with forecasts of only tepid
demand growth, inventories are expected to
rise sharply. Accordingly, prices for oilseeds,
oils and meals are on a marked downward
trend.
OILCROPS
International dairy product prices stabilized
during the first four months of 2015. Ample
export supplies and uncertainty over import
demand maintained prices at relatively low
levels. Milk production continues to increase
steadily in many countries.
DAIRY
Overabundance of wheat supply is likely to
continue into the 2015/16 season in spite
of the forecast decline in 2015 production.
Following two consecutive years of record
crops, world wheat inventories are at
sufficiently large levels. This, coupled with
less buoyant growth in demand for feed
wheat, could contribute to fairly stable
market conditions in the new season.
.
WHEAT
World meat production is forecast to expand
by 1.3 percent in 2015, mostly driven by
pig and poultry meat. The trade expansion
is predicted to slow to 1.7 percent in 2015,
constrained by limited export supplies and
subdued import demand. The FAO Meat
Price Index in the first four months of 2015,
were well below 2014 with the decline
affecting all categories of meat.
MEAT
Understanding how and when price volatility has changed is critically important. Motivated by the recent calmness in markets,
there is a need to investigate whether volatility has returned to “normal” levels predating the 2006/07 turmoil. However, there
are important conceptual issues concerning measurement and policy inference that merit being highlighted.
Aquaculture remains the main engine for
growth of world fish supplies. Brisk import
demand in the United States and European
Union is forecast to boost international trade
in fish in 2015. In 2014, human consumption
of farmed fish overtook that of wild fish for
the first time.
FISHERIES
arge supplies and a strong
US dollar are keeping
international food prices
under downward pressure.
The outlook for the coming
season is unlikely to diverge much from the
current situation, but currency movements
and macroeconomic developments may
have important implications for markets
again in 2015/16. Against this backdrop, the
world food import bill is forecast to reach a
five-year low in 2015.
L
HIGHLIGHTS
SPECIAL FEATURE: Has price volatility changed?

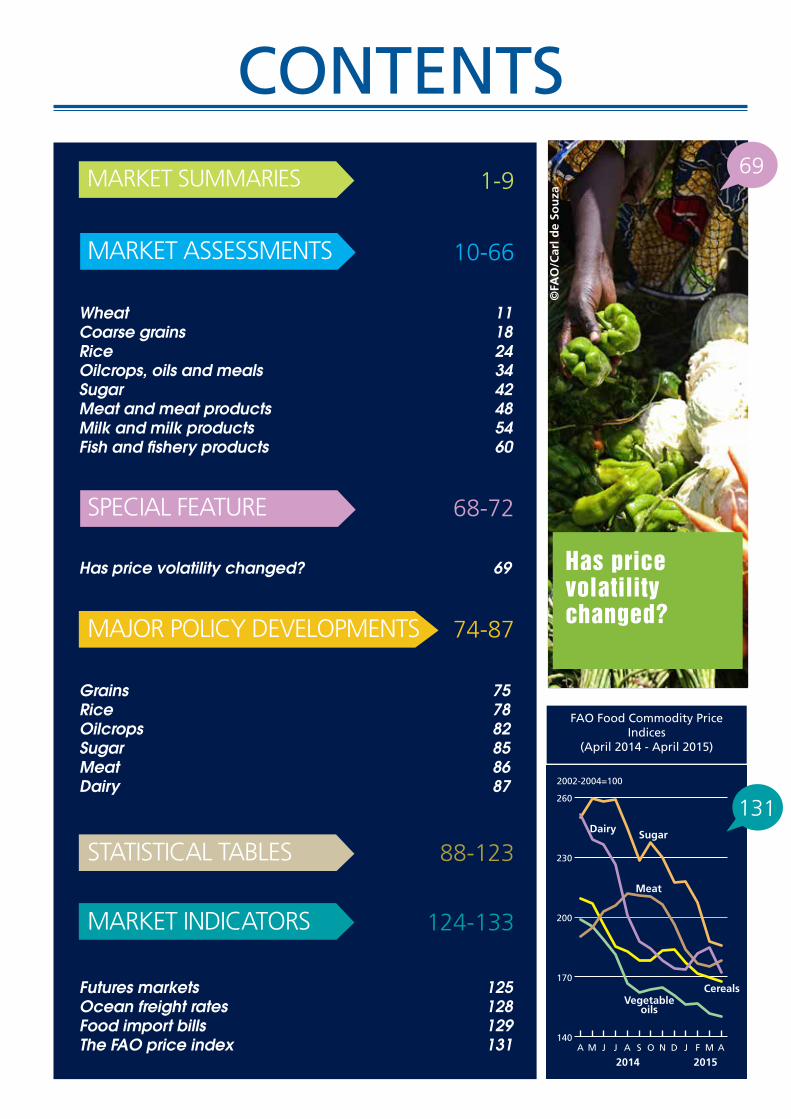
140
170
200
230
260
AMFJDNOSAJJMA
2014 2015
2002-2004=100
Dairy
Vegetableoils
Cereals
Sugar
Meat
CONTENTS1-9
88-123
124-133
74-87
68-72
10-66
Wheat 11Coarse grains 18Rice 24Oilcrops, oils and meals 34Sugar 42Meat and meat products 48Milk and milk products 54Fish and fishery products 60
Grains 75Rice 78Oilcrops 82Sugar 85Meat 86Dairy 87
Futures markets 125Ocean freight rates 128Food import bills 129The FAO price index 131
Has price volatility changed? 69
69
131
Has price volatility changed?
MARKET SUMMARIES
MARKET ASSESSMENTS
SPECIAL FEATURE
MAJOR POLICY DEVELOPMENTS
STATISTICAL TABLES
MARKET INDICATORS
FAO Food Commodity Price Indices
(April 2014 - April 2015)
©FA
O/C
arl d
e So
uza

MAR
KET
SUM
MAR
IES
MAR
KET
SUM
MAR
IES
Ma
rke
t sum
ma
ries
1FOOD OUTLOOKMAY 2015
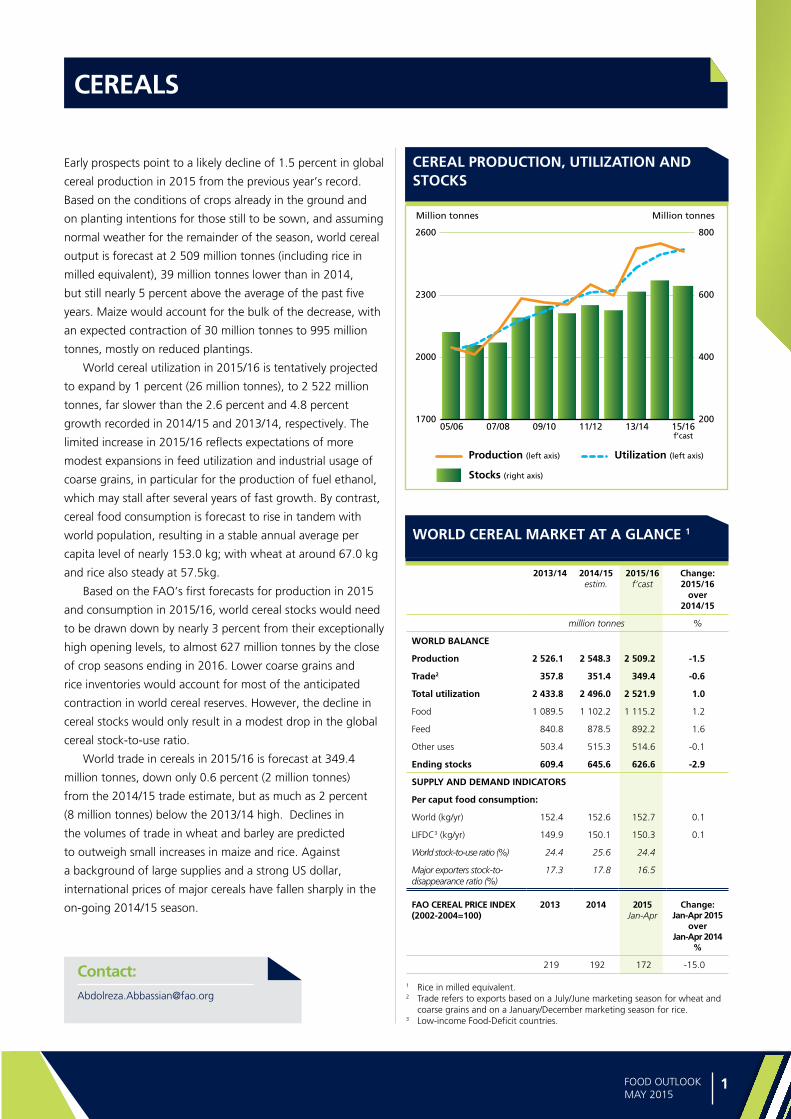
Early prospects point to a likely decline of 1.5 percent in global
cereal production in 2015 from the previous year’s record.
Based on the conditions of crops already in the ground and
on planting intentions for those still to be sown, and assuming
normal weather for the remainder of the season, world cereal
output is forecast at 2 509 million tonnes (including rice in
milled equivalent), 39 million tonnes lower than in 2014,
but still nearly 5 percent above the average of the past five
years. Maize would account for the bulk of the decrease, with
an expected contraction of 30 million tonnes to 995 million
tonnes, mostly on reduced plantings.
World cereal utilization in 2015/16 is tentatively projected
to expand by 1 percent (26 million tonnes), to 2 522 million
tonnes, far slower than the 2.6 percent and 4.8 percent
growth recorded in 2014/15 and 2013/14, respectively. The
limited increase in 2015/16 reflects expectations of more
modest expansions in feed utilization and industrial usage of
coarse grains, in particular for the production of fuel ethanol,
which may stall after several years of fast growth. By contrast,
cereal food consumption is forecast to rise in tandem with
world population, resulting in a stable annual average per
capita level of nearly 153.0 kg; with wheat at around 67.0 kg
and rice also steady at 57.5kg.
Based on the FAO’s first forecasts for production in 2015
and consumption in 2015/16, world cereal stocks would need
to be drawn down by nearly 3 percent from their exceptionally
high opening levels, to almost 627 million tonnes by the close
of crop seasons ending in 2016. Lower coarse grains and
rice inventories would account for most of the anticipated
contraction in world cereal reserves. However, the decline in
cereal stocks would only result in a modest drop in the global
cereal stock-to-use ratio.
World trade in cereals in 2015/16 is forecast at 349.4
million tonnes, down only 0.6 percent (2 million tonnes)
from the 2014/15 trade estimate, but as much as 2 percent
(8 million tonnes) below the 2013/14 high. Declines in
the volumes of trade in wheat and barley are predicted
to outweigh small increases in maize and rice. Against
a background of large supplies and a strong US dollar,
international prices of major cereals have fallen sharply in the
on-going 2014/15 season.
CEREALS
Contact:[email protected]
CEREAL PRODUCTION, UTILIZATION AND STOCKS
WORLD CEREAL MARKET AT A GLANCE 1
2013/14 2014/15 estim.
2015/16 f’cast
Change: 2015/16
over 2014/15
million tonnes %
WORLD BALANCE
Production 2 526.1 2 548.3 2 509.2 -1.5
Trade2 357.8 351.4 349.4 -0.6
Total utilization 2 433.8 2 496.0 2 521.9 1.0
Food 1 089.5 1 102.2 1 115.2 1.2
Feed 840.8 878.5 892.2 1.6
Other uses 503.4 515.3 514.6 -0.1
Ending stocks 609.4 645.6 626.6 -2.9
SUPPLY AND DEMAND INDICATORS
Per caput food consumption:
World (kg/yr) 152.4 152.6 152.7 0.1
LIFDC3 (kg/yr) 149.9 150.1 150.3 0.1
World stock-to-use ratio (%) 24.4 25.6 24.4
Major exporters stock-to-disappearance ratio (%)
17.3 17.8 16.5
FAO CEREAL PRICE INDEX (2002-2004=100)
2013 2014 2015 Jan-Apr
Change: Jan-Apr 2015
over Jan-Apr 2014
%
219 192 172 -15.0
1 Rice in milled equivalent.2 Trade refers to exports based on a July/June marketing season for wheat and
coarse grains and on a January/December marketing season for rice.3 Low-income Food-Deficit countries.
200
400
600
800
1700
2000
2300
2600
15/1613/1411/1209/1007/0805/06
Million tonnes Million tonnes
f’cast
Stocks (right axis)
Production (left axis) Utilization (left axis)

Ma
rke
t su
mm
ari
es
2 FOOD OUTLOOKMAY 2015
Overabundance of wheat supply is likely to continue into the
2015/16 season in spite of an anticipated decline in 2015
production. FAO’s latest forecast for 2015 global wheat
production stands at 719 million tonnes, 10 million tonnes
(1.2 percent) below the record of 2014. The decline is largely
attributable to a lower production in Europe, following
a contraction in the area planted, which will more than
outweigh small increases in Asia and North America. FAO’s
first forecast for world trade in wheat (including wheat flour in
wheat equivalent) in 2015/16 (July/June) stands at 151 million
tonnes, down marginally from the 2014/15 estimate. Imports
by the developing countries are expected to fall most, whereas
total imports by the developed countries are likely to remain at
the same level as in 2014/15.
Early indications for world wheat utilization in the new
season (2015/16) point to a continuing expansion, up 0.6
percent from the latest 2014/15 estimate. However, this
increase would be much less significant than those of the
previous two seasons, mostly because of a larger availability of
coarse grains in many feed markets and their more competitive
prices. Feed use of wheat is likely to increase marginally after
an 8.5 percent expansion in 2014/15, while food use is set
to increase at about the same rate as population, which will
keep the annual per capita consumption level steady at around
67 kg.
Based on the latest production prospects for 2015 and the
projected utilization in 2015/16, FAO’s first forecast for world
wheat stocks by the close of crop seasons in 2016 stands at
nearly 199 million tonnes, marginally below this year. The
largest drawdown is expected in China, but this decrease
would be mostly offset by further build-ups of inventories
in the United States and the EU. With world wheat stocks
at sufficiently large levels to buffer against any unexpected
production shortfall, international prices have remained
under downward pressure. In fact, the overall favourable
supply prospects for another season kept Chicago Board of
Trade (CBOT) quotations at some 25 percent below the levels
registered in the corresponding period last year.
WHEAT
Contact:[email protected]@fao.org
WHEAT PRODUCTION, UTILIZATION AND STOCKS
WORLD WHEAT MARKET AT A GLANCE
1 Trade refers to exports based on a common July/June marketing season.2 Major exporters include Argentina, Australia, Canada, EU, Kazakhstan,
Russian Fed., Ukraine and the United States.3 Derived from the International Grains Council (IGC) wheat index.
2013/14 2014/15 estim.
2015/16 f’cast
Change: 2015/16
over 2014/15
million tonnes %
WORLD BALANCE
Production 717.2 729.5 719.1 -1.4
Trade1 156.7 153.0 151.0 -1.3
Total utilization 695.2 711.7 716.1 0.6
Food 480.8 484.6 488.8 0.9
Feed 128.1 139.0 139.4 0.3
Other uses 86.4 88.1 87.9 -0.2
Ending stocks 189.4 200.0 198.9 -0.5
SUPPLY AND DEMAND INDICATORS
Per caput food consumption:
World (kg/yr) 67.2 67.1 66.9 -0.3
LIFDC (kg/yr) 46.2 45.9 45.8 -0.2
World stock-to-use ratio (%) 26.6 27.9 27.8
Major exporters stock-to-disappearance ratio2 (%)
13.6 15.5 16.5
FAO WHEAT PRICE INDEX3 (2002-2004=100)
2013 2014 2015 Jan-Apr
Change: Jan-Apr 2015
over Jan-Apr 2014
%
194 181 157 -16.9
100
140
180
220
260
550
600
650
700
750
15/1613/1411/1209/1007/0805/06
Million tonnes Million tonnes
f’cast
Stocks (right axis)
Production (left axis) Utilization (left axis)

Ma
rke
t sum
ma
ries
3FOOD OUTLOOKMAY 2015
World coarse grains output in 2015 is forecast at
1 290 million tonnes, 2.6 percent below the record of 2014.
Total maize production, in particular, is expected to contract
by 3 percent to 995 million tonnes in the United States, the
world’s largest producer, largely reflecting a decline. World
barley and sorghum outputs are also forecast to be smaller
than in 2014. Most of the barley reduction is expected to occur
in the EU, the Russian Federation and Ukraine.
Global trade in coarse grains in the new 2015/16 season
could contract slightly, to 156 million tonnes, on weaker
international demand for barley, which would more than
offset anticipated rises in global maize, oats, rye and sorghum
shipments. Much of the decline in world barley imports is
expected to be concentrated in China where imports in
2014/15 soared to exceptionally high levels.
Based on preliminary indications, total utilization of coarse
grains could expand by 1 percent in 2015/16, exceeding its
10-year trend value for the third consecutive season. Increased
feed use, forecast to surpass 737 million tonnes globally, is
behind the 2015/16 expected rise in world utilization.
After two consecutive seasons of build-up, global
inventories of coarse grains by the close of crop seasons in
2016 are projected to decline by 3.7 percent. However, at
the current projected level of nearly 260 million tonnes, world
reserves would still be high, resulting in fairly comfortable
world stock-to-use ratios. Among the major coarse grains,
global maize ending stocks could decline to 217 million
tonnes, down 2 percent (5 million tonnes) from their very high
opening levels. In China, the size of coarse grains inventories
may approach 100 million tonnes, exceeding their already high
level of this season. The increase in coarse grains inventories
in China largely reflects rising maize stocks, following several
years of record crops stimulated by attractive price support
measures.
COARSE GRAINS
Contact:[email protected] [email protected]
COARSE GRAIN PRODUCTION, UTILIZATION AND STOCKS
1 Trade refers to exports based on a common July/June marketing season.2 Major exporters include Argentina, Australia, Brazil, Canada, EU, Russian Fed.,
Ukraine and the United States.
WORLD COARSE GRAIN MARKET AT A GLANCE
2013/14 2014/15 estim.
2015/16 f’cast
Change: 2015/16
over 2014/15
million tonnes %
WORLD BALANCE
Production 1 312.3 1 324.4 1 290.0 -2.6
Trade1 158.7 157.0 156.0 -0.6
Total utilization 1 247.4 1 284.5 1 297.5 1.0
Food 199.7 202.7 206.1 1.7
Feed 698.7 724.9 737.3 1.7
Other uses 349.0 356.9 354.2 -0.8
Ending stocks 238.9 269.5 259.6 -3.7
SUPPLY AND DEMAND INDICATORS
Per caput food consumption:
World (kg/yr) 27.9 28.1 28.2 0.4
LIFDC (kg/yr) 39.6 39.7 40.1 1.0
World stock-to-use ratio (%) 18.6 20.8 19.6
Major exporters stock-to-disappearance ratio2 (%)
11.5 14.6 13.7
FAO COARSE GRAIN PRICE INDEX (2002-2004=100)
2013 2014 2015 Jan-Apr
Change: Jan-Apr 2015
over Jan-Apr 2014
%
246 183 165 -18.3
100
150
200
250
300
950
1050
1150
1250
1350
15/1613/1411/1209/1007/0805/06
Million tonnes Million tonnes
f’cast
Stocks (right axis)
Production (left axis) Utilization (left axis)
Ma
rke
t su
mm
ari
es
4 FOOD OUTLOOKMAY 2015
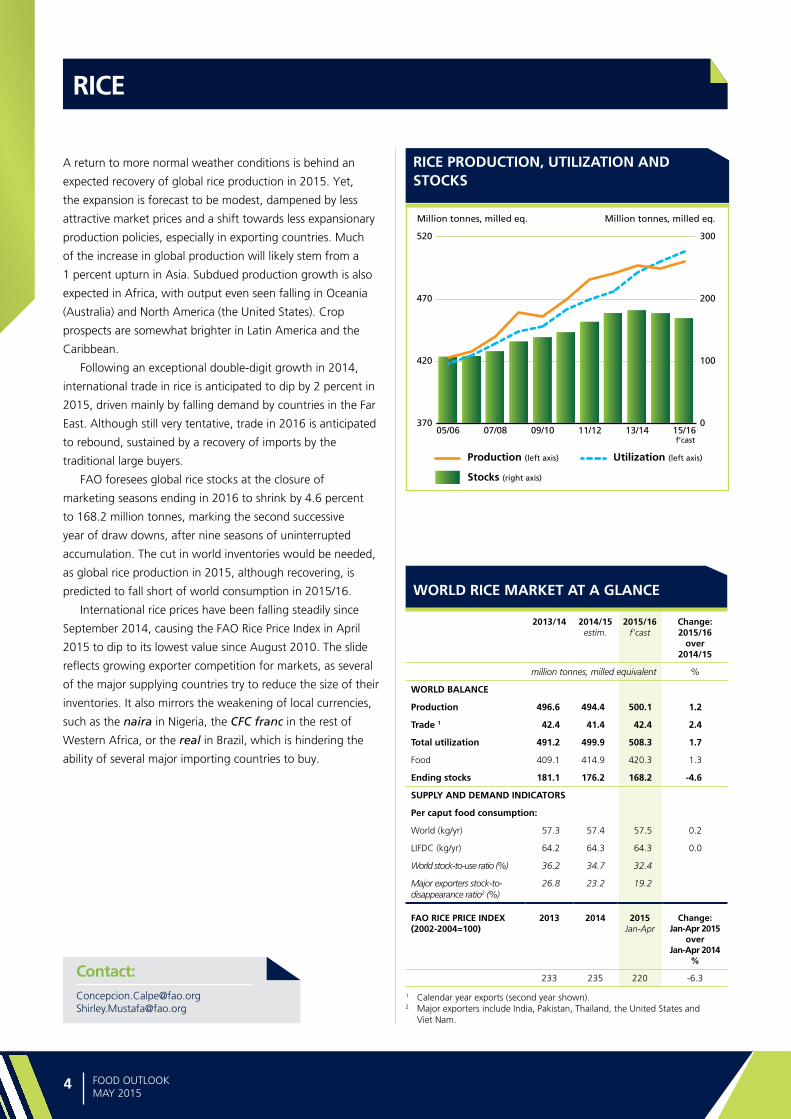
A return to more normal weather conditions is behind an
expected recovery of global rice production in 2015. Yet,
the expansion is forecast to be modest, dampened by less
attractive market prices and a shift towards less expansionary
production policies, especially in exporting countries. Much
of the increase in global production will likely stem from a
1 percent upturn in Asia. Subdued production growth is also
expected in Africa, with output even seen falling in Oceania
(Australia) and North America (the United States). Crop
prospects are somewhat brighter in Latin America and the
Caribbean.
Following an exceptional double-digit growth in 2014,
international trade in rice is anticipated to dip by 2 percent in
2015, driven mainly by falling demand by countries in the Far
East. Although still very tentative, trade in 2016 is anticipated
to rebound, sustained by a recovery of imports by the
traditional large buyers.
FAO foresees global rice stocks at the closure of
marketing seasons ending in 2016 to shrink by 4.6 percent
to 168.2 million tonnes, marking the second successive
year of draw downs, after nine seasons of uninterrupted
accumulation. The cut in world inventories would be needed,
as global rice production in 2015, although recovering, is
predicted to fall short of world consumption in 2015/16.
International rice prices have been falling steadily since
September 2014, causing the FAO Rice Price Index in April
2015 to dip to its lowest value since August 2010. The slide
reflects growing exporter competition for markets, as several
of the major supplying countries try to reduce the size of their
inventories. It also mirrors the weakening of local currencies,
such as the naira in Nigeria, the CFC franc in the rest of
Western Africa, or the real in Brazil, which is hindering the
ability of several major importing countries to buy.
RICE
Contact:[email protected]@fao.org
RICE PRODUCTION, UTILIZATION AND STOCKS
WORLD RICE MARKET AT A GLANCE
2013/14 2014/15 estim.
2015/16 f’cast
Change: 2015/16
over 2014/15
million tonnes, milled equivalent %
WORLD BALANCE
Production 496.6 494.4 500.1 1.2
Trade 1 42.4 41.4 42.4 2.4
Total utilization 491.2 499.9 508.3 1.7
Food 409.1 414.9 420.3 1.3
Ending stocks 181.1 176.2 168.2 -4.6
SUPPLY AND DEMAND INDICATORS
Per caput food consumption:
World (kg/yr) 57.3 57.4 57.5 0.2
LIFDC (kg/yr) 64.2 64.3 64.3 0.0
World stock-to-use ratio (%) 36.2 34.7 32.4
Major exporters stock-to-disappearance ratio2 (%)
26.8 23.2 19.2
FAO RICE PRICE INDEX (2002-2004=100)
2013 2014 2015 Jan-Apr
Change: Jan-Apr 2015
over Jan-Apr 2014
%
233 235 220 -6.3
1 Calendar year exports (second year shown).2 Major exporters include India, Pakistan, Thailand, the United States and
Viet Nam.
0
100
200
300
370
420
470
520
15/1613/1411/1209/1007/0805/06
Million tonnes, milled eq. Million tonnes, milled eq.
f’cast
Stocks (right axis)
Production (left axis) Utilization (left axis)

Ma
rke
t sum
ma
ries
5FOOD OUTLOOKMAY 2015
The latest forecasts for the 2014/15 season point towards a
further easing of the global supply and demand balance for
oilseeds products. Driven by bumper soybean crops in the
United States and South American countries, global oilseed
production is expected to expand significantly for the third
consecutive season. Such an increase, together with sizeable
opening stocks, will facilitate a strong expansion in global
supplies of oils/fats and even more so of meals/cakes.
On the demand side, growth in oils/fats consumption
could slow in 2014/15, largely due to a subdued demand from
the biodiesel sector, while global meal consumption is seen
expanding at an about-average rate. As production of oilseed
products is anticipated to exceed utilization by an ample
margin, especially in the case of meals, a sharp rise in global
inventories appears likely. Year-on-year, carry-out stocks are
currently projected to increase by 11 percent for oils/fats and
by a stunning 34 percent for meals/cakes, mainly due to soy/
meal.
Responding to the positive supply and demand prospects,
international prices for most oilseeds and oilseed products
eased during the first half of 2014/15. In April 2015, FAO’s
price indices for the oilseed complex not only ranged 20–30
percent below their corresponding 2014 values, they also
tumbled to 5–6 year lows. The latest harvest updates in the
Southern Hemisphere and the first planting indications for next
season in the Northern Hemisphere, suggest that international
prices could remain under pressure for the next few months.
With regard to international trade, current forecasts
indicate a deceleration in the volume of transactions in both
oilseeds and oilseed products – despite the recent slide in
prices.
Incomplete and highly tentative forecasts for 2015/16
suggest that, after three consecutive rises, global oilseed
production could contract in the coming season, with the
largest dip seen for soybeans. Nonetheless, considering the
current season’s prospective record-high carry-out stocks, a
production decrease would not necessarily lead to tightness in
global markets.
OILCROPS
Contact:[email protected]
FAO MONTHLY INTERNATIONAL PRICE INDICES FOR OILSEEDS, VEGETABLE OILS AND MEALS/CAKES (2002-2004=100)
WORLD OILCROP AND PRODUCT MARKET AT A GLANCE
2012/13 2013/14 estim.
2014/15 f’cast
Change: 2014/15
over 2013/14
million tonnes %
TOTAL OILCROPS
Production 482.9 513.0 542.3 5.7
OILS AND FATS
Production 189.9 202.7 209.6 3.4
Supply 222.2 234.7 244.3 4.1
Utilization 189.7 199.0 203.9 2.5
Trade 101.9 107.3 109.0 1.6
Global stock-to-use ratio (%) 16.9 17.5 18.9
Major exporters stock-to-disappearance ratio (%)
9.6 9.8 12.0
MEALS AND CAKES
Production 120.0 128.9 139.2 8.0
Supply 137.6 146.9 160.6 9.3
Utilization 118.5 125.2 131.2 4.8
Trade 73.6 81.3 84.2 3.6
Global stock-to-use ratio (%) 15.2 17.1 21.8
Major exporters stock-to-disappearance ratio (%)
7.6 9.3 14.8
FAO PRICE INDICES (Jan/Dec) (2002-2004=100)
2013 2014 2015 Jan-Apr
Change: Jan-Apr 2015
overJan-Apr 2014
%
Oilseeds 207 184 154 -24.5
Meals/cakes 255 243 193 -28.1
Vegetable oils 193 181 154 -22.2
NOTE: Refer to footnote 4 on page 34 and to table 2 on page 37 for explanations regarding definitions and coverage.
100
150
200
250
300
20152014201320122011201020092008
Meals/cakesVegetable oils
Oilseeds
Ma
rke
t su
mm
ari
es
6 FOOD OUTLOOKMAY 2015
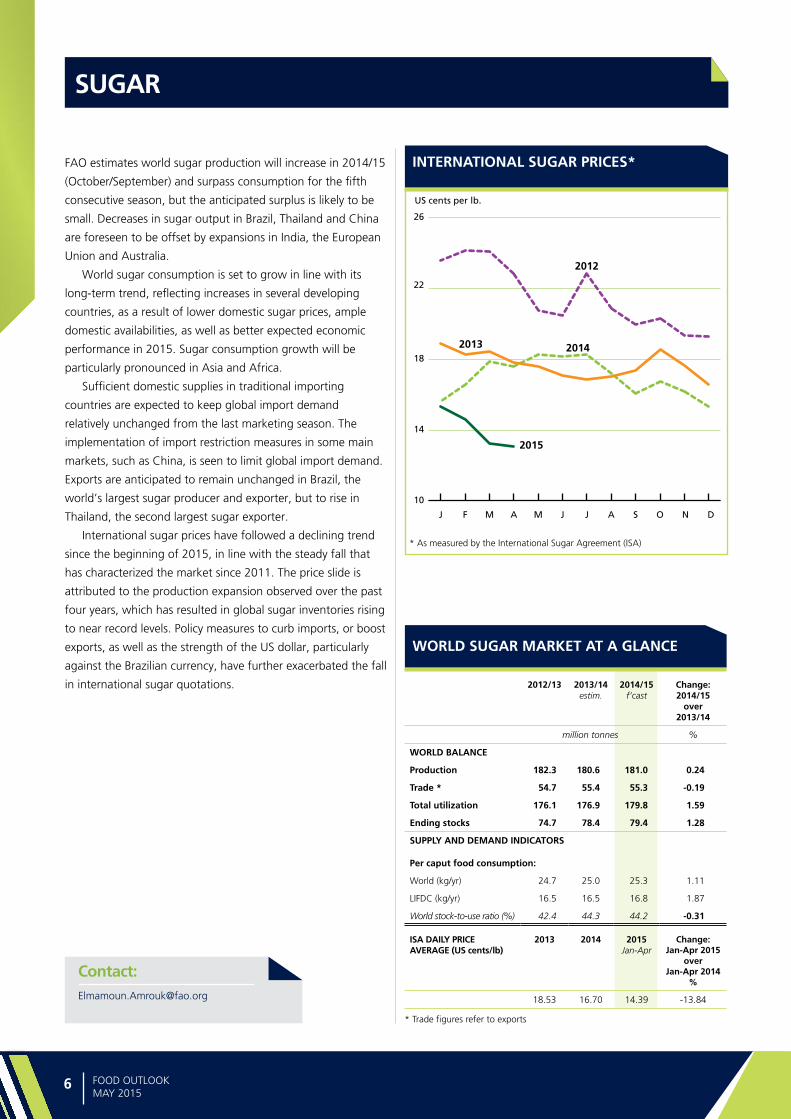
FAO estimates world sugar production will increase in 2014/15
(October/September) and surpass consumption for the fifth
consecutive season, but the anticipated surplus is likely to be
small. Decreases in sugar output in Brazil, Thailand and China
are foreseen to be offset by expansions in India, the European
Union and Australia.
World sugar consumption is set to grow in line with its
long-term trend, reflecting increases in several developing
countries, as a result of lower domestic sugar prices, ample
domestic availabilities, as well as better expected economic
performance in 2015. Sugar consumption growth will be
particularly pronounced in Asia and Africa.
Sufficient domestic supplies in traditional importing
countries are expected to keep global import demand
relatively unchanged from the last marketing season. The
implementation of import restriction measures in some main
markets, such as China, is seen to limit global import demand.
Exports are anticipated to remain unchanged in Brazil, the
world’s largest sugar producer and exporter, but to rise in
Thailand, the second largest sugar exporter.
International sugar prices have followed a declining trend
since the beginning of 2015, in line with the steady fall that
has characterized the market since 2011. The price slide is
attributed to the production expansion observed over the past
four years, which has resulted in global sugar inventories rising
to near record levels. Policy measures to curb imports, or boost
exports, as well as the strength of the US dollar, particularly
against the Brazilian currency, have further exacerbated the fall
in international sugar quotations.
SUGAR
Contact:[email protected]
INTERNATIONAL SUGAR PRICES*
WORLD SUGAR MARKET AT A GLANCE
2012/13 2013/14 estim.
2014/15 f’cast
Change: 2014/15
over 2013/14
million tonnes %
WORLD BALANCE
Production 182.3 180.6 181.0 0.24
Trade * 54.7 55.4 55.3 -0.19
Total utilization 176.1 176.9 179.8 1.59
Ending stocks 74.7 78.4 79.4 1.28
SUPPLY AND DEMAND INDICATORS
Per caput food consumption:
World (kg/yr) 24.7 25.0 25.3 1.11
LIFDC (kg/yr) 16.5 16.5 16.8 1.87
World stock-to-use ratio (%) 42.4 44.3 44.2 -0.31
ISA DAILY PRICE AVERAGE (US cents/lb)
2013 2014 2015 Jan-Apr
Change: Jan-Apr 2015
over Jan-Apr 2014
%
18.53 16.70 14.39 -13.84
10
14
18
22
26
2013 2014
2012
2015
US cents per lb.
DNOSAJJMAMFJ
* As measured by the International Sugar Agreement (ISA)
* Trade figures refer to exports
Ma
rke
t sum
ma
ries
7FOOD OUTLOOKMAY 2015
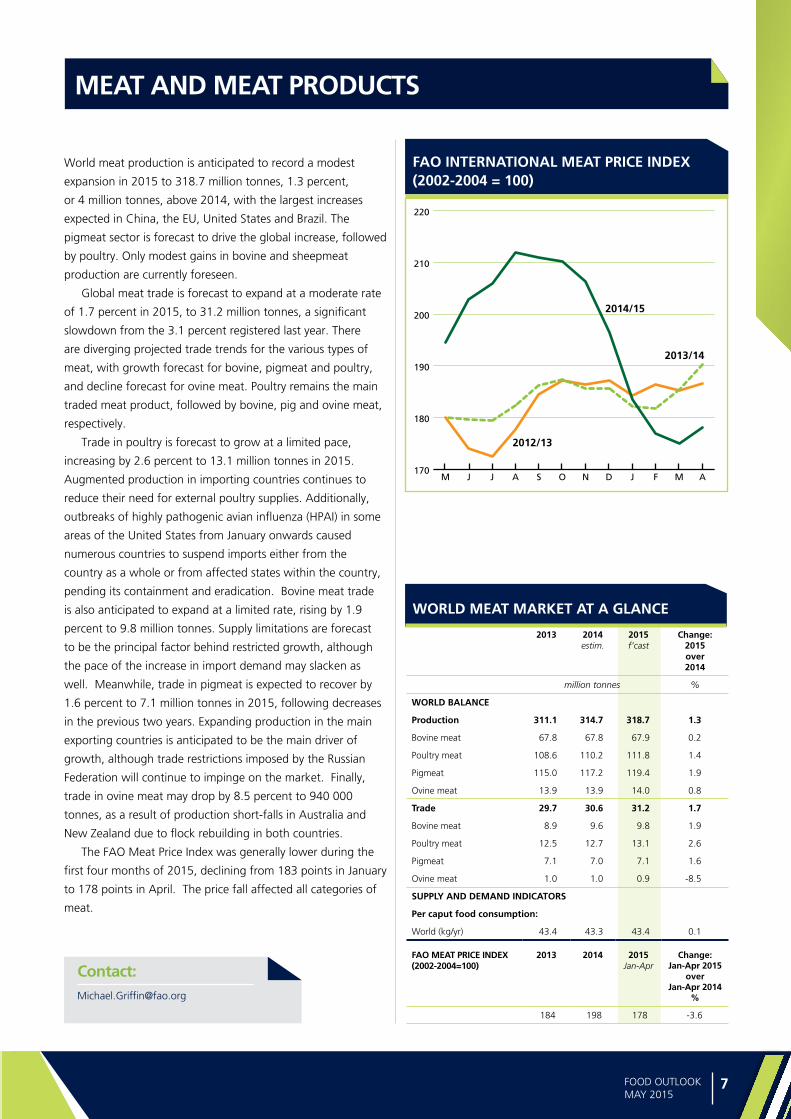
World meat production is anticipated to record a modest
expansion in 2015 to 318.7 million tonnes, 1.3 percent,
or 4 million tonnes, above 2014, with the largest increases
expected in China, the EU, United States and Brazil. The
pigmeat sector is forecast to drive the global increase, followed
by poultry. Only modest gains in bovine and sheepmeat
production are currently foreseen.
Global meat trade is forecast to expand at a moderate rate
of 1.7 percent in 2015, to 31.2 million tonnes, a significant
slowdown from the 3.1 percent registered last year. There
are diverging projected trade trends for the various types of
meat, with growth forecast for bovine, pigmeat and poultry,
and decline forecast for ovine meat. Poultry remains the main
traded meat product, followed by bovine, pig and ovine meat,
respectively.
Trade in poultry is forecast to grow at a limited pace,
increasing by 2.6 percent to 13.1 million tonnes in 2015.
Augmented production in importing countries continues to
reduce their need for external poultry supplies. Additionally,
outbreaks of highly pathogenic avian influenza (HPAI) in some
areas of the United States from January onwards caused
numerous countries to suspend imports either from the
country as a whole or from affected states within the country,
pending its containment and eradication. Bovine meat trade
is also anticipated to expand at a limited rate, rising by 1.9
percent to 9.8 million tonnes. Supply limitations are forecast
to be the principal factor behind restricted growth, although
the pace of the increase in import demand may slacken as
well. Meanwhile, trade in pigmeat is expected to recover by
1.6 percent to 7.1 million tonnes in 2015, following decreases
in the previous two years. Expanding production in the main
exporting countries is anticipated to be the main driver of
growth, although trade restrictions imposed by the Russian
Federation will continue to impinge on the market. Finally,
trade in ovine meat may drop by 8.5 percent to 940 000
tonnes, as a result of production short-falls in Australia and
New Zealand due to flock rebuilding in both countries.
The FAO Meat Price Index was generally lower during the
first four months of 2015, declining from 183 points in January
to 178 points in April. The price fall affected all categories of
meat.
MEAT AND MEAT PRODUCTS
Contact:[email protected]
FAO INTERNATIONAL MEAT PRICE INDEX (2002-2004 = 100)
WORLD MEAT MARKET AT A GLANCE
170
180
190
200
210
220
AMFJDNOSAJJM
2014/15
2012/13
2013/14
2013 2014estim.
2015f’cast
Change: 2015 over 2014
million tonnes %
WORLD BALANCE
Production 311.1 314.7 318.7 1.3
Bovine meat 67.8 67.8 67.9 0.2
Poultry meat 108.6 110.2 111.8 1.4
Pigmeat 115.0 117.2 119.4 1.9
Ovine meat 13.9 13.9 14.0 0.8
Trade 29.7 30.6 31.2 1.7
Bovine meat 8.9 9.6 9.8 1.9
Poultry meat 12.5 12.7 13.1 2.6
Pigmeat 7.1 7.0 7.1 1.6
Ovine meat 1.0 1.0 0.9 -8.5
SUPPLY AND DEMAND INDICATORS
Per caput food consumption:
World (kg/yr) 43.4 43.3 43.4 0.1
FAO MEAT PRICE INDEX(2002-2004=100)
2013 2014 2015 Jan-Apr
Change: Jan-Apr 2015
over Jan-Apr 2014
%
184 198 178 -3.6
Ma
rke
t su
mm
ari
es
8 FOOD OUTLOOKMAY 2015
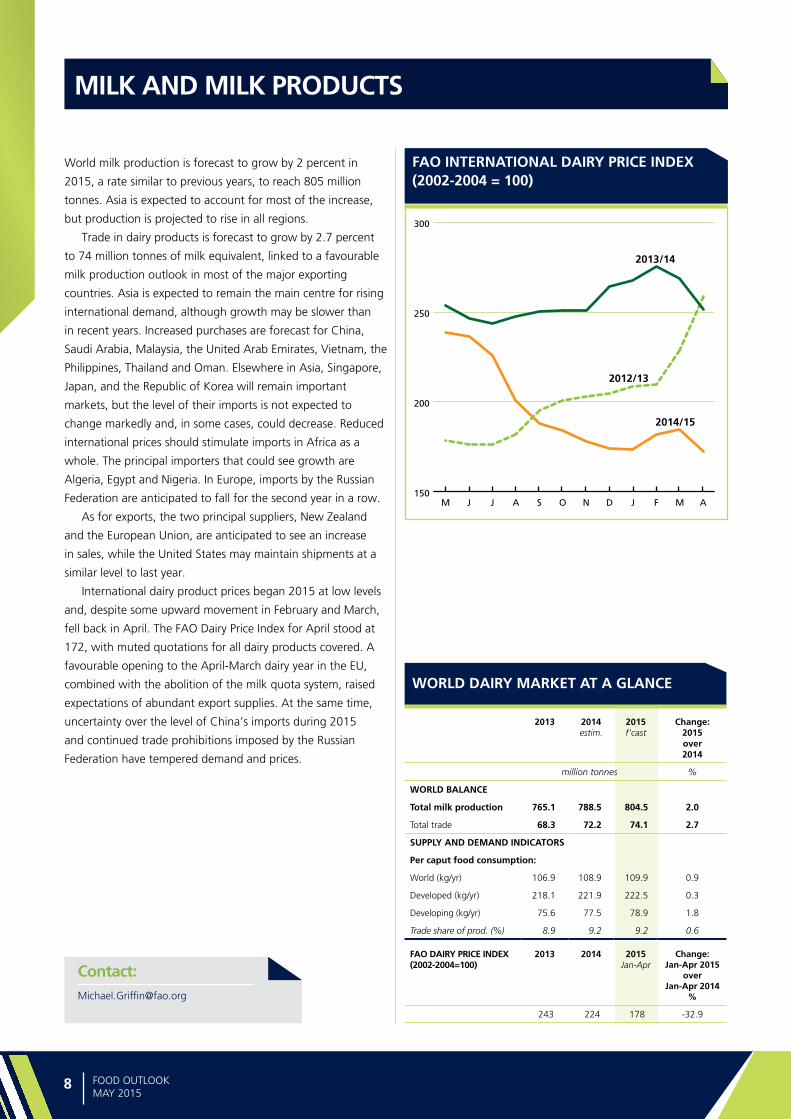
World milk production is forecast to grow by 2 percent in
2015, a rate similar to previous years, to reach 805 million
tonnes. Asia is expected to account for most of the increase,
but production is projected to rise in all regions.
Trade in dairy products is forecast to grow by 2.7 percent
to 74 million tonnes of milk equivalent, linked to a favourable
milk production outlook in most of the major exporting
countries. Asia is expected to remain the main centre for rising
international demand, although growth may be slower than
in recent years. Increased purchases are forecast for China,
Saudi Arabia, Malaysia, the United Arab Emirates, Vietnam, the
Philippines, Thailand and Oman. Elsewhere in Asia, Singapore,
Japan, and the Republic of Korea will remain important
markets, but the level of their imports is not expected to
change markedly and, in some cases, could decrease. Reduced
international prices should stimulate imports in Africa as a
whole. The principal importers that could see growth are
Algeria, Egypt and Nigeria. In Europe, imports by the Russian
Federation are anticipated to fall for the second year in a row.
As for exports, the two principal suppliers, New Zealand
and the European Union, are anticipated to see an increase
in sales, while the United States may maintain shipments at a
similar level to last year.
International dairy product prices began 2015 at low levels
and, despite some upward movement in February and March,
fell back in April. The FAO Dairy Price Index for April stood at
172, with muted quotations for all dairy products covered. A
favourable opening to the April-March dairy year in the EU,
combined with the abolition of the milk quota system, raised
expectations of abundant export supplies. At the same time,
uncertainty over the level of China’s imports during 2015
and continued trade prohibitions imposed by the Russian
Federation have tempered demand and prices.
MILK AND MILK PRODUCTS
Contact:[email protected]
FAO INTERNATIONAL DAIRY PRICE INDEX (2002-2004 = 100)
WORLD DAIRY MARKET AT A GLANCE
2013 2014estim.
2015f’cast
Change: 2015 over 2014
million tonnes %
WORLD BALANCE
Total milk production 765.1 788.5 804.5 2.0
Total trade 68.3 72.2 74.1 2.7
SUPPLY AND DEMAND INDICATORS
Per caput food consumption:
World (kg/yr) 106.9 108.9 109.9 0.9
Developed (kg/yr) 218.1 221.9 222.5 0.3
Developing (kg/yr) 75.6 77.5 78.9 1.8
Trade share of prod. (%) 8.9 9.2 9.2 0.6
FAO DAIRY PRICE INDEX(2002-2004=100)
2013 2014 2015 Jan-Apr
Change: Jan-Apr 2015
over Jan-Apr 2014
%
243 224 178 -32.9
150
200
250
300
2014/15
2012/13
2013/14
AMFJDNOSAJJM

Ma
rke
t sum
ma
ries
9FOOD OUTLOOKMAY 2015
In 2014, overall fish production is estimated to have grown
by only 1 percent to 164.3 million tonnes, boosted by a 5
percent expansion of aquaculture to 74.3 million tonnes,
which compensated for a 2 percent contraction in wild fish
output to 90.0 million tonnes. Supply in 2015 is likely to see a
small rebound in wild catches from the 2014 El Niño-related
shortfall, to 90.6 million tonnes, and a further 5 percent
growth in aquaculture production to 78 million tonnes. As a
result, fish production is forecast to reach 168.6 million tonnes
in 2015, up 2.6 percent from the previous year.
Consumer demand for fish remains brisk, with more people
worldwide appreciating the health benefits of regular fish
consumption. Direct human consumption, which accounts for
more than 85 percent of all uses, is now projected to grow by
2 percent. On the other hand, the expected recovery in world
wild fish catches in 2015 is predicted to foster a 9 percent
rebound in the usage of fish as feed, mostly destined for
aquaculture operations.
Sustained import demand in the United States, together
with renewed interest from the European Union market have
underpinned international fish trade in 2014 and early 2015.
Fish deliveries to emerging markets also were strong, despite
some weakness in countries such as Brazil and the Russian
Federation, which faced economic slowdowns and sharp
currency devaluations. However, Japan’s buying interest has
been tepid with seafood consumption now stagnating. Fish
international prices remained at relatively high levels in the
course of 2014, although subject to fluctuations depending on
individual species. As a result of the firm prices and sustained
volume growth, the value of fish trade is estimated to have
reached a record USD 143.9 billion in 2014. However, the
value of trade is forecast to grow only modestly to USD 144.5
billion in 2015, on anticipation of a stalling volume of trade
and steady world prices.
The FAO Code of Conduct for Responsible Fisheries will
celebrate its twentieth anniversary in 2015. A groundbreaking
and negotiated document, the Code lays forth principles and
standards for national and international efforts to ensure
sustainable production of aquatic living resources. As a living
document, it serves as the basis for the development of various
new instruments to address new challenges related to areas
such as illegal, unreported and unregulated fishing (IUU) and
small-scale fisheries.
FISH AND FISHERY PRODUCTS
Contact:[email protected]
FAO FISH PRICE INDEX (2002-2004 = 100)
WORLD FISH MARKET AT A GLANCE
Source: FAO Fish Price Index: Norwegian Seafood Council (NSC)Totals may not add up due to rounding
80
105
130
155
180
201520132011200920072005200320011999
FAO total fish price index
Capture totalAquaculture Total
Source: Norwegian Seafood Council (NSC)
2013 2014estim.
2015f’cast
Change: 2015 over 2014
million tonnes %
WORLD BALANCE
Production 162.8 164.3 168.6 2.6
Capture fisheries 92.6 90.0 90.6 0.7
Aquaculture 70.2 74.3 78.0 5.0
Trade value (exports USD billion)
136.5 143.9 144.5 0.4
Trade volume (live weight) 58.8 59.5 59.7 0.3
Total utilization 162.8 164.3 168.6 2.6
Food 141.0 144.6 147.5 2.0
Feed 16.8 15.0 16.4 9.7
Other uses 5.0 4.8 4.7 -2.1
SUPPLY AND DEMAND INDICATORS
Per caput food consumption:
Food fish (kg/yr) 19.7 20.0 20.1 0.9
From capture fisheries (kg/year) 9.9 9.7 9.5 -2.2
From aquaculture (kg/year) 9.8 10.3 10.6 3.8
FAO FISH PRICE INDEX
(2002-2004=100)2013 2014 2015
Jan-AprChange:
Jan-Apr 2015 over
Jan-Apr 2014 %
148 157 150 -6.6

MAR
KET
ASSE
SSM
ENTS
MAR
KET
ASSE
SSM
ENTS

11FOOD OUTLOOKMAY 2015
WH
EA
T
Figure 1. Wheat export price (US No. 2 H.W. Gulf) Figure 2. CBOT wheat futures for September
Major Wheat Exporters and Importers
Major ExportersMajor Importers
WHEAT
200
250
300
350
400
2014/15
2013/14
2012/13
2011/12
USD per tonne
JMAMFJDNOSAJ
150
200
250
300
USD per tonne
S O N D J F M A
2014 values 2015 values
PRICES
Wheat prices under downward pressure since the start of 2015Large global supplies, in particular in major exporting
countries, have kept international wheat prices under
downward pressure since the beginning of 2015. In fact, with
two consecutive bumper crops in 2013 and 2014 pushing
world inventories to above average levels, wheat prices have
been on a declining trend since the start of the 2014/15
marketing season, in July 2014, falling in March 2015 to
their lowest level since 2010. While at times, developments
in other markets, in particular maize and soybean markets
provided some support, wheat prices remained under
downward pressure even after the imposition of export
restrictions by the Russian Federation (from February 2015 to
June 2015), which could have lifted world prices, but did not.
By April, the benchmark US wheat (No.2 Hard Red Winter)
averaged USD 242 per tonne, down over USD 100 per tonne,
or nearly 30 percent, from April 2014.
Wheat futures also remained under substantial pressure
because of large supplies. While in recent weeks, concerns

Ma
rke
t a
sse
ssm
en
ts
12 FOOD OUTLOOKMAY 2015
Table 1. World wheat market at a glance
Table 2. Wheat production: leading producers*
2013 2014 estim.
2015f”cast
Change:2015 over
2014
million tonnes %
European Union 143.6 156.1 148.5 -4.9
China (Mainland) 121.9 126.2 126.5 0.2
India 93.5 95.8 92.0 -4.0
United States 58.1 55.1 56.0 1.6
Russian Federation 52.1 59.7 54.0 -9.5
Canada 37.5 29.3 29.5 0.7
Pakistan 24.2 25.3 26.4 4.3
Australia 26.9 23.6 24.4 3.4
Ukraine 22.3 24.1 23.6 -2.1
Turkey 22.0 19.0 21.0 10.5
Iran Islamic Rep. of 14.0 13.0 13.5 3.8
Kazakhstan 14.0 13.0 12.5 -3.8
Argentina 9.2 13.9 12.0 -13.7
Egypt 8.8 8.8 8.5 -3.4
Uzbekistan 6.9 7.2 7.5 4.2
Other countries 62.2 59.4 63.2 6.4
World 717.2 729.5 719.1 -1.4
* Countries listed according to their position in global production (average 2013-2015)
1 Trade refers to exports based on a common July/June marketing season.
2 Major exporters include Argentina, Australia, Canada, EU, Kazakhstan, Russian Fed., Ukraine and the United States.
3 Derived from the International Grains Council (IGC) wheat index.
2013/14 2014/15 estim.
2015/16 f’cast
Change: 2015/16
over 2014/15
million tonnes %
WORLD BALANCE
Production 717.2 729.5 719.1 -1.4
Trade1 156.7 153.0 151.0 -1.3
Total utilization 695.2 711.7 716.1 0.6
Food 480.8 484.6 488.8 0.9
Feed 128.1 139.0 139.4 0.3
Other uses 86.4 88.1 87.9 -0.2
Ending stocks 189.4 200.0 198.9 -0.5
SUPPLY AND DEMAND INDICATORS
Per caput food consumption:
World (kg/yr) 67.2 67.1 66.9 -0.3
LIFDC (kg/yr) 46.2 45.9 45.8 -0.2
World stock-to-use ratio (%) 26.6 27.9 27.8
Major exporters stock-to-disappearance ratio2 (%)
13.6 15.5 16.5
FAO WHEAT PRICE INDEX3 (2002-2004=100)
2013 2014 2015 Jan-Apr
Change: Jan-Apr 2015
over Jan-Apr 2014
%
194 181 157 -16.9
about dry conditions in the southern plains of the United
States provided some support, the overall favourable supply
prospects for another season kept the Chicago Board of
Trade (CBOT) quotations at some 25 percent below the
levels registered in the corresponding period in 2014. More
detailed analysis of the futures markets can be found in the
Market Indicators section of this report.
PRODUCTION
Wheat production could decline slightly in 2015 FAO’s latest forecast for 2015 wheat production stands at
719 million tonnes, over 10 million tonnes (1.4 percent)
below the record of 2014. The decline is largely attributable
to a lower production forecast in Europe, following a
contraction in the area planted, only partly compensated by
small increases in Asia and North America.
In the United States, production is forecast to grow by
1.6 percent to 56 million tonnes in 2015. The anticipated
gain reflects a 9 percent increase in the main winter
wheat plantings, to be harvested from June, on account
of a recovery to average yields and a lower abandonment
rate more than compensating for reduced plantings.
Plantings for the minor spring crop are expected to remain
unchanged from 2014’s above-average level and, assuming
normal weather conditions, production is forecast to
be close to last year’s level. In Canada, with the bulk of
the wheat crop planted in May, production is tentatively
forecast to increase by 0.7 percent to 29.5 million tonnes.
The positive outlook mainly reflects a projected
enlargement in the area sown to durum wheat.
In Europe, production is set to fall by nearly
15 million tonnes. Current prospects for the EU point to a
production of just over 148 million tonnes, nearly 4 percent
less than the 2014 record, but still the second largest crop.
Smaller plantings are the main reason for the decrease, but
beneficial weather is expected to maintain above average
yields, averting further declines. In the Russian Federation,
the total area planted to wheat in 2015 is expected to
remain unchanged compared to last year’s average level,
with a strong expansion in winter plantings forecast to
offset a projected shortfall in spring sowings due, in part,
to higher input costs. Assuming near-average yields, wheat
production in 2015 is forecast at an above-average level of
54 million tonnes, although 10 percent below 2014. Ukraine
is set to harvest a smaller wheat crop of 23.6 million tonnes,
2 percent down from 2014. The decline is on account of a
likely decrease in yields from the record last year.
In Asia, with harvesting underway, current prospects
for 2015 point to a production close to the high level of

13FOOD OUTLOOKMAY 2015
WH
EA
T
Figure 3. Wheat production and area
550
600
650
700
750
15141312111009080706180
195
210
225
240
Million tonnes Million ha
Production Area
estim. f’cast
the previous year. In China, considering similar plantings to
2014 and assuming favourable weather conditions for the
remainder of the season, the 2015 wheat production is set
to remain close to the 2014 record. In India, the production
forecast has been revised downwards by 1.8 million tonnes
to 92 million tonnes, reflecting unfavourable weather
before harvest in the main wheat producing states. At this
level, the 2015 wheat output would be 2 percent lower
than that of 2014 but still the fourth highest on record. In Pakistan, the 2015 wheat production is officially forecast
at 26.4 million tonnes, 4 percent up from the bumper
level of the previous year, mainly reflecting an increase in
the area planted. Buoyed by an adequate irrigated water
supply, higher fertilizer use and good weather conditions,
yields are also predicted to remain around the high level
of the previous year. Planting of the spring wheat crop is
progressing in Kazakhstan, with the preliminary 2015
production forecast for the aggregate harvest standing at
12.5 million tonnes, 4 percent below the average 2014
outcome, due to an expected 2 percent fall in plantings.
In the Near East, wheat production is forecast to
rebound from the drought-affected level of 2014. In
Turkey, an anticipated increase in yields, reflecting
adequate soil moisture, and a small expansion in the area
planted are foreseen to result in a 10 percent production
increase in 2015. Although good climatic conditions also
favoured crop development in Iraq and Syria, the on-going
conflicts are likely to limit any significant production gains
after the weather-depressed output of 2014.
In North Africa, the sub-region which accounts for the
bulk of Africa’s wheat, the production outlook remains
positive, mainly due to favourable weather in most
countries, except for Algeria, where an autumn drought
resulted in a reduced forecast for 2015. Both Morocco,
following last year’s below average harvest, and Tunisia
are expected to harvest larger crops in 2015.
In the Southern Hemisphere, early indications for
Australia point to improved production, with the 2015
harvest expected to commence in August-September. The
anticipated increase would rest on a forecast recovery in
yields from the below-average 2014 level and on a slight
expansion in the area planted, provisionally forecast at
about 14 million hectares.
In South America, sowing began in May and will be
finalized by September. Lower wheat prices in Argentina
will likely cause a decline in the sown area for the 2015
crop, while plantings are tentatively forecast to rise in
Brazil, owing to strong demand for high quality milling
wheat. Overall, aggregate production for the region is
expected to decline by 2.3 percent from the exceptionally
high level of 2014. In Central America and the Caribbean,
the 2015 wheat production prospects are positive, driven
by an expected increase in the main producer Mexico, reflecting a significant rise of plantings.
TRADE
World trade to contract in 2015/16FAO’s first forecast for world trade in wheat (including
wheat flour in wheat equivalent) in 2015/16 (July/June)
stands at 151 million tonnes, down 1.3 million tonnes
from the 2014/15 revised estimate. The largest declines
are expected in imports by the developing countries
whereas the developed countries are likely to maintain
their purchases at the same level as in 2014/15. While
world wheat trade in 2014/15 is currently put at almost
4 million tonnes below the record in 2013/14, the
estimated drop in trade volume is less than anticipated,
as lower international prices have helped stimulate import
demand. In fact, the forecast for world wheat trade in
2014/15 has been raised by 1.6 million tonnes since April,
mostly on upward adjustments to import forecasts of
several countries in Africa and Asia.
Total imports in Asia in 2015/16 are forecast at
72.8 million tonnes, down just 700 000 tonnes from the
2014/15 estimate. A reduction of 1 million tonnes in wheat
imports by Turkey in 2015/16 (to 4.5 million tonnes),
mostly on expectation of larger output in 2015, would
more than offset some increases in imports by the
Republic of Korea and China. Imports by most other
major wheat importers in Asia are seen to decline slightly,
in view of the relatively large levels of carryover stocks as
well as generally good production outlook for the largest
producers. Imports by the Philippines are expected to

Ma
rke
t a
sse
ssm
en
ts
14 FOOD OUTLOOKMAY 2015
Figure 4. Wheat imports by region Figure 5. Wheat exports: major exporters
0
20
40
60
80
2014/15 estimate
2015/16 forecast
Million tonnes
Asia Africa EuropeSouthAmerica
CentralAmerica
remain steady, at around 3.3 million tonnes. In November
2014, the government initiated anti-dumping duties of just
over 16 percent on imports of wheat flour from Turkey for
five years.
In Africa, total wheat imports in 2015/16 are forecast
to remain unchanged at the 2014/15 level of around
43 million tonnes. In North Africa, wheat imports by
Egypt, the world’s largest wheat importer, are set to
increase slightly, to 11 million tonnes in 2015/16, given
the expectation of a small decline in production and rising
demand. In January, the government approved the release
of 139 000 tonnes of imported wheat, along with over
630 000 tonnes of domestic wheat from state reserves to
help ease tight domestic supply of high protein grades.
This move was followed by a decision in February to
extend for six months the import of wheat with moisture
levels of up to 13.5 percent. However, shipments to
Morocco, the second largest North African importer,
could decline slightly, to 3 million tonnes, given the
prospect for higher production this year. In April, Morocco
increased the custom duty on soft wheat imports sharply,
to 75 percent from 17.5 percent last year (effective from
1 May through October 31). Wheat imports by other
major buyers in Africa are expected to remain close to
2014/15 levels. In Nigeria, they are forecast to reach
4.7 million tonnes, similar to the previous two seasons. In
South Africa, where production is put at nearly the same
level as in 2014, imports are expected to decline slightly,
to 1.6 million tonnes. In March, the country increased its
import tariff on wheat, from ZAR 157 (USD 13) per tonne
to ZAR 461 (USD 38) per tonne.
In Europe, aggregate wheat imports in 2015/16 are
forecast to reach 8.5 million tonnes, up just marginally
from 2013/14. As in the current season, the EU would be
responsible for all of the projected increase. In spite of the
sharp fall in its wheat production, currently anticipated,
wheat imports by the EU are forecast to reach just
6 million tonnes in 2015/16, up only 300 000 tonnes from
the current season. Large inventories will limit the need
for higher imports. By contrast, in Latin America and the
Caribbean, aggregate wheat imports in 2015/16 are put at
nearly 21.3 million tonnes, down 1.4 million tonnes from
2014/15. All of the decline would be on account of Brazil and Mexico, which may curb imports by 1.2 million tonnes
and 200 000 tonnes respectively from their 2014/15 levels,
on expectation of larger crops this year.
As for exports, the current 2014/15 season, which
is soon coming to a close, was marked by some
unexpected developments concerning market shares
for several exporters. The main driving factor has been
currency movements, most specifically the continuing
strengthening of the US dollar which eroded the export
price competitiveness of United States’ wheat against its
main rivals, in particular the EU. Wheat shipments from the
United States are currently forecast at 23.5 million tonnes
in 2014/15, down almost 8 million tonnes from the
previous season and 6.5 million tonnes less than the FAO’s
first forecast published in the May 2014 Food Outlook. By
contrast, wheat shipments from the EU are currently put
at an all-time high of 32 million tonnes which exceeds the
previous season’s level by 1.5 million tonnes and FAO’s
initial forecast by 7.5 million tonnes. Argentina has been
another major exporter making much larger shipments in
2014/15 than in the previous season, on improved supply
situation following a rebound in domestic production. Even
Ukraine and the Russian Federation, the two countries
0 7 14 21 28 35
2014/15 estimate 2015/16 forecast
Million tonnes
UnitedStates
EU
Canada
Argentina
Ukraine
Kazakhstan
Australia
RussianFederation
15FOOD OUTLOOKMAY 2015
WH
EA
T
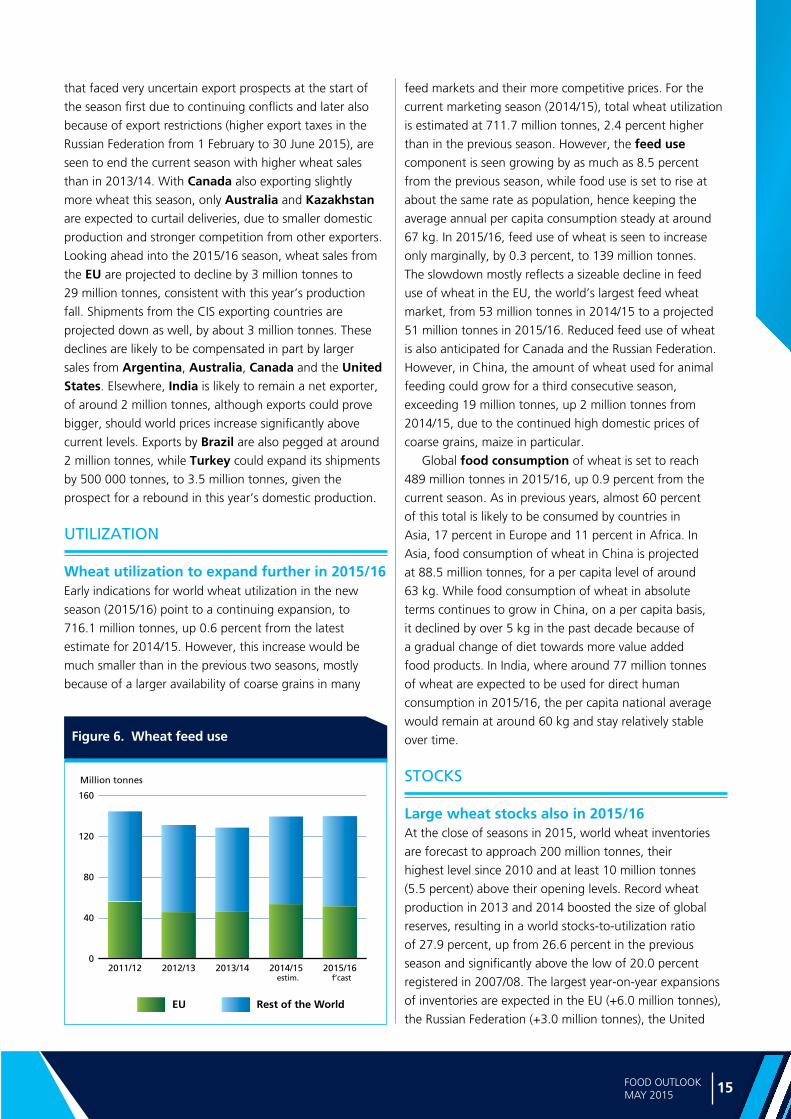
Figure 6. Wheat feed use
that faced very uncertain export prospects at the start of
the season first due to continuing conflicts and later also
because of export restrictions (higher export taxes in the
Russian Federation from 1 February to 30 June 2015), are
seen to end the current season with higher wheat sales
than in 2013/14. With Canada also exporting slightly
more wheat this season, only Australia and Kazakhstan
are expected to curtail deliveries, due to smaller domestic
production and stronger competition from other exporters.
Looking ahead into the 2015/16 season, wheat sales from
the EU are projected to decline by 3 million tonnes to
29 million tonnes, consistent with this year’s production
fall. Shipments from the CIS exporting countries are
projected down as well, by about 3 million tonnes. These
declines are likely to be compensated in part by larger
sales from Argentina, Australia, Canada and the United States. Elsewhere, India is likely to remain a net exporter,
of around 2 million tonnes, although exports could prove
bigger, should world prices increase significantly above
current levels. Exports by Brazil are also pegged at around
2 million tonnes, while Turkey could expand its shipments
by 500 000 tonnes, to 3.5 million tonnes, given the
prospect for a rebound in this year’s domestic production.
UTILIZATION
Wheat utilization to expand further in 2015/16 Early indications for world wheat utilization in the new
season (2015/16) point to a continuing expansion, to
716.1 million tonnes, up 0.6 percent from the latest
estimate for 2014/15. However, this increase would be
much smaller than in the previous two seasons, mostly
because of a larger availability of coarse grains in many
feed markets and their more competitive prices. For the
current marketing season (2014/15), total wheat utilization
is estimated at 711.7 million tonnes, 2.4 percent higher
than in the previous season. However, the feed use
component is seen growing by as much as 8.5 percent
from the previous season, while food use is set to rise at
about the same rate as population, hence keeping the
average annual per capita consumption steady at around
67 kg. In 2015/16, feed use of wheat is seen to increase
only marginally, by 0.3 percent, to 139 million tonnes.
The slowdown mostly reflects a sizeable decline in feed
use of wheat in the EU, the world’s largest feed wheat
market, from 53 million tonnes in 2014/15 to a projected
51 million tonnes in 2015/16. Reduced feed use of wheat
is also anticipated for Canada and the Russian Federation.
However, in China, the amount of wheat used for animal
feeding could grow for a third consecutive season,
exceeding 19 million tonnes, up 2 million tonnes from
2014/15, due to the continued high domestic prices of
coarse grains, maize in particular.
Global food consumption of wheat is set to reach
489 million tonnes in 2015/16, up 0.9 percent from the
current season. As in previous years, almost 60 percent
of this total is likely to be consumed by countries in
Asia, 17 percent in Europe and 11 percent in Africa. In
Asia, food consumption of wheat in China is projected
at 88.5 million tonnes, for a per capita level of around
63 kg. While food consumption of wheat in absolute
terms continues to grow in China, on a per capita basis,
it declined by over 5 kg in the past decade because of
a gradual change of diet towards more value added
food products. In India, where around 77 million tonnes
of wheat are expected to be used for direct human
consumption in 2015/16, the per capita national average
would remain at around 60 kg and stay relatively stable
over time.
STOCKS
Large wheat stocks also in 2015/16At the close of seasons in 2015, world wheat inventories
are forecast to approach 200 million tonnes, their
highest level since 2010 and at least 10 million tonnes
(5.5 percent) above their opening levels. Record wheat
production in 2013 and 2014 boosted the size of global
reserves, resulting in a world stocks-to-utilization ratio
of 27.9 percent, up from 26.6 percent in the previous
season and significantly above the low of 20.0 percent
registered in 2007/08. The largest year-on-year expansions
of inventories are expected in the EU (+6.0 million tonnes),
the Russian Federation (+3.0 million tonnes), the United
0
40
80
120
160
2015/162014/152013/142012/132011/12
Million tonnes
estim. f’cast
EU Rest of the World
Ma
rke
t a
sse
ssm
en
ts
16 FOOD OUTLOOKMAY 2015
States (+2.6 million tonnes), India (+2.5 million tonnes)
and Argentina (+1.0 million tonnes), more than offsetting
declines in Canada (-3.4 million tonnes) and China
(-2.2 million tonnes).
Based on the latest production forecast for 2015 and
the projected utilization in 2015/16, FAO’s first forecast
for world wheat stocks by the close of crop seasons in
2016 stands at nearly 199 million tonnes, marginally below
this year. In China, ending stocks are anticipated to fall to
44 million tonnes, down 4.9 million tonnes from 2015,
the smallest in over a decade. Offsetting this decrease,
however, inventories in the United States and the EU
are expected to increase further in the new season, by
2.4 million tonnes and 3.0 million tonnes respectively.
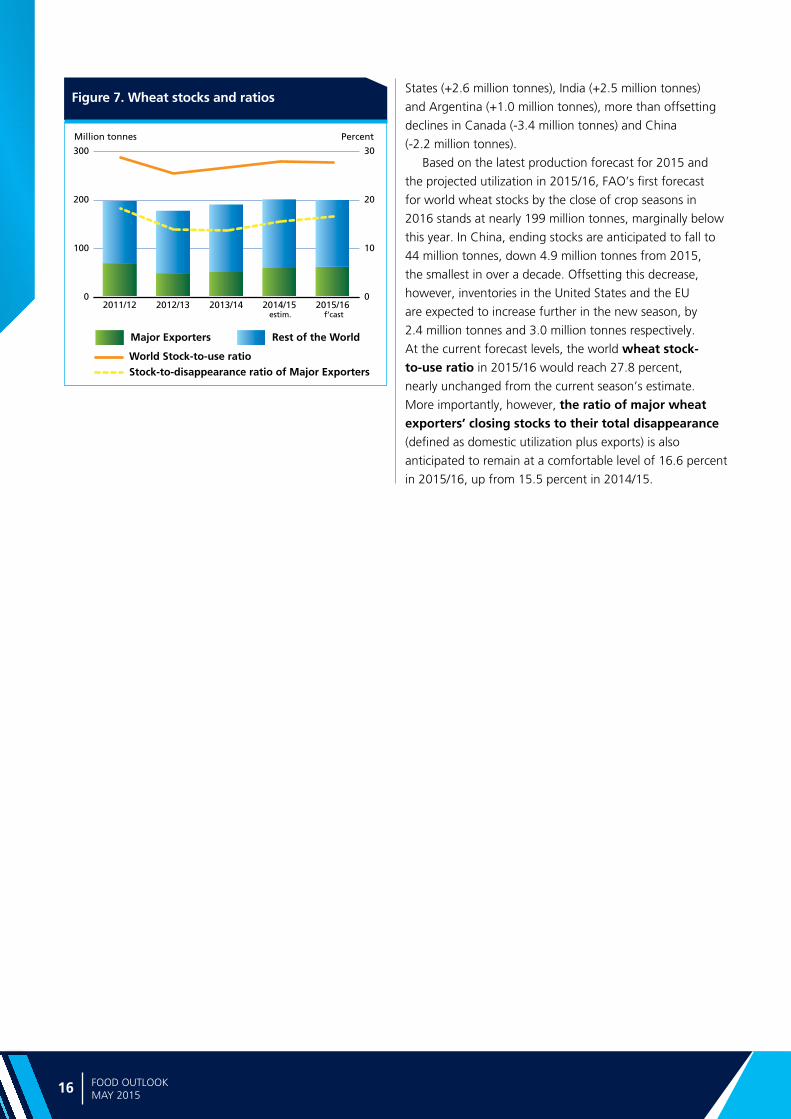
At the current forecast levels, the world wheat stock-to-use ratio in 2015/16 would reach 27.8 percent,
nearly unchanged from the current season’s estimate.
More importantly, however, the ratio of major wheat exporters’ closing stocks to their total disappearance
(defined as domestic utilization plus exports) is also
anticipated to remain at a comfortable level of 16.6 percent
in 2015/16, up from 15.5 percent in 2014/15.
Figure 7. Wheat stocks and ratios
0
100
200
300
2015/162014/152013/142012/132011/120
10
20
30
Million tonnes Percent
Major Exporters Rest of the World
World Stock-to-use ratioStock-to-disappearance ratio of Major Exporters
estim. f’cast

Ma
rke
t a
sse
ssm
en
ts
18 FOOD OUTLOOKMAY 2015
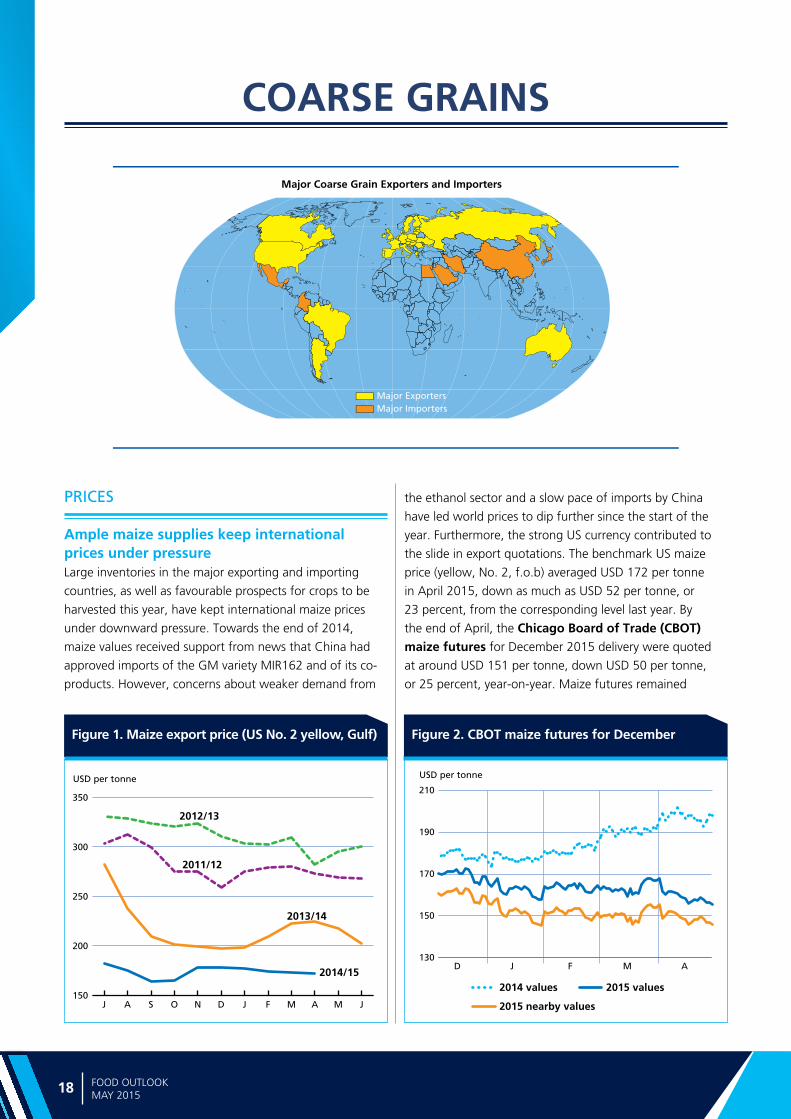
Figure 2. CBOT maize futures for DecemberFigure 1. Maize export price (US No. 2 yellow, Gulf)
Major Coarse Grain Exporters and Importers
Major ExportersMajor Importers
150
200
250
300
350
2014/15
2013/14
2012/13
2011/12
USD per tonne
JMAMFJDNOSAJ
130
150
170
190
210
USD per tonne
D J F M A
2014 values 2015 values
2015 nearby values
COARSE GRAINS
PRICES
Ample maize supplies keep international prices under pressure Large inventories in the major exporting and importing
countries, as well as favourable prospects for crops to be
harvested this year, have kept international maize prices
under downward pressure. Towards the end of 2014,
maize values received support from news that China had
approved imports of the GM variety MIR162 and of its co-
products. However, concerns about weaker demand from
the ethanol sector and a slow pace of imports by China
have led world prices to dip further since the start of the
year. Furthermore, the strong US currency contributed to
the slide in export quotations. The benchmark US maize
price (yellow, No. 2, f.o.b) averaged USD 172 per tonne
in April 2015, down as much as USD 52 per tonne, or
23 percent, from the corresponding level last year. By
the end of April, the Chicago Board of Trade (CBOT) maize futures for December 2015 delivery were quoted
at around USD 151 per tonne, down USD 50 per tonne,
or 25 percent, year-on-year. Maize futures remained

19FOOD OUTLOOKMAY 2015
CO
AR
SE G
RA
INS
Figure 3. Coarse grain production and area Figure 4. World maize production
950
1050
1150
1250
1350
15141312111009080706280
300
320
340
360
Million tonnes Million ha
Production Area
estim. f’cast
under downward pressure in April mostly on a slack world
demand and prospects for continuing high supplies.
By contrast, international prices of barley and sorghum
rose sharply between September 2014 and March 2015.
The Canadian feed barley and US sorghum quotations
gained over 50 percent and 40 percent, respectively,
underpinned by large sales to China, where import demand
for both commodities surged unexpectedly. Tightening
export supplies also contributed to the strengthening of
international quotations, of sorghum in particular.
PRODUCTION
Early prospects indicate smaller coarse grains production in 2015FAO’s first forecast for world coarse grains production in
2015 stands at 1 290 million tonnes, 2.6 percent lower
than the record of 2014. The overall decrease mainly
reflects reduced output prospects in North America (maize)
and Europe (maize and barley).
Global maize production in 2015 is forecast at
995 million tonnes, 3 percent (30 million tonnes) below
the 2014 record. The contraction would result from lower
anticipated outputs in the United States and Europe, but
also in South America and Africa.
In the Northern Hemisphere, planting of the 2015
maize crops is underway, with harvesting expected to start
from September. Maize production in the United States,
the world’s largest producer, is forecast to decline by
3 percent from the 2014 record, to 350 million tonnes. The
contraction would ensue from a 5 percent price-induced
reduction in plantings, partly offset by an expected recovery
in yields.
0
300
600
900
1200
2015/162014/152013/142012/132011/12
Million tonnes
United States
Brazil
China (Mainland) EU
Others
estim. f’cast
In China, continued government support and a switch
away from cotton cultivation could foster a small expansion
in the area planted to maize. For instance, the northeastern
provinces of China, traditionally specialized in soybeans,
are reportedly shifting towards the cultivation of maize
and rice, which benefit from government procurement
programmes. Assuming average yield levels, maize
production in the country is forecast to grow by about
1 percent to 217 million tonnes in 2015.
In the EU, early indications point to a 6 percent decline
in production from the 2014 record to 70 million tonnes.
The decrease rests on expectations of a contraction in
plantings (mainly in the United Kingdom) and of a return
to near-average yields from the 2014 exceptionally high
level. In the Russian Federation, official projections
point to a 3 percent expansion in plantings, which is likely
to outweigh a decline of yields from the above-average
level of last year, resulting in a an expected 11 million
tonne increase in maize production in 2015. In Ukraine,
production is anticipated to decrease from last year’s high
level, owing partly to higher production costs that are
expected to reduce plantings.
In the Southern Hemisphere, harvesting of the main
2015 maize crops is underway and expected to be
finalized by July. In South America, Brazil’s production is
forecast to decrease from the high level of 2014, largely
on account of a drop in the area planted, in response
to less attractive prices relative to soybeans. Similarly,
in Argentina, a fall in plantings is anticipated to result
in a smaller production. Despite an expected combined
decline of nearly 6 million tonnes in Brazil and Argentina,
production in the subregion is still forecast to remain above
average levels. In Central America and the Caribbean,

Ma
rke
t a
sse
ssm
en
ts
20 FOOD OUTLOOKMAY 2015
Table 1. World coarse grain market at a glance
Table 2. Coarse grain production: leading producers*
* Countries listed according to their position in global production (average 2013-2015)
1 Trade refers to exports based on a common July/June marketing season.
2 Major exporters include Argentina, Australia, Brazil, Canada, EU, Russian Fed., Ukraine and the United States.
2013 2014 estim.
2015f”cast
Change:2015 over
2014
million tonnes %
United States 367.4 377.4 365.6 -3.1
China (Mainland) 227.9 224.7 226.1 0.6
European Union 158.9 169.0 161.5 -4.4
Brazil 83.5 81.7 78.7 -3.7
India 43.2 38.2 40.7 6.5
Argentina 40.9 39.9 37.6 -5.8
Russian Federation 36.6 41.7 39.7 -4.8
Ukraine 40.5 39.5 35.0 -11.4
Mexico 30.7 31.8 30.4 -4.4
Canada 28.8 22.0 23.8 8.2
Nigeria 18.4 19.5 19.4 -0.5
Indonesia 18.5 19.1 19.2 0.5
Ethiopia 18.5 18.0 17.2 -4.4
Turkey 14.5 12.9 12.9 0.0
South Africa 13.0 15.6 10.5 -32.7
Other countries 171.0 173.4 171.7 -1.0
World 1 312.3 1 324.4 1 290.0 -2.6
2013/14 2014/15 estim.
2015/16 f’cast
Change: 2015/16
over 2014/15
million tonnes %
WORLD BALANCE
Production 1 312.3 1 324.4 1 290.0 -2.6
Trade1 158.7 157.0 156.0 -0.6
Total utilization 1 247.4 1 284.5 1 297.5 1.0
Food 199.7 202.7 206.1 1.7
Feed 698.7 724.9 737.3 1.7
Other uses 349.0 356.9 354.2 -0.8
Ending stocks 238.9 269.5 259.6 -3.7
SUPPLY AND DEMAND INDICATORS
Per caput food consumption:
World (kg/yr) 27.9 28.1 28.2 0.4
LIFDC (kg/yr) 39.6 39.7 40.1 1.0
World stock-to-use ratio (%) 18.6 20.8 19.6
Major exporters stock-to-disappearance ratio2 (%)
11.5 14.6 13.7
FAO COARSE GRAIN PRICE INDEX (2002-2004=100)
2013 2014 2015 Jan-Apr
Change: Jan-Apr 2015
over Jan-Apr 2014
%
246 183 165 -18.3
prospects point to an above-average output in Mexico,
the subregion’s main producer, although not matching the
2014 record.
In Southern Africa, drought conditions earlier in the year
have marred the production outlook, especially in South Africa, the largest maize producer in Africa, which may
incur a 33 percent output contraction. Adverse weather
conditions across most of the subregion have resulted in
poor crop prospects, with virtually all countries expected to
register a contraction in production from the 2014 bumper
levels. As a result, the subregion aggregate output in 2015
is provisionally forecast at 21 million tonnes, 25 percent
below the previous year’s high level.
The global forecast for 2015 barley production stands
at 141 million tonnes, about 2 percent less than in 2014.
The outlook reflects lower forecasts for Europe and the CIS
region that would more than outweigh a foreseen recovery
in South America, and increases in Asia and North America.
World sorghum production in 2015 is forecast at around
62 million tonnes, 1.4 million tonnes (2 percent) below the
previous year. The anticipated overall decrease is mainly on
account of lower expected harvests in the Sudan and the United States, which more than offset a projected rise in
India.
TRADE
World trade in coarse grains could decline slightly in 2015/16FAO’s first forecast for world trade in coarse grains in
2015/16 (July/June) stands at 156 million tonnes, which
would point to a 0.6 percent (1 million tonnes) decline from
the estimated level for 2014/15. The projected decrease
reflects reduced trade in barley, which could offset
expected rises in maize, oats, rye and sorghum, while trade
in millet is likely to remain unchanged.
Global trade in maize is forecast at 117 million tonnes,
slightly above the 2014/15 level. A decline in maize imports in
Asia (particularly China) and North America (Canada) is likely
to outweigh increased purchases by other regions. Total maize
imports in Europe are forecast to exceed 9 million tonnes in
2015/16. The increase is consistent with the EU’s prospects
for lower maize production. In Asia, aggregate maize
imports are set to decrease slightly, to 59 million tonnes in
2015/16. In China (Mainland), they may fall to a 5-year low
of 3 million tonnes (500 000 less than in 2014/15) despite
high domestic maize prices, as import restrictions and high
inventories are anticipated to curtail demand.
In Africa, total maize imports could reach
18 million tonnes, 500 000 tonnes higher than last
season, with most of the anticipated increase resting on
21FOOD OUTLOOKMAY 2015
CO
AR
SE G
RA
INS
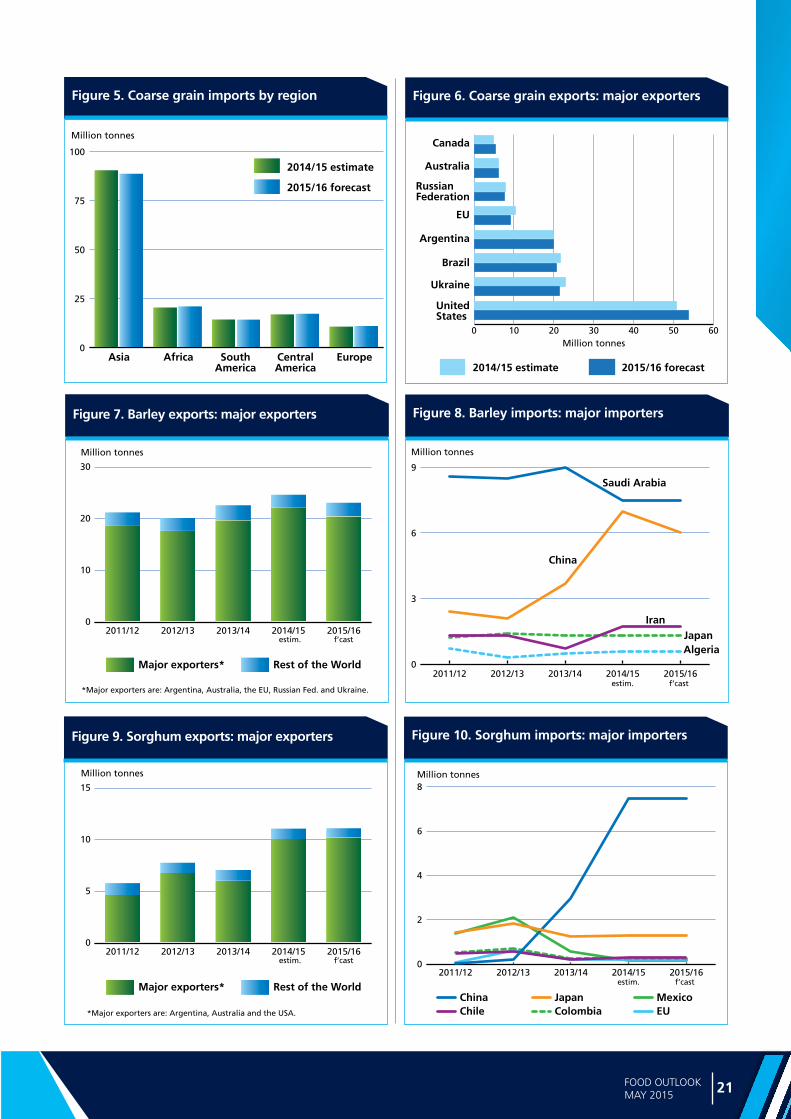
Figure 5. Coarse grain imports by region
0
25
50
75
100
2014/15 estimate
2015/16 forecast
Million tonnes
Asia Africa EuropeSouthAmerica
CentralAmerica
Figure 6. Coarse grain exports: major exporters
0 10 20 30 40 50 60
2014/15 estimate 2015/16 forecast
Million tonnes
UnitedStates
EU
Canada
Brazil
Ukraine
Argentina
Australia
RussianFederation
Figure 8. Barley imports: major importers
Figure 10. Sorghum imports: major importers
Figure 7. Barley exports: major exporters
Figure 9. Sorghum exports: major exporters
0
10
20
30
2015/162014/152013/142012/132011/12
Million tonnes
estim. f’cast
Major exporters* Rest of the World
*Major exporters are: Argentina, Australia, the EU, Russian Fed. and Ukraine.
0
3
6
9
2015/162014/152013/142012/132011/12
China
IranJapanAlgeria
Saudi Arabia
estim. f’cast
Million tonnes
0
5
10
15
2015/162014/152013/142012/132011/12
Million tonnes
estim. f’cast
Major exporters* Rest of the World
*Major exporters are: Argentina, Australia and the USA.
0
2
4
6
8
2015/162014/152013/142012/132011/12
China
estim. f’cast
Japan MexicoChile Colombia EU
Million tonnes

Ma
rke
t a
sse
ssm
en
ts
22 FOOD OUTLOOKMAY 2015
2007/08 2008/09 2009/10 2010/11 2011/12 2012/13 2013/14* estim. 2014/15*
(f'cast)
Thousand tonnes
Maize production 331 177 307 142 332 550 316 166 313 956 273 188 351 270 361 101
Ethanol use 77 453 93 396 116 616 127 538 127 005 117 886 130 409 132 085
Yearly change (%) 44 21 25 9 -0.4 -7 11 1
As % of production 23 30 35 40 41 43 37 37
Table 3. Maize use for ethanol (excluding non-fuel) in the United States
Source: WASDE-USDA. * 9 April 2015
larger purchases by Zimbabwe and South Africa, which
face production declines in 2015. In Latin America and
the Caribbean, maize imports by Mexico may climb to
11 million tonnes, 500 000 tonnes more than in 2014/15,
to compensate for an anticipated small production decline
in 2015 from last year’s record harvest. Elsewhere, imports
by Canada are expected to fall to 1 million tonnes on
expectations of a larger 2015 crop.
World trade in barley is forecast at 23 million tonnes
in 2015/16, around 2 million tonnes, or almost 6 percent,
less than the record of 2014/15. Much of the contraction
in world barley imports is expected to be concentrated
in Asia, where China is set to import 6 million tonnes in
2015/16, 1 million tonnes less than the exceptionally high
level of the current season, but still well above the 5-year
average. In recent years, China has turned increasingly to
barley and sorghum as a source of livestock feed. Saudi Arabia, which accounts for 33 percent of world barley
imports, is projected to purchase a similar volume to that of
2014/15. On the other hand, in Africa, barley imports could
rise slightly, to 1.9 million tonnes, on higher deliveries to
Tunisia.
Global trade in sorghum is projected to approach
11 million tonnes in 2015/16, virtually unchanged from an
unusually high level in the current season. Total imports
in Asia are anticipated to remain steady around this
season’s level. China (Mainland) is forecast to purchase
7.5 million tonnes of sorghum in 2015/16, confirming its
position as the world major importer of sorghum, held for
the past three years. Similar to barley, sorghum is a low
cost feed substitute for maize and is not subject to import
quotas as maize is. Purchases of sorghum by Japan are
expected to remain stable at 1.3 million tonnes. Mexico,
traditionally the largest sorghum importer, has switched
to maize for livestock feeding over the past two years.
In 2015/16, it is forecast to import 150 000 tonnes of
sorghum, similar to the previous year, but well below the
high levels it used to purchase prior to 2013/14.
Based on the prospect of a slight decrease in world
demand for coarse grains in 2015/16, most exporting
countries, are anticipated to export less than in the current
season except for Australia and the United States.
Notably, given the positive outlook for maize production
in the United States, shipments of coarse grains from the
country could rise by 3 million tonnes to 53 million tonnes.
The global contraction in coarse grains exports would
mainly reflect reduced sales by the EU, currently forecast
to dip by 1.3 million tonnes to 8.4 million tonnes,
Ukraine, which may ship around 21 million tonnes, almost
2 million tonnes less than in 2014/15, and Brazil, which
is likely to register a 1 million tonne decline in sales to
20 million tonnes. Exports by the Russian Federation
are also predicted to drop slightly mainly on account of a
smaller crop in 2015.
UTILIZATION
Utilization in 2015/16 to increase at a slower pace than in the two previous seasonsBased on current expectations, total utilization of coarse
grains in 2015/16 may reach 1 298 million tonnes,
1 percent higher than in 2014/15. At this forecast level,
utilization would exceed its 10-year trend value for the third
consecutive season.
Global feed utilization of coarse grains in 2015/16 is
forecast to rise by around 2 percent, or 12 million tonnes,
to 737 million tonnes. Much of the expected increase
would be driven by the United States, which may feed a
record 145 million tonnes (mostly maize) in 2015/16, up by
6 million tonnes, or 5 percent, from the current season, and
the EU, with an increase of 3 million tonnes, or 3 percent,
to 124 million tonnes. China is also anticipated to use more
coarse grains for feed in 2015/16, but the increase would
be modest, about 1 percent, far lower than the 7 percent
growth registered in 2014/15. The utilization of coarse
grains by the livestock sector is also foreseen to increase in
Brazil and the Russian Federation.
World food consumption of coarse grains is projected
to increase by almost 2 percent (around 3 million tonnes)
in 2015/16, to 206 million tonnes, or about 16 percent
of total utilization. Most of the expected increase would
originate in Africa (up 3 percent to 86 million tonnes) and

23FOOD OUTLOOKMAY 2015
CO
AR
SE G
RA
INS
Figure 12. Coarse grain stocks and ratios
0
100
200
300
2015/162014/152013/142012/132011/127
12
17
22
Million tonnes Percent
Major Exporters Rest of the World
World Stock-to-use ratioStock-to-disappearance ratio of Major Exporters
estim. f’cast
to a lesser extent Asia (up 1 percent to 65 million tonnes)
and Latin America and the Caribbean (up 1 percent to
21 million tonnes). At the global level, average annual per
capita consumption of coarse grains as food is expected
to remain stable at 28.2 kg. Small rises in per capita food
consumption of coarse grains in 2015/16 are projected
for Latin America and the Caribbean, to 96.9 kg, and for
Africa, to 75.0 kg, while in Asia it could stabilize at around
14.9 kg.
Total industrial use of coarse grains is projected
to slightly exceed 300 million tonnes in 2015/16, up
1 percent from the estimated level in 2014/15, with the
increase driven by higher starch, sweetener and alcohol
demand. According to the International Grains Council,
around 263 million tonnes of maize are likely to be used
for conversion into fuel ethanol, starch and sweeteners
in 2014/15, up almost 3 percent from the previous year.
In the United States, the world’s largest user of maize for
production of fuel ethanol, current expectations point to
a stagnant, if not declining, use of maize as feedstock
for ethanol production in 2015/16. The shrinking profit
margin on the back of low oil prices is among the main
reasons.
STOCKS
Inventories to decline slightly after two consecutive seasons of accumulation Based on the latest forecasts for production in 2015 and
utilization in 2015/16, global inventories of coarse grains
are likely to decline by 4 percent (10 million tonnes) to
260 million tonnes by the close of the crop seasons in
2016. This follows two consecutive seasons of build-
up in stocks. Among the major coarse grains, global
maize stocks could decline to 217 million tonnes, down
2 percent, or 5 million tonnes, from their historically high
opening levels.
South Africa and Ukraine are expected to account
for much of the projected decrease in reserves, given
the smaller production expected in 2015. By contrast,
carry-over stocks of coarse grains in China may approach
100 million tonnes, even bigger than their recently revised
estimates for this year. The increase in coarse grains
inventories in China would mainly concern maize, following
two years of bumper crops and the government’s attractive
procurement programme. The latter sustained domestic
support prices for maize well above international prices,
a development that has made barley and sorghum more
attractive as a feed ingredient for the country’s livestock
sector.
Given the small decline in world inventories, the world stock-to-use ratio2 is estimated to fall from 20.8 percent
in 2014/15 to 19.6 percent in 2015/16, still a relatively
high level and two percentage points above the levels in
the recent period of high international prices (between
2007 and 2012). Similarly, the major exporters’ stock-to-disappearance ratio3 (i.e. domestic consumption
plus exports) is forecast at 13.8 percent, down from
14.5 percent in 2014/15, but still adequate in terms of
meeting demand prospects in world markets in the new
season.
2 The stock-to-use ratio in 2015/16 is defined as the sum of ending stocks of all countries by the end of seasons in 2016 divided by their expected total utilization in 2016/17
3 The stock-to-disappearance ratio in 2015/16 is defined as the sum of ending stocks held by major exporters divided by their domestic utilization and exports in 2015/16.
Figure 11. Coarse grain utilization
0
350
700
1050
1400
2015/162014/152013/142012/132011/12
Million tonnes
Feed use
Other uses
Food use
estim. f’cast

Ma
rke
t a
sse
ssm
en
ts
24 FOOD OUTLOOKMAY 2015
Figure 1. FAO rice price sub-indices
0
100
200
300
400
20152013201120092007200520032001
2002-2004=100
Indica: High Quality
Indica: Low Quality
Japonica
Aromatic
Major Rice Exporters and Importers
Major ExportersMajor Importers
RICE
PRICES
International rice prices still fallingInternational rice prices have been falling steadily since
September 2014, causing the value of the FAO All Rice
Price Index (2002-2004=100) to drop to 218 points in
April 2015, its lowest level since August 2010. In the first
four months of 2015, the downward pressure on prices
lessened, with the index subsiding only four points between
January and April. Notwithstanding tight Japonica supplies,
prices in that segment fell by 3 percent over the period,
influenced by weakening quotations in the United States.
International rice prices in April were steady around their
January level for the Lower Quality Indica (with no less
than 20 percent brokens) but softened by 3 percent for
the Higher Quality Indica. By contrast, after incurring sharp
losses in the last quarter of 2014, fragrant rice prices in
April 2015 were 2 percent up from January, on prospects
of a re-opening of the Iranian market. Comparing the
average of the All Rice Price index in January-April 2015
with its corresponding period value in 2014 shows it falling
by 6 percent.
Figure 2. Export prices for higher-quality rice in selected countries
300
400
500
600
700
201520142013
USD per tonne
Thai 100% B
US no.2 4% l.g.Uruguay 5%
Pakistan IRRI 10%
Viet Nam 5%India IR 5%

25FOOD OUTLOOKMAY 2015
RIC
E
Figure 3. Global rice paddy production and area
550
600
650
700
750
800
15141312111009080706140
145
150
155
160
165
Million tonnes Million ha
Production Area
estim. f’cast
Much of the prevailing weakness of Indica prices reflects
the intensification of competition among exporters, which,
despite poor 2014 seasons, keep holding large supplies
in stocks. The introduction of more stringent controls on
China’s border also appears to have reduced the volumes
entering the country unofficially, somewhat suppressing
one of the factors that had sustained the market in recent
years. As for the benchmark Thai white 100%B rice, this
was quoted at USD 410 per tonne in April 2015, down
4.4 percent from its January level, partly a reflection of the
1.5 million tonnes offloaded from public stocks through
auctions by Thailand since December. The weakening of
currencies such as the naira in Nigeria, the CFC franc in
Western Africa, or the real in Brazil also contributed to the
easing of world prices in recent months, by hampering the
ability of major importing countries to buy.
PRODUCTION4
Low market prices and less supportive policies to dampen 2015 world rice production growth The 2015 season is already well advanced along and south
of the equator, where the first crops are reaching maturity.
However, it is just starting in Northern Hemisphere
countries, which account for the bulk of world production.
There, farmers are presently sowing their first 2015 crops,
or preparing to sow them when the monsoon rains arrive
4 All figures quoted correspond to rice expressed on a milled weight basis.
in May/June. Taking into account the limited available
information on crop progress or planting intentions,
FAO has set its first forecast for global rice production
in 2015 at some 500 million tonnes (milled basis), only
1.2 percent above the poor 2014 outcome. The growth is
expected to result from a 0.5 percent recovery in the rice
area to 162.6 million hectares and a 0.7 percent gain in
yields to 4.61 tonnes per hectare. These forecasts assume
the prevalence of normal weather conditions, unlike
the 2014 season which, although little affected by the
dreaded El Niño, was marred by severe climatic setbacks,
in particular late and insufficient rains and/or floods.
The adverse climate was very much behind an estimated
0.5 percent contraction of world output in 2014 which, if
confirmed, would be the first since 2009, another season
marked by erratic weather. As for the new 2015 season,
the rather modest 1.2 percent output recovery currently
projected takes also account of the general tendency of
falling international prices witnessed in recent months,
which may encourage farmers to curb plantings. The low
price context is already prompting several governments,
in particular in exporting countries, to lean towards less
supportive production policies, for instance by imposing
limitations on rice cultivation or keeping official producer
prices unchanged. The policy shift also reflects a growing
concern about the negative environmental impacts of
rice cultivation and the budgetary implications of holding
bulging public stocks. At the same time, it is noteworthy
that the pursuance of rice self-sufficiency, i.e. producing
enough to cover domestic consumption, remains a
mainstay of policies in many rice importing countries.
Much of the expected growth in world production
in 2015 is likely to originate in Asia, where
Will 2015 be a strong EL Niño year?
The 2014 paddy season opened under the threat of a recurring El Niño weather anomaly, which could have wreaked havoc to crops worldwide. In retrospect, a number of climatic disruptions did impact crops in 2014, for instance a late arrival of the monsoon and a precipitation deficit in India, which were mainly responsible for the poor global outcome of the 2014 paddy season. However, most of the setbacks incurred in 2014 were not, or only limitedly, related with the prevalence of an El Niño, especially as this did not de-velop as a “strong” event. Since late last year, various Climatic Prediction Centres have again portended the arising the weather anomaly in 2015 and, in March, the National Oceanic and Atmospheric Administra-tion (NOAA) officially declared the onset of an El Niño episode. In April, the prevalence of the event was confirmed, with the NOAA setting the chances of an El Niño manifestation throughout the 2015 Northern Hemisphere summer at 70 percent, and of its lasting till autumn at 60 percent. At this stage, however, the Centre noted the “considerable uncertainty as to how strong this event may become”.

Ma
rke
t a
sse
ssm
en
ts
26 FOOD OUTLOOKMAY 2015
Table 1. World rice market at a glance
1 Calendar year exports (second year shown).2 Major exporters include India, Pakistan, Thailand, the United States
and Viet Nam.
Table 2. Rice Production: leading producers *
2013 2014 estim.
2015f.cast
Change:2015 over
2014
million tonnes, milled equivalent %
China (Mainland) 139.5 141.4 141.8 0.3
India 106.7 103.0 105.5 2.4
Indonesia 44.9 44.6 46.0 3.1
Bangladesh 34.4 34.8 34.5 -0.8
Viet Nam 29.4 30.0 29.9 -0.4
Thailand 24.4 22.7 23.2 2.1
Myanmar 17.8 18.2 18.4 1.0
Philippines 12.3 12.4 12.9 4.0
Brazil 7.9 8.1 8.3 2.3
Japan 7.8 7.6 7.6 -0.5
United States 6.1 7.1 7.0 -1.0
Pakistan 6.8 6.7 6.5 -3.7
Cambodia 6.0 5.9 6.0 0.7
Korea Rep. of 4.2 4.2 4.1 -3.5
Egypt 4.2 4.1 4.1 -1.7
World 496.6 494.4 500.1 1.2
* Countries listed according to their position in global production (average 2013-2015).
2013/14 2014/15 estim.
2015/16 f’cast
Change: 2015/16
over 2014/15
million tonnes, milled equivalent %
WORLD BALANCE
Production 496.6 494.4 500.1 1.2
Trade 1 42.4 41.4 42.4 2.4
Total utilization 491.2 499.9 508.3 1.7
Food 409.1 414.9 420.3 1.3
Ending stocks 181.1 176.2 168.2 -4.6
SUPPLY AND DEMAND INDICATORS
Per caput food consumption:
World (kg/yr) 57.3 57.4 57.5 0.2
LIFDC (kg/yr) 64.2 64.3 64.3 0.0
World stock-to-use ratio (%) 36.2 34.7 32.4
Major exporters stock-to-disappearance ratio2 (%)
26.8 23.2 19.2
FAO RICE PRICE INDEX (2002-2004=100)
2013 2014 2015 Jan-Apr
Change: Jan-Apr 2015
over Jan-Apr 2014
%
233 235 220 -6.3
452.8 million tonnes are forecast to be harvested,
1.2 percent above the 2014 reduced output and a new
record. Many of the countries in the region that suffered
from poor weather over the 2014 season could see
production rebound in 2015. This could be particularly
the case of India, where a delayed monsoon was much
behind a 3.6 million tonne, or 3.4 percent, contraction
of output to 103.0 million tonnes in 2014. Although very
tentative, since the season will only start with the arrival
of the monsoon in June, production in India is forecast
to rise to 105.5 million tonnes in 2015. The level would
imply only a partial recovery, but sweeping changes in
national procurement policies, already enacted or under
discussion, are shrouding the sector with uncertainty.
In Indonesia, the 2015 season is more advanced and
progressing well, although belated seasonal rains delayed
plantings. The country, which endured flood-related losses
last year, is expected to witness a 3.1 percent output
growth, to a new record of 46.0 million tonnes, sustained
by attractive market prices and government assistance,
especially through infrastructure improvements and
higher government procurement prices. In Sri Lanka,
abundant precipitation since late last year is mostly
behind an expected 21 percent recovery from the 2014
drought-affected output. Barring any major natural
setback, government support and high local prices are also
anticipated to boost production in the Philippines, where
the 2015 season is yet to start. Prospects also point to
some increase in China, albeit relatively modest. Although
support to producers of cereals remains a priority for the
country, the Government is paying growing attention to
concerns about resource constraints, environmental impacts
and bulging public grain inventories, partly explaining the
decision to keep official rice procurement prices unchanged
in 2015 after seven years of steady rises. Within the
region, Cambodia, the Democratic People’s Republic of Korea, Nepal and Myanmar are also expected to
gather larger crops. In the case of Thailand, the expected
increase would mean a recovery from the 2014 drought-
reduced performance. However, given the much lower
prices prevailing since the termination of the pledging
programme, output in 2015 is anticipated to remain well
below the levels attained between 2010 and 2013. By
contrast, the current outlook points to possible contractions
in Japan, due to depressed prices, and in Bangladesh
because of low returns. Efforts to divert area away from
paddy may also result in falling production in the Republic of Korea, as well as Pakistan and Viet Nam.
Although very preliminary, prospects for Africa point
to a rather modest 0.8 percent production increase to
18 .5 million tonnes in 2015, which would mark the

27FOOD OUTLOOKMAY 2015
RIC
E
sixth season of uninterrupted growth. In the Eastern and
Southern parts of the region, where the 2015 crops are at a
more advanced stage of development, growing conditions
have been overall positive, despite some reported flood
problems. In particular, Madagascar and Tanzania, two
of the leading producers in the region, are expected to
harvest larger crops, while both Malawi and Mozambique
may endure contractions, following excessive precipitation.
Although the 2015 crop has yet to be sown in Egypt, FAO anticipates that rising costs and marketing difficulties
will depress plantings and production in the country. By
contrast, in Western Africa, more normal weather could
facilitate a recovery in Benin, Chad, Gambia and Togo. In Burkina Faso, Cote D’Ivoire, Ghana and Senegal, support to the sector under self-sufficiency drives could
also prop up production. As for Nigeria, which benefited
in 2014 from a very favourable growing environment, a
return to more normal conditions could instead result in a
2 percent decline in output, especially if, as predicted by
the Nigerian Meteorological Agency, the 2015 rainy season
is characterized by a late onset and an early retrieval under
the influence of an El Niño recurrence.
In Latin America and the Caribbean, the first 2015
crops have already reached harvest stage in the southern
part of the continent. Overall, the region is forecast
to gather 18.9 million tonnes, 2.3 percent above the
previous season. Excess precipitation, along with shrinking
margins, is behind an expected contraction in Argentina
and Uruguay. Similarly, shortages of basic inputs and
payment delays to producers may result in output falling
in Venezuela. The outlook points to improved harvests in
the rest of the region, in particular for Brazil, Guyana and
Paraguay, but also Colombia, Ecuador and Peru, which
faced marked shortfalls in 2014 due to water shortages.
Although very tentatively, most countries in Central
America and the Caribbean are expected to gather good
crops in 2015, with the largest absolute increases foreseen
in the Dominican Republic, where growing conditions
have been favourable so far, as well as Nicaragua and
Panama, which experienced some declines in 2014 due to
deficient rains.
In North America, the USDA, in March, foreshadowed
a small contraction of area in the United States, reflecting
a prolonged drought in California and weak price
prospects, which could depress production by 1 percent.
According to the planting intention survey, short and
medium grain rice is likely to be most affected by the cut
in land coverage. In Oceania, output in Australia, which
already harvested its 2015 crop, is officially estimated to
have shrunk by 18 percent, as insufficient water availability
forced producers to curtail the area under rice. The 2015
fall in Australia’s output succeeds to the 28 percent dip
already registered in 2014, a season also characterized
by scant precipitation. FAO’s outlook for Europe is more
optimistic. In the EU, where the season is about to start,
a more normal unfolding of the season along with firm
domestic prices of Japonica rice is expected to support a
2 percent recovery, especially in Italy, but also Greece and
Portugal. Attractive prices are likewise expected to boost
production in the Russian Federation.
TRADE
Subdued import demand in the Far East behind an anticipated 2 percent contraction of international rice trade in 2015 After an outstanding 14.1 percent growth registered
in 2014, FAO forecasts international trade in rice
to decline by 2.3 percent, or 1.0 million tonnes, to
41.4 million tonnes in 2015, still the second highest level
on record. A softening of demand, especially in leading
importing countries, lies behind the expected reduced
volume of world rice exchange. Shipments to the Far East,
in particular, are foreseen to be slashed by 11 percent
to 11.1 million tonnes. Bumper 2014 crops and easing
domestic prices are behind expectations of sharply
reduced purchases by Bangladesh and the Philippines,
while a recovery of production in 2015 is anticipated
to curb those by Indonesia. On the other hand, high
domestic prices relative to those prevailing internationally
are likely to support a further rise in official imports by
mainland China. However, the forecast is subject to much
uncertainty given the recent implementation of measures
intended to contain rice inflows: the government, while
Figure 4. World rice trade and FAO rice export price index
0
15
30
45
151413121110090807060
100
200
300
*
* January-April average for prices
Million tonnes, milled eq. 2002-2004=100
Exports FAO Rice ExportPrice Index
estim. f’cast

Ma
rke
t a
sse
ssm
en
ts
28 FOOD OUTLOOKMAY 2015
Figure 5. Rice imports by region
0
5
10
15
15141312111009080706
Near East Asia Far East
Africa Latin America
Million tonnes, milled eq.
Others
Europe
estim. f’cast
Figure 6. Rice exports by the major exporters
0
4
8
12
2014 estimate
2015 forecast
Million tonnes, milled eq.
India PakistanThailand USAViet Nam Others
keeping the preferential import quota unchanged at
5.32 million tonnes in 2015, equally divided between the
public and private sector, has tied its allocation to private
traders to their purchasing rice through public auctions
at prices exceeding official procurement levels. In parallel,
officials have continued to clampdown unrecorded rice
inflows. Deliveries to countries in Near East Asia are
anticipated to make further inroads to 8.1 million tonnes,
sustained by larger purchases by the Islamic Republic of Iran, Iraq, Jordan and Saudi Arabia. Imports by African
countries are currently foreseen to remain steady around
14.6 million tonnes. Larger inflows to northern, central
and southern Africa are indeed expected to be offset by
reduced shipments to western Africa, where a depreciation
of currencies will make imports less attractive. At the
country level, the major cuts would concern Burkina Faso,
Guinea, Madagascar, Nigeria, Senegal and Tanzania,
while increased purchases are expected to be made by
Cote d’Ivoire, Liberia and South Africa. The outlook
for deliveries to Latin America and Caribbean countries
is more bullish, with an anticipated 5 percent growth. It
would be mainly sustained by increasing demand in South
America, in particular, by Colombia and Venezuela, although purchases are seen falling in Bolivia, reflecting
an improved supply situation, and in Brazil, following
a pronounced depreciation of the real. Among Central
America and Caribbean countries, Haiti and Panama are
anticipated to step up imports. For the other continents,
the United States officially forecasts its purchases to
dip by 7 percent from the high 2014 level. Intakes by the
Russian Federation may also fall following a good 2014
production outcome. By contrast, tighter domestic supplies
may prompt the EU and Australia to buy more.
As for exports, several international suppliers are
expected to face a tightening of supplies, which may lead
them to reduce their deliveries to foreign markets in 2015,
foremost India, but also Argentina, Australia, Brazil and Uruguay. In the case of India, exports are currently
forecast to fall to 9.3 million tonnes, 18 percent below
the record 11.3 million tonnes shipped in 2014 that had
confirmed the country as the leading rice exporter. The
contraction would be consistent with the prospects of
softer import demands in traditional markets, especially
for white rice in Bangladesh and Sri Lanka, as well as for
parboiled rice in Africa, amid growing competition from
Thailand. Although Thailand is also predicted to incur a
sizeable decline in production in 2014, the country still
holds large reserves, especially in public warehouses, which
the government has targeted for liquidation through
market auctions within two years, much of which will
have to be destined to foreign markets. The country is
also in the process to sign an agreement with China for
a sale of 2 million tonnes for delivery in 2015 and 2016.
These should help boost Thailand’s exports from close
to 11 million tonnes in 2014 to 11.2 million tonnes in
2015, a volume that would enable the country to recover
its status of leading rice exporter, which it lost to India in
2012. Exports by the United States are officially forecast
to increase, despite a strong dollar, on larger sales to Latin
America and the Caribbean. Pakistan may also step up its
deliveries in the course of the year, while those from Viet Nam are forecast to stagnate, influenced by a weakening
demand in traditional Far Eastern markets. As for the other
rice exporting countries, further increases of sales are
expected in 2015 for Cambodia and Myanmar, which
continue to benefit from the EBA preferential access to the
EU market, but also for Egypt, the EU and the Russian

29FOOD OUTLOOKMAY 2015
RIC
E
Federation, which will continue to benefit from reduced
competition from Australia and the United States in the
Japonica market segment.
Although subject to much uncertainty, largely drawing
on current supply and demand prospects, rice trade in
calendar 2016 is forecast to rebound to close to the 2014
record. Deliveries from India, Thailand, the United States and Viet Nam, in particular, may increase, while
the outlook points to some decline for Pakistan. As for
imports, the increase would stem from a recovery of
demand in Asia, especially by China, Indonesia, the Islamic Republic of Iran, Iraq and the Philippines, but
also Africa, spearheaded by increased imports by Cote d’Ivoire, Nigeria and South Africa. Purchases by the EU
are projected to remain on the rise.
UTILIZATION
Rice utilization to grow by 1.7 percent in 2015/16Overall, FAO projects world rice utilization to increase by
1.7 percent in 2015/16 to 508.3 million tonnes, much on
account of growth in food consumption, which represents
the principal end-use of the product, with an 83 percent
share of the total. At a forecasted 420.3 million tonnes,
food intake of rice in 2015/16 would be 1.3 percent
above the previous year’s estimate, slightly outpacing
the 1.1 percent population growth. As a result, direct
human rice consumption is seen rising only marginally
on a per capita basis, from 57.4 kg in 2014/15 to 57.5
kg in 2015/16. Indeed, despite the general tendency for
international prices to weaken, domestic consumer prices
remain high or are even rising from their year earlier levels
in a number of countries, in particular, India, Indonesia
and Nepal in Asia; Liberia, Mauritania and Uganda in
Africa; Brazil, Colombia, Ecuador, Mexico, Nicaragua and
Uruguay in Latin America and the Caribbean; and Italy
and the Russian Federation in Europe. The utilization of
rice as animal feed, which remains a relatively secondary
destination for the crop, accounting for an estimated
3 percent of total utilization, is predicted to grow by about
6 percent to 15.6 million tonnes in 2015/16, sustained
by increases in China and Thailand. Other uses, which
comprise, seeds, non-food industrial uses and post-harvest
losses, are now assessed to reach 72.5 million tonnes in
2015/16, 3 percent above the previous season, accounting
for over 14 percent of the total.
GLOBAL RICE INVENTORIES
Global rice stocks to fall in 2016 for the second consecutive year after nine years of uninterrupted accumulationBased on the latest estimates, global rice consumption in
2015/16 is predicted to surpass world 2015 production,
which would require the gap to be filled from existing
reserves. As a result, world rice stocks carried over at
the close of the marketing seasons ending in 2016 are
expected to decline by 4.6 percent, or 8.1 million tonnes,
to 168.2 million tonnes. If confirmed, this would be
the second consecutive season of global stock declines,
succeeding to nine years of uninterrupted buildups. The
anticipated fall of world reserves is also in line with current
efforts by several governments to reduce the size of public
rice inventories. This stance particularly concerns Thailand,
where the authorities announced in February 2015 the
intention to liquidate the estimated 17 million tonnes held
in government granaries within a two year period. India
also amended its Buffer Stocks Norms, announcing at the
same time that Central Pool supplies in excess of those
mandated would be put on sale through open market
operations. China also issued new guidelines, calling on
provincial governments to maintain local grain stocks, in an
attempt to relieve pressure from central reserves.
As a group, developing countries could see their
inventories fall by 4.8 percent to 163 million tonnes in
2016, while those held by developed nations may rise by
almost 3 percent to 5.2 million tonnes. From a trade status
Existing since April 2005 As of January 2015
Buffer norms Strategic reserves Total Buffer norms Strategic reserves Total
1st January 11.8 2.0 13.8 5.61 2.0 7.61
1st April 12.2 2.0 14.2 11.58 2.0 13.58
1st July 9.8 2.0 11.8 11.54 2.0 13.54
1st October 5.2 2.0 7.2 8.25 2.0 10.25
Table 3. India: buffer stock norms (million mt) 1
1 Refers to rice component only.Source: Ministry of Consumer Affairs, Food and Public Distribution.
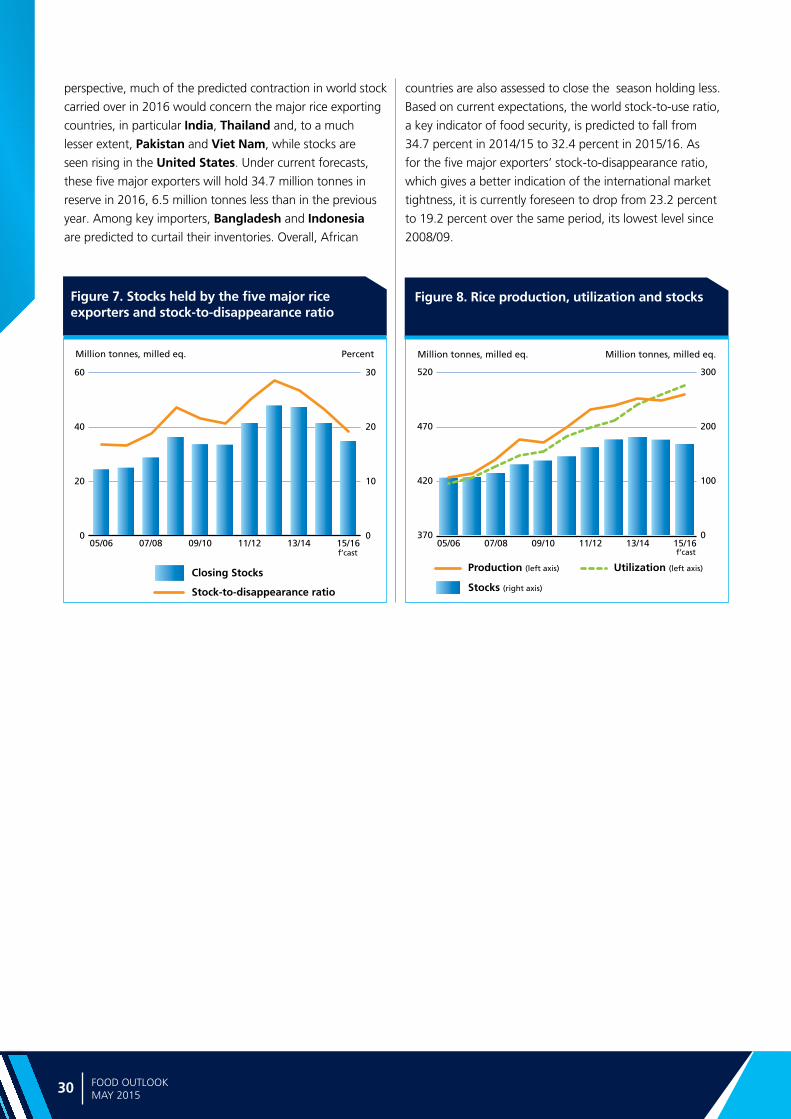
Ma
rke
t a
sse
ssm
en
ts
30 FOOD OUTLOOKMAY 2015
perspective, much of the predicted contraction in world stock
carried over in 2016 would concern the major rice exporting
countries, in particular India, Thailand and, to a much
lesser extent, Pakistan and Viet Nam, while stocks are
seen rising in the United States. Under current forecasts,
these five major exporters will hold 34.7 million tonnes in
reserve in 2016, 6.5 million tonnes less than in the previous
year. Among key importers, Bangladesh and Indonesia
are predicted to curtail their inventories. Overall, African
Figure 7. Stocks held by the five major rice exporters and stock-to-disappearance ratio
0
20
40
60
15/1613/1411/1209/1007/0805/060
10
20
30
Million tonnes, milled eq. Percent
f’cast
Closing Stocks
Stock-to-disappearance ratio
Figure 8. Rice production, utilization and stocks
0
100
200
300
370
420
470
520
15/1613/1411/1209/1007/0805/06
Million tonnes, milled eq. Million tonnes, milled eq.
f’cast
Stocks (right axis)
Production (left axis) Utilization (left axis)
countries are also assessed to close the season holding less.
Based on current expectations, the world stock-to-use ratio,
a key indicator of food security, is predicted to fall from
34.7 percent in 2014/15 to 32.4 percent in 2015/16. As
for the five major exporters’ stock-to-disappearance ratio,
which gives a better indication of the international market
tightness, it is currently foreseen to drop from 23.2 percent
to 19.2 percent over the same period, its lowest level since
2008/09.
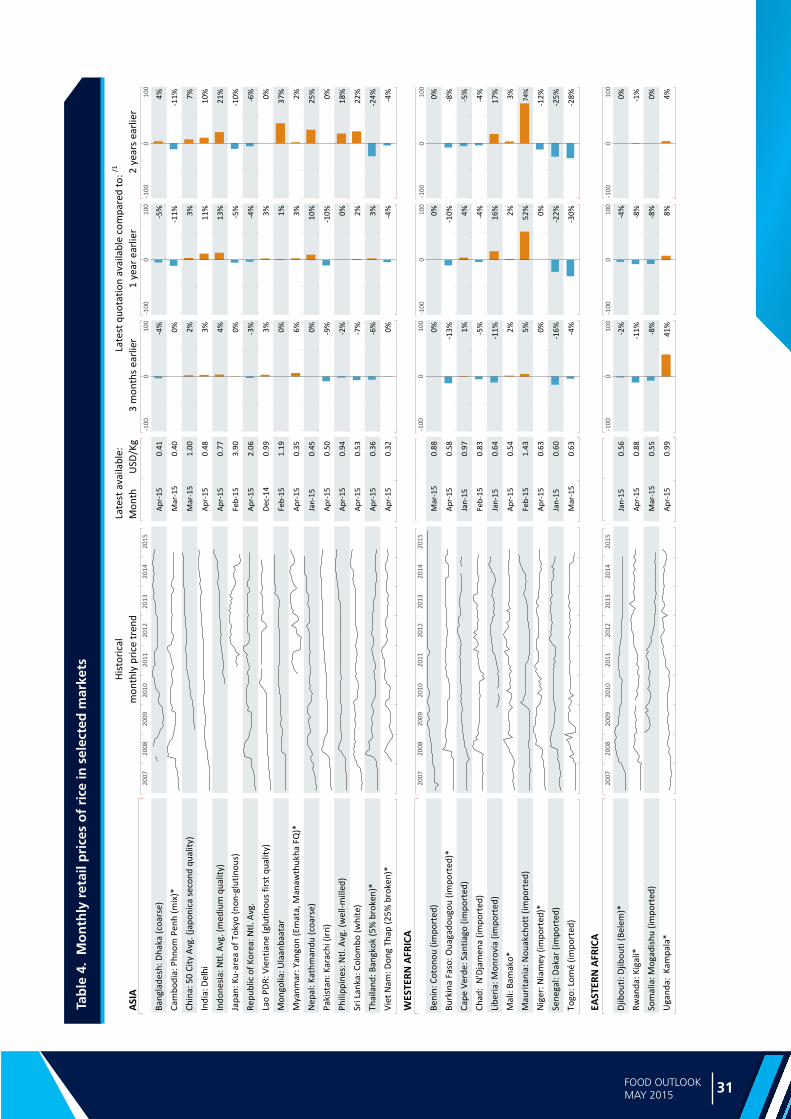
31FOOD OUTLOOKMAY 2015
RIC
E
ASIA
Mon
thU
SD/K
g3
mon
ths
earli
er1
year
ear
lier
2 ye
ars
earli
er
Bang
lade
sh: D
haka
(coa
rse)
Apr-
150.
41
-4
%-5
%4%
Cam
bodi
a: P
hnom
Pen
h (m
ix)*
Mar
-15
0.40
0%-1
1%-1
1%
Chin
a: 5
0 Ci
ty A
vg. (
japo
nica
seco
nd q
ualit
y)M
ar-1
51.
00
2%
3%7%
Indi
a: D
elhi
Ap
r-15
0.48
3%11
%10
%
Indo
nesia
: Ntl.
Avg
. (m
ediu
m q
ualit
y)Ap
r-15
0.77
4%13
%21
%
Japa
n: K
u-ar
ea o
f Tok
yo (n
on-g
lutin
ous)
Fe
b-15
3.90
0%-5
%-1
0%
Repu
blic
of K
orea
: Ntl.
Avg
. Ap
r-15
2.06
-3%
-4%
-6%
Lao
PDR:
Vie
ntia
ne (g
lutin
ous f
irst q
ualit
y)De
c-14
0.99
3%3%
0%
Mon
golia
: Ula
anba
atar
Fe
b-15
1.19
0%1%
37%
Mya
nmar
: Yan
gon
(Em
ata,
Man
awth
ukha
FQ
)*Ap
r-15
0.35
6%3%
2%
Nep
al: K
athm
andu
(coa
rse)
Jan-
150.
45
0%
10%
25%
Paki
stan
: Kar
achi
(irr
i) Ap
r-15
0.50
-9%
-10%
0%
Phili
ppin
es: N
tl. A
vg. (
wel
l-mill
ed)
Apr-
150.
94
-2
%0%
18%
Sri L
anka
: Col
ombo
(whi
te)
Apr-
150.
53
-7
%2%
22%
Thai
land
: Ban
gkok
(5%
bro
ken)
*Ap
r-15
0.36
-6%
3%-2
4%
Viet
Nam
: Don
g Th
ap (2
5% b
roke
n)*
Apr-
150.
32
0%
-4%
-4%
WES
TERN
AFR
ICA
Beni
n: C
oton
ou (i
mpo
rted
)M
ar-1
50.
88
0%
0%0%
Burk
ina
Faso
: Oua
gado
ugou
(im
port
ed)*
Apr-
150.
58
-1
3%-1
0%-8
%
Cape
Ver
de: S
antia
go (i
mpo
rted
)Ja
n-15
0.97
1%4%
-5%
Chad
: N
'Dja
men
a (im
port
ed)
Feb-
150.
83
-5
%-4
%-4
%
Libe
ria: M
onro
via
(impo
rted
)Ja
n-15
0.64
-11%
16%
17%
Mal
i: Ba
mak
o*
Apr-
150.
54
2%
2%3%
Mau
ritan
ia: N
ouak
chot
t (im
port
ed)
Feb-
151.
43
5%
52%
74%
Nig
er: N
iam
ey (i
mpo
rted
)*Ap
r-15
0.63
0%0%
-12%
Sene
gal:
Daka
r (im
port
ed)
Jan-
150.
60
-1
6%-2
2%-2
5%
Togo
: Lom
é (im
port
ed)
Mar
-15
0.63
-4%
-30%
-28%
EAST
ERN
AFR
ICA
Djib
outi:
Djib
outi
(Bel
em)*
Jan-
150.
56
-2
%-4
%0%
Rwan
da: K
igal
i*
Apr-
150.
88
-1
1%-8
%-1
%
Som
alia
: Mog
adish
u (im
port
ed)
Mar
-15
0.55
-8%
-8%
0%
Uga
nda:
Kam
pala
* Ap
r-15
0.99
41%
8%4%
Hist
oric
alLa
test
ava
ilabl
e:La
test
quo
tatio
n av
aila
ble
com
pare
d to
: /1
mon
thly
pric
e tr
end
2015
20
14
2013
20
09
2008
20
12
2011
20
10
2007
10
0 -1
00
0 10
0 -1
00
0 -1
00
100
0
2015
20
14
2013
20
09
2008
20
12
2011
20
10
2007
10
0 -1
00
0 10
0 -1
00
0 -1
00
100
0
2015
20
14
2013
20
09
2008
20
12
2011
20
10
2007
10
0 -1
00
0 10
0 -1
00
0 -1
00
100
0
Tab
le 4
. M
on
thly
ret
ail p
rice
s o
f ri
ce in
sel
ecte
d m
arke
ts

Ma
rke
t a
sse
ssm
en
ts
32 FOOD OUTLOOKMAY 2015
SOU
THER
N A
FRIC
AM
onth
USD
/Kg
3 m
onth
s ea
rlier
1 ye
ar e
arlie
r2
year
s ea
rlier
Ango
la: L
uand
a Ja
n-15
3.17
1%2%
5%
Mad
agas
car:
Ntl.
Avg
. (lo
cal)
Dec-
140.
50
4%
-9%
1%
Moz
ambi
que:
Map
uto
Apr-
150.
72
0%
0%0%
CEN
TRAL
AM
ERIC
A AN
D T
HE
CARI
BBEA
N
Cost
a Ri
ca: N
tl. A
vg. (
first
qua
lity)
M
ar-1
51.
44
0%
6%0%
Dom
inic
an R
ep: S
anto
Dom
ingo
(firs
t qua
lity)
Ap
r-15
1.06
4%2%
5%
El S
alva
dor:
San
Salv
ador
M
ar-1
51.
09
0%
0%9%
Gua
tem
ala:
Ntl.
Avg
. (se
cond
qua
lity)
M
ar-1
51.
23
0%
1%2%
Hai
ti: P
ort-
au-P
rince
(im
port
ed)
Apr-
150.
95
0%
0%0%
Mex
ico:
Mex
ico
City
(sin
aloa
)*Ap
r-15
0.84
0%18
%21
%
Nic
arag
ua: N
tl. A
vg. (
seco
nd q
ualit
y)*
Jan-
150.
92
-1
%8%
18%
Pana
ma:
Pan
ama
City
(firs
t qua
lity)
Ap
r-15
1.04
20%
-20%
-13%
SOU
TH A
MER
ICA
Boliv
ia: L
a Pa
z (g
rano
de
oro)
*Ap
r-15
0.94
-18%
-15%
-2%
Braz
il: S
ão P
aulo
M
ar-1
50.
87
2%
12%
10%
Colo
mbi
a: N
tl. A
vg (f
irst q
ualit
y)M
ar-1
51.
37
42
%44
%33
%
Ecua
dor:
Qui
to (l
ong
grai
n)*
Apr-
151.
14
11
%9%
9%
Peru
: Lim
a (c
orrie
nte)
*Ap
r-15
0.65
-2%
0%34
%
Uru
guay
: Ntl.
Avg
. (gr
ade
1)*
Apr-
150.
95
3%
19%
39%
NO
RTH
AM
ERIC
A
Uni
ted
Stat
es: C
ity A
vg. (
long
gra
in, u
ncoo
ked)
M
ar-1
51.
48
-4
%-9
%-6
%
EURO
PE
Italy
: Mila
n (a
rbor
io v
olan
o)*
Apr-
151.
76
6%
7%11
8%
Russ
ian
Fede
ratio
n: N
tl. A
vg.
Jan-
150.
88
20
%33
%40
%
mon
thly
pric
e tr
end
Hist
oric
al
/1 Q
uota
tions
in th
e m
onth
spec
ified
in th
e th
ird c
olum
n w
ere
com
pare
d to
thei
r lev
els i
n th
e pr
eced
ing
thre
e, tw
elve
and
twen
ty-fo
ur m
onth
s. P
rice
com
paris
ons w
ere
mad
e in
nom
inal
loca
l cur
renc
y un
its.
* W
hole
sale
pric
es.
So
urce
s: F
AO/G
IEW
S G
IEW
S Fo
od P
rice
Data
and
Ana
lysis
Too
l; K
orea
Agr
icul
tura
l Mar
ketin
g In
form
atio
n Se
rvic
e (K
AMIS
); Ja
pan
Min
istry
of A
gric
ultu
re, F
ores
try
and
Fish
erie
s; U
.S. B
urea
u of
Lab
or S
tatis
tics (
BLS)
; Ass
ocia
zion
e In
dust
rie R
isier
e Ita
liane
(AIR
I).
Plea
se n
ote
that
pric
es sh
own
are
com
para
ble
over
tim
e, b
ut n
ot a
cros
s cou
ntrie
s, a
s the
y m
ay re
fer t
o di
ffere
nt st
ages
of t
he m
arke
ting
chai
n (e
.g. r
etai
l ver
sus w
hole
sale
pric
es),
diffe
rent
rice
type
s (e.
g. a
rom
atic
ver
sus n
on-a
rom
atic
) or d
iffer
ent q
ualit
ies o
f
rice
(e.g
fully
bro
ken
vers
us 5
% b
roke
ns).
Cu
rren
cy c
onve
rsio
ns a
re a
s of 2
7 Ap
ril 2
015.
Late
st a
vaila
ble:
Late
st q
uota
tion
avai
labl
e co
mpa
red
to: /1
2015
20
14
2013
20
09
2008
20
12
2011
20
10
2007
10
0 -1
00
0 10
0 -1
00
0 -1
00
100
0
2015
20
14
2013
20
09
2008
20
12
2011
20
10
2007
10
0 -1
00
0 10
0 -1
00
0 -1
00
100
0
2015
20
14
2013
20
09
2008
20
12
2011
20
10
2007
10
0 -1
00
0 10
0 -1
00
0 -1
00
100
0
2015
20
14
2013
20
09
2008
20
12
2011
20
10
2007
10
0 -1
00
0 10
0 -1
00
0 -1
00
100
0
2015
20
14
2013
20
09
2008
20
12
2011
20
10
2007
10
0 -1
00
0 10
0 -1
00
0 -1
00
100
0
Tab
le 4
. Mo
nth
ly r
etai
l pri
ces
of
rice
in s
elec
ted
mar
kets
(C
on
t’d
)


Ma
rke
t a
sse
ssm
en
ts
34 FOOD OUTLOOKMAY 2015
Major Oilseed Exporters and Importers
Major ExportersMajor Importers
Figure 1. FAO monthly international price indices for oilseeds, vegetable oils and meals/cakes (2002-2004=100)
100
150
200
250
300
20152014201320122011201020092008
Meals/cakesVegetable oils
Oilseeds
OILCROPS, OILS AND MEALS4
PRICES5
Prices in the oilseed complex at multi-year lowsDuring the 2013/14 (October/September) season,
international prices for oilseeds and oilseed products
embarked on a downward trend, driven by large export
availabilities, a temporary slowdown in import demand and
a general build-up in inventories. Forecasts for 2014/15
suggest a further easing of the global supply and demand
balance. In particular, the coincidence of bumper soybean
crops in the United States and South American countries
point towards a sizeable supply surplus for oils/fats and
even more so for meals/cakes with a consequential boost
in inventories – a setting suggesting further downward
pressure on prices.
Indeed, international oilseed and product quotations
weakened considerably during the first half of 2014/15,
5 For details on prices and corresponding indices, see appendix Table 24.
as reflected by FAO’s price indices, which, in April 2015,
showed a year-on-year decline of 24 percent for both
oilseeds and oils, and of 32 percent for meals. Seen from
a historic perspective, the indices for oilseeds and meals
plunged to 5-year lows, while the oils index tumbled to a
6-year low.
Developments in other commodity markets also played
a role: abundant global availabilities of feedgrains started
impinging on global demand for oilmeals, thus adding
downward price pressure on the latter. On the oils/fats
4 Almost the entire volume of oilcrops harvested worldwide is crushed to obtain oils and fats for human nutrition or industrial purposes, and to obtain cakes and meals which are used as feed ingredients. Therefore, rather than referring to oilseeds, the analysis of the market situation is mainly undertaken in terms of oils/fats and cakes/meals. Please note that data on trade in and stocks of oils (meals) refer to the sum of trade in and stocks of oils or meals plus the oil (meal) equivalent of oilseed trade and stocks. Trade in oilseed trade (including situations where oilseeds are produced in one country but crushed in another) is fully reflected in national oil/meal consumption statistics. Furthermore, production data for oils and meals are derived from domestic production of the relevant oilseeds in a given year, i.e. they do not reflect the outcome of actual oilseed crushing in a given country and period.

35FOOD OUTLOOKMAY 2015
OILC
RO
PS, O
ILS AN
D M
EA
LS
Figure 5. CBOT soybean futures for SeptemberFigure 2. FAO monthly price index for oilseeds (2002-2004=100)
Figure 3. FAO monthly price index for vegetable oils (2002-2004=100)
Figure 4. FAO monthly price index for oilmeals/cakes (2002-2004=100)
130
170
210
250
2014/15
2012/13
2013/14
Note: With regard to the sudden drops in the price index for oilseedsin May 2013 and March 2014, please note the clarification provided inappendix table 24
SAJJMAMFJDNO
130
160
190
220
2012/13
2014/15
2013/14
SAJJMAMFJDNO
150
200
250
300
2014/15
2012/13
2013/14
SAJJMAMFJDNO
300
350
400
450
500
550
USD per tonne
S O N D J F M A
2013 values 2014 values 2015 values
side, the sudden slump in international mineral oil prices
compromised the competitiveness of vegetable oil-based
biofuels, thus cutting into global demand for vegetable
oils (especially palm oil) and accentuating the slide in world
vegetable oil prices.
Latest reports about South America’s on-going soybean
harvest confirm the bright outlook for production in
2014/15. This, together with first indications that soybean
plantings for the 2015/16 season in the United States could
match the 2014/15 record-high, suggest that international
prices for oilseeds and oilseed products could remain
depressed in the next few months. The persistent weakness
in Chicago Board of Trade futures prices for soybeans,
which currently stand at more than USD 100 per tonne
below their corresponding values of the past two years,
point to the same direction.
OILSEEDS
Expansion in global oilseed production to continue in 2014/15Possibly topping 542 million tonnes, global oilseed
production is forecast to expand strongly for the third
consecutive season. The projected year-on-year rise
of 5.7 percent almost matches the rates recorded in
2012/13 and 2013/14. Higher area and improved yields
both contribute to the expansion. Growth will again be
led by soybeans, the production of which is forecast to
surge by 11 percent or 31 million tonnes. In the Northern
Hemisphere, where 2014/15 crops were harvested last
year, aggregate output bounced up by about 14 percent,
under the lead of the United States. The United States’
soy area climbed to unprecedented levels (at the expense
of grains), as did average yields, which, thanks to near-ideal

Ma
rke
t a
sse
ssm
en
ts
36 FOOD OUTLOOKMAY 2015
Note: The split years bring together northern hemisphere annual crops harvested in the latter part of the first year shown, with southern hemisphere annual crops harvested in the early part of the second year shown. For tree crops, which areproduced throughout the year, calendar year production for the second year shown is used.
2012/13 2013/14estim.
2014/15 f’cast
Change 2014/15
over 2013/14
million tonnes %
Soybeans 267.2 283.7 314.5 10.9
Rapeseed 64.3 71.3 70.9 -0.6
Cottonseed 45.8 45.0 45.6 1.4
Groundnuts (unshelled) 37.9 38.9 37.9 -2.4
Sunflower seed 36.2 42.3 40.7 -3.9
Palm kernels 13.9 14.6 15.3 4.5
Copra 5.9 5.6 5.7 0.7
Total 471.2 501.4 530.6 5.8
Table 1. World production of major oilcrops
growing conditions, reached an all-time high of 3.2 tonnes
per hectare. Larger plantings also lifted Canada’s output.
Similarly, Ukraine and the Russian Federation, where
soy production expanded strongly in recent years, reported
further gains based on additional expansion in area. In
China, production improved thanks to better yields. By
contrast, India’s output dropped on both lower plantings
and reduced productivity. In South America, the 2014/15
soybean harvest is currently in full swing. Thanks to further
growth in area and generally favourable growing conditions
in key producing regions, South America’s total output
could climb to an all-time high, despite recent downward
corrections due to periods of adverse weather. The largest
production gains are reported by Brazil, followed by Argentina. Paraguay’s output could fall compared with
last season, based on lower plantings and productivity
losses, while, in Uruguay, area gains should compensate
for lower yields.
Global rapeseed, sunflowerseed and groundnut
production in 2014/15 are expected to fall short of last
season’s record levels. Rapeseed output is forecast slightly
below last season, with drops in Canada, India and
Australia only partly offset by a bumper EU crop. While
good weather has benefited production in both Canada
and the EU, in Canada, yields trailed behind last season’s
top level. India’s crop suffered from poor weather that
hindered yields and reduced the area harvested. Global
sunflowerseed and groundnut productions are projected
to drop by 4 percent and 2 percent respectively from last
year, still reaching their second highest levels on record.
For sunflowerseed, production drops in Ukraine and the
Russian Federation are expected to be partly offset by
gains in Argentina. Favourable weather conditions should
also lift Argentina’s groundnut output, which should help
compensate production falls in India and the United States.
With regard to cottonseed, a rebound in global
production should be possible as larger crops in the United States and Pakistan are expected to more than offset
reduced harvests in Australia, Brazil and China. A small
recovery is also expected in copra production, although
global output is set to trail behind recent records. Global
palmkernel output should keep rising, mainly reflecting
continued expansion in mature oil palm area in Southeast
Asia.
OILS AND FATS6
Global oils/fats supplies to rise furtherCurrent crop forecasts for 2014/15 translate into an
increase in global oils/fats production of only 3 percent,
about half the rate recorded in 2013/14. Last season’s rise
was made possible by record outturns of high oil-yielding
crops, whereas this season, the lower oil-yielding soybeans
will play a dominant role. Rapeseed, sunflowerseed,
groundnut, olive and fish oil outputs are all projected to
fall, while global soy oil output should surge by 12 percent.
Palm oil production is expected to expand, although
less than in recent years, due to unfavourable weather
in Indonesia and Malaysia that affected oil palms last
year and during the first months of this year. While in
Malaysia production is forecast to increase by no more
than 110 000 tonnes (or 0.6 percent), Indonesia’s output
could still rise by 2 million tonnes (or 6.5 percent) thanks
to further growth in mature oil palm area. This compares
with an average growth rate (for the last five years) of
2.3 percent in Malaysia and 8 percent in Indonesia.
Global oils/fats supplies (comprising 2014/15 production
and 2013/14 ending stocks) are forecast to grow by an
about-average rate of 4 percent. Thanks to record crops,
robust gains in domestic availabilities are expected in several
major producers, notably Indonesia, United States, EU,
Brazil and Argentina. In the three latter countries, large
carry-in stocks will contribute to the gains. By contrast, only
marginal supply increases are forecast for Malaysia and
China, while year-on-year falls in oils/fats supplies – mostly
due to modest crop outturns – are forecast for Canada,
India, the Russian Federation, Ukraine and Australia.
In Canada and India, the presence of large carry-in stocks is
expected to attenuate the drop in supplies.
6 This section refers to oils from all origins, which – in addition to products derived from the oil crops discussed under the section on oilseeds – include palm oil, marine oils as well as animal fats.

37FOOD OUTLOOKMAY 2015
OILC
RO
PS, O
ILS AN
D M
EA
LS
1 Refer to footnote 4 on page 34 for overall definitions and methodology.2 Includes oils and fats of vegetable, animal and marine origin.3 Production plus opening stocks.4 Residual of the balance.5 Trade data refer to exports based on a common October/September
marketing season.6 Major exporters include Argentina, Brazil, Canada, Indonesia, Malaysia,
Ukraine and the United States.7 All meal figures are expressed in protein equivalent; meals include all meals
and cakes derived from oilcrops as well as meals of marine and animal origin.8 Major exporters include Argentina, Brazil, Canada, India, Indonesia, Malaysia,
Paraguay, Ukraine and the United States.
Table 2. World oilcrops and product market ata glance1
2012/13 2013/14 estim.
2014/15 f’cast
Change: 2014/15
over 2013/14
million tonnes %
TOTAL OILCROPS
Production 482.9 513.0 542.3 5.7
OILS AND FATS 2
Production 189.9 202.7 209.6 3.4
Supply 3 222.2 234.7 244.3 4.1
Utilization 4 189.7 199.0 203.9 2.5
Trade 5 101.9 107.3 109.0 1.6
Global stock-to-use ratio (%) 16.9 17.5 18.9
Major exporters stock-to-disappearance ratio (%) 6
9.6 9.8 12.0
MEALS AND CAKES 7
Production 120.0 128.9 139.2 8.0
Supply 3 137.6 146.9 160.6 9.3
Utilization 4 118.5 125.2 131.2 4.8
Trade 5 73.6 81.3 84.2 3.6
Global stock-to-use ratio (%) 15.2 17.1 21.8
Major exporters stock-to-disappearance ratio (%) 8
7.6 9.3 14.8
FAO PRICE INDICES (Oct/Sept) (2002-2004=100)
2012/13 2013/14 2014/15 Oct-Apr
Change: Oct-Apr 2014/15
overOct-Apr 2013/14
%
Oilseeds 213 194 159 -22.4
Oilmeals/cakes 255 253 205 -22.7
Vegetable oils 193 189 158 -19.6
Subdued demand from biodiesel producers to dampen growth in global oils/fats utilizationIn 2014/15, global consumption of oils/fats is projected
to rise by no more than 5 million tonnes, which implies a
below-average growth rate of 2.5 percent. With regard to
individual oils, the strongest contribution to overall growth
comes from soyoil, whose consumption should leap by
about 3.5 million tonnes or over 7 percent. By contrast,
palm oil utilization is estimated to expand by no more than
0.9 million tonnes, or 1.5 percent, by far the lowest rate
recorded in the last 15 years.
In most developing countries, utilization for food and
traditional industrial uses should continue to expand,
sustained by rising populations and income growth, but
also by more attractive prices. One important exception,
however, is China, where a dimmer economic outlook is
expected to temper demand growth for vegetable oils.
The key reason for the anticipated slowdown in global
consumption concerns fuel use. In 2014/15, demand
from the biofuel sector – one of the main drivers of
consumption growth in the last few years – could suffer
its first setback. In the EU and the United States, the
world’s leading producers and consumers of biodiesel,
the freeze in domestic biodiesel consumption mandates
and increasing uncertainty about future biofuel policies
have curbed the industry’s enthusiasm for biodiesel. In
addition, policies to encourage the use of alternative
feedstock, for example waste vegetable oil, are under
implementation in several countries. In those countries
where biofuel demand is less policy-driven and, hence,
more price elastic, the recent plunge in world mineral oil
prices depressed biodiesel production – and thus demand
for the main feedstock, i.e. vegetable oils and animal
fats. This is because rising discounts for mineral oil quickly
eroded the competitiveness of biodiesel. Countries strongly
affected by this development include Indonesia, Malaysia
and Argentina. In an effort to safeguard demand for
domestically produced oils/fats, some governments decided
to strengthen their policies in favour of biodiesel. New
support measures and ambitious biodiesel consumption
targets have been announced in Indonesia, Malaysia,
Argentina, Brazil and India, with similar initiatives
under consideration in the Philippines and the Republic of Korea. However, it should be noted that, in recent
years, the implementation of such policies has often been
hampered by regulatory problems, logistical difficulties and/
or inadequate domestic feedstock supplies.
Higher inventory levels and stock-to-use ratios expected in 2014/15Based on the above supply and demand forecasts, global
2014/15 closing stocks (which comprise oils/fats inventories
plus the oil contained in stored oilseeds) should increase
strongly for the second consecutive season. As total
production is projected to surpass total consumption by
about 5.7 million tonnes, global oils/fats inventories could
top 38 million tonnes, with soyoil accounting for most
of the rise. At country level, a marked build-up in stocks
is envisaged in the United States, while more modest
gains are expected in Brazil, Argentina, Indonesia, EU
and China. By contrast, Canada and India may witness
a sizeable contraction in stocks. China is estimated to
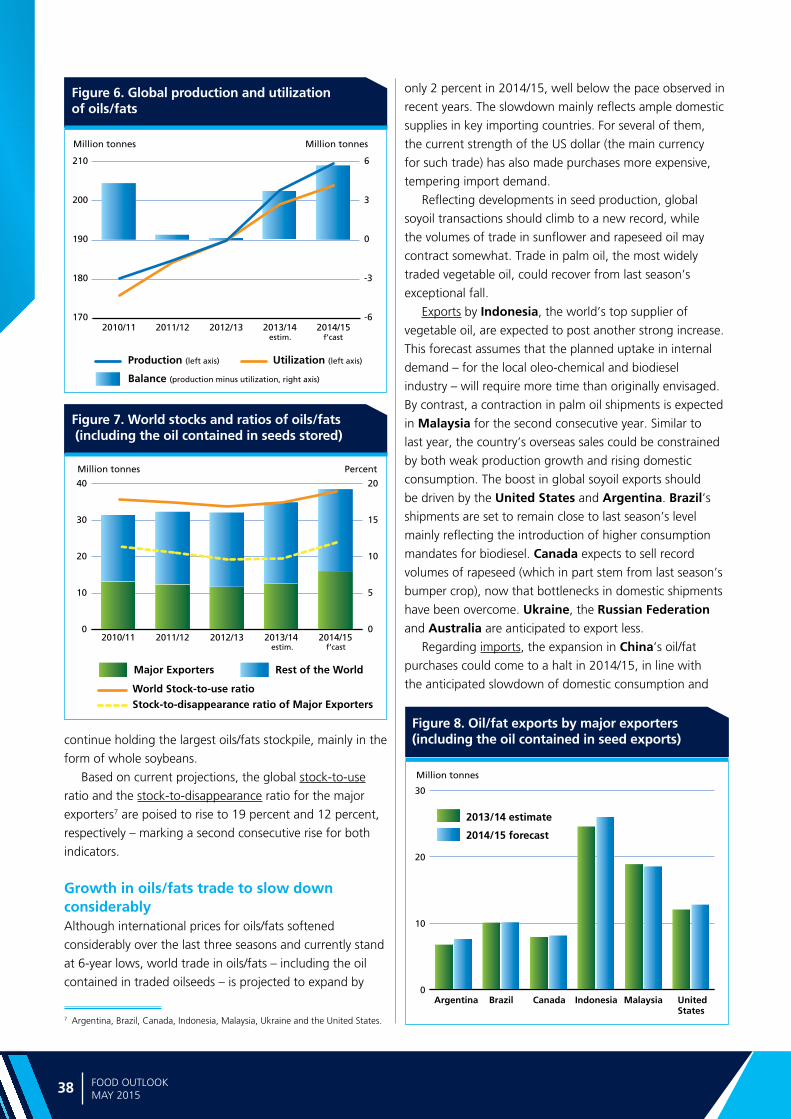
Ma
rke
t a
sse
ssm
en
ts
38 FOOD OUTLOOKMAY 2015
Figure 7. World stocks and ratios of oils/fats (including the oil contained in seeds stored)
0
10
20
30
40
2014/152013/142012/132011/122010/110
5
10
15
20
Million tonnes Percent
Major Exporters Rest of the World
World Stock-to-use ratioStock-to-disappearance ratio of Major Exporters
estim. f’cast
Figure 6. Global production and utilizationof oils/fats
-6
-3
0
3
6
170
180
190
200
210
2014/152013/142012/132011/122010/11
Million tonnes Million tonnes
estim. f’cast
Balance (production minus utilization, right axis)
Production (left axis) Utilization (left axis)
continue holding the largest oils/fats stockpile, mainly in the
form of whole soybeans.
Based on current projections, the global stock-to-use
ratio and the stock-to-disappearance ratio for the major
exporters7 are poised to rise to 19 percent and 12 percent,
respectively – marking a second consecutive rise for both
indicators.
Growth in oils/fats trade to slow down considerablyAlthough international prices for oils/fats softened
considerably over the last three seasons and currently stand
at 6-year lows, world trade in oils/fats – including the oil
contained in traded oilseeds – is projected to expand by
7 Argentina, Brazil, Canada, Indonesia, Malaysia, Ukraine and the United States.
only 2 percent in 2014/15, well below the pace observed in
recent years. The slowdown mainly reflects ample domestic
supplies in key importing countries. For several of them,
the current strength of the US dollar (the main currency
for such trade) has also made purchases more expensive,
tempering import demand.
Reflecting developments in seed production, global
soyoil transactions should climb to a new record, while
the volumes of trade in sunflower and rapeseed oil may
contract somewhat. Trade in palm oil, the most widely
traded vegetable oil, could recover from last season’s
exceptional fall.
Exports by Indonesia, the world’s top supplier of
vegetable oil, are expected to post another strong increase.
This forecast assumes that the planned uptake in internal
demand – for the local oleo-chemical and biodiesel
industry – will require more time than originally envisaged.
By contrast, a contraction in palm oil shipments is expected
in Malaysia for the second consecutive year. Similar to
last year, the country’s overseas sales could be constrained
by both weak production growth and rising domestic
consumption. The boost in global soyoil exports should
be driven by the United States and Argentina. Brazil’s shipments are set to remain close to last season’s level
mainly reflecting the introduction of higher consumption
mandates for biodiesel. Canada expects to sell record
volumes of rapeseed (which in part stem from last season’s
bumper crop), now that bottlenecks in domestic shipments
have been overcome. Ukraine, the Russian Federation
and Australia are anticipated to export less.
Regarding imports, the expansion in China’s oil/fat
purchases could come to a halt in 2014/15, in line with
the anticipated slowdown of domestic consumption and
Figure 8. Oil/fat exports by major exporters (including the oil contained in seed exports)
0
10
20
30
2013/14 estimate
2014/15 forecast
Million tonnes
UnitedStates
IndonesiaCanada MalaysiaArgentina Brazil
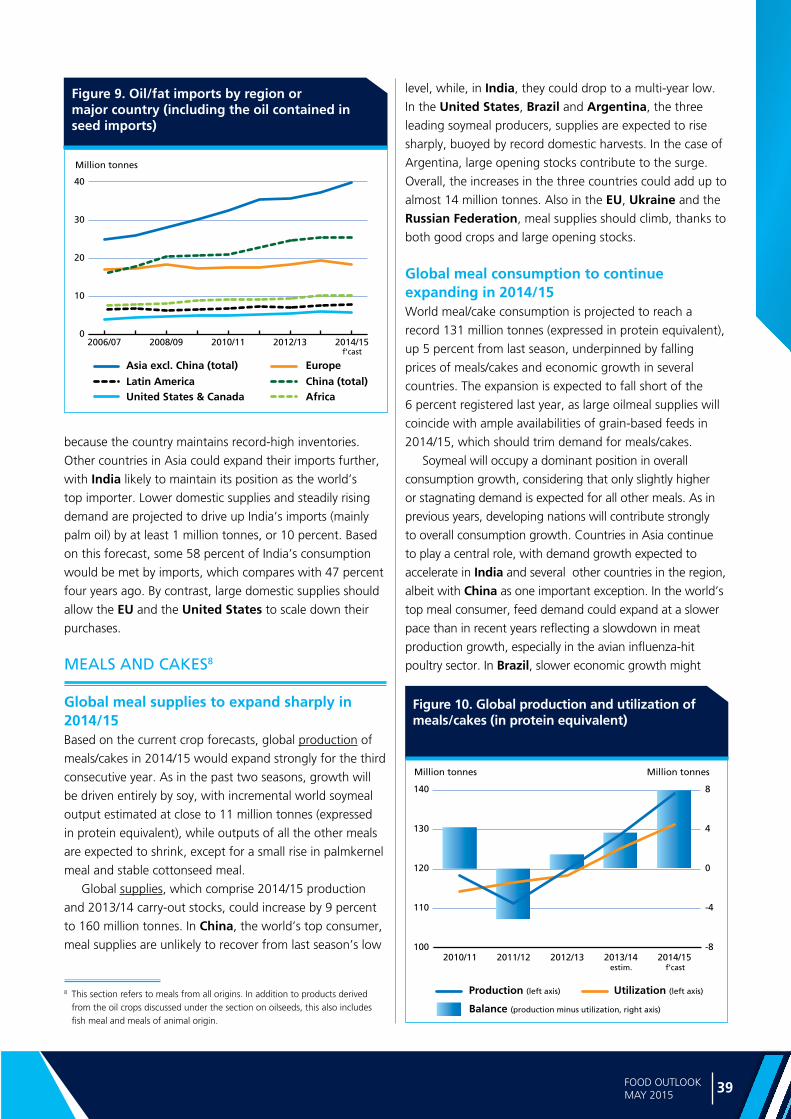
39FOOD OUTLOOKMAY 2015
OILC
RO
PS, O
ILS AN
D M
EA
LS
Figure 9. Oil/fat imports by region or major country (including the oil contained in seed imports)
0
10
20
30
40
2014/152012/132010/112008/092006/07
Latin America
Asia excl. China (total) Europe
China (total)
Million tonnes
United States & Canada Africa
f’cast
because the country maintains record-high inventories.
Other countries in Asia could expand their imports further,
with India likely to maintain its position as the world’s
top importer. Lower domestic supplies and steadily rising
demand are projected to drive up India’s imports (mainly
palm oil) by at least 1 million tonnes, or 10 percent. Based
on this forecast, some 58 percent of India’s consumption
would be met by imports, which compares with 47 percent
four years ago. By contrast, large domestic supplies should
allow the EU and the United States to scale down their
purchases.
MEALS AND CAKES8
Global meal supplies to expand sharply in 2014/15Based on the current crop forecasts, global production of
meals/cakes in 2014/15 would expand strongly for the third
consecutive year. As in the past two seasons, growth will
be driven entirely by soy, with incremental world soymeal
output estimated at close to 11 million tonnes (expressed
in protein equivalent), while outputs of all the other meals
are expected to shrink, except for a small rise in palmkernel
meal and stable cottonseed meal.
Global supplies, which comprise 2014/15 production
and 2013/14 carry-out stocks, could increase by 9 percent
to 160 million tonnes. In China, the world’s top consumer,
meal supplies are unlikely to recover from last season’s low
8 This section refers to meals from all origins. In addition to products derived from the oil crops discussed under the section on oilseeds, this also includes fish meal and meals of animal origin.
level, while, in India, they could drop to a multi-year low.
In the United States, Brazil and Argentina, the three
leading soymeal producers, supplies are expected to rise
sharply, buoyed by record domestic harvests. In the case of
Argentina, large opening stocks contribute to the surge.
Overall, the increases in the three countries could add up to
almost 14 million tonnes. Also in the EU, Ukraine and the
Russian Federation, meal supplies should climb, thanks to
both good crops and large opening stocks.
Global meal consumption to continue expanding in 2014/15World meal/cake consumption is projected to reach a
record 131 million tonnes (expressed in protein equivalent),
up 5 percent from last season, underpinned by falling
prices of meals/cakes and economic growth in several
countries. The expansion is expected to fall short of the
6 percent registered last year, as large oilmeal supplies will
coincide with ample availabilities of grain-based feeds in
2014/15, which should trim demand for meals/cakes.
Soymeal will occupy a dominant position in overall
consumption growth, considering that only slightly higher
or stagnating demand is expected for all other meals. As in
previous years, developing nations will contribute strongly
to overall consumption growth. Countries in Asia continue
to play a central role, with demand growth expected to
accelerate in India and several other countries in the region,
albeit with China as one important exception. In the world’s
top meal consumer, feed demand could expand at a slower
pace than in recent years reflecting a slowdown in meat
production growth, especially in the avian influenza-hit
poultry sector. In Brazil, slower economic growth might
Figure 10. Global production and utilization of meals/cakes (in protein equivalent)
-8
-4
0
4
8
100
110
120
130
140
2014/152013/142012/132011/122010/11
Million tonnes Million tonnes
estim. f’cast
Balance (production minus utilization, right axis)
Production (left axis) Utilization (left axis)

Ma
rke
t a
sse
ssm
en
ts
40 FOOD OUTLOOKMAY 2015
Figure 11. World stocks and ratios of meals/cakes (in protein equivalent and including the meal contained in seeds stored)
0
10
20
30
2014/152013/142012/132011/122010/110
10
20
30
Million tonnes Percent
Major Exporters Rest of the World
World Stock-to-use ratioStock-to-disappearance ratio of Major Exporters
estim. f’cast
Figure 12. Meal/cake imports by region or major country (in protein equivalent and including the meal contained in seed imports)
0
8
16
24
32
2014/152012/132010/112008/092006/07
Latin America Asia excl. China (total) Europe
China (total)
Million tonnes
United States & Canada Africa
f’cast
affect meat consumption, possibly trimming demand for
oilseed meals. In the EU, the world’s second largest meal
consumer, oilmeal use is likely to be negatively affected
by the high availability of attractively priced feed wheat.
By contrast, in the United States, meal consumption may
increase faster than last season, as, compared to recent
years, the livestock sector has been less affected by disease
problems and adverse weather conditions.
Strong build-up of meal inventories anticipated in 2014/15Based on current 2014/15 forecasts, global meal production
will exceed consumption by almost 8 million tonnes
(expressed in protein equivalent). Such a large production
surplus will foster a surge of inventories, chiefly of soymeal.
Total meal stocks are set to reach 28.6 million tonnes
(including the meal contained in stored oilseeds), one-third
above last season’s level. The extraordinary stock build-up
should be concentrated in the United States, Argentina
and Brazil. In the United States, where the 2013/14 season
closed with exceptionally low carry-out stocks due to a
brisk export pace, the current season’s bumper crop and
less buoyant export sales should bring about a massive
replenishment in inventories, possibly lifting the United
States’ reserves to an 8-year high. It is estimated that up
to 7.5 million tonnes of soybeans – i.e. nearly half of this
season’s incremental production – could be earmarked for
stock rebuilding by the country. In Argentina and Brazil,
inventories could climb to all-time highs, given record soy
harvests and, in the case of Brazil, a sharp slowdown in
exports growth. In Argentina, the anticipated stock build-
up should occur mostly on-farm as farmers are expected to
hold their crops as a means of hedging against domestic
price inflation. Among other countries, a moderate increase
in inventories is expected in the EU, while stocks may be
trimmed in China, India and Canada.
The current forecasts lead to a sharp rise in the
2014/15 stock-to-use ratios. Estimated at, respectively,
22 percent and 15 percent, the global stock-to-use ratio
and the stock-to-disappearance ratio for major exporters9
would hit multi-year highs, indicating there is considerable
scope for world meal prices to slide further.
Global meal trade to slow down in 2014/15After expanding briskly in 2013/14, world trade in meals/
cakes, which includes the meal contained in traded
oilseeds, is projected to grow by only 3–4 percent in the
current season. Commodity-wise, record volumes of trade
in soybean meal are anticipated to offset smaller flows of
most other meals, in particular of rapeseed.
Regarding imports, countries in Asia will continue to
dominate demand, with China alone accounting for one-
third of global purchases. China’s imports (mostly in the form
of whole soybeans) should keep expanding, but at a lower
pace than last season, in line with the projected slowdown
of domestic demand. Purchases by other Asian countries,
in particular Turkey, Vietnam, Thailand, Indonesia and
Pakistan are anticipated to expand further. In the EU, the
world’s second largest buyer, imports should remain about
unchanged as incremental demand can be met by higher
domestic supplies of both oilmeals and feedgrains. Imports by
9 Argentina, Brazil, Canada, India, Indonesia, Malaysia, Paraguay, Ukraine and the United States.
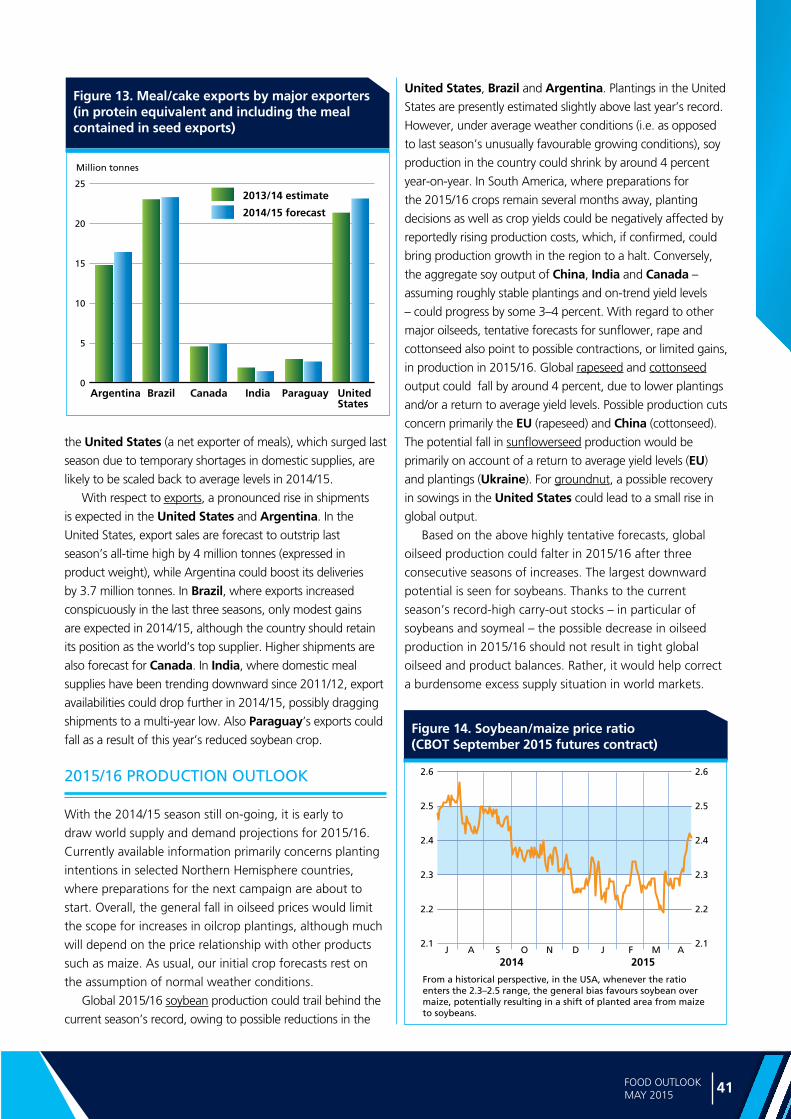
41FOOD OUTLOOKMAY 2015
OILC
RO
PS, O
ILS AN
D M
EA
LS
Figure 13. Meal/cake exports by major exporters (in protein equivalent and including the meal contained in seed exports)
0
5
10
15
20
252013/14 estimate
2014/15 forecast
Million tonnes
UnitedStates
Canada India ParaguayArgentina Brazil
Figure 14. Soybean/maize price ratio (CBOT September 2015 futures contract)
2.1
2.2
2.3
2.4
2.5
2.6
2.1
2.2
2.3
2.4
2.5
2.6
J A OS N D J F M A2014 2015
From a historical perspective, in the USA, whenever the ratioenters the 2.3–2.5 range, the general bias favours soybean overmaize, potentially resulting in a shift of planted area from maizeto soybeans.
the United States (a net exporter of meals), which surged last
season due to temporary shortages in domestic supplies, are
likely to be scaled back to average levels in 2014/15.
With respect to exports, a pronounced rise in shipments
is expected in the United States and Argentina. In the
United States, export sales are forecast to outstrip last
season’s all-time high by 4 million tonnes (expressed in
product weight), while Argentina could boost its deliveries
by 3.7 million tonnes. In Brazil, where exports increased
conspicuously in the last three seasons, only modest gains
are expected in 2014/15, although the country should retain
its position as the world’s top supplier. Higher shipments are
also forecast for Canada. In India, where domestic meal
supplies have been trending downward since 2011/12, export
availabilities could drop further in 2014/15, possibly dragging
shipments to a multi-year low. Also Paraguay’s exports could
fall as a result of this year’s reduced soybean crop.
2015/16 PRODUCTION OUTLOOK
With the 2014/15 season still on-going, it is early to
draw world supply and demand projections for 2015/16.
Currently available information primarily concerns planting
intentions in selected Northern Hemisphere countries,
where preparations for the next campaign are about to
start. Overall, the general fall in oilseed prices would limit
the scope for increases in oilcrop plantings, although much
will depend on the price relationship with other products
such as maize. As usual, our initial crop forecasts rest on
the assumption of normal weather conditions.
Global 2015/16 soybean production could trail behind the
current season’s record, owing to possible reductions in the
United States, Brazil and Argentina. Plantings in the United
States are presently estimated slightly above last year’s record.
However, under average weather conditions (i.e. as opposed
to last season’s unusually favourable growing conditions), soy
production in the country could shrink by around 4 percent
year-on-year. In South America, where preparations for
the 2015/16 crops remain several months away, planting
decisions as well as crop yields could be negatively affected by
reportedly rising production costs, which, if confirmed, could
bring production growth in the region to a halt. Conversely,
the aggregate soy output of China, India and Canada –
assuming roughly stable plantings and on-trend yield levels
– could progress by some 3–4 percent. With regard to other
major oilseeds, tentative forecasts for sunflower, rape and
cottonseed also point to possible contractions, or limited gains,
in production in 2015/16. Global rapeseed and cottonseed
output could fall by around 4 percent, due to lower plantings
and/or a return to average yield levels. Possible production cuts
concern primarily the EU (rapeseed) and China (cottonseed).
The potential fall in sunflowerseed production would be
primarily on account of a return to average yield levels (EU)
and plantings (Ukraine). For groundnut, a possible recovery
in sowings in the United States could lead to a small rise in
global output.
Based on the above highly tentative forecasts, global
oilseed production could falter in 2015/16 after three
consecutive seasons of increases. The largest downward
potential is seen for soybeans. Thanks to the current
season’s record-high carry-out stocks – in particular of
soybeans and soymeal – the possible decrease in oilseed
production in 2015/16 should not result in tight global
oilseed and product balances. Rather, it would help correct
a burdensome excess supply situation in world markets.

Ma
rke
t a
sse
ssm
en
ts
42 FOOD OUTLOOKMAY 2015
Major Sugar Exporters and Importers
Major ExportersMajor Importers
Figure 1. International sugar prices*
10
14
18
22
26
2012
2013 2014
2015
US cents per lb.
DNOSAJJMAMFJ
* As measured by the International Sugar Agreement (ISA)
SUGAR
PRICES
Large availabilities in both exporting and importing countries weigh on International sugar prices
International sugar prices, as measured by the ISA daily
prices for raw sugar, have been declining since the
beginning of 2015, confirming the steady fall that has
characterized the market since 2011. The slide is attributed
to large expansions in production capacity over the past
four years, which have resulted in rising global sugar
inventories to near record levels. After starting the current
year at USD 15.34 cents per pound, sugar quotations fell
in February and again in March, when they hit their lowest
level since February 2009 at USD 13 cents per pound.
Consequently, from January to April 2015, prices averaged
26 percent less than in the same period in 2014. Reports
of increasing production in India, the European Union and
the United States, coupled with lower anticipated import
demand by China, are expected to keep international prices
in 2015 under downward pressure.
Downgradings of production prospects in March in
Brazil, the world’s largest producer and exporter, and in
Thailand, the world’s second largest exporter, were not
sufficient to reverse the tendency for international prices to
fall.
Early indications of a small production deficit in the
new 2015/16 season have not yet helped prices to
recover. Also, the continued weakening of the Brazilian
real against the US dollar, which dropped by more than
30 percent since August 2014, favours increasing Brazilian
sugar exports, since sugar is traded in US dollars. In fact,
while sugar prices declined by 8 percent in USD between
August 2014 and January 2015, they increased by about
7 percent in Brazilian real. In addition, the US dollar
appreciation, renders imports of many countries more
expensive in local currency. For example, in the Russian
Federation, prices in USD declined by 12 percent between
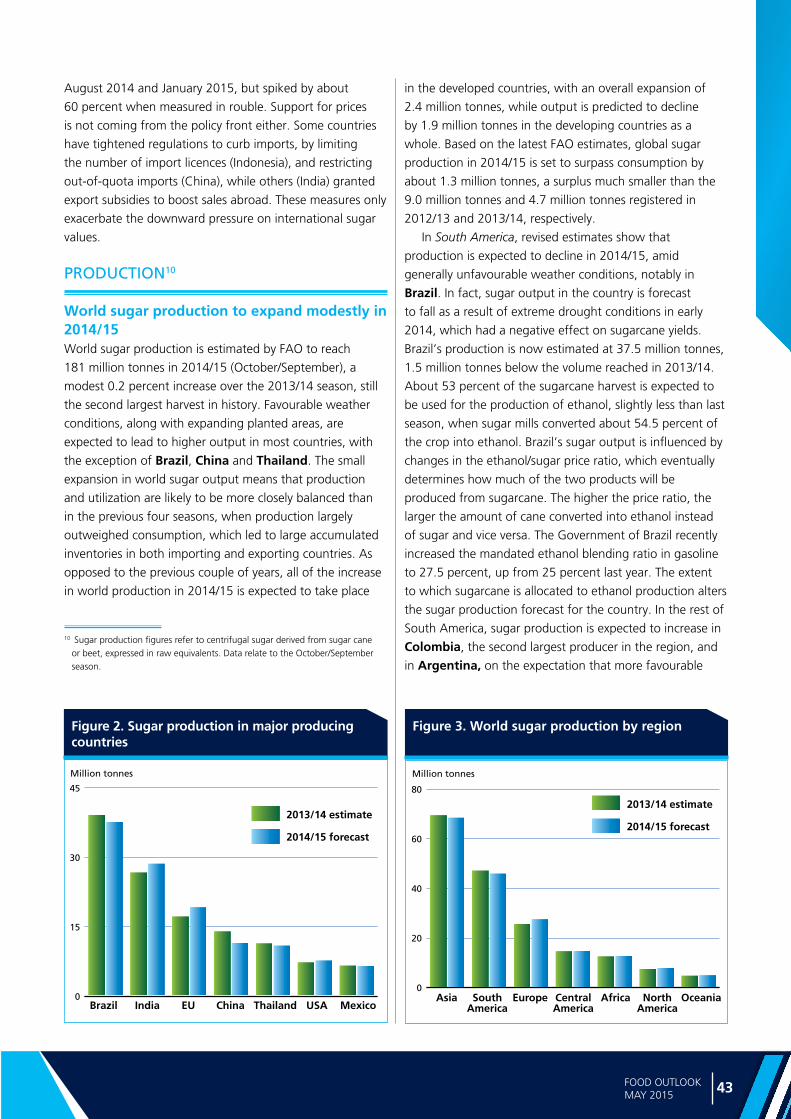
43FOOD OUTLOOKMAY 2015
SUG
AR
Figure 3. World sugar production by region
0
20
40
60
80
2013/14 estimate
2014/15 forecast
Million tonnes
NorthAmerica
CentralAmerica
SouthAmerica
AfricaAsia Europe Oceania
Figure 2. Sugar production in major producing countries
August 2014 and January 2015, but spiked by about
60 percent when measured in rouble. Support for prices
is not coming from the policy front either. Some countries
have tightened regulations to curb imports, by limiting
the number of import licences (Indonesia), and restricting
out-of-quota imports (China), while others (India) granted
export subsidies to boost sales abroad. These measures only
exacerbate the downward pressure on international sugar
values.
PRODUCTION10
World sugar production to expand modestly in 2014/15World sugar production is estimated by FAO to reach
181 million tonnes in 2014/15 (October/September), a
modest 0.2 percent increase over the 2013/14 season, still
the second largest harvest in history. Favourable weather
conditions, along with expanding planted areas, are
expected to lead to higher output in most countries, with
the exception of Brazil, China and Thailand. The small
expansion in world sugar output means that production
and utilization are likely to be more closely balanced than
in the previous four seasons, when production largely
outweighed consumption, which led to large accumulated
inventories in both importing and exporting countries. As
opposed to the previous couple of years, all of the increase
in world production in 2014/15 is expected to take place
10 Sugar production figures refer to centrifugal sugar derived from sugar cane or beet, expressed in raw equivalents. Data relate to the October/September season.
in the developed countries, with an overall expansion of
2.4 million tonnes, while output is predicted to decline
by 1.9 million tonnes in the developing countries as a
whole. Based on the latest FAO estimates, global sugar
production in 2014/15 is set to surpass consumption by
about 1.3 million tonnes, a surplus much smaller than the
9.0 million tonnes and 4.7 million tonnes registered in
2012/13 and 2013/14, respectively.
In South America, revised estimates show that
production is expected to decline in 2014/15, amid
generally unfavourable weather conditions, notably in
Brazil. In fact, sugar output in the country is forecast
to fall as a result of extreme drought conditions in early
2014, which had a negative effect on sugarcane yields.
Brazil’s production is now estimated at 37.5 million tonnes,
1.5 million tonnes below the volume reached in 2013/14.
About 53 percent of the sugarcane harvest is expected to
be used for the production of ethanol, slightly less than last
season, when sugar mills converted about 54.5 percent of
the crop into ethanol. Brazil’s sugar output is influenced by
changes in the ethanol/sugar price ratio, which eventually
determines how much of the two products will be
produced from sugarcane. The higher the price ratio, the
larger the amount of cane converted into ethanol instead
of sugar and vice versa. The Government of Brazil recently
increased the mandated ethanol blending ratio in gasoline
to 27.5 percent, up from 25 percent last year. The extent
to which sugarcane is allocated to ethanol production alters
the sugar production forecast for the country. In the rest of
South America, sugar production is expected to increase in
Colombia, the second largest producer in the region, and
in Argentina, on the expectation that more favourable
0
15
30
45
2013/14 estimate
2014/15 forecast
Million tonnes
USA MexicoIndiaBrazil China ThailandEU

Ma
rke
t a
sse
ssm
en
ts
44 FOOD OUTLOOKMAY 2015
Table 2. World sugar production
2012/13 2013/14 2014/15 Change: 2014/15
over 2013/14
million tonnes
Asia 69.3 68.3 69.4 1.30
South America 47.0 45.8 12.4 5.51
Europe 25.5 27.4 14.6 1.86
Central America 14.5 14.6 48.0 -0.06
Africa 12.4 12.5 8.3 -2.30
North America 7.3 7.7 24.7 -7.10
Oceania 4.6 4.8 4.6 -1.80
World 180.6 181.0 182.0 -0.21
Developing countries 140.3 138.4 141.4 1.24
Developed countries 40.3 42.7 40.7 -4.97
Table 1. World sugar market at a glance
2012/13 2013/14 estim.
2014/15 f’cast
Change: 2014/15
over 2013/14
million tonnes %
WORLD BALANCE
Production 182.3 180.6 181.0 0.24
Trade * 54.7 55.4 55.3 -0.19
Total utilization 176.1 176.9 179.8 1.59
Ending stocks 74.7 78.4 79.4 1.28
SUPPLY AND DEMAND INDICATORS
Per caput food consumption:
World (kg/yr) 24.7 25.0 25.3 1.11
LIFDC (kg/yr) 16.5 16.5 16.8 1.87
World stock-to-use ratio (%) 42.4 44.3 44.2 -0.31
ISA DAILY PRICE AVERAGE (US cents/lb)
2013 2014 2015 Jan-Apr
Change: Jan-Apr 2015
over Jan-Apr 2014
%
18.53 16.70 14.39 -13.84
* Trade figures refer to exports
growing conditions prevail in the main producing region of
Tucuman than in 2013/14.
In Central America and the Caribbean, 2014/15
estimates indicate that sugar production in Mexico
will remain at about the same level as last year, or even
decline slightly, as large outputs in 2012/13 and 2013/14
reduced the incentive to expand sugarcane areas for
the new season. In Guatemala, higher than expected
sugarcane yields boosted sugar output in 2013/14, but no
further increase is anticipated for 2014/15. In Cuba, sugar
production is expected to continue its recovery, sustained
by investments to raise sugar productive capacities at both
farm and factory levels. In Africa, 2014/15 sugar production
is set to rise, prompted by continued area expansions and
improved processing capacities. Kenya, Swaziland, Sudan
and Morocco are anticipated to harvest larger crops,
while output is expected to fall in South Africa following
drought conditions. Sugar output in the country has
recently been expanding but at a moderate rate because
of labour disputes and land reform challenges. In Zambia, sugar production has been expanding by an average
of 9 percent per year over the past ten years, driven by
investment in irrigation and the price incentives introduced
under the 2009 EU Economic Partnership Agreement (EPA).
Zambia’s sugar production is estimated to increase further
in 2014/15.
In Asia, output forecasts have been revised since the
November issue of Food Outlook and now point to a
contraction in the region of 1.4 percent compared with
the 2013/14 marketing season, due to anticipated declines
in China and Thailand. By contrast, production is set to
increase in India, Indonesia and the Philippines. In India,
favourable monsoon rainfalls last August boosted yields,
resulting in a 1.9 million tonne increase of sugar production
to 28.5 million tonnes in 2014/15. Also, remunerative
sugarcane prices have led farmers to substitute sugarcane
for rice or wheat. It is expected that India’s recent partial
deregulation of the sugar industry, which abolished the
required 10 percent levy on sugar mills and deregulated
sales in the open market for the next two years, will give
sugar mills some financial flexibility to repay cane arrears.
As already mentioned in the November issue of Food
Outlook, below average precipitation at the beginning of the
season reduced sugarcane yields in Thailand, the world’s
second largest sugar exporter. Output is now estimated to
fall 4.4 percent to 10.8 million tonnes, despite a 4.2 percent
Figure 4. Sugar production and exports in India
0
10
20
30
40
2014/152013/14 2012/132011/122010/112009/100
1
2
3
4Million tonnes Million tonnes
Production (left axis) Exports (right axis)
f’castestim.

45FOOD OUTLOOKMAY 2015
SUG
AR
expansion in planted area. Similarly, sugar production in
China is expected to decline in 2014/15, due to a reduction
in planted area in response to falling domestic prices and
rising input costs. Sugar returns have reportedly fallen in
comparison with competing crops such as cassava and fruits.
In recent years, financial assistance and subsidized inputs
that sugar mills provided to farmers helped boost plantings.
However, with limited available areas for expansion due to
competition with other crops, increases in output will need
to originate from high-yielding varieties as well as better crop
husbandry and productivity gains at farm and processing
stages. Production is foreseen to contract in Pakistan,
following an estimated 6 percent decline in planted area.
In 2013/14, sugar production expanded in response to the
relatively high sugar returns witnessed over the past three
seasons. Remunerative prices also encouraged the use of
fertilizers and other inputs, which boosted sugar crop yields.
Sugar output is set to expand in Indonesia, amid favourable
weather, area increases and a high extraction rate. The area
expansion occurred mainly in Central Java, Lampung and
South Sulawesi. Expansion in the sugar market is largely
attributed to sustained demand for sugar by the food and
beverage industries, a reflection of per capita income growth.
Similarly, sugar production in Turkey, the world’s fifth largest
sugar beet producer, is foreseen to rise by 0.1 million tonnes
from its 2013/14 level. The increase comes on the back of an
estimated 8 percent growth in sugar beet area to satisfy the
increase in beet sugar production quota for the new season.
In Europe, the latest estimates for the European Union
point to a significant rise in sugar production largely on
account of better yields, notably in France, Germany
and the Netherlands. With the elimination of production
quotas as of September 2017, the European Union is
projected to become more self-sufficient in sugar in the
medium-term. The impact of the abolition of domestic
sugar quotas on the Economic Partnership Agreements
(EPAs) and “Everything But Arms” (EBA) countries is still
uncertain and further analysis is warranted. It is likely,
however, that producers supplying the European Union
under the EBA initiative, or holding preferential access to
the European Union market through bilateral or multilateral
tariff rate quotas (TRQs), will ship more to the European
Union market as long as the European Union internal price
is higher than their own export price, plus transportation
and marketing costs. Also, a great deal of uncertainty
remains regarding the extent to which sugar will be
displaced by isoglucose in the sweetener market following
European Union market liberalization.
Production in 2014/15 is expected to grow modestly
in the Russian Federation, on the back of high beet
sugar content, even though drought conditions impacted
negatively on beet yields. Domestic prices have been
remunerative in recent years, which prompted increases
in plantings. However, the expansion is constrained by
competition from grains and oilseeds. Growth in sugar
production is also likely to be limited by more expensive
imported inputs, such as seeds and fertilizers, given the
depreciation of the Russian currency, notably, with respect
to the US dollar. Sugar production is also expected to
expand in Ukraine, where cultivated area is reportedly
significantly higher than last year. However, rising costs
of imported inputs, the result of a significant depreciation
of the Ukrainian currency, are likely to weigh negatively
on beet yields. In Australia, sugar output is anticipated
to increase following gains in area harvested and higher
sugar yields. In 2013/14, floods and the spread of canopy
disease had negative impacts on plantings. In the rest of
the world, production in the United States is forecast to
rise from its 2013/14 level, on the back of higher sugarcane
yields in Florida as favourable weather conditions helped
support plant development. In 2013/14, ample supplies
put pressure on domestic sugar prices, forcing the US
Department of Agriculture (USDA) to purchase sugar and
re-sell it, at a loss, to bioenergy producers, as part of the
Feedstock Flexible Program (FFP). The USDA has recently
confirmed that for the new season, it is not planning to
make use of the FFP.
UTILIZATION
Per caput sugar consumption to rise only slightly in 2014/15Global sugar consumption is anticipated to reach
179.8 million tonnes in 2014/15, 2.8 million tonnes, or
1.6 percent, more than in 2013/14, in line with the 10-year
trend. Large supply availabilities and lower international
and domestic prices are foreseen to support increases
in per capita sugar intake in 2014/15. Domestic prices
in local currencies are up sharply, particularly in China,
Brazil, Mexico and the Russian Federation, while they
are down in the European Union, the United States,
India and Japan. Under current prospects, world per
capita sugar consumption is to rise slightly, from 25.0 kg
in 2013/14 to 25.3 kg in 2014/15. In developing countries,
aggregate sugar utilization is estimated to expand by
2.9 million tonnes, to 130 million tonnes, equivalent
to 72 percent of the world total. In the generally more
mature markets of the developed countries, consumption is
estimated to remain relatively unchanged.
Sugar consumption in the long-run is mostly driven
by per capita income and population growth. According
to the January update of the World Economic Outlook
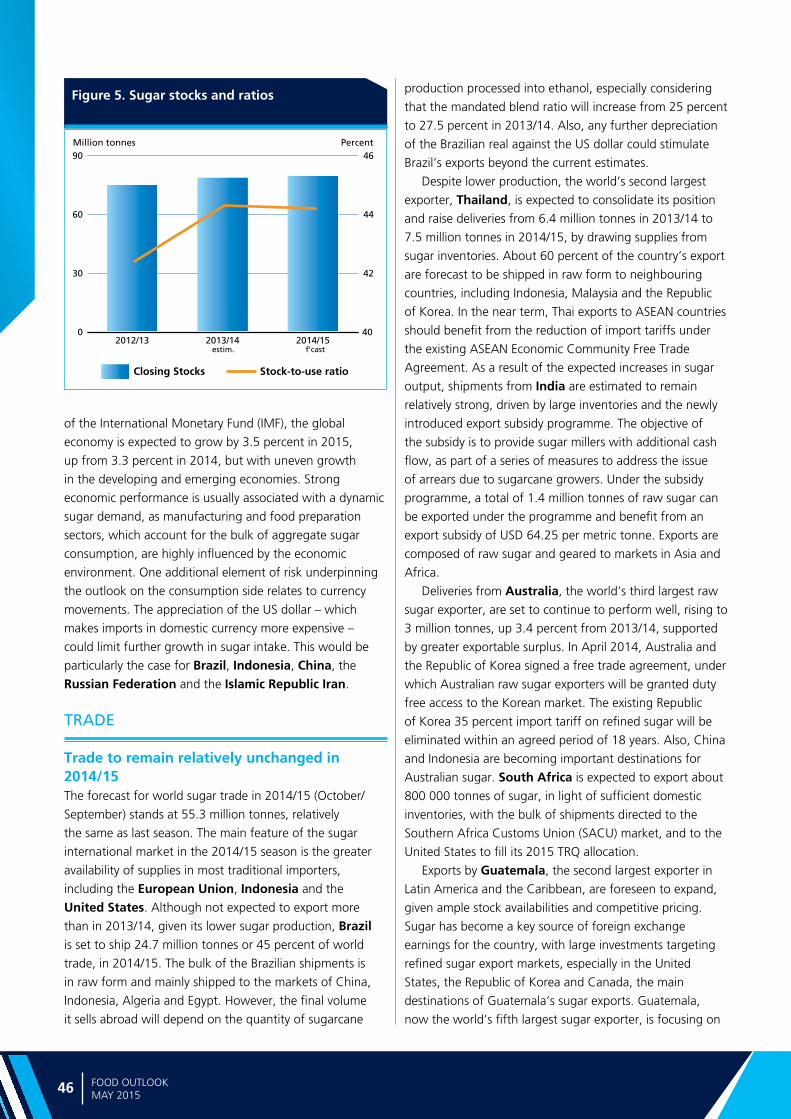
Ma
rke
t a
sse
ssm
en
ts
46 FOOD OUTLOOKMAY 2015
Figure 5. Sugar stocks and ratios
0
30
60
90
2014/152013/142012/1340
42
44
46Million tonnes Percent
Closing Stocks Stock-to-use ratio
f’castestim.
of the International Monetary Fund (IMF), the global
economy is expected to grow by 3.5 percent in 2015,
up from 3.3 percent in 2014, but with uneven growth
in the developing and emerging economies. Strong
economic performance is usually associated with a dynamic
sugar demand, as manufacturing and food preparation
sectors, which account for the bulk of aggregate sugar
consumption, are highly influenced by the economic
environment. One additional element of risk underpinning
the outlook on the consumption side relates to currency
movements. The appreciation of the US dollar – which
makes imports in domestic currency more expensive –
could limit further growth in sugar intake. This would be
particularly the case for Brazil, Indonesia, China, the
Russian Federation and the Islamic Republic Iran.
TRADE
Trade to remain relatively unchanged in 2014/15 The forecast for world sugar trade in 2014/15 (October/
September) stands at 55.3 million tonnes, relatively
the same as last season. The main feature of the sugar
international market in the 2014/15 season is the greater
availability of supplies in most traditional importers,
including the European Union, Indonesia and the
United States. Although not expected to export more
than in 2013/14, given its lower sugar production, Brazil is set to ship 24.7 million tonnes or 45 percent of world
trade, in 2014/15. The bulk of the Brazilian shipments is
in raw form and mainly shipped to the markets of China,
Indonesia, Algeria and Egypt. However, the final volume
it sells abroad will depend on the quantity of sugarcane
production processed into ethanol, especially considering
that the mandated blend ratio will increase from 25 percent
to 27.5 percent in 2013/14. Also, any further depreciation
of the Brazilian real against the US dollar could stimulate
Brazil’s exports beyond the current estimates.
Despite lower production, the world’s second largest
exporter, Thailand, is expected to consolidate its position
and raise deliveries from 6.4 million tonnes in 2013/14 to
7.5 million tonnes in 2014/15, by drawing supplies from
sugar inventories. About 60 percent of the country’s export
are forecast to be shipped in raw form to neighbouring
countries, including Indonesia, Malaysia and the Republic
of Korea. In the near term, Thai exports to ASEAN countries
should benefit from the reduction of import tariffs under
the existing ASEAN Economic Community Free Trade
Agreement. As a result of the expected increases in sugar
output, shipments from India are estimated to remain
relatively strong, driven by large inventories and the newly
introduced export subsidy programme. The objective of
the subsidy is to provide sugar millers with additional cash
flow, as part of a series of measures to address the issue
of arrears due to sugarcane growers. Under the subsidy
programme, a total of 1.4 million tonnes of raw sugar can
be exported under the programme and benefit from an
export subsidy of USD 64.25 per metric tonne. Exports are
composed of raw sugar and geared to markets in Asia and
Africa.
Deliveries from Australia, the world’s third largest raw
sugar exporter, are set to continue to perform well, rising to
3 million tonnes, up 3.4 percent from 2013/14, supported
by greater exportable surplus. In April 2014, Australia and
the Republic of Korea signed a free trade agreement, under
which Australian raw sugar exporters will be granted duty
free access to the Korean market. The existing Republic
of Korea 35 percent import tariff on refined sugar will be
eliminated within an agreed period of 18 years. Also, China
and Indonesia are becoming important destinations for
Australian sugar. South Africa is expected to export about
800 000 tonnes of sugar, in light of sufficient domestic
inventories, with the bulk of shipments directed to the
Southern Africa Customs Union (SACU) market, and to the
United States to fill its 2015 TRQ allocation.
Exports by Guatemala, the second largest exporter in
Latin America and the Caribbean, are foreseen to expand,
given ample stock availabilities and competitive pricing.
Sugar has become a key source of foreign exchange
earnings for the country, with large investments targeting
refined sugar export markets, especially in the United
States, the Republic of Korea and Canada, the main
destinations of Guatemala’s sugar exports. Guatemala,
now the world’s fifth largest sugar exporter, is focusing on
47FOOD OUTLOOKMAY 2015
SUG
AR
increasing its exports of refined sugar. Expected production
gains in 2014/15 are also anticipated to enable Cuba to
increase exports, with about 0.4 million tonnes directed
to China, as part of an export agreement between the
two countries. On the other hand, sales by Mexico
are anticipated to decline for the new season, with
inventory and production levels falling from 2013/14.
Most importantly, shipments to the United States are set
to contract as part of the agreement reached between
the United States Department of Commerce and Mexico
which suspends the anti-dumping and countervailing duty
investigations launched against imports from Mexico.
Under this agreement, Mexican sugar exports entering the
United States will be subject to quantity limits11 as well as a
minimum reference price for both white and raw sugar.
Imports by Asian countries are estimated to fall in
2014/15, as a result of lower purchases by India and
China. In the latter, domestic sugar prices have been rising,
underpinned by a reduction in sugar output, as well as
by the agreement between the China Sugar Association
and domestic refineries to limit out-of-quota raw sugar
imports to 1.9 million tonnes between January 2015
and September 2015. Nevertheless, China is expected
to remain the world’s largest sugar importer in 2014/15.
Similarly, external purchases by India are anticipated to fall,
on the back of large domestic supplies. In contrast, those
by Indonesia are set to remain strong, driven by robust
domestic utilization, particularly from the beverage and
11 This limit is equal to 100 percent of the remaining demanded quantity after the US producers and countries with fixed quotas have exhausted their supplies to the US market.
food processing sectors. The country is to consolidate its
position as the world’s second largest sugar importer.
In Europe, shipments to the European Union are
forecast to decline because of the estimated bumper crop.
With new free trade agreements being fully implemented
with Peru, Colombia and six Central American countries,
namely Costa Rica, El Salvador, Guatemala, Honduras,
Nicaragua and Panama, imports by the EU actually may end
up higher than the 3 million tonnes currently estimated.
An additional 20 000 tonnes of sugar from Ukraine is also
available to enter the European Union market, on the basis
of a newly negotiated free trade agreement. On the other
hand, a continued decline in EU’s domestic sugar prices
could result in falling preferential imports and lower overall
imports to the Union than currently estimated. As a result
of expanding domestic production, imports by the Russian Federation, once the world’s largest sugar market for
trade, are anticipated to fall in 2014/15. Also, any further
depreciation of the Russian currency against the United
States dollar (beyond current levels) could further dampen
purchases. Likewise, shipments to Kenya are estimated
to fall, unlike those to Malaysia and Morocco, which are
expected to increase.
In the rest of the world, purchases by the United States, about half of which are managed through a TRQ
system of 1.4 million tonnes, are anticipated to be cut,
given an increase in domestic production combined and
falling shipments from Mexico, as discussed previously.
Despite anticipated gains in sugar output in 2014/15,
African countries are foreseen to import larger quantities,
in general, to meet robust growth in domestic sugar intake.

Ma
rke
t a
sse
ssm
en
ts
48 FOOD OUTLOOKMAY 2015
Figure 1. Prices fall on reduced demand (2002-2004=100)
Major Meat Exporters and Importers
Major ExportersMajor Importers
MEAT AND MEAT PRODUCTS
The FAO Meat Price Index was generally lower during
the first four months of 2015, declining from 183 points
in January to 178 points in April. The price fall affected all
categories of meat.
Limited production growth; muted trade World meat production is anticipated to record a modest
expansion in 2015 to 318.7 million tonnes, 1.3 percent,
or 4 million tonnes, above 2014, with the largest increases
expected in China, the EU, United States and Brazil. The
pigmeat sector is forecast to drive the global increase,
followed by poultry meat. Only modest gains in bovine and
ovine meat production are currently foreseen.
Global meat trade is forecast to expand at a moderate
rate of 1.7 percent in 2015, to 31.2 million tonnes, a
significant slowdown from the 3.1 percent registered last
year. There are diverging projected trade trends for the
various types of meat, with growth forecast for bovine
meat, pigmeat and poultry, and decline forecast for ovine
meat. Poultry remains the main traded meat product,
followed by bovine, pig and ovine meat, respectively.
BOVINE MEAT
Unchanged productionBovine meat production in 2015 is forecast to remain
largely unchanged at 68 million tonnes – continuing a trend
of limited growth evident for several years. 100
140
180
220
260
201520142013201220112010
Bovine
Poultry
Ovine
Total meat
Pigmeat
170
180
190
200
210
220
AMFJDNOSAJJM
2014/15
2012/13
2013/14

49FOOD OUTLOOKMAY 2015
ME
AT
AN
D M
EA
T P
RO
DU
CT
S
Table 1. World meat market at a glance
2013 2014estim.
2015f’cast
Change: 2015 over 2014
million tonnes %
WORLD BALANCE
Production 311.1 314.7 318.7 1.3
Bovine meat 67.8 67.8 67.9 0.2
Poultry meat 108.6 110.2 111.8 1.4
Pigmeat 115.0 117.2 119.4 1.9
Ovine meat 13.9 13.9 14.0 0.8
Trade 29.7 30.6 31.2 1.7
Bovine meat 8.9 9.6 9.8 1.9
Poultry meat 12.5 12.7 13.1 2.6
Pigmeat 7.1 7.0 7.1 1.6
Ovine meat 1.0 1.0 0.9 -8.5
SUPPLY AND DEMAND INDICATORS
Per caput food consumption:
World (kg/yr) 43.4 43.3 43.4 0.1
FAO MEAT PRICE INDEX(2002-2004=100)
2013 2014 2015 Jan-Apr
Change: Jan-Apr 2015
over Jan-Apr 2014
%
184 198 178 -3.6
In South America, cattle availabilities and slaughter
have been rising, particularly in Brazil. The country,
which is the second largest producer after the United
States, is anticipated to account for most of the
regional growth, as its production is projected to rise by
1.6 percent to 10 million tonnes. The Brazilian cattle herd
is in an expansion phase, supported by improvements
in productivity and genetics. Additionally, favourable
prices on the export market have stimulated the use of
feed to maintain cattle weight during the dry season. In
Argentina, government export restrictions have obliged
the industry to focus increasingly on internal demand,
which absorbs over 90 percent of output. Preference for
younger, lighter animals for the domestic market means
that production is growing at a relatively slow rate. In
neighbouring Paraguay and Uruguay, strong production
growth is anticipated, spurred by international demand
and sustained cattle prices, and supported by an expanding
herd and productivity increases.
In Asia, India, the sixth largest bovine meat producer,
continues to see its industry grow, supported by a
government programme to utilize male buffalo calves from
the country’s expanding dairy herd. Output is forecast to
drop in the Republic of Korea, where low profitability has
led to herd reduction. In China, production is anticipated
to record a second year of decline, due to a reduction in
the size of the national herd. Limitations on space and
fodder supplies, combined with poor profitability, have
led to a number of smaller-scale producers leaving the
industry.
Most parts of Africa received adequate rainfall during
the first part of the year, which led to satisfactory pasture
conditions and laid the basis for an anticipated moderate
increase in bovine meat production. However, some areas
of southern Africa suffered from flooding at the start
of the year, followed more recently by dry conditions,
which may affect both pastures and feed availability. As
a consequence, the sector growth may be constrained in
the subregion. Furthermore, outbreaks of foot-and-mouth
disease in east-central Africa including Kenya, Uganda
and Rwanda may depress yields. Egypt, where bovine
meat production is mainly based on dairy cattle (including
buffaloes), the continued presence of FMD and a high calf
slaughter rate are anticipated to depress output.
In North America, the United States, the world’s largest
producer, is anticipated to incur a further, although smaller,
decline in bovine meat production in 2015, as a result of
calves being retained for herd expansion. This should be only
partly offset by higher average slaughter weights, fostered
by cheaper feed costs. Output could decline by 2.3 percent,
to 10.9 million tonnes, its lowest level since 1994. The long-
term decline in the cattle herd in neighbouring Canada,
evident since 1992, is expected to continue.
In Oceania, the after-effects of drought are anticipated
to impinge on production. In Australia, slaughter rates
increased markedly in 2013 and the first part of 2014,
prompted by reduced availability of pasture and fodder.
Diminished herd size and rebuilding should combine
to curb output in 2015, with a decline of 7.1 percent
to 2.3 million tonnes anticipated. In New Zealand,
production is foreseen to be higher – at around 590 000
tonnes – as a result of drought during the first part of the
year and substantially lower milk payouts to farmers. The
beef industry in New Zealand is highly dependent on the
dairy sector, which provides 80 percent of the total supply
in the form of culled cows and male calves for fattening.
In the Russian Federation, improved productivity and
slaughtering facilities may be sufficient to counterbalance
long-term herd reduction, resulting in a small increase in
output overall. In the EU, the world’s third largest beef
producer at 7.8 million tonnes, the prolonged reduction
in the cattle herd has reversed as a result of dairy sector
expansion. Bovine meat production is anticipated to rise
by 1.7 percent in 2015, mainly owing to a rise in the
number of male dairy calves for fattening and the culling
of dairy cows in some countries, stemming from lower
milk prices.

Ma
rke
t a
sse
ssm
en
ts
50 FOOD OUTLOOKMAY 2015
Limited trade growthWorld trade in bovine meat in 2015 is anticipated
to expand at a reduced rate of 1.9 percent, to
9.8 million tonnes. Supply limitations are forecast to be the
principal factor behind the slowdown, although, the pace
of growth in import demand may slacken as well.
China is expected to record a significant increase in
imports, although not to the same degree as in the previous
three years, when they tripled. Total imports could reach
1.3 million tonnes in 2015, 12.7 percent more than in 2014,
placing China above the United States as the main world
market for bovine meat. Changing consumption patterns,
associated with increased income and growth in meals
outside the home, have underpinned the substantial hike
in imports China has experienced since 2011. Additionally,
following outbreaks of avian influenza, some Chinese
consumers have switched from poultry to other meats.
Elsewhere in Asia, imports by Vietnam, the Islamic Republic of Iran, the Republic of Korea and Malaysia could increase, as domestic production is forecast to be
either stable or decrease, while purchases by Japan may fall.
Imports by the United States and Canada may also decline
somewhat. In the Russian Federation, the devaluation of
the rouble, combined with increased domestic production,
are expected to result in a fall in purchases. Deliveries to the
EU, Chile and Mexico are anticipated to be little changed.
Much of the 2015 expected expansion in trade is projected
to be met by India and Brazil. India, in particular, is anticipated
to see a strong rise in sales of buffalo meat (carabeef), which
grew by 11 percent in 2014 and has almost quadrupled since
2009. India’s exports in 2015 are projected at 2 million tonnes,
confirming its position as the leading supplier of bovine meat,
having overtaken Brazil already last year. India’s main markets
are in Asia – particularly Vietnam – and in North Africa.
The popularity of carabeef rests on its price competitiveness,
although quotations are moving nearer to those for beef from
competitors such as Australia and Brazil. Brazil’s stagnant
domestic demand and increased competitiveness stemming
from the depreciation of the real, the local currency, should
promote exports, now projected to rise by 6.1 percent to
1.9 million tonnes. Favourable market conditions for bovine
meat are expected to stimulate exports from Paraguay, the
EU, Argentina and Nicaragua. Increased exports are also
forecast for New Zealand, arising from drought-related
herd reduction and a reduced rate of retention within the
dairy herd caused by lower milk payouts. On the other hand, reduced production is anticipated to curb exports by the
United States and Australia. In the case of Uruguay, the government-imposed restrictions on trade, to guarantee
supplies to the domestic market, are anticipated to constrain
exports.
PIGMEAT
Production to grow in all regionsWorld production of pigmeat is anticipated to grow by
1.9 percent to 119.4 million tonnes in 2015, aided by
lower feed costs. Asia is the leading pigmeat-producing
region, accounting for almost 60 percent of the world
total. Strong consumer demand and government support
policies are anticipated to boost China’s output by
1.2 percent, to 57.8 million tonnes, equivalent to almost
half of the world total. Elsewhere in Asia, Vietnam,
the Philippines and Indonesia are foreseen to register
growth rates similar to China. Production in Japan and the
Republic of Korea is set to recover following last year’s
outbreaks of porcine endemic diarrhoea (PED), which
reduced piglet numbers. Recovery from the effects of PED
is also projected to result in a rise in pigmeat production in
the United States. Elsewhere in the Americas, Brazil and
Canada are set to increase output, stimulated by reduced
feed costs. Steady growth is also anticipated for Mexico,
underpinned by improved genetics and productivity, which
translates into more piglets per litter and higher animal
weights. Production in the EU is expected to continue
the expansion seen last year. As a reflection of this, the
year-end breeding sow herd increased for the first time
in several years. In the Russian Federation, government
policies favouring large-scale farms have resulted in
production doubling over the past decade. The trend
towards increased output may be amplified in 2015,
following prohibitions of pork imports from the EU and
Canada, which together supplied two-thirds of Russian
imports before the ban was introduced.
Figure 2. Bovine meat exports
700
1000
1300
1600
1900
2200
201520142013201220112010
India BrazilAustralia United States
f’cast
Thousand tonnes, cwe

51FOOD OUTLOOKMAY 2015
ME
AT
AN
D M
EA
T P
RO
DU
CT
S
Figure 3. EU pigmeat exports
0
100
200
300
400
Aug.13 - Jan.14
Aug.14 - Jan.15
Thousand tonnes, cwe
Ru
ssia
n F
ed.
USA
Au
stra
lia
Ch
ina
Phili
pp
ines
Jap
an
R. o
f K
ore
a
Excess export supplies depress world pricesTrade in pigmeat is expected to recover by 1.6 percent
to 7.1 million tonnes in 2015, following a decrease in
the previous two years. The United States, the EU and
Canada account for four-fifths of the world pig meat
exports. Adding Brazil and China to the group brings the
total to more than 90 percent. Expanding production in
the main exporting countries is anticipated to be the main
driver behind export growth. Abundance of supplies on the
world market was reflected in the movement of the FAO
Pigmeat Price Index which, after reaching an historic peak
in June 2014, had fallen by 37 percent by April, reaching
a level last seen in January 2011. An additional factor in
the weakness in pigmeat prices was the country-specific
import ban introduced by the Russian Federation, which
particularly affected sales from the EU. Initially, EU pigmeat
exports were redirected to Asia, in particular Japan, the
Republic of Korea, China and the Philippines. However,
towards the end of 2014 and into 2015, demand from
these markets slackened and sales declined. A fall in
exports increased supply to the EU domestic market causing
internal prices to drop substantially. As a consequence,
in February 2015, the European Commission opened a
private storage aid scheme to assist price recovery. Lower
international prices for pigmeat are anticipated to serve
as the principal motor of trade growth. China, Mexico, the Republic of Korea, Vietnam, Australia, Angola, Singapore and Colombia and are all forecast to increase
imports. Meanwhile, expansion in production in the
United States, Japan and the Russian Federation is anticipated to lead to lower purchases this year.
POULTRY
Stagnation in China production weighs on world growthLimited growth is foreseen for poultry production in
2015. Output is expected to rise by 1.4 percent to
111.8 million tonnes, much slower than the 3 percent per
year trend observed over the past decade. While falling
feed prices have supported growth in many countries,
industry challenges in China continue to weigh on the
world total. In China, concerns over avian influenza have
caused demand for poultry to stagnate. As a consequence,
poultry production in China is projected to be unchanged
in 2015, at 18.5 million tonnes. Excluding China, the
tendency in all the other largest producing countries is
expected to be positive. Production in the United States,
the principal producer, could grow by 0.8 percent, to
20.7 million tonnes. Elsewhere, the other major producers
likely to witness gains include the EU, Brazil, the Russian Federation, Mexico, India, the Islamic Republic of Iran and Turkey.
Slow trade growthPoultry, the most traded meat category, accounts for
over 40 percent of total meat trade. Although poultry
trade volume has increased by 55 percent over the past
decade, growth has slowed since 2012, a trend expected
to continue in 2015, with trade increasing by 2.6 percent
to 13.1 million tonnes. In part, the slowdown in growth
is a reflection of augmented production in importing
countries, which has reduced their need for external meat
supplies. Additionally, outbreaks of highly pathogenic avian
influenza (HPAI) in some areas of the United States from
Figure 4. Pork and poultry producers benefit from reduced feed costs
0.4
0.6
0.8
1.0
1.2
130
180
230
280
330
201520142013201220112010
2002-2004=100 Ratio
Feed price index (left axis)
Pigmeat/feed index (right axis)
Poultry/feed index (right axis)

Ma
rke
t a
sse
ssm
en
ts
52 FOOD OUTLOOKMAY 2015
Figure 6. Poultry exports
0
300
600
900
201520142013201220112010
Thailand TurkeyArgentina
f’cast
Thousand tonnes, cwe
January onwards caused numerous countries to suspend
imports from this country, pending its containment and
eradication.
The two major poultry meat importers, China and
Japan, are projected to maintain their purchases at similar
levels to the previous year. Stable to positive growth in
imports by other major markets, including Mexico, Saudi Arabia, the EU and Vietnam, is expected to contrast
with a second year of falling purchases by the Russian Federation. In the Federation, imports are provisionally
estimated to decline by 12 percent, stemming from
abundant domestic production and the August 2014 ban
on imports from specific countries. In the case of poultry,
this group of countries had supplied approximately three
quarters of the Federation’s overseas purchases in 2013,
which means identifying alternative sources of supply has
presented a challenge. In Africa, imports as a whole are
forecast to rise by 6.7 percent. Among the main importing
countries, Angola and Benin are anticipated to purchase
more, as income growth strengthens demand, while
imports by South Africa, the major trade destination in the
region, are forecast to rise by 1 percent.
The three leading exporters, Brazil, the United States and the EU, which together account for almost
three quarters of global poultry exports, have seen little
expansion in sales in recent years. This situation may
change in 2015, when sales by Brazil may receive a fillip
from the US HPAI-related export restrictions and from the
opening up of opportunities in the Russian Federation.
Exports by the United States for the year as a whole are
anticipated to suffer from HPAI-related import restrictions,
even falling somewhat, although the severity of the
decrease will depend on how soon the disease is contained
and eradicated. As a result of this, second-tier exporters,
such as Thailand and Turkey, along with Brazil, are
projected to drive the expansion of world poultry exports
in 2015. Conversely, Argentina, which has also seen
substantial growth in recent years, suffered a decline in
sales to its principal market, Venezuela, in 2014. A further
fall in overall sales is anticipated for this year, despite
Argentina having widened the focus of its trade to include
China, Chile, South Africa and the Russian Federation,
among others.
OVINE MEAT
Limited production growth After stagnating in 2014, production of ovine meat
is forecast to show limited growth in 2015, rising by
0.8 percent to 14 million tonnes. Developing countries
account for three quarters of the total, with the largest
producers being China, India, Sudan, Pakistan and
Nigeria. Generally satisfactory pasture conditions have
set the basis for flock rebuilding in many of the major
producing areas of Asia and Africa. In Oceania, drought-
imposed herd reduction and subsequent rebuilding are
anticipated to constrain output in Australia and New Zealand. In the EU, the second largest producer, outbreaks
of bluetongue disease reduced both herd size and off-take
in several member countries in 2014 and the effects are
anticipated to carry over into 2015.
Trade to fall With Australia and New Zealand accounting for
almost 85 percent of world ovine meat exports, trade in
ovine meat is set to fall as a result of restocking in both
countries. Overall, trade may drop by 8.5 percent to 940
000 tonnes. In dealing with reduced availabilities, Oceania
exporters may maintain supplies to the highest value
markets, such as the EU and the United States, while
seeking, to the extent possible, to meet the requirements
of growing markets, albeit lower priced ones, including
China, the United Arab Emirates, Qatar and Malaysia.
Among the small-scale exporters, India is expected to see
sales grow this year, mainly to the Middle East, especially
the United Arab Emirates and Saudi Arabia. Exports
by the EU and Uruguay are forecast to be little changed
from last year.

53FOOD OUTLOOKMAY 2015
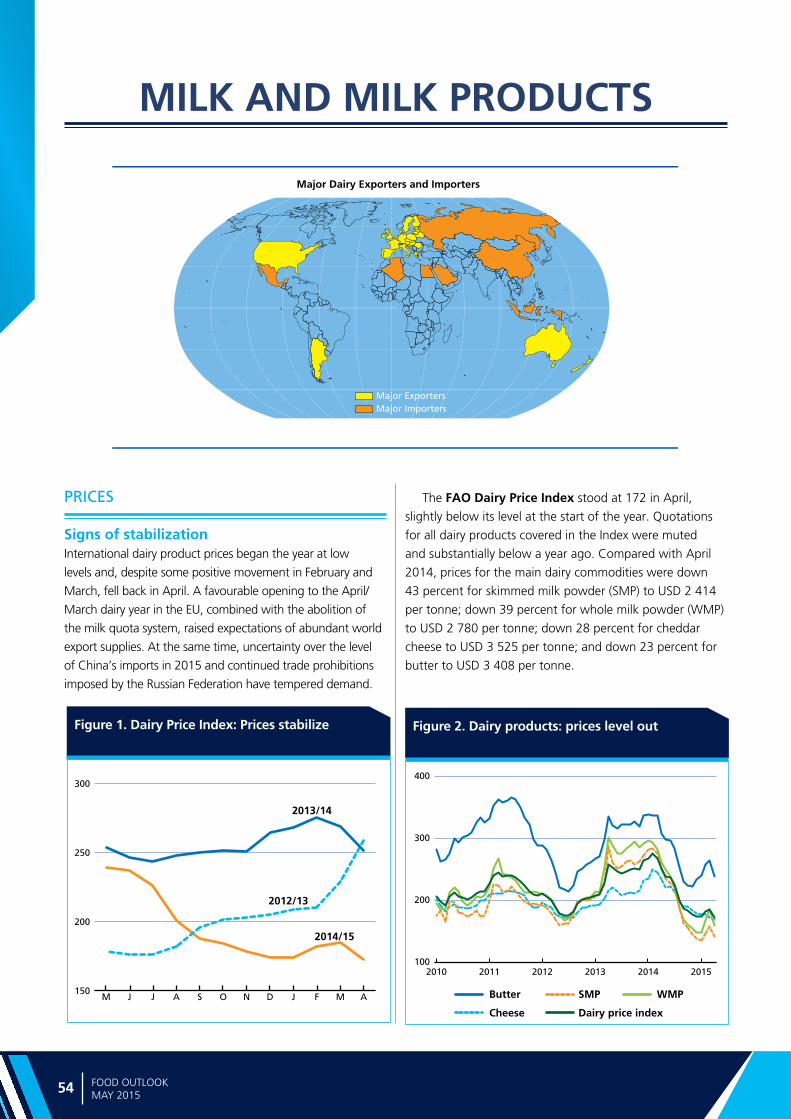
Ma
rke
t a
sse
ssm
en
ts
54 FOOD OUTLOOKMAY 2015
Figure 1. Dairy Price Index: Prices stabilize Figure 2. Dairy products: prices level out
Major Dairy Exporters and Importers
Major ExportersMajor Importers
MILK AND MILK PRODUCTS
PRICES
Signs of stabilizationInternational dairy product prices began the year at low
levels and, despite some positive movement in February and
March, fell back in April. A favourable opening to the April/
March dairy year in the EU, combined with the abolition of
the milk quota system, raised expectations of abundant world
export supplies. At the same time, uncertainty over the level
of China’s imports in 2015 and continued trade prohibitions
imposed by the Russian Federation have tempered demand.
The FAO Dairy Price Index stood at 172 in April,
slightly below its level at the start of the year. Quotations
for all dairy products covered in the Index were muted
and substantially below a year ago. Compared with April
2014, prices for the main dairy commodities were down
43 percent for skimmed milk powder (SMP) to USD 2 414
per tonne; down 39 percent for whole milk powder (WMP)
to USD 2 780 per tonne; down 28 percent for cheddar
cheese to USD 3 525 per tonne; and down 23 percent for
butter to USD 3 408 per tonne.
150
200
250
300
AMFJDNOSAJJM
2014/15
2012/13
2013/14
100
200
300
400
201520142013201220112010
Butter
Cheese
WMPSMP
Dairy price index

55FOOD OUTLOOKMAY 2015
MILK
AN
D M
ILK P
RO
DU
CT
S
Table 1. World dairy market at a glance
Figure 3. EU intervention prices, price and export refund for butter and skim milk powder
0
1500
3000
4500
1514131211100908070605
SMP (interv. price)
SMP Refund
SMP (export price) Butter (export price)Butter (interv. price)
Butter Refund
Euro per tonne
2013 2014estim.
2015f’cast
Change: 2015 over 2014
million tonnes %
WORLD BALANCE
Total milk production 765.1 788.5 804.5 2.0
Total trade 68.3 72.2 74.1 2.7
SUPPLY AND DEMAND INDICATORS
Per caput food consumption:
World (kg/yr) 106.9 108.9 109.9 0.9
Developed (kg/yr) 218.1 221.9 222.5 0.3
Developing (kg/yr) 75.6 77.5 78.9 1.8
Trade share of prod. (%) 8.9 9.2 9.2 0.6
FAO DAIRY PRICE INDEX(2002-2004=100)
2013 2014 2015 Jan-Apr
Change: Jan-Apr 2015
over Jan-Apr 2014
%
243 224 178 -32.9
PRODUCTION
Most growth to come from AsiaWorld milk production in 2015 is forecast to grow by
2.0 percent to 805 million tonnes. While Asia is expected
to account for most of the increase, production should
rise in all regions. Output in India, the world’s largest milk
producing country, is expected to expand by 4.3 percent,
or 6.1 million tonnes, to 147.8 million tonnes. Expansion in
herd size and improved productivity are important engines
underpinning production growth in the country. Increased
output is also anticipated in China, Pakistan and Turkey, spurred by steady growth in consumer demand. Several
other main producing countries in the region are anticipated
to record production levels slightly above last year,
including: the Islamic Republic of Iran, Japan and Saudi Arabia. Meanwhile, in the Republic of Korea, production
is expected to remain subdued as a result of limited
profitability. In Africa, a moderate increase in milk production
is foreseen for 2015, assisted by generally favourable
weather conditions. However, some areas of southern Africa
suffered from flooding at the start of the year, followed
more recently by dry conditions, which may affect pasture
condition and feed availability. Expansion is foreseen for
Algeria, South Africa and Tanzania, while unusually dry
weather in Kenya may negatively affect pastures as well as
fodder and feed supplies. Furthermore, outbreaks of foot-
and-mouth disease in east-central Africa including Kenya,
Uganda and Rwanda continue to negatively affect yields.
Rising incomes and strong regional and international
demand have promoted growth in dairy production in
several countries in Latin America and the Caribbean.
Countries of the southern cone experienced dry conditions
at the start of the year, followed by flooding in February/
March, raising concerns about the condition of pastures
for the rest of the year. For the present, subregional
milk production is projected to rise 1.4 percent to
72 million tonnes. Gains are forecast for Brazil, Chile,
Colombia, Ecuador, Paraguay and Uruguay. In
Argentina, in addition to the adverse weather seen so
far this year, the sector is constrained by falling domestic
demand and government-imposed limitations on exports,
and production is expected to register a decline of almost
5 percent, to 11.1 million tonnes. In Central America,
milk production in Mexico, the largest producer in the
subregion, should recover after two years of constrained
output caused by prolonged dry weather. Production in
Costa Rica is expected to show a moderate increase.
In North America, output in the United States is
forecast to register a second year of strong growth and
rise by 2.9 percent to 96.3 million tonnes. Production in
Canada is set to remain at 8.5 million tonnes, within the
limits set by its milk quota system.
In Europe, EU milk production is projected to grow by
1.2 percent to 162.4 million tonnes, stimulated by reduced
feed costs, a favourable start to the current season and
the abolition of the Union’s milk quota system. With the
ending of the quota system, several EU member-states,
particularly Ireland, the Netherlands and Germany, are
expected to maximize their production, while others
with less favourable production conditions may register a
decline. This diverging trend within the EU has meant that
2014’s exceptional rise in dairy cow numbers has not been
repeated and the herd size is stable. Milk production in the

Ma
rke
t a
sse
ssm
en
ts
56 FOOD OUTLOOKMAY 2015
Figure 4. Feed prices continue to decline
Average
2011-13
2014
prelim.
2015
f'cast
Change
2015 over
2014
thousand tonnes (product weight) %
WHOLE MILK POWDER
World 2389 2591 2672 3.1
New Zealand 1221 1424 1480 3.9
European Union* 383 389 397 2.1
Argentina 195 144 132 -8.0
Australia 107 81 89 10.0
SKIM MILK POWDER
World 1811 2130 2239 5.1
European Union* 481 646 743 15.0
United States 478 554 550 -0.6
New Zealand 381 383 400 4.4
Australia 142 164 175 6.9
BUTTER
World 878 976 995 1.9
New Zealand 446 510 530 3.9
European Union* 127 149 149 -0.2
Belarus 70 69 70 1.9
United States 69 74 67 -9.0
Australia 48 43 47 9.7
CHEESE
World 2388 2398 2457 2.5
European Union* 742 721 757 5.0
United States 269 371 360 -2.8
New Zealand 278 278 285 2.5
Belarus 132 166 185 11.8
Australia 165 151 160 6.2
Egypt 134 115 119 3.3
Table 2. Trade in dairy products 2012-2014: Principal exporting countries
* Excluding trade between the EU Member States. From 2013: EU-28
110
160
210
260
310
201520142013201220112010
Dairy price index Feed price index
Russian Federation is anticipated to move sharply lower
in 2015, as poor profitability has caused a contraction in
the dairy herd, in particular in the small-farm sector. In
neighbouring Belarus, production is on an upward trend,
assisted by increased sales to the Russian Federation.
In Oceania, a strong start to New Zealand’s milk
production in the second-half of the current 2015
dairy marketing year (June-May) was curtailed by dry to
drought conditions in many areas from January to March.
Additionally, falling world prices have led to a substantial
revision in payments to producers, which may be down
by as much as 40 percent compared to last year. This
situation has acted as a strong disincentive for farmers to
seek to maximize production via feeding supplements.
New Zealand’s current year production is anticipated
to close at a level similar to the previous one, at some
20.7 million tonnes. In Australia, generally favourable
weather conditions and falling feed costs are anticipated to
result in a 2 percent rise in output for the current July-June
dairy year.
TRADE
Market adjusts to changes seen in 2014Trade in dairy products is projected to rise by 2.7 percent in
2015, a slower rate than last year, to reach 74 million tonnes
of milk equivalent. The two principal exporters, New Zealand and the European Union, which together account
for slightly more than 50 percent of world exports, are
both anticipated to record an increase in sales. In the case
of New Zealand, as the 2015/2016 dairy year has yet to
begin, much will depend on pasture conditions following
the dry-to-drought weather prevailing during the first part of
2015. For the EU, the current April-March dairy year marks
the first time in 31 years that milk production will not be
constrained by the milk quota system, which could facilitate
higher exports. Elsewhere, the United States is anticipated
to maintain sales at a level similar to last year. Conversely,
exports from Argentina are projected to decline for the
second year, as a result of reduced milk production and
government-imposed limitations on overseas sales.
Asia is expected to remain the main centre for rising
international demand in 2015, although growth may
be slower than in recent years. Increased purchases are
forecast for China, Saudi Arabia, Malaysia, the United Arab Emirates, Vietnam, the Philippines, Thailand and Oman. Elsewhere in Asia, Singapore, Japan and the
Republic of Korea remain important markets, but the
level of their imports is not expected to change markedly
and, in some cases, could decrease slightly. Low prevailing
international prices should stimulate imports by Africa.

57FOOD OUTLOOKMAY 2015
MILK
AN
D M
ILK P
RO
DU
CT
S
The principal countries that could see growth in purchases
are Algeria, Egypt and Nigeria. In Latin America and the
Caribbean, increased domestic production could result in
reduced imports by Brazil, while Mexico and Venezuela are projected to maintain dairy imports at a level similar to
last year. For Europe, imports by the Russian Federation are anticipated to fall for the second year in a row, reflecting
the substantial devaluation of the rouble, along with the
continuation of the ban introduced in August 2014 on
imports of dairy products from Australia, Canada, the EU,
Norway and the United States, which has affected cheese in
particular. Imports by the EU are forecast to be little changed
compared with 2014, as are those of the United States.
Whole milk powder (WMP) – Prices remain weak Following a steep decline throughout 2014, prices rose
somewhat in February and March 2015, before falling
back in April. Increased purchases by China and concerns
over supplies from drought-affected New Zealand were
the main causes of the price hike, although, subsequently,
anticipation of continued abundant export supplies overall
caused prices to drop in April. China’s imports of WMP for
2015 are foreseen to be 4 percent higher, consolidating
its position as the main international market, representing
a third of total world sales. Elsewhere in Asia, lower prices
may stimulate demand in several major markets, including
Saudi Arabia, Sri Lanka and Indonesia. In North Africa
and Latin America and the Caribbean, Algeria and Venezuela are anticipated to boost imports, building on
substantial purchases made last year. Most of the principal
exporters, including New Zealand, the EU and Australia, are projected to increase the level of sales in 2015, while
supply limitations are anticipated to cause exports by
Argentina, Uruguay and Brazil to fall. Overall, world
exports of WMP are projected to rise by 3.1 percent in
2015 to 2.7 million tonnes.
Skim milk powder (SMP) – Prices lacklustreAs with WMP, SMP prices fell back in April 2015, after a
short-lived rally in February and March. However, in the
case of SMP, the decline was not as sharp, due to the more
stable price of its co-product, butter.
Trade in SMP is predicted to grow by 5.1 percent in
2015. SMP is central to the milk processing industry in
many countries and, as such, market demand is more
dispersed than that of WMP. The principal markets are
(in order of volume) China, Mexico, Algeria, Malaysia, Indonesia, the Philippines, Saudi Arabia, Vietnam and
the Russian Federation, followed by Egypt, Thailand and Singapore. While China is anticipated to remain the
main market, with 15 percent of total imports, a rise in
purchases is also expected for some other major importers,
including (in order of volume) Algeria, Malaysia and the Philippines. Conversely, imports by the Russian Federation and Japan could fall.
Almost 85 percent of world SMP exports are supplied by
the United States, the EU, New Zealand and Australia. With the exception of the United States, all are anticipated
to either maintain or expand sales during 2015. Following a
surge in 2013, exports by India almost halved in 2014. The
decline is projected to continue this year, as domestic prices
have remained above those prevailing in the world market.
Butter – Prices also downSince dairy prices began to fall in March 2014, butter
prices have been less affected than the other products – a
reflection of differing markets and utilization.
Trade in butter is forecast to increase by 1.9 percent to
995 000 tonnes in 2015. Demand for butter comes mainly
from Southeast Asia, the Middle East and the Russian Federation, although, as with many other milk products,
China has substantially increased purchases in recent years.
Furthermore, as a result of trade agreements and duty-free
access for inward processing (where products are imported
duty free for additional processing and export), the EU is both an important butter importer (ranking sixth) and
exporter (ranking second). Many of the principal markets,
including China, Saudi Arabia and Singapore, are
predicted to maintain or increase imports in 2015, while
the devaluation of the rouble in the Russian Federation is expected to reduce purchases by the country this year.
The two principal exporters of butter, New Zealand and the EU, are both anticipated to see sales increase
in 2015. In New Zealand, reduced returns from WMP
may foster a shift towards production of butter/SMP, as
processors seek to maximize returns from the new season’s
milk production. In the case of the EU, a devaluation
of member states’ currencies against the United States
dollar has improved export competitiveness. In the United States, increased production of cheese and yogurt may
cause exports of butter to fall for the second year in a row.
Cheese – Marginal price decline Cheese prices have declined along with other dairy products,
with April prices a third lower than their February 2014
peak. The Russian Federation’s country-specific import
ban and the devaluation of the rouble continue to weigh
on the market. In 2014, imports by the Federation fell
by 34 percent. Unlike the other commodities, cheese is a
highly differentiated product and is used mainly for direct
consumption rather than as an ingredient in the food

Ma
rke
t a
sse
ssm
en
ts
58 FOOD OUTLOOKMAY 2015
industry. Thus, the sudden loss of the Russian market caused
difficulties for some suppliers, in particular the EU – which
had previously supplied 55 percent of the country’s imports,
representing a third of total EU cheese exports. Some
EU member states were particularly affected by the ban,
including the Netherlands, Germany, Finland, Lithuania and Poland. Subsequently, EU cheese trade reoriented
towards Asia and, as a consequence, only declined by
8 percent for 2014 as a whole. In the EU, cheese exports
represent less than 10 percent of internal production
which means that, in addition to seeking alternative export
markets, it has the potential to absorb the surplus within its
domestic market. In this regard, the European Commission
has announced that additional funds will be allocated for
measures to promote consumption in 2015.
In terms of the overall cheese market, trade is forecast
to rise by 2.5 percent in 2015, as the market adjusts to
the substantial changes of 2014. Imports by the Russian Federation are forecast to remain low – falling by as much
as 15 percent over the substantially diminished levels of 2014.
Elsewhere, reduced prices and growing demand are expected
to lead to augmented purchases by most of the principal
Main exporters US Cheese exports: major markets
EU cheese exports: major markets before and after the Russian Federation import ban
Figure 5. EU and United States cheese exports
importing countries. A particularly strong rise is anticipated for
China, where imports have more than doubled over the past
five years. Sales to the second largest market, Japan, may also
show moderate growth, along with those to Saudi Arabia,
Mexico and the Republic of Korea. In the United States,
a fall in exports could lead to reduced import demand by the
country. Purchases by Australia and the European Union are forecast to remain stable.
Cheese sales by the EU are projected to recover some
of the ground lost in 2014 and to grow by 5 percent. Other
countries expected to increase exports include New Zealand,
Australia and Belarus. Following meteoric growth since
2009, the United States superseded New Zealand as the
second major cheese exporter in 2013 and 2014. While the
US is expected to maintain this position in 2015, a slowdown
of sales in recent months suggests that the steady rise in
cheese exports may stall in 2015. Overall, the United States
has benefitted from Australia’s and New Zealand’s focus on
milk powder and has seen substantial demand growth in its
main markets in recent years, including Mexico, the Republic
of Korea and Japan, as well as a significant expansion in sales
to Australia, Saudi Arabia, China and Egypt.
0
50
100
150
Aug.13 - Jan.14
Aug.14 - Jan.15
Thousand tonnes
Ru
ssia
n F
ed
Mex
ico
Au
stra
lia
Egyp
t
Lib
ya
Iraq
USA
Sau
di A
rab
ia
Jap
an
Swit
zerl
and
R. o
f K
or e
a 0
100
200
300
400
500
Aug14-Jan15Aug13-Jan14Aug12-Jan13
Thousand tonnes
Exports to the Russian Fed.
Exports to other countries
0
30
60
90
Thousand tonnes
2009 2010 2011
2012 2013 2014
Mexico Rep. ofKorea
Japan China Australia SaudiArabia
Canada0
200
400
600
800
15141312111009080706
EU New ZealandUSA
f’cast
Thousand tonnes


Ma
rke
t a
sse
ssm
en
ts
60 FOOD OUTLOOKMAY 2015
Major Exporters and Importers of Fish and Fishery Products
Major ExportersMajor Importers
Figure 1. The FAO Fish Price Index(2002-2004=100)
80
105
130
155
180
201520132011200920072005200320011999
FAO total fish price index
Capture totalAquaculture Total
FISH AND FISHERY PRODUCTS
Source: Norwegian Seafood Council (NSC)
GLOBAL FISH ECONOMY
The global seafood industry in 2014 was characterized by
sustained high prices for many important species, and a
continuation of major trends in production and consumption
growth. The shift towards relatively greater consumption of
farmed species compared with wild fish hit a milestone in
2014, when the farmed sector’s contribution to fish food
supply overtook that of wild fish for the first time.
In 2014, overall fish production is estimated to have
grown by only 1 percent to 164.3 million tonnes, boosted by
a 5 percent expansion of aquaculture to 74.3 million tonnes,
which compensated for a 2 percent contraction in wild fish
output to 90.0 million tonnes. The contraction in capture
fisheries production mainly reflected reduced anchoveta
catches, a result of the El Niño climatic phenomenon. Supply
in 2015 is likely to see a small rebound in wild catches from
the 2014 El Niño-related shortfall, to 90.6 million tonnes,
and a further 5 percent growth in aquaculture production to
78.0 million tonnes. As a result, fish production is forecast to
reach 168.6 million tonnes in 2015, up 2.6 percent from the
previous year.
Booming demand in Eastern Asia, together with a
strong increase in fishmeal prices and impressive shrimp
exports from Asia and from Latin America and the
Caribbean are estimated to have boosted the value of
world fish exports by 5.4 percent to USD 143.9 billion.
Despite a surge of export revenues by developed countries
in the last quarter of 2014, developing countries continue
as frontrunners in the expansion of fish trade, earning
USD 78.7 billion through exports in 2014, 6.3 percent
more than in the previous year. India, Indonesia and
Ecuador benefited from high prices of shrimps; Chile, of
salmon; and Peru of fishmeal and fish oil. Norway, one
of the world’s most important producers, enjoyed record
export revenues in 2014, as did China, already the most
important producer and exporter of seafood. Among the
world’s major importers, deliveries to the United States
were boosted by an improving economic situation and the
strengthening of the US dollar. Meanwhile, imports to the

61FOOD OUTLOOKMAY 2015
FISH A
ND
FISHE
RY
PR
OD
UC
TS
Table 1. World fish market at a glance
Source: FAO Fish Price Index: Norwegian Seafood Council (NSC)Totals may not match due to rounding.
2013 2014estim.
2015f’cast
Change: 2015 over 2014
million tonnes %
WORLD BALANCE
Production 162.8 164.3 168.6 2.6
Capture fisheries 92.6 90.0 90.6 0.7
Aquaculture 70.2 74.3 78.0 5.0
Trade value (exports USD billion)
136.5 143.9 144.5 0.4
Trade volume (live weight) 58.8 59.5 59.7 0.3
Total utilization 162.8 164.3 168.6 2.6
Food 141.0 144.6 147.5 2.0
Feed 16.8 15.0 16.4 9.7
Other uses 5.0 4.8 4.7 -2.1
SUPPLY AND DEMAND INDICATORS
Per caput food consumption:
Food fish (kg/yr) 19.7 20.0 20.1 0.9
From capture fisheries (kg/year) 9.9 9.7 9.5 -2.2
From aquaculture (kg/year) 9.8 10.3 10.6 3.8
FAO FISH PRICE INDEX
(2002-2004=100)2013 2014 2015
Jan-AprChange:
Jan-Apr 2015 over
Jan-Apr 2014 %
148 157 150 -6.6
European Union continued its steady rise, while Japan’s
importance as a seafood importer declined further in 2014.
According to the FAO Fish Price Index, prices were up by
5 percent in 2014, sustained by strong increases of farmed
fish prices, which gain 12 percent, while prices of captured
fishes were barely changed. Across different species, shrimp
traded at high prices throughout 2014, as producers
capitalized on low Thai harvests and buoyant world demand.
Whitefish prices, particularly for cod, also rose significantly
in 2014, as did prices for cephalopods, fishmeal and fish oil.
By contrast, tuna prices declined significantly due to excess
supply, with frozen skipjack prices hitting a 6-year low. Fresh
salmon prices also fell back somewhat from previous highs,
partly reflecting the import ban and a deteriorating economic
situation in the Russian Federation, which intensified
exporter competition for alternative markets. World mackerel
prices fell on increased catches.
The overall outlook for seafood trade in 2015 is
generally positive, although prices are forecast to soften
for some species. More specifically, increasing production
will exert downward pressure on shrimp prices, while
salmon price prospects have been revised downwards due
to expectations of sustained production growth in Norway
and an overreliance on the US market to absorb volumes.
Meanwhile, anchoveta catches are predicted to increase
in 2015, which is good news for the growing number of
aquaculture producers who use anchoveta as feedstuffs
in their operations. Finally, as of early 2015, there are
indications that demand for tuna is picking up and there is
hope it will be sustained in the longer term.
Consumer demand for fish remains strong, with more
people worldwide appreciating the health benefits of
regular fish consumption. Direct human consumption, which
accounts for more than 85 percent of all fish uses, is now
projected to grow by 2 percent to 147.5 million tonnes. This
would result in only a slight increase in per capita fish intake,
from 20.0 kg in 2014 to 20.1 kg in 2015, a consequence
of firm fish product prices and slowing income growth in
several important markets. On the other hand, the expected
recovery in world wild fish catches in 2015 is predicted to
foster a 9 percent rebound in the usage of fish as feed,
which is mostly destined for aquaculture operations.
The FAO Code of Conduct for Responsible Fisheries
will celebrate its twentieth anniversary in 2015. A
groundbreaking and negotiated document, the Code lays
forth principles and standards for national and international
efforts to ensure sustainable production of aquatic living
resources. As a living document, it serves as the basis for
the development of various new instruments to address
new challenges related to areas such as illegal, unreported
and unregulated fishing (IUU) and small-scale fisheries.
SHRIMP
The United States continues to be the target market
for many shrimp producing countries, although import
2009 2010 2011 2012 2013 2014
Jan-Dec (thousand tonnes)
India 20.0 30.3 48.2 66.1 94.2 108.8
Indonesia 69.3 61.1 70.3 74.1 81.2 103.4
Ecuador 61.6 65.0 73.8 81.5 74.7 92.5
Viet Nam 42.3 48.5 45.4 41.2 60.0 73.8
Thailand 192.8 203.4 185.8 136.1 84.2 64.6
China 44.2 48.2 43.0 35.7 32.5 32.5
Mexico 41.1 23.5 30.9 26.3 18.5 20.2
Malaysia 18.4 24.3 29.3 23.5 10.5 17.9
Peru 8.5 7.0 8.3 8.4 9.0 11.8
Honduras 8.7 10.3 10.4 9.1 8.5 8.0
Guyana 8.9 7.8 6.5 9.0 8.7 6.7
Others 36.7 32.0 25.1 24.2 27.3 29.0
Total 552.6 561.5 577.1 535.0 509.3 569.1
Source: NMFS
Table 2. USA shrimp imports, by origin

Ma
rke
t a
sse
ssm
en
ts
62 FOOD OUTLOOKMAY 2015
demand has been weak since January 2015 due to the
large unsold stocks imported in 2014. Primary demand in
2015 is also poor in the European Union and in Japan,
which is exerting downward pressure on shrimp prices.
Local inventories, particularly in the United States, may
decrease if shrimp prices to the end consumer come down
over the rest of the year, but many traders in the market
are unable to reduce selling prices as they bought products
at higher prices last year. In the United States, demand
for Indian shrimp may suffer as a result of the higher
tariff rates imposed following the latest review by the US
Department of Commerce, while those from Viet Nam may
rise due to reduced tariffs. Meanwhile, the weakening Euro
is likely to reduce European Union imports, while Japanese
Figure 2. Shrimp prices (16-20 count) in main wholesale markets
2
4
6
8
10
201520142013201220112010200920082007
Japan (Indian white, Tokio)
USA (Gulf brown, New York)
USD per lb.
Figure 3. Prices of white shrimp on the Japanese market
5
10
15
20
25
30
201520142013201220112010200920082007
USD per kg.
16/20 pc/lb 31/40 pc/lb
2009 2010 2011 2012 2013 2014
Jan-Dec (thousand tonnes)
IMPORTS
Ecuador 74.7 80.7 97.3 92.2 82.9 93.1
India 65.3 60.0 59.5 60.6 66.4 83.2
Argentina 47.1 55.5 62.1 55.0 59.9 66.2
Greenland 74.3 72.6 68.3 61.2 60.1 55.1
Viet Nam 38.1 43.2 45.5 35.7 37.9 49.7
Denmark 46.3 49.5 44.8 43.4 47.1 44.0
Bangladesh 39.0 41.2 43.4 42.1 42.3 40.7
Canada 31.4 30.5 27.8 30.1 31.4 35.8
Netherlands 36.9 41.1 44.1 40.8 35.1 35.5
China 40.2 41.0 38.8 36.2 37.4 28.8
Spain 22.1 26.1 24.8 28.4 23.3 25.0
Belgium 24.3 23.4 27.7 21.6 22.9 22.7
Germany 18.9 21.7 22.1 19.8 19.1 18.8
Thailand 52.8 68.2 63.1 53.7 31.9 18.2
Indonesia 26.2 23.1 18.9 10.8 12.1 15.6
Morocco 14.0 14.5 15.1 13.1 13.3 15.4
Nicaragua 8.9 8.5 9.7 11.5 11.3 15.2
Others 163.1 147.9 137.1 126.6 123.7 128.0
Grand Total 823.5 848.6 850.0 782.6 758.0 790.9
Total Intra Imports 187.7 202.9 202.1 188.7 185.4 183.6
Total Extra Imports 635.8 645.7 647.9 593.9 572.6 607.3
EXPORTS
Grand Total 362.2 373.9 370.2 335.3 326.8 316.3
Total Intra Exports 261.4 275.0 284.4 258.0 253.1 245.8
Total Extra Exports 100.8 98.9 85.8 77.3 73.7 70.5
Table 3. EU-28 shrimp imports, by origin
importers are also likely to be selective due to the weak
yen. This would leave only the US market to absorb much
of the excess supplies. On the exporter side, the weakening
of demand may result in more conservative stocking of
ponds by farmers in developing countries, although world
aquaculture experts expect increased farmed shrimp
production overall for 2015, following a 6 percent increase
in 2014. Viet Nam and Indonesia will continue to focus
more on aquaculture of vannamei species. In India and
Thailand, meanwhile, the first harvests of the season could
be delayed due to a late stockings of ponds.
TUNA
Catches of yellowfin and skipjack in the Pacific have
increased since July 2014, but import demand from
Southeast Asian canners has not followed suit. In the
Atlantic Ocean, the ICCAT FAD closure ended on 28
February 2015 and catches have since improved, with
Source: EUROSTAT
Source: INFOFISH
Source: INFOFISH

63FOOD OUTLOOKMAY 2015
FISH A
ND
FISHE
RY
PR
OD
UC
TS
Figure 5. Oyster prices, origin: Ireland/France
1.5
2.5
3.5
4.5
5.5
2015201420132012201120102009
Euro per kg.
yellowfin making up the majority of landings. Prices of both
skipjack and yellowfin have declined due to limited demand
from the canneries, although in early 2015, prices of
frozen skipjack for delivery to Thailand stabilized at around
USD 1 000 per tonne. Canned tuna prices are unlikely to
weaken further in the short-term, especially as demand in
major markets appears to be strengthening once again.
For instance, in January 2015, imports of canned tuna by
Australia, Japan and the United States were respectively
up by 9 percent, 22 percent and 5 percent compared with
the same month in 2014. Summer demand for fresh tuna
in the United States is also expected to firm. Meanwhile,
in the price-sensitive European Union markets, the recent
steep increase in the Southeast Asian fresh tuna export
price is likely to negatively impact consumer demand for
fresh product. European Union demand for tuna from the
Maldives has increased following the ban on all imports of
fishery products from competing Sri Lanka due to the non-
compliance of IUU regulations.
GROUNDFISH
Global cod landings have been rising for the past decade,
and in 2014 total catches came to 1.8 million tonnes.
Recently, strong demand has seen price increases
accompany this trend. For Norway, 2014 was the best
ever year for whitefish exports, mainly because of higher
prices, which boosted the country’s whitefish exports to
442 000 tonnes, worth USD 1.9 billion. However, the cod
season was off to a slow start in early 2015 and modest
reductions in global cod landings for the year are expected.
Cod prices are forecast to rise during the first half of 2015
before stabilizing. The Alaska pollock season opened in
January 2015 with a larger quota than in 2014. The total
Bering Sea quota for 2015 is 1.31 million tonnes, 3 percent
higher than in 2014, with around 40 percent of this
allocated to the A season, which is set to end in early June.
The depreciation of the Euro against the US dollar has had
a major effect on Alaska pollock prices, making them far
more expensive for European buyers in domestic currency.
In the hake market, China is emerging as the largest
supplier to the Russian Federation following the Russian
import ban against specific countries, while exports from
Canada and the United States to the same market have
dropped dramatically. Argentinean hake is being diverted
from the European Union to the United States, where
demand is very strong. Foreign exchange fluctuations
will affect trade in 2015, particularly with respect to the
strengthening Krone and the weak Ruble that is making
Russian groundfish easier to sell.
CEPHALOPODS
Total octopus production in 2014 rose to about 370 000
tonnes, the highest level since 2009. The main producer
was China, with over 120 000 tonnes. Imports by Japan
were down, but those directed to Italy and Spain
increased. Octopus supplies might be a little tighter in
2015, particularly in Japan, and prices are expected to
rise somewhat. Global squid production appears to be
declining slightly, and Argentinean squid exports dropped
slightly to 493 244 tonnes (-2.7 percent) in 2014. Tighter
supplies also meant Japan imported 11.2 percent less
squid in 2014. European Union imports also declined
somewhat, with the United States the only major squid
Figure 4. CFR prices canned tuna (USA and Europe)
10
20
30
40
50
201520142013201220112010200920082007
USD per carton
Europe United States
Source: INFOFISH 48x6.5 oz Europe, 48x6 oz USA, chunk, origin Thailand
Source: GLOBEFISH European Price Report
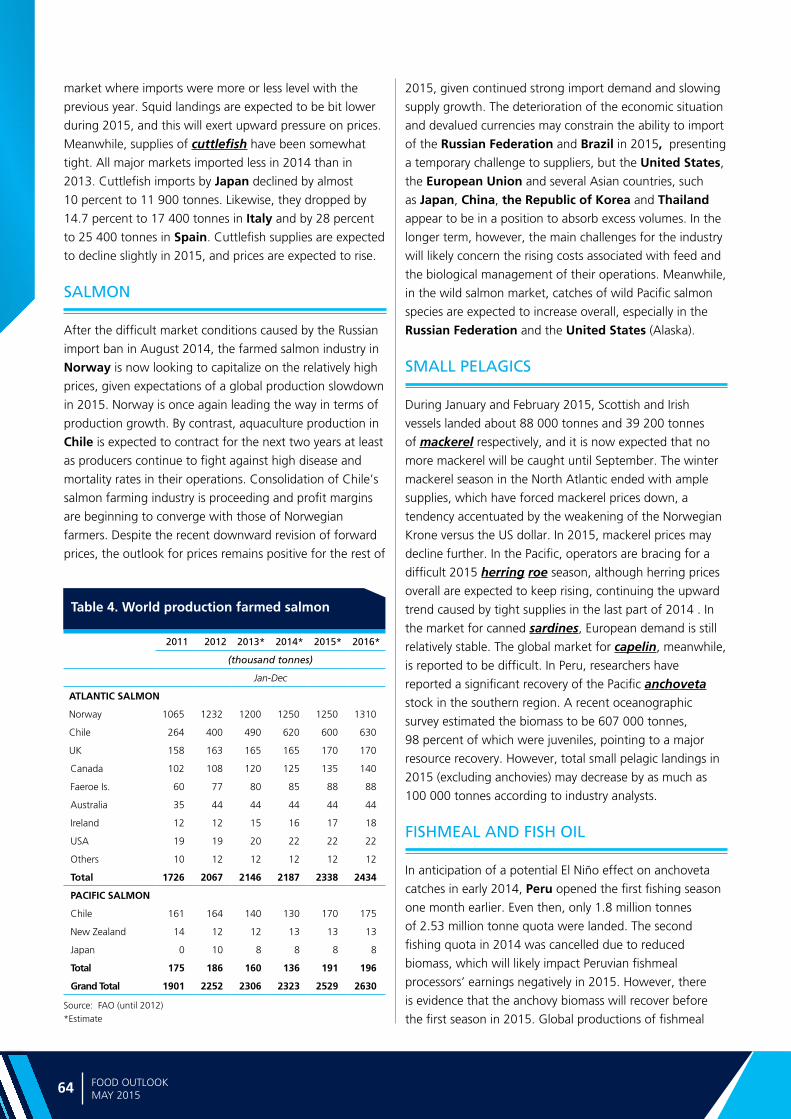
Ma
rke
t a
sse
ssm
en
ts
64 FOOD OUTLOOKMAY 2015
Source: FAO (until 2012)*Estimate
Table 4. World production farmed salmon
2011 2012 2013* 2014* 2015* 2016*
(thousand tonnes)
Jan-Dec
ATLANTIC SALMON
Norway 1065 1232 1200 1250 1250 1310
Chile 264 400 490 620 600 630
UK 158 163 165 165 170 170
Canada 102 108 120 125 135 140
Faeroe Is. 60 77 80 85 88 88
Australia 35 44 44 44 44 44
Ireland 12 12 15 16 17 18
USA 19 19 20 22 22 22
Others 10 12 12 12 12 12
Total 1726 2067 2146 2187 2338 2434
PACIFIC SALMON
Chile 161 164 140 130 170 175
New Zealand 14 12 12 13 13 13
Japan 0 10 8 8 8 8
Total 175 186 160 136 191 196
Grand Total 1901 2252 2306 2323 2529 2630
market where imports were more or less level with the
previous year. Squid landings are expected to be bit lower
during 2015, and this will exert upward pressure on prices.
Meanwhile, supplies of cuttlefish have been somewhat
tight. All major markets imported less in 2014 than in
2013. Cuttlefish imports by Japan declined by almost
10 percent to 11 900 tonnes. Likewise, they dropped by
14.7 percent to 17 400 tonnes in Italy and by 28 percent
to 25 400 tonnes in Spain. Cuttlefish supplies are expected
to decline slightly in 2015, and prices are expected to rise.
SALMON
After the difficult market conditions caused by the Russian
import ban in August 2014, the farmed salmon industry in
Norway is now looking to capitalize on the relatively high
prices, given expectations of a global production slowdown
in 2015. Norway is once again leading the way in terms of
production growth. By contrast, aquaculture production in
Chile is expected to contract for the next two years at least
as producers continue to fight against high disease and
mortality rates in their operations. Consolidation of Chile’s
salmon farming industry is proceeding and profit margins
are beginning to converge with those of Norwegian
farmers. Despite the recent downward revision of forward
prices, the outlook for prices remains positive for the rest of
2015, given continued strong import demand and slowing
supply growth. The deterioration of the economic situation
and devalued currencies may constrain the ability to import
of the Russian Federation and Brazil in 2015, presenting
a temporary challenge to suppliers, but the United States,
the European Union and several Asian countries, such
as Japan, China, the Republic of Korea and Thailand
appear to be in a position to absorb excess volumes. In the
longer term, however, the main challenges for the industry
will likely concern the rising costs associated with feed and
the biological management of their operations. Meanwhile,
in the wild salmon market, catches of wild Pacific salmon
species are expected to increase overall, especially in the
Russian Federation and the United States (Alaska).
SMALL PELAGICS
During January and February 2015, Scottish and Irish
vessels landed about 88 000 tonnes and 39 200 tonnes
of mackerel respectively, and it is now expected that no
more mackerel will be caught until September. The winter
mackerel season in the North Atlantic ended with ample
supplies, which have forced mackerel prices down, a
tendency accentuated by the weakening of the Norwegian
Krone versus the US dollar. In 2015, mackerel prices may
decline further. In the Pacific, operators are bracing for a
difficult 2015 herring roe season, although herring prices
overall are expected to keep rising, continuing the upward
trend caused by tight supplies in the last part of 2014 . In
the market for canned sardines, European demand is still
relatively stable. The global market for capelin, meanwhile,
is reported to be difficult. In Peru, researchers have
reported a significant recovery of the Pacific anchoveta
stock in the southern region. A recent oceanographic
survey estimated the biomass to be 607 000 tonnes,
98 percent of which were juveniles, pointing to a major
resource recovery. However, total small pelagic landings in
2015 (excluding anchovies) may decrease by as much as
100 000 tonnes according to industry analysts.
FISHMEAL AND FISH OIL
In anticipation of a potential El Niño effect on anchoveta
catches in early 2014, Peru opened the first fishing season
one month earlier. Even then, only 1.8 million tonnes
of 2.53 million tonne quota were landed. The second
fishing quota in 2014 was cancelled due to reduced
biomass, which will likely impact Peruvian fishmeal
processors’ earnings negatively in 2015. However, there
is evidence that the anchovy biomass will recover before
the first season in 2015. Global productions of fishmeal
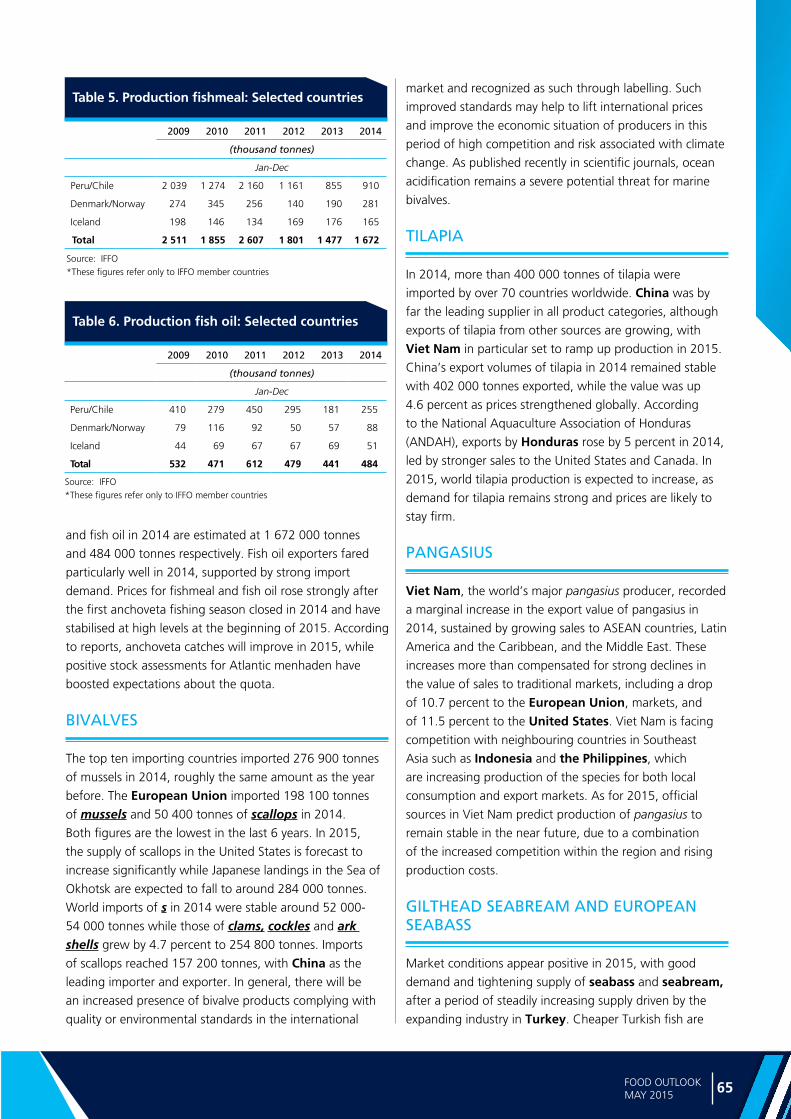
65FOOD OUTLOOKMAY 2015
FISH A
ND
FISHE
RY
PR
OD
UC
TS
Source: IFFO*These figures refer only to IFFO member countries
Table 5. Production fishmeal: Selected countries
2009 2010 2011 2012 2013 2014
(thousand tonnes)
Jan-Dec
Peru/Chile 2 039 1 274 2 160 1 161 855 910
Denmark/Norway 274 345 256 140 190 281
Iceland 198 146 134 169 176 165
Total 2 511 1 855 2 607 1 801 1 477 1 672
and fish oil in 2014 are estimated at 1 672 000 tonnes
and 484 000 tonnes respectively. Fish oil exporters fared
particularly well in 2014, supported by strong import
demand. Prices for fishmeal and fish oil rose strongly after
the first anchoveta fishing season closed in 2014 and have
stabilised at high levels at the beginning of 2015. According
to reports, anchoveta catches will improve in 2015, while
positive stock assessments for Atlantic menhaden have
boosted expectations about the quota.
BIVALVES
The top ten importing countries imported 276 900 tonnes
of mussels in 2014, roughly the same amount as the year
before. The European Union imported 198 100 tonnes
of mussels and 50 400 tonnes of scallops in 2014.
Both figures are the lowest in the last 6 years. In 2015,
the supply of scallops in the United States is forecast to
increase significantly while Japanese landings in the Sea of
Okhotsk are expected to fall to around 284 000 tonnes.
World imports of s in 2014 were stable around 52 000-
54 000 tonnes while those of clams, cockles and ark shells grew by 4.7 percent to 254 800 tonnes. Imports
of scallops reached 157 200 tonnes, with China as the
leading importer and exporter. In general, there will be
an increased presence of bivalve products complying with
quality or environmental standards in the international
Source: IFFO*These figures refer only to IFFO member countries
Table 6. Production fish oil: Selected countries
2009 2010 2011 2012 2013 2014
(thousand tonnes)
Jan-Dec
Peru/Chile 410 279 450 295 181 255
Denmark/Norway 79 116 92 50 57 88
Iceland 44 69 67 67 69 51
Total 532 471 612 479 441 484
market and recognized as such through labelling. Such
improved standards may help to lift international prices
and improve the economic situation of producers in this
period of high competition and risk associated with climate
change. As published recently in scientific journals, ocean
acidification remains a severe potential threat for marine
bivalves.
TILAPIA
In 2014, more than 400 000 tonnes of tilapia were
imported by over 70 countries worldwide. China was by
far the leading supplier in all product categories, although
exports of tilapia from other sources are growing, with
Viet Nam in particular set to ramp up production in 2015.
China’s export volumes of tilapia in 2014 remained stable
with 402 000 tonnes exported, while the value was up
4.6 percent as prices strengthened globally. According
to the National Aquaculture Association of Honduras
(ANDAH), exports by Honduras rose by 5 percent in 2014,
led by stronger sales to the United States and Canada. In
2015, world tilapia production is expected to increase, as
demand for tilapia remains strong and prices are likely to
stay firm.
PANGASIUS
Viet Nam, the world’s major pangasius producer, recorded
a marginal increase in the export value of pangasius in
2014, sustained by growing sales to ASEAN countries, Latin
America and the Caribbean, and the Middle East. These
increases more than compensated for strong declines in
the value of sales to traditional markets, including a drop
of 10.7 percent to the European Union, markets, and
of 11.5 percent to the United States. Viet Nam is facing
competition with neighbouring countries in Southeast
Asia such as Indonesia and the Philippines, which
are increasing production of the species for both local
consumption and export markets. As for 2015, official
sources in Viet Nam predict production of pangasius to
remain stable in the near future, due to a combination
of the increased competition within the region and rising
production costs.
GILTHEAD SEABREAM AND EUROPEAN SEABASS
Market conditions appear positive in 2015, with good
demand and tightening supply of seabass and seabream, after a period of steadily increasing supply driven by the
expanding industry in Turkey. Cheaper Turkish fish are

Ma
rke
t a
sse
ssm
en
ts
66 FOOD OUTLOOKMAY 2015
increasingly present in many important markets, particularly
the Russian Federation. Turkish producers will now seek
to take advantage of the higher prices and increase their
margins through marketing efforts, value addition and
technical improvements at the farm level. The bass and
bream aquaculture sector in Greece, amidst ongoing debt
restructuring activities, must now follow a similar direction,
Figure 6. Prices of seabass and seabream in Italy, origin Greece
3
4
5
6
7
201520142013201220112010200920082007
Euro per kg.
Seabream Seabass
although its current focus on traditional European markets
may prove somewhat of an obstacle. In the medium term,
falling harvest volumes in Greece and Turkey suggests
international prices are likely to strengthen further, which
will also benefit other producers, such as Spain.
LOBSTER
Lobster is one of the most expensive traded fishery
products, with an average unit value is USD 20 per kg. It
is of special importance for the livelihoods of particular
regions, such as the Caribbean. In 2014, lobster
imports by the United States came to 53 000 tonnes
worth over USD 1 billion, both record figures. After
the United States, the second major market for lobster
is the European Union, which sources the product
mainly from the United States and Canada. The positive
economic situation in the United States is expected
to strengthen demand for both domestic produce and
imports this year, and prices are likely to rise. Imports
by the European Union are also expected to grow,
following tariff reductions on lobster from Canada,
although the weakness of the Euro will impact the
market. The management efforts in the Caribbean lobster
fisheries will result in positive effects on stock levels and
thus also on world trade in coming years.
66 FOOD OUTLOOKMAY 2015
Source: GLOBEFISH European Price Report: Seabass fresh whole 300-450 gr/pc – Seabream fresh whole 300-450 gr/pc


SPEC
IAL
FEAT
URES

Spe
cial fe
atu
res
69FOOD OUTLOOKMAY 2015
HAS PRICE VOLATILITY CHANGED?Contributed by Friederike Greb and Adam Prakash, Economists, FAO
WHY CHANGING VOLATILITY MATTERS
Prices of agricultural commodities are naturally volatile
owing to their dependence on unpredictable factors like
the weather. Periods of low volatility pose little threat,
which cannot be said of periods of high volatility. Excessive
agricultural price volatility can have severe impacts on
governments, in terms of financing imports, export earning
risks and also terms-of-trade. Large impacts are also felt by
farmers and consumers, especially in developing countries,
where about 2 billion people live off small farms1 and
spend large shares of their income on food items. Excessive
price fluctuations do not allow stabilizing farm income or
consumption, especially when coping mechanisms (e.g.
storage, savings, access to credit and insurance) are not
available. Thus, they can pose a serious threat to food
security. What is more, vulnerable households are left with
little scope to mitigate unusually high prices other than by
lessening the intake of nutritious food, dropping out of
school, lowering access to healthcare or distress sales of
land and livestock. These responses can result in poverty
traps and, accordingly, have long-term consequences.
Producers are affected, too. As sellers of commodities, high
volatility brings with it considerable downside price risk,
which affects planting decisions and undermines agricultural
investment where it is needed most. In addition, increasing
volatility makes it difficult for farmers to extract price signals
in production response.
Not only does high volatility pose a threat to the
vulnerable, but changes in volatility can have consequences.
This is because adjustments, often costly, are induced in
households, in traders’ trading strategies and also in policy-
making. The period of elevated food price volatility starting
in 2006/07 prompted a range of policy responses. These
included export restrictions, reduction in import levies,
removal of value added tax on food as well as targeted
cash transfers and food subsidies. Most of them were ad
hoc and very costly fiscally2, and hence short lived.3
1 http://www.ifad.org/operations/food/farmer.htm
2 Also some measures were costly in terms of welfare impacts.
3 Per Pinstrup-Andersen. 2015. How do governments respond to food price
However, some countries’ policies reflected longer-term
concerns about price volatility. For example, Nigeria
earmarked USD 280 million for development of 33 silo
complexes to store grains.4 Senegal signed a five-year
contract with India to secure the purchase of 600 000
metric tonnes of rice annually.5 Saudi Arabia launched an
initiative that provided incentives for the private sector to
undertake long term investments in agricultural sectors
abroad.6
For those making decisions based on the level of price
volatility – farmers, actors along the value chain, traders,
consumers and governments – it is indispensable to have
a good estimate of it. Consequently, several questions are
posited: where are we now in terms of agricultural price
volatility? Prices appear to be less volatile over the past two
years relative to the 2006/07 to 2011/12 period; therefore,
are we back to a more normal level of volatility?
Should policies be thus re-orientated? Finding that we
are in a different volatility regime now from what it was
three years ago does not imply that we will not enter a
different regime tomorrow – we must wait for sufficient
price observations to determine whether a regime change
has taken place. As long as the drivers of price volatility
are not fully understood, it is impossible to anticipate the
moment at which volatility could change. Nonetheless,
investigating the degree to which volatility has changed
precedes any analysis of the causes of higher price volatility
and is, therefore, essential for policy orientation. In the
absence of perfect prediction, flexibility in policy-making
is needed. Needless to say, measures to improve market
functioning and strengthen resilience to shocks7
will always be vital regardless of the regime.
MEASURING VOLATILITY: ISSUES AND CHALLENGES
Before distinguishing between different price volatility
regimes, it is important to clarify what we mean by
volatility and to highlight some conceptual difficulties. It is
indisputable that price volatility measures price fluctuations.
However, a trader in Chicago will probably give a different
assessment of wheat price volatility than a smallholder
farmer in Pakistan or a baker in Niger. Whereas they might
volatility? UNU-WIDER Policy Brief.
4 http://www.nigeriasilostransactions.com/background
5 Shane Bryan. 2013. A cacophony of policy responses: Evidence from fourteen countries during the 2007/08 food price crisis, UNU-WIDER Working Paper.
6 http://www.isdb.org/irj/go/km/docs/documents/IDBDevelopments/Internet/English/IDB/CM/Publications/IDB _AnnualSymposium/20thSymposium/8-AbdullaAlobaid.pdf
7 Adam Prakash. 2010. Price Volatility in Agricultural Markets, FAO Policy Brief.
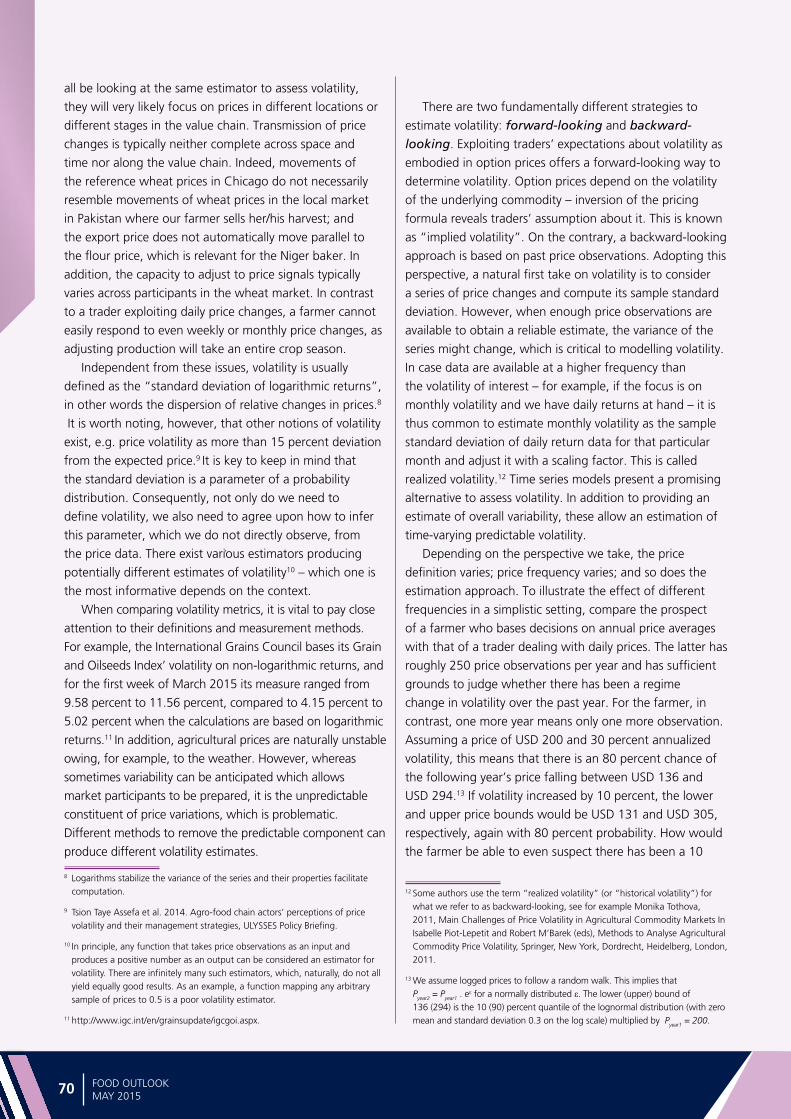
Spe
cia
l fe
atu
res
70 FOOD OUTLOOKMAY 2015
all be looking at the same estimator to assess volatility,
they will very likely focus on prices in different locations or
different stages in the value chain. Transmission of price
changes is typically neither complete across space and
time nor along the value chain. Indeed, movements of
the reference wheat prices in Chicago do not necessarily
resemble movements of wheat prices in the local market
in Pakistan where our farmer sells her/his harvest; and
the export price does not automatically move parallel to
the flour price, which is relevant for the Niger baker. In
addition, the capacity to adjust to price signals typically
varies across participants in the wheat market. In contrast
to a trader exploiting daily price changes, a farmer cannot
easily respond to even weekly or monthly price changes, as
adjusting production will take an entire crop season.
Independent from these issues, volatility is usually
defined as the “standard deviation of logarithmic returns”,
in other words the dispersion of relative changes in prices.8
It is worth noting, however, that other notions of volatility
exist, e.g. price volatility as more than 15 percent deviation
from the expected price.9 It is key to keep in mind that
the standard deviation is a parameter of a probability
distribution. Consequently, not only do we need to
define volatility, we also need to agree upon how to infer
this parameter, which we do not directly observe, from
the price data. There exist various estimators producing
potentially different estimates of volatility10 – which one is
the most informative depends on the context.
When comparing volatility metrics, it is vital to pay close
attention to their definitions and measurement methods.
For example, the International Grains Council bases its Grain
and Oilseeds Index’ volatility on non-logarithmic returns, and
for the first week of March 2015 its measure ranged from
9.58 percent to 11.56 percent, compared to 4.15 percent to
5.02 percent when the calculations are based on logarithmic
returns.11 In addition, agricultural prices are naturally unstable
owing, for example, to the weather. However, whereas
sometimes variability can be anticipated which allows
market participants to be prepared, it is the unpredictable
constituent of price variations, which is problematic.
Different methods to remove the predictable component can
produce different volatility estimates.
8 Logarithms stabilize the variance of the series and their properties facilitate computation.
9 Tsion Taye Assefa et al. 2014. Agro-food chain actors’ perceptions of price volatility and their management strategies, ULYSSES Policy Briefing.
10 In principle, any function that takes price observations as an input and produces a positive number as an output can be considered an estimator for volatility. There are infinitely many such estimators, which, naturally, do not all yield equally good results. As an example, a function mapping any arbitrary sample of prices to 0.5 is a poor volatility estimator.
11 http://www.igc.int/en/grainsupdate/igcgoi.aspx.
There are two fundamentally different strategies to
estimate volatility: forward-looking and backward-looking. Exploiting traders’ expectations about volatility as
embodied in option prices offers a forward-looking way to
determine volatility. Option prices depend on the volatility
of the underlying commodity – inversion of the pricing
formula reveals traders’ assumption about it. This is known
as “implied volatility”. On the contrary, a backward-looking
approach is based on past price observations. Adopting this
perspective, a natural first take on volatility is to consider
a series of price changes and compute its sample standard
deviation. However, when enough price observations are
available to obtain a reliable estimate, the variance of the
series might change, which is critical to modelling volatility.
In case data are available at a higher frequency than
the volatility of interest – for example, if the focus is on
monthly volatility and we have daily returns at hand – it is
thus common to estimate monthly volatility as the sample
standard deviation of daily return data for that particular
month and adjust it with a scaling factor. This is called
realized volatility.12 Time series models present a promising
alternative to assess volatility. In addition to providing an
estimate of overall variability, these allow an estimation of
time-varying predictable volatility.
Depending on the perspective we take, the price
definition varies; price frequency varies; and so does the
estimation approach. To illustrate the effect of different
frequencies in a simplistic setting, compare the prospect
of a farmer who bases decisions on annual price averages
with that of a trader dealing with daily prices. The latter has
roughly 250 price observations per year and has sufficient
grounds to judge whether there has been a regime
change in volatility over the past year. For the farmer, in
contrast, one more year means only one more observation.
Assuming a price of USD 200 and 30 percent annualized
volatility, this means that there is an 80 percent chance of
the following year’s price falling between USD 136 and
USD 294.13 If volatility increased by 10 percent, the lower
and upper price bounds would be USD 131 and USD 305,
respectively, again with 80 percent probability. How would
the farmer be able to even suspect there has been a 10
12 Some authors use the term “realized volatility” (or “historical volatility”) for what we refer to as backward-looking, see for example Monika Tothova, 2011, Main Challenges of Price Volatility in Agricultural Commodity Markets In Isabelle Piot-Lepetit and Robert M’Barek (eds), Methods to Analyse Agricultural Commodity Price Volatility, Springer, New York, Dordrecht, Heidelberg, London, 2011.
13 We assume logged prices to follow a random walk. This implies that Pyear2 = Pyear1 . e
ε for a normally distributed ε. The lower (upper) bound of 136 (294) is the 10 (90) percent quantile of the lognormal distribution (with zero mean and standard deviation 0.3 on the log scale) multiplied by Pyear1 = 200.
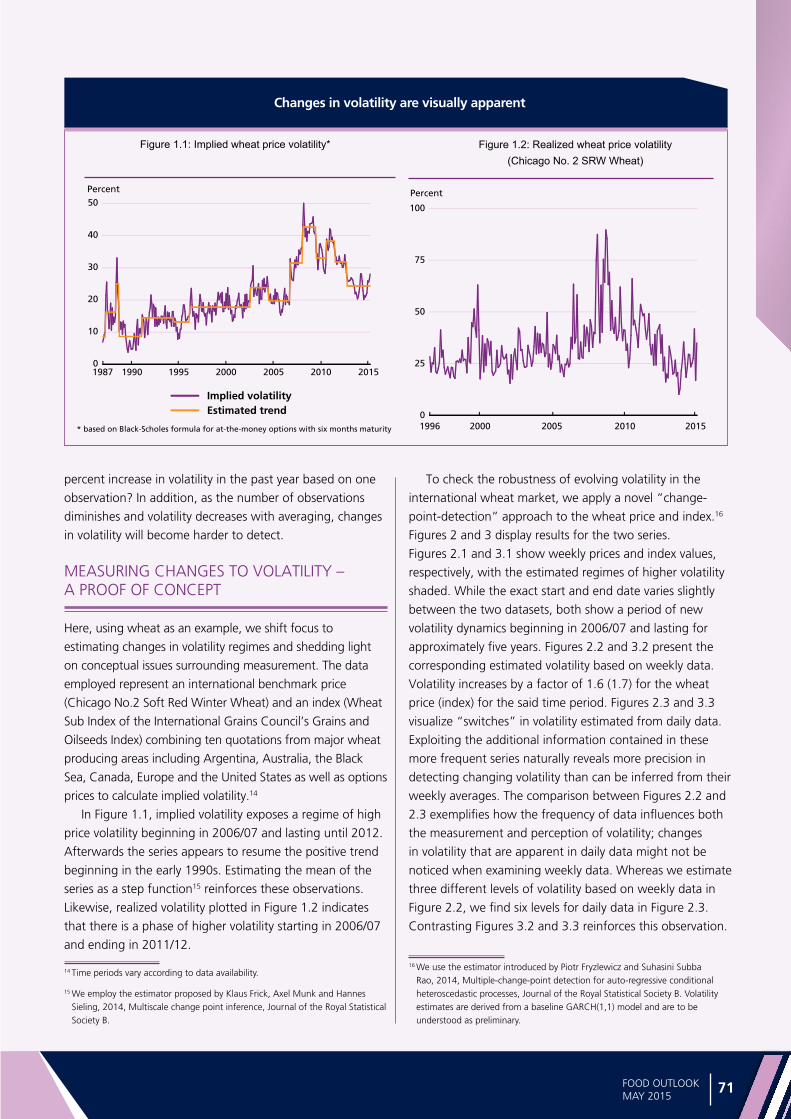
Spe
cial fe
atu
res
71FOOD OUTLOOKMAY 2015
percent increase in volatility in the past year based on one
observation? In addition, as the number of observations
diminishes and volatility decreases with averaging, changes
in volatility will become harder to detect.
MEASURING CHANGES TO VOLATILITY – A PROOF OF CONCEPT
Here, using wheat as an example, we shift focus to
estimating changes in volatility regimes and shedding light
on conceptual issues surrounding measurement. The data
employed represent an international benchmark price
(Chicago No.2 Soft Red Winter Wheat) and an index (Wheat
Sub Index of the International Grains Council’s Grains and
Oilseeds Index) combining ten quotations from major wheat
producing areas including Argentina, Australia, the Black
Sea, Canada, Europe and the United States as well as options
prices to calculate implied volatility.14
In Figure 1.1, implied volatility exposes a regime of high
price volatility beginning in 2006/07 and lasting until 2012.
Afterwards the series appears to resume the positive trend
beginning in the early 1990s. Estimating the mean of the
series as a step function15 reinforces these observations.
Likewise, realized volatility plotted in Figure 1.2 indicates
that there is a phase of higher volatility starting in 2006/07
and ending in 2011/12.
14 Time periods vary according to data availability.
15 We employ the estimator proposed by Klaus Frick, Axel Munk and Hannes Sieling, 2014, Multiscale change point inference, Journal of the Royal Statistical Society B.
Changes in volatility are visually apparent
To check the robustness of evolving volatility in the
international wheat market, we apply a novel “change-
point-detection” approach to the wheat price and index.16
Figures 2 and 3 display results for the two series.
Figures 2.1 and 3.1 show weekly prices and index values,
respectively, with the estimated regimes of higher volatility
shaded. While the exact start and end date varies slightly
between the two datasets, both show a period of new
volatility dynamics beginning in 2006/07 and lasting for
approximately five years. Figures 2.2 and 3.2 present the
corresponding estimated volatility based on weekly data.
Volatility increases by a factor of 1.6 (1.7) for the wheat
price (index) for the said time period. Figures 2.3 and 3.3
visualize “switches” in volatility estimated from daily data.
Exploiting the additional information contained in these
more frequent series naturally reveals more precision in
detecting changing volatility than can be inferred from their
weekly averages. The comparison between Figures 2.2 and
2.3 exemplifies how the frequency of data influences both
the measurement and perception of volatility; changes
in volatility that are apparent in daily data might not be
noticed when examining weekly data. Whereas we estimate
three different levels of volatility based on weekly data in
Figure 2.2, we find six levels for daily data in Figure 2.3.
Contrasting Figures 3.2 and 3.3 reinforces this observation.
16 We use the estimator introduced by Piotr Fryzlewicz and Suhasini Subba Rao, 2014, Multiple-change-point detection for auto-regressive conditional heteroscedastic processes, Journal of the Royal Statistical Society B. Volatility estimates are derived from a baseline GARCH(1,1) model and are to be understood as preliminary.
Figure 1.1: Implied wheat price volatility* Figure 1.2: Realized wheat price volatility (Chicago No. 2 SRW Wheat)
0
10
20
30
40
50
2015201020052000199519901987
Percent
Implied volatility
* based on Black-Scholes formula for at-the-money options with six months maturity
Estimated trend 0
25
50
75
100
20152010200520001996
Percent
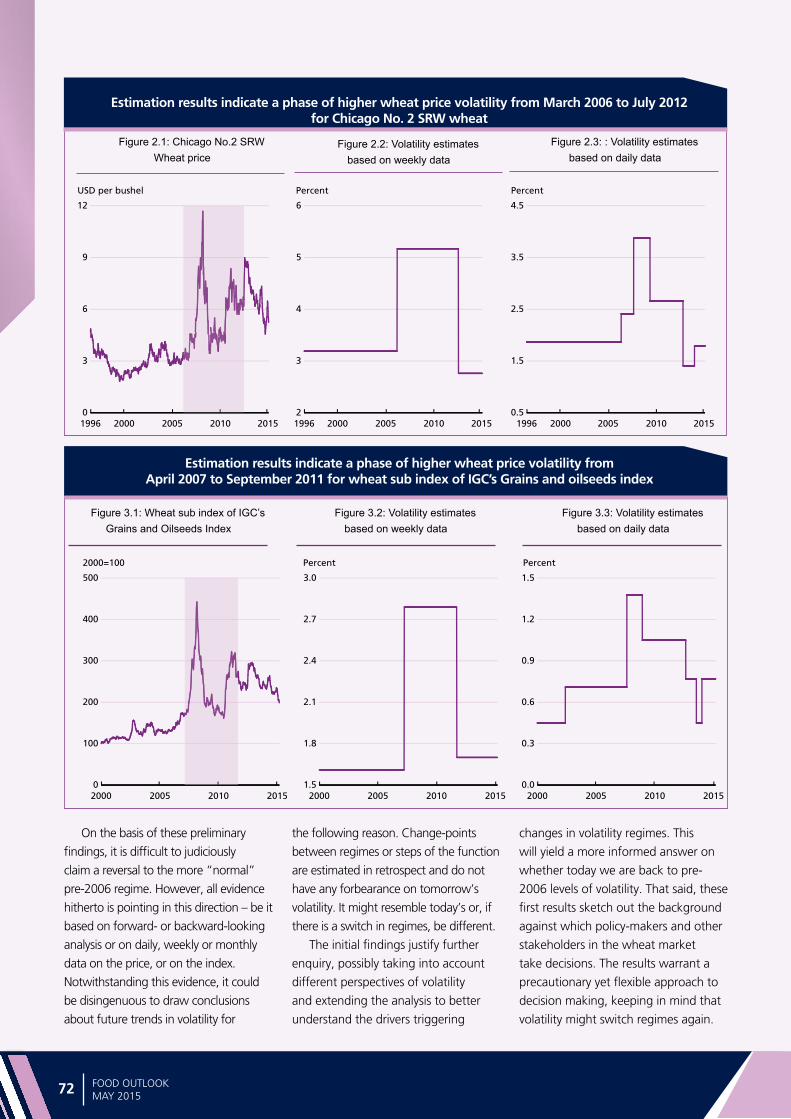
Spe
cia
l fe
atu
res
72 FOOD OUTLOOKMAY 2015
Estimation results indicate a phase of higher wheat price volatility from March 2006 to July 2012 for Chicago No. 2 SRW wheat
Estimation results indicate a phase of higher wheat price volatility from April 2007 to September 2011 for wheat sub index of IGC’s Grains and oilseeds index
Figure 2.1: Chicago No.2 SRW Wheat price
Figure 3.1: Wheat sub index of IGC’s Grains and Oilseeds Index
Figure 2.2: Volatility estimates based on weekly data
Figure 2.3: : Volatility estimates based on daily data
Figure 3.2: Volatility estimates based on weekly data
Figure 3.3: Volatility estimates based on daily data
On the basis of these preliminary
findings, it is difficult to judiciously
claim a reversal to the more “normal”
pre-2006 regime. However, all evidence
hitherto is pointing in this direction – be it
based on forward- or backward-looking
analysis or on daily, weekly or monthly
data on the price, or on the index.
Notwithstanding this evidence, it could
be disingenuous to draw conclusions
about future trends in volatility for
the following reason. Change-points
between regimes or steps of the function
are estimated in retrospect and do not
have any forbearance on tomorrow’s
volatility. It might resemble today’s or, if
there is a switch in regimes, be different.
The initial findings justify further
enquiry, possibly taking into account
different perspectives of volatility
and extending the analysis to better
understand the drivers triggering
changes in volatility regimes. This
will yield a more informed answer on
whether today we are back to pre-
2006 levels of volatility. That said, these
first results sketch out the background
against which policy-makers and other
stakeholders in the wheat market
take decisions. The results warrant a
precautionary yet flexible approach to
decision making, keeping in mind that
volatility might switch regimes again.
Figure 2.3: Volatility estimates based on daily data
Figure 3.3: Volatility estimates based on daily data
2
3
4
5
6
201520102005200019960.5
1.5
2.5
3.5
4.5
201520102005200019960
3
6
9
12
20152010200520001996
USD per bushel Percent Percent
1.5
1.8
2.1
2.4
2.7
3.0
20152010200520000.0
0.3
0.6
0.9
1.2
1.5
20152010200520000
100
200
300
400
500
2015201020052000
2000=100 Percent Percent

changes in volatility regimes. This
will yield a more informed answer on
whether today we are back to pre-
2006 levels of volatility. That said, these
first results sketch out the background
against which policy-makers and other
stakeholders in the wheat market
take decisions. The results warrant a
precautionary yet flexible approach to
decision making, keeping in mind that
volatility might switch regimes again.
Figure 2.3: Volatility estimates based on daily data
Figure 3.3: Volatility estimates based on daily data

74 75
MA
JOR
POLI
CY
DEV
ELO
PMEN
TS
MAR
KET
POLIC
Y
DEVE
LOPM
ENTS

Ma
jor p
olicy d
eve
lop
me
nts
74 75FOOD OUTLOOKMAY 2015
GRA
INS:
M
AJO
R PO
LICY
DEV
ELO
PMEN
TS:
OCT
OBE
R 2
014
TO M
ID-A
PRIL
201
5*
CO
UN
TRY
PRO
DU
CT
DA
TEPO
LIC
Y C
ATE
GO
RY
/INST
RU
MEN
TD
ESC
RIP
TIO
N
Arg
enti
na
Wh
eat
Oct
14
Exp
ort
qu
ota
Au
tho
rize
d t
he
exp
ort
of
400
000
ton
nes
of
wh
eat
and
100
000
to
nn
es o
f w
hea
t fl
ou
r fr
om
th
e 20
13/1
4 h
arve
st.
Mai
zeO
ct 1
4Ex
po
rt q
uo
taA
uth
ori
zed
th
e ex
po
rt o
f 50
0 00
0 to
nn
es o
f m
aize
fro
m t
he
2013
/14
har
vest
.
Mai
zeN
ov
14Ex
po
rt q
uo
taA
uth
ori
zed
th
e ex
po
rt o
f 8
mill
ion
to
nn
es o
f th
e fu
ture
mai
ze c
rop
, to
be
gat
her
ed f
rom
Mar
ch. T
he
qu
ota
to
go
into
eff
ect
as o
f 15
Mar
ch 2
015.
Wh
eat
Dec
14
Exp
ort
qu
ota
Ap
pro
ved
an
ad
dit
ion
al 1
mill
ion
to
nn
es o
f 20
14/1
5 w
hea
t an
d w
hea
t fl
ou
r fo
r ex
po
rt, e
ffec
tive
1
Jan
uar
y 20
15.
Wh
eat
Feb
15
Exp
ort
qu
ota
Ap
pro
ved
1 m
illio
n t
on
nes
of
2014
/15
wh
eat
for
exp
ort
. Th
is a
dd
s to
a p
revi
ou
s au
tho
riza
tio
n t
o e
xpo
rt
1.5
mill
ion
to
nn
es o
f w
hea
t an
d w
hea
t fl
ou
r, st
arte
d in
Dec
emb
er 2
014.
Th
e to
tal q
uo
ta w
ill n
ow
am
ou
nt
to 3
.5 m
illio
n t
on
nes
.
Gra
ins
Mar
15
Exp
ort
pro
mo
tio
nA
nn
ou
nce
d t
he
crea
tio
n o
f a
new
fu
nd
wh
ich
will
co
mp
ensa
te b
y u
p t
o 5
0 p
erce
nt
the
'ret
enti
on
' tax
es
on
exp
ort
atio
n r
igh
ts p
aid
by
smal
l an
d m
ediu
m a
gri
cult
ura
l pro
du
cers
Mai
zeA
pr
15Ex
po
rt q
uo
taM
inis
try
of
Eco
no
my
and
Pu
blic
Fin
ance
s an
no
un
ced
th
e au
tho
riza
tio
n o
f an
ad
dit
ion
al 3
.5m
t o
f m
aize
ex
po
rts
fro
m t
he
2014
/15
cro
p.
Can
ada
Gra
ins
No
v 14
Exp
ort
pro
mo
tio
nA
nn
ou
nce
d t
hat
min
imu
m g
rain
sh
ipm
ent
targ
ets
for
the
railw
ay n
etw
ork
wo
uld
be
exte
nd
ed t
hro
ug
h
28 M
arch
201
5. T
he
targ
ets
wer
e se
t af
ter
a ra
ilcar
sh
ort
age
in 2
014
cau
sed
sh
ipm
ents
of
Can
adia
n
gra
in t
o t
he
US
to d
ecre
ase
sig
nifi
can
tly.
Ch
ina
Wh
eat
Oct
14
Pro
cure
men
t p
rice
An
no
un
ced
th
at t
he
2015
sta
te p
urc
has
e p
rice
fo
r w
hea
t w
ou
ld b
e m
ain
tain
ed a
t th
e 20
14 le
vel o
f C
NY
2
360
(USD
385
) p
er t
on
ne.
Mai
zeN
ov
14Pr
ocu
rem
ent
pri
ceA
nn
ou
nce
d t
he
star
t o
f th
e 20
14/1
5 in
terv
enti
on
pro
gra
mm
e fo
r m
aize
. Th
e St
ate
pu
rch
ase
pri
ce w
as
kep
t u
nch
ang
ed f
rom
201
4 at
CN
Y2,
220-
2,26
0 (U
SD 3
62-3
68)
per
to
nn
e. In
terv
enti
on
pro
gra
mm
e w
ill
last
un
til t
he
end
of
Ap
ril 2
015.
Gra
ins
Dec
14
Imp
ort
qu
ota
An
no
un
ced
th
at g
rain
imp
ort
qu
ota
s in
201
5 w
ou
ld b
e ke
pt
un
chan
ged
fro
m t
he
pre
vio
us
year
, 9.6
36
mill
ion
to
nn
es f
or
wh
eat
and
7.2
mill
ion
to
nn
es f
or
mai
ze.
Wh
eat
Jan
15
Sto
ck r
elea
seA
pp
rove
d t
he
rele
ase
of
139
000
ton
nes
of
imp
ort
ed w
hea
t, a
lon
g w
ith
630
600
to
nn
es o
f d
om
esti
c w
hea
t fr
om
sta
te r
eser
ves
to h
elp
eas
e ti
gh
t d
om
esti
c su
pp
ly o
f h
igh
pro
tein
gra
des
.
Gra
ins
Mar
15
Go
vern
men
t p
rocu
rem
ent
An
no
un
ced
th
at U
SD 2
4.7b
n w
ill s
pen
t o
n s
tock
pili
ng
of
gra
ins,
ed
ible
oils
an
d o
ther
co
mm
od
itie
s in
20
15; g
ove
rnm
ent
targ
etin
g z
ero
gro
wth
in u
se o
f ch
emic
al f
erti
lizer
s b
y 20
20; g
ove
rnm
ent
sold
a t
ota
l o
f 1.
38m
t o
f d
om
esti
c w
hea
t an
d 2
9,71
2t U
S SR
W s
up
plie
s.
Egyp
tW
hea
tFe
b 1
5Im
po
rt p
olic
yEx
ten
ded
fo
r si
x m
on
ths
a d
ecis
ion
to
allo
w im
po
rts
of
wh
eat
wit
h u
p t
o 1
3.5
per
cen
t m
ois
ture
.
Euro
pea
n U
nio
n
Gra
ins
Oct
14
Imp
ort
tar
iff
Incr
ease
d im
po
rt t
arif
fs f
or
mai
ze, s
org
hu
m a
nd
rye
fro
m E
UR
5.3
2 to
EU
R 1
0.44
(U
SD 1
3.15
) p
er t
on
ne.
Gra
ins
No
v 14
Imp
ort
tar
iff
Susp
end
ed im
po
rt d
uti
es o
n m
aize
an
d s
ever
al o
ther
cer
eals
. Th
e im
po
rt d
uty
had
bee
n r
ein
stat
ed o
n
16 J
uly
an
d s
ub
seq
uen
tly
revi
sed
on
sev
eral
occ
asio
ns.
Gra
ins
Dec
14
Imp
ort
tar
iff
Dec
reas
ed im
po
rt t
arif
fs f
or
mai
ze, s
org
hu
m a
nd
rye
fro
m E
UR
10.
44 t
o E
UR
4.4
9 (U
SD 5
.52)
per
to
nn
e.
Wh
eat
Mar
14
Imp
ort
qu
ota
Aw
ard
ed li
cen
ses
to im
po
rt 4
5 00
0 to
nn
es o
f U
krai
nia
n w
hea
t u
nd
er a
n a
nn
ual
du
ty f
ree
qu
ota
. Th
is
bri
ng
s th
e aw
ard
ed v
olu
me
to 3
09 4
37 t
on
nes
; ou
t o
fa t
ota
l vo
lum
e o
f 95
0 00
0 to
nn
es a
vaila
ble
in
2015
.
Fran
ceB
iod
iese
lJa
n 1
5B
len
d r
atio
Rai
sed
th
e au
tho
rize
d c
on
cen
trat
ion
of
bio
die
sel i
n g
aso
line
fro
m 7
per
cen
t to
8 p
erce
nt.
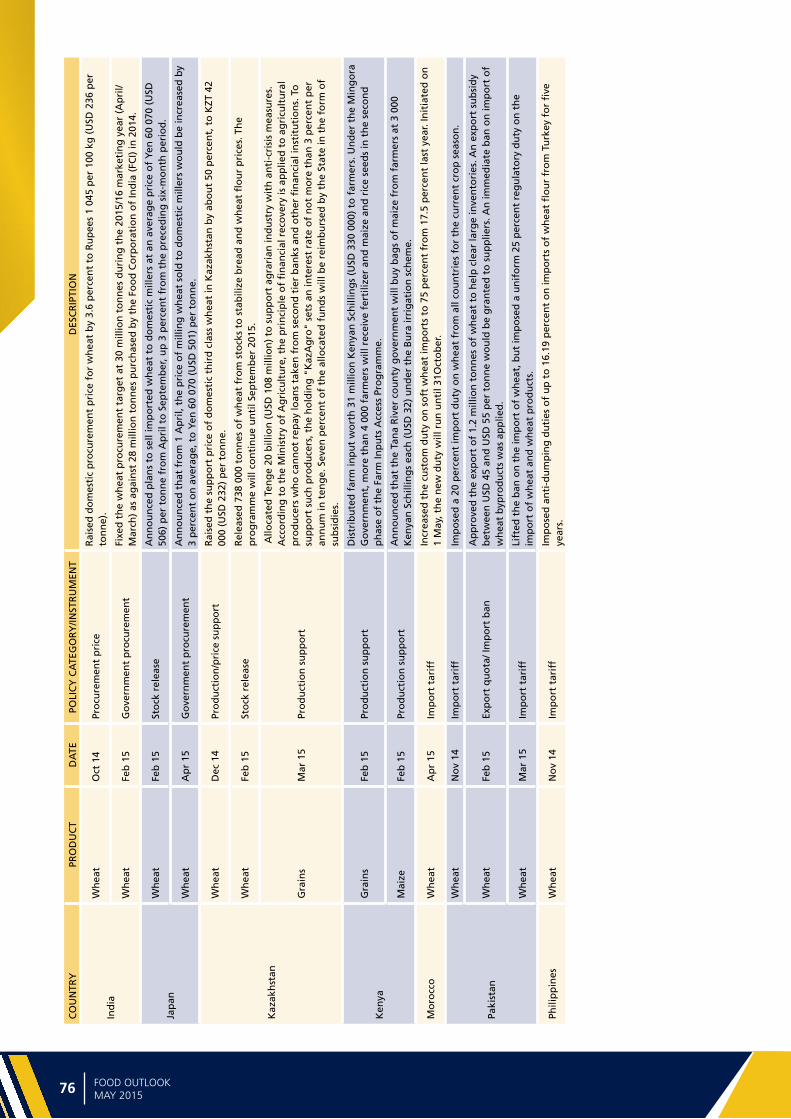
Ma
jor
po
licy
de
velo
pm
en
ts
76 77FOOD OUTLOOKMAY 2015
CO
UN
TRY
PRO
DU
CT
DA
TEPO
LIC
Y C
ATE
GO
RY
/INST
RU
MEN
TD
ESC
RIP
TIO
N
Ind
ia
Wh
eat
Oct
14
Pro
cure
men
t p
rice
Rai
sed
do
mes
tic
pro
cure
men
t p
rice
fo
r w
hea
t b
y 3.
6 p
erce
nt
to R
up
ees
1 04
5 p
er 1
00 k
g (
USD
236
per
to
nn
e).
Wh
eat
Feb
15
Go
vern
men
t p
rocu
rem
ent
Fixe
d t
he
wh
eat
pro
cure
men
t ta
rget
at
30 m
illio
n t
on
nes
du
rin
g t
he
2015
/16
mar
keti
ng
yea
r (A
pri
l/M
arch
) as
ag
ain
st 2
8 m
illio
n t
on
nes
pu
rch
ased
by
the
Foo
d C
orp
ora
tio
n o
f In
dia
(FC
I) in
201
4.
Jap
an
Wh
eat
Feb
15
Sto
ck r
elea
seA
nn
ou
nce
d p
lan
s to
sel
l im
po
rted
wh
eat
to d
om
esti
c m
iller
s at
an
ave
rag
e p
rice
of
Yen
60
070
(USD
50
6) p
er t
on
ne
fro
m A
pri
l to
Sep
tem
ber
, up
3 p
erce
nt
fro
m t
he
pre
ced
ing
six
-mo
nth
per
iod
.
Wh
eat
Ap
r 15
Go
vern
men
t p
rocu
rem
ent
An
no
un
ced
th
at f
rom
1 A
pri
l, th
e p
rice
of
mill
ing
wh
eat
sold
to
do
mes
tic
mill
ers
wo
uld
be
incr
ease
d b
y 3
per
cen
t o
n a
vera
ge,
to
Yen
60
070
(USD
501
) p
er t
on
ne.
Kaz
akh
stan
Wh
eat
Dec
14
Pro
du
ctio
n/p
rice
su
pp
ort
Rai
sed
th
e su
pp
ort
pri
ce o
f d
om
esti
c th
ird
cla
ss w
hea
t in
Kaz
akh
stan
by
abo
ut
50 p
erce
nt,
to
KZT
42
000
(USD
232
) p
er t
on
ne.
Wh
eat
Feb
15
Sto
ck r
elea
seR
elea
sed
738
000
to
nn
es o
f w
hea
t fr
om
sto
cks
to s
tab
ilize
bre
ad a
nd
wh
eat
flo
ur
pri
ces.
Th
e p
rog
ram
me
will
co
nti
nu
e u
nti
l Sep
tem
ber
201
5.
Gra
ins
Mar
15
Pro
du
ctio
n s
up
po
rt
Allo
cate
d T
eng
e 20
bill
ion
(U
SD 1
08 m
illio
n)
to s
up
po
rt a
gra
rian
ind
ust
ry w
ith
an
ti-c
risi
s m
easu
res.
A
cco
rdin
g t
o t
he
Min
istr
y o
f A
gri
cult
ure
, th
e p
rin
cip
le o
f fi
nan
cial
rec
ove
ry is
ap
plie
d t
o a
gri
cult
ura
l p
rod
uce
rs w
ho
can
no
t re
pay
loan
s ta
ken
fro
m s
eco
nd
tie
r b
anks
an
d o
ther
fin
anci
al in
stit
uti
on
s. T
o
sup
po
rt s
uch
pro
du
cers
, th
e h
old
ing
"K
azA
gro
" se
ts a
n in
tere
st r
ate
of
no
t m
ore
th
an 3
per
cen
t p
er
ann
um
in t
eng
e. S
even
per
cen
t o
f th
e al
loca
ted
fu
nd
s w
ill b
e re
imb
urs
ed b
y th
e St
ate
in t
he
form
of
sub
sid
ies.
Ken
ya
Gra
ins
Feb
15
Pro
du
ctio
n s
up
po
rtD
istr
ibu
ted
far
m in
pu
t w
ort
h 3
1 m
illio
n K
enya
n S
chill
ing
s (U
SD 3
30 0
00)
to f
arm
ers.
Un
der
th
e M
ing
ora
G
ove
rnm
ent,
mo
re t
han
4 0
00 f
arm
ers
will
rec
eive
fer
tiliz
er a
nd
mai
ze a
nd
ric
e se
eds
in t
he
seco
nd
p
has
e o
f th
e Fa
rm In
pu
ts A
cces
s Pr
og
ram
me.
Mai
zeFe
b 1
5Pr
od
uct
ion
su
pp
ort
An
no
un
ced
th
at t
he
Tan
a R
iver
co
un
ty g
ove
rnm
ent
will
bu
y b
ags
of
mai
ze f
rom
far
mer
s at
3 0
00
Ken
yan
Sch
illin
gs
each
(U
SD 3
2) u
nd
er t
he
Bu
ra ir
rig
atio
n s
chem
e.
Mo
rocc
oW
hea
tA
pr
15Im
po
rt t
arif
fIn
crea
sed
th
e cu
sto
m d
uty
on
so
ft w
hea
t im
po
rts
to 7
5 p
erce
nt
fro
m 1
7.5
per
cen
t la
st y
ear.
Init
iate
d o
n
1 M
ay, t
he
new
du
ty w
ill r
un
un
til 3
1Oct
ob
er.
Paki
stan
Wh
eat
No
v 14
Imp
ort
tar
iff
Imp
ose
d a
20
per
cen
t im
po
rt d
uty
on
wh
eat
fro
m a
ll co
un
trie
s fo
r th
e cu
rren
t cr
op
sea
son
.
Wh
eat
Feb
15
Exp
ort
qu
ota
/ Im
po
rt b
anA
pp
rove
d t
he
exp
ort
of
1.2
mill
ion
to
nn
es o
f w
hea
t to
hel
p c
lear
larg
e in
ven
tori
es. A
n e
xpo
rt s
ub
sid
y b
etw
een
USD
45
and
USD
55
per
to
nn
e w
ou
ld b
e g
ran
ted
to
su
pp
liers
. An
imm
edia
te b
an o
n im
po
rt o
f w
hea
t b
ypro
du
cts
was
ap
plie
d.
Wh
eat
Mar
15
Imp
ort
tar
iff
Lift
ed t
he
ban
on
th
e im
po
rt o
f w
hea
t, b
ut
imp
ose
d a
un
ifo
rm 2
5 p
erce
nt
reg
ula
tory
du
ty o
n t
he
imp
ort
of
wh
eat
and
wh
eat
pro
du
cts.
Phili
pp
ines
Wh
eat
No
v 14
Imp
ort
tar
iff
Imp
ose
d a
nti
-du
mp
ing
du
ties
of
up
to
16.
19 p
erce
nt
on
imp
ort
s o
f w
hea
t fl
ou
r fr
om
Tu
rkey
fo
r fi
ve
year
s.

Ma
jor p
olicy d
eve
lop
me
nts
76 77FOOD OUTLOOKMAY 2015
* A
col
lect
ion
of m
ajor
gra
in p
olic
y de
velo
pmen
ts s
tart
ing
in J
uly
2010
is a
vaila
ble
at: h
ttp:
//ww
w.f
ao.o
rg/e
cono
mic
/est
/est
-com
mod
ities
/com
mod
ity-p
olic
y-ar
chiv
e/en
/?gr
oupA
ND
com
mod
ity=
grai
ns
CO
UN
TRY
PRO
DU
CT
DA
TEPO
LIC
Y C
ATE
GO
RY
/INST
RU
MEN
TD
ESC
RIP
TIO
N
Ru
ssia
n F
eder
atio
n
Wh
eat
Dec
14
Go
vern
men
t p
rocu
rem
ent
Rai
sed
th
e st
ate
pu
rch
ase
inte
rven
tio
n p
rice
s fo
r 20
14 w
hea
t cr
op
by
app
roxi
mat
ely
50 p
erce
nt.
N
ew p
rice
s fo
r w
hea
t ar
e ar
ou
nd
RU
B 1
0 00
0 fo
r 3d
cat
ego
ry w
hea
t, a
rou
nd
920
0 fo
r 4t
h c
ateg
ory
w
hea
t an
d R
UB
9 0
00 f
or
5th
cat
ego
ry S
ales
of
wh
eat
to t
he
Stat
e In
terv
enti
on
Fu
nd
cea
sed
in m
id-
No
vem
ber
, wh
en t
he
mar
ket
pri
ce o
f w
hea
t in
th
e R
uss
ian
Fed
erat
ion
incr
ease
d s
har
ply
an
d s
urp
asse
d
the
inte
rven
tio
n p
rice
s b
y 70
–90
per
cen
t. T
he
firs
t in
terv
enti
on
pu
rch
ases
of
wh
eat
at n
ew p
rice
s w
ere
sch
edu
led
fo
r 23
an
d 2
4 D
ecem
ber
201
4.
Gra
ins
Dec
14
Imp
ort
res
tric
tio
ns
Imp
ose
d li
mit
atio
ns
on
th
e tr
ansp
ort
of
gra
in t
o p
ort
s an
d la
nd
bo
rder
cro
ssin
gs.
Rai
sed
gra
in lo
adin
g
tari
ff b
y 13
per
cen
t, e
ffec
tive
24
Jan
uar
y 20
15.
Wh
eat
Dec
14
Exp
ort
tar
iff
An
no
un
ced
a c
om
bin
ed t
ax o
n w
hea
t ex
po
rts
fro
m 1
Feb
ruar
y to
30
Jun
e 20
15. T
he
tax
add
s EU
R 7
.50
per
to
nn
e to
a 1
5 p
erce
nt
tax
on
th
e cu
sto
ms
pri
ce, s
ub
ject
to
a m
inim
um
tax
leve
l of
EUR
35
(USD
40.
4)
per
to
nn
e. L
imit
atio
ns
in t
ran
spo
rt a
nd
del
ays
in t
he
cert
ifica
tio
n o
f ex
po
rt g
rain
s h
ad a
pp
lied
bef
ore
th
is a
nn
ou
nce
men
t. In
terv
enti
on
ten
der
s in
Dec
emb
er a
nd
Jan
uar
y p
rocu
red
ove
r 40
000
to
nn
es o
f w
hea
t.
Gra
ins
Ap
r 15
Go
vern
men
t p
rocu
rem
ent
Set
the
min
imu
m p
urc
has
ing
pri
ces
for
the
pu
blic
inte
rven
tio
n f
un
d o
n g
rain
s fo
r th
e n
ew h
arve
st.
In p
arti
cula
r, th
e p
urc
has
ing
pri
ces
for
3-g
rad
e so
ft m
illin
g w
hea
t w
ill r
edu
ce t
o 9
700
RU
R/t
in t
he
Euro
pea
n p
art
of
Ru
ssia
an
d 9
500
RU
R/t
in t
he
Asi
an p
art,
ag
ain
st t
he
curr
ent
leve
l of
1010
0 R
UR
/t
and
100
00 R
UR
/t, r
esp
ecti
vely
. At
the
sam
e ti
me,
th
e m
inim
um
pu
rch
asin
g p
rice
s fo
r o
ther
cro
ps
will
in
crea
se: A
-gro
up
mill
ing
rye
- 6
400
RU
R/t
, ag
ain
st t
he
curr
ent
leve
l of
5100
RU
R/t
, fee
d b
arle
y -
6500
R
UR
/t, a
gai
nst
th
e cu
rren
t le
vel o
f 51
50 R
UR
/t, 3
-gra
de
corn
- 6
900
RU
R/t
, ag
ain
st t
he
curr
ent
leve
l of
5600
RU
R/t
. Th
e d
ecre
e co
mes
into
fo
rce
on
Ju
ly 1
, 201
5, a
nd
is v
alid
un
til J
uly
1, 2
016.
Sou
th A
fric
a W
hea
tM
ar 1
5Im
po
rt t
arif
fIn
crea
sed
its
imp
ort
tar
iff
on
wh
eat
fro
m Z
AR
157
(U
SD 1
3) p
er t
on
ne
to Z
AR
461
(U
SD 3
8) p
er t
on
ne.
Tan
zan
iaM
aize
Feb
15
Pro
du
ctio
n s
up
po
rtB
orr
ow
ed a
bo
ut
15 b
illio
n T
anza
nia
n S
chill
ing
s (U
SD 8
mill
ion
) to
set
tle
exte
nd
ed d
ebts
th
at t
he
Nat
ion
al F
oo
d R
eser
ve A
gen
cy (
NFR
A)
ow
es f
arm
ers.
Th
e G
ove
rnm
ent
will
set
tle
the
deb
t N
FRA
ow
es
mai
ze f
arm
ers
by
Mar
ch.
Vie
tnam
Mai
zeM
ar 1
5Pr
od
uct
ion
su
pp
ort
Ap
pro
ved
th
ree
typ
es o
f G
MO
mai
ze c
om
mer
cial
cro
ps
of
for
dis
trib
uti
on
to
loca
l far
mer
s
Ukr
ain
e
Gra
ins
Jan
15
Trad
e C
ance
lled
VA
T re
fun
ds
for
gra
in e
xpo
rter
s
Wh
eat
Jan
15
Exp
ort
qu
ota
Rea
ched
ag
reem
ent
bet
wee
n g
ove
rnm
ent
and
tra
der
s to
lim
it w
hea
t ex
po
rts
fro
m 1
Jan
uar
y to
30
Jun
e 20
15 t
o 4
.6 m
illio
n t
on
nes
, of
wh
ich
1.2
mill
ion
to
nn
es is
mill
ing
wh
eat,
wit
h p
rovi
sio
ns
to r
evis
e th
ese
qu
anti
ties
.
Gra
ins
Feb
15
Imp
ort
tar
iff
Intr
od
uce
d a
tem
po
rary
(12
mo
nth
) ad
dit
ion
al im
po
rt c
har
ge
on
go
od
s im
po
rted
into
th
e cu
sto
ms
terr
ito
ry o
f U
krai
ne,
incl
ud
ing
10
per
cen
t in
crea
ses
on
imp
ort
s o
f fo
od
pro
du
cts,
live
an
imal
s, t
rees
an
d
pla
nts
, cer
eals
, see
ds,
fat
s an
d o
ils, a
lco
ho
l an
d t
ob
acco
.
Un
ited
Sta
tes
Bio
fuel
Jan
15
Trad
e m
easu
reA
uth
ori
zed
a s
imp
lified
, th
ird
-par
ty-o
per
ated
, ren
ewab
le t
rack
ing
pro
gra
mm
e fo
r A
rgen
tin
ian
b
iod
iese
l, in
lieu
of
the
curr
ent
reco
rd k
eep
ing
req
uir
emen
t. T
his
res
po
nd
s to
a p
lan
su
bm
itte
d o
n 2
9 A
ug
ust
201
2. T
he
app
rova
l may
be
revo
ked
at
any
tim
e.
Zam
bia
Wh
eat
Mar
15
Exp
ort
qu
ota
Stat
ed t
hat
, aft
er a
larg
e cr
op
bo
ost
ed a
vaila
bili
ties
, 1m
t o
f m
aize
had
bee
n a
pp
rove
d f
or
sale
, in
clu
din
g 8
00,0
00t
for
exp
ort
at
pri
ces
som
e 20
% a
bo
ve d
om
esti
c va
lues

Ma
jor
po
licy
de
velo
pm
en
ts
78 79FOOD OUTLOOKMAY 2015
RICE
: M
AJO
R PO
LICY
DEV
ELO
PMEN
TS: J
AN
UA
RY T
O M
ID A
PRIL
201
5*
CO
UN
TRY
PRO
DU
CT
DA
TEPO
LIC
Y C
ATE
GO
RY
/INST
RU
MEN
TD
ESC
RIP
TIO
N
An
go
laR
ice
Jan
-15
Imp
ort
qu
ota
, lic
ense
sIn
tro
du
ced
an
imp
ort
qu
ota
of
457
000
ton
nes
of
rice
fo
r ca
len
dar
201
5, a
s p
art
of
bro
ader
eff
ort
s to
b
oo
st n
atio
nal
pro
du
ctio
n o
f va
rio
us
item
s an
d r
edu
ce d
epen
den
ce o
n o
il re
ven
ue.
Th
e m
easu
re is
to
re
pla
ce a
pre
vio
us
imp
ort
lice
nsi
ng
sys
tem
.
Ban
gla
des
hR
ice
Mar
-15
Go
vern
men
t p
rocu
rem
ent,
p
urc
has
ing
pri
ces
An
no
un
ced
th
at it
wo
uld
pu
rch
ase
1.0
mill
ion
to
nn
es o
f ri
ce a
nd
100
000
to
nn
es o
f p
add
y fr
om
th
e 20
14-2
015
Bo
ro h
arve
st. T
he
pro
cure
men
t d
rive
is t
o r
un
bet
wee
n M
ay a
nd
Sep
tem
ber
201
5 an
d w
ill
off
er T
aka
22 p
er k
g (
USD
276
per
to
nn
e) o
f p
add
y an
d T
aka
32 p
er k
g (
USD
402
per
to
nn
e) o
f ri
ce.
Bo
livia
Ric
eM
ar-1
5G
ove
rnm
ent
pro
cure
men
t,
pu
rch
asin
g p
rice
sA
nn
ou
nce
d t
hat
th
e st
ate
ente
rpri
se E
MA
PA w
ou
ld p
rocu
re s
up
plie
s fr
om
th
e 20
15 h
arve
st a
t U
SD 6
0 p
er 2
00-k
g f
aneg
a (U
SD 3
00 p
er t
on
ne)
, up
9 p
erce
nt
fro
m t
he
pre
vio
us
year
.
Bra
zil
Ric
eJa
n-1
5St
ock
rel
ease
Rel
ease
d 1
15 0
00 t
on
nes
of
pad
dy
fro
m G
ove
rnm
ent
rese
rves
th
rou
gh
six
au
ctio
ns
hel
d in
Jan
uar
y 20
15,
wh
ich
off
ered
a c
om
bin
ed 1
35 0
00 t
on
nes
of
pad
dy.
Cam
bo
dia
Ric
eM
ar-1
5Ex
po
rt p
rom
oti
on
An
no
un
ced
th
at t
he
Phn
om
Pen
h A
uto
no
mo
us
Port
wo
uld
fo
rgo
ch
arg
es f
or
rice
sto
red
in it
s fa
cilit
ies
for
up
to
18
day
s.
Ch
ina
(Mai
nla
nd
)
Ric
eJa
n-1
5St
ock
ho
ldin
g p
olic
yIs
sued
new
gu
idel
ines
en
tru
stin
g p
rovi
nci
al g
ove
rno
rs w
ith
th
e re
spo
nsi
bili
ty o
f g
rain
sec
uri
ty, i
ncl
ud
ing
th
at o
f ra
isin
g lo
cal g
rain
pro
du
ctio
n, m
ain
tain
ing
res
erve
s an
d e
nsu
rin
g g
rain
cir
cula
tio
n.
Ric
eFe
b-1
5Su
pp
ort
pri
ces
An
no
un
ced
th
at g
ove
rnm
ent
pad
dy
pro
cure
men
t p
rice
s fo
r th
e 20
15 s
easo
n w
ou
ld b
e ke
pt
un
chan
ged
ye
ar-t
o-y
ear
at Y
uan
135
per
50
kg b
ag (
USD
440
per
to
nn
e) in
th
e ca
se o
f ea
rly
Ind
ica
rice
; at
Yuan
138
p
er 5
0 kg
bag
(U
SD 4
50 p
er t
on
ne)
fo
r la
te/in
term
edia
te In
dic
a ri
ce; a
nd
at
Yuan
155
per
50
kg b
ag o
f Ja
po
nic
a ri
ce (
USD
506
per
to
nn
e).
Ric
eM
ar-1
5G
ove
rnm
ent
pro
cure
men
tA
nn
ou
nce
d t
hat
it w
ou
ld a
lloca
te Y
uan
154
.6 b
illio
n (
USD
25.
2 b
illio
n),
33
per
cen
t m
ore
th
an in
201
4, t
o
pu
rch
ase
gra
ins,
oils
an
d o
ther
loca
l pro
du
ce in
201
5.
Co
lom
bia
Ric
eM
ar-1
5Im
po
rt q
uo
taA
pp
rove
d im
po
rts
of
80 0
00 t
on
nes
of
mill
ed r
ice,
or
an e
qu
ival
ent
pad
dy
amo
un
t, f
rom
Ecu
ado
r. V
olu
mes
are
to
arr
ive
no
late
r th
an 3
1 Ju
ly 2
015
or
bet
wee
n 1
No
vem
ber
an
d 3
1 D
ecem
ber
201
5.
Co
sta
Ric
a
Ric
eJa
n-1
5Sa
feg
uar
d m
easu
res
Dec
ided
to
imp
ose
saf
egu
ard
mea
sure
s o
n s
elec
ted
cla
sses
of
mill
ed r
ice
imp
ort
s (S
AC
co
des
100
6309
091
and
100
6309
099)
, rai
sin
g t
arif
fs f
or
thes
e cl
asse
s fr
om
35
per
cen
t to
62.
06 p
erce
nt,
wit
h t
he
rate
to
b
e p
rog
ress
ivel
y re
du
ced
bac
k to
its
ori
gin
al le
vel o
f 35
per
cen
t in
eq
ual
inst
alm
ents
ove
r a
fou
r-ye
ar
per
iod
.
Ric
eFe
b-1
5C
on
sum
er p
rice
s
Ad
just
ed c
eilin
g a
nd
flo
ors
fo
r al
l qu
alit
ies
of
rice
co
nsu
med
in t
he
cou
ntr
y an
d o
f al
l ori
gin
s, e
ffec
tive
8
Jun
e 20
15. I
n t
he
case
of
80-2
0 ri
ce, t
hes
e w
ere
set
at a
min
imu
m o
f C
olo
nes
631
an
d a
max
imu
m o
f C
olo
nes
634
per
kg
bag
s (U
SD 1
.15–
1.16
per
kg
) at
th
e re
tail
leve
l, d
ow
n 4
per
cen
t fr
om
pre
vio
usl
y se
t b
and
s.
Ric
eFe
b-1
5Su
pp
ort
pri
ces
Set
a n
ew r
efer
ence
pri
ce o
f C
olo
nes
22
139.
00 p
er 7
3.6
kg b
ag (
USD
550
per
to
nn
e) o
f p
add
y to
rep
lace
th
e fi
xed
pro
du
cer
pri
ce o
f C
olo
nes
22
604.
41 (
USD
562
per
to
nn
e) p
reva
ilin
g s
ince
201
1. T
he
init
iati
ve
is p
art
of
go
vern
men
t ef
fort
s to
bri
ng
th
e co
un
try’
s ag
ricu
ltu
ral s
ub
sid
ies
wit
hin
lim
its
com
mit
ted
to
th
e W
TO, b
ut
un
der
a g
rad
ual
ap
pro
ach
th
at w
ou
ld p
erm
it t
he
ind
ust
ry t
o m
ake
nec
essa
ry a
dju
stm
ents
to
im
pro
ve it
s co
mp
etit
iven
ess
ove
r th
e m
ediu
m t
erm
.
Ric
eFe
b-1
5Sa
feg
uar
d m
easu
res
Ad
just
ed t
he
rate
of
the
add
itio
nal
imp
ort
du
ty t
o b
e le
vied
on
sel
ecte
d c
lass
es o
f m
illed
ric
e im
po
rts,
as
a sa
feg
uar
d m
easu
re, f
rom
27.
06 p
erce
nt
to 2
4.88
per
cen
t. T
he
mo
ve w
ill b
rin
g t
ota
l du
ties
acc
rued
by
such
imp
ort
s to
59.
88 p
erce
nt,
ap
plic
able
fro
m 1
9 Fe
bru
ary
2015
un
til 1
8 Fe
bru
ary
2019
an
d s
ub
ject
to
p
rog
ress
ive
red
uct
ion
s in
eq
ual
an
nu
al in
stal
men
ts.
Ric
eA
pr-
15Sa
feg
uar
d m
easu
res,
imp
ort
q
uo
tas
Allo
cate
d a
nn
ual
imp
ort
qu
ota
s to
Uru
gu
ay a
nd
Arg
enti
na
in a
bid
to
co
mp
ensa
te t
he
two
So
uth
A
mer
ican
ori
gin
s fo
r th
e im
po
siti
on
of
safe
gu
ard
mea
sure
s ag
ain
st im
po
rts
of
sele
cted
cla
sses
of
mill
ed
rice
. Acc
ord
ing
to
th
e d
ecis
ion
, 6 9
60 t
on
nes
of
mill
ed r
ice
fro
m U
rug
uay
will
be
per
mit
ted
to
en
ter
Co
sta
Ric
a an
nu
ally
du
rin
g t
he
fou
r-ye
ar d
ura
tio
n o
f th
e sa
feg
uar
d a
pp
licat
ion
, su
bje
ct t
o a
n im
po
rt
tari
ff o
f 35
per
cen
t, w
ith
an
ad
dit
ion
al 3
062
to
nn
es o
f p
add
y an
d 1
100
to
nn
es o
f p
arb
oile
d r
ice
exem
pte
d f
rom
du
ties
. Sim
ilarl
y, 3
786
to
nn
es o
f m
illed
ric
e fr
om
Arg
enti
na
will
be
levi
ed a
n im
po
rt
du
ty o
f 35
per
cen
t, w
hile
2 2
35 t
on
nes
of
Arg
enti
nia
n p
arb
oile
d r
ice
will
be
allo
wed
into
Co
sta
Ric
a p
er
year
fre
e o
f d
uti
es.

Ma
jor p
olicy d
eve
lop
me
nts
78 79FOOD OUTLOOKMAY 2015
CO
UN
TRY
PRO
DU
CT
DA
TEPO
LIC
Y C
ATE
GO
RY
/INST
RU
MEN
TD
ESC
RIP
TIO
N
Do
min
ican
Rep
ub
licR
ice
Ap
r-15
Sup
po
rt p
rice
sPa
dd
y su
pp
ort
pri
ces
set
at P
eso
s 2
150–
2 25
0 p
er 1
20-k
g f
aneg
a (U
SD 3
97–4
15 p
er t
on
ne)
by
the
Nat
ion
al R
ice
Co
mm
issi
on
.
Ecu
ado
r
Ric
eFe
b-1
5Im
po
rt le
vies
, saf
egu
ard
mea
sure
sD
ecid
ed t
o e
xclu
de
pad
dy
for
sow
ing
fro
m t
he
tem
po
rary
imp
ort
du
ties
ap
plie
d o
n g
oo
ds
ori
gin
ated
in
Peru
an
d C
olo
mb
ia s
ince
Jan
uar
y 20
15, w
ith
imm
edia
te e
ffec
t.
Ric
eM
ar-1
5C
on
sum
er p
rice
sA
nn
ou
nce
d t
hat
it w
ou
ld r
elea
se s
up
plie
s fr
om
go
vern
men
t g
ran
arie
s in
ord
er t
o r
elie
ve p
ress
ure
on
lo
cal q
uo
tati
on
s. S
up
plie
s ar
e to
be
sold
to
co
nsu
mer
s at
a U
SD 1
.74
per
2 k
g p
acka
ges
(U
SD 0
.87
per
kg
) o
r U
SD 3
7.5
per
qu
inta
l (U
SD 8
27 p
er t
on
ne)
fo
r a
per
iod
of
15 d
ays.
Ric
eM
ar-1
5Im
po
rt le
vies
, saf
egu
ard
mea
sure
sR
evo
ked
a D
ecem
ber
201
4 m
easu
re im
po
sin
g a
tem
po
rary
du
ty o
f 7
per
cen
t fo
r g
oo
ds
ori
gin
ated
in
Peru
an
d o
f 21
per
cen
t fo
r im
po
rts
fro
m C
olo
mb
ia s
ince
Jan
uar
y 20
15, e
ffec
tive
11
Mar
ch 2
015.
Ric
eM
ar-1
5Im
po
rt le
vies
, saf
egu
ard
mea
sure
s
Imp
ose
d im
po
rt s
urc
har
ges
on
a w
ide
ran
ge
of
pro
du
cts
for
15 m
on
ths,
sta
rtin
g 1
1 M
arch
201
5, in
an
ef
fort
to
co
un
tera
ct t
he
imp
act
of
the
dec
line
in in
tern
atio
nal
oil
pri
ces
and
str
eng
then
ing
of
the
US
do
llar
on
its
eco
no
my.
Wh
ile e
xcep
tio
ns
wer
e es
tab
lish
ed, i
ncl
ud
ing
fo
r th
e le
sser
dev
elo
ped
mem
ber
s o
f th
e La
tin
Am
eric
an In
teg
rati
on
Ass
oci
atio
n (
ALA
DI)
, in
th
e ca
se o
f m
illed
ric
e, t
he
levy
was
set
at
45
per
cen
t, t
o b
e ap
plie
d o
n t
op
of
the
du
ties
of
0–67
.5 p
erce
nt
no
rmal
ly a
ccru
ed b
y m
illed
ric
e.
Ind
ia
Ric
e an
d W
hea
tJa
n-1
5St
ock
ho
ldin
g p
olic
y
Rev
ised
qu
anti
ties
man
dat
ed t
o b
e h
eld
in t
he
Cen
tral
Po
ol u
nd
er t
he
Bu
ffer
Sto
ck N
orm
s at
th
e st
art
of
each
qu
arte
r o
f th
e ye
ar. A
cco
rdin
g t
o t
he
dec
isio
n, m
and
ated
sto
ck le
vels
of
foo
dg
rain
s (w
hea
t an
d
rice
) as
of
1 Ja
nu
ary
wer
e re
du
ced
by
3.6
mill
ion
to
nn
es t
o 2
1.41
mill
ion
to
nn
es a
nd
by
200
000
ton
nes
to
21.
04 m
illio
n t
on
nes
fo
r 1
Ap
ril.
Sto
ck n
orm
s fo
r 1
July
an
d 1
Oct
ob
er w
ere
inst
ead
rai
sed
by
9.2
mill
ion
an
d 9
.6 m
illio
n t
on
nes
, res
pec
tive
ly, t
o 4
1.12
an
d 3
0.77
mill
ion
to
nn
es. T
he
revi
sed
qu
anti
ties
are
in
clu
sive
of
a 5.
0 m
illio
n t
on
ne
stra
teg
ic r
eser
ve (
2.0
mill
ion
to
nn
es r
ice
and
3.0
mill
ion
to
nn
es w
hea
t)
app
licab
le f
or
all q
uar
ters
of
the
year
. Mo
reo
ver,
it a
nn
ou
nce
d t
hat
su
pp
lies
wo
uld
be
rele
ased
on
th
e d
om
esti
c m
arke
t th
rou
gh
op
en s
ales
or
exp
ort
s, s
ho
uld
inve
nto
ries
hel
d a
t th
e C
entr
al P
oo
l exc
eed
th
ese
revi
sed
leve
ls.
Ric
eFe
b-1
5B
ud
get
ary
allo
cati
on
s, f
oo
d
sub
sid
ies
As
par
t o
f it
s 20
15-1
6 b
ud
get
ary
allo
cati
on
s, r
aise
d a
llotm
ents
to
fo
od
su
bsi
die
s b
y 1.
4 p
erce
nt
to
Ru
pee
s 1.
24 t
rilli
on
(U
SD 1
9.9
bill
ion
).
Gen
eral
Feb
-15
Bu
dg
etar
y al
loca
tio
ns,
pro
du
ctio
n
sup
po
rt
An
no
un
ced
th
at in
its
effo
rts
to a
dd
ress
cri
tica
l fac
tors
rel
ated
to
so
il an
d w
ater
, it
wo
uld
su
pp
ort
o
rgan
ic f
arm
ing
th
rou
gh
th
e "P
aram
par
agat
Kri
shi V
ikas
Yo
jan
a” s
chem
e, a
s a
com
ple
men
t to
on
go
ing
ef
fort
s to
ext
end
so
il h
ealt
h c
ard
s to
far
mer
s. T
he
2015
–16
bu
dg
et w
ou
ld s
ee a
n a
dd
itio
nal
Ru
pee
s 53
b
illio
n (
USD
847
mill
ion
) re
serv
ed t
o t
he
"Pra
dh
anm
antr
i Gra
m S
inch
ai Y
oja
na"
sch
eme,
wit
h a
tar
get
o
f ex
ten
din
g ir
rig
atio
n t
o a
ll fa
rmer
s an
d e
nh
ance
wat
er u
se e
ffici
ency
, an
d f
or
mic
ro-i
rrig
atio
n a
nd
w
ater
shed
dev
elo
pm
ent.
Fu
rth
er e
ffo
rts
will
co
nce
ntr
ate
on
bo
ost
ing
ag
ricu
ltu
ral c
red
it a
nd
init
iati
ng
th
e p
roce
ss t
o c
reat
e a
nat
ion
al a
gri
cult
ure
mar
ket,
gre
ater
ou
tlay
s to
fer
tiliz
er s
ub
sid
ies,
as
wel
l as
enh
anci
ng
th
e ef
fect
iven
ess
of
the
Mah
atm
a G
and
hi N
atio
nal
Ru
ral E
mp
loym
ent
Gu
aran
tee
Act
. M
ean
wh
ile, s
elec
ted
pro
gra
mm
es, s
uch
as
the
Ras
htr
iya
Kri
shi V
ikas
Yo
jan
a an
d t
he
Nat
ion
al F
oo
d
Secu
rity
Mis
sio
n, w
ill f
all u
nd
er a
new
co
st-s
har
ing
mec
han
ism
bet
wee
n t
he
cen
tral
go
vern
men
t an
d
stat
es.
Ric
eFe
b-1
5G
ove
rnm
ent
pro
cure
men
tIn
stru
cted
sta
te g
ove
rnm
ents
to
elim
inat
e al
l pro
cure
men
t o
f ri
ce u
nd
er s
tatu
tory
levy
, as
of
1 O
cto
ber
20
15.
Ric
eFe
b-1
5Ta
x p
olic
y
Rei
nst
ated
th
e d
uty
dra
wb
ack
on
ric
e ex
po
rts,
eff
ecti
ve 1
3 Fe
bru
ary
2015
. Th
e m
easu
re, w
hic
h is
in
ten
ded
to
co
mp
ensa
te f
or
du
ties
levi
ed o
n in
pu
ts o
f p
rod
uct
s d
esti
ned
to
ou
tsid
e m
arke
ts, i
s to
be
exte
nd
ed o
n a
bra
nd
rat
e b
asis
, req
uir
ing
th
e su
bm
issi
on
of
an a
pp
licat
ion
by
ind
ivid
ual
exp
ort
ers
to
det
erm
ine
the
rate
of
dra
wb
ack
bas
ed u
po
n a
ctu
al q
uan
titi
es o
f in
pu
ts u
sed
an
d r
esp
ecti
ve d
uti
es p
aid
.
Ind
on
esia
Ric
eM
ar-1
5G
ove
rnm
ent
pro
cure
men
t,
pu
rch
asin
g p
rice
s
Rai
sed
go
vern
men
t p
urc
has
ing
pri
ces
by
12 p
erce
nt
to R
up
iah
3 7
00–3
750
per
kg
(U
SD 2
96–3
00 p
er
ton
ne)
of
wet
pad
dy,
wh
ile d
ry p
add
y an
d r
ice
wer
e ra
ised
by
11 p
erce
nt
each
, to
Ru
pia
h 4
600
–4 6
50
(USD
368
–372
per
to
nn
e) a
nd
7 3
00 p
er k
g (
USD
584
per
to
nn
e), r
esp
ecti
vely
.

Ma
jor
po
licy
de
velo
pm
en
ts
80 81FOOD OUTLOOKMAY 2015
CO
UN
TRY
PRO
DU
CT
DA
TEPO
LIC
Y C
ATE
GO
RY
/INST
RU
MEN
TD
ESC
RIP
TIO
N
Nig
eria
Ric
eJa
n-1
5Pr
od
uct
ion
su
pp
ort
Allo
cate
d N
aira
26
bill
ion
(U
SD 1
29 m
illio
n)
to s
up
po
rt a
gri
cult
ura
l pro
du
cers
wit
h s
ub
sid
ized
inp
uts
th
rou
gh
th
e 20
15 D
ry S
easo
n F
arm
ing
Pro
gra
m.
Paki
stan
Ric
eFe
b-1
5Fi
nan
ce a
nd
cre
dit
fac
iliti
esEx
ten
ded
co
vera
ge
of
the
Exp
ort
Refi
nan
ce S
chem
e to
bro
wn
ric
e ex
po
rts
(in
bu
lk/lo
ose
pac
kin
g)
to a
ll d
esti
nat
ion
s, w
ith
dra
win
g t
he
Lett
er o
f C
red
it r
equ
irem
ent
for
such
sh
ipm
ents
.
Phili
pp
ines
Ric
eFe
b-1
5Im
po
rt q
uo
taA
pp
rove
d im
po
rts
of
500
000
ton
nes
of
rice
, to
be
con
trac
ted
on
a g
ove
rnm
ent-
to-g
ove
rnm
ent
bas
is.
Vo
lum
es a
re t
o b
e d
eliv
ered
by
30 A
pri
l 201
5 an
d w
ill s
erve
to
ref
urb
ish
pu
blic
inve
nto
ries
ah
ead
of
the
lean
sea
son
.
Rep
ub
lic o
f K
ore
aR
ice
Jan
-15
Exp
ort
res
tric
tio
ns
and
pro
hib
itio
ns
An
no
un
ced
th
at lo
ng
-sta
nd
ing
res
tric
tio
ns
req
uir
ing
th
at t
rad
ers
rece
ive
pri
or
auth
ori
zati
on
on
ric
e ex
po
rts
wo
uld
be
elim
inat
ed a
s o
f M
arch
201
5, a
s p
art
of
its
effo
rts
to p
rom
ote
sh
ipm
ents
ab
road
an
d
stab
ilize
th
e d
om
esti
c m
arke
t.
Sen
egal
Ric
eFe
b-1
5Pr
od
uct
ion
su
pp
ort
An
no
un
ced
th
at F
CFA
8 b
illio
n (
USD
13
mill
ion
) w
ou
ld b
e al
loca
ted
to
en
han
ce a
cces
s to
cre
dit
an
d m
arke
tin
g o
f p
rod
uce
, wit
h s
tate
en
titi
es h
ence
fort
h d
raw
ing
su
pp
lies
excl
usi
vely
fro
m lo
cal
pro
du
ctio
n. T
he
init
iati
ve, p
art
of
the
go
vern
men
t’s
self
-su
ffici
ency
pro
gra
mm
e, a
lso
en
visa
ges
in
fras
tru
ctu
ral i
mp
rove
men
ts a
nd
pro
visi
on
of
mac
hin
ery
and
tax
co
nce
ssio
ns,
an
d m
akes
th
e is
suan
ce
of
imp
ort
lice
nse
s co
nd
itio
nal
on
th
e p
urc
has
e o
f lo
cal p
rod
uce
.
Ric
eM
ar-1
5Im
po
rt q
uo
ta, l
icen
ses
On
th
e o
ccas
ion
of
a m
emo
ran
du
m o
f u
nd
erst
and
ing
's s
ign
atu
re, w
her
eby
sect
or
rep
rese
nta
tive
s co
mm
itte
d t
o e
nh
ance
mar
keti
ng
of
do
mes
tic
pro
du
ce, a
nn
ou
nce
d t
hat
ric
e im
po
rts
in 2
016
wo
uld
b
e lim
ited
to
500
000
to
nn
es, w
ith
au
tho
riti
es t
o d
evis
e a
reg
ula
tory
mec
han
ism
th
at c
on
sid
ers
loca
l p
rod
uct
ion
, as
wel
l as
ind
ivid
ual
tra
der
's m
arke
t sh
are.
Sri L
anka
Ric
eJa
n-1
5B
ud
get
ary
allo
cati
on
s, p
rod
uct
ion
su
pp
ort
, su
pp
ort
pri
ces,
cre
dit
Allo
cate
d R
up
ees
2.5
bill
ion
(U
SD 1
8 m
illio
n)
to p
rovi
de
a 50
per
cen
t w
aive
r o
n f
arm
er lo
ans
of
up
to
Ru
pee
s 10
0 00
0 (U
SD 7
34),
as
par
t o
f th
e 20
15 In
teri
m B
ud
get
. Ad
dit
ion
al s
up
po
rt m
easu
res
will
in
clu
de
a h
igh
er g
uar
ante
ed p
urc
has
ing
pri
ce f
or
pad
dy
of
Ru
pee
s 50
per
kg
(U
SD 3
67 p
er t
on
ne)
, th
e co
nti
nu
atio
n o
f th
e su
bsi
diz
ed f
erti
lizer
pro
gra
mm
e, a
s w
ell a
s ef
fort
s to
low
er p
rice
s o
f ag
ricu
ltu
ral
mac
hin
ery.
Ric
eJa
n-1
5Im
po
rt t
arif
f, t
ax p
olic
yR
aise
d d
uti
es le
vied
on
pad
dy,
hu
sked
, sem
i/wh
olly
mill
ed a
nd
/or
bro
ken
ric
e to
Ru
pee
s 20
per
kg
(U
SD
147
per
to
nn
e), v
alid
fo
r a
per
iod
of
fou
r m
on
ths
star
tin
g f
rom
22
Jan
uar
y 20
15.
Ric
eFe
b-1
5G
ove
rnm
ent
pro
cure
men
t
Ap
pro
ved
th
e p
urc
has
e o
f 20
0 00
0 to
nn
es o
f p
add
y fr
om
th
e 20
15 M
aha
har
vest
. Th
e p
rocu
rem
ent
dri
ve is
to
be
un
der
take
n b
y re
gis
tere
d f
arm
er o
rgan
izat
ion
s an
d D
istr
ict
Secr
etar
ies
and
will
off
er
Ru
pee
s 50
per
kg
(U
SD 3
67 p
er t
on
ne)
fo
r Sa
mb
a p
add
y p
urc
has
ed a
nd
Ru
pee
s 45
per
kg
(U
SD 3
30 p
er
ton
ne)
fo
r N
adu
pad
dy.
Ric
eM
ar-1
5Fi
nan
ce a
nd
cre
dit
fac
iliti
esA
nn
ou
nce
d t
hat
a c
red
it li
ne
wo
uld
be
op
ened
, at
sub
sid
ized
rat
es, t
o s
up
po
rt s
mal
l- a
nd
med
ium
-sca
le
rice
mill
s.
Thai
lan
d
Ric
eJa
n-1
5 to
M
ar-1
5St
ock
rel
ease
Hel
d t
wo
pu
blic
au
ctio
ns,
sel
ling
a c
om
bin
ed 1
.3 m
illio
n t
on
nes
of
rice
fro
m G
ove
rnm
ent
rese
rves
fo
r th
e d
om
esti
c m
arke
t an
d e
xpo
rt, o
ut
of
a to
tal v
olu
me
off
ered
of
2.0
mill
ion
to
nn
es.
Ric
eFe
b-1
5Pr
od
uct
ion
ad
just
men
t p
rog
ram
An
no
un
ced
th
at, i
n a
n e
ffo
rt t
o r
edu
ce a
n e
stim
ated
4.4
mill
ion
to
nn
es o
f ex
cess
do
mes
tic
sup
ply
, it
aim
ed t
o p
ut
290
000
ha
of
pad
die
s to
cu
ltiv
atio
n o
f o
ther
cro
ps
in t
wo
yea
rs, i
ncl
ud
ing
112
000
ha
just
to
su
gar
. An
ad
dit
ion
al 6
4 00
0 h
a o
f o
ffse
aso
n p
add
ies
wo
uld
als
o b
e cu
t.
Ric
eFe
b-1
5St
ock
rel
ease
An
no
un
ced
pla
ns
to d
isp
ose
of
an e
stim
ated
17
mill
ion
to
nn
es o
f ri
ce h
eld
in g
ove
rnm
ent
gra
nar
ies
in
two
yea
rs. O
ffici
als
exp
ect
up
to
10
mill
ion
to
nn
es t
o b
e d
isp
ose
d o
f o
ver
the
cou
rse
of
2015
, wit
h t
he
rem
ain
ing
ric
e to
be
rele
ased
in 2
016.
Ric
eM
ar-1
5Pr
od
uct
ion
ad
just
men
t p
rog
ram
Ap
pro
ved
a fi
ve-y
ear
(201
5–20
19)
agri
cult
ura
l res
tru
ctu
rin
g p
lan
. Un
der
its
rice
co
mp
on
ent,
th
e p
rog
ram
me
wo
uld
aim
to
imp
rove
pro
du
ctiv
ity
leve
ls, l
ow
er p
rod
uct
ion
co
sts,
bo
ost
qu
alit
y o
f su
pp
lies
and
ass
ist
farm
co
op
erat
ives
. Eff
ort
s w
ill a
lso
co
nce
ntr
ate
on
co
nve
rtin
g p
add
ies
to s
ug
ar c
ult
ivat
ion
an
d r
edu
cin
g o
ffse
aso
n a
crea
ge.
Ric
eM
ar-1
5St
ock
rel
ease
Dec
ided
to
po
stp
on
e th
e re
leas
e o
f su
pp
lies
fro
m g
ove
rnm
ent
sto
ckp
iles
un
til a
fter
th
e co
mp
leti
on
of
off
seas
on
har
vest
s, s
o a
s to
avo
id p
ress
ure
on
loca
l pri
ces.

Ma
jor p
olicy d
eve
lop
me
nts
80 81FOOD OUTLOOKMAY 2015
* B
ecau
se o
f the
ir nu
mbe
r, ric
e po
licy
deve
lopm
ents
are
repo
rted
sinc
e Ja
nuar
y 20
15 o
nly.
The
full c
olle
ctio
n st
artin
g in
Janu
ary
2011
is a
vaila
ble
at: h
ttp:
//ww
w.f
ao.o
rg/e
cono
mic
/est
/est
com
mod
ities
/com
mod
ity p
olic
y ar
chiv
e/en
/?gr
oupA
ND
com
mod
ity=
rice
CO
UN
TRY
PRO
DU
CT
DA
TEPO
LIC
Y C
ATE
GO
RY
/INST
RU
MEN
TD
ESC
RIP
TIO
N
Vie
tnam
Ric
eJa
n-1
5 to
M
ar-2
015
Min
imu
m e
xpo
rt p
rice
sLo
wer
ed m
inim
um
exp
ort
pri
ces
for
25 p
erce
nt
bro
ken
ric
e tw
ice,
last
set
tin
g t
hem
at
USD
350
per
to
nn
e.
Ric
eJa
n-1
5Ex
po
rt r
equ
irem
ents
In a
n e
ffo
rt t
o p
rom
ote
gre
ater
ver
tica
l in
teg
rati
on
, iss
ued
dir
ecti
ves
that
mak
e it
req
uis
ite
for
exp
ort
ers
to p
rog
ress
ivel
y en
gag
e in
co
ntr
act
farm
ing
, in
vest
in la
rge-
scal
e fa
rms
or
dev
elo
p a
lter
nat
ive
pro
du
ctio
n a
reas
of
thei
r o
wn
in o
rder
to
sec
ure
ric
e ex
po
rt p
erm
its,
eff
ecti
ve 1
Mar
ch 2
015.
Th
e si
ze o
f p
rod
uct
ion
are
as t
o b
e d
evel
op
ed/in
vest
ed o
n w
ill b
e b
ased
up
on
exp
ort
ers’
tra
de
reco
rd in
201
1–20
13
and
will
be
rais
ed p
rog
ress
ivel
y th
rou
gh
202
0.
Ric
eFe
b-1
5G
ove
rnm
ent
pro
cure
men
tA
pp
rove
d a
pro
cure
men
t d
rive
fo
r 1
mill
ion
to
nn
es o
f w
inte
r-sp
rin
g r
ice
fro
m f
arm
ers,
to
be
pu
rch
ased
b
y m
emb
er c
om
pan
ies
of
the
Vie
tnam
Fo
od
Ass
oci
atio
n b
etw
een
Mar
ch a
nd
Ap
ril 2
015.
Go
vern
men
t cr
edit
ass
ista
nce
will
be
avai
lab
le f
or
enti
ties
par
tici
pat
ing
in t
he
dri
ve f
or
a p
erio
d o
f fo
ur
mo
nth
s.
Ric
eFe
b-1
5Im
po
rt q
uo
taR
enew
ed im
po
rt d
uty
exe
mp
tio
ns
on
70
000
ton
nes
of
rice
ori
gin
atin
g in
th
e La
o P
DR
, eff
ecti
ve u
nti
l 31
Dec
emb
er 2
015.

Ma
jor
po
licy
de
velo
pm
en
ts
82 83FOOD OUTLOOKMAY 2015
OIL
CRO
PS:
MA
JOR
POLI
CY D
EVEL
OPM
ENTS
: OCT
OBE
R 20
14 T
O M
ID-A
PRIL
201
5 *
CO
UN
TRY
PRO
DU
CT
DA
TEPO
LIC
Y C
ATE
GO
RY
/INST
RU
MEN
TD
ESC
RIP
TIO
N
Arg
enti
na
Soyb
ean
sD
ec-1
4 to
Fe
b-1
5M
arke
t re
gu
lati
on
Lim
ited
acc
ess
of
farm
ers
ho
ldin
g s
oyb
ean
sto
cks
to p
ub
lic p
rod
uct
ion
loan
s, a
nd
intr
od
uce
d f
orm
al
rep
ort
ing
req
uir
emen
ts f
or
the
sale
of
silo
-bag
s (u
sed
fo
r o
n-f
arm
sto
rag
e), i
n a
bid
to
en
cou
rag
e fa
rmer
s to
rel
ease
so
ybea
ns
into
th
e m
arke
t.
Oils
eed
s, g
rain
sM
ar-1
5A
gri
cult
ura
l po
licy
Esta
blis
hed
a f
un
d t
o s
up
po
rt s
mal
l an
d m
ediu
m-s
ized
gra
in/o
ilsee
d p
rod
uce
rs, w
ith
th
e sp
ecifi
c o
bje
ctiv
e o
f re
du
cin
g t
he
exp
ort
tax
bu
rden
th
ey f
aced
.
Bra
zil
Soyb
ean
sN
ov-
14En
viro
nm
enta
l po
licy
End
ors
ed t
he
exte
nsi
on
– u
nti
l May
201
6 –
of
the
ind
ust
ry’s
vo
lun
tary
mo
rato
riu
m o
n t
rad
ing
an
d
fin
anci
ng
so
ybea
ns
gro
wn
on
ille
gal
ly c
lear
ed la
nd
in t
he
Am
azo
n r
egio
n.
Bio
die
sel
No
v-14
Ren
ewab
le e
ner
gy
po
licy
Exem
pte
d s
elle
rs o
f ve
get
al-o
rig
in f
eed
sto
ck t
o b
iod
iese
l man
ufa
ctu
rers
fro
m p
ayin
g s
elec
ted
tax
es,
wit
h a
vie
w t
o s
tim
ula
te d
om
esti
c b
iod
iese
l pro
du
ctio
n.
Cam
ero
on
Oil
pal
mJa
n-1
5Se
cto
r d
evel
op
men
t G
ran
ted
pu
blic
fu
nd
ing
to
incr
ease
th
e p
rod
uct
ion
an
d f
ree
dis
trib
uti
on
of
cert
ified
pla
nti
ng
mat
eria
l to
far
mer
s, in
an
eff
ort
to
sti
mu
late
do
mes
tic
pal
m o
il p
rod
uct
ion
.
Can
ada
Rap
esee
d o
ilO
ct-1
4B
ilate
ral t
rad
e ag
reem
ent
Co
mp
lete
d n
ego
tiat
ion
of
the
Co
mp
reh
ensi
ve E
con
om
ic a
nd
Tra
de
Ag
reem
ent
(CET
A)
wit
h t
he
EU,
wh
ich
incl
ud
es e
limin
atio
n o
f EU
tar
iffs
on
Can
adia
n im
po
rts
of
rap
esee
d o
il as
wel
l as
pro
visi
on
s to
re
du
ce b
iote
ch-r
elat
ed t
rad
e h
urd
les.
Rap
esee
d, r
apes
eed
oil
Oct
-14
Bila
tera
l tra
de
Ob
tain
ed r
emo
val o
f ta
riff
s o
n r
apes
eed
exp
ort
s to
th
e R
epu
blic
of
Ko
rea,
as
wel
l as
a g
rad
ual
ph
asin
g-
ou
t o
f ta
riff
s o
n c
rud
e an
d r
efin
ed r
apes
eed
oil.
Gra
ins,
oils
eed
sD
ec-1
4M
arke
t re
gu
lati
on
Exte
nd
ed m
easu
res
reg
ula
tin
g n
atio
nal
gra
in t
ran
spo
rtat
ion
un
til M
arch
201
5, in
ord
er t
o a
dd
ress
lo
gis
tica
l bo
ttle
nec
ks a
ffec
tin
g t
he
mo
vem
ent
of
gra
ins/
oils
eed
s to
po
rts.
Cam
elin
a sa
tiva
mea
lJa
n-1
5 M
arke
t re
gu
lati
on
A
pp
rove
d t
he
feed
ing
of
cam
elin
a sa
tiva
mea
l to
bro
iler
chic
ken
s.
Rap
esee
d, s
oyb
ean
sJa
n-1
5Se
cto
r d
evel
op
men
t Fu
nd
ed R
&D
act
ivit
ies
mea
nt
to e
nh
ance
th
e co
mp
etit
iven
ess
and
su
stai
nab
ility
of
the
cou
ntr
y's
rap
esee
d a
nd
so
ybea
n in
du
stri
es.
Bio
die
sel
Mar
-15
Ren
ewab
le e
ner
gy
po
licy
Sup
po
rted
res
earc
h o
n r
aw g
lyce
rol (
a b
y-p
rod
uct
of
veg
etab
le o
il-b
ased
die
sel p
rod
uct
ion
) w
ith
a v
iew
to
en
han
ce v
alu
e ad
dit
ion
in t
he
bio
die
sel s
ecto
r.
Ch
ina
Soyb
ean
sN
ov
to
Dec
-14
GM
O p
olic
yA
uth
ori
zed
imp
ort
atio
n o
f tw
o n
ew g
enet
ical
ly m
od
ified
so
ybea
n v
arie
ties
, bu
t su
spen
ded
th
e ap
pro
val
pro
cess
fo
r an
oth
er G
M s
oy
stra
in.
Bio
die
sel
Feb
-15
Ren
ewab
le e
ner
gy
po
licy
Pub
lish
ed n
ew p
olic
y g
uid
elin
es f
or
the
dev
elo
pm
ent
of
the
cou
ntr
y's
bio
die
sel i
nd
ust
ry, w
ith
th
e o
vera
ll o
bje
ctiv
e o
f p
rom
oti
ng
do
mes
tic
bio
die
sel c
on
sum
pti
on
wh
ile p
rote
ctin
g lo
cal r
eso
urc
es.
Euro
pea
n U
nio
n
Rap
esee
d o
ilO
ct-1
4B
ilate
ral t
rad
e ag
reem
ent
Co
mp
lete
d n
ego
tiat
ion
of
the
Co
mp
reh
ensi
ve E
con
om
ic a
nd
Tra
de
Ag
reem
ent
(CET
A)
wit
h C
anad
a,
wh
ich
incl
ud
es t
he
elim
inat
ion
of
EU t
arif
fs o
n C
anad
ian
imp
ort
s o
f ra
pes
eed
oil
and
pro
visi
on
s to
re
du
ce b
iote
ch-r
elat
ed t
rad
e h
urd
les.
Edib
le o
ilsO
ct-1
4Fo
od
lab
ellin
gO
pen
ed in
frin
gem
ent
pro
ceed
ing
s ag
ain
st t
he
Un
ited
Kin
gd
om
ove
r it
s vo
lun
tary
nu
trit
ion
al la
bel
ling
sc
hem
e.
Palm
oil
Feb
-15
Trad
e p
olic
yR
equ
este
d e
stab
lish
men
t o
f a
WTO
dis
pu
te s
ettl
emen
t p
anel
to
rev
iew
th
e R
uss
ian
Fed
erat
ion
’s im
po
rt
du
ties
on
th
e se
lect
ed p
rod
uct
s, in
clu
din
g p
alm
oil.
GM
cro
ps
Mar
-15
GM
O p
olic
yA
do
pte
d a
new
reg
ula
tio
n a
llow
ing
ind
ivid
ual
mem
ber
sta
tes
to r
estr
ict
or
ban
GM
O c
ult
ivat
ion
on
th
eir
ow
n t
erri
tory
.
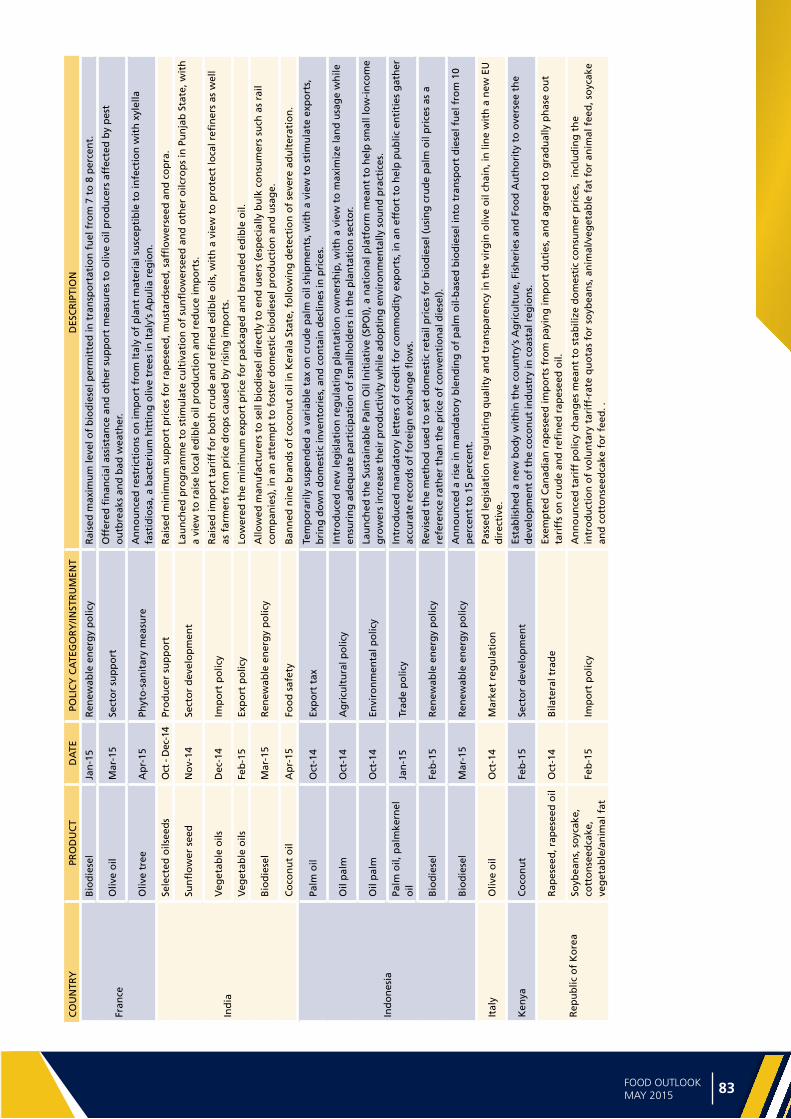
Ma
jor p
olicy d
eve
lop
me
nts
82 83FOOD OUTLOOKMAY 2015
CO
UN
TRY
PRO
DU
CT
DA
TEPO
LIC
Y C
ATE
GO
RY
/INST
RU
MEN
TD
ESC
RIP
TIO
N
Fran
ce
Bio
die
sel
Jan
-15
Ren
ewab
le e
ner
gy
po
licy
Rai
sed
max
imu
m le
vel o
f b
iod
iese
l per
mit
ted
in t
ran
spo
rtat
ion
fu
el f
rom
7 t
o 8
per
cen
t.
Oliv
e o
ilM
ar-1
5Se
cto
r su
pp
ort
Off
ered
fin
anci
al a
ssis
tan
ce a
nd
oth
er s
up
po
rt m
easu
res
to o
live
oil
pro
du
cers
aff
ecte
d b
y p
est
ou
tbre
aks
and
bad
wea
ther
.
Oliv
e tr
eeA
pr-
15Ph
yto
-san
itar
y m
easu
reA
nn
ou
nce
d r
estr
icti
on
s o
n im
po
rt f
rom
Ital
y o
f p
lan
t m
ater
ial s
usc
epti
ble
to
infe
ctio
n w
ith
xyl
ella
fa
stid
iosa
, a b
acte
riu
m h
itti
ng
oliv
e tr
ees
in It
aly’
s A
pu
lia r
egio
n.
Ind
ia
Sele
cted
oils
eed
sO
ct -
Dec
-14
Pro
du
cer
sup
po
rtR
aise
d m
inim
um
su
pp
ort
pri
ces
for
rap
esee
d, m
ust
ard
seed
, saf
flo
wer
seed
an
d c
op
ra.
Sun
flo
wer
see
dN
ov-
14Se
cto
r d
evel
op
men
t La
un
ched
pro
gra
mm
e to
sti
mu
late
cu
ltiv
atio
n o
f su
nfl
ow
erse
ed a
nd
oth
er o
ilcro
ps
in P
un
jab
Sta
te, w
ith
a
view
to
rai
se lo
cal e
dib
le o
il p
rod
uct
ion
an
d r
edu
ce im
po
rts.
Veg
etab
le o
ilsD
ec-1
4Im
po
rt p
olic
yR
aise
d im
po
rt t
arif
f fo
r b
oth
cru
de
and
refi
ned
ed
ible
oils
, wit
h a
vie
w t
o p
rote
ct lo
cal r
efin
ers
as w
ell
as f
arm
ers
fro
m p
rice
dro
ps
cau
sed
by
risi
ng
imp
ort
s.
Veg
etab
le o
ilsFe
b-1
5Ex
po
rt p
olic
yLo
wer
ed t
he
min
imu
m e
xpo
rt p
rice
fo
r p
acka
ged
an
d b
ran
ded
ed
ible
oil.
Bio
die
sel
Mar
-15
Ren
ewab
le e
ner
gy
po
licy
Allo
wed
man
ufa
ctu
rers
to
sel
l bio
die
sel d
irec
tly
to e
nd
use
rs (
esp
ecia
lly b
ulk
co
nsu
mer
s su
ch a
s ra
il co
mp
anie
s), i
n a
n a
ttem
pt
to f
ost
er d
om
esti
c b
iod
iese
l pro
du
ctio
n a
nd
usa
ge.
Co
con
ut
oil
Ap
r-15
Foo
d s
afet
yB
ann
ed n
ine
bra
nd
s o
f co
con
ut
oil
in K
eral
a St
ate,
fo
llow
ing
det
ecti
on
of
seve
re a
du
lter
atio
n.
Ind
on
esia
Palm
oil
Oct
-14
Exp
ort
tax
Tem
po
rari
ly s
usp
end
ed a
var
iab
le t
ax o
n c
rud
e p
alm
oil
ship
men
ts, w
ith
a v
iew
to
sti
mu
late
exp
ort
s,
bri
ng
do
wn
do
mes
tic
inve
nto
ries
, an
d c
on
tain
dec
lines
in p
rice
s.
Oil
pal
mO
ct-1
4A
gri
cult
ura
l po
licy
Intr
od
uce
d n
ew le
gis
lati
on
reg
ula
tin
g p
lan
tati
on
ow
ner
ship
, wit
h a
vie
w t
o m
axim
ize
lan
d u
sag
e w
hile
en
suri
ng
ad
equ
ate
par
tici
pat
ion
of
smal
lho
lder
s in
th
e p
lan
tati
on
sec
tor.
Oil
pal
mO
ct-1
4En
viro
nm
enta
l po
licy
La
un
ched
th
e Su
stai
nab
le P
alm
Oil
Init
iati
ve (
SPO
I), a
nat
ion
al p
latf
orm
mea
nt
to h
elp
sm
all l
ow
-in
com
e g
row
ers
incr
ease
th
eir
pro
du
ctiv
ity
wh
ile a
do
pti
ng
en
viro
nm
enta
lly s
ou
nd
pra
ctic
es.
Palm
oil,
pal
mke
rnel
o
ilJa
n-1
5Tr
ade
po
licy
Intr
od
uce
d m
and
ato
ry le
tter
s o
f cr
edit
fo
r co
mm
od
ity
exp
ort
s, in
an
eff
ort
to
hel
p p
ub
lic e
nti
ties
gat
her
ac
cura
te r
eco
rds
of
fore
ign
exc
han
ge
flo
ws.
Bio
die
sel
Feb
-15
Ren
ewab
le e
ner
gy
po
licy
Rev
ised
th
e m
eth
od
use
d t
o s
et d
om
esti
c re
tail
pri
ces
for
bio
die
sel (
usi
ng
cru
de
pal
m o
il p
rice
s as
a
refe
ren
ce r
ath
er t
han
th
e p
rice
of
con
ven
tio
nal
die
sel)
.
Bio
die
sel
Mar
-15
Ren
ewab
le e
ner
gy
po
licy
An
no
un
ced
a r
ise
in m
and
ato
ry b
len
din
g o
f p
alm
oil-
bas
ed b
iod
iese
l in
to t
ran
spo
rt d
iese
l fu
el f
rom
10
per
cen
t to
15
per
cen
t.
Ital
yO
live
oil
Oct
-14
Mar
ket
reg
ula
tio
n
Pass
ed le
gis
lati
on
reg
ula
tin
g q
ual
ity
and
tra
nsp
aren
cy in
th
e vi
rgin
oliv
e o
il ch
ain
, in
lin
e w
ith
a n
ew E
U
dir
ecti
ve.
Ken
yaC
oco
nu
tFe
b-1
5Se
cto
r d
evel
op
men
t Es
tab
lish
ed a
new
bo
dy
wit
hin
th
e co
un
try’
s A
gri
cult
ure
, Fis
her
ies
and
Fo
od
Au
tho
rity
to
ove
rsee
th
e d
evel
op
men
t o
f th
e co
con
ut
ind
ust
ry in
co
asta
l reg
ion
s.
Rep
ub
lic o
f K
ore
a
Rap
esee
d, r
apes
eed
oil
Oct
-14
Bila
tera
l tra
de
Exem
pte
d C
anad
ian
rap
esee
d im
po
rts
fro
m p
ayin
g im
po
rt d
uti
es, a
nd
ag
reed
to
gra
du
ally
ph
ase
ou
t ta
riff
s o
n c
rud
e an
d r
efin
ed r
apes
eed
oil.
Soyb
ean
s, s
oyc
ake,
co
tto
nse
edca
ke,
veg
etab
le/a
nim
al f
at
Feb
-15
Imp
ort
po
licy
An
no
un
ced
tar
iff
po
licy
chan
ges
mea
nt
to s
tab
ilize
do
mes
tic
con
sum
er p
rice
s, i
ncl
ud
ing
th
e in
tro
du
ctio
n o
f vo
lun
tary
tar
iff-
rate
qu
ota
s fo
r so
ybea
ns,
an
imal
/veg
etab
le f
at f
or
anim
al f
eed
, so
ycak
e an
d c
ott
on
seed
cake
fo
r fe
ed. .

Ma
jor
po
licy
de
velo
pm
en
ts
84 85FOOD OUTLOOKMAY 2015
* A
col
lect
ion
of m
ajor
pol
icy
deve
lopm
ents
sta
rtin
g in
Jan
uary
201
1 is
ava
ilabl
e at
: htt
p://w
ww
.fao
.org
/eco
nom
ic/e
st/e
st-c
omm
oditi
es/c
omm
odity
-pol
icy-
arch
ive/
en/?
grou
pAN
Dco
mm
odity
=O
ilsee
ds,%
20oi
ls%
20an
d%20
mea
ls
CO
UN
TRY
PRO
DU
CT
DA
TEPO
LIC
Y C
ATE
GO
RY
/INST
RU
MEN
TD
ESC
RIP
TIO
N
Mal
aysi
a
Palm
oil
Oct
-14
to
Mar
-15
Exp
ort
tax
Susp
end
ed v
aria
ble
tax
on
cru
de
pal
m o
il ex
po
rts,
wit
h a
vie
w t
o s
tim
ula
te e
xpo
rts,
bri
ng
do
wn
d
om
esti
c in
ven
tori
es, a
nd
co
nta
in d
eclin
es in
pri
ces.
Palm
oil
Ap
r-15
Exp
ort
tax
Rea
ctiv
ated
th
e sl
idin
g e
xpo
rt t
ax r
egim
e fo
r cr
ud
e p
alm
oil,
wit
h a
vie
w t
o h
elp
sec
ure
ad
equ
ate
sup
plie
s fo
r th
e d
om
esti
c p
alm
oil
refi
nin
g in
du
stry
.
Paki
stan
Soyb
ean
sN
ov-
14Se
cto
r d
evel
op
men
t La
un
ched
a p
rog
ram
me
to p
rom
ote
do
mes
tic
soyb
ean
cu
ltiv
atio
n, w
ith
a v
iew
to
hel
p m
eet
mea
l d
eman
d b
y th
e d
om
esti
c p
ou
ltry
an
d a
qu
acu
ltu
re s
ecto
rs.
Veg
etab
le o
ilsJa
n-1
5Im
po
rt p
olic
yA
dd
ed a
ll m
ajo
r ed
ible
oils
(cr
ud
e an
d r
efin
ed)
to t
he
list
of
pro
du
cts
that
mu
st m
eet
Paki
stan
's q
ual
ity
stan
dar
ds
at t
he
imp
ort
sta
ge.
Phili
pp
ines
Co
con
ut
No
v-14
Sect
or
sup
po
rt
Pro
vid
ed s
tate
fu
nd
ing
to
reh
abili
tate
dam
aged
co
con
ut
tree
s in
are
as a
ffec
ted
by
typ
ho
on
Bo
ph
a in
la
te 2
012.
Co
con
ut
Dec
-14
Sect
or
dev
elo
pm
ent
Ap
pro
ved
su
pp
lem
enta
ry f
un
din
g f
or
the
Co
con
ut
Au
tho
rity
's a
ctiv
itie
s in
su
pp
ort
of
coco
nu
t fa
rmin
g.
Thai
lan
dPa
lm o
il Ja
n-1
5M
arke
t re
gu
lati
on
Ap
pro
ved
an
incr
ease
in p
alm
oil
reta
il p
rice
s, w
ith
a v
iew
to
sti
mu
late
th
e sa
le o
f ed
ible
oils
by
loca
l m
anu
fact
ure
rs.
Un
ited
Sta
tes
Oils
eed
sO
ct-1
4A
gri
cult
ura
l po
licy
Info
rmed
th
at (
as p
art
of
the
2014
Far
m B
ill)
a p
rog
ram
me
pro
vid
ing
rel
ief
to f
arm
ers
affe
cted
by
seve
re w
eath
er w
ou
ld b
e im
ple
men
ted
fro
m 2
015,
so
as
to o
ffer
bet
ter
risk
co
vera
ge
to f
arm
ers.
Soyb
ean
sO
ct-1
4M
arke
t re
gu
lati
on
Tem
po
rari
ly a
llow
ed, i
n Io
wa
Stat
e, c
ircu
lati
on
of
ove
rwei
gh
t tr
uck
load
s o
f ce
rtai
n p
rod
uct
s (i
ncl
ud
ing
so
ybea
ns)
, in
an
eff
ort
to
red
uce
pre
ssu
re o
n t
he
stat
e’s
ove
r-b
urd
ened
riv
er f
reig
ht
syst
em.
Bio
die
sel
No
v-14
Ren
ewab
le e
ner
gy
po
licy
Gra
nte
d f
eder
al s
up
po
rt f
or
the
pro
du
ctio
n o
f “
adva
nce
d b
iofu
els”
(fu
els
pro
du
ced
fro
m r
enew
able
b
iom
ass
oth
er t
han
mai
ze k
ern
el s
tarc
h);
elig
ible
fee
dst
ock
incl
ud
es v
eget
able
oils
an
d a
nim
al f
ats.
Bio
die
sel
Dec
-14
Ren
ewab
le e
ner
gy
po
licy
Ret
roac
tive
ly r
ein
stat
ed, f
or
cale
nd
ar y
ear
2014
, th
e b
iod
iese
l tax
ince
nti
ve t
hat
exp
ired
in J
anu
ary
2014
.
Bio
die
sel
Jan
-15
Ren
ewab
le e
ner
gy
po
licy
Allo
wed
Arg
enti
ne
bio
die
sel p
rod
uce
rs t
o a
pp
ly a
n a
lter
nat
ive
met
ho
d f
or
pro
vin
g t
hat
fee
dst
ock
use
d
to p
rod
uce
bio
die
sel w
as n
ot
gro
wn
on
def
ore
sted
lan
d, t
hu
s p
erm
itti
ng
bio
die
sel o
f A
rgen
tin
e o
rig
in
to b
enefi
t fr
om
US
bio
fuel
su
pp
ort
mea
sure
s.
Bio
die
sel
Feb
-15
Bio
die
sel p
olic
yG
ran
ted
, in
Iow
a St
ate,
a t
ax b
reak
on
sal
es o
f fu
el b
len
ds
con
tain
ing
at
leas
t 11
.per
cen
t o
f so
y-b
ased
b
iod
iese
l, w
ith
a v
iew
to
sp
ur
loca
l bio
die
sel u
sag
e.
Zam
bia
Edib
le o
ilsM
ar-1
5Im
po
rt p
olic
ySu
spen
ded
th
e is
suan
ce o
f lic
ense
s fo
r ed
ible
oil
imp
ort
s w
hile
car
ryin
g o
ut
inve
stig
atio
ns
abo
ut
po
ssib
le a
dve
rse
effe
cts
of
such
imp
ort
s o
n t
he
do
mes
tic
mar
ket.
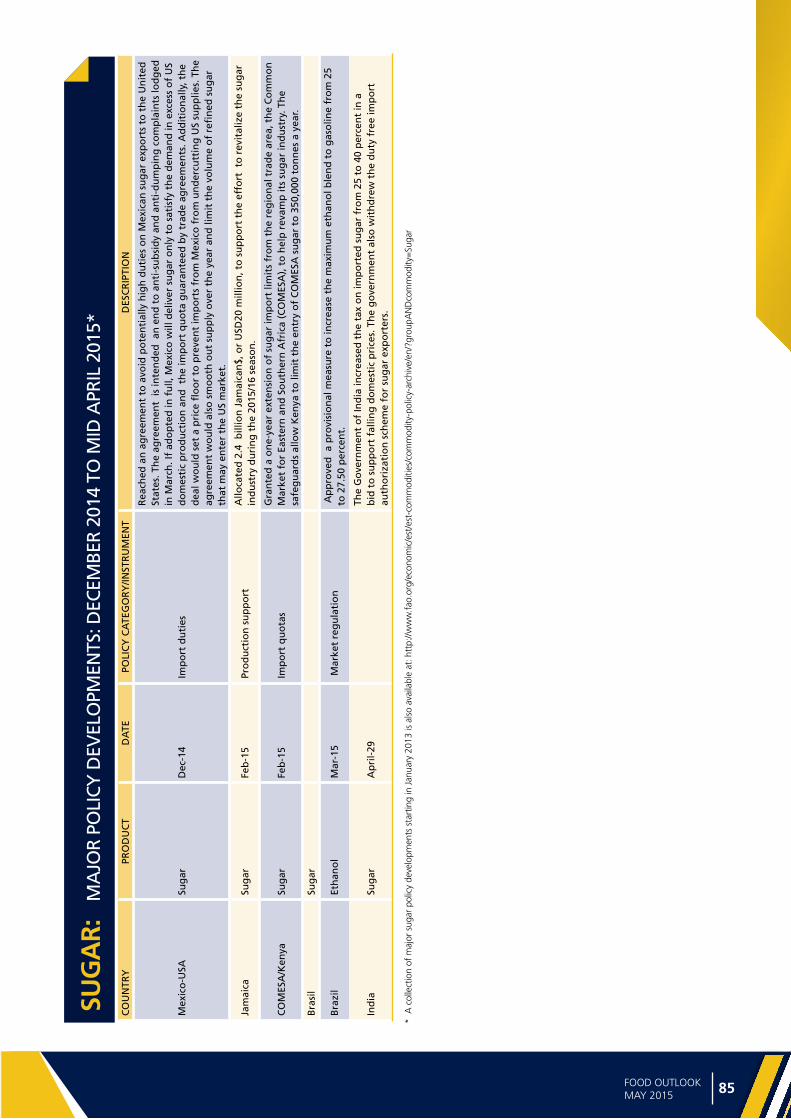
Ma
jor p
olicy d
eve
lop
me
nts
84 85FOOD OUTLOOKMAY 2015
SUG
AR:
M
AJO
R PO
LICY
DEV
ELO
PMEN
TS: D
ECEM
BER
2014
TO
MID
APR
IL 2
015*
CO
UN
TRY
PRO
DU
CT
DA
TEPO
LIC
Y C
ATE
GO
RY
/INST
RU
MEN
TD
ESC
RIP
TIO
N
Mex
ico
-USA
Sug
ar
Dec
-14
Imp
ort
du
ties
Rea
ched
an
ag
reem
ent
to a
void
po
ten
tial
ly h
igh
du
ties
on
Mex
ican
su
gar
exp
ort
s to
th
e U
nit
ed
Stat
es. T
he
agre
emen
t is
inte
nd
ed a
n e
nd
to
an
ti-s
ub
sid
y an
d a
nti
-du
mp
ing
co
mp
lain
ts lo
dg
ed
in M
arch
. If
ado
pte
d in
fu
ll, M
exic
o w
ill d
eliv
er s
ug
ar o
nly
to
sat
isfy
th
e d
eman
d in
exc
ess
of
US
do
mes
tic
pro
du
ctio
n a
nd
th
e im
po
rt q
uo
ta g
uar
ante
ed b
y tr
ade
agre
emen
ts. A
dd
itio
nal
ly, t
he
dea
l wo
uld
set
a p
rice
flo
or
to p
reve
nt
imp
ort
s fr
om
Mex
ico
fro
m u
nd
ercu
ttin
g U
S su
pp
lies.
Th
e ag
reem
ent
wo
uld
als
o s
mo
oth
ou
t su
pp
ly o
ver
the
year
an
d li
mit
th
e vo
lum
e o
f re
fin
ed s
ug
ar
that
may
en
ter
the
US
mar
ket.
Jam
aica
Sug
arFe
b-1
5Pr
od
uct
ion
su
pp
ort
Allo
cate
d 2
.4 b
illio
n J
amai
can
$, o
r U
SD20
mill
ion
, to
su
pp
ort
th
e ef
fort
to
rev
ital
ize
the
sug
ar
ind
ust
ry d
uri
ng
th
e 20
15/1
6 se
aso
n.
CO
MES
A/K
enya
Sug
arFe
b-1
5Im
po
rt q
uo
tas
Gra
nte
d a
on
e-ye
ar e
xten
sio
n o
f su
gar
imp
ort
lim
its
fro
m t
he
reg
ion
al t
rad
e ar
ea, t
he
Co
mm
on
M
arke
t fo
r Ea
ster
n a
nd
So
uth
ern
Afr
ica
(CO
MES
A),
to
hel
p r
evam
p it
s su
gar
ind
ust
ry. T
he
safe
gu
ard
s al
low
Ken
ya t
o li
mit
th
e en
try
of
CO
MES
A s
ug
ar t
o 3
50,0
00 t
on
nes
a y
ear.
Bra
sil
Sug
ar
Bra
zil
Eth
ano
lM
ar-1
5 M
arke
t re
gu
lati
on
Ap
pro
ved
a p
rovi
sio
nal
mea
sure
to
incr
ease
th
e m
axim
um
eth
ano
l ble
nd
to
gas
olin
e fr
om
25
to 2
7.50
per
cen
t.
Ind
iaSu
gar
Ap
ril-
29Th
e G
ove
rnm
ent
of
Ind
ia in
crea
sed
th
e ta
x o
n im
po
rted
su
gar
fro
m 2
5 to
40
per
cen
t in
a
bid
to
su
pp
ort
fal
ling
do
mes
tic
pri
ces.
Th
e g
ove
rnm
ent
also
wit
hd
rew
th
e d
uty
fre
e im
po
rt
auth
ori
zati
on
sch
eme
for
sug
ar e
xpo
rter
s.
* A
col
lect
ion
of m
ajor
sug
ar p
olic
y de
velo
pmen
ts s
tart
ing
in J
anua
ry 2
013
is a
lso
avai
labl
e at
: htt
p://w
ww
.fao
.org
/eco
nom
ic/e
st/e
st-c
omm
oditi
es/c
omm
odity
-pol
icy-
arch
ive/
en/?
grou
pAN
Dco
mm
odity
=Su
gar

Ma
jor
po
licy
de
velo
pm
en
ts
86 87FOOD OUTLOOKMAY 2015
MEA
T:
MA
JOR
POLI
CY D
EVEL
OPM
ENTS
: NO
VEM
BER
2014
TO
MID
APR
IL 2
015*
CO
UN
TRY
PRO
DU
CT
DA
TEPO
LIC
Y C
ATE
GO
RY
/INST
RU
MEN
TD
ESC
RIP
TIO
N
An
go
laPo
ult
ryJa
n-1
5Im
po
rt q
uo
taA
nn
ou
nce
d im
po
rt q
uo
tas
on
14
foo
d it
ems,
incl
ud
ing
mea
t. T
he
qu
ota
s re
pla
ce t
he
pre
vio
us
syst
em o
f im
po
rt li
cen
sin
g.
Ch
ina
Bo
vin
e m
eat
Feb
-15
Imp
ort
ban
lift
edLi
fted
a lo
ng
-sta
nd
ing
imp
ort
ban
on
bee
f fr
om
Irel
and
: det
ails
of
the
imp
ort
pro
toco
l sti
ll n
eed
to
be
agre
ed.
Pou
ltry
Jan
-15
Imp
ort
ban
Ban
ned
imp
ort
s o
f p
ou
ltry
an
d p
ou
ltry
-rel
ated
pro
du
cts
fro
m t
he
Un
ited
Sta
tes,
fo
llow
ing
det
ecti
on
of
hig
hly
pat
ho
gen
ic a
vian
infl
uen
za (
HPA
I) t
her
e.
Pou
ltry
Jan
-15
Mar
ket
reg
ula
tio
nPu
blis
hed
po
ult
ry t
rad
ing
an
d m
anag
emen
t re
gu
lati
on
s lim
itin
g li
ve b
ird
tra
din
g in
urb
an a
reas
, in
o
rder
to
ste
m t
he
tran
smis
sio
n o
f av
ian
infl
uen
za.
Euro
pea
n U
nio
nB
ovi
ne
mea
tM
ar-1
5Im
po
rt b
an li
fted
Lift
ed t
he
imp
ort
ban
on
bee
f fr
om
Par
agu
ay, i
ntr
od
uce
d in
Sep
tem
ber
201
1 fo
llow
ing
an
ou
tbre
ak o
f fo
ot-
and
-mo
uth
dis
ease
th
ere.
Pig
mea
tM
ar-1
5St
ate
mar
ket
Reg
ula
tio
nA
do
pte
d A
id-f
or-
Priv
ate-
Sto
rag
e m
easu
res
for
pig
mea
t.
Ind
iaB
ovi
ne
mea
tD
ec-1
4St
ate
Mar
ket
Reg
ula
tio
nLa
un
ched
“R
ash
triy
a G
oku
l Mis
sio
n”
un
der
th
e N
atio
nal
Pro
gra
mm
e fo
r B
ovi
ne
Bre
edin
g a
nd
Dai
ry
Dev
elo
pm
ent
(NPB
BD
) to
co
nse
rve
and
dev
elo
p in
dig
eno
us
bo
vin
e b
reed
s an
d t
o r
aise
pro
du
ctiv
ity.
Iraq
Bo
vin
e m
eat
Mar
-15
Imp
ort
ban
lift
edLi
fted
ban
on
bee
f im
po
rts
fro
m B
razi
l, w
hic
h h
ad b
een
intr
od
uce
d in
201
4 fo
llow
ing
a c
ase
of
bo
vin
e sp
on
gif
orm
en
cep
hal
op
ath
y (B
SE)
ther
e.
Pou
ltry
Feb
-15
Imp
ort
tax
An
no
un
ced
a s
ub
stan
tial
incr
ease
in im
po
rt d
uti
es o
n p
ou
ltry
mea
t an
d e
gg
s fr
om
Tu
rkey
.
Jap
anA
llFe
b-1
5R
egu
lato
ry m
easu
reC
han
ged
sta
nd
ard
s o
n L
iste
ria
mo
no
cyto
gen
es, f
acili
tati
ng
gre
ater
imp
ort
atio
n o
f m
eat
and
oth
er
anim
al p
rod
uct
s.
Jord
anPo
ult
ryJa
n-1
5Im
po
rt b
anIm
po
sed
a w
eig
ht
limit
of
less
th
an 2
.5 k
g/p
ack
for
imp
ort
ed c
hic
ken
leg
qu
arte
rs.
Kaz
akh
stan
All
Feb
-15
Tari
ff r
ate
qu
ota
Ap
pro
ved
th
e an
nu
alta
riff
qu
ota
s fo
r fr
esh
or
chill
ed m
eat
(HS
0201
), f
roze
n m
eat
(HS
0202
), p
ork
(H
S 02
03)
and
po
ult
ry m
eat
(HS
0207
).
Mex
ico
Pou
ltry
Jan
-15
Imp
ort
ban
Ban
ned
all
po
ult
ry a
nd
po
ult
ry p
rod
uct
s o
rig
inat
ing
in t
he
stat
e o
f C
alif
orn
ia, i
ncl
ud
ing
eg
g
pro
du
cts,
hat
chin
g e
gg
s an
d b
aby
chic
ks –
du
e to
th
e p
rese
nce
of
hig
hly
pat
ho
gen
ic a
vian
infl
uen
za
(HPA
I).
Ad
dit
ion
al t
esti
ng
req
uir
emen
ts f
or
po
ult
ry f
rom
co
nti
gu
ou
s an
d n
earb
y U
S st
ates
wer
e al
so
ann
ou
nce
d.
Paki
stan
All
Feb
-15
Imp
ort
ban
lift
edR
each
ed a
n a
gre
emen
t w
ith
th
e U
SDA
reg
ard
ing
hea
lth
cer
tifi
cati
on
of
catt
le s
hip
ped
fro
m t
he
Un
ited
St
ates
.
Phili
pp
ines
Pou
ltry
Feb
-15
Imp
ort
ban
Ban
ned
imp
ort
s o
f p
ou
ltry
pro
du
cts
fro
m Is
rael
an
d t
he
US
stat
e o
f O
reg
on
, fo
llow
ing
co
nce
rns
ove
r th
e p
rese
nce
of
avia
n in
flu
enza
.
Ru
ssia
n F
eder
atio
nPi
gm
eat
Dec
-14
Imp
ort
ban
Tem
po
rari
ly s
usp
end
ed im
po
rts
of
no
n-h
eat-
trea
ted
po
rk p
rod
uct
s fr
om
Bel
aru
s, d
ue
to A
fric
an s
win
e fe
ver
con
cern
s.
Sou
th A
fric
a B
ovi
ne
mea
tM
ar-1
5Im
po
rt b
an li
fted
Lift
ed b
an o
n b
eef
imp
ort
s fr
om
Bra
zil,
intr
od
uce
d in
201
4 fo
llow
ing
a c
ase
of
bo
vin
e sp
on
gif
orm
en
cep
hal
op
ath
y (B
SE)
in B
razi
l.
Swit
zerl
and
Pou
ltry
No
v-14
Imp
ort
ban
Ban
ned
imp
ort
s o
f p
ou
ltry
fro
m s
pec
ified
are
as o
f th
e N
eth
erla
nd
s an
d t
he
UK
, fo
llow
ing
ou
tbre
aks
of
avia
n in
flu
enza
.
Turk
eyA
llM
ar-1
5M
arke
t R
egu
lati
on
Pub
lish
ed a
dec
isio
n p
erm
itti
ng
th
e im
po
rtat
ion
of
feed
er c
attl
e b
y m
emb
ers
of
asso
ciat
ion
s/co
op
erat
ives
, pro
vid
ed it
is a
pp
rove
d b
y th
e M
eat
and
Milk
Bo
ard
(ES
K).
Ukr
ain
ePo
ult
ryN
ov-
14Im
po
rt b
anB
ann
ed p
ou
ltry
imp
ort
s fr
om
UK
, Net
her
lan
ds
and
Ger
man
y, f
ollo
win
g r
epo
rted
ou
tbre
aks
of
H5N
8 av
ian
infl
uen
za.
* A
col
lect
ion
of m
ajor
mea
t po
licy
deve
lopm
ents
sta
rtin
g in
Jan
uary
201
1 is
ava
ilabl
e at
: htt
p://w
ww
.fao
.org
/eco
nom
ic/e
st/e
st-c
omm
oditi
es/c
omm
odity
-pol
icy-
arch
ive/
en/?
grou
pAN
Dco
mm
odity
=M
eat
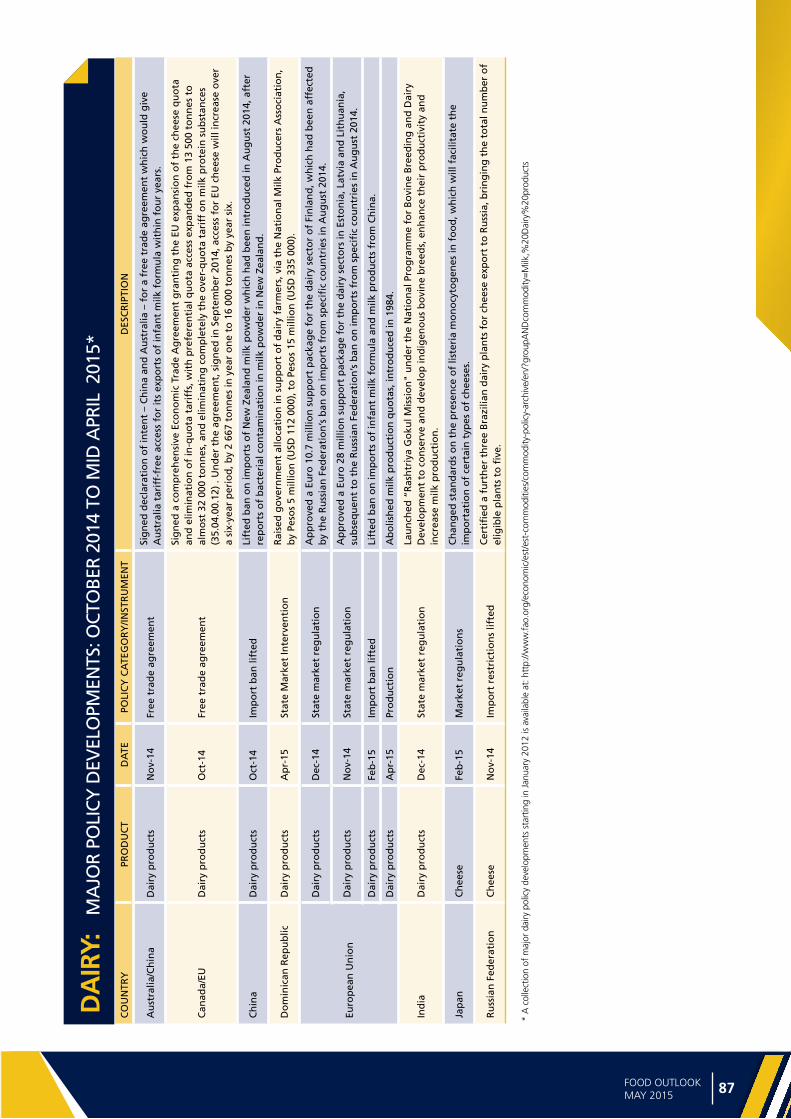
Ma
jor p
olicy d
eve
lop
me
nts
86 87FOOD OUTLOOKMAY 2015
DA
IRY:
M
AJO
R PO
LICY
DEV
ELO
PMEN
TS: O
CTO
BER
2014
TO
MID
APR
IL 2
015*
CO
UN
TRY
PRO
DU
CT
DA
TEPO
LIC
Y C
ATE
GO
RY
/INST
RU
MEN
TD
ESC
RIP
TIO
N
Au
stra
lia/C
hin
aD
airy
pro
du
cts
No
v-14
Free
tra
de
agre
emen
tSi
gn
ed d
ecla
rati
on
of
inte
nt
– C
hin
a an
d A
ust
ralia
– f
or
a fr
ee t
rad
e ag
reem
ent
wh
ich
wo
uld
giv
e A
ust
ralia
tar
iff-
free
acc
ess
for
its
exp
ort
s o
f in
fan
t m
ilk f
orm
ula
wit
hin
fo
ur
year
s.
Can
ada/
EUD
airy
pro
du
cts
Oct
-14
Free
tra
de
agre
emen
t
Sig
ned
a c
om
pre
hen
sive
Eco
no
mic
Tra
de
Ag
reem
ent
gra
nti
ng
th
e EU
exp
ansi
on
of
the
chee
se q
uo
ta
and
elim
inat
ion
of
in-q
uo
ta t
arif
fs, w
ith
pre
fere
nti
al q
uo
ta a
cces
s ex
pan
ded
fro
m 1
3 50
0 to
nn
es t
o
alm
ost
32
000
ton
nes
, an
d e
limin
atin
g c
om
ple
tely
th
e o
ver-
qu
ota
tar
iff
on
milk
pro
tein
su
bst
ance
s (3
5.04
.00.
12)
. Un
der
th
e ag
reem
ent,
sig
ned
in S
epte
mb
er 2
014,
acc
ess
for
EU c
hee
se w
ill in
crea
se o
ver
a si
x-ye
ar p
erio
d, b
y 2
667
ton
nes
in y
ear
on
e to
16
000
ton
nes
by
year
six
.
Ch
ina
Dai
ry p
rod
uct
sO
ct-1
4Im
po
rt b
an li
fted
Lift
ed b
an o
n im
po
rts
of
New
Zea
lan
d m
ilk p
ow
der
wh
ich
had
bee
n in
tro
du
ced
in A
ug
ust
201
4, a
fter
re
po
rts
of
bac
teri
al c
on
tam
inat
ion
in m
ilk p
ow
der
in N
ew Z
eala
nd
.
Do
min
ican
Rep
ub
licD
airy
pro
du
cts
Ap
r-15
Stat
e M
arke
t In
terv
enti
on
Rai
sed
go
vern
men
t al
loca
tio
n in
su
pp
ort
of
dai
ry f
arm
ers,
via
th
e N
atio
nal
Milk
Pro
du
cers
Ass
oci
atio
n,
by
Peso
s 5
mill
ion
(U
SD 1
12 0
00),
to
Pes
os
15 m
illio
n (
USD
335
000
).
Euro
pea
n U
nio
n
Dai
ry p
rod
uct
sD
ec-1
4St
ate
mar
ket
reg
ula
tio
nA
pp
rove
d a
Eu
ro 1
0.7
mill
ion
su
pp
ort
pac
kag
e fo
r th
e d
airy
sec
tor
of
Fin
lan
d, w
hic
h h
ad b
een
aff
ecte
d
by
the
Ru
ssia
n F
eder
atio
n’s
ban
on
imp
ort
s fr
om
sp
ecifi
c co
un
trie
s in
Au
gu
st 2
014.
Dai
ry p
rod
uct
sN
ov-
14St
ate
mar
ket
reg
ula
tio
nA
pp
rove
d a
Eu
ro 2
8 m
illio
n s
up
po
rt p
acka
ge
for
the
dai
ry s
ecto
rs in
Est
on
ia, L
atvi
a an
d L
ith
uan
ia,
sub
seq
uen
t to
th
e R
uss
ian
Fed
erat
ion
’s b
an o
n im
po
rts
fro
m s
pec
ific
cou
ntr
ies
in A
ug
ust
201
4.
Dai
ry p
rod
uct
sFe
b-1
5Im
po
rt b
an li
fted
Lift
ed b
an o
n im
po
rts
of
infa
nt
milk
fo
rmu
la a
nd
milk
pro
du
cts
fro
m C
hin
a.
Dai
ry p
rod
uct
sA
pr-
15Pr
od
uct
ion
Ab
olis
hed
milk
pro
du
ctio
n q
uo
tas,
intr
od
uce
d in
198
4.
Ind
iaD
airy
pro
du
cts
Dec
-14
Stat
e m
arke
t re
gu
lati
on
Lau
nch
ed “
Ras
htr
iya
Go
kul M
issi
on
" u
nd
er t
he
Nat
ion
al P
rog
ram
me
for
Bo
vin
e B
reed
ing
an
d D
airy
D
evel
op
men
t to
co
nse
rve
and
dev
elo
p in
dig
eno
us
bo
vin
e b
reed
s, e
nh
ance
th
eir
pro
du
ctiv
ity
and
in
crea
se m
ilk p
rod
uct
ion
.
Jap
anC
hee
seFe
b-1
5M
arke
t re
gu
lati
on
sC
han
ged
sta
nd
ard
s o
n t
he
pre
sen
ce o
f lis
teri
a m
on
ocy
tog
enes
in f
oo
d, w
hic
h w
ill f
acili
tate
th
e im
po
rtat
ion
of
cert
ain
typ
es o
f ch
eese
s.
Ru
ssia
n F
eder
atio
n
Ch
eese
No
v-14
Imp
ort
res
tric
tio
ns
lifte
dC
erti
fied
a f
urt
her
th
ree
Bra
zilia
n d
airy
pla
nts
fo
r ch
eese
exp
ort
to
Ru
ssia
, bri
ng
ing
th
e to
tal n
um
ber
of
elig
ible
pla
nts
to
five
.
* A
col
lect
ion
of m
ajor
dai
ry p
olic
y de
velo
pmen
ts s
tart
ing
in J
anua
ry 2
012
is a
vaila
ble
at: h
ttp:
//ww
w.f
ao.o
rg/e
cono
mic
/est
/est
-com
mod
ities
/com
mod
ity-p
olic
y-ar
chiv
e/en
/?gr
oupA
ND
com
mod
ity=
Milk
,%20
Dai
ry%
20pr
oduc
ts
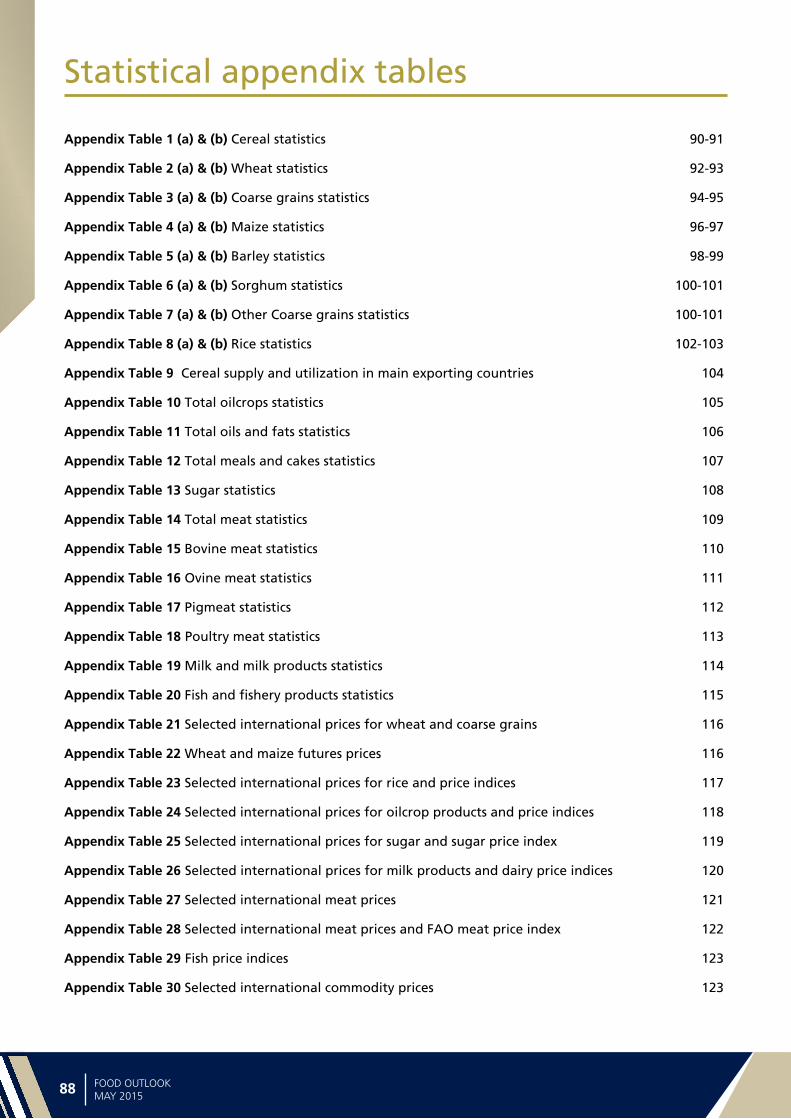
Sta
tist
ica
l a
pp
en
dix
88 89FOOD OUTLOOKMAY 2015
Appendix Table 1 (a) & (b) Cereal statistics 90-91
Appendix Table 2 (a) & (b) Wheat statistics 92-93
Appendix Table 3 (a) & (b) Coarse grains statistics 94-95
Appendix Table 4 (a) & (b) Maize statistics 96-97
Appendix Table 5 (a) & (b) Barley statistics 98-99
Appendix Table 6 (a) & (b) Sorghum statistics 100-101
Appendix Table 7 (a) & (b) Other Coarse grains statistics 100-101
Appendix Table 8 (a) & (b) Rice statistics 102-103
Appendix Table 9 Cereal supply and utilization in main exporting countries 104
Appendix Table 10 Total oilcrops statistics 105
Appendix Table 11 Total oils and fats statistics 106
Appendix Table 12 Total meals and cakes statistics 107
Appendix Table 13 Sugar statistics 108
Appendix Table 14 Total meat statistics 109
Appendix Table 15 Bovine meat statistics 110
Appendix Table 16 Ovine meat statistics 111
Appendix Table 17 Pigmeat statistics 112
Appendix Table 18 Poultry meat statistics 113
Appendix Table 19 Milk and milk products statistics 114
Appendix Table 20 Fish and fishery products statistics 115
Appendix Table 21 Selected international prices for wheat and coarse grains 116
Appendix Table 22 Wheat and maize futures prices 116
Appendix Table 23 Selected international prices for rice and price indices 117
Appendix Table 24 Selected international prices for oilcrop products and price indices 118
Appendix Table 25 Selected international prices for sugar and sugar price index 119
Appendix Table 26 Selected international prices for milk products and dairy price indices 120
Appendix Table 27 Selected international meat prices 121
Appendix Table 28 Selected international meat prices and FAO meat price index 122
Appendix Table 29 Fish price indices 123
Appendix Table 30 Selected international commodity prices 123
Statistical appendix tables
Statistica
l ap
pe
nd
ix
88 89FOOD OUTLOOKMAY 2015
NOTES
General• FAO estimates and forecasts are
based on official and unofficial
sources.
• Unless otherwise stated, all charts
and tables refer to FAO data as
source.
• Estimates of world imports and
exports may not always match, mainly
because shipments and deliveries
do not necessarily occur in the same
marketing year.
• Tonnes refer to metric tonnes.
• All totals are computed from
unrounded data.
• Regional totals may include estimates
for countries not listed. The countries
shown in the tables were chosen
based on their importance of either
production or trade in each region.
The totals shown for Central America
include countries in the Caribbean.
• Estimates for China also include those
for the Taiwan Province, Hong Kong
SAR and Macao SAR, unless otherwise
stated.
• Up to 2012/13, the European
Union includes 27 member states.
From 2013/14, the European Union
includes 28 member states.
• ‘-‘ means nil or negligible.
Production• Cereals: Data refer to the calendar
year in which the whole harvest or
bulk of harvest takes place.
• Sugar: Figures refer to centrifugal
sugar derived from sugar cane or
beet, expressed in raw equivalents.
Data relate to the October/September
season.
Utilization• Cereals: Data are on individual
country’s marketing year basis.
• Sugar: Figures refer to centrifugal
sugar derived from sugar cane or
beet, expressed in raw equivalents.
Data relate to the October/September
season.
Trade• Trade between European Union
member states is excluded, unless
otherwise stated.
• Wheat: Trade data include wheat
flour in wheat grain equivalent. The
time reference period is July/June,
unless otherwise stated.
• Coarse grains: The time reference
period is July/June, unless otherwise
stated.
• Rice, dairy and meat products:
The time reference period is January/
December.
• Oilseeds, oils and fats and meals
and sugar: The time reference
period is October/September, unless
otherwise stated.
Stocks• Cereals: Data refer to carry-overs at
the close of national crop seasons
ending in the year shown.
Price indices• The FAO price indices are calculated
using the Laspeyres formula; the weights used are based on the average export value of each commodity for the 2002-2004
period.
COUNTRY CLASSIFICATION
In the presentation of statistical
material, countries are subdivided
according to geographical location as
well as into the following two main
economic groupings: “developed
countries” (including the developed
market economies and the transition
markets) and “developing countries”
(including the developing market
economies and the Asia centrally
planned countries). The designation
“Developed” and “Developing”
economies is intended for statistical
convenience and does not necessarily
express a judgement about the stage
reached by a particular country or area
in the development process.
References are also made to special country groupings: Low-Income Food-Deficit Countries (LIFDCs), Least Developed Countries (LDCs). The LIFDCs include 55 countries that are net importers of basic foodstuffs with per caput income below the level used by the World Bank to determine eligibility for International Development Aid (IDA) assistance (i.e. USD 1 945 in 2011). The LDCs group currently includes 48 countries with low income as well as weak human resources and low level of economic diversification. The list is reviewed every three years by the Economic and Social Council of the United Nations.
DISCLAIMER
The designations employed and
the presentation of material in
this publication do not imply the
expression of any opinion whatsoever
on the part of the Food and
Agriculture Organization of the United
Nations concerning the legal status
of any country, territory, city or area
or of its authorities, or concerning
the delimitation of its frontiers or
boundaries.

Sta
tist
ica
l a
pp
en
dix
90 91FOOD OUTLOOKMAY 2015
APPENDIX TABLE 1(A): CEREAL STATISTICS
Production Imports Exports
2011-2013 2014 2015
11/12-13/142014/15 2015/16
11/12-13/14 2014/15 2015/16
average average average estim. f’cast estim. f’cast estim. f’cast
(. . . . . . . . . . . . . . . . . . . . . . . . . . . . . . . . . . . . . . . . million tonnes . . . . . . . . . . . . . . . . . . . . . . . . . . . . . . . . . . . . . . .)
ASIA 1 096.3 1 112.9 1 123.2 160.4 183.3 181.2 59.0 53.1 54.6 Bangladesh 37.5 38.5 38.4 2.6 4.2 4.2 - - - China 475.0 493.6 495.5 21.2 29.2 28.1 1.1 1.1 1.3 India 239.2 237.1 238.2 0.1 0.2 0.3 20.9 13.8 15.2 Indonesia 61.8 63.8 65.2 10.8 11.8 11.8 0.2 0.2 0.2 Iran, Islamic Republic of 19.8 19.1 19.8 11.3 15.0 14.7 0.2 0.5 0.5 Iraq 4.1 4.4 4.1 5.0 5.1 5.2 - - - Japan 8.7 8.7 8.7 24.7 25.3 25.2 0.4 0.3 0.3 Kazakhstan 18.7 16.5 16.0 - - - 8.7 6.5 5.5 Korea, Republic of 4.4 4.5 4.4 13.9 14.3 14.7 0.1 0.1 0.1 Myanmar 19.7 20.3 20.3 0.3 0.3 0.3 0.9 1.2 1.2 Pakistan 35.4 37.3 38.3 0.4 0.8 0.8 3.8 4.3 4.4 Philippines 19.0 20.2 20.7 4.6 5.3 5.4 - - - Saudi Arabia 1.2 0.9 0.8 15.1 16.0 16.0 - - - Thailand 30.0 27.7 28.2 2.8 2.4 2.5 8.7 11.5 11.9 Turkey 35.0 32.4 34.5 5.4 8.1 7.0 3.2 3.3 3.7 Viet Nam 33.9 35.2 35.0 4.4 4.7 4.9 7.0 6.5 6.6
AFRICA 159.0 170.6 165.0 74.4 77.8 78.9 8.7 8.3 7.0 Algeria 4.7 3.3 4.0 10.6 11.6 11.6 - - - Egypt 20.1 19.6 19.4 17.2 18.3 18.4 0.4 0.5 0.5 Ethiopia 20.3 22.0 21.2 0.9 0.7 0.8 1.4 1.7 1.3 Morocco 7.9 7.0 8.7 6.1 5.9 5.7 0.1 0.1 0.1 Nigeria 20.2 22.5 22.4 7.3 7.8 8.1 0.7 0.7 0.7 South Africa 14.5 17.3 12.3 3.1 2.9 3.4 2.3 2.2 1.1 Sudan 3.6 7.9 6.6 2.6 2.8 2.6 - 0.2 0.3
CENTRAL AMERICA 38.8 42.1 41.4 26.2 27.3 27.4 1.6 2.1 1.8 Mexico 32.1 35.7 34.6 15.8 16.2 16.5 1.4 1.9 1.7
SOUTH AMERICA 159.7 177.5 172.4 27.6 29.8 28.4 57.8 54.2 54.7 Argentina 46.7 54.9 50.6 - 0.1 0.1 29.5 24.2 25.7 Brazil 85.7 96.0 94.7 9.1 9.2 8.1 21.6 23.8 22.8 Chile 3.6 3.3 3.6 2.4 2.5 2.4 0.1 0.1 0.1 Colombia 3.2 2.4 2.9 6.0 7.2 7.2 0.1 0.1 0.1 Peru 4.1 4.0 4.2 4.1 4.4 4.4 - - - Venezuela 3.1 3.2 3.2 4.2 4.7 4.9 - 0.1 0.1
NORTH AMERICA 444.7 490.9 481.9 9.6 10.9 10.4 94.5 103.7 108.8 Canada 55.5 51.3 53.3 1.4 2.3 1.7 24.0 26.8 27.7 United States of America 389.3 439.6 428.6 8.2 8.7 8.6 70.6 77.0 81.1
EUROPE 453.0 518.4 488.5 22.6 20.5 21.3 81.6 106.6 98.5 European Union 290.5 326.8 311.7 18.3 16.3 17.0 30.3 42.0 37.6 Russian Federation 82.8 102.1 94.4 0.8 0.7 0.7 22.8 27.3 26.0 Serbia 8.0 9.6 8.7 0.1 0.1 0.1 2.2 3.1 3.1 Ukraine 54.8 63.7 58.7 0.1 0.2 0.2 25.5 33.2 30.7
OCEANIA 40.6 35.9 36.9 1.6 1.7 1.7 28.1 23.4 23.9 Australia 39.7 35.0 36.0 0.2 0.2 0.2 28.1 23.4 23.9
WORLD 2 392.2 2 548.3 2 509.2 322.4 351.4 349.4 331.3 351.4 349.4 Developing countries 1 396.8 1 445.2 1 449.1 250.8 279.7 277.3 114.9 107.8 110.4 Developed countries 995.3 1 103.1 1 060.1 71.5 71.7 72.1 216.5 243.6 238.9 LIFDCs 434.3 445.1 446.0 51.6 55.8 56.1 26.7 19.5 20.6 LDCs 159.4 170.5 168.0 26.7 29.5 29.1 7.1 7.3 7.1

Statistica
l ap
pe
nd
ix
90 91FOOD OUTLOOKMAY 2015
APPENDIX TABLE 1(B): CEREAL STATISTICS
Total Utilization Stocks ending in Per caput food use
11/12-13/14 2014/15 2015/16
2012-20142015 2016
11/12-13/14 2014/15 2015/16
average average average estim. f’cast estim. f’cast estim. f’cast
(. . . . . . . . . . . . . . . . . . . . . . . . . . million tonnes . . . . . . . . . . . . . . . . . . . . .) (. . . . . . . . . . Kg/year . . . . . . .)
ASIA 1 171.9 1 241.8 1 258.3 387.7 407.3 395.7 161.5 162.3 162.6 Bangladesh 40.4 41.7 42.3 9.9 10.4 10.1 194.3 197.0 199.5 China 478.7 518.3 526.7 229.0 251.6 247.2 149.5 149.4 149.3 India 216.1 224.1 225.9 49.8 46.9 43.0 153.0 153.2 153.6 Indonesia 72.1 76.2 77.0 13.2 12.8 12.2 209.3 212.2 212.6 Iran, Islamic Republic of 28.9 32.3 33.1 5.5 8.7 9.5 205.2 205.5 205.4 Iraq 8.8 9.4 9.5 2.1 2.6 2.4 198.1 199.0 199.1 Japan 33.2 33.6 33.7 4.9 4.9 5.0 130.1 130.2 130.2 Kazakhstan 10.3 10.7 10.4 5.0 2.2 2.3 165.5 166.4 166.5 Korea, Republic of 18.3 18.8 18.6 4.2 4.0 4.3 119.6 117.1 116.8 Myanmar 20.2 19.6 19.7 3.8 2.1 1.8 221.0 218.3 219.3 Pakistan 31.7 33.1 33.7 4.2 4.0 4.3 147.4 147.6 147.7 Philippines 23.8 25.2 26.0 2.8 3.1 3.2 160.5 163.9 166.1 Saudi Arabia 15.7 16.7 17.0 5.2 6.1 5.9 144.6 147.0 147.0 Thailand 21.0 21.4 22.2 16.9 15.1 11.8 155.9 158.1 158.6 Turkey 36.4 37.7 38.1 4.7 5.2 4.8 240.8 242.0 241.7 Viet Nam 30.4 32.7 33.2 5.9 7.4 7.3 207.0 211.0 210.8
AFRICA 222.9 237.1 239.3 39.5 41.7 37.9 149.9 151.7 150.9 Algeria 14.4 15.7 15.7 5.5 5.8 5.8 224.4 224.2 224.2 Egypt 36.6 37.7 38.1 6.9 6.4 5.7 289.9 289.7 288.7 Ethiopia 19.3 20.9 20.9 2.0 2.1 1.9 168.4 171.2 171.0 Morocco 13.3 13.8 13.9 4.7 5.1 5.5 258.2 258.0 258.1 Nigeria 26.7 29.1 29.7 1.1 1.2 1.0 118.4 122.6 120.0 South Africa 15.8 16.3 16.1 2.2 3.2 1.9 171.8 171.9 171.8 Sudan 6.8 8.7 8.7 0.8 1.9 1.7 172.3 182.7 181.7
CENTRAL AMERICA 63.4 67.2 67.5 6.0 7.2 6.9 157.8 158.6 158.9 Mexico 46.6 50.0 50.0 2.8 3.6 3.2 185.6 187.0 186.6
SOUTH AMERICA 128.6 143.5 146.0 20.7 32.0 30.0 121.4 121.9 122.0 Argentina 17.4 24.0 24.1 4.3 8.4 6.3 136.4 138.9 139.2 Brazil 72.3 78.0 80.1 8.7 14.0 13.9 116.4 116.6 116.6 Chile 6.0 6.2 6.2 0.8 0.9 0.9 150.4 150.9 151.1 Colombia 9.3 10.2 10.2 0.6 0.7 0.7 101.3 100.6 101.0 Peru 8.0 8.4 8.4 1.4 1.6 1.4 148.9 150.3 151.2 Venezuela 7.3 7.9 7.9 0.6 0.7 0.9 135.7 136.5 136.3
NORTH AMERICA 357.8 377.9 383.1 58.9 78.2 78.8 109.6 110.2 110.3 Canada 29.3 30.4 29.5 10.6 9.2 7.0 96.1 96.2 97.1 United States of America 328.5 347.5 353.6 48.3 69.1 71.9 111.0 111.8 111.7
EUROPE 397.5 413.6 412.6 53.3 70.9 69.4 135.3 136.1 135.8 European Union 278.0 287.3 288.8 30.7 47.1 49.1 135.3 136.1 136.0 Russian Federation 65.5 71.8 71.1 9.7 9.7 7.6 126.9 127.9 128.2 Serbia 6.1 6.6 5.6 0.9 0.8 0.8 151.6 152.5 127.2 Ukraine 28.9 30.7 29.8 9.0 8.6 6.9 157.2 158.1 159.5
OCEANIA 15.1 15.0 15.1 8.8 8.3 7.9 90.9 90.8 91.6 Australia 12.8 12.6 12.7 8.3 7.8 7.3 98.1 98.0 99.4
WORLD 2 357.3 2 496.0 2 521.9 574.9 645.6 626.6 151.6 152.6 152.7 Developing countries 1 504.0 1 604.5 1 626.3 435.7 471.4 454.3 156.8 157.7 157.8 Developed countries 853.3 891.6 895.6 139.2 174.2 172.3 130.7 131.4 131.3 LIFDCs 456.5 479.1 484.5 89.6 88.0 82.1 148.6 150.1 150.3 LDCs 179.6 189.1 191.3 35.7 36.6 33.8 154.3 156.4 157.1

Sta
tist
ica
l a
pp
en
dix
92 93FOOD OUTLOOKMAY 2015
APPENDIX TABLE 2(A): WHEAT STATISTICS
Production Imports Exports
2011-2013 2014 2015
11/12-13/142014/15 2015/16
11/12-13/14 2014/15 2015/16
average average average estim. f’cast estim. f’cast estim. f’cast
(. . . . . . . . . . . . . . . . . . . . . . . . . . . . . . . . . . . . . . . . million tonnes . . . . . . . . . . . . . . . . . . . . . . . . . . . . . . . . . . . . . . .)
ASIA 314.7 320.2 321.1 69.5 73.6 72.8 20.0 14.9 14.6 Bangladesh 1.2 1.3 1.5 2.1 3.4 3.3 - - - China 120.1 126.2 126.5 6.0 3.3 3.6 0.4 0.4 0.5 of which Taiwan Prov. - - - 1.3 1.6 1.6 - - - India 91.8 95.9 92.0 - 0.1 0.2 5.2 2.0 2.0 Indonesia - - - 7.0 7.6 7.5 0.1 0.1 0.1 Iran, Islamic Republic of 13.8 13.0 13.5 4.6 6.3 6.0 0.2 0.5 0.5 Iraq 2.8 3.0 2.8 3.4 3.3 3.4 - - - Japan 0.8 0.8 0.9 6.1 6.0 6.0 0.3 0.3 0.3 Kazakhstan 15.5 13.0 12.5 - - - 8.1 6.0 5.0 Korea, Republic of - - - 4.8 4.2 4.5 0.1 0.1 0.1 Pakistan 24.3 25.3 26.4 0.3 0.7 0.7 0.6 0.5 0.8 Philippines - - - 3.0 3.3 3.3 - - - Saudi Arabia 0.8 0.5 0.4 2.8 3.5 3.5 - - - Thailand - - - 2.2 1.9 2.1 0.2 0.2 0.2 Turkey 21.3 19.0 21.0 3.8 5.5 4.5 3.1 3.0 3.5
AFRICA 25.8 24.9 26.7 41.4 43.0 43.0 1.2 1.0 0.9 Algeria 3.2 2.0 2.5 6.8 7.2 7.2 - - - Egypt 8.7 8.8 8.5 10.2 10.7 11.0 - - - Ethiopia 3.5 4.0 4.0 0.8 0.7 0.8 - - - Morocco 5.6 5.1 6.5 3.9 3.3 3.0 0.1 0.1 0.1 Nigeria 0.1 0.1 0.1 4.2 4.7 4.7 0.5 0.5 0.5 South Africa 1.9 1.8 1.8 1.6 1.7 1.6 0.3 0.2 0.1 Tunisia 1.5 1.5 1.7 1.7 1.6 1.6 0.1 0.1 0.1
CENTRAL AMERICA 3.4 3.7 4.1 8.5 8.5 8.3 0.9 1.5 1.3 Cuba - - - 0.8 0.8 0.8 - - - Mexico 3.4 3.7 4.1 4.6 4.5 4.3 0.9 1.4 1.2
SOUTH AMERICA 20.3 24.7 24.1 14.1 14.2 13.0 10.1 8.2 9.8 Argentina 10.6 13.9 12.0 - - - 6.8 4.5 6.0 Brazil 5.3 6.2 7.7 7.1 7.0 5.8 1.2 2.0 2.0 Chile 1.4 1.4 1.5 0.9 0.7 0.7 - - - Colombia - - - 1.5 1.8 1.8 - 0.1 0.1 Peru 0.2 0.2 0.2 1.8 1.7 1.7 - - - Venezuela - - - 1.8 1.8 2.0 - - -
NORTH AMERICA 87.9 84.4 85.5 3.4 4.8 4.5 48.4 46.0 47.5 Canada 30.0 29.3 29.5 0.2 0.3 0.2 19.4 22.5 23.0 United States of America 57.9 55.1 56.0 3.2 4.5 4.3 29.0 23.5 24.5
EUROPE 214.1 247.7 233.0 7.6 8.1 8.5 47.5 64.0 59.0 European Union 137.9 156.1 148.5 5.4 5.7 6.0 22.7 32.0 29.0 Russian Federation 48.7 59.7 54.0 0.1 0.3 0.3 16.8 20.0 19.0 Ukraine 20.1 24.1 23.6 - - - 7.2 11.0 10.0
OCEANIA 26.9 23.9 24.7 0.9 0.9 0.9 20.9 17.5 18.0 Australia 26.6 23.6 24.4 - - - 20.9 17.5 18.0
WORLD 693.1 729.5 719.1 145.3 153.0 151.0 149.1 153.0 151.0 Developing countries 334.1 345.6 348.1 118.0 124.1 122.0 22.8 18.2 20.4 Developed countries 358.9 383.8 371.0 27.3 29.0 29.0 126.3 134.8 130.6 LIFDCs 112.8 118.9 115.5 30.6 33.5 33.2 6.6 3.3 3.3 LDCs 12.3 13.7 13.7 15.7 17.9 17.4 0.1 0.1 0.1

Statistica
l ap
pe
nd
ix
92 93FOOD OUTLOOKMAY 2015
APPENDIX TABLE 2(B): WHEAT STATISTICS
Total Utilization Stocks ending in Per caput food use
11/12-13/14 2014/15 2015/16
2012-20142015 2016
11/12-13/14 2014/15 2015/16
average average average estim. f’cast estim. f’cast estim. f’cast
(. . . . . . . . . . . . . . . . . . . . . . . . . . million tonnes . . . . . . . . . . . . . . . . . . . . .) (. . . . . . . . . . Kg/year . . . . . . . .)
ASIA 360.0 374.9 380.3 111.8 115.2 111.6 64.3 64.5 64.7 Bangladesh 3.5 3.8 4.0 2.8 3.4 3.5 20.6 20.7 21.1 China 125.8 131.1 134.5 49.9 49.8 44.9 62.9 62.8 62.8 of which Taiwan Prov. 1.3 1.4 1.5 0.4 0.5 0.5 45.1 45.8 45.7 India 84.9 89.7 89.2 23.2 26.5 26.0 59.8 60.0 60.0 Indonesia 6.5 7.3 7.4 2.5 2.9 2.9 18.9 19.4 19.6 Iran, Islamic Republic of 16.3 17.9 18.2 3.1 6.3 7.1 167.5 167.6 167.3 Iraq 5.9 6.2 6.3 1.9 2.4 2.3 143.1 143.1 143.3 Japan 6.5 6.7 6.7 1.0 0.9 0.9 43.1 43.3 43.4 Kazakhstan 7.6 7.8 7.5 4.8 1.8 1.8 150.0 150.5 150.6 Korea, Republic of 4.8 4.1 4.3 0.9 0.6 0.8 47.8 47.9 47.9 Pakistan 24.0 24.9 25.6 2.1 2.2 2.5 124.6 124.7 125.2 Philippines 3.0 3.2 3.3 0.4 0.4 0.4 23.0 23.0 24.1 Saudi Arabia 3.8 3.7 3.8 2.3 2.6 2.8 98.7 98.7 98.7 Thailand 2.0 1.9 1.9 0.5 0.2 0.2 15.0 16.2 16.2 Turkey 21.6 21.8 22.0 2.6 2.7 2.8 211.5 211.6 211.2
AFRICA 64.4 67.2 68.1 17.9 18.4 18.1 51.4 50.9 50.0 Algeria 9.2 9.9 9.9 4.4 4.5 4.4 202.7 202.9 202.9 Egypt 18.8 19.6 20.0 5.1 4.6 4.1 198.3 198.5 198.3 Ethiopia 4.3 4.7 4.8 0.4 0.5 0.5 40.2 40.3 40.4 Morocco 8.6 9.0 9.1 3.4 4.0 4.3 202.9 203.0 203.0 Nigeria 3.8 4.0 4.0 0.2 0.2 0.2 19.7 20.6 19.5 South Africa 3.2 3.2 3.3 0.6 0.6 0.6 58.4 58.8 58.4 Tunisia 3.0 3.0 3.1 0.7 0.7 0.8 211.2 211.4 211.3
CENTRAL AMERICA 10.7 10.6 10.9 1.7 2.2 2.3 43.8 44.2 44.3 Cuba 0.8 0.8 0.8 - - - 55.4 54.6 54.7 Mexico 7.0 6.9 7.1 0.5 0.8 0.9 47.9 48.5 48.7
SOUTH AMERICA 26.0 27.0 27.4 4.0 7.3 6.5 60.2 60.4 60.4 Argentina 5.5 5.9 5.9 1.0 2.9 2.1 119.7 120.8 121.0 Brazil 11.0 11.3 11.5 1.0 1.5 1.5 52.5 52.5 52.5 Chile 2.3 2.4 2.4 0.2 0.2 0.2 119.8 120.6 120.7 Colombia 1.4 1.5 1.5 0.3 0.5 0.5 27.6 27.7 27.9 Peru 1.9 2.0 2.0 0.4 0.6 0.5 60.2 60.6 60.8 Venezuela 1.8 1.9 1.9 0.2 0.2 0.3 58.3 59.0 59.2
NORTH AMERICA 43.8 42.5 42.4 25.5 24.8 25.4 81.1 81.4 81.4 Canada 9.2 9.9 9.0 6.9 6.2 4.4 80.4 80.2 80.8 United States of America 34.6 32.6 33.4 18.6 18.6 21.0 81.2 81.5 81.5
EUROPE 178.5 181.8 179.3 21.2 26.7 29.8 109.7 109.8 109.3 European Union 121.0 123.6 122.3 9.5 15.0 18.0 111.1 111.2 111.0 Russian Federation 36.0 36.9 35.8 6.2 6.4 5.8 100.4 100.7 100.8 Ukraine 13.0 13.1 13.2 3.7 2.8 3.2 122.8 123.1 123.4
OCEANIA 7.5 7.7 7.8 5.6 5.3 5.1 67.0 66.7 67.1 Australia 6.4 6.5 6.6 5.2 4.9 4.7 78.1 78.3 79.4
WORLD 690.9 711.7 716.1 187.7 199.9 198.9 67.1 67.1 66.9 Developing countries 425.3 443.3 450.1 123.9 134.4 129.4 60.0 60.0 59.9 Developed countries 265.5 268.4 266.0 63.9 65.6 69.5 96.3 96.5 96.3 LIFDCs 134.9 142.2 142.8 37.9 42.5 42.0 45.8 45.9 45.8 LDCs 28.2 29.6 30.4 8.2 9.7 9.4 28.7 28.7 28.8

Sta
tist
ica
l a
pp
en
dix
94 95FOOD OUTLOOKMAY 2015
APPENDIX TABLE 3(A): COARSE GRAIN STATISTICS
Production Imports Exports
2011-2013 2014 2015
11/12-13/142014/15 2015/16
11/12-13/14 2014/15 2015/16
average average average estim. f’cast estim. f’cast estim. f’cast
(. . . . . . . . . . . . . . . . . . . . . . . . . . . . . . . . . . . . . . . . million tonnes . . . . . . . . . . . . . . . . . . . . . . . . . . . . . . . . . . . . . . .)
ASIA 336.1 345.2 349.3 72.5 90.2 88.4 7.5 4.9 6.0 China 214.7 224.8 226.1 12.3 22.8 21.3 0.2 0.2 0.3 of which Taiwan Prov. 0.1 0.1 0.1 4.5 4.6 4.6 - - - India 41.7 38.2 40.7 - - - 4.9 2.5 3.5 Indonesia 18.5 19.1 19.2 2.6 3.3 3.3 0.1 0.1 0.1 Iran, Islamic Republic of 4.5 4.5 4.7 5.2 7.1 7.1 - - - Japan 0.2 0.2 0.2 17.9 18.6 18.5 - - - Korea, D.P.R. 2.3 2.7 2.7 0.3 0.1 0.1 - - - Korea, Republic of 0.2 0.2 0.2 8.7 9.6 9.7 - - - Malaysia 0.1 0.1 0.1 3.2 3.9 3.9 - - - Pakistan 4.9 5.3 5.4 - - - - - - Philippines 7.2 7.8 7.8 0.3 0.5 0.5 - - - Saudi Arabia 0.4 0.4 0.4 10.9 11.0 11.0 - - - Thailand 5.1 5.0 5.1 0.2 0.2 0.2 0.5 0.1 0.2 Turkey 13.1 12.9 12.9 1.3 2.3 2.2 0.1 0.3 0.2 Viet Nam 4.9 5.2 5.1 1.8 2.1 2.1 - - -
AFRICA 115.6 127.3 119.8 18.8 20.2 20.8 6.9 6.8 5.5 Algeria 1.6 1.3 1.5 3.7 4.3 4.3 - - - Egypt 7.4 6.6 6.8 6.9 7.6 7.4 - - - Ethiopia 16.8 18.0 17.2 0.1 - - 1.4 1.7 1.3 Kenya 3.8 3.2 3.6 0.6 1.0 0.9 - - - Morocco 2.3 1.9 2.2 2.3 2.6 2.7 - - - Nigeria 17.4 19.5 19.4 0.2 0.2 0.2 0.3 0.3 0.3 South Africa 12.6 15.6 10.5 0.3 0.1 0.7 2.1 2.0 1.0 Sudan 3.3 7.4 6.1 0.4 0.3 0.2 - 0.2 0.3 Tanzania, United Rep. of 6.1 6.2 6.2 - - - 0.2 0.2 0.2
CENTRAL AMERICA 33.5 36.5 35.4 15.7 16.7 17.0 0.6 0.6 0.5 Mexico 28.5 31.8 30.4 10.6 11.1 11.6 0.5 0.5 0.5
SOUTH AMERICA 122.9 136.4 131.4 12.0 14.1 14.0 44.5 42.8 41.5 Argentina 35.0 39.9 37.6 - 0.1 0.1 22.1 19.2 19.1 Brazil 72.2 81.7 78.7 1.2 1.6 1.8 19.5 21.0 20.0 Chile 2.1 1.9 2.1 1.5 1.7 1.6 0.1 0.1 0.1 Colombia 1.8 1.1 1.6 4.4 5.2 5.2 0.1 0.1 0.1 Peru 1.9 1.8 1.9 2.2 2.5 2.5 - - - Venezuela 2.5 2.5 2.5 2.1 2.6 2.6 - 0.1 0.1
NORTH AMERICA 350.7 399.4 389.4 5.1 5.1 4.7 42.9 54.3 57.8 Canada 25.5 22.0 23.8 0.8 1.6 1.1 4.6 4.3 4.7 United States of America 325.3 377.4 365.6 4.3 3.5 3.6 38.3 50.0 53.1
EUROPE 236.3 268.2 253.0 13.2 10.4 10.8 33.7 42.2 39.1 European Union 150.8 169.0 161.5 11.7 9.1 9.4 7.5 9.7 8.4 Russian Federation 33.4 41.7 39.7 0.4 0.1 0.1 5.8 7.1 6.8 Serbia 5.8 7.2 6.5 - - - 1.6 2.3 2.3 Ukraine 34.6 39.5 35.0 0.1 0.1 0.1 18.3 22.2 20.7
OCEANIA 13.1 11.4 11.7 0.3 0.3 0.3 6.7 5.5 5.5 Australia 12.6 10.8 11.1 - - - 6.7 5.5 5.5
WORLD 1 208.2 1 324.4 1 290.0 137.6 157.0 156.0 142.8 157.0 156.0 Developing countries 589.4 623.5 619.1 98.6 119.8 118.6 56.9 52.6 52.1 Developed countries 618.8 700.9 670.9 38.9 37.2 37.4 86.0 104.5 104.0 LIFDCs 147.6 153.4 154.1 5.1 5.3 5.3 9.2 6.7 7.5 LDCs 73.4 81.6 78.7 2.5 2.4 2.3 5.1 5.1 4.9

Statistica
l ap
pe
nd
ix
94 95FOOD OUTLOOKMAY 2015
APPENDIX TABLE 3(B): COARSE GRAIN STATISTICS
Total Utilization Stocks ending in Per caput food use
11/12-13/14 2014/15 2015/16
2012-20142015 2016
11/12-13/14 2014/15 2015/16
average average average estim. f’cast estim. f’cast estim. f’cast
(. . . . . . . . . . . . . . . . . . . . . . . . . . million tonnes . . . . . . . . . . . . . . . . . . . . .) (. . . . . . . . . . Kg/year . . . . . . . .)
ASIA 391.2 427.9 431.3 110.6 123.2 123.1 15.1 14.9 14.9 China 218.4 244.4 246.3 86.0 99.3 100.1 10.8 10.8 10.8 of which Taiwan Prov. 4.6 4.7 4.6 0.3 0.2 0.2 6.7 7.1 7.0 India 36.7 36.5 37.4 3.2 1.5 1.5 20.4 19.6 19.8 Indonesia 20.9 22.4 22.5 4.3 4.3 4.1 28.7 28.7 28.7 Iran, Islamic Republic of 9.5 11.3 11.7 1.9 2.0 2.0 1.3 1.3 1.3 Japan 18.4 18.7 18.7 1.3 1.3 1.3 29.2 29.3 29.3 Korea, D.P.R. 2.6 2.8 2.7 0.1 - 0.1 77.3 84.0 84.0 Korea, Republic of 8.9 10.1 9.8 1.6 1.6 1.6 4.4 4.5 4.5 Malaysia 3.3 3.9 3.9 0.1 0.1 0.1 1.6 1.6 1.5 Pakistan 4.8 5.2 5.1 1.6 1.3 1.3 9.4 9.4 9.0 Philippines 7.5 8.2 8.3 0.4 0.5 0.5 16.4 16.8 16.9 Saudi Arabia 10.6 11.6 11.8 2.8 3.3 2.9 3.4 3.3 3.2 Thailand 4.9 4.6 5.0 0.3 0.6 0.6 2.8 2.8 2.7 Turkey 14.1 15.1 15.4 2.0 2.4 2.0 20.1 20.3 20.4 Viet Nam 6.6 7.4 7.2 0.7 0.8 0.8 5.6 5.8 3.9
AFRICA 127.7 137.2 138.2 17.9 20.1 16.8 73.3 75.0 75.0 Algeria 5.1 5.7 5.7 1.1 1.3 1.4 18.7 18.3 18.3 Egypt 14.0 14.3 14.3 1.3 1.5 1.4 50.1 49.7 48.9 Ethiopia 14.9 16.1 16.0 1.5 1.6 1.4 126.8 129.7 129.4 Kenya 4.3 4.3 4.5 0.6 0.4 0.4 83.6 82.9 82.7 Morocco 4.6 4.8 4.8 1.2 1.1 1.2 53.9 53.9 53.9 Nigeria 17.4 19.3 19.6 0.4 0.7 0.5 69.9 72.3 71.6 South Africa 11.5 12.0 11.8 1.5 2.6 1.3 93.9 94.1 93.5 Sudan 4.0 6.3 6.2 0.2 1.1 0.9 95.7 120.8 118.5 Tanzania, United Rep. of 5.8 6.2 6.2 0.8 0.8 0.5 91.8 92.8 94.4
CENTRAL AMERICA 48.8 52.6 52.6 3.9 4.6 4.1 96.5 96.8 96.9 Mexico 38.8 42.3 42.1 2.2 2.9 2.4 131.5 132.3 131.6
SOUTH AMERICA 87.7 101.5 103.5 14.5 23.2 22.0 27.2 27.5 27.4 Argentina 11.4 17.6 17.7 3.3 5.4 4.2 7.4 7.4 7.3 Brazil 53.0 58.7 60.6 6.4 12.0 11.9 24.9 25.3 25.4 Chile 3.5 3.6 3.6 0.6 0.7 0.7 18.7 18.4 18.4 Colombia 6.3 7.2 7.2 0.2 0.2 0.2 43.0 44.1 43.9 Peru 3.9 4.2 4.2 0.6 0.7 0.6 24.8 24.4 24.1 Venezuela 4.5 5.0 5.0 0.4 0.5 0.5 51.4 50.7 50.0
NORTH AMERICA 309.9 331.0 336.2 32.3 52.0 51.8 17.8 17.6 17.4 Canada 19.8 20.1 20.1 3.7 2.9 2.5 4.7 4.7 4.7 United States of America 290.1 310.9 316.1 28.6 49.1 49.3 19.2 19.0 18.8
EUROPE 215.1 227.6 229.1 31.5 43.5 39.1 20.7 21.1 21.2 European Union 154.1 160.7 163.5 20.7 31.7 30.7 19.0 19.4 19.4 Russian Federation 28.8 34.2 34.5 3.5 3.3 1.8 21.8 22.1 22.2 Serbia 4.4 4.9 4.2 0.4 0.5 0.5 20.2 21.4 21.5 Ukraine 15.7 17.4 16.4 5.3 5.8 3.7 31.2 31.2 32.3
OCEANIA 6.9 6.5 6.6 3.1 2.9 2.7 8.2 8.1 8.2 Australia 6.1 5.7 5.8 3.0 2.8 2.6 9.8 9.6 9.7
WORLD 1 187.4 1 284.5 1 297.5 213.8 269.5 259.6 27.7 28.1 28.2 Developing countries 618.3 680.5 687.3 143.2 165.8 161.9 29.0 29.4 29.6 Developed countries 569.1 604.0 610.3 70.6 103.6 97.7 22.2 22.4 22.4 LIFDCs 143.4 151.8 153.8 15.5 13.9 12.3 39.2 39.7 40.1 LDCs 70.4 76.5 77.1 12.1 12.7 11.2 57.1 58.8 59.5

Sta
tist
ica
l a
pp
en
dix
96 97FOOD OUTLOOKMAY 2015
APPENDIX TABLE 4(A): MAIZE STATISTICS
Production Imports Exports
2011-2013 2014 2015
11/12-13/142014/15 2015/16
11/12-13/14 2014/15 2015/16
average average average estim. f’cast estim. f’cast estim. f’cast
(. . . . . . . . . . . . . . . . . . . . . . . . . . . . . . . . . . . . . . . . million tonnes . . . . . . . . . . . . . . . . . . . . . . . . . . . . . . . . . . . . . . .)
ASIA 287.9 300.7 301.9 52.7 59.5 59.1 6.4 3.8 4.9 China 205.7 215.7 217.0 8.3 8.0 7.5 0.1 0.1 0.2 of which Taiwan Prov. - - - 4.3 4.4 4.4 - - - India 22.8 22.0 22.5 - - - 4.4 2.0 3.0 Indonesia 18.5 19.1 19.2 2.5 3.2 3.2 0.1 0.1 0.1 Iran, Islamic Republic of 1.3 1.3 1.4 4.0 5.4 5.4 - - - Japan - - - 14.9 15.6 15.5 - - - Korea, D.P.R. 2.2 2.6 2.6 0.3 0.1 0.1 - - - Korea, Republic of 0.1 0.1 0.1 8.6 9.5 9.6 - - - Malaysia 0.1 0.1 0.1 3.2 3.9 3.9 - - - Pakistan 4.4 4.7 4.8 - - - - - - Philippines 7.2 7.8 7.8 0.3 0.5 0.5 - - - Thailand 4.9 4.8 4.9 0.2 0.2 0.2 0.5 0.1 0.2 Turkey 4.9 6.0 5.0 1.1 1.5 1.8 0.1 0.2 0.1 Viet Nam 4.9 5.2 5.1 1.7 2.0 2.0 - - -
AFRICA 69.0 75.0 68.9 16.0 17.6 18.1 4.7 4.4 3.4 Algeria - - - 3.2 3.7 3.7 - - - Egypt 6.5 5.8 6.0 6.8 7.5 7.3 - - - Ethiopia 6.3 6.6 6.5 - - - 0.3 0.3 0.3 Kenya 3.5 2.9 3.3 0.5 0.9 0.8 - - - Morocco 0.2 0.2 0.2 1.9 2.2 2.2 - - - Nigeria 9.4 11.0 11.0 0.2 0.2 0.2 0.2 0.2 0.2 South Africa 12.1 14.9 10.0 0.2 - 0.5 2.0 2.0 1.0 Tanzania, United Rep. of 4.9 5.0 5.0 - - - 0.2 0.2 0.2
CENTRAL AMERICA 25.4 28.2 27.1 14.0 16.0 16.4 0.6 0.6 0.5 Mexico 20.8 23.9 22.5 9.0 10.5 11.0 0.5 0.5 0.5
SOUTH AMERICA 108.2 123.9 118.3 10.1 12.2 12.2 38.8 39.5 37.3 Argentina 25.7 33.0 30.0 - - - 16.6 16.0 15.0 Brazil 69.4 78.8 75.9 0.9 1.0 1.2 19.5 21.0 20.0 Chile 1.5 1.2 1.4 1.0 1.3 1.2 - - - Colombia 1.7 1.1 1.6 3.7 4.6 4.6 0.1 0.1 0.1 Peru 1.6 1.5 1.7 2.0 2.4 2.4 - - - Venezuela 2.0 2.0 2.0 2.1 2.6 2.6 - 0.1 0.1
NORTH AMERICA 325.3 372.6 362.2 2.6 2.4 2.0 36.6 42.9 46.0 Canada 12.9 11.5 12.2 0.7 1.5 1.0 1.2 0.9 1.0 United States of America 312.4 361.1 350.0 1.9 0.9 1.0 35.3 42.0 45.0
EUROPE 107.3 124.6 116.0 11.4 8.7 9.2 23.0 25.3 24.8 European Union 63.3 74.3 69.9 10.8 8.0 8.5 2.5 2.5 2.5 Russian Federation 8.9 11.3 11.4 - - - 2.8 2.5 2.5 Serbia 5.4 6.8 6.1 - - - 1.6 2.3 2.3 Ukraine 24.7 28.5 25.0 0.1 0.1 0.1 15.8 17.5 17.0
OCEANIA 0.6 0.5 0.6 - - - 0.1 0.1 0.1
WORLD 923.7 1 025.3 994.9 106.9 116.5 117.0 110.1 116.5 117.0 Developing countries 476.6 511.0 504.4 76.2 87.8 88.0 48.4 46.2 45.1 Developed countries 447.1 514.3 490.6 30.7 28.7 29.0 61.8 70.3 71.9 LIFDCs 85.8 88.1 88.6 4.0 4.6 4.7 6.5 3.9 4.9 LDCs 41.2 43.7 42.6 1.8 1.9 1.9 3.0 2.9 3.0
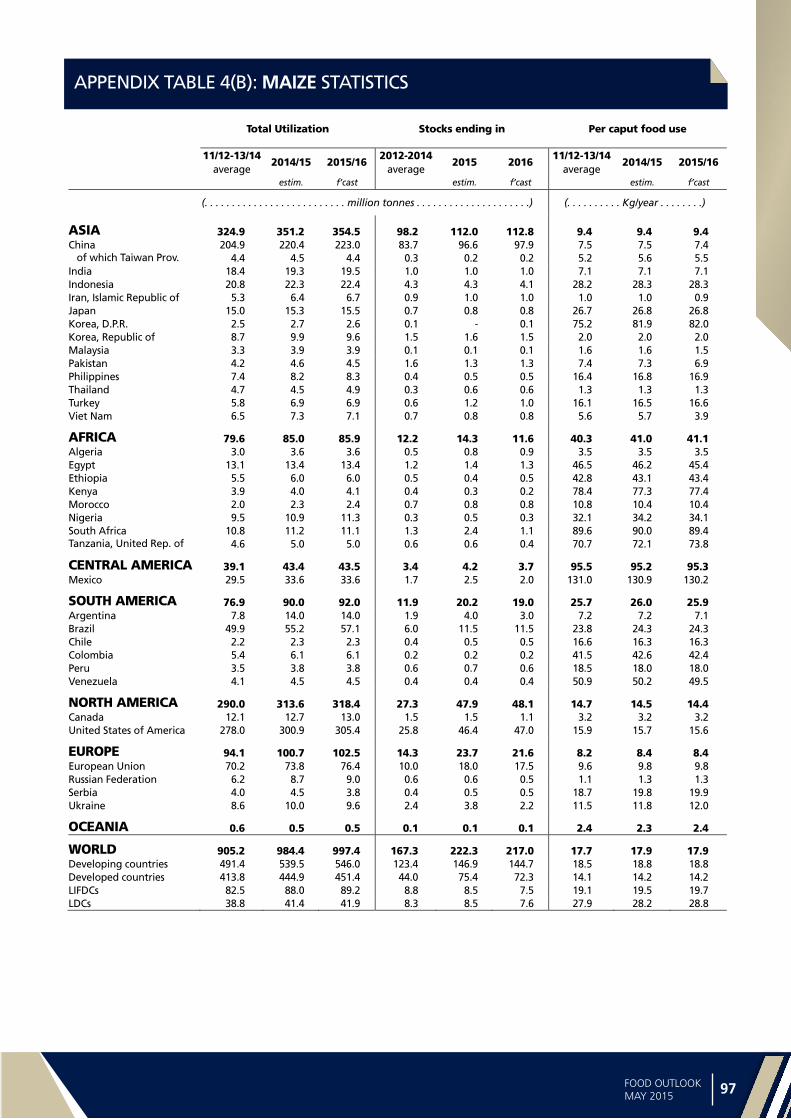
Statistica
l ap
pe
nd
ix
96 97FOOD OUTLOOKMAY 2015
APPENDIX TABLE 4(B): MAIZE STATISTICS
Total Utilization Stocks ending in Per caput food use
11/12-13/14 2014/15 2015/16
2012-20142015 2016
11/12-13/14 2014/15 2015/16
average average average estim. f’cast estim. f’cast estim. f’cast
(. . . . . . . . . . . . . . . . . . . . . . . . . . million tonnes . . . . . . . . . . . . . . . . . . . . .) (. . . . . . . . . . Kg/year . . . . . . . .)
ASIA 324.9 351.2 354.5 98.2 112.0 112.8 9.4 9.4 9.4 China 204.9 220.4 223.0 83.7 96.6 97.9 7.5 7.5 7.4 of which Taiwan Prov. 4.4 4.5 4.4 0.3 0.2 0.2 5.2 5.6 5.5 India 18.4 19.3 19.5 1.0 1.0 1.0 7.1 7.1 7.1 Indonesia 20.8 22.3 22.4 4.3 4.3 4.1 28.2 28.3 28.3 Iran, Islamic Republic of 5.3 6.4 6.7 0.9 1.0 1.0 1.0 1.0 0.9 Japan 15.0 15.3 15.5 0.7 0.8 0.8 26.7 26.8 26.8 Korea, D.P.R. 2.5 2.7 2.6 0.1 - 0.1 75.2 81.9 82.0 Korea, Republic of 8.7 9.9 9.6 1.5 1.6 1.5 2.0 2.0 2.0 Malaysia 3.3 3.9 3.9 0.1 0.1 0.1 1.6 1.6 1.5 Pakistan 4.2 4.6 4.5 1.6 1.3 1.3 7.4 7.3 6.9 Philippines 7.4 8.2 8.3 0.4 0.5 0.5 16.4 16.8 16.9 Thailand 4.7 4.5 4.9 0.3 0.6 0.6 1.3 1.3 1.3 Turkey 5.8 6.9 6.9 0.6 1.2 1.0 16.1 16.5 16.6 Viet Nam 6.5 7.3 7.1 0.7 0.8 0.8 5.6 5.7 3.9
AFRICA 79.6 85.0 85.9 12.2 14.3 11.6 40.3 41.0 41.1 Algeria 3.0 3.6 3.6 0.5 0.8 0.9 3.5 3.5 3.5 Egypt 13.1 13.4 13.4 1.2 1.4 1.3 46.5 46.2 45.4 Ethiopia 5.5 6.0 6.0 0.5 0.4 0.5 42.8 43.1 43.4 Kenya 3.9 4.0 4.1 0.4 0.3 0.2 78.4 77.3 77.4 Morocco 2.0 2.3 2.4 0.7 0.8 0.8 10.8 10.4 10.4 Nigeria 9.5 10.9 11.3 0.3 0.5 0.3 32.1 34.2 34.1 South Africa 10.8 11.2 11.1 1.3 2.4 1.1 89.6 90.0 89.4 Tanzania, United Rep. of 4.6 5.0 5.0 0.6 0.6 0.4 70.7 72.1 73.8
CENTRAL AMERICA 39.1 43.4 43.5 3.4 4.2 3.7 95.5 95.2 95.3 Mexico 29.5 33.6 33.6 1.7 2.5 2.0 131.0 130.9 130.2
SOUTH AMERICA 76.9 90.0 92.0 11.9 20.2 19.0 25.7 26.0 25.9 Argentina 7.8 14.0 14.0 1.9 4.0 3.0 7.2 7.2 7.1 Brazil 49.9 55.2 57.1 6.0 11.5 11.5 23.8 24.3 24.3 Chile 2.2 2.3 2.3 0.4 0.5 0.5 16.6 16.3 16.3 Colombia 5.4 6.1 6.1 0.2 0.2 0.2 41.5 42.6 42.4 Peru 3.5 3.8 3.8 0.6 0.7 0.6 18.5 18.0 18.0 Venezuela 4.1 4.5 4.5 0.4 0.4 0.4 50.9 50.2 49.5
NORTH AMERICA 290.0 313.6 318.4 27.3 47.9 48.1 14.7 14.5 14.4 Canada 12.1 12.7 13.0 1.5 1.5 1.1 3.2 3.2 3.2 United States of America 278.0 300.9 305.4 25.8 46.4 47.0 15.9 15.7 15.6
EUROPE 94.1 100.7 102.5 14.3 23.7 21.6 8.2 8.4 8.4 European Union 70.2 73.8 76.4 10.0 18.0 17.5 9.6 9.8 9.8 Russian Federation 6.2 8.7 9.0 0.6 0.6 0.5 1.1 1.3 1.3 Serbia 4.0 4.5 3.8 0.4 0.5 0.5 18.7 19.8 19.9 Ukraine 8.6 10.0 9.6 2.4 3.8 2.2 11.5 11.8 12.0
OCEANIA 0.6 0.5 0.5 0.1 0.1 0.1 2.4 2.3 2.4
WORLD 905.2 984.4 997.4 167.3 222.3 217.0 17.7 17.9 17.9 Developing countries 491.4 539.5 546.0 123.4 146.9 144.7 18.5 18.8 18.8 Developed countries 413.8 444.9 451.4 44.0 75.4 72.3 14.1 14.2 14.2 LIFDCs 82.5 88.0 89.2 8.8 8.5 7.5 19.1 19.5 19.7 LDCs 38.8 41.4 41.9 8.3 8.5 7.6 27.9 28.2 28.8
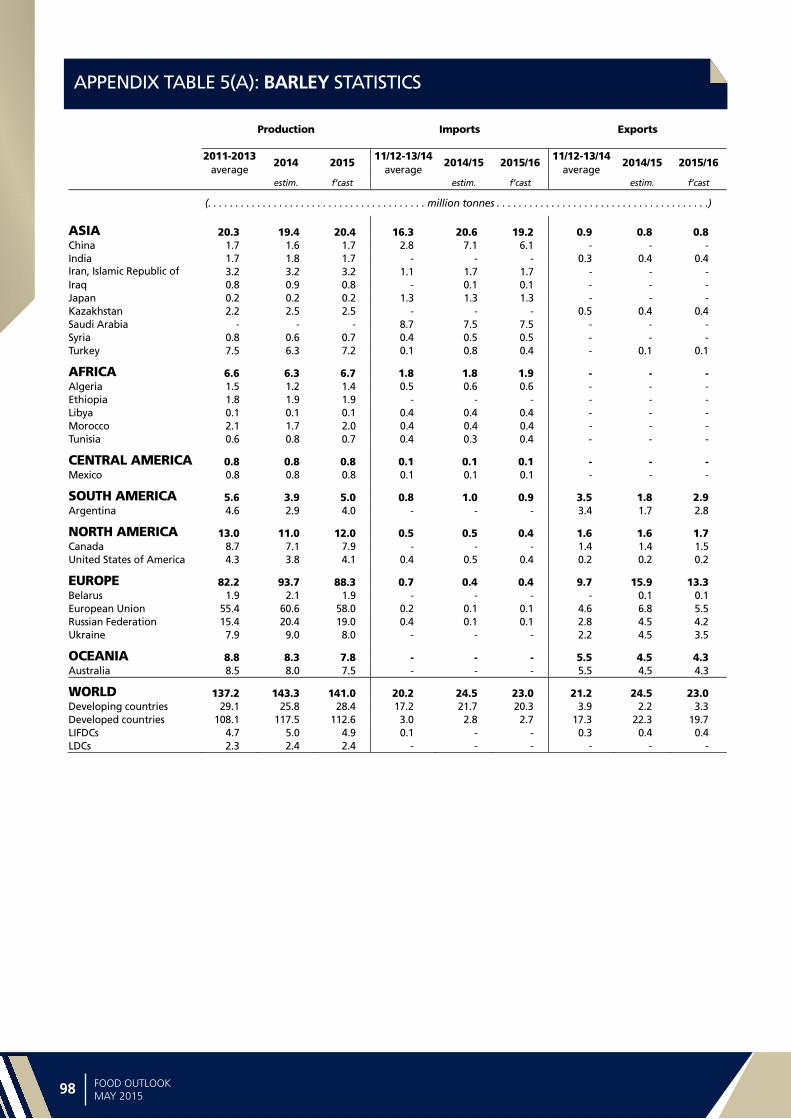
Sta
tist
ica
l a
pp
en
dix
98 99FOOD OUTLOOKMAY 2015
APPENDIX TABLE 5(A): BARLEY STATISTICS
Production Imports Exports
2011-2013 2014 2015
11/12-13/142014/15 2015/16
11/12-13/14 2014/15 2015/16
average average average estim. f’cast estim. f’cast estim. f’cast
(. . . . . . . . . . . . . . . . . . . . . . . . . . . . . . . . . . . . . . . . million tonnes . . . . . . . . . . . . . . . . . . . . . . . . . . . . . . . . . . . . . . .)
ASIA 20.3 19.4 20.4 16.3 20.6 19.2 0.9 0.8 0.8 China 1.7 1.6 1.7 2.8 7.1 6.1 - - - India 1.7 1.8 1.7 - - - 0.3 0.4 0.4 Iran, Islamic Republic of 3.2 3.2 3.2 1.1 1.7 1.7 - - - Iraq 0.8 0.9 0.8 - 0.1 0.1 - - - Japan 0.2 0.2 0.2 1.3 1.3 1.3 - - - Kazakhstan 2.2 2.5 2.5 - - - 0.5 0.4 0.4 Saudi Arabia - - - 8.7 7.5 7.5 - - - Syria 0.8 0.6 0.7 0.4 0.5 0.5 - - - Turkey 7.5 6.3 7.2 0.1 0.8 0.4 - 0.1 0.1
AFRICA 6.6 6.3 6.7 1.8 1.8 1.9 - - - Algeria 1.5 1.2 1.4 0.5 0.6 0.6 - - - Ethiopia 1.8 1.9 1.9 - - - - - - Libya 0.1 0.1 0.1 0.4 0.4 0.4 - - - Morocco 2.1 1.7 2.0 0.4 0.4 0.4 - - - Tunisia 0.6 0.8 0.7 0.4 0.3 0.4 - - -
CENTRAL AMERICA 0.8 0.8 0.8 0.1 0.1 0.1 - - - Mexico 0.8 0.8 0.8 0.1 0.1 0.1 - - -
SOUTH AMERICA 5.6 3.9 5.0 0.8 1.0 0.9 3.5 1.8 2.9 Argentina 4.6 2.9 4.0 - - - 3.4 1.7 2.8
NORTH AMERICA 13.0 11.0 12.0 0.5 0.5 0.4 1.6 1.6 1.7 Canada 8.7 7.1 7.9 - - - 1.4 1.4 1.5 United States of America 4.3 3.8 4.1 0.4 0.5 0.4 0.2 0.2 0.2
EUROPE 82.2 93.7 88.3 0.7 0.4 0.4 9.7 15.9 13.3 Belarus 1.9 2.1 1.9 - - - - 0.1 0.1 European Union 55.4 60.6 58.0 0.2 0.1 0.1 4.6 6.8 5.5 Russian Federation 15.4 20.4 19.0 0.4 0.1 0.1 2.8 4.5 4.2 Ukraine 7.9 9.0 8.0 - - - 2.2 4.5 3.5
OCEANIA 8.8 8.3 7.8 - - - 5.5 4.5 4.3 Australia 8.5 8.0 7.5 - - - 5.5 4.5 4.3
WORLD 137.2 143.3 141.0 20.2 24.5 23.0 21.2 24.5 23.0 Developing countries 29.1 25.8 28.4 17.2 21.7 20.3 3.9 2.2 3.3 Developed countries 108.1 117.5 112.6 3.0 2.8 2.7 17.3 22.3 19.7 LIFDCs 4.7 5.0 4.9 0.1 - - 0.3 0.4 0.4 LDCs 2.3 2.4 2.4 - - - - - -
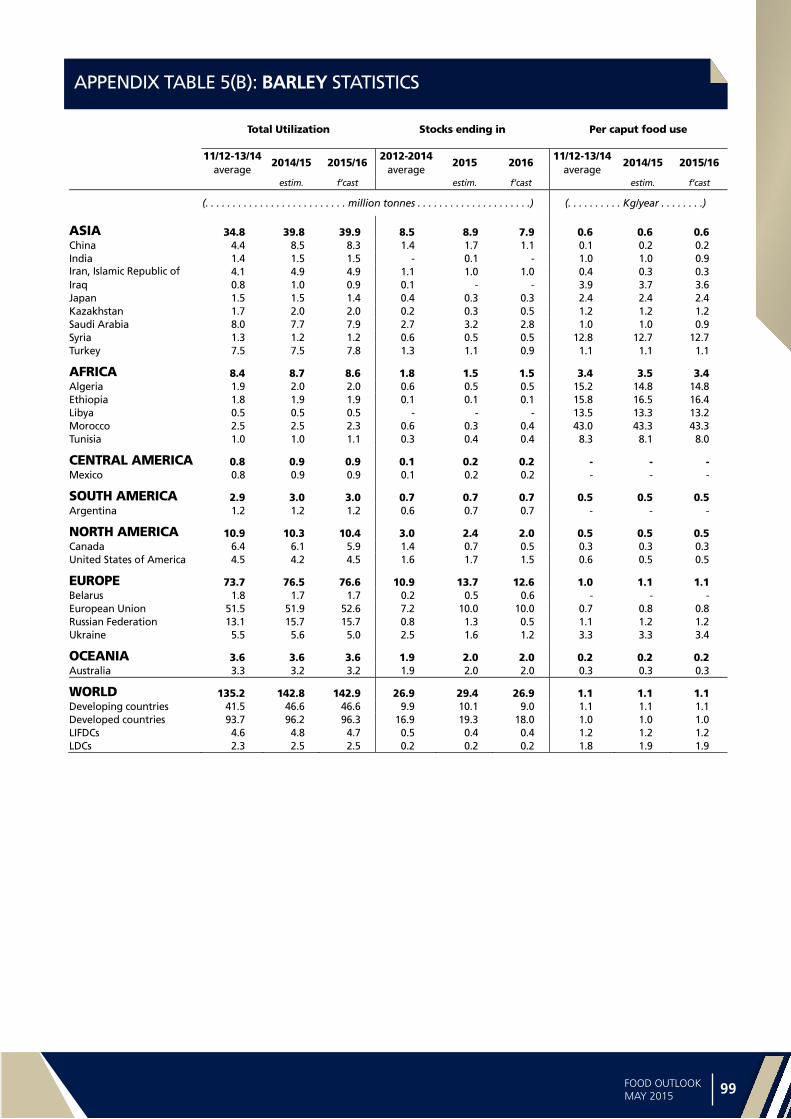
Statistica
l ap
pe
nd
ix
98 99FOOD OUTLOOKMAY 2015
APPENDIX TABLE 5(B): BARLEY STATISTICS
Total Utilization Stocks ending in Per caput food use
11/12-13/14 2014/15 2015/16
2012-20142015 2016
11/12-13/14 2014/15 2015/16
average average average estim. f’cast estim. f’cast estim. f’cast
(. . . . . . . . . . . . . . . . . . . . . . . . . . million tonnes . . . . . . . . . . . . . . . . . . . . .) (. . . . . . . . . . Kg/year . . . . . . . .)
ASIA 34.8 39.8 39.9 8.5 8.9 7.9 0.6 0.6 0.6 China 4.4 8.5 8.3 1.4 1.7 1.1 0.1 0.2 0.2 India 1.4 1.5 1.5 - 0.1 - 1.0 1.0 0.9 Iran, Islamic Republic of 4.1 4.9 4.9 1.1 1.0 1.0 0.4 0.3 0.3 Iraq 0.8 1.0 0.9 0.1 - - 3.9 3.7 3.6 Japan 1.5 1.5 1.4 0.4 0.3 0.3 2.4 2.4 2.4 Kazakhstan 1.7 2.0 2.0 0.2 0.3 0.5 1.2 1.2 1.2 Saudi Arabia 8.0 7.7 7.9 2.7 3.2 2.8 1.0 1.0 0.9 Syria 1.3 1.2 1.2 0.6 0.5 0.5 12.8 12.7 12.7 Turkey 7.5 7.5 7.8 1.3 1.1 0.9 1.1 1.1 1.1
AFRICA 8.4 8.7 8.6 1.8 1.5 1.5 3.4 3.5 3.4 Algeria 1.9 2.0 2.0 0.6 0.5 0.5 15.2 14.8 14.8 Ethiopia 1.8 1.9 1.9 0.1 0.1 0.1 15.8 16.5 16.4 Libya 0.5 0.5 0.5 - - - 13.5 13.3 13.2 Morocco 2.5 2.5 2.3 0.6 0.3 0.4 43.0 43.3 43.3 Tunisia 1.0 1.0 1.1 0.3 0.4 0.4 8.3 8.1 8.0
CENTRAL AMERICA 0.8 0.9 0.9 0.1 0.2 0.2 - - - Mexico 0.8 0.9 0.9 0.1 0.2 0.2 - - -
SOUTH AMERICA 2.9 3.0 3.0 0.7 0.7 0.7 0.5 0.5 0.5 Argentina 1.2 1.2 1.2 0.6 0.7 0.7 - - -
NORTH AMERICA 10.9 10.3 10.4 3.0 2.4 2.0 0.5 0.5 0.5 Canada 6.4 6.1 5.9 1.4 0.7 0.5 0.3 0.3 0.3 United States of America 4.5 4.2 4.5 1.6 1.7 1.5 0.6 0.5 0.5
EUROPE 73.7 76.5 76.6 10.9 13.7 12.6 1.0 1.1 1.1 Belarus 1.8 1.7 1.7 0.2 0.5 0.6 - - - European Union 51.5 51.9 52.6 7.2 10.0 10.0 0.7 0.8 0.8 Russian Federation 13.1 15.7 15.7 0.8 1.3 0.5 1.1 1.2 1.2 Ukraine 5.5 5.6 5.0 2.5 1.6 1.2 3.3 3.3 3.4
OCEANIA 3.6 3.6 3.6 1.9 2.0 2.0 0.2 0.2 0.2 Australia 3.3 3.2 3.2 1.9 2.0 2.0 0.3 0.3 0.3
WORLD 135.2 142.8 142.9 26.9 29.4 26.9 1.1 1.1 1.1 Developing countries 41.5 46.6 46.6 9.9 10.1 9.0 1.1 1.1 1.1 Developed countries 93.7 96.2 96.3 16.9 19.3 18.0 1.0 1.0 1.0 LIFDCs 4.6 4.8 4.7 0.5 0.4 0.4 1.2 1.2 1.2 LDCs 2.3 2.5 2.5 0.2 0.2 0.2 1.8 1.9 1.9

Sta
tist
ica
l a
pp
en
dix
100 101FOOD OUTLOOKMAY 2015
APPENDIX TABLE 6(A): SORGHUM STATISTICS
APPENDIX TABLE 7(A): OTHER COARSE GRAIN STATISTICS: MILLET, RYE, OATS AND OTHER GRAINS
Production Imports Exports
2011-2013 2014 2015
11/12-13/142014/15 2015/16
11/12-13/14 2014/15 2015/16
average average average estim. f’cast estim. f’cast estim. f’cast
(. . . . . . . . . . . . . . . . . . . . . . . . . . . . . . . . . . . . . . . . million tonnes . . . . . . . . . . . . . . . . . . . . . . . . . . . . . . . . . . . . . . .)
ASIA 9.0 7.6 8.9 2.9 9.1 9.1 0.1 0.1 0.1 China 2.5 2.6 2.5 1.2 7.6 7.6 - 0.1 0.1 India 5.6 4.1 5.5 - - - - - - Japan - - - 1.5 1.3 1.3 - - -
AFRICA 23.8 28.0 26.4 0.9 0.7 0.6 0.9 0.8 0.7 Burkina Faso 1.8 1.7 1.8 - - - 0.2 0.1 0.1 Ethiopia 4.0 4.2 3.8 - - - 0.4 0.4 0.2 Nigeria 6.7 6.9 7.0 - - - 0.1 0.1 0.1 Sudan 2.9 6.3 5.0 0.4 0.2 0.1 - 0.2 0.3
CENTRAL AMERICA 7.3 7.4 7.4 1.4 0.2 0.2 - - - Mexico 6.9 7.0 7.0 1.4 0.2 0.2 - - -
SOUTH AMERICA 7.3 6.9 6.2 0.9 0.6 0.6 2.1 1.5 1.3 Argentina 4.1 3.5 3.0 - - - 2.1 1.5 1.3 Brazil 2.0 2.2 1.9 - - - - - - Venezuela 0.4 0.4 0.4 - - - - - -
NORTH AMERICA 7.2 11.0 10.0 0.1 - - 2.7 7.7 7.8 United States of America 7.2 11.0 10.0 0.1 - - 2.7 7.7 7.8
EUROPE 0.9 1.0 0.9 0.4 0.3 0.3 0.1 0.1 0.1 European Union 0.6 0.7 0.6 0.3 0.2 0.2 - - -
OCEANIA 2.1 1.1 1.8 0.1 0.1 0.1 1.0 0.8 1.1 Australia 2.1 1.1 1.8 - - - 1.0 0.8 1.1
WORLD 57.6 63.1 61.7 6.8 11.0 11.0 6.8 11.0 11.0 Developing countries 47.3 49.8 48.9 4.6 9.2 9.1 3.0 2.4 2.1 Developed countries 10.4 13.3 12.8 2.2 1.8 1.9 3.8 8.6 9.0 LIFDCs 29.0 31.7 31.5 0.8 0.6 0.5 0.9 0.8 0.7 LDCs 15.1 18.9 17.3 0.6 0.4 0.3 0.8 0.7 0.6
Production Imports Exports
2011-2013 2014 2015
11/12-13/142014/15 2015/16
11/12-13/14 2014/15 2015/16
average average average estim. f’cast estim. f’cast estim. f’cast
(. . . . . . . . . . . . . . . . . . . . . . . . . . . . . . . . . . . . . . . . million tonnes . . . . . . . . . . . . . . . . . . . . . . . . . . . . . . . . . . . . . . .)
ASIA 18.8 17.5 18.1 0.6 1.0 1.1 0.2 0.2 0.2
AFRICA 16.2 18.0 17.8 0.1 0.1 0.1 1.3 1.5 1.4
CENTRAL AMERICA 0.1 0.1 0.1 0.2 0.4 0.4 - - -
SOUTH AMERICA 1.7 1.7 1.8 0.2 0.3 0.3 0.1 0.1 0.1
NORTH AMERICA 5.2 4.9 5.2 2.0 2.2 2.2 2.1 2.2 2.3
EUROPE 46.0 49.0 47.8 0.6 1.0 0.8 0.8 0.9 0.9
OCEANIA 1.6 1.5 1.5 0.1 0.1 0.1 0.1 0.1 0.1
WORLD 89.7 92.8 92.4 3.7 5.0 5.0 4.7 5.0 5.0
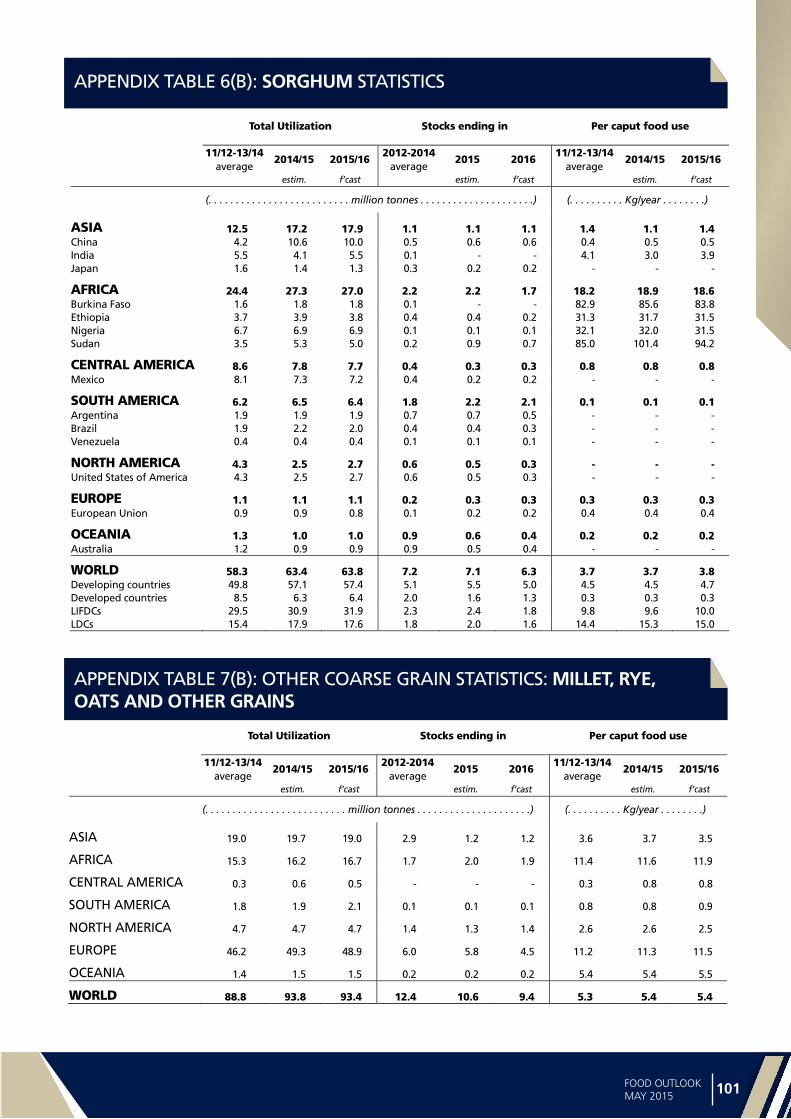
Statistica
l ap
pe
nd
ix
100 101FOOD OUTLOOKMAY 2015
APPENDIX TABLE 7(B): OTHER COARSE GRAIN STATISTICS: MILLET, RYE, OATS AND OTHER GRAINS
APPENDIX TABLE 6(B): SORGHUM STATISTICS
Total Utilization Stocks ending in Per caput food use
11/12-13/14 2014/15 2015/16
2012-20142015 2016
11/12-13/14 2014/15 2015/16
average average average estim. f’cast estim. f’cast estim. f’cast
(. . . . . . . . . . . . . . . . . . . . . . . . . . million tonnes . . . . . . . . . . . . . . . . . . . . .) (. . . . . . . . . . Kg/year . . . . . . . .)
ASIA 12.5 17.2 17.9 1.1 1.1 1.1 1.4 1.1 1.4 China 4.2 10.6 10.0 0.5 0.6 0.6 0.4 0.5 0.5 India 5.5 4.1 5.5 0.1 - - 4.1 3.0 3.9 Japan 1.6 1.4 1.3 0.3 0.2 0.2 - - -
AFRICA 24.4 27.3 27.0 2.2 2.2 1.7 18.2 18.9 18.6 Burkina Faso 1.6 1.8 1.8 0.1 - - 82.9 85.6 83.8 Ethiopia 3.7 3.9 3.8 0.4 0.4 0.2 31.3 31.7 31.5 Nigeria 6.7 6.9 6.9 0.1 0.1 0.1 32.1 32.0 31.5 Sudan 3.5 5.3 5.0 0.2 0.9 0.7 85.0 101.4 94.2
CENTRAL AMERICA 8.6 7.8 7.7 0.4 0.3 0.3 0.8 0.8 0.8 Mexico 8.1 7.3 7.2 0.4 0.2 0.2 - - -
SOUTH AMERICA 6.2 6.5 6.4 1.8 2.2 2.1 0.1 0.1 0.1 Argentina 1.9 1.9 1.9 0.7 0.7 0.5 - - - Brazil 1.9 2.2 2.0 0.4 0.4 0.3 - - - Venezuela 0.4 0.4 0.4 0.1 0.1 0.1 - - -
NORTH AMERICA 4.3 2.5 2.7 0.6 0.5 0.3 - - - United States of America 4.3 2.5 2.7 0.6 0.5 0.3 - - -
EUROPE 1.1 1.1 1.1 0.2 0.3 0.3 0.3 0.3 0.3 European Union 0.9 0.9 0.8 0.1 0.2 0.2 0.4 0.4 0.4
OCEANIA 1.3 1.0 1.0 0.9 0.6 0.4 0.2 0.2 0.2 Australia 1.2 0.9 0.9 0.9 0.5 0.4 - - -
WORLD 58.3 63.4 63.8 7.2 7.1 6.3 3.7 3.7 3.8 Developing countries 49.8 57.1 57.4 5.1 5.5 5.0 4.5 4.5 4.7 Developed countries 8.5 6.3 6.4 2.0 1.6 1.3 0.3 0.3 0.3 LIFDCs 29.5 30.9 31.9 2.3 2.4 1.8 9.8 9.6 10.0 LDCs 15.4 17.9 17.6 1.8 2.0 1.6 14.4 15.3 15.0
Total Utilization Stocks ending in Per caput food use
11/12-13/14 2014/15 2015/16
2012-20142015 2016
11/12-13/14 2014/15 2015/16
average average average estim. f’cast estim. f’cast estim. f’cast
(. . . . . . . . . . . . . . . . . . . . . . . . . . million tonnes . . . . . . . . . . . . . . . . . . . . .) (. . . . . . . . . . Kg/year . . . . . . . .)
ASIA 19.0 19.7 19.0 2.9 1.2 1.2 3.6 3.7 3.5
AFRICA 15.3 16.2 16.7 1.7 2.0 1.9 11.4 11.6 11.9
CENTRAL AMERICA 0.3 0.6 0.5 - - - 0.3 0.8 0.8
SOUTH AMERICA 1.8 1.9 2.1 0.1 0.1 0.1 0.8 0.8 0.9
NORTH AMERICA 4.7 4.7 4.7 1.4 1.3 1.4 2.6 2.6 2.5
EUROPE 46.2 49.3 48.9 6.0 5.8 4.5 11.2 11.3 11.5
OCEANIA 1.4 1.5 1.5 0.2 0.2 0.2 5.4 5.4 5.5
WORLD 88.8 93.8 93.4 12.4 10.6 9.4 5.3 5.4 5.4

Sta
tist
ica
l a
pp
en
dix
102 103FOOD OUTLOOKMAY 2015
APPENDIX TABLE 8(A): RICE STATISTICS
Production Imports Exports
2011-2013 2014 2015
2011-20132014 2015
2011-2013 2014 2015
average average average estim. f’cast estim. f’cast estim. f’cast
(. . . . . . . . . . . . . . . . . . . . . . . . . . . . . . . . million tonnes, milled equivalent . . . . . . . . . . . . . . . . . . . . . . . . . . . . . . .)
ASIA 445.5 447.5 452.8 17.4 20.7 19.5 29.3 34.7 33.3 Bangladesh 34.0 34.8 34.5 0.6 1.1 0.7 - - - China 140.2 142.6 142.9 2.2 3.0 3.2 0.5 0.4 0.5 of which Taiwan Prov. 1.2 1.2 1.1 0.1 0.1 0.1 - - - India 105.7 103.0 105.5 0.1 0.1 0.1 8.6 11.3 9.3 Indonesia 43.3 44.6 46.0 1.8 1.2 0.9 - - - Iran, Islamic Republic of 1.6 1.6 1.7 1.5 1.4 1.6 - - - Iraq 0.2 0.3 0.3 1.4 1.4 1.5 - - - Japan 7.7 7.6 7.6 0.7 0.7 0.7 0.1 0.1 - Korea, D.P.R. 1.8 1.7 1.8 0.1 0.1 0.1 - - - Korea, Republic of 4.2 4.2 4.1 0.5 0.4 0.5 - - - Malaysia 1.7 1.7 1.7 1.0 1.1 1.2 - - - Myanmar 17.9 18.2 18.4 - - - 0.7 0.7 0.8 Pakistan 6.2 6.7 6.5 0.1 0.1 0.1 3.0 3.7 3.8 Philippines 11.8 12.4 12.9 1.1 1.9 1.5 - - - Saudi Arabia - - - 1.2 1.4 1.5 - - - Sri Lanka 2.8 2.3 2.8 - 0.6 0.2 - - - Thailand 24.9 22.7 23.2 0.5 0.4 0.3 8.0 11.0 11.2 Viet Nam 28.9 30.0 29.9 0.6 0.6 0.6 7.2 6.5 6.5
AFRICA 17.6 18.3 18.5 13.3 14.5 14.6 0.5 0.6 0.6 Cote d’Ívoire 0.4 0.5 0.5 1.2 1.2 1.2 - - - Egypt 4.1 4.1 4.1 0.1 - 0.1 0.3 0.4 0.5 Madagascar 2.8 2.7 2.7 0.3 0.3 0.3 - - - Nigeria 2.7 2.9 2.9 2.6 3.0 2.9 - - - Senegal 0.3 0.3 0.3 1.1 1.3 1.2 - - - South Africa - - - 1.1 0.9 1.1 - - - Tanzania, United Rep. of 1.4 1.7 1.7 0.1 0.2 0.1 - 0.1 0.1
CENTRAL AMERICA 1.9 1.9 2.0 2.1 2.1 2.1 0.1 - - Cuba 0.4 0.4 0.4 0.4 0.4 0.4 - - - Mexico 0.1 0.2 0.2 0.6 0.7 0.6 - - -
SOUTH AMERICA 16.5 16.5 16.9 1.4 1.4 1.5 3.4 3.1 3.2 Argentina 1.1 1.1 1.0 - - - 0.6 0.5 0.5 Brazil 8.3 8.1 8.3 0.7 0.6 0.6 1.1 0.8 0.8 Peru 2.0 2.0 2.0 0.2 0.2 0.2 - - - Uruguay 1.0 0.9 0.9 - - - 0.9 0.9 0.8
NORTH AMERICA 6.1 7.1 7.0 1.0 1.1 1.1 3.3 3.0 3.5 Canada - - - 0.4 0.4 0.4 - - - United States of America 6.1 7.1 7.0 0.6 0.8 0.7 3.3 3.0 3.5
EUROPE 2.6 2.5 2.6 1.6 2.0 2.0 0.4 0.4 0.5 European Union 1.8 1.7 1.7 1.2 1.4 1.5 0.2 0.2 0.3 Russian Federation 0.7 0.7 0.7 0.2 0.3 0.3 0.2 0.2 0.2
OCEANIA 0.6 0.6 0.5 0.5 0.5 0.5 0.4 0.4 0.4 Australia 0.6 0.6 0.5 0.1 0.2 0.2 0.4 0.4 0.4
WORLD 490.9 494.4 500.1 37.3 42.4 41.4 37.3 42.4 41.4 Developing countries 473.3 476.0 481.9 32.3 37.0 35.9 33.1 38.4 37.0 Developed countries 17.6 18.3 18.2 5.0 5.4 5.5 4.3 4.0 4.4 LIFDCs 173.9 172.8 176.4 14.8 18.3 17.0 8.8 11.5 9.5 LDCs 73.7 75.2 75.6 8.0 9.8 9.2 2.0 1.9 2.0

Statistica
l ap
pe
nd
ix
102 103FOOD OUTLOOKMAY 2015
APPENDIX TABLE 8(B): RICE STATISTICS
Total Utilization Stocks ending in Per caput food use
10/11-12/13 2013/14 2014/15
2011-20132014 2015
10/11-12/13 2013/14 2014/15
average average average estim. f’cast estim. f’cast estim. f’cast
(. . . . . . . . . . . . . . . . . million tonnes, milled equivalent . . . . . . . . . . . . .) (. . . . . . . . . . Kg/year . . . . . . . .)
ASIA 412.2 430.8 438.9 153.1 173.5 169.0 81.7 82.6 82.9 Bangladesh 33.9 35.5 35.4 6.9 6.6 6.7 166.6 171.5 171.7 China 132.2 137.5 142.8 84.8 100.0 102.5 75.9 75.8 75.7 of which Taiwan Prov. 1.2 1.3 1.3 0.2 0.2 0.2 46.2 49.6 49.6 India 92.9 96.3 97.9 22.9 23.0 18.9 72.3 73.2 73.6 Indonesia 43.5 45.7 46.6 6.0 6.4 5.6 159.7 162.5 164.0 Iran, Islamic Republic of 3.1 3.1 3.2 0.4 0.4 0.4 35.9 36.6 36.7 Iraq 1.5 1.7 1.8 0.1 0.1 0.1 46.8 50.1 50.2 Japan 8.1 8.3 8.3 2.6 2.8 2.8 57.9 57.7 57.6 Korea, D.P.R. 1.7 1.9 1.9 0.1 0.1 0.1 62.9 68.2 68.3 Korea, Republic of 4.6 4.6 4.6 1.6 1.7 1.8 69.4 65.2 64.8 Malaysia 2.7 2.7 2.7 0.3 0.2 0.2 83.4 82.9 83.1 Myanmar 19.1 18.3 17.9 4.7 2.2 1.9 211.2 205.9 206.1 Pakistan 2.8 2.9 3.0 0.5 0.6 0.6 13.2 13.4 13.5 Philippines 12.8 14.4 13.8 2.4 2.0 2.2 120.0 123.8 124.1 Saudi Arabia 1.2 1.4 1.4 0.1 0.2 0.2 40.8 44.1 44.9 Sri Lanka 2.8 2.9 2.9 0.3 0.3 0.4 117.6 118.0 119.1 Thailand 13.3 14.5 14.9 12.8 17.3 14.3 137.1 138.6 139.1 Viet Nam 21.1 22.6 23.2 3.3 5.2 6.1 186.8 191.8 193.0
AFRICA 29.4 32.0 32.6 3.6 3.7 3.2 24.6 25.5 25.9 Cote d’Ívoire 1.6 1.6 1.7 0.1 0.1 - 74.7 76.4 76.5 Egypt 3.7 3.9 3.9 0.5 0.5 0.4 41.7 41.5 41.5 Madagascar 3.2 3.0 3.0 0.3 0.1 0.1 123.0 117.6 117.6 Nigeria 5.3 5.7 5.9 0.5 0.4 0.3 28.0 28.9 29.7 Senegal 1.3 1.5 1.5 0.3 0.5 0.4 95.8 96.9 97.1 South Africa 1.0 1.2 1.0 - 0.2 - 17.4 20.8 19.0 Tanzania, United Rep. of 1.4 1.5 1.6 0.3 0.2 0.3 23.7 25.7 25.8
CENTRAL AMERICA 3.8 3.9 4.0 0.4 0.4 0.5 17.6 17.5 17.6 Cuba 0.8 0.8 0.8 - - 0.1 63.5 64.8 65.0 Mexico 0.8 0.8 0.8 - - - 6.3 6.2 6.2
SOUTH AMERICA 14.6 15.4 15.0 2.5 1.6 1.5 34.0 34.5 34.0 Argentina 0.4 0.5 0.5 - 0.1 0.1 8.8 9.8 10.8 Brazil 8.1 8.5 8.0 1.6 0.7 0.6 39.0 39.8 38.8 Peru 2.1 2.2 2.2 0.3 0.4 0.3 63.3 64.9 65.2 Uruguay 0.1 0.1 0.1 0.1 - - 8.6 8.5 8.5
NORTH AMERICA 4.4 4.4 4.4 1.4 1.1 1.4 11.0 11.2 11.3 Canada 0.4 0.4 0.4 - - - 10.9 11.2 11.3 United States of America 4.0 4.0 4.0 1.3 1.0 1.4 11.0 11.2 11.3
EUROPE 3.9 4.1 4.2 0.6 0.7 0.6 4.8 5.0 5.2 European Union 2.9 3.0 3.0 0.5 0.5 0.4 5.2 5.3 5.5 Russian Federation 0.7 0.7 0.8 - 0.1 0.1 4.6 5.0 5.1
OCEANIA 0.7 0.7 0.7 0.1 0.2 0.1 15.9 15.6 15.9 Australia 0.3 0.3 0.3 - 0.1 0.1 10.4 10.0 10.2
WORLD 469.0 491.2 499.9 161.6 181.1 176.2 56.5 57.2 57.4 Developing countries 450.5 471.9 480.7 156.9 176.2 171.2 67.5 68.1 68.3 Developed countries 18.5 19.3 19.2 4.7 4.9 5.0 12.1 12.4 12.4 LIFDCs 173.8 183.3 185.1 35.8 35.8 31.6 63.2 64.2 64.5 LDCs 79.7 82.8 82.9 16.4 14.6 14.2 68.2 68.9 68.9

Sta
tist
ica
l a
pp
en
dix
104 105FOOD OUTLOOKMAY 2015
APPENDIX TABLE 9: CEREAL SUPPLY AND UTILIZATION IN SELECTED EXPORTERS (million tonnes)
,1,2 Wheat1 Coarse Grains2 Rice (milled basis)
2013/14 2014/15 2015/16 2013/14 2014/15 2015/16 2013/14 2014/15 2015/16 estim. f’cast estim. f’cast estim. f’cast
UNITED STATES (June/May) UNITED STATES UNITED STATES (Aug./July) Opening stocks 19.5 16.1 18.6 23.5 34.3 49.1 1.2 1.0 1.4 Production 58.1 55.1 56.0 367.4 377.4 365.6 6.1 7.1 7.0 Imports 4.6 3.9 4.3 3.3 3.3 3.6 0.7 0.7 0.8 Total Supply 82.2 75.1 78.9 394.2 415.0 418.2 8.0 8.8 9.1 Domestic use 34.2 32.6 33.4 305.4 310.9 316.1 4.0 4.1 4.1 Exports 32.0 24.0 24.5 54.5 55.0 52.8 3.0 3.4 3.5 Closing stocks 16.1 18.6 21.0 34.3 49.1 49.3 1.0 1.4 1.6
CANADA (August/July) CANADA THAILAND (Nov./Oct.)3 Opening stocks 5.1 9.7 6.2 3.1 4.6 2.9 18.0 17.3 14.3 Production 37.5 29.3 29.5 28.8 22.0 23.8 24.4 22.7 23.2 Imports 0.1 0.1 0.1 0.6 1.8 1.2 0.4 0.3 0.3 Total Supply 42.6 39.0 35.8 32.6 28.4 27.9 42.8 40.3 37.7 Domestic use 9.5 9.9 9.0 21.2 20.1 20.1 14.5 14.9 15.2 Exports 23.5 22.9 22.4 6.7 5.4 5.2 11.0 11.2 11.5 Closing stocks 9.7 6.2 4.4 4.6 2.9 2.5 17.3 14.3 11.0
ARGENTINA (Dec./Nov.) ARGENTINA INDIA (Oct./Sept.)3 Opening stocks 0.3 1.9 2.9 1.8 4.0 5.4 23.9 23.0 18.9 Production 9.2 13.9 12.0 40.9 39.9 37.6 106.7 103.0 105.5 Imports 0.0 0.0 0.0 0.1 0.1 0.1 0.1 0.1 0.1 Total Supply 9.5 15.8 15.0 42.8 43.9 43.0 130.6 126.1 124.5 Domestic use 5.7 5.9 5.9 15.4 17.6 17.7 96.3 97.9 99.3 Exports 1.9 7.0 7.0 23.4 20.9 21.1 11.3 9.3 9.7 Closing stocks 1.9 2.9 2.1 4.0 5.4 4.2 23.0 18.9 15.5
AUSTRALIA (Oct./Sept.) AUSTRALIA PAKISTAN (Nov./Oct.)3 Opening stocks 4.2 5.3 4.9 2.7 3.5 2.8 0.4 0.6 0.6 Production 26.9 23.6 24.4 14.0 10.8 11.1 6.8 6.7 6.5 Imports 0.0 0.0 0.0 0.0 0.0 0.0 0.1 0.1 0.1 Total Supply 31.1 28.9 29.3 16.7 14.3 13.9 7.2 7.4 7.1 Domestic use 6.3 6.5 6.6 6.5 5.7 5.8 2.9 3.0 3.0 Exports 19.5 17.5 18.0 6.8 5.8 5.5 3.7 3.8 3.6 Closing stocks 5.3 4.9 4.7 3.5 2.8 2.6 0.6 0.6 0.5
EU (July/June) EU VIET NAM (Nov./Oct.)3 Opening stocks 8.7 9.0 15.0 16.6 24.1 31.7 4.3 5.2 6.1 Production 143.6 156.1 148.5 158.9 169.0 161.5 29.4 30.0 29.9 Imports 3.7 5.7 6.0 15.8 9.1 9.4 0.6 0.6 0.6 Total Supply 156.0 170.8 169.5 191.3 202.1 202.6 34.2 35.8 36.5 Domestic use 116.2 123.6 122.3 158.2 160.7 163.5 22.6 23.2 23.9 Exports 30.8 32.2 29.2 9.1 9.7 8.4 6.5 6.5 6.6 Closing stocks 9.0 15.0 18.0 24.1 31.7 30.7 5.2 6.1 6.1
TOTAL OF ABOVE TOTAL OF ABOVE TOTAL OF ABOVE Opening stocks 37.8 41.9 47.7 47.8 70.4 91.9 47.7 47.1 41.2 Production 275.3 278.0 270.4 610.1 619.2 599.6 173.3 169.5 172.0 Imports 8.4 9.7 10.4 19.8 14.2 14.2 1.8 1.8 1.8 Total Supply 321.5 329.6 328.4 677.7 703.7 705.6 222.8 218.4 215.0 Domestic use 171.9 178.4 177.2 506.8 515.1 523.2 140.3 143.0 145.5 Exports 107.7 103.6 101.1 100.6 96.8 93.1 35.4 34.2 34.9 Closing stocks 41.9 47.7 50.2 70.4 91.9 89.3 47.1 41.2 34.7
1 Trade data include wheat flour in wheat grain equivalent. For the EU semolina is also included. 2 Argentina (December/November) for rye, barley and oats, (March/February) for maize and sorghum; Australia (November/October) for rye, barley and oats, (March/February) for maize and sorghum; Canada (August/July); EU (July/June); United States (June/May) for rye, barley and oats, (September/August) for maize and sorghum. 3 Rice trade data refer to the calendar year of the second year shown.
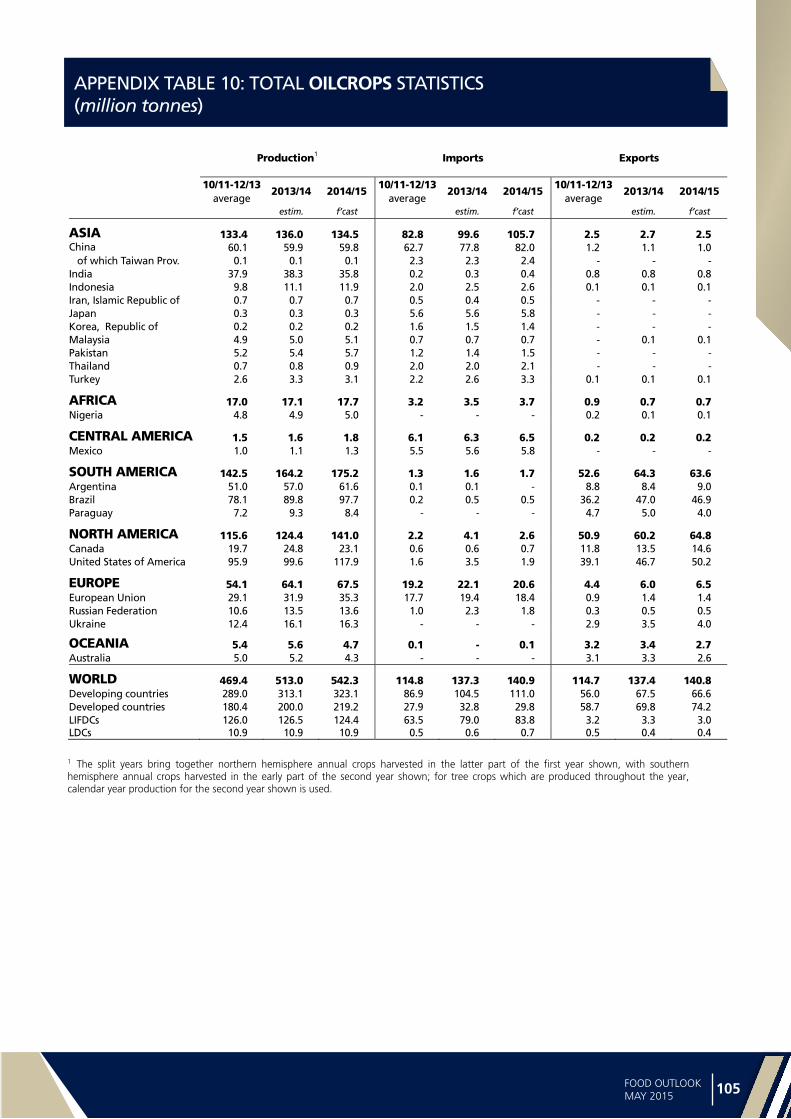
Statistica
l ap
pe
nd
ix
104 105FOOD OUTLOOKMAY 2015
APPENDIX TABLE 10: TOTAL OILCROPS STATISTICS (million tonnes)
Production1 Imports Exports
10/11-12/13 2013/14 2014/15
10/11-12/132013/14 2014/15
10/11-12/13 2013/14 2014/15
average average average estim. f’cast estim. f’cast estim. f’cast
ASIA 133.4 136.0 134.5 82.8 99.6 105.7 2.5 2.7 2.5 China 60.1 59.9 59.8 62.7 77.8 82.0 1.2 1.1 1.0 of which Taiwan Prov. 0.1 0.1 0.1 2.3 2.3 2.4 - - - India 37.9 38.3 35.8 0.2 0.3 0.4 0.8 0.8 0.8 Indonesia 9.8 11.1 11.9 2.0 2.5 2.6 0.1 0.1 0.1 Iran, Islamic Republic of 0.7 0.7 0.7 0.5 0.4 0.5 - - - Japan 0.3 0.3 0.3 5.6 5.6 5.8 - - - Korea, Republic of 0.2 0.2 0.2 1.6 1.5 1.4 - - - Malaysia 4.9 5.0 5.1 0.7 0.7 0.7 - 0.1 0.1 Pakistan 5.2 5.4 5.7 1.2 1.4 1.5 - - - Thailand 0.7 0.8 0.9 2.0 2.0 2.1 - - - Turkey 2.6 3.3 3.1 2.2 2.6 3.3 0.1 0.1 0.1
AFRICA 17.0 17.1 17.7 3.2 3.5 3.7 0.9 0.7 0.7 Nigeria 4.8 4.9 5.0 - - - 0.2 0.1 0.1
CENTRAL AMERICA 1.5 1.6 1.8 6.1 6.3 6.5 0.2 0.2 0.2 Mexico 1.0 1.1 1.3 5.5 5.6 5.8 - - -
SOUTH AMERICA 142.5 164.2 175.2 1.3 1.6 1.7 52.6 64.3 63.6 Argentina 51.0 57.0 61.6 0.1 0.1 - 8.8 8.4 9.0 Brazil 78.1 89.8 97.7 0.2 0.5 0.5 36.2 47.0 46.9 Paraguay 7.2 9.3 8.4 - - - 4.7 5.0 4.0
NORTH AMERICA 115.6 124.4 141.0 2.2 4.1 2.6 50.9 60.2 64.8 Canada 19.7 24.8 23.1 0.6 0.6 0.7 11.8 13.5 14.6 United States of America 95.9 99.6 117.9 1.6 3.5 1.9 39.1 46.7 50.2
EUROPE 54.1 64.1 67.5 19.2 22.1 20.6 4.4 6.0 6.5 European Union 29.1 31.9 35.3 17.7 19.4 18.4 0.9 1.4 1.4 Russian Federation 10.6 13.5 13.6 1.0 2.3 1.8 0.3 0.5 0.5 Ukraine 12.4 16.1 16.3 - - - 2.9 3.5 4.0
OCEANIA 5.4 5.6 4.7 0.1 - 0.1 3.2 3.4 2.7 Australia 5.0 5.2 4.3 - - - 3.1 3.3 2.6
WORLD 469.4 513.0 542.3 114.8 137.3 140.9 114.7 137.4 140.8 Developing countries 289.0 313.1 323.1 86.9 104.5 111.0 56.0 67.5 66.6 Developed countries 180.4 200.0 219.2 27.9 32.8 29.8 58.7 69.8 74.2 LIFDCs 126.0 126.5 124.4 63.5 79.0 83.8 3.2 3.3 3.0 LDCs 10.9 10.9 10.9 0.5 0.6 0.7 0.5 0.4 0.4
1 The split years bring together northern hemisphere annual crops harvested in the latter part of the first year shown, with southern hemisphere annual crops harvested in the early part of the second year shown; for tree crops which are produced throughout the year, calendar year production for the second year shown is used.
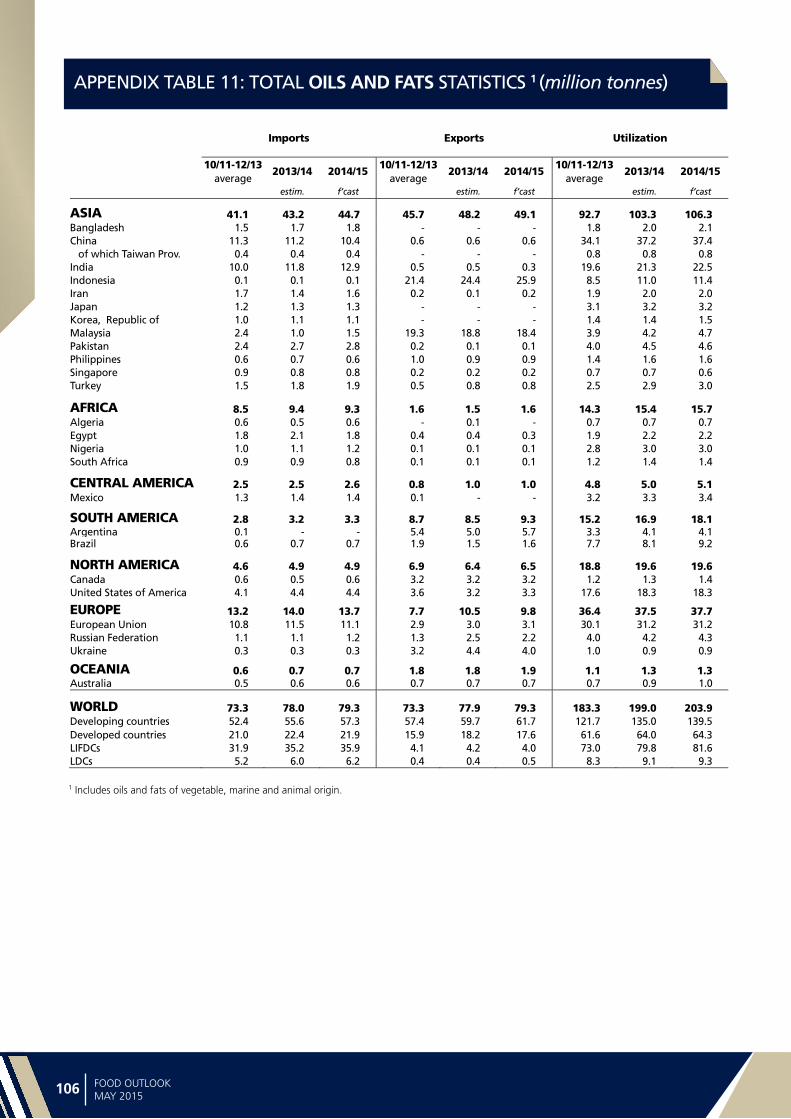
Sta
tist
ica
l a
pp
en
dix
106 107FOOD OUTLOOKMAY 2015
APPENDIX TABLE 11: TOTAL OILS AND FATS STATISTICS 1 (million tonnes)
Imports Exports Utilization
10/11-12/13 2013/14 2014/15
10/11-12/132013/14 2014/15
10/11-12/13 2013/14 2014/15
average average average estim. f’cast estim. f’cast estim. f’cast
ASIA 41.1 43.2 44.7 45.7 48.2 49.1 92.7 103.3 106.3 Bangladesh 1.5 1.7 1.8 - - - 1.8 2.0 2.1 China 11.3 11.2 10.4 0.6 0.6 0.6 34.1 37.2 37.4 of which Taiwan Prov. 0.4 0.4 0.4 - - - 0.8 0.8 0.8 India 10.0 11.8 12.9 0.5 0.5 0.3 19.6 21.3 22.5 Indonesia 0.1 0.1 0.1 21.4 24.4 25.9 8.5 11.0 11.4 Iran 1.7 1.4 1.6 0.2 0.1 0.2 1.9 2.0 2.0 Japan 1.2 1.3 1.3 - - - 3.1 3.2 3.2 Korea, Republic of 1.0 1.1 1.1 - - - 1.4 1.4 1.5 Malaysia 2.4 1.0 1.5 19.3 18.8 18.4 3.9 4.2 4.7 Pakistan 2.4 2.7 2.8 0.2 0.1 0.1 4.0 4.5 4.6 Philippines 0.6 0.7 0.6 1.0 0.9 0.9 1.4 1.6 1.6 Singapore 0.9 0.8 0.8 0.2 0.2 0.2 0.7 0.7 0.6 Turkey 1.5 1.8 1.9 0.5 0.8 0.8 2.5 2.9 3.0
AFRICA 8.5 9.4 9.3 1.6 1.5 1.6 14.3 15.4 15.7 Algeria 0.6 0.5 0.6 - 0.1 - 0.7 0.7 0.7 Egypt 1.8 2.1 1.8 0.4 0.4 0.3 1.9 2.2 2.2 Nigeria 1.0 1.1 1.2 0.1 0.1 0.1 2.8 3.0 3.0 South Africa 0.9 0.9 0.8 0.1 0.1 0.1 1.2 1.4 1.4
CENTRAL AMERICA 2.5 2.5 2.6 0.8 1.0 1.0 4.8 5.0 5.1 Mexico 1.3 1.4 1.4 0.1 - - 3.2 3.3 3.4
SOUTH AMERICA 2.8 3.2 3.3 8.7 8.5 9.3 15.2 16.9 18.1 Argentina 0.1 - - 5.4 5.0 5.7 3.3 4.1 4.1Brazil 0.6 0.7 0.7 1.9 1.5 1.6 7.7 8.1 9.2
NORTH AMERICA 4.6 4.9 4.9 6.9 6.4 6.5 18.8 19.6 19.6 Canada 0.6 0.5 0.6 3.2 3.2 3.2 1.2 1.3 1.4 United States of America 4.1 4.4 4.4 3.6 3.2 3.3 17.6 18.3 18.3
EUROPE 13.2 14.0 13.7 7.7 10.5 9.8 36.4 37.5 37.7 European Union 10.8 11.5 11.1 2.9 3.0 3.1 30.1 31.2 31.2 Russian Federation 1.1 1.1 1.2 1.3 2.5 2.2 4.0 4.2 4.3 Ukraine 0.3 0.3 0.3 3.2 4.4 4.0 1.0 0.9 0.9
OCEANIA 0.6 0.7 0.7 1.8 1.8 1.9 1.1 1.3 1.3 Australia 0.5 0.6 0.6 0.7 0.7 0.7 0.7 0.9 1.0
WORLD 73.3 78.0 79.3 73.3 77.9 79.3 183.3 199.0 203.9 Developing countries 52.4 55.6 57.3 57.4 59.7 61.7 121.7 135.0 139.5 Developed countries 21.0 22.4 21.9 15.9 18.2 17.6 61.6 64.0 64.3 LIFDCs 31.9 35.2 35.9 4.1 4.2 4.0 73.0 79.8 81.6 LDCs 5.2 6.0 6.2 0.4 0.4 0.5 8.3 9.1 9.3
1 Includes oils and fats of vegetable, marine and animal origin.

Statistica
l ap
pe
nd
ix
106 107FOOD OUTLOOKMAY 2015
APPENDIX TABLE 12: TOTAL MEALS AND CAKES STATISTICS 1 (million tonnes)
Imports Exports Utilization
10/11-12/13 2013/14 2014/15
10/11-12/132013/14 2014/15
10/11-12/13 2013/14 2014/15
average average average estim. f’cast estim. f’cast estim. f’cast
ASIA 31.4 34.8 35.9 15.5 16.0 14.7 131.2 144.4 151.7 China 3.2 2.9 2.7 1.4 2.4 2.0 71.4 79.6 83.1 of which Taiwan Prov. 0.5 0.5 0.6 - - - 2.4 2.4 2.4 India 0.2 0.2 0.3 5.7 4.3 3.1 12.0 12.4 13.1 Indonesia 3.5 4.3 4.4 3.4 4.1 4.3 5.3 6.4 6.8 Japan 2.6 2.6 2.4 - - - 6.7 6.5 6.5 Korea, Republic of 3.5 4.0 4.0 0.1 0.2 0.2 4.7 5.0 5.1 Malaysia 1.2 1.4 1.5 2.5 2.6 2.6 1.9 2.1 2.2 Pakistan 0.7 0.8 1.1 0.2 0.2 0.3 3.3 3.7 3.9 Philippines 2.0 2.4 2.5 0.5 0.5 0.5 2.4 2.8 2.9 Saudi Arabia 0.7 0.8 0.9 - - - 0.7 0.9 0.9 Thailand 3.2 3.2 3.5 0.1 0.2 0.1 5.4 5.6 5.7 Turkey 1.7 2.3 2.5 0.2 0.2 0.1 3.9 5.0 5.7 Viet Nam 3.5 3.7 4.0 0.1 0.2 0.2 4.3 4.8 5.3
AFRICA 4.7 5.5 6.2 0.9 1.0 1.0 11.1 12.3 12.9 Egypt 1.0 1.1 1.3 - - - 2.5 2.7 2.9 South Africa 1.2 1.1 1.2 0.1 0.1 0.1 1.9 2.2 2.2
CENTRAL AMERICA 3.4 3.4 3.7 0.2 0.2 0.2 8.2 8.4 8.6 Mexico 1.8 1.7 2.0 0.1 0.1 0.1 6.1 6.2 6.3
SOUTH AMERICA 4.9 5.3 5.5 45.1 45.9 49.9 23.6 26.2 28.0 Argentina - - - 27.0 26.2 29.5 2.5 3.8 5.0 Bolivia - - - 1.4 1.8 1.8 0.1 0.1 0.2 Brazil 0.2 - - 14.0 14.0 14.6 14.6 15.4 15.7 Chile 1.0 1.2 1.3 0.3 0.3 0.3 1.4 1.6 1.7 Paraguay - - - 1.1 2.5 2.6 0.4 0.4 0.4 Peru 0.9 0.9 0.9 1.2 1.0 1.0 1.0 1.1 1.1 Venezuela 1.3 1.4 1.5 - - - 1.4 1.5 1.6
NORTH AMERICA 4.2 5.0 4.9 13.6 15.4 16.4 34.9 35.0 36.1 Canada 1.2 1.1 1.1 4.1 4.6 4.5 2.3 2.3 2.0 United States of America 3.1 3.9 3.8 9.6 10.9 11.9 32.7 32.7 34.1
EUROPE 31.2 30.0 30.9 6.6 8.0 7.7 61.5 64.7 67.1 European Union 28.5 27.3 28.1 1.4 1.1 1.2 54.0 56.0 57.5 Russian Federation 0.6 0.6 0.7 1.6 2.6 2.5 4.2 5.0 5.6 Ukraine - - - 3.1 3.9 3.5 0.9 1.3 1.6
OCEANIA 2.4 2.9 3.2 0.2 0.2 0.2 3.1 3.7 4.0 Australia 0.8 0.9 1.2 0.1 0.1 0.1 1.3 1.7 1.9
WORLD 82.2 86.8 90.2 82.2 86.8 90.2 273.6 294.7 308.5 Developing countries 40.0 44.7 47.2 61.5 63.0 65.7 163.6 180.6 190.6 Developed countries 42.2 42.1 43.0 20.7 23.8 24.5 110.0 114.1 118.0 LIFDCs 8.8 9.6 10.1 9.0 8.7 7.3 96.0 105.7 111.0 LDCs 0.6 0.7 0.8 0.4 0.5 0.5 3.8 4.0 4.1
1 Expressed in product weight; includes meals and cakes derived from oilcrops as well as fish meal and other meals from animal origin.

Sta
tist
ica
l a
pp
en
dix
108 109FOOD OUTLOOKMAY 2015
APPENDIX TABLE 13: SUGAR STATISTICS (million tonnes, raw value)
Production Imports Exports Utilization
2013/14 2014/15 2013/14 2014/15 2013/14 2014/15 2013/14 2014/15 estim. f’cast estim. f’cast estim. f’cast estim. f’cast
ASIA 69.3 68.3 32.2 32.0 13.5 13.6 83.9 85.7 China 13.9 11.4 5.3 4.9 0.3 0.1 17.6 18.1 India 26.6 28.5 1.3 1.2 2.7 2.1 26.3 26.6 Indonesia 2.7 2.8 3.5 4.1 - - 5.9 6.1 Japan 0.7 0.7 1.5 1.5 - - 2.2 2.2 Korea, Republic of - - 1.6 1.7 0.3 0.3 1.4 1.4 Malaysia - - 1.6 1.9 0.1 0.1 1.8 1.8 Pakistan 5.4 5.3 0.1 0.1 0.6 0.7 4.8 4.9 Philippines 2.4 2.5 - - 0.4 0.3 2.1 2.2 Thailand 11.3 10.8 - - 6.4 7.5 2.7 3.4 Turkey 2.5 2.5 - - 0.1 0.1 2.5 2.5 Viet Nam 1.7 1.7 0.1 0.1 0.1 0.2 1.6 1.7
AFRICA 12.4 12.5 10.3 10.7 3.2 3.3 19.8 20.3 Algeria - - 2.0 1.9 0.5 0.5 1.3 1.3 Egypt 2.1 2.1 1.3 1.5 0.1 0.1 3.4 3.6 Ethiopia 0.4 0.4 0.2 0.2 - - 0.5 0.6 Kenya 0.6 0.7 0.2 0.2 - - 0.9 0.9 Mauritius 0.4 0.4 - - 0.4 0.3 0.1 0.1 Morocco 0.4 0.5 0.8 1.0 - - 1.3 1.4 Mozambique 0.5 0.5 - - 0.3 0.3 0.2 0.2 South Africa 2.4 2.3 0.3 0.3 0.5 0.8 2.3 2.4 Sudan 0.9 1.0 0.8 0.8 - - 1.7 1.7 Swaziland 0.7 0.7 - - 0.6 0.6 0.1 0.1 Tanzania, United Rep. of 0.4 0.4 0.2 0.2 - - 0.5 0.6 Zambia
CENTRAL AMERICA 14.5 14.6 0.6 0.6 7.1 6.5 8.8 8.7 Cuba 1.7 1.8 - - 0.9 1.1 0.6 0.7 Dominican Republic 0.6 0.6 - - 0.2 0.2 0.5 0.5 Guatemala 2.9 2.9 0.1 0.1 1.9 2.1 0.9 0.9 Mexico 6.5 6.4 0.1 0.2 2.6 1.8 4.7 4.8
SOUTH AMERICA 47.0 45.8 2.2 2.3 26.4 26.4 21.5 22.0 Argentina 2.1 2.2 - - 0.4 0.4 1.8 1.8 Brazil 39.0 37.5 - - 24.7 24.7 12.9 13.1 Colombia 2.4 2.5 0.4 0.4 0.8 0.8 1.9 2.2 Peru 1.1 1.1 0.3 0.4 - - 1.4 1.4 Venezuela 0.6 0.6 0.6 0.7 - - 1.2 1.3
NORTH AMERICA 7.3 7.7 4.3 4.5 0.3 0.3 12.2 12.2 United States of America 7.2 7.6 2.9 2.8 0.2 0.2 10.7 10.7
EUROPE 25.5 27.4 5.5 4.8 1.9 2.0 29.3 29.2 European Union 17.1 19.1 3.4 3.0 1.3 1.4 19.3 19.4 Russian Federation 4.8 4.8 1.1 0.9 - - 6.0 6.1 Ukraine 1.9 2.3 - - 0.1 0.1 2.0 2.1
OCEANIA 4.6 4.8 0.3 0.3 3.1 3.2 1.5 1.6 Australia 4.4 4.6 - - 2.9 3.0 1.1 1.2 Fiji 0.2 0.2 - - 0.1 0.1 - -
WORLD 180.6 181.0 55.4 55.3 55.4 55.3 176.9 179.8 Developing countries 140.3 138.4 41.2 41.6 49.7 49.1 127.0 129.9 Developed countries 40.3 42.7 14.2 13.7 5.7 6.2 49.9 49.8 LIFDCs 36.1 38.2 15.0 13.8 4.5 3.8 45.6 46.1 LDCs 4.3 4.4 10.3 9.0 1.0 0.9 11.0 11.3

Statistica
l ap
pe
nd
ix
108 109FOOD OUTLOOKMAY 2015
APPENDIX TABLE 14: TOTAL MEAT STATISTICS1
(thousand tonnes, carcass weight equivalent)
Production Imports Exports Utilization
2014 2015 2014 2015 2014 2015 2014 2015 estim. f’cast estim. f’cast estim. f’cast estim. f’cast
ASIA 134 108 135 727 15 833 16 261 4 500 4 731 145 441 147 257 China 87 741 88 390 4 663 4 828 730 753 91 674 92 465 India 6 316 6 530 1 1 1 966 2 048 4 350 4 483 Indonesia 3 340 3 401 103 98 5 5 3 438 3 494 Iran, Islamic Republic of 2 595 2 694 142 157 75 93 2 662 2 758 Japan 3 262 3 287 3 214 3 175 15 14 6 460 6 448 Korea, Republic of 2 232 2 277 1 002 1 058 29 31 3 204 3 304 Malaysia 1 646 1 675 289 294 50 50 1 885 1 919 Pakistan 3 092 3 171 19 24 64 72 3 047 3 122 Philippines 3 135 3 155 440 451 18 19 3 556 3 587 Saudi Arabia 821 829 1 036 1 068 62 66 1 795 1 832 Singapore 118 119 331 355 28 30 421 444 Thailand 2 712 2 795 40 41 851 879 1 901 1 956 Turkey 3 106 3 145 3 4 450 502 2 659 2 647 Viet Nam 4 328 4 413 1 783 1 886 22 26 6 089 6 273
AFRICA 17 087 17 286 2 866 2 991 239 269 19 714 20 007 Algeria 742 747 102 102 1 1 843 849 Angola 267 274 693 766 - - 960 1 039 Egypt 2 097 2 089 333 329 16 10 2 414 2 408 Nigeria 1 464 1 494 4 4 1 1 1 468 1 497 South Africa 2 821 2 848 459 459 148 184 3 131 3 122
CENTRAL AMERICA 8 872 9 030 2 820 2 872 505 539 11 187 11 364 Cuba 304 303 244 230 - - 549 533 Mexico 6 184 6 301 1 848 1 907 274 285 7 758 7 923
SOUTH AMERICA 42 050 42 765 1 197 1 139 8 128 8 497 35 118 35 407 Argentina 5 274 5 359 14 15 562 565 4 726 4 809 Brazil 26 348 26 806 85 93 6 546 6 852 19 887 20 048 Chile 1 457 1 458 362 356 289 286 1 530 1 528 Colombia 2 396 2 421 134 143 14 12 2 517 2 552 Uruguay 650 683 40 38 348 371 342 349 Venezuela 2 073 2 146 468 397 - - 2 540 2 542
NORTH AMERICA 46 854 47 481 2 775 2 678 9 252 9 242 40 377 40 917 Canada 4 491 4 581 769 766 1 717 1 723 3 542 3 624 United States of America 42 362 42 899 1 995 1 900 7 535 7 519 36 822 37 280
EUROPE 59 470 60 324 3 767 3 661 4 797 4 872 58 440 59 113 Belarus 1 147 1 159 86 110 312 325 921 944 European Union 45 515 46 079 1 291 1 325 4 037 4 106 42 769 43 297 Russian Federation 8 615 8 886 1 880 1 719 143 129 10 352 10 475 Ukraine 2 559 2 564 109 111 206 212 2 463 2 463
OCEANIA 6 242 6 089 443 455 3 225 3 026 3 460 3 518 Australia 4 500 4 325 222 234 2 253 2 057 2 470 2 502 New Zealand 1 235 1 255 70 70 969 966 336 359
WORLD 314 683 318 701 29 700 30 056 30 645 31 176 313 737 317 582 Developing countries 192 914 195 470 18 658 19 243 13 197 13 826 198 375 200 888 Developed countries 121 769 123 231 11 042 10 814 17 448 17 350 115 362 116 694 LIFDCs 22 204 22 637 1 845 1 922 2 138 2 241 21 911 22 318 LDCs 10 011 10 179 1 683 1 816 11 12 11 683 11 983
1 Including “other meat”.

Sta
tist
ica
l a
pp
en
dix
110 111FOOD OUTLOOKMAY 2015
APPENDIX TABLE 15: BOVINE MEAT STATISTICS (thousand tonnes, carcass weight equivalent)
Production Imports Exports Utilization
2014 2015 2014 2015 2014 2015 2014 2015 estim. f’cast estim. f’cast estim. f’cast estim. f’cast
ASIA 17 611 17 683 4 609 4 852 2 183 2 269 20 045 20 305 China 6 546 6 459 1 189 1 340 43 42 7 713 7 767 India 2 621 2 678 - 1 1 933 2 010 688 668 Indonesia 591 601 93 86 - 1 683 686 Iran, Islamic Republic of 253 254 127 140 4 3 377 391 Japan 495 482 737 731 2 2 1 221 1 221 Korea, Republic of 330 325 346 365 5 5 671 701 Malaysia 31 31 194 202 13 12 211 221 Pakistan 1 680 1 735 5 4 29 33 1 656 1 707 Philippines 290 286 142 145 4 3 427 428
AFRICA 6 161 6 229 764 763 76 100 6 850 6 892 Algeria 135 132 94 95 - - 229 228 Angola 107 108 143 150 - - 250 258 Egypt 870 860 300 300 2 1 1 168 1 159 South Africa 860 862 30 29 45 70 846 820
CENTRAL AMERICA 2 468 2 509 381 378 310 338 2 538 2 549 Mexico 1 770 1 782 223 220 133 138 1 860 1 864
SOUTH AMERICA 15 776 16 017 462 422 2 740 2 927 13 488 13 517 Argentina 2 809 2 848 - 1 215 230 2 594 2 618 Brazil 9 820 9 973 71 80 1 839 1 950 8 052 8 103 Chile 209 211 224 220 5 5 428 426 Colombia 840 835 4 4 11 9 833 831 Uruguay 525 550 3 2 308 330 220 221 Venezuela 510 512 144 100 - - 644 617
NORTH AMERICA 12 280 12 028 1 507 1 428 1 562 1 531 12 288 11 921 Canada 1 160 1 163 280 275 343 341 1 110 1 098 United States of America 11 120 10 864 1 224 1 150 1 218 1 190 11 175 10 820
EUROPE 10 453 10 590 1 263 1 209 516 502 11 201 11 297 European Union 7 661 7 788 327 323 315 335 7 674 7 776 Russian Federation 1 654 1 687 830 780 46 19 2 438 2 448 Ukraine 459 443 3 4 18 16 445 430
OCEANIA 3 013 2 861 60 59 2 209 2 108 934 814 Australia 2 423 2 251 12 12 1 680 1 560 825 706 New Zealand 570 590 17 14 526 545 61 59
WORLD 67 762 67 916 9 046 9 111 9 596 9 774 67 344 67 296 Developing countries 38 834 39 234 5 297 5 507 5 261 5 559 38 878 39 216 Developed countries 28 927 28 682 3 749 3 604 4 335 4 215 28 467 28 079 LIFDCs 8 102 8 243 297 295 2 071 2 167 6 328 6 371 LDCs 3 485 3 533 218 229 3 3 3 700 3 758

Statistica
l ap
pe
nd
ix
110 111FOOD OUTLOOKMAY 2015
APPENDIX TABLE 16: OVINE MEAT STATISTICS (thousand tonnes, carcass weight equivalent)
Production Imports Exports Utilization
2014 2015 2014 2015 2014 2015 2014 2015 estim. f’cast estim. f’cast estim. f’cast estim. f’cast
ASIA 8 102 8 191 643 577 45 53 8 700 8 716 Bangladesh 210 213 - - - - 210 213 China 4 128 4 178 327 273 2 1 4 453 4 450 India 741 732 - - 23 27 718 706 Iran, Islamic Republic of 280 291 2 7 - - 282 298 Pakistan 464 467 - - 13 15 451 452 Saudi Arabia 132 134 60 55 3 3 189 186 Turkey 360 366 1 1 - - 361 367
AFRICA 3 064 3 101 33 31 36 37 3 061 3 095 Algeria 308 315 5 3 - - 313 318 Nigeria 481 487 - - - - 481 487 South Africa 181 182 10 10 2 1 189 191 Sudan 482 483 - - 6 6 477 478
CENTRAL AMERICA 125 124 21 22 - - 145 146 Mexico 96 95 11 13 - - 107 108
SOUTH AMERICA 322 324 10 8 26 25 305 307 Brazil 117 116 10 8 - - 127 124
NORTH AMERICA 91 92 118 104 4 5 205 191 United States of America 74 75 98 85 4 5 167 155
EUROPE 1 217 1 224 176 174 36 38 1 357 1 360 European Union 898 901 156 157 28 30 1 026 1 028 Russian Federation 191 191 10 8 - - 201 200
OCEANIA 987 964 28 23 880 781 135 205 Australia 575 558 1 1 482 408 94 152 New Zealand 411 405 4 3 398 374 17 34
WORLD 13 907 14 019 1 028 941 1 028 940 13 908 14 020 Developing countries 10 796 10 913 696 628 105 114 11 387 11 427 Developed countries 3 111 3 107 332 313 922 826 2 521 2 593 LIFDCs 3 698 3 728 25 22 31 35 3 692 3 715 LDCs 1 896 1 919 6 6 6 6 1 896 1 919

Sta
tist
ica
l a
pp
en
dix
112 113FOOD OUTLOOKMAY 2015
APPENDIX TABLE 17: PIGMEAT STATISTICS (thousand tonnes, carcass weight equivalent)
Production Imports Exports Utilization
2014 2015 2014 2015 2014 2015 2014 2015 estim. f’cast estim. f’cast estim. f’cast estim. f’cast
ASIA 68 019 68 867 3 753 3 852 299 315 71 424 72 611 China 57 091 57 768 1 346 1 413 200 213 58 212 59 168 India 355 357 1 1 - - 355 357 Indonesia 744 748 3 3 - - 747 750 Japan 1 273 1 295 1 351 1 300 2 2 2 588 2 592 Korea, D.P.R. 113 114 3 3 - - 116 117 Korea, Republic of 1 200 1 240 486 520 3 3 1 695 1 766 Malaysia 230 230 16 15 6 5 240 239 Philippines 1 701 1 724 122 121 3 3 1 821 1 842 Thailand 980 985 4 3 34 35 950 953 Viet Nam 3 284 3 352 183 213 22 25 3 446 3 540
AFRICA 1 326 1 356 317 331 33 32 1 610 1 655 Madagascar 59 60 - - - - 59 60 Nigeria 255 257 1 1 - - 256 258 South Africa 221 225 25 22 24 25 222 221 Uganda 118 120 1 1 - - 118 120
CENTRAL AMERICA 1 806 1 854 894 919 146 150 2 554 2 624 Cuba 194 191 15 17 - - 209 208 Mexico 1 285 1 335 711 735 127 131 1 870 1 939
SOUTH AMERICA 5 485 5 692 190 193 807 821 4 868 5 065 Argentina 450 485 11 8 1 1 460 492 Brazil 3 344 3 494 2 2 646 661 2 700 2 836 Chile 553 554 44 41 157 155 440 440 Colombia 245 249 71 82 - - 316 331 Venezuela 250 260 8 6 - - 258 266
NORTH AMERICA 12 377 13 051 792 784 3 303 3 337 9 885 10 493 Canada 2 008 2 051 239 240 1 176 1 181 1 074 1 115 United States of America 10 368 11 000 548 540 2 127 2 155 8 807 9 374
EUROPE 27 663 28 077 739 714 2 388 2 437 26 014 26 354 Belarus 443 451 41 61 79 86 405 426 European Union 22 681 22 964 15 15 2 222 2 259 20 475 20 720 Russian Federation 3 013 3 157 535 480 32 33 3 517 3 604 Serbia 242 240 29 31 26 27 245 244 Ukraine 809 790 40 51 12 16 838 825
OCEANIA 497 501 262 278 35 33 719 745 Australia 365 365 192 202 34 32 518 535 Papua New Guinea 73 72 8 9 - - 81 81
WORLD 117 173 119 398 6 947 7 072 7 011 7 124 117 075 119 548 Developing countries 75 046 76 147 3 742 3 938 1 259 1 289 77 515 79 005 Developed countries 42 127 43 251 3 205 3 134 5 752 5 835 39 561 40 543 LIFDCs 3 307 3 355 286 287 7 8 3 586 3 634 LDCs 1 570 1 593 238 259 1 1 1 807 1 851
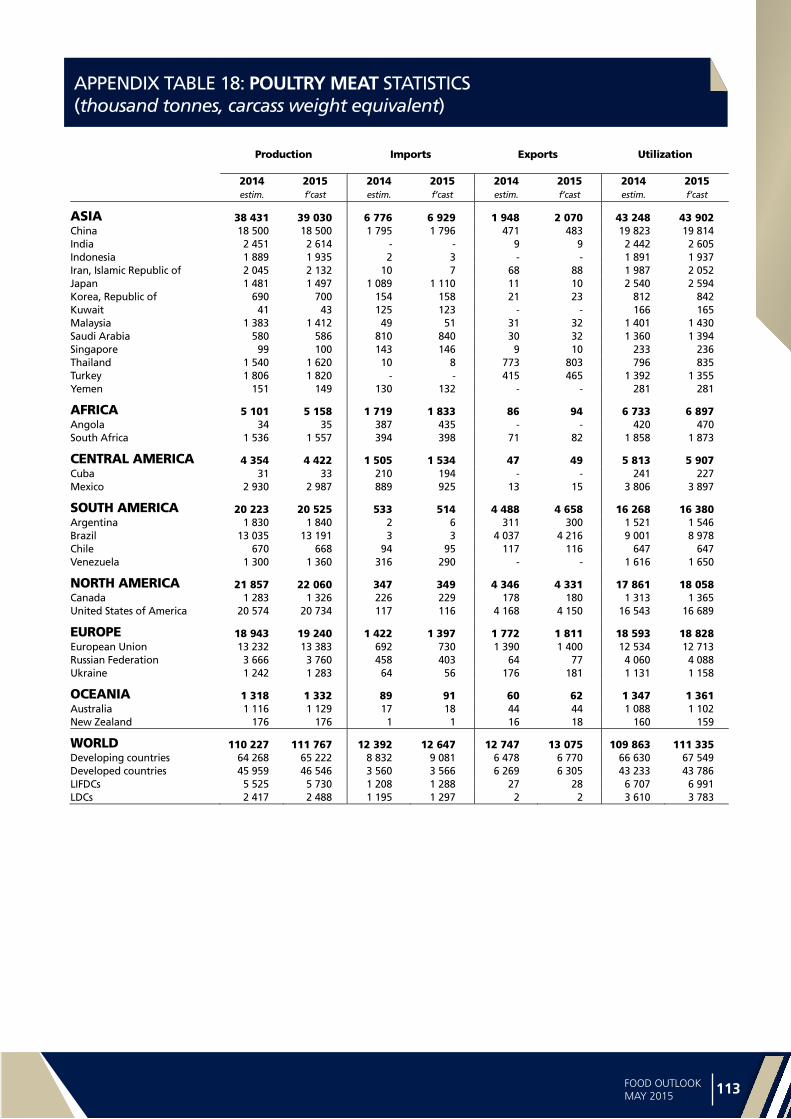
Statistica
l ap
pe
nd
ix
112 113FOOD OUTLOOKMAY 2015
APPENDIX TABLE 18: POULTRY MEAT STATISTICS (thousand tonnes, carcass weight equivalent)
Production Imports Exports Utilization
2014 2015 2014 2015 2014 2015 2014 2015 estim. f’cast estim. f’cast estim. f’cast estim. f’cast
ASIA 38 431 39 030 6 776 6 929 1 948 2 070 43 248 43 902 China 18 500 18 500 1 795 1 796 471 483 19 823 19 814 India 2 451 2 614 - - 9 9 2 442 2 605 Indonesia 1 889 1 935 2 3 - - 1 891 1 937 Iran, Islamic Republic of 2 045 2 132 10 7 68 88 1 987 2 052 Japan 1 481 1 497 1 089 1 110 11 10 2 540 2 594 Korea, Republic of 690 700 154 158 21 23 812 842 Kuwait 41 43 125 123 - - 166 165 Malaysia 1 383 1 412 49 51 31 32 1 401 1 430 Saudi Arabia 580 586 810 840 30 32 1 360 1 394 Singapore 99 100 143 146 9 10 233 236 Thailand 1 540 1 620 10 8 773 803 796 835 Turkey 1 806 1 820 - - 415 465 1 392 1 355 Yemen 151 149 130 132 - - 281 281
AFRICA 5 101 5 158 1 719 1 833 86 94 6 733 6 897 Angola 34 35 387 435 - - 420 470 South Africa 1 536 1 557 394 398 71 82 1 858 1 873
CENTRAL AMERICA 4 354 4 422 1 505 1 534 47 49 5 813 5 907 Cuba 31 33 210 194 - - 241 227 Mexico 2 930 2 987 889 925 13 15 3 806 3 897
SOUTH AMERICA 20 223 20 525 533 514 4 488 4 658 16 268 16 380 Argentina 1 830 1 840 2 6 311 300 1 521 1 546 Brazil 13 035 13 191 3 3 4 037 4 216 9 001 8 978 Chile 670 668 94 95 117 116 647 647 Venezuela 1 300 1 360 316 290 - - 1 616 1 650
NORTH AMERICA 21 857 22 060 347 349 4 346 4 331 17 861 18 058 Canada 1 283 1 326 226 229 178 180 1 313 1 365 United States of America 20 574 20 734 117 116 4 168 4 150 16 543 16 689
EUROPE 18 943 19 240 1 422 1 397 1 772 1 811 18 593 18 828 European Union 13 232 13 383 692 730 1 390 1 400 12 534 12 713 Russian Federation 3 666 3 760 458 403 64 77 4 060 4 088 Ukraine 1 242 1 283 64 56 176 181 1 131 1 158
OCEANIA 1 318 1 332 89 91 60 62 1 347 1 361 Australia 1 116 1 129 17 18 44 44 1 088 1 102 New Zealand 176 176 1 1 16 18 160 159
WORLD 110 227 111 767 12 392 12 647 12 747 13 075 109 863 111 335 Developing countries 64 268 65 222 8 832 9 081 6 478 6 770 66 630 67 549 Developed countries 45 959 46 546 3 560 3 566 6 269 6 305 43 233 43 786 LIFDCs 5 525 5 730 1 208 1 288 27 28 6 707 6 991 LDCs 2 417 2 488 1 195 1 297 2 2 3 610 3 783
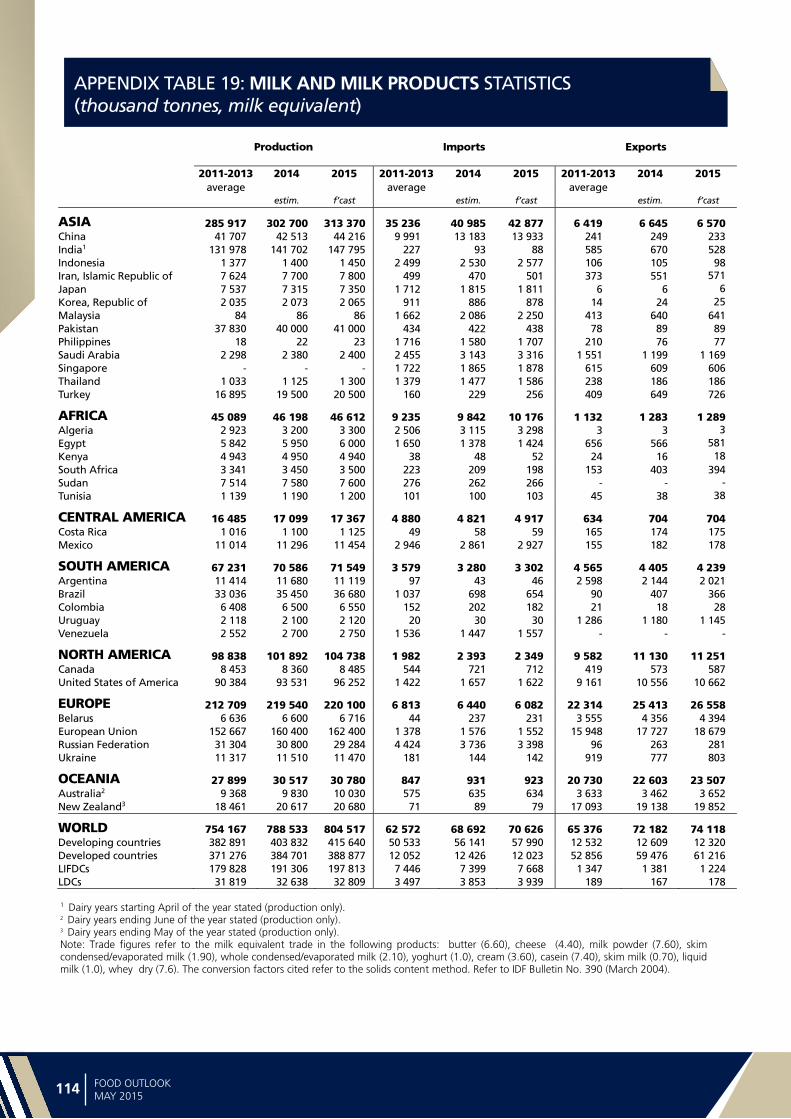
Sta
tist
ica
l a
pp
en
dix
114 115FOOD OUTLOOKMAY 2015
APPENDIX TABLE 19: MILK AND MILK PRODUCTS STATISTICS (thousand tonnes, milk equivalent)
Production Imports Exports
2011-2013 2014 2015 2011-2013 2014 2015 2011-2013 2014 2015
average average average
estim. f’cast estim. f’cast estim. f’cast
ASIA 285 917 302 700 313 370 35 236 40 985 42 877 6 419 6 645 6 570 China 41 707 42 513 44 216 9 991 13 183 13 933 241 249 233 India1 131 978 141 702 147 795 227 93 88 585 670 528 Indonesia 1 377 1 400 1 450 2 499 2 530 2 577 106 105 98 Iran, Islamic Republic of 7 624 7 700 7 800 499 470 501 373 551 571Japan 7 537 7 315 7 350 1 712 1 815 1 811 6 6 6Korea, Republic of 2 035 2 073 2 065 911 886 878 14 24 25Malaysia 84 86 86 1 662 2 086 2 250 413 640 641 Pakistan 37 830 40 000 41 000 434 422 438 78 89 89 Philippines 18 22 23 1 716 1 580 1 707 210 76 77 Saudi Arabia 2 298 2 380 2 400 2 455 3 143 3 316 1 551 1 199 1 169 Singapore - - - 1 722 1 865 1 878 615 609 606 Thailand 1 033 1 125 1 300 1 379 1 477 1 586 238 186 186 Turkey 16 895 19 500 20 500 160 229 256 409 649 726
AFRICA 45 089 46 198 46 612 9 235 9 842 10 176 1 132 1 283 1 289 Algeria 2 923 3 200 3 300 2 506 3 115 3 298 3 3 3Egypt 5 842 5 950 6 000 1 650 1 378 1 424 656 566 581Kenya 4 943 4 950 4 940 38 48 52 24 16 18South Africa 3 341 3 450 3 500 223 209 198 153 403 394 Sudan 7 514 7 580 7 600 276 262 266 - - -Tunisia 1 139 1 190 1 200 101 100 103 45 38 38
CENTRAL AMERICA 16 485 17 099 17 367 4 880 4 821 4 917 634 704 704 Costa Rica 1 016 1 100 1 125 49 58 59 165 174 175 Mexico 11 014 11 296 11 454 2 946 2 861 2 927 155 182 178
SOUTH AMERICA 67 231 70 586 71 549 3 579 3 280 3 302 4 565 4 405 4 239 Argentina 11 414 11 680 11 119 97 43 46 2 598 2 144 2 021 Brazil 33 036 35 450 36 680 1 037 698 654 90 407 366 Colombia 6 408 6 500 6 550 152 202 182 21 18 28 Uruguay 2 118 2 100 2 120 20 30 30 1 286 1 180 1 145 Venezuela 2 552 2 700 2 750 1 536 1 447 1 557 - - -
NORTH AMERICA 98 838 101 892 104 738 1 982 2 393 2 349 9 582 11 130 11 251 Canada 8 453 8 360 8 485 544 721 712 419 573 587 United States of America 90 384 93 531 96 252 1 422 1 657 1 622 9 161 10 556 10 662
EUROPE 212 709 219 540 220 100 6 813 6 440 6 082 22 314 25 413 26 558 Belarus 6 636 6 600 6 716 44 237 231 3 555 4 356 4 394 European Union 152 667 160 400 162 400 1 378 1 576 1 552 15 948 17 727 18 679 Russian Federation 31 304 30 800 29 284 4 424 3 736 3 398 96 263 281 Ukraine 11 317 11 510 11 470 181 144 142 919 777 803
OCEANIA 27 899 30 517 30 780 847 931 923 20 730 22 603 23 507 Australia2 9 368 9 830 10 030 575 635 634 3 633 3 462 3 652 New Zealand3 18 461 20 617 20 680 71 89 79 17 093 19 138 19 852
WORLD 754 167 788 533 804 517 62 572 68 692 70 626 65 376 72 182 74 118 Developing countries 382 891 403 832 415 640 50 533 56 141 57 990 12 532 12 609 12 320 Developed countries 371 276 384 701 388 877 12 052 12 426 12 023 52 856 59 476 61 216 LIFDCs 179 828 191 306 197 813 7 446 7 399 7 668 1 347 1 381 1 224 LDCs 31 819 32 638 32 809 3 497 3 853 3 939 189 167 178
1 Dairy years starting April of the year stated (production only). 2 Dairy years ending June of the year stated (production only).
3 Dairy years ending May of the year stated (production only). Note: Trade figures refer to the milk equivalent trade in the following products: butter (6.60), cheese (4.40), milk powder (7.60), skim condensed/evaporated milk (1.90), whole condensed/evaporated milk (2.10), yoghurt (1.0), cream (3.60), casein (7.40), skim milk (0.70), liquid milk (1.0), whey dry (7.6). The conversion factors cited refer to the solids content method. Refer to IDF Bulletin No. 390 (March 2004).

Statistica
l ap
pe
nd
ix
114 115FOOD OUTLOOKMAY 2015
APPENDIX TABLE 20: FISH AND FISHERY PRODUCTS STATISTICS1
Capture fisheries production
Aquaculture fisheries production Exports Imports
2012 2013 2012 2013 2012 2013 2014 2012 2013 2014 estim. estim.
Million tonnes (live weight equivalent) USD billion USD billion
ASIA 50.2 50.9 59.0 62.5 51.2 53.8 56.2 44.2 42.7 43.8 China2 17.2 17.4 41.5 43.9 20.8 22.2 23.6 12.2 12.9 13.5 of which: Hong Kong SAR 0.2 0.2 - - 0.7 1.1 1.0 3.7 3.8 3.6 Taiwan Prov. 0.9 0.9 0.3 0.3 2.0 1.8 1.8 1.0 1.0 1.2 India 4.9 4.6 4.2 4.5 3.4 4.6 6.0 0.1 0.1 0.1 Indonesia 5.8 6.1 3.1 3.8 3.6 3.8 4.1 0.4 0.4 0.3 Japan 3.7 3.7 0.6 0.6 1.8 2.0 1.9 18.4 15.6 14.8 Korea, Rep. of 1.7 1.6 0.5 0.4 2.0 1.8 1.7 3.7 3.6 4.3 Philippines 2.3 2.3 0.8 0.8 0.8 1.2 1.1 0.2 0.2 0.2 Thailand 1.7 1.8 1.3 1.1 8.1 7.0 6.6 3.1 3.2 2.7 Viet Nam 2.7 2.8 3.1 3.2 6.3 6.8 6.9 0.8 0.9 1.0
AFRICA 8.2 8.0 1.5 1.6 5.4 5.5 5.7 5.4 6.1 6.1 Ghana 0.4 0.3 - - - - - 0.2 0.3 0.3 Morocco 1.2 1.3 - - 1.6 1.8 1.8 0.1 0.2 0.2 Namibia 0.5 0.5 - - 0.8 0.8 0.8 - - 0.1 Nigeria 0.7 0.7 0.3 0.3 0.3 0.2 0.2 1.5 1.7 1.3 Senegal 0.5 0.5 - - 0.3 0.3 0.4 - - - South Africa 0.7 0.4 - - 0.6 0.5 0.7 0.5 0.5 0.4
CENTRAL AMERICA 2.2 2.2 0.3 0.4 2.2 2.4 2.6 1.7 2.0 2.2 Mexico 1.6 1.6 0.1 0.2 1.1 1.1 1.1 0.6 0.8 0.9 Panama 0.2 0.2 - - 0.1 0.2 0.2 0.1 0.1 0.1
SOUTH AMERICA 10.1 10.3 2.1 2.1 12.7 13.6 15.5 2.8 3.5 3.6 Argentina 0.7 0.9 - - 1.3 1.5 1.6 0.2 0.2 0.2 Brazil 0.8 0.8 0.5 0.5 0.2 0.2 0.2 1.2 1.5 1.6 Chile 2.6 1.8 1.1 1.0 4.3 5.0 5.9 0.4 0.4 0.4 Ecuador 0.5 0.5 0.3 0.3 2.8 3.6 4.4 0.2 0.1 0.1 Peru 4.8 5.9 0.1 0.1 3.3 2.7 3.0 0.1 0.2 0.2
NORTH AMERICA 6.2 6.4 0.6 0.6 10.4 10.7 11.1 20.3 22.0 25.0 Canada 0.8 0.9 0.2 0.2 4.2 4.3 4.5 2.7 2.9 3.0 United States of America 5.1 5.2 0.4 0.4 5.8 6.0 6.1 17.6 19.0 21.9
EUROPE 13.1 13.5 2.9 2.8 44.3 47.5 49.8 53.6 58.3 61.0 European Union2 4.7 5.0 1.3 1.2 28.7 30.2 32.1 47.2 50.9 54.0 of which Extra -EU 5.7 5.8 6.0 24.9 26.5 28.2 Iceland 1.4 1.4 - - 2.2 2.3 2.1 0.1 0.1 0.1 Norway 2.2 2.1 1.3 1.2 8.9 10.3 10.8 1.4 1.3 1.4 Russian Federation 4.3 4.3 0.1 0.2 3.2 3.6 3.6 2.8 3.4 3.1
OCEANIA 1.3 1.2 0.2 0.2 3.1 2.9 3.1 2.0 2.0 2.3 Australia 0.2 0.2 0.1 0.1 1.0 1.0 1.1 1.6 1.6 1.7 New Zealand 0.4 0.4 0.1 0.1 1.2 1.2 1.2 0.1 0.2 0.2
WORLD3 91.3 92.6 66.5 70.2 129.3 136.5 143.9 130.0 136.6 144.0 Excl. Intra-EU 106.5 112.0 118.4 107.8 112.2 118.2 Developing countries 67.2 68.1 62.2 66.0 70.5 74.0 78.7 35.5 38.4 40.8 Developed countries 24.0 24.4 4.3 4.2 58.8 62.5 65.3 94.5 98.2 103.2 LIFDCs 14.8 14.5 7.4 7.9 7.4 9.0 10.0 3.6 4.3 4.0 LDCs 9.8 10.1 3.0 3.2 2.6 2.6 2.6 0.9 1.1 1.2
1 Production and trade data exclude whales, seals, other aquatic mammals and aquatic plants. Trade data include fish meal and fish oil. 2 Including intra-trade. Cyprus is included in the European Union as well as in Asia. Starting with 2013 data, EU includes Croatia. 3 For capture fisheries production, the aggregate includes also 32 358 tonnes in 2012 and 83 275 in 2013 of not identified countries, data not included in any other aggregates.
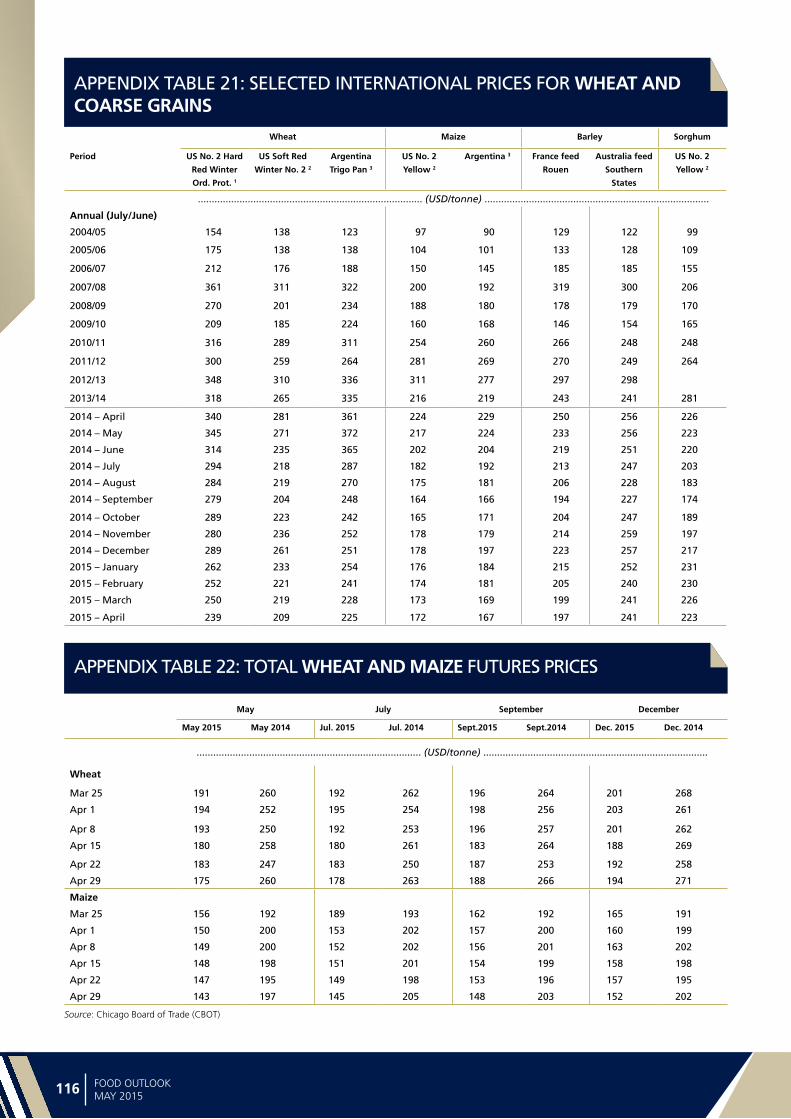
Sta
tist
ica
l a
pp
en
dix
116 117FOOD OUTLOOKMAY 2015
APPENDIX TABLE 21: SELECTED INTERNATIONAL PRICES FOR WHEAT AND COARSE GRAINS
APPENDIX TABLE 22: TOTAL WHEAT AND MAIZE FUTURES PRICES
Wheat Maize Barley Sorghum
Period US No. 2 Hard
Red Winter
Ord. Prot. 1
US Soft Red
Winter No. 2 2
Argentina
Trigo Pan 3
US No. 2
Yellow 2
Argentina 3 France feed
Rouen
Australia feed
Southern
States
US No. 2
Yellow 2
................................................................................. (USD/tonne) .................................................................................
Annual (July/June)
2004/05 154 138 123 97 90 129 122 99
2005/06 175 138 138 104 101 133 128 109
2006/07 212 176 188 150 145 185 185 155
2007/08 361 311 322 200 192 319 300 206
2008/09 270 201 234 188 180 178 179 170
2009/10 209 185 224 160 168 146 154 165
2010/11 316 289 311 254 260 266 248 248
2011/12 300 259 264 281 269 270 249 264
2012/13 348 310 336 311 277 297 298
2013/14 318 265 335 216 219 243 241 281
2014 – April 340 281 361 224 229 250 256 226
2014 – May 345 271 372 217 224 233 256 223
2014 – June 314 235 365 202 204 219 251 220
2014 – July 294 218 287 182 192 213 247 203
2014 – August 284 219 270 175 181 206 228 183
2014 – September 279 204 248 164 166 194 227 174
2014 – October 289 223 242 165 171 204 247 189
2014 – November 280 236 252 178 179 214 259 197
2014 – December 289 261 251 178 197 223 257 217
2015 – January 262 233 254 176 184 215 252 231
2015 – February 252 221 241 174 181 205 240 230
2015 – March 250 219 228 173 169 199 241 226
2015 – April 239 209 225 172 167 197 241 223
May July September December
May 2015 May 2014 Jul. 2015 Jul. 2014 Sept.2015 Sept.2014 Dec. 2015 Dec. 2014
................................................................................. (USD/tonne) .................................................................................
Wheat
Mar 25 191 260 192 262 196 264 201 268
Apr 1 194 252 195 254 198 256 203 261
Apr 8 193 250 192 253 196 257 201 262
Apr 15 180 258 180 261 183 264 188 269
Apr 22 183 247 183 250 187 253 192 258
Apr 29 175 260 178 263 188 266 194 271
Maize
Mar 25 156 192 189 193 162 192 165 191
Apr 1 150 200 153 202 157 200 160 199
Apr 8 149 200 152 202 156 201 163 202
Apr 15 148 198 151 201 154 199 158 198
Apr 22 147 195 149 198 153 196 157 195
Apr 29 143 197 145 205 148 203 152 202
Source: Chicago Board of Trade (CBOT)

Statistica
l ap
pe
nd
ix
116 117FOOD OUTLOOKMAY 2015
APPENDIX TABLE 23: SELECTED INTERNATIONAL PRICES FOR RICE AND PRICE INDICES
International prices FAO indices
Indica
Period Thai 100% B1
Thai broken 2
US long grain 3
Pakisan Basmati4
Total Higher quality
Lower quality
Japonica Aromatic
Annual (Jan/Dec) ..........................(USD per tonne) .......................... ............................. (2002-2004=100) .............................
2009 587 329 545 937 253 224 196 317 231
2010 518 386 510 881 227 206 212 252 229
2011 565 464 577 1060 242 232 250 258 220
2012 588 540 567 1137 231 225 241 235 222
2013 534 483 628 1372 233 219 226 230 268
2014 435 322 571 1324 235 207 201 266 255
Monthly
2014 – April 408 307 594 1350 237 205 198 268 264
2014 – May 408 298 594 1350 235 207 199 262 264
2014 – June 419 313 593 1350 236 209 202 263 265
2014 – July 439 325 574 1350 239 212 206 265 265
2014 – August 458 343 566 1430 242 215 213 263 271
2014 – September 444 336 555 1450 239 207 208 265 272
2014 – October 437 345 529 1435 235 203 204 260 268
2014 – November 427 338 540 1181 233 199 200 289 211
2014 – December 427 332 518 885 224 195 191 283 187
2015 – January 429 330 508 876 222 194 189 279 189
2015 – February 430 331 503 978 220 189 186 276 196
2015 – March 419 330 501 985 219 189 187 272 194
2015 – April 410 333 500 980 218 188 189 271 193
1 White rice, 100% second grade, f.o.b. Bangkok, indicative traded prices.2 A1 super, f.o.b. Bangkok, indicative traded prices.3 US No.2, 4% brokens f.o.b.4 Up to May 2011: Basmati ordinary, f.o.b. Karachi; from June 2011 onwards: Super Kernel White Basmati Rice 2%.Note: The FAO Rice Price Index is based on 16 rice export quotations. ‘Quality’ is defined by the percentage of broken kernels, with higher (lower) quality referring to rice with less (equal to or more) than 20 percent brokens. The sub-index for Aromatic Rice follows movements in prices of Basmati and Fragrant rice.Sources: FAO for indices. Rice prices: Livericeindex.com, Thai Department of Foreign Trade (DFT) and other public sources.

Sta
tist
ica
l a
pp
en
dix
118 119FOOD OUTLOOKMAY 2015
APPENDIX TABLE 24: SELECTED INTERNATIONAL PRICES FOR OILCROP PRODUCTS
International prices1 FAO indices
Period Soybeans 2 Soybean oil 3 Palm oil 4 Soybean
cake 5
Rapeseed
meal 6
Oilseeds Vegetable oils Oilcakes/
meals
.............................................. (USD per tonne) .............................................. ................... (2002-2004=100) ................
Annual (Oct/Sept)
2004/05 275 545 419 212 130 104 103 101
2005/06 259 572 451 202 130 100 107 96
2006/07 335 772 684 264 184 129 150 128
2007/08 549 1325 1050 445 296 216 246 214
2008/09 422 826 627 385 196 157 146 179
2009/10 429 924 806 388 220 162 177 183
2010/11 549 1308 1147 418 279 214 259 200
2011/12 562 1235 1051 461 295 214 232 219
2012/13 563 1099 835 539 345 213 193 255
2013/14 521 949 867 534 324 194 189 253
Monthly
2013 - October 544 989 866 555 318 202 188 262
2013 - November 556 992 921 541 316 206 199 257
2013 - December 568 979 907 548 336 210 196 260
2014 - January 566 935 871 539 337 208 189 256
2014 - February 594 991 911 571 361 219 198 271
2014 - March 501 1001 959 582 396 193 205 278
2014 - April 516 1005 911 563 375 198 199 269
2014 - May 522 973 896 552 340 197 195 263
2014 - June 514 933 859 531 304 192 189 251
2014 - July 480 886 839 477 272 178 181 226
2014 - August 457 855 755 485 265 170 167 229
2014 - September 433 850 714 463 265 162 162 219
2014 - October 430 835 724 463 258 161 164 218
2014 - November 447 827 728 485 265 167 165 228
2014 - December 446 816 694 449 278 168 161 213
2015 - January 421 789 681 431 279 159 156 206
2015 - February 407 775 693 412 273 154 157 197
2015 - March 402 748 673 392 262 152 152 188
2015 - April 396 753 657 380 263 151 150 183
1 Spot prices for nearest forward shipment 2 Soybeans: US, No.2 yellow, c.i.f. Rotterdam.3 Soybean oil: Dutch, fob ex-mill.4 Palm oil: Crude, c.i.f. Northwest Europe.5 Soybean cake: Pellets, 44/45 percent, Argentina, c.i.f. Rotterdam.6 Rapeseed meal: 34 percent, Hamburg, f.o.b. ex-mill. Notes:- The sudden drop in the FAO price index for oilseeds in March 2014 is due to a structural break in the underlying price series for soybeans (US no.2 yellow, c.i.f.
Rotterdam), the component with the highest weight. A look at alternative reference prices for soybeans reveals that, during March and April 2014, international soybean values have actually appreciated further rather than falling. For a detailed explanation of the anomalous trend in the soybean reference price, please refer to issue no. 58 of the Oilcrops Monthly Price and Policy Update (MPPU), which can be downloaded through the following link.
http://www.fao.org/fileadmin/templates/est/COMM_MARKETS_MONITORING/Oilcrops/Documents/MPPU_April_14.pdf - The FAO indices are based on the international prices of five selected seeds, ten selected oils and five selected cakes and meals.
Sources: FAO and Oil World.

Statistica
l ap
pe
nd
ix
118 119FOOD OUTLOOKMAY 2015
APPENDIX TABLE 25: SELECTED INTERNATIONAL PRICES FOR SUGAR AND SUGAR PRICE INDEX
I.S.A. average of daily prices ISO (Euronext, Liffe) white sugar price index
FAO sugar price index
Raw Sugar White Sugar
Annual (Jan/Dec) ................. (US cents/lb) ................. ...(2002/04 = 100) ...
2005 9.9 13.2 140.3
2006 14.8 19.0 209.6
2007 10.1 14.0 143.0
2008 12.8 16.1 181.6
2009 18.1 22.2 257.3
2010 21.3 27.2 302.0
2011 26.0 31.1 368.9
2012 21.5 26.3 305.7
2013 17.8 22.4 251.2
2014 17.0 20.2 241.2
Monthly
January, 2014 15.6 19.3 221.7
February, 2014 16.6 20.6 235.4
March, 2014 17.9 21.4 254.0
April, 2014 17.6 21.2 249.9
May, 2014 18.3 21.7 259.3
June, 2014 18.2 21.6 258.0
July, 2014 18.3 20.8 259.1
August, 2014 17.2 19.9 244.3
September, 2014 16.1 19.1 228.1
October, 2014 16.7 19.4 237.6
November, 2014 16.2 19.1 229.7
December, 2014 15.3 18.1 217.5
January, 2015 15.3 18.0 217.7
February, 2015 14.6 17.4 207.1
March, 2015 13.2 16.6 187.9
April, 2015 13.1 16.7 185.5
1 International Sugar Agreement (ISA) prices: simple average of the closing quotes for the first three future positions of the New York Intercontinental Exchange (NYCE) Trade Sugar Contract no. 11.
2 ISA white sugar prices: white sugar price is a simple average of the closing quotes for the first two future positions of the White Sugar Contract in UK Euronext.liffe.
Sources: International Sugar Organization (ISO). FAO for the sugar index.
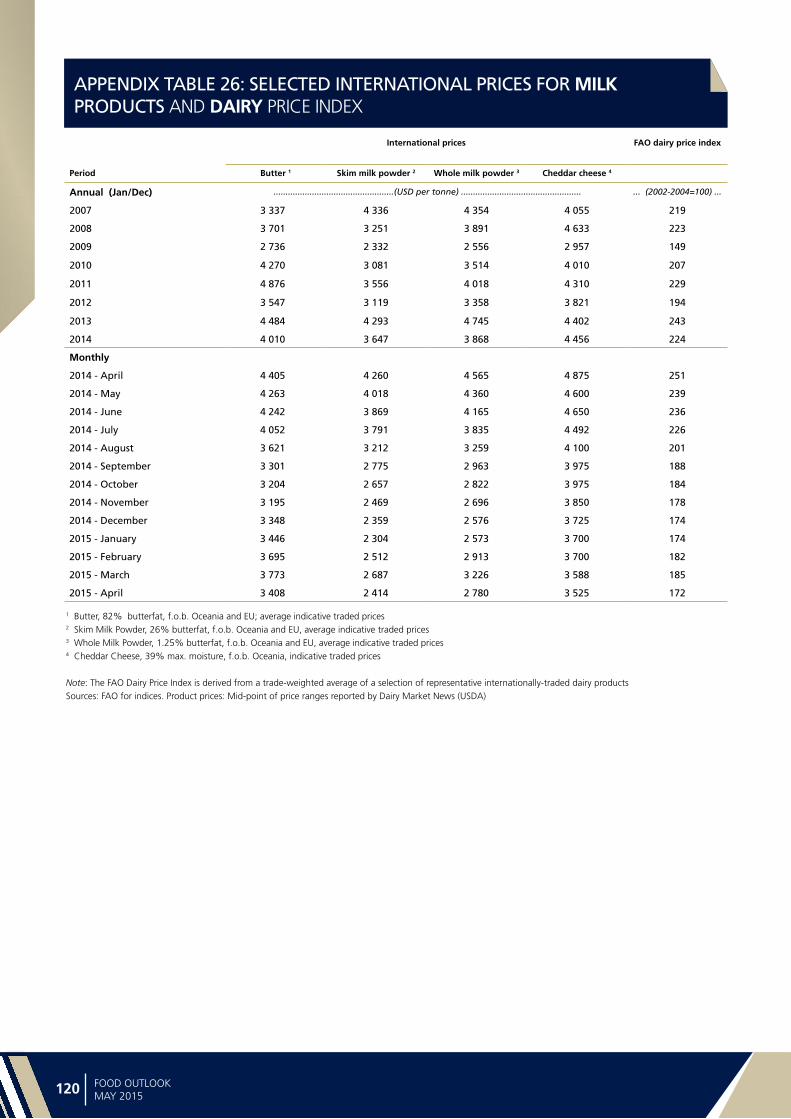
Sta
tist
ica
l a
pp
en
dix
120 121FOOD OUTLOOKMAY 2015
APPENDIX TABLE 26: SELECTED INTERNATIONAL PRICES FOR MILK PRODUCTS AND DAIRY PRICE INDEX
International prices FAO dairy price index
Period Butter 1 Skim milk powder 2 Whole milk powder 3 Cheddar cheese 4
Annual (Jan/Dec) ..................................................(USD per tonne) .................................................. ... (2002-2004=100) ...
2007 3 337 4 336 4 354 4 055 219
2008 3 701 3 251 3 891 4 633 223
2009 2 736 2 332 2 556 2 957 149
2010 4 270 3 081 3 514 4 010 207
2011 4 876 3 556 4 018 4 310 229
2012 3 547 3 119 3 358 3 821 194
2013 4 484 4 293 4 745 4 402 243
2014 4 010 3 647 3 868 4 456 224
Monthly
2014 - April 4 405 4 260 4 565 4 875 251
2014 - May 4 263 4 018 4 360 4 600 239
2014 - June 4 242 3 869 4 165 4 650 236
2014 - July 4 052 3 791 3 835 4 492 226
2014 - August 3 621 3 212 3 259 4 100 201
2014 - September 3 301 2 775 2 963 3 975 188
2014 - October 3 204 2 657 2 822 3 975 184
2014 - November 3 195 2 469 2 696 3 850 178
2014 - December 3 348 2 359 2 576 3 725 174
2015 - January 3 446 2 304 2 573 3 700 174
2015 - February 3 695 2 512 2 913 3 700 182
2015 - March 3 773 2 687 3 226 3 588 185
2015 - April 3 408 2 414 2 780 3 525 172
1 Butter, 82% butterfat, f.o.b. Oceania and EU; average indicative traded prices2 Skim Milk Powder, 26% butterfat, f.o.b. Oceania and EU, average indicative traded prices3 Whole Milk Powder, 1.25% butterfat, f.o.b. Oceania and EU, average indicative traded prices4 Cheddar Cheese, 39% max. moisture, f.o.b. Oceania, indicative traded prices
Note: The FAO Dairy Price Index is derived from a trade-weighted average of a selection of representative internationally-traded dairy productsSources: FAO for indices. Product prices: Mid-point of price ranges reported by Dairy Market News (USDA)
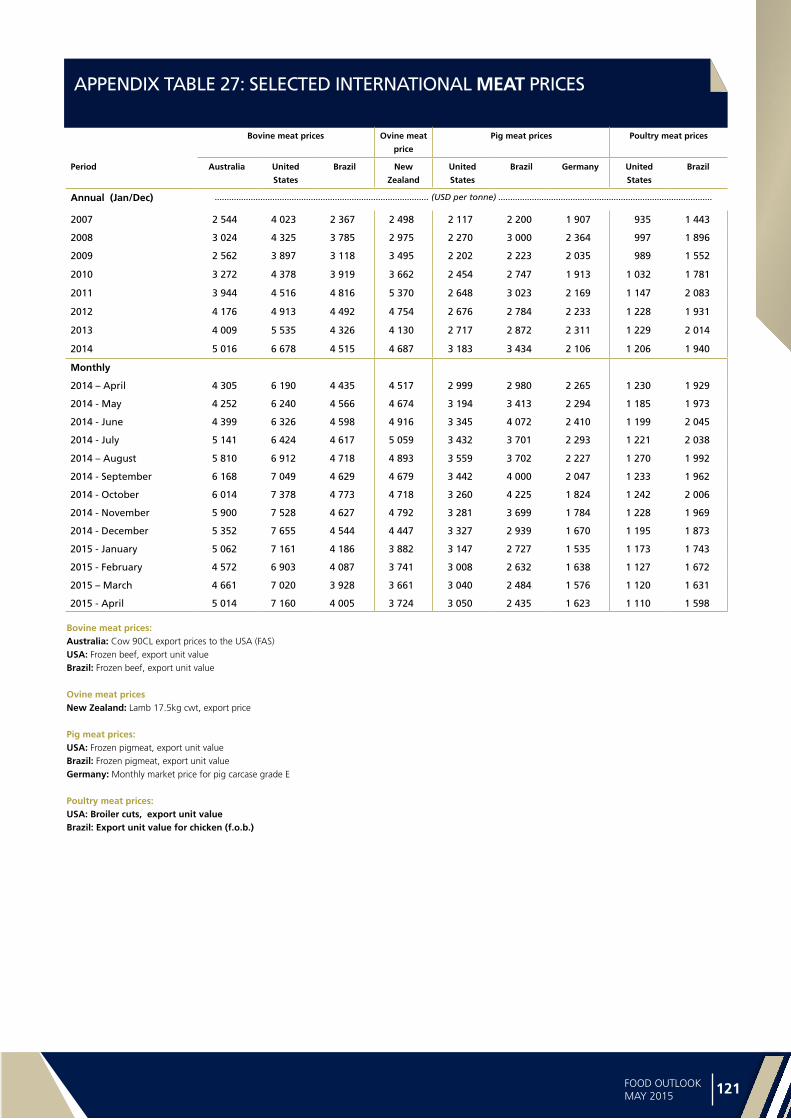
Statistica
l ap
pe
nd
ix
120 121FOOD OUTLOOKMAY 2015
APPENDIX TABLE 27: SELECTED INTERNATIONAL MEAT PRICES
Bovine meat prices Ovine meat
price
Pig meat prices Poultry meat prices
Period Australia United
States
Brazil New
Zealand
United
States
Brazil Germany United
States
Brazil
Annual (Jan/Dec) ......................................................................................... (USD per tonne) .........................................................................................
2007 2 544 4 023 2 367 2 498 2 117 2 200 1 907 935 1 443
2008 3 024 4 325 3 785 2 975 2 270 3 000 2 364 997 1 896
2009 2 562 3 897 3 118 3 495 2 202 2 223 2 035 989 1 552
2010 3 272 4 378 3 919 3 662 2 454 2 747 1 913 1 032 1 781
2011 3 944 4 516 4 816 5 370 2 648 3 023 2 169 1 147 2 083
2012 4 176 4 913 4 492 4 754 2 676 2 784 2 233 1 228 1 931
2013 4 009 5 535 4 326 4 130 2 717 2 872 2 311 1 229 2 014
2014 5 016 6 678 4 515 4 687 3 183 3 434 2 106 1 206 1 940
Monthly
2014 – April 4 305 6 190 4 435 4 517 2 999 2 980 2 265 1 230 1 929
2014 - May 4 252 6 240 4 566 4 674 3 194 3 413 2 294 1 185 1 973
2014 - June 4 399 6 326 4 598 4 916 3 345 4 072 2 410 1 199 2 045
2014 - July 5 141 6 424 4 617 5 059 3 432 3 701 2 293 1 221 2 038
2014 – August 5 810 6 912 4 718 4 893 3 559 3 702 2 227 1 270 1 992
2014 - September 6 168 7 049 4 629 4 679 3 442 4 000 2 047 1 233 1 962
2014 - October 6 014 7 378 4 773 4 718 3 260 4 225 1 824 1 242 2 006
2014 - November 5 900 7 528 4 627 4 792 3 281 3 699 1 784 1 228 1 969
2014 - December 5 352 7 655 4 544 4 447 3 327 2 939 1 670 1 195 1 873
2015 - January 5 062 7 161 4 186 3 882 3 147 2 727 1 535 1 173 1 743
2015 - February 4 572 6 903 4 087 3 741 3 008 2 632 1 638 1 127 1 672
2015 – March 4 661 7 020 3 928 3 661 3 040 2 484 1 576 1 120 1 631
2015 - April 5 014 7 160 4 005 3 724 3 050 2 435 1 623 1 110 1 598
Bovine meat prices:Australia: Cow 90CL export prices to the USA (FAS)USA: Frozen beef, export unit valueBrazil: Frozen beef, export unit value
Ovine meat pricesNew Zealand: Lamb 17.5kg cwt, export price
Pig meat prices:USA: Frozen pigmeat, export unit valueBrazil: Frozen pigmeat, export unit valueGermany: Monthly market price for pig carcase grade E
Poultry meat prices:USA: Broiler cuts, export unit valueBrazil: Export unit value for chicken (f.o.b.)

Sta
tist
ica
l a
pp
en
dix
122 123FOOD OUTLOOKMAY 2015
APPENDIX TABLE 28: SELECTED INTERNATIONAL MEAT PRICES AND FAO MEAT PRICE INDICES
FAO indices
Period Total meat Bovine meat Ovine meat Pig meat Poultry meat
Annual (Jan/Dec) .............................................................................. (2002-2004=100) .........................................................................
2007 131 126 108 125 151
2008 161 158 128 152 184
2009 141 135 151 131 162
2010 158 165 158 138 179
2011 183 191 232 153 206
2012 182 195 205 153 201
2013 184 197 178 157 206
2014 198 231 202 164 200
Monthly
2014 – April 190 212 195 161 201
2014 - May 195 213 202 171 201
2014 - June 203 217 212 185 206
2014 - July 206 231 218 178 207
2014 – August 212 250 211 178 207
2014 - September 211 257 202 173 203
2014 - October 210 260 204 165 207
2014 - November 206 258 207 158 203
2014 - December 196 249 192 147 195
2015 - January 183 233 168 137 185
2015 - February 177 220 162 137 178
2015 – March 175 221 158 134 175
2015 - April 178 229 161 135 172
The FAO Meat Price Indices consist of 2 poultry meat product quotations (the average weighted by assumed fixed trade weights), 3 bovine meat product quotations (average weighted by assumed fixed trade weights), 3 pig meat product quotations (average weighted by assumed fixed trade weights), 1 ovine meat product quotation (average weighted by assumed fixed trade weights): the four meat group average prices are weighted by world average export trade shares for 2002/2004.Prices for the two most recent months may be estimates and subject to revision.

Statistica
l ap
pe
nd
ix
122 123FOOD OUTLOOKMAY 2015
APPENDIX TABLE 29: FISH PRICE INDICES
APPENDIX TABLE 30: SELECTED INTERNATIONAL COMMODITY PRICES
Period Total Aquaculture Capture White fish Salmon Shrimp Pelagic
e/tuna
Tuna Other fish
Annual (Jan/Dec) .................................................................. (2002-2004=100) ..................................................................
2006 117 114 119 128 144 100 124 118 120
2007 124 115 132 139 147 102 130 135 126
2008 136 120 148 151 151 109 148 162 133
2009 126 119 131 132 159 98 140 147 128
2010 137 137 136 138 187 109 144 146 146
2011 154 149 157 151 195 124 173 175 166
2012 144 124 157 145 146 107 207 195 176
2013 148 141 151 134 157 126 215 190 175
2014 157 158 153 142 159 148 210 175 185
Monthly
2014 - January 161 162 155 134 179 154 220 181 177
2014 - February 158 162 150 132 173 154 217 181 175
2014 - March 164 168 155 138 176 159 200 181 190
2014 - April 162 168 151 141 176 152 200 169 187
2014 - May 155 162 143 139 165 137 174 170 185
2014 - June 150 150 145 143 153 133 170 174 156
2014 - July 149 148 150 145 156 133 213 172 173
2014 - August 152 150 153 145 146 139 256 170 198
2014 - September 157 153 160 142 143 151 214 187 195
2014 - October 158 157 159 146 143 157 236 174 201
2014 - November 158 158 158 153 149 158 196 171 186
2014 - December 156 156 156 150 155 149 222 164 196
2015 - January 150 149 151 143 143 139 244 159 198
Source= Norwegian Seafood Council.Note: The FAO Fish Price Index is based on nominal import values expressed in CIF in the three major import markets; Japan, USA and EU. Separate indexes exist for products from aquaculture and from capture fisheries. Additional sub-indexes exist for the major commodity groups based on species.
Currency and unit Effective date Latest quotation One month ago One year ago Average
2010-2014
Sugar (ISA daily price) US cents per lb 28-04-14 17.58 18.30 17.59 20.93
Coffee (ICO daily price) US cents per lb 27-04-15 126.05 128.39 170.58 157.75
Cocoa (ICCO daily price) US cents per lb 27-04-15 134.27 127.07 138.37 127.08
Tea (FAO Tea Composite Price) USD per kg 31-03-15 2.64 2.43 2.69 2.79
Cotton (COTLOOK A index) US cents per lb 31-03-15 69.35 69.84 96.95 104.18
Jute “BTD” USD per tonne 22-04-15 720.00 750.00 575.00 650.71
(Fob Bangladesh Port)

124 125
MA
RKET
IND
ICAT
ORS
MAR
KET
INDI
CATO
RS

Ma
rke
t ind
icato
rs
124 125FOOD OUTLOOKMAY 2015
FUTURES MARKETS Contributed by Ann Berg, Senior Commodity Analyst
Futures prices for wheat, maize and soybeans rose
modestly after October 2014 but, overall, demonstrated
a significant decline from the 2012/2013 and 2013/2014
crop year levels. Wheat prices exhibited a short-term surge
in December 2014, as Black Sea regional tensions flared,
but fell afterwards as the region’s shipments continued
unabated and drought conditions in the US southern plains
resolved with the arrival of soaking rains. Expectations for
record wheat exports particularly from the EU in 2014/2015
and competition from feed grains caused further price
pressure. For soybeans, following back-to-back bumper
crops in the US and South America as well as a seasonal
slowdown in US exports to China, 2014/2015 prices traded
25 to 30 percent lower than the previous two years. Maize
prices were similarly weighed by record supplies, as well as
low energy prices. A rising US dollar against the currencies
of both major and emerging markets and heightened
currency volatility also restrained price increases for all three
commodities.
VOLUMES AND VOLATILITY
Trade volumes generally followed seasonal crop patterns
for wheat, maize and soybeans. Post-harvest hedging
followed a record US maize crop, resulting in increased
trade volume in the fourth quarter of 2014, with volumes
reverting to more normal levels as of January 2015. In
soybeans, following a record volume surge during October
2014 as large options positions were squared with futures,
volumes similarly followed normal monthly patterns. Wheat
volumes exhibited comparable monthly patterns.
Implied volatility – calculated by the level of option
premiums on underlying futures contracts – was
lower for maize and soybeans than the previous two
years, hovering between 15 and 25. However, implied
volatility for wheat persisted in a higher range (between
25 and 30), as its price fluctuations are usually more
sensitive to policy measures and political tensions than
maize or soybeans.
FORWARD CURVES
For wheat and maize, forward curves have displayed mostly
upward sloping (contango) price configurations since
November 2014, indicating ample supply situations for
both commodities. However, forward curves in soybeans
narrowed in configuration. This revealed a modest
Forward curves snapshots as of April 2012, 2013, 2014
100
150
200
250
300
32M23M15M8M1M
2014
2015
2013
USD per tonne
Maize
Soybeans
Wheat
300
400
500
600
43M33M28M21M15M7M1M
2013
2015
2014
USD per tonne
150
200
250
300
27M20M15M11M5M1M
2013
2014
2015
USD per tonne

Ma
rke
t in
dic
ato
rs
126 127FOOD OUTLOOKMAY 2015
downward slope (backwardation) between old and new
crop months of July and November 2015, as soybean
exports and domestic consumption were projected at
record levels. This mild price inversion provided a stark
difference from previous crop years, particularly 2013/2014,
when backwardation levels were as high as USD 100
per tonne between the old and new crops, indicating an
extreme end-of-year supply shortage.
INVESTMENT FLOWS
Managed money established short positions simultaneously
in wheat, maize and soybeans during March 2015
for the first time since the CFTC began publishing the
disaggregated Commitment of Traders Report in 2006. An
ample supply situation coupled with US dollar strength –
historically correlated with low commodity prices – were
the main drivers of this strategy. Notional levels in index
fund investment have declined since October 2014 by
about 10 percent, driven by lower prices for grains and
oilseeds as well as several key commodities in the energy
and industrial metals sectors.
The level of notional amounts – approximately
USD250 billion in both long and short index investments –
has dropped fairly steadily since April 2011 when
investment amounts reached USD 460 billion, according
to the CFTC monthly reports on commodity futures index
investments. Declining levels in wheat and maize were
registered by the modest decrease in the swaps dealers
categories, while unchanged levels were seen in the
soybean market.
Although banks continue to wind down commodities
trading activities, the sector reported profits in commodities
trading in 2014, reversing three years of decline mostly
attributable to volatile energy prices.
CME net-length as % of open interests (January 2011 - April 2014)
Soybeans
Wheat
Maize
-60
-40
-20
0
20
40
2015201420132012
Percent
Commercial Managedmoney
Swapdealers
-60
-40
-20
0
20
40
2015201420132012
Percent
Commercial Managedmoney
Swapdealers
-60
-40
-20
0
20
40
60
2015201420132012
Percent
Commercial Managedmoney
Swapdealers

Ma
rke
t ind
icato
rs
126 127FOOD OUTLOOKMAY 2015
CME futures prices
100
300
500
700
2015201420132012
Wheat Maize Soybeans
USD per tonne
CME futures volumes
Notional Amounts of Commodity Futures Index Investment*
0
100
200
300
400
500
2015201420132012
Wheat Maize Soybeans
Thousand contracts
Historical volatility (30 days)
0
30
60
90
2015201420132012
Wheat Maize Soybeans
Percent
Implied volatility
10
30
50
70
2015201420132012
Wheat Maize Soybeans
Percent
0
100
200
300
400
Feb
-15
No
v-14
Jul-
14
Mar
-14
No
v-13
Jul-
13
Mar
-13
No
v-12
Jun
-12
Sep
-11
Dec
-10
Dec
-09
Dec
-08
Dec
-07
USD per tonne
Long Positions Short Positions
* USD amounts invested in commodity index funds or other commodity based investment vehicles as measured by the outstanding value of their underlying futures contracts.source; CFTC

Ma
rke
t in
dic
ato
rs
128 129FOOD OUTLOOKMAY 2015
OCEAN FREIGHT RATES Contributed by the International Grains Council (IGC) www.igc.int
OCEAN FREIGHT MARKET (OCTOBER 2014 - MID-APRIL 2015)
Dry bulk ocean freight rates remained under pressure over
the past six months. After substantial gains in October,
attributed to a surge in demand for commodities, including
grains and soyabeans, the freight market fell sharply on
weaker chartering activity and an oversupply of tonnage,
notably on routes across the Atlantic and to Far East Asia.
The arrival of newly-built vessels, although down from
the peak of 2012, outpaced the volume of demolition. A
slowdown in China’s mineral demand added to the market
weakness. However, in March 2015, ocean freight rates
in the grains-carrying sectors rebounded on the back of
improved demand for commodities, particularly on routes
from South America. Overall, since the beginning of
October 2014, the average of the Baltic Indices of the three
grains-carrying sectors plummeted by 34 percent and was
down by 28 percent year-on-year. The Baltic Dry Index,
which includes the Capesize sector in addition to grains, fell
by 44 percent, weaker by 40 percent year-on-year.
After the October rally, Panamax rates were in decline
until the end of February 2015, pressured by an oversupply
Selected routes (monthly averages) USD/tonne
Brazil/EU ARAH US Gulf/EU ARAH US Gulf/Japan US Gulf/S. Korea
Vessel size Handysize Panamax Panamax Panamax
Origin Brazil US (Gulf) US (Gulf) US (Gulf)
Destination EU (ARAH) EU (ARAH) Japan South Korea
April 2014 31 17 45 46
May 2014 30 16 44 45
June 2014 29 15 41 42
July 2014 28 14 40 41
August 2014 28 14 40 41
September 2014 29 17 44 45
October 2014 28 17 43 44
November 2014 26 14 40 41
December 2014 27 15 40 41
January 2015 25 12 34 35
February 2015 20 9 26 27
March 2015 21 10 29 30
April 2015 23 11 30 31
of tonnage and spill-over weakness from the Capesize
sector. Trading volumes remained low, notably on
transatlantic routes, losing competition to the Supramax
sector. Business from South America was mostly covered
by the ballasters from the Indian Ocean and South East
Asia. In March, however, the Atlantic market found some
support in chartering activity from South America to Far
East Asia and to Europe/Mediterranean, although overall
trading volumes remained low. Rates in the Pacific stayed
under pressure due to surplus tonnage and reduced mineral
demand, prompting owners to send vessels in ballast
to a more lucrative Atlantic market. Overall, from early
October to mid-April, the Baltic Panamax Index (BPI) fell by
27 percent.
October saw firmer Atlantic Supramax rates attributed
to increased chartering activity in the key loading areas,
particularly on transatlantic routes from the US Gulf.
However, in the November to February period, rates came
under significant pressure from poor demand and an
oversupply of tonnage. In March, similar to the Panamax
market, Atlantic Supramax rates increased in most areas
due to improved charting activity, especially on routes
from South America and the US Gulf. Rates in the Pacific
were supported by mineral business from Indonesia and
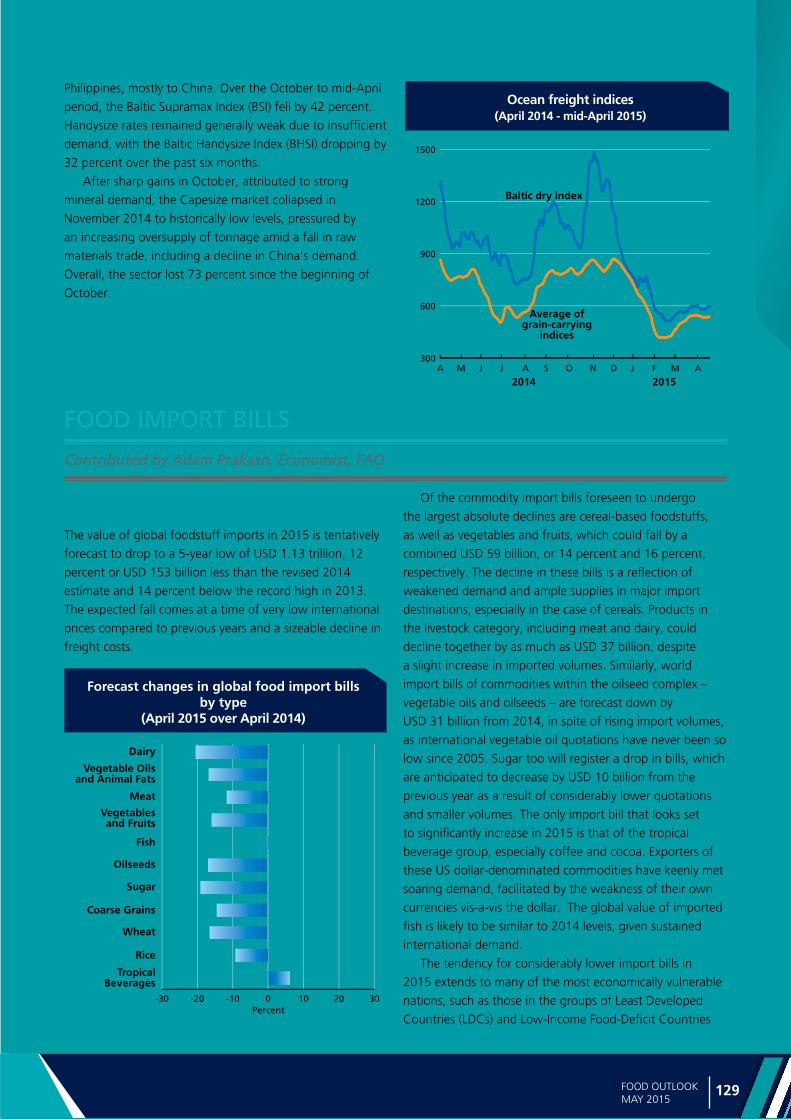
Ma
rke
t ind
icato
rs
128 129FOOD OUTLOOKMAY 2015
Ocean freight indices (April 2014 - mid-April 2015)
Philippines, mostly to China. Over the October to mid-April
period, the Baltic Supramax Index (BSI) fell by 42 percent.
Handysize rates remained generally weak due to insufficient
demand, with the Baltic Handysize Index (BHSI) dropping by
32 percent over the past six months.
After sharp gains in October, attributed to strong
mineral demand, the Capesize market collapsed in
November 2014 to historically low levels, pressured by
an increasing oversupply of tonnage amid a fall in raw
materials trade, including a decline in China’s demand.
Overall, the sector lost 73 percent since the beginning of
October.
300
600
900
1200
1500
AMFJDNOSAJJMA
2014 2015
Baltic dry index
Average ofgrain-carrying
indices
FOOD IMPORT BILLS
Global food import bills set to fall sharply in 2015 but currency movements curb benefitsThe value of global foodstuff imports in 2015 is tentatively
forecast to drop to a 5-year low of USD 1.13 trillion, 12
percent or USD 153 billion less than the revised 2014
estimate and 14 percent below the record high in 2013.
The expected fall comes at a time of very low international
prices compared to previous years and a sizeable decline in
freight costs.
Forecast changes in global food import bills by type
(April 2015 over April 2014)
Of the commodity import bills foreseen to undergo
the largest absolute declines are cereal-based foodstuffs,
as well as vegetables and fruits, which could fall by a
combined USD 59 billion, or 14 percent and 16 percent,
respectively. The decline in these bills is a reflection of
weakened demand and ample supplies in major import
destinations, especially in the case of cereals. Products in
the livestock category, including meat and dairy, could
decline together by as much as USD 37 billion, despite
a slight increase in imported volumes. Similarly, world
import bills of commodities within the oilseed complex –
vegetable oils and oilseeds – are forecast down by
USD 31 billion from 2014, in spite of rising import volumes,
as international vegetable oil quotations have never been so
low since 2005. Sugar too will register a drop in bills, which
are anticipated to decrease by USD 10 billion from the
previous year as a result of considerably lower quotations
and smaller volumes. The only import bill that looks set
to significantly increase in 2015 is that of the tropical
beverage group, especially coffee and cocoa. Exporters of
these US dollar-denominated commodities have keenly met
soaring demand, facilitated by the weakness of their own
currencies vis-a-vis the dollar. The global value of imported
fish is likely to be similar to 2014 levels, given sustained
international demand.
The tendency for considerably lower import bills in
2015 extends to many of the most economically vulnerable
nations, such as those in the groups of Least Developed
Countries (LDCs) and Low-Income Food-Deficit Countries
-30 -20 -10 0 10 20 30Percent
Dairy
Meat
Wheat
Rice
TropicalBeverages
Vegetablesand Fruits
Vegetable Oilsand Animal Fats
Oilseeds
Fish
Sugar
Coarse Grains
Contributed by Adam Prakash, Economist, FAO

Ma
rke
t in
dic
ato
rs
130 131FOOD OUTLOOKMAY 2015
World Developed Developing LDC LIFDC Sub-Saharan Africa
2014 2015
f’cast
2014 2015
f’cast
2014 2015
f’cast
2014 2015
f’cast
2014 2015
f’cast
2014 2015
f’cast
TOTAL FOOD 1 282 1 129 776 690 506 439 38 32 76 65 46 41
Vegetables and Fruits 224 189 165 139 59 50 3 3 9 8 3 3
Cereals 164 141 71 62 93 79 11 9 20 17 14 12
Fish 144 145 106 109 38 35 1 1 4 3 5 4
Meat 174 154 115 101 59 53 3 3 4 3 5 4
Dairy 98 78 59 46 39 32 3 2 5 4 3 2
Vegetable Oils and Animal Fats
96 80 44 36 52 44 6 5 17 14 5 4
Oilseeds 88 73 29 23 59 50 1 1 1 1 1 1
Sugar 52 42 27 21 26 21 5 3 7 5 4 3
Tropical beverages 102 109 79 84 23 25 1 1 4 4 2 2
Import bills of total food and major foodstuffs (USD billion)
(LIFDCs) and those geographically situated in sub-Saharan
Africa. Lower bills will not necessarily come at the expense
of volumes as imported food quantities for many of
them look set to rise above the previous year’s levels in
contrast to the global trend. When viewed from a local
currency perspective, however, a different picture arises
(see box below). Shortfalls in the production of staples in
many economically disadvantaged countries necessitate
procurement on the global marketplace to meet domestic
demand. But this brings with it a severe burden on foreign
exchange reserves, especially when international purchases
are required to be paid in US dollars. Although a strong
US dollar is generally beneficial to net merchandise
exporters who can pay for food imports, it can prove
onerous to many of the most vulnerable countries which
are net importers, notably of foodstuffs.
Beneath the benign picture of low food prices are numerous uncertainties. Since August 2014, the US dollar has risen
uninterruptedly against many currencies, reaching a 12-year high in March of this year. All things being equal, a strong dollar tends to lower international demand and with it commodity prices as most are US dollar-denominated. Gains to importing countries will be influenced by the degree to which their currencies have withstood depreciation.
The figures to the right show that this has not been the case for major-importing Low-Income Food-Deficit Countries (LIFDCs): unit costs of key imported foods - cereals and vegetable oils - when converted to local currency have declined less than in US dollars. Where US dollar unit costs have risen, the increase has been stronger in local currency.
Strengthening US dollar and falling food prices
Unit costs of major imported foodstuffs have risen in local currencies in many low-income food-deficit countries despite falling US dollar values.
Changes in unit values for selected LIFDCs (%):
Cereals
Vegetable oilsTrends of the US Dollar and FAO Food Price Indices:
(May 2014 - April 2015)
-16
-12
-8
-4
0
4
8
12
16Percent
Ru
ssia
n F
ed
Sri L
anka
Nic
arag
ua
Gh
ana
Ind
ia
Sen
egal
*
Co
te d
’Iv.*
Ken
ya
Phili
pp
ines
Ho
nd
ura
s
Ind
on
esia
USDLCU
-30-25-20-15-10
-505
1015Percent
Sri L
anka
Nic
arag
ua
Gh
ana
Ind
ia
Egyp
t
Sen
egal
*
Co
te d
’Iv.*
Ken
ya
Phili
pp
ines
Ho
nd
ura
s
Ind
on
esia
USDLCU
160
173
186
199
212
225
AMFJDNOSAJJM70
75
80
85
90
95
2002-2004=100 January 1980=100
FAO Food Price Index (left axis)
2014 2015
Nominal major currencies dollar index (right axis)
Sources: GTIS/FAO. Based on reflected trade statistics, USD versus local currencies (LCUs), Nov-Jan 2015 over Apr-Jun 2014 * Pegged to the Euro
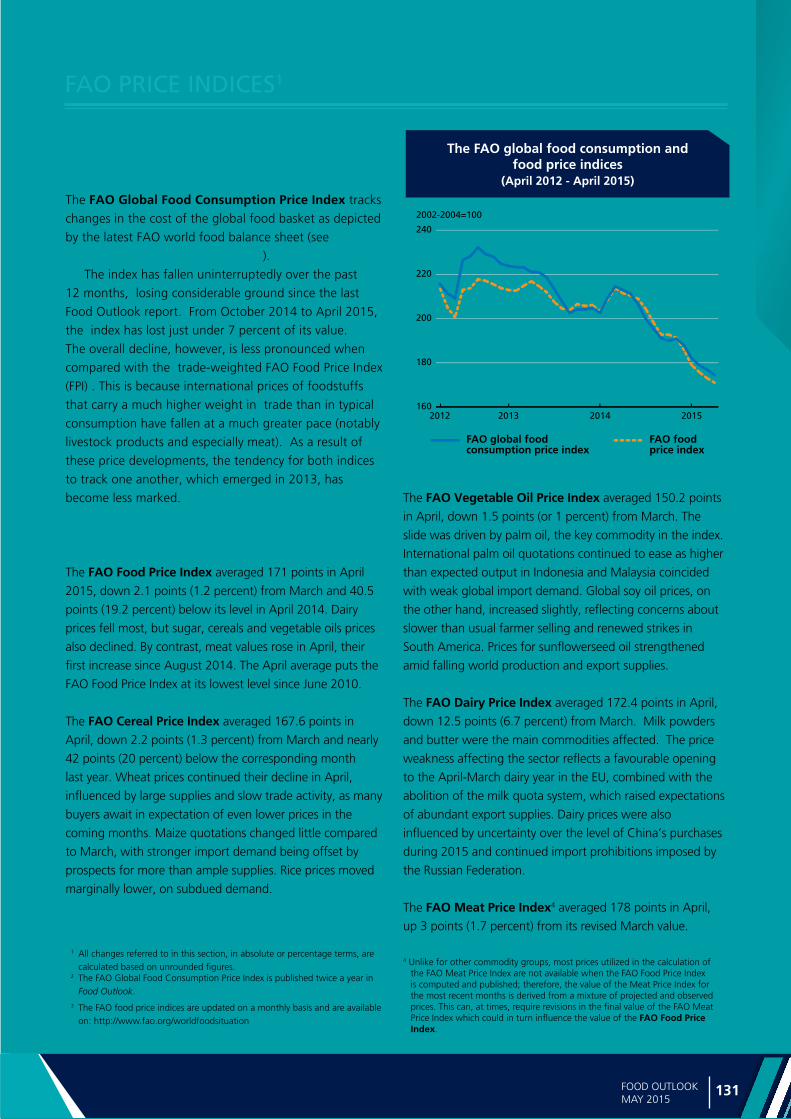
Ma
rke
t ind
icato
rs
130 131FOOD OUTLOOKMAY 2015
FAO PRICE INDICES1
The FAO Global Food Consumption Price Index continues to slide2
The FAO Global Food Consumption Price Index tracks
changes in the cost of the global food basket as depicted
by the latest FAO world food balance sheet (see http://
faostat3.fao.org/download/FB/FBS/E).
The index has fallen uninterruptedly over the past
12 months, losing considerable ground since the last
Food Outlook report. From October 2014 to April 2015,
the index has lost just under 7 percent of its value.
The overall decline, however, is less pronounced when
compared with the trade-weighted FAO Food Price Index
(FPI) . This is because international prices of foodstuffs
that carry a much higher weight in trade than in typical
consumption have fallen at a much greater pace (notably
livestock products and especially meat). As a result of
these price developments, the tendency for both indices
to track one another, which emerged in 2013, has
become less marked.
FAO Food Price Index keeps falling3
The FAO Food Price Index averaged 171 points in April
2015, down 2.1 points (1.2 percent) from March and 40.5
points (19.2 percent) below its level in April 2014. Dairy
prices fell most, but sugar, cereals and vegetable oils prices
also declined. By contrast, meat values rose in April, their
first increase since August 2014. The April average puts the
FAO Food Price Index at its lowest level since June 2010.
The FAO Cereal Price Index averaged 167.6 points in
April, down 2.2 points (1.3 percent) from March and nearly
42 points (20 percent) below the corresponding month
last year. Wheat prices continued their decline in April,
influenced by large supplies and slow trade activity, as many
buyers await in expectation of even lower prices in the
coming months. Maize quotations changed little compared
to March, with stronger import demand being offset by
prospects for more than ample supplies. Rice prices moved
marginally lower, on subdued demand.
1 All changes referred to in this section, in absolute or percentage terms, are calculated based on unrounded figures.
The FAO global food consumption and food price indices
(April 2012 - April 2015)
160
180
200
220
240
2015201420132012
2002-2004=100
FAO global foodconsumption price index
FAO foodprice index
The FAO Vegetable Oil Price Index averaged 150.2 points
in April, down 1.5 points (or 1 percent) from March. The
slide was driven by palm oil, the key commodity in the index.
International palm oil quotations continued to ease as higher
than expected output in Indonesia and Malaysia coincided
with weak global import demand. Global soy oil prices, on
the other hand, increased slightly, reflecting concerns about
slower than usual farmer selling and renewed strikes in
South America. Prices for sunflowerseed oil strengthened
amid falling world production and export supplies.
The FAO Dairy Price Index averaged 172.4 points in April,
down 12.5 points (6.7 percent) from March. Milk powders
and butter were the main commodities affected. The price
weakness affecting the sector reflects a favourable opening
to the April-March dairy year in the EU, combined with the
abolition of the milk quota system, which raised expectations
of abundant export supplies. Dairy prices were also
influenced by uncertainty over the level of China’s purchases
during 2015 and continued import prohibitions imposed by
the Russian Federation.
The FAO Meat Price Index4 averaged 178 points in April,
up 3 points (1.7 percent) from its revised March value.
3 The FAO food price indices are updated on a monthly basis and are available on: http://www.fao.org/worldfoodsituation
4 Unlike for other commodity groups, most prices utilized in the calculation of the FAO Meat Price Index are not available when the FAO Food Price Index is computed and published; therefore, the value of the Meat Price Index for the most recent months is derived from a mixture of projected and observed prices. This can, at times, require revisions in the final value of the FAO Meat Price Index which could in turn influence the value of the FAO Food Price Index.
2 The FAO Global Food Consumption Price Index is published twice a year in Food Outlook.

Ma
rke
t in
dic
ato
rs
132 133FOOD OUTLOOKMAY 2015
The main causes of the rise were higher prices for bovine
and ovine meat from Oceania, where herd rebuilding
restricted exports. Pigmeat prices also showed some
upward movement, while those of poultry were lower. For
meat overall, moderately higher import demand in China,
Japan, the United States and Vietnam is the main factor
underpinning the market.
The FAO Sugar Price Index averaged 185.5 points in
April, down 2.4 points (1.3 percent) from March and
reaching its lowest level since February 2009. The decrease
was mainly fueled by reports of higher than expected
sugarcane harvesting in Brazil, the world’s largest producer
and exporter of sugar. Also, India’s recent announcement
it would raise sugar import tariffs from 25 percent to 40
percent, in a bid to support falling domestic prices, weighed
on international sugar quotations. Persistent weakness in the
Brazilian currency (Real) against the US dollar also kept the
FAO Sugar Price Index under pressure.
165
185
205
225
245
2002-2004=100
2011
2015
2014
2013
2012
FAO Food Price Index
DNOSAJJMAMFJ140
170
200
230
260
2014 2015
2002-2004=100
Dairy
Vegetableoils
Cereals
Sugar
Meat
FAO Food Commodity Price Indices
AMFJDNOSAJJMA
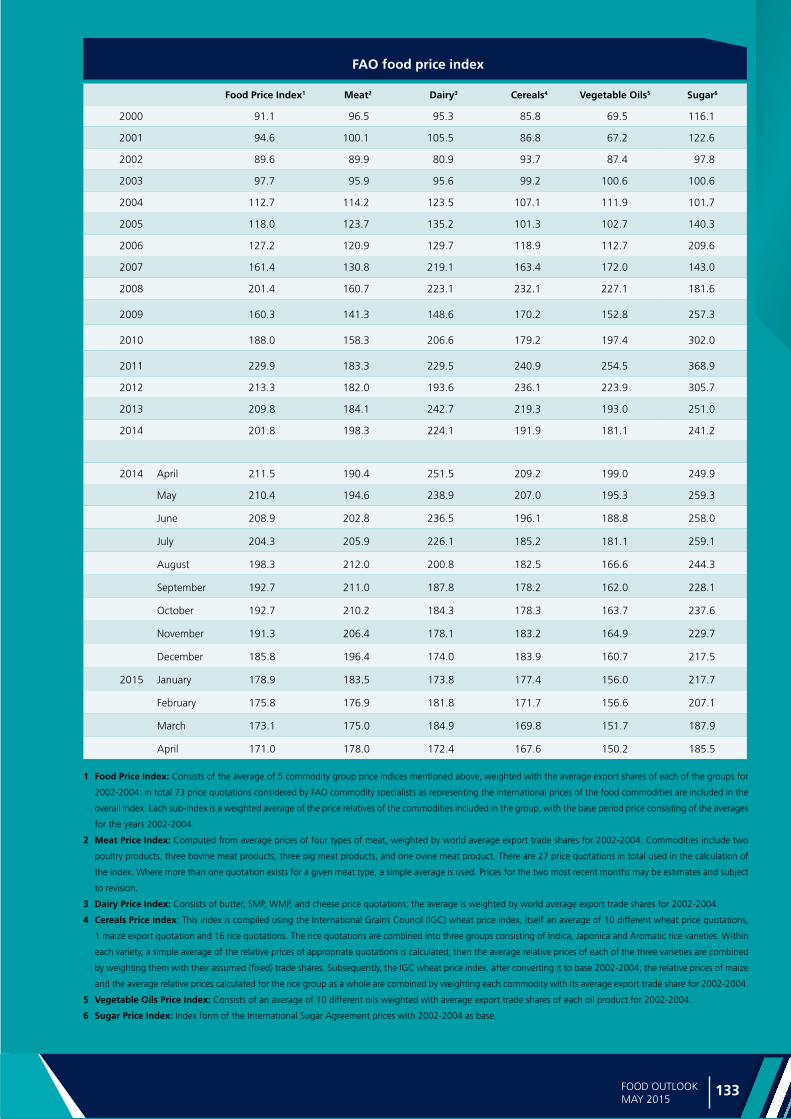
Ma
rke
t ind
icato
rs
132 133FOOD OUTLOOKMAY 2015
Food Price Index1 Meat2 Dairy3 Cereals4 Vegetable Oils5 Sugar6
2000 91.1 96.5 95.3 85.8 69.5 116.1
2001 94.6 100.1 105.5 86.8 67.2 122.6
2002 89.6 89.9 80.9 93.7 87.4 97.8
2003 97.7 95.9 95.6 99.2 100.6 100.6
2004 112.7 114.2 123.5 107.1 111.9 101.7
2005 118.0 123.7 135.2 101.3 102.7 140.3
2006 127.2 120.9 129.7 118.9 112.7 209.6
2007 161.4 130.8 219.1 163.4 172.0 143.0
2008 201.4 160.7 223.1 232.1 227.1 181.6
2009 160.3 141.3 148.6 170.2 152.8 257.3
2010 188.0 158.3 206.6 179.2 197.4 302.0
2011 229.9 183.3 229.5 240.9 254.5 368.9
2012 213.3 182.0 193.6 236.1 223.9 305.7
2013 209.8 184.1 242.7 219.3 193.0 251.0
2014 201.8 198.3 224.1 191.9 181.1 241.2
2014 April 211.5 190.4 251.5 209.2 199.0 249.9
May 210.4 194.6 238.9 207.0 195.3 259.3
June 208.9 202.8 236.5 196.1 188.8 258.0
July 204.3 205.9 226.1 185.2 181.1 259.1
August 198.3 212.0 200.8 182.5 166.6 244.3
September 192.7 211.0 187.8 178.2 162.0 228.1
October 192.7 210.2 184.3 178.3 163.7 237.6
November 191.3 206.4 178.1 183.2 164.9 229.7
December 185.8 196.4 174.0 183.9 160.7 217.5
2015 January 178.9 183.5 173.8 177.4 156.0 217.7
February 175.8 176.9 181.8 171.7 156.6 207.1
March 173.1 175.0 184.9 169.8 151.7 187.9
April 171.0 178.0 172.4 167.6 150.2 185.5
FAO food price index
1 Food Price Index: Consists of the average of 5 commodity group price indices mentioned above, weighted with the average export shares of each of the groups for
2002-2004: in total 73 price quotations considered by FAO commodity specialists as representing the international prices of the food commodities are included in the
overall index. Each sub-index is a weighted average of the price relatives of the commodities included in the group, with the base period price consisting of the averages
for the years 2002-2004.
2 Meat Price Index: Computed from average prices of four types of meat, weighted by world average export trade shares for 2002-2004. Commodities include two
poultry products, three bovine meat products, three pig meat products, and one ovine meat product. There are 27 price quotations in total used in the calculation of
the index. Where more than one quotation exists for a given meat type, a simple average is used. Prices for the two most recent months may be estimates and subject
to revision.
3 Dairy Price Index: Consists of butter, SMP, WMP, and cheese price quotations; the average is weighted by world average export trade shares for 2002-2004.
4 Cereals Price Index: This index is compiled using the International Grains Council (IGC) wheat price index, itself an average of 10 different wheat price quotations,
1 maize export quotation and 16 rice quotations. The rice quotations are combined into three groups consisting of Indica, Japonica and Aromatic rice varieties. Within
each variety, a simple average of the relative prices of appropriate quotations is calculated; then the average relative prices of each of the three varieties are combined
by weighting them with their assumed (fixed) trade shares. Subsequently, the IGC wheat price index, after converting it to base 2002-2004, the relative prices of maize
and the average relative prices calculated for the rice group as a whole are combined by weighting each commodity with its average export trade share for 2002-2004.
5 Vegetable Oils Price Index: Consists of an average of 10 different oils weighted with average export trade shares of each oil product for 2002-2004.
6 Sugar Price Index: Index form of the International Sugar Agreement prices with 2002-2004 as base.

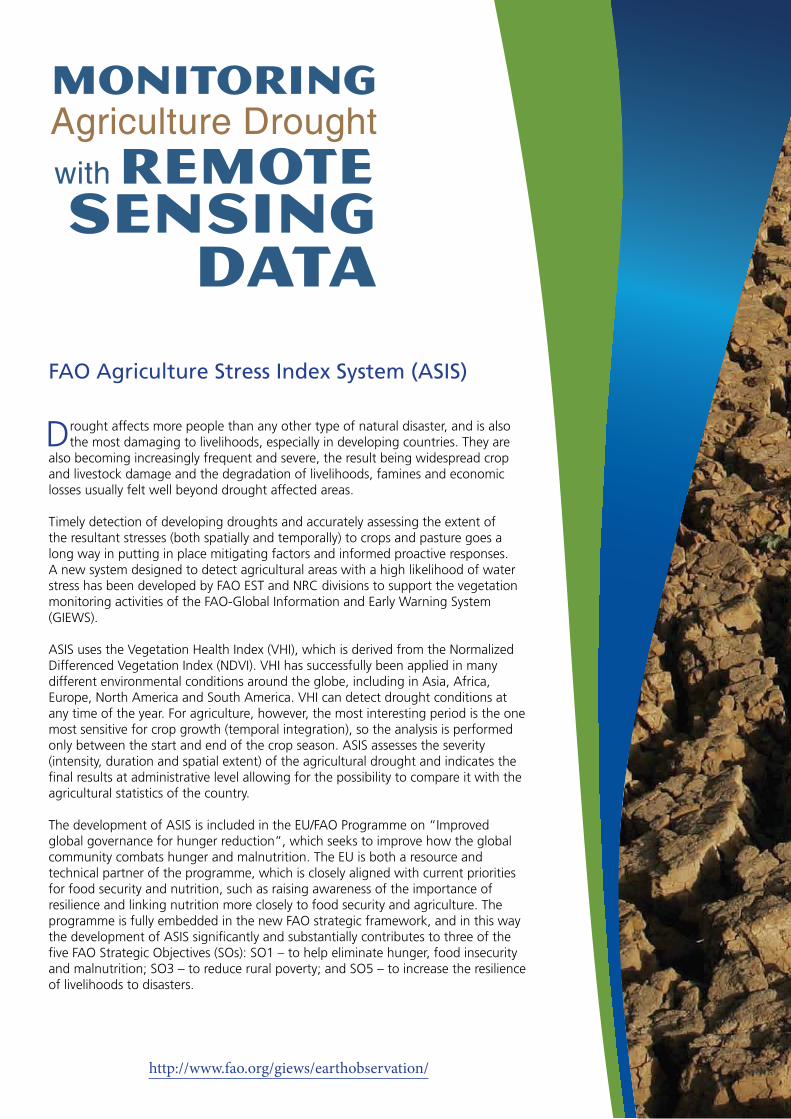
Wednesday, 29 April 201510:30 – 12:00
Iran Room
MonitoringAgriculture Droughtwith Remote Sensing Data
Drought affects more people than any other type of natural disaster, and is also the most damaging to livelihoods, especially in developing countries. They are
also becoming increasingly frequent and severe, the result being widespread crop and livestock damage and the degradation of livelihoods, famines and economic losses usually felt well beyond drought affected areas. Timely detection of developing droughts and accurately assessing the extent of the resultant stresses (both spatially and temporally) to crops and pasture goes a long way in putting in place mitigating factors and informed proactive responses. A new system designed to detect agricultural areas with a high likelihood of water stress has been developed by FAO EST and NRC divisions to support the vegetation monitoring activities of the FAO-Global Information and Early Warning System (GIEWS). ASIS uses the Vegetation Health Index (VHI), which is derived from the Normalized Differenced Vegetation Index (NDVI). VHI has successfully been applied in many different environmental conditions around the globe, including in Asia, Africa, Europe, North America and South America. VHI can detect drought conditions at any time of the year. For agriculture, however, the most interesting period is the one most sensitive for crop growth (temporal integration), so the analysis is performed only between the start and end of the crop season. ASIS assesses the severity (intensity, duration and spatial extent) of the agricultural drought and indicates the final results at administrative level allowing for the possibility to compare it with the agricultural statistics of the country. The development of ASIS is included in the EU/FAO Programme on “Improved global governance for hunger reduction”, which seeks to improve how the global community combats hunger and malnutrition. The EU is both a resource and technical partner of the programme, which is closely aligned with current priorities for food security and nutrition, such as raising awareness of the importance of resilience and linking nutrition more closely to food security and agriculture. The programme is fully embedded in the new FAO strategic framework, and in this way the development of ASIS significantly and substantially contributes to three of the five FAO Strategic Objectives (SOs): SO1 – to help eliminate hunger, food insecurity and malnutrition; SO3 – to reduce rural poverty; and SO5 – to increase the resilience of livelihoods to disasters.
http://www.fao.org/giews/earthobservation/
FAO Agriculture Stress Index System (ASIS)

Food Outlook is published by the Trade and Market Division of FAO under Global Information and Early Warning System (GIEWS). It is a
biannual publication focusing on developments affecting global food and feed markets. Each report provides comprehensive assessments and short term forecasts for production, utilization, trade, stocks and prices on a commodity by commodity basis and includes feature articles on topical issues. Food Outlook maintains a close synergy with another major GIEWS publication, Crop Prospects and Food Situation, especially with regard to the coverage of cereals. Food outlook is available in English. The summary section is also available in Arabic, Chinese, French, Spanish and Russian.
Food Outlook and other GIEWS reports are available on the internet as part of the FAO world wide web (http://www.fao.org/) at the following URL address: http://www.fao.org/giews/. Other relevant studies on markets and global food situation can be found at http://www.fao.org/worldfoodsituation.
This report is based on information available up to late April 2015. The next Food Outlook report will be published in November 2015.
For enquiries or further information contact:
Abdolreza Abbassian
Trade and Markets Division
Food and Agriculture Organization of the United Nations
Via delle Terme di Caracalla
00153 Rome - Italy
Telephone: 0039-06-5705-3264
Facsimile: 0039-06-5705-4495
E-mail: [email protected] or [email protected]
I4581E/1/05.15
Related Documents