PHDPROGRAM IN BIOENGINEERING AND ROBOTICS INNOVATING CONTROL AND EMOTIONAL EXPRESSIVE MODALITIES OF USER INTERFACES FOR PEOPLE WITH LOCKED-IN SYNDROME by Fanny Larradet Thesis submitted for the degree of Doctor of Philosophy (32° cycle) January 2020 Leonardo S. Mattos Supervisor Prof. Cannata Head of the PhD program Thesis Reviewers: Prof. Catia Prandi, University of Bologna Prof. Marco Porta, University of Pavia Istituto Italiano di Tecnologia Advanced Robotics and University of Genova Department of Informatics, Bioengineering, Robotics and System Engineering (DIBRIS)

Welcome message from author
This document is posted to help you gain knowledge. Please leave a comment to let me know what you think about it! Share it to your friends and learn new things together.
Transcript
PHD PROGRAM IN BIOENGINEERING AND ROBOTICS
INNOVATING CONTROL AND EMOTIONAL EXPRESSIVEMODALITIES OF USER INTERFACES FOR PEOPLE WITH
LOCKED-IN SYNDROME
by
Fanny Larradet
Thesis submitted for the degree of Doctor of Philosophy (32° cycle)
January 2020
Leonardo S. Mattos SupervisorProf. Cannata Head of the PhD program
Thesis Reviewers:
Prof. Catia Prandi, University of BolognaProf. Marco Porta, University of Pavia
Istituto Italiano di TecnologiaAdvanced Robotics
and
University of GenovaDepartment of Informatics, Bioengineering, Robotics and System Engineering (DIBRIS)

To my parents Jean and Nathalie Larradet
2

DECLARATION
I hereby declare that except where specific reference is made to the work of others, thecontents of this dissertation are original and have not been submitted in whole or in partfor consideration for any other degree or qualification in this, or any other university.This dissertation is my own work and contains nothing which is the outcome of workdone in collaboration with others, except as specified in the text and Acknowledgements.This dissertation contains fewer than 65,000 words including appendices, bibliography,footnotes, tables and equations and has fewer than 150 figures.
Fanny LarradetJanuary 2020
3
ACKNOWLEDGEMENTS
First of all, I would like to thank Leonardo De Mattos and Prof. Darwin Caldwell for givingme the opportunity to pursue this research at the Italian Institute of Technology (IIT). Aparticular thank you to Leonardo De Mattos for supervising my work during the 3 yearsof my PhD, for reviewing my papers and advising me towards greater goals. I would liketo thank Giacinto Barresi for managing the TEEP-SLA project and making my PhD possi-ble while taking the time to guide me and advise me every step of the way. I would liketo thank Radoslaw Niewiadomski who voluntarily went out of his way to advise me whenI most needed it and to help me restructure my ideas and my work. While our collabo-ration only started halfway through my PhD, it has given me a broader perspective and abetter understanding of research in general.
I am thankful for all the TEEP-SLA team. It was a great pleasure to work with thisamazing team of scientists who have worked together towards this very valuable goalwhich has made the last 3 years particularly pleasant. I always looked forward to our tripsto Rome, where seeing the appreciation from our patients was a reward for all our hardwork. I could not have done this research without the time given by the people with ALSin Rome and their infinite patience. Unfortunately, many of them passed away beforethe end of the project so my thoughts go to them and to their families. I would like tothank Fondazione Roma and Fondazione Sanitaria Ricerca for supporting the TEEP-SLAproject and assisting the clinical activities with the patients.
I am particularly grateful for Louis who supported me emotionally during these last3 years, kept me going when I was in doubt and never stopped believing in me and mycapacity to successfully achieve this PhD. He always took the time to proofread my papersand let me bounce ideas off him which usually resulted in fascinating debates.
I would like to thank all my friends from Genova that made this experience extraordi-nary. A special thanks to Brendan for listening to me talk about my PhD for the last yearand for his constant positivity and enthusiasm which reflected on me. Yonas for his kind-ness and his delicious Ethiopian meals which I am still waiting for the recipe. Alexei forhistory courses and tea parties. Anand, our dedicated hike organizer and official photog-rapher. Emily for her positivity and our exhausting sport meetings. Nabeel for his out ofthis world and adorable personality. The mountain bike team for unforgettable moments.The secret Genova food club for culinary discoveries. Vishal, Hiram and Prashanth forrooftop barbecues and teaching me how to eat spicy food. All my flatmates for makingthe apartment a real home. Vaibhav, Tony, Dave, Shamel, Sep, Elco, Matt, Giulia, Buddy,Jan, Paul, Gaurvi, Octavio, Yannick, Andreea, Nora, Richard, Eamon, Olmo, Joao, Diego,
4

5
Emiliano, Fausto, Patricia and all the others for infinite fun times in Genova and IIT. TheADVR department for participating in all my experiments. I would like to thank them allfor making my time in Genova unforgettable and full of great memories.
Last but not least, I would like to thank all my family for teaching me how to livelife to the fullest. My parents for giving me the opportunity to pursue my masters andmy exchange abroad without which I could not have achieved this PhD. I am gratefulfor them as well as all my family members and Clara, for always supporting me in myadventures, during good and bad times and for pushing me to accomplish great things. Icould never have done it without them and I will always be grateful for all the things theyhave done for me.
ABSTRACT
Patients with Lock-In-Syndrome (LIS) lost their ability to control any body part besidestheir eyes. Current solutions mainly use eye-tracking cameras to track patients’ gaze assystem input. However, despite the fact that the interface design strongly impacts theuser experience, only a few guidelines have been used so far to ensure an easy, quick, fluidand non-tiresome computer system control for these patients. On the other hand, theemergence of dedicated computer software has been greatly increasing the patients’ ca-pabilities, but there is still a great need for improvements as existing systems still presentlow usability and limited capabilities. Most interfaces designed for LIS patients aim atproviding internet browsing or communication abilities. State of the art augmentativeand alternative communication systems mainly focus on communication based on wordsto form sentences without considering the need for emotional expressions inextricablefrom human communication.
This thesis aims at exploring new types of system control and expressive modali-ties for people with LIS. Firstly, existing gaze-based web-browsing interfaces were in-vestigated. Page analysis and high mental workload appeared as recurring issues withcommon systems. To address these issues, a novel user interface using an innovativemenu control reducing eye movements and therefore fatigue was designed and evalu-ated against a commercial system. The results suggested that it is easier to learn andto use, quicker, more satisfying, less frustrating, less tiring and less prone to error. Themental workload was greatly diminished with this system. Other types of system controlfor LIS patients were then investigated in particular using a gaze-controlled game. It wasfound that galvanic skin response may be used as system input and that stress relatedbio-feedback helped lowering mental workload during stressful tasks.
Improving communication was one of the main goals of this research and in parti-cular emotional communication. A system including a gaze-controlled emotional voicesynthesis and a personal emotional avatar was developed with this purpose. The assess-ment of the proposed system highlighted its capability to enhance dialogs and to allowemotional expression. Enabling emotion communication in parallel to sentences wasfound to help with the conversation. Automatic emotion detection seemed to be thenext step toward improving emotional communication. Several studies established thatphysiological signals relate to emotions. The ability to use physiological signals sensorswith LIS patients and their non-invasiveness made them an ideal candidate for this study.One of the main difficulties of emotion detection is the collection of high intensity affect-related data. Studies in this field are currently mostly limited to laboratory investigations,
6
7
using laboratory-induced emotions, and are rarely adapted for real-life applications. Avirtual reality emotion elicitation technique based on appraisal theories was proposedhere in order to study physiological signals of high intensity emotions in a real-life-likeenvironment. While this solution successfully elicited positive and negative emotions, itdid not elicit the desired emotions for all subjects and was therefore, not appropriate forthe goals of this research. Collecting emotions in the wild appeared as the best method-ology toward emotion detection for real-life applications. The state of the art in the fieldwas therefore reviewed and assessed using a specifically designed method for evaluat-ing datasets collected for emotion recognition in real-life applications. The proposedevaluation method provides guidelines for future researcher in the field. Based on theresearch findings, a mobile application was developed for physiological and emotionaldata collection in the wild. Based on the appraisal theory, this application provides guid-ance to users to provide valuable emotion labelling and help them differentiate moodsfrom emotions. A sample dataset collected using this application was compared to onecollected using a paper-based preliminary study. The dataset collected using the mo-bile application was found to provide a more valuable dataset with data consistent withthe literature. This mobile application was used to create an open-source affect-relatedphysiological signals database.
While the path toward emotion detection usable in real-life applications is still long,we hope that the tools provided to the research community will represent a step towardachieving this goal in the future. Automatically detecting emotion could not only be usedfor LIS patients to communicate but also for total-LIS patients who have lost their abilityto move their eyes. Indeed, giving the ability to family and caregiver to visualize andtherefore understand the patients’ emotional state could greatly improve their quality oflife.
This research provided tools to LIS patients and the scientific community to improveaugmentative and alternative communication, technologies with better interfaces, emo-tion expression capabilities and real-life emotion detection. Emotion recognition meth-ods for real-life applications could not only enhance health care but also robotics, do-motics and many other fields of study.
A complete system fully gaze-controlled was made available open-source with all thedeveloped solutions for LIS patients. This is expected to enhance their daily lives by im-proving their communication and by facilitating the development of novel assistive sys-tems capabilities.
CONTENTS
dedication . . . . . . . . . . . . . . . . . . . . . . . . . . . . . . . . . . . . . . . . . . 2declaration . . . . . . . . . . . . . . . . . . . . . . . . . . . . . . . . . . . . . . . . . . 3Acknowledgment . . . . . . . . . . . . . . . . . . . . . . . . . . . . . . . . . . . . . . 4Abstract . . . . . . . . . . . . . . . . . . . . . . . . . . . . . . . . . . . . . . . . . . . . 6List of abbreviations . . . . . . . . . . . . . . . . . . . . . . . . . . . . . . . . . . . . iv
1 Introduction 11.1 Motivations . . . . . . . . . . . . . . . . . . . . . . . . . . . . . . . . . . . . . . 11.2 Hypothesis . . . . . . . . . . . . . . . . . . . . . . . . . . . . . . . . . . . . . . . 21.3 Approach . . . . . . . . . . . . . . . . . . . . . . . . . . . . . . . . . . . . . . . . 21.4 Contributions . . . . . . . . . . . . . . . . . . . . . . . . . . . . . . . . . . . . . 3
1.4.1 Improving control . . . . . . . . . . . . . . . . . . . . . . . . . . . . . . 31.4.2 Improving communication . . . . . . . . . . . . . . . . . . . . . . . . . 3
1.5 Overview of the Thesis . . . . . . . . . . . . . . . . . . . . . . . . . . . . . . . . 4
2 Improving user interfaces control 52.1 Design and Evaluation of an Open-source Gaze-controlled GUI for Web-
browsing . . . . . . . . . . . . . . . . . . . . . . . . . . . . . . . . . . . . . . . . 52.1.1 Internet browsing control modalities . . . . . . . . . . . . . . . . . . . 62.1.2 GUI design approach . . . . . . . . . . . . . . . . . . . . . . . . . . . . . 72.1.3 Proposed design . . . . . . . . . . . . . . . . . . . . . . . . . . . . . . . 82.1.4 Experimental evaluation . . . . . . . . . . . . . . . . . . . . . . . . . . . 122.1.5 Data analysis and results . . . . . . . . . . . . . . . . . . . . . . . . . . 152.1.6 Discussion . . . . . . . . . . . . . . . . . . . . . . . . . . . . . . . . . . . 18
2.2 Effects of galvanic skin response feedback on user experience in gaze-controlledgaming . . . . . . . . . . . . . . . . . . . . . . . . . . . . . . . . . . . . . . . . . 202.2.1 Experimental study . . . . . . . . . . . . . . . . . . . . . . . . . . . . . . 202.2.2 Data analysis and results . . . . . . . . . . . . . . . . . . . . . . . . . . 242.2.3 Discussion . . . . . . . . . . . . . . . . . . . . . . . . . . . . . . . . . . . 26
2.3 Conclusions . . . . . . . . . . . . . . . . . . . . . . . . . . . . . . . . . . . . . . 26
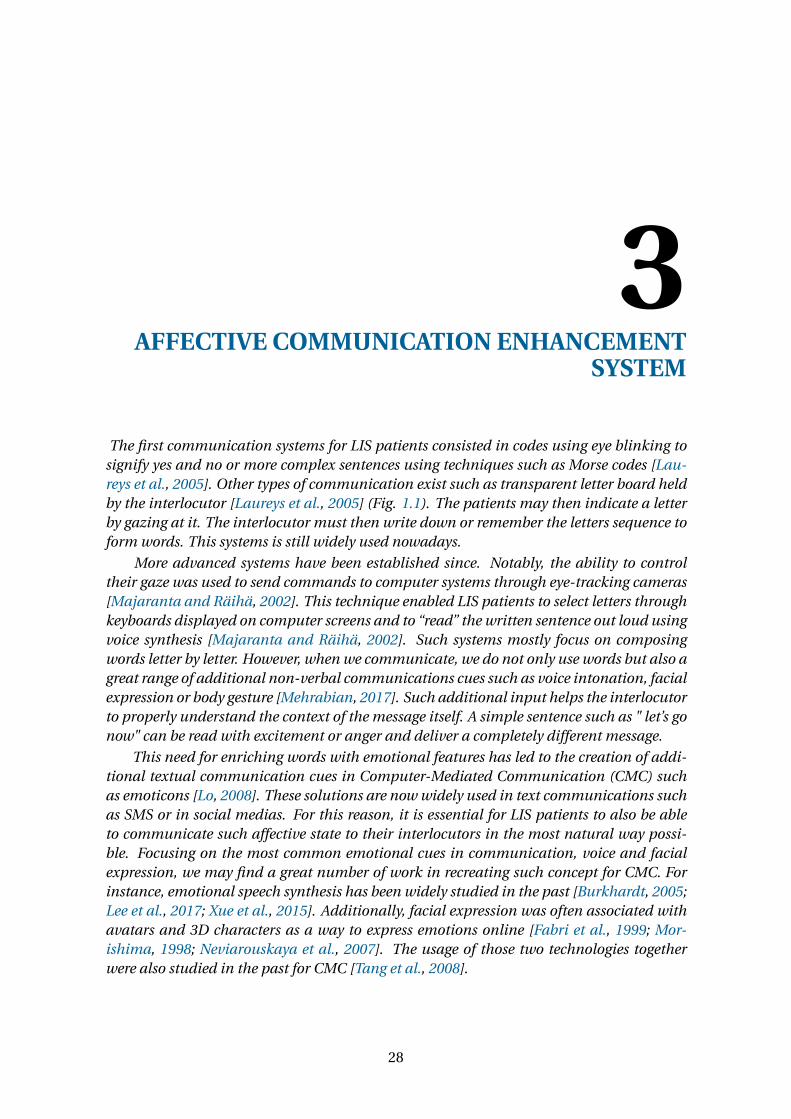
3 Affective communication enhancement system 283.1 The proposed solution . . . . . . . . . . . . . . . . . . . . . . . . . . . . . . . . 30
3.1.1 Gaze-based keyboard . . . . . . . . . . . . . . . . . . . . . . . . . . . . 313.1.2 Emotional voice synthesis . . . . . . . . . . . . . . . . . . . . . . . . . . 31
i
ii CONTENTS
3.1.3 Emotional avatar . . . . . . . . . . . . . . . . . . . . . . . . . . . . . . . 313.2 Methodology . . . . . . . . . . . . . . . . . . . . . . . . . . . . . . . . . . . . . . 323.3 Results . . . . . . . . . . . . . . . . . . . . . . . . . . . . . . . . . . . . . . . . . 35
3.3.1 Speech synthesis emotion recognition . . . . . . . . . . . . . . . . . . 353.3.2 Questionnaire . . . . . . . . . . . . . . . . . . . . . . . . . . . . . . . . . 35
3.4 Discussion . . . . . . . . . . . . . . . . . . . . . . . . . . . . . . . . . . . . . . . 363.5 Conclusions . . . . . . . . . . . . . . . . . . . . . . . . . . . . . . . . . . . . . . 37
4 Investigating emotional data collection methodologies 394.1 Introduction . . . . . . . . . . . . . . . . . . . . . . . . . . . . . . . . . . . . . . 394.2 Existing affect related data collection techniques . . . . . . . . . . . . . . . . 414.3 The “in-the-wild” methodology . . . . . . . . . . . . . . . . . . . . . . . . . . 43
4.3.1 Why are datasets in-the-wild needed? . . . . . . . . . . . . . . . . . . . 434.3.2 Advantages . . . . . . . . . . . . . . . . . . . . . . . . . . . . . . . . . . . 444.3.3 Challenges and limitations . . . . . . . . . . . . . . . . . . . . . . . . . 45
4.4 The GARAFED method . . . . . . . . . . . . . . . . . . . . . . . . . . . . . . . 504.4.1 The GARAFED categories . . . . . . . . . . . . . . . . . . . . . . . . . . 504.4.2 The GARAFED visual aid . . . . . . . . . . . . . . . . . . . . . . . . . . 53
4.5 Assessment of existing datasets . . . . . . . . . . . . . . . . . . . . . . . . . . 534.5.1 Physiological signals-based studies . . . . . . . . . . . . . . . . . . . . 544.5.2 Multimodal approaches . . . . . . . . . . . . . . . . . . . . . . . . . . . 59
4.6 Conclusions . . . . . . . . . . . . . . . . . . . . . . . . . . . . . . . . . . . . . . 61
5 Emotional data collection in the laboratory using VR games 635.1 Introduction . . . . . . . . . . . . . . . . . . . . . . . . . . . . . . . . . . . . . . 63
5.1.1 Roseman’s appraisal theory . . . . . . . . . . . . . . . . . . . . . . . . . 645.2 A VR game for emotion elicitation . . . . . . . . . . . . . . . . . . . . . . . . . 65
5.2.1 Game flow . . . . . . . . . . . . . . . . . . . . . . . . . . . . . . . . . . . 665.2.2 Multimodal recording system . . . . . . . . . . . . . . . . . . . . . . . . 675.2.3 EmoVR multimodal corpus . . . . . . . . . . . . . . . . . . . . . . . . . 705.2.4 Results an Discussion . . . . . . . . . . . . . . . . . . . . . . . . . . . . 70
5.3 Conclusions . . . . . . . . . . . . . . . . . . . . . . . . . . . . . . . . . . . . . . 71
6 Tools for emotion detection for real-life application 736.1 Appraisal Theory-based Mobile App for Physiological Data Collection and
Labelling in the Wild . . . . . . . . . . . . . . . . . . . . . . . . . . . . . . . . . 736.1.1 Emotion recognition from physiological signals . . . . . . . . . . . . . 746.1.2 Methods for emotional self-reporting in the wild . . . . . . . . . . . . 746.1.3 Methods for emotional physiological data collection . . . . . . . . . . 756.1.4 Preliminary study . . . . . . . . . . . . . . . . . . . . . . . . . . . . . . . 756.1.5 The proposed solution . . . . . . . . . . . . . . . . . . . . . . . . . . . . 766.1.6 Data collection . . . . . . . . . . . . . . . . . . . . . . . . . . . . . . . . 82
6.2 An emotional physiological signal database built in-the-wild. . . . . . . . . . 826.2.1 Data collection protocol . . . . . . . . . . . . . . . . . . . . . . . . . . . 83

CONTENTS iii
6.2.2 Results . . . . . . . . . . . . . . . . . . . . . . . . . . . . . . . . . . . . . 846.2.3 Discussion . . . . . . . . . . . . . . . . . . . . . . . . . . . . . . . . . . . 88
6.3 Conclusions . . . . . . . . . . . . . . . . . . . . . . . . . . . . . . . . . . . . . . 90
7 A complete system for LIS patients 927.1 System structure . . . . . . . . . . . . . . . . . . . . . . . . . . . . . . . . . . . 92
7.1.1 Menu . . . . . . . . . . . . . . . . . . . . . . . . . . . . . . . . . . . . . . 927.1.2 Web browsing . . . . . . . . . . . . . . . . . . . . . . . . . . . . . . . . . 937.1.3 Communication . . . . . . . . . . . . . . . . . . . . . . . . . . . . . . . 947.1.4 Gaming . . . . . . . . . . . . . . . . . . . . . . . . . . . . . . . . . . . . 947.1.5 Telepresence . . . . . . . . . . . . . . . . . . . . . . . . . . . . . . . . . 957.1.6 Relaxation . . . . . . . . . . . . . . . . . . . . . . . . . . . . . . . . . . . 957.1.7 Affect-aware system . . . . . . . . . . . . . . . . . . . . . . . . . . . . . 95
7.2 Overall system evaluation . . . . . . . . . . . . . . . . . . . . . . . . . . . . . 96
8 Conclusions and future work 98
A SUPLEMENTARY MATERIALS 122

LIST OF ABBREVIATIONS
AAC Augmentative and alternative communication HR Heart rateAcc Accelerometer HRV Heart rate variabilityALS Amyotrophic Lateral Sclerosis IBI Interbeat intervalANS Autonomic Nervous System L LoadAoE Area of action LIS Locked-In SyndromeAP Airway pressure MA MagnetometerBP Blood pressure PPG PhotoplethysmogramBPC Blood pressure cuff PS Preliminary studyBVP Blood volume pressure R ResearchECG Electrocardiogram Resp RespirationEDA Electrodermal activity SC Skin conductanceEEG Electroencephalogram SP Several productsEMA Ecological momentary assessment SpO2 Peripheral oxygen saturationEMG Electromyogram ST Skin temperatureEMSR Emotion mood and stress recognition T TorqueEOG Electrooculogram TEMP TemperatureF Force UD User dependentGP General public UID User independentGSR Galvanic skin response UP User-pickedGUI Graphical user interface W WeightGY Gyroscope
iv
1INTRODUCTION
1.1 Motivations
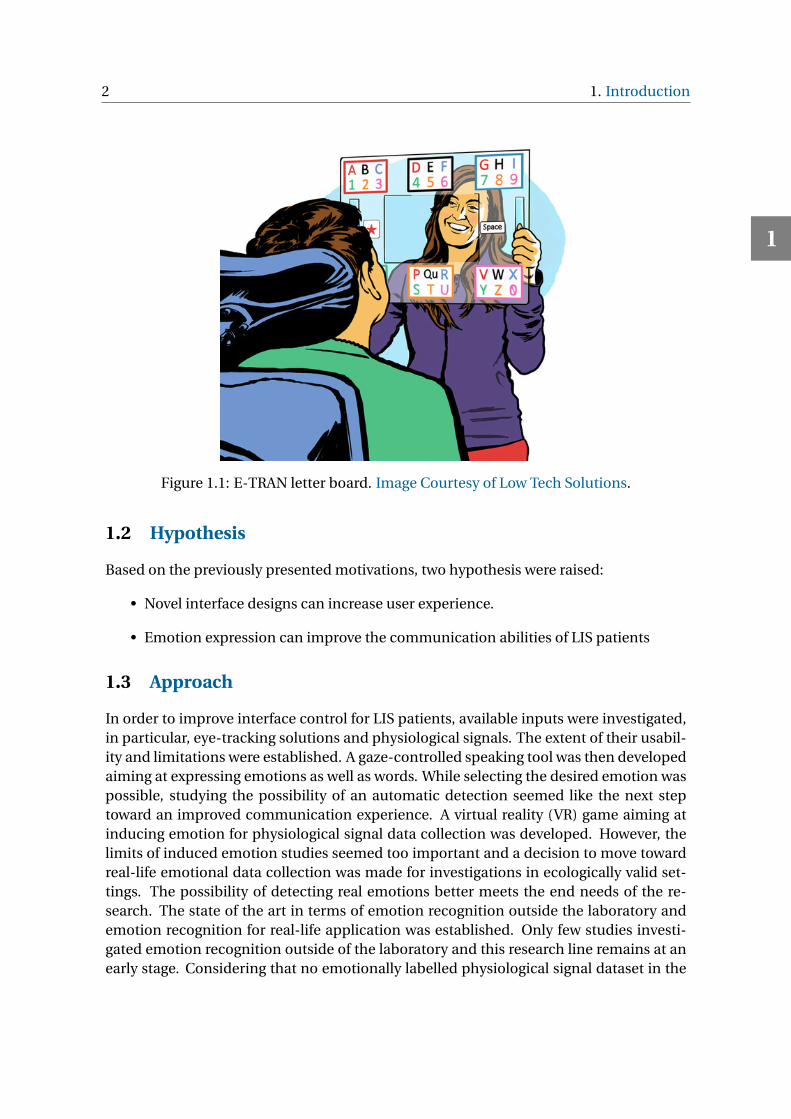
Amyotrophic Lateral Sclerosis (ALS) is an “idiopathic, fatal neurodegenerative diseaseof the human motor system”, which can lead to a locked-in syndrome (LIS) [Kiernanet al., 2011]. LIS is a medical condition “characterized by quadriplegia and anorthic withpreservation of consciousness. Patients retain vertical eye movement“ [Jacob, 1995]. LISpatients’ abilities are limited, especially in terms of computer system control and com-munication. Their remaining ability to control their eyes is often used as input for user in-terfaces thank to eye-tracking technology. However, few guidelines are available to buildgaze-controlled interfaces and other types of system input may be investigated. When itcomes to communication, most patients use spelling boards (Fig. 1.1) or simple blinkingcodes in order to express themselves. Several systems provide adapted communicationmodalities using gaze-controlled software systems. However, existing dedicated systemsusually focus on word spelling not taking into consideration that human-human com-munication goes way beyond words. It also includes actions such as face expressions,hand gestures, para-verbal signals and physical contacts. While written expressions likeemoticons are commonly used in Computer-Mediated Communication (CMC) to trans-fer those emotions, it is not a naturalistic way to express emotions and it is not adapted totext-to-speech communication systems used by ALS patients. Considering this context,the main goal of this research is to build novel modalities of technologically mediatedcommunication designed to improve ALS patients’ quality of life. Such solutions mustprovide novel interfaces adapted to LIS patients capabilities and provide them a moreextensive, and complete communication systems. It should improve their ability to ex-press emotions as well as words. To further explore this goal, this research also aims atproviding tools for research in emotion detection from physiological signals for real-lifeapplications.
1
2 1. Introduction
Figure 1.1: E-TRAN letter board. Image Courtesy of Low Tech Solutions.
1.2 Hypothesis
Based on the previously presented motivations, two hypothesis were raised:
• Novel interface designs can increase user experience.
• Emotion expression can improve the communication abilities of LIS patients
1.3 Approach
In order to improve interface control for LIS patients, available inputs were investigated,in particular, eye-tracking solutions and physiological signals. The extent of their usabil-ity and limitations were established. A gaze-controlled speaking tool was then developedaiming at expressing emotions as well as words. While selecting the desired emotion waspossible, studying the possibility of an automatic detection seemed like the next steptoward an improved communication experience. A virtual reality (VR) game aiming atinducing emotion for physiological signal data collection was developed. However, thelimits of induced emotion studies seemed too important and a decision to move towardreal-life emotional data collection was made for investigations in ecologically valid set-tings. The possibility of detecting real emotions better meets the end needs of the re-search. The state of the art in terms of emotion recognition outside the laboratory andemotion recognition for real-life application was established. Only few studies investi-gated emotion recognition outside of the laboratory and this research line remains at anearly stage. Considering that no emotionally labelled physiological signal dataset in the
1
1.4. Contributions 3
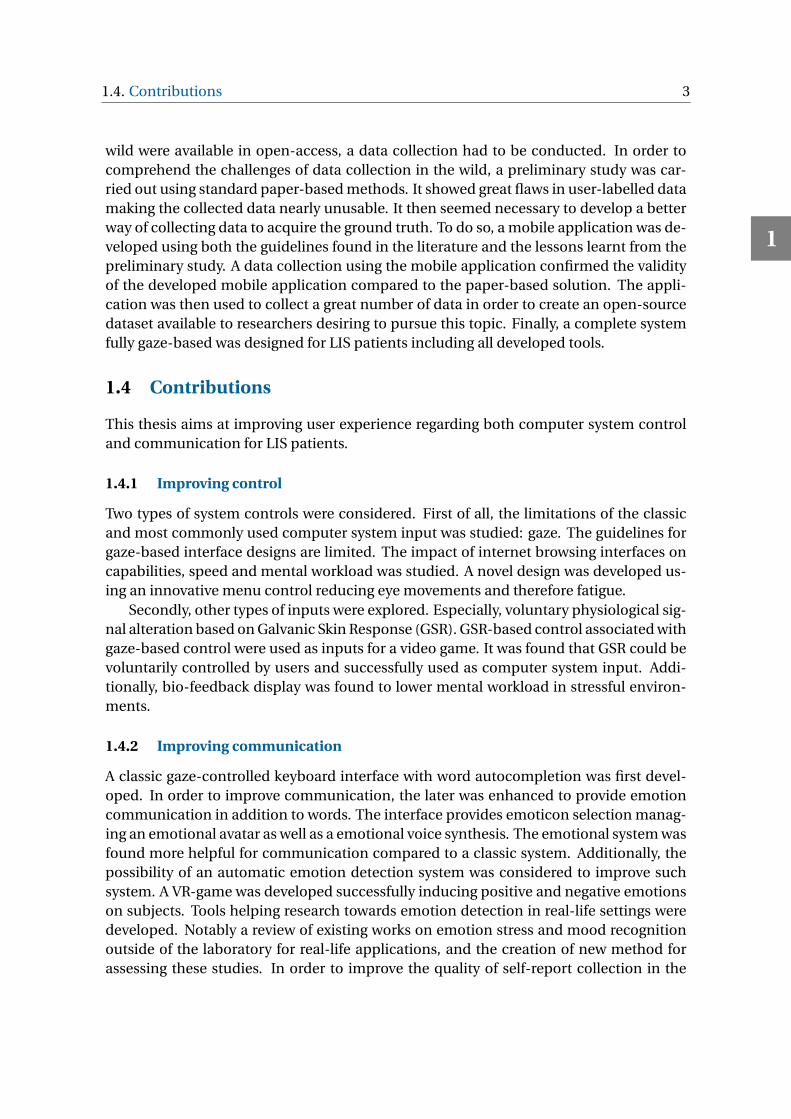
wild were available in open-access, a data collection had to be conducted. In order tocomprehend the challenges of data collection in the wild, a preliminary study was car-ried out using standard paper-based methods. It showed great flaws in user-labelled datamaking the collected data nearly unusable. It then seemed necessary to develop a betterway of collecting data to acquire the ground truth. To do so, a mobile application was de-veloped using both the guidelines found in the literature and the lessons learnt from thepreliminary study. A data collection using the mobile application confirmed the validityof the developed mobile application compared to the paper-based solution. The appli-cation was then used to collect a great number of data in order to create an open-sourcedataset available to researchers desiring to pursue this topic. Finally, a complete systemfully gaze-based was designed for LIS patients including all developed tools.
1.4 Contributions
This thesis aims at improving user experience regarding both computer system controland communication for LIS patients.
1.4.1 Improving control
Two types of system controls were considered. First of all, the limitations of the classicand most commonly used computer system input was studied: gaze. The guidelines forgaze-based interface designs are limited. The impact of internet browsing interfaces oncapabilities, speed and mental workload was studied. A novel design was developed us-ing an innovative menu control reducing eye movements and therefore fatigue.
Secondly, other types of inputs were explored. Especially, voluntary physiological sig-nal alteration based on Galvanic Skin Response (GSR). GSR-based control associated withgaze-based control were used as inputs for a video game. It was found that GSR could bevoluntarily controlled by users and successfully used as computer system input. Addi-tionally, bio-feedback display was found to lower mental workload in stressful environ-ments.
1.4.2 Improving communication
A classic gaze-controlled keyboard interface with word autocompletion was first devel-oped. In order to improve communication, the later was enhanced to provide emotioncommunication in addition to words. The interface provides emoticon selection manag-ing an emotional avatar as well as a emotional voice synthesis. The emotional system wasfound more helpful for communication compared to a classic system. Additionally, thepossibility of an automatic emotion detection system was considered to improve suchsystem. A VR-game was developed successfully inducing positive and negative emotionson subjects. Tools helping research towards emotion detection in real-life settings weredeveloped. Notably a review of existing works on emotion stress and mood recognitionoutside of the laboratory for real-life applications, and the creation of new method forassessing these studies. In order to improve the quality of self-report collection in the
1

4 1. Introduction
wild, a mobile application was created to help the user provide ground-truth emotionlabels. The application was then used to create a large dataset of emotionally-labeledphysiological signals in real-life settings.
1.5 Overview of the Thesis
The thesis is organized as follow: Chapter 2 presents research contributions regardinguser interfaces control. Chapter 3 focuses on emotion communication systems. Chapters4, 5 and 6 discuss emotion detection for real-life application in greater details. Chapter 4investigates emotional data collection methodologies. Chapter 5 focuses on alternativedata collection methods in the laboratory while Chapter 6 presents a novel solution foremotion detection for real-life application and the database created using this solution.Chapter 7 presents the resulting system made available to LIS patients. Finally, conclu-sions and possible future research directions are provided in Chapter 8.
1
2IMPROVING USER INTERFACES CONTROL
Eye-tracking technologies greatly assist the interactions and communication acts of motor-impaired people, specially of those only able to control their ocular movements (Locked-In Syndrome, LIS, as in late stages of Amyotrophic Lateral Sclerosis, ALS) [Kiernan et al.,2011]. It allows, for instance, to select letters on a screen to compose a message in an intu-itive fashion [Söderholm et al., 2001]. However, eye-tracking technologies can show lim-itations in terms of user experience [Majaranta and Räihä, 2002]. For instance, it canincrease users’ mental workload due to repetitive ocular movements in demanding tasks[Yuan and Semmlow, 2000]. It can lead to users’ frustration, and to a degradation in theengagement and motivation in using eye-tracking. Thus, it is necessary to design novelsolutions improving the user experience with particular attention to its aspects related tousers’ workload. Other types of input may also be investigated to extend the range of LIScapabilities.
2.1 Design and Evaluation of an Open-source Gaze-controlled GUIfor Web-browsing
Few ocular control modalities have been explored so far, with a dearth of guidelines tobuild gaze-controlled systems [Majaranta, 2011]. In particular, most gaze commands arebased on dwelling [Jacob, 1995] (activating a UI item when the user looks at it for a certaintime - dwell time) or on eye gestures [Porta and Ravelli, 2009] (e.g., looking from left toright). Gaze control often represents the LIS people’s sole interaction method, thus it isessential to make it easier, quicker and more efficient. The interaction mechanic of thesystem should, therefore, avoid inducing actions known to be tiring such as repetitivesaccadic eye movements [Yuan and Semmlow, 2000].
With the purpose of increasing LIS people’s web-surfing experience, this section presentsan open-source internet browser design based on eye-tracking. It promotes a way ofquickly controlling the browser while imposing minimal screen clutter and requiringminimal eye movements. The interface provides the user with full freedom to controlany website, generally including the ones not specifically designed for people with dis-
5
6 2. Improving user interfaces control
abilities. Here, the usability, user experience, and performance of the proposed browserwere compared to those of a typical eye-tracking Graphical User Interface (GUI): the de-fault configuration of The Grid 3 [ThinkSmartBox, 2011]. The new open-source systemis referred as SightWeb. It can be freely downloaded with technical documentation [Lar-radet, 2018].
2.1.1 Internet browsing control modalities
Only solutions proposed by dedicated gaze-controlled internet applications are discussedhere such as The Grid 3 [ThinkSmartBox, 2011] rather than systems available to control acomplete operating system such as Optikey [Sweetland, 2015].
The main functions for internet browsing are link selection, scrolling and text typing.In the case of common accessible and gaze-controlled web-browsers such as The Grid 3,links and buttons are extracted from the page by the system. They can then be selectedusing different techniques. Side buttons might allow to travel from link to link or a menumight contain all links displayed as buttons [ThinkSmartBox, 2011]. Many solutions con-sist in gazing at the desired link. An increased precision might be done by progressivelyzooming in the gazed area [Menges et al., 2017] or by confirming the desire to click ona specific link through color coding [Kondaveeti et al., 2016]. Other methods might in-clude gaze gesture such as performing an upside then downside gaze movement [Portaand Ravelli, 2009].
To perform scrolling, existing solutions include side buttons [ThinkSmartBox, 2011]that might trigger an additional speed selection menu [Porta and Ravelli, 2009]. Thosemethods do not provide contextual scrolling of specific areas and therefore would not beable to deal with a website containing several windows with several scroll bars, such asthe one in Figure 2.2.a. Additional methods allow to contextually scroll an area by lookingat the corner of it [Menges et al., 2017].
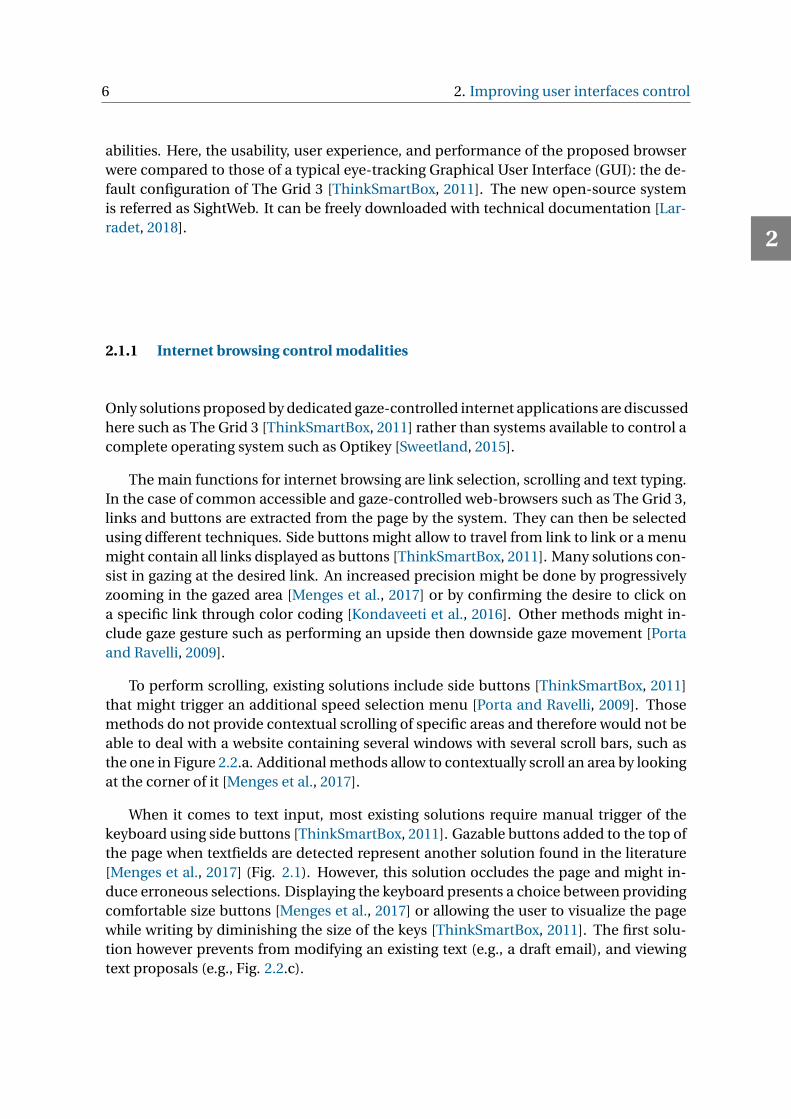
When it comes to text input, most existing solutions require manual trigger of thekeyboard using side buttons [ThinkSmartBox, 2011]. Gazable buttons added to the top ofthe page when textfields are detected represent another solution found in the literature[Menges et al., 2017] (Fig. 2.1). However, this solution occludes the page and might in-duce erroneous selections. Displaying the keyboard presents a choice between providingcomfortable size buttons [Menges et al., 2017] or allowing the user to visualize the pagewhile writing by diminishing the size of the keys [ThinkSmartBox, 2011]. The first solu-tion however prevents from modifying an existing text (e.g., a draft email), and viewingtext proposals (e.g., Fig. 2.2.c).
2
2.1. Design and Evaluation of an Open-source Gaze-controlled GUI for Web-browsing 7
Figure 2.1: Gaze The Web interface, example of gazable buttons for text input
An important limitation for most of the previously cited techniques is the need forpage analysis. Indeed, the systems must know where the links are in the page, what is atext-field, what is scrollable. Because of rapidly changing web technology, such systemshould be frequently updated to detect which UI items are clickable or can be writtenin. It is risky and challenging to use page analysis in order to provide functionalities foractions as an oversight or a fail to upgrade might make the page features inaccessible.
Finally, most gaze-controlled internet applications include side buttons which re-quire constant movement back and forth from the action buttons to the web view. Thismotion could cause fatigue [Yuan and Semmlow, 2000]. Such buttons should therefore belimited as much as possible. Next subsections will present SightWeb in details and com-pare its design with The Grid 3, notably in terms of speed, appreciation, eye movementsand screen usage.
2.1.2 GUI design approach
The ideal gaze-controlled internet browser must satisfy several requirements. First of all,it needs to be quick to use (high ‘action-speed’) and have a minimally invasive screen-space usage. It should be able to understand users’ actions without confusing their nat-ural eye movements with a command [Jacob, 1993]. In terms of gaze detection, severalsolutions are available for a great range of prices (increasing with precision). However,financial accessibility is a priority to provide systems to many patients. Thus, it is neces-sary to overcome the low control precision and the risk of errors through proper design.
Furthermore, a system that is too demanding in terms of mental workload also in-duces fatigue [Ahsberg et al., 2000]. Therefore, two factors affecting mental workloadshould be considered. First of all, the intuitiveness of the system [Naumann et al., 2007]is important so that the user do not have to intensely and repeatedly think about how touse the system to perform actions. Secondly, repetitive eye movements must be mini-mized as they have a negative impact on mental workload [Yuan and Semmlow, 2000].Consequently, the design of the proposed system took as requirements the needs to workwith low-cost eye-tracking devices, to provide an intuitive interaction paradigm, and tominimize necessary eye movements for control.
2
8 2. Improving user interfaces control
The ideal system would permit a LIS person to perform the same actions as a regu-lar user, such as: clicking on regular buttons, clicking on links, clicking on other itemssuch as form-like items (e.g. drop-down menu, radio buttons), hovering (which includesmouse aspect changes, color changes, and contextual menus opening), scrolling in thecase where there are several windows and several scroll bars, e.g. Figure 2.2.a. It is im-portant to be able to update an already written text (modify a draft for example), see thesuggestions from the website while writing (Fig. 2.2.c), and be able to select this sugges-tion.
Lastly, the system needs to stay usable regardless of new web technologies updates.Building a system dependent on knowledge of the web components in the page wouldneed constant system updates to keep it usable. For this reason, the system should notdepend on current web technology knowledge and therefore would not need updating.
2.1.3 Proposed design
To control any kind of website (including web-based instant messaging and social net-working) with general-purpose interfaces, not designed for people with motor disabili-ties, the control of the cursor was given to the user in the same fashion as a computermouse. This provides all interface possibilities such as ‘hovering’, which is used in web-sites, for example, to temporarily display a menu as the mouse passes over specific com-ponents, change menu color, or change the mouse aspect. Mouse control also providesthe possibility to scroll in specific areas, in the case of websites containing several screenparts with several scrolls (Fig. 2.2.a), or clicking on items that are not buttons or linkssuch as dropdown form options.
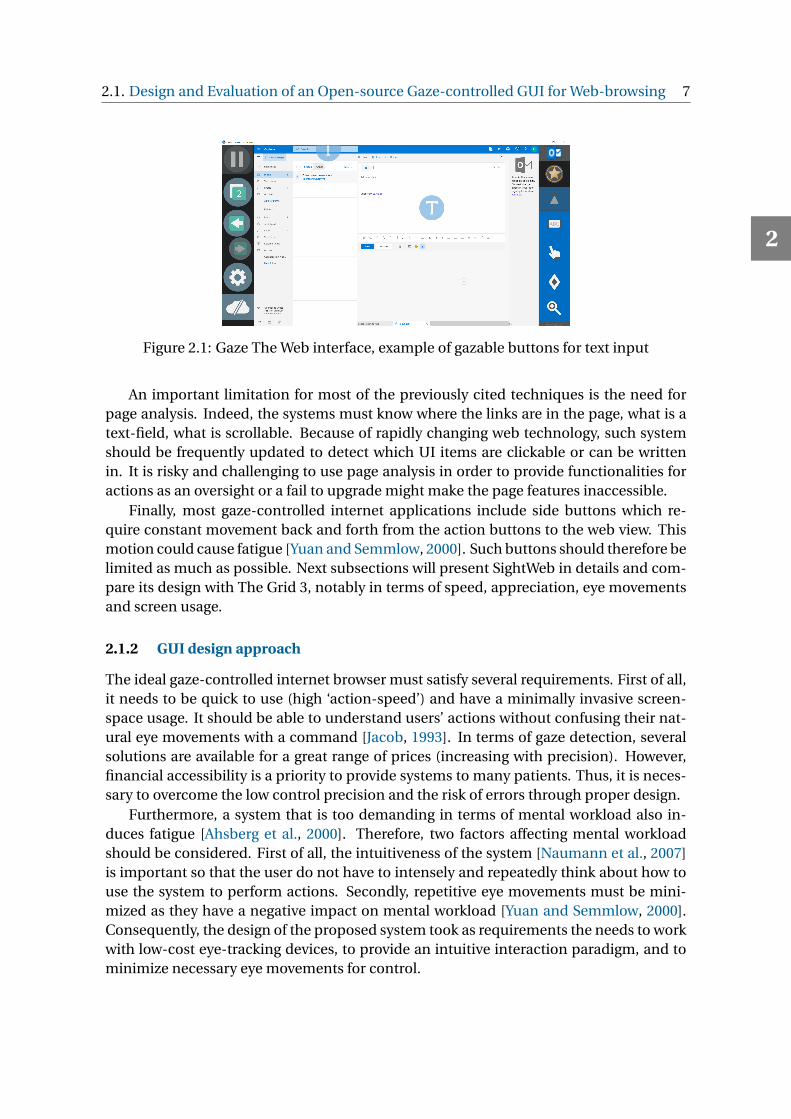
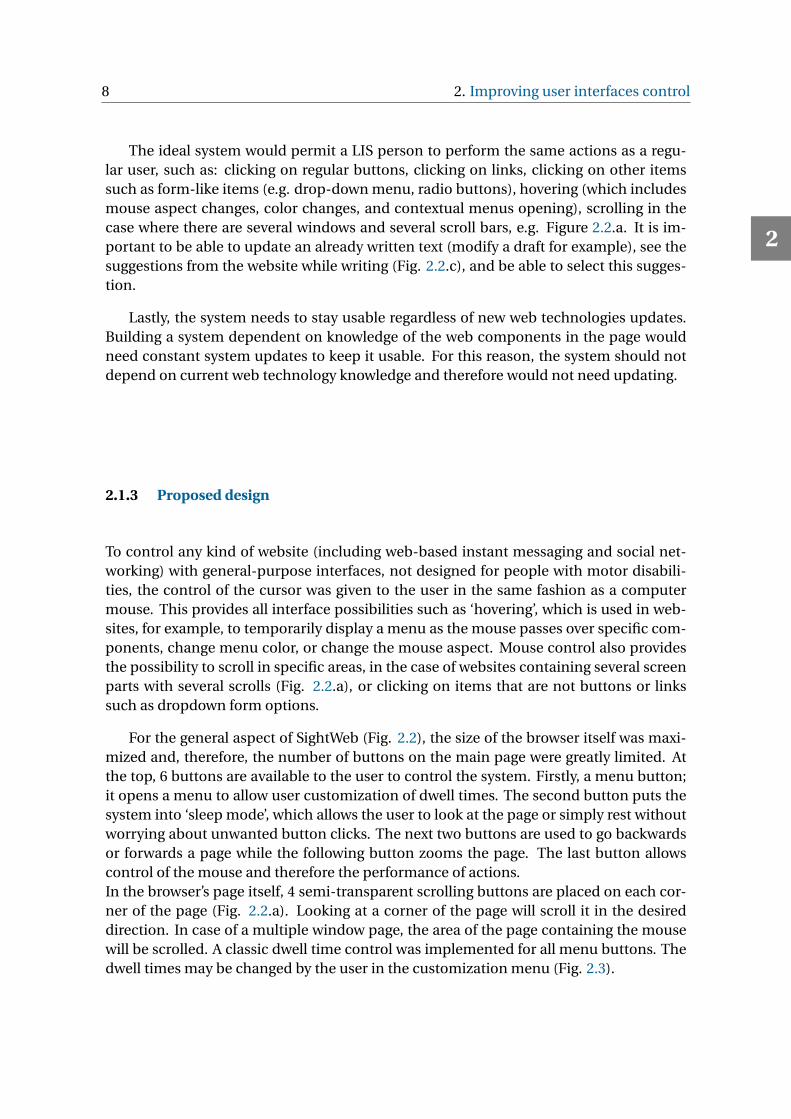
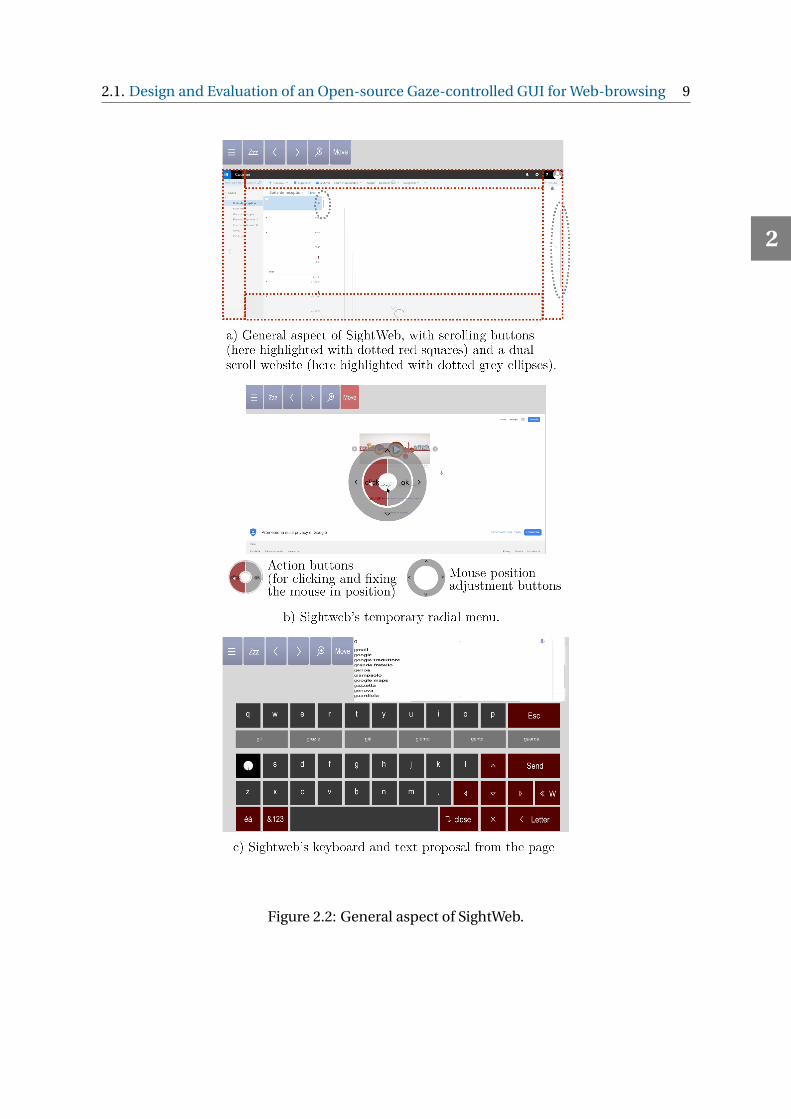
For the general aspect of SightWeb (Fig. 2.2), the size of the browser itself was maxi-mized and, therefore, the number of buttons on the main page were greatly limited. Atthe top, 6 buttons are available to the user to control the system. Firstly, a menu button;it opens a menu to allow user customization of dwell times. The second button puts thesystem into ‘sleep mode’, which allows the user to look at the page or simply rest withoutworrying about unwanted button clicks. The next two buttons are used to go backwardsor forwards a page while the following button zooms the page. The last button allowscontrol of the mouse and therefore the performance of actions.In the browser’s page itself, 4 semi-transparent scrolling buttons are placed on each cor-ner of the page (Fig. 2.2.a). Looking at a corner of the page will scroll it in the desireddirection. In case of a multiple window page, the area of the page containing the mousewill be scrolled. A classic dwell time control was implemented for all menu buttons. Thedwell times may be changed by the user in the customization menu (Fig. 2.3).
2
2.1. Design and Evaluation of an Open-source Gaze-controlled GUI for Web-browsing 9
Figure 2.2: General aspect of SightWeb.
2
10 2. Improving user interfaces control
Figure 2.3: SightWeb customisation menu
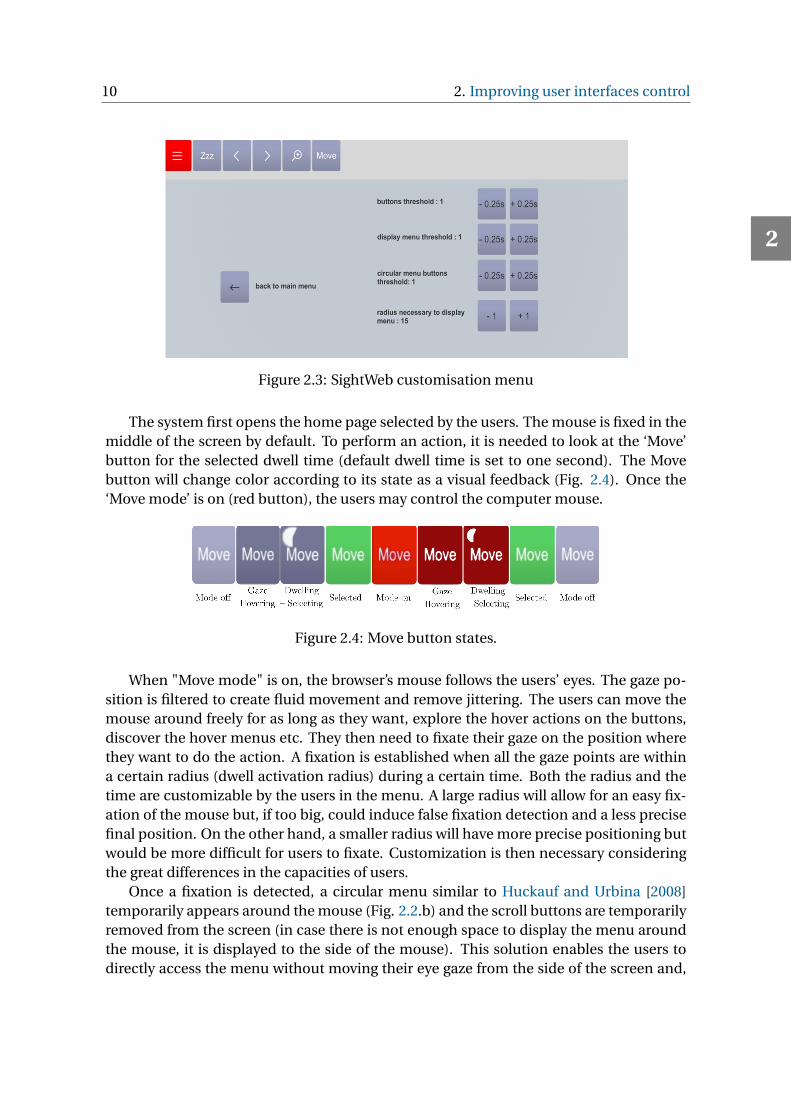
The system first opens the home page selected by the users. The mouse is fixed in themiddle of the screen by default. To perform an action, it is needed to look at the ‘Move’button for the selected dwell time (default dwell time is set to one second). The Movebutton will change color according to its state as a visual feedback (Fig. 2.4). Once the‘Move mode’ is on (red button), the users may control the computer mouse.
Figure 2.4: Move button states.
When "Move mode" is on, the browser’s mouse follows the users’ eyes. The gaze po-sition is filtered to create fluid movement and remove jittering. The users can move themouse around freely for as long as they want, explore the hover actions on the buttons,discover the hover menus etc. They then need to fixate their gaze on the position wherethey want to do the action. A fixation is established when all the gaze points are withina certain radius (dwell activation radius) during a certain time. Both the radius and thetime are customizable by the users in the menu. A large radius will allow for an easy fix-ation of the mouse but, if too big, could induce false fixation detection and a less precisefinal position. On the other hand, a smaller radius will have more precise positioning butwould be more difficult for users to fixate. Customization is then necessary consideringthe great differences in the capacities of users.
Once a fixation is detected, a circular menu similar to Huckauf and Urbina [2008]temporarily appears around the mouse (Fig. 2.2.b) and the scroll buttons are temporarilyremoved from the screen (in case there is not enough space to display the menu aroundthe mouse, it is displayed to the side of the mouse). This solution enables the users todirectly access the menu without moving their eye gaze from the side of the screen and,
2
2.1. Design and Evaluation of an Open-source Gaze-controlled GUI for Web-browsing 11
Figure 2.5: Radial menu functionality explanation.
therefore, it helps minimize the required amount of eye movements. The center of themenu is left empty to permit the users to see the mouse and to provide a ‘safe area’ to lookat the screen without triggering any actions. Around it, two buttons permit performing amouse click where the mouse is positioned or to fix the mouse position without perform-ing a click.
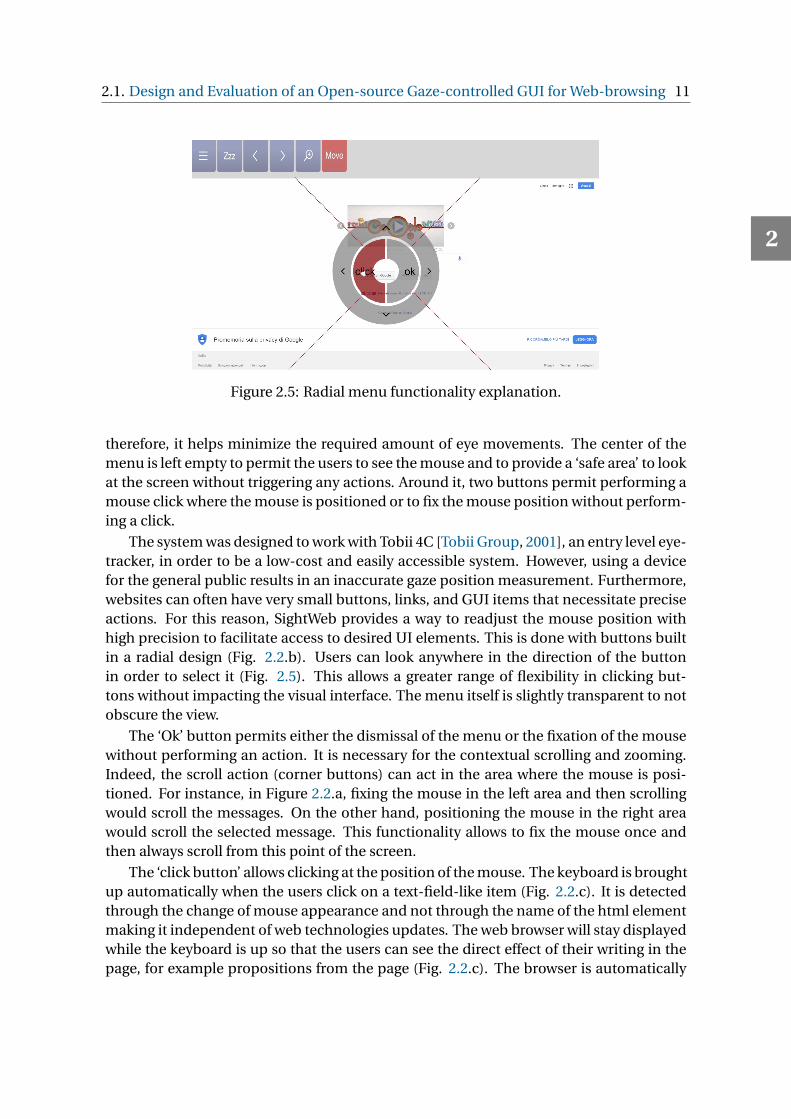
The system was designed to work with Tobii 4C [Tobii Group, 2001], an entry level eye-tracker, in order to be a low-cost and easily accessible system. However, using a devicefor the general public results in an inaccurate gaze position measurement. Furthermore,websites can often have very small buttons, links, and GUI items that necessitate preciseactions. For this reason, SightWeb provides a way to readjust the mouse position withhigh precision to facilitate access to desired UI elements. This is done with buttons builtin a radial design (Fig. 2.2.b). Users can look anywhere in the direction of the buttonin order to select it (Fig. 2.5). This allows a greater range of flexibility in clicking but-tons without impacting the visual interface. The menu itself is slightly transparent to notobscure the view.
The ‘Ok’ button permits either the dismissal of the menu or the fixation of the mousewithout performing an action. It is necessary for the contextual scrolling and zooming.Indeed, the scroll action (corner buttons) can act in the area where the mouse is posi-tioned. For instance, in Figure 2.2.a, fixing the mouse in the left area and then scrollingwould scroll the messages. On the other hand, positioning the mouse in the right areawould scroll the selected message. This functionality allows to fix the mouse once andthen always scroll from this point of the screen.
The ‘click button’ allows clicking at the position of the mouse. The keyboard is broughtup automatically when the users click on a text-field-like item (Fig. 2.2.c). It is detectedthrough the change of mouse appearance and not through the name of the html elementmaking it independent of web technologies updates. The web browser will stay displayedwhile the keyboard is up so that the users can see the direct effect of their writing in thepage, for example propositions from the page (Fig. 2.2.c). The browser is automatically
2
12 2. Improving user interfaces control
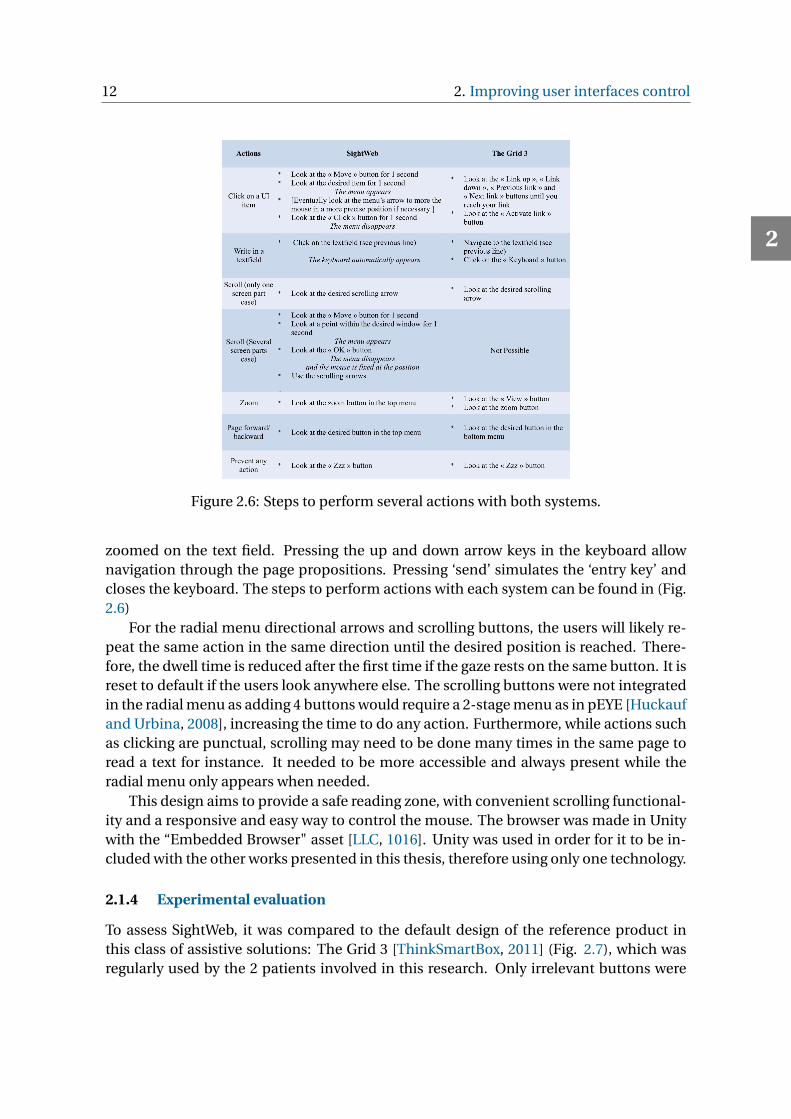
Figure 2.6: Steps to perform several actions with both systems.
zoomed on the text field. Pressing the up and down arrow keys in the keyboard allownavigation through the page propositions. Pressing ‘send’ simulates the ‘entry key’ andcloses the keyboard. The steps to perform actions with each system can be found in (Fig.2.6)
For the radial menu directional arrows and scrolling buttons, the users will likely re-peat the same action in the same direction until the desired position is reached. There-fore, the dwell time is reduced after the first time if the gaze rests on the same button. It isreset to default if the users look anywhere else. The scrolling buttons were not integratedin the radial menu as adding 4 buttons would require a 2-stage menu as in pEYE [Huckaufand Urbina, 2008], increasing the time to do any action. Furthermore, while actions suchas clicking are punctual, scrolling may need to be done many times in the same page toread a text for instance. It needed to be more accessible and always present while theradial menu only appears when needed.
This design aims to provide a safe reading zone, with convenient scrolling functional-ity and a responsive and easy way to control the mouse. The browser was made in Unitywith the “Embedded Browser" asset [LLC, 1016]. Unity was used in order for it to be in-cluded with the other works presented in this thesis, therefore using only one technology.
2.1.4 Experimental evaluation
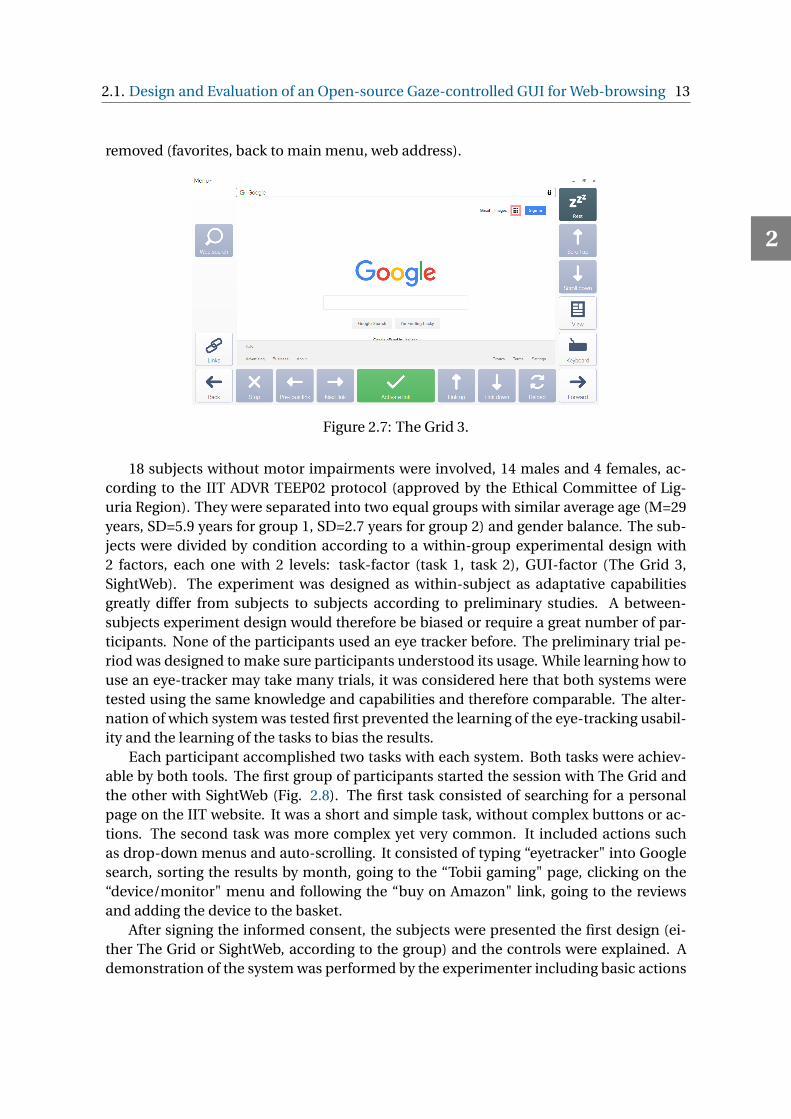
To assess SightWeb, it was compared to the default design of the reference product inthis class of assistive solutions: The Grid 3 [ThinkSmartBox, 2011] (Fig. 2.7), which wasregularly used by the 2 patients involved in this research. Only irrelevant buttons were
2
2.1. Design and Evaluation of an Open-source Gaze-controlled GUI for Web-browsing 13
removed (favorites, back to main menu, web address).
Figure 2.7: The Grid 3.
18 subjects without motor impairments were involved, 14 males and 4 females, ac-cording to the IIT ADVR TEEP02 protocol (approved by the Ethical Committee of Lig-uria Region). They were separated into two equal groups with similar average age (M=29years, SD=5.9 years for group 1, SD=2.7 years for group 2) and gender balance. The sub-jects were divided by condition according to a within-group experimental design with2 factors, each one with 2 levels: task-factor (task 1, task 2), GUI-factor (The Grid 3,SightWeb). The experiment was designed as within-subject as adaptative capabilitiesgreatly differ from subjects to subjects according to preliminary studies. A between-subjects experiment design would therefore be biased or require a great number of par-ticipants. None of the participants used an eye tracker before. The preliminary trial pe-riod was designed to make sure participants understood its usage. While learning how touse an eye-tracker may take many trials, it was considered here that both systems weretested using the same knowledge and capabilities and therefore comparable. The alter-nation of which system was tested first prevented the learning of the eye-tracking usabil-ity and the learning of the tasks to bias the results.
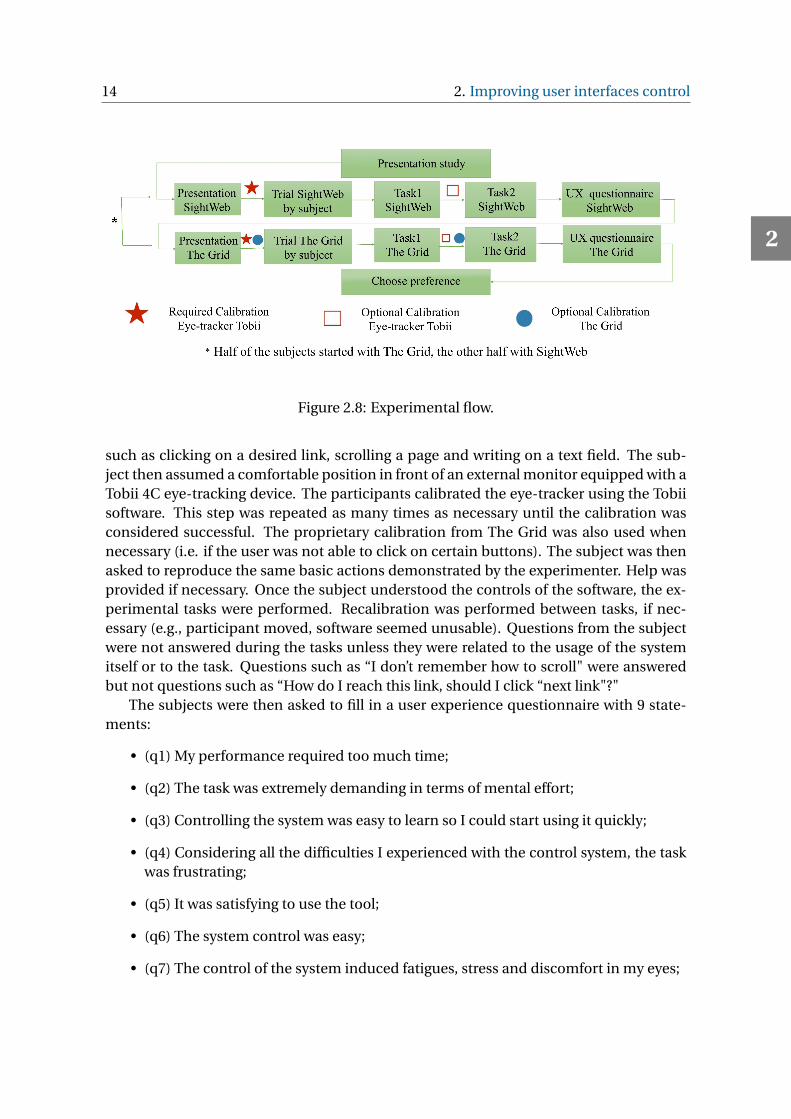
Each participant accomplished two tasks with each system. Both tasks were achiev-able by both tools. The first group of participants started the session with The Grid andthe other with SightWeb (Fig. 2.8). The first task consisted of searching for a personalpage on the IIT website. It was a short and simple task, without complex buttons or ac-tions. The second task was more complex yet very common. It included actions suchas drop-down menus and auto-scrolling. It consisted of typing “eyetracker" into Googlesearch, sorting the results by month, going to the “Tobii gaming" page, clicking on the“device/monitor" menu and following the “buy on Amazon" link, going to the reviewsand adding the device to the basket.
After signing the informed consent, the subjects were presented the first design (ei-ther The Grid or SightWeb, according to the group) and the controls were explained. Ademonstration of the system was performed by the experimenter including basic actions
2
14 2. Improving user interfaces control
Figure 2.8: Experimental flow.
such as clicking on a desired link, scrolling a page and writing on a text field. The sub-ject then assumed a comfortable position in front of an external monitor equipped with aTobii 4C eye-tracking device. The participants calibrated the eye-tracker using the Tobiisoftware. This step was repeated as many times as necessary until the calibration wasconsidered successful. The proprietary calibration from The Grid was also used whennecessary (i.e. if the user was not able to click on certain buttons). The subject was thenasked to reproduce the same basic actions demonstrated by the experimenter. Help wasprovided if necessary. Once the subject understood the controls of the software, the ex-perimental tasks were performed. Recalibration was performed between tasks, if nec-essary (e.g., participant moved, software seemed unusable). Questions from the subjectwere not answered during the tasks unless they were related to the usage of the systemitself or to the task. Questions such as “I don’t remember how to scroll" were answeredbut not questions such as “How do I reach this link, should I click “next link"?"
The subjects were then asked to fill in a user experience questionnaire with 9 state-ments:
• (q1) My performance required too much time;
• (q2) The task was extremely demanding in terms of mental effort;
• (q3) Controlling the system was easy to learn so I could start using it quickly;
• (q4) Considering all the difficulties I experienced with the control system, the taskwas frustrating;
• (q5) It was satisfying to use the tool;
• (q6) The system control was easy;
• (q7) The control of the system induced fatigues, stress and discomfort in my eyes;
2
2.1. Design and Evaluation of an Open-source Gaze-controlled GUI for Web-browsing 15
• (q8) My performance with this system in this task was frustrating;
• (q9) It is easy to make errors with this system.
While traditional questionnaires like SUS and NASA-TLX do not consider gaze control-specific features, this questionnaire was designed according to Barresi et al. [2016] toevaluate the user experience in such conditions. According to preliminary tests with bothpeople with and without motor impairments, default values of 15 pixels (0.4 cm) for theSightWeb dwell activation radius and 1 second for the dwell time were selected. This wasthe best compromise between accessibility and speed.
For each statement, the subjects were asked to answer using a rating scale from 0 to100 (0 being “strongly disagree”, 50 “neither agree nor disagree” and 100 being “stronglyagree”). These Likert-type scales allow for the adoption of many inferential statisticalanalyses, since they are perceptually similar to visually continuous scales [Jaeschke et al.,1990]. The same steps were then repeated with the second system. When both tasks andquestionnaires were completed for both systems, the subjects were asked which systemthey preferred. During tasks 1 and 2, a separate application was running in the back-ground to calculate the total distance covered by the eyes during the task and the elapsedtime. The same experiment was conducted with two people with ALS in the late stagesof the disease, with preserved voluntary gaze movements (a 55 year-old male and a 58year-old female) to assess the system with the intended end-users following the IIT ADVRTEEP03 protocol (approved by the Ethical Committee of Lazio Region 2).
2.1.5 Data analysis and results
All measures (questionnaire scores, times, accumulative eye distances) collected fromsubjects without motor impairment were analyzed through the Wilcoxon signed-ranktest because of a lack of normality in the distributions.
In terms of browser size (only page content, without buttons), on a 34.5cm by 19.4cmscreen, SightWeb displayed a 34.5cm x 16cm browser and The Grid 3 a 27cm x 14cm one.
2.1.5.1 User experience questionnaire
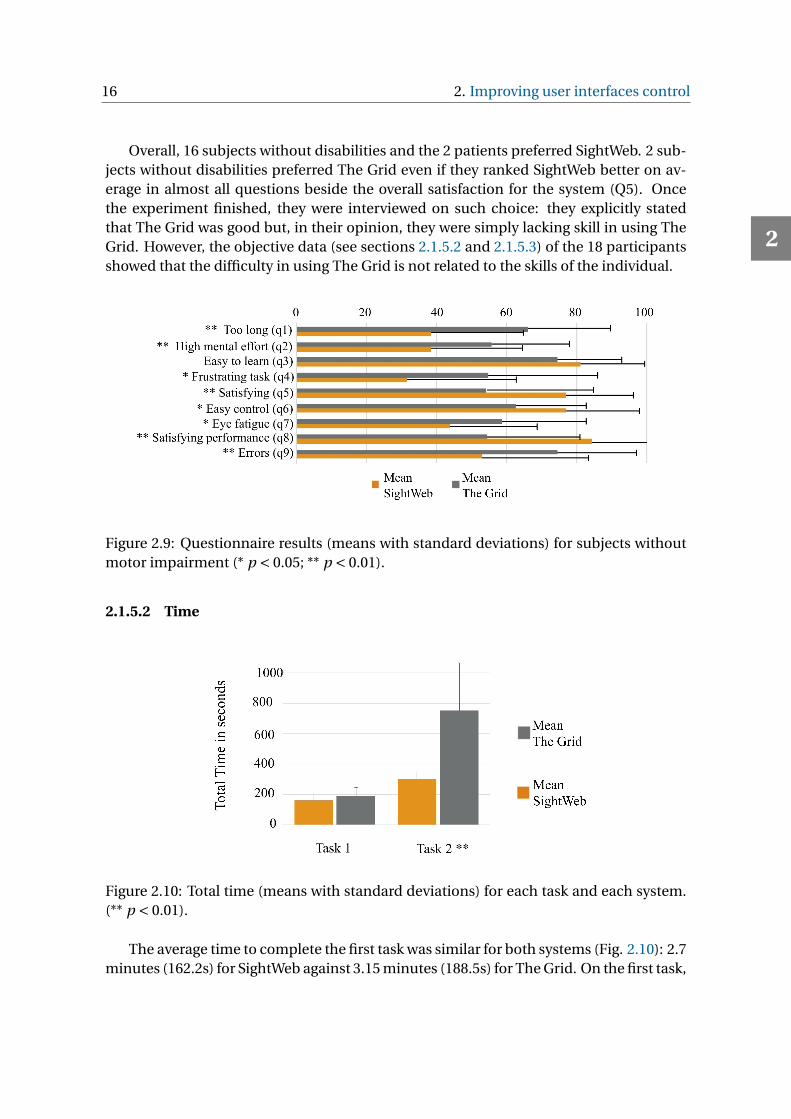
The questionnaire showed an overall significant preference of SightWeb compared to TheGrid (Fig. 2.9). The system control was found to be easier to learn (W=28.5 - p=0.08) andto use (W=18 - p=0.02), more satisfying to use (W=4 - p=0.004) and less easy to makeerrors (W=158 - p=0.002). The participants estimated that SightWeb was less demand-ing in terms of mental effort (W=108.5 - p=0.006), they were more satisfied with theirperformance (W=0 - p < 0.001) and less frustrated (W=113.5 - p=0.02) during the tasks.The participants estimated that their tasks required less time with SightWeb (W=155.5 -p=0.002), which correlated with the actual execution times. Finally, SightWeb inducedless fatigue, stress and discomfort in the eyes (W=103.5 - p=0.01), which correlated withthe actual accumulated eye distance for the task. Both patients preferred SightWeb toThe Grid in all aspects of the questionnaire.
2
16 2. Improving user interfaces control
Overall, 16 subjects without disabilities and the 2 patients preferred SightWeb. 2 sub-jects without disabilities preferred The Grid even if they ranked SightWeb better on av-erage in almost all questions beside the overall satisfaction for the system (Q5). Oncethe experiment finished, they were interviewed on such choice: they explicitly statedthat The Grid was good but, in their opinion, they were simply lacking skill in using TheGrid. However, the objective data (see sections 2.1.5.2 and 2.1.5.3) of the 18 participantsshowed that the difficulty in using The Grid is not related to the skills of the individual.
Figure 2.9: Questionnaire results (means with standard deviations) for subjects withoutmotor impairment (* p < 0.05; ** p < 0.01).
2.1.5.2 Time
Figure 2.10: Total time (means with standard deviations) for each task and each system.(** p < 0.01).
The average time to complete the first task was similar for both systems (Fig. 2.10): 2.7minutes (162.2s) for SightWeb against 3.15 minutes (188.5s) for The Grid. On the first task,
2
2.1. Design and Evaluation of an Open-source Gaze-controlled GUI for Web-browsing 17
SightWeb was quicker on average but not significantly (W=121 - p=0.130). The secondtask, more complex, took an average of 5 minutes (301.1s) for SightWeb and 12.5 minutes(754.57s) for The Grid. SightWeb was significantly superior in terms of speed (W=171 -p < 0.001). Similar results were found with the 2 patients in both Task1 (302s and 234swith The Grid; 166s and 201s with SightWeb) and Task2 (1024s and 1228s with The Grid;474s and 285s with SightWeb).
2.1.5.3 Accumulated gaze distance
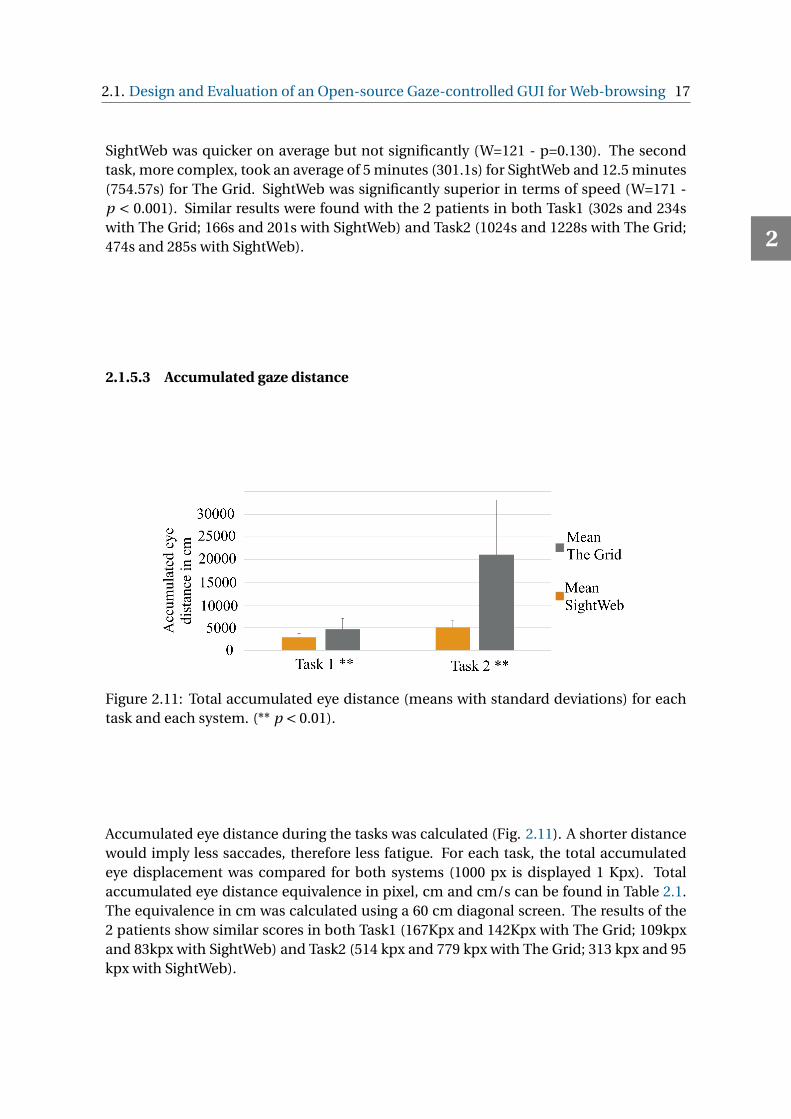
Figure 2.11: Total accumulated eye distance (means with standard deviations) for eachtask and each system. (** p < 0.01).
Accumulated eye distance during the tasks was calculated (Fig. 2.11). A shorter distancewould imply less saccades, therefore less fatigue. For each task, the total accumulatedeye displacement was compared for both systems (1000 px is displayed 1 Kpx). Totalaccumulated eye distance equivalence in pixel, cm and cm/s can be found in Table 2.1.The equivalence in cm was calculated using a 60 cm diagonal screen. The results of the2 patients show similar scores in both Task1 (167Kpx and 142Kpx with The Grid; 109kpxand 83kpx with SightWeb) and Task2 (514 kpx and 779 kpx with The Grid; 313 kpx and 95kpx with SightWeb).
2
18 2. Improving user interfaces control
Table 2.1: Total accumulated eye distance equivalence in pixel, cm and cm/s for peoplewithout motor impairment.
Task1 Task2
SightWeb The Grid Wilcoxon test SightWeb The Grid Wilcoxon
test
Kpx 105 169 W = 161 p< 0.001 187 773 W = 166
p< 0.001
cm 2846.9 4608.5 5107 21054.9
cm/s 17.5 23.6 16.9 26.5
Since only 2 subjects with ALS were available to participate, no statistical inferencecould be performed on their (subjective and objective) data. However, their appreciationof SightWeb can be highlighted.
2.1.6 Discussion
On similar tasks, the subjects were significantly quicker with SightWeb. The time for com-pleting the second task took on average over double the time for The Grid compared toSightWeb. Furthermore, due to the radial menu being around the target area, our designallowed for the reduction of the eye movements, diminishing fatigue and effort. This iscorroborated by both the reduced accumulative eye distance in SightWeb and the ques-tionnaire answers (statements 2 and 7). SightWeb was found to be easier to learn and touse, more satisfying, less prone to errors, and less frustrating.
SightWeb needs less accumulative distance than The Grid for completing the sametasks which confirms that side buttons increase the need for eye travel (and thereforefatigue), while a circular menu centered on the point of interest greatly decreases thisdistance. In terms of browser size, SightWeb represents the best option for screen real-estate for the browser.
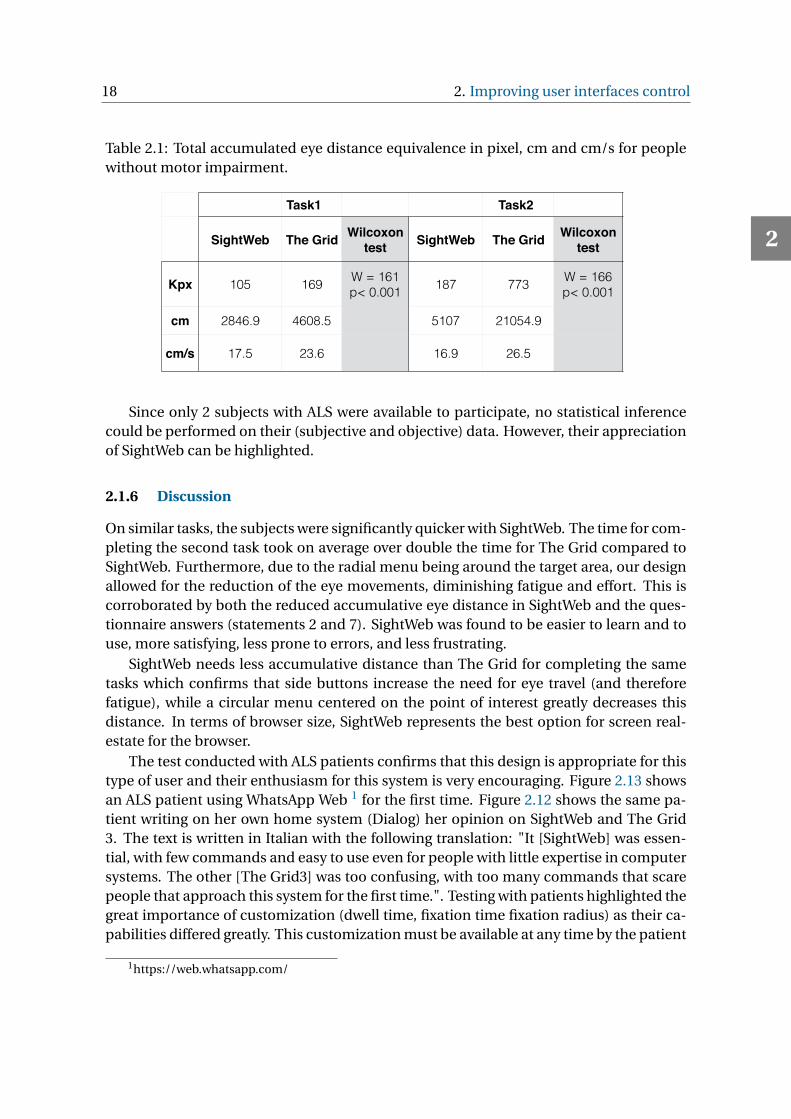
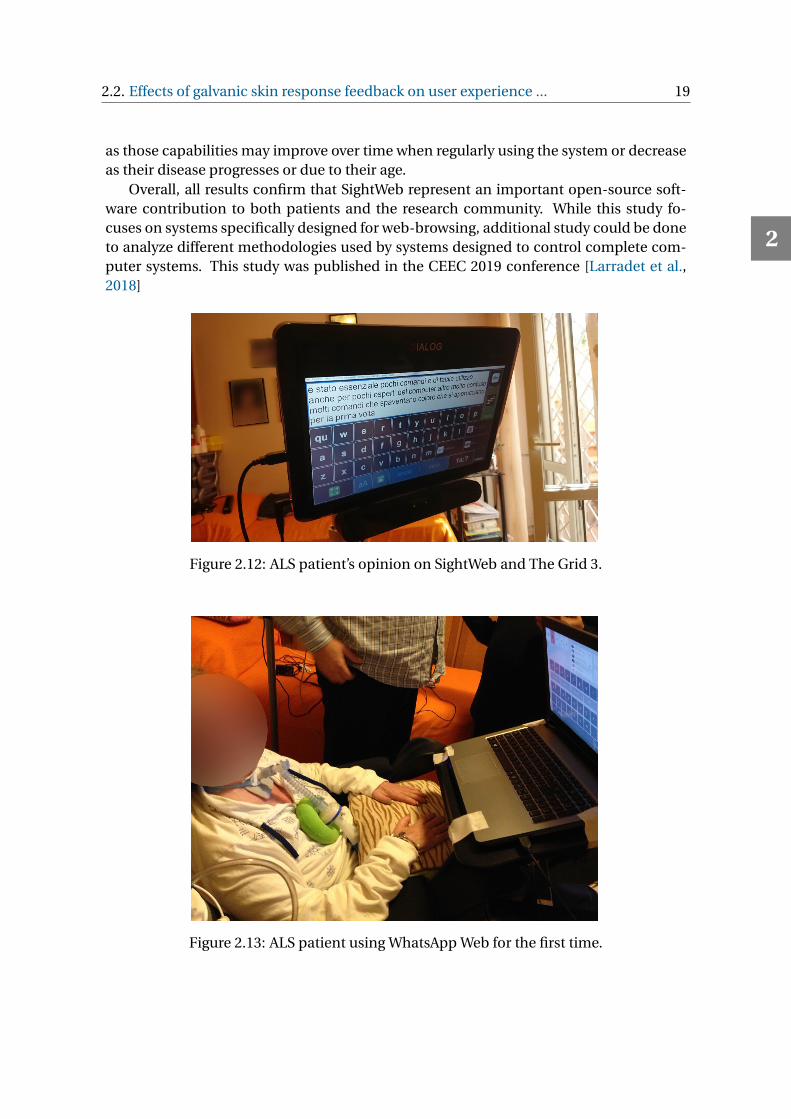
The test conducted with ALS patients confirms that this design is appropriate for thistype of user and their enthusiasm for this system is very encouraging. Figure 2.13 showsan ALS patient using WhatsApp Web 1 for the first time. Figure 2.12 shows the same pa-tient writing on her own home system (Dialog) her opinion on SightWeb and The Grid3. The text is written in Italian with the following translation: "It [SightWeb] was essen-tial, with few commands and easy to use even for people with little expertise in computersystems. The other [The Grid3] was too confusing, with too many commands that scarepeople that approach this system for the first time.". Testing with patients highlighted thegreat importance of customization (dwell time, fixation time fixation radius) as their ca-pabilities differed greatly. This customization must be available at any time by the patient
1https://web.whatsapp.com/
2
2.2. Effects of galvanic skin response feedback on user experience ... 19
as those capabilities may improve over time when regularly using the system or decreaseas their disease progresses or due to their age.
Overall, all results confirm that SightWeb represent an important open-source soft-ware contribution to both patients and the research community. While this study fo-cuses on systems specifically designed for web-browsing, additional study could be doneto analyze different methodologies used by systems designed to control complete com-puter systems. This study was published in the CEEC 2019 conference [Larradet et al.,2018]
Figure 2.12: ALS patient’s opinion on SightWeb and The Grid 3.
Figure 2.13: ALS patient using WhatsApp Web for the first time.
2
20 2. Improving user interfaces control
2.2 Effects of galvanic skin response feedback on user experience ingaze-controlled gaming
Additional input solutions for computer system available to LIS patients were investi-gated. While ALS patients lost the ability to perform any movements, their vital bodyfunction are still intact as well as their Autonomic Nervous System (ANS) reactions toemotions [Lulé et al., 2005]. Such physiological signals such as Galvanic Skin Response(GSR) could therefore be accessed and used to alter specific variable in an interface. Pre-vious studies have demonstrated that adapting the parameters of eye-tracking to theusers’ physiological indices related to their mental processes can be useful to improveboth the system performance and the user experience [Barresi et al., 2016]. Furthermore,physiological data are consistent with user experience-related measures of stress, frus-tration, and workload experienced by the user during the control of a device [Lin et al.,2005]. Accordingly, such physiological signals can be monitored to provide a biofeedbackdesigned to shape the user’s affective states. This could be used, for example, to maintainoptimal engagement by adapting the difficulty level in computer games [Chanel et al.,2011].
Following this approach, the effects of a relaxation-biofeedback solution on differentdimensions of user experience during eye tracking control were investigated. In particu-lar, subjects tested a gaze-controlled system that is mentally and temporally demanding:an eye-tracking-based video game designed to be compatible with a biofeedback sys-tem controlled by the user’s Galvanic Skin Response (GSR). This methodology has alsobeen implemented in portable systems [Dillon et al., 2016]. Here, different aspects ofuser experience were estimated, through a questionnaire, under two test conditions: eye-tracking-gaming without biofeedback, and eye-tracking-gaming with GSR biofeedbackto provide an additional control modality to the scenario.
2.2.1 Experimental study
2.2.1.1 Experimental setup
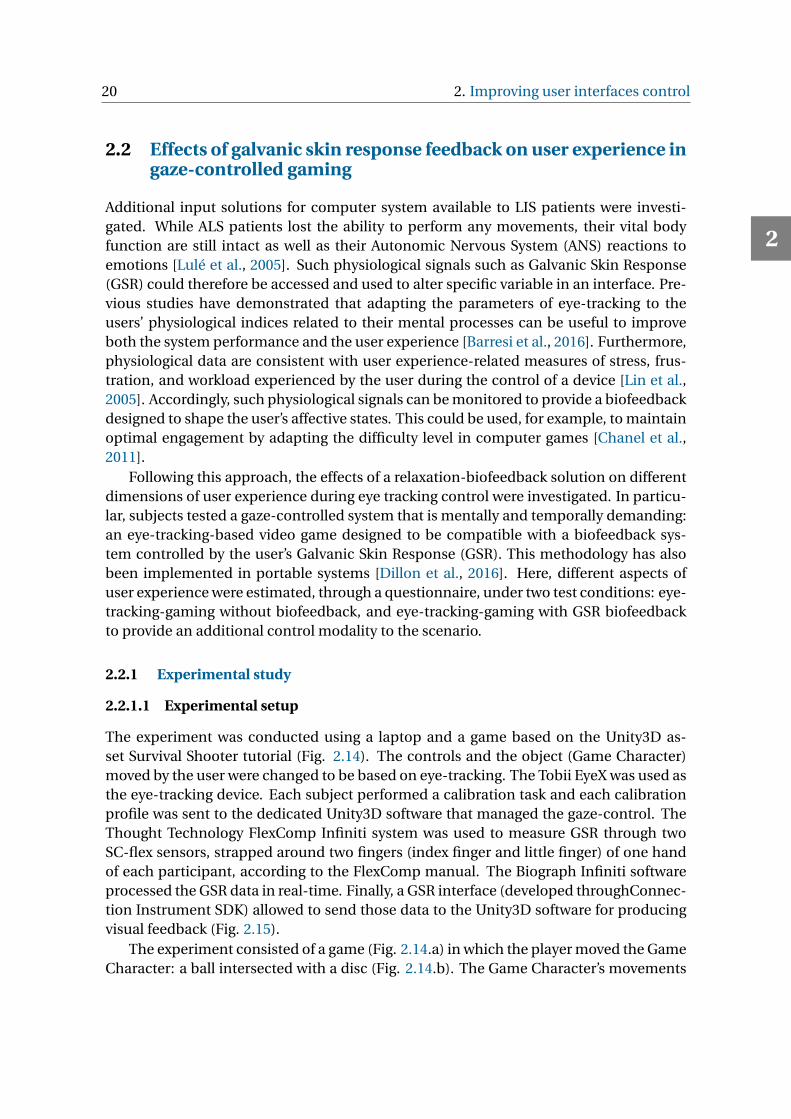
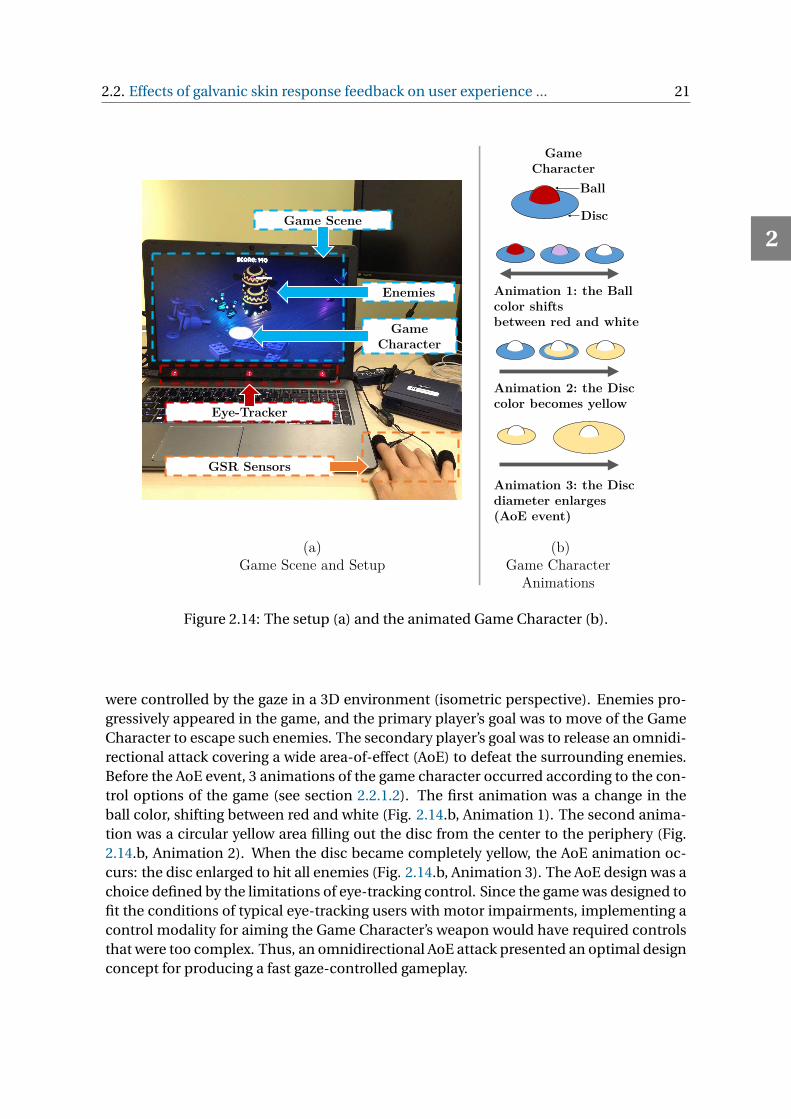
The experiment was conducted using a laptop and a game based on the Unity3D as-set Survival Shooter tutorial (Fig. 2.14). The controls and the object (Game Character)moved by the user were changed to be based on eye-tracking. The Tobii EyeX was used asthe eye-tracking device. Each subject performed a calibration task and each calibrationprofile was sent to the dedicated Unity3D software that managed the gaze-control. TheThought Technology FlexComp Infiniti system was used to measure GSR through twoSC-flex sensors, strapped around two fingers (index finger and little finger) of one handof each participant, according to the FlexComp manual. The Biograph Infiniti softwareprocessed the GSR data in real-time. Finally, a GSR interface (developed throughConnec-tion Instrument SDK) allowed to send those data to the Unity3D software for producingvisual feedback (Fig. 2.15).
The experiment consisted of a game (Fig. 2.14.a) in which the player moved the GameCharacter: a ball intersected with a disc (Fig. 2.14.b). The Game Character’s movements
2
2.2. Effects of galvanic skin response feedback on user experience ... 21
Eye-Tracker
Game Scene
GSR Sensors
Game Character
Enemies
Ball
Game Character
Disc
Animation 1: the Ball color shiftsbetween red and white
Animation 2: the Disc color becomes yellow
Animation 3: the Disc diameter enlarges(AoE event)
(b)Game Character
Animations
(a)Game Scene and Setup
Figure 2.14: The setup (a) and the animated Game Character (b).
were controlled by the gaze in a 3D environment (isometric perspective). Enemies pro-gressively appeared in the game, and the primary player’s goal was to move of the GameCharacter to escape such enemies. The secondary player’s goal was to release an omnidi-rectional attack covering a wide area-of-effect (AoE) to defeat the surrounding enemies.Before the AoE event, 3 animations of the game character occurred according to the con-trol options of the game (see section 2.2.1.2). The first animation was a change in theball color, shifting between red and white (Fig. 2.14.b, Animation 1). The second anima-tion was a circular yellow area filling out the disc from the center to the periphery (Fig.2.14.b, Animation 2). When the disc became completely yellow, the AoE animation oc-curs: the disc enlarged to hit all enemies (Fig. 2.14.b, Animation 3). The AoE design was achoice defined by the limitations of eye-tracking control. Since the game was designed tofit the conditions of typical eye-tracking users with motor impairments, implementing acontrol modality for aiming the Game Character’s weapon would have required controlsthat were too complex. Thus, an omnidirectional AoE attack presented an optimal designconcept for producing a fast gaze-controlled gameplay.
2
22 2. Improving user interfaces control
POSITION
EYE-TRACKER
PLAYER
GSR SENSORS
UNITY3DGAME
CHARGING-SHOOTING FEEDBACK
GAME CHARACTER
BIOGRAPH INFINITI
GSRINTERFACE
Figure 2.15: The flow of information between player and game.
2.2.1.2 Experimental conditions
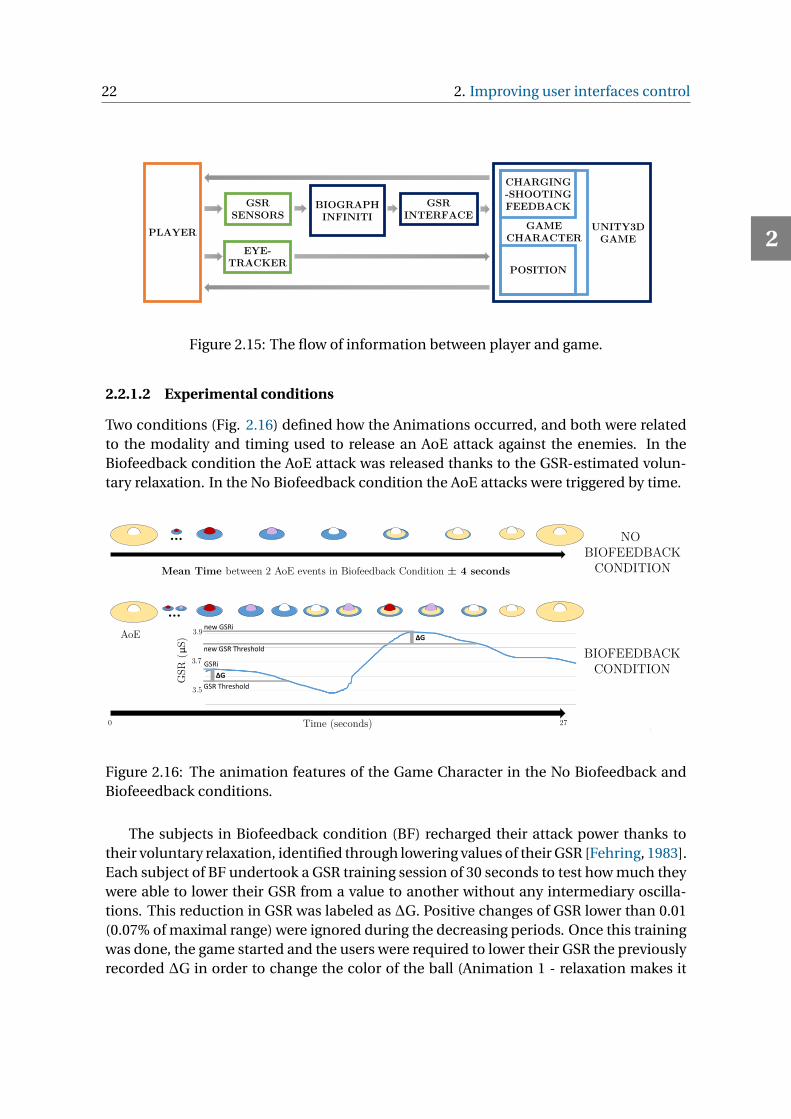
Two conditions (Fig. 2.16) defined how the Animations occurred, and both were relatedto the modality and timing used to release an AoE attack against the enemies. In theBiofeedback condition the AoE attack was released thanks to the GSR-estimated volun-tary relaxation. In the No Biofeedback condition the AoE attacks were triggered by time.
3.5
3.7
3.9
Mean Time between 2 AoE events in Biofeedback Condition ± 4 seconds
Time (seconds)
GSR
(μS
)
GSRi
0 27
GSR ThresholdΔG
new GSRi
new GSR ThresholdΔG
…
… NO BIOFEEDBACK
CONDITION
BIOFEEDBACKCONDITION
AoE
Figure 2.16: The animation features of the Game Character in the No Biofeedback andBiofeeedback conditions.
The subjects in Biofeedback condition (BF) recharged their attack power thanks totheir voluntary relaxation, identified through lowering values of their GSR [Fehring, 1983].Each subject of BF undertook a GSR training session of 30 seconds to test how much theywere able to lower their GSR from a value to another without any intermediary oscilla-tions. This reduction in GSR was labeled as ∆G. Positive changes of GSR lower than 0.01(0.07% of maximal range) were ignored during the decreasing periods. Once this trainingwas done, the game started and the users were required to lower their GSR the previouslyrecorded ∆G in order to change the color of the ball (Animation 1 - relaxation makes it
2
2.2. Effects of galvanic skin response feedback on user experience ... 23
shifts from red to white). To do so, a GSR threshold to reach was set to GSRi-∆G (GSRibeing the current GSR value, as described later). Once this level has been reached, thedisc started to change color radially from the center to the periphery (Animation2). TheAoE event occurred automatically once the disc changed color completely (Animation 3).
Since GSR typically increases quickly but decreases slowly, it would takes too muchtime for anyone to lower their GSR to a previously set threshold after their GSR increased.For this reason, the threshold is adaptive. Indeed, if the current GSR went over the GSRi,the GSRi and the threshold were updated as previously. Once the threshold was reachedby the user, the GSRi and the threshold were updated progressively which incites the userto keep relaxing. The relaxation was represented as the ball color shifting from red towhite. Red was for high stress, white was for relax, this way the subjects were able to seetheir relaxation level over time. The subjects were also able to monitor when the AoE wasready from the amount of disc colored in yellow before the transition from Animation 2 toAnimation 3. When the stress level increased and the ball became red, the portion of thedisc not yet yellow-colored was indicating how long the person had to relax again in orderto completely change the color of the disc and trigger the AoE. Indeed, the design choiceto display all information on the Game Character was necessary, since the eye-trackingusers cannot look elsewhere while they are controlling the object motion with their gaze.Furthermore, having a visual feedback about their relaxation level on the Game Characterenabled the user to see continuously the effects of relaxation during the game session.
In the No Biofeedback (NBF) condition the GSR was not recorded. The Animationswere controlled only by a timer and their sequence was similar to BF: the ball first wentfrom red to white, then the disc was filled up by the yellow area, and finally the AoE shoot-ing occurred. This presented in NBF a condition perceptually similar to BF. Consideringhow task success can affect time estimation when measuring mental workload [Hertzumand Holmegaard, 2013], the time required for AoE events in NBF had to be similar tothe average one in BF. Thus, the mean time needed for BF subjects to relax and triggerAoE was calculated (27 seconds) and labeled as MeanTimeBF. The time required to shootin NBF was calculated randomly in a range from MeanTimeBF±4 seconds (the optimalrange according to an assessment performed before this study). This solution allowed toobtain an equivalent number of AoE events in both conditions, making them compara-ble.
2.2.1.3 Experimental design
18 healthy people were involved, 16 males and 2 females: 9 passed the BF condition and9 the NBF condition. The composition of the two groups balanced the age and gender ofthe members: each group was composed of 1 female and 8 males with an average age of27.33 years (SD=3.32 years) for the BF group, and 27.56 years (SD=4.42years) for the NBFgroup. The gender was not balanced within each groups due to difficulties in recruitingfemales. The participants’ gaming time per week was also balanced between the twogroups, with 4 playing less than 1 hour per week and 5 playing more than 1 hour perweek in each group. The investigation was included into the IITADVRTEEP01 protocol,
2
24 2. Improving user interfaces control
approved by the Ethical Committee of Liguria Region on June 14th, 2016.
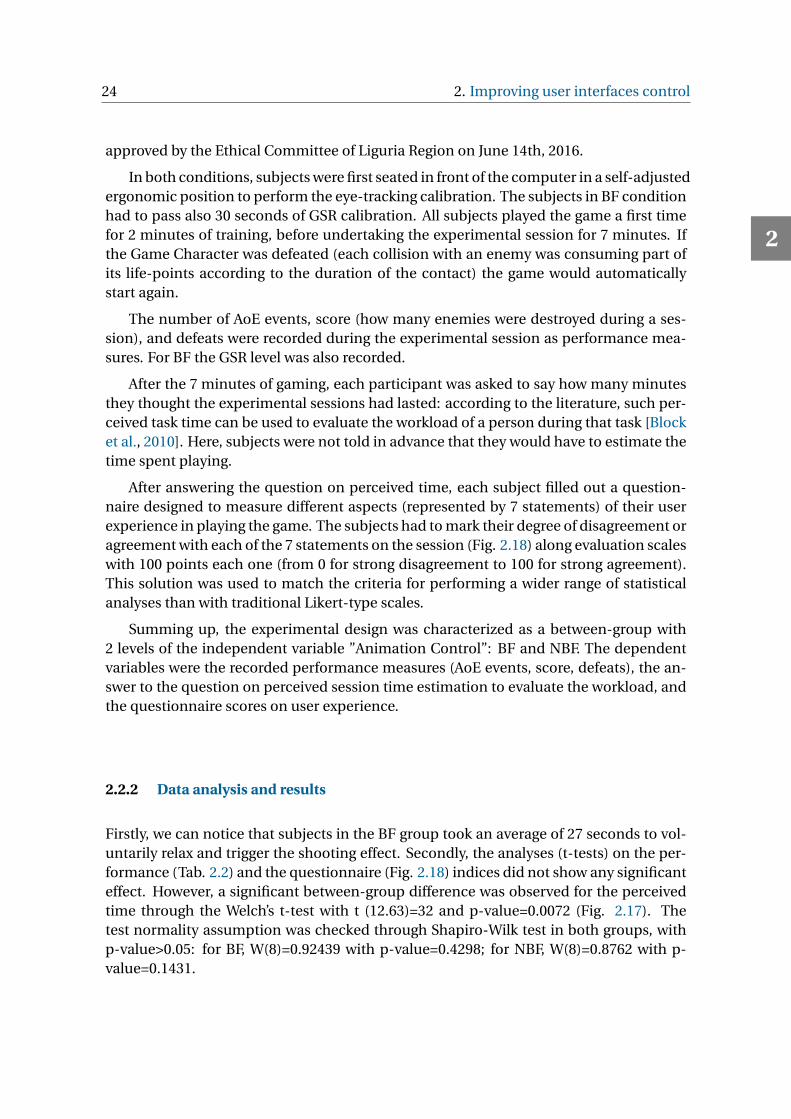
In both conditions, subjects were first seated in front of the computer in a self-adjustedergonomic position to perform the eye-tracking calibration. The subjects in BF conditionhad to pass also 30 seconds of GSR calibration. All subjects played the game a first timefor 2 minutes of training, before undertaking the experimental session for 7 minutes. Ifthe Game Character was defeated (each collision with an enemy was consuming part ofits life-points according to the duration of the contact) the game would automaticallystart again.
The number of AoE events, score (how many enemies were destroyed during a ses-sion), and defeats were recorded during the experimental session as performance mea-sures. For BF the GSR level was also recorded.
After the 7 minutes of gaming, each participant was asked to say how many minutesthey thought the experimental sessions had lasted: according to the literature, such per-ceived task time can be used to evaluate the workload of a person during that task [Blocket al., 2010]. Here, subjects were not told in advance that they would have to estimate thetime spent playing.
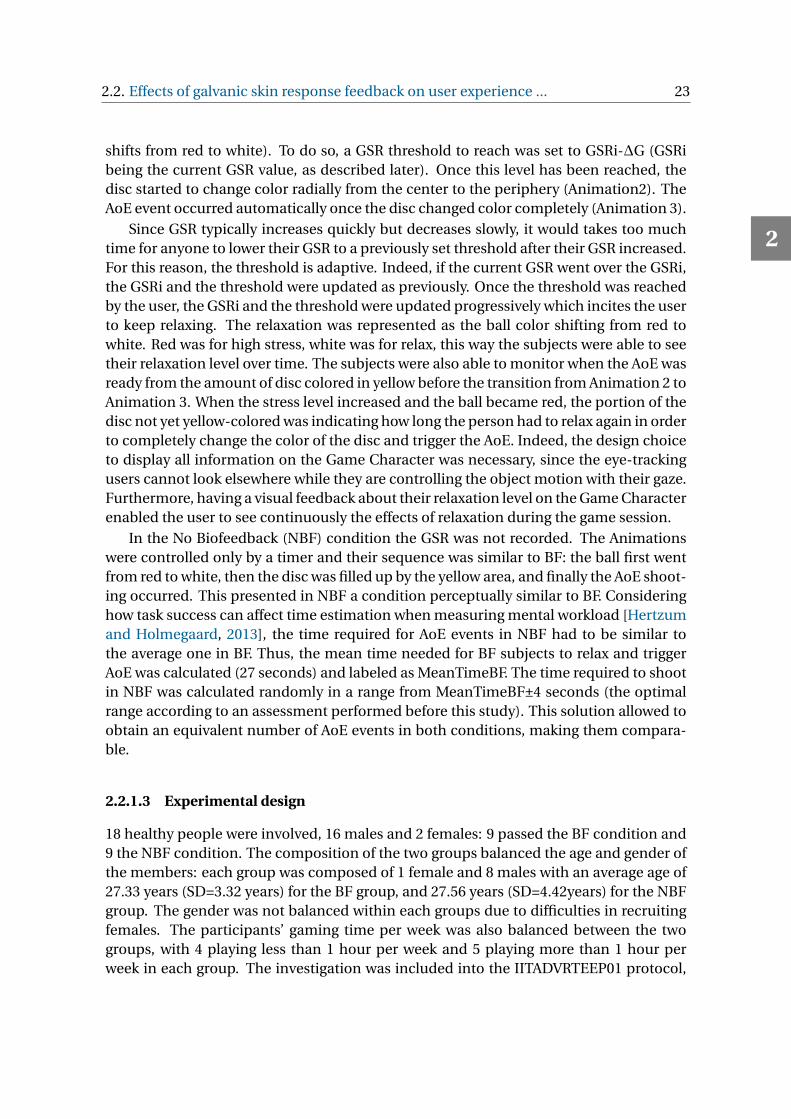
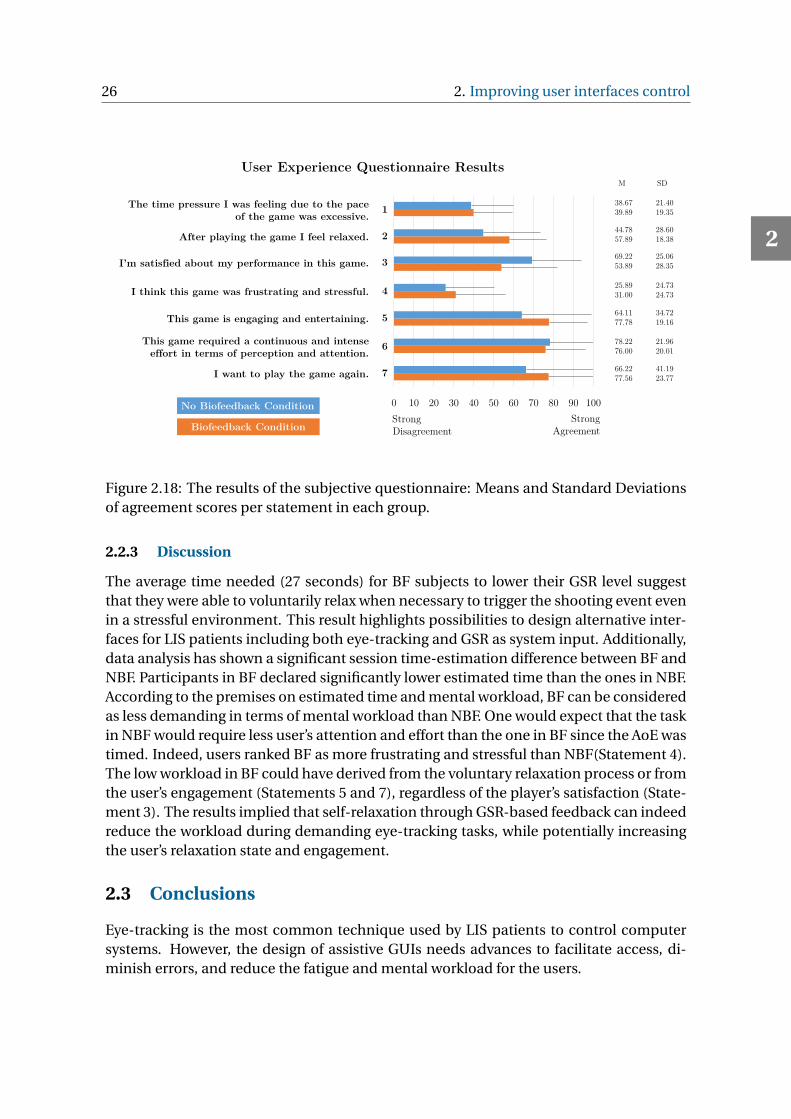
After answering the question on perceived time, each subject filled out a question-naire designed to measure different aspects (represented by 7 statements) of their userexperience in playing the game. The subjects had to mark their degree of disagreement oragreement with each of the 7 statements on the session (Fig. 2.18) along evaluation scaleswith 100 points each one (from 0 for strong disagreement to 100 for strong agreement).This solution was used to match the criteria for performing a wider range of statisticalanalyses than with traditional Likert-type scales.
Summing up, the experimental design was characterized as a between-group with2 levels of the independent variable ”Animation Control”: BF and NBF. The dependentvariables were the recorded performance measures (AoE events, score, defeats), the an-swer to the question on perceived session time estimation to evaluate the workload, andthe questionnaire scores on user experience.
2.2.2 Data analysis and results
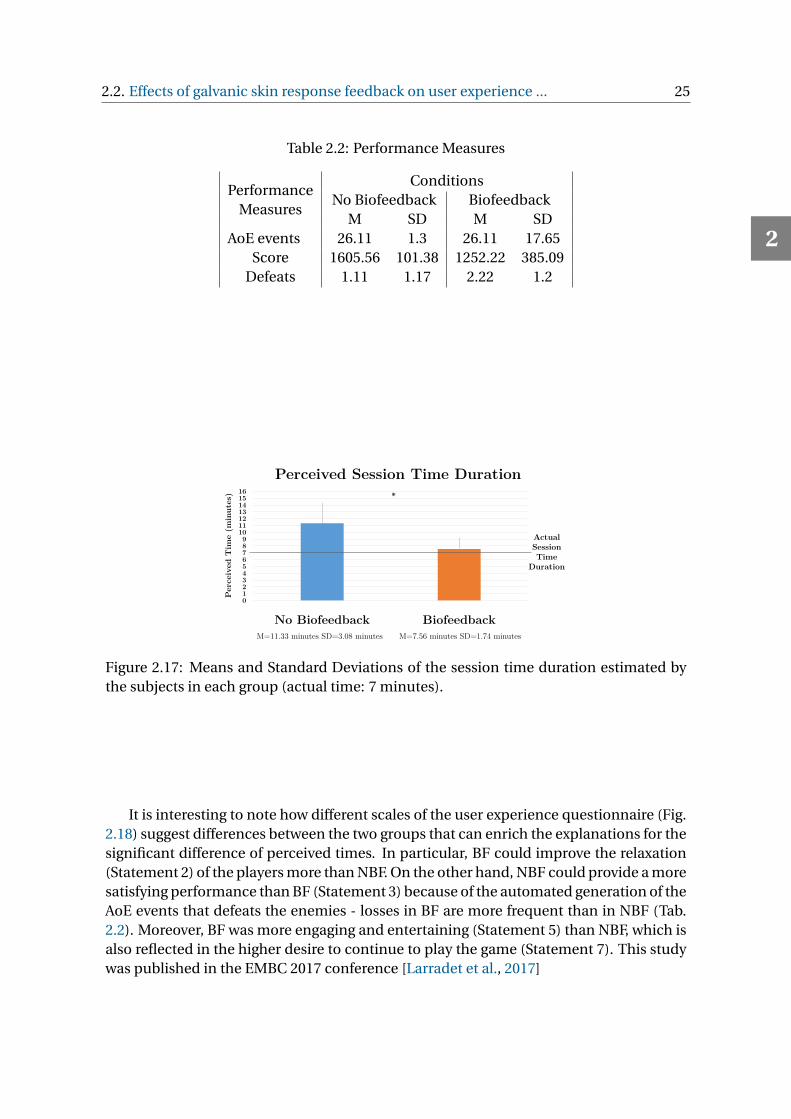
Firstly, we can notice that subjects in the BF group took an average of 27 seconds to vol-untarily relax and trigger the shooting effect. Secondly, the analyses (t-tests) on the per-formance (Tab. 2.2) and the questionnaire (Fig. 2.18) indices did not show any significanteffect. However, a significant between-group difference was observed for the perceivedtime through the Welch’s t-test with t (12.63)=32 and p-value=0.0072 (Fig. 2.17). Thetest normality assumption was checked through Shapiro-Wilk test in both groups, withp-value>0.05: for BF, W(8)=0.92439 with p-value=0.4298; for NBF, W(8)=0.8762 with p-value=0.1431.
2
2.2. Effects of galvanic skin response feedback on user experience ... 25
Table 2.2: Performance Measures
PerformanceMeasures
ConditionsNo Biofeedback Biofeedback
M SD M SDAoE events 26.11 1.3 26.11 17.65
Score 1605.56 101.38 1252.22 385.09Defeats 1.11 1.17 2.22 1.2
Perceived Session Time Duration
0123456789
10111213141516
No BiofeedbackCondition
BiofeedbackCondition
Per
ceiv
edT
ime
(min
utes
)
ActualSession Time
Duration
*
M=11.33 minutes SD=3.08 minutes M=7.56 minutes SD=1.74 minutes
Figure 2.17: Means and Standard Deviations of the session time duration estimated bythe subjects in each group (actual time: 7 minutes).
It is interesting to note how different scales of the user experience questionnaire (Fig.2.18) suggest differences between the two groups that can enrich the explanations for thesignificant difference of perceived times. In particular, BF could improve the relaxation(Statement 2) of the players more than NBF. On the other hand, NBF could provide a moresatisfying performance than BF (Statement 3) because of the automated generation of theAoE events that defeats the enemies - losses in BF are more frequent than in NBF (Tab.2.2). Moreover, BF was more engaging and entertaining (Statement 5) than NBF, which isalso reflected in the higher desire to continue to play the game (Statement 7). This studywas published in the EMBC 2017 conference [Larradet et al., 2017]
2
26 2. Improving user interfaces control
The time pressure I was feeling due to the pace of the game was excessive. 1
After playing the game I feel relaxed. 2
I’m satisfied about my performance in this game. 3
I think this game was frustrating and stressful. 4
This game is engaging and entertaining. 5
This game required a continuous and intense effort in terms of perception and attention. 6
I want to play the game again. 7
0 10 20 30 40 50 60 70 80 90 100StrongDisagreement
StrongAgreement
No Biofeedback Condition
Biofeedback Condition
User Experience Questionnaire Results
38.67 21.4039.89 19.35
44.78 28.6057.89 18.38
69.22 25.0653.89 28.35
25.89 24.7331.00 24.73
64.11 34.7277.78 19.16
78.22 21.9676.00 20.01
66.22 41.1977.56 23.77
M SD
Figure 2.18: The results of the subjective questionnaire: Means and Standard Deviationsof agreement scores per statement in each group.
2.2.3 Discussion
The average time needed (27 seconds) for BF subjects to lower their GSR level suggestthat they were able to voluntarily relax when necessary to trigger the shooting event evenin a stressful environment. This result highlights possibilities to design alternative inter-faces for LIS patients including both eye-tracking and GSR as system input. Additionally,data analysis has shown a significant session time-estimation difference between BF andNBF. Participants in BF declared significantly lower estimated time than the ones in NBF.According to the premises on estimated time and mental workload, BF can be consideredas less demanding in terms of mental workload than NBF. One would expect that the taskin NBF would require less user’s attention and effort than the one in BF since the AoE wastimed. Indeed, users ranked BF as more frustrating and stressful than NBF(Statement 4).The low workload in BF could have derived from the voluntary relaxation process or fromthe user’s engagement (Statements 5 and 7), regardless of the player’s satisfaction (State-ment 3). The results implied that self-relaxation through GSR-based feedback can indeedreduce the workload during demanding eye-tracking tasks, while potentially increasingthe user’s relaxation state and engagement.
2.3 Conclusions
Eye-tracking is the most common technique used by LIS patients to control computersystems. However, the design of assistive GUIs needs advances to facilitate access, di-minish errors, and reduce the fatigue and mental workload for the users.
2
2.3. Conclusions 27
A new minimalistic gaze control paradigm, implemented within an open-source stan-dalone web browser, was proposed: SightWeb. This system enables LIS patients (as inlate stage of ALS) to navigate the web with minimal effort, high freedom, and precise ac-tions. SightWeb was designed to achieve better performance than typical gaze-controlledGUIs, allowing for precise actions even with entry-level sensors for eye-tracking, whilealso minimizing screen obstruction. It imitates the original mouse control to stay rel-evant regardless of website technology updates. While at this time it does not includeadvanced interactions such as copy-pasting or text selection, it allows people with LIS touse common websites.
This system fulfills all of the design requirements, maximizing precision, browser size,and interaction simplicity. According to the presented results (gaze movements, exe-cution times, user experience questionnaire scores), this new solution was found to bequicker, easier to learn and to use than a state-of-the-art system adopted by many pa-tients today. It decreases the amount of eye movements required to perform a task, thus,it reduces fatigue and mental workload. The subjects felt higher satisfaction and reducedrisk of error with this new system. Nonetheless, Gaze-controlled web surfing needs fur-ther improvements to perfect the balance between user capabilities, system intuitive-ness, and screen space usage.
SightWeb exploits an interaction paradigm analogous to the Microsoft Eye Controlsystem [Microsoft Corp., 2018] which was first released to control Windows machineswhen this study was already in progress. SightWeb has the peculiarity and benefit of be-ing an open source system specifically dedicated to web browsing. Moreover, given thesimilarities, the assessment methods and key results presented here are also valid for theMicrosoft EyE Control and other eventual future systems based on the interaction con-cepts presented above.
Additional system input may be considered such as physiological signals monitoring.The ability to voluntary control one’s GSR to control a specific UI variable was studied aswell as the effects of a relaxation-biofeedback system on user experience dimensions dur-ing a demanding eye-tracking-based gaming task. It was shown that the presence of GSRbiofeedback contributes to lowering the level of mental workload required by such tasks.This confirms the opportunity to use relaxation-biofeedback features in eye-tracking sys-tems to improve the user experience. Further results allow to assume that the biofeed-back game enhanced also the users’ relaxation level and engagement.
In both presented systems, all of the information, whether it was for menu display(SightWeb) or for relaxation feedback (ball color), was displayed in the area of action. Thistype of display was found to be a reliable way to make information easily accessible byusers without the need for tiring eye movements. While the ability of subjects to willinglydecrease their GSR to control a UI is a promising result for LIS-specific GUIs, the timenecessary to do so needs to be taken into account. Indeed, this type of input seems tobe too slow to be used as classic control such as a mouse click. It can however be usedfor less crucial commands such as a background color adapting to one’s stress level forself-awareness, similarly to the work done by Roseway et al. [2015].
2
3AFFECTIVE COMMUNICATION ENHANCEMENT
SYSTEM
The first communication systems for LIS patients consisted in codes using eye blinking tosignify yes and no or more complex sentences using techniques such as Morse codes [Lau-reys et al., 2005]. Other types of communication exist such as transparent letter board heldby the interlocutor [Laureys et al., 2005] (Fig. 1.1). The patients may then indicate a letterby gazing at it. The interlocutor must then write down or remember the letters sequence toform words. This systems is still widely used nowadays.
More advanced systems have been established since. Notably, the ability to controltheir gaze was used to send commands to computer systems through eye-tracking cameras[Majaranta and Räihä, 2002]. This technique enabled LIS patients to select letters throughkeyboards displayed on computer screens and to “read” the written sentence out loud usingvoice synthesis [Majaranta and Räihä, 2002]. Such systems mostly focus on composingwords letter by letter. However, when we communicate, we do not only use words but also agreat range of additional non-verbal communications cues such as voice intonation, facialexpression or body gesture [Mehrabian, 2017]. Such additional input helps the interlocutorto properly understand the context of the message itself. A simple sentence such as " let’s gonow" can be read with excitement or anger and deliver a completely different message.
This need for enriching words with emotional features has led to the creation of addi-tional textual communication cues in Computer-Mediated Communication (CMC) suchas emoticons [Lo, 2008]. These solutions are now widely used in text communications suchas SMS or in social medias. For this reason, it is essential for LIS patients to also be ableto communicate such affective state to their interlocutors in the most natural way possi-ble. Focusing on the most common emotional cues in communication, voice and facialexpression, we may find a great number of work in recreating such concept for CMC. Forinstance, emotional speech synthesis has been widely studied in the past [Burkhardt, 2005;Lee et al., 2017; Xue et al., 2015]. Additionally, facial expression was often associated withavatars and 3D characters as a way to express emotions online [Fabri et al., 1999; Mor-ishima, 1998; Neviarouskaya et al., 2007]. The usage of those two technologies togetherwere also studied in the past for CMC [Tang et al., 2008].
28

3.1. Affective communication enhancement system 29
However, to our knowledge, those advances in technology related to emotion expres-sion haven’t yet been adapted for LIS patients. Augmentative and Alternative Communica-tion (AAC) systems for persons with disabilities rarely provide tools for emotion expression[Baldassarri et al., 2014]. Focusing on children with disabilities, [Na et al., 2016] reviewsthe past studies on AAC and exposes the great need for emotional communication in suchtools. Additionally, the effect of such affective capabilities on communication abilities forpatients with LIS haven’t been studied so far. To fill this gap in the literature we proposea novel open-source system controlled with eye gaze, including emotional voice synthesisand an emotional personalized avatar for enhance affective communication.
3
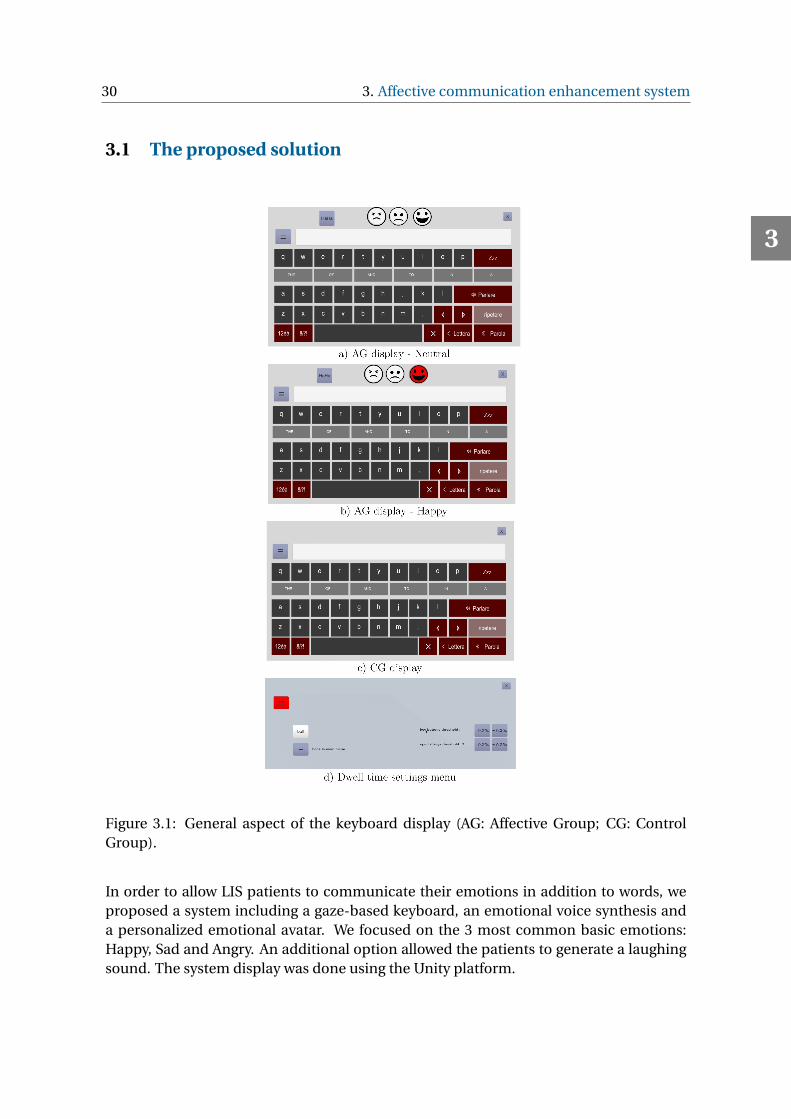
30 3. Affective communication enhancement system
3.1 The proposed solution
Figure 3.1: General aspect of the keyboard display (AG: Affective Group; CG: ControlGroup).
In order to allow LIS patients to communicate their emotions in addition to words, weproposed a system including a gaze-based keyboard, an emotional voice synthesis anda personalized emotional avatar. We focused on the 3 most common basic emotions:Happy, Sad and Angry. An additional option allowed the patients to generate a laughingsound. The system display was done using the Unity platform.
3
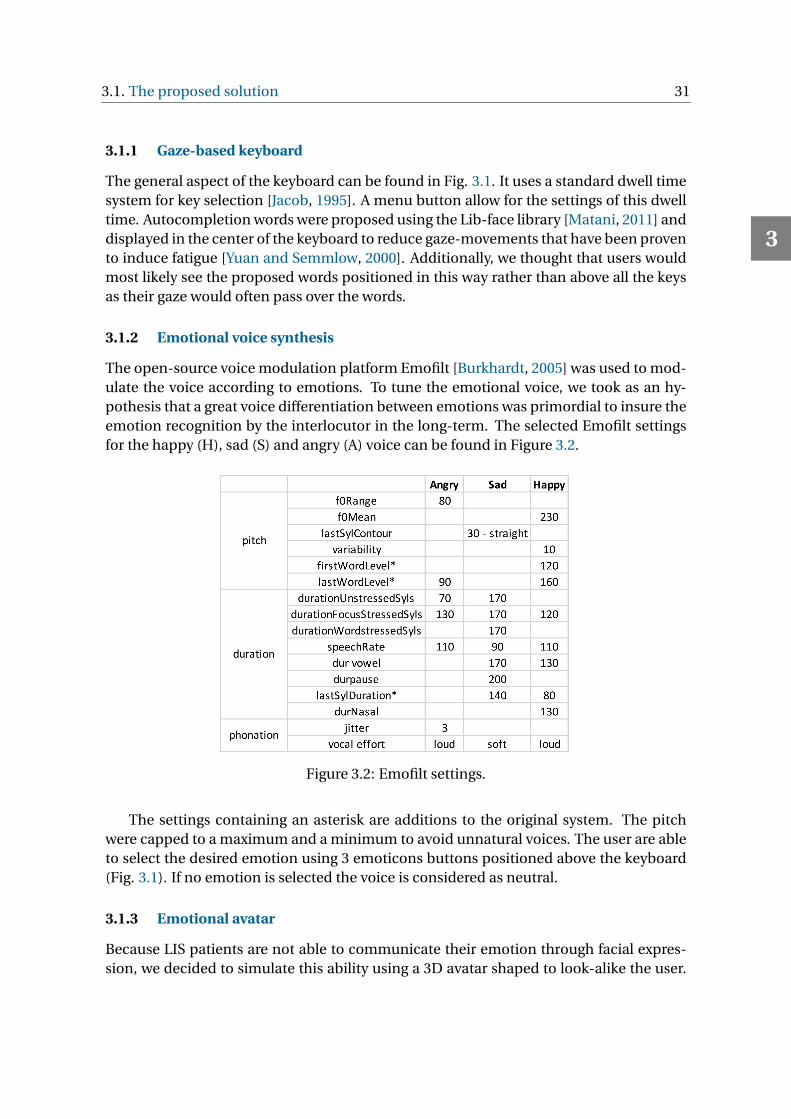
3.1. The proposed solution 31
3.1.1 Gaze-based keyboard
The general aspect of the keyboard can be found in Fig. 3.1. It uses a standard dwell timesystem for key selection [Jacob, 1995]. A menu button allow for the settings of this dwelltime. Autocompletion words were proposed using the Lib-face library [Matani, 2011] anddisplayed in the center of the keyboard to reduce gaze-movements that have been provento induce fatigue [Yuan and Semmlow, 2000]. Additionally, we thought that users wouldmost likely see the proposed words positioned in this way rather than above all the keysas their gaze would often pass over the words.
3.1.2 Emotional voice synthesis
The open-source voice modulation platform Emofilt [Burkhardt, 2005] was used to mod-ulate the voice according to emotions. To tune the emotional voice, we took as an hy-pothesis that a great voice differentiation between emotions was primordial to insure theemotion recognition by the interlocutor in the long-term. The selected Emofilt settingsfor the happy (H), sad (S) and angry (A) voice can be found in Figure 3.2.
Figure 3.2: Emofilt settings.
The settings containing an asterisk are additions to the original system. The pitchwere capped to a maximum and a minimum to avoid unnatural voices. The user are ableto select the desired emotion using 3 emoticons buttons positioned above the keyboard(Fig. 3.1). If no emotion is selected the voice is considered as neutral.
3.1.3 Emotional avatar
Because LIS patients are not able to communicate their emotion through facial expres-sion, we decided to simulate this ability using a 3D avatar shaped to look-alike the user.
3
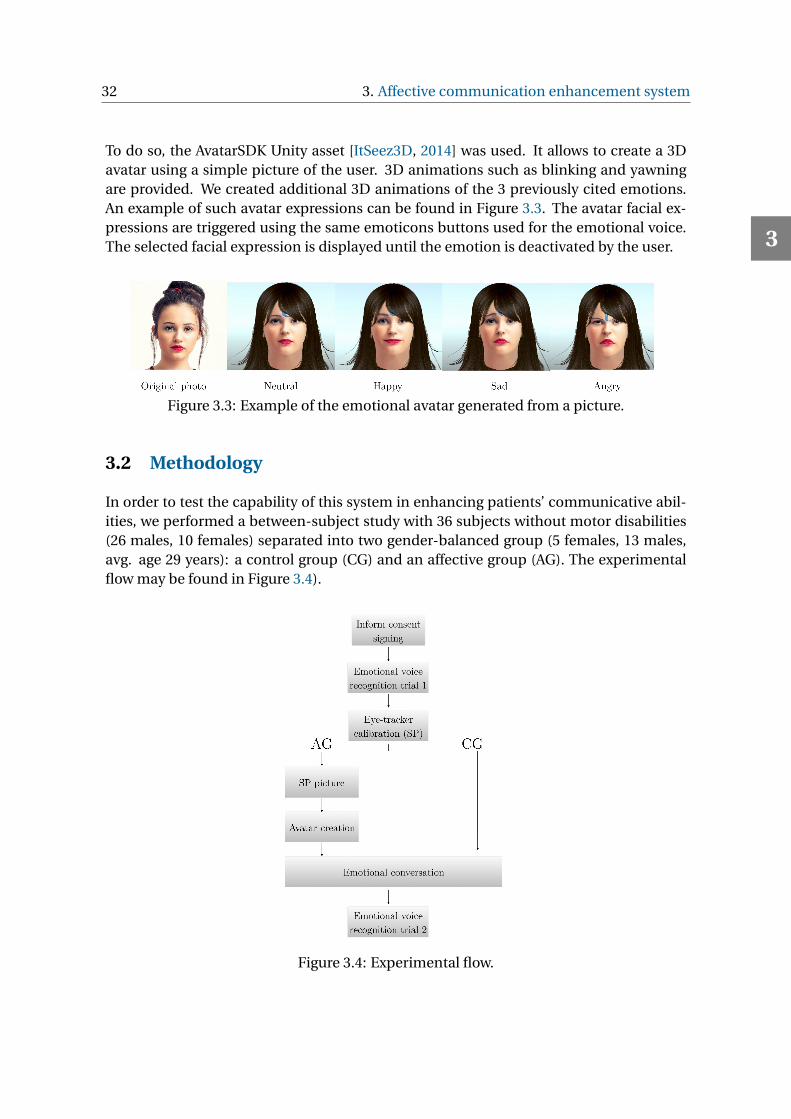
32 3. Affective communication enhancement system
To do so, the AvatarSDK Unity asset [ItSeez3D, 2014] was used. It allows to create a 3Davatar using a simple picture of the user. 3D animations such as blinking and yawningare provided. We created additional 3D animations of the 3 previously cited emotions.An example of such avatar expressions can be found in Figure 3.3. The avatar facial ex-pressions are triggered using the same emoticons buttons used for the emotional voice.The selected facial expression is displayed until the emotion is deactivated by the user.
Figure 3.3: Example of the emotional avatar generated from a picture.
3.2 Methodology
In order to test the capability of this system in enhancing patients’ communicative abil-ities, we performed a between-subject study with 36 subjects without motor disabilities(26 males, 10 females) separated into two gender-balanced group (5 females, 13 males,avg. age 29 years): a control group (CG) and an affective group (AG). The experimentalflow may be found in Figure 3.4).
Figure 3.4: Experimental flow.
3
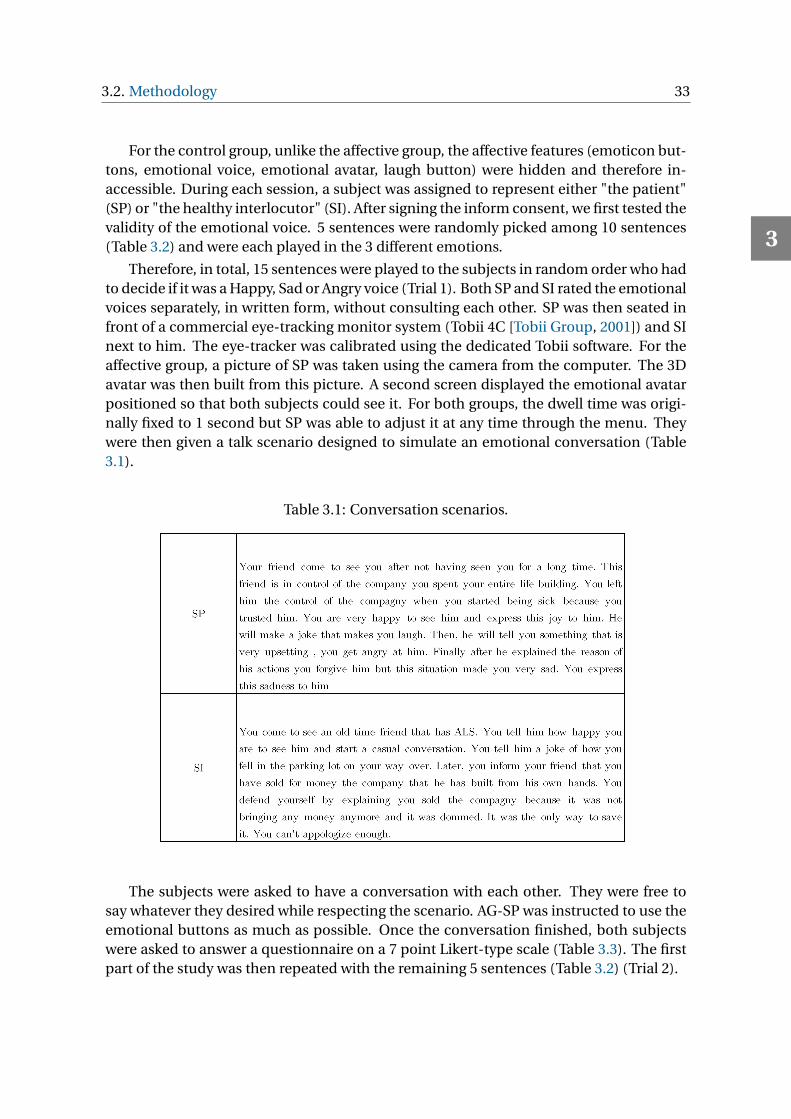
3.2. Methodology 33
For the control group, unlike the affective group, the affective features (emoticon but-tons, emotional voice, emotional avatar, laugh button) were hidden and therefore in-accessible. During each session, a subject was assigned to represent either "the patient"(SP) or "the healthy interlocutor" (SI). After signing the inform consent, we first tested thevalidity of the emotional voice. 5 sentences were randomly picked among 10 sentences(Table 3.2) and were each played in the 3 different emotions.
Therefore, in total, 15 sentences were played to the subjects in random order who hadto decide if it was a Happy, Sad or Angry voice (Trial 1). Both SP and SI rated the emotionalvoices separately, in written form, without consulting each other. SP was then seated infront of a commercial eye-tracking monitor system (Tobii 4C [Tobii Group, 2001]) and SInext to him. The eye-tracker was calibrated using the dedicated Tobii software. For theaffective group, a picture of SP was taken using the camera from the computer. The 3Davatar was then built from this picture. A second screen displayed the emotional avatarpositioned so that both subjects could see it. For both groups, the dwell time was origi-nally fixed to 1 second but SP was able to adjust it at any time through the menu. Theywere then given a talk scenario designed to simulate an emotional conversation (Table3.1).
Table 3.1: Conversation scenarios.
The subjects were asked to have a conversation with each other. They were free tosay whatever they desired while respecting the scenario. AG-SP was instructed to use theemotional buttons as much as possible. Once the conversation finished, both subjectswere asked to answer a questionnaire on a 7 point Likert-type scale (Table 3.3). The firstpart of the study was then repeated with the remaining 5 sentences (Table 3.2) (Trial 2).
3
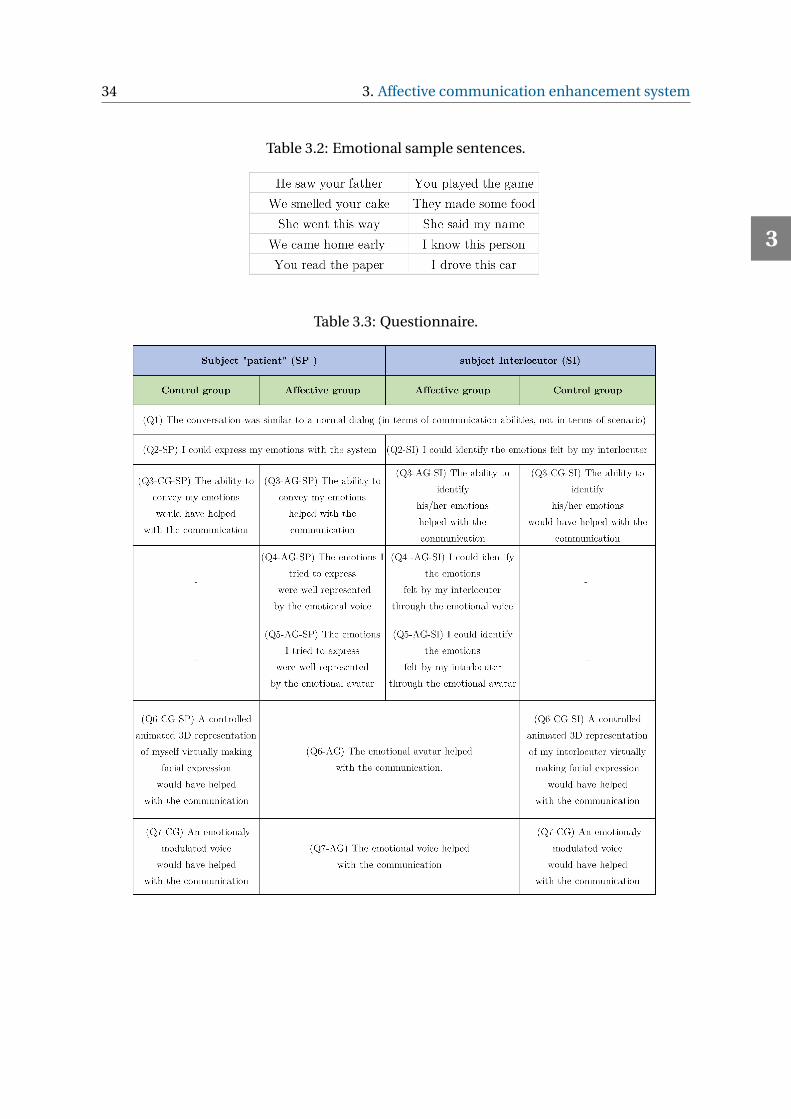
34 3. Affective communication enhancement system
Table 3.2: Emotional sample sentences.
Table 3.3: Questionnaire.
3
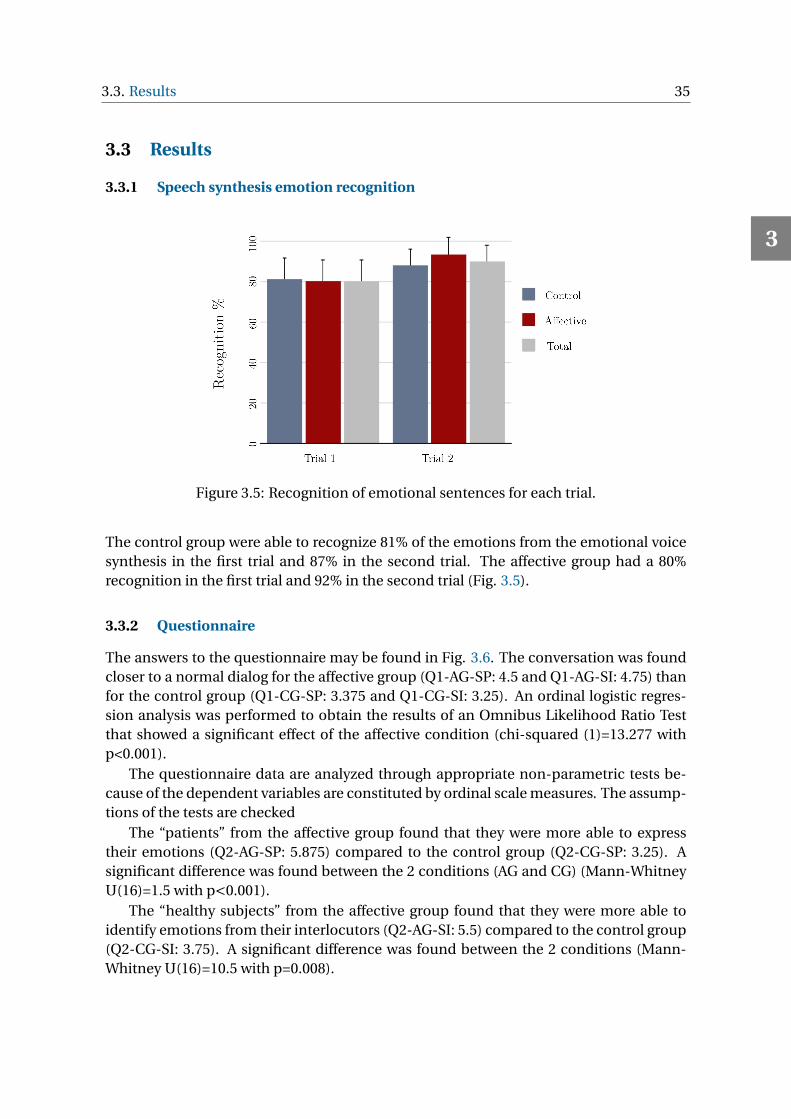
3.3. Results 35
3.3 Results
3.3.1 Speech synthesis emotion recognition
Figure 3.5: Recognition of emotional sentences for each trial.
The control group were able to recognize 81% of the emotions from the emotional voicesynthesis in the first trial and 87% in the second trial. The affective group had a 80%recognition in the first trial and 92% in the second trial (Fig. 3.5).
3.3.2 Questionnaire
The answers to the questionnaire may be found in Fig. 3.6. The conversation was foundcloser to a normal dialog for the affective group (Q1-AG-SP: 4.5 and Q1-AG-SI: 4.75) thanfor the control group (Q1-CG-SP: 3.375 and Q1-CG-SI: 3.25). An ordinal logistic regres-sion analysis was performed to obtain the results of an Omnibus Likelihood Ratio Testthat showed a significant effect of the affective condition (chi-squared (1)=13.277 withp<0.001).
The questionnaire data are analyzed through appropriate non-parametric tests be-cause of the dependent variables are constituted by ordinal scale measures. The assump-tions of the tests are checked
The “patients” from the affective group found that they were more able to expresstheir emotions (Q2-AG-SP: 5.875) compared to the control group (Q2-CG-SP: 3.25). Asignificant difference was found between the 2 conditions (AG and CG) (Mann-WhitneyU(16)=1.5 with p<0.001).
The “healthy subjects” from the affective group found that they were more able toidentify emotions from their interlocutors (Q2-AG-SI: 5.5) compared to the control group(Q2-CG-SI: 3.75). A significant difference was found between the 2 conditions (Mann-Whitney U(16)=10.5 with p=0.008).
3
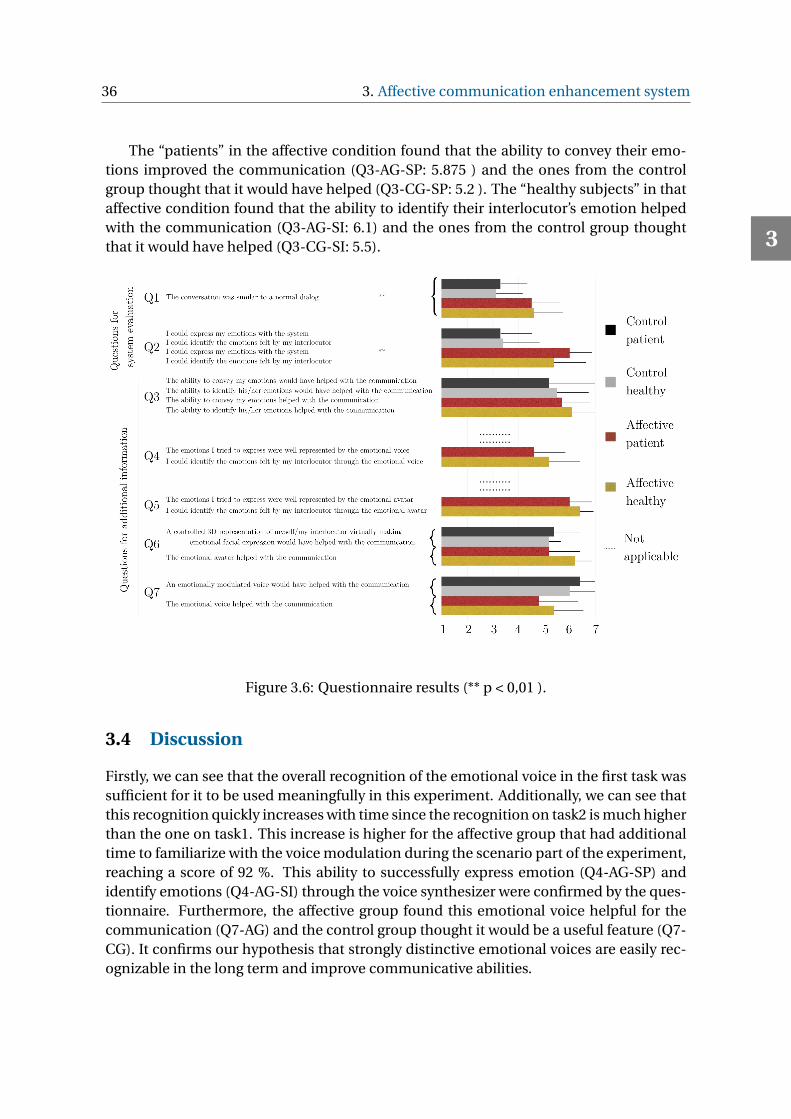
36 3. Affective communication enhancement system
The “patients” in the affective condition found that the ability to convey their emo-tions improved the communication (Q3-AG-SP: 5.875 ) and the ones from the controlgroup thought that it would have helped (Q3-CG-SP: 5.2 ). The “healthy subjects” in thataffective condition found that the ability to identify their interlocutor’s emotion helpedwith the communication (Q3-AG-SI: 6.1) and the ones from the control group thoughtthat it would have helped (Q3-CG-SI: 5.5).
Figure 3.6: Questionnaire results (** p < 0,01 ).
3.4 Discussion
Firstly, we can see that the overall recognition of the emotional voice in the first task wassufficient for it to be used meaningfully in this experiment. Additionally, we can see thatthis recognition quickly increases with time since the recognition on task2 is much higherthan the one on task1. This increase is higher for the affective group that had additionaltime to familiarize with the voice modulation during the scenario part of the experiment,reaching a score of 92 %. This ability to successfully express emotion (Q4-AG-SP) andidentify emotions (Q4-AG-SI) through the voice synthesizer were confirmed by the ques-tionnaire. Furthermore, the affective group found this emotional voice helpful for thecommunication (Q7-AG) and the control group thought it would be a useful feature (Q7-CG). It confirms our hypothesis that strongly distinctive emotional voices are easily rec-ognizable in the long term and improve communicative abilities.
3
3.5. Conclusions 37
The emotional avatar was found to successfully represent the desired emotion (Q5-AG-SP), to provide easily identifiable emotions (Q5-AG-SI) and to help with the com-munication in the affective group (Q6-AG). It is interesting to notice the affective groupfound the avatar to be more helpful for the communication than the voice (Q6-AG andQ7-AG).
Overall, the communication was found more natural to the affective group than tothe control group (Q1). SP subjects found that they were more able to express their emo-tion (Q2-SP). It highlights the positive impacts of both the emotional avatar and the emo-tional voice on the communication which is confirmed by Q3-AG-SP and Q3-AG-SI. Con-currently, the control group that did not have access to any emotional tools, also foundthat the ability to express emotion (Q3-CG-SP) and to identify emotion (Q3-CG-SI) wouldhave helped with the communication.
It is interesting to notice that in the affective group the “healthy” subject ranked higherhow much the avatar and the voice helped (Q6-AG-SI and Q7-AG-SI ) compared to the“patient” (Q6-AG-SP and Q7-AG-SP). This highlights the fact that this system is particu-larly useful for the interlocutor who is the one looking for cues about the emotion felt bythe patient. The “patients” subjects often stated that they did not really pay real attentionto the avatar as they were focused on writing on the keyboard.
3.5 Conclusions
People in LIS have limited methods to communicate. In the past decades, technologyhave greatly improve their quality of life by providing a great range of communicationtools. However AAC are still constrained in communicating words and rarely includeways of expressing emotions. This work proposes to study the impact of expressing emo-tion on communicative ability for LIS patients. To do so we created a platform that allowsthe user to select an emotion between happy, angry and sad. A 3D avatar representing theuser was then animated according to the selected emotion along-side with an emotion-ally modulated voice synthesis. This system was tested by 36 subjects who were suc-cessfully able to recognize the emotions from the voice modulation and the avatar. Theyfound that the two emotional tools helped with the communication as they were moreable to convey and identify emotions. This system is available in open-source [Larradet,2019b].
While today the avatar is only expressing fixed emotions it shows the need for extend-ing AAC tools to include more non-verbal communication cues. This system could inthe future include additional animations such as lip synchronization, visual reaction todetected skin temperature (sweating, shivering), additional gesture (wink, hand gesture,eye raised...), additional type of sounds ("waaaw", "uhm uhm", "oooh"). The avatar couldtherefore become an extensive communication tool as well as a quick visual aid for the in-terlocutor, family and caregiver to understand the internal state of the patient. Advancedavatar control could be used for instance to perform art [Aparicio, 2015].
While voice modulation and facial expression are the most common in non-verbalcommunication, other types of natural communication may be simulated such as physi-
3

38 3. Affective communication enhancement system
cal contact. Indeed, systems such as heating wristbands placed on family and loved onesmay be activated by the patient using gaze control and therefore convey the idea of armtouching.
In the future, the emotion could be automatically detected for instance from physi-ological signals [Jerritta et al., 2011]. However it would raise the concern of the patients’willingness to constantly display their emotion without a way to hide their true feelingsfrom their interlocutor [Petronio and Bantz, 1991]. This capability to detect users’ emo-tions will be further discussed in next chapters. This study was accepted to the HCI in-ternational 2020 conference.
3
4INVESTIGATING EMOTIONAL DATA COLLECTION
METHODOLOGIES
The capability to detect patient’s emotions from physiological signals would allow to greatlyimprove the system presented in the previous chapter. For this reason, this particular topicwas investigated further in this chapter.
Emotion, mood and stress recognition (EMSR), whether it is from facial expression[Fasel and Luettin, 2003], speech [El Ayadi et al., 2011], full-body motion [Castellano et al.,2007], words [Hirschberg and Manning, 2015], physiological signals [Jerritta et al., 2011]or other data type, have been studied intensively for at least two decades. While all thepreviously cited techniques follow similar methodologies in terms of data collection, thischapter will focus on physiological signals.
One of the biggest challenges in EMSR consists in collecting and annotating data forboth model creation and testing [Constantine and Hajj, 2012]. This chapter will addressthis challenge by providing a thorough discussion of existing methodologies for physiologi-cal dataset creation as well as proposing evaluation criteria and tools to compare datasets.
4.1 Introduction
The studies on EMSR can be differentiated according to the type of emotion theory adoptedto characterize the data. While using labels such as anger, disgust, fear, joy, sadness, andsurprise [Lazarus and Lazarus, 1991] present the advantages of being meaningful to non-expert , many researchers use multi-dimensional models such as valence-arousal [Rus-sell, 1980] or pleasure-arousal-dominance [Mehrabian, 1996] to classify emotions in atwo 2 or 3 dimensional space. Valence is defined as the perception of a situation frompositive to negative, the arousal can refer to a level of physiological activation ( fromcalm to agitated), and the dominance defines how in control an individual is toward asituation. Finally, appraisal theories such as the OCC model [Ortony et al., 1990] or IraRoseman’s theory [Roseman, 1984], which explain emotion elicitation in terms of cogni-tive evaluations of significant events, are more rarely used in recognition and detectionstudies.
39
40 4. Investigating emotional data collection methodologies
As for the classification method, most works use approaches based on feature extrac-tion and machine learning (e.g., support vector machine [Hovsepian et al., 2015], deci-sion trees [Plarre et al., 2011]), while the solutions based on expertise knowledge (e.g.,rule-based) are more rare. Recently deep learning methods were proposed (e.g., convo-lutional deep belief networks [Ranganathan et al., 2016]). The later are, however, limitedby the capacity to collect a sufficient amount of data. EMSR methods might be user-dependent (or person-specific), built from the data of a specific user to detect his/herown emotions, or user-independent, built from the data of multiple users to detect emo-tions of any user.
Building physiological datasets for EMSR was usually performed in laboratory set-tings by purposely inducing emotions to subjects at specific time intervals. It allows ex-perimenters to control the stimuli and reduce the number of contextual factors that mayinfluence the subjects’ reactions.
On the other hand, to this date, only few studies have attempted to create real-life(not induced) emotions datasets, i.e., collections of affect-related data, outside of the lab,in reaction to everyday events. In the literature, the terms “in the wild” [Dhall et al., 2013],“in the fray” [Healey et al., 2010], and “in real-life” [Devillers et al., 2005] are used to de-scribe such approach, in which the experimenters do not control the emotion elicitationprocess. In this methodology, the subjects can be, for example, monitored during theireveryday activities over long time periods in order to collect their most natural reactions.This kind of study can either be ambulatory [Healey et al., 2010] where people are ableto move freely, or static where people experience real-life emotions but constrained toa specific location (e.g., a desk in a workplace [McDuff et al., 2012] or during an exam[Melillo et al., 2011]). This similarity to real-life settings defines the ecological validity ofa study.
In this chapter, the term EMSR for “real-life applications” includes methods able torecognize emotions, moods or stress, in the wild (not induced, elicited by real-life events) with the potential to enable many useful application. The previously described sys-tem aiming at detecting real-life emotions for patients with Locked-in Syndrome is anexample of such real-life application. In this case, there is no need to be concern aboutambulatory challenges. However, the difficulty to find patients in this state might com-promise the capacity to build a successful EMSR model. Additionally, it might be tiring ordifficult to involve such patients in early testing stages of the model. In those cases pre-liminary testing might be required with subjects without motor impairments. Such datamodel creation and testing would then need to be performed in ambulatory settings toaccess the subjects’ emotions during their daily lives.
The perspective of the researcher or software developer who needs to create a newdataset to be used for EMSR was taken. The categories to consider when building “real-life application”-focused datasets in-the-wild are discussed. Differences between eachdata collection method are presented, their advantages, challenges and limitations. Inparticular, the focus was made on physiological data collection outside of the laboratoryas it represents a way to access people’s emotional state without invading their privacy(e.g., using video, audio) and without being cumbersome (thanks to the minimal size of
4
4.2. Existing affect related data collection techniques 41
the sensors). The set of guidelines presented may be used by future researchers aimingto build physiological datasets for EMSR. Furthermore, a method to assess the readinessof specific studies toward ambulatory real-life applications is presented.
In order to facilitate the comparison and evaluation of such studies, a visual method isintroduced to assess EMSR studies in terms of their ability to be used in real-life applica-tions. This graphical method is used to visually compare the existing dataset collectionsof the literature and their different approaches. Then, an overview of the studies that tooka step toward EMSR using physiological data outside of the laboratory is presented. Thegraphical assessment focusses on studies including detection or classification methods(not the one presenting observations only).
The main contributions are:
• while other recent surveys on EMSR make a census by considering expressive modal-ity (e.g., Castellano et al. [2007]; El Ayadi et al. [2011]), this work brings a new pointof view to the field by focusing on methodologies for physiological data collectionto build real-life EMSR applications in the wild,
• A complete list of criteria is proposed as well as a novel graphical aid to compareand evaluate any existing and future affect-related datasets in terms of their appli-cability in real-life applications.
The currently (1st July 2019) available commercial devices for ambulatory physiolog-ical data collecting are listed in the annex.
4.2 Existing affect related data collection techniques
While here the focus is given to physiological signals, established techniques to elicitemotions are common for all types of signals [Kory and D’Mello, 2015]. Techniques de-scribed in the literature to collect emotion-related data provide a great range of realismand genuineness of emotions.
Some techniques involved the participation of actors simulating emotions throughfacial expressions and speech [Wallbott and Scherer, 1986]. In this case, however, there isno emotion elicitation protocol as the participants do not actually feel any affective statebut only pretend to react in an emotional way.
Several researchers, however, claim that the spontaneous expressions of emotions aredifferent from the acted ones [Ekman, 1997]. For instance, Hoque et al. [2012] found sig-nificant differences in facial expressions of acted and induced emotions. Consequently,the EMSR models trained on acted data may not work properly in real-life applications.Using actors is not viable for physiological signals collections as people may not simulatetheir own physiological reaction.
Actors may use some techniques such as the Stanislavski’s method [Cole, 1995] tomake their acting more natural. Other methods of self-induction of emotion were usedin scientific literature: e.g., in Vrana [1993] where subjects are asked to apply the guidedimagery method that consist in thinking about specific situations to elicit emotions. Ret-rospection is another commonly used techniques where participants are asked to narrate
4
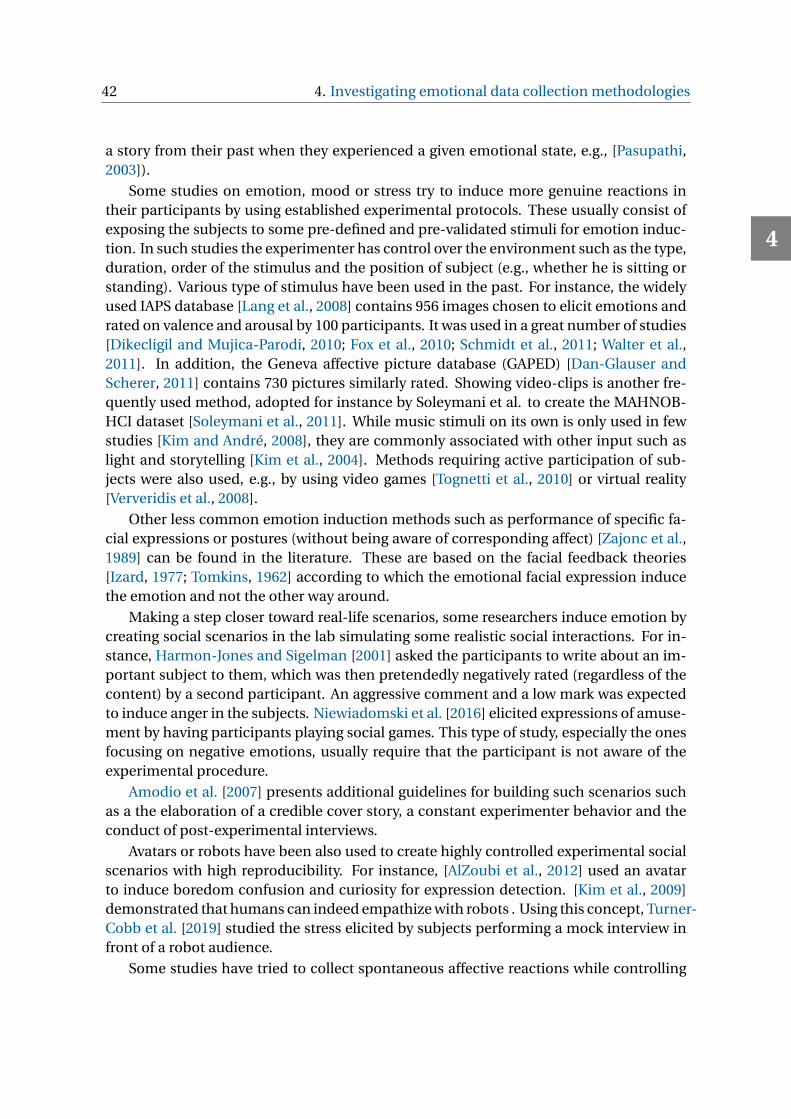
42 4. Investigating emotional data collection methodologies
a story from their past when they experienced a given emotional state, e.g., [Pasupathi,2003]).
Some studies on emotion, mood or stress try to induce more genuine reactions intheir participants by using established experimental protocols. These usually consist ofexposing the subjects to some pre-defined and pre-validated stimuli for emotion induc-tion. In such studies the experimenter has control over the environment such as the type,duration, order of the stimulus and the position of subject (e.g., whether he is sitting orstanding). Various type of stimulus have been used in the past. For instance, the widelyused IAPS database [Lang et al., 2008] contains 956 images chosen to elicit emotions andrated on valence and arousal by 100 participants. It was used in a great number of studies[Dikecligil and Mujica-Parodi, 2010; Fox et al., 2010; Schmidt et al., 2011; Walter et al.,2011]. In addition, the Geneva affective picture database (GAPED) [Dan-Glauser andScherer, 2011] contains 730 pictures similarly rated. Showing video-clips is another fre-quently used method, adopted for instance by Soleymani et al. to create the MAHNOB-HCI dataset [Soleymani et al., 2011]. While music stimuli on its own is only used in fewstudies [Kim and André, 2008], they are commonly associated with other input such aslight and storytelling [Kim et al., 2004]. Methods requiring active participation of sub-jects were also used, e.g., by using video games [Tognetti et al., 2010] or virtual reality[Ververidis et al., 2008].
Other less common emotion induction methods such as performance of specific fa-cial expressions or postures (without being aware of corresponding affect) [Zajonc et al.,1989] can be found in the literature. These are based on the facial feedback theories[Izard, 1977; Tomkins, 1962] according to which the emotional facial expression inducethe emotion and not the other way around.
Making a step closer toward real-life scenarios, some researchers induce emotion bycreating social scenarios in the lab simulating some realistic social interactions. For in-stance, Harmon-Jones and Sigelman [2001] asked the participants to write about an im-portant subject to them, which was then pretendedly negatively rated (regardless of thecontent) by a second participant. An aggressive comment and a low mark was expectedto induce anger in the subjects. Niewiadomski et al. [2016] elicited expressions of amuse-ment by having participants playing social games. This type of study, especially the onesfocusing on negative emotions, usually require that the participant is not aware of theexperimental procedure.
Amodio et al. [2007] presents additional guidelines for building such scenarios suchas a the elaboration of a credible cover story, a constant experimenter behavior and theconduct of post-experimental interviews.
Avatars or robots have been also used to create highly controlled experimental socialscenarios with high reproducibility. For instance, [AlZoubi et al., 2012] used an avatarto induce boredom confusion and curiosity for expression detection. [Kim et al., 2009]demonstrated that humans can indeed empathize with robots . Using this concept, Turner-Cobb et al. [2019] studied the stress elicited by subjects performing a mock interview infront of a robot audience.
Some studies have tried to collect spontaneous affective reactions while controlling
4
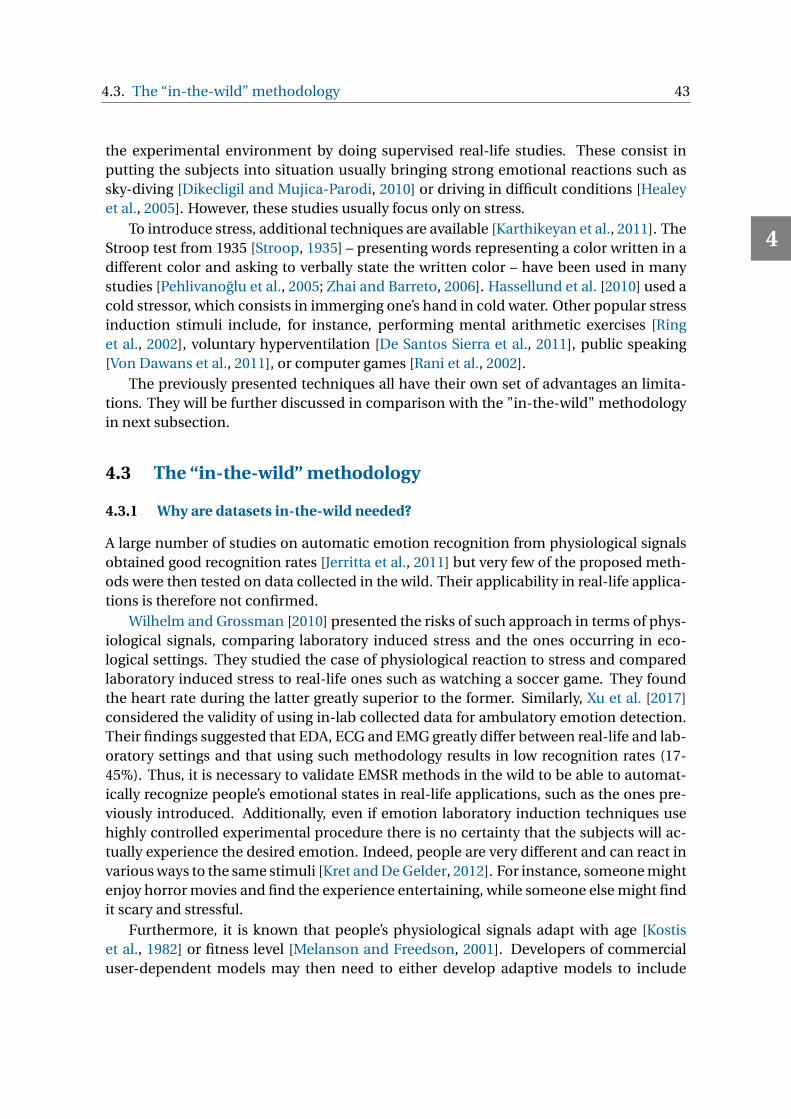
4.3. The “in-the-wild” methodology 43
the experimental environment by doing supervised real-life studies. These consist inputting the subjects into situation usually bringing strong emotional reactions such assky-diving [Dikecligil and Mujica-Parodi, 2010] or driving in difficult conditions [Healeyet al., 2005]. However, these studies usually focus only on stress.
To introduce stress, additional techniques are available [Karthikeyan et al., 2011]. TheStroop test from 1935 [Stroop, 1935] – presenting words representing a color written in adifferent color and asking to verbally state the written color – have been used in manystudies [Pehlivanoglu et al., 2005; Zhai and Barreto, 2006]. Hassellund et al. [2010] used acold stressor, which consists in immerging one’s hand in cold water. Other popular stressinduction stimuli include, for instance, performing mental arithmetic exercises [Ringet al., 2002], voluntary hyperventilation [De Santos Sierra et al., 2011], public speaking[Von Dawans et al., 2011], or computer games [Rani et al., 2002].
The previously presented techniques all have their own set of advantages an limita-tions. They will be further discussed in comparison with the "in-the-wild" methodologyin next subsection.
4.3 The “in-the-wild” methodology
4.3.1 Why are datasets in-the-wild needed?
A large number of studies on automatic emotion recognition from physiological signalsobtained good recognition rates [Jerritta et al., 2011] but very few of the proposed meth-ods were then tested on data collected in the wild. Their applicability in real-life applica-tions is therefore not confirmed.
Wilhelm and Grossman [2010] presented the risks of such approach in terms of phys-iological signals, comparing laboratory induced stress and the ones occurring in eco-logical settings. They studied the case of physiological reaction to stress and comparedlaboratory induced stress to real-life ones such as watching a soccer game. They foundthe heart rate during the latter greatly superior to the former. Similarly, Xu et al. [2017]considered the validity of using in-lab collected data for ambulatory emotion detection.Their findings suggested that EDA, ECG and EMG greatly differ between real-life and lab-oratory settings and that using such methodology results in low recognition rates (17-45%). Thus, it is necessary to validate EMSR methods in the wild to be able to automat-ically recognize people’s emotional states in real-life applications, such as the ones pre-viously introduced. Additionally, even if emotion laboratory induction techniques usehighly controlled experimental procedure there is no certainty that the subjects will ac-tually experience the desired emotion. Indeed, people are very different and can react invarious ways to the same stimuli [Kret and De Gelder, 2012]. For instance, someone mightenjoy horror movies and find the experience entertaining, while someone else might findit scary and stressful.
Furthermore, it is known that people’s physiological signals adapt with age [Kostiset al., 1982] or fitness level [Melanson and Freedson, 2001]. Developers of commercialuser-dependent models may then need to either develop adaptive models to include
4
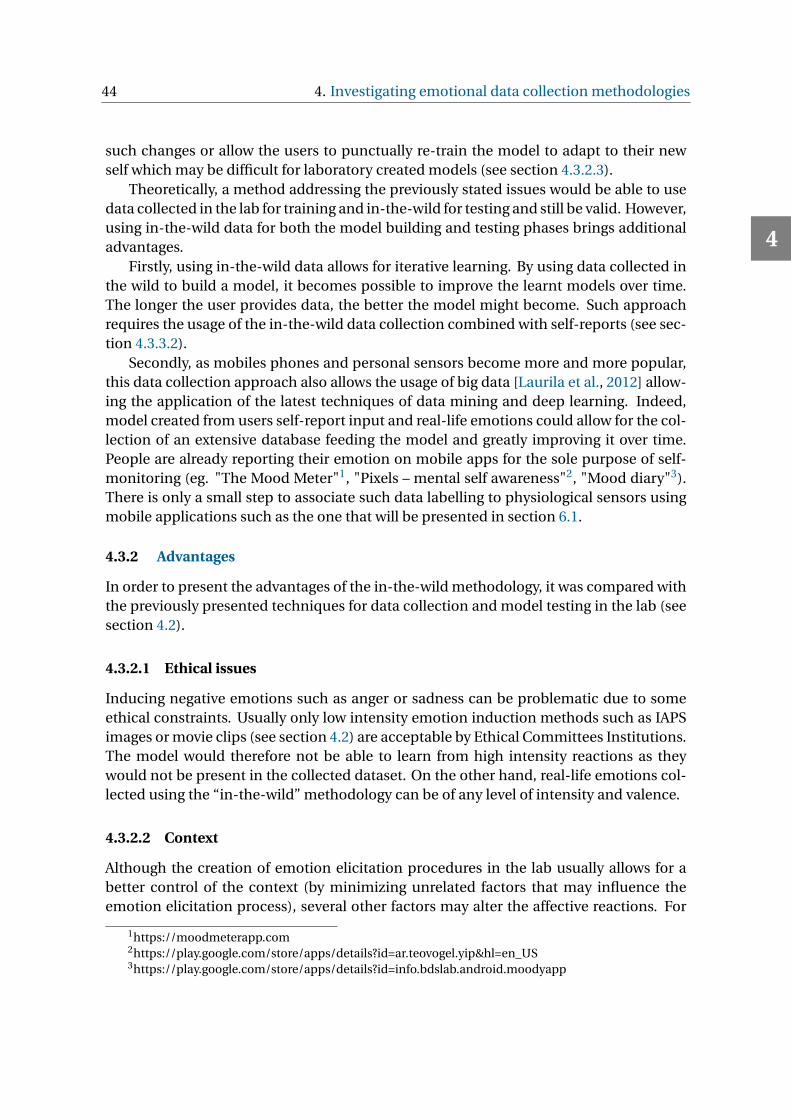
44 4. Investigating emotional data collection methodologies
such changes or allow the users to punctually re-train the model to adapt to their newself which may be difficult for laboratory created models (see section 4.3.2.3).
Theoretically, a method addressing the previously stated issues would be able to usedata collected in the lab for training and in-the-wild for testing and still be valid. However,using in-the-wild data for both the model building and testing phases brings additionaladvantages.
Firstly, using in-the-wild data allows for iterative learning. By using data collected inthe wild to build a model, it becomes possible to improve the learnt models over time.The longer the user provides data, the better the model might become. Such approachrequires the usage of the in-the-wild data collection combined with self-reports (see sec-tion 4.3.3.2).
Secondly, as mobiles phones and personal sensors become more and more popular,this data collection approach also allows the usage of big data [Laurila et al., 2012] allow-ing the application of the latest techniques of data mining and deep learning. Indeed,model created from users self-report input and real-life emotions could allow for the col-lection of an extensive database feeding the model and greatly improving it over time.People are already reporting their emotion on mobile apps for the sole purpose of self-monitoring (eg. "The Mood Meter"1, "Pixels – mental self awareness"2, "Mood diary"3).There is only a small step to associate such data labelling to physiological sensors usingmobile applications such as the one that will be presented in section 6.1.
4.3.2 Advantages
In order to present the advantages of the in-the-wild methodology, it was compared withthe previously presented techniques for data collection and model testing in the lab (seesection 4.2).
4.3.2.1 Ethical issues
Inducing negative emotions such as anger or sadness can be problematic due to someethical constraints. Usually only low intensity emotion induction methods such as IAPSimages or movie clips (see section 4.2) are acceptable by Ethical Committees Institutions.The model would therefore not be able to learn from high intensity reactions as theywould not be present in the collected dataset. On the other hand, real-life emotions col-lected using the “in-the-wild” methodology can be of any level of intensity and valence.
4.3.2.2 Context
Although the creation of emotion elicitation procedures in the lab usually allows for abetter control of the context (by minimizing unrelated factors that may influence theemotion elicitation process), several other factors may alter the affective reactions. For
1https://moodmeterapp.com2https://play.google.com/store/apps/details?id=ar.teovogel.yip&hl=en_US3https://play.google.com/store/apps/details?id=info.bdslab.android.moodyapp
4
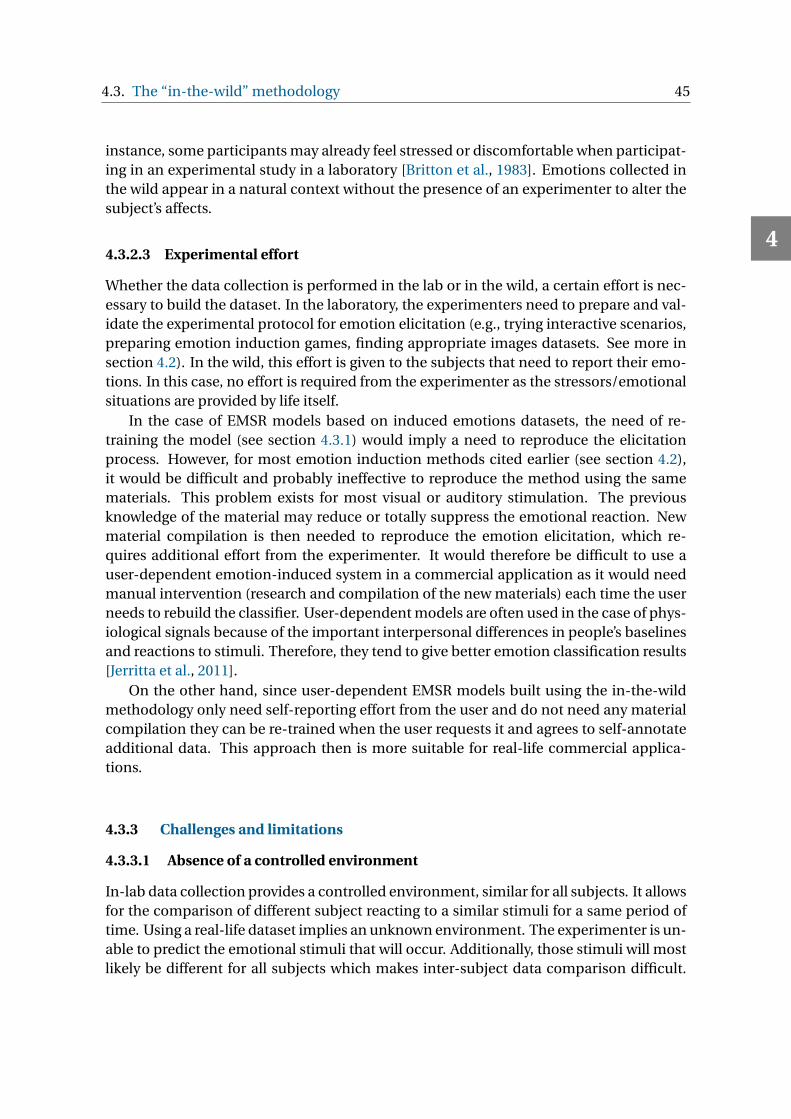
4.3. The “in-the-wild” methodology 45
instance, some participants may already feel stressed or discomfortable when participat-ing in an experimental study in a laboratory [Britton et al., 1983]. Emotions collected inthe wild appear in a natural context without the presence of an experimenter to alter thesubject’s affects.
4.3.2.3 Experimental effort
Whether the data collection is performed in the lab or in the wild, a certain effort is nec-essary to build the dataset. In the laboratory, the experimenters need to prepare and val-idate the experimental protocol for emotion elicitation (e.g., trying interactive scenarios,preparing emotion induction games, finding appropriate images datasets. See more insection 4.2). In the wild, this effort is given to the subjects that need to report their emo-tions. In this case, no effort is required from the experimenter as the stressors/emotionalsituations are provided by life itself.
In the case of EMSR models based on induced emotions datasets, the need of re-training the model (see section 4.3.1) would imply a need to reproduce the elicitationprocess. However, for most emotion induction methods cited earlier (see section 4.2),it would be difficult and probably ineffective to reproduce the method using the samematerials. This problem exists for most visual or auditory stimulation. The previousknowledge of the material may reduce or totally suppress the emotional reaction. Newmaterial compilation is then needed to reproduce the emotion elicitation, which re-quires additional effort from the experimenter. It would therefore be difficult to use auser-dependent emotion-induced system in a commercial application as it would needmanual intervention (research and compilation of the new materials) each time the userneeds to rebuild the classifier. User-dependent models are often used in the case of phys-iological signals because of the important interpersonal differences in people’s baselinesand reactions to stimuli. Therefore, they tend to give better emotion classification results[Jerritta et al., 2011].
On the other hand, since user-dependent EMSR models built using the in-the-wildmethodology only need self-reporting effort from the user and do not need any materialcompilation they can be re-trained when the user requests it and agrees to self-annotateadditional data. This approach then is more suitable for real-life commercial applica-tions.
4.3.3 Challenges and limitations
4.3.3.1 Absence of a controlled environment
In-lab data collection provides a controlled environment, similar for all subjects. It allowsfor the comparison of different subject reacting to a similar stimuli for a same period oftime. Using a real-life dataset implies an unknown environment. The experimenter is un-able to predict the emotional stimuli that will occur. Additionally, those stimuli will mostlikely be different for all subjects which makes inter-subject data comparison difficult.
4
46 4. Investigating emotional data collection methodologies
For instance, two subjects might both experience happiness but one due to an acceptedpublication and the other because of a conversation with a friend. While both eventswill be labelled as "happy", they are elicited in very different environments. Because ofthis unpredictability and uncontrolled experimental procedure, the experimenter is un-aware of the emotions felt by the subjects and therefore this information needs to bedetermined. Several ways of acquiring such information will be presented in the nextparagraph.
4.3.3.2 Emotion labelling
There are 2 main methods to acquire the emotions labels, starting and end times in un-controlled environments:
Self-report
The most commonly used data labelling technique is achieved by the subjects them-selves. In this method, participants are asked to report the time in which they felt anemotion, which emotion, and, eventually, some other parameters such as its intensity orcontext. This emotion self-labelling may be done following different types of emotiontheories such as writing labels or estimating valence and arousal. However, it may be dif-ficult for the subjects to estimate valence and arousal as it is a concept non-expert areusually unfamiliar with. Consequently their report might not be reliable. Indeed, Healeyet al. [2010] found that subjects’ valence and arousal reports did not correlate with theircomments. They identified that subjects misunderstood the functionality of the 2 dimen-sional map. Techniques such as the SAM images [Bradley and Lang, 1994] makes this pro-cess more accessible to the subjects. Asking the subjects to self-report emotions by usingthe labels such as “angry” or “sad” can also lead to problems. Indeed, Widen and Russell[2010] highlights the need for a distinction between “descriptive definition” of emotion,as it is used in everyday life, and a “prescriptive definition”, as it is used by the scientificcommunity. The concept of an emotional label might differ from the one understoodby the experimenter. Similarly, the label concepts might differ within participants due todifferent gender [Kret and De Gelder, 2012], or cultural differences [Mesquita et al., 1997].All these differences in labels conception might alter the capacity to recognize emotionsfor user-independent model. A user-dependent model might not be affected as the con-ception of a label would most likely stay constant for each subject. This problem will beaddressed in section 6.1 using an appraisal theory-based questionnaire tree to help thesubjects providing precise information about the emotion elicitation stimuli, without theneed for them to choose a specific emotion label.
Oversight is another problem derived from subject labelling their own data. One maynot immediately report the felt emotion and then, simply forget to do it. Depending onthe type of application and model used, rating the emotion in terms of intensity mightalso be necessary. However, subjects might underrate their emotions for several reasonssuch as ego (e.g., subjects may not admit that they felt sad or scared), or time (emotion
4
4.3. The “in-the-wild” methodology 47
self-reports tend to be less valid when performed long time after the experienced emo-tion [Mauss and Robinson, 2009]).
Furthermore, user-given annotation of emotions beginning and end times might notbe precise. Subjects will tend to give approximated times, making the exact data labellingmore difficult. Instead of asking the subject to voluntary report emotions when they feelthem, some studies use alternative electronic systems that prompt the user to report hisemotions at regular intervals [Plarre et al., 2011]. This solution is based on the EcologicalMomentary Assessment (EMA, in Shiffman et al. [2008]) designed to improve typical self-reports during clinic visits. It is not clear, however, what is the optimal frequency of suchprompting. Asking too often can easily become bothersome to the subjects and there-fore affect the emotional data collection. Asking too rarely would increase the chanceof the subject lowering the strength rating of the emotion [Mauss and Robinson, 2009],or forgetting a previously felt emotions. Schmidt et al. [2018] advise to perform an EMAevery 2 hours or five times a day coupled with a possibility to manually report emotions.Asking at a regular time interval would allow to know the emotions felt the last hour forinstance but it would not provide the precise time it happened. This technique may bemore appropriate to collect information about moods which are longer and less momen-tary [Mauss and Robinson, 2009], rather than emotions that are usually short [Gray et al.,2001]. Indeed, Robinson and Clore [2002] states that increasing the time between twoconsecutive prompts increases the chances to collect semantic (related to beliefs andgeneralizations about oneself) memory of emotions instead of episodic (related to a par-ticular event) ones. Accessing events details of the day may improve the recall [Lang et al.,1980; Robinson and Clore, 2001]. However, the retrospective thinking about too manydetails may disproportionately bias the emotional report [Kahneman et al., 1999]. Askingsubjects details about their daily lives might not meet the ethical regulations as it wouldprovide an easy way to recognize the subject. Asking the subjects to mentally reproducethe event without giving details to the experimenter might be a solution [Clore et al.,2001]
The other issue linked with emotion labelling is the amount of information not givenby the subjects. Researchers may have research constraints for a particular study. Forinstance, a study might focus on happiness and anger and therefore only ask the partici-pants to report those events. However, the subjects will still experience the whole rangeof emotion. Additionally, subjects might do unrelated actions such as smoking or drink-ing which may not be in the scope of the study and therefore would not be reported bythe participants. These other emotions or actions might however have an impact on thestudied signal (for example coffee intake can affect HR [Green and Suls, 1996]). A real-life emotion study will therefore include parts of the data affected by unannotated eventswhich makes machine learning training difficult. Schmidt et al. [2018] recommends tocollect in parallel the physical activities and the sleep quality of the subjects and to con-duct data-driven screenings interviews with the participants to gather additional contextinformation.
4
48 4. Investigating emotional data collection methodologies
Expert labelling
This method consists in having one or several experts examining the data and usinghis/their knowledge and expertise to annotate emotions. This can be done either us-ing the same physiological signal(s) as the one that will be used in the EMSR model [Yinet al., 2006] or using a different type of signal (e.g., facial expressions, body movements).For instance, Healey et al. [2005] conducted an experiment where both physiological sig-nals and video were recorded in the wild. Video was analyzed by experts to validate thedata labels given by the subjects and physiological data was used later on to create anemotion detection model.
However, this method often requires multimodal synchronized recordings which canbe difficult in-the-wild. Additionally, the modalities which are most often used by ex-perts when performing the annotation, such as video or audio, are usually the most in-trusive. Additionally, even experts may still misclassify or miss some emotional states ofsubjects. If more than one expert is used to perform the annotation, they may disagree onperceived emotions. Thus, a combination of expert labelling with user post-experimentcross-validation is often a preferred solution [Yin et al., 2006].
4.3.3.3 Ambulatory
When it comes to real-life dataset collection, there is a distinction to be made betweenambulatory and static studies. Indeed, as previously stated, real-life emotions happenat unpredictable times. Collecting of such data often implies long-term studies duringwhich people can more freely. This implies a necessity for ambulatory systems able tocollect physiological signals while the person is moving. Some existing studies focused onreal-life emotions felt by the subject but they limited the collection to a specific physicalspace, e.g., to a desk space [Roseway et al., 2015]. This type of studies will be referred as“static studies” (as opposed to ambulatory ones previously mentioned).
In ambulatory studies, more issues need to be addressed. First of all, the devicesrecording the data must be both mobile and comfortable as they must allow the subjectsto move freely for extended periods of time. This is the main reason why studies usingHR or GSR are among the most common real life emotion recognition studies as somesignals such as EEG would be difficult to achieve without very bothersome wearable de-vices. There are a few devices available in the commerce for physiological signals-basedambulatory studies which are presented in the supplementary materials. Some studieschose to develop their own device [Wilhelm et al., 2005].
The choice of sensors for ambulatory studies presents another challenge. While it isimportant to choose small sensors to improve the wearability of the device, some sen-sors might be more affected by movement than others. For instance, in order to calculateHR, it is possible to use small PPG sensors, from which the BVP is read, the InterBeat In-terval (IBI) calculated and the HR extracted. This technique is reliable but very sensitiveto sensor movement. Another solution to measure HR is to use ECG. Chest ECG, whilebeing a much more invasive sensor provides more precise data which are less affectedby movement [Ge et al., 2016]. The choice between the two is then a compromise be-
4
4.4. The “in-the-wild” methodology 49
tween wearability and accuracy. There are techniques in order to improve the accuracyof the IBI calculated from PPG [Torres et al., 2016]. The most common is the use of a3D accelerometer to detect movement [Lee et al., 2010]. Furthermore, HR is also greatlyaffected by physical activity (e.g., sports). It is advised to remove from the physiologicaldata the periods of such activities, so that they would not be mistaken by an emotion.Once again accelerometer may help detecting such activities with some limitation, forinstance stairs may increase HR and may not be easily detectable by the accelerometer[Foerster et al., 1999]. Additional elements may need to be considered when conductingambulatory studies such as EDA asymmetry. Indeed, while EDA signal might be foundsimilar in both side in the lab, Picard et al. [2016] noticed differences in EDA measures inleft and right wrists during ambulatory studies. They concluded that the right wrist ac-quired stronger signal overtime. It is therefore recommended to place this sensor in theright side in the field.
4.3.3.4 Long-term experiment
In-the-wild conditions implies an unpredictability of the emotions. It is uncertain howmany time the subject will experience a certain emotion during the study or if they willexperience it at all. However, some techniques exist to increase the likelihood of the emo-tion during the collection period. For instance, some subjects might know specific eventin their future that are likely to trigger emotions (e.g., public presentation, importantmeeting, job interview). Performing the data collection during this specific period wouldincrease the likelihood of collecting the desired emotional data without providing anycertainty. Studies involving multiple emotions might require all subject to experience allstudied emotions (e.g., anger, sadness, happiness, frustration) during the data collectionperiod. While it would be unlikely to happen in a short period of time (a day), increasingthe duration of the experiment (several days, week, months), would increase the chancesof having subjects experiencing a specific emotion or a different ranges of emotions. Thismethod will however, greatly impact the length of the study or the number of subjects.Additionally, the wearability of the device chosen will impact the possible length of thestudy. Indeed, the more comfortable the device, the more it would be acceptable for asubject to wear it over a long period of time.
4.3.3.5 Lack of databases
Considering the great differences between people when it comes to emotion, it is im-portant to word with data from a large number of subjects. For this reason, open accessdatabases are very valuable for EMSR research. However, while induced emotion-basedopen access databases exist [Abadi et al., 2015; Dan-Glauser and Scherer, 2011; Koelstraet al., 2011; Sharma et al., 2018], to the best of our knowledge, there is no open accessdatabase of emotional data collected in the wild. Such database was built during thisresearch (see section 6.2) using the protocol that will be presented in section 6.1
4
50 4. Investigating emotional data collection methodologies
4.4 The GARAFED method
In this subsection, a new assessment of the data collection methodologies is presentedbased on their readiness toward ambulatory real-life application usage: GARAFED(Graphical Assessment of Real-life Application-Focused Emotional Dataset).
Eight criteria were selected, each containing sub-classes that allow assessing the dis-tance from the ambulatory real-life EMSR goal. While specific application cases mighthave different needs and requirements (e.g., work focusing on detecting stress during anexam would not need an ambulatory setup), the assessment will be made on the capacityfor the proposed method to be used in any ambulatory real-life applications.
In addition, even though other methodology choices must be considered for EMSRresearch ( e.g., emotion labelling methods, see sections 4.2 and 4.3), they are not includedin this assessment model. This is because such choices cannot be ranked from the mostto the least suitable for real-life applications as each decision is equally valid. Here, whencategories ranges include numbers (e.g., between 3 days and 7 days), the lower number(e.g., 3 days) is included and the higher number (e.g., 7 days) is not included.
4.4.1 The GARAFED categories
• Emotion origin
As previously presented, there are many possible origins for the emotions. Theorigin of the emotion may be induced by an experimenter, or, in real-life, can becaused by other agents, events or objects [Ortony et al., 1990]. By collecting data insituations closer to ecological settings the creation of a more appropriate dataset isinsured. Here the following emotion origin possibilities are defined.
1. Simulation of the emotion (e.g., actors).
2. Induction of emotions in-lab (e.g., movies, IAPS images).
3. Induction of emotions through supervised real activities (e.g., car driving, sky-diving).
4. Real-life emotions, static monitoring.
5. Real-life emotions, ambulatory monitoring.
• Invasiveness
The size and portability of the system used to collect data in the wild impacts howeasy it is for the subjects to carry it for longer periods and thus the possibility toconduct longer experiments. This invasiveness factor has been separated in 4 cat-egories from "Non portable" to "Portable and non-invasive".
1. Non portable: the system needs to be linked to a power supply and/or requirethe experimenter intervention, such as sampling of salivary cortisol level.
4
4.4. The GARAFED method 51
2. Portable and highly invasive: the system is heavy bulky or invasive. It mayinclude sensors such as nasal respiration sensors. It is not possible to wearit for many hours a day without it being uncomfortable for the subject. (ex:Vu-ams [De Geus and Van Doornen, 1996]).
3. Portable and slightly invasive: The system is light. It can be worn for severalhours a day but it is noticeable and/or potentially uncomfortable for the sub-ject after a certain time. (e.g., Shimmer3 GSR+ Unit ).
4. Portable and non-invasive: The system is light and non-invasive. Others maynot notice the device. It is similar to a commonly worn object such as a watch,a belt etc. (e.g., Empatica E4 ).
• Privacy
The input data used to classify emotions can infringe the privacy of the subject.Indeed, input data such as video, voice or calendar activity would give the exper-imenter access to very personal data. They may also allow for the identificationof the subjects. While the focus is given to physiological data that are usually non-intrusive, other studies were also consider, using physiological data combined withother types of data which may be intrusive. Papers will be classified using the 4 cat-egories bellow.
1. Intrusive data: personal data or data that allows identification.
2. Non-intrusive data: non personal and does not allow identification.
• Number of experimental days
Collecting data over many days increases the probability to gather data in a varietyof situations and environments. It therefore ensures the creation and validation ofa better model.
The number of collection days in papers in the first paragraph in 4.5.1.1 and the firstparagraph in 4.5.2.1 were aggregated. From this data, 4 quartiles were extractedthat will be used to separate each papers proposing an EMSR model into the fol-lowing 4 categories.
1. Less than 3 days.
2. Between 3 days and 7 days.
3. Between 7 days and 34 days.
4. 34 days or more.
For papers giving a range of experiment days (e.g., 4 to 6 days), the maximum timewas taken (e.g., 6 days).
4
52 4. Investigating emotional data collection methodologies
• Number of hours per day
The number of hours for data collection per day also greatly impacts the value ofthe dataset. Indeed, physiological signals may vary with the time of day [Gjoreskiet al., 2017]. Here again the same studies were used to extract the 4 quartiles thatwill represent the following 4 categories.
1. Less than 4h a day.
2. Between 4h and 8h a day.
3. Between 8h and 16h a day.
4. 16 hours a day or more.
For papers giving a range of experiment time per days, (e.g., 12to 14 hours) themaximum time was taken (e.g., 14h)..
• Number of subjects
As previously stated, emotions are experienced very differently by people. In orderto validate an emotion recognition system, it is necessary to test it on as many sub-jects as possible. Similarly, the studies quartiles were used to create the followingcategories.
1. Less than 6 subjects.
2. 6 to 12 subjects.
3. 12 to 24 subjects.
4. 24 subjects or more.
Quartiles were averaged to the superior round number.
These criteria represent a data collection paradigm that can be used to build an emo-tion recognition model usable in any ambulatory real-life application, such as the onespreviously presented. Ideally, the data collection would be done using small non-invasiveand non-intrusive sensors, with a model close to reality and tested in real life. Such studyshould be done for an extensive time with a great number of subjects to prove its efficacy.
4
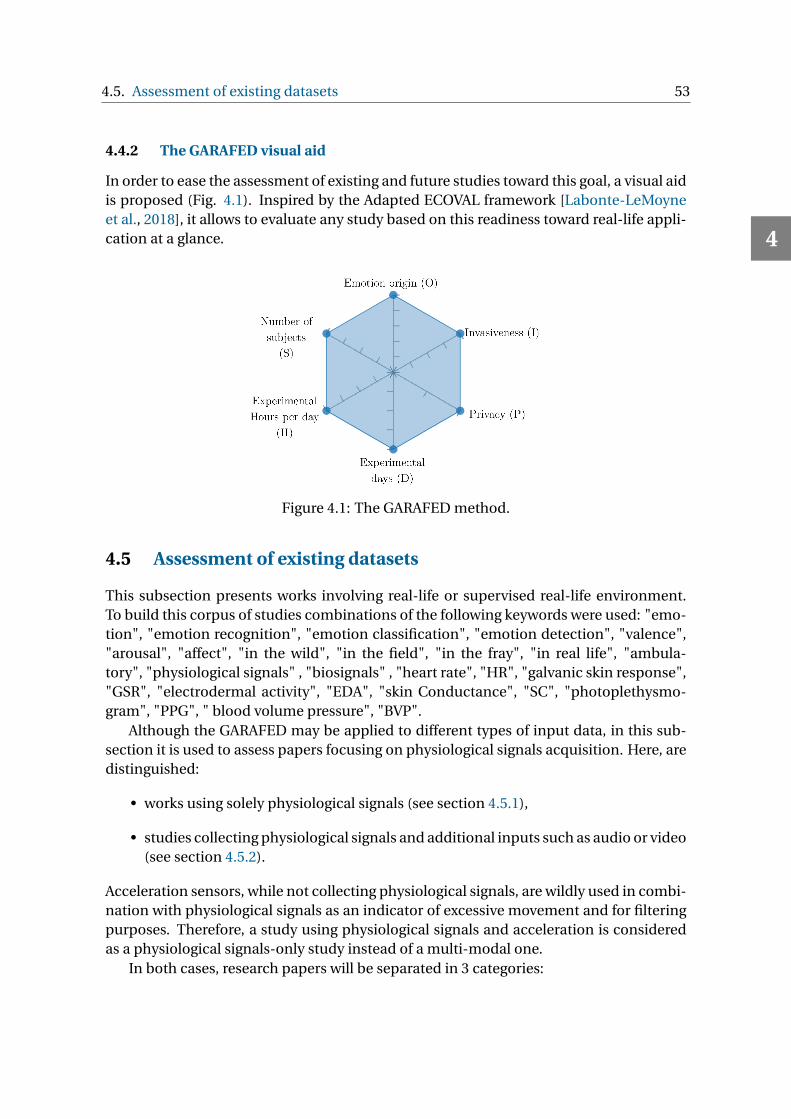
4.5. Assessment of existing datasets 53
4.4.2 The GARAFED visual aid
In order to ease the assessment of existing and future studies toward this goal, a visual aidis proposed (Fig. 4.1). Inspired by the Adapted ECOVAL framework [Labonte-LeMoyneet al., 2018], it allows to evaluate any study based on this readiness toward real-life appli-cation at a glance.
Figure 4.1: The GARAFED method.
4.5 Assessment of existing datasets
This subsection presents works involving real-life or supervised real-life environment.To build this corpus of studies combinations of the following keywords were used: "emo-tion", "emotion recognition", "emotion classification", "emotion detection", "valence","arousal", "affect", "in the wild", "in the field", "in the fray", "in real life", "ambula-tory", "physiological signals" , "biosignals" , "heart rate", "HR", "galvanic skin response","GSR", "electrodermal activity", "EDA", "skin Conductance", "SC", "photoplethysmo-gram", "PPG", " blood volume pressure", "BVP".
Although the GARAFED may be applied to different types of input data, in this sub-section it is used to assess papers focusing on physiological signals acquisition. Here, aredistinguished:
• works using solely physiological signals (see section 4.5.1),
• studies collecting physiological signals and additional inputs such as audio or video(see section 4.5.2).
Acceleration sensors, while not collecting physiological signals, are wildly used in combi-nation with physiological signals as an indicator of excessive movement and for filteringpurposes. Therefore, a study using physiological signals and acceleration is consideredas a physiological signals-only study instead of a multi-modal one.
In both cases, research papers will be separated in 3 categories:
4
54 4. Investigating emotional data collection methodologies
• First of all, the studies proposing an EMSR detection or classification method testedin the wild.
• Secondarily, the empirical studies exploring physiological signals reactions to emo-tions, mood or stress in real-life settings without proposing a detection or classifi-cation method.
• Lastly, the studies using laboratory knowledge or real-life established methods torecognize emotions, mood or stress for specific real-life applications.
Only the first category will be displayed using the previously presented visualizationmethod as only them are proposing an EMSR method. The second category representthe step before EMSR and may help researcher wishing to build such method by provid-ing empirical information about emotions. The third category represents the step afterEMSR as it presents studies using established models for specific applications. A list ofthe currently (2019) available devices to perform such ambulatory studies are availablein the supplementary materials.
4.5.1 Physiological signals-based studies
Here, the studies focusing solely on physiological signals will be presented.
4.5.1.1 In-the-wild detection and classification studies
Studies on stress
.
4
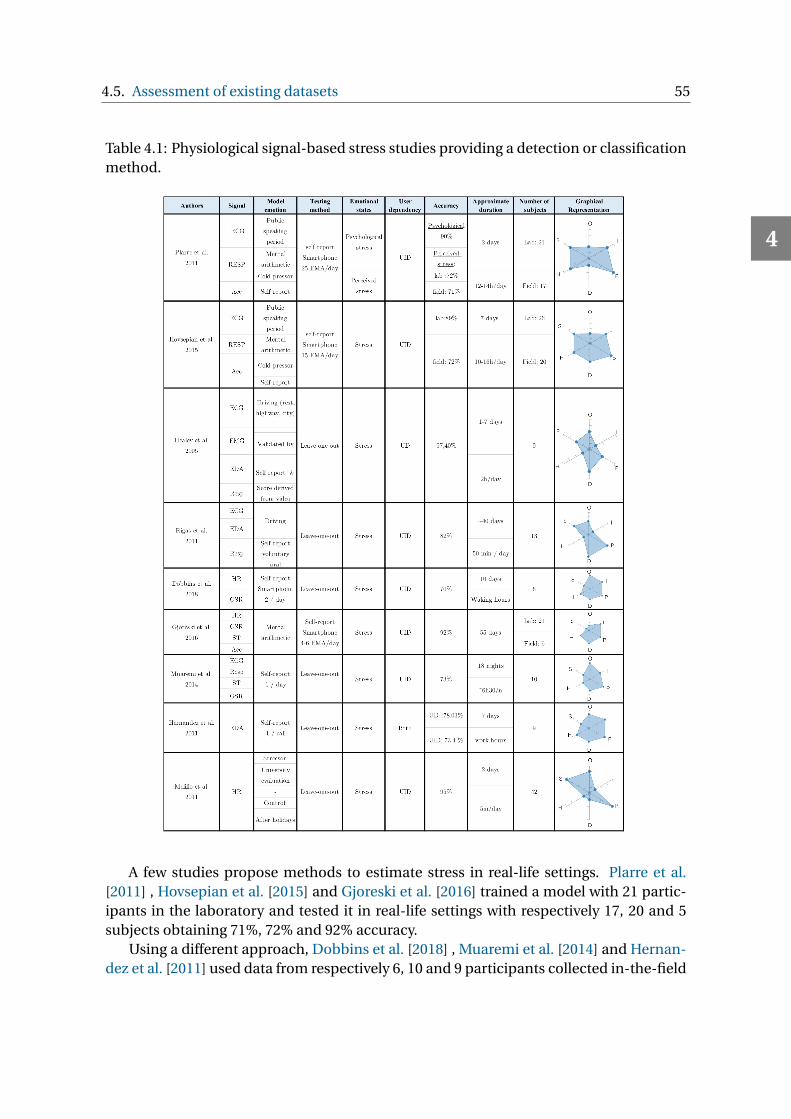
4.5. Assessment of existing datasets 55
Table 4.1: Physiological signal-based stress studies providing a detection or classificationmethod.
A few studies propose methods to estimate stress in real-life settings. Plarre et al.[2011] , Hovsepian et al. [2015] and Gjoreski et al. [2016] trained a model with 21 partic-ipants in the laboratory and tested it in real-life settings with respectively 17, 20 and 5subjects obtaining 71%, 72% and 92% accuracy.
Using a different approach, Dobbins et al. [2018] , Muaremi et al. [2014] and Hernan-dez et al. [2011] used data from respectively 6, 10 and 9 participants collected in-the-field
4
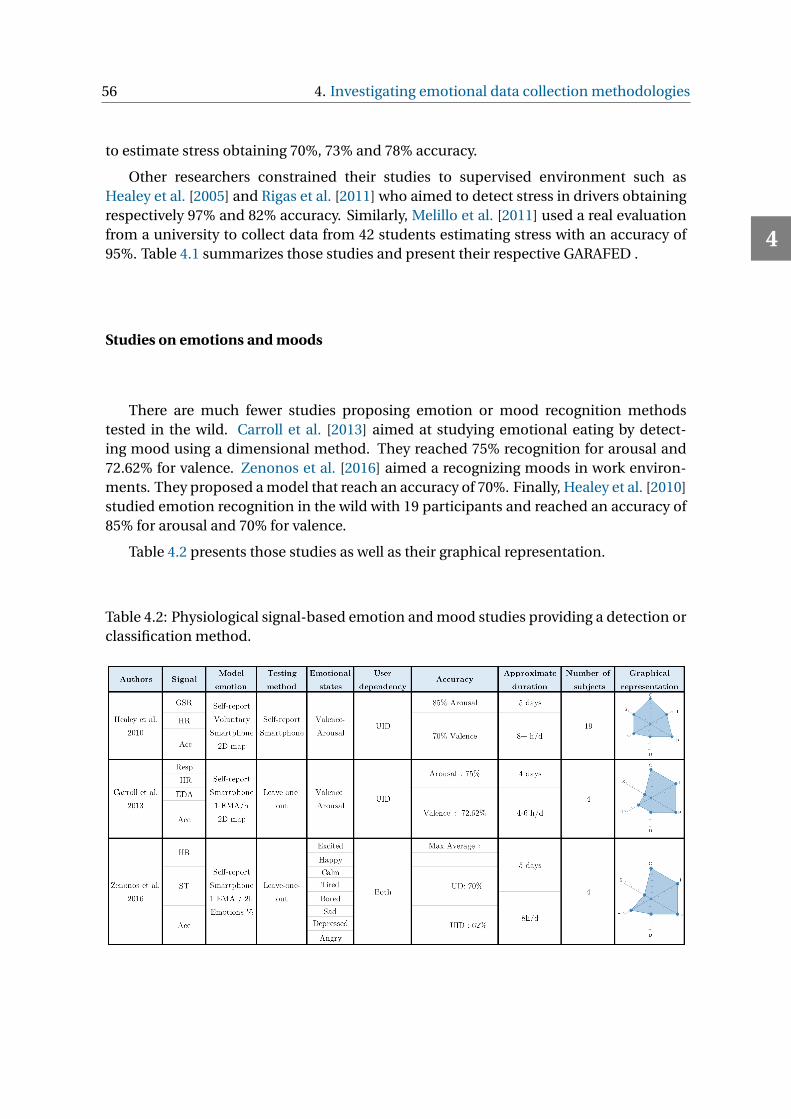
56 4. Investigating emotional data collection methodologies
to estimate stress obtaining 70%, 73% and 78% accuracy.
Other researchers constrained their studies to supervised environment such asHealey et al. [2005] and Rigas et al. [2011] who aimed to detect stress in drivers obtainingrespectively 97% and 82% accuracy. Similarly, Melillo et al. [2011] used a real evaluationfrom a university to collect data from 42 students estimating stress with an accuracy of95%. Table 4.1 summarizes those studies and present their respective GARAFED .
Studies on emotions and moods
.
There are much fewer studies proposing emotion or mood recognition methodstested in the wild. Carroll et al. [2013] aimed at studying emotional eating by detect-ing mood using a dimensional method. They reached 75% recognition for arousal and72.62% for valence. Zenonos et al. [2016] aimed a recognizing moods in work environ-ments. They proposed a model that reach an accuracy of 70%. Finally, Healey et al. [2010]studied emotion recognition in the wild with 19 participants and reached an accuracy of85% for arousal and 70% for valence.
Table 4.2 presents those studies as well as their graphical representation.
Table 4.2: Physiological signal-based emotion and mood studies providing a detection orclassification method.
4
4.5. Assessment of existing datasets 57
4.5.1.2 Empirical studies in real-life environment
Studies on stress
.
Most studies on stress in the wild are preliminary studies and present findings andobservations of physiological reactions to natural stressors without proposing a detectionmodel.
The disparities in stress experiences in-lab compared to in-the-wild are assessed byDikecligil and Mujica-Parodi [2010] that compared HRV obtained from 33 subjects during2 short term laboratory measurements (aversive then benign IAPS images), a long-termhospitalized monitoring (24h) and a supervised real-life study (180 min including a first-time tandem skydive). They found strongly predictive correlations between laboratoryresults and supervised real-life study.
Similar supervised real-life studies were conducted notably by Fenz and Epstein[1967] that monitored HR and respiration in 10 novice and 10 experienced parachutistsduring a jump. They found a sharp rise in physiological activity in novice jumpers and aninverted V-shaped curve in experimented ones. Wilhelm and Roth [1998] similarly stud-ied HR and respiration during a plane trip with flight phobics which pointed additionalHR as a reflection of participants anxiety. Kusserow et al. [2012b] present their findingwhen monitoring people in the wild as well as a musician, an Olympic ski jumper and apublic speaker. They found correlations between HR and stress arousal. Baek et al. [2009]tried to evaluate stress in driving using a custom car equipped with sensors (ECG, GSR,Resp). In this supervised real-life study, temperature, noise, time of day (night vs day-time) and simultaneous arithmetic calculations separated were altered to create stressfulenvironments. They found meaningful changes in physiological signals during simu-lated stress environment. Different physiological reactions in participants were obtainedfor the same stressor. This highlights individual differences in reaction to emotional trig-gers.
Ambulatory in-the-wild studies were also conducted. Verkuil et al. [2016] proposedan in-lab calibration using rest, standing cycling and stairs to improve the capabilities ofcategorizing metabolic and non-metabolic HRV reductions in the wild (24h) using ECGand 3D accelerometer. Additional HRV was found associated with negative affect andworrying. Johnston and Anastasiades [1990] studied the relation between HR and stress,arousal and time pressure in real life with 32 subjects for 24h. No significant relationwere found between the HR and the emotional state in most participants. A significantrelation was obtained only in a small subset of subjects which were found more anxious,angry and with higher systolic blood pressure. Ramos et al. [2014] attempted to simu-late out-of-the lab environment by introducing movements. They found a great need indetection methodologies adapted to real-life applications and assessed the possibility touse detection of physical activity to improve stress detection increasing stress classifica-tion (f-measure improved of 130%).
4
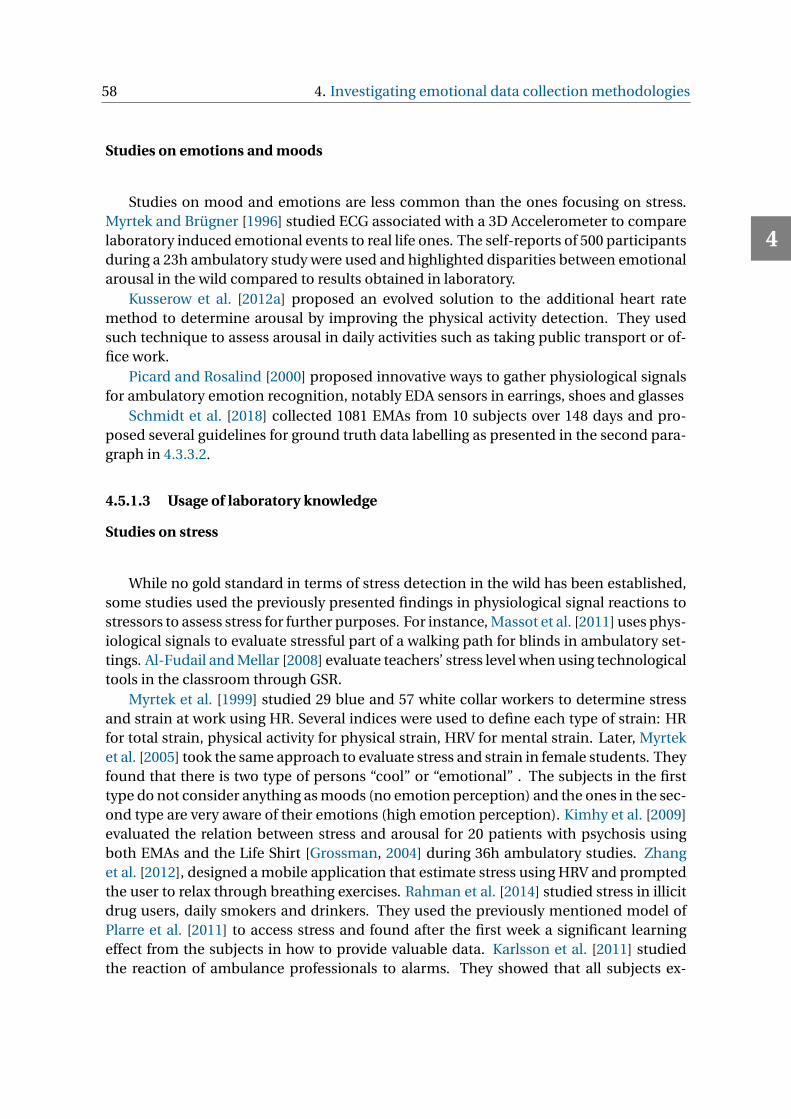
58 4. Investigating emotional data collection methodologies
Studies on emotions and moods
.Studies on mood and emotions are less common than the ones focusing on stress.
Myrtek and Brügner [1996] studied ECG associated with a 3D Accelerometer to comparelaboratory induced emotional events to real life ones. The self-reports of 500 participantsduring a 23h ambulatory study were used and highlighted disparities between emotionalarousal in the wild compared to results obtained in laboratory.
Kusserow et al. [2012a] proposed an evolved solution to the additional heart ratemethod to determine arousal by improving the physical activity detection. They usedsuch technique to assess arousal in daily activities such as taking public transport or of-fice work.
Picard and Rosalind [2000] proposed innovative ways to gather physiological signalsfor ambulatory emotion recognition, notably EDA sensors in earrings, shoes and glasses
Schmidt et al. [2018] collected 1081 EMAs from 10 subjects over 148 days and pro-posed several guidelines for ground truth data labelling as presented in the second para-graph in 4.3.3.2.
4.5.1.3 Usage of laboratory knowledge
Studies on stress
.While no gold standard in terms of stress detection in the wild has been established,
some studies used the previously presented findings in physiological signal reactions tostressors to assess stress for further purposes. For instance, Massot et al. [2011] uses phys-iological signals to evaluate stressful part of a walking path for blinds in ambulatory set-tings. Al-Fudail and Mellar [2008] evaluate teachers’ stress level when using technologicaltools in the classroom through GSR.
Myrtek et al. [1999] studied 29 blue and 57 white collar workers to determine stressand strain at work using HR. Several indices were used to define each type of strain: HRfor total strain, physical activity for physical strain, HRV for mental strain. Later, Myrteket al. [2005] took the same approach to evaluate stress and strain in female students. Theyfound that there is two type of persons “cool” or “emotional” . The subjects in the firsttype do not consider anything as moods (no emotion perception) and the ones in the sec-ond type are very aware of their emotions (high emotion perception). Kimhy et al. [2009]evaluated the relation between stress and arousal for 20 patients with psychosis usingboth EMAs and the Life Shirt [Grossman, 2004] during 36h ambulatory studies. Zhanget al. [2012], designed a mobile application that estimate stress using HRV and promptedthe user to relax through breathing exercises. Rahman et al. [2014] studied stress in illicitdrug users, daily smokers and drinkers. They used the previously mentioned model ofPlarre et al. [2011] to access stress and found after the first week a significant learningeffect from the subjects in how to provide valuable data. Karlsson et al. [2011] studiedthe reaction of ambulance professionals to alarms. They showed that all subjects ex-
4
4.5. Assessment of existing datasets 59
perienced increased heart rate when there was an alarm regardless of their experience,education and gender which implies a physical arousal detected by the heart rate.
Studies on emotions and moods
.
Similarly, researchers used knowledge of emotions and mood’s effect on physiologicalsignals established in the lab to use in application conducted in the wild. For instance,Kim and Fesenmaier [2015] used EDA to estimate 2 travelers’ emotions during a 4 daystrip. Their mean EDA level correlated with their experience of each activity. Roseway et al.[2015] used EDA to determine arousal and HRV to determine valence in 10 participantsduring a 10 days study. Arousal was displayed using a color-changing emotional crystalto help mood-awareness at work in the workplace. The device improved stress controlabilities in the subjects. Similarly, Snyder et al. [2015] used the color of a desk lamp toreflect subjects internal state estimated from EDA. It provided information on the wayarousal feedback affects understanding of ourselves and others.
4.5.2 Multimodal approaches
Collecting additional signals in addition to physiological signals might ease the recog-nition of emotions moods and stress. Here, the studies using a multi-modal approachincluding physiological signals will be presented.
4.5.2.1 In-the-wild detection and classification studies
Studies on stress
.
4
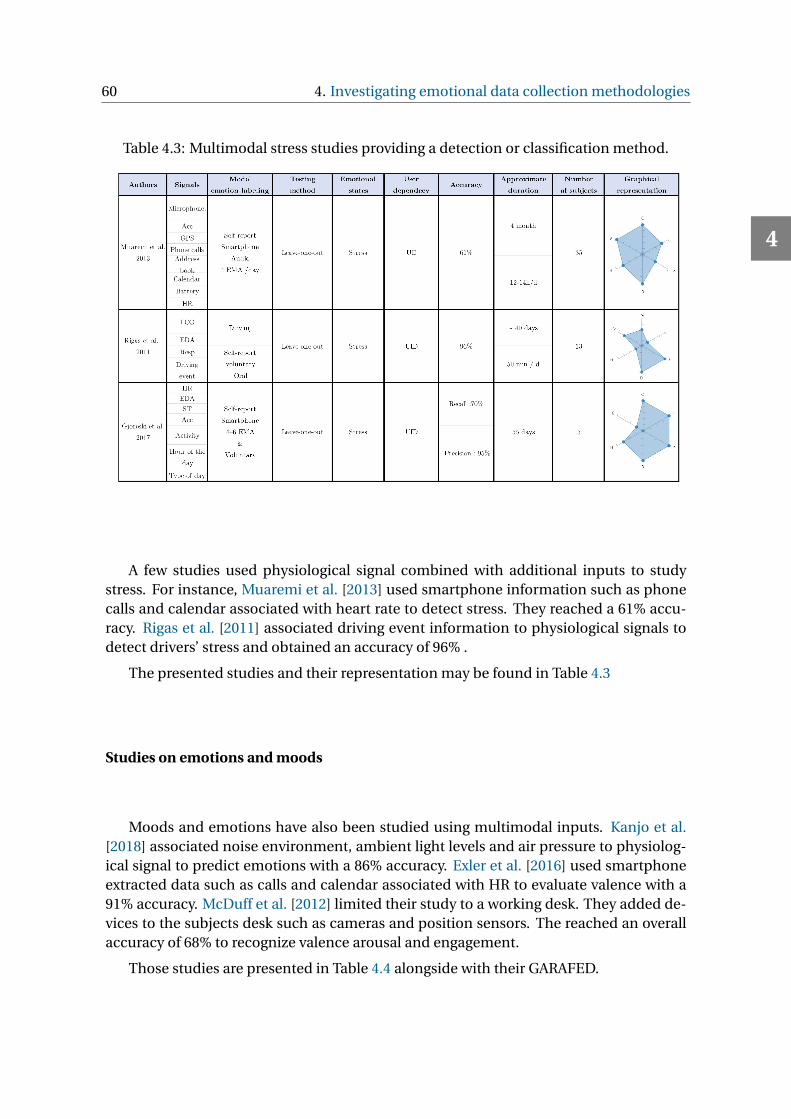
60 4. Investigating emotional data collection methodologies
Table 4.3: Multimodal stress studies providing a detection or classification method.
A few studies used physiological signal combined with additional inputs to studystress. For instance, Muaremi et al. [2013] used smartphone information such as phonecalls and calendar associated with heart rate to detect stress. They reached a 61% accu-racy. Rigas et al. [2011] associated driving event information to physiological signals todetect drivers’ stress and obtained an accuracy of 96% .
The presented studies and their representation may be found in Table 4.3
Studies on emotions and moods
.
Moods and emotions have also been studied using multimodal inputs. Kanjo et al.[2018] associated noise environment, ambient light levels and air pressure to physiolog-ical signal to predict emotions with a 86% accuracy. Exler et al. [2016] used smartphoneextracted data such as calls and calendar associated with HR to evaluate valence with a91% accuracy. McDuff et al. [2012] limited their study to a working desk. They added de-vices to the subjects desk such as cameras and position sensors. The reached an overallaccuracy of 68% to recognize valence arousal and engagement.
Those studies are presented in Table 4.4 alongside with their GARAFED.
4
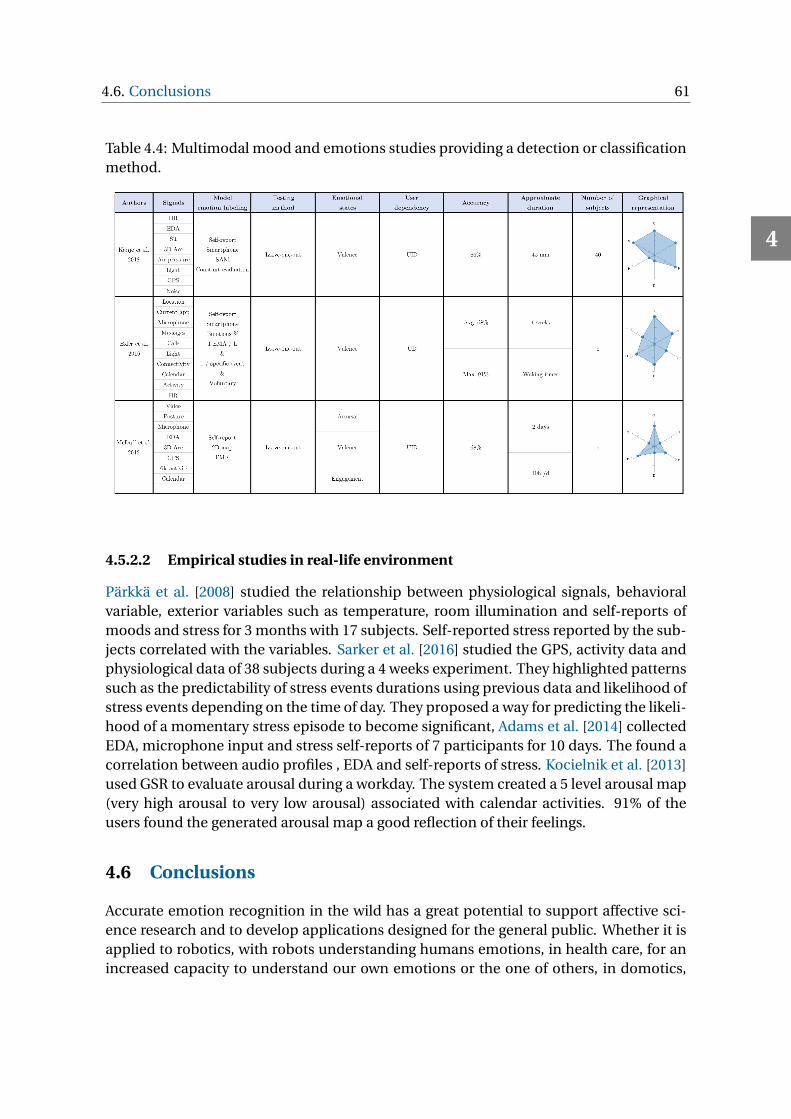
4.6. Conclusions 61
Table 4.4: Multimodal mood and emotions studies providing a detection or classificationmethod.
4.5.2.2 Empirical studies in real-life environment
Pärkkä et al. [2008] studied the relationship between physiological signals, behavioralvariable, exterior variables such as temperature, room illumination and self-reports ofmoods and stress for 3 months with 17 subjects. Self-reported stress reported by the sub-jects correlated with the variables. Sarker et al. [2016] studied the GPS, activity data andphysiological data of 38 subjects during a 4 weeks experiment. They highlighted patternssuch as the predictability of stress events durations using previous data and likelihood ofstress events depending on the time of day. They proposed a way for predicting the likeli-hood of a momentary stress episode to become significant, Adams et al. [2014] collectedEDA, microphone input and stress self-reports of 7 participants for 10 days. The found acorrelation between audio profiles , EDA and self-reports of stress. Kocielnik et al. [2013]used GSR to evaluate arousal during a workday. The system created a 5 level arousal map(very high arousal to very low arousal) associated with calendar activities. 91% of theusers found the generated arousal map a good reflection of their feelings.
4.6 Conclusions
Accurate emotion recognition in the wild has a great potential to support affective sci-ence research and to develop applications designed for the general public. Whether it isapplied to robotics, with robots understanding humans emotions, in health care, for anincreased capacity to understand our own emotions or the one of others, in domotics,
4
62 4. Investigating emotional data collection methodologies
with smart homes adapting settings to your moods or other domains, emotion recogni-tion has been a goal we are trying to achieved for decades. Emotion recognition is ofparticular interest in this research since, as previously stated, it would allow to automati-cally detect patients emotion and create an affect-aware and adaptative system.
However, research has mainly be limited to laboratory environment and needs to bebroaden out to the wild to really achieve meaningful progress. In this chapter the maindifferences between classification and detection of emotions in the wild and in the lab-oratory were presented. The main decisions to take, according to the goal of the desiredstudy, their advantages, challenges and limitations were pointed out, and a visual methodto categorize studies based on those main choices was proposed. Studies focusing onphysiological signals were assessed using such method and existing devices suitable forambulatory studies, whether they are designed for research or for the general public werelisted. Studies, past or future, using physiological signals or other types of input for emo-tion, stress or mood recognition may be assessed using this method in the future.
The reason why there is a real need for research to be done in emotions recognitionin the wild was highlighted. It was shown that while a tendency toward this goal has beenseen, very few papers focus on this matter today. The quantified-self trend associatedwith the smaller and more portative sensors technology nowadays makes it easier forresearcher to step in this path. This review was submitted to the journal "frontiers inpsychology - emotion science".
4
5EMOTIONAL DATA COLLECTION IN THE
LABORATORY USING VR GAMES
As seen in the previous chapter, one of the greatest challenges in Affective Computing is thecreation of ecological multimodal datasets for emotion detection and recognition. Ideally,such datasets would contain affective expressions recorded in the wild, i.e., in a real-life set-ting. Unfortunately, reproducing these ideal conditions is time consuming and very chal-lenging. This chapter investigate alternative data collection methods in laboratory settingsthat would elicit strong emotions.
5.1 Introduction
Currently, Virtual Reality (VR) technologies are widely applied to investigate complexhuman behaviors and to elicit similar-to real-life emotions. For example, VR is a well-established medium for investigating fear perception and treatment [Diemer et al., 2014;Mühlberger et al., 2007; Rothbaum, 2009]. A characteristic of VR is the possibility to elicitemotional reactions as, by its nature, it mainly relies on perceptual, visual and auditorystimulation (including perceptual feedback of one’s own actions). Recent studies havehighlighted the need to consider both bottom-up and top-down perceptual processes, inorder to understand how VR can become emotionally engaging (e.g., how backgroundnarrative can enhance emotional experience [Peperkorn and Mühlberger, 2013]). InDiemer et al. [2015], authors reviewed the factors influencing presence perception, withemotional states (e.g., fear) being crucial, according to clinical psychology. In their analy-sis, they considered the central role of perception in eliciting emotional reactions and therole of arousal as a basic dimension of emotional experience. Finally, in Meuleman andRudrauf [2018] the authors used a set of VR consumer games to elicit emotions in partic-ipants in lab conditions. According to Scherer’s model [Scherer, 2009], they asked partic-ipants to self-report appraisal components, physiological reactions, feelings, regulationand action tendencies in addition to emotion labels and dimensions. Using multivariateanalyses, they shown the relation between reported labels and affect components.
Several works attempting to create emotional states in the laboratory for scientific
63
64 5. Emotional data collection in the laboratory using VR games
aims are based on appraisal theories. For instance, Conati and Zhou [Conati and Zhou,2002] implemented a probabilistic model, using Dynamic Decision Networks, to recog-nize student’s emotional states in an educational game context, following the OCC ap-praisal theory [Ortony et al., 1990] and considering the students’ goals and personality.
In the video game context, Johnstone [1996] analyzed the relation between the acous-tic features of the player’s vocal responses and the manipulations of some appraisal prop-erties of Scherer’s Component Process Model [Scherer, 2009]. Another attempt at using avideo game for the manipulation of appraisals was proposed by Kappas and Pecchinenda[1999], while van Reekum et al. [2004] used a simple video game to study physiologicaleffects of the same properties addressed by Johnstone.
5.1.1 Roseman’s appraisal theory
In affective sciences, emotion elicitation refers to the use of emotionally valanced stim-uli to evoke affective responses. Emotion research often relies on appraisal theories ofemotions, considering emotion as a process, rather than a state.
These theories highlight the central role of appraisal, suggesting that it can trigger anddifferentiate emotional episodes, determine intensity and quality of action tendencies,physiological responses, behaviors and feelings [Lazarus, 1991; Scherer, 2001]. In thisframework, it can be argued that appraisal elicits emotions [Moors et al., 2013].
This chapter relies on the appraisal theory of emotions proposed by Roseman et al.[1996] for emotion elicitation . According to this theory, the appraisal process categorizesa given situation according to five dimensions:
• situational state: assessing whether the appraised event is consistent or not withsomeone’s motives;
• probability: indicating the certainty or uncertainty of the outcome of the appraisedevent;
• agency: indicating whether the person is in control over the event or if some otheragent (or external circumstance) is in charge;
• motivational state: assessing whether the event is consistent with the motive ofobtaining reward or of avoiding punishment;
• power: referring to a person’s control power over the situation.
For instance, the event of receiving a prize would elicit pride, as it is (1) consistent withone’s motives of being rewarded, (2) certain, and (3) appraised as something dependingon the person’s ability or performance. In the Ironman game, the elicitation of the posi-tive emotion of joy and of the negative emotion of frustration is the focus. More precisely,the game play is designed to re-create the situational circumstances that, according toRoseman’s appraisal theory, elicit joy and frustration. Details about the emotion elicitingevents exploited in the game are provided in Table 5.1.
5
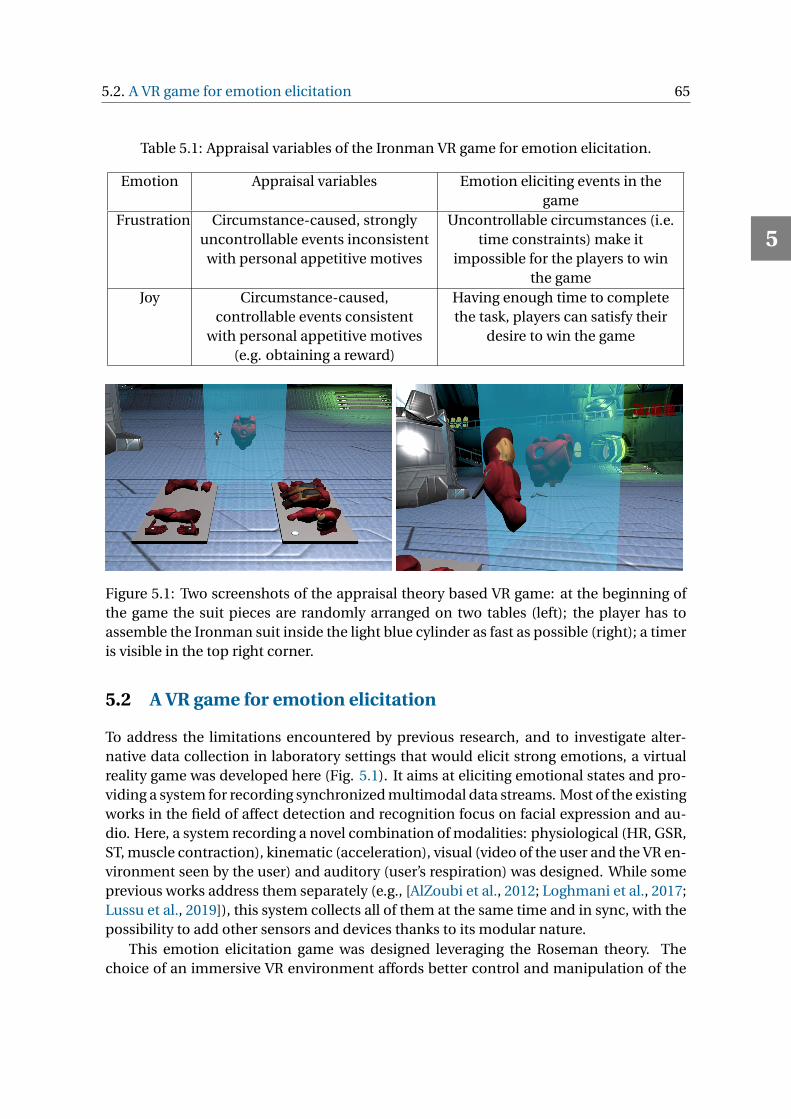
5.2. A VR game for emotion elicitation 65
Table 5.1: Appraisal variables of the Ironman VR game for emotion elicitation.
Emotion Appraisal variables Emotion eliciting events in thegame
Frustration Circumstance-caused, stronglyuncontrollable events inconsistent
with personal appetitive motives
Uncontrollable circumstances (i.e.time constraints) make it
impossible for the players to winthe game
Joy Circumstance-caused,controllable events consistent
with personal appetitive motives(e.g. obtaining a reward)
Having enough time to completethe task, players can satisfy their
desire to win the game
Figure 5.1: Two screenshots of the appraisal theory based VR game: at the beginning ofthe game the suit pieces are randomly arranged on two tables (left); the player has toassemble the Ironman suit inside the light blue cylinder as fast as possible (right); a timeris visible in the top right corner.
5.2 A VR game for emotion elicitation
To address the limitations encountered by previous research, and to investigate alter-native data collection in laboratory settings that would elicit strong emotions, a virtualreality game was developed here (Fig. 5.1). It aims at eliciting emotional states and pro-viding a system for recording synchronized multimodal data streams. Most of the existingworks in the field of affect detection and recognition focus on facial expression and au-dio. Here, a system recording a novel combination of modalities: physiological (HR, GSR,ST, muscle contraction), kinematic (acceleration), visual (video of the user and the VR en-vironment seen by the user) and auditory (user’s respiration) was designed. While someprevious works address them separately (e.g., [AlZoubi et al., 2012; Loghmani et al., 2017;Lussu et al., 2019]), this system collects all of them at the same time and in sync, with thepossibility to add other sensors and devices thanks to its modular nature.
This emotion elicitation game was designed leveraging the Roseman theory. Thechoice of an immersive VR environment affords better control and manipulation of the
5
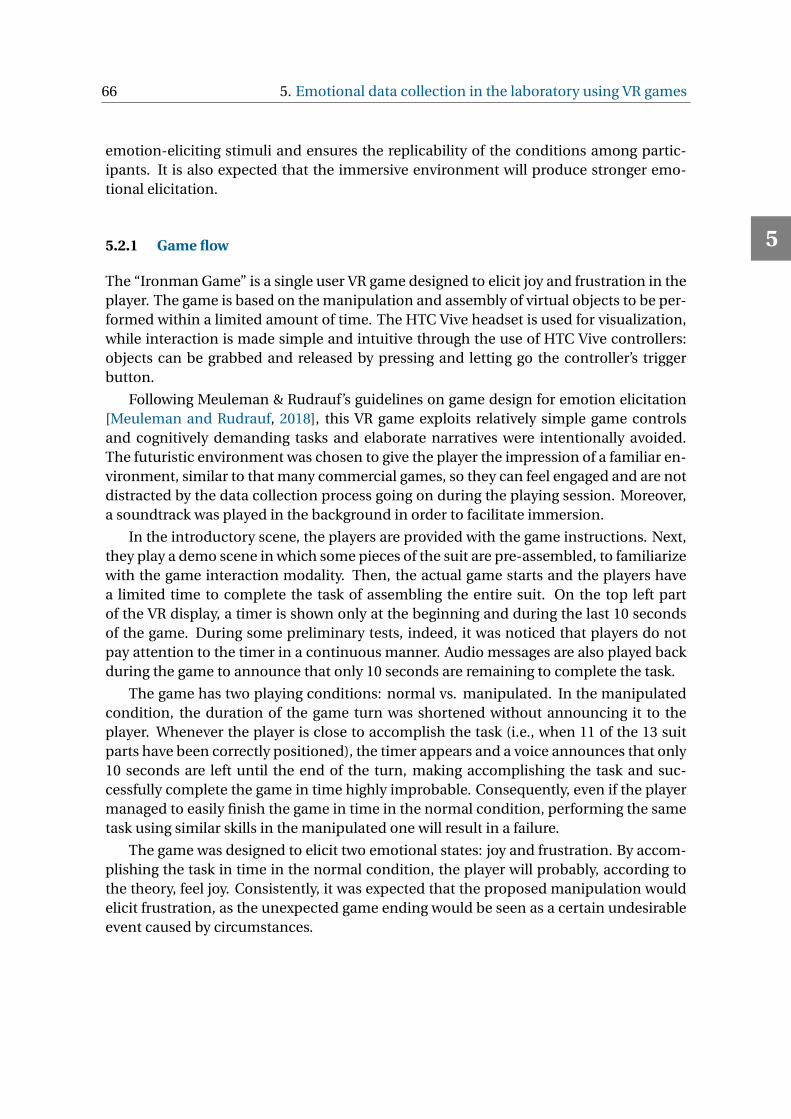
66 5. Emotional data collection in the laboratory using VR games
emotion-eliciting stimuli and ensures the replicability of the conditions among partic-ipants. It is also expected that the immersive environment will produce stronger emo-tional elicitation.
5.2.1 Game flow
The “Ironman Game” is a single user VR game designed to elicit joy and frustration in theplayer. The game is based on the manipulation and assembly of virtual objects to be per-formed within a limited amount of time. The HTC Vive headset is used for visualization,while interaction is made simple and intuitive through the use of HTC Vive controllers:objects can be grabbed and released by pressing and letting go the controller’s triggerbutton.
Following Meuleman & Rudrauf’s guidelines on game design for emotion elicitation[Meuleman and Rudrauf, 2018], this VR game exploits relatively simple game controlsand cognitively demanding tasks and elaborate narratives were intentionally avoided.The futuristic environment was chosen to give the player the impression of a familiar en-vironment, similar to that many commercial games, so they can feel engaged and are notdistracted by the data collection process going on during the playing session. Moreover,a soundtrack was played in the background in order to facilitate immersion.
In the introductory scene, the players are provided with the game instructions. Next,they play a demo scene in which some pieces of the suit are pre-assembled, to familiarizewith the game interaction modality. Then, the actual game starts and the players havea limited time to complete the task of assembling the entire suit. On the top left partof the VR display, a timer is shown only at the beginning and during the last 10 secondsof the game. During some preliminary tests, indeed, it was noticed that players do notpay attention to the timer in a continuous manner. Audio messages are also played backduring the game to announce that only 10 seconds are remaining to complete the task.
The game has two playing conditions: normal vs. manipulated. In the manipulatedcondition, the duration of the game turn was shortened without announcing it to theplayer. Whenever the player is close to accomplish the task (i.e., when 11 of the 13 suitparts have been correctly positioned), the timer appears and a voice announces that only10 seconds are left until the end of the turn, making accomplishing the task and suc-cessfully complete the game in time highly improbable. Consequently, even if the playermanaged to easily finish the game in time in the normal condition, performing the sametask using similar skills in the manipulated one will result in a failure.
The game was designed to elicit two emotional states: joy and frustration. By accom-plishing the task in time in the normal condition, the player will probably, according tothe theory, feel joy. Consistently, it was expected that the proposed manipulation wouldelicit frustration, as the unexpected game ending would be seen as a certain undesirableevent caused by circumstances.
5
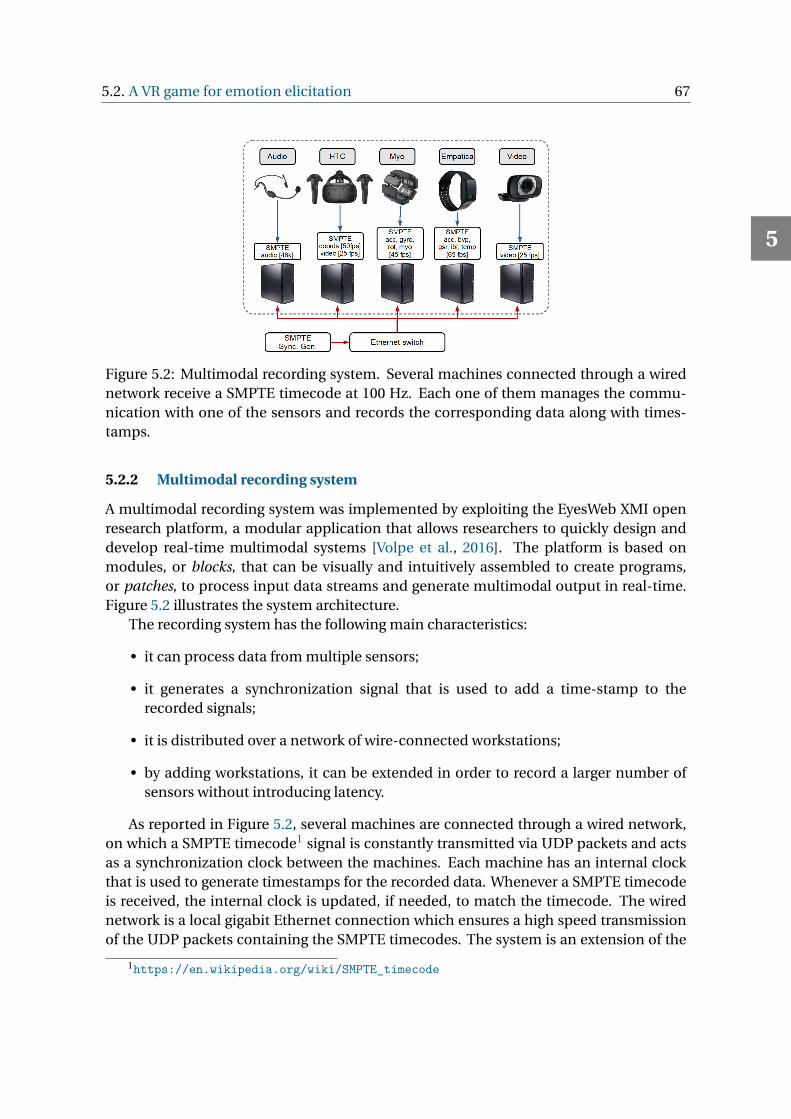
5.2. A VR game for emotion elicitation 67
Figure 5.2: Multimodal recording system. Several machines connected through a wirednetwork receive a SMPTE timecode at 100 Hz. Each one of them manages the commu-nication with one of the sensors and records the corresponding data along with times-tamps.
5.2.2 Multimodal recording system
A multimodal recording system was implemented by exploiting the EyesWeb XMI openresearch platform, a modular application that allows researchers to quickly design anddevelop real-time multimodal systems [Volpe et al., 2016]. The platform is based onmodules, or blocks, that can be visually and intuitively assembled to create programs,or patches, to process input data streams and generate multimodal output in real-time.Figure 5.2 illustrates the system architecture.
The recording system has the following main characteristics:
• it can process data from multiple sensors;
• it generates a synchronization signal that is used to add a time-stamp to therecorded signals;
• it is distributed over a network of wire-connected workstations;
• by adding workstations, it can be extended in order to record a larger number ofsensors without introducing latency.
As reported in Figure 5.2, several machines are connected through a wired network,on which a SMPTE timecode1 signal is constantly transmitted via UDP packets and actsas a synchronization clock between the machines. Each machine has an internal clockthat is used to generate timestamps for the recorded data. Whenever a SMPTE timecodeis received, the internal clock is updated, if needed, to match the timecode. The wirednetwork is a local gigabit Ethernet connection which ensures a high speed transmissionof the UDP packets containing the SMPTE timecodes. The system is an extension of the
1https://en.wikipedia.org/wiki/SMPTE_timecode
5
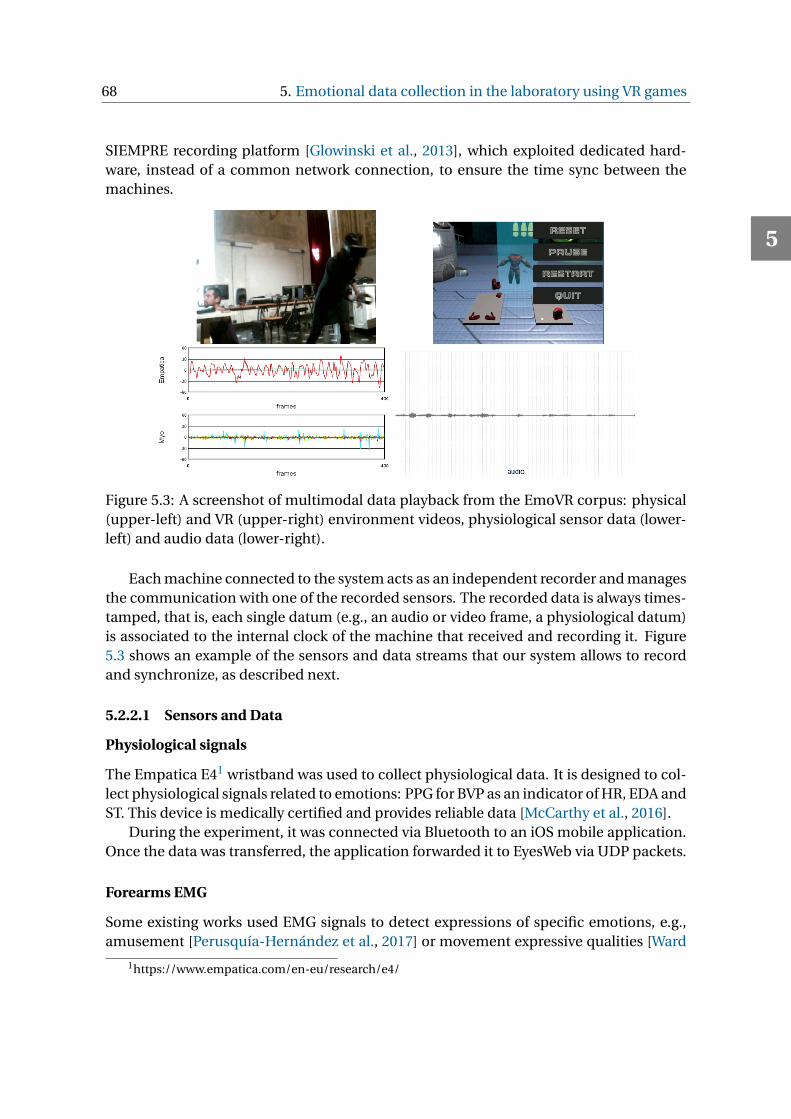
68 5. Emotional data collection in the laboratory using VR games
SIEMPRE recording platform [Glowinski et al., 2013], which exploited dedicated hard-ware, instead of a common network connection, to ensure the time sync between themachines.
Figure 5.3: A screenshot of multimodal data playback from the EmoVR corpus: physical(upper-left) and VR (upper-right) environment videos, physiological sensor data (lower-left) and audio data (lower-right).
Each machine connected to the system acts as an independent recorder and managesthe communication with one of the recorded sensors. The recorded data is always times-tamped, that is, each single datum (e.g., an audio or video frame, a physiological datum)is associated to the internal clock of the machine that received and recording it. Figure5.3 shows an example of the sensors and data streams that our system allows to recordand synchronize, as described next.
5.2.2.1 Sensors and Data
Physiological signals
The Empatica E41 wristband was used to collect physiological data. It is designed to col-lect physiological signals related to emotions: PPG for BVP as an indicator of HR, EDA andST. This device is medically certified and provides reliable data [McCarthy et al., 2016].
During the experiment, it was connected via Bluetooth to an iOS mobile application.Once the data was transferred, the application forwarded it to EyesWeb via UDP packets.
Forearms EMG
Some existing works used EMG signals to detect expressions of specific emotions, e.g.,amusement [Perusquía-Hernández et al., 2017] or movement expressive qualities [Ward
1https://www.empatica.com/en-eu/research/e4/
5
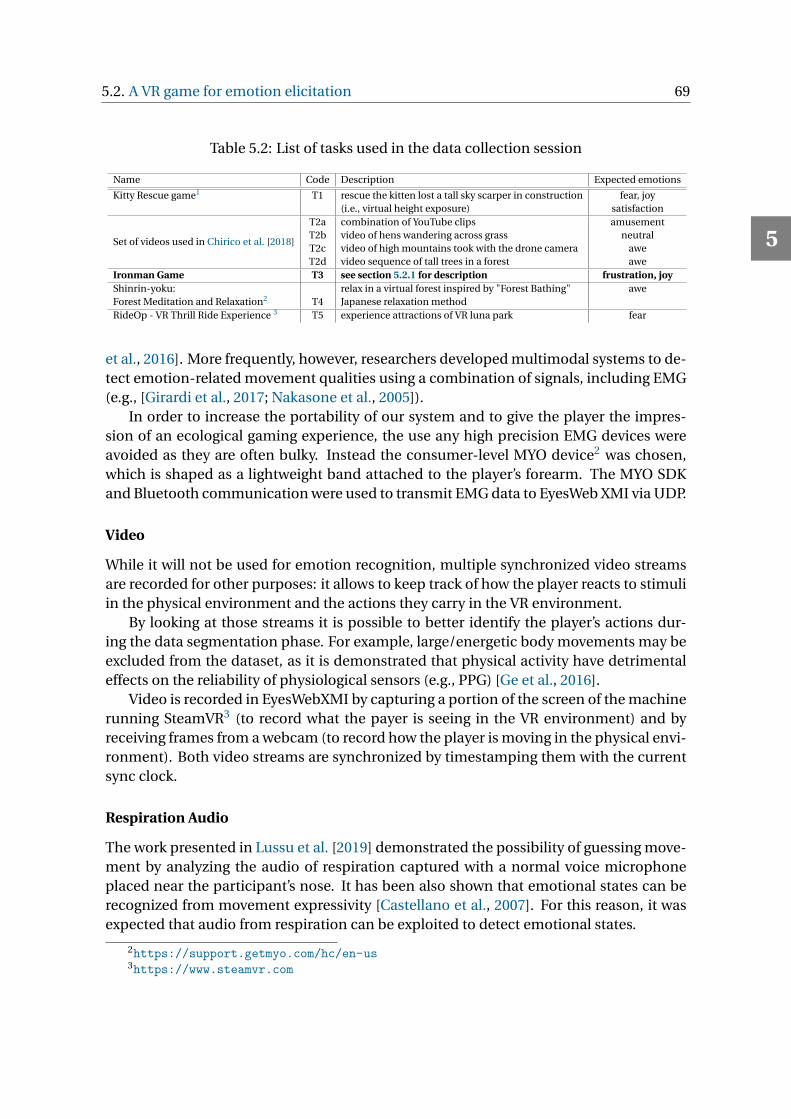
5.2. A VR game for emotion elicitation 69
Table 5.2: List of tasks used in the data collection session
Name Code Description Expected emotions
Kitty Rescue game1 T1 rescue the kitten lost a tall sky scarper in construction fear, joy(i.e., virtual height exposure) satisfaction
Set of videos used in Chirico et al. [2018]
T2a combination of YouTube clips amusementT2b video of hens wandering across grass neutralT2c video of high mountains took with the drone camera aweT2d video sequence of tall trees in a forest awe
Ironman Game T3 see section 5.2.1 for description frustration, joyShinrin-yoku: relax in a virtual forest inspired by "Forest Bathing" aweForest Meditation and Relaxation2 T4 Japanese relaxation methodRideOp - VR Thrill Ride Experience 3 T5 experience attractions of VR luna park fear
et al., 2016]. More frequently, however, researchers developed multimodal systems to de-tect emotion-related movement qualities using a combination of signals, including EMG(e.g., [Girardi et al., 2017; Nakasone et al., 2005]).
In order to increase the portability of our system and to give the player the impres-sion of an ecological gaming experience, the use any high precision EMG devices wereavoided as they are often bulky. Instead the consumer-level MYO device2 was chosen,which is shaped as a lightweight band attached to the player’s forearm. The MYO SDKand Bluetooth communication were used to transmit EMG data to EyesWeb XMI via UDP.
Video
While it will not be used for emotion recognition, multiple synchronized video streamsare recorded for other purposes: it allows to keep track of how the player reacts to stimuliin the physical environment and the actions they carry in the VR environment.
By looking at those streams it is possible to better identify the player’s actions dur-ing the data segmentation phase. For example, large/energetic body movements may beexcluded from the dataset, as it is demonstrated that physical activity have detrimentaleffects on the reliability of physiological sensors (e.g., PPG) [Ge et al., 2016].
Video is recorded in EyesWebXMI by capturing a portion of the screen of the machinerunning SteamVR3 (to record what the payer is seeing in the VR environment) and byreceiving frames from a webcam (to record how the player is moving in the physical envi-ronment). Both video streams are synchronized by timestamping them with the currentsync clock.
Respiration Audio
The work presented in Lussu et al. [2019] demonstrated the possibility of guessing move-ment by analyzing the audio of respiration captured with a normal voice microphoneplaced near the participant’s nose. It has been also shown that emotional states can berecognized from movement expressivity [Castellano et al., 2007]. For this reason, it wasexpected that audio from respiration can be exploited to detect emotional states.
2https://support.getmyo.com/hc/en-us3https://www.steamvr.com
5
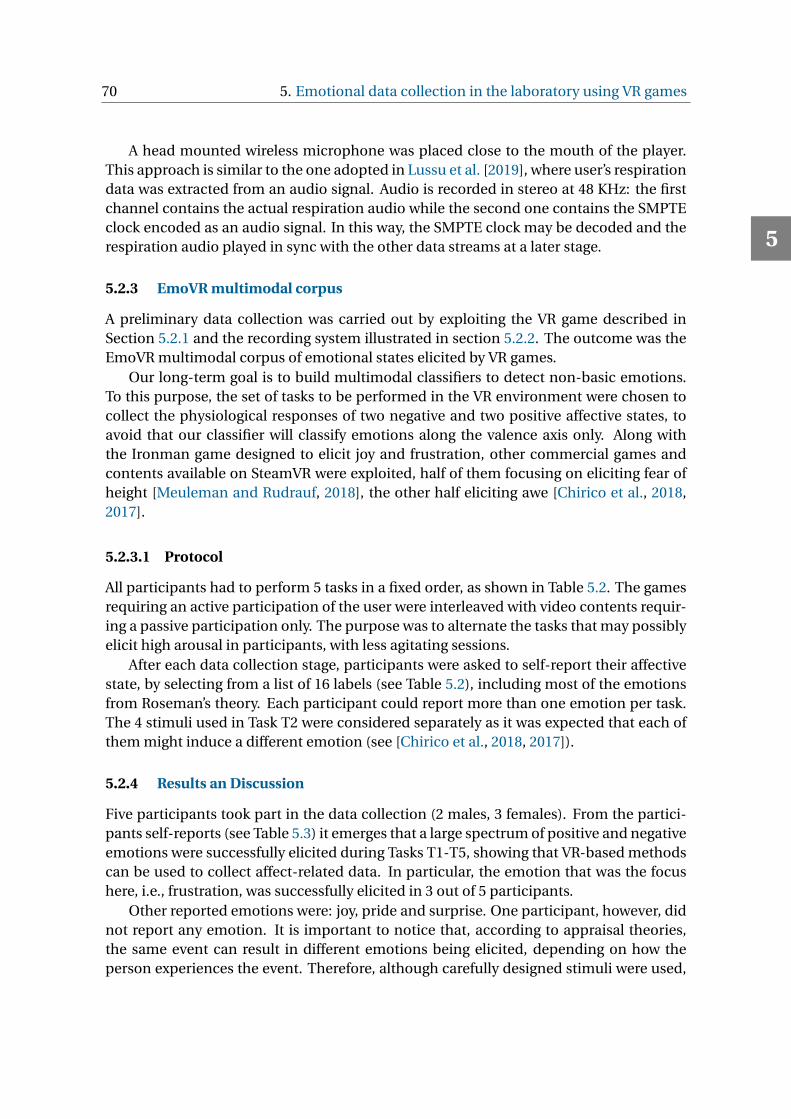
70 5. Emotional data collection in the laboratory using VR games
A head mounted wireless microphone was placed close to the mouth of the player.This approach is similar to the one adopted in Lussu et al. [2019], where user’s respirationdata was extracted from an audio signal. Audio is recorded in stereo at 48 KHz: the firstchannel contains the actual respiration audio while the second one contains the SMPTEclock encoded as an audio signal. In this way, the SMPTE clock may be decoded and therespiration audio played in sync with the other data streams at a later stage.
5.2.3 EmoVR multimodal corpus
A preliminary data collection was carried out by exploiting the VR game described inSection 5.2.1 and the recording system illustrated in section 5.2.2. The outcome was theEmoVR multimodal corpus of emotional states elicited by VR games.
Our long-term goal is to build multimodal classifiers to detect non-basic emotions.To this purpose, the set of tasks to be performed in the VR environment were chosen tocollect the physiological responses of two negative and two positive affective states, toavoid that our classifier will classify emotions along the valence axis only. Along withthe Ironman game designed to elicit joy and frustration, other commercial games andcontents available on SteamVR were exploited, half of them focusing on eliciting fear ofheight [Meuleman and Rudrauf, 2018], the other half eliciting awe [Chirico et al., 2018,2017].
5.2.3.1 Protocol
All participants had to perform 5 tasks in a fixed order, as shown in Table 5.2. The gamesrequiring an active participation of the user were interleaved with video contents requir-ing a passive participation only. The purpose was to alternate the tasks that may possiblyelicit high arousal in participants, with less agitating sessions.
After each data collection stage, participants were asked to self-report their affectivestate, by selecting from a list of 16 labels (see Table 5.2), including most of the emotionsfrom Roseman’s theory. Each participant could report more than one emotion per task.The 4 stimuli used in Task T2 were considered separately as it was expected that each ofthem might induce a different emotion (see [Chirico et al., 2018, 2017]).
5.2.4 Results an Discussion
Five participants took part in the data collection (2 males, 3 females). From the partici-pants self-reports (see Table 5.3) it emerges that a large spectrum of positive and negativeemotions were successfully elicited during Tasks T1-T5, showing that VR-based methodscan be used to collect affect-related data. In particular, the emotion that was the focushere, i.e., frustration, was successfully elicited in 3 out of 5 participants.
Other reported emotions were: joy, pride and surprise. One participant, however, didnot report any emotion. It is important to notice that, according to appraisal theories,the same event can result in different emotions being elicited, depending on how theperson experiences the event. Therefore, although carefully designed stimuli were used,
5
5.3. Conclusions 71
Table 5.3: Self-reported emotions for each task.
Task T1 T2 T3 T4 T5a b c d
awe/delight 0 0 0 1 1 0 3 3surprise 1 1 0 0 2 1 1 0hope 0 0 0 1 0 0 0 0joy 1 3 0 1 2 1 2 1relief 2 0 0 1 0 0 2 1fear 5 0 1 0 1 0 0 4frustration 2 0 0 0 0 3 0 0anger 0 1 1 0 0 0 0 0pride 0 0 0 0 0 1 0 0guilt 0 0 0 0 0 0 0 0regret 0 0 0 0 0 0 0 0sadness 1 0 1 0 0 0 0 0distress 1 0 0 0 0 0 0 0no emotion 0 1 3 1 1 1 0 0other emotion 0 0 1 0 0 0 0 0
the elicited emotions may differ from the ones expected by the experimenter, at leastfor some of the participants. For instance, in our experiment, one participant reportedthe disgust emotion (the “other emotion” row in Table 5.3) in response to the supposedlyemotionally neutral stimuli (i.e., hen-house video, stimuli T2b). After the experiment,the participant reported a personal repulsion for that animal. Regarding the elicitationof the positive emotion of awe (T2c and d, T4),it was experienced by three participants,confirming the previous results in [Chirico et al., 2018, 2017].
This study was published in the MIG 2019 conference [Bassano et al., 2019]
5.3 Conclusions
This game is the first immersive VR game inducing emotional states based on appraisalpsychological theories and a system for collecting synchronized multimodal data, ex-ploiting a novel combination of modalities, i.e., physiological data (Empatica and MYO),kinematic data (MYO), video recordings and audio. Preliminary experimental resultsshow that it is possible to successfully induce a spectrum of positive and negative emo-tions in VR scenarios, even if there are some limitations in using a simplified question-naire for emotion self-reporting.
In the future, more sophisticated validated tools (e.g., GRID [Fontaine et al., 2013])could be exploited to check whether the participants’ reactions not only corresponded tothe experimenter’s expectations in terms of emotional labels but also in terms of singleappraisal evaluations. Finally, deep learning techniques may be used on the collectedcorpus to develop models for automatically recognize of emotional states.
5

72 5. Emotional data collection in the laboratory using VR games
While this system successfully elicited strong positive and negative emotions on sub-jects and can be used for other type of research, it did not successfully elicited the desiredemotion on every participants. Therefore, adapting it for LIS patients as a way to elicitemotion for emotion recognition would not be an adequate route to pursue the goal ofthis research. Collecting emotions in the wild seems to be a more adapted solution forthe purpose of this research and will be investigated further in next chapter. 5
6TOOLS FOR EMOTION DETECTION FOR
REAL-LIFE APPLICATION
As seen in Chapter 4, several works have shown that physiological signals can constitute in-dices for automatic emotion recognition [Shu et al., 2018]. Differences were observed whencomparing physiological data of emotions induced in the lab to real-life emotional reac-tions [Wilhelm and Grossman, 2010]. Difficulties in building the affect-related datasets inecological settings, e.g., establishing the ground truth, are well documented in the litera-ture [Schmidt et al., 2018]. Proper data segmentation and labelling is one of the main chal-lenges [Healey et al., 2010]. This chapter will investigate novel ways to collect physiologicaldata in the wild while taking into account the challenges of data labelling. Open-sourcetools will be proposed to researchers wishing to work toward this goal.
6.1 Appraisal Theory-based Mobile App for Physiological Data Col-lection and Labelling in the Wild
As seen in Chapter 5, appraisal theories have been greatly used in emotion-related ap-plications in the past. It was used in this section in order to help collecting and labellingphysiological data in the wild through an open-source mobile application (app). TheOrtony, Clore and Collins (OCC) model [Ortony et al., 1990] (Fig. 6.1) has been chosen asit was successfully used in affective computing applications in the past [Bartneck, 2002;Conati, 2002]. It can predict 22 emotion labels based on valence and the emotional trig-ger type (event, object or agent). The app detects additional heart rate to predict emo-tional events from physiological signals [Myrtek and Brügner, 1996]. Once relevant eventsare detected, the app prompts the users to provide the appraisal evaluation of the event,helping them to define their emotional state. Unlike existing solutions, which often onlyuse a constrained list of emotional labels [Nasoz et al., 2004] or dimensions [Carroll et al.,2013], here, a questionnaire is introduced based on appraisal theory to help the user pro-vide the ground truth for his/her emotional states. By collecting the information aboutappraisal process, the hope is to improve the ground-truth labelling and to provide moreconsistent annotation of corresponding physiological signals.
73
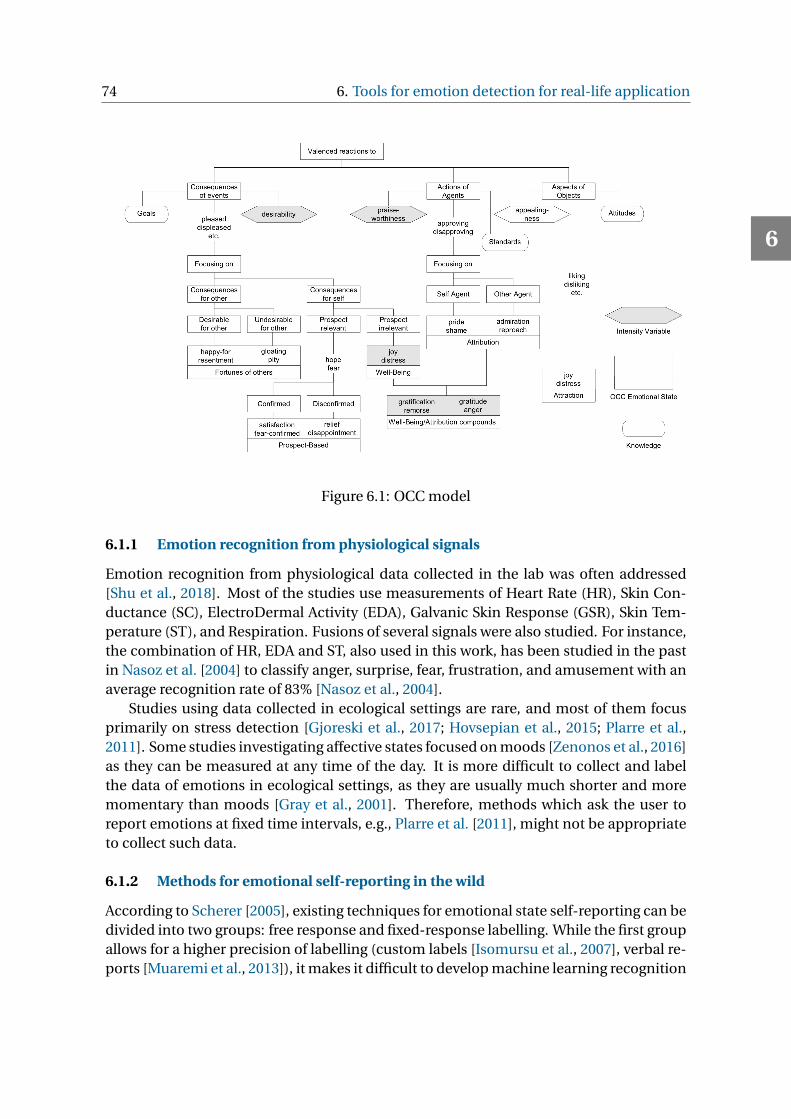
74 6. Tools for emotion detection for real-life application
Figure 6.1: OCC model
6.1.1 Emotion recognition from physiological signals
Emotion recognition from physiological data collected in the lab was often addressed[Shu et al., 2018]. Most of the studies use measurements of Heart Rate (HR), Skin Con-ductance (SC), ElectroDermal Activity (EDA), Galvanic Skin Response (GSR), Skin Tem-perature (ST), and Respiration. Fusions of several signals were also studied. For instance,the combination of HR, EDA and ST, also used in this work, has been studied in the pastin Nasoz et al. [2004] to classify anger, surprise, fear, frustration, and amusement with anaverage recognition rate of 83% [Nasoz et al., 2004].
Studies using data collected in ecological settings are rare, and most of them focusprimarily on stress detection [Gjoreski et al., 2017; Hovsepian et al., 2015; Plarre et al.,2011]. Some studies investigating affective states focused on moods [Zenonos et al., 2016]as they can be measured at any time of the day. It is more difficult to collect and labelthe data of emotions in ecological settings, as they are usually much shorter and moremomentary than moods [Gray et al., 2001]. Therefore, methods which ask the user toreport emotions at fixed time intervals, e.g., Plarre et al. [2011], might not be appropriateto collect such data.
6.1.2 Methods for emotional self-reporting in the wild
According to Scherer [2005], existing techniques for emotional state self-reporting can bedivided into two groups: free response and fixed-response labelling. While the first groupallows for a higher precision of labelling (custom labels [Isomursu et al., 2007], verbal re-ports [Muaremi et al., 2013]), it makes it difficult to develop machine learning recognition
6
6.1. ... Mobile App for Physiological Data Collection and Labelling in the Wild 75
models due to a potentially wide range of emotion labels selected by users. Constrainedsolutions include the usage of a finite list of labels (e.g., Nasoz et al. [2004]) or dimen-sional models such as valence-arousal (e.g., Healey et al. [2010]) or pleasure-arousal-dominance (e.g., Kocielnik et al. [2013]). More user-friendly techniques may be used forreporting such as emoticons [Meschtscherjakov et al., 2009]. Affect dimensions are usu-ally reported through the Self-Assessment Manikin (SAM) method [Isomursu et al., 2007]or through 2D point maps [Carroll et al., 2013].
In Schmidt et al. [2018], guidelines are provided for emotional labelling in the wild bycomparing the results of different methods. A combination of manual reports and au-tomatically triggered prompts is advised, as well as providing the means to the user tomanually correct the timespan of an emotional event. Unlike Schmidt et al. [2018], thatused time-based trigger, in this study prompting based on physiological cues [Myrtekand Brügner, 1996] was used and an experimenter-free data gathering protocol was im-plemented. The role of the experimenter was reduce in order to help different researchteams to contribute in future to the creation of a large shared dataset.
6.1.3 Methods for emotional physiological data collection
In real-life settings, the physiological data labelling and segmentation (i.e., defining thestart and end of an emotion) are the main challenge [Healey et al., 2010]. A few studiesused mobile apps to collect both physiological data and affect related states. The mostcommon ones collect stress levels [Hovsepian et al., 2015; Muaremi et al., 2013] or moods[Carroll et al., 2013; Zenonos et al., 2016] .
Healey and colleagues [Healey et al., 2010] conducted a real-life experiment using amobile phone app to study different labelling methodologies for physiological data col-lection. They collected data and self-reports in the form of discrete labels and dimen-sional models (valence and arousal) and drew attention to some difficulties linked toself-reporting. For instance, from the reports, the label "anxious" was annotated bothas a positive and negative emotion. This example highlights a need for a scheme to helpusers pick labels. They reached a rate of 85% for classifying arousal and 70% for classify-ing valence using GSR and HR on manually extracted data segments of various durations.
6.1.4 Preliminary study
In a preliminary study (PS) physiological data was collected in ecological settings usinga standard paper-based self-reporting method. 4 subjects (3 males, 1 female; avg. age29 years ) participated in the study. The experimental procedures follow the IIT ADVRTEEP02 protocol, approved by the Ethical Committee of Liguria Region on September 19,2017.
6.1.4.1 Study protocol
The subjects wore the Empatica E4 bracelet [Empatica, 2012] for 5 days, 12 hours a day.They were asked to remove the bracelet at night, during sport and showers. They kept
6
76 6. Tools for emotion detection for real-life application
a hand-written journal of their emotions. The focus was given to the 3 most commonbasic states: happy, sad and angry. For each emotional event, participants were asked toreport its start and end time as well as the intensity using a 5 point Likert scale. The focuswas made on those emotions because of the end goal to use this emotion detection forautomatically modulating the voice and the avatar in the system presented in chapter 3.Additionally, emotional labels were collected instead of valence and arousal for the samereason.
6.1.4.2 Issues and lessons learned
Blood Volume Pressure (BVP), EDA and ST data were collected for a total of 234h 02m29s. This pilot study gave us a great number of insights into the problems faced when col-lecting physiological data in ecological settings. It also confirmed the issues previouslydiscussed in the literature e.g., Healey et al. [2010]; Schmidt et al. [2018]. Several subjectsforgot to wear the device and failed to report some relevant events. When the data wasanalyzed after the study, some participants were asked about moments in the day wherethe physiological signals was particularly different from the baseline. Only then they re-membered the events which they had failed to report before. Additionally, some subjectsforgot to rate the intensity of certain emotions.
Furthermore, our participants had difficulty with distinguishing what constitutes anemotion. For instance, an event "Happy: 8AM to 8PM intensity rating 1" was reported bya participant. However, the long duration and low intensity makes us believe that in thiscase the user was referring to a mood rather than an emotion [Gray et al., 2001].
6.1.5 The proposed solution
Collecting and labelling the physiological data of emotions in ecological settings bringsmany difficulties. In order to address them, a mobile application was created with theaim that it:
1. can be used to capture physiological signals of spontaneous emotions duringevery-day activities;
2. is minimally intrusive;
3. guides the user through the process of reporting relevant events, by acquiring thenecessary information to infer the related affective states, and without asking theuser to pick any emotional labels;
4. helps the user to provide meaningful annotation by differentiating emotions frommoods;
5. detects the relevant events from the physiological data and prompts the user aboutit;
6. provides a limited set of ground-truth labels to be used in recognition and classifi-cation models.
6
6.1. ... Mobile App for Physiological Data Collection and Labelling in the Wild 77
Taking into account the results of the preliminary study (see section 6.1.4) a solutionbased on appraisal theory was proposed using a commercially available physiologicalsensor, a mobile application, as well as a state-of-the-art event detection algorithm.
6.1.5.1 Self-reporting about relevant events
To fulfil the requirements 3, 4 and 6, appraisal theory was used for self-reporting whichacquires the whole appraisal process around the event. The resulting annotation consistsof a limited set of labels (single appraisals or emotional labels corresponding to a com-binations of appraisals), and it can, therefore, be used to build classifiers with machinelearning.
Unlike user-picked (UP) label-based datasets that use a specific set of labels for a spe-cific application, exploiting appraisal theory to annotate the data allows one to buildapplication-independent datasets. Indeed, the same dataset can be used in differentapplication-specific recognition models, by choosing the relevant subset of emotionallabels, or by detecting single appraisals. It provides for a greater information about theevent (additional details on what led to the emotion) and a large number of labels to theexperimenter without being cumbersome to the user since they do not need to choosesuch complex labels from a long list. Additionally, using appraisal theories allows for thecreation of a single appraisal recognition model from physiological data [Mortillaro et al.,2012]. Such models have rarely been studied so far but the results are promising [Smith,1989]. The OCC model was chosen for its simplicity to create an adapted questionnairecomprehensible by non-experts.
6.1.5.2 Sensors
The Empatica E4 bracelet allowed us to fulfil requirements 1 and 2. This medical devicewas chosen for its sensors relevant to emotion detection: BVP, EDA and ST as well askinematic data through a 3D accelerometer. Its small size allows for long duration exper-iments without being bothersome. The device comes with an API for mobile applicationsand an already processed BVP to Inter Beat Interval (IBI). Both raw BVP and calculatedIBI are collected by the app to allow experimenters to perform their own peak detectionmethod. The sensor has also been used in the past for research purposes [Gjoreski et al.,2017].
The iPhone-based (iOS) mobile app use a Bluetooth connection to collect physiolog-ical data from the E4 bracelet.
6.1.5.3 The application modules
The emotion definition module
This module is designed to collect information about relevant emotional events. Usingthis module, the users first provide the duration of a relevant event. The maximum du-ration of the event was set to 5 minutes to limit the collection of moods as emotions are
6
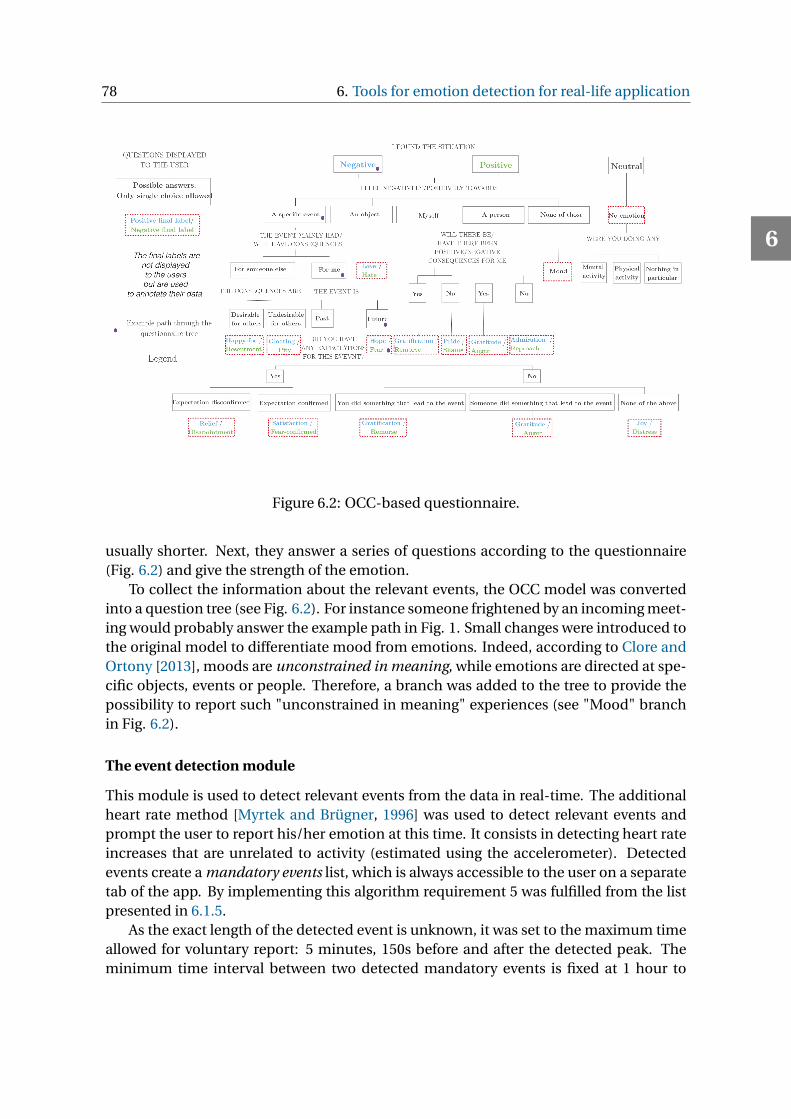
78 6. Tools for emotion detection for real-life application
Figure 6.2: OCC-based questionnaire.
usually shorter. Next, they answer a series of questions according to the questionnaire(Fig. 6.2) and give the strength of the emotion.
To collect the information about the relevant events, the OCC model was convertedinto a question tree (see Fig. 6.2). For instance someone frightened by an incoming meet-ing would probably answer the example path in Fig. 1. Small changes were introduced tothe original model to differentiate mood from emotions. Indeed, according to Clore andOrtony [2013], moods are unconstrained in meaning, while emotions are directed at spe-cific objects, events or people. Therefore, a branch was added to the tree to provide thepossibility to report such "unconstrained in meaning" experiences (see "Mood" branchin Fig. 6.2).
The event detection module
This module is used to detect relevant events from the data in real-time. The additionalheart rate method [Myrtek and Brügner, 1996] was used to detect relevant events andprompt the user to report his/her emotion at this time. It consists in detecting heart rateincreases that are unrelated to activity (estimated using the accelerometer). Detectedevents create a mandatory events list, which is always accessible to the user on a separatetab of the app. By implementing this algorithm requirement 5 was fulfilled from the listpresented in 6.1.5.
As the exact length of the detected event is unknown, it was set to the maximum timeallowed for voluntary report: 5 minutes, 150s before and after the detected peak. Theminimum time interval between two detected mandatory events is fixed at 1 hour to
6
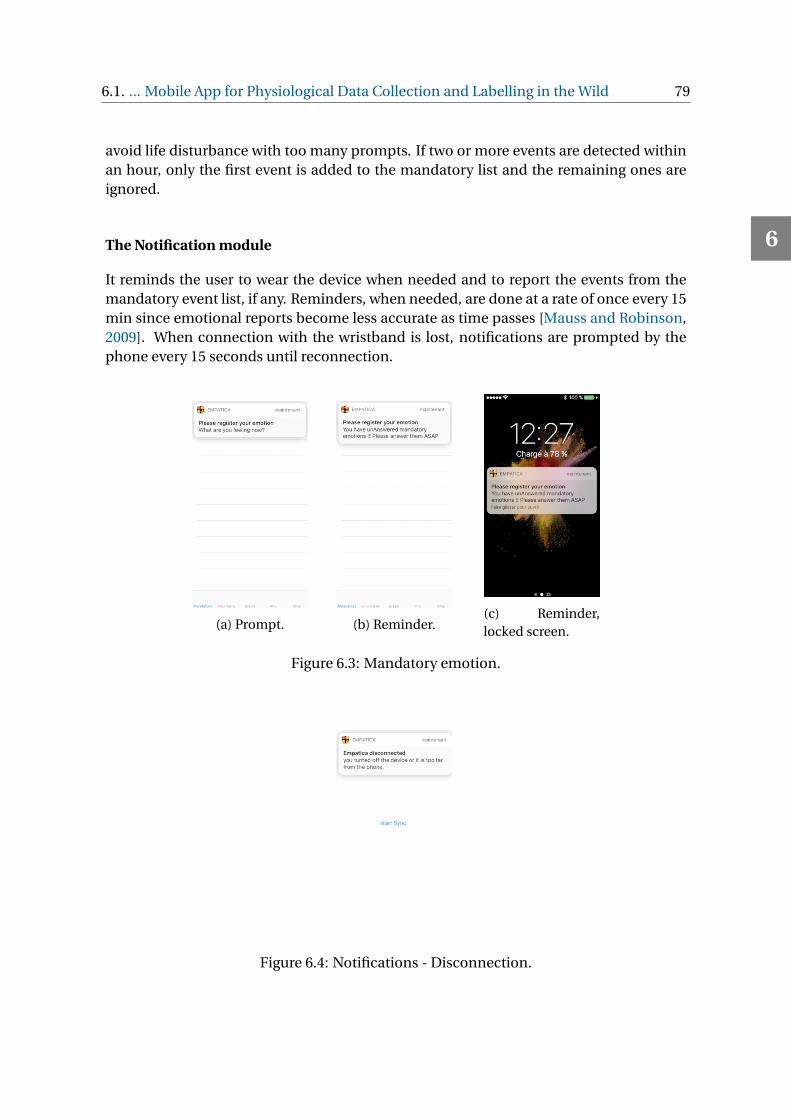
6.1. ... Mobile App for Physiological Data Collection and Labelling in the Wild 79
avoid life disturbance with too many prompts. If two or more events are detected withinan hour, only the first event is added to the mandatory list and the remaining ones areignored.
The Notification module
It reminds the user to wear the device when needed and to report the events from themandatory event list, if any. Reminders, when needed, are done at a rate of once every 15min since emotional reports become less accurate as time passes [Mauss and Robinson,2009]. When connection with the wristband is lost, notifications are prompted by thephone every 15 seconds until reconnection.
(a) Prompt. (b) Reminder.(c) Reminder,locked screen.
Figure 6.3: Mandatory emotion.
Figure 6.4: Notifications - Disconnection.
6
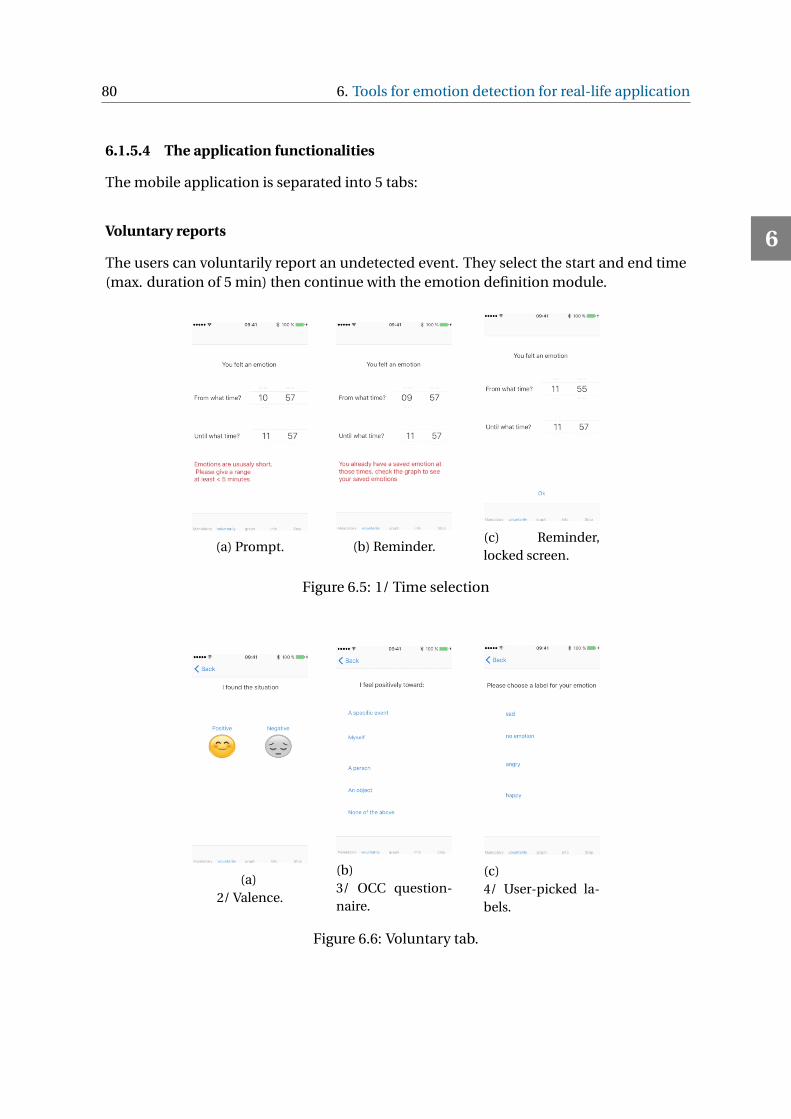
80 6. Tools for emotion detection for real-life application
6.1.5.4 The application functionalities
The mobile application is separated into 5 tabs:
Voluntary reports
The users can voluntarily report an undetected event. They select the start and end time(max. duration of 5 min) then continue with the emotion definition module.
(a) Prompt. (b) Reminder.(c) Reminder,locked screen.
Figure 6.5: 1/ Time selection
(a)2/ Valence.
(b)3/ OCC question-naire.
(c)4/ User-picked la-bels.
Figure 6.6: Voluntary tab.
6
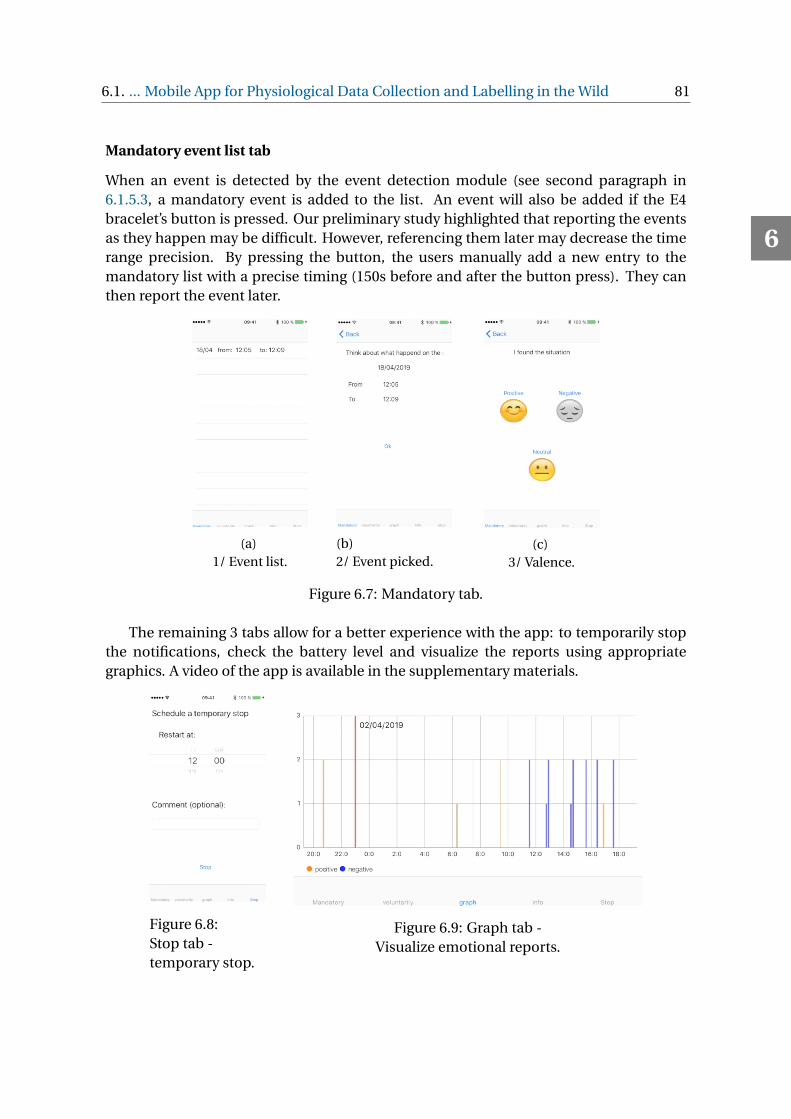
6.1. ... Mobile App for Physiological Data Collection and Labelling in the Wild 81
Mandatory event list tab
When an event is detected by the event detection module (see second paragraph in6.1.5.3, a mandatory event is added to the list. An event will also be added if the E4bracelet’s button is pressed. Our preliminary study highlighted that reporting the eventsas they happen may be difficult. However, referencing them later may decrease the timerange precision. By pressing the button, the users manually add a new entry to themandatory list with a precise timing (150s before and after the button press). They canthen report the event later.
(a)1/ Event list.
(b)2/ Event picked.
(c)3/ Valence.
Figure 6.7: Mandatory tab.
The remaining 3 tabs allow for a better experience with the app: to temporarily stopthe notifications, check the battery level and visualize the reports using appropriategraphics. A video of the app is available in the supplementary materials.
Figure 6.8:Stop tab -temporary stop.
Figure 6.9: Graph tab -Visualize emotional reports.
6
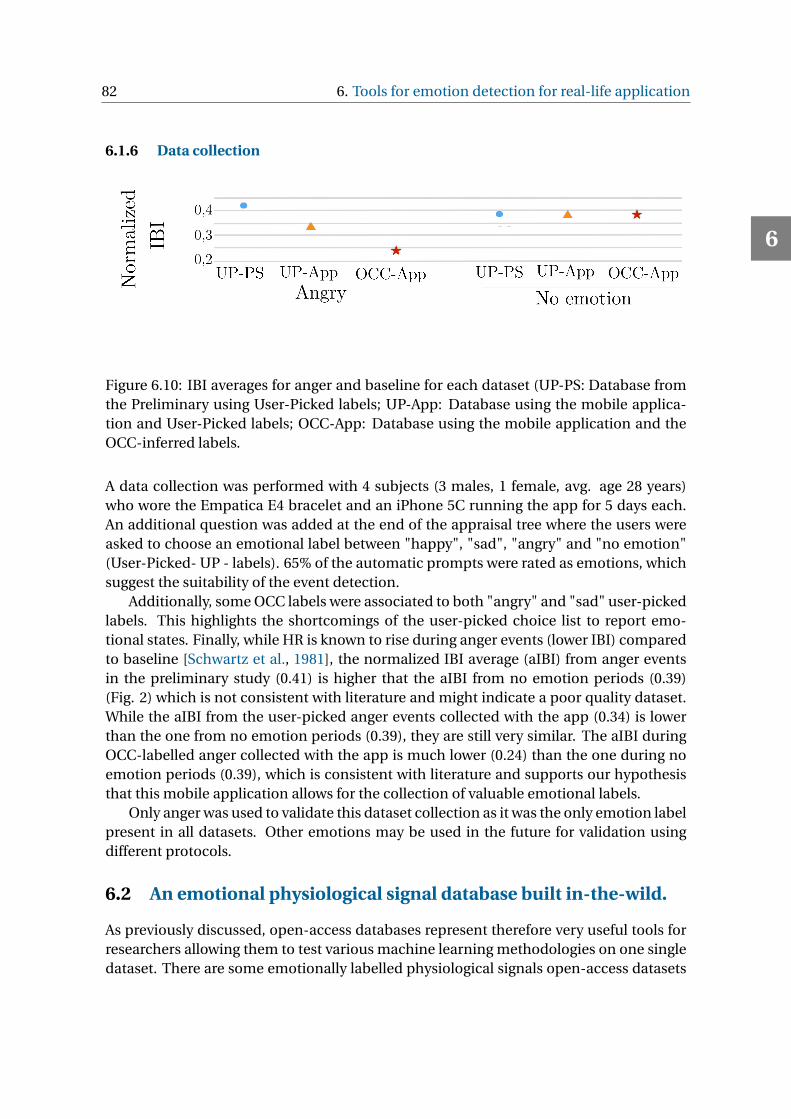
82 6. Tools for emotion detection for real-life application
6.1.6 Data collection
Figure 6.10: IBI averages for anger and baseline for each dataset (UP-PS: Database fromthe Preliminary using User-Picked labels; UP-App: Database using the mobile applica-tion and User-Picked labels; OCC-App: Database using the mobile application and theOCC-inferred labels.
A data collection was performed with 4 subjects (3 males, 1 female, avg. age 28 years)who wore the Empatica E4 bracelet and an iPhone 5C running the app for 5 days each.An additional question was added at the end of the appraisal tree where the users wereasked to choose an emotional label between "happy", "sad", "angry" and "no emotion"(User-Picked- UP - labels). 65% of the automatic prompts were rated as emotions, whichsuggest the suitability of the event detection.
Additionally, some OCC labels were associated to both "angry" and "sad" user-pickedlabels. This highlights the shortcomings of the user-picked choice list to report emo-tional states. Finally, while HR is known to rise during anger events (lower IBI) comparedto baseline [Schwartz et al., 1981], the normalized IBI average (aIBI) from anger eventsin the preliminary study (0.41) is higher that the aIBI from no emotion periods (0.39)(Fig. 2) which is not consistent with literature and might indicate a poor quality dataset.While the aIBI from the user-picked anger events collected with the app (0.34) is lowerthan the one from no emotion periods (0.39), they are still very similar. The aIBI duringOCC-labelled anger collected with the app is much lower (0.24) than the one during noemotion periods (0.39), which is consistent with literature and supports our hypothesisthat this mobile application allows for the collection of valuable emotional labels.
Only anger was used to validate this dataset collection as it was the only emotion labelpresent in all datasets. Other emotions may be used in the future for validation usingdifferent protocols.
6.2 An emotional physiological signal database built in-the-wild.
As previously discussed, open-access databases represent therefore very useful tools forresearchers allowing them to test various machine learning methodologies on one singledataset. There are some emotionally labelled physiological signals open-access datasets
6
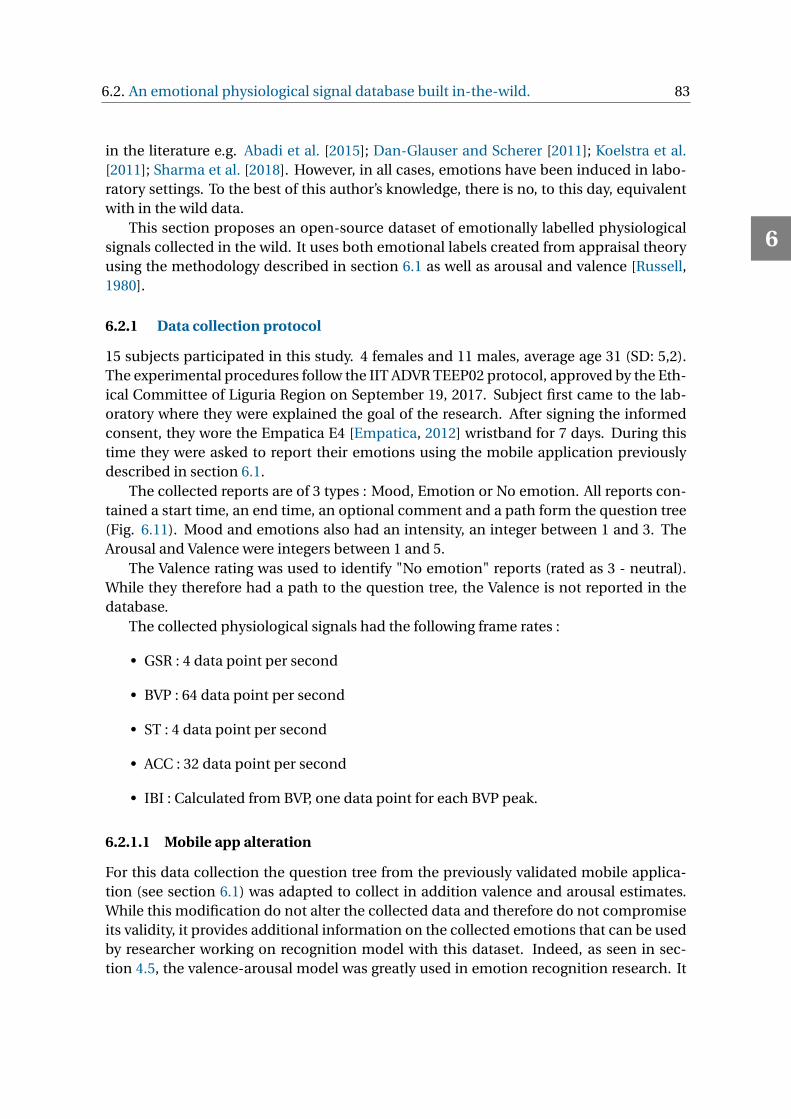
6.2. An emotional physiological signal database built in-the-wild. 83
in the literature e.g. Abadi et al. [2015]; Dan-Glauser and Scherer [2011]; Koelstra et al.[2011]; Sharma et al. [2018]. However, in all cases, emotions have been induced in labo-ratory settings. To the best of this author’s knowledge, there is no, to this day, equivalentwith in the wild data.
This section proposes an open-source dataset of emotionally labelled physiologicalsignals collected in the wild. It uses both emotional labels created from appraisal theoryusing the methodology described in section 6.1 as well as arousal and valence [Russell,1980].
6.2.1 Data collection protocol
15 subjects participated in this study. 4 females and 11 males, average age 31 (SD: 5,2).The experimental procedures follow the IIT ADVR TEEP02 protocol, approved by the Eth-ical Committee of Liguria Region on September 19, 2017. Subject first came to the lab-oratory where they were explained the goal of the research. After signing the informedconsent, they wore the Empatica E4 [Empatica, 2012] wristband for 7 days. During thistime they were asked to report their emotions using the mobile application previouslydescribed in section 6.1.
The collected reports are of 3 types : Mood, Emotion or No emotion. All reports con-tained a start time, an end time, an optional comment and a path form the question tree(Fig. 6.11). Mood and emotions also had an intensity, an integer between 1 and 3. TheArousal and Valence were integers between 1 and 5.
The Valence rating was used to identify "No emotion" reports (rated as 3 - neutral).While they therefore had a path to the question tree, the Valence is not reported in thedatabase.
The collected physiological signals had the following frame rates :
• GSR : 4 data point per second
• BVP : 64 data point per second
• ST : 4 data point per second
• ACC : 32 data point per second
• IBI : Calculated from BVP, one data point for each BVP peak.
6.2.1.1 Mobile app alteration
For this data collection the question tree from the previously validated mobile applica-tion (see section 6.1) was adapted to collect in addition valence and arousal estimates.While this modification do not alter the collected data and therefore do not compromiseits validity, it provides additional information on the collected emotions that can be usedby researcher working on recognition model with this dataset. Indeed, as seen in sec-tion 4.5, the valence-arousal model was greatly used in emotion recognition research. It
6
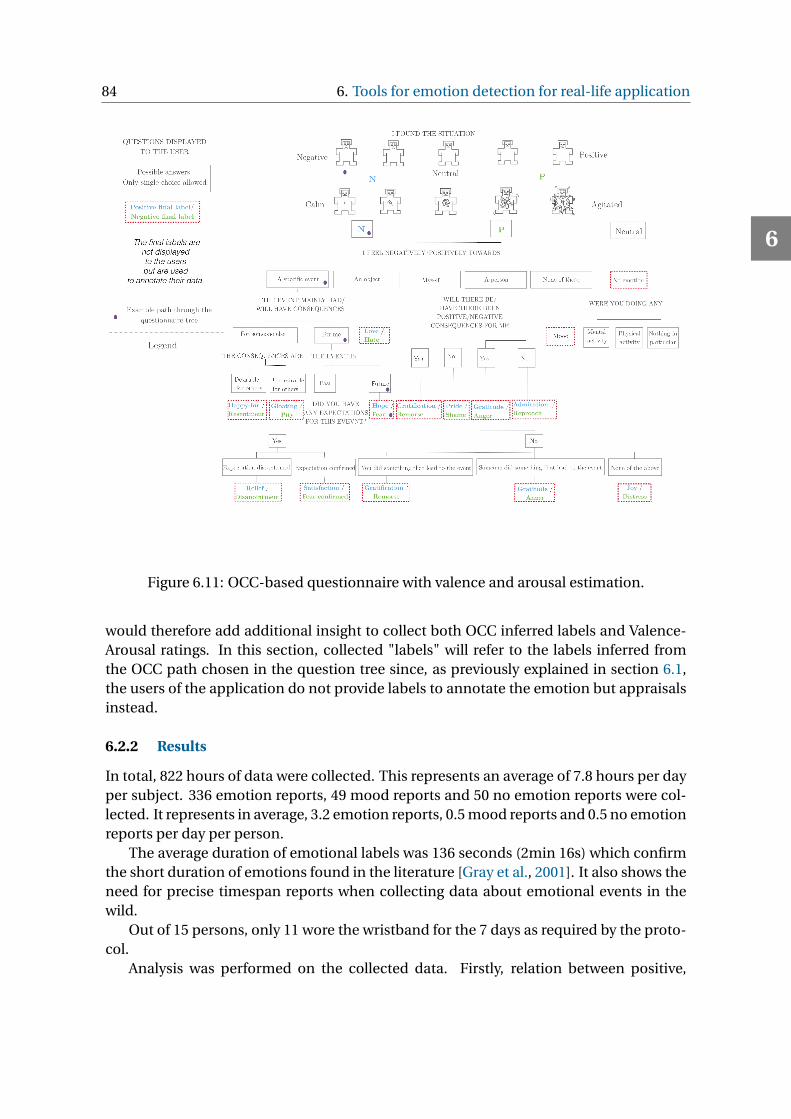
84 6. Tools for emotion detection for real-life application
Figure 6.11: OCC-based questionnaire with valence and arousal estimation.
would therefore add additional insight to collect both OCC inferred labels and Valence-Arousal ratings. In this section, collected "labels" will refer to the labels inferred fromthe OCC path chosen in the question tree since, as previously explained in section 6.1,the users of the application do not provide labels to annotate the emotion but appraisalsinstead.
6.2.2 Results
In total, 822 hours of data were collected. This represents an average of 7.8 hours per dayper subject. 336 emotion reports, 49 mood reports and 50 no emotion reports were col-lected. It represents in average, 3.2 emotion reports, 0.5 mood reports and 0.5 no emotionreports per day per person.
The average duration of emotional labels was 136 seconds (2min 16s) which confirmthe short duration of emotions found in the literature [Gray et al., 2001]. It also shows theneed for precise timespan reports when collecting data about emotional events in thewild.
Out of 15 persons, only 11 wore the wristband for the 7 days as required by the proto-col.
Analysis was performed on the collected data. Firstly, relation between positive,
6
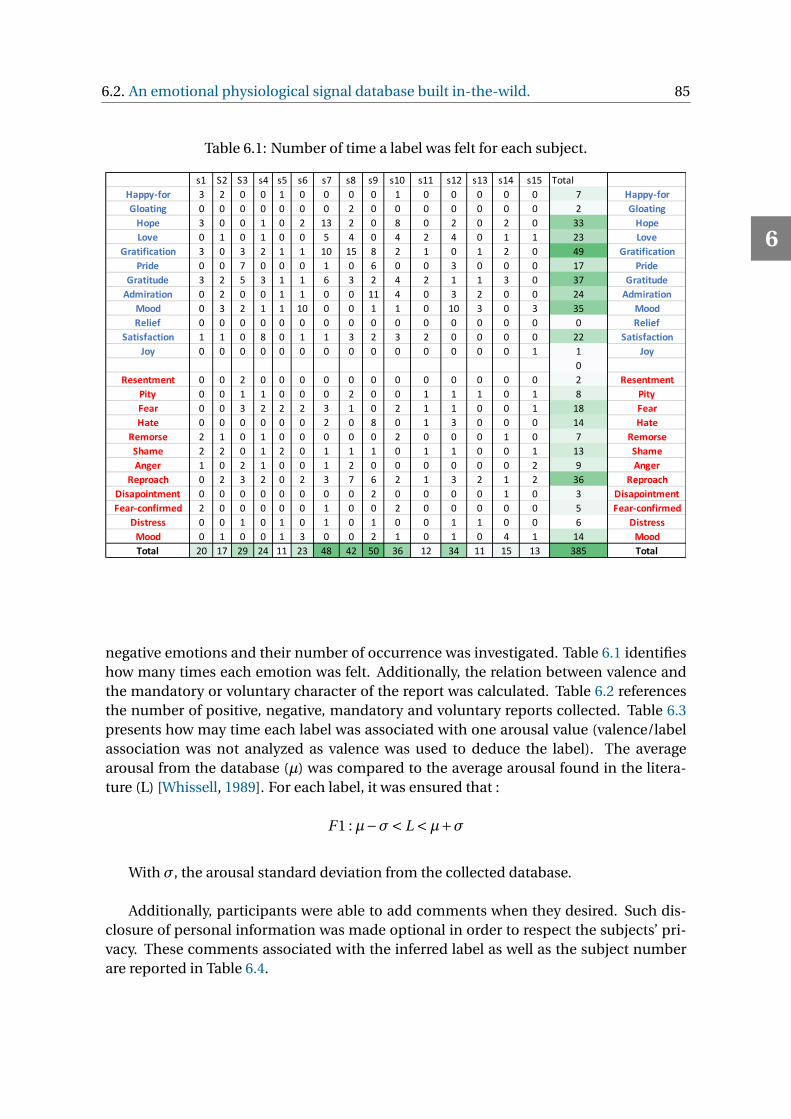
6.2. An emotional physiological signal database built in-the-wild. 85
Table 6.1: Number of time a label was felt for each subject.
s1 S2 S3 s4 s5 s6 s7 s8 s9 s10 s11 s12 s13 s14 s15 TotalHappy-for 3 2 0 0 1 0 0 0 0 1 0 0 0 0 0 7 Happy-forGloating 0 0 0 0 0 0 0 2 0 0 0 0 0 0 0 2 GloatingHope 3 0 0 1 0 2 13 2 0 8 0 2 0 2 0 33 HopeLove 0 1 0 1 0 0 5 4 0 4 2 4 0 1 1 23 Love
Gratification 3 0 3 2 1 1 10 15 8 2 1 0 1 2 0 49 GratificationPride 0 0 7 0 0 0 1 0 6 0 0 3 0 0 0 17 Pride
Gratitude 3 2 5 3 1 1 6 3 2 4 2 1 1 3 0 37 GratitudeAdmiration 0 2 0 0 1 1 0 0 11 4 0 3 2 0 0 24 Admiration
Mood 0 3 2 1 1 10 0 0 1 1 0 10 3 0 3 35 MoodRelief 0 0 0 0 0 0 0 0 0 0 0 0 0 0 0 0 Relief
Satisfaction 1 1 0 8 0 1 1 3 2 3 2 0 0 0 0 22 SatisfactionJoy 0 0 0 0 0 0 0 0 0 0 0 0 0 0 1 1 Joy
0Resentment 0 0 2 0 0 0 0 0 0 0 0 0 0 0 0 2 Resentment
Pity 0 0 1 1 0 0 0 2 0 0 1 1 1 0 1 8 PityFear 0 0 3 2 2 2 3 1 0 2 1 1 0 0 1 18 FearHate 0 0 0 0 0 0 2 0 8 0 1 3 0 0 0 14 Hate
Remorse 2 1 0 1 0 0 0 0 0 2 0 0 0 1 0 7 RemorseShame 2 2 0 1 2 0 1 1 1 0 1 1 0 0 1 13 ShameAnger 1 0 2 1 0 0 1 2 0 0 0 0 0 0 2 9 Anger
Reproach 0 2 3 2 0 2 3 7 6 2 1 3 2 1 2 36 ReproachDisapointment 0 0 0 0 0 0 0 0 2 0 0 0 0 1 0 3 DisapointmentFear-confirmed 2 0 0 0 0 0 1 0 0 2 0 0 0 0 0 5 Fear-confirmed
Distress 0 0 1 0 1 0 1 0 1 0 0 1 1 0 0 6 DistressMood 0 1 0 0 1 3 0 0 2 1 0 1 0 4 1 14 MoodTotal 20 17 29 24 11 23 48 42 50 36 12 34 11 15 13 385 Total
negative emotions and their number of occurrence was investigated. Table 6.1 identifieshow many times each emotion was felt. Additionally, the relation between valence andthe mandatory or voluntary character of the report was calculated. Table 6.2 referencesthe number of positive, negative, mandatory and voluntary reports collected. Table 6.3presents how may time each label was associated with one arousal value (valence/labelassociation was not analyzed as valence was used to deduce the label). The averagearousal from the database (µ) was compared to the average arousal found in the litera-ture (L) [Whissell, 1989]. For each label, it was ensured that :
F 1 :µ−σ< L <µ+σ
With σ, the arousal standard deviation from the collected database.
Additionally, participants were able to add comments when they desired. Such dis-closure of personal information was made optional in order to respect the subjects’ pri-vacy. These comments associated with the inferred label as well as the subject numberare reported in Table 6.4.
6
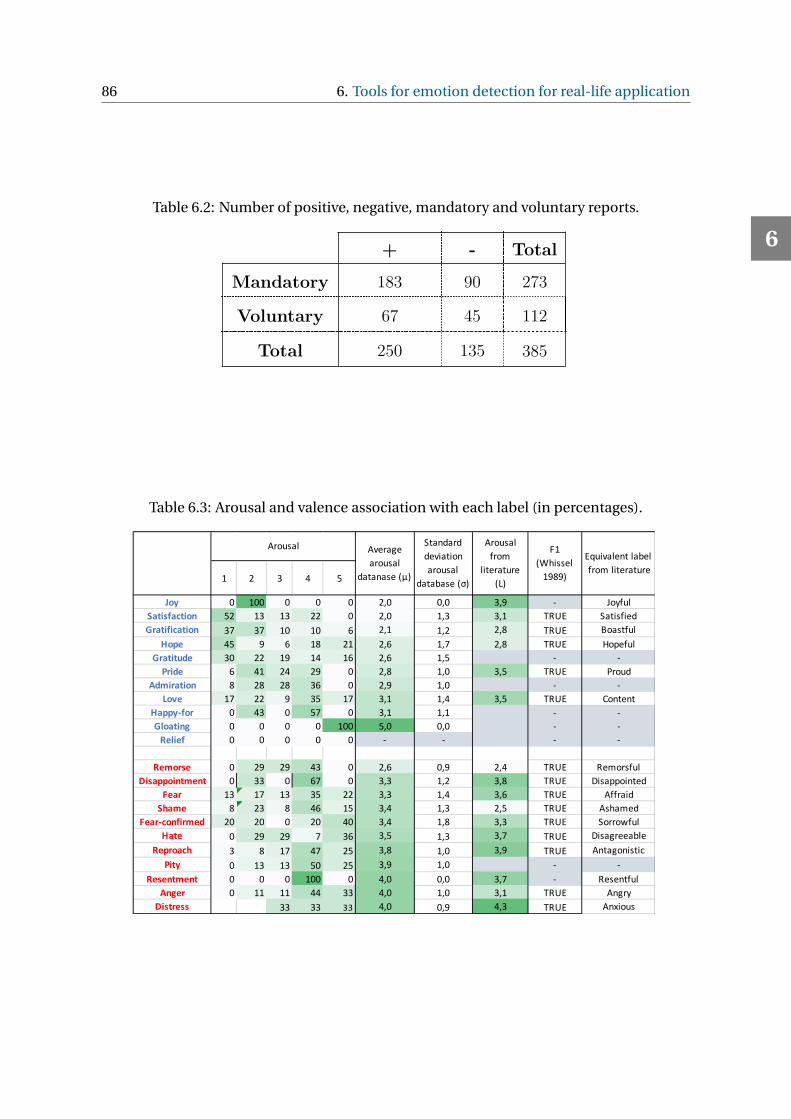
86 6. Tools for emotion detection for real-life application
Table 6.2: Number of positive, negative, mandatory and voluntary reports.
+ - Total
Mandatory 183 90 273
Voluntary 67 45 112
Total 250 135 385
Table 6.3: Arousal and valence association with each label (in percentages).
1 2 3 4 5
Joy 0 100 0 0 0 2,0 0,0 3,9 - JoyfulSatisfaction 52 13 13 22 0 2,0 1,3 3,1 TRUE SatisfiedGratification 37 37 10 10 6 2,1 1,2 2,8 TRUE Boastful
Hope 45 9 6 18 21 2,6 1,7 2,8 TRUE HopefulGratitude 30 22 19 14 16 2,6 1,5 - -Pride 6 41 24 29 0 2,8 1,0 3,5 TRUE Proud
Admiration 8 28 28 36 0 2,9 1,0 - -Love 17 22 9 35 17 3,1 1,4 3,5 TRUE Content
Happy-for 0 43 0 57 0 3,1 1,1 - -Gloating 0 0 0 0 100 5,0 0,0 - -Relief 0 0 0 0 0 - - - -
Remorse 0 29 29 43 0 2,6 0,9 2,4 TRUE RemorsfulDisappointment 0 33 0 67 0 3,3 1,2 3,8 TRUE Disappointed
Fear 13 17 13 35 22 3,3 1,4 3,6 TRUE AffraidShame 8 23 8 46 15 3,4 1,3 2,5 TRUE Ashamed
Fear-confirmed 20 20 0 20 40 3,4 1,8 3,3 TRUE SorrowfulHate 0 29 29 7 36 3,5 1,3 3,7 TRUE Disagreeable
Reproach 3 8 17 47 25 3,8 1,0 3,9 TRUE AntagonisticPity 0 13 13 50 25 3,9 1,0 - -
Resentment 0 0 0 100 0 4,0 0,0 3,7 - ResentfulAnger 0 11 11 44 33 4,0 1,0 3,1 TRUE AngryDistress 33 33 33 4,0 0,9 4,3 TRUE Anxious
Arousal Average arousal
datanase (µ)
Equivalent label from literature
Standarddeviation arousal
database (σ)
Arousal from
literature (L)
F1(Whissel
1989)
6
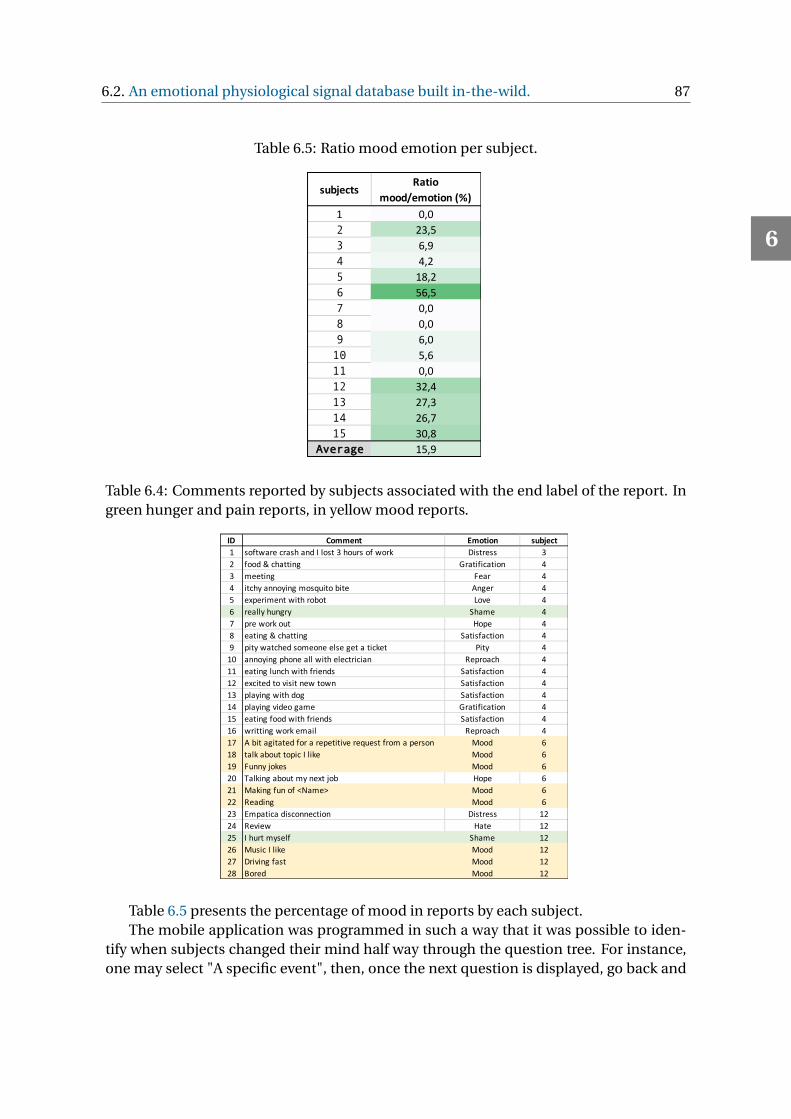
6.2. An emotional physiological signal database built in-the-wild. 87
Table 6.5: Ratio mood emotion per subject.
subjectsRatio
mood/emotion (%)1 0,02 23,53 6,94 4,25 18,26 56,57 0,08 0,09 6,010 5,611 0,012 32,413 27,314 26,715 30,8
Average 15,9
Table 6.4: Comments reported by subjects associated with the end label of the report. Ingreen hunger and pain reports, in yellow mood reports.
ID Comment Emotion subject1 software crash and I lost 3 hours of work Distress 32 food & chatting Gratification 43 meeting Fear 44 itchy annoying mosquito bite Anger 45 experiment with robot Love 46 really hungry Shame 47 pre work out Hope 48 eating & chatting Satisfaction 49 pity watched someone else get a ticket Pity 4
10 annoying phone all with electrician Reproach 411 eating lunch with friends Satisfaction 412 excited to visit new town Satisfaction 413 playing with dog Satisfaction 414 playing video game Gratification 415 eating food with friends Satisfaction 416 writting work email Reproach 417 A bit agitated for a repetitive request from a person Mood 618 talk about topic I like Mood 619 Funny jokes Mood 620 Talking about my next job Hope 621 Making fun of <Name> Mood 622 Reading Mood 623 Empatica disconnection Distress 1224 Review Hate 1225 I hurt myself Shame 1226 Music I like Mood 1227 Driving fast Mood 1228 Bored Mood 12
Table 6.5 presents the percentage of mood in reports by each subject.The mobile application was programmed in such a way that it was possible to iden-
tify when subjects changed their mind half way through the question tree. For instance,one may select "A specific event", then, once the next question is displayed, go back and
6
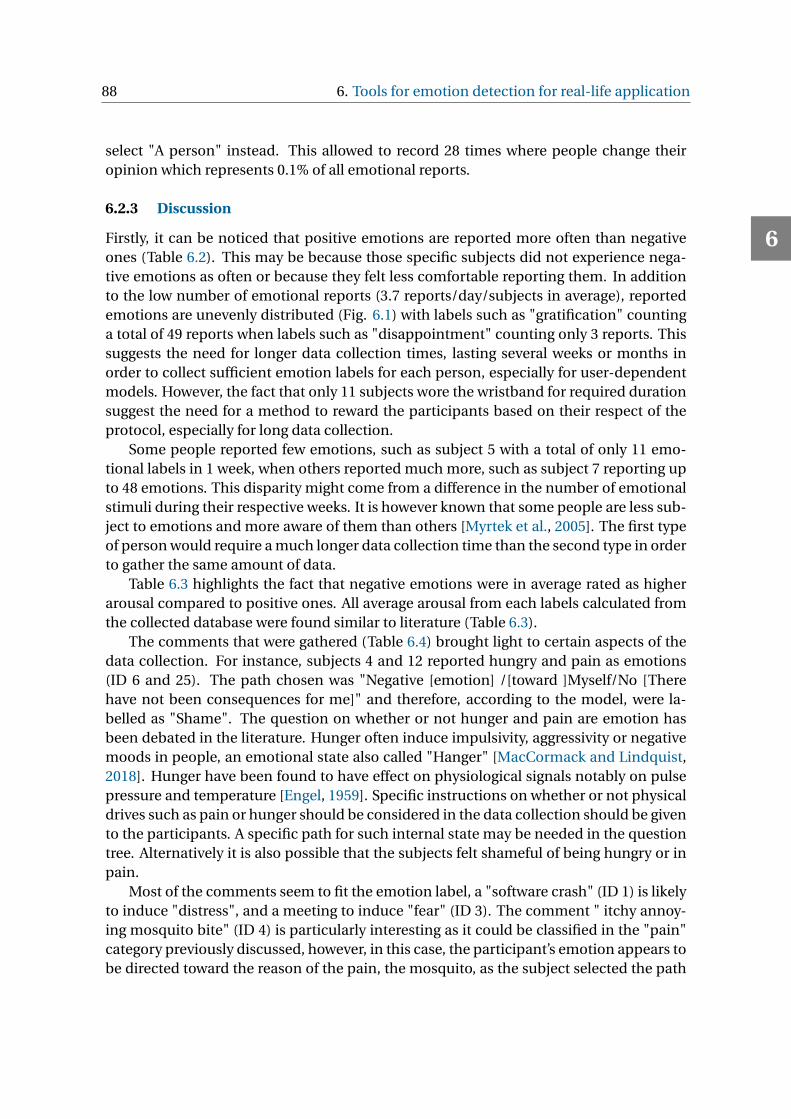
88 6. Tools for emotion detection for real-life application
select "A person" instead. This allowed to record 28 times where people change theiropinion which represents 0.1% of all emotional reports.
6.2.3 Discussion
Firstly, it can be noticed that positive emotions are reported more often than negativeones (Table 6.2). This may be because those specific subjects did not experience nega-tive emotions as often or because they felt less comfortable reporting them. In additionto the low number of emotional reports (3.7 reports/day/subjects in average), reportedemotions are unevenly distributed (Fig. 6.1) with labels such as "gratification" countinga total of 49 reports when labels such as "disappointment" counting only 3 reports. Thissuggests the need for longer data collection times, lasting several weeks or months inorder to collect sufficient emotion labels for each person, especially for user-dependentmodels. However, the fact that only 11 subjects wore the wristband for required durationsuggest the need for a method to reward the participants based on their respect of theprotocol, especially for long data collection.
Some people reported few emotions, such as subject 5 with a total of only 11 emo-tional labels in 1 week, when others reported much more, such as subject 7 reporting upto 48 emotions. This disparity might come from a difference in the number of emotionalstimuli during their respective weeks. It is however known that some people are less sub-ject to emotions and more aware of them than others [Myrtek et al., 2005]. The first typeof person would require a much longer data collection time than the second type in orderto gather the same amount of data.
Table 6.3 highlights the fact that negative emotions were in average rated as higherarousal compared to positive ones. All average arousal from each labels calculated fromthe collected database were found similar to literature (Table 6.3).
The comments that were gathered (Table 6.4) brought light to certain aspects of thedata collection. For instance, subjects 4 and 12 reported hungry and pain as emotions(ID 6 and 25). The path chosen was "Negative [emotion] /[toward ]Myself/No [Therehave not been consequences for me]" and therefore, according to the model, were la-belled as "Shame". The question on whether or not hunger and pain are emotion hasbeen debated in the literature. Hunger often induce impulsivity, aggressivity or negativemoods in people, an emotional state also called "Hanger" [MacCormack and Lindquist,2018]. Hunger have been found to have effect on physiological signals notably on pulsepressure and temperature [Engel, 1959]. Specific instructions on whether or not physicaldrives such as pain or hunger should be considered in the data collection should be givento the participants. A specific path for such internal state may be needed in the questiontree. Alternatively it is also possible that the subjects felt shameful of being hungry or inpain.
Most of the comments seem to fit the emotion label, a "software crash" (ID 1) is likelyto induce "distress", and a meeting to induce "fear" (ID 3). The comment " itchy annoy-ing mosquito bite" (ID 4) is particularly interesting as it could be classified in the "pain"category previously discussed, however, in this case, the participant’s emotion appears tobe directed toward the reason of the pain, the mosquito, as the subject selected the path
6
6.2. An emotional physiological signal database built in-the-wild. 89
"[I feel negatively toward ] A person" which resulted in the label "Anger". This showsthe advantages of using appraisal theory for labelling as this theory states that emotionsdo not depend of the event that brought the emotion but rather by the way the personexperienced it.
Table 6.4 also allows to notice the trend of certain subjects to always select " None ofthose" in the question tree resulting in a Mood label such as subjects 6 and 12. However,comments bring additional insights suggesting that this labelling might not be correctin certain cases. For instance, "A bit agitated for a repetitive request from a person" (ID17) could have probably be labelled as anger or reproach. It is surprising that this personwrote such a comment but did not pick the "person" or "event" categories. The causemight be that such participants were less able to understand the categories and were lessable to match the emotion to the category that were the most appropriate. It might alsobe a technique to answer the form quicker as no other question is asked after the "none ofthose" answer, however, it is less likely as those participants took the time to write a com-ment which was optional. Additionally, the subjects giving inconsistent comments werealso the ones with a disproportionally high ratio of mood reports compared to emotionreports (Table 6.5). Indeed, while the average number of moods report is 17%, subject6 reported more moods than emotions (56%) and subject 12 reported an unusually highamount of moods (32%). While the "none of those" option was added to the questiontree in order to detect mood as they are unconstrained in meaning (see section 6.1.5.3 ) ,it seems that it might be necessary to rename it "Nothing" in order to avoid participantsselecting "None of those" when their emotion is constrained in meaning but they thinkthat it does not match with the other options. In this way they would most probably bemore willing to analyze the situation and try to find the most appropriate category be-tween "An event", "An object", "Myself", "A person". Unfortunately, only 4 participantsdecided to use comments, which constrained the possibilities of analysis.
On the one hand, the mandatory reports were rated as emotion 56% of the time and78% of the emotional reports were mandatory, which highlights the usefulness of themandatory prompts as they allowed to collect many additional emotional reports to thedatabase. On the other hand, 10% of the mandatory reports were labelled as mood and88% of the Mood labels were picked in mandatory reports. The reason is most probablythat participants feel the need to provide an emotion report when a mandatory trigger israised. However, those reports appear to be mainly of moods. This findings confirms theneed for differentiating moods from emotions in the question tree to validate emotionalreports especially mandatory ones.
A high number of times subjects seemed to have change their mind half way throughthe question tree. It is likely that by reading the next question they realized that this pathwas probably not appropriate for their emotion and that another path would be a betterfit. It would be interesting to reproduce this experiment adding post-experiment inter-views to ask the thought process behind the change to understand it better. It is interest-ing to notice that those changes only occurred at the first layer of the OCC tree.
Finally, the Empatica E4 wristband that was used in this data collection resulted inmany disconnection due to Bluetooth sensibility. Unfortunately, the Empatica API did
6
90 6. Tools for emotion detection for real-life application
not provide the possibility to save the data internally until the connection was restoredor to automatically reconnect once the Bluetooth device was in range again. This re-sulted in a significant amount of lost data. The mobile application was designed to alertthe user of this disconnection through vibrations, however, subjects reported leaving theroom without the mobile phone and returning long time later, only then realizing theiroversight and loosing many hours of data. Subjects also reported many disconnectionsand need for reconnection to be irritating. A different device including both automaticreconnection and internal data saving would be advised for future research.
The collected database is made open-source [Larradet, 2019a] and might be used byfuture researchers to unravel the challenges of emotion detection in the wild. It proposesa large spectrum of emotional labels rarely used in emotion studies nowadays.
6.3 Conclusions
Based on the in-the-wild methodology presented in chapter 4, a new tool was proposedto collect and label physiological signals, acquired during relevant events in ecologicalsettings. This solution was designed according to appraisal theories, allowing the userto self-report the whole appraisal process around relevant events. The system is able toprompt the user to report the emotional self-assessment. The hypothesis is that the pos-sibility of precise selection of relevant events timing and duration, the assistance given tothe user to differentiate moods from emotions and the ability to report appraisals insteadof emotion labels will improve the quality of the dataset compared to standard paper-type collection.
To our knowledge, this is the first app for emotion reporting based on appraisal theory.It is open-source [Larradet, 2019a] and can be used by other researchers to extend theexisting dataset. It provides the novel methodology to evaluate the physiological datacollection of emotions in the wild. It allows to collect application-independent datasetcontaining an increased number of information about the emotional trigger and a greatvariability of label without it being cumbersome for the user. The same dataset might beused in the future, e.g., to create different application-specific classifiers, by choosing therelevant subset of the appraisals and emotional labels. The increased information of theevent accessed thanks to the use of appraisal theory, allow researchers to make informeddecision about how to use each event according to the need of their research. This studywas published in the Ubicomp 2019 conference [Larradet et al., 2019].
This mobile application was used to collect data from a great number of subjects tocreate an open-source database of emotionally labelled physiological signals collected inthe wild. It was collected using a state of the art mobile application to ensure groundtruth. Both appraisals and valence-arousal sets were collected. Analysis of the datashowed that a single week of data collection might not be enough for user-dependent de-tection or classification models. Participants reported consequently more positive emo-tions than negative ones and some subject reported much more emotions as a wholecompared to others. Negative emotions were found to be associated to higher arousal inaverage compared to positive ones. Additionally, it was found that specifications must be
6
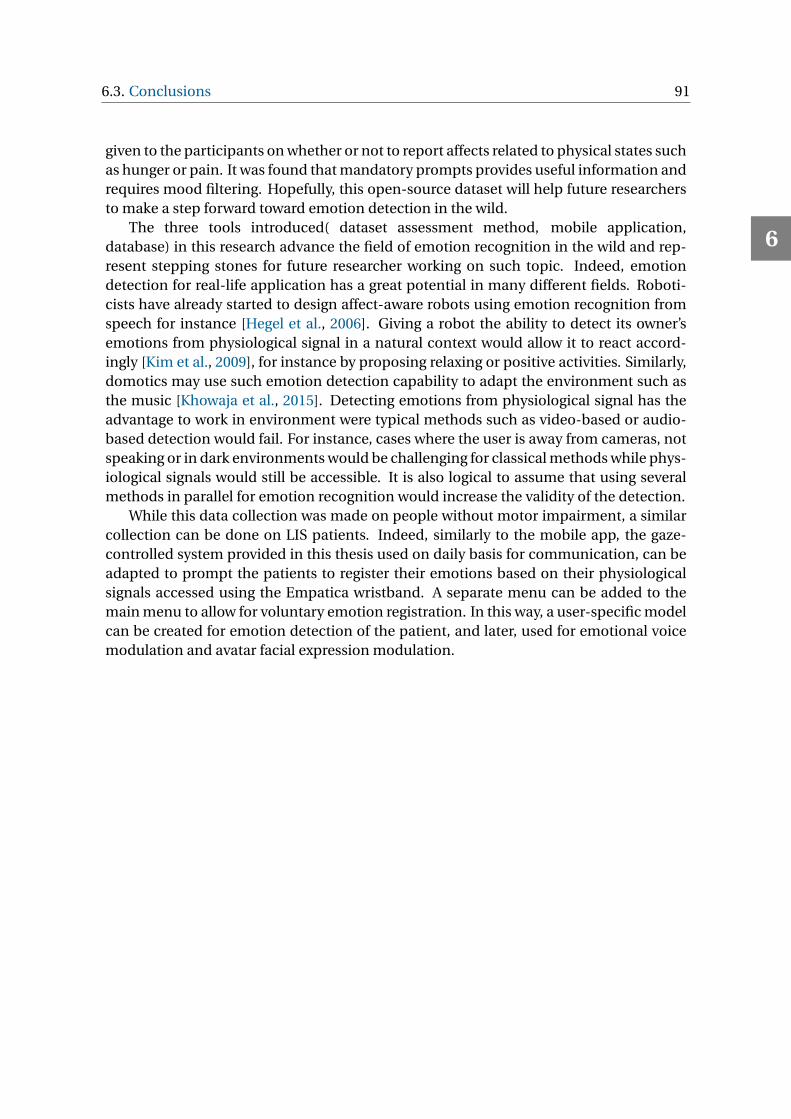
6.3. Conclusions 91
given to the participants on whether or not to report affects related to physical states suchas hunger or pain. It was found that mandatory prompts provides useful information andrequires mood filtering. Hopefully, this open-source dataset will help future researchersto make a step forward toward emotion detection in the wild.
The three tools introduced( dataset assessment method, mobile application,database) in this research advance the field of emotion recognition in the wild and rep-resent stepping stones for future researcher working on such topic. Indeed, emotiondetection for real-life application has a great potential in many different fields. Roboti-cists have already started to design affect-aware robots using emotion recognition fromspeech for instance [Hegel et al., 2006]. Giving a robot the ability to detect its owner’semotions from physiological signal in a natural context would allow it to react accord-ingly [Kim et al., 2009], for instance by proposing relaxing or positive activities. Similarly,domotics may use such emotion detection capability to adapt the environment such asthe music [Khowaja et al., 2015]. Detecting emotions from physiological signal has theadvantage to work in environment were typical methods such as video-based or audio-based detection would fail. For instance, cases where the user is away from cameras, notspeaking or in dark environments would be challenging for classical methods while phys-iological signals would still be accessible. It is also logical to assume that using severalmethods in parallel for emotion recognition would increase the validity of the detection.
While this data collection was made on people without motor impairment, a similarcollection can be done on LIS patients. Indeed, similarly to the mobile app, the gaze-controlled system provided in this thesis used on daily basis for communication, can beadapted to prompt the patients to register their emotions based on their physiologicalsignals accessed using the Empatica wristband. A separate menu can be added to themain menu to allow for voluntary emotion registration. In this way, a user-specific modelcan be created for emotion detection of the patient, and later, used for emotional voicemodulation and avatar facial expression modulation.
6
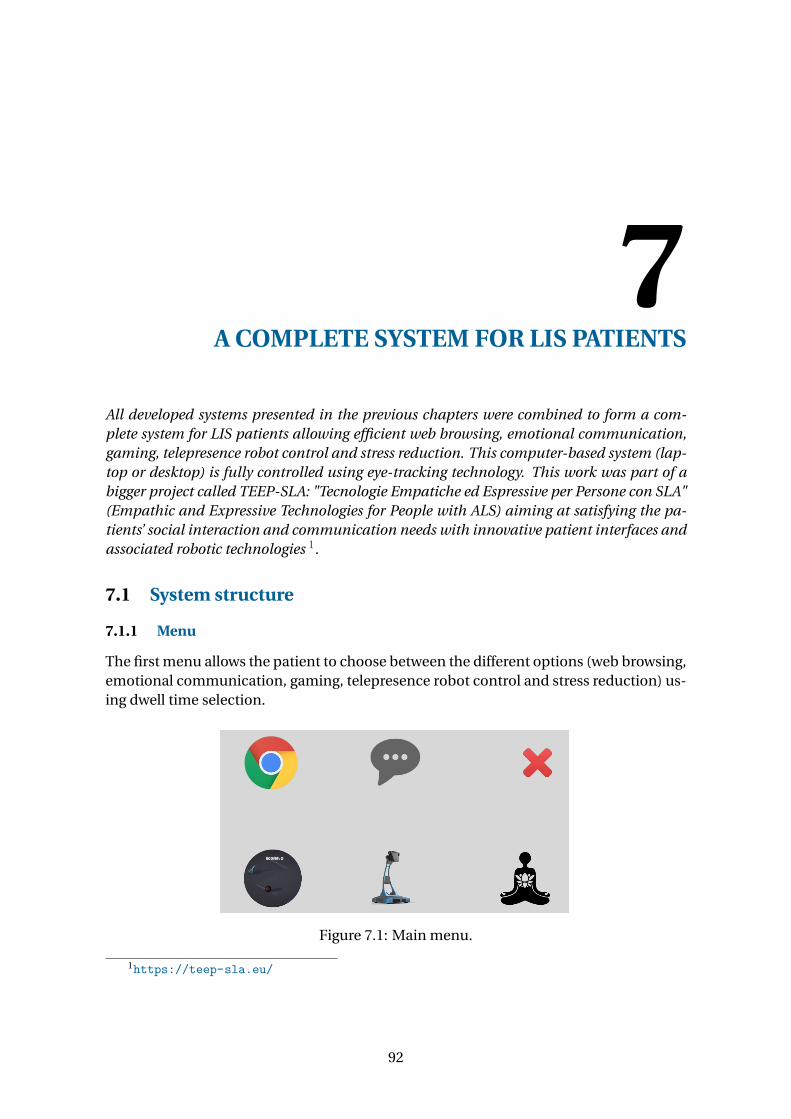
7A COMPLETE SYSTEM FOR LIS PATIENTS
All developed systems presented in the previous chapters were combined to form a com-plete system for LIS patients allowing efficient web browsing, emotional communication,gaming, telepresence robot control and stress reduction. This computer-based system (lap-top or desktop) is fully controlled using eye-tracking technology. This work was part of abigger project called TEEP-SLA: "Tecnologie Empatiche ed Espressive per Persone con SLA"(Empathic and Expressive Technologies for People with ALS) aiming at satisfying the pa-tients’ social interaction and communication needs with innovative patient interfaces andassociated robotic technologies 1.
7.1 System structure
7.1.1 Menu
The first menu allows the patient to choose between the different options (web browsing,emotional communication, gaming, telepresence robot control and stress reduction) us-ing dwell time selection.
Figure 7.1: Main menu.
1https://teep-sla.eu/
92
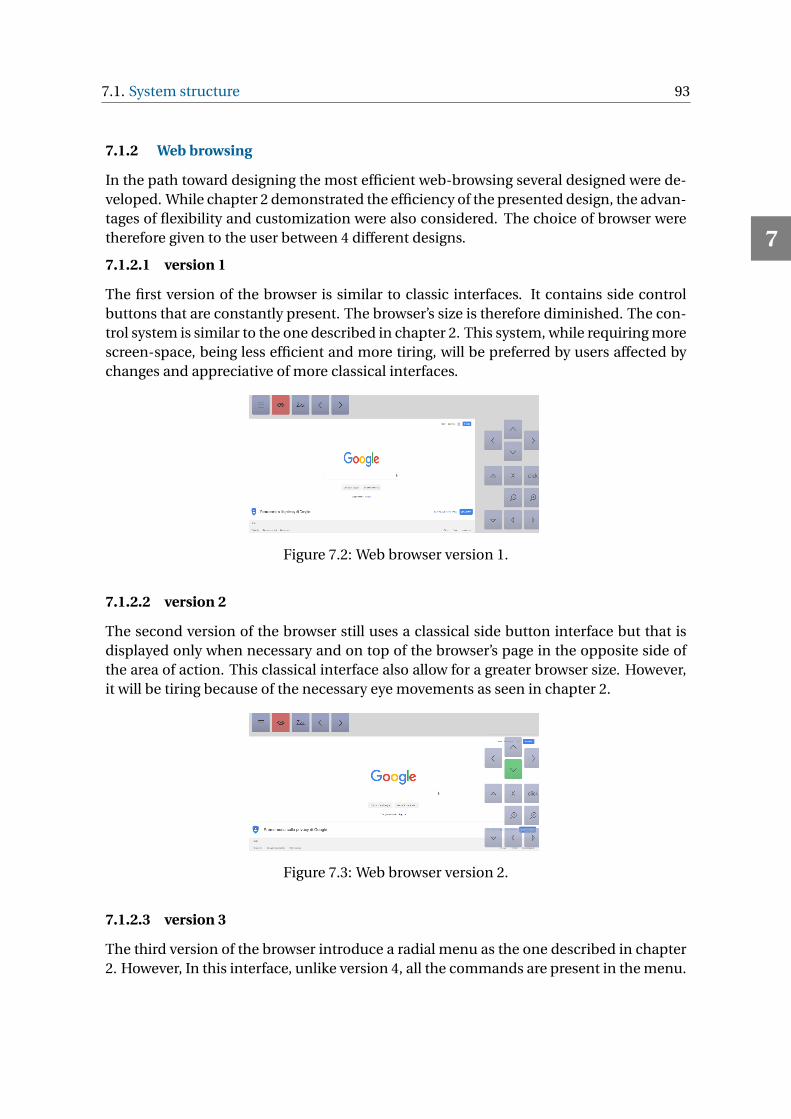
7.1. System structure 93
7.1.2 Web browsing
In the path toward designing the most efficient web-browsing several designed were de-veloped. While chapter 2 demonstrated the efficiency of the presented design, the advan-tages of flexibility and customization were also considered. The choice of browser weretherefore given to the user between 4 different designs.
7.1.2.1 version 1
The first version of the browser is similar to classic interfaces. It contains side controlbuttons that are constantly present. The browser’s size is therefore diminished. The con-trol system is similar to the one described in chapter 2. This system, while requiring morescreen-space, being less efficient and more tiring, will be preferred by users affected bychanges and appreciative of more classical interfaces.
Figure 7.2: Web browser version 1.
7.1.2.2 version 2
The second version of the browser still uses a classical side button interface but that isdisplayed only when necessary and on top of the browser’s page in the opposite side ofthe area of action. This classical interface also allow for a greater browser size. However,it will be tiring because of the necessary eye movements as seen in chapter 2.
Figure 7.3: Web browser version 2.
7.1.2.3 version 3
The third version of the browser introduce a radial menu as the one described in chapter2. However, In this interface, unlike version 4, all the commands are present in the menu.
7
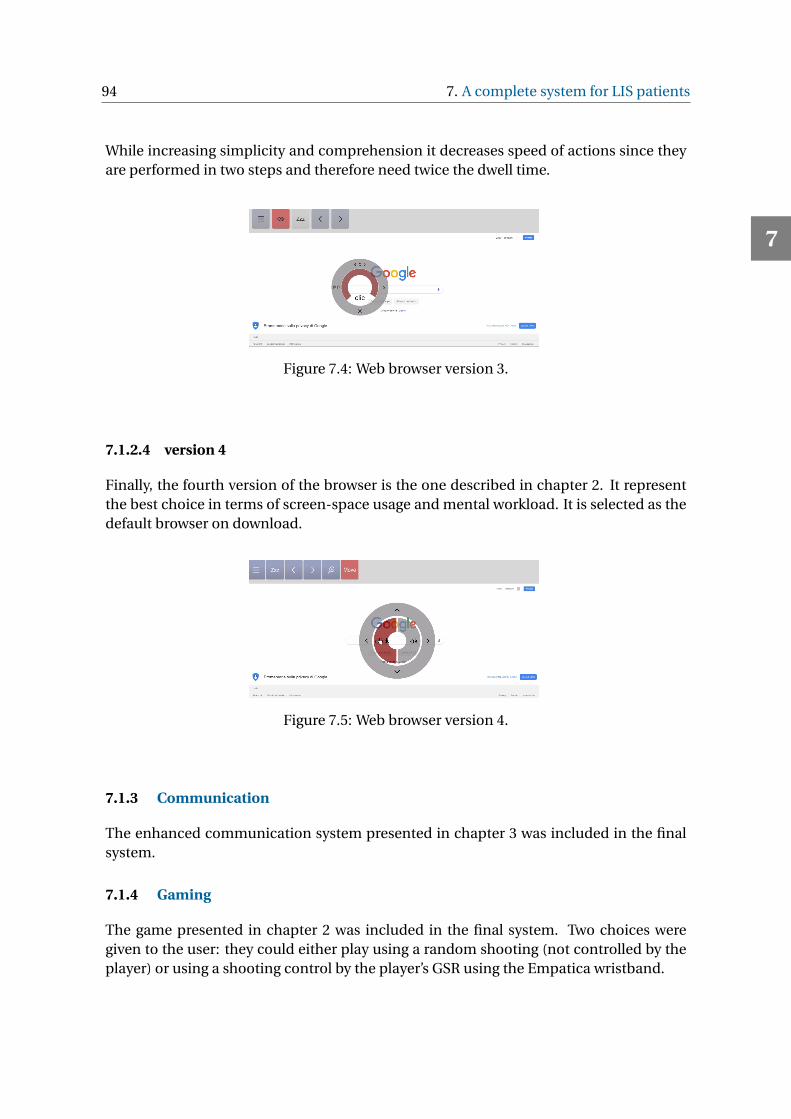
94 7. A complete system for LIS patients
While increasing simplicity and comprehension it decreases speed of actions since theyare performed in two steps and therefore need twice the dwell time.
Figure 7.4: Web browser version 3.
7.1.2.4 version 4
Finally, the fourth version of the browser is the one described in chapter 2. It representthe best choice in terms of screen-space usage and mental workload. It is selected as thedefault browser on download.
Figure 7.5: Web browser version 4.
7.1.3 Communication
The enhanced communication system presented in chapter 3 was included in the finalsystem.
7.1.4 Gaming
The game presented in chapter 2 was included in the final system. Two choices weregiven to the user: they could either play using a random shooting (not controlled by theplayer) or using a shooting control by the player’s GSR using the Empatica wristband.
7
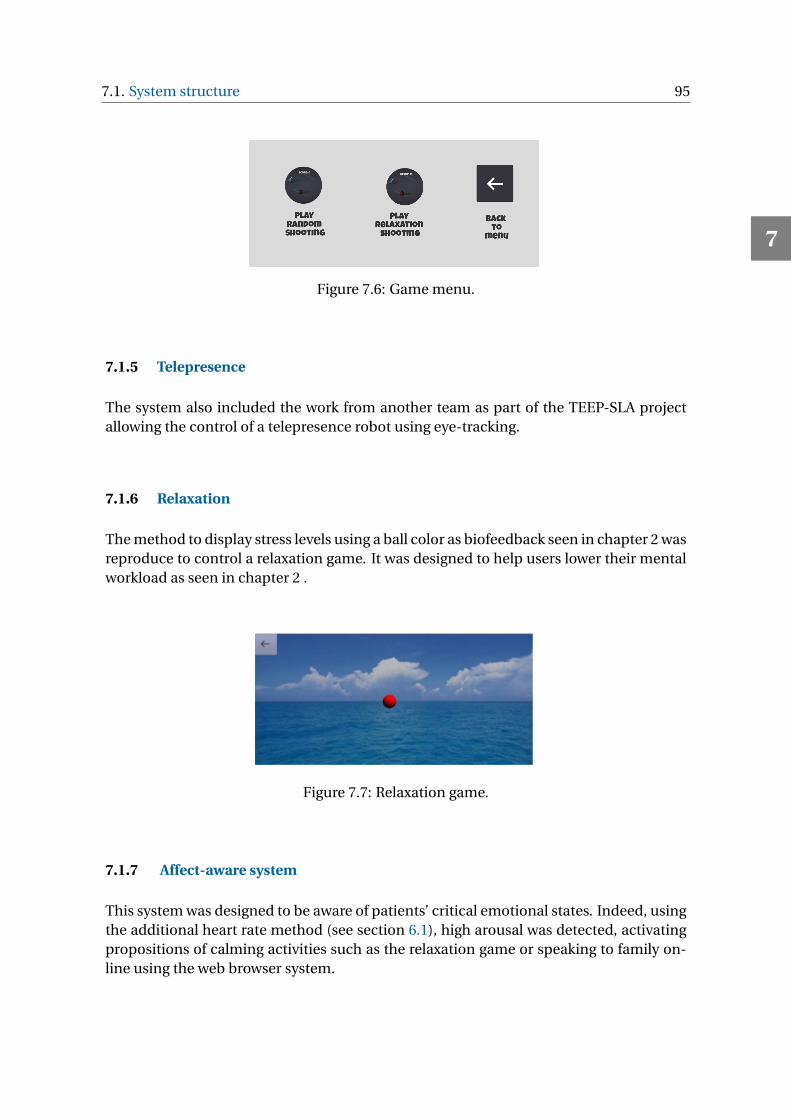
7.1. System structure 95
Figure 7.6: Game menu.
7.1.5 Telepresence
The system also included the work from another team as part of the TEEP-SLA projectallowing the control of a telepresence robot using eye-tracking.
7.1.6 Relaxation
The method to display stress levels using a ball color as biofeedback seen in chapter 2 wasreproduce to control a relaxation game. It was designed to help users lower their mentalworkload as seen in chapter 2 .
Figure 7.7: Relaxation game.
7.1.7 Affect-aware system
This system was designed to be aware of patients’ critical emotional states. Indeed, usingthe additional heart rate method (see section 6.1), high arousal was detected, activatingpropositions of calming activities such as the relaxation game or speaking to family on-line using the web browser system.
7
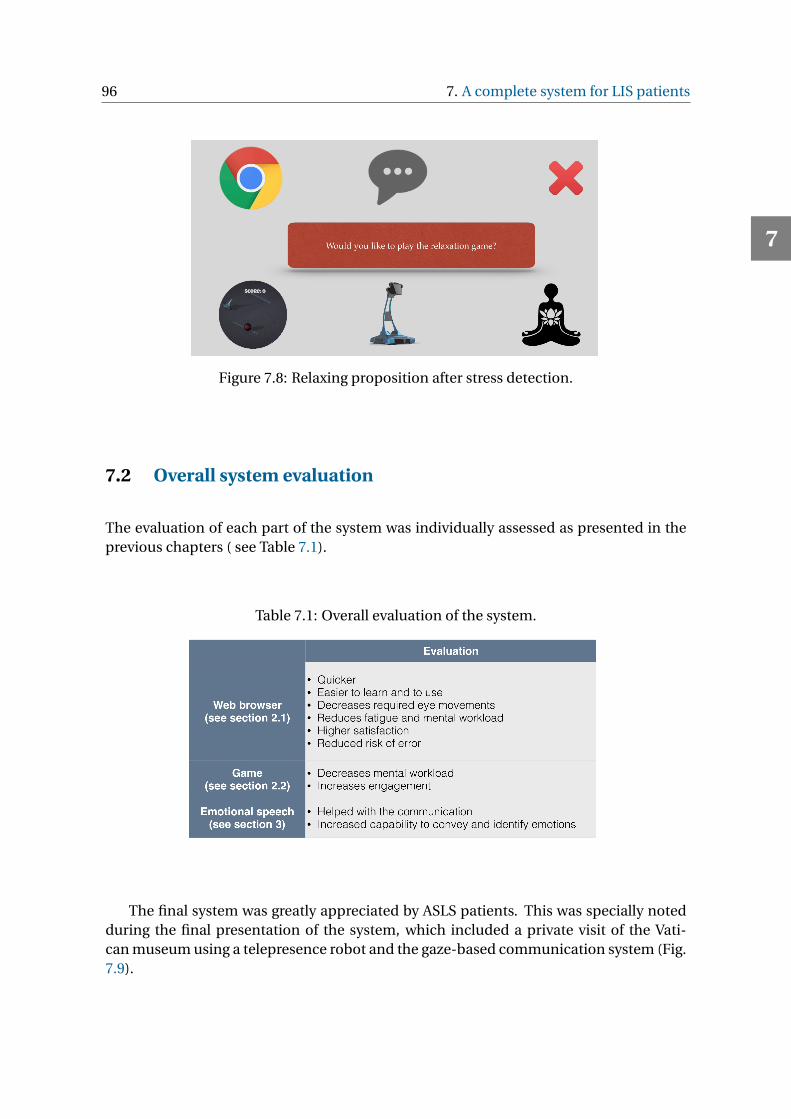
96 7. A complete system for LIS patients
Figure 7.8: Relaxing proposition after stress detection.
7.2 Overall system evaluation
The evaluation of each part of the system was individually assessed as presented in theprevious chapters ( see Table 7.1).
Table 7.1: Overall evaluation of the system.
The final system was greatly appreciated by ASLS patients. This was specially notedduring the final presentation of the system, which included a private visit of the Vati-can museum using a telepresence robot and the gaze-based communication system (Fig.7.9).
7
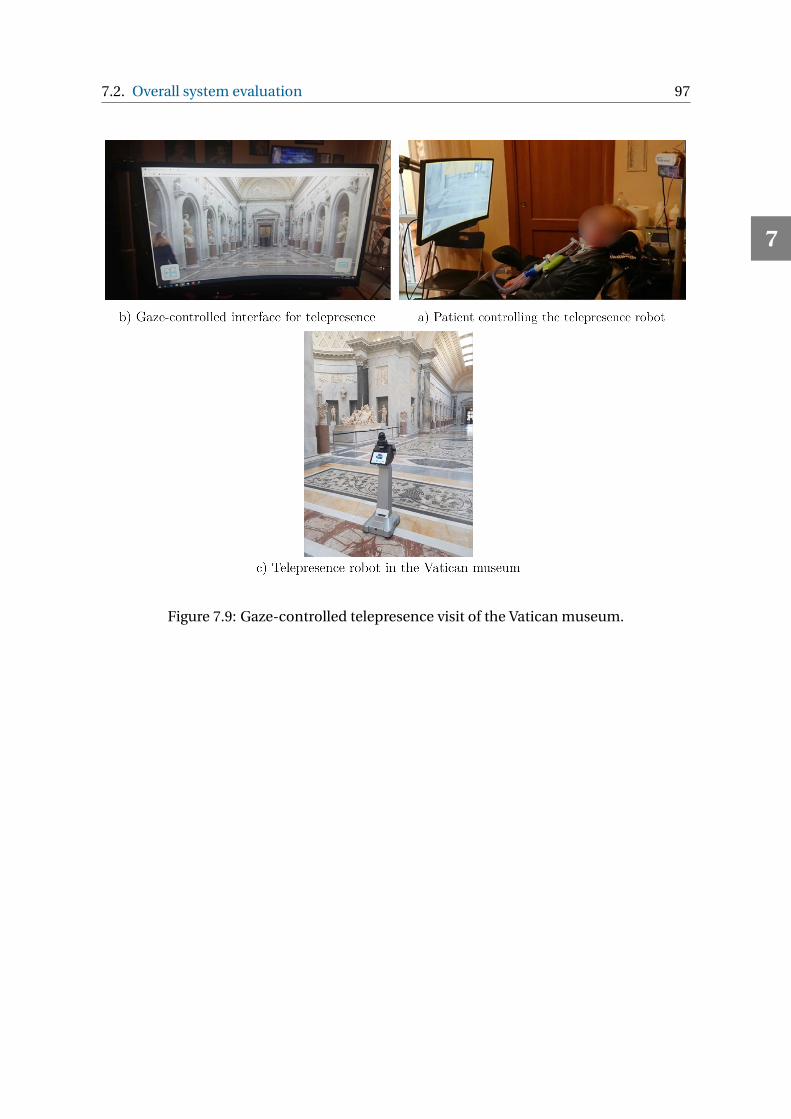
7.2. Overall system evaluation 97
Figure 7.9: Gaze-controlled telepresence visit of the Vatican museum.
7
8CONCLUSIONS AND FUTURE WORK
People with LIS have reduced capabilities due to their loss of movements. Systems avail-able to such patients are limited and can be tiring when used for long periods of time.This thesis aimed at improving computer system control and enhancing communicationfor people with LIS.
Firstly, gaze-based system control was improved by proposing a novel web-browsinginterface using a menu centered in the area of action. This solution was found to improvethe action-speed and reduce mental workload. Users found this interface easy to learnand to use, less frustrating, more satisfying and less prone to error. It was found to induceless fatigue stress and discomfort in the eyes. Using this concept, a dedicated video gamecontrolled by eye gaze was designed. The player’s stress level was estimated from GSRand represented by the character color. The users appeared to be capable of voluntarilycontrolling their stress level to activate a specific UI in the game. This biofeedback dis-play associated with the reward following the relaxation was found to decrease mentalworkload. These findings represent new solutions for LIS dedicated computer interfaces.Their abilities being limited, interfaces design matter much more to ensure a satisfyingexperience. Developing, testing and comparing different GUIs with both healthy subjectsand patients allows to better understand their needs and helps to determine the advan-tages and disadvantages of each solution. Exploring new types of input can increase thepatients abilities and open the door to different and more empathic user interfaces.
The main concern for LIS patients is communication. Their inability to speak makethem dependent of novel communication systems or technologies to express themselves.While common systems allow users to communicate through eye gaze commands, theyrarely involve any emotion communication system that is intrinsic to human-human ex-changes. A novel solution was developed simulating humans most natural emotion ex-pression: voice modulation and facial expression. Users were given control of an emo-tional voice synthesis as well as an emotional avatar. This solution allowed user to havemore natural dialog and to better express their emotions.
While this system was found to help with the communication, it seems that it couldbe improved by automatically detecting emotions from the user rather than manually
98
8.0. Conclusions and future work 99
selecting the emotion. However, this would require an emotion detection model ableto recognize the patients’ emotion for real-life applications. However, to this day veryfew studies have been conducted outside the laboratory and there is still a long way togo before detecting emotions in real-life. In order to help toward this goal, several toolswere developed and made available to the scientific community. Firstly a method wasproposed to assess emotion, mood and stress detection based on their readiness towardreal-life applications. Secondly, an open-source mobile application was designed usingpsychology concepts and state of the art guidelines to help gathering valuable groundtruth from users when collecting emotional self-reports. Finally, this mobile applicationwas used to collect a large dataset of emotionally labelled physiological data in the wild.
Those tools are made open-source in order to help future researchers willing to makea step toward detecting emotion in the wild. The data labelling was purposely broadenough and informative enough to be used by different types of research. State of theart machine learning methods may be applied in the future to this dataset to detect orclassify emotions in the wild whether it is from valence and arousal, emotion labels orappraisals. While emotion detection may be used for enhancing communication for LISpatients, it would be especially useful to build systems for total LIS patients that lost thereeye movement capabilities. Indeed, today their communication abilities are reduced tobinaryEEG systems [Mir et al., 2019] or no communication at all. Providing the patient’sfamily and caregivers the ability to visualize their emotional state via tools such as theavatar system presented in chapter 3 would be a great improvement to understand theaffective states of such patients. Emotion recognition in the wild may also be applied toa great range of other types of applications such as healthcare, self-awareness, roboticsor domotics. It would open new doors to have affect-aware systems in our lives. A finalsystem was made available open-source to patients including all the developed noveltools.
Being in Locked-in state represent an every-day challenge. Fortunately, thanks totechnology we have the power to provide new solutions to such patients and to improvetheir daily life. It is to be hoped that future technological development will allow addi-tional solutions to enable even greater capabilities in such patients.
8
REFERENCES
Abadi, M. K., Subramanian, R., Kia, S. M., Avesani, P., Patras, I., and Sebe, N. (2015). Decaf:Meg-based multimodal database for decoding affective physiological responses. IEEETransactions on Affective Computing, 6(3):209–222. 49, 83
Adams, P., Rabbi, M., Rahman, T., Matthews, M., Voida, A., Gay, G., Choudhury, T., andVoida, S. (2014). Towards personal stress informatics: comparing minimally invasivetechniques for measuring daily stress in the wild. In Proceedings of the 8th Interna-tional Conference on Pervasive Computing Technologies for Healthcare, pages 72–79.ICST (Institute for Computer Sciences, Social-Informatics and . . . . 61
Ahsberg, E., Gamberale, F., and Gustafsson, K. (2000). Perceived fatigue after mental work:an experimental evaluation of a fatigue inventory. Ergonomics, 43(2):252–268. 7
Al-Fudail, M. and Mellar, H. (2008). Investigating teacher stress when using technology.Computers & Education, 51(3):1103–1110. 58
AlZoubi, O., D’Mello, S. K., and Calvo, R. A. (2012). Detecting naturalistic expressions ofnonbasic affect using physiological signals. IEEE Transactions on Affective Computing,3(3):298–310. 42, 65
Amodio, D. M., Zinner, L. R., and Harmon-Jones, E. (2007). Social psychological methodsof emotion elicitation. Handbook of emotion elicitation and assessment, 91:91–105. 42
Aparicio, A. (2015). Immobilis in mobili: performing arts, bci, and locked-in syndrome.Brain-Computer Interfaces, 2(2-3):150–159. 37
Arnold, M. B. (1960). Emotion and personality.
Arthur, K. C., Calvo, A., Price, T. R., Geiger, J. T., Chio, A., and Traynor, B. J. (2016). Projectedincrease in amyotrophic lateral sclerosis from 2015 to 2040. Nature communications,7:12408.
Baek, H. J., Lee, H. B., Kim, J. S., Choi, J. M., Kim, K. K., and Park, K. S. (2009). Nonintru-sive biological signal monitoring in a car to evaluate a driver’s stress and health state.Telemedicine and e-Health, 15(2):182–189. 57
Baldassarri, S., Rubio, J. M., Azpiroz, M. G., and Cerezo, E. (2014). Araboard: A multiplat-form alternative and augmentative communication tool. Procedia Computer Science,27:197–206. 29
100
8
8.0. REFERENCES 101
Barresi, G., Tessadori, J., Schiatti, L., Mazzanti, D., Caldwell, D. G., and Mattos, L. S. (2016).Focus-sensitive dwell time in eyebci: Pilot study. In 8th Computer Science and Elec-tronic Engineering (CEEC), pages 54–59. IEEE. 15, 20
Bartneck, C. (2002). Integrating the occ model of emotions in embodied characters. InWorkshop on Virtual Conversational Characters, pages 39–48. Citeseer. 73
Bassano, C., Ballestin, G., Ceccaldi, E., Larradet, F. I., Mancini, M., Volta, E., andNiewiadomski, R. (2019). A vr game-based system for multimodal emotion data col-lection. In Motion, Interaction and Games, page 38. ACM. 71
Bauer, G., Gerstenbrand, F., and Rumpl, E. (1979). Varieties of the locked-in syndrome.Journal of neurology, 221(2):77–91.
Baveye, Y., Dellandréa, E., Chamaret, C., and Chen, L. (2015). Liris-accede: A videodatabase for affective content analysis. IEEE Transactions on Affective Computing,6(1):43–55.
Best, D. S. and Duchowski, A. T. (2016). A rotary dial for gaze-based pin entry. In Proceed-ings of the Ninth Biennial ACM Symposium on Eye Tracking Research & Applications,pages 69–76. ACM.
BITalino (2013). Bitalino. https://bitalino.com/ (accessed 4 September 2019).
Block, R. A., Hancock, P. A., and Zakay, D. (2010). How cognitive load affects durationjudgments: A meta-analytic review. Acta psychologica, 134(3):330–343. 24
Botella, C., Rey, A., Perpiñá, C., Baños, R., Alcaniz, M., Garcia-Palacios, A., Villa, H., andAlozano, J. (1999). Differences on presence and reality judgment using a high impactworkstation and a pc workstation. Cyberpsychology & Behavior, 2(1):49–52.
Bradley, M. M. and Lang, P. J. (1994). Measuring emotion: the self-assessment manikinand the semantic differential. Journal of behavior therapy and experimental psychiatry,25(1):49–59. 46
Britton, B. K., Richardson, D., Smith, S. S., and Hamilton, T. (1983). Ethical aspects of par-ticipating in psychology experiments: Effects of anonymity on evaluation, and com-plaints of distressed subjects. Teaching of Psychology, 10(3):146–149. 45
Burkhardt, F. (2005). Emofilt: the simulation of emotional speech by prosody-transformation. In Ninth European Conference on Speech Communication and Tech-nology. 28, 31
Carroll, E. A., Czerwinski, M., Roseway, A., Kapoor, A., Johns, P., Rowan, K., and Schrae-fel, M. (2013). Food and mood: Just-in-time support for emotional eating. In 2013Humaine Association Conference on Affective Computing and Intelligent Interaction,pages 252–257. IEEE. 56, 73, 75
8
102 8. REFERENCES
Castellano, G., Villalba, S. D., and Camurri, A. (2007). Recognising human emotions frombody movement and gesture dynamics. In International Conference on Affective Com-puting and Intelligent Interaction, pages 71–82. Springer. 39, 41, 69
Cebeci, B., Celikcan, U., and Capin, T. K. (2019). A comprehensive study of the affectiveand physiological responses induced by dynamic virtual reality environments. Com-puter Animation and Virtual Worlds, page e1893.
Chaffar, S. and Frasson, C. (2004). Using an emotional intelligent agent to improve thelearner’s performance. In Proceedings of the Workshop on Social and Emotional Intel-ligence in Learning Environments in conjunction with Intelligent Tutoring Systems.
Chanel, G., Rebetez, C., Bétrancourt, M., and Pun, T. (2011). Emotion assessment fromphysiological signals for adaptation of game difficulty. IEEE Transactions on Systems,Man, and Cybernetics-Part A: Systems and Humans, 41(6):1052–1063. 20
Chirico, A., Cipresso, P., Riva, G., and Gaggioli, A. (2018). A process for selecting and vali-dating awe-inducing audio-visual stimuli. In Oliver, N., Serino, S., Matic, A., Cipresso,P., Filipovic, N., and Gavrilovska, L., editors, Pervasive Computing Paradigms for MentalHealth, pages 19–27, Cham. Springer International Publishing. 69, 70, 71
Chirico, A., Cipresso, P., Yaden, D. B., Biassoni, F., Riva, G., and Gaggioli, A. (2017). Ef-fectiveness of immersive videos in inducing awe: an experimental study. ScientificReports, 7(1):1218. 70, 71
Chirico, A., Yaden, D. B., Riva, G., and Gaggioli, A. (2016). The potential of virtual realityfor the investigation of awe. Frontiers in Psychology, 7:1766.
Clore, G. L., Gasper, K., and Garvin, E. (2001). Affect as information. Handbook of affectand social cognition, pages 121–144. 47
Clore, G. L. and Ortony, A. (2013). Psychological construction in the occ model of emo-tion. Emotion Review, 5(4):335–343. 78
Cole, T. (1995). Acting: A handbook of the Stanislavski method. Three Rivers Press. 41
Conati, C. (2002). Probabilistic assessment of user’s emotions in educational games. Ap-plied artificial intelligence, 16(7-8):555–575. 73
Conati, C. and Zhou, X. (2002). Modeling students’ emotions from cognitive appraisal ineducational games. In Cerri, S. A., Gouardères, G., and Paraguaçu, F., editors, IntelligentTutoring Systems, pages 944–954, Berlin, Heidelberg. Springer Berlin Heidelberg. 64
Constantine, L. and Hajj, H. (2012). A survey of ground-truth in emotion data annotation.In 2012 IEEE International Conference on Pervasive Computing and CommunicationsWorkshops, pages 697–702. IEEE. 39
8
8.0. REFERENCES 103
Dan-Glauser, E. S. and Scherer, K. R. (2011). The geneva affective picture database(gaped): a new 730-picture database focusing on valence and normative significance.Behavior research methods, 43(2):468. 42, 49, 83
De Geus, E. J. and Van Doornen, L. J. (1996). Ambulatory assessment of parasym-pathetic/sympathetic balance by impedance cardiography. Ambulatory assessment:Computer-assisted psychological and psychophysiological methods in monitoring andfield studies, pages 141–163. 51
De Santos Sierra, A., Ávila, C. S., Casanova, J. G., and del Pozo, G. B. (2011). A stress-detection system based on physiological signals and fuzzy logic. IEEE Transactions onIndustrial Electronics, 58(10):4857–4865. 43
Devillers, L., Vidrascu, L., and Lamel, L. (2005). Challenges in real-life emotion annota-tion and machine learning based detection. Neural Networks, 18(4):407–422. 40
Dhall, A., Goecke, R., Joshi, J., Wagner, M., and Gedeon, T. (2013). Emotion recognition inthe wild challenge 2013. In Proceedings of the 15th ACM on International conference onmultimodal interaction, pages 509–516. ACM. 40
Diemer, J., Alpers, G. W., Peperkorn, H. M., Shiban, Y., and Mühlberger, A. (2015). Theimpact of perception and presence on emotional reactions: a review of research invirtual reality. Frontiers in psychology, 6:26. 63
Diemer, J., Mühlberger, A., Pauli, P., and Zwanzger, P. (2014). Virtual reality exposurein anxiety disorders: impact on psychophysiological reactivity. The World Journal ofBiological Psychiatry, 15(6):427–442. 63
Dikecligil, G. N. and Mujica-Parodi, L. R. (2010). Ambulatory and challenge-associatedheart rate variability measures predict cardiac responses to real-world acute emotionalstress. Biological psychiatry, 67(12):1185–1190. 42, 43, 57
Dillon, A., Kelly, M., Robertson, I. H., and Robertson, D. A. (2016). Smartphone applica-tions utilizing biofeedback can aid stress reduction. Frontiers in Psychology, 7. 20
Dobbins, C. and Fairclough, S. (2017). A mobile lifelogging platform to measure anxi-ety and anger during real-life driving. In 2017 IEEE International Conference on Perva-sive Computing and Communications Workshops (PerCom Workshops), pages 327–332.IEEE.
Dobbins, C., Fairclough, S., Lisboa, P., and Navarro, F. F. G. (2018). A lifelogging platformtowards detecting negative emotions in everyday life using wearable devices. In 2018IEEE International Conference on Pervasive Computing and Communications Work-shops (PerCom Workshops), pages 306–311. IEEE. 55
Ekman, R. (1997). What the face reveals: Basic and applied studies of spontaneous ex-pression using the Facial Action Coding System (FACS). Oxford University Press, USA.41
8
104 8. REFERENCES
El Ayadi, M., Kamel, M. S., and Karray, F. (2011). Survey on speech emotion recognition:Features, classification schemes, and databases. Pattern Recognition, 44(3):572–587.39, 41
Empatica (2012). E4. https://www.empatica.com/en-eu/research/e4/ (accessed 4september 2019). 75, 83
Engel, B. T. (1959). Some physiological correlates of hunger and pain. Journal of experi-mental psychology, 57(6):389. 88
Equivital (2012). Eq02 lifemonitor. https://www.equivital.com (accessed 4 September2019).
Exler, A., Schankin, A., Klebsattel, C., and Beigl, M. (2016). A wearable system for mood as-sessment considering smartphone features and data from mobile ecgs. In Proceedingsof the 2016 ACM international joint conference on pervasive and ubiquitous computing:Adjunct, pages 1153–1161. ACM. 60
Fabri, M., Moore, D. J., and Hobbs, D. J. (1999). The emotional avatar: Non-verbal com-munication between inhabitants of collaborative virtual environments. In Interna-tional gesture workshop, pages 269–273. Springer. 28
Fasel, B. and Luettin, J. (2003). Automatic facial expression analysis: a survey. Patternrecognition, 36(1):259–275. 39
Feel (2015). Feel. https://www.myfeel.co/ (accessed 4 September 2019).
Fehring, R. J. (1983). Effects of biofeedback-aided relaxation on the psychological stresssymptoms of college students. Nursing Research, 32(6):362–366. 22
Fenz, W. D. and Epstein, S. (1967). Gradients of physiological arousal in parachutists as afunction of an approaching jump. Psychosomatic medicine, 29(1):33–51. 57
Fischer, A. H. and Roseman, I. J. (2007). Beat them or ban them: The characteristics andsocial functions of anger and contempt. Journal of personality and social psychology,93(1):103.
Foerster, F., Smeja, M., and Fahrenberg, J. (1999). Detection of posture and motion byaccelerometry: a validation study in ambulatory monitoring. Computers in HumanBehavior, 15(5):571–583. 49
Fontaine, J. R., Scherer, K. R., and Soriano, C. (2013). Components of emotional meaning:A sourcebook. Oxford University Press. 71
Fox, E., Cahill, S., and Zougkou, K. (2010). Preconscious processing biases predict emo-tional reactivity to stress. Biological psychiatry, 67(4):371–377. 42
Frijda, N. H. (1986). The emotions. Cambridge University Press.
8
8.0. REFERENCES 105
Frijda, N. H. (1993). The place of appraisal in emotion. Cognition & Emotion, 7(3-4):357–387.
Ge, Z., Prasad, P., Costadopoulos, N., Alsadoon, A., Singh, A., and Elchouemi, A.(2016). Evaluating the accuracy of wearable heart rate monitors. In 2016 2nd In-ternational Conference on Advances in Computing, Communication, & Automation(ICACCA)(Fall), pages 1–6. IEEE. 48, 69
Girardi, D., Lanubile, F., and Novielli, N. (2017). Emotion detection using noninvasivelow cost sensors. In 2017 Seventh International Conference on Affective Computing andIntelligent Interaction (ACII), pages 125–130. 69
Gjoreski, M., Gjoreski, H., Luštrek, M., and Gams, M. (2016). Continuous stress detectionusing a wrist device: in laboratory and real life. In Proceedings of the 2016 ACM In-ternational Joint Conference on Pervasive and Ubiquitous Computing: Adjunct, pages1185–1193. ACM. 55
Gjoreski, M., Luštrek, M., Gams, M., and Gjoreski, H. (2017). Monitoring stress with awrist device using context. Journal of biomedical informatics, 73:159–170. 52, 74, 77
Glowinski, D., Mancini, M., and Camurri, A. (2013). Studying the effect of creative jointaction on musicians’ behavior. In International Conference on Arts and Technology,pages 113–119. Springer. 68
Granka, L. A., Joachims, T., and Gay, G. (2004). Eye-tracking analysis of user behavior inWWW search. In Proceedings of the 27th annual international ACM SIGIR conferenceon Research and development in information retrieval, pages 478–479. ACM.
Gray, E. K., Watson, D., Payne, R., and Cooper, C. (2001). Emotion, mood, and temper-ament: Similarities, differences, and a synthesis. Emotions at work: Theory, researchand applications for management, pages 21–43. 47, 74, 76, 84
Green, P. J. and Suls, J. (1996). The effects of caffeine on ambulatory blood pressure, heartrate, and mood in coffee drinkers. Journal of behavioral medicine, 19(2):111–128. 47
Grossman, P. (2004). The lifeshirt: a multi-function ambulatory system monitoringhealth, disease, and medical intervention in the real world. Stud Health Technol In-form, 108:133–141. 58
g.tec (2000). g.mobilab+. http://www.gtec.at/Products/Hardware-and-Accessories/g.MOBIlab-Specs-Features (accessed 4 September 2019).
Harmon-Jones, E. and Sigelman, J. (2001). State anger and prefrontal brain activity: Ev-idence that insult-related relative left-prefrontal activation is associated with experi-enced anger and aggression. Journal of personality and social psychology, 80(5):797.42
8
106 8. REFERENCES
Hassellund, S. S., Flaa, A., Sandvik, L., Kjeldsen, S. E., and Rostrup, M. (2010). Long-term stability of cardiovascular and catecholamine responses to stress tests: an 18-yearfollow-up study. Hypertension, 55(1):131–136. 43
Healey, J., Nachman, L., Subramanian, S., Shahabdeen, J., and Morris, M. (2010). Out ofthe lab and into the fray: towards modeling emotion in everyday life. In InternationalConference on Pervasive Computing, pages 156–173. Springer. 40, 46, 56, 73, 75, 76
Healey, J., Picard, R. W., et al. (2005). Detecting stress during real-world driving tasksusing physiological sensors. IEEE Transactions on intelligent transportation systems,6(2):156–166. 43, 48, 56
Hegel, F., Spexard, T., Wrede, B., Horstmann, G., and Vogt, T. (2006). Playing a differentimitation game: Interaction with an empathic android robot. In 2006 6th IEEE-RASInternational Conference on Humanoid Robots, pages 56–61. IEEE. 91
Hernandez, J., Morris, R. R., and Picard, R. W. (2011). Call center stress recognition withperson-specific models. In International Conference on Affective Computing and Intel-ligent Interaction, pages 125–134. Springer. 55
Hertzum, M. and Holmegaard, K. D. (2013). Perceived time as a measure of mental work-load: Effects of time constraints and task success. International Journal of Human-Computer Interaction, 29(1):26–39. 23
Hirschberg, J. and Manning, C. D. (2015). Advances in natural language processing. Sci-ence, 349(6245):261–266. 39
Hoque, M. E., McDuff, D. J., and Picard, R. W. (2012). Exploring temporal patterns inclassifying frustrated and delighted smiles. IEEE Transactions on Affective Computing,3(3):323–334. 41
Hovsepian, K., al’Absi, M., Ertin, E., Kamarck, T., Nakajima, M., and Kumar, S. (2015).cstress: towards a gold standard for continuous stress assessment in the mobile envi-ronment. In Proceedings of the 2015 ACM international joint conference on pervasiveand ubiquitous computing, pages 493–504. ACM. 40, 55, 74, 75
Huckauf, A. and Urbina, M. H. (2008). Gazing with peyes: towards a universal input forvarious applications. In Proceedings of the 2008 symposium on Eye tracking research &applications, pages 51–54. ACM. 10, 12
Isomursu, M., Tähti, M., Väinämö, S., and Kuutti, K. (2007). Experimental evaluation offive methods for collecting emotions in field settings with mobile applications. Inter-national Journal of Human-Computer Studies, 65(4):404–418. 74, 75
ItSeez3D (2014). Avatarsdk. https://avatarsdk.com (accessed 31 July 2019). 32
Izard, C. E. (1977). Human emotions. New York: Plenum. 42
8
8.0. REFERENCES 107
Jacob, R. J. K. (1993). Eye movement-based human-computer interaction techniques:Toward non-command interfaces. Advances in human-computer interaction, 4:151–190. 7
Jacob, R. J. K. (1995). Eye tracking in advanced interface design. Virtual environmentsand advanced interface design, pages 258–288. 1, 5, 31
Jacob, R. J. K. and Karn, K. S. (2003). Eye tracking in human-computer interaction andusability research: Ready to deliver the promises. In The mind’s eye, pages 573–605.Elsevier.
Jaeschke, R., Singer, J., and Guyatt, G. H. (1990). A comparison of seven-point and visualanalogue scales: data from a randomized trial. Controlled clinical trials, 11(1):43–51.15
Jawbone (2006). jawbone. https://www.jawbone.com/ (accessed 4 September 2019).
Jerritta, S., Murugappan, M., Nagarajan, R., and Wan, K. (2011). Physiological signalsbased human emotion recognition: a review. In 2011 IEEE 7th International Collo-quium on Signal Processing and its Applications, pages 410–415. IEEE. 38, 39, 43, 45
Johnston, D. W. and Anastasiades, P. (1990). The relationship between heart rate andmood in real life. Journal of psychosomatic research, 34(1):21–27. 57
Johnstone, T. (1996). Emotional speech elicited using computer games. In Proceeding ofFourth International Conference on Spoken Language Processing. ICSLP’96, volume 3,pages 1985–1988. IEEE. 64
Kahneman, D., Diener, E., and Schwarz, N. (1999). Well-being: Foundations of hedonicpsychology. Russell Sage Foundation. 47
Kanjo, E., Younis, E. M., and Sherkat, N. (2018). Towards unravelling the relationshipbetween on-body, environmental and emotion data using sensor information fusionapproach. Information Fusion, 40:18–31. 60
Kappas, A. and Pecchinenda, A. (1999). Brief report don’t wait for the monsters to getyou: A video game task to manipulate appraisals in real time. Cognition and Emotion,13(1):119–124. 64
Karlsson, K., Niemelä, P., and Jonsson, A. (2011). Heart rate as a marker of stress in am-bulance personnel: a pilot study of the body’s response to the ambulance alarm. Pre-hospital and disaster medicine, 26(1):21–26. 58
Karthikeyan, P., Murugappan, M., and Yaacob, S. (2011). A review on stress inducementstimuli for assessing human stress using physiological signals. In 2011 IEEE 7th Inter-national Colloquium on Signal Processing and its Applications, pages 420–425. IEEE.43
8
108 8. REFERENCES
Karumuri, S., Niewiadomski, R., Volpe, G., and Camurri, A. (2019). From motions to emo-tions: Classification of affect from dance movements using deep learning. In ExtendedAbstracts of the 2019 CHI Conference on Human Factors in Computing Systems, CHI EA’19, pages LBW0231:1–LBW0231:6, New York, NY, USA. ACM.
Khasnobish, A., Gavas, R., Chatterjee, D., Raj, V., and Naitam, S. (2017). EyeAssist: Acommunication aid through gaze tracking for patients with neuro-motor disabilities.In Pervasive Computing and Communications Workshops (PerCom Workshops), 2017IEEE International Conference on, pages 382–387. IEEE.
Khowaja, S. A., Dahri, K., Kumbhar, M. A., and Soomro, A. M. (2015). Facial expressionrecognition using two-tier classification and its application to smart home automationsystem. In 2015 International Conference on Emerging Technologies (ICET), pages 1–6.IEEE. 91
Kiernan, M. C., Vucic, S., Cheah, B. C., Turner, M. R., Eisen, A., Hardiman, O., Burrell, J. R.,and Zoing, M. C. (2011). Amyotrophic lateral sclerosis. The lancet, 377(9769):942–955.1, 5
Kim, E. H., Kwak, S. S., and Kwak, Y. K. (2009). Can robotic emotional expressions inducea human to empathize with a robot? In RO-MAN 2009-The 18th IEEE InternationalSymposium on Robot and Human Interactive Communication, pages 358–362. IEEE.42, 91
Kim, J. and André, E. (2008). Emotion recognition based on physiological changesin music listening. IEEE transactions on pattern analysis and machine intelligence,30(12):2067–2083. 42
Kim, J. and Fesenmaier, D. R. (2015). Measuring emotions in real time: Implications fortourism experience design. Journal of Travel Research, 54(4):419–429. 59
Kim, K. H., Bang, S. W., and Kim, S. R. (2004). Emotion recognition system using short-term monitoring of physiological signals. Medical and biological engineering and com-puting, 42(3):419–427. 42
Kimhy, D., Delespaul, P., Ahn, H., Cai, S., Shikhman, M., Lieberman, J. A., Malaspina, D.,and Sloan, R. P. (2009). Concurrent measurement of “real-world” stress and arousal inindividuals with psychosis: assessing the feasibility and validity of a novel methodol-ogy. Schizophrenia bulletin, 36(6):1131–1139. 58
Kocielnik, R., Sidorova, N., Maggi, F. M., Ouwerkerk, M., and Westerink, J. H. (2013). Smarttechnologies for long-term stress monitoring at work. In Proceedings of the 26th IEEEInternational Symposium on Computer-Based Medical Systems, pages 53–58. IEEE. 61,75
8
8.0. REFERENCES 109
Koelstra, S., Muhl, C., Soleymani, M., Lee, J.-S., Yazdani, A., Ebrahimi, T., Pun, T., Nijholt,A., and Patras, I. (2011). Deap: A database for emotion analysis; using physiologicalsignals. IEEE transactions on affective computing, 3(1):18–31. 49, 83
Kondaveeti, S. A., Vidyapu, S., and Bhattacharya, S. (2016). Improved gaze likelihoodbased web browsing. In Proceedings of the 8th Indian Conference on Human ComputerInteraction, pages 84–89. ACM. 6
Kory, J. M. and D’Mello, S. K. (2015). Affect elicitation for affective. The Oxford handbookof affective computing, page 371. 41
Kostis, J., Moreyra, A., Amendo, M., Di Pietro, J., Cosgrove, N., and Kuo, P. (1982). Theeffect of age on heart rate in subjects free of heart disease. studies by ambulatory elec-trocardiography and maximal exercise stress test. Circulation, 65(1):141–145. 43
Kret, M. E. and De Gelder, B. (2012). A review on sex differences in processing emotionalsignals. Neuropsychologia, 50(7):1211–1221. 43, 46
Kusserow, M., Amft, O., and Tröster, G. (2012a). Modeling arousal phases in daily livingusing wearable sensors. IEEE Transactions on Affective Computing, 4(1):93–105. 58
Kusserow, M., Amft, O., and Tröster, G. (2012b). Monitoring stress arousal in the wild.IEEE Pervasive Computing, 12(2):28–37. 57
Labonte-LeMoyne, É., Courtemanche, F., Fredette, M., and Léger, P.-M. (2018). How wildis too wild: Lessons learned and recommendations for ecological validity in physiolog-ical computing research. In PhyCS, pages 123–130. 53
Lambie, J. A. and Marcel, A. J. (2002). Consciousness and the varieties of emotion experi-ence: A theoretical framework. Psychological review, 109(2):219.
Lang, P. J., Bradley, M. M., and Cuthbert, B. N. (2008). International affective picturesystem (iaps): affective ratings of pictures and instruction manual. university of florida,gainesville. Technical report, Tech Rep A-8. 42
Lang, P. J., Kozak, M. J., Miller, G. A., Levin, D. N., and McLean Jr, A. (1980). Emotionalimagery: Conceptual structure and pattern of somato-visceral response. Psychophysi-ology, 17(2):179–192. 47
Larradet, F. (2018). Sightweb. https://tinyurl.com/yyuanrcz (accessed 30 july 2019). 6
Larradet, F. (2019a). Epsdi. https://gitlab.com/flarradet/epsdi (November 9 july 2019).90
Larradet, F. (2019b). Liscommunication. https://gitlab.com/flarradet/liscommunication/(accessed 27 december 2019). 37
Larradet, F. (2019c). Mafed. https://gitlab.com/flarradet/mafed (accessed 9 july 2019).
8
110 8. REFERENCES
Larradet, F., Barresi, G., and Mattos, L. S. (2017). Effects of galvanic skin response feed-back on user experience in gaze-controlled gaming: A pilot study. In Engineering inMedicine and Biology Society (EMBC), 2017 39th Annual International Conference ofthe IEEE, pages 2458–2461. IEEE. 25
Larradet, F., Barresi, G., and Mattos, L. S. (2018). Design and evaluation of an open-sourcegaze-controlled gui for web-browsing. In 11th Computer Science and Electronic Engi-neering (CEEC). IEEE. 19
Larradet, F., Niewiadomski, R., Barresi, G., and Mattos, L. S. (2019). Appraisal theory-based mobile app for physiological data collection and labelling in the wild. In Pro-ceedings of the 2019 ACM International Joint Conference on Pervasive and UbiquitousComputing and Proceedings of the 2019 ACM International Symposium on WearableComputers, pages 752–756. ACM. 90
Laureys, S., Pellas, F., Van Eeckhout, P., Ghorbel, S., Schnakers, C., Perrin, F., Berre, J.,Faymonville, M.-E., Pantke, K.-H., Damas, F., et al. (2005). The locked-in syndrome:what is it like to be conscious but paralyzed and voiceless? Progress in brain research,150:495–611. 28
Laurila, J. K., Gatica-Perez, D., Aad, I., Bornet, O., Do, T.-M.-T., Dousse, O., Eberle, J., Mi-ettinen, M., et al. (2012). The mobile data challenge: Big data for mobile computingresearch. Technical report. 44
Lazarus, R. S. (1991). Progress on a cognitive-motivational-relational theory of emotion.American psychologist, 46(8):819. 64
Lazarus, R. S. and Lazarus, R. S. (1991). Emotion and adaptation. Oxford University Presson Demand. 39
Lee, B., Han, J., Baek, H. J., Shin, J. H., Park, K. S., and Yi, W. J. (2010). Improved eliminationof motion artifacts from a photoplethysmographic signal using a kalman smootherwith simultaneous accelerometry. Physiological measurement, 31(12):1585. 49
Lee, Y., Rabiee, A., and Lee, S.-Y. (2017). Emotional end-to-end neural speech synthesizer.arXiv preprint arXiv:1711.05447. 28
Li, L. and Chen, J. (2006). Emotion recognition using physiological signals from multi-ple subjects. In 2006 International Conference on Intelligent Information Hiding andMultimedia, pages 355–358.
Lin, T., Omata, M., Hu, W., and Imamiya, A. (2005). Do physiological data relate to tradi-tional usability indexes? In Proceedings of the 17th Australia conference on Computer-Human Interaction: Citizens Online: Considerations for Today and the Future, pages1–10. Computer-Human Interaction Special Interest Group (CHISIG) of Australia. 20
8
8.0. REFERENCES 111
Lisetti, C. L. and Nasoz, F. (2002). Maui: a multimodal affective user interface. In Proceed-ings of the tenth ACM international conference on Multimedia, pages 161–170. ACM.
Lisetti, C. L. and Nasoz, F. (2004). Using noninvasive wearable computers to recognizehuman emotions from physiological signals. EURASIP Journal on Advances in SignalProcessing, 2004(11):929414.
LLC, Z. F. (1016). Embedded browser. https://tinyurl.com/yd5hq6lv (accessed 4 March2019). 12
Lo, S.-K. (2008). The nonverbal communication functions of emoticons in computer-mediated communication. CyberPsychology & Behavior, 11(5):595–597. 28
Loghmani, M. R., Rovetta, S., and Venture, G. (2017). Emotional intelligence in robots:Recognizing human emotions from daily-life gestures. In 2017 IEEE International Con-ference on Robotics and Automation (ICRA), pages 1677–1684. 65
Lulé, D., Kurt, A., Jürgens, R., Kassubek, J., Diekmann, V., Kraft, E., Neumann, N., Ludolph,A. C., Birbaumer, N., and Anders, S. (2005). Emotional responding in amyotrophiclateral sclerosis. Journal of neurology, 252(12):1517–1524. 20
Lussu, V., Niewiadomski, R., Volpe, G., and Camurri, A. (2019). The role of respirationaudio in multimodal analysis of movement qualities. Journal on Multimodal User In-terfaces, pages 1–15. 65, 69, 70
MacCormack, J. K. and Lindquist, K. A. (2018). Feeling hangry? when hunger is concep-tualized as emotion. Emotion. 88
Majaranta, P. (2011). Gaze Interaction and Applications of Eye Tracking: Advances in As-sistive Technologies: Advances in Assistive Technologies. IGI Global. 5
Majaranta, P. and Räihä, K.-J. (2002). Twenty years of eye typing: systems and designissues. In Proceedings of the 2002 symposium on Eye tracking research & applications,pages 15–22. ACM. 5, 28
Marsella, S. C. and Gratch, J. (2009). Ema: A process model of appraisal dynamics. Cog-nitive Systems Research, 10(1):70–90.
Massot, B., Baltenneck, N., Gehin, C., Dittmar, A., and McAdams, E. (2011). Emosense:An ambulatory device for the assessment of ans activity—application in the objectiveevaluation of stress with the blind. IEEE Sensors Journal, 12(3):543–551. 58
Matani, D. (2011). An o (k log n) algorithm for prefix based ranked autocomplete. English,pages 1–14. 31
Mauss, I. B. and Robinson, M. D. (2009). Measures of emotion: A review. Cognition andemotion, 23(2):209–237. 47, 79
8
112 8. REFERENCES
McCarthy, C., Pradhan, N., Redpath, C., and Adler, A. (2016). Validation of the empaticae4 wristband. In 2016 IEEE EMBS International Student Conference (ISC), pages 1–4.IEEE. 68
McDuff, D., Karlson, A., Kapoor, A., Roseway, A., and Czerwinski, M. (2012). Affectaura:an intelligent system for emotional memory. In Proceedings of the SIGCHI Conferenceon Human Factors in Computing Systems, pages 849–858. ACM. 40, 60
Mehrabian, A. (1996). Pleasure-arousal-dominance: A general framework for describingand measuring individual differences in temperament. Current Psychology, 14(4):261–292. 39
Mehrabian, A. (2017). Nonverbal communication. Routledge. 28
Melanson, E. L. and Freedson, P. S. (2001). The effect of endurance training on restingheart rate variability in sedentary adult males. European journal of applied physiology,85(5):442–449. 43
Melillo, P., Bracale, M., and Pecchia, L. (2011). Nonlinear heart rate variability features forreal-life stress detection. case study: students under stress due to university examina-tion. Biomedical engineering online, 10(1):96. 40, 56
Menges, R., Kumar, C., Müller, D., and Sengupta, K. (2017). Gazetheweb: A gaze-controlled web browser. In Proceedings of the 14th Web for All Conference on The Futureof Accessible Work, page 25. ACM. 6
Meschtscherjakov, A., Weiss, A., and Scherndl, T. (2009). Utilizing emoticons on mobiledevices within esm studies to measure emotions in the field. Proc. MME in conjunctionwith MobileHCI, 9:3361–3366. 75
Mesquita, B., Frijda, N. H., and Scherer, K. R. (1997). Culture and emotion. Handbook ofcross-cultural psychology, 2:255–297. 46
Meuleman, B. and Rudrauf, D. (2018). Induction and profiling of strong multi-componential emotions in virtual reality. IEEE Transactions on Affective Computing,pages 1–1. 63, 66, 70
Microsoft Corp. (2018). Eye control. https://tinyurl.com/yd9sksba (accessed 4 March2019). 27
Mindmedia (2004). Nexus-4. https://www.mindmedia.com/en/products/nexus-4/ (ac-cessed 4 September 2019).
MindWare Technologies (2006). Mobile impedance cardiograph.http://www.gtec.at/Products/Hardware-and-Accessories/g.MOBIlab-Specs-Features(accessed 4 September 2019).
8
8.0. REFERENCES 113
Mir, N., Sarirete, A., Hejres, J., and Al Omairi, M. (2019). Use of eeg technology with basedbrain-computer interface to address amyotrophic lateral sclerosis—als. In The Inter-national Research & Innovation Forum, pages 433–439. Springer. 99
Moodmetric (2012). Moodmetric. https://www.moodmetric.com/ (accessed 4 Septem-ber 2019).
Moors, A. (2009). Theories of emotion causation: A review. Cognition and emotion,23(4):625–662.
Moors, A., Ellsworth, P. C., Scherer, K. R., and Frijda, N. H. (2013). Appraisal theories ofemotion: State of the art and future development. Emotion Review, 5(2):119–124. 64
Morishima, S. (1998). Real-time talking head driven by voice and its application tocommunication and entertainment. In AVSP’98 International Conference on Auditory-Visual Speech Processing. 28
Mortillaro, M., Meuleman, B., and Scherer, K. R. (2012). Advocating a componential ap-praisal model to guide emotion recognition. International Journal of Synthetic Emo-tions (IJSE), 3(1):18–32. 77
Movisens (2010). Movisens. https://www.movisens.com/ (accessed 4 September 2019).
Muaremi, A., Arnrich, B., and Tröster, G. (2013). Towards measuring stress with smart-phones and wearable devices during workday and sleep. BioNanoScience, 3(2):172–183. 60, 74, 75
Muaremi, A., Bexheti, A., Gravenhorst, F., Arnrich, B., and Tröster, G. (2014). Monitoringthe impact of stress on the sleep patterns of pilgrims using wearable sensors. In IEEE-EMBS international conference on biomedical and health informatics (BHI), pages 185–188. IEEE. 55
Mühlberger, A., Bülthoff, H. H., Wiedemann, G., and Pauli, P. (2007). Virtual reality forthe psychophysiological assessment of phobic fear: responses during virtual tunneldriving. Psychological assessment, 19(3):340. 63
Myrtek, M., Aschenbrenner, E., Brügner, G., et al. (2005). Emotions in everyday life: anambulatory monitoring study with female students. Biological psychology, 68(3):237–255. 58, 88
Myrtek, M. and Brügner, G. (1996). Perception of emotions in everyday life: studies withpatients and normals. Biological psychology, 42(1-2):147–164. 58, 73, 75, 78
Myrtek, M., Fichtler, A., Strittmatter, M., and Brügner, G. (1999). Stress and strain of blueand white collar workers during work and leisure time: results of psychophysiologicaland behavioral monitoring. Applied Ergonomics, 30(4):341–351. 58
8
114 8. REFERENCES
Na, J. Y., Wilkinson, K., Karny, M., Blackstone, S., and Stifter, C. (2016). A synthesis of rele-vant literature on the development of emotional competence: Implications for designof augmentative and alternative communication systems. American Journal of Speech-Language Pathology, 25(3):441–452. 29
Nakasone, A., Prendinger, H., and Ishizuka, M. (2005). Emotion recognition from elec-tromyography and skin conductance. In The Fifth International Workshop on BiosignalInterpretation (BSI-05, pages 219–222. 69
Nasoz, F., Alvarez, K., Lisetti, C. L., and Finkelstein, N. (2004). Emotion recognitionfrom physiological signals using wireless sensors for presence technologies. Cognition,Technology & Work, 6(1):4–14. 73, 74, 75
Naumann, A., Hurtienne, J., Israel, J. H., Mohs, C., Kindsmüller, M. C., Meyer, H. A., andHußlein, S. (2007). Intuitive use of user interfaces: defining a vague concept. In Inter-national Conference on Engineering Psychology and Cognitive Ergonomics, pages 128–136. Springer. 7
Neviarouskaya, A., Prendinger, H., and Ishizuka, M. (2007). Textual affect sensing for so-ciable and expressive online communication. In International Conference on AffectiveComputing and Intelligent Interaction, pages 218–229. Springer. 28
Niewiadomski, R., Mancini, M., Varni, G., Volpe, G., and Camurri, A. (2016). Automatedlaughter detection from full-body movements. IEEE Transactions on Human-MachineSystems, 46(1):113–123. 42
Ortony, A., Clore, G. L., and Collins, A. (1990). The cognitive structure of emotions. Cam-bridge university press. 39, 50, 64, 73
Pärkkä, J., Merilahti, J., Mattila, E. M., Malm, E., Antila, K., Tuomisto, M. T., Saarinen, A. V.,van Gils, M., and Korhonen, I. (2008). Relationship of psychological and physiologicalvariables in long-term self-monitored data during work ability rehabilitation program.IEEE Transactions on Information Technology in Biomedicine, 13(2):141–151. 61
Pasupathi, M. (2003). Emotion regulation during social remembering: Differences be-tween emotions elicited during an event and emotions elicited when talking about it.Memory, 11(2):151–163. 42
Pehlivanoglu, B., Durmazlar, N., and Balkancı, D. (2005). Computer adapted stroopcolour-word conflict test as a laboratory stress model. Erciyes Medical Journal,27(2):58–63. 43
Peperkorn, H. M. and Mühlberger, A. (2013). The impact of different perceptual cues onfear and presence in virtual reality. 63
Perusquía-Hernández, M., Hirokawa, M., and Suzuki, K. (2017). A wearable device for fastand subtle spontaneous smile recognition. IEEE Transactions on Affective Computing,8(4):522–533. 68
8
8.0. REFERENCES 115
Petronio, S. and Bantz, C. (1991). Research note: Controlling the ramifications of disclo-sure:don’t tell anybody but.. Journal of Language and Social Psychology, 10(4):263–269.38
Petrushin, A., Tessadori, J., Barresi, G., and Mattos, L. S. (2018). Effect of a Click-LikeFeedback on Motor Imagery in EEG-BCI and Eye-Tracking Hybrid Control for Telep-resence. In 2018 IEEE/ASME International Conference on Advanced Intelligent Mecha-tronics (AIM), pages 628–633. IEEE.
Picard, R. W., Fedor, S., and Ayzenberg, Y. (2016). Multiple arousal theory and daily-lifeelectrodermal activity asymmetry. Emotion Review, 8(1):62–75. 49
Picard, R. W. and Rosalind, W. (2000). Toward agents that recognize emotion. VIVEK-BOMBAY-, 13(1):3–13. 58
Picard, R. W., Vyzas, E., and Healey, J. (2001). Toward machine emotional intelligence:Analysis of affective physiological state. IEEE Transactions on Pattern Analysis & Ma-chine Intelligence, (10):1175–1191.
Plarre, K., Raij, A., Hossain, S. M., Ali, A. A., Nakajima, M., Al’Absi, M., Ertin, E., Kamarck,T., Kumar, S., Scott, M., et al. (2011). Continuous inference of psychological stressfrom sensory measurements collected in the natural environment. In Proceedings ofthe 10th ACM/IEEE International Conference on Information Processing in Sensor Net-works, pages 97–108. IEEE. 40, 47, 55, 58, 74
Porta, M. and Ravelli, A. (2009). Weyeb, an eye-controlled web browser for hands-freenavigation. In 2nd Conference on Human System Interactions, pages 210–215. IEEE. 5,6
Rahman, M. M., Bari, R., Ali, A. A., Sharmin, M., Raij, A., Hovsepian, K., Hossain, S. M.,Ertin, E., Kennedy, A., Epstein, D. H., et al. (2014). Are we there yet?: Feasibility of con-tinuous stress assessment via wireless physiological sensors. In Proceedings of the 5thACM Conference on Bioinformatics, Computational Biology, and Health Informatics,pages 479–488. ACM. 58
Rajanna, V. and Hammond, T. (2018). A gaze gesture-based paradigm for situational im-pairments, accessibility, and rich interactions. In Proceedings of the 2018 ACM Sympo-sium on Eye Tracking Research & Applications, page 102. ACM.
Ramos, J., Hong, J.-H., and Dey, A. K. (2014). Stress recognition-a step outside the lab. InPhyCS, pages 107–118. 57
Ranganathan, H., Chakraborty, S., and Panchanathan, S. (2016). Multimodal emotionrecognition using deep learning architectures. In 2016 IEEE Winter Conference on Ap-plications of Computer Vision (WACV), pages 1–9. IEEE. 40
8
116 8. REFERENCES
Rani, P., Sims, J., Brackin, R., and Sarkar, N. (2002). Online stress detection using psy-chophysiological signals for implicit human-robot cooperation. Robotica, 20(6):673–685. 43
Reilly, W. and Bates, J. (1992). Building emotional agents. pittsburgh.
Rigas, G., Goletsis, Y., and Fotiadis, D. I. (2011). Real-time driver’s stress event detection.IEEE Transactions on intelligent transportation systems, 13(1):221–234. 56, 60
Ring, C., Drayson, M., Walkey, D. G., Dale, S., and Carroll, D. (2002). Secretory im-munoglobulin a reactions to prolonged mental arithmetic stress: inter-session andintra-session reliability. Biological psychology, 59(1):1–13. 43
Robinson, M. D. and Clore, G. L. (2001). Simulation, scenarios, and emotional appraisal:Testing the convergence of real and imagined reactions to emotional stimuli. Person-ality and Social Psychology Bulletin, 27(11):1520–1532. 47
Robinson, M. D. and Clore, G. L. (2002). Belief and feeling: evidence for an accessibilitymodel of emotional self-report. Psychological bulletin, 128(6):934. 47
Roseman, I. and Evdokas, A. (2004). Appraisals cause experienced emotions: Experimen-tal evidence. Cognition and Emotion, 18(1):1–28.
Roseman, I. J. (1984). Cognitive determinants of emotion: A structural theory. Review ofpersonality & social psychology. 39
Roseman, I. J. (2011). Emotional behaviors, emotivational goals, emotion strategies: Mul-tiple levels of organization integrate variable and consistent responses. Emotion Re-view, 3(4):434–443.
Roseman, I. J., Antoniou, A. A., and Jose, P. E. (1996). Appraisal determinants of emo-tions: Constructing a more accurate and comprehensive theory. Cognition & Emotion,10(3):241–278. 64
Roseway, A., Lutchyn, Y., Johns, P., Mynatt, E., and Czerwinski, M. (2015). Biocrystal: Anambient tool for emotion and communication. International Journal of Mobile HumanComputer Interaction (IJMHCI), 7(3):20–41. 27, 48, 59
Rothbaum, B. O. (2009). Using virtual reality to help our patients in the real world. De-pression and Anxiety. 63
Russell, J. A. (1980). A circumplex model of affect. Journal of personality and social psy-chology, 39(6):1161. 39, 83
Sarkar, N. (2002). Psychophysiological control architecture for human-robotcoordination-concepts and initial experiments. In Proceedings 2002 IEEE InternationalConference on Robotics and Automation (Cat. No. 02CH37292), volume 4, pages 3719–3724. IEEE.
8
8.0. REFERENCES 117
Sarker, H., Tyburski, M., Rahman, M. M., Hovsepian, K., Sharmin, M., Epstein, D. H., Pre-ston, K. L., Furr-Holden, C. D., Milam, A., Nahum-Shani, I., et al. (2016). Finding sig-nificant stress episodes in a discontinuous time series of rapidly varying mobile sensordata. In Proceedings of the 2016 CHI conference on human factors in computing systems,pages 4489–4501. ACM. 61
Scherer, K. (2001). Appraisal considered as a process of multilevel sequential checking.Appraisal processes in emotion: Theory, methods, research, 92(120):57. 64
Scherer, K., Schorr, A., and Johnstone, T. (2001). Appraisal Processes in Emotion: Theory,Methods, Research. Oxford University Press.
Scherer, K. R. (1982). Emotion as a process: Function, origin and regulation.
Scherer, K. R. (1984). Emotion as a multicomponent process: A model and some cross-cultural data. Review of personality & social psychology.
Scherer, K. R. (2004). Which emotions can be induced by music? what are the under-lying mechanisms? and how can we measure them? Journal of new music research,33(3):239–251.
Scherer, K. R. (2005). What are emotions? and how can they be measured? Social scienceinformation, 44(4):695–729. 74
Scherer, K. R. (2009). Emotions are emergent processes: they require a dynamic com-putational architecture. Philosophical Transactions of the Royal Society B: BiologicalSciences, 364(1535):3459–3474. 63, 64
Schmidt, K., Patnaik, P., and Kensinger, E. A. (2011). Emotion’s influence on memory forspatial and temporal context. Cognition and emotion, 25(2):229–243. 42
Schmidt, P., Reiss, A., Dürichen, R., and Van Laerhoven, K. (2018). Labelling affectivestates in the wild: Practical guidelines and lessons learned. In Proceedings of the 2018ACM International Joint Conference and 2018 International Symposium on Pervasiveand Ubiquitous Computing and Wearable Computers, pages 654–659. ACM. 47, 58, 73,75, 76
Schuhfried (2010). Biofeedback-xpert. https://www.schuhfried.com/biofeedback/biofeedback-xpert (accessed 4 September 2019).
Schwartz, G. E., Weinberger, D. A., and Singer, J. A. (1981). Cardiovascular differentiationof happiness, sadness, anger, and fear following imagery and exercise. Psychosomaticmedicine, 43(4):343–364. 82
Sharma, K., Castellini, C., Broek, E. L., Albu-Schaeffer, A., and Schwenker, F. (2018). Adataset of continuous affect annotations and physiological signals for emotion analy-sis. arXiv preprint arXiv:1812.02782. 49, 83
8

118 8. REFERENCES
Shiffman, S., Stone, A. A., and Hufford, M. R. (2008). Ecological momentary assessment.Annu. Rev. Clin. Psychol., 4:1–32. 47
Shimmer sensing (2011). Shimmer3 gsr+ unit. http://www.shimmersensing.com/products/shimmer3-wireless-gsr-sensor (accessed 4 September 2019).
Shu, L., Xie, J., Yang, M., Li, Z., Li, Z., Liao, D., Xu, X., and Yang, X. (2018). A review ofemotion recognition using physiological signals. Sensors, 18(7):1–41. 73, 74
Smith, C. (1989). Dimensions of appraisal and physiological response in emotion. Journalof Personality and Social Psychology, pages 339–353. 77
Smith, E. and Delargy, M. (2005). Locked-in syndrome. Bmj, 330(7488):406–409.
Smith, J. D. and Graham, T. C. (2006). Use of eye movements for video game control. InProceedings of the 2006 ACM SIGCHI international conference on Advances in computerentertainment technology, page 20. ACM.
Snyder, J., Matthews, M., Chien, J., Chang, P. F., Sun, E., Abdullah, S., and Gay, G. (2015).Moodlight: Exploring personal and social implications of ambient display of biosensordata. In Proceedings of the 18th ACM Conference on Computer Supported CooperativeWork & Social Computing, pages 143–153. ACM. 59
Söderholm, S., Meinander, M., and Alaranta, H. (2001). Augmentative and alternativecommunication methods in locked-in syndrome. Journal of rehabilitation medicine,33(5):235–239. 5
Soleymani, M., Lichtenauer, J., Pun, T., and Pantic, M. (2011). A multimodal databasefor affect recognition and implicit tagging. IEEE transactions on affective computing,3(1):42–55. 42
Somnomedics (2013). Somnomedics. https://somnomedics.eu/ (accessed 4 September2019).
Spire health (2016). Spire health. https://spirehealth.com/ (accessed 4 September 2019).
Stroop, J. R. (1935). Studies of interference in serial verbal reactions. Journal of experi-mental psychology, 18(6):643. 43
Sweetland, J. (2015). Optikey. https://tinyurl.com/ybh9pnek (accessed 4 March 2019). 6
Tang, H., Fu, Y., Tu, J., Huang, T. S., and Hasegawa-Johnson, M. (2008). Eava: a 3d emotiveaudio-visual avatar. In 2008 IEEE Workshop on Applications of Computer Vision, pages1–6. IEEE. 28
ThinkSmartBox (2011). The grid 3. https://tinyurl.com/y8vbxoej (accessed 4 March2019). 6, 12
8
8.0. REFERENCES 119
Tobii Group (2001). Tobii 4c. http://www.tobii.com (accessed 4 March 2019). 11, 33
Tognetti, S., Garbarino, M., Bonanno, A. T., Matteucci, M., and Bonarini, A. (2010). Enjoy-ment recognition from physiological data in a car racing game. In Proceedings of the3rd International Workshop on Affective Interaction in Natural Environments, AFFINE’10, pages 3–8. ACM. 42
Tomkins, S. (1962). Affect imagery consciousness: Volume I: The positive affects. Springerpublishing company. 42
Torres, J. M. M., Ghosh, A., Stepanov, E. A., and Riccardi, G. (2016). Heal-t: An efficientppg-based heart-rate and ibi estimation method during physical exercise. In 2016 24thEuropean Signal Processing Conference (EUSIPCO), pages 1438–1442. IEEE. 49
Turner-Cobb, J. M., Asif, M., Turner, J. E., Bevan, C., and Fraser, D. S. (2019). Use of a non-human robot audience to induce stress reactivity in human participants. Computersin Human Behavior, 99:76–85. 42
Uhrig, M. K., Trautmann, N., Baumgärtner, U., Treede, R.-D., Henrich, F., Hiller, W., andMarschall, S. (2016). Emotion elicitation: A comparison of pictures and films. Frontiersin psychology, 7:180.
van Reekum, C., Johnstone, T., Banse, R., Etter, A., Wehrle, T., and Scherer, K. (2004). Psy-chophysiological responses to appraisal dimensions in a computer game. Cognitionand Emotion, 18(5):663–688. 64
Verkuil, B., Brosschot, J. F., Tollenaar, M. S., Lane, R. D., and Thayer, J. F. (2016). Prolongednon-metabolic heart rate variability reduction as a physiological marker of psycholog-ical stress in daily life. Annals of Behavioral Medicine, 50(5):704–714. 57
Ververidis, D., Kotsia, I., Kotropoulos, C., and Pitas, I. (2008). Multi-modal emotion-related data collection within a virtual earthquake emulator. In Programme of theWorkshop on Corpora for Research on Emotion and Affect, page 57. 42
VitaMove (2010). Vitamove. http://www.vitamove.nl/ (accessed 4 September 2019).
Volpe, G., Alborno, P., Camurri, A., Coletta, P., Ghisio, S., Mancini, M., Niewiadomski, R.,and Piana, S. (2016). Designing multimodal interactive systems using eyesweb xmi. InSERVE@ AVI, pages 49–56. 67
Von Dawans, B., Kirschbaum, C., and Heinrichs, M. (2011). The trier social stress test forgroups (tsst-g): A new research tool for controlled simultaneous social stress exposurein a group format. Psychoneuroendocrinology, 36(4):514–522. 43
Vrana, S. R. (1993). The psychophysiology of disgust: Differentiating negative emotionalcontexts with facial emg. Psychophysiology, 30(3):279–286. 41
8
120 8. REFERENCES
Wallbott, H. G. and Scherer, K. R. (1986). Cues and channels in emotion recognition.Journal of personality and social psychology, 51(4):690. 41
Walter, S., Scherer, S., Schels, M., Glodek, M., Hrabal, D., Schmidt, M., Böck, R., Lim-brecht, K., Traue, H. C., and Schwenker, F. (2011). Multimodal emotion classificationin naturalistic user behavior. In International Conference on Human-Computer Inter-action, pages 603–611. Springer. 42
Ward, N., Ortiz, M., Bernardo, F., and Tanaka, A. (2016). Designing and measuring ge-sture using laban movement analysis and electromyogram. In Proceedings of the 2016ACM International Joint Conference on Pervasive and Ubiquitous Computing: Adjunct,UbiComp ’16, pages 995–1000, New York, NY, USA. ACM. 68
Whissell, C. M. (1989). The dictionary of affect in language. In The measurement of emo-tions, pages 113–131. Elsevier. 85
Widen, S. C. and Russell, J. A. (2010). Descriptive and prescriptive definitions of emotion.Emotion Review, 2(4):377–378. 46
Wilhelm, F. H. and Grossman, P. (2010). Emotions beyond the laboratory: Theoretical fun-daments, study design, and analytic strategies for advanced ambulatory assessment.Biological psychology, 84(3):552–569. 43, 73
Wilhelm, F. H., Pfaltz, M. C., and Grossman, P. (2005). Continuous electronic data cap-ture of physiology, behavior and experience in real life: towards ecological momentaryassessment of emotion. Interacting with Computers, 18(2):171–186. 48
Wilhelm, F. H. and Roth, W. T. (1998). Using minute ventilation for ambulatory estimationof additional heart rate. Biological psychology, 49(1-2):137–150. 57
Xu, Y., Hübener, I., Seipp, A.-K., Ohly, S., and David, K. (2017). From the lab to the real-world: An investigation on the influence of human movement on emotion recognitionusing physiological signals. In 2017 IEEE International Conference on Pervasive Com-puting and Communications Workshops (PerCom Workshops), pages 345–350. IEEE. 43
Xue, Y., Hamada, Y., and Akagi, M. (2015). Emotional speech synthesis system based on athree-layered model using a dimensional approach. In 2015 Asia-Pacific Signal and In-formation Processing Association Annual Summit and Conference (APSIPA), pages 505–514. IEEE. 28
Yin, L., Wei, X., Sun, Y., Wang, J., and Rosato, M. J. (2006). A 3d facial expression databasefor facial behavior research. In 7th international conference on automatic face and ge-sture recognition (FGR06), pages 211–216. IEEE. 48
Yuan, W. and Semmlow, J. L. (2000). The influence of repetitive eye movements on ver-gence performance. Vision research, 40(22):3089–3098. 5, 7, 31
8
.0. REFERENCES 121
Zajonc, R. B., Murphy, S. T., and Inglehart, M. (1989). Feeling and facial efference: impli-cations of the vascular theory of emotion. Psychological review, 96(3):395. 42
Zenonos, A., Khan, A., Kalogridis, G., Vatsikas, S., Lewis, T., and Sooriyabandara, M.(2016). Healthyoffice: Mood recognition at work using smartphones and wearable sen-sors. In 2016 IEEE International Conference on Pervasive Computing and Communica-tion Workshops (PerCom Workshops), pages 1–6. IEEE. 56, 74, 75
Zephyr (2005). Zephyr. https://www.zephyranywhere.com/ (accessed 4 September2019).
Zhai, J. and Barreto, A. (2006). Stress detection in computer users based on digital signalprocessing of noninvasive physiological variables. In 2006 international conference ofthe IEEE engineering in medicine and biology society, pages 1355–1358. IEEE. 43
Zhang, J., Tang, H., Chen, D., and Zhang, Q. (2012). destress: Mobile and remote stressmonitoring, alleviation, and management platform. In 2012 IEEE global communica-tions conference (GLOBECOM), pages 2036–2041. IEEE. 58

ASUPLEMENTARY MATERIALS
In order to collect physiological signals in the wild, researchers must choose which de-vice to use. As mentioned in the previous sections , decisions must be done regardingcomfort, invasiveness and data accuracy. A list devices available for ambulatory datacollection are listed below with indications of their characteristics. Companies with sev-eral similar products are marked with SP. Invasiveness is marked from 1 to 3, 1 being thebulkier and 3 the less invasive as described in section 4.4.1. If several combination of sen-sors are available for a certain product a range of invasiveness will be displayed. It will bespecified for each device if it was made for research (R) or for the general public (GP).
122
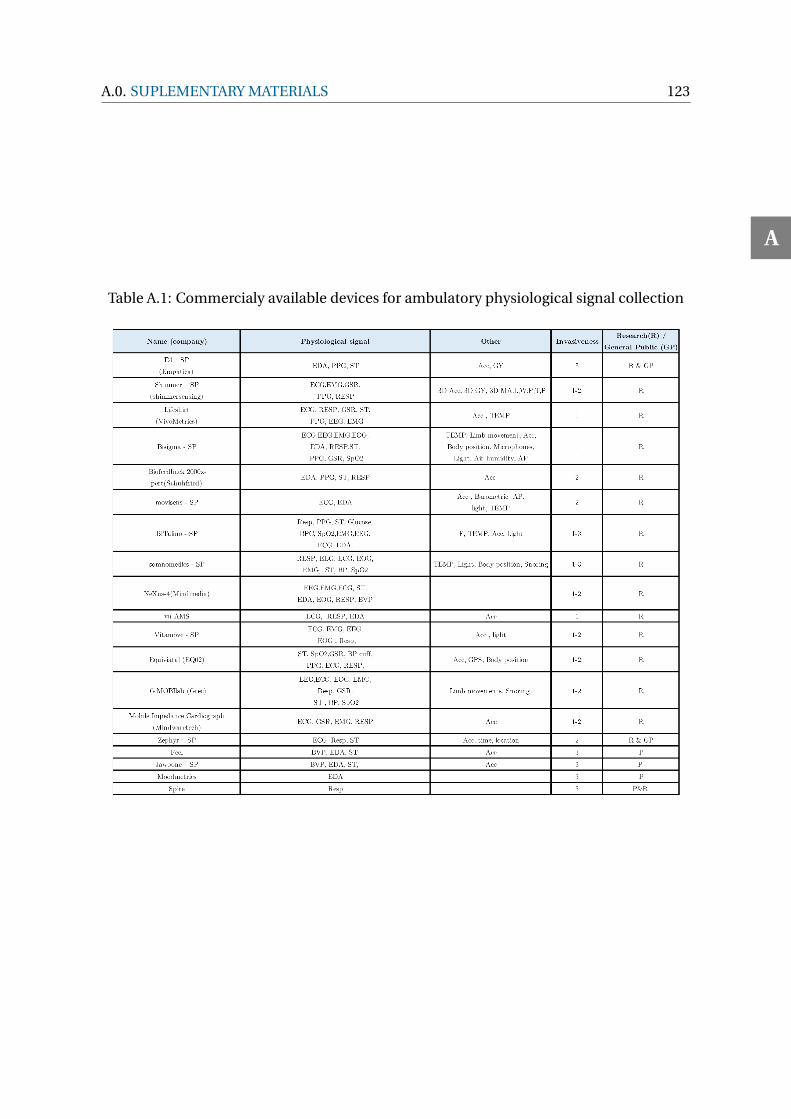
A.0. SUPLEMENTARY MATERIALS 123
Table A.1: Commercialy available devices for ambulatory physiological signal collection
A
Related Documents