271 13 Family strategies, wage labour and the family life cycle in the Groningen countryside, c. 1850-1910 Richard Paping Introduction The second half of the nineteenth century was a period of rapid economic and social change in the Netherlands. In this respect the Groningen countryside was no exception. On the one hand the production per capita began to rise structurally, which resulted in a steady increase in real wages, in economic well- being and eventually in a fall in the death rate. 1 On the other hand bourgeois ideas about the role of married men and women, and also to some extent of adolescent children, began to penetrate all parts of society. Lower class political and social movements became important. 2 Partly as a reaction, the different religious denominations began increasingly to organise their members from both the lower and middle classes in strictly segmented pillars, with their own schools, clubs and societies. All these more or less interrelated developments make the second half of the nineteenth century an extremely interesting period to study. This chapter concentrates on agricultural labourer families and the ways they tried to earn a living using the labour of the different family members in this dynamic period. The data mainly relates to Nieuw-Scheemda, a small village in the eastern part of the Groningen clay area. The different family strategies labourers developed were strongly influenced by the phase in the family life cycle in which they lived. In the first instance, the increase in the number of mouths to feed after marriage created problems which lasted until children 1 R.F.J. Paping and G.A. Collenteur, ‘The economic development of the clay area of Groningen 1770- 1910: Income and socio-economic groups’, in: P. Kooij (ed.), Where the twain meet. Dutch and Russian regional demographic development in a comparative perspective 1800-1917 (Groningen/Wageningen 1998) 43; R.F.J. Paping, ‘Groei of stagnatie. De bevolkingsontwikkeling van Groningen’, Gronings Historisch Jaarboek, 7 (2000) 44-48; G.A. Collenteur and R.F.J. Paping, ‘De arbeidsmarkt voor inwonend boerenpersoneel in het Groningse kleigebied 1830-1920’, NEHA-Jaarboek voor economische, bedrijfs- en techniekgeschiedenis, 60 (1997) 119-120. 2 G. Bruintjes, Socialisme in Groningen 1881-1894 (Amsterdam 1981); V.C. Sleebe, In termen van fatsoen. Sociale controle in het Groningse kleigebied 1770-1914 (Groningen 1994).

Welcome message from author
This document is posted to help you gain knowledge. Please leave a comment to let me know what you think about it! Share it to your friends and learn new things together.
Transcript
271
13
Family strategies, wage labour and the family life cyclein the Groningen countryside, c. 1850-1910
Richard Paping
Introduction The second half of the nineteenth century was a period of rapid economic
and social change in the Netherlands. In this respect the Groningen countrysidewas no exception. On the one hand the production per capita began to risestructurally, which resulted in a steady increase in real wages, in economic well-being and eventually in a fall in the death rate.1 On the other hand bourgeoisideas about the role of married men and women, and also to some extent ofadolescent children, began to penetrate all parts of society. Lower class politicaland social movements became important.2 Partly as a reaction, the differentreligious denominations began increasingly to organise their members fromboth the lower and middle classes in strictly segmented pillars, with their ownschools, clubs and societies. All these more or less interrelated developmentsmake the second half of the nineteenth century an extremely interesting periodto study.
This chapter concentrates on agricultural labourer families and the ways theytried to earn a living using the labour of the different family members in thisdynamic period. The data mainly relates to Nieuw-Scheemda, a small village inthe eastern part of the Groningen clay area. The different family strategieslabourers developed were strongly influenced by the phase in the family lifecycle in which they lived. In the first instance, the increase in the number ofmouths to feed after marriage created problems which lasted until children
1 R.F.J. Paping and G.A. Collenteur, ‘The economic development of the clay area of Groningen 1770-1910: Income and socio-economic groups’, in: P. Kooij (ed.), Where the twain meet. Dutch and Russianregional demographic development in a comparative perspective 1800-1917 (Groningen/Wageningen 1998) 43;R.F.J. Paping, ‘Groei of stagnatie. De bevolkingsontwikkeling van Groningen’, Gronings Historisch Jaarboek,7 (2000) 44-48; G.A. Collenteur and R.F.J. Paping, ‘De arbeidsmarkt voor inwonend boerenpersoneel inhet Groningse kleigebied 1830-1920’, NEHA-Jaarboek voor economische, bedrijfs- en techniekgeschiedenis, 60(1997) 119-120.2 G. Bruintjes, Socialisme in Groningen 1881-1894 (Amsterdam 1981); V.C. Sleebe, In termen van fatsoen.Sociale controle in het Groningse kleigebied 1770-1914 (Groningen 1994).
272
started to leave the parental home. After some years of marriage the rising age ofchildren also shaped economic chances for the family by augmenting thepossibilities of the children going out to work and also of the mother whoneeded less time to care for the children than before. However, the economicand social developments sketched in the introduction also played a major role indetermining the strategies of labourer families, changing their goals and theirpossibilities.
Recently the term strategy has become quite popular in scientific social-historic research. Choices made by people and even social developments areexplained by referring to strategic behaviour. Nonetheless, family strategy is arather problematic and complicated concept in empirical research. Two pro-blems will be touched on briefly.3
Firstly, the term strategy is not easy to operationalise in historical research.This becomes clear if the conscious use of means to reach a certain goal is used as adefinition of strategy. However, historical databanks normally only provide in-sight into the behaviour of people, their actual actions, but not into theconsiderations they had for acting in that way. So, in most instances somethingis known only about the means used to fulfil the strategy but nothing is knownabout the exact purposes the people had in mind. Because of this, the relationbetween means and goals is not known either. In other words, it is relativelyeasy to reconstruct what happened but very difficult to find out why it hap-pened in each case. A great deal can be discovered about the outcomes of deci-sion-making processes, but it is difficult to reconstruct the underlying consciousstrategies of the people.
Secondly, the problems become even greater if the notion of strategy isconnected to the entity of the family. Family strategy means that there is notone decision-maker, but that there is some kind of joint whole-family strategy.How such a joint strategy comes into being is not easy to imagine. A weightingbetween the different interests of the different members of the family has to takeplace. It will be clear that not all members of the same family have the samegoals, although the family acts as a single unit most of the time.
These two theoretical notions suggest that in the practice of historical re-search the actual reconstruction of family strategies will be very difficult, and it 3 See also T. Engelen, J. Kok, A. Knotter and R. Paping, ‘Labour strategies of families: an introduction’,and T. Engelen, J. Kok and R. Paping, ‘The family strategy concept. An evaluation of our empirical casestudies’, both in The History of the Family. An International Quarterly, 9 (2004); R. Paping, ‘Gezinnen encohorten: arbeidsstrategieën in een marktgerichte agrarische economie: de Groningse kleigebieden 1830-1920’, in: J. Kok et al., Levensloop en levenslot. Arbeidsstrategieën van gezinnen in de negentiende en twintigsteeeuw (Groningen/Wageningen 1999) 17-19; P.P. Viazzo and K.A. Lynch, ‘Anthropology, family historyand the concept of strategy’, International Review of Social History, 47 (2002) 423-452; J. Kok, ‘Thechallenge of strategy: A comment’, International Review of Social History, 47 (2002) 465-485.
273
is only possible to make hypotheses about these strategies. However, it seems asafe proposition that most human behaviour will have been purposeful, aimingat certain goals. For this reason it is not possible to do without the concept of(family) strategy, if human behaviour is to be explained, although it has to beaccepted that it is difficult to get a complete and clear picture of these strategies.
The municipality of Scheemda (province of Groningen)Nieuw-Scheemda is one of five villages in the municipality of Scheemda,
situated in the eastern part of the Groningen clay area. The working class, ormore accurately the labourers, were the single largest occupational group in theGroningen clay area (Table 1). Their share in the population rose in the secondhalf of the nineteenth century. Most of the labourers were active in agriculture.By the end of the nineteenth century, however, some employment arose inlarge agriculture-related factories as a result of the hesitant industrialisation of theNetherlands. Around 1900 two large strawboard factories were established inthe village of Midwolda, very near to Nieuw-Scheemda, and these employed155 people, mainly unskilled labourers, in 1911.
Table 1 Estimated occupational structure of heads of households in the Groningen clayarea, 1850-1910 (percentages)
farmers labourers ‘middle class’1850 17% 41% 42%1870 18% 45% 37%1890 15% 48% 37%1910 13% 53% 34%
Note: Labourers also comprises unskilled and skilled labourers in services andindustry. ‘Middle class’ comprises all other occupations, including civil servantsand preachers. Heads of households without occupation were not taken intoaccount.Source: R.F.J. Paping and G.A. Collenteur, ‘The economic development of theclay soil area of Groningen 1770-1910: income and socio-economic groups’, in:Kooij (ed.), Where the twain meet, 39.
In 1850 the municipality of Scheemda numbered 3,733 inhabitants, rising to6,215 in 1910.4 During the whole period far more people left than settled in themunicipality. In the period 1900-1910 the total net loss due to departure was ashigh as 14% of the population. In most parts of the Groningen clay area thisoutmigration was stimulated by the agricultural depression which started around
4 CD-ROM, CBS and NIWI, Publicaties Volkstellingen 1795-1971.
274
1877 with falling prices of cereals and accompanying rising unemployment.However, in the municipality of Scheemda leaving was already a much olderphenomenon, dating from the eighteen-fifties. Nevertheless, despite themigration losses, the population of Scheemda grew, as is clear from Table 2.The high and rising natural population growth in the period 1870-1910 signi-fies that Scheemda had entered the first phase of the demographic transitionwith a steady or even rising number of births combined with steeply fallingdeath rates.5
Table 2 Average annual population development of the municipality of Scheemda,1850-1910 (numbers per 1000 inhabitants)
annual migrationsurplus
natural populationgrowth
real populationgrowth
1850-1860 -3 +12 +91860-1870 -8 +13 +51870-1880 -7 +16 +91880-1890 -6 +17 +111890-1900 -7 +19 +121900-1910 -14 +19 +5
Sources: Groninger Archieven, Provincieverslagen Groningen; CD-ROM,CBS and NIWI, Publicaties Volkstellingen 1795-1971.
In the agricultural census of 1862 Scheemda numbered around 842 families,among them 389 families of agricultural labourers (46%) and 118 families offarmers (14%).6 On average, every farmer employed three to four labourerfamilies. Around 1910 there were still 118 farmers but the number of labourer’sfamilies had risen to at least 463, but probably to considerably more.7 Thevillage of Nieuw-Scheemda had more or less the same occupational pattern asthe municipality of Scheemda as a whole, although it is possible that the per-centage of labourers and farmers combined was a little higher.
Farm labourers and agricultural wage work in GroningenAs has already been mentioned, the group of unskilled labourers comprised
mainly farm labourers.8 Although farm work formed their most important 5 Paping, ‘Groei of stagnatie’.6 Bijdragen tot de kennis van den tegenwoordigen staat der provincie Groningen vijfde deel: Landbouw-statistiek, 2 parts(Groningen 1870).7 Uitkomsten der telling in zake het grondgebruik en den veestapel gehouden 20 mei - 20 juni 1910 ('s-Gravenhage 1912).8 For agricultural wage work see also P.R. Priester and H. De Raad. ‘De iezeren kette van d'armoude’. Aspecten vande sociaal-economische geschiedenis van Beerta, 1800-1870 (Groningen 1982); P.R. Priester, ‘Agrarische produktie enwerkgelegenheid in een Groninger gemeente: Beerta 1800-1870’, Tijdschrift voor Sociale Geschiedenis, 11 (1985)51-86; P.R. Priester, De economische ontwikkeling van de landbouw in Groningen, 1800-1910. Een kwalitatieve en
275
activity, labourers sometimes also did other physical work, for example diggingcanals, dikes and roads. While the head of the family depended on wage for hisincome, the other members of the family had only limited possibilities ofearning an income or of performing economic labour within the household.Most of the labourer families in the Groningen clay area had only very smallplots of land at their disposal, mainly for growing potatoes and vegetables. Thearea around Scheemda was in that respect somewhat exceptional because mostof the labourers also cultivated relatively large plots of land on their ownaccount. In 1862, 55% of all the families in the municipality of Scheemdaowned one or more cows, 52% had some poultry, 63% fattened one or morepigs, and as many as 68% bred sheep.9 The percentages are high enough tosuggest that some of the labourers must also have owned some livestock.Therefore it is not surprising that in 1910 nearly three hundred labourers inScheemda cultivated more than one quarter of a hectare. This was madepossible by the short working days in the Oldambt region of which Nieuw-Scheemda was a part.10 When it was not harvest time, the working day of thelabourers on the farm ended at around one or two o'clock in the afternoon andafterwards the labourers worked in their own gardens and fields. So labourers inScheemda combined their wage income with the home production of food,part of which, for example some potatoes and also some of the bacon from afattened pig, could even be sold. In a sense farm labourers in Scheemda resem-bled cottagers. However, wage income remained their most important sourceof income. They needed money to pay house and land rents and also to buybread, flour, peat, soap, tobacco and other grocery products.
Because the pieces of land and the wage income of the male family headwere not sufficient to allow a reasonable standard of living, other members ofthe labourer families also had to go out to work for wages. The unskilled natureof the work of the labourers resulted in quite low wages for the family heads.The profession of labourer offered almost no perspectives for the future andoccupational mobility was a quite rare phenomenon. It could be said thatanybody who was once a labourer had a high chance of remaining a labourer allhis life. Most of the labourers were also children of labourers (Table 3). Duringthe second half of the nineteenth century it seems that the labouring class in theGroningen clay area became even more closed. The percentage of labourers kwantitatieve analyse (Wageningen 1991) 135-206; R.F.J. Paping, Voor een handvol stuivers. Werken, verdienen enbesteden: de levensstandaard van boeren, arbeiders en middenstanders op de Groninger klei, 1770-1860 (Groningen 1995)99-117. 9 Bijdragen tot de kennis: Landbouw-statistiek.10 O.S. Knottnerus, ‘Het Land Kanaän aan de Noordzee: een vergeten hoofdstuk’, in: J.H.N. Elerie and P.C.M.Hoppenbrouwers (eds.), Het Oldambt, deel 2. Nieuwe visies op geschiedenis en actuele problemen (Groningen 1991) 48-52.
276
with parents from other occupational groups fell significantly.
Table 3 Social origin of unskilled labourers (cohort members born 1830, 1850 and1870 in the Groningen clay area)
born 1830 born 1850 born 1870Unskilled labourers 64 % 73 % 78 %Farmers 8 % 3 % 4 %Middle class 23 % 15 % 15 %Other occupations and none 6 % 9 % 4 %Total N 226 188 130
Source: Cohort analysis Integral History project Groningen. Occupations ofparents as stated by the birth of the cohort member, and occupations of thecohort members after marriage (males and females).
Around 1850, the labour strategies were presumably still mainly aimed atgenerating enough income to survive in the short term and in the future.However, other motives could also have already been of importance for labourmarket choices made by labourers in this period, for example the preservationof a social network (a reason not to migrate to unknown places). Anothermotive could have been the creation of pleasant domestic circumstances bykeeping the children at home. The rise in real wages after 1860 seems to havemade such new goals more and more attainable.11
For most children staying at home it was only possible to find paid workduring the summer half of the year, when the demand for labour on the farmswas very high (see also later on). Even for the family heads it was difficult tofind work the whole year through. Taking this into account the Groningenlabourers can be split into three groups.12 Group 1 consisted of regular workerswho had concluded a fixed contract with a farmer, and who were assured ofwork the whole year through (regular labourers). Group 2 consisted of so-called‘semi-regular’ labourers, who just as group 1 always worked for the samefarmer, but who were dismissed for part of the year. This was especially the casein winter when there was not so much to do on the farms. The third groupcomprised casual labourers who continuously changed employer, working forseveral different farmers and also for other kinds of employers in the same year.They were heavily hit by winter unemployment. Casual labourers alsoparticipated in the seasonal labour-migration movement. Some of them went toFriesland to harvest the hay or to the Dutch peat districts to dig peat, and also to
11 Collenteur and Paping, ‘De arbeidsmarkt voor inwonend boerenpersoneel’, 127-131.12 R.F.J. Paping, ‘Vaste en losse arbeiders en de werkloosheid op de Groninger klei, 1760-1820’ NEHA-Jaarboekvoor economische, bedrijfs- en techniekgeschiedenis, 57 (1994) 126-127, 151-153.
277
Germany to do all kinds of unskilled labour (particularly in the period between1895 and 1914).13
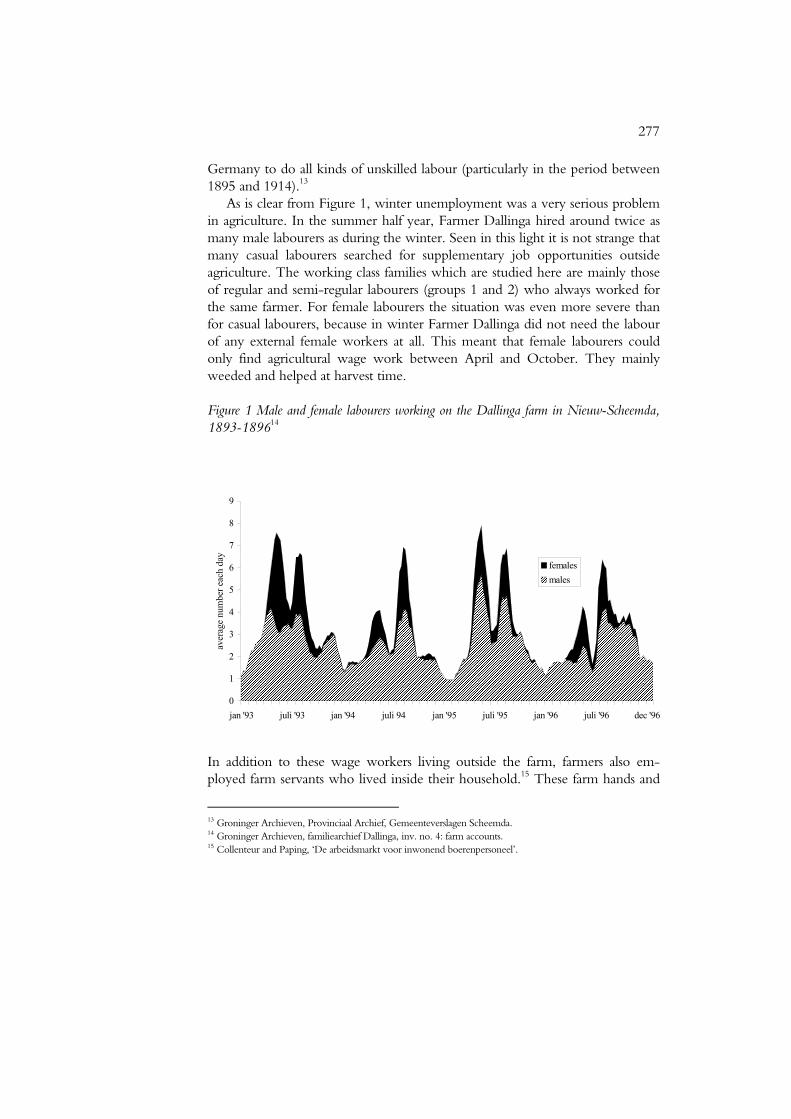
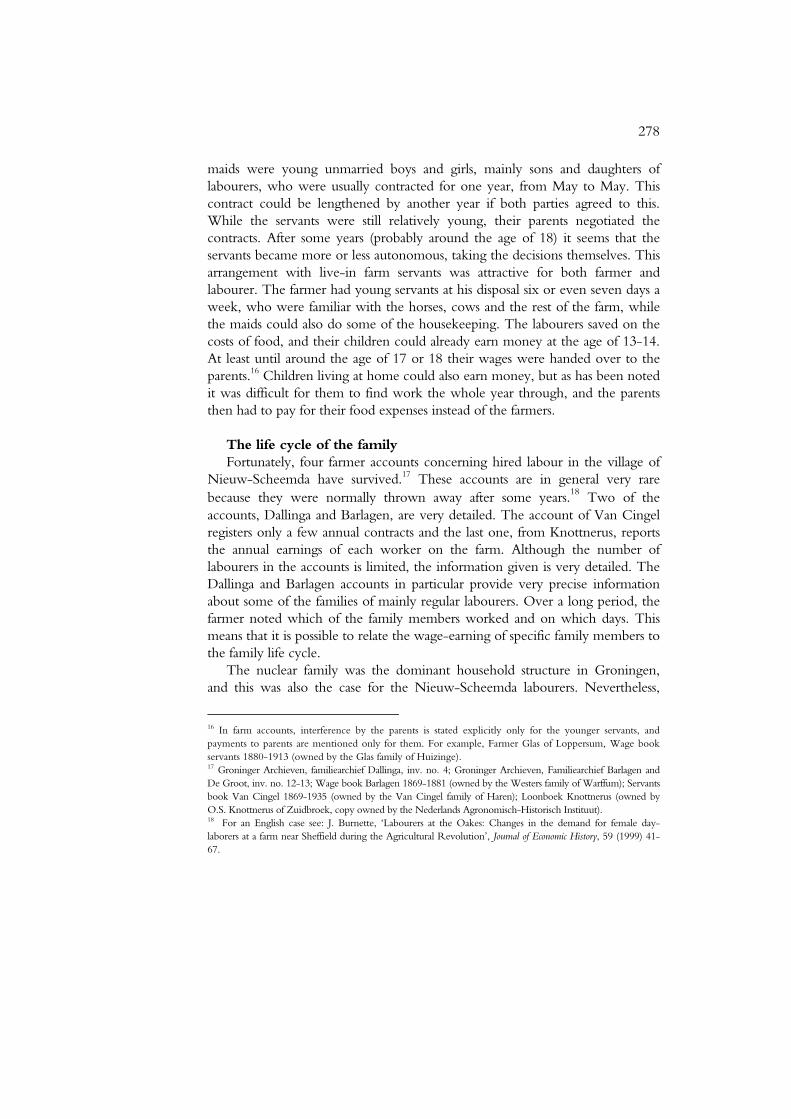
As is clear from Figure 1, winter unemployment was a very serious problemin agriculture. In the summer half year, Farmer Dallinga hired around twice asmany male labourers as during the winter. Seen in this light it is not strange thatmany casual labourers searched for supplementary job opportunities outsideagriculture. The working class families which are studied here are mainly thoseof regular and semi-regular labourers (groups 1 and 2) who always worked forthe same farmer. For female labourers the situation was even more severe thanfor casual labourers, because in winter Farmer Dallinga did not need the labourof any external female workers at all. This meant that female labourers couldonly find agricultural wage work between April and October. They mainlyweeded and helped at harvest time.
Figure 1 Male and female labourers working on the Dallinga farm in Nieuw-Scheemda,1893-189614
In addition to these wage workers living outside the farm, farmers also em-ployed farm servants who lived inside their household.15 These farm hands and
13 Groninger Archieven, Provinciaal Archief, Gemeenteverslagen Scheemda.14 Groninger Archieven, familiearchief Dallinga, inv. no. 4: farm accounts.15 Collenteur and Paping, ‘De arbeidsmarkt voor inwonend boerenpersoneel’.
������������������������������������������������������������������������������������������������������������������������������������������������������������������������������������������������������������������������������������������������������������������������������������������������������������������������������������������������������������������������������������������������������������������������������������������������������������������������������������������������������������������������������������������������������������������������������������������������������������������������������������������������������������������������������������������������������������������������������������������������������������������������������������������������������������������������������������������������������������������������������������������������������������������������������������������������������������������������������������������������������������������������������������������������������������������������������������������������������������������������������������������������������������������������������������������������������������������������������������������������������������������������������������������������������������������������������������������������������������������������������������������������������������������������������������������������������������������������������������������������������������������
0
1
2
3
4
5
6
7
8
9
jan '93 juli '93 jan '94 juli 94 jan '95 juli '95 jan '96 juli '96 dec '96
aver
age
num
ber e
ach
day
females����males
278
maids were young unmarried boys and girls, mainly sons and daughters oflabourers, who were usually contracted for one year, from May to May. Thiscontract could be lengthened by another year if both parties agreed to this.While the servants were still relatively young, their parents negotiated thecontracts. After some years (probably around the age of 18) it seems that theservants became more or less autonomous, taking the decisions themselves. Thisarrangement with live-in farm servants was attractive for both farmer andlabourer. The farmer had young servants at his disposal six or even seven days aweek, who were familiar with the horses, cows and the rest of the farm, whilethe maids could also do some of the housekeeping. The labourers saved on thecosts of food, and their children could already earn money at the age of 13-14.At least until around the age of 17 or 18 their wages were handed over to theparents.16 Children living at home could also earn money, but as has been notedit was difficult for them to find work the whole year through, and the parentsthen had to pay for their food expenses instead of the farmers.
The life cycle of the familyFortunately, four farmer accounts concerning hired labour in the village of
Nieuw-Scheemda have survived.17 These accounts are in general very rarebecause they were normally thrown away after some years.18 Two of theaccounts, Dallinga and Barlagen, are very detailed. The account of Van Cingelregisters only a few annual contracts and the last one, from Knottnerus, reportsthe annual earnings of each worker on the farm. Although the number oflabourers in the accounts is limited, the information given is very detailed. TheDallinga and Barlagen accounts in particular provide very precise informationabout some of the families of mainly regular labourers. Over a long period, thefarmer noted which of the family members worked and on which days. Thismeans that it is possible to relate the wage-earning of specific family members tothe family life cycle.
The nuclear family was the dominant household structure in Groningen,and this was also the case for the Nieuw-Scheemda labourers. Nevertheless,
16 In farm accounts, interference by the parents is stated explicitly only for the younger servants, andpayments to parents are mentioned only for them. For example, Farmer Glas of Loppersum, Wage bookservants 1880-1913 (owned by the Glas family of Huizinge).17 Groninger Archieven, familiearchief Dallinga, inv. no. 4; Groninger Archieven, Familiearchief Barlagen andDe Groot, inv. no. 12-13; Wage book Barlagen 1869-1881 (owned by the Westers family of Warffum); Servantsbook Van Cingel 1869-1935 (owned by the Van Cingel family of Haren); Loonboek Knottnerus (owned byO.S. Knottnerus of Zuidbroek, copy owned by the Nederlands Agronomisch-Historisch Instituut).18 For an English case see: J. Burnette, ‘Labourers at the Oakes: Changes in the demand for female day-laborers at a farm near Sheffield during the Agricultural Revolution’, Journal of Economic History, 59 (1999) 41-67.
279
quite a lot of the families were extended for a few years, but if the circumstancesare investigated this was mainly for forced reasons such as a daughter givingbirth to illegitimate children and living temporarily in the house of thegrandparents until the daughter married, or a son making a girl pregnant at theage of 19 and being forced to marry immediately without having a house of hisown. Afterwards the young family left the parental household as soon aspossible. There was also a daughter who was widowed very young and returnedto her parents with two little children.
Table 4 Forced first marriages of cohort members (unskilled labourers) born around1830, 1850 and 1870 in the Groningen clay area (percentages)
1830 1850 1870First child born before marriage 11% 13% 10%First child born before 6½ months of marriage 41% 42% 50%First child born after 6½ months of marriage 48% 46% 40%N 205 174 121
Source: Cohort analysis Integral History project Groningen.
As Table 4 shows, forced marriages were very common for labourers in theGroningen clay area. In this sense bourgeois ideas on family life do not seem tohave made much impact on this occupational group in the second half of thenineteenth century. The practice of letting the female partner become pregnantbefore marrying even seems to have increased. Forced marriages of course alsosignified that new couples were suddenly confronted with the problem ofstarting a household of their own. For the first months these problems wereoften solved by staying in one of the parental households or returning to thesehouseholds. Because the bride as well as the bridegroom were often working aslive-in servants on annual contracts, it was financially beneficial to remain so foras long as possible. Sometimes the husband even kept working as a live-in farmhand for a short period after marriages and birth of the first child. Although thispractice of forced marriage would seem to have created much uncertainty it wasnot completely irrational. Married women could earn less money (andemoluments) as day labourers than unmarried women as live-in maids. So it wasattractive to keep on working as a farm maid for as long as possible andpostpone marriage until this event was nearly inevitable.
The practice of forced marriages presumably also stimulated youngmarriages. It is remarkable that the age at marriage of female labourers was atfirst (cohort born 1830) higher than that for other occupational groups.19
19 Compared with P. Kooij and A. Mennens-van Zeijst, ‘Demographic behaviour in the Groningen clay area.The results of cohort analysis’, in: Kooij (ed.), Where the twain meet, 190.
280
During the second half of the nineteenth century, however, the marriage age offemale labourers fell swiftly, so that later on female labourers married relativelyyoung. During the whole period, male labourers were relatively young whenmarrying compared with other groups in the Groningen clay area. However,their average age at marriage also fell slightly more during the second half of thenineteenth century.
Table 5 Average age at marriage of cohort members born 1830, 1850 and 1870 inthe Groningen clay area who became labourers after marriage
males N females N
1830 27.7 98 27.6 1281850 26.6 82 24.9 1031870 24.9 58 24.5 71
Source: Collenteur and Paping, ‘De arbeidsmarkt voor inwonend boeren-personeel’, 115.
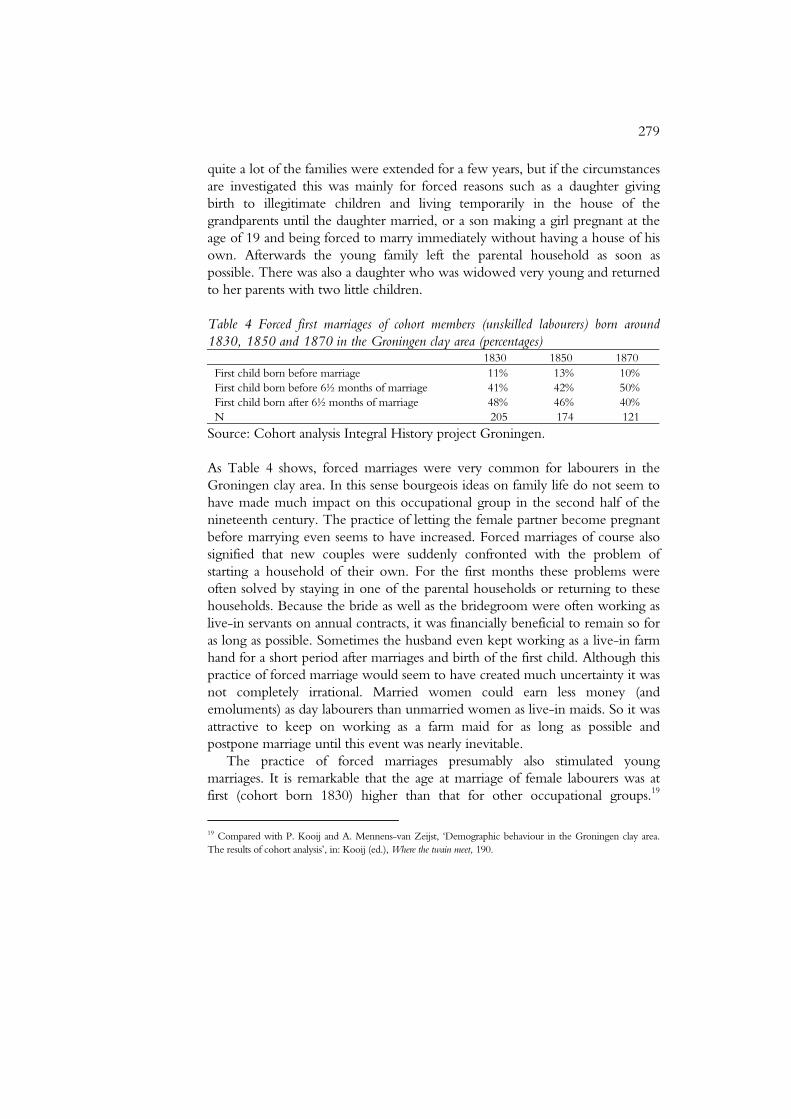
A theoretical family life cycle can be sketched for working class families.20 Wemust remember that most of the couples started a household of their own assoon as possible after the wedding and stayed independent during the wholeperiod of their marriage. In the first years of marriage the labourer families werestill quite small with no children, or only one young child, and this can be seenas the first phase of the family life cycle. The number of children increased inthe following years and particularly between 5 and 15-20 years of marriage,many young children incapable of earning much money themselves were livingin the household (the second phase of the family life cycle).
However, after about 15 years most of the children became capable ofworking and in most of the families no new children were born anymore. Inthis third period of the family life cycle, which lasted until 25-30 years aftermarriage, the number of non-working children fell steadily, while the numberof children working increased. However, it has already been remarked thatmany of these children left the parental household to become live-in farmservants so that in this period the size of many labourer families began todecrease. This fall in size took place quite early for the families with fewchildren, and much later for large families such as the Snitjers. In the fourthphase in the family life cycle, after 25-30 years of marriage, the two old parents,if still alive, remained alone or sometimes with only one or two children in thehousehold.
20 A. Knotter, ‘Gezinsarmoede-gezinsarbeid: De invloed van de gezinscyclus op de inkomsten van gezinnen vanlosse (haven)arbeiders in Amsterdam in de eerste helft van deze eeuw’, in: Kok et al., Levensloop en levenslot, 209-210.
281
Figure 2 Average household size and duration of marriage for several labourers in Nieuw-Scheemda in the second half of the nineteenth century
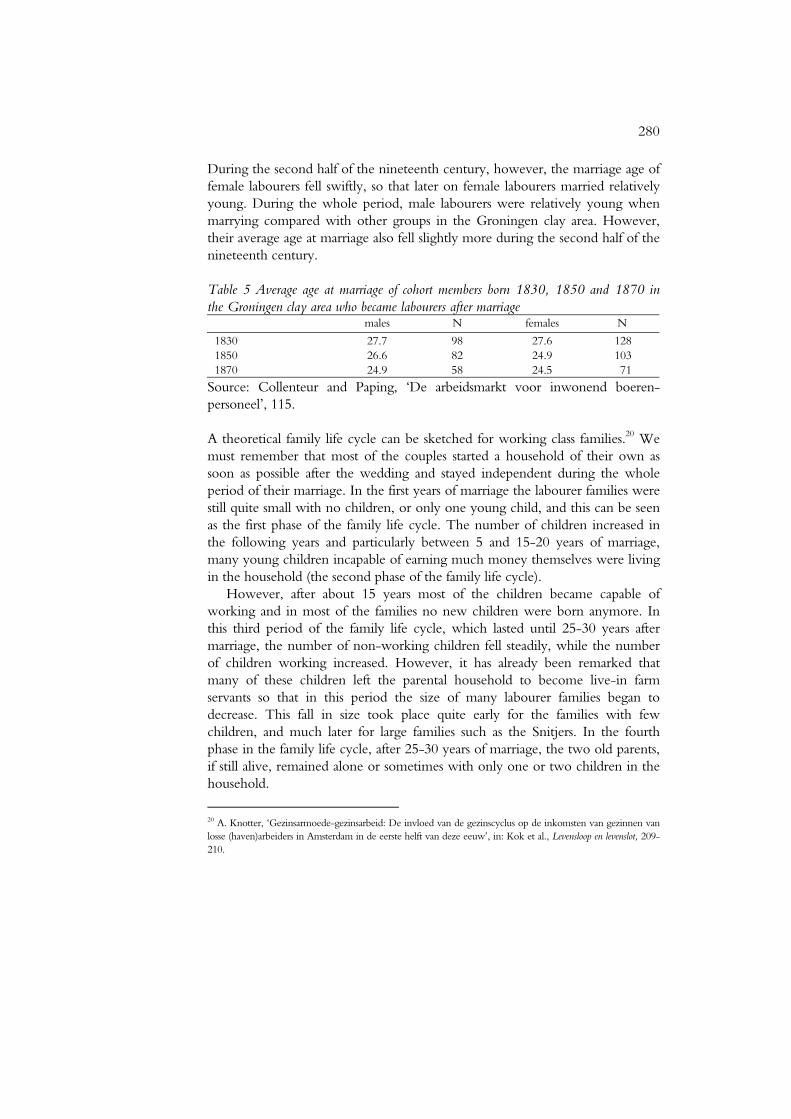
Figure 3 Number of children of married cohort members (labourers born 1830, 1850 and1870)
������������
����������������
������������������������
������������������������������������
���������������
����������������������������
���������������������
������������������������������������
������������������
��������������������
������������
������������
������
������
������
0
2
4
6
8
10
12
14
16
18
20
0 1 2 3 4 5 6 7 8 9 10 11 12 13 14
number of children
perc
enta
ge o
f coh
ort-m
embe
rs
1830���18501870
0
2
4
6
8
10
12
0 5 10 15 20 25 30 35 40
years since marriage
num
ber o
f hou
seho
ld-m
embe
rs
Total averageSnitjerPrak
282
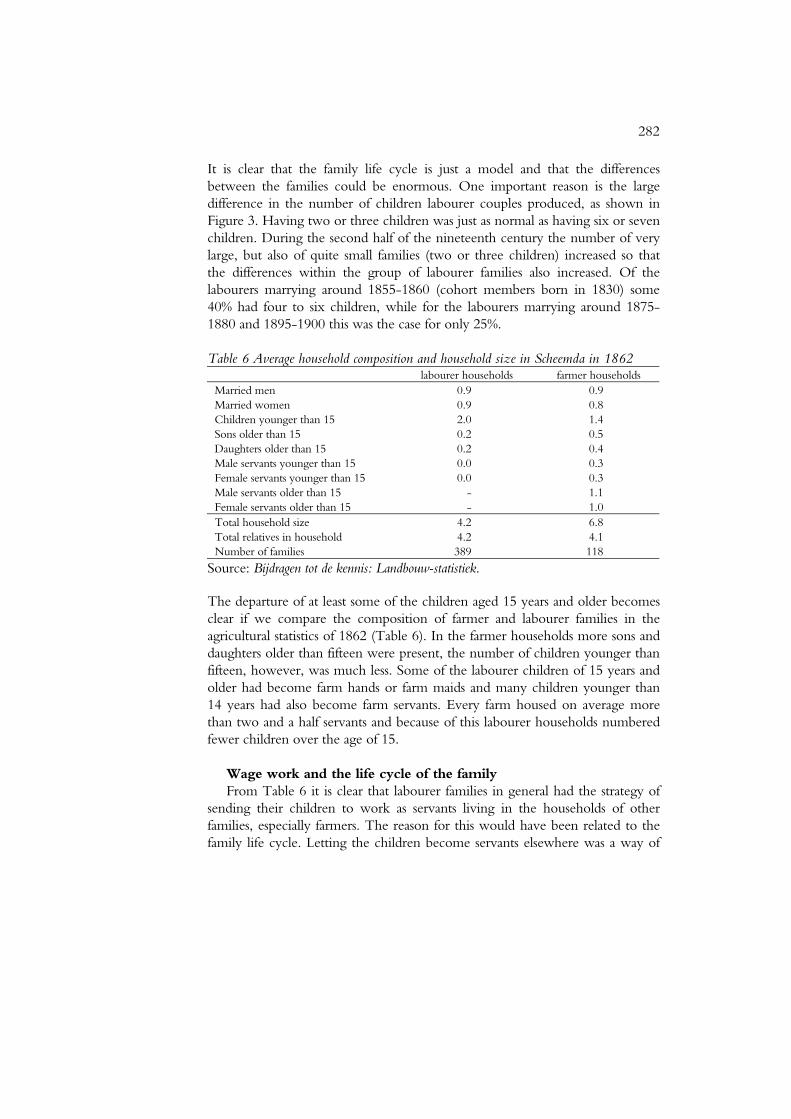
It is clear that the family life cycle is just a model and that the differencesbetween the families could be enormous. One important reason is the largedifference in the number of children labourer couples produced, as shown inFigure 3. Having two or three children was just as normal as having six or sevenchildren. During the second half of the nineteenth century the number of verylarge, but also of quite small families (two or three children) increased so thatthe differences within the group of labourer families also increased. Of thelabourers marrying around 1855-1860 (cohort members born in 1830) some40% had four to six children, while for the labourers marrying around 1875-1880 and 1895-1900 this was the case for only 25%.
Table 6 Average household composition and household size in Scheemda in 1862labourer households farmer households
Married men 0.9 0.9Married women 0.9 0.8Children younger than 15 2.0 1.4Sons older than 15 0.2 0.5Daughters older than 15 0.2 0.4Male servants younger than 15 0.0 0.3Female servants younger than 15 0.0 0.3Male servants older than 15 - 1.1Female servants older than 15 - 1.0Total household size 4.2 6.8Total relatives in household 4.2 4.1Number of families 389 118
Source: Bijdragen tot de kennis: Landbouw-statistiek.
The departure of at least some of the children aged 15 years and older becomesclear if we compare the composition of farmer and labourer families in theagricultural statistics of 1862 (Table 6). In the farmer households more sons anddaughters older than fifteen were present, the number of children younger thanfifteen, however, was much less. Some of the labourer children of 15 years andolder had become farm hands or farm maids and many children younger than14 years had also become farm servants. Every farm housed on average morethan two and a half servants and because of this labourer households numberedfewer children over the age of 15.
Wage work and the life cycle of the familyFrom Table 6 it is clear that labourer families in general had the strategy of
sending their children to work as servants living in the households of otherfamilies, especially farmers. The reason for this would have been related to thefamily life cycle. Letting the children become servants elsewhere was a way of
283
letting them generate income and of lowering the costs of consumption withinthe labourer households.
In this first phase of the family life cycle it was relatively easy for marriedwomen to perform wage work since they only had a few children to take careof. However, in this first period it was less necessary for women to work as thesmall family could relatively easily survive on the wages of the father. Economi-cally, the first phase was in general a favourable period.
After some years the household started to grow further and further as moreand more children were born and the need for money and food to maintain thefamily increased rapidly. However, for the mothers it became much moredifficult to do wage work because they had to take care of the children. Whenthe oldest labourer children became 9 years old they were sometimes notallowed to go to school in summer anymore as they had to keep an eye on theirlittle brothers and sisters while mother was with father at work on the farm. Inthis way it was possible for married women to combine farm work duringsummer with having a large number of young children.
The third phase started when the oldest children reached the age at whichthey could earn income. For the labourer family it was very attractive to letthem earn as much as possible for in this way the family could escape from thedifficult second phase when the parents were troubled with too many depen-dent children. Leaving home to become a servant meant at least a reduction incosts for the labourer family, not to mention the wage they could give to theparents. For most of the children, by the time they reached the age of 14 thefamily was in a very difficult period. For the older children in the larger familiesthe parents at that time still had to take care of numerous younger brothers andsisters, while for the last children in the labourer family it was also necessary toearn as much money as possible because the earning capacities of the parentshad begun to fall. The family was entering the dangerous phase four of thefamily life cycle. Work in agriculture was very strenuous and many labourerswere not capable of working after the age of 50 to 60. The period between 20and 25 years after marriage was in general quite favourable for the labourerfamilies, but this was only the case if the family succeeded in finding well-paidjobs for the children.
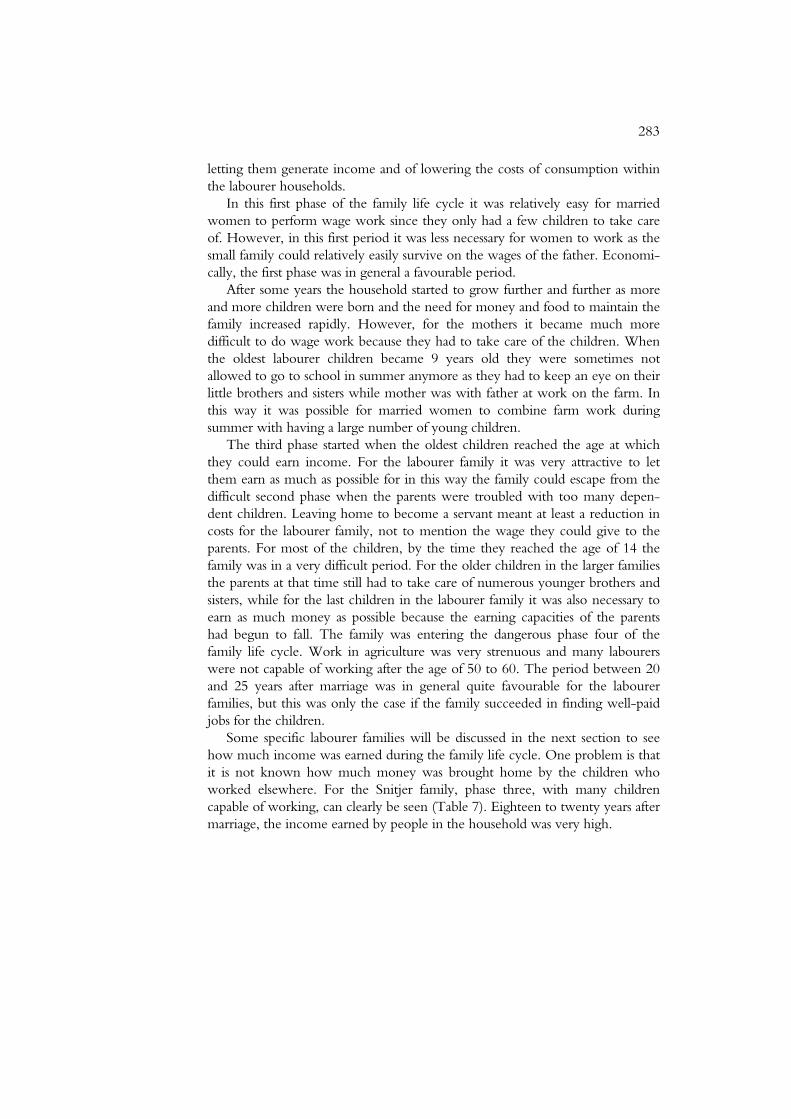
Some specific labourer families will be discussed in the next section to seehow much income was earned during the family life cycle. One problem is thatit is not known how much money was brought home by the children whoworked elsewhere. For the Snitjer family, phase three, with many childrencapable of working, can clearly be seen (Table 7). Eighteen to twenty years aftermarriage, the income earned by people in the household was very high.
284
Table 7 The earnings in Dutch guilders of the Snitjer family, 1877-1879, 1885-1891, (regular) labourers for farmer Dallinga inNieuw-Scheemda
birth 1877 1878 1879 1886 1887 1888 1889 1890 1891Klaas S. *1834 310.71 287.19 251.59 252.26 265.05 250.40 232.51 68.91 12.10Trijntje O. *1836 36.20 23.20 29.63 27.84 40.66 37.46 19.43 4.55 -Geessien S. *1859 28.25 52.73 63.97 leftHindrik S. *1861 196.40 224.05 215.00 leftKoert S. *1864 12.81 13.57 f. h. leftHarm S. *1866 - 0.90 6.80 f. h. 61.41 marriedFrouwke S. *1869 - - - 10.70 - 19.85 1.20 - 8.43Aaltje S. *1871 - - - 16.50 35.50 maid maid maid 16.88Fenje S. *1875 deceased 1884Luppo S. *1878 deceased 1878Poor relief 46.00
Total 584.37 601.64 566.99 307.30 402.62 307.71 253.14 73.46 83.41Years after marriage (18) (19) (20) (27) (28) (29) (30) (31) (32)Number of children 7 7 6 2 3 1 1 1 2
Source: Groninger Archieven, familiearchief Dallinga, inv. no. 4; f.h. means farm hand.
285
This was mainly due to the son, Hindrik Snitjer, who left the household forthe city of Groningen in 1885. Some 25-30 years after marriage the familyincome was already much lower, but in this period the costs were also lowbecause only a few children were still living at home. In 1889, father KlaasSnitjer’s wage was first lowered, but by the next year, at the early age of 55,Klaas had become totally incapable of working. Afterwards Klaas Snitjer and hiswife received poor relief each week, totalling 104 guilders a year. The Snitjerfamily had clearly arrived in the very unfavourable phase four of the family lifecycle, no longer being capable of earning enough money for a living.
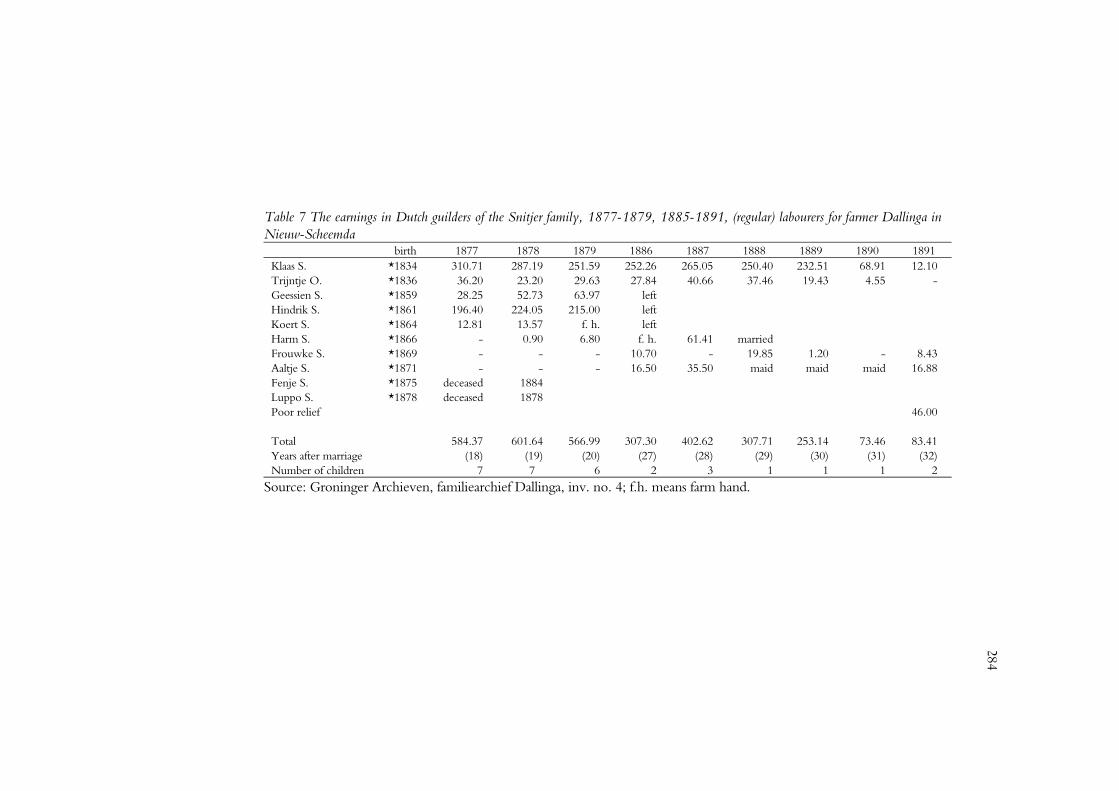
Table 8 Income composition of the household of the Prak family, regular labourer forfarmer Barlagen in Nieuw-ScheemdaYears aftermarriage
Total income
Lodewijk*1850
Grietje *1851
Thomas *1879
Maria *1881
Hendrikje *1883
1878 (3) 304.27 90% 10%1879 (4) 288.48 90% 10%1880 (5) 331.25 85% 15%1881 (6) 315.08 84% 16%1882 (7) 318.60 87% 13%1883 (8) 287.57 87% 13%1884 (9) 317.61 77% 23%1885 (10) 301.01 75% 25%1886 (11) 283.37 85% 15%1887 (12) 277.72 86% 14%1888 (13) 260.98 86% 13% 1%1889 (14) 282.45 87% 12% 1%1890 (15) 325.48 83% 16% 1%1891 (16) 330.72 85% 14% 1%1892 (17) 332.39 83% 10% 7%1893 (18) 350.67 76% 10% 13% 1% 0%1894 (19) 396.17 66% 8% 21% 4%1895 (20) 454.10 56% 8% 29% 7%1896 (21) 385.01 65% 10% 16% 10%1897 (22) 326.38 76% 12% farm hand 13%1898 (23) 328.66 76% 7% elsewhere 17%
Source: Groninger Archieven, Familiearchief Barlagen and De Groot, inv. no.12-13; Wage book Barlagen 1869-1881.
The family life cycle is also clearly present in the wage-earning development ofthe Prak family (Table 8). From a few years after the beginning of the marriageuntil fifteen years after, the amount of money earned did not change much,although the number of children rose from zero to three. The father earnedsome 85-90% of the family income, while mother Grietje Kramer only worked
286
in the summer and had a share of 10-15% of the family income. Strangelyenough, it was exactly in the period that there were three very young childrenat home, 1884-1885, that the mother worked substantially longer in order tocompensate for the declining income of her husband. When the son Thomasbegan to work regularly while still staying at home there was a steep rise in thefamily income. After Thomas had left to become a farm hand else-where thisrole was taken over by his sister, Maria Prak. Extraordinary was the presence athome of Hindriktje Prak, who never did any farm work. Although thepopulation register records no special occupation for Hindriktje, it is pro-bablethat she had a different way of contributing to the family income. Possibly thePrak family tried to protect the youngest daughter from a not very promisingfuture in agriculture, which would correspond with the findings that children inthe Groningen countryside who did not become a live-in servant had a greaterchance of upward social mobility.21
In the short term it was economically attractive for labourer families toensure that their young children earned money as fast as possible. This wasespecially the case if the family was in the second phase of the family life cycle.
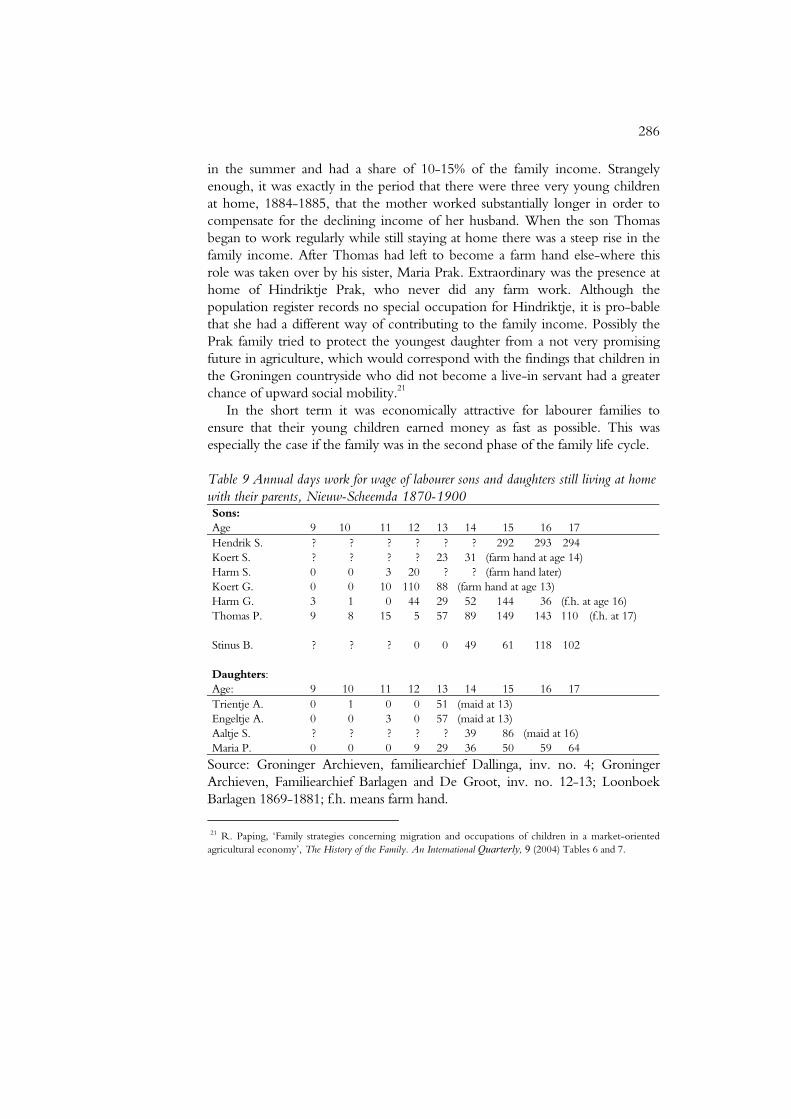
Table 9 Annual days work for wage of labourer sons and daughters still living at homewith their parents, Nieuw-Scheemda 1870-1900Sons:Age 9 10 11 12 13 14 15 16 17Hendrik S. ? ? ? ? ? ? 292 293 294Koert S. ? ? ? ? 23 31 (farm hand at age 14)Harm S. 0 0 3 20 ? ? (farm hand later)Koert G. 0 0 10 110 88 (farm hand at age 13)Harm G. 3 1 0 44 29 52 144 36 (f.h. at age 16)Thomas P. 9 8 15 5 57 89 149 143 110 (f.h. at 17)
Stinus B. ? ? ? 0 0 49 61 118 102
Daughters:Age: 9 10 11 12 13 14 15 16 17Trientje A. 0 1 0 0 51 (maid at 13)Engeltje A. 0 0 3 0 57 (maid at 13)Aaltje S. ? ? ? ? ? 39 86 (maid at 16)Maria P. 0 0 0 9 29 36 50 59 64
Source: Groninger Archieven, familiearchief Dallinga, inv. no. 4; GroningerArchieven, Familiearchief Barlagen and De Groot, inv. no. 12-13; LoonboekBarlagen 1869-1881; f.h. means farm hand.
21 R. Paping, ‘Family strategies concerning migration and occupations of children in a market-orientedagricultural economy’, The History of the Family. An International Quarterly, 9 (2004) Tables 6 and 7.
287
Table 9 shows how many days each year some of the children worked on thefarm for daily wages. With the exception of Hindrik Snitjer, it was impossiblefor children of labourers living with their parents to find full-time work. Thiswas even more difficult for girls than for boys. At a maximum they could find60 to 90 days of paid labour per year so it was very attractive for the families oflabourers to let the girls become a maid as soon as possible. The problems seemto have been a little less for boys. However, neither Thomas Prak nor StinusBos managed to find paid labour for more than half of the year, although theywere already 16 or 17 years old.
It is also clear from Table 9 that the number of paid working days ofchildren younger than 12 years on the farm was negligible. Boys and girls of 13or 14 worked only some 2 to 3 months each year, although there wereexceptions like the sons in the Greven family, Koert and Harm, who were bothrelatively active when they were only 12 or 13 years old. The reasons for thisare not clear. For the parents, the wages of their only two sons would not seemto have been crucial, because of the small family size and the very activemother. Perhaps this family regarded wage work as very important for children.
Most of the children did indeed become live-in farm servants, some whenthey were only 13 years old; others stayed at home until they were 16 and aminority always stayed at home. At the end of the nineteenth century thenumber of farm servants fell steeply because of the proliferation of thispractice.22 Because the standard of living of labourer families had increased quitea lot – a result of rising real wages – labourer families became more inclined tokeep their children at home. This must have been socially attractive with familylife remaining intact in this way, not being affected by absent children. Also, thechildren probably had more freedom in their parental home than in the housesof the farmers, where they had to make very long working days, and sometimesalso had to work on Sundays. Possibly the most important reason for thisdevelopment, however, is that the future prospects of labourer children stayingat home were better than for those who became live-in servants.23 Significantlymore children of labourers who stayed at home managed in the long run toescape from the dismal life of an unskilled farm labourer. Families around 1900must have been aware of the success of the children who did not become live-in servants, because this phenomenon can already be seen quite significantlyaround 1850. Around 1900 the strategy of keeping children at home can in thisway be seen as an investment in their future and in the quality of life.24
22 Collenteur en Paping, ‘De arbeidsmarkt voor inwonend boerenpersoneed’.23 Paping, ‘Gezinnen en cohorten’, 68-70. 24 T. Engelen, ‘Labour strategies of families: A critical assessment of an appealing concept’, International Review of
288
However, in the short term it meant that costs rose, because of expenditure onfood, and perhaps also wage income decreased because the children could noteasily find work the whole year round.
The difficult period in the second phase of the family life cycle forced mostof the labourer families to let their children become live-in servants as soon aspossible. The more favourable third phase was easier to reach when the olderchildren were consuming elsewhere and were working the whole year round.Another question concerning this family life cycle is whether it influenced thedecision of the female marriage partner to work, and particularly whether itinfluenced the number of working days since nearly all the wives of labourersworked at least a few days each year for wages. Ad Knotter has suggested thatthe wives of labourers only worked if their husbands did not earn enough.25
However, if the children were old enough they replaced their mother as wageearners. This has to mean that the number of working days of mothers shouldbe closely related to the phases in the family life cycle.
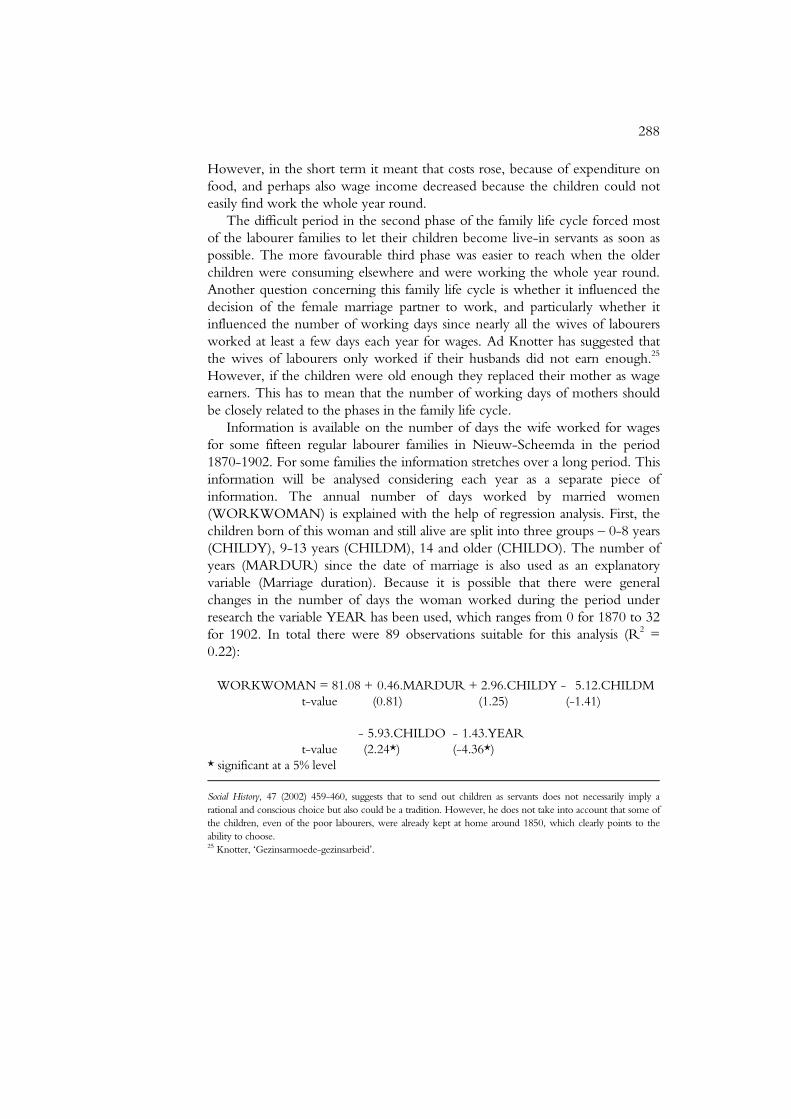
Information is available on the number of days the wife worked for wagesfor some fifteen regular labourer families in Nieuw-Scheemda in the period1870-1902. For some families the information stretches over a long period. Thisinformation will be analysed considering each year as a separate piece ofinformation. The annual number of days worked by married women(WORKWOMAN) is explained with the help of regression analysis. First, thechildren born of this woman and still alive are split into three groups – 0-8 years(CHILDY), 9-13 years (CHILDM), 14 and older (CHILDO). The number ofyears (MARDUR) since the date of marriage is also used as an explanatoryvariable (Marriage duration). Because it is possible that there were generalchanges in the number of days the woman worked during the period underresearch the variable YEAR has been used, which ranges from 0 for 1870 to 32for 1902. In total there were 89 observations suitable for this analysis (R2 =0.22):
WORKWOMAN = 81.08 + 0.46.MARDUR + 2.96.CHILDY - 5.12.CHILDMt-value (0.81) (1.25) (-1.41)
- 5.93.CHILDO - 1.43.YEARt-value (2.24*) (-4.36*)
* significant at a 5% level Social History, 47 (2002) 459-460, suggests that to send out children as servants does not necessarily imply arational and conscious choice but also could be a tradition. However, he does not take into account that some ofthe children, even of the poor labourers, were already kept at home around 1850, which clearly points to theability to choose.25 Knotter, ‘Gezinsarmoede-gezinsarbeid’.

289
The result is perhaps a little disappointing because only 22% of the differencesare explained by the regression equation. The most important explanatoryvariable is not the family life cycle but the specific year. Wives of labourersdecreased their number of working days significantly during the period 1870-1902. The explanation must be partly sought in the rising real wages of theirhusbands and also partly in the development that paid labour of married womenwith children became socially less acceptable. However, the number of childrenolder than 14 years also had a significant influence. In accordance with Knotter’sfindings it appears that the earnings of these older children partly replaced theearnings of their mothers. As the children became older the income of thewives of the labourers became less necessary. The presence of children betweenthe ages of 9 and 13, who could take care of the younger children and in thisway make it easier for their mothers to work, did not promote working by thewomen. On the contrary, it even seems that these children also earned enoughto allow their mother to stop working, although this influence was notstatistically significant.
The family life cycle was modelled in a second regression equation with thehelp of a dummy variable (R2 = 0.17). This showed that it was only in the thirdphase that the wives of labourers significantly decreased their number ofworking days, which is in accordance with the earlier result that older childrenpartly replaced their mother in earning income. The mothers already reducedtheir number of working days in the second phase because of the large numberof children to take care of, but this influence was very insignificant. In thedummy, PHASE1, families with up to two children younger than 14 years, andfewer children older than 14 years than younger than 14 years, was set at zero.PHASE2 comprises families with more than two children younger than 14, andfewer children older than 14 years than younger than 14 years. PHASE3comprises families with more or just as many children over the age of 14 yearsas under.
WORKWOMAN = 85.10 - 3.95.PHASE2 - 17.86.PHASE3 - 1.25.YEARt-value (0.57) (2.32*) (3.76*)
* significant at a 5% level.
The equation which models the three phases results in only 17% explaineddeviations, which is less than the equation with the number of children, leaving83% unexplained deviations. It is clear that other factors next to the family lifecycle were of importance when married female labourers made decisions onwhether to go to work or not. It is possible that social opinions and the ambi
290
tion level of the family also played an important role.
ConclusionsJust as elsewhere, labourer families in Nieuw-Scheemda in Groningen in the
second half of the nineteenth century went through a family life cycle. Becauseof the growing number of young children who did not earn any money, theeconomic position of the labourer family became more difficult after some 5years of marriage. After some 15 or 20 years the situation became better whenolder children began to contribute to the family income. The number of house-hold members began to decrease during this period, because most children lefthome to go work and live on farms between the ages of 13 to 16. However,children began to do farm work as early as age 12-13, although not veryregularly, earning only small amounts of money. Children living at home wereconfronted with high seasonal unemployment. Only as a live-in servant theycould be sure of finding work the whole year round. Working as a live-inservant was economically attractive because the farmer paid for the daily food,and the wages were generally higher than could be earned by irregular farmlabour when the children stayed at home. However, by the end of thenineteenth century farm labourers increasingly kept their children at home,even when the children reached the age of 16. Although unattractive in theshort term this strategy was preferred, presumably because staying at home wasbetter for the future of the children and also more pleasant.
Female farm labourers only worked during the summer half year. The far-mers were not in need of much labour in the winter and female labourers weredismissed during this period. Some wives of labourers worked more and othersworked less. The family life cycle caused some problems if women wanted towork. If there were young children someone had to take care of them. How-ever, especially in the period when there were many young children, the extramoney earned by the mother was needed the most. From the number of daysfemale labourers worked it is clear that they chose to work when the childrenwere young. Their number of working days declined somewhat when thechildren began to grow older, but never stopped altogether, so it may bepresumed that females worked partly because it was necessary. However evenwhen it was not absolutely necessary female labourers remained working forsome days in order to supplement their husband’s income.
During the period 1870-1902 the number of days worked by marriedfemale labourers fell. The probable reasons are that female labour became lessaccepted and the labourer families could afford the mother working less,because the real wages of the males were increasing fast during this period. Thedecreasing number of days worked by female labourers in Nieuw-Scheemda is

291
in agreement with the emergence of the normal pattern of family labour in theNetherlands during the twentieth century until 1975: the man worked andearned the money while the wife stayed at home and took care of the childrenand the household.
Related Documents


![Navigating the Family Philanthropy Lifecycle [Read-Only] · The family/family office can help organize philanthropy meetings either as a way test the families desire to work together](https://static.cupdf.com/doc/110x72/5f99aa2d418a3341192bbb24/navigating-the-family-philanthropy-lifecycle-read-only-the-familyfamily-office.jpg)