® SRI International 333 Ravenswood Avenue Menlo Park, CA 94025 March 28, 2005 FAMILY INVOLVEMENT IN THE EDUCATIONAL DEVELOPMENT OF YOUTH WITH DISABILITIES A Special Topic Report of Findings from the National Longitudinal Transition Study-2 (NLTS2) Prepared for: Office of Special Education Programs U.S. Department of Education NLTS2 has been funded with Federal funds from the U.S. Department of Education, Office of Special Education Programs, under contract number ED-01-CO-0003. The content of this publication does not necessarily reflect the views or policies of the U.S. Department of Education nor does mention of trade names, commercial products, or organizations imply endorsement by the U.S. government.

Welcome message from author
This document is posted to help you gain knowledge. Please leave a comment to let me know what you think about it! Share it to your friends and learn new things together.
Transcript
®
SRI International 333 Ravenswood Avenue Menlo Park, CA 94025
March 28, 2005
FAMILY INVOLVEMENT IN THE EDUCATIONAL DEVELOPMENT OF YOUTH WITH DISABILITIES A Special Topic Report of Findings from the National Longitudinal Transition Study-2 (NLTS2)
Prepared for: Office of Special Education Programs U.S. Department of Education
NLTS2 has been funded with Federal funds from the U.S. Department of Education, Office of Special Education Programs, under contract number ED-01-CO-0003. The content of this publication does not necessarily reflect the views or policies of the U.S. Department of Education nor does mention of trade names, commercial products, or organizations imply endorsement by the U.S. government.
®
SRI International 333 Ravenswood Avenue Menlo Park, CA 94025
March 28, 2005
FAMILY INVOLVEMENT IN THE EDUCATIONAL DEVELOPMENT OF YOUTH WITH DISABILITIES A Special Topic Report of Findings from the National Longitudinal Transition Study-2 (NLTS2)
Prepared for: Office of Special Education Programs U.S. Department of Education
Prepared by: Lynn Newman SRI Project P11182 NLTS2 has been funded with Federal funds from the U.S. Department of Education, Office of Special Education Programs, under contract number ED-01-CO-0003. The content of this publication does not necessarily reflect the views or policies of the U.S. Department of Education nor does mention of trade names, commercial products, or organizations imply endorsement by the U.S. government.
i
ACKNOWLEDGMENTS
The comprehensiveness and scale of the National Longitudinal Transition Study-2 (NLTS2) make it a complex study that is made possible only by the contributions of a large team. The author’s sincere thanks go to:
• Pat Gonzalez and Lou Danielson of the Office of Special Education Programs, U.S. Department of Education, for their leadership and guidance in helping make NLTS2 and the OSEP longitudinal studies program such a valuable asset to our field.
• Kathryn Valdes, Mary McCracken, Hal Javitz, and the rest of SRI’s programming and data management team, whose technical expertise and responsiveness to innumerable and sometimes frantic analyses requests make a huge analytic task manageable.
• Marion Collins, Klaus Krause, and SRI’s administrative team for their unfailing support in bringing the study’s findings to the public.
• Mary Wagner for her always insightful input and review. • Our colleagues at Westat for their contributions as subcontractors in collecting the data
reported here. • Richard Robison and Trina Osher, who reviewed this report, and to our several
colleagues in the research, policy, practitioner, parent, and advocacy communities who have contributed their time and ideas to NLTS2 along the way.
But none of the contributions made by the NLTS2 team would be meaningful without the generosity of the more than 9,000 parents and guardians of youth with disabilities whose stories we tell. Our hats are off to them for their time, openness, and insights.

ii
iii
CONTENTS
Acknowledgments ...................................................................................................................... i Executive Summary .................................................................................................................... ES-1 1. Examining Family Involvement in Support of Youth with Disabilities ................. 1-1 Research Questions .................................................................................................... 1-3 Information Sources .................................................................................................... 1-3 Technical Notes .......................................................................................................... 1-3 Organization of the Report .......................................................................................... 1-4
2. Family Involvement at Home ...................................................................................... 2-1 Involvement at Home .................................................................................................. 2-1 Scale of Family Support at Home ......................................................................... 2-3 Comparison with Families in the General Population ........................................... 2-4 Disability Differences in Home-Based Family Involvement ......................................... 2-6 Summary ..................................................................................................................... 2-7
3. Family Involvement at School .................................................................................. 3-1 Involvement in School-Based Activities, Other Than IEP Meetings ............................ 3-1 Scale of Involvement in School-Based Activities ................................................... 3-3 Comparison with Families in the General Population ........................................... 3-4 Involvement in the IEP Process .................................................................................. 3-5 Differences in School-Based Family Involvement across Disability Categories ......... 3-8 Summary ..................................................................................................................... 3-9
4. Student and Family Characteristics Associated with Family Involvement ......... 4-1 Types of Family Involvement Included in Analyses .................................................... 4-2 Youth and Family Characteristics Included in Analyses ............................................. 4-3 Youth Characteristics ............................................................................................ 4-3 Family Characteristics ........................................................................................... 4-6 Characteristics Associated with Family Involvement .................................................. 4-8 Individual Characteristics ...................................................................................... 4-9 Family Characteristics ........................................................................................... 4-13 Summary ..................................................................................................................... 4-18

iv
5. Looking to the Future: Family Expectations .......................................................... 5-1 Educational Attainment Expectations .......................................................................... 5-1 Independence Expectations ........................................................................................ 5-4 Disability Differences in Family Expectations .............................................................. 5-6 Educational Attainment ......................................................................................... 5-6 Independence ....................................................................................................... 5-8 Demographic Differences in Expectations .................................................................. 5-10 Summary ..................................................................................................................... 5-15
6. Relationship of Family Involvement to Student Outcomes .................................. 6-1 Independent Variables Included in Multivariate Analyses ........................................... 6-1 Relationship between Family Involvement and Student Achievements ...................... 6-3 School Engagement .............................................................................................. 6-3 Academic Performance ......................................................................................... 6-4 Social Adjustment ................................................................................................. 6-6 Independence ....................................................................................................... 6-7 Summary ..................................................................................................................... 6-8
7. Families Make a Difference: Summary and Implications ...................................... 7-1 Key Themes ................................................................................................................ 7-1 Highly Involved Families ....................................................................................... 7-1 More Involved Than Other Families ...................................................................... 7-2 Similarities between Families of Students with Disabilities and Other Families .... 7-2 High Expectations for the Future ........................................................................... 7-3 Involvement Is Important ....................................................................................... 7-3 Implications ................................................................................................................. 7-3
References ....................................................................................................................... R-1
Appendix A NLTS2 Sampling, Data Collection, and Analysis Procedures .............. A-1 NLTS2 Sample Overview ............................................................................................ A-1 The NLTS2 LEA Sample ............................................................................................. A-2 The NLTS2 Student Sample ....................................................................................... A-4 Data Sources .............................................................................................................. A-5 Combining Data from Multiple Data Sources .............................................................. A-6 Weighting Wave 1 Data .............................................................................................. A-8 Estimating Standard Errors ......................................................................................... A-10 Unweighted and Weighted Sample Sizes ................................................................... A-11 Calculating Significance Levels ................................................................................... A-13 Multivariate Analysis Methods ..................................................................................... A-13 Correlations among Types of Family Involvement ...................................................... A-14 Measurement and Reporting Issues ........................................................................... A-15 Appendix A References .............................................................................................. A-20
v
Appendix B Demographic Characteristics of Youth with Disabilities and Their Households .............................................................................................. B-1 Individual Characteristics ............................................................................................ B-1 Household Risk Factors .............................................................................................. B-5 Summary ..................................................................................................................... B-8 Appendix B References .............................................................................................. B-9
Appendix C Estimated Differences for the Models Presented in Chapter 4 ........... C-1
Appendix D Independent Variables Included in Multivariate Analyses Presented in Chapter 6 .............................................................................................. D-1
Appendix E Unweighted Sample Sizes ...................................................................... E-1
vi
EXHIBITS 2-1 Helping with Homework ....................................................................................... 2-2 2-2 Talking about School ........................................................................................... 2-3 2-3 Family Support at Home ...................................................................................... 2-4 2-4 Frequency of Receiving Help with Homework for Secondary School Students
with Disabilities and in the General Population ................................................. 2-5 2-5 Family Involvement at Home, by Disability Category .......................................... 2-6 3-1 Involvement in School-Based Activities by Families of Students with Disabilities 3-2 3-2 Frequency of Involvement in School-Based Activities by Families of Students
with Disabilities .................................................................................................. 3-3 3-3 Scale of Family Involvement in School-Based Activities ..................................... 3-4 3-4 Involvement in School-Based Activities by Families of Students with Disabilities
and Students in the General Population ............................................................ 3-5 3-5 Family Attendance at Individualized Education Program Meetings ..................... 3-6 3-6 Individualized Education Program Decision-Making ............................................ 3-8 3-7 School-Based Family Involvement, by Disability Category .................................. 3-9 4-1 Differences in Family Involvement Associated with Functional Ability
Characteristics of Youth with Disabilities ........................................................... 4-9 4-2 Differences in Family Involvement Associated with Demographic
Characteristics of Youth with Disabilities ........................................................... 4-11 4-3 Differences in Family Involvement Associated with School-Related
Characteristics of Youth with Disabilities ........................................................... 4-12 4-4 Differences in Family Involvement Associated with Household Characteristics
of Youth with Disabilities ................................................................................... 4-13 4-5 Differences in Family Involvement Associated with Demands on
Families of Youth with Disabilities ..................................................................... 4-15 4-6 Differences in Family Involvement Associated with Supports for
Families of Youth with Disabilities ..................................................................... 4-16 4-7 Differences in Family Involvement Associated with Perceptions of Families
of Youth with Disabilities ................................................................................... 4-17 4-8 Differences in Family Involvement Associated with Families of Youth with
Disabilities’ Types of Involvement ..................................................................... 4-18 5-1 Parents’ Expectations for Youth’s Future Educational Attainment ...................... 5-2 5-2 Parents’ Expectations for Youth’s Future Postsecondary School Completion .... 5-3 5-3 Parents’ Expectations for Youth’s Future Driving, Employment, and
Financial Independence .................................................................................... 5-4 5-4 Parents’ Expectations for Youth’s Future Residential Independence .................. 5-6 5-5 Parents’ Expectations for Youth’s Future Education, by Disability Category ....... 5-7 5-6 Parents’ Expectations for Youth’s Future Independence, by Disability Category 5-9 5-7 Parents’ Expectations for Youth’s Future Educational Attainment, by Age ......... 5-10 5-8 Parents’ Expectations for Youth’s Future Independence, by Age ....................... 5-11 5-9 Parents’ Expectations for Youth’s Future Educational Attainment, by Income
and Race/Ethnicity ............................................................................................ 5-13 5-10 Parents’ Expectations for Youth’s Future Independence, by Income and
Race/Ethnicity ................................................................................................... 5-14
vii
6-1 Independent Variables Used in Multivariate Analyses of Student Achievements 6-3 6-2 Differences in School Engagement Associated with Levels of Family
Involvement ....................................................................................................... 6-4 6-3 Differences in Academic Performance Associated with Levels of Family
Involvement ....................................................................................................... 6-5 6-4 Differences in Social Adjustment Associated with Levels of Family Involvement 6-6 6-5 Differences in Independence Associated with Levels of Family Involvement ...... 6-7 A-1 Response Rates for NLTS2 Parent/Guardian Telephone Interview and
Mail Survey ........................................................................................................ A-6 A-2 Imputation of Missing Values ............................................................................... A-8 A-3 Example of Weighted Percentage Calculation .................................................... A-9 A-4 Example of Calculating Weighted Sample Sizes .................................................. A-12 A-5 Population Sizes of Groups Represented by NLTS2 ........................................... A-13 A-6 Correlations among Types of Family Involvement ............................................... A-15 A-7 Definitions of Disabilities ...................................................................................... A-16 A-8 Original Primary Disability Category of Youth Assigned to Deaf-Blindness
Category for NLTS2 Reporting Purposes .......................................................... A-18 A-9 Correspondence of Letter and Qualitative Grades in Constructing a Composite
Grade Variable ................................................................................................... A-18 B-1 Disability Category Distribution of Youth with Disabilities, Ages 13 to 16 ............ B-2 B-2 Youth’s Age on March 15, 2002, by Disability Category ...................................... B-3 B-3 Student Gender, by Disability Category ............................................................... B-4 B-4 Racial/Ethnic Backgrounds of Youth, by Disability Category ............................... B-5 B-5 Household Characteristics of Youth with Disabilities and Youth in the General
Population .......................................................................................................... B-6 B-6 Household Characteristics, by Disability Category .............................................. B-7 C-1 Differences in Family Involvement Associated with Disability Characteristics
of Youth with Disabilities .................................................................................... C-1 C-2 Differences in Family Involvement Associated with Demographic Characteristics
of Youth with Disabilities .................................................................................... C-2 C-3 Differences in Family Involvement Associated with School-Related
Characteristics of Youth with Disabilities ........................................................... C-2 C-4 Differences in Family Involvement Associated with Household Characteristics
of Youth with Disabilities .................................................................................... C-3 C-5 Differences in Family Involvement Associated with Demands on Families of
Youth with Disabilities ........................................................................................ C-3 C-6 Differences in Family Involvement Associated with Supports for Families of
Youth with Disabilities ........................................................................................ C-4 C-7 Differences in Family Involvement Associated with Perceptions of Families of
Youth with Disabilities ........................................................................................ C-4 C-8 Differences in Family Involvement Associated with Other Types of Involvement
of Families of Youth with Disabilities ................................................................. C-5
viii
E-1 Exhibits for Youth with Disabilities: Exhibits 2-1, 2-2, 2-3, 3-1, 3-2, 3-3, 3-5, 3-6,
5-1, 5-2, 5-3, 5-4 ................................................................................................ E-1 E-2 Exhibits for Disability Categories: Exhibits 2-5, 3-9, 5-5, 5-6 ............................... E-2 E-3 Unweighted Sample Sizes for Exhibits by Age: Exhibits 5-7, 5-8 ........................ E-3 E-4 Unweighted Sample Sizes for Exhibits by Household Income: Exhibits 5-9, 5-10 E-3 E-5 Unweighted Sample Sizes for Exhibits by Household Race/Ethnicity:
Exhibits 5-9, 5-10 ............................................................................................... E-4 E-6 Other Exhibits: Exhibits 2-4, 3-4 .......................................................................... E-4
This is the Executive Summary of Newman, L. (2004). Family Involvement in the Educational Development of Youth with Disabilities. A Special Topic Report from the National Longitudinal Transition Study-2 (NLTS2). Menlo Park, CA: SRI International.
ES-1
EXECUTIVE SUMMARY
The No Child Left Behind Act of 2001 (NCLB) has brought an increased awareness of the importance of family-school connections by focusing on the integral role parents play in assisting their children’s learning, encouraging parents to be actively involved in their children’s education, and including, for the first time in the history of federal education legislation, a specific statutory definition of parent involvement.
The evidence is persuasive and consistent that families play a critical role in nurturing their children’s educational growth. Family support for learning is important for all students, but it may be particularly important for children with disabilities. One of the main tenets of IDEA, as amended in 1997 (IDEA ’97), is parents’ participation in decision-making related to their children’s education. However, despite legislative support for parental involvement, little information has been available until now to examine the actual level of family support for education that is given to middle- and high-school-age students with disabilities.
The National Longitudinal Transition Study-2 (NLTS2) provides the first national picture of the involvement of families in the educational development of their secondary-school-age children with disabilities. NLTS2 is one component of a portfolio of longitudinal studies that span the age range of children and youth with disabilities. These studies are sponsored by the Office of Special Education Programs (OSEP) of the U.S. Department of Education in response to requirements of IDEA ’97. NLTS2 is a rich source of information on the characteristics, experiences, and achievements of youth with disabilities who were ages 13 through 16 and receiving special education services in grade 7 or above when they were sampled in 2000. Information is being collected about these youth five times during this 10-year study, from parents, school staff, and the youth themselves, as they transition from secondary school to early adulthood. Findings from this nationally representative sample generalize to youth with disabilities nationally and to youth in each of the 12 federal special education disability categories in use for students in the NLTS2 age range.
This report considers the following questions for secondary-school-age students with disabilities receiving special education:
To what extent do families of secondary-school-age students with disabilities engage in activities at home and at school that support their children’s educational development? How does this level of involvement compare with that of families in the general population?
What are the relationships between student and family characteristics and levels of family involvement? How do these relationships compare with those of families in the general population?
What are families’ expectations for their children’s future education and independence?
To what extent do differences in levels of family involvement and family expectations relate to variations in students’ school engagement, academic performance, social adjustment, and independence?

This is the Executive Summary of Newman, L. (2004). Family Involvement in the Educational Development of Youth with Disabilities. A Special Topic Report from the National Longitudinal Transition Study-2 (NLTS2). Menlo Park, CA: SRI International.
ES-2
These questions are addressed primarily by using data collected from parents or guardians of NLTS2 study members during spring and summer of 2001. Parents provide their unique perspective on their children’s schools, programs, and future attainments, as well as on their own participation in their children’s education at home and at school. Telephone interviews addressed these important topics; mail questionnaires were administered to parents who could not be reached by phone. Information collected from staff of schools attended by students with disabilities in the 2001-02 school year also is used in identifying variations in students’ achievements related to differences in levels of family involvement.
Highlights of the information NLTS2 obtained from these sources are presented below.
Involvement at Home Families of most students with disabilities are very involved in supporting their children’s
educational development at home.
Most families report regularly talking with their children about school and helping with homework at least once a week.
One in five provide homework assistance as often as five or more times per week.
Students with disabilities are more likely to receive help with homework than are their peers in the general population.
The difference in homework support is especially apparent for those who receive frequent help; students with disabilities are five times as likely as their peers in the general population to receive homework assistance frequently.
Family support for education at home varies across disability categories.
Youth with emotional disturbances are among the least likely to receive help with homework.
Students with multiple disabilities, autism, or orthopedic impairments receive the most frequent homework assistance.
Involvement at School and in the Individualized Education Program (IEP) Process Many families of students with disabilities are involved at their children’s schools, with
almost all participating in at least one type of school-based activity.
Families attend general school meetings, parent-teacher conferences, and school or class events, and, to a lesser extent, volunteer at school.
Parents who participate in school-based activities are most frequently at the school for school or class events, such as science fairs, student performances, sports activities, and awards assemblies.
Families of students with disabilities are as involved as their peers in the general population; and, for some types of school-based activities—general school meetings and parent-teacher conferences—they are more involved.
This is the Executive Summary of Newman, L. (2004). Family Involvement in the Educational Development of Youth with Disabilities. A Special Topic Report from the National Longitudinal Transition Study-2 (NLTS2). Menlo Park, CA: SRI International.
ES-3
Nearly 9 out of 10 parents of secondary-school-age students with disabilities report participating in at least one IEP meeting in the current or prior school year.
Slightly more than half of the families report being involved in developing IEP goals.
About one-third want to be more involved in IEP decision-making.
Family involvement in educational activities at school varies by disability category, with more variation in attending a school or class event or volunteering at school than in attending a general school meeting or an IEP meeting.
Students with speech or orthopedic impairments have parents who consistently are among the most likely to participate in several types of school-based activities.
Families of students with emotional disturbances or mental retardation are among the least likely to attend a general school meeting or a school or class event or to volunteer at the school, but are among those most likely to attend parent-teacher conferences.
Families of students with other health impairments or traumatic brain injuries are among those most likely to attend IEP meetings.
Families of students with mental retardation or speech impairments are among those least likely to attend IEP meetings.
Student and Family Characteristics Associated with Family Involvement
Several characteristics of students with disabilities are related to the participation of their families in their educational development, when controlling for other differences.
Families of students experiencing problems in more domains and having lower functional cognitive skills are more likely to help with homework than families of students with fewer impairments.
Negative youth behavior is related to lower levels of family involvement at school and at home.
Involvement in home- and school-based activities is lower among families of older students with disabilities.
Parents of daughters in secondary school are more likely than parents of sons to help with homework and to be involved at school.
Neither student age nor gender is related to parent participation in the IEP process.
Families of Hispanic students are less likely than families of white students to be involved in home-based education-related activities.
African-American students have families who are more likely to be involved at home than their white peers but less likely to be involved at school and to attend IEP meetings.
Students who attend their neighborhood school are more likely to have families who participate at the school and attend IEP meetings than are those who attend schools not located in their local area.
This is the Executive Summary of Newman, L. (2004). Family Involvement in the Educational Development of Youth with Disabilities. A Special Topic Report from the National Longitudinal Transition Study-2 (NLTS2). Menlo Park, CA: SRI International.
ES-4
Families of students who are actively involved in extracurricular activities at school are more likely to participate in school-based activities.
In addition to the relationships between family involvement and student characteristics, levels of involvement also relate to characteristics of families themselves.
Having more family resources—higher incomes or higher levels of parental educational attainment—is associated with higher levels of involvement of all kinds.
Families with two parents in the household are more likely than single-parent families to be involved at home and at school.
Having external supports is related to more frequent family participation. Those who belong to support groups for families of children with disabilities and those who participate in OSEP-supported or other types of training are more likely to support their children’s educational development.
Families with higher expectations for their children’s postsecondary educational attainment are less likely to help with homework but are more likely to be involved at school than families of youth with disabilities who are less optimistic for their children’s continued education.
The more satisfied families are with their children’s schools, the less likely they are to spend time on homework support.
Families of students who receive special education services frequently deal with issues unique to parenting these students, including participation in the IEP process. However, variations in levels of participation associated with differences in youth’s cognitive abilities, behavior, age, gender, race/ethnicity, family income, mother’s educational attainment, number of parents and siblings in the household, and level of social support for families of students with disabilities parallel those of families of students in the general population.
Family Expectations A majority of youth with disabilities, but not all, have parents who expect them to experience
future success in many aspects of education and independence.
Their parents expect that 85% or more “definitely” or “probably” will graduate from high school with a regular diploma and live independently.
Although virtually all youth are expected to be able to find paid employment, fewer than two-thirds are expected to further their education after high school.
More than four out of five youth are expected to achieve financial independence.
Expectations regarding completing a 2-year college program and finding paid employment have increased for youth with disabilities since 1987, yet expectations for educational attainment lag behind those of youth in the general population.
This is the Executive Summary of Newman, L. (2004). Family Involvement in the Educational Development of Youth with Disabilities. A Special Topic Report from the National Longitudinal Transition Study-2 (NLTS2). Menlo Park, CA: SRI International.
ES-5
Parents of about 15% of youth with disabilities do not expect them to receive a regular high school diploma or to live independently; nearly two out of five are not expected to pursue postsecondary education.
As with most aspects of youth’s experiences, these expectations are not shared equally by all youth with disabilities.
Lower expectations are particularly common for youth with mental retardation, autism, multiple disabilities, and, to a somewhat lesser extent, deaf-blindness.
Expectations also generally are lower for youth with disabilities from lower-income households.
Relationship between Family Involvement and Student Achievements
The importance of family involvement and expectations is supported by NLTS2 analyses. Parents’ activities in support of their children’s education is associated with consistent differences in several achievement domains, independent of disability, functioning, or other differences among youth.
Youth whose families are more involved in their schools are less far behind grade level in reading, tend to receive better grades, and have higher rates of involvement in organized groups (many of which are school based) and with individual friendships than youth with less family involvement at school.
In the independence domain, youth whose families are more involved in their schools are more likely than youth from less-involved families to have had regular paid jobs in the preceding year.
In contrast, family support for education at home is not related to many outcomes, controlling for other differences among youth. One exception:
Greater support for education at home is negatively associated with grades, possibly because parents are more likely to provide homework help to students who are doing poorly in school.
Expectations that parents hold for the futures of their children with disabilities in part reflect parents’ experience with and perceptions of the ways those disabilities are thought to limit activities and accomplishments. However, NLTS2 findings suggest that family expectations for the future also help shape the achievements of youth with disabilities, irrespective of the nature of the youth’s disabilities and their levels of functioning, particularly with regard to academic engagement and achievement. Other things being equal, youth with disabilities whose parents expect them to go on to postsecondary education after high school have more positive engagement and achievements while in high school than youth whose parents do not share that optimism for the future.
This is the Executive Summary of Newman, L. (2004). Family Involvement in the Educational Development of Youth with Disabilities. A Special Topic Report from the National Longitudinal Transition Study-2 (NLTS2). Menlo Park, CA: SRI International.
ES-6
When holding disability, functioning, or other differences among youth constant, youth with disabilities whose parents expect them to go on to postsecondary education are more likely to:
Have positive classroom engagement behaviors in all settings and receive better grades than youth who are not expected to continue their education.
Be closer to grade level in their tested reading and math abilities than youth who are not expected to further their education after high school.
Avoid disciplinary actions and affiliate with organized groups, many of which may be sponsored by or meet at school.
In the independence domain, when controlling for other differences, youth with disabilities whose parents have high expectations that they will live independently in the future are more likely to:
Assume household responsibilities while in high school than are those who are not expected to live independently.
Looking Ahead This report describes families’ involvement at home and at school in support of their
children’s education during the secondary school years. Many families will need to continue to assist their children beyond the secondary school years, often by acting as a case manager. Longitudinal analyses in subsequent waves of NLTS2 will shed light on how parent roles unfold over a period of years and how family involvement affects later outcomes as youth with disabilities transition from school to early adult life.
1-1
1. EXAMINING FAMILY INVOLVEMENT IN SUPPORT OF YOUTH WITH DISABILITIES
The No Child Left Behind Act of 2001 (NCLB) has brought an increased awareness of the
importance of family-school connections by focusing on the integral role parents play in assisting their children’s learning, encouraging parents to be actively involved in their children’s education, and including, for the first time in the history of federal education legislation, a specific statutory definition of parent involvement.
The evidence is persuasive and consistent that families play a critical role in nurturing their children’s educational growth. Multiple comprehensive reviews of family involvement research have found that when parents are involved in education, students benefit (Fan & Chen, 2001; Henderson & Berla, 1994; Henderson & Mapp, 2002; Jeynes, 2003). Families’ support for their children’s education is a significant contributor to a range of positive outcomes, including:
Improved student motivation to learn and academic self-confidence (Ames, Khoju, & Watkins, 1993; Grolnick & Slowiaczek, 1994; Hoover-Dempsey et al., 2001).
A stronger sense of self as a learner (Eccles, Goldsmith, Jacobs, & Flanagan, 1988).
More consistent attendance (Falbo, Lein, & Amador, 2001).
Improved homework completion and greater time spent on homework (Callahan, Rademacher, & Hildreth, 1998; Cooper, Lindsay, & Nye, 2000).
Improved behavior in school (Epstein, 1987a; Gonzalez, 2002).
Improved academic performance (Finn, 1998; Keith et al., 1998; Simon, 2001b; Van Voorhis, 2001), including achievement on standardized tests (Sui-Chu & Willms, 1996; Thorkildsen & Stein, 1998; Zellman & Waterman, 1998).
Higher school completion rates (Rumberger, Ghatak, Poulas, Ritter, & Dornbusch, 1990).
More clearly defined future plans and educational expectations (Eccles et al., 1988; Trusty, 1999).
Higher rates of postsecondary education enrollment (Eagle, 1989).
Family support for learning is important for all students, but it may be particularly important for children with disabilities (Council for Exceptional Children, 2001; Turnbull & Turnbull, 2001). Families of those with disabilities played a vital role in the creation and implementation of the first federal law mandating education for all children with disabilities, P.L. 94-142, the Education for All Handicapped Children Act of 1975 (EHA), which later became the Individuals with Disabilities Education Act (IDEA) (Rothstein, 2000; Weintraub, Abeson, Ballard, & LaVor, 1976).1
1 On December 3, 2004, President Bush signed into law the “Individuals with Disabilities Education Improvement Act of 2004” (PL 108-446) — the most recent amendments to Parts A-D, which will go into effect (for Parts B and C) on July 1, 2005.
1-2
One of the main tenets of IDEA, as amended in 1997 (IDEA ’97), is parents’ participation in decision-making related to their children’s education. The regulations for IDEA ’97 stipulate that “each public agency shall take steps to ensure that one or both of the parents of a child with a disability are present at each IEP [individualized education program] meeting or are afforded the opportunity to participate” [Section 300.345(a)]. Policy-makers were so committed to parental involvement in the education of students with disabilities that the regulations specify that “if neither parent can attend, the public agency shall use other methods to ensure parent participation, including individual or conference telephone calls” [Section 300.345(c)] and that “the public agency shall take whatever action is necessary to ensure that the parent understands the proceedings at the IEP meeting” [Section 300.345(e)].
Despite legislative support for parental involvement, little information has been available until now to examine the actual level of family support for education that is given to middle- and high-school-age students with disabilities. Thus, it has not been clear whether variations in family involvement that have been observed in the general population for families with children of different ages and with different racial/ethnic backgrounds, household incomes, and other characteristics also apply to families of students with disabilities. Schools and others creating programs to promote family involvement have had little information to guide their efforts to support family-school partnerships for students with disabilities.
In addition to there being a dearth of information about the involvement of families of students with disabilities overall, much of the family involvement research, whether for students with disabilities or their peers in the general population, has focused on students in elementary school, with less attention to the involvement of families of students in secondary school. Yet research has found that family involvement continues to play an important role in the success of secondary school students (Bursuck, Rose, Coven, & Yahaya, 1989; Catsambis, 2002; Deslandes, Royer, Turcotte, & Bertrand, 1997; Dornbusch & Ritter, 1988; Gonzalez, 2002; Simon, 2001a).
The National Longitudinal Transition Study-2 (NLTS2) provides the first national picture of the involvement of families in the educational development of their secondary-school-age children with disabilities. NLTS2 is one component of a portfolio of longitudinal studies that span the age range of children and youth with disabilities. These studies are sponsored by the Office of Special Education Programs (OSEP) of the U.S. Department of Education in response to requirements of IDEA ’97.
NLTS2 is a rich source of information on the characteristics, experiences, and achievements of youth with disabilities who were ages 13 through 16 and receiving special education services in grade 7 or above when they were sampled in 2000. Information is being collected about these youth five times during this 10-year study, from parents, school staff, and the youth themselves, as they transition from secondary school to early adulthood. Findings from this nationally representative sample generalize to youth with disabilities nationally and to youth in each of the 12 federal special education disability categories in use for students in the NLTS2 age range.2
2 Please see Appendix A for details about the NLTS2 design, sample, analysis approach, and measurement issues. Additional information about NLTS2, including previously released reports, are available at www.nlts2.org.
1-3
Research Questions This report considers the following questions for secondary-school-age students with
disabilities receiving special education:
To what extent do families of secondary-school-age students with disabilities engage in activities at home and at school that support their children’s educational development? How does this level of involvement compare with that of families in the general population?
What are the relationships between student and family characteristics and levels of family involvement? How do these relationships compare with those of families in the general population?
What are families’ expectations for their children’s future education and independence?
To what extent do differences in levels of family involvement and family expectations relate to variations in students’ school engagement, academic performance, social adjustment, and independence?
Information Sources These questions are addressed primarily by using data collected from parents or guardians3
of NLTS2 study members during spring and summer of 2001. Parents provide their unique perspective on their children’s schools, programs, and future attainments, as well as on their own participation in their children’s education at home and at school. Telephone interviews addressed these important topics; mail questionnaires were administered to parents who could not be reached by phone. An 82% response rate resulted in interview/survey data for 9,230 students; they were ages 13 through 17 at the time. Information collected from staff of schools attended by students with disabilities in the 2001-02 school year also is used in identifying variations in students’ achievements related to differences in levels of family involvement (Chapter 6).4
Technical Notes Readers should remember the following issues when interpreting the findings in this report:
Descriptive findings are weighted. NLTS2 was designed to provide a national picture of the characteristics, experiences, and achievements of youth with disabilities in the NLTS2 age range. Therefore, all the statistics presented in this report are weighted estimates of the national population of students receiving special education in the NLTS2 age group, as well as those in each disability category individually. Each response for each sample member is weighted to represent the number of youth nationally who are in his or her disability category in the kind of school district (defined by region, student enrollment, and proportion of students in poverty) or special school from which he or she was selected.
3 For simplicity, parents and guardians are referred to as parents in this report. 4 Additional information on parent and school surveys is presented in Appendix A.
1-4
Standard errors. For each mean and percentage in this report, a standard error is presented that indicates the precision of the estimate. For example, a variable with a weighted estimated value of 50% and a standard error of 2 means that the value for the total population, if it had been measured, would, with 95% confidence, lie between 48% and 52% (i.e., within plus or minus 2 percentage points of 50%). Thus, smaller standard errors allow for greater confidence to be placed in the estimate, whereas larger ones require caution.
Small samples. Although NLTS2 data are weighted to represent the population, the size of standard errors is influenced heavily by the actual number of youth in a given group (e.g., a disability category). Groups with very small samples have comparatively large standard errors (in fact, findings are not reported separately for groups that do not include at least 35 sample members). For example, because there are relatively few youth with deaf-blindness, estimates for that group have relatively large standard errors. Therefore, readers should be cautious in interpreting results for this group and others with small sample sizes and large standard errors.
Significant differences. Only differences among groups that reach a level of statistical significance of at least .05 are mentioned in the text; significance levels generally are noted in the text. Appendix A outlines a method for using standard errors to calculate the significance of differences between groups of interest.
Organization of the Report The chapters in this report generally correspond to the research questions posed. Chapters 2
and 3 describe families’ involvement in their children’s education at home and at school. Chapter 4 explores the relationship between student and family characteristics and differences in levels of involvement, using a multivariate analysis approach.5 Chapter 5 looks to the future, discussing parents’ expectations for their children’s education and independence. Chapter 6 addresses the relationship between levels of involvement and student outcomes, synthesizing findings from earlier analyses on student achievements. The final chapter identifies key lessons learned about families’ involvement in their children’s education during their secondary school years. Appendix A provides details of the NLTS2 design, sample, measures, and analysis approaches, including definitions of the disability categories used throughout this report. Appendix B contains background information on the demographic characteristics of students with disabilities represented in NLTS2 and their families. Appendix C presents the estimated differences for the models included in Chapter 4. Appendix D provides a description of the independent variables included in the multivariate analyses presented in Chapter 6. Appendix E presents unweighted sample sizes for the analyses reported in the data tables.
This document is one in a series of reports from NLTS2 that began in 2003 and will continue over the next several years. The following chapters provide the first national picture of family involvement in the educational development of secondary school students with disabilities. 5 Multivariate analysis techniques (i.e., linear and logistic regression) are used to identify the independent relationships of various family and youth characteristics with differences in levels of involvement. Such analyses estimate the magnitude and direction of relationships for numerous explanatory factors, statistically holding constant the other factors in the analysis. Multivariate analysis procedures are described further in Appendix A.
2-1
2. FAMILY INVOLVEMENT AT HOME
By maintaining a home environment that encourages learning and focuses on school-related issues, parents can convey their support for education (Simon & Epstein, 2001). Parents communicate to their children that school is important by paying attention to school issues and asking questions and talking about their children’s school day (Hoover-Dempsey & Sandler, 1995). Conversations about daily classroom events or projects signal that education is valued and can be a strong predictor of student achievement (Balli, Demo, & Wedman, 1998; Muller, 1993; Sui-Chu & Willms, 1996). Encouraging students to do their homework and helping with homework can improve the quality of students’ academic work and their attitudes toward school (Callahan et al., 1998; Hoover-Dempsey et al., 2001).
Parents’ involvement in their children’s homework can take multiple forms, including creating a physical environment conducive to homework completion; establishing schedules for time use; providing oversight of the homework process; interacting with teachers; providing feedback on homework performance; participating in the homework process by helping, tutoring, or assisting their children; providing strategies that help with understanding homework, such as modeling and discussing problem-solving strategies; and focusing on children’s self-management skills or emotional responses to homework (Hoover-Dempsey et al., 2001).
This chapter describes families’ involvement in home-based activities that support the education of secondary-school-age students with disabilities, specifically focusing on two types of involvement at home1:
Talking with students about school
Helping with homework.
The chapter begins with a description of the two types of at-home involvement. It continues with a comparison of home-based education support for students with disabilities with that for students in the general population. Finally, disability category differences in home-based family involvement are presented.
Involvement at Home The majority of families of secondary-school-age students with disabilities report providing
support at home for schoolwork (Exhibit 2-1).
Three-quarters of students have parents who are involved at least once a week in helping with homework.
Twenty-one percent help with homework three to four times a week.
One in five report supervising and assisting with homework as often as five or more times a week.
1 This chapter describes the experiences of youth with disabilities who were ages 13 through 17 at the time of the parent interview. Findings are weighted estimates of the national population of students receiving special education in the NLTS2 age group, as well as those in each disability category individually. Only differences among groups that reach a level of statistical significance of at least .05 are mentioned in the text.
2-2
Exhibit 2-1HELPING WITH HOMEWORK
11.512.7
33.2
21.221.3
0
5
10
15
20
25
30
35
5 or moretimes a week
3-4 times aweek
1-2 times aweek
Less thanonce a week
Never
Perc
enta
ge w
hose
fam
ilies
repo
rt
help
ing
with
hom
ewor
k
(1.4)
(1.6)
(1.1) (1.1)
(1.4)
Source: NLTS2 Wave 1 parent interviews.Standard errors are in parentheses.
Although students often benefit from parents’ homework involvement, such as having higher rates of homework completion and higher grades (Epstein, 2001; Levine, 2001; Sui-Chu & Willms, 1996), this type of involvement may have less desirable effects as well. Some researchers suggest that interactions about homework can put tension on the parent-child relationship (Baumgartner, Bryan, Donahue, & Nelson, 1993; Turnbull & Turnbull, 2001). Helping secondary school students with homework can be particularly difficult when students take complex courses, such as geometry or chemistry. These issues point to the importance of parents’ receiving ongoing information and guidance on how best to assist their children.
Parents also can communicate their interest in and support for education by asking questions and having conversations about their children’s school day. Most students with disabilities live in households where families talk with them about their school experiences (Exhibit 2-2). According to parents:
More than 80% of middle and high school students with disabilities regularly have conversations with their parents about their school experiences.
Fewer than 4% rarely or never talk about school with adults at home.
2-3
Exhibit 2-2TALKING ABOUT SCHOOL
3.5
14.9
81.7
0
10
20
30
40
50
60
70
80
90
Regularly Occasionally Rarely or never
Perc
enta
ge w
hose
fam
ilies
repo
rt
talk
ing
with
them
abo
ut s
choo
l
(1.2)
(.6)
(1.2)
Source: NLTS2 Wave 1 parent interviews.Standard errors are in parentheses.
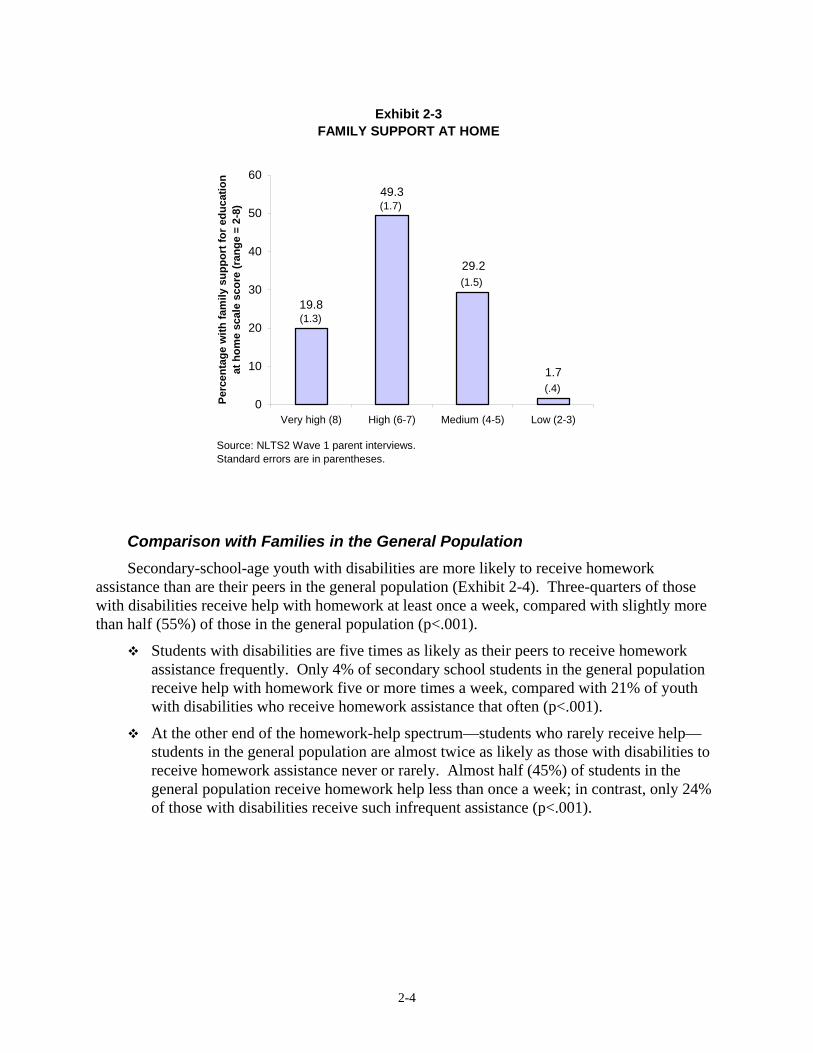
Scale of Family Support at Home A scale was created to examine the extent to which parents exhibit two educational support
behaviors at home: talking about school and helping with homework (Exhibit 2-3). Summing values from 1 to 4 for the frequency of each of these behaviors2 results in a scale that ranges from 2 (the least involved in both activities) to 8 (the most involved in both).
Almost one in five students have families who provide very high support (i.e. a score of 8). These students have families in which adults speak with them about school regularly and help them with homework five or more times a week.
An additional 49% of families receive high scores (i.e. a score of 6 or 7), resulting in more than two-thirds (69%) having high or very high scores.
Fewer than 2% of families report low levels of support (i.e. a score of 2 or 3).
The mean scale score is 6.2, with families on average being highly supportive of education in the home.
2 The homework variable was collapsed to a 4-point scale by summing the responses of “less than once a week” with responses for “never” for use in this combined-scale score.
2-4
Exhibit 2-3FAMILY SUPPORT AT HOME
1.7
29.2
49.3
19.8
0
10
20
30
40
50
60
Very high (8) High (6-7) Medium (4-5) Low (2-3)
Perc
enta
ge w
ith fa
mily
sup
port
for e
duca
tion
at h
ome
scal
e sc
ore
(ran
ge =
2-8
) (1.7)
(.4)
(1.3)
Source: NLTS2 Wave 1 parent interviews.Standard errors are in parentheses.
(1.5)
Comparison with Families in the General Population Secondary-school-age youth with disabilities are more likely to receive homework
assistance than are their peers in the general population (Exhibit 2-4). Three-quarters of those with disabilities receive help with homework at least once a week, compared with slightly more than half (55%) of those in the general population (p<.001).
Students with disabilities are five times as likely as their peers to receive homework assistance frequently. Only 4% of secondary school students in the general population receive help with homework five or more times a week, compared with 21% of youth with disabilities who receive homework assistance that often (p<.001).
At the other end of the homework-help spectrum—students who rarely receive help—students in the general population are almost twice as likely as those with disabilities to receive homework assistance never or rarely. Almost half (45%) of students in the general population receive homework help less than once a week; in contrast, only 24% of those with disabilities receive such infrequent assistance (p<.001).
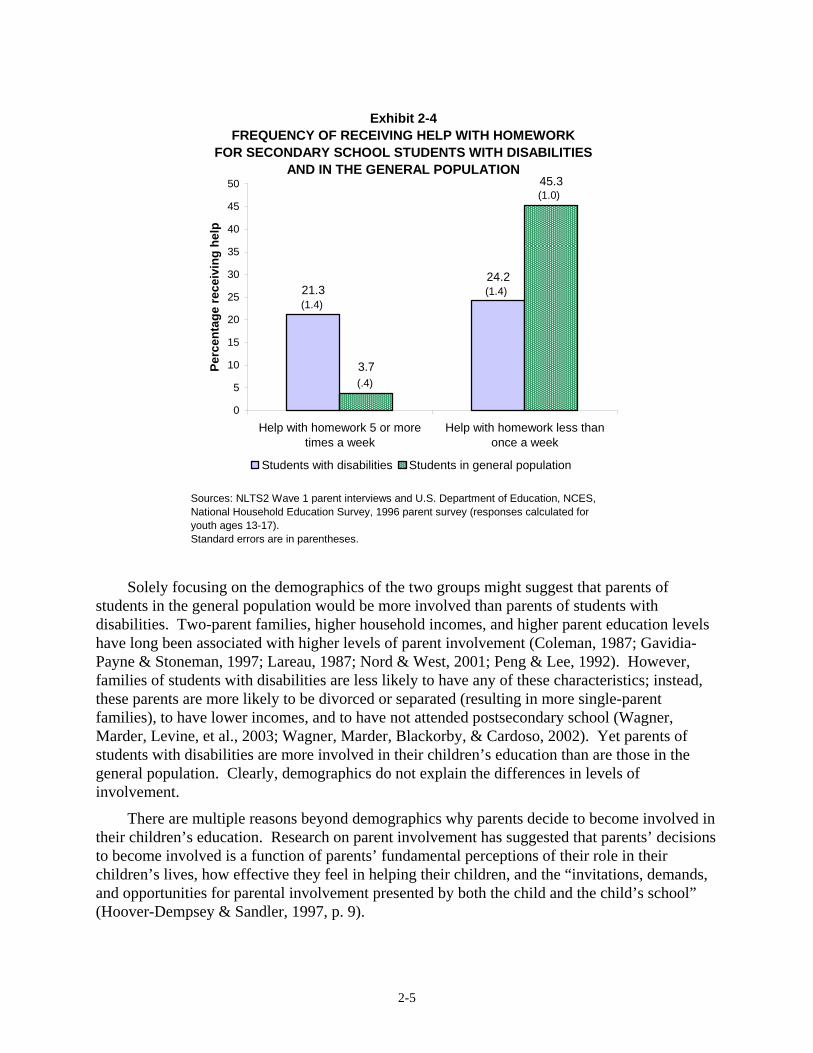
2-5
Solely focusing on the demographics of the two groups might suggest that parents of students in the general population would be more involved than parents of students with disabilities. Two-parent families, higher household incomes, and higher parent education levels have long been associated with higher levels of parent involvement (Coleman, 1987; Gavidia-Payne & Stoneman, 1997; Lareau, 1987; Nord & West, 2001; Peng & Lee, 1992). However, families of students with disabilities are less likely to have any of these characteristics; instead, these parents are more likely to be divorced or separated (resulting in more single-parent families), to have lower incomes, and to have not attended postsecondary school (Wagner, Marder, Levine, et al., 2003; Wagner, Marder, Blackorby, & Cardoso, 2002). Yet parents of students with disabilities are more involved in their children’s education than are those in the general population. Clearly, demographics do not explain the differences in levels of involvement.
There are multiple reasons beyond demographics why parents decide to become involved in their children’s education. Research on parent involvement has suggested that parents’ decisions to become involved is a function of parents’ fundamental perceptions of their role in their children’s lives, how effective they feel in helping their children, and the “invitations, demands, and opportunities for parental involvement presented by both the child and the child’s school” (Hoover-Dempsey & Sandler, 1997, p. 9).
24.221.3
3.7
45.3
0
5
10
15
20
25
30
35
40
45
50
Help with homework 5 or moretimes a week
Help with homework less thanonce a week
Perc
enta
ge re
ceiv
ing
help
Students with disabilities Students in general population
(1.4)
(.4)
(1.4)
(1.0)
Exhibit 2-4FREQUENCY OF RECEIVING HELP WITH HOMEWORK
FOR SECONDARY SCHOOL STUDENTS WITH DISABILITIES AND IN THE GENERAL POPULATION
Sources: NLTS2 Wave 1 parent interviews and U.S. Department of Education, NCES, National Household Education Survey, 1996 parent survey (responses calculated for youth ages 13-17).Standard errors are in parentheses.

2-6
Disability Differences in Home-Based Family Involvement Family involvement in the education-related activities at home measured by NLTS2 varies
across disability categories, with more variation in some forms of family involvement than others (Exhibit 2-5). Talking with children about school is more uniformly reported across disability categories than helping with homework. For example, there is a 13-percentage-point difference between families with the lowest and highest rates of regularly talking about school (77% of families of students with deaf-blindness, p<.05 vs. 90% of families of students with other health impairments), compared with an 18-percentage-point spread in the rates of families frequently assisting with homework (18% for families of students with emotional disturbances vs. 36% for families of students with multiple disabilities, p<.001).
Exhibit 2-5 FAMILY INVOLVEMENT AT HOME, BY DISABILITY CATEGORY
Learning Disability
Speech/ Language
Impair-ment
Mental Retar-dation
Emo-tional Distur-bance
Hearing Impair-ment
Visual Impair-ment
Ortho-pedic
Impair-ment
Other Health Impair-ment Autism
Trau-matic Brain Injury
Multiple Disabili-
ties
Deaf-Blind-ness
Percentage whose families report helping with homework 5 or more times a week
19.8 (2.0)
22.6 (2.1)
28.6(2.5)
18.2(2.2)
21.0(2.6)
26.8(3.6)
31.3 (2.7)
21.6(2.0)
35.2 (3.0)
20.6 (3.8)
35.9(3.2)
26.3(5.6)
Percentage whose families report talking with them regularly about school
80.7 (1.9)
84.8 (1.8)
79.3(2.1)
84.9(1.9)
85.6(2.2)
87.1(2.7)
86.1 (1.9)
89.7(1.5)
78.7 (2.2)
83.5 (3.4)
79.8(2.2)
77.0(5.0)
Source: NLTS2 Wave 1 parent interviews. Standard errors are in parentheses.
Families of youth with emotional disturbances are the least likely to help with
homework frequently (18%) and the most likely to provide homework assistance less than once a week (36%).
Students with multiple disabilities, autism, or orthopedic impairments receive the most frequent homework assistance, with 31% to 36% helped five or more times a week, compared with 20% of those with learning disabilities (p<.001 for all comparisons).
Families of those with other health (90%), visual (87%), or hearing impairments (86%) are among the most likely to report regularly talking with their children about school.
Families of those with deaf-blindness (77%), autism (79%), or mental retardation (79%) are among the least likely to report regularly talking with their children about school.
2-7
Summary Families of most students with disabilities are very involved in supporting their children’s
educational development at home.
Most families report regularly talking with their children about school and helping with homework at least once a week.
One in five provide homework assistance as often as five or more times per week.
Students with disabilities are more likely to receive help with homework than are their peers in the general population.
The difference in homework support is especially apparent for those who receive frequent help; students with disabilities are five times as likely as their peers in the general population to receive homework assistance frequently.
Family support for education at home varies across disability categories.
Youth with emotional disturbances are among the least likely to receive help with homework.
Students with multiple disabilities, autism, or orthopedic impairments receive the most frequent homework assistance.
This chapter has examined family involvement at home, focusing on overall experiences and differences across disability categories. Chapter 3 moves the focus from home- to school-based involvement.

3-1
3. FAMILY INVOLVEMENT AT SCHOOL
Family involvement in children’s educational development can take place in a variety of settings, including at home, at school, and in the community. The preceding chapter focused on involvement at home; this chapter shifts the focus to school. Families may be involved at school in numerous ways, including volunteering in classrooms or with class or school activities, participating in parent-teacher organizations and school decision-making bodies, attending school or class events or parent-teacher conferences, and participating in the individualized education program (IEP) process (Epstein, 2001; Jordan, Orozco, & Averett, 2002; Mapp, 2003).
Parent involvement at school has been linked to a range of positive student outcomes, including improved academic achievement, better attendance, and more positive attitudes and behavior (Dornbusch & Ritter, 1988; Eccles & Harold, 1996; Henderson & Mapp, 2002). In addition to student benefits, family participation at school provides opportunities for communication and interactions between staff and families, thereby strengthening linkages between school and home (Hiatt-Michael, 2001). When families are involved at school, teachers report being more aware of family perspectives, as well as benefiting from parent volunteer efforts (Epstein, 1987a, 2001).
The chapter begins by examining school-based family involvement activities that are available to all families, regardless of whether their children have a disability.1 These include participation in:
General school meetings
Parent-teacher conferences
School or class events
Volunteer activities at school.
The chapter continues with a comparison of levels of involvement in the school setting for families of youth with disabilities with those for families in the general population. It then includes a discussion of involvement in a school-based activity that is specific to families of youth with disabilities—participation in IEP meetings. The chapter concludes with an examination of variations in school-based family involvement for students in different disability categories.
Involvement in School-Based Activities, Other Than IEP Meetings Families of secondary-school-age students with disabilities participate in a wide range of
school-based activities, including schoolwide meetings (e.g., back-to-school nights or PTA meetings), conferences with individual teachers, student or class activities (e.g., attending
1 This chapter describes the experiences of youth with disabilities who were ages 13 through 17 at the time of the parent interview. Findings are weighted estimates of the national population of students receiving special education in the NLTS2 age group, as well as those in each disability category individually. Only differences among groups that reach a level of statistical significance of at least .05 are mentioned in the text.
3-2
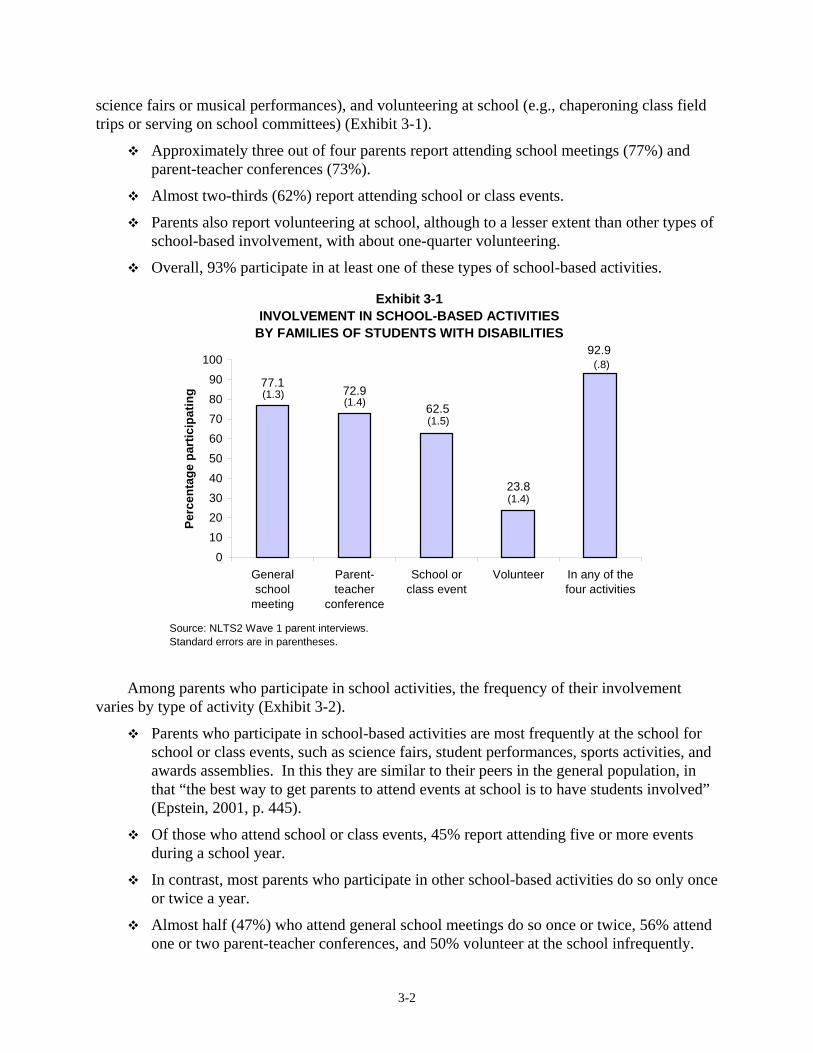
science fairs or musical performances), and volunteering at school (e.g., chaperoning class field trips or serving on school committees) (Exhibit 3-1).
Approximately three out of four parents report attending school meetings (77%) and parent-teacher conferences (73%).
Almost two-thirds (62%) report attending school or class events.
Parents also report volunteering at school, although to a lesser extent than other types of school-based involvement, with about one-quarter volunteering.
Overall, 93% participate in at least one of these types of school-based activities.
Exhibit 3-1INVOLVEMENT IN SCHOOL-BASED ACTIVITIES
BY FAMILIES OF STUDENTS WITH DISABILITIES 92.9
23.8
62.572.9
77.1
0102030405060708090
100
Generalschool
meeting
Parent-teacher
conference
School orclass event
Volunteer In any of thefour activities
Perc
enta
ge p
artic
ipat
ing
(1.4)
(1.5)
(1.4)
(.8)
(1.3)
Source: NLTS2 Wave 1 parent interviews.Standard errors are in parentheses.
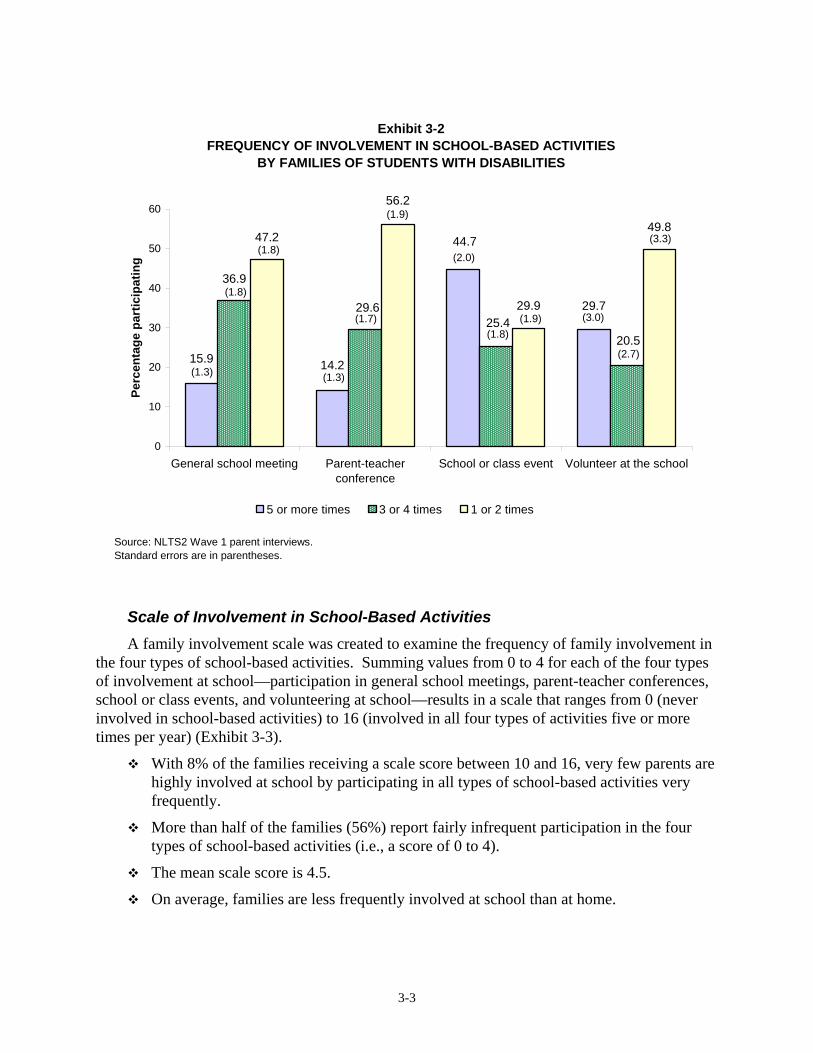
Among parents who participate in school activities, the frequency of their involvement varies by type of activity (Exhibit 3-2).
Parents who participate in school-based activities are most frequently at the school for school or class events, such as science fairs, student performances, sports activities, and awards assemblies. In this they are similar to their peers in the general population, in that “the best way to get parents to attend events at school is to have students involved” (Epstein, 2001, p. 445).
Of those who attend school or class events, 45% report attending five or more events during a school year.
In contrast, most parents who participate in other school-based activities do so only once or twice a year.
Almost half (47%) who attend general school meetings do so once or twice, 56% attend one or two parent-teacher conferences, and 50% volunteer at the school infrequently.
3-3
15.9 14.2
44.7
29.7
36.9
29.625.4
20.5
49.8
29.9
56.2
47.2
0
10
20
30
40
50
60
General school meeting Parent-teacherconference
School or class event Volunteer at the school
Perc
enta
ge p
artic
ipat
ing
5 or more times 3 or 4 times 1 or 2 times
(1.8)
(1.7)
(2.0)
(1.8)
(1.3)
Source: NLTS2 Wave 1 parent interviews.Standard errors are in parentheses.
Exhibit 3-2FREQUENCY OF INVOLVEMENT IN SCHOOL-BASED ACTIVITIES
BY FAMILIES OF STUDENTS WITH DISABILITIES
(1.8)
(1.3)
(1.9)
(1.9)
(2.7)
(3.0)
(3.3)
Scale of Involvement in School-Based Activities A family involvement scale was created to examine the frequency of family involvement in
the four types of school-based activities. Summing values from 0 to 4 for each of the four types of involvement at school—participation in general school meetings, parent-teacher conferences, school or class events, and volunteering at school—results in a scale that ranges from 0 (never involved in school-based activities) to 16 (involved in all four types of activities five or more times per year) (Exhibit 3-3).
With 8% of the families receiving a scale score between 10 and 16, very few parents are highly involved at school by participating in all types of school-based activities very frequently.
More than half of the families (56%) report fairly infrequent participation in the four types of school-based activities (i.e., a score of 0 to 4).
The mean scale score is 4.5.
On average, families are less frequently involved at school than at home.

3-4
Exhibit 3-3
SCALE OF FAMILY INVOLVEMENT IN SCHOOL-BASED ACTIVITIES
Percentage of families with school-based scale scorea:
High (10-16) 8.2 (1.6) Medium (5-9) 35.6 (1.5) Low (0-4) 56.3 (.9)
Mean school-based family involvement scale score 4.5 (.1) Source: NTLS2 Wave 1 parent interviews. a Range = 0 to 16. Standard errors are in parentheses.
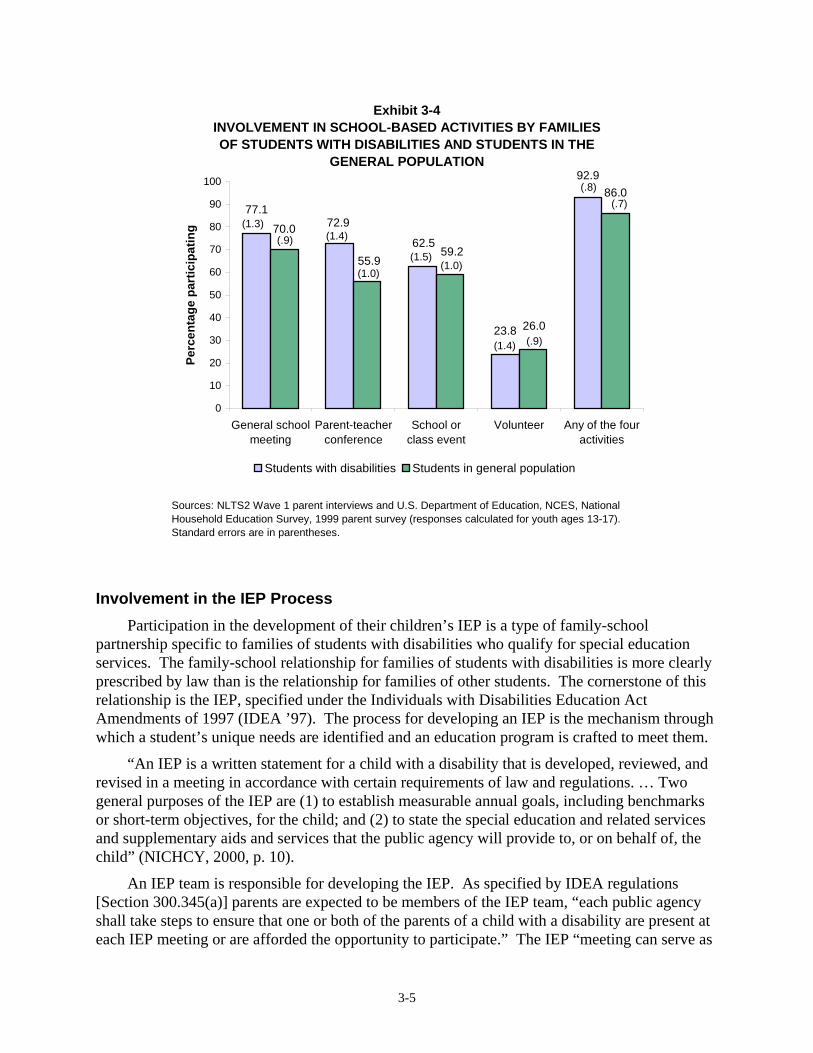
Comparison with Families in the General Population Families of students with disabilities are as likely as, and in some cases more likely than,
their peers in the general population to participate in several types of school-based activities (Exhibit 3-4).
More than three-quarters (77%) of families of students with disabilities attend general school meetings in a school year, compared with 70% of other parents (p<.001).
Almost three-quarters (73%) participate in parent-teacher conferences, compared with 56% of their peers in the general population (p<.001).
Families of students with disabilities and families of other students have similar levels of attending school and class events (62% and 59%), and similar levels of volunteering at school (24% and 26%).
Families of students with disabilities are more likely to be involved in any of the four types of in-school activities than are their peers. More than 9 out of 10 parents of youth with disabilities (93%) participate in at least one of the four types of school-based activities in a school year, compared with 86% of families of students in the general population (p<.001).
3-5
77.172.9
62.5
23.8
92.9
70.0
55.959.2
26.0
86.0
0
10
20
30
40
50
60
70
80
90
100
General schoolmeeting
Parent-teacherconference
School orclass event
Volunteer Any of the fouractivities
Perc
enta
ge p
artic
ipat
ing
Students with disabilities Students in general population
(1.4)
(1.5)
(1.4)
(.8)
(1.3)
Sources: NLTS2 Wave 1 parent interviews and U.S. Department of Education, NCES, National Household Education Survey, 1999 parent survey (responses calculated for youth ages 13-17).Standard errors are in parentheses.
Exhibit 3-4INVOLVEMENT IN SCHOOL-BASED ACTIVITIES BY FAMILIES OF STUDENTS WITH DISABILITIES AND STUDENTS IN THE
GENERAL POPULATION
(.9)
(1.0)(1.0)
(.9)
(.7)
Involvement in the IEP Process Participation in the development of their children’s IEP is a type of family-school
partnership specific to families of students with disabilities who qualify for special education services. The family-school relationship for families of students with disabilities is more clearly prescribed by law than is the relationship for families of other students. The cornerstone of this relationship is the IEP, specified under the Individuals with Disabilities Education Act Amendments of 1997 (IDEA ’97). The process for developing an IEP is the mechanism through which a student’s unique needs are identified and an education program is crafted to meet them.
“An IEP is a written statement for a child with a disability that is developed, reviewed, and revised in a meeting in accordance with certain requirements of law and regulations. … Two general purposes of the IEP are (1) to establish measurable annual goals, including benchmarks or short-term objectives, for the child; and (2) to state the special education and related services and supplementary aids and services that the public agency will provide to, or on behalf of, the child” (NICHCY, 2000, p. 10).
An IEP team is responsible for developing the IEP. As specified by IDEA regulations [Section 300.345(a)] parents are expected to be members of the IEP team, “each public agency shall take steps to ensure that one or both of the parents of a child with a disability are present at each IEP meeting or are afforded the opportunity to participate.” The IEP “meeting can serve as
3-6
an excellent communication vehicle between parents and the public agency. It enables the parents and other members of the IEP team to decide what the child's educational needs are, what goals and objectives or benchmarks are appropriate, what services will be provided, and what results can be anticipated, and to specify these in the IEP” (NICHCY, 2000, p. 13).
Parents can face multiple barriers to their active participation in the IEP process. Some are similar to barriers faced by all parents to school involvement in general, including logistical problems, such as lack of transportation or child care or conflicts with work schedules; a lack of understanding of the school system; or language or cultural differences (Kalyanpur & Harry, 1999; Smith, 2001; Smrekar & Cohen-Vogel, 2001). Other difficulties are specific to the IEP process, such as miscommunication or discomfort with educational jargon or with technical terminology related to testing, statistical analysis, placement, and services (Harry, Allen, & McLaughlin, 1995; Smith, 2001).
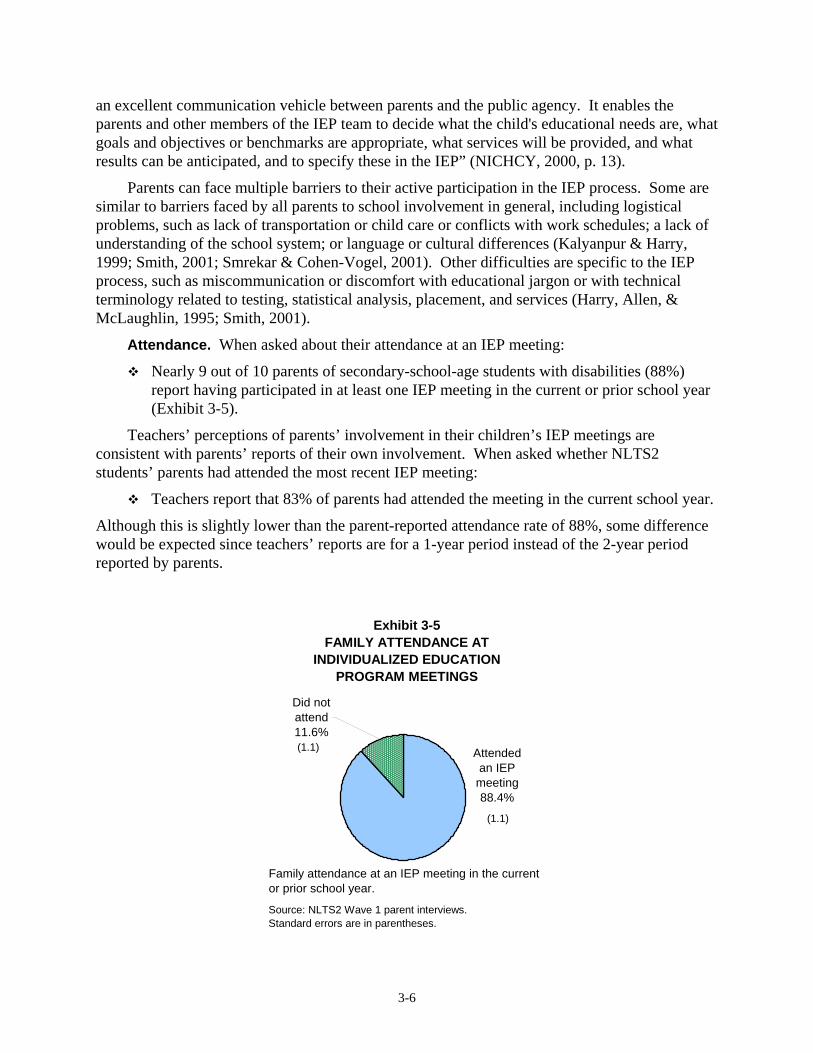
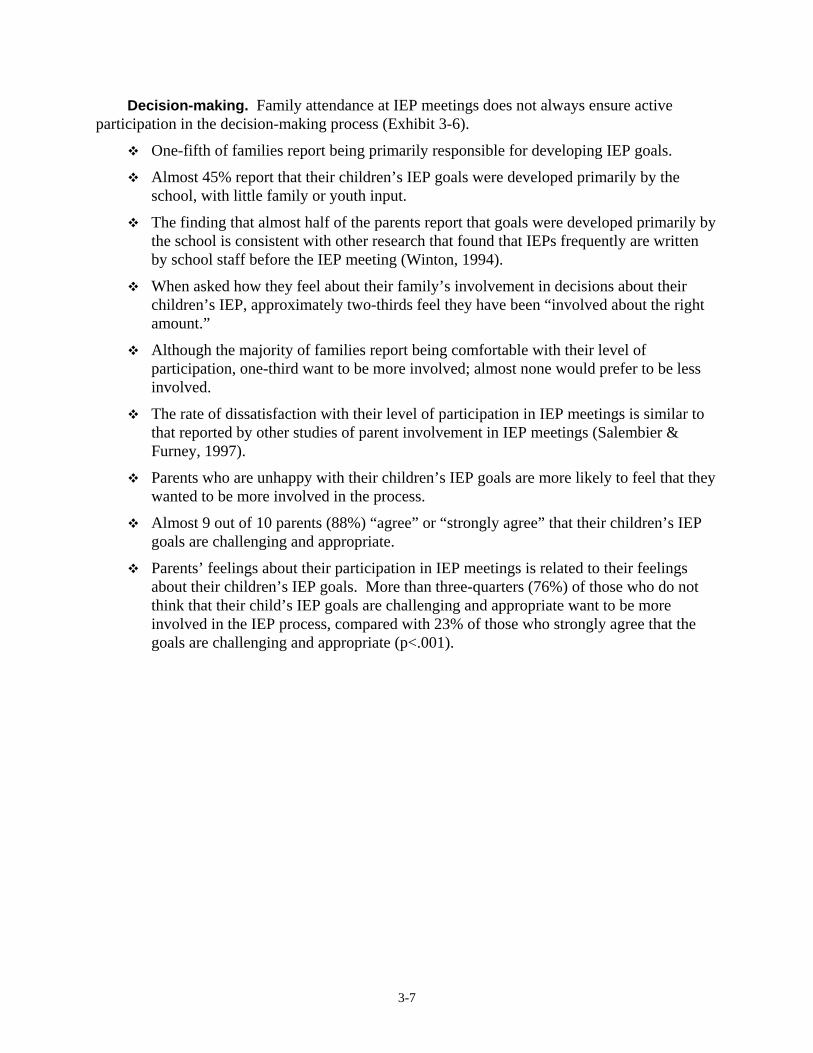
Attendance. When asked about their attendance at an IEP meeting:
Nearly 9 out of 10 parents of secondary-school-age students with disabilities (88%) report having participated in at least one IEP meeting in the current or prior school year (Exhibit 3-5).
Teachers’ perceptions of parents’ involvement in their children’s IEP meetings are consistent with parents’ reports of their own involvement. When asked whether NLTS2 students’ parents had attended the most recent IEP meeting:
Teachers report that 83% of parents had attended the meeting in the current school year.
Although this is slightly lower than the parent-reported attendance rate of 88%, some difference would be expected since teachers’ reports are for a 1-year period instead of the 2-year period reported by parents.
Exhibit 3-5FAMILY ATTENDANCE AT
INDIVIDUALIZED EDUCATION PROGRAM MEETINGS
Attended an IEP
meeting88.4%
Did not attend11.6%
Source: NLTS2 Wave 1 parent interviews.Standard errors are in parentheses.
(1.1)
Family attendance at an IEP meeting in the current or prior school year.
(1.1)
3-7
Decision-making. Family attendance at IEP meetings does not always ensure active participation in the decision-making process (Exhibit 3-6).
One-fifth of families report being primarily responsible for developing IEP goals.
Almost 45% report that their children’s IEP goals were developed primarily by the school, with little family or youth input.
The finding that almost half of the parents report that goals were developed primarily by the school is consistent with other research that found that IEPs frequently are written by school staff before the IEP meeting (Winton, 1994).
When asked how they feel about their family’s involvement in decisions about their children’s IEP, approximately two-thirds feel they have been “involved about the right amount.”
Although the majority of families report being comfortable with their level of participation, one-third want to be more involved; almost none would prefer to be less involved.
The rate of dissatisfaction with their level of participation in IEP meetings is similar to that reported by other studies of parent involvement in IEP meetings (Salembier & Furney, 1997).
Parents who are unhappy with their children’s IEP goals are more likely to feel that they wanted to be more involved in the process.
Almost 9 out of 10 parents (88%) “agree” or “strongly agree” that their children’s IEP goals are challenging and appropriate.
Parents’ feelings about their participation in IEP meetings is related to their feelings about their children’s IEP goals. More than three-quarters (76%) of those who do not think that their child’s IEP goals are challenging and appropriate want to be more involved in the IEP process, compared with 23% of those who strongly agree that the goals are challenging and appropriate (p<.001).
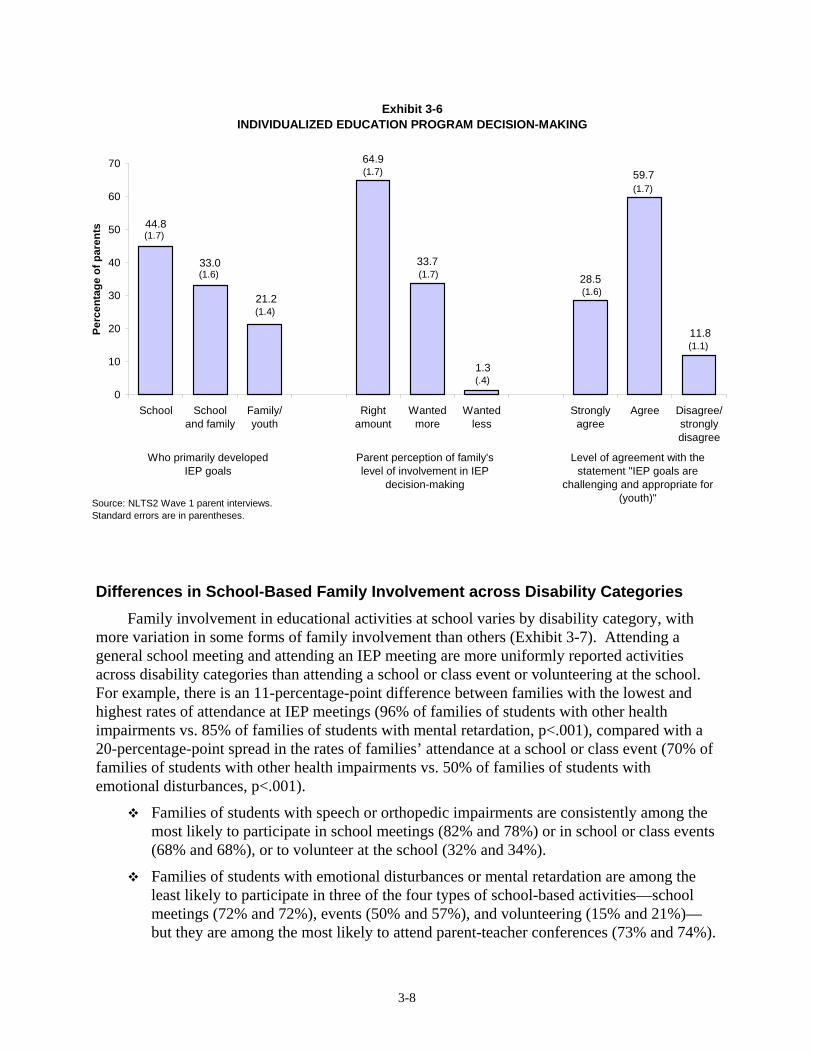
3-8
Differences in School-Based Family Involvement across Disability Categories Family involvement in educational activities at school varies by disability category, with
more variation in some forms of family involvement than others (Exhibit 3-7). Attending a general school meeting and attending an IEP meeting are more uniformly reported activities across disability categories than attending a school or class event or volunteering at the school. For example, there is an 11-percentage-point difference between families with the lowest and highest rates of attendance at IEP meetings (96% of families of students with other health impairments vs. 85% of families of students with mental retardation, p<.001), compared with a 20-percentage-point spread in the rates of families’ attendance at a school or class event (70% of families of students with other health impairments vs. 50% of families of students with emotional disturbances, p<.001).
Families of students with speech or orthopedic impairments are consistently among the most likely to participate in school meetings (82% and 78%) or in school or class events (68% and 68%), or to volunteer at the school (32% and 34%).
Families of students with emotional disturbances or mental retardation are among the least likely to participate in three of the four types of school-based activities—school meetings (72% and 72%), events (50% and 57%), and volunteering (15% and 21%)—but they are among the most likely to attend parent-teacher conferences (73% and 74%).
11.8
59.7
28.5
1.3
33.7
44.8
33.0
21.2
64.9
0
10
20
30
40
50
60
70
School Schooland family
Family/youth
Rightamount
Wantedmore
Wantedless
Stronglyagree
Agree Disagree/stronglydisagree
Perc
enta
ge o
f par
ents
(1.4)
(1.7)
Who primarily developed IEP goals
(1.7)
(1.7)
Source: NLTS2 Wave 1 parent interviews.Standard errors are in parentheses.
Exhibit 3-6INDIVIDUALIZED EDUCATION PROGRAM DECISION-MAKING
(1.6)
(1.7)
(.4)
(1.6)
(1.1)
Parent perception of family's level of involvement in IEP
decision-making
Level of agreement with the statement "IEP goals are
challenging and appropriate for (youth)"
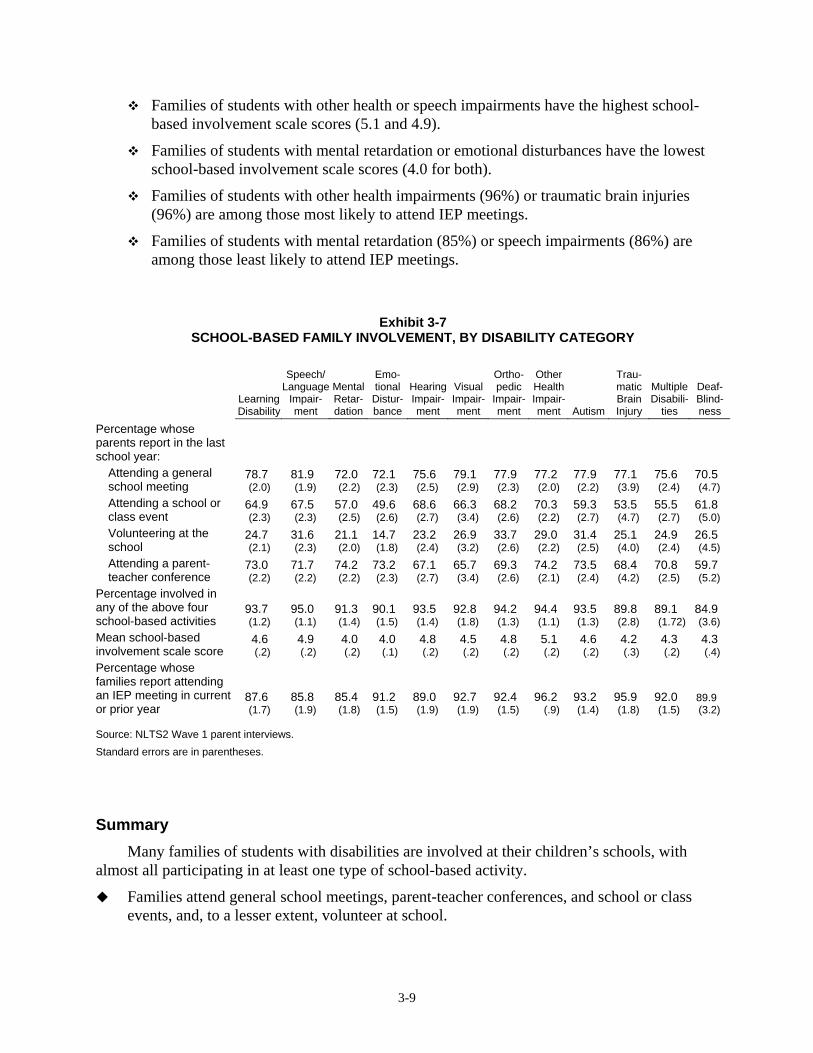
3-9
Families of students with other health or speech impairments have the highest school-based involvement scale scores (5.1 and 4.9).
Families of students with mental retardation or emotional disturbances have the lowest school-based involvement scale scores (4.0 for both).
Families of students with other health impairments (96%) or traumatic brain injuries (96%) are among those most likely to attend IEP meetings.
Families of students with mental retardation (85%) or speech impairments (86%) are among those least likely to attend IEP meetings.
Exhibit 3-7 SCHOOL-BASED FAMILY INVOLVEMENT, BY DISABILITY CATEGORY
Learning Disability
Speech/ Language
Impair-ment
Mental Retar-dation
Emo-tional Distur-bance
Hearing Impair-ment
Visual Impair-ment
Ortho-pedic
Impair-ment
Other Health Impair-ment Autism
Trau-matic Brain Injury
Multiple Disabili-
ties
Deaf-Blind-ness
Percentage whose parents report in the last school year:
Attending a general school meeting
78.7 (2.0)
81.9 (1.9)
72.0(2.2)
72.1 (2.3)
75.6 (2.5)
79.1 (2.9)
77.9 (2.3)
77.2(2.0)
77.9 (2.2)
77.1 (3.9)
75.6 (2.4)
70.5 (4.7)
Attending a school or class event
64.9 (2.3)
67.5 (2.3)
57.0(2.5)
49.6 (2.6)
68.6 (2.7)
66.3 (3.4)
68.2 (2.6)
70.3(2.2)
59.3 (2.7)
53.5 (4.7)
55.5 (2.7)
61.8 (5.0)
Volunteering at the school
24.7 (2.1)
31.6 (2.3)
21.1(2.0)
14.7 (1.8)
23.2 (2.4)
26.9 (3.2)
33.7 (2.6)
29.0(2.2)
31.4 (2.5)
25.1 (4.0)
24.9 (2.4)
26.5 (4.5)
Attending a parent-teacher conference
73.0 (2.2)
71.7 (2.2)
74.2(2.2)
73.2 (2.3)
67.1 (2.7)
65.7 (3.4)
69.3 (2.6)
74.2(2.1)
73.5 (2.4)
68.4 (4.2)
70.8 (2.5)
59.7 (5.2)
Percentage involved in any of the above four school-based activities
93.7 (1.2)
95.0 (1.1)
91.3(1.4)
90.1 (1.5)
93.5 (1.4)
92.8 (1.8)
94.2 (1.3)
94.4(1.1)
93.5 (1.3)
89.8 (2.8)
89.1 (1.72)
84.9 (3.6)
Mean school-based involvement scale score
4.6 (.2)
4.9 (.2)
4.0(.2)
4.0 (.1)
4.8 (.2)
4.5 (.2)
4.8 (.2)
5.1(.2)
4.6 (.2)
4.2 (.3)
4.3 (.2)
4.3 (.4)
Percentage whose families report attending an IEP meeting in current or prior year
87.6 (1.7)
85.8 (1.9)
85.4(1.8)
91.2 (1.5)
89.0 (1.9)
92.7 (1.9)
92.4 (1.5)
96.2(.9)
93.2 (1.4)
95.9 (1.8)
92.0 (1.5)
89.9 (3.2)
Source: NLTS2 Wave 1 parent interviews. Standard errors are in parentheses.
Summary Many families of students with disabilities are involved at their children’s schools, with
almost all participating in at least one type of school-based activity.
Families attend general school meetings, parent-teacher conferences, and school or class events, and, to a lesser extent, volunteer at school.
3-10
Parents who participate in school-based activities are most frequently at the school for school or class events, such as science fairs, student performances, sports activities, and awards assemblies.
Families of students with disabilities are as involved as their peers in the general population; and, for some types of school-based activities—general school meetings and parent-teacher conferences—they are more involved.
Nearly 9 out of 10 parents of secondary-school-age students with disabilities report participating in at least one IEP meeting in the current or prior school year.
Slightly more than half of the families report being involved in developing IEP goals.
About one-third want to be more involved in IEP decision-making.
Family involvement in educational activities at school varies by disability category, with more variation in attending a school or class event or volunteering at school than in attending a general school meeting or an IEP meeting.
Students with speech or orthopedic impairments have parents who consistently are among the most likely to participate in several types of school-based activities.
Families of students with emotional disturbances or mental retardation are among the least likely to attend a general school meeting or a school or class event, or to volunteer at the school, but are among those most likely to attend parent-teacher conferences.
Families of students with other health impairments or traumatic brain injuries are among those most likely to attend IEP meetings.
Families of students with mental retardation or speech impairments are among those least likely to attend IEP meetings.
This chapter has examined family involvement at school, focusing on overall experiences and differences across disability categories. Chapter 4 will expand these findings by using a multivariate analysis approach to examine the relationship between student and family characteristics and levels of both school-based and home-based involvement.
4-1
4. STUDENT AND FAMILY CHARACTERISTICS ASSOCIATED WITH FAMILY INVOLVEMENT
Thus far, this report has described family support for education at home and at school for
youth with disabilities as a group and for those who differ in their primary disability category. However, students and their families differ in many ways beyond a student’s disability classification, such as differences in gender, race/ethnicity, behavior and abilities, household income, families’ participation in trainings, and parents’ expectations. For youth in the general population, differences in student and family characteristics have been found to be related to variations in family involvement (Carter & Wojtkiewicz, 2000; Catsambis & Garland, 1997; Eccles & Harold, 1996; Grolnick, Benjet, Kurowski, & Apostoleris, 1997; Harry, 2002; Hoover-Dempsey et al., 2001; Lareau, 2000; Nord & West, 2001; Simon, 2001b). This chapter extends this understanding to families of students with disabilities by asking the following questions:
To what extent are variations in student and family characteristics related to differences in levels of family involvement for youth with disabilities?
How do the relationships between these characteristics and levels of involvement compare with that of families in the general population?
Multivariate analysis approaches (i.e., multiple linear and logistic regression) were chosen to explore the relationships between student and family characteristics and levels of involvement because many family and youth characteristics are interrelated. For example, families who are wealthier also tend to be better educated (Coleman, 1988). If the relationship between household income and family involvement is examined and it appears that wealthier families are more likely to be involved, the extent to which this difference is associated with differences in income or education would be unclear. Multivariate analysis disentangles these complex relationships and examines how one factor is associated with differences in levels of family involvement, independent of other factors included in the analysis.
The result is almost like creating statistical twins—two students who are identical in every way measured in the analysis, except for the one characteristic being examined. For example, if the focus is the relationship between racial/ethnic background and family involvement, it would be as if there are two youth who are identical in all factors included in the analysis, except that one youth is white and the other is African-American. The analysis would identify the relationship between race/ethnicity and family involvement, controlling for all other characteristics included in the analysis.
The chapter begins with a brief description of the three types of family involvement included in the analyses1:
Frequency of helping with homework.
1 The three types of involvement included in the models are described more fully in Chapters 2 and 3. This report describes the experiences of youth with disabilities who were ages 13 through 17 at the time of the parent interview. Only differences that reach a level of statistical significance of at least .05 are mentioned in the text.
4-2
Frequency of participating in school-based activities—combining parent responses to questions about the three types of involvement that are most highly correlated: frequency of attending a school meeting, attending a school or class event, and volunteering at the school.
Attendance at an IEP meeting.
The chapter then describes the student and family characteristics expected to relate to levels of family involvement. A presentation of the results from the multivariate analyses, including comparison of findings for families in the general population, concludes the chapter.
Types of Family Involvement Included in Analyses During a telephone interview, parents responded to closed-ended questions about three
types of family involvement: at home, at school, and in the IEP process. Involvement in school differs from involvement at home in its barriers, facilitators, and benefits, as well as in how it affects student outcomes (Baker & Soden, 1998; Henderson & Mapp, 2002). Research with students in the general population has found that the relationship between family and youth characteristics and family involvement differs for different types of involvement (Eccles & Harold, 1996; Sui-Chu & Willms, 1996; Simon, 2001a). Because of these differences, the three types of families’ participation in their children’s education are considered separately.
Helping with homework. To assess family involvement in homework, parents were asked, “During this school year, how often did you or another adult in the household help [YOUTH NAME] with [his/her] homework? Would you say never, less than once a week, 1 to 2 times a week, 3 to 4 times a week, or 5 or more times a week?” Parents were provided the option to say that their child was not assigned homework. Those whose children were not assigned homework were not asked this item and are not included in the analysis of helping with homework.
A scale measuring the extent that parents help with homework was created, with scores ranging from 1 (never helps with homework) to 5 (helps with homework five or more times a week). The mean scale score for helping with homework is 3.3, with a standard error around the mean of .02. Chapter 2 describes levels of family involvement with homework.
Involvement at school. To assess family involvement at school, parents were asked the following questions:
Since the beginning of this school year, have you or another adult in the household done each of the following at [YOUTH NAME’s] school? Attend a general school meeting, for example, back to school night, or a meeting of a parent-teacher organization? Attend a school or class event, such as a play, sports event, or science fair? Volunteer at the school, for example, chaperoning a class field trip, or serving on a committee? Gone to a parent/teacher conference with [YOUTH NAME’s] teacher, other than an Individualized Education Plan or IEP meeting?
Parents responded to each item in this series with a “yes” or “no.” Those who said “yes” were then asked, “About how many times has that happened?” and were provided with a 4-point scale of “1-2 times” “3-4 times,” “5-6 times,” and “more than that.”
Three of the four school-based involvement activities—participation in general school meetings or in school or class events, and volunteering at school—are included in the
4-3
multivariate analysis. Participation in parent-teacher conferences is not included in the scale for statistical purposes because family involvement in parent-teacher conferences is less correlated with each of the other types of school-based activities than they are correlated with each other.2 As presented in Chapter 3, parent participation in parent-teacher conferences also differs from the other involvement activities in its relationship with family characteristics; for example, families of students with emotional disturbances or mental retardation are among the most likely to attend parent-teacher conferences but are among the least likely to participate in the three other types of school-based activities. Research with students in the general population also has found that participation in parent-teacher conferences is related to family and youth characteristics differently than other forms of involvement in school-based activities are (Deslandes et al., 1997; Sui-Chu & Willms, 1996).
The scale of the remaining three items ranges from 0 (is never involved in these activities) to 12 (has been involved in all three types of activities more than six times in the school year). The mean scale score is 3.1, with a standard error around the mean of .04. Involvement of families of secondary-school-age students in school-based activities is described in Chapter 3.
Involvement in IEP meetings. To assess involvement in the IEP process, parents were asked, “During this or last school year, did you or another adult in the household go to a meeting about an Individualized Education Plan, or IEP, for [his/her] special education program or services?” Parents’ participation in IEP meetings is included in the multivariate analyses (logistic regression) as a dichotomous variable, with “yes” equaling 1 and “no” equaling 0. Family involvement in IEP meetings is discussed more fully in Chapter 3.
Youth and Family Characteristics Included in Analyses Theoretical models of family involvement have long asserted the importance of considering
youth and family characteristics when examining the extent to which families support children’s education and development (Bronfenbrenner, 1979; Epstein, 1987b; Epstein, 1994; Simon & Epstein, 2001). Most of the family and youth variables included in the NLTS2 analyses have been found to be related to variations in levels of family involvement for families of youth in the general population (Catsambis, 2002; Eccles & Harold, 1996; Grolnick et al., 1997; Kalyanpur, Harry, & Skrtic, 2000; Nord & West, 2001; Simon, 2001b). They are included in the multivariate analyses to learn how and whether they are related to the involvement of families of secondary-school-age students with disabilities. Also included are factors specific to youth with disabilities, including those related to their disabilities and functioning.
Youth Characteristics Family involvement has been found to be related to student characteristics, such as gender,
age, abilities, and behaviors (e.g., Catsambis, 2002; Sui-Chu & Willms, 1996; Zellman & Waterman, 1998). The parent-child dyad is a complex, two-way relationship. Not only do parents affect their children, but children help shape their parents (Maccoby, Snow, & Jacklin, 1984). Including youth characteristics in the analyses is particularly important when examining the involvement of families of children with disabilities. Aspects of students’ disabilities or functioning may be associated with differences in levels of involvement; for example, some
2 Correlations among types of family involvement are presented in Appendix A.
4-4
disabilities have behavioral implications that might in turn influence their parents’ behavior of helping with homework.
The following aspects of youths’ abilities, disabilities, and demographic and school-related characteristics have been included in the analyses. Additional information on demographic characteristics of youth and their households can be found in Appendix B.
Disability category. Research has shown that youth with disabilities differ from each other on many dimensions; for example, youth with visual impairments have very different postsecondary education experiences than do youth with mental retardation (Wagner, D’Amico, Marder, Newman, & Blackorby, 1992). As presented in Chapters 2 and 3, family involvement in children’s education at home and at school also differs across disability categories.
The assignment of youth to a disability category is based on the primary disability designated by the youth’s school or district in the 2000-01 school year. Almost two-thirds (62%) of students receiving special education in the NLTS2 age group are classified as having a learning disability. Youth with mental retardation or emotional disturbances make up 12% and 11% of students, respectively. Another 5% of youth are classified as having other health impairments (many are students with attention deficit disorders), and 4% are identified as having speech impairments. The seven remaining disability categories each account for 1% or fewer of students and, together, make up about 5% of youth with disabilities (Wagner, Marder, Levine, et al., 2003).
The federally defined special education disability categories in use for secondary-school-age students are included in the multivariate analyses as dichotomous variables (i.e., an independent variable for each disability category, except for the learning disability category). In multivariate analyses, dichotomous variables such as these statistically contrast the effects of being in a category that is included in the analyses with being in a comparison category. Learning disability is the comparison category in NLTS2 multivariate analyses because it is the largest category and, therefore, most closely represents the experiences of students with disabilities as a whole.
Number of domains influenced by disability. The number of functional domains affected by disability indicates the breadth of the potential impact of disability on the youth. To assess the breadth of the functional impacts of youth’s disabilities, parents were asked to report whether youth experience limitations in six areas: general health; vision; use of arms, hands, legs, and feet; speech production; understanding of speech; and participation in bidirectional communication. Parents of youth with disabilities report that half have problems in a least one area, whereas 8% have problems in four or more of these areas (Wagner, Blackorby, Marder, & Levine, 2003).
Self-care skills. To assess the independence of youth in caring for their fundamental physical needs, parents of youth with disabilities were asked to rate how well youth can feed and dress themselves without help on a 4-point scale that ranges from “not at all well” to “very well.” A summative scale of abilities ranges from 2 (both skills done “not at all well”) to 8 (both skills done “very well”). According to parents, the vast majority of youth feed and dress themselves on their own “very well”; only 3% and 6% feed and dress themselves “not very well” or “not at all well,” respectively. Virtually all youth (94%) have a high self-care skills scale score (Cameto, Levine, & Wagner, 2003).
4-5
Functional cognitive skills. Parents were asked to use a 4-point scale that ranges from “not at all well” to “very well” to evaluate their children regarding four skills that often are used in daily activities: reading and understanding common signs, telling time on a clock with hands, counting change, and looking up telephone numbers and using the telephone. Parents report that approximately 90% of youth with disabilities read and understand common signs, about 80% count change, about 75% look up telephone numbers and use the telephone, and about 85% tell time on a clock “very well” or “pretty well” (Cameto et al., 2003).
Behavior at home. The behavior and social skills of youth with disabilities are assessed by asking parents to rate the frequency with which youth exhibit four aspects of social interactions at home: ending disagreements with parents calmly, receiving criticism well, behaving at home in a way that causes problems for the family, and speaking in an appropriate tone at home. These items were drawn from the Social Skills Rating System, Parent Form (Gresham & Elliott, 1990). Parents were asked to rate these behaviors on a 3-point scale: “never,” “sometimes,” or “always.” More than half of youth with disabilities are reported to speak in an appropriate tone at home always, approximately one-third always end disagreements with parents calmly, 36% never behave at home in a problematic way, but only 17% always receive criticism well (Marder, Wagner, & Sumi, 2003).
A summative scale of home behavior was created by first reverse coding the “behaving at home in a way that causes problems” item and then summing the four items, yielding scores that range from 0 (parents indicated “never” to all four items) to 8 (parents indicated “very often” to all four items).
Gender. Whereas youth in the general population are split about evenly between boys and girls, almost two-thirds of youth with disabilities in the NLTS2 age range are boys. Further, it is also clear that gender is intertwined with the nature of youth’s disabilities, with males accounting for a much higher proportion of some disability categories (e.g., autism, emotional disturbance) than others (e.g., hearing or visual impairment) (Marder, Levine, & Wagner, 2003). Including both gender and disability in multivariate analyses enables their independent relationships with family involvement variables to be identified.
Age. Youth with disabilities in NLTS2 were ages 13 through 17 when Wave 1 interview data were collected from parents. The age distribution of youth differs across disability categories (e.g., youth with speech impairments tend to be younger, on average, than other groups) (Marder, Levine, et al., 2003).
Race/ethnicity. The racial/ethnic background of youth was determined primarily from data provided by schools or districts. For youth for whom information was not provided by schools or districts, data were taken from the parent interview. Overall, 62% of youth with disabilities are white, 21% are African-American, 14% are Hispanic, and 3% have other or multiple racial/ethnic backgrounds. The racial/ethnic composition of most disability categories does not differ significantly from that of the general population of youth. However, African-Americans make up significantly larger proportions of youth with mental retardation (33%), emotional disturbance (25%), and autism (24%) than their proportion of the general population, and Hispanics make up a significantly larger proportion of youth with hearing impairments (17%) and significantly smaller proportions of youth with mental retardation (10%), other health impairments (8%), and autism (9%) than their proportion of the general population (Marder,

4-6
Levine, et al., 2003). Again, multivariate analyses permit the relationships of these factors to family involvement for youth with disabilities to be assessed independently.
Neighborhood school attendance. Parents were asked whether youth attend a school that is located in the neighborhood where they live. Overall, 72% of youth with disabilities attend a neighborhood school. Parents of the 1% of students who attend residential facilities are not included in the family involvement analyses because these parents were not asked the family involvement items.
Participation in school activities outside of class. Overall, 46% of youth with disabilities are reported by parents to have participated during the past year in school activities outside of class, such as sports teams, band or chorus, school clubs, or student government.
Family Characteristics Families bring a wide range of strengths and resources to bear in raising children and in
providing the support and attention needed for academic success. Most families share a deep desire for their children to be successful, and most want to help their children succeed (Mapp, 2003; Scott-Jones, 1988). Families also differ in many ways, including differences in cultures and languages, number of parents and siblings in the household, work experiences, education and literacy levels, and levels of support. Many of these differences have long been associated with variations in levels of involvement (e.g., Kalyanpur & Harry, 1999). The following family characteristics are included in the multivariate analyses.
Household income. Household income is reported in categories (e.g., $25,001 to $30,000) rather than specific dollar amounts. The incomes of families of youth with disabilities range widely, with 19% living in households with annual incomes of $15,000 or less and 13% living in households with incomes of more than $75,000.
Mother’s education level. Parents were asked to indicate the highest year or grade the youth’s mother had completed in school. Responses were coded into 10 categories: 8th grade or less; 9th grade or above, not a high school graduate; high school graduate or GED; post-high-school education, no college degree; vocational-technical degree or certificate; 2-year college degree; 4-year college degree; some post-BA work with no degree; master’s degree; professional degree. Using these categories, a 10-point scale was created. The educational levels of mothers of youth with disabilities vary widely. Mothers of 14% of youth have completed college, whereas 21% have not completed high school.
Language spoken at home. Parents were asked whether a language other than English is regularly spoken in the home. Overall, 14% of students with disabilities live in homes in which a language other than English is spoken regularly. This percentage varies by race/ethnicity, with 4% of white students and 7% of African-American students regularly speaking a language other than English at home, compared with 67% of Hispanic students.
Number of parents in the household. Youth with disabilities are less likely than youth in the general population to live with both parents. Sixty-one percent of students with disabilities live with two parents, whereas 74% of secondary students in the general population live with both parents (Wagner, Marder, Levine, et al., 2003).

4-7
Mother’s employment status. Parents were asked whether the youth’s mother “has a paid job now.” Those who responded “yes” were then asked, “In an average week, about how many hours [does youth’s mother] work for pay?” Those who were unable to provide the number of hours were asked whether the youth’s mother usually works “less than 20 hours a week, 20 to 35 hours a week, or more than 35 hours a week.” The responses for the three items were combined to create a three-category scale: (1) not employed; (2) employed part-time; (3) employed full-time. Full-time is defined as more than 35 hours a week; part-time is defined as working at all, but 35 hours a week or less. Because respondents were asked to report mother’s employment status at the time the interview was conducted, the data do not necessarily reflect their employment status during the entire year. About half (51%) of mothers of secondary school students with disabilities are employed full-time, 21% are employed part-time, and 28% are not working outside the home.
Number of children/siblings in the household. Parents were asked to indicate the number of children living in the household. Approximately one-fourth of youth with disabilities are the only children in their households, about 60% live in households with two or three children, and 15% live in households with four or more children.
Other children with disability in the household. If there were other children living in the household, parents were asked whether any of these other children, not including the youth, “have any disability, developmental delay, special need, or condition?” Slightly more than one-third (36%) of secondary-school-age students with disabilities with siblings live in a household in which one or more other children also have a disability.
Number of years family has lived in the community. Parents were asked to report “How long has [YOUTH NAME] lived in the community?” Responses coded in number of months were converted to number of years. Overall, four-fifths of families of children with disabilities have lived in their communities at least 5 years, with 21% having lived in their community between 5 and 10 years, 35% 11 to 15 years, and 24% more than 15 years.
Belonging to a support group for families of children with disabilities. Parents were asked, “Do you or another household member belong to any support groups for children with disabilities or their families?” Fewer than 10% of families belong to a support group for families of children with disabilities.
Family participation in OSEP-supported trainings and other trainings. Parents were asked, “Have you, or anyone in your family, ever participated in any parent meetings, programs, or trainings for families of students with disabilities?” Those who responded “yes” were asked if “any of the meetings, programs, or trainings [were] sponsored by a parent training and information center, such as….” Names of parent centers for the state in which the respondent lived were displayed on the interviewer’s screen and read to the respondent. Slightly more than one-quarter (28%) have participated in programs or trainings for families of students with disabilities. Of those who have participated in these types of trainings, 42% have attended trainings sponsored by OSEP Parent Training and Information Centers (PTIs).
In the multivariate analyses, a dichotomous variable is included for those who have ever participated in OSEP PTIs. A dichotomous variable also is included for those who have ever participated in other types of training. These two variables are mutually exclusive; if parents have participated in OSEP trainings, they are counted in the OSEP variable, whereas if they have
4-8
not participated in OSEP trainings but have participated in trainings, they are included in the “other trainings” variable.
Parent satisfaction with child’s school. Parents were asked to rate their satisfaction with their child’s school, teachers, special education services, education, and how well the school keeps the family informed about their child’s behavior and academic performance. They were asked to use a 4-point scale, with responses including “very satisfied,” “somewhat satisfied,” “somewhat dissatisfied,” and “very dissatisfied.” Regarding satisfaction with the school overall, 37% are very satisfied, and 20% are somewhat/very dissatisfied. Forty-four percent are very satisfied with their child’s teacher, and 14% are somewhat/very dissatisfied. Half are very satisfied with their child’s special education services, and 16% are somewhat/very dissatisfied. Regarding students’ overall education, 40% are very satisfied, and 14% are somewhat/very dissatisfied. More than half (53%) are very satisfied with how well the school keeps parents informed, and 16% are somewhat/very dissatisfied. Summing these five satisfaction items produces a scale that ranges from 0 (very dissatisfied with all four aspects of schooling) to 20 (very satisfied with all four aspects); the mean scale score is 12.8.
Parents’ expectations for children’s postsecondary education. Parents were asked to report their expectations that their adolescent children with disabilities will “attend school after high school,” using a 4-point scale ranging from “definitely will” to “definitely won’t.” Overall, 25% of parents expect that their children definitely will attend postsecondary school, 37% think they probably will attend, and 38% feel they probably or definitely will not attend postsecondary school. Parents who thought their children would definitely or probably not graduate from high school were not asked the question about postsecondary school but are included in the analyses as “definitely will not attend school after high school.”
First request for special services for student. Parents were asked whether they were the one who first asked for special services for their child in school, or whether school staff first suggested that the child might need services. For more than half of students (56%), school staff were the first to recommend services; for 41% of students, parents initiated the request for special services, and for 3% of the students, someone else first suggested that the students needed services.
Characteristics Associated with Family Involvement Multivariate regression analyses were conducted to explore the associations of these youth
and family characteristics with family involvement at home, at school in general, and in the IEP process in particular. Results from these analyses illuminate the association of each variable with family involvement, controlling for other variables in the analyses. All of the factors noted above were included in the analyses; however, if they were not significant, they are not reported in the discussion below.3 For each exhibit, an example of how to interpret the data is provided, using the first data presented in the exhibit’s first row.
3 Disability category variables are not included in the discussion, irrespective of their level of significance in the models. Bivariate relationships between disability category and parent involvement are described in Chapters 2 and 3. Appendix C presents the full findings, including disability category variables, coefficients, and r² values, related to the three regression models.
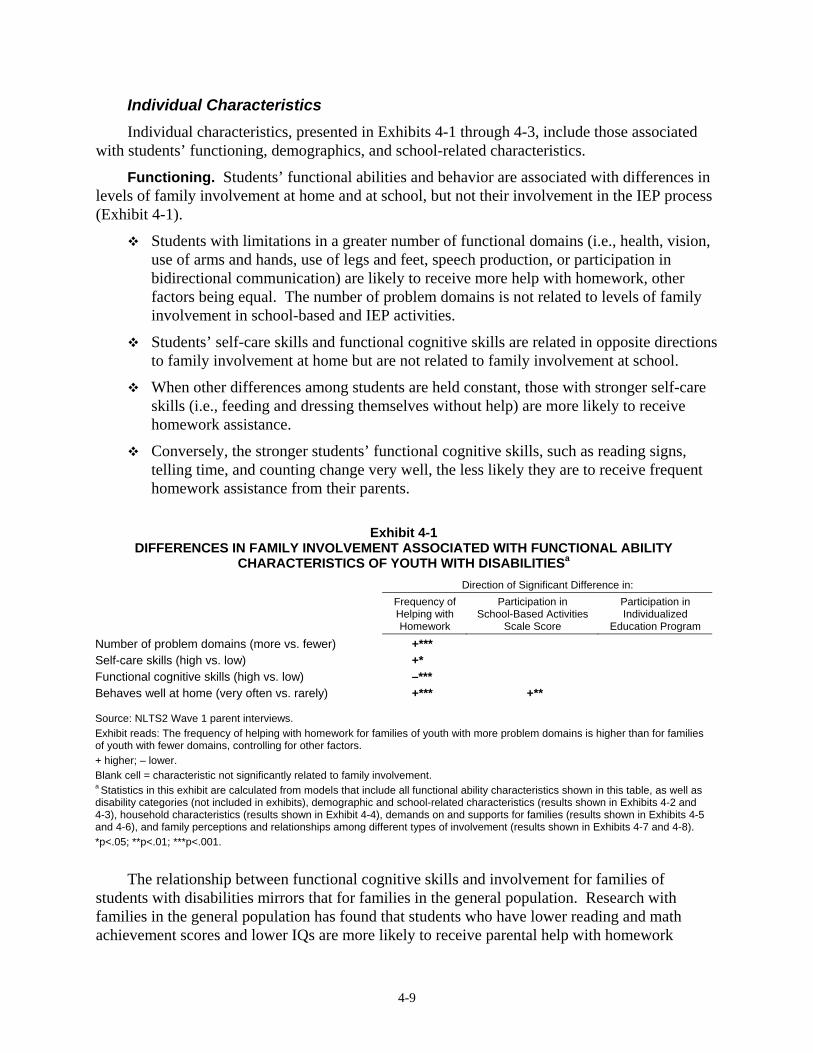
4-9
Individual Characteristics Individual characteristics, presented in Exhibits 4-1 through 4-3, include those associated
with students’ functioning, demographics, and school-related characteristics.
Functioning. Students’ functional abilities and behavior are associated with differences in levels of family involvement at home and at school, but not their involvement in the IEP process (Exhibit 4-1).
Students with limitations in a greater number of functional domains (i.e., health, vision, use of arms and hands, use of legs and feet, speech production, or participation in bidirectional communication) are likely to receive more help with homework, other factors being equal. The number of problem domains is not related to levels of family involvement in school-based and IEP activities.
Students’ self-care skills and functional cognitive skills are related in opposite directions to family involvement at home but are not related to family involvement at school.
When other differences among students are held constant, those with stronger self-care skills (i.e., feeding and dressing themselves without help) are more likely to receive homework assistance.
Conversely, the stronger students’ functional cognitive skills, such as reading signs, telling time, and counting change very well, the less likely they are to receive frequent homework assistance from their parents.
Exhibit 4-1
DIFFERENCES IN FAMILY INVOLVEMENT ASSOCIATED WITH FUNCTIONAL ABILITY CHARACTERISTICS OF YOUTH WITH DISABILITIESa
Direction of Significant Difference in:
Frequency of Helping with Homework
Participation in School-Based Activities
Scale Score
Participation in Individualized
Education Program
Number of problem domains (more vs. fewer) +*** Self-care skills (high vs. low) +* Functional cognitive skills (high vs. low) –*** Behaves well at home (very often vs. rarely) +*** +** Source: NLTS2 Wave 1 parent interviews. Exhibit reads: The frequency of helping with homework for families of youth with more problem domains is higher than for families of youth with fewer domains, controlling for other factors. + higher; – lower. Blank cell = characteristic not significantly related to family involvement. a Statistics in this exhibit are calculated from models that include all functional ability characteristics shown in this table, as well as disability categories (not included in exhibits), demographic and school-related characteristics (results shown in Exhibits 4-2 and 4-3), household characteristics (results shown in Exhibit 4-4), demands on and supports for families (results shown in Exhibits 4-5 and 4-6), and family perceptions and relationships among different types of involvement (results shown in Exhibits 4-7 and 4-8). *p<.05; **p<.01; ***p<.001.
The relationship between functional cognitive skills and involvement for families of students with disabilities mirrors that for families in the general population. Research with families in the general population has found that students who have lower reading and math achievement scores and lower IQs are more likely to receive parental help with homework
4-10
(Milne, Myers, Rosenthal, & Ginsburg, 1986; Muller, 1993; Zellman & Waterman, 1998). Similar to their peers, students with disabilities who have weaker functional cognitive skills are more likely to receive homework assistance.
Positive youth behaviors at home—ending disagreements with parents calmly, receiving criticism well, behaving in a way that rarely causes problems for their family, and speaking in an appropriate tone at home—are consistently related to higher levels of family involvement at home and at school.
When controlling for disability category and other student differences, those who are rated as behaving well at home are more likely to receive homework assistance and to have parents who participate in school-based activities.
Youth behavior has been found to be a predictor of parent involvement for students in the general population as well. Other studies have found that parents who describe their children’s behavior as being more difficult are less likely to be involved both at home and at school (Grolnick, Apostoleris, & Rosen, 1995; Sui-Chu & Willms, 1996). Clearly, it can be difficult to sit across the kitchen table from a child with conduct disorder and try to help with math problems. In addition, whereas parents are more likely to be involved in school activities when their children are participating in them (Epstein, 2001), children with negative behaviors often do not participate in the types of extracurricular activities at school, such as theater, sports, or school events, that frequently bring families to school (Wagner, Cadwallader, et al., 2003).
Demographics. Both age and gender are related to family involvement at home and at school, but not to involvement in the IEP process (Exhibit 4-2).
Parents of older students are consistently less likely to be involved, both at home and at school.
Family involvement is lower for older students in studies of the general population as well (Ames, deStefano, Watkins, & Sheldon, 1995; Burke, 2001; Cooper et al., 2000; Crosnoe, 2001; Dauber & Epstein, 1993); not only does participation decline as students move from elementary to secondary schools, but it continues to decline as students progress through secondary schools.
Multiple factors may contribute to this decline as families and students mature and change, including adolescents’ growing need for independence, the increasingly technical content of homework, and the organization and policies of secondary schools. Schools attended by secondary-school-age students with disabilities use significantly fewer strategies to reach out to families and encourage involvement than do elementary schools. For example, 44% of elementary-age and middle-school-age students attend schools that offer services to support parent involvement, such as child care or transportation, compared with only 12 percent of secondary-school-age students.4
Parents of daughters are more likely than parents of sons to be involved in their schooling, both at home and at school, independent of differences in disability and other factors.
4 Unpublished data from Wave 1 of U.S. Department of Education SEELS (www.seels.net) and NLTS2.
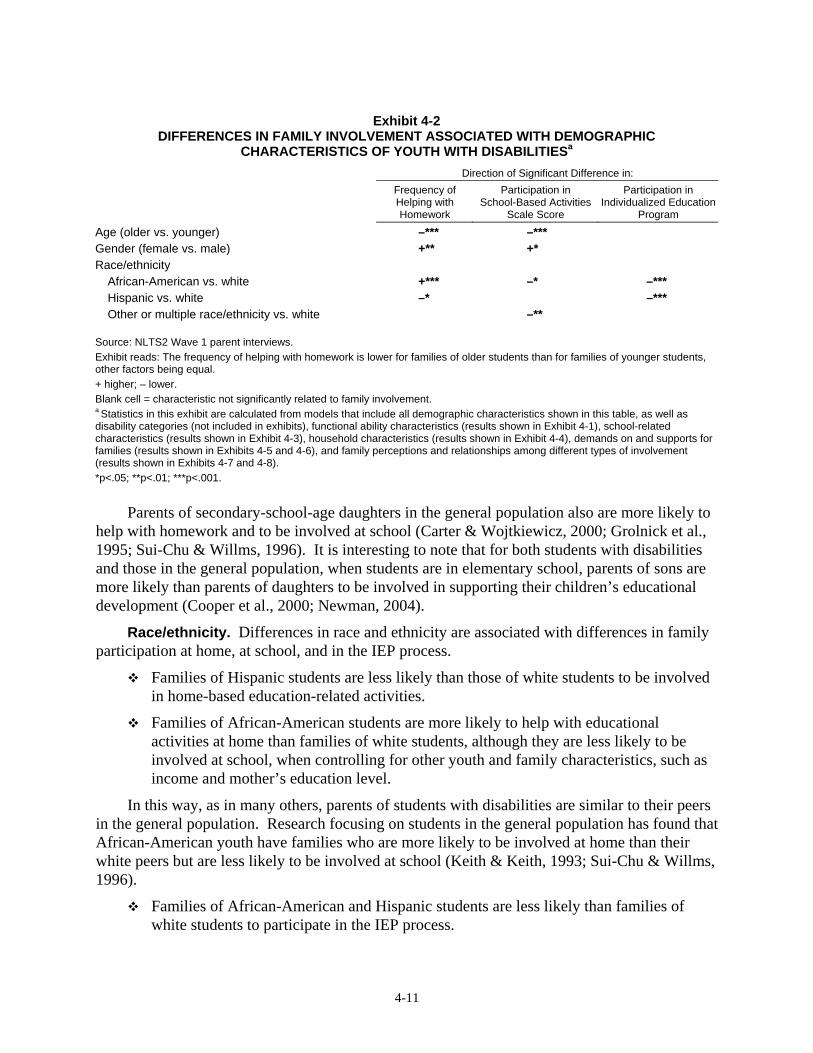
4-11
Exhibit 4-2 DIFFERENCES IN FAMILY INVOLVEMENT ASSOCIATED WITH DEMOGRAPHIC
CHARACTERISTICS OF YOUTH WITH DISABILITIESa
Direction of Significant Difference in:
Frequency of Helping with Homework
Participation in School-Based Activities
Scale Score
Participation in Individualized Education
Program
Age (older vs. younger) –*** –*** Gender (female vs. male) +** +* Race/ethnicity
African-American vs. white +*** –* –*** Hispanic vs. white –* –*** Other or multiple race/ethnicity vs. white –**
Source: NLTS2 Wave 1 parent interviews. Exhibit reads: The frequency of helping with homework is lower for families of older students than for families of younger students, other factors being equal. + higher; – lower. Blank cell = characteristic not significantly related to family involvement. a Statistics in this exhibit are calculated from models that include all demographic characteristics shown in this table, as well as disability categories (not included in exhibits), functional ability characteristics (results shown in Exhibit 4-1), school-related characteristics (results shown in Exhibit 4-3), household characteristics (results shown in Exhibit 4-4), demands on and supports for families (results shown in Exhibits 4-5 and 4-6), and family perceptions and relationships among different types of involvement (results shown in Exhibits 4-7 and 4-8). *p<.05; **p<.01; ***p<.001.
Parents of secondary-school-age daughters in the general population also are more likely to help with homework and to be involved at school (Carter & Wojtkiewicz, 2000; Grolnick et al., 1995; Sui-Chu & Willms, 1996). It is interesting to note that for both students with disabilities and those in the general population, when students are in elementary school, parents of sons are more likely than parents of daughters to be involved in supporting their children’s educational development (Cooper et al., 2000; Newman, 2004).
Race/ethnicity. Differences in race and ethnicity are associated with differences in family participation at home, at school, and in the IEP process.
Families of Hispanic students are less likely than those of white students to be involved in home-based education-related activities.
Families of African-American students are more likely to help with educational activities at home than families of white students, although they are less likely to be involved at school, when controlling for other youth and family characteristics, such as income and mother’s education level.
In this way, as in many others, parents of students with disabilities are similar to their peers in the general population. Research focusing on students in the general population has found that African-American youth have families who are more likely to be involved at home than their white peers but are less likely to be involved at school (Keith & Keith, 1993; Sui-Chu & Willms, 1996).
Families of African-American and Hispanic students are less likely than families of white students to participate in the IEP process.
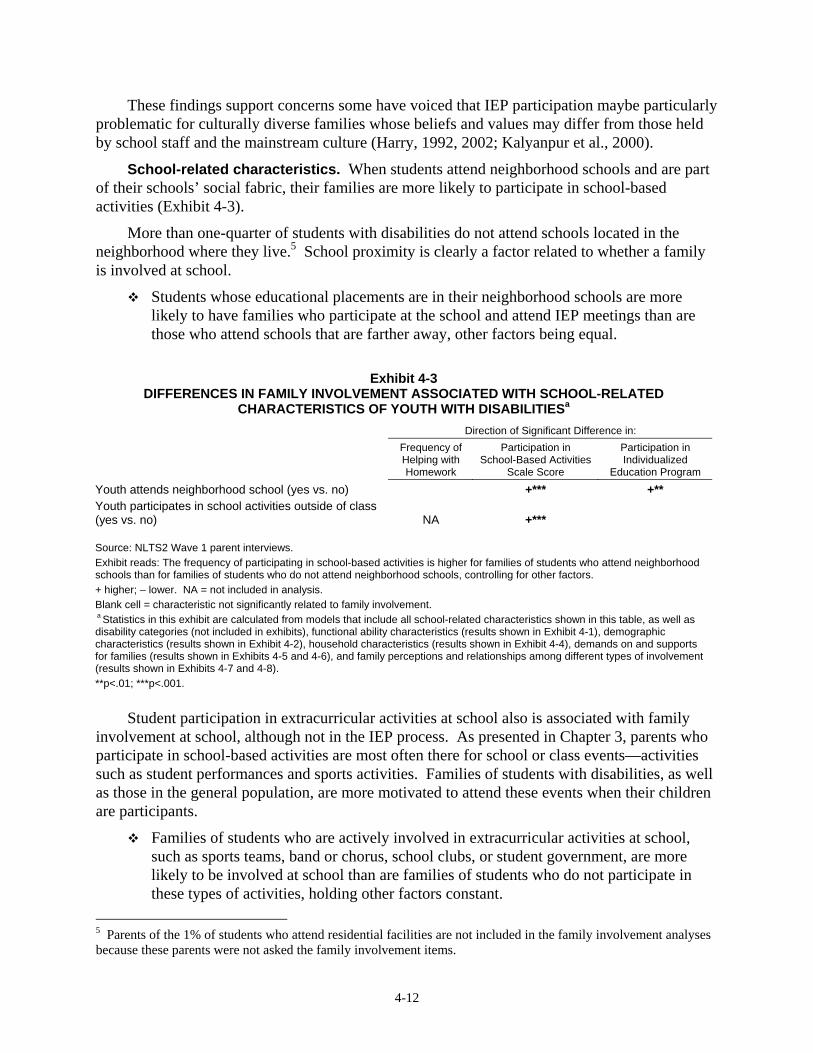
4-12
These findings support concerns some have voiced that IEP participation maybe particularly problematic for culturally diverse families whose beliefs and values may differ from those held by school staff and the mainstream culture (Harry, 1992, 2002; Kalyanpur et al., 2000).
School-related characteristics. When students attend neighborhood schools and are part of their schools’ social fabric, their families are more likely to participate in school-based activities (Exhibit 4-3).
More than one-quarter of students with disabilities do not attend schools located in the neighborhood where they live.5 School proximity is clearly a factor related to whether a family is involved at school.
Students whose educational placements are in their neighborhood schools are more likely to have families who participate at the school and attend IEP meetings than are those who attend schools that are farther away, other factors being equal.
Exhibit 4-3
DIFFERENCES IN FAMILY INVOLVEMENT ASSOCIATED WITH SCHOOL-RELATED CHARACTERISTICS OF YOUTH WITH DISABILITIESa
Direction of Significant Difference in:
Frequency of Helping with Homework
Participation in School-Based Activities
Scale Score
Participation in Individualized
Education Program
Youth attends neighborhood school (yes vs. no) +*** +** Youth participates in school activities outside of class (yes vs. no) NA +*** Source: NLTS2 Wave 1 parent interviews. Exhibit reads: The frequency of participating in school-based activities is higher for families of students who attend neighborhood schools than for families of students who do not attend neighborhood schools, controlling for other factors. + higher; – lower. NA = not included in analysis. Blank cell = characteristic not significantly related to family involvement. a Statistics in this exhibit are calculated from models that include all school-related characteristics shown in this table, as well as disability categories (not included in exhibits), functional ability characteristics (results shown in Exhibit 4-1), demographic characteristics (results shown in Exhibit 4-2), household characteristics (results shown in Exhibit 4-4), demands on and supports for families (results shown in Exhibits 4-5 and 4-6), and family perceptions and relationships among different types of involvement (results shown in Exhibits 4-7 and 4-8). **p<.01; ***p<.001.
Student participation in extracurricular activities at school also is associated with family involvement at school, although not in the IEP process. As presented in Chapter 3, parents who participate in school-based activities are most often there for school or class events—activities such as student performances and sports activities. Families of students with disabilities, as well as those in the general population, are more motivated to attend these events when their children are participants.
Families of students who are actively involved in extracurricular activities at school, such as sports teams, band or chorus, school clubs, or student government, are more likely to be involved at school than are families of students who do not participate in these types of activities, holding other factors constant.
5 Parents of the 1% of students who attend residential facilities are not included in the family involvement analyses because these parents were not asked the family involvement items.
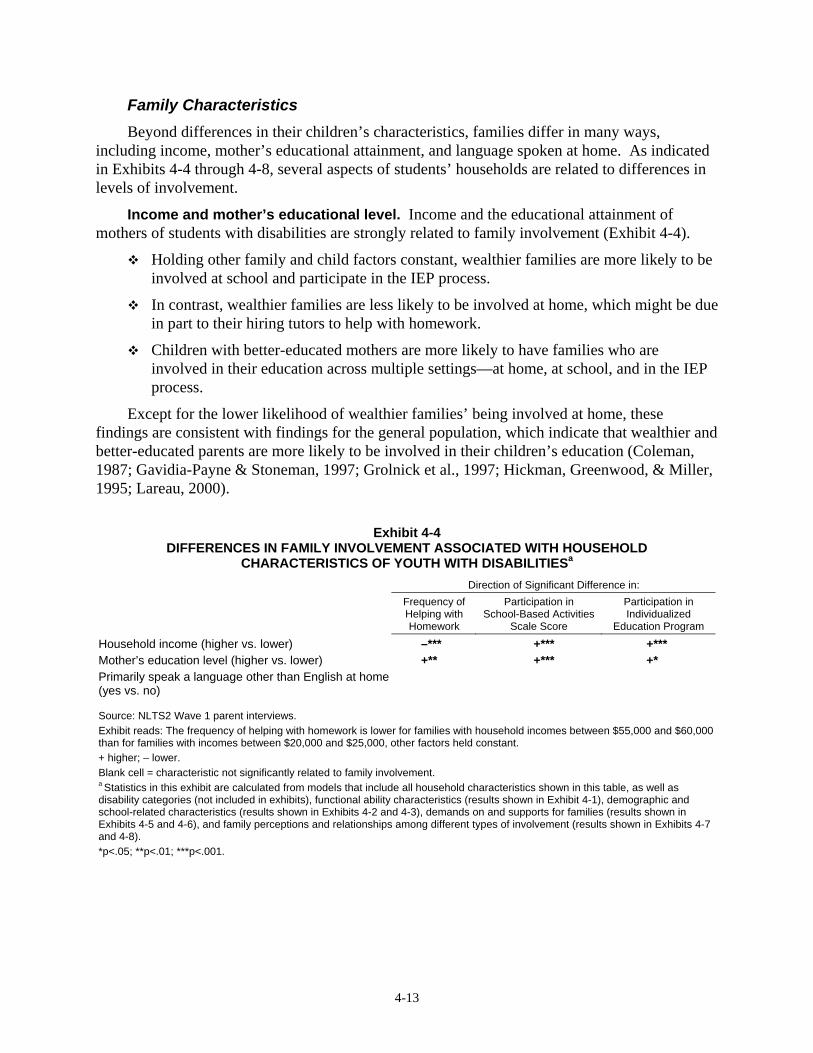
4-13
Family Characteristics Beyond differences in their children’s characteristics, families differ in many ways,
including income, mother’s educational attainment, and language spoken at home. As indicated in Exhibits 4-4 through 4-8, several aspects of students’ households are related to differences in levels of involvement.
Income and mother’s educational level. Income and the educational attainment of mothers of students with disabilities are strongly related to family involvement (Exhibit 4-4).
Holding other family and child factors constant, wealthier families are more likely to be involved at school and participate in the IEP process.
In contrast, wealthier families are less likely to be involved at home, which might be due in part to their hiring tutors to help with homework.
Children with better-educated mothers are more likely to have families who are involved in their education across multiple settings—at home, at school, and in the IEP process.
Except for the lower likelihood of wealthier families’ being involved at home, these findings are consistent with findings for the general population, which indicate that wealthier and better-educated parents are more likely to be involved in their children’s education (Coleman, 1987; Gavidia-Payne & Stoneman, 1997; Grolnick et al., 1997; Hickman, Greenwood, & Miller, 1995; Lareau, 2000).
Exhibit 4-4 DIFFERENCES IN FAMILY INVOLVEMENT ASSOCIATED WITH HOUSEHOLD
CHARACTERISTICS OF YOUTH WITH DISABILITIESa Direction of Significant Difference in:
Frequency of Helping with Homework
Participation in School-Based Activities
Scale Score
Participation in Individualized
Education Program
Household income (higher vs. lower) –*** +*** +*** Mother’s education level (higher vs. lower) +** +*** +* Primarily speak a language other than English at home(yes vs. no) Source: NLTS2 Wave 1 parent interviews. Exhibit reads: The frequency of helping with homework is lower for families with household incomes between $55,000 and $60,000than for families with incomes between $20,000 and $25,000, other factors held constant. + higher; – lower. Blank cell = characteristic not significantly related to family involvement. a Statistics in this exhibit are calculated from models that include all household characteristics shown in this table, as well as disability categories (not included in exhibits), functional ability characteristics (results shown in Exhibit 4-1), demographic and school-related characteristics (results shown in Exhibits 4-2 and 4-3), demands on and supports for families (results shown in Exhibits 4-5 and 4-6), and family perceptions and relationships among different types of involvement (results shown in Exhibits 4-7 and 4-8). *p<.05; **p<.01; ***p<.001.
4-14
Primary language spoken at home. When using a multivariate approach to analyzing the NLTS2 data, speaking a language other than English at home is not related to differences in levels of families’ support for their children’s education at home or at school. NLTS2 interviews were conducted only in English or Spanish; therefore, most families who report they primarily speak a language other than English at home, speak Spanish. Multivariate analyses already account for differences in family involvement related to being Hispanic; therefore, when speaking primarily Spanish at home is included in the multivariate analyses, it is not associated with differences in family involvement beyond those already found for being Hispanic.
Research with students in the general population frequently uses a bivariate approach—looking only at the relationship between language and involvement, and not taking other factors into account—instead of a multivariate approach to analyze family involvement data. These studies have found that primarily speaking a language other than English at home is related to differences in levels of family involvement (Delgado-Gaitan, 1991; Pena, 2000; Tinkler, 2002). Analysis of NLTS2 data with a bivariate approach corroborates the findings of these other studies. Crosstabulations of primary language spoken at home and frequency of helping with homework indicate that 33% of NLTS2 families who primarily speak a language other than English at home assist with homework less than once a week, compared with 22% of families where English is the primary language at home (p<.05).
Demands on families. None of the family stressors included in these analyses are related to family involvement in the IEP process, but several are associated with other types of family support for education, when other differences among students and families are held constant (Exhibit 4-5).
Students with disabilities living in two-parent households are more likely to have families who are involved in education-related activities at home and at school than are their peers in single-parent households, other factors being equal.
Having two parents in the household is linked to increased parent involvement both at home and at school for families of youth in the general population as well (Grolnick et al., 1997; Milne et al., 1986; Nord & West, 2001; Sui-Chu & Willms, 1996).
Students who have more siblings are less likely to receive homework support.
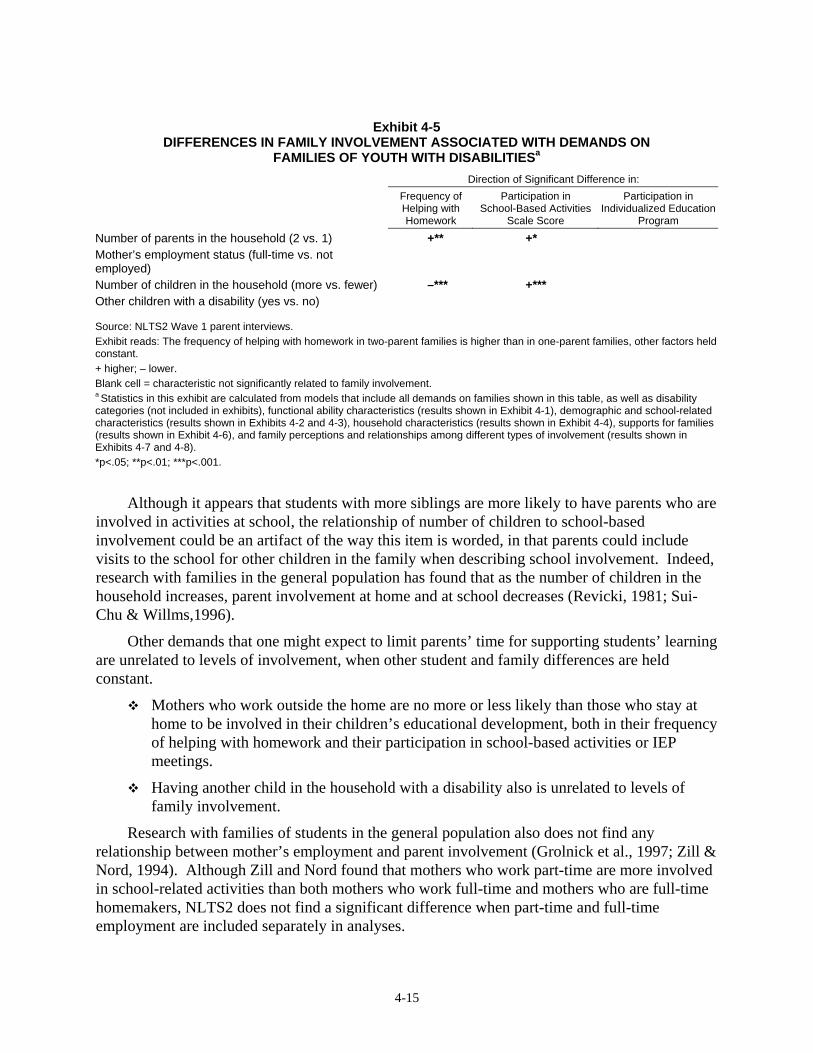
4-15
Exhibit 4-5
DIFFERENCES IN FAMILY INVOLVEMENT ASSOCIATED WITH DEMANDS ON FAMILIES OF YOUTH WITH DISABILITIESa
Direction of Significant Difference in:
Frequency of Helping with Homework
Participation in School-Based Activities
Scale Score
Participation in Individualized Education
Program
Number of parents in the household (2 vs. 1) +** +* Mother’s employment status (full-time vs. not employed) Number of children in the household (more vs. fewer) –*** +*** Other children with a disability (yes vs. no) Source: NLTS2 Wave 1 parent interviews. Exhibit reads: The frequency of helping with homework in two-parent families is higher than in one-parent families, other factors held constant. + higher; – lower. Blank cell = characteristic not significantly related to family involvement. a Statistics in this exhibit are calculated from models that include all demands on families shown in this table, as well as disability categories (not included in exhibits), functional ability characteristics (results shown in Exhibit 4-1), demographic and school-related characteristics (results shown in Exhibits 4-2 and 4-3), household characteristics (results shown in Exhibit 4-4), supports for families (results shown in Exhibit 4-6), and family perceptions and relationships among different types of involvement (results shown in Exhibits 4-7 and 4-8). *p<.05; **p<.01; ***p<.001.
Although it appears that students with more siblings are more likely to have parents who are
involved in activities at school, the relationship of number of children to school-based involvement could be an artifact of the way this item is worded, in that parents could include visits to the school for other children in the family when describing school involvement. Indeed, research with families in the general population has found that as the number of children in the household increases, parent involvement at home and at school decreases (Revicki, 1981; Sui-Chu & Willms,1996).
Other demands that one might expect to limit parents’ time for supporting students’ learning are unrelated to levels of involvement, when other student and family differences are held constant.
Mothers who work outside the home are no more or less likely than those who stay at home to be involved in their children’s educational development, both in their frequency of helping with homework and their participation in school-based activities or IEP meetings.
Having another child in the household with a disability also is unrelated to levels of family involvement.
Research with families of students in the general population also does not find any relationship between mother’s employment and parent involvement (Grolnick et al., 1997; Zill & Nord, 1994). Although Zill and Nord found that mothers who work part-time are more involved in school-related activities than both mothers who work full-time and mothers who are full-time homemakers, NLTS2 does not find a significant difference when part-time and full-time employment are included separately in analyses.
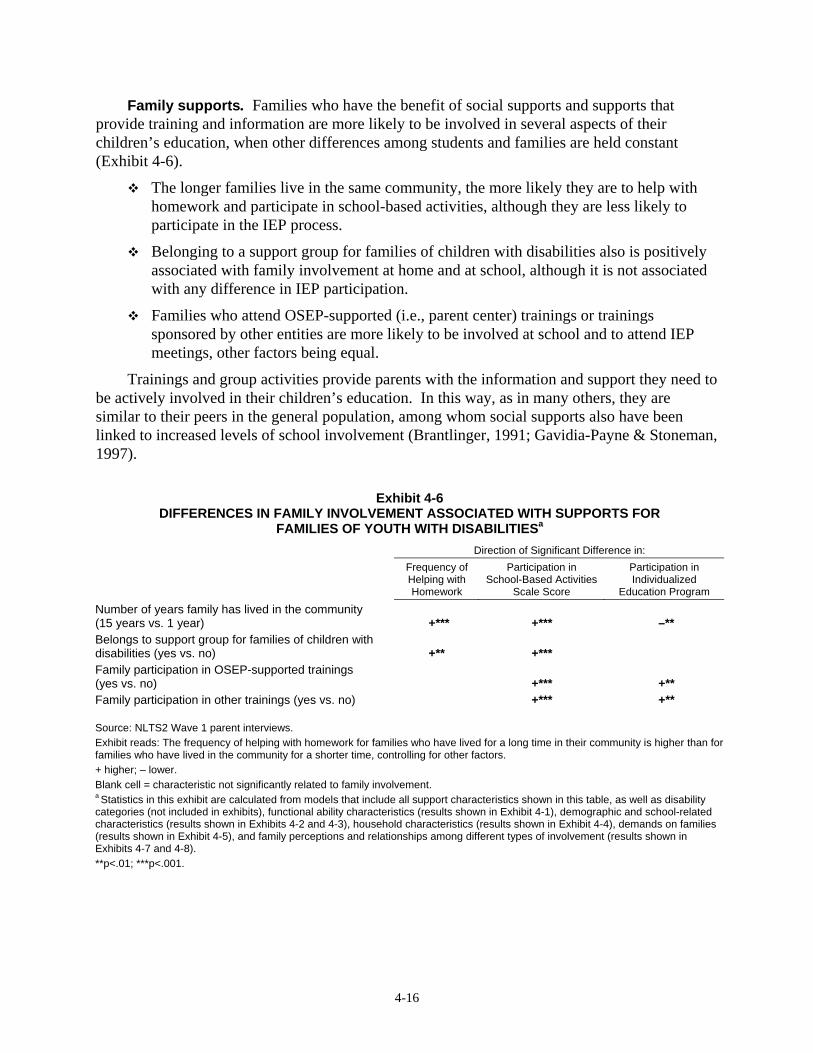
4-16
Family supports. Families who have the benefit of social supports and supports that provide training and information are more likely to be involved in several aspects of their children’s education, when other differences among students and families are held constant (Exhibit 4-6).
The longer families live in the same community, the more likely they are to help with homework and participate in school-based activities, although they are less likely to participate in the IEP process.
Belonging to a support group for families of children with disabilities also is positively associated with family involvement at home and at school, although it is not associated with any difference in IEP participation.
Families who attend OSEP-supported (i.e., parent center) trainings or trainings sponsored by other entities are more likely to be involved at school and to attend IEP meetings, other factors being equal.
Trainings and group activities provide parents with the information and support they need to be actively involved in their children’s education. In this way, as in many others, they are similar to their peers in the general population, among whom social supports also have been linked to increased levels of school involvement (Brantlinger, 1991; Gavidia-Payne & Stoneman, 1997).
Exhibit 4-6 DIFFERENCES IN FAMILY INVOLVEMENT ASSOCIATED WITH SUPPORTS FOR
FAMILIES OF YOUTH WITH DISABILITIESa Direction of Significant Difference in:
Frequency of Helping with Homework
Participation in School-Based Activities
Scale Score
Participation in Individualized
Education Program
Number of years family has lived in the community (15 years vs. 1 year) +*** +*** –** Belongs to support group for families of children with disabilities (yes vs. no) +** +*** Family participation in OSEP-supported trainings (yes vs. no) +*** +** Family participation in other trainings (yes vs. no) +*** +** Source: NLTS2 Wave 1 parent interviews. Exhibit reads: The frequency of helping with homework for families who have lived for a long time in their community is higher than for families who have lived in the community for a shorter time, controlling for other factors. + higher; – lower. Blank cell = characteristic not significantly related to family involvement. a Statistics in this exhibit are calculated from models that include all support characteristics shown in this table, as well as disability categories (not included in exhibits), functional ability characteristics (results shown in Exhibit 4-1), demographic and school-related characteristics (results shown in Exhibits 4-2 and 4-3), household characteristics (results shown in Exhibit 4-4), demands on families (results shown in Exhibit 4-5), and family perceptions and relationships among different types of involvement (results shown in Exhibits 4-7 and 4-8). **p<.01; ***p<.001.
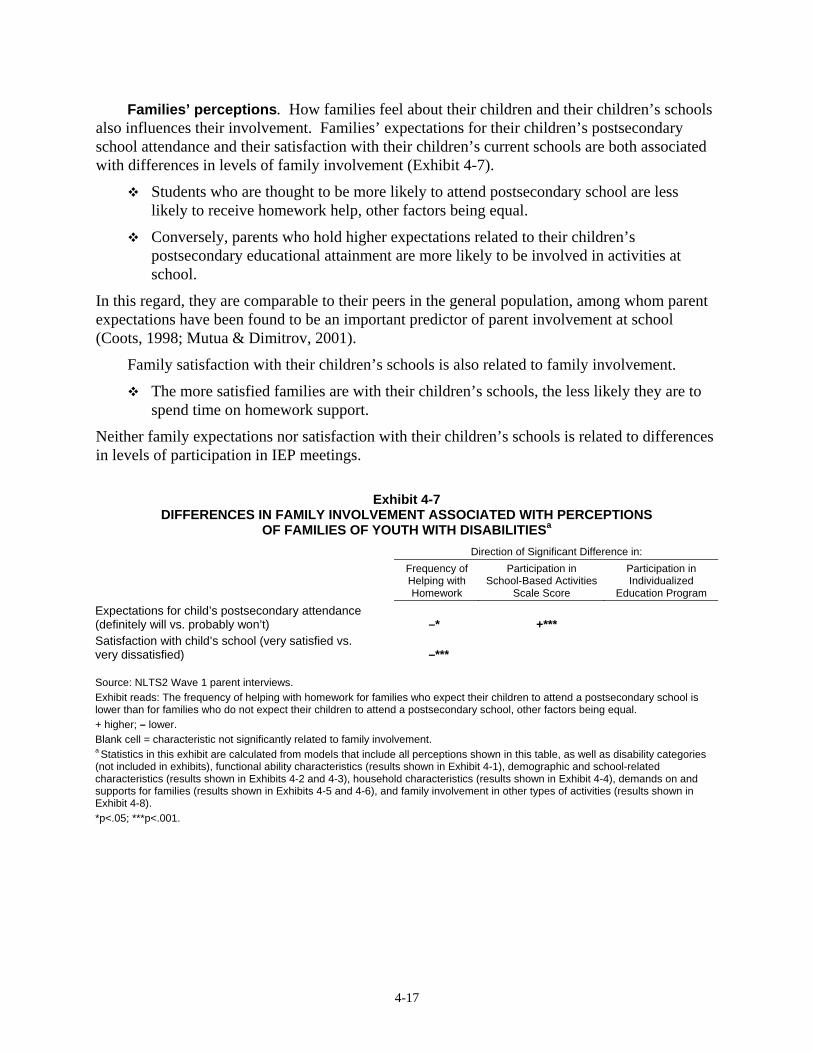
4-17
Families’ perceptions. How families feel about their children and their children’s schools also influences their involvement. Families’ expectations for their children’s postsecondary school attendance and their satisfaction with their children’s current schools are both associated with differences in levels of family involvement (Exhibit 4-7).
Students who are thought to be more likely to attend postsecondary school are less likely to receive homework help, other factors being equal.
Conversely, parents who hold higher expectations related to their children’s postsecondary educational attainment are more likely to be involved in activities at school.
In this regard, they are comparable to their peers in the general population, among whom parent expectations have been found to be an important predictor of parent involvement at school (Coots, 1998; Mutua & Dimitrov, 2001).
Family satisfaction with their children’s schools is also related to family involvement.
The more satisfied families are with their children’s schools, the less likely they are to spend time on homework support.
Neither family expectations nor satisfaction with their children’s schools is related to differences in levels of participation in IEP meetings.
Exhibit 4-7 DIFFERENCES IN FAMILY INVOLVEMENT ASSOCIATED WITH PERCEPTIONS
OF FAMILIES OF YOUTH WITH DISABILITIESa Direction of Significant Difference in:
Frequency of Helping with Homework
Participation in School-Based Activities
Scale Score
Participation in Individualized
Education Program
Expectations for child’s postsecondary attendance (definitely will vs. probably won’t) –* +*** Satisfaction with child’s school (very satisfied vs. very dissatisfied) –*** Source: NLTS2 Wave 1 parent interviews. Exhibit reads: The frequency of helping with homework for families who expect their children to attend a postsecondary school is lower than for families who do not expect their children to attend a postsecondary school, other factors being equal. + higher; – lower. Blank cell = characteristic not significantly related to family involvement. a Statistics in this exhibit are calculated from models that include all perceptions shown in this table, as well as disability categories (not included in exhibits), functional ability characteristics (results shown in Exhibit 4-1), demographic and school-related characteristics (results shown in Exhibits 4-2 and 4-3), household characteristics (results shown in Exhibit 4-4), demands on and supports for families (results shown in Exhibits 4-5 and 4-6), and family involvement in other types of activities (results shown in Exhibit 4-8). *p<.05; ***p<.001.
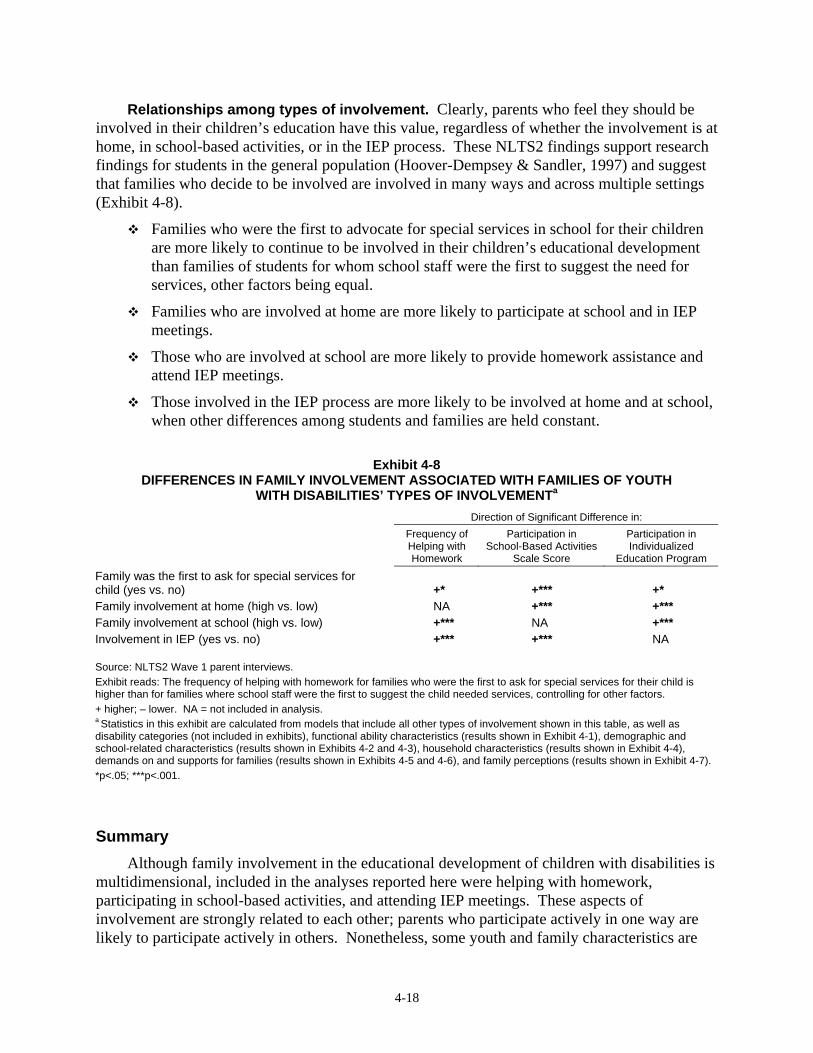
4-18
Relationships among types of involvement. Clearly, parents who feel they should be involved in their children’s education have this value, regardless of whether the involvement is at home, in school-based activities, or in the IEP process. These NLTS2 findings support research findings for students in the general population (Hoover-Dempsey & Sandler, 1997) and suggest that families who decide to be involved are involved in many ways and across multiple settings (Exhibit 4-8).
Families who were the first to advocate for special services in school for their children are more likely to continue to be involved in their children’s educational development than families of students for whom school staff were the first to suggest the need for services, other factors being equal.
Families who are involved at home are more likely to participate at school and in IEP meetings.
Those who are involved at school are more likely to provide homework assistance and attend IEP meetings.
Those involved in the IEP process are more likely to be involved at home and at school, when other differences among students and families are held constant.
Exhibit 4-8
DIFFERENCES IN FAMILY INVOLVEMENT ASSOCIATED WITH FAMILIES OF YOUTH WITH DISABILITIES’ TYPES OF INVOLVEMENTa
Direction of Significant Difference in:
Frequency of Helping with Homework
Participation in School-Based Activities
Scale Score
Participation in Individualized
Education Program
Family was the first to ask for special services for child (yes vs. no) +* +*** +* Family involvement at home (high vs. low) NA +*** +*** Family involvement at school (high vs. low) +*** NA +*** Involvement in IEP (yes vs. no) +*** +*** NA Source: NLTS2 Wave 1 parent interviews. Exhibit reads: The frequency of helping with homework for families who were the first to ask for special services for their child is higher than for families where school staff were the first to suggest the child needed services, controlling for other factors. + higher; – lower. NA = not included in analysis. a Statistics in this exhibit are calculated from models that include all other types of involvement shown in this table, as well as disability categories (not included in exhibits), functional ability characteristics (results shown in Exhibit 4-1), demographic and school-related characteristics (results shown in Exhibits 4-2 and 4-3), household characteristics (results shown in Exhibit 4-4), demands on and supports for families (results shown in Exhibits 4-5 and 4-6), and family perceptions (results shown in Exhibit 4-7). *p<.05; ***p<.001.
Summary Although family involvement in the educational development of children with disabilities is
multidimensional, included in the analyses reported here were helping with homework, participating in school-based activities, and attending IEP meetings. These aspects of involvement are strongly related to each other; parents who participate actively in one way are likely to participate actively in others. Nonetheless, some youth and family characteristics are
4-19
related to variations in levels of these forms of family involvement in the same way, whereas other factors relate differently, as summarized below.
Supporting the notion that students are important participants in parent-child dynamics, several characteristics of students with disabilities are related to the participation of their families in their educational development, when controlling for other differences.
Families of those experiencing problems in more domains and having lower functional cognitive skills are more likely to help with homework than families of students with fewer impairments.
Negative youth behavior is related to lower levels of family involvement at school and at home.
Involvement in home- and school-based activities is lower among families of older students with disabilities.
Parents of daughters in secondary school are more likely than parents of sons to help with homework and to be involved at school.
Neither age nor gender is related to parent participation in the IEP process.
Families of Hispanic students are less likely than families of white students to be involved in home-based education-related activities.
African-American students have families who are more likely to be involved at home than their white peers but less likely to be involved at school and to attend IEP meetings.
Students who attend their neighborhood schools are more likely to have families who participate at the school and attend IEP meetings than are those who attend schools not located in their local area.
Families of students who are actively involved in extracurricular activities at school are more likely to participate in school-based activities.
In addition to the relationships between family involvement and student characteristics, levels of involvement also relate to characteristics of families themselves.
Having more family resources—higher incomes or higher levels of parental educational attainment—is associated with higher levels of involvement of all kinds.
Families with two parents in the household are more likely than single-parent families to be involved at home and at school.
Having external supports is related to more frequent family participation. Those who belong to support groups for families of children with disabilities and those who participate in OSEP-supported or other types of training are more likely to support their children’s educational development.
Families with higher expectations for their children’s postsecondary educational attainment are less likely to help with homework but more likely to be involved at school than families of youth with disabilities who are less optimistic for their children’s continued education.
4-20
The more satisfied families are with their children’s schools, the less likely they are to spend time on homework support.
Families of students who receive special education services often deal with issues unique to parenting these students, including participation in the IEP process. However, the relationship between their characteristics and their levels of involvement mirror those of other families in many ways. Variations in levels of participation associated with differences in youth’s cognitive abilities, behavior, age, gender, race/ethnicity, family income, mother’s educational attainment, number of parents and siblings in the household, and level of social support for families of students with disabilities parallel those of families of students in the general population.
This chapter has examined the relationships between student and family characteristics and levels of family involvement in activities at home and at school that support students’ learning. Family expectations regarding their children’s future achievements have been identified as a factor that is associated with students’ academic success. Chapter 5 provides greater detail regarding parents’ expectations for their children’s educational attainment and independence.

5-1
5. LOOKING TO THE FUTURE: FAMILY EXPECTATIONS
Research has demonstrated that having clear, consistent, and high expectations for students’ learning and academic performance plays a key role in student achievement (Goldenberg, Gallimore, Reese, & Garnier, 2001; Muller & Kerbow, 1993; Newman & Cameto, 1993; Phillips, 1992; Thorkildsen & Stein, 1998). Thus, encouraging parents to hold such expectations is a key message of many parenting education and parent involvement programs (e.g., North Central Regional Educational Laboratory, 2002). Such expectations are no less important for youth with disabilities than for other students, but finding the appropriate balance between high expectations for achievement and a realistic assessment of aptitude and potential, in light of the child’s disabilities, may be particularly challenging for these parents.
NLTS2 has investigated the expectations of parents of middle- and high-school-age youth with disabilities regarding their adolescent children’s future achievements. Questions about students’ future attainment may be difficult to answer because they ask parents to speculate about events that may not occur for several years. Nonetheless, understanding such expectations is important because they can help shape both students’ attitudes and behaviors toward their schooling and parents’ own actions in support of students’ learning. In fact, parents’ expectations for youth with disabilities have been shown to be powerfully related to the youth’s accomplishments in multiple domains, including postsecondary education and aspects of independence (Wagner, Blackorby, Cameto, & Newman, 1993).
Findings are reported for youth with disabilities as a whole and for those who differ in disability category, age, gender, household income, and race/ethnicity.1 Comparisons also are made between the expectations of youth with disabilities in NLTS2 and those in the original NLTS, for whom data first were collected in 1987.2
Educational Attainment Expectations Parents of youth with disabilities were asked how likely they thought it was that their
adolescent children with disabilities would reach several education milestones (Exhibit 5-1).3 More than half (53%) of youth with disabilities have parents who expect them
“definitely” to graduate from high school with a regular high school diploma. Almost one-third (32%) are expected “probably” to graduate from high school with a
regular diploma. The remaining 15% of youth are not expected to graduate from high school with a
regular diploma.
1 This chapter describes parent expectations for youth with disabilities who were ages 13 through 17 at the time of the parent interview. Findings are weighted estimates of the national population of students receiving special education in the NLTS2 age group, as well as those in each disability category individually. Only differences among groups that reach a level of statistical significance of at least .05 are mentioned in the text. 2 Comparisons between NLTS2 and NLTS involve 15- through 17-year-olds, the age group of youth with disabilities that was common to Wave 1 of both studies. For more findings from this comparison, see Wagner, Cameto, and Newman (2003). 3 Possible responses were “definitely will,” “probably will,” “probably won’t,” and “definitely won’t.”
5-2
The percentage of parents who expect youth “definitely” to graduate from high school with a regular diploma is similar to actual graduation rates for students with disabilities. In the 1999-2000 school year, 57% of students with disabilities ages 14 to 21 who left school did so by graduating with a regular high school diploma (Office of Special Education Programs, 2001). However, the expectation that 85% “definitely” or “probably” will graduate significantly exceeds the actual graduation rate.
Exhibit 5-1 PARENTS’ EXPECTATIONS FOR YOUTH’S FUTURE EDUCATIONAL ATTAINMENT
25.0
53.2
36.8
31.6
38.2
15.2
Attend school after highschool
Graduate from high schoolwith a regular diploma
Percentage of youthDefinitely will Probably will Probably or definitely won't
(1.5)
Source: NLTS2 Wave 1 parent interviews. Standard errors are in parentheses.
(1.6)
(1.6)
(1.4)
Youth expected to:
(1.2)
(1.6)
Parents are far less confident that youth will attend postsecondary school.4 One-fourth are expected “definitely” to continue on to postsecondary school. More than one-third (37%) are expected “probably” to further their educations after high
school. Postsecondary education for youth with disabilities is considered unlikely for more than
one-third of students. Parents are even less confident that youth will graduate from postsecondary school
(Exhibit 5-2). About 14% of youth are expected “definitely” to complete a vocational, technical, or
trade school program. Almost one-third are expected “probably” to finish such a program. Expectations regarding graduation from a 2-year college are similar, with 12% expected
“definitely” and 35% expected “probably” to graduate. Fewer youth are expected to become 4-year-college graduates: 10% are expected
“definitely” to graduate. About one-fourth are expected “probably” to graduate from such an institution.
4 The survey did not specify the basis for these assessed expectations. They can be based on a variety of factors, such as assessment of students’ ability or family’s or student’s capacity to pay college tuition.

5-3
Exhibit 5-2 PARENTS’ EXPECTATIONS FOR YOUTH’S FUTURE POSTSECONDARY SCHOOL COMPLETION
10.1
12.0
13.9
25.9
35.2
31.9
64.1
52.8
54.2
Graduate from a 4-yearcollege
Graduate from a 2-yearcollege
Complete apostsecondary
vocational, technical, ortrade school
Percentage of youth
Definitely will Probably will Probably or definitely won't
(1.5)
(1.6)
Source: NLTS2 Wave 1 parent interviews. Standard errors are in parentheses.
(1.6)(1.1)
(1.1)
Youth expected to:
(1.6)
(1.0) (1.4) (1.6)
Similar to expectations regarding high school graduation, expectations about “definitely” attending a postsecondary program are comparable to actual rates of postsecondary education enrollment. The original NLTS demonstrated that, in 1990, 27% of youth with disabilities who had been out of secondary school 3 to 5 years had been enrolled in some kind of postsecondary institution since leaving high school (Marder, 1992). Enrollment in a 4-year college or university was much less common; 4% had done so in the 3 to 5 years since leaving high school.
Youth with disabilities are much less likely to be expected to attend school after high school than are their peers in the general population. Although parents of 62% of youth with disabilities have some expectation that youth will continue on to postsecondary education, almost 92% of peers in the general population have parents who expect them to continue their education after high school.5
Parents of youth with disabilities also are markedly less positive than other parents about youth’s graduating from a 4-year college; 36% of those with disabilities are expected “definitely” or “probably” to complete a 4-year college program, whereas 88% of their peers in the general population are expected to receive a 4-year college diploma.
Despite lower expectations for youth with disabilities than for those in the general population, parents’ expectations have increased over time regarding some aspects of postsecondary education. Comparisons of parents’ expectations for 15- through 17-year-olds with disabilities in 1987 and 2001 show a 10-percentage-point increase in expectations that youth with disabilities “definitely” will complete a 2-year college program, which is
5 Figures for the general population were calculated from the 1999 National Household Education Survey. Data are for 13- to 17-year-olds.
5-4
accompanied by a 13-percentage-point decline in expectations that youth “definitely” or “probably” will not do so (Wagner, Cameto, et al., 2003). This increase is apparent in spite of parents’ being no more likely to expect youth with disabilities to receive a regular high school diploma than previously. Expectations for other aspects of postsecondary educational attainment also have not changed significantly.
Independence Expectations In addition to their expectations regarding the educational attainment of youth, parents of
youth with disabilities were asked how likely they think it is that youth will achieve several milestones of independence: getting a driver’s license, finding paid employment, being financially self-sufficient, and living independently. Parents differ markedly in their expectations regarding the future independence of their children with disabilities across these dimensions of independence (Exhibit 5-3).
Somewhat more than half of youth with disabilities (55%) who do not already have a driver’s license or learner’s permit are expected “definitely” to get a driver’s license in the future.
Another 30% are thought “probably” to be able to earn driving privileges.
Exhibit 5-3 PARENTS’ EXPECTATIONS FOR YOUTH’S FUTURE DRIVING, EMPLOYMENT,
AND FINANCIAL INDEPENDENCE
46.1
85.5
55.2
37.0
11.8
30.2
16.9
14.6
2.7
Be financially self-supporting
Get a paid job
Get a driver's license
Percentage of youth
Definitely will Probably will Probably or definitely won't
(1.0)
Source: NLTS2 Wave 1 parent interviews. a Youth who have a driver's license are included as "definitely will."b Youth who have had a paid job are included as "definitely will."Standard errors are in parentheses.
(1.6) (1.2)(1.7)
(1.1)
Youth expected to:
(.5)
(1.6) (1.6) (1.2)
a
b
Expectations for paid employment are considerably higher, dramatically exceeding expectations for any other aspect of education or independence.
The large majority of youth with disabilities (86%) are expected “definitely” to be able to get a paid job in the future.
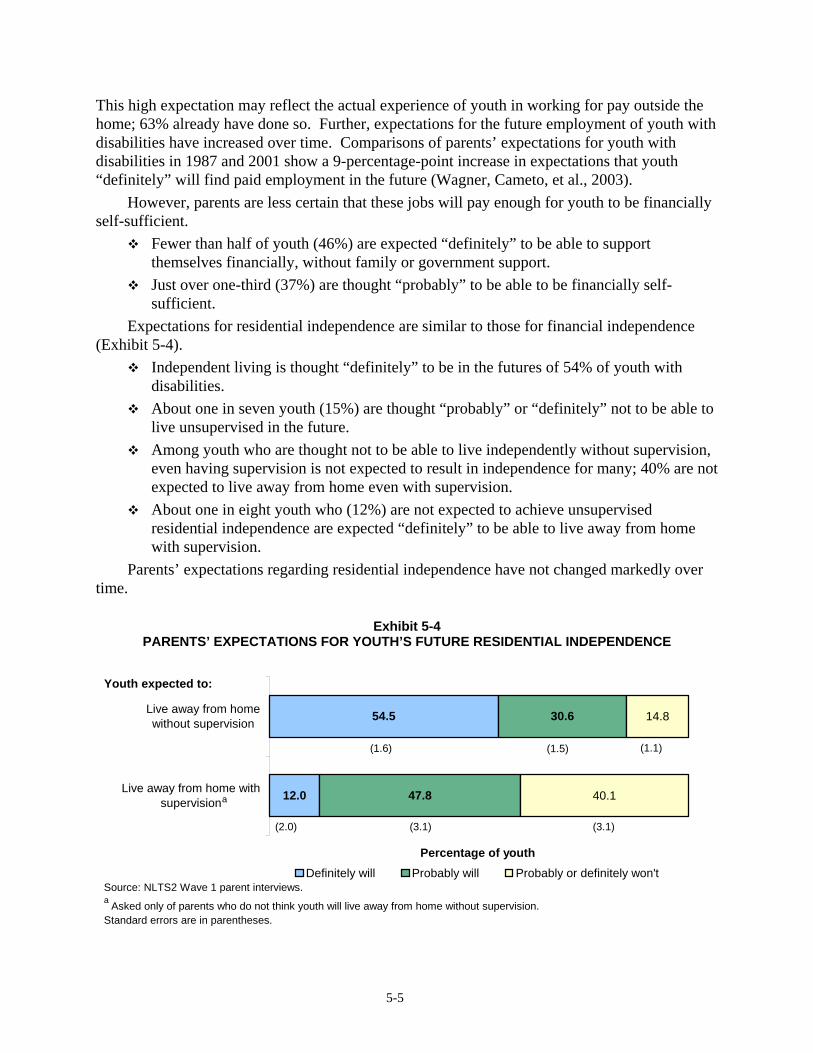
5-5
This high expectation may reflect the actual experience of youth in working for pay outside the home; 63% already have done so. Further, expectations for the future employment of youth with disabilities have increased over time. Comparisons of parents’ expectations for youth with disabilities in 1987 and 2001 show a 9-percentage-point increase in expectations that youth “definitely” will find paid employment in the future (Wagner, Cameto, et al., 2003).
However, parents are less certain that these jobs will pay enough for youth to be financially self-sufficient.
Fewer than half of youth (46%) are expected “definitely” to be able to support themselves financially, without family or government support.
Just over one-third (37%) are thought “probably” to be able to be financially self-sufficient.
Expectations for residential independence are similar to those for financial independence (Exhibit 5-4).
Independent living is thought “definitely” to be in the futures of 54% of youth with disabilities.
About one in seven youth (15%) are thought “probably” or “definitely” not to be able to live unsupervised in the future.
Among youth who are thought not to be able to live independently without supervision, even having supervision is not expected to result in independence for many; 40% are not expected to live away from home even with supervision.
About one in eight youth who (12%) are not expected to achieve unsupervised residential independence are expected “definitely” to be able to live away from home with supervision.
Parents’ expectations regarding residential independence have not changed markedly over time.
Exhibit 5-4 PARENTS’ EXPECTATIONS FOR YOUTH’S FUTURE RESIDENTIAL INDEPENDENCE
12.0
54.5
47.8
30.6
40.1
14.8
Live away from home withsupervision
Live away from homewithout supervision
Percentage of youthDefinitely will Probably will Probably or definitely won't
Source: NLTS2 Wave 1 parent interviews. a Asked only of parents who do not think youth will live away from home without supervision.Standard errors are in parentheses.
Youth expected to:
(1.5)(1.6) (1.1)
(3.1)(2.0) (3.1)
a
5-6
Disability Differences in Family Expectations There are notable differences in expectations regarding the future educational attainment
and independence of youth in different disability categories.
Educational Attainment Parents of students with learning disabilities or with speech/language, hearing, or visual
impairments hold higher expectations for their children’s graduation from high school than do parents of students in other disability categories.
Approximately two-thirds of youth with visual, hearing, or speech impairments are expected “definitely” to graduate from high school with a regular diploma, as are 60% of those with learning disabilities (Exhibit 5-5).
These youth also have among the highest actual rates of graduating from high school with a regular diploma (e.g., 62% and 66% of students with learning disabilities or speech/language impairments, respectively; OSEP, 2001).
Expectations for postsecondary education enrollment also are relatively high for youth with speech/language or hearing and visual impairments (42%, 45%, and 45% respectively, expected “definitely” to pursue postsecondary education); however, students with learning disabilities are not expected to do so with the same frequency (28%, p<.001).
In fact, earlier research has shown that between 30% and 60% of youth in these categories had enrolled in postsecondary education 3 to 5 years after high school (Marder, 1992), with youth with learning disabilities having the lowest rate among these groups.
Youth with speech/language, hearing, or visual impairments are the most frequently expected to graduate from a 2-year college (20%, 23%, and 20%, respectively, “definitely will”) or a 4-year college (23%, 20%, and 25%, respectively, “definitely will”).
Previous postsecondary enrollment rates 3 to 5 years after secondary school for these categories of youth ranged from 9% to 13% (Marder, 1992).
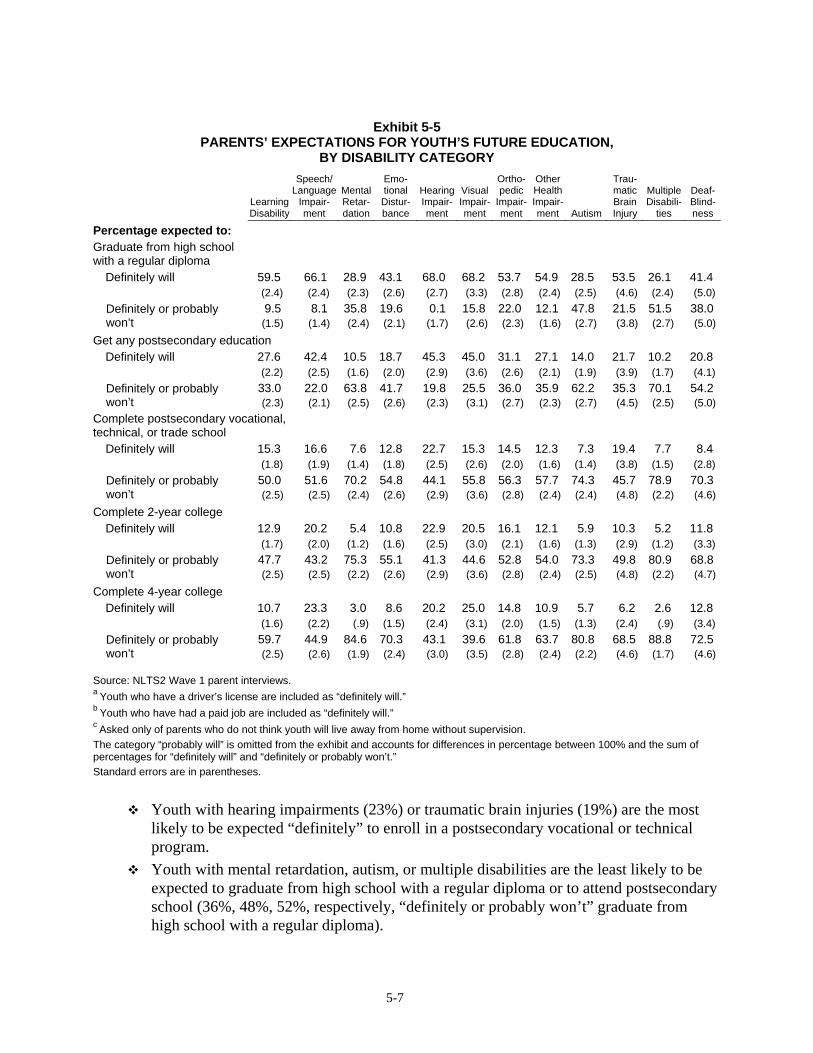
5-7
Exhibit 5-5
PARENTS’ EXPECTATIONS FOR YOUTH’S FUTURE EDUCATION, BY DISABILITY CATEGORY
Learning Disability
Speech/ Language
Impair-ment
Mental Retar-dation
Emo-tional Distur-bance
Hearing Impair-ment
Visual Impair-ment
Ortho-pedic
Impair-ment
Other Health Impair-ment Autism
Trau-matic Brain Injury
Multiple Disabili-
ties
Deaf-Blind-ness
Percentage expected to: Graduate from high school with a regular diploma
Definitely will 59.5 66.1 28.9 43.1 68.0 68.2 53.7 54.9 28.5 53.5 26.1 41.4 (2.4) (2.4) (2.3) (2.6) (2.7) (3.3) (2.8) (2.4) (2.5) (4.6) (2.4) (5.0)
9.5 8.1 35.8 19.6 0.1 15.8 22.0 12.1 47.8 21.5 51.5 38.0 Definitely or probably won’t (1.5) (1.4) (2.4) (2.1) (1.7) (2.6) (2.3) (1.6) (2.7) (3.8) (2.7) (5.0)
Get any postsecondary education Definitely will 27.6 42.4 10.5 18.7 45.3 45.0 31.1 27.1 14.0 21.7 10.2 20.8 (2.2) (2.5) (1.6) (2.0) (2.9) (3.6) (2.6) (2.1) (1.9) (3.9) (1.7) (4.1)
33.0 22.0 63.8 41.7 19.8 25.5 36.0 35.9 62.2 35.3 70.1 54.2 Definitely or probably won’t (2.3) (2.1) (2.5) (2.6) (2.3) (3.1) (2.7) (2.3) (2.7) (4.5) (2.5) (5.0)
Complete postsecondary vocational, technical, or trade school
Definitely will 15.3 16.6 7.6 12.8 22.7 15.3 14.5 12.3 7.3 19.4 7.7 8.4 (1.8) (1.9) (1.4) (1.8) (2.5) (2.6) (2.0) (1.6) (1.4) (3.8) (1.5) (2.8)
50.0 51.6 70.2 54.8 44.1 55.8 56.3 57.7 74.3 45.7 78.9 70.3 Definitely or probably won’t (2.5) (2.5) (2.4) (2.6) (2.9) (3.6) (2.8) (2.4) (2.4) (4.8) (2.2) (4.6)
Complete 2-year college Definitely will 12.9 20.2 5.4 10.8 22.9 20.5 16.1 12.1 5.9 10.3 5.2 11.8 (1.7) (2.0) (1.2) (1.6) (2.5) (3.0) (2.1) (1.6) (1.3) (2.9) (1.2) (3.3)
47.7 43.2 75.3 55.1 41.3 44.6 52.8 54.0 73.3 49.8 80.9 68.8 Definitely or probably won’t (2.5) (2.5) (2.2) (2.6) (2.9) (3.6) (2.8) (2.4) (2.5) (4.8) (2.2) (4.7)
Complete 4-year college Definitely will 10.7 23.3 3.0 8.6 20.2 25.0 14.8 10.9 5.7 6.2 2.6 12.8 (1.6) (2.2) (.9) (1.5) (2.4) (3.1) (2.0) (1.5) (1.3) (2.4) (.9) (3.4)
59.7 44.9 84.6 70.3 43.1 39.6 61.8 63.7 80.8 68.5 88.8 72.5 Definitely or probably won’t (2.5) (2.6) (1.9) (2.4) (3.0) (3.5) (2.8) (2.4) (2.2) (4.6) (1.7) (4.6)
Source: NLTS2 Wave 1 parent interviews. a Youth who have a driver’s license are included as “definitely will.” b Youth who have had a paid job are included as “definitely will.” c Asked only of parents who do not think youth will live away from home without supervision.
The category “probably will” is omitted from the exhibit and accounts for differences in percentage between 100% and the sum of percentages for “definitely will” and “definitely or probably won’t.” Standard errors are in parentheses.
Youth with hearing impairments (23%) or traumatic brain injuries (19%) are the most likely to be expected “definitely” to enroll in a postsecondary vocational or technical program.
Youth with mental retardation, autism, or multiple disabilities are the least likely to be expected to graduate from high school with a regular diploma or to attend postsecondary school (36%, 48%, 52%, respectively, “definitely or probably won’t” graduate from high school with a regular diploma).
5-8
In actuality, even more youth in these categories do not receive regular high school diplomas (e.g., 60% of those with mental retardation; OSEP, 2001).
From 62% to 70% of youth with mental retardation, autism, or multiple disabilities are not expected to pursue education after high school, and even higher percentages are thought unlikely to graduate from technical, 2-year, or 4-year postsecondary schools.
Independence Expectations for the future independence of youth with disabilities also differ widely across
disability categories (Exhibit 5-6). On all dimensions of independence, youth with learning disabilities or speech
impairments are the most likely to be expected “definitely” to attain independence milestones.
More than 60% of those with learning disabilities or speech impairments are expected “definitely” to earn a driver’s license, and 92% and 87%, respectively, are expected to find paid employment in the future.
Youth with learning disabilities or speech impairments also are among those categories most likely to have a driver’s license or learner’s permit and paid employment.
High employment expectations also are apparent for youth with other health or hearing impairments or emotional disturbances.
Seven out of eight (87%) of those with other health impairments, 83% of those with emotional disturbances, and 82% of those with hearing impairments are expected “definitely” to be employed.
Despite high employment expectations, students with other health or hearing impairments or emotional disturbances are less likely to be expected to support themselves (44%, 45%, and 39%, respectively) than are those with learning disabilities (53%; p<.05 for comparison with other health and hearing impairments, and p<.001 for emotional disturbances) or those with speech impairments (58%; p<.001 for all three comparisons).
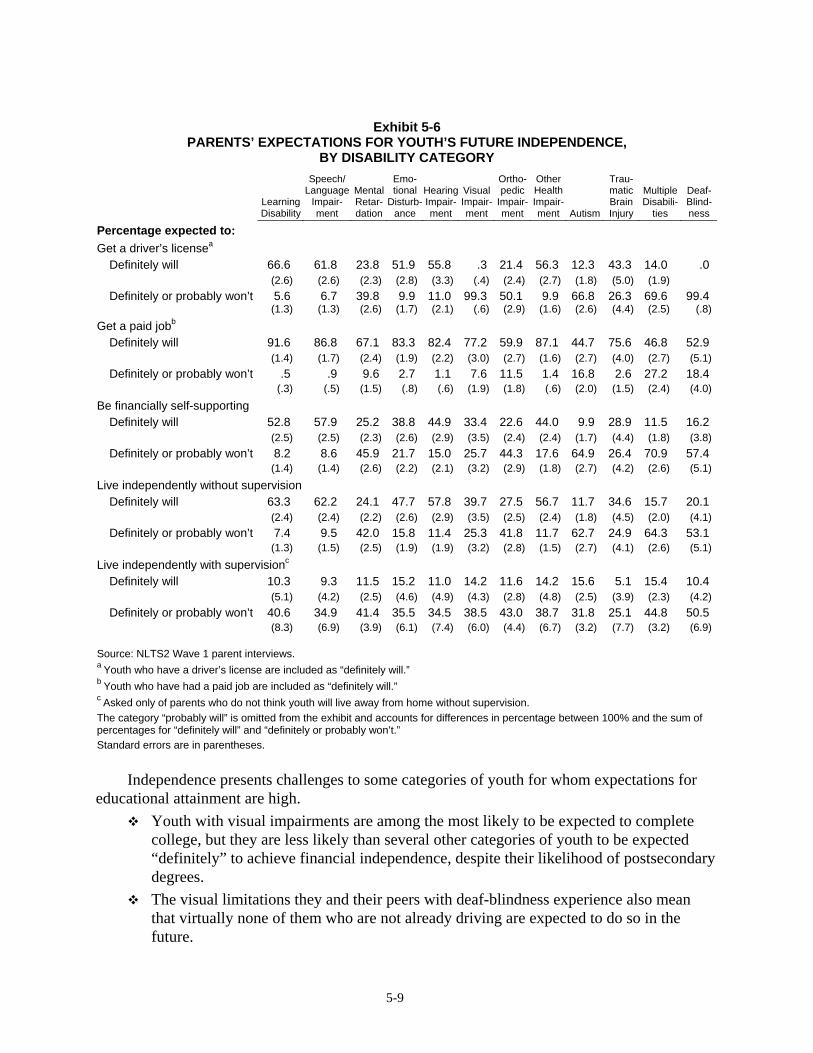
5-9
Exhibit 5-6
PARENTS’ EXPECTATIONS FOR YOUTH’S FUTURE INDEPENDENCE, BY DISABILITY CATEGORY
Learning Disability
Speech/ Language
Impair-ment
Mental Retar-dation
Emo-tional
Disturb-ance
Hearing Impair-ment
Visual Impair-ment
Ortho-pedic
Impair-ment
Other Health Impair-ment Autism
Trau-matic Brain Injury
Multiple Disabili-
ties
Deaf-Blind-ness
Percentage expected to: Get a driver’s licensea
Definitely will 66.6 61.8 23.8 51.9 55.8 .3 21.4 56.3 12.3 43.3 14.0 .0 (2.6) (2.6) (2.3) (2.8) (3.3) (.4) (2.4) (2.7) (1.8) (5.0) (1.9) Definitely or probably won’t 5.6 6.7 39.8 9.9 11.0 99.3 50.1 9.9 66.8 26.3 69.6 99.4
(1.3) (1.3) (2.6) (1.7) (2.1) (.6) (2.9) (1.6) (2.6) (4.4) (2.5) (.8)Get a paid jobb
Definitely will 91.6 86.8 67.1 83.3 82.4 77.2 59.9 87.1 44.7 75.6 46.8 52.9 (1.4) (1.7) (2.4) (1.9) (2.2) (3.0) (2.7) (1.6) (2.7) (4.0) (2.7) (5.1)Definitely or probably won’t .5 .9 9.6 2.7 1.1 7.6 11.5 1.4 16.8 2.6 27.2 18.4
(.3) (.5) (1.5) (.8) (.6) (1.9) (1.8) (.6) (2.0) (1.5) (2.4) (4.0)Be financially self-supporting
Definitely will 52.8 57.9 25.2 38.8 44.9 33.4 22.6 44.0 9.9 28.9 11.5 16.2 (2.5) (2.5) (2.3) (2.6) (2.9) (3.5) (2.4) (2.4) (1.7) (4.4) (1.8) (3.8)Definitely or probably won’t 8.2 8.6 45.9 21.7 15.0 25.7 44.3 17.6 64.9 26.4 70.9 57.4
(1.4) (1.4) (2.6) (2.2) (2.1) (3.2) (2.9) (1.8) (2.7) (4.2) (2.6) (5.1)Live independently without supervision
Definitely will 63.3 62.2 24.1 47.7 57.8 39.7 27.5 56.7 11.7 34.6 15.7 20.1 (2.4) (2.4) (2.2) (2.6) (2.9) (3.5) (2.5) (2.4) (1.8) (4.5) (2.0) (4.1)Definitely or probably won’t 7.4 9.5 42.0 15.8 11.4 25.3 41.8 11.7 62.7 24.9 64.3 53.1
(1.3) (1.5) (2.5) (1.9) (1.9) (3.2) (2.8) (1.5) (2.7) (4.1) (2.6) (5.1)Live independently with supervisionc
Definitely will 10.3 9.3 11.5 15.2 11.0 14.2 11.6 14.2 15.6 5.1 15.4 10.4 (5.1) (4.2) (2.5) (4.6) (4.9) (4.3) (2.8) (4.8) (2.5) (3.9) (2.3) (4.2)Definitely or probably won’t 40.6 34.9 41.4 35.5 34.5 38.5 43.0 38.7 31.8 25.1 44.8 50.5
(8.3) (6.9) (3.9) (6.1) (7.4) (6.0) (4.4) (6.7) (3.2) (7.7) (3.2) (6.9) Source: NLTS2 Wave 1 parent interviews. a Youth who have a driver’s license are included as “definitely will.” b Youth who have had a paid job are included as “definitely will.” c Asked only of parents who do not think youth will live away from home without supervision.
The category “probably will” is omitted from the exhibit and accounts for differences in percentage between 100% and the sum of percentages for “definitely will” and “definitely or probably won’t.” Standard errors are in parentheses.
Independence presents challenges to some categories of youth for whom expectations for educational attainment are high.
Youth with visual impairments are among the most likely to be expected to complete college, but they are less likely than several other categories of youth to be expected “definitely” to achieve financial independence, despite their likelihood of postsecondary degrees.
The visual limitations they and their peers with deaf-blindness experience also mean that virtually none of them who are not already driving are expected to do so in the future.
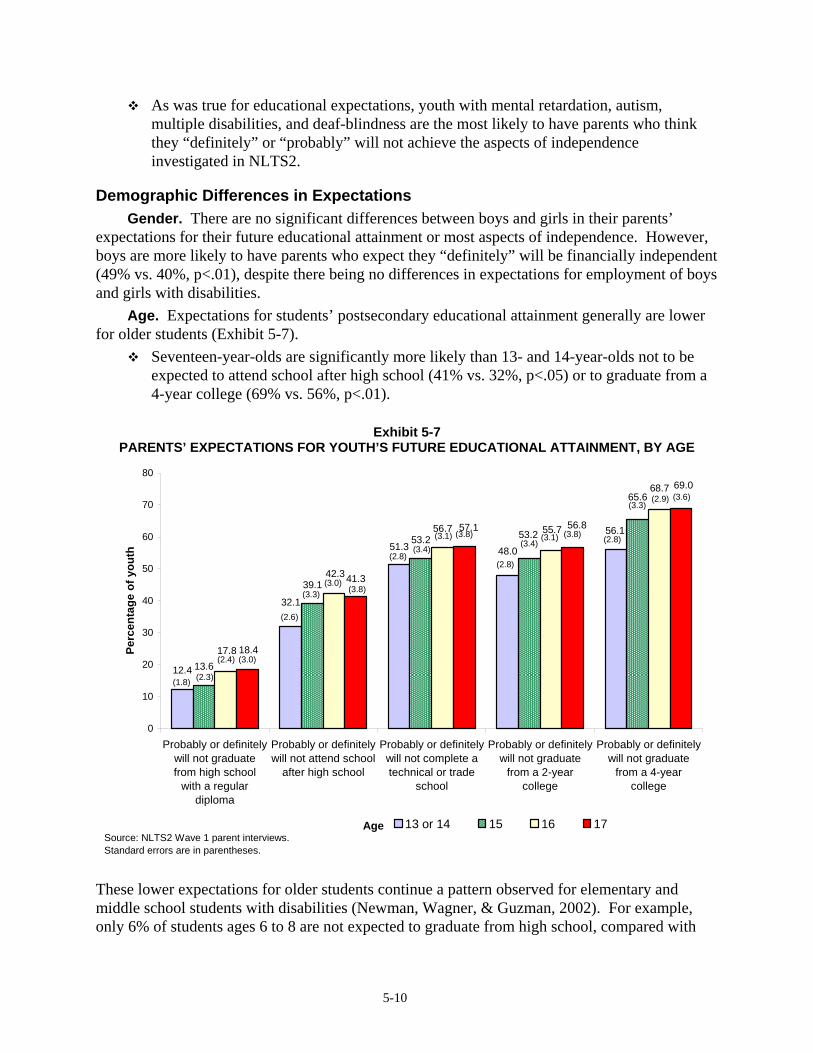
5-10
As was true for educational expectations, youth with mental retardation, autism, multiple disabilities, and deaf-blindness are the most likely to have parents who think they “definitely” or “probably” will not achieve the aspects of independence investigated in NLTS2.
Demographic Differences in Expectations Gender. There are no significant differences between boys and girls in their parents’
expectations for their future educational attainment or most aspects of independence. However, boys are more likely to have parents who expect they “definitely” will be financially independent (49% vs. 40%, p<.01), despite there being no differences in expectations for employment of boys and girls with disabilities.
Age. Expectations for students’ postsecondary educational attainment generally are lower for older students (Exhibit 5-7).
Seventeen-year-olds are significantly more likely than 13- and 14-year-olds not to be expected to attend school after high school (41% vs. 32%, p<.05) or to graduate from a 4-year college (69% vs. 56%, p<.01).
Exhibit 5-7 PARENTS’ EXPECTATIONS FOR YOUTH’S FUTURE EDUCATIONAL ATTAINMENT, BY AGE
56.1
48.051.3
32.1
12.4
65.6
53.253.2
13.6
39.1
68.7
55.756.7
42.3
17.8
69.0
56.857.1
41.3
18.4
0
10
20
30
40
50
60
70
80
Probably or definitelywill not graduatefrom high school
with a regulardiploma
Probably or definitelywill not attend school
after high school
Probably or definitelywill not complete atechnical or trade
school
Probably or definitelywill not graduate
from a 2-yearcollege
Probably or definitelywill not graduate
from a 4-yearcollege
Perc
enta
ge o
f you
th
13 or 14 15 16 17
(1.8) (2.3)
(2.4) (3.0)
Source: NLTS2 Wave 1 parent interviews.Standard errors are in parentheses.
Age
(2.6)
(3.3)(3.0)
(3.8)
(2.8)(3.4)
(3.1) (3.8)
(2.8)
(3.4)(3.1) (3.8) (2.8)
(3.3)(2.9) (3.6)
These lower expectations for older students continue a pattern observed for elementary and middle school students with disabilities (Newman, Wagner, & Guzman, 2002). For example, only 6% of students ages 6 to 8 are not expected to graduate from high school, compared with
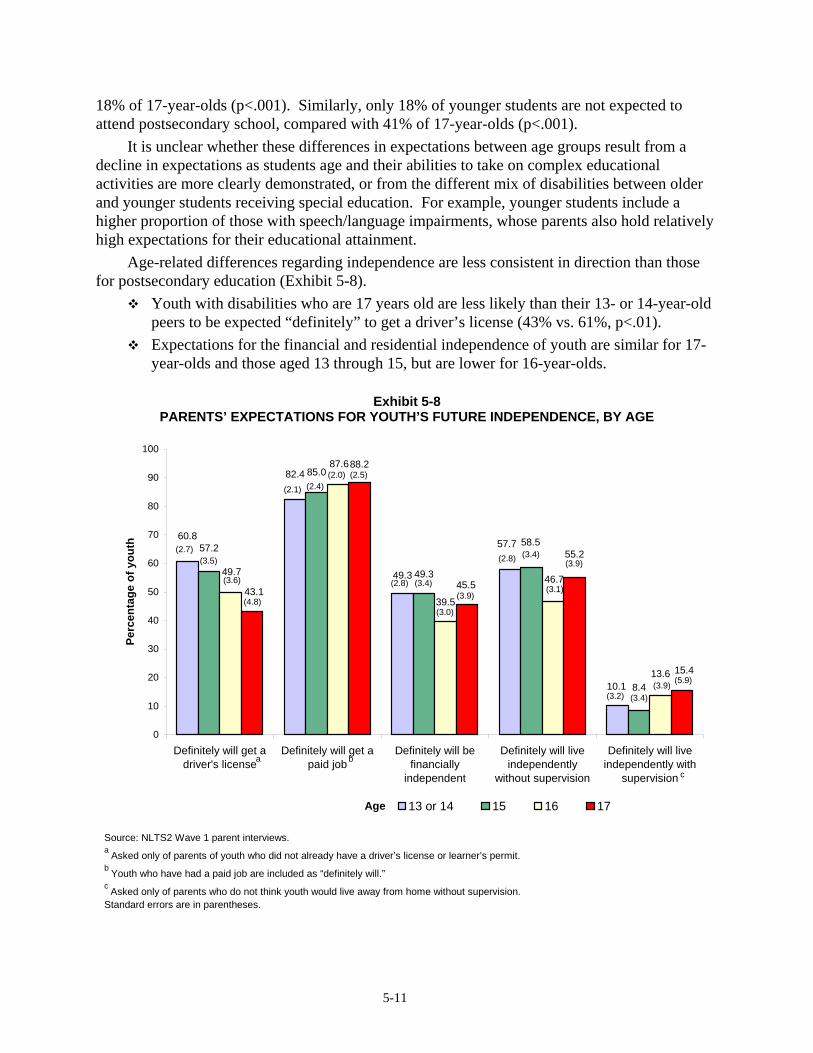
5-11
18% of 17-year-olds (p<.001). Similarly, only 18% of younger students are not expected to attend postsecondary school, compared with 41% of 17-year-olds (p<.001).
It is unclear whether these differences in expectations between age groups result from a decline in expectations as students age and their abilities to take on complex educational activities are more clearly demonstrated, or from the different mix of disabilities between older and younger students receiving special education. For example, younger students include a higher proportion of those with speech/language impairments, whose parents also hold relatively high expectations for their educational attainment.
Age-related differences regarding independence are less consistent in direction than those for postsecondary education (Exhibit 5-8).
Youth with disabilities who are 17 years old are less likely than their 13- or 14-year-old peers to be expected “definitely” to get a driver’s license (43% vs. 61%, p<.01).
Expectations for the financial and residential independence of youth are similar for 17-year-olds and those aged 13 through 15, but are lower for 16-year-olds.
Exhibit 5-8 PARENTS’ EXPECTATIONS FOR YOUTH’S FUTURE INDEPENDENCE, BY AGE
10.1
57.7
49.3
82.4
60.8
8.4
58.5
49.3
57.2
85.0
13.6
46.7
39.5
87.6
49.7
15.4
55.2
45.5
88.2
43.1
0
10
20
30
40
50
60
70
80
90
100
Definitely will get adriver's license
Definitely will get apaid job
Definitely will befinancially
independent
Definitely will liveindependently
without supervision
Definitely will liveindependently with
supervision
Perc
enta
ge o
f you
th
13 or 14 15 16 17
(2.7)(3.5)
(3.6)
(4.8)
Source: NLTS2 Wave 1 parent interviews.a Asked only of parents of youth who did not already have a driver’s license or learner’s permit.b Youth who have had a paid job are included as “definitely will.”c Asked only of parents who do not think youth would live away from home without supervision.Standard errors are in parentheses.
Age
(2.1) (2.4)(2.0) (2.5)
(2.8) (3.4)
(3.0)
(3.9)
(2.8) (3.4)
(3.1)
(3.9)
(3.2) (3.4)(3.9) (5.9)
a b
c

5-12
Youth with disabilities of different ages have parents with similar expectations regarding the likelihood that they will find future paid employment, probably because many older youth already have experience with paid employment. When considering only youth who have never had a paid job, however, older youth are less likely than their younger peers to be “definitely” expected to eventually get paid employment. Not shown in this exhibit is the finding that youth who are 17 years old and have never been employed are less likely to be expected to “definitely” get a paid job (44%) than their 15-year-old (64%, p<.05) and 13- or 14-year-old peers (66%, p<.01).
Household income and race/ethnicity. Parents of youth from lower-income households generally hold lower expectations for their children’s educational attainment than do parents from higher-income households (Exhibit 5-9).
Of youth in households with incomes of $25,000 or less, 41% are expected “definitely” to graduate from high school with a regular diploma, compared with 63% of those in households with incomes of more than $50,000 (p<.001).
One in five (20%) are expected “definitely” to attend postsecondary school, compared with 30% of those in households with incomes of more than $50,000 (p<.001).
Lower expectations for postsecondary education for youth in lower-income households may reflect parents’ acknowledgment of the difficulty of affording college or the generally lower graduation rates in many schools with large proportions of low-income students. However, these income-related differences are not reflected in expectations for graduation from a postsecondary school.
Mirroring income differences, parents’ expectations for graduation from high school with a regular diploma are higher for white youth with disabilities and lower for African-American youth.
More than half (56%) of white students are expected “definitely” to graduate with a regular diploma, compared with 48% of African-American students (p<.05).
Earlier research suggests that their actual rates of graduation do not differ significantly (Wagner et al., 1991).
In contrast, parents of white youth have lower expectations for postsecondary education opportunities than do parents of Hispanic youth.
42% of white youth with disabilities are not expected to attend a postsecondary school, 59% are not expected to graduate from 2-year college, and 71% are not expected to graduate from a 4-year college, compared with 23%, 36%, and 43% of Hispanic students (p<.05, .01, and .001, respectively).
White students also are less likely to be expected to graduate from a 4-year college than are their African-American peers (71% vs. 56% “probably” or “definitely won’t”, p<.001).
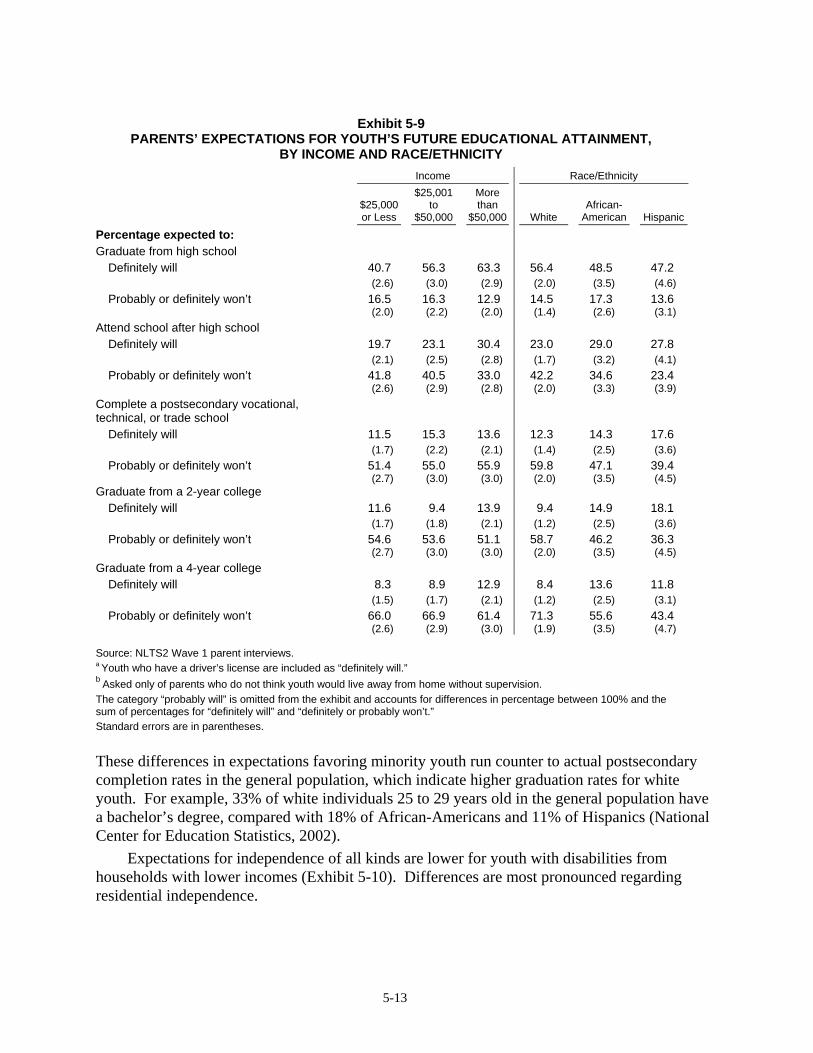
5-13
Exhibit 5-9 PARENTS’ EXPECTATIONS FOR YOUTH’S FUTURE EDUCATIONAL ATTAINMENT,
BY INCOME AND RACE/ETHNICITY Income Race/Ethnicity
$25,000 or Less
$25,001 to
$50,000
More than
$50,000 White African-
American Hispanic
Percentage expected to: Graduate from high school
Definitely will 40.7 56.3 63.3 56.4 48.5 47.2 (2.6) (3.0) (2.9) (2.0) (3.5) (4.6) Probably or definitely won’t 16.5 16.3 12.9 14.5 17.3 13.6
(2.0) (2.2) (2.0) (1.4) (2.6) (3.1) Attend school after high school
Definitely will 19.7 23.1 30.4 23.0 29.0 27.8 (2.1) (2.5) (2.8) (1.7) (3.2) (4.1) Probably or definitely won’t 41.8 40.5 33.0 42.2 34.6 23.4
(2.6) (2.9) (2.8) (2.0) (3.3) (3.9) Complete a postsecondary vocational, technical, or trade school
Definitely will 11.5 15.3 13.6 12.3 14.3 17.6 (1.7) (2.2) (2.1) (1.4) (2.5) (3.6) Probably or definitely won’t 51.4 55.0 55.9 59.8 47.1 39.4
(2.7) (3.0) (3.0) (2.0) (3.5) (4.5) Graduate from a 2-year college
Definitely will 11.6 9.4 13.9 9.4 14.9 18.1 (1.7) (1.8) (2.1) (1.2) (2.5) (3.6) Probably or definitely won’t 54.6 53.6 51.1 58.7 46.2 36.3
(2.7) (3.0) (3.0) (2.0) (3.5) (4.5) Graduate from a 4-year college
Definitely will 8.3 8.9 12.9 8.4 13.6 11.8 (1.5) (1.7) (2.1) (1.2) (2.5) (3.1) Probably or definitely won’t 66.0 66.9 61.4 71.3 55.6 43.4
(2.6) (2.9) (3.0) (1.9) (3.5) (4.7)
Source: NLTS2 Wave 1 parent interviews. a Youth who have a driver’s license are included as “definitely will.” b Asked only of parents who do not think youth would live away from home without supervision. The category “probably will” is omitted from the exhibit and accounts for differences in percentage between 100% and the sum of percentages for “definitely will” and “definitely or probably won’t.” Standard errors are in parentheses.
These differences in expectations favoring minority youth run counter to actual postsecondary completion rates in the general population, which indicate higher graduation rates for white youth. For example, 33% of white individuals 25 to 29 years old in the general population have a bachelor’s degree, compared with 18% of African-Americans and 11% of Hispanics (National Center for Education Statistics, 2002).
Expectations for independence of all kinds are lower for youth with disabilities from households with lower incomes (Exhibit 5-10). Differences are most pronounced regarding residential independence.
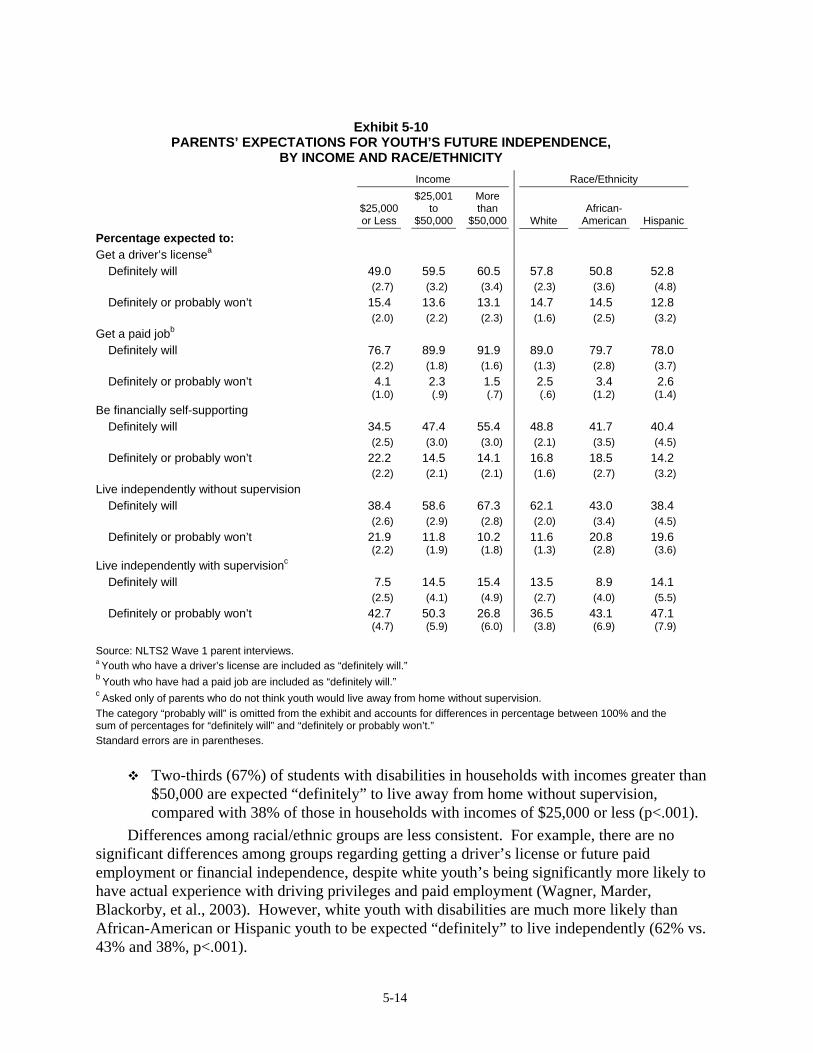
5-14
Exhibit 5-10
PARENTS’ EXPECTATIONS FOR YOUTH’S FUTURE INDEPENDENCE, BY INCOME AND RACE/ETHNICITY
Income Race/Ethnicity
$25,000 or Less
$25,001 to
$50,000
More than
$50,000 White African-
American Hispanic
Percentage expected to: Get a driver’s licensea
Definitely will 49.0 59.5 60.5 57.8 50.8 52.8 (2.7) (3.2) (3.4) (2.3) (3.6) (4.8) Definitely or probably won’t 15.4 13.6 13.1 14.7 14.5 12.8 (2.0) (2.2) (2.3) (1.6) (2.5) (3.2)
Get a paid jobb Definitely will 76.7 89.9 91.9 89.0 79.7 78.0 (2.2) (1.8) (1.6) (1.3) (2.8) (3.7) Definitely or probably won’t 4.1 2.3 1.5 2.5 3.4 2.6
(1.0) (.9) (.7) (.6) (1.2) (1.4) Be financially self-supporting
Definitely will 34.5 47.4 55.4 48.8 41.7 40.4 (2.5) (3.0) (3.0) (2.1) (3.5) (4.5) Definitely or probably won’t 22.2 14.5 14.1 16.8 18.5 14.2 (2.2) (2.1) (2.1) (1.6) (2.7) (3.2)
Live independently without supervision Definitely will 38.4 58.6 67.3 62.1 43.0 38.4 (2.6) (2.9) (2.8) (2.0) (3.4) (4.5) Definitely or probably won’t 21.9 11.8 10.2 11.6 20.8 19.6
(2.2) (1.9) (1.8) (1.3) (2.8) (3.6) Live independently with supervisionc
Definitely will 7.5 14.5 15.4 13.5 8.9 14.1 (2.5) (4.1) (4.9) (2.7) (4.0) (5.5) Definitely or probably won’t 42.7 50.3 26.8 36.5 43.1 47.1
(4.7) (5.9) (6.0) (3.8) (6.9) (7.9)
Source: NLTS2 Wave 1 parent interviews. a Youth who have a driver’s license are included as “definitely will.”
b Youth who have had a paid job are included as “definitely will.” c Asked only of parents who do not think youth would live away from home without supervision.
The category “probably will” is omitted from the exhibit and accounts for differences in percentage between 100% and the sum of percentages for “definitely will” and “definitely or probably won’t.” Standard errors are in parentheses.
Two-thirds (67%) of students with disabilities in households with incomes greater than $50,000 are expected “definitely” to live away from home without supervision, compared with 38% of those in households with incomes of $25,000 or less (p<.001).
Differences among racial/ethnic groups are less consistent. For example, there are no significant differences among groups regarding getting a driver’s license or future paid employment or financial independence, despite white youth’s being significantly more likely to have actual experience with driving privileges and paid employment (Wagner, Marder, Blackorby, et al., 2003). However, white youth with disabilities are much more likely than African-American or Hispanic youth to be expected “definitely” to live independently (62% vs. 43% and 38%, p<.001).
5-15
Summary A majority of youth with disabilities, but not all, have parents who expect them to
experience future success in many aspects of education and independence. Their parents expect that 85% or more “definitely” or “probably” will graduate from high
school with a regular diploma and live independently. Although virtually all youth are expected to be able to find paid employment, fewer than
two-thirds are expected to further their education after high school. More than four out of five youth are expected to achieve financial independence. Expectations regarding completing a 2-year college program and finding paid employment
have increased for youth with disabilities since 1987, yet expectations for educational attainment lag behind those of youth in the general population.
Parents of about 15% of youth with disabilities do not expect them to receive a regular high school diploma or to live independently; nearly two out of five are not expected to pursue postsecondary education. As with most aspects of youth’s experiences, these expectations are not shared equally by
all youth with disabilities. Lower expectations are particularly common for youth with mental retardation, autism,
multiple disabilities, and, to a somewhat lesser extent, deaf-blindness. Expectations also generally are lower for youth with disabilities from lower-income
households. The longitudinal design of NLTS2 permits the monitoring of the progress of youth with
disabilities in their future pursuits and an assessment of the extent to which the expectations of their parents are borne out.
This chapter has examined the expectations for their children’s future achievements of parents of secondary-school-age youth with disabilities. Chapter 6 describes the relationships of parental expectations and family involvement to student outcomes.

6-1
6. RELATIONSHIP OF FAMILY INVOLVEMENT TO STUDENT OUTCOMES
Families’ support for their children’s education is a significant contributor to a range of positive s outcomes for students in the general population (Fan & Chen, 2001; Henderson & Berla, 1994; Henderson & Mapp, 2002; Jeynes, 2003). Students have benefited in multiple domains, including improvements in their academic self-confidence, attendance, homework completion, school behavior, academic performance, high school completion rates, and rates of postsecondary education enrollment (e.g., Eccles et al., 1988; Finn, 1998; Hoover-Dempsey et al., 2001; Keith et al., 1998; Thorkildsen & Stein, 1998).
Earlier chapters in this report focused on the extent to which families of students with disabilities are involved in their children’s educational development. Although it is important to know the degree to which families participate and the relationships of student and family characteristics to levels of involvement, particularly for schools and programs focusing on supporting these types of activities, the bottom line is whether family involvement makes a difference in children’s lives.
This chapter examines the relationships between levels of family involvement and student outcomes for students with disabilities.1 It brings to bear information from previous NLTS2 analyses of student outcomes that span multiple domains, including school engagement, academic performance, social adjustment, and independence.2 Multivariate analysis techniques (i.e., linear and logistic regression) were used to identify the independent relationships of various factors to these outcomes. Such analyses estimate the magnitude and direction of relationships for numerous explanatory factors, statistically holding constant other factors in the analysis.
This chapter comprises a discussion of the relationships of three aspects of family support—involvement at home, involvement at school, and family expectations—to differences in student outcomes across multiple domains. The chapter begins with a description of the independent variables included in multivariate analyses of student outcomes. It continues with a description of the relationships of family involvement with student outcomes in four domains:
School engagement
Academic performance
Social adjustment
Independence achievements.
Independent Variables Included in Multivariate Analyses Many of the factors associated with both family involvement and student outcomes are
interrelated. For example, as described in Chapter 4, multiple student and family characteristics, such as students’ having limitations in a greater number of functional domains, are associated with variations in levels of family involvement. Student outcomes also are related to multiple 1 This chapter describes the relationships of family involvement to student outcomes for youth with disabilities who were ages 13 through 17 at the time of the parent interview. 2 These analyses are presented in The Achievements of Youth with Disabilities During Secondary School (Wagner, Cadwallader, & Marder, 2003).

6-2
student and family factors. For example, having more functional limitations is associated with being significantly more behind in reading and being less independent at home (Wagner, Marder, Blackorby, et al., 2003). For this chapter, a multivariate approach is used to hold other factors constant in an effort to disentangle complex relationships and identify the independent relationships between family support and student outcomes.
In exploring the relationships between family involvement and student achievements, multiple youth and family factors have been included in the multivariate analyses, including aspects of students’ disability and functioning, their individual and household characteristics, their experiences related to school programs and performance, as well as three family involvement variables: involvement at home and at school, and family expectations (Exhibit 6-1). The family involvement variables are briefly described here; definitions of the other variables are presented in Appendix D.
As noted in Chapter 2, family involvement in education at home is assessed on a 4-point scale, which is the frequency with which parents report helping youth with homework and talking with youth. Summing responses to these items produces a scale that ranges from 0 to 8; the mean scale score 6.8.
Family involvement at school, as described in Chapter 3, is assessed with a scale constructed by summing parents’ reports (on a 4-point scale) of the frequency with which they did the following in the 2001-02 school year: “attend a general school meeting, for example, back to school night or meeting of a parent-teacher organization”; “attend a school or class event, such as a play, sports event, or science fair”; or “volunteer at school, for example, chaperoning a class field trip, or serving on a committee.” The scale ranges from 0 to 12; the mean scale score is 3.3.
Parents’ expectations that their adolescent children with disabilities will “attend school after high school” or “live away from home on his/her own without supervision” are reported on a 4-point scale: “definitely will,” “probably will,” “probably won’t,” and “definitely won’t.” These two items are used separately in the analyses (i.e., they are not summed). As noted in Chapter 5, expectations for youth are generally high. Overall, 62% of youth are expected “definitely” or “probably” to attend postsecondary school, and 85% are expected to live independently.
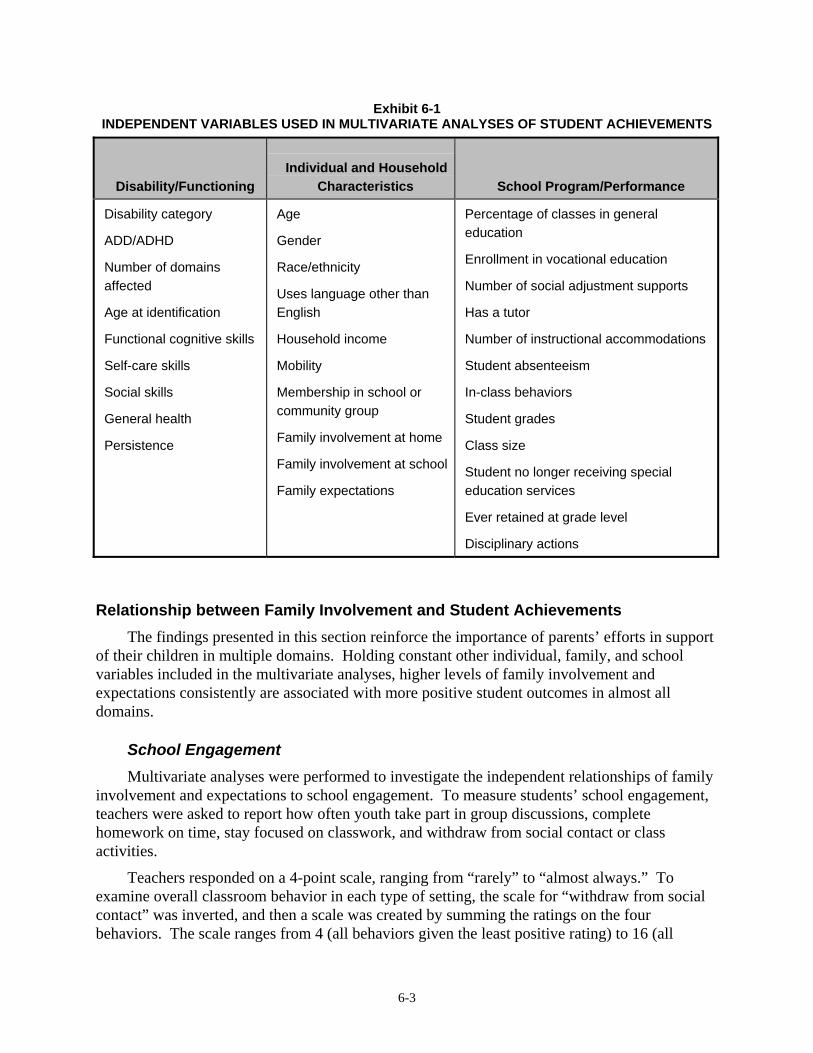
6-3
Exhibit 6-1 INDEPENDENT VARIABLES USED IN MULTIVARIATE ANALYSES OF STUDENT ACHIEVEMENTS
Disability/Functioning Individual and Household
Characteristics School Program/Performance
Disability category
ADD/ADHD
Number of domains affected
Age at identification
Functional cognitive skills
Self-care skills
Social skills
General health
Persistence
Age
Gender
Race/ethnicity
Uses language other than English
Household income
Mobility
Membership in school or community group
Family involvement at home
Family involvement at school
Family expectations
Percentage of classes in general education
Enrollment in vocational education
Number of social adjustment supports
Has a tutor
Number of instructional accommodations
Student absenteeism
In-class behaviors
Student grades
Class size
Student no longer receiving special education services
Ever retained at grade level
Disciplinary actions
Relationship between Family Involvement and Student Achievements The findings presented in this section reinforce the importance of parents’ efforts in support
of their children in multiple domains. Holding constant other individual, family, and school variables included in the multivariate analyses, higher levels of family involvement and expectations consistently are associated with more positive student outcomes in almost all domains.
School Engagement Multivariate analyses were performed to investigate the independent relationships of family
involvement and expectations to school engagement. To measure students’ school engagement, teachers were asked to report how often youth take part in group discussions, complete homework on time, stay focused on classwork, and withdraw from social contact or class activities.
Teachers responded on a 4-point scale, ranging from “rarely” to “almost always.” To examine overall classroom behavior in each type of setting, the scale for “withdraw from social contact” was inverted, and then a scale was created by summing the ratings on the four behaviors. The scale ranges from 4 (all behaviors given the least positive rating) to 16 (all
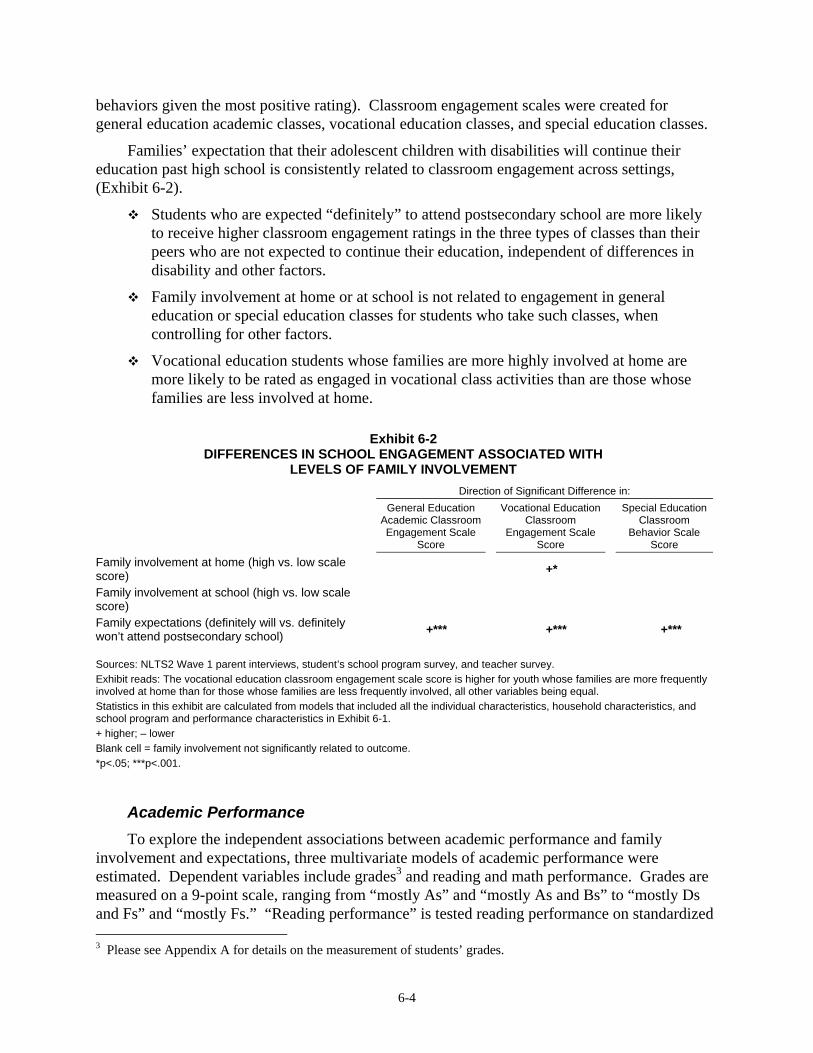
6-4
behaviors given the most positive rating). Classroom engagement scales were created for general education academic classes, vocational education classes, and special education classes.
Families’ expectation that their adolescent children with disabilities will continue their education past high school is consistently related to classroom engagement across settings, (Exhibit 6-2).
Students who are expected “definitely” to attend postsecondary school are more likely to receive higher classroom engagement ratings in the three types of classes than their peers who are not expected to continue their education, independent of differences in disability and other factors.
Family involvement at home or at school is not related to engagement in general education or special education classes for students who take such classes, when controlling for other factors.
Vocational education students whose families are more highly involved at home are more likely to be rated as engaged in vocational class activities than are those whose families are less involved at home.
Exhibit 6-2 DIFFERENCES IN SCHOOL ENGAGEMENT ASSOCIATED WITH
LEVELS OF FAMILY INVOLVEMENT Direction of Significant Difference in:
General Education Academic Classroom Engagement Scale
Score
Vocational Education Classroom
Engagement Scale Score
Special Education Classroom
Behavior Scale Score
Family involvement at home (high vs. low scale score) +*
Family involvement at school (high vs. low scale score)
Family expectations (definitely will vs. definitely won’t attend postsecondary school) +*** +*** +*** Sources: NLTS2 Wave 1 parent interviews, student’s school program survey, and teacher survey. Exhibit reads: The vocational education classroom engagement scale score is higher for youth whose families are more frequently involved at home than for those whose families are less frequently involved, all other variables being equal. Statistics in this exhibit are calculated from models that included all the individual characteristics, household characteristics, and school program and performance characteristics in Exhibit 6-1. + higher; – lower Blank cell = family involvement not significantly related to outcome. *p<.05; ***p<.001.
Academic Performance To explore the independent associations between academic performance and family
involvement and expectations, three multivariate models of academic performance were estimated. Dependent variables include grades3 and reading and math performance. Grades are measured on a 9-point scale, ranging from “mostly As” and “mostly As and Bs” to “mostly Ds and Fs” and “mostly Fs.” “Reading performance” is tested reading performance on standardized 3 Please see Appendix A for details on the measurement of students’ grades.
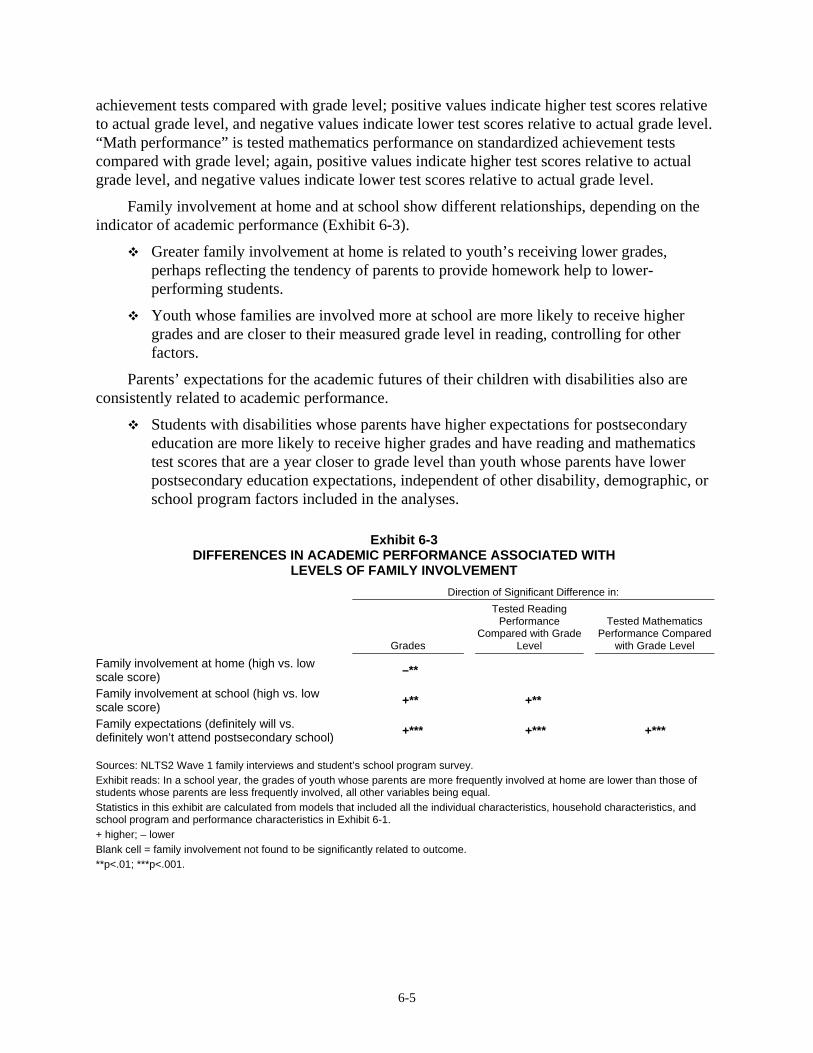
6-5
achievement tests compared with grade level; positive values indicate higher test scores relative to actual grade level, and negative values indicate lower test scores relative to actual grade level. “Math performance” is tested mathematics performance on standardized achievement tests compared with grade level; again, positive values indicate higher test scores relative to actual grade level, and negative values indicate lower test scores relative to actual grade level.
Family involvement at home and at school show different relationships, depending on the indicator of academic performance (Exhibit 6-3).
Greater family involvement at home is related to youth’s receiving lower grades, perhaps reflecting the tendency of parents to provide homework help to lower-performing students.
Youth whose families are involved more at school are more likely to receive higher grades and are closer to their measured grade level in reading, controlling for other factors.
Parents’ expectations for the academic futures of their children with disabilities also are consistently related to academic performance.
Students with disabilities whose parents have higher expectations for postsecondary education are more likely to receive higher grades and have reading and mathematics test scores that are a year closer to grade level than youth whose parents have lower postsecondary education expectations, independent of other disability, demographic, or school program factors included in the analyses.
Exhibit 6-3 DIFFERENCES IN ACADEMIC PERFORMANCE ASSOCIATED WITH
LEVELS OF FAMILY INVOLVEMENT Direction of Significant Difference in:
Grades
Tested Reading Performance
Compared with Grade Level
Tested Mathematics Performance Compared
with Grade Level
Family involvement at home (high vs. low scale score) –**
Family involvement at school (high vs. low scale score) +** +**
Family expectations (definitely will vs. definitely won’t attend postsecondary school) +*** +*** +*** Sources: NLTS2 Wave 1 family interviews and student’s school program survey. Exhibit reads: In a school year, the grades of youth whose parents are more frequently involved at home are lower than those of students whose parents are less frequently involved, all other variables being equal. Statistics in this exhibit are calculated from models that included all the individual characteristics, household characteristics, and school program and performance characteristics in Exhibit 6-1. + higher; – lower Blank cell = family involvement not found to be significantly related to outcome. **p<.01; ***p<.001.
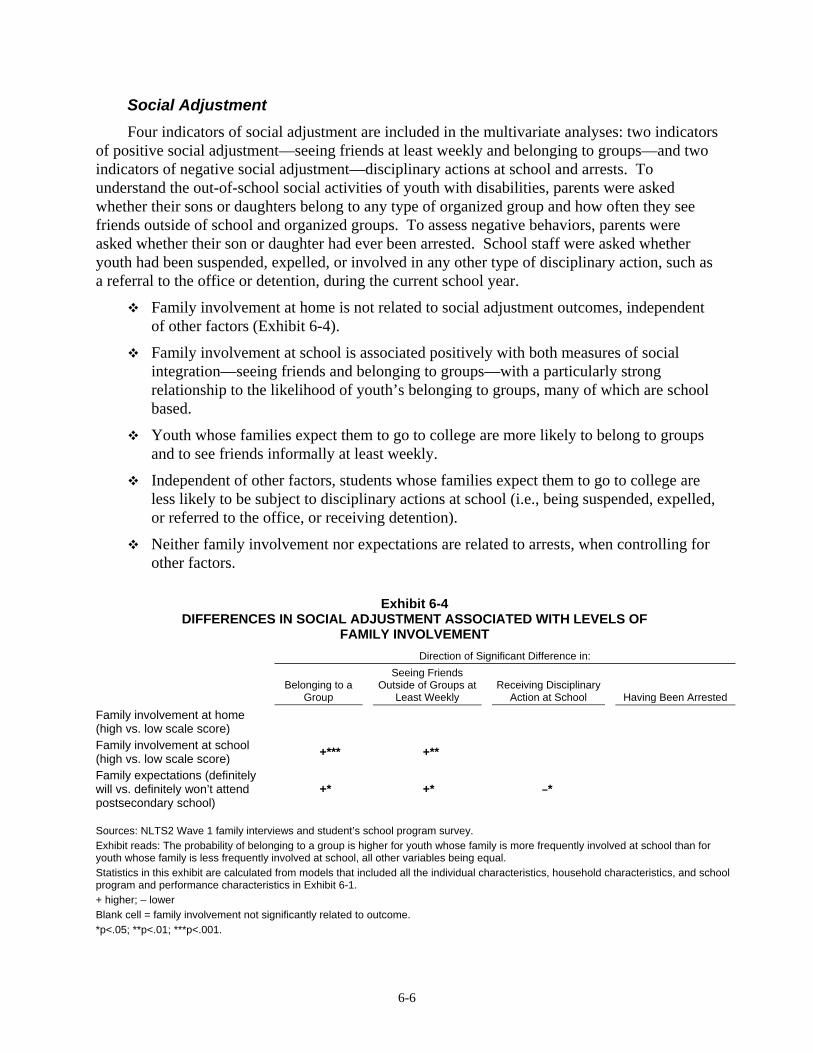
6-6
Social Adjustment Four indicators of social adjustment are included in the multivariate analyses: two indicators
of positive social adjustment—seeing friends at least weekly and belonging to groups—and two indicators of negative social adjustment—disciplinary actions at school and arrests. To understand the out-of-school social activities of youth with disabilities, parents were asked whether their sons or daughters belong to any type of organized group and how often they see friends outside of school and organized groups. To assess negative behaviors, parents were asked whether their son or daughter had ever been arrested. School staff were asked whether youth had been suspended, expelled, or involved in any other type of disciplinary action, such as a referral to the office or detention, during the current school year.
Family involvement at home is not related to social adjustment outcomes, independent of other factors (Exhibit 6-4).
Family involvement at school is associated positively with both measures of social integration—seeing friends and belonging to groups—with a particularly strong relationship to the likelihood of youth’s belonging to groups, many of which are school based.
Youth whose families expect them to go to college are more likely to belong to groups and to see friends informally at least weekly.
Independent of other factors, students whose families expect them to go to college are less likely to be subject to disciplinary actions at school (i.e., being suspended, expelled, or referred to the office, or receiving detention).
Neither family involvement nor expectations are related to arrests, when controlling for other factors.
Exhibit 6-4 DIFFERENCES IN SOCIAL ADJUSTMENT ASSOCIATED WITH LEVELS OF
FAMILY INVOLVEMENT Direction of Significant Difference in:
Belonging to a Group
Seeing Friends Outside of Groups at
Least Weekly Receiving Disciplinary
Action at School Having Been Arrested
Family involvement at home (high vs. low scale score)
Family involvement at school (high vs. low scale score) +*** +**
Family expectations (definitely will vs. definitely won’t attend postsecondary school)
+* +* –*
Sources: NLTS2 Wave 1 family interviews and student’s school program survey. Exhibit reads: The probability of belonging to a group is higher for youth whose family is more frequently involved at school than for youth whose family is less frequently involved at school, all other variables being equal. Statistics in this exhibit are calculated from models that included all the individual characteristics, household characteristics, and school program and performance characteristics in Exhibit 6-1. + higher; – lower Blank cell = family involvement not significantly related to outcome. *p<.05; **p<.01; ***p<.001.
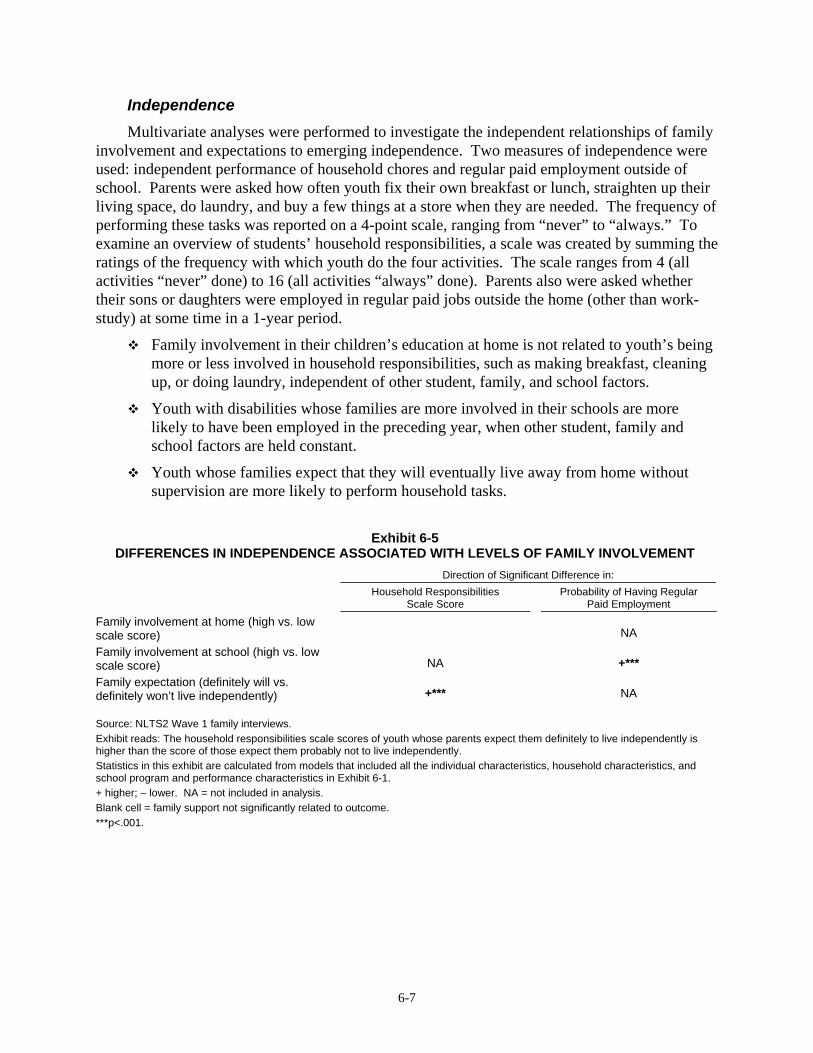
6-7
Independence Multivariate analyses were performed to investigate the independent relationships of family
involvement and expectations to emerging independence. Two measures of independence were used: independent performance of household chores and regular paid employment outside of school. Parents were asked how often youth fix their own breakfast or lunch, straighten up their living space, do laundry, and buy a few things at a store when they are needed. The frequency of performing these tasks was reported on a 4-point scale, ranging from “never” to “always.” To examine an overview of students’ household responsibilities, a scale was created by summing the ratings of the frequency with which youth do the four activities. The scale ranges from 4 (all activities “never” done) to 16 (all activities “always” done). Parents also were asked whether their sons or daughters were employed in regular paid jobs outside the home (other than work-study) at some time in a 1-year period.
Family involvement in their children’s education at home is not related to youth’s being more or less involved in household responsibilities, such as making breakfast, cleaning up, or doing laundry, independent of other student, family, and school factors.
Youth with disabilities whose families are more involved in their schools are more likely to have been employed in the preceding year, when other student, family and school factors are held constant.
Youth whose families expect that they will eventually live away from home without supervision are more likely to perform household tasks.
Exhibit 6-5
DIFFERENCES IN INDEPENDENCE ASSOCIATED WITH LEVELS OF FAMILY INVOLVEMENT Direction of Significant Difference in:
Household Responsibilities Scale Score
Probability of Having Regular Paid Employment
Family involvement at home (high vs. low scale score) NA Family involvement at school (high vs. low scale score) NA +*** Family expectation (definitely will vs. definitely won’t live independently) +*** NA Source: NLTS2 Wave 1 family interviews. Exhibit reads: The household responsibilities scale scores of youth whose parents expect them definitely to live independently is higher than the score of those expect them probably not to live independently. Statistics in this exhibit are calculated from models that included all the individual characteristics, household characteristics, and school program and performance characteristics in Exhibit 6-1. + higher; – lower. NA = not included in analysis. Blank cell = family support not significantly related to outcome. ***p<.001.

6-8
Summary
The importance of family involvement and expectations is supported by NLTS2 analyses. Parents’ support of their children’s education, as demonstrated by such activities as attending school meetings or classroom events or volunteering at school, is associated with consistent differences in several achievement domains, independent of disability, functioning, or other differences among youth.
Youth whose families are more involved in their schools are less far behind grade level in reading, tend to receive better grades, and have higher rates of involvement in organized groups (many of which are school based) and with individual friendships than youth with less family involvement at school.
In the independence domain, youth whose families are more involved in their schools are more likely than youth from less-involved families to have had regular paid jobs in the preceding year.
This pattern of relationships suggests that families may demonstrate similar levels of active involvement in support of their children both at school and in pursuing extracurricular activities, getting together with friends, and holding jobs.
In contrast, family support for education at home (i.e., talking regularly about school and helping with homework, providing a computer for schoolwork) is not related to many outcomes, controlling for other differences among youth. One exception:
Greater support for education at home is negatively associated with grades, possibly because parents are more likely to provide homework help to students who are doing poorly in school.
Expectations that parents hold for the futures of their children with disabilities in part reflect parents’ experience with and perceptions of the ways those disabilities are thought to limit activities and accomplishments. However, NLTS2 findings suggest that family expectations for the future also help shape the achievements of youth with disabilities, irrespective of the nature of the youth’s disabilities and their levels of functioning, particularly with regard to academic engagement and achievement. Other things being equal, youth with disabilities whose parents expect them to go on to postsecondary education after high school have more positive engagement and achievements while in high school than youth whose parents do not share that optimism for the future.
When holding disability, functioning, or other differences among youth constant, youth with disabilities whose parents expect them to go on to postsecondary education are more likely to:
Have positive classroom engagement behaviors in all settings and receive better grades than youth who are not expected to continue their education.
Be closer to grade level in their tested reading and math abilities than youth who are not expected to further their education after high school.
Avoid disciplinary actions and affiliate with organized groups, many of which may be sponsored by or meet at school.
6-9
In the independence domain, when controlling for other differences, youth with disabilities whose parents have high expectations that they will live independently in the future are more likely to:
Assume household responsibilities while in high school than are those who are not expected to live independently.
This chapter has examined the relationships of family involvement and expectations to various outcomes for youth with disabilities, including students’ school engagement, academic performance, social adjustment, and independence. Chapter 7 presents key themes from the analyses documented in this report.

7-1
7. FAMILIES MAKE A DIFFERENCE: SUMMARY AND IMPLICATIONS
This report provides the first national picture of the involvement of families of secondary-
school-age students with disabilities in their children’s educational development. Family involvement has been defined in multiple ways (Grolnick et al., 1997; Jordan et al., 2002), but current consensus is that family involvement is a multifaceted construct (Fan & Chen, 2001; Mutua & Dimitrov, 2001; Rosenzweig, 2001; Simon & Epstein, 2001). This may be true especially for families of students with disabilities, where involvement frequently goes beyond the traditional measures, such as helping with homework or attending school events, to involvement as advocates, liaisons, and case managers (Berger, 2000; Turnbull & Turnbull, 2001). Across the multiple ways family involvement has been defined, the one constant is the consensus that it is an important contributor to student outcomes, both for students in the general population and for those in special education.
The NLTS2 analyses reported here focus on three aspects of family involvement: involvement at home, specifically helping with homework and talking about school; involvement at school, specifically family participation in general school meetings, parent-teacher conferences, and school or class events, and volunteering at school; and involvement in IEP meetings. This report provides a benchmark for comparing the involvement of families of students with disabilities in special education with that of families in the general population.
This chapter presents key themes from the analyses documented in this report and discusses some of their implications for special education practice.
Key Themes
Highly Involved Families Families of secondary-school-age students with disabilities are actively involved in
supporting their children’s educational development, both at home and at school. Most families report regularly talking with their children about school and helping with homework at least once a week, with almost one in five providing homework assistance as often as five or more times per week. Families also participate in a wide range of school-based activities, including attending schoolwide meetings, parent-teacher conferences, and school and class events, and, to a lesser extent, volunteering at school. In addition, most parents of students with disabilities report having participated in at least one IEP meeting in the current or prior school year.
Not all parents are equally involved in the education-related activities measured by NLTS2—family involvement in these activities does vary by disability category. Families of students with emotional disturbances are less likely than other families to help with homework. They, along with families of students with mental retardation, are among the least likely to participate in school meetings, events, and volunteering, although parents of students in both disability categories are among the most likely to attend parent-teacher conferences.
It is important to be aware that disability category differences often are compounded by other youth and family characteristics. For example, students with emotional disturbances and students with mental retardation are more likely than other youth with disabilities to live in single-parent households, to be in poverty, and to be among the least likely to be involved in
7-2
extracurricular activities at their schools (Wagner, Cadwallader, et al., 2003; Wagner, Marder, Levine, et al., 2003). Analyses presented in Chapter 4 found these characteristics—lower family income, single-parent families, and student nonparticipation in extracurricular activities—to be related to lower levels of family involvement. Clearly, reasons for varying levels of involvement are many, above and beyond disability category.
More Involved Than Other Families Compared with their peers in the general population, families of students with disabilities
are more involved in monitoring and assisting with homework, and they are as involved, and at times more involved, in school-based activities. The difference in homework support is especially striking for those who help with homework frequently; youth with disabilities are much more likely to receive homework assistance frequently than are their peers in the general population. Families of students with disabilities also are more likely to attend general school meetings and parent-teacher conferences than those in the general population.
These findings raise the question of why parents of youth with disabilities are helping their children with homework so much more than other parents, particularly when considering the family demographics of the two groups. Having two-parent families, higher household incomes, and higher parent educational levels have long been associated with higher levels of family involvement in the general population (Coleman, 1987; Gavidia-Payne & Stoneman, 1997; Lareau, 1987; Nord & West, 2001; Peng & Lee, 1992). However, families of students with disabilities are less likely to have any of these characteristics; in fact, they are more likely than other families to have single-parent households, have lower family incomes, and not have a parent who has attended postsecondary school (Wagner, Marder, Levine, et al., 2003; Wagner, et al., 2002).
Parents of students with disabilities may be helping with homework more than other families because of their children’s additional homework needs. Often, students with disabilities have more problems with homework than do their peers in the general population (Berger, 2000; Gajria & Salend, 1995; Turnbull & Turnbull, 2001). Some families of students with disabilities are used to providing support in many other aspects of their children’s lives, so involvement in education-related activities may be a natural extension of that relationship. Families also may be helping with homework because they may feel that schools are not meeting students’ needs fully. NLTS2 findings presented in Chapter 4 indicate that families who spend more time helping with homework tend to be less satisfied with their children’s schools. There probably are many reasons, which can be explored in future research, why families of students with disabilities are more involved than other families.
Similarities between Families of Students with Disabilities and Other Families Despite demographic differences and the fact that families of students with disabilities
frequently deal with issues unique to parenting students with disabilities, including participating in the IEP process, families of students with disabilities are very much like other families in many ways. For example, families of students with disabilities are similar to peers in the general population in that homework is one of the activities most often necessitating a partnership between families, students, and schools.
In addition, the relationships between the characteristics of families of youth with disabilities and levels of involvement mirror those of families in the general population. Youth
7-3
behavior, abilities, and demographics are related to family involvement in much the same way for students with disabilities and students in the general population. For both groups, students who have weaker cognitive abilities are more likely to receive homework assistance. Students whose behavior is described as being more difficult are less likely to have families involved in their education at home and at school. Older students with disabilities and their peers in the general population have parents who tend to be less involved than parents of younger students. Girls in secondary school are more likely than boys to have parents who are involved at home and at school. African-American students with disabilities, as well as their peers in the general population, are more likely than white students to receive help with educational activities at home and are less likely to have families who are involved at school, holding constant other differences.
Household characteristics also are related to involvement in education for both families of youth with disabilities and youth in the general population. For both groups, wealthier families, families with two parents, families with better-educated parents, and families who have social supports are more likely to be involved in their children’s education, when other factors are held constant.
High Expectations for the Future A large majority of students with disabilities have parents who expect them to succeed in
the future in many aspects of education and independence. Most are expected to graduate from high school with a regular diploma, get a paid job, achieve financial independence, and live independently. Parents of students with disabilities are more optimistic about the future employment and 2-year college enrollment outlook for their children than they were in 1987, although fewer than two-thirds currently are expected to continue on to any type of postsecondary education.
As with most aspects of youth’s experiences, these expectations are not shared equally for all youth with disabilities. Lower expectations are particularly common for youth with mental retardation, autism, or multiple disabilities, and for those from lower-income households.
Involvement Is Important Parent involvement and expectations for the future are related to students’ achievements.
Even taking into account the relationship between students’ level of functioning and parent expectations, youth whose parents expect them to go on to postsecondary education are more engaged in their classes, receive better grades, are closer to grade level in their tested reading and math abilities, and are more likely to affiliate with organized groups and avoid disciplinary actions than are those whose parents are not as optimistic.
Similar to the experiences of their peers in the general population, youth with disabilities whose families are more involved in their schools benefit from that support. Family involvement in their children’s education at school is associated with a range of positive outcomes, including better grades, stronger reading skills, more involvement in organized groups, more individual friendships, and higher rates of employment.
Implications These findings have implications for special education practice, especially related to family-
school communication, information and support, and teacher training.
7-4
Whereas strong family involvement clearly is important to the success of youth with disabilities, this type of involvement also can be challenging. Parent-child interactions about homework may be stressful for both parents and students, especially if parents feel they don’t have the necessary knowledge and information to help effectively (Bauer & Shea, 2003; Baumgartner, et al., 1993). Helping with homework at the secondary-school level can be particularly daunting when students take more complex courses, such as geometry or chemistry, which may explain in part why homework assistance is lower among families of older students.
Parents need information and guidance to support them in their involvement in their children’s educational development. They need information about how and when to help with homework and how best to support their children’s academic work. Parents can receive this information through regular communication with teachers regarding topics such as material covered in class, how homework should be completed, and teacher expectations for adequate performance, yet researchers have found that fewer than half of schools report offering parents weekly or monthly information about curriculum or instruction (Schiller et al., 2003).
The IEP process places demands on parents beyond what often is expected in other types of family-school partnerships. Although most families report attending their children’s IEP meeting, more than one-third want to be more involved in IEP decision-making. Schools can use a number of strategies to support active parental involvement in IEP meetings, including providing parents with a draft of the IEP to review before the meeting, yet fewer than half the schools report offering parents this type of information (Schiller et al., 2003).
To better support families’ involvement in their children’s education, schools need to expand the strategies they are using. NLTS2 findings highlight the need for schools and teachers to broaden their focus from programs that bring parents to the school building to programs that support family involvement at home and that expand family expectations, both of which NLTS2 analyses have found to be strongly related to student outcomes.
In addition, preservice and inservice teacher preparation should include components on parent involvement. Teachers’ actions can have a strong impact on family involvement. Researchers have found that families who receive prompting and invitations for involvement from teachers are more likely to be involved in homework and school-based activities (Ames et al., 1995; Hoover-Dempsey & Sandler, 1997). This form of targeted outreach may be particularly necessary for parents of students with emotional disturbances or mental retardation, along with additional efforts to include these children in school-based events and activities that bring families to schools. Further, it is important for schools and teachers to be aware of differences among families. Families who are spending the most time helping with homework, such as African-American families, often are those who are not coming to the school building. These families could benefit from creative outreach and support in their involvement at home.
Schools are not the only sources of information and support for families. OSEP-supported trainings and other types of trainings and programs provide parents with much-needed information about how to monitor their children’s progress, be productive members of the IEP team, and support their children’s education at school. Other factors being equal, families who attend OSEP-supported trainings or other types of trainings are more likely to be involved at school and to attend IEP meetings.
Parent-to-parent programs and support groups also can be particularly effective in providing informational, emotional, and motivational support to families of children with disabilities. Belonging to these groups is positively associated with family involvement both at home and at
7-5
school. Other research has found that only one-quarter of schools offer support or parent groups to families of students with disabilities (Schiller et al., 2003). NLTS2 findings point to the importance of providing a forum for parents to share their thoughts and feelings and a place to receive information, support, and encouragement from others who understand what they are experiencing.
Support and information will become particularly important for families of youth with disabilities during their children’s transition from secondary school to adult life, when the focus on participation shifts from involvement in school-related activities to involvement with services, postsecondary schools, and the workplace. Many families will need to continue to assist their children beyond the secondary school years, often by acting as a case manager. When youth with disabilities are in secondary school, their services usually are coordinated by school staff (Levine, Marder, & Wagner, 2004). Once students leave the school system, many parents will need to assume this role (Salembier & Furney, 1997). When NLTS2 families are asked about barriers to getting services for their children, the most frequently cited barrier is a lack of information about available services (Levine et al., 2004). Getting timely and accurate information about adult services, postsecondary opportunities, or vocational assistance will be critical to these families’ ability to navigate a smooth transition from school to postschool life.
This report describes families’ involvement at home and at school in support of their children’s education during the secondary school years. Longitudinal analyses in subsequent waves of NLTS2 will shed light on how parent roles unfold over a period of years and how family involvement affects later outcomes as youth with disabilities transition from school to early adult life.

R-1
REFERENCES
Ames, C., deStefano, L., Watkins, T., & Sheldon, S. (1995). Teachers’ school-to-home communications and parent involvement: The role of parent perceptions and beliefs. Baltimore, MD: Center on Families, Communities, Schools & Children’s Learning.
Ames, C., Khoju, M., & Watkins, T. (1993). Parent involvement: The relationship between school-to-home communication and parents’ perceptions and beliefs. Baltimore, MD: Center on Families, Communities, Schools & Children’s Learning.
Baker, A. J. L., & Soden, L. (1998). The challenges of parent involvement research. New York: ERIC Clearinghouse on Urban Education. (ED419030).
Balli, S., Demo, D. H., & Wedman, J. F. (1998). Family involvement with children’s homework: An intervention in the middle grades. Family Relations, 47(2), 149-157.
Bauer, A., & Shea, T. (2003). Parents and schools: Creating a successful partnership for students with special needs. Upper Saddle River, NJ: Prentice Hall.
Baumgartner, D., Bryan, T., Donahue, M., & Nelson, C. (1993). Thanks for asking: Parent comments about homework, tests and grades. Exceptionality, 4, 153-176.
Berger, E. H. (2000). Parents as partners in education. Upper Saddle River, NJ: Prentice Hall.
Brantlinger, E. (1991). Home-school partnerships that benefit children with special needs. Elementary School Journal, 91, 249-260.
Bronfenbrenner, U. (1979). The ecology of human development: Experiment by nature and design. Cambridge, MA: Harvard University Press.
Burke, M. A. (2001). Recruiting and using volunteers in meaningful ways in secondary schools. NASSP Bulletin, 85(627), 46-52.
Bursuck, W. D., Rose, E., Coven, S., & Yahaya, A. (1989). Nationwide survey of postsecondary education services for students with learning disabilities. Exceptional Children, 56, 236-245.
Callahan, K., Rademacher, J. A., & Hildreth, B. I. (1998). The effect of parent participation in strategies to improve the homework performance of students who are at risk. Remedial and Special Education, 19, 131-141.
R-2
Cameto, R., Levine, P., & Wagner, M. (2003). The emerging independence of youth with disabilities. In M. Wagner, C. Marder, J. Blackorby, R. Cameto, L. Newman, P. Levine, et al., The achievements of youth with disabilities during secondary school. Menlo Park, CA: SRI International.
Carter, R. S., & Wojtkiewicz, R. A. (2000). Parental involvement with adolescents’ education: Do daughters or sons get more help? Adolescence, 35, 29-44.
Catsambis, S. (2002). Expanding knowledge of parental involvement in children’s secondary education: Connections with high school seniors’ academic success. Social Psychology of Education, 5(2), 149-177.
Catsambis, S., & Garland, J. (1997). Parental involvement in students’ education during middle school and high school. Baltimore, MD: Center for Research on the Education of Students Placed at Risk.
Coleman, J. S. (1987). Families and schools. Educational Researcher, 16, 32-38.
Coleman, J. S. (1988). Social capital in the creation of human capital. American Journal of Sociology, 94(Suppl.), S94-S120.
Cooper, H. M., Lindsay, J. J., & Nye, B. (2000). Homework in the home: How student, family and parenting-style differences relate to the homework process. Contemporary Educational Psychology, 25(4), 464-487.
Coots, J. J. (1998). Family resources and parent participation in schooling activities for their children with developmental delays. The Journal of Special Education, 31, 498-520.
Council for Exceptional Children. (2001). Improving family involvement in special education. Research Connections in Special Education, 9, 1.
Crosnoe, R. (2001). Academic orientation and parental involvement in education during high school. Sociology of Education, 74, 210-230.
Dauber, S. L., & Epstein, J. L. (1993). Parents’ attitudes and practices of involvement in inner-city elementary and middle schools. In N. F. Chavkin (Ed.), Families and schools in a pluralistic society (pp. 53-71). Albany, NY: State University of New York Press.
Delgado-Gaitan, C. (1991). Involving parents in the schools: A process of empowerment. American Journal of Education, 100(1), 20-46.
Deslandes, R., Royer, E., Turcotte, D., & Bertrand, R. (1997). School achievement at the secondary level: Influence of parenting style and parent involvement in schooling. McGill Journal of Education, 32, 191-207.
R-3
Dornbusch, S. M., & Ritter, P. L. (1988). Parents of high school students: A neglected resource. Educational Horizons, 66, 75-77.
Eagle, E. (1989). Socioeconomic status, family structure, and parental involvement: The correlates of achievement. Paper presented at the annual meeting of the American Educational Research Association, San Francisco, CA.
Eccles, J. S., Goldsmith, R. H., Jacobs, J., & Flanagan, C. (1988). Parental influences on adolescents’ academic motivation. Paper presented at the annual meeting of the American Educational Research Association, New Orleans, LA.
Eccles, J. S., & Harold, R. D. (1996). Family involvement in children’s and adolescents’ schooling. In A. Booth & J. F. Dunn (Eds.), Family-school links: How do they affect educational outcomes? (pp. 3-34). Mahwah, NJ: Erlbaum.
Epstein, J. L. (1987a). Involvement: What research says to administrators. Education and Urban Society, 19, 119-136.
Epstein, J. L. (1987b). Toward a theory of family-school connections: Teacher practices and parent involvement. In K. Hurrelmann, F. Kaufmann, & F. Losel (Eds.), Social intervention: Potential and constraints (pp. 121-136). New York: de Gruyter.
Epstein, J. L. (1994). Theory to practice: School and family partnerships lead to school improvement and student success. In C. L. Fagnano & B. Z. Werber (Eds.), School, family, and community interaction: A view from the firing lines (pp. 39-52). Boulder, CO: Westview Press.
Epstein, J. L. (2001). School, family, and community partnerships: Preparing educators and improving schools. Boulder, CO: Westview Press.
Falbo, T., Lein, L., & Amador, N. A. (2001). Parental involvement during the transition to high school. Journal of Adolescent Research, 16, 511-529.
Fan, X. T., & Chen, M. (2001). Parental involvement and students’ academic achievement: A meta-analysis. Educational Psychology Review, 13(1), 1-22.
Finn, J. D. (1998). Parental engagement that makes a difference. Educational Leadership, 55(8), 20-24.
Gajria, M., & Salend, S. (1995). A comparison of homework practices of students with and without learning disabilities. Journal of Learning Disabilities, 28, 291-296.
Gavidia-Payne, S., & Stoneman, Z. (1997). Family predictors of maternal and paternal involvement in programs for young children with disabilities. Child Development, 68(4), 701-717.
R-4
Gresham, F. M., & Elliott, S. N. (1990). Social skills rating system manual. Circle Pines, MN: American Guidance Service.
Goldenberg, C., Gallimore, R., Reese, L., & Garnier, H. (2001). Cause or effect? A longitudinal study of immigrant Latino parents’ aspirations and expectations, and their children’s school performance. American Educational Research Journal, 38(3), 547-582.
Gonzalez, A. R. (2002). Parental involvement: Its contribution to high school students’ motivation. The Clearing House, 75(3), 132-134.
Grolnick, W. S., Apostoleris, N. H., & Rosen, S. (1995). Socioeconomic and family predictors of parent involvement: A multidimensional approach. Paper presented at the annual meeting of the American Educational Research Association, San Francisco, CA.
Grolnick, W. S., Benjet, C., Kurowski, C. O., & Apostoleris, N. H. (1997). Predictors of parent involvement in children’s schooling. Journal of Educational Psychology, 89, 538-548.
Grolnick, W. S., & Slowiaczek, M. L. (1994). Parents’ involvement in children’s schooling: A multidimensional conceptualization and motivational model. Child Development, 64, 237-252.
Harry, B. (1992). Cultural diversity, families and the special education system: Communication and empowerment. New York: Teachers College Press.
Harry, B. (2002). Trends and issues in serving culturally diverse families of children with disabilities. The Journal of Special Education, 36(3), 131-138.
Harry, B., Allen, N., & McLaughlin, M. (1995). Communication versus compliance: African American parents’ involvement in special education. Exceptional Children, 61(4), 364-377.
Henderson, A. T., & Berla, N. (1994). A new generation of evidence: The family is critical to student achievement. Washington, DC: National Committee for Citizens in Education.
Henderson, A. T., & Mapp, K. L. (2002). A new wave of evidence: The impact of school, family, and community connections on student achievement. Austin, TX: Southwest Educational Development Laboratory.
Hiatt-Michael, D. B. (2001). Home-school communication. In D. B. Hiatt-Michael (Ed.), Promising practices for family involvement in schools (pp. 39-57). Greenwich, CT: Information Age Publishing.
Hickman, C. W., Greenwood, G., & Miller, M. D. (1995). High school parent involvement: Relationships with achievement, grade level, SES, and gender. Journal of Research and Development in Education, 28, 125-134.
R-5
Hoover-Dempsey, K. V., Battaito, A. C., Walker, J. M. T., Reed, R. P., DeJong, J. M., & Jones, K. P. (2001). Parental involvement in homework. Educational Psychologist, 36(3), 195-209.
Hoover-Dempsey, K. V., & Sandler, H. H. (1995). Parental involvement in children’s education: Why does it make a difference? Teachers College Record, 95, 310-331.
Hoover-Dempsey, K. V., & Sandler, H. H. (1997). Why do parents become involved in their children’s education? Review of Educational Research, 67, 3-42.
Jeynes, W. H. (2003). A meta-analysis: The effects of parental involvement on minority children’s academic achievement. Education and Urban Society, 35(2), 202-218.
Jordan, C., Orozco, E., & Averett, A. (2002). Emerging issues in school, family, community connections. Annual synthesis, 2001. Austin, TX: Southwest Educational Development Laboratory.
Kalyanpur, M., & Harry, B. (1999). Culture in special education: Building reciprocal family-professional relationships. Baltimore, MD: Paul H. Brookes Publishing Company.
Kalyanpur, M., Harry, B., & Skrtic, T. (2000). Equity and advocacy expectations of culturally diverse families’ participation in special education. Journal of Disability, Development and Education, 47(2), 119-136.
Keith, T. Z., & Keith, P. B. (1993). Does parental involvement affect eighth-grade student achievement? Structural analysis of national data. School Psychology Review, 22(3), 474-496.
Keith, T. Z., Keith, P. B., Quirk, K. J., Sperduto, J., Santillo, S., & Killings, S. (1998). Longitudinal effects of parent involvement on high school grades: Similarities and differences across gender and ethnic groups. Journal of School Psychology, 36, 335-363.
Lareau, A. (1987). Social class differences in family-school relationships: The importance of cultural capital. Sociology of Education, 60(2), 73-85.
Lareau, A. (2000). Home advantage: Social class and parental intervention in elementary education (2nd ed.). Lanham, MA: Rowman & Littlefield Publishers, Inc.
Levine, M. (2001). Educational care: A system for understanding and helping children with learning differences (2nd ed.). Cambridge, MA: Educators Publishing Service, Inc.
Levine, P., Marder, C., & Wagner, M. (2004). Services and supports for secondary school students with disabilities. Menlo Park, CA: SRI International.
R-6
Maccoby, E. E., Snow, M. E., & Jacklin, C. N. (1984). Children’s dispositions and mother-child interaction at 12 and 18 months: A short-term longitudinal study. Developmental Psychology, 20, 459-472.
Mapp, K. L. (2003). Having their say: Parents describe why and how they are engaged in their children’s learning. The School Community Journal, 13(1), 35-64.
Marder, C. (1992). Education after secondary school. In M. Wagner, R. D’Amico, C. Marder, L. Newman & J. Blackorby, What happens next? Trends in postschool outcomes of youth with disabilities. Menlo Park, CA: SRI International.
Marder, C., Levine, P., & Wagner, M. (2003). Demographic characteristics of youth with disabilities. In M. Wagner, C. Marder, P. Levine, R. Cameto, T. Cadwallader, & J. Blackorby, The individual and household characteristics of youth with disabilities. Menlo Park, CA: SRI International.
Marder, C., Wagner, M., & Sumi, C. (2003). The social adjustment of youth with disabilities. In M. Wagner, C. Marder, J. Blackorby, R. Cameto, L. Newman, P. Levine, et al., The achievements of youth with disabilities during secondary school. Menlo Park, CA: SRI International.
Milne, A., Myers, D., Rosenthal, A., & Ginsburg, A. (1986). Single parents, working mothers and the educational achievement of school children. Sociology of Education, 59, 125-139.
Muller, C. (1993). Parent involvement and academic achievement: An analysis of family resources available to the child. In B. Schneider & J. S. Coleman (Eds.), Parents, their children and schools. Boulder, CO: Westview Press, Inc.
Muller, C., & Kerbow, D. (1993). Parent involvement in the home, school, and community. In B. Schneider & J. S. Coleman (Eds.), Parents, their children and schools. Boulder, CO: Westview Press, Inc.
Mutua, N. K., & Dimitrov, D. (2001). Parents’ expectations about future outcomes of children with MR in Kenya: Differential effects of gender and severity of MR. The Journal of Special Education, 35(3), 172-180.
National Center for Education Statistics. (2002). Digest of education statistics, 2001. Washington, DC: Author.
Newman, L. (2004) A national study of parent involvement in education of youth with disabilities. In D. B. Hiatt-Michael (Ed.), Promising practices connecting schools to families of children with special needs (pp. 25-39). Greenwich, CT: Information Age Publishing.
Newman, L. A., & Cameto, R. (1993). What makes a difference? Factors related to postsecondary school attendance for young people with disabilities. Paper presented at the annual meeting of the American Educational Research Association, Atlanta, GA.
R-7
Newman, L., Wagner, M., & Guzman, A.-M. (2002). Family supports for education at home. In M. Wagner, T. Cadwallader, L. Newman, N. Garza, J. Blackorby & A.-M. Guzman, The other 80% of their time: The experiences of elementary and middle school students with disabilities in their nonschool hours. Menlo Park, CA: SRI International.
NICHCY. (2000). Questions and answers about IDEA. Retrieved August 5, 2004, from http://www.nichcy.org/pubs/newsdig/nd21.pdf
Nord, C. W., & West, J. (2001). Fathers’ and mothers’ involvement in their children’s schools by family type and resident status (NCES 2001032). Washington, DC: National Center for Education Statistics.
North Central Regional Educational Laboratory. (2002). Engage parents. Retrieved February 21, 2005, from http://www.ncrel.org/sdrs/areas/issues/content/cntareas/math/ma8engage.htm
Office of Special Education Programs. (2001). Table AD1. Number of students age 14 and older exiting special education during the 1999-2000 school year. Available at http://www.ideadata.org/tables24th/ar_ad1.htm
Pena, D. C. (2000). Parent involvement: Influencing factors and implications. The Journal of Educational Research, 94(1), 42-54.
Peng, S. S., & Lee, R. M. (1992). Home variables, parent-child activities, and academic achievement: A study of 1988 eighth graders. Paper presented at the annual meeting of the American Educational Research Association, San Francisco, CA.
Phillips, L. (1992). Parent involvement: Relationships of expectations, goals, and activities to student achievement among minority, socioeconomic, and gender groups. Paper presented at the annual meeting of the American Educational Research Association, San Francisco, CA.
Revicki, D. A. (1981). The relationship among socioeconomic status, home environment, parent involvement, child self-concept, and child achievement. Chapel Hill, NC: University of North Carolina. (ERIC Document Reproduction Service No. ED206645)
Rosenzweig, C. (2001). A meta-analysis of parenting and school success: The role of parents in promoting students’ academic performance. Paper presented at annual meeting of the American Educational Research Association, Seattle, WA. (ERIC Document Reproduction Service No. ED452232)
Rothstein, L. (2000). Special education law (3rd ed.). New York: Longman.
Rumberger, R. W., Ghatak, R., Poulas, G., Ritter, P. L., & Dornbusch, S. M. (1990). Family influences on dropout behavior in one California high school. Sociology of Education, 63, 283-299.
R-8
Salembier, G., & Furney, K. S. (1997). Facilitating participation: Parents’ perceptions of their involvement in the IEP/transition planning process. Career Development for Exceptional Individuals, 20, 29-41.
Schiller, E., Burnaska, K., Cohen, G., Douglas, Z., Fiore, T., Glazier, R., et al. (2003). The study of state and local implementation and impact of the Individuals with Disabilities Education Act: Final interim report (1999-2000 school year). Bethesda, MD: Abt Associates.
Scott-Jones, D. (1988). Families as educators: The transition from informal to formal school learning. Educational Horizons, 66, 66-69.
Simon, B. S. (2001a). Family involvement in high school: Predictors and effects. NASSP Bulletin, 85(627), 8-19.
Simon, B. S. (2001b). Predictors of high school and family partnerships and the influence of partnerships on student success (Doctoral dissertation, Johns Hopkins University, 2001). Dissertation Abstracts International, 61, 3949A.
Simon, B. S., & Epstein, J. L. (2001). School, family, and community partnerships: Linking theory to practices. In D. B. Hiatt-Michael (Ed.), Promising practices for family involvement in schools (pp. 1-24). Greenwich, CT: Information Age Publishing.
Smith, S. (2001). Involving parents in the IEP process. Washington, DC: ERIC Clearinghouse on Disabilities and Gifted Education. Retrieved February 2005 from http://ericec.org/digests/e611.html
Smrekar, C., & Cohen-Vogel, L. (2001). The voices of parents: Rethinking the intersection of family and school. Peabody Journal of Education, 76, 75-100.
Sui-Chu, E. H., & Willms, J. D. (1996). Effects of parental involvement on eighth-grade achievement. Sociology of Education, 69(2), 126-141. (ERIC Document Reproduction Service No. EJ548327).
Thorkildsen, R., & Stein, M. R. (1998). Is parent involvement related to student achievement? Exploring the evidence [Online]. Research Bulletin, 22. Retrieved February 2005 from http://www.pdkintl.org/edres/resbul22.htm
Tinkler, B. (2002). A review of literature on Hispanic/Latino parent involvement in K-12 education. Denver, CO: Assets for Colorado Youth.
Trusty, J. (1999). Effects of eighth-grade parental involvement on late adolescents’ educational experiences. Journal of Research and Development in Education, 32(4), 224-233. (ERIC Document Reproduction Service No. EJ598231).
R-9
Turnbull, A., & Turnbull, H. R. (2001). Families, professionals and exceptionality: Collaborating for empowerment (4th ed.). Upper Saddle River, NJ: Prentice Hall.
Van Voorhis, F. (2001). Interactive science homework: An experiment in home and school connections. NASSP Bulletin, 85(627), 20-32.
Wagner, M., Blackorby, J., Cameto, R., & Newman, L. (1993). What makes a difference? Influences on postschool outcomes of youth with disabilities. Menlo Park, CA: SRI International.
Wagner, M., Blackorby, J., Marder, C., & Levine, P. (2003). The functional abilities of youth. In M. Wagner, C. Marder, P. Levine, R. Cameto, T. Cadwallader, & J. Blackorby, The individual and household characteristics of youth with disabilities. Menlo Park, CA: SRI International.
Wagner, M., Cadwallader, T., & Marder, C. (with Cameto, R., Cardoso, D., Garza, N., et al.). (2003). Life outside the classroom for youth with disabilities. Menlo Park, CA: SRI International.
Wagner, M., Cameto, R., & Newman, L. (2003). Youth with disabilities: A changing population. Menlo Park, CA: SRI International.
Wagner, M., D’Amico, R., Marder, C., Newman, L., & Blackorby, J. (1992). What happens next? Trends in postschool outcomes of youth with disabilities. Menlo Park, CA: SRI International.
Wagner, M., Marder, C., Blackorby, J., & Cardoso, D. (2002). The children we serve: The demographic characteristics of elementary and middle school students with disabilities and their households. Menlo Park, CA: SRI International.
Wagner, M., Marder, C., Levine, P., Cameto, R., Cadwallader, T., Blackorby, J. (2003). The individual and household characteristics of youth with disabilities. Menlo Park, CA: SRI International.
Wagner, M., Marder, C., Blackorby, J., Cameto, R., Newman, L., Levine, P., et al. (2003). The achievements of youth with disabilities during secondary school. Menlo Park, CA: SRI International.
Wagner, M., Newman, L., D’Amico, R., Jay, D., Butler-Nalin, P., Marder, C., et al. (1991). Youth with disabilities: How are they doing? Menlo Park, CA: SRI International.
Weintraub, F., Abeson, A., Ballard, J., & LaVor, M. (1976). Public policy and the education of exceptional children. Reston, VA: Council for Exceptional Children.
R-10
Winton, P. J. (1994). Families of children with disabilities. In N. G. Haring, L. McCormick, & T. G. Haring (Eds.), Exceptional children and youth (6th ed.) (pp. 502-525). New York: Merrill.
Zellman, G. L., & Waterman, J. M. (1998). Understanding the impact of parent school involvement on children’s educational outcomes. The Journal of Educational Research, 91(6), 370-380.
Zill, N., & Nord, C. W. (1994). Running in place: How American families are faring in a changing economy and an individualistic society. Washington, DC: Child Trends.
A-1
Appendix A
NLTS2 SAMPLING, DATA COLLECTION, AND ANALYSIS PROCEDURES
This appendix describes several aspects of the NLTS2 methodology relevant to the Wave 1 data reported here, including:
• Sampling of local education agencies (LEAs) and students
• Data sources and response rates
• Combination of data from multiple sources
• Weighting of the data
• Estimation and use of standard errors
• Unweighted and weighted sample sizes
• Calculation of statistical significance
• Measurement and reporting issues.
NLTS2 Sample Overview The NLTS2 sample was constructed in two stages. A stratified random sample of 3,634
LEAs was selected in early 2000 from the universe of approximately 12,000 LEAs that served students receiving special education in at least one grade from 7th through 12th grades. These LEAs and 77 state-supported special schools that serve primarily students with hearing and vision impairments and multiple disabilities were invited to participate in the study, with the intention of recruiting 497 LEAs and as many special schools as possible from which to select the target sample of about 12,000 students. The target LEA sample was reached; 501 LEAs and 38 special schools agreed to participate and provided rosters of students receiving special education in the designated age range.
The roster of all students in the NLTS2 age range who were receiving special education from each LEA1 and special school was stratified by disability category. Then, students were selected randomly from each disability category. Sampling fractions were calculated that would produce enough students in each category so that, in the final study year, findings would generalize to most categories individually with an acceptable level of precision, accounting for attrition and for response rates to the parent/youth interview. A total of 11,276 students were selected and eligible to participate in NLTS2.
Details of the LEA and student samples are provided below.
1 LEAs were instructed to include on the roster any student for whom they were administratively responsible, even if the student was not educated within the LEA (e.g., attended a school sponsored by an education cooperative or was sent by the LEA to a private school). Despite these instructions, some LEAs may have underreported students served outside the LEA.
A-2
The NLTS2 LEA Sample
Defining the Universe of LEAs The NLTS2 sample includes only LEAs that have teachers, students, administrators, and
operating schools—that is, “operating LEAs.” It excludes such units as supervisory unions; Bureau of Indian Affairs schools; public and private agencies (e.g., correctional facilities); LEAs in U.S. territories; and LEAs with 10 or fewer students in the NLTS2 age range, which would be unlikely to have students with disabilities.
The public school universe data file maintained by Quality Education Data (QED, 2000) was used to construct the sampling frame because it had more recent information than the alternative list maintained by the National Center for Education Statistics. Correcting for errors and duplications resulted in a master list of 12,435 LEAs that met the selection criteria. These LEAs comprise the NLTS2 LEA sampling frame.
Stratification The NLTS2 LEA sample was stratified to increase the precision of estimates, to ensure that
low-frequency types of LEAs (e.g., large urban districts) were adequately represented in the sample, to improve comparisons with the findings of other research, and to make NLTS2 responsive to concerns voiced in policy debate (e.g., differential effects of federal policies in particular regions, LEAs of different sizes). Three stratifying variables were used:
Region. This variable captures essential political differences, as well as subtle differences in the organization of schools, the economic conditions under which they operate, and the character of public concerns. The regional classification variable selected was used by the U.S. Department of Commerce, the U.S. Bureau of Economic Analysis, and the National Assessment of Educational Progress. (The categories are Northeast, Southeast, Midwest, and West.)
LEA size (student enrollment). LEAs vary considerably by size, the most useful available measure of which is student enrollment. Numerous organizational and contextual variables are associated with size, and they exert considerable potential influence over the operations and effects of special education and related programs. In addition, total enrollment serves as an initial proxy for the number of students receiving special education served by an LEA. The QED database provided enrollment data from which LEAs were sorted into four categories serving approximately equal numbers of students:
• Very large (estimated2 enrollment greater than 14,931 in grades 7 through 12)
• Large (estimated enrollment from 4,661 to 14,930 in grades 7 through 12)
• Medium (estimated enrollment from 1,622 to 4,660 in grades 7 through 12)
• Small (estimated enrollment from 11 to 1,621 in grades 7 through 12).
2 Enrollment in grades 7 through 12 was estimated by dividing the total enrollment in all grade levels served by an LEA by the number of grade levels to estimate an enrollment per grade level.; that level was multiplied by 6 to estimate the enrollment in grades 7 through 12.
A-3
LEA/community wealth. As a measure of district wealth, the Orshansky index (the proportion of the student population living below the federal definition of poverty; Fisher, 1992) is a well-accepted measure. The distribution of Orshansky index scores was organized into four categories of LEA/community wealth, each containing approximately 25% of the student population in grades 7 through 12:
• High (0% to 13% Orshansky)
• Medium (14% to 24% Orshansky)
• Low (25% to 43% Orshansky)
• Very low (more than 43% Orshansky).
The three variables generate a 64-cell grid into which the universe of LEAs was arrayed.
LEA Sample Size On the basis of an analysis of LEAs’ estimated enrollment across LEA size and estimated
sampling fractions for each disability category, 497 LEAs and as many state-sponsored special schools as would participate were considered sufficient to generate the student sample. Taking into account the rate at which LEAs were expected to refuse to participate, a sample of 3,635 LEAs was invited to participate, from which 497 participating LEAs might be recruited. A total of 501 LEAs actually provided students for the sample, 101% of the target number needed and 14% of those invited. Analyses of the region, size, and wealth of the LEA sample, both weighted and unweighted, confirmed that the weighted LEA sample closely resembled the LEA universe with respect to those variables.
In addition to ensuring that the LEA sample matched the universe of LEAs on variables used in sampling, it was important to ascertain whether the stratified random sampling approach resulted in skewed distributions on relevant variables not included in the stratification scheme. Several analyses were conducted.
First, three variables from the QED database were chosen to compare the “fit” between the first-stage sample and the population: the LEA’s racial/ethnic distribution of students, the proportion who attended college, and the urban/rural status of the LEA. This analysis revealed that the sample of LEAs somewhat underrepresented African-American students and college-bound students and overrepresented Hispanic students and LEAs in rural areas. Thus, in addition to accounting for stratification variables, LEA weights were calculated to achieve a distribution on the urbanicity and racial/ethnic distributions of students that matched the universe.
To determine whether the resulting weights, when applied to the participating NLTS2 LEAs, accurately represented the universe of LEAs serving the specified grade levels, data collected from the universe of LEAs by the U.S. Department of Education’s Office of Civil Rights (OCR) and additional items from QED were compared for the weighted NLTS2 LEA sample and the universe. Finally, the NLTS2 participating LEAs and a sample of 1,000 LEAs that represented the universe of LEAs were surveyed to assess a variety of policies and practices known to vary among LEAs and to be relevant to secondary-school-age youth with disabilities. Analyses of both the extant databases and the LEA survey data confirmed that the weighted NLTS2 LEA sample accurately represented the universe of LEAs.
A-4
The NLTS2 Student Sample Determining the size of the NLTS2 student sample took into account the duration of the
study, desired levels of precision, and assumptions regarding attrition and response rates. Analyses determined that approximately three students would need to be sampled for each student who would have a parent/youth interview in Wave 5 of NLTS2 data collection.
The NLTS2 sample design called for findings to be generalizable to students receiving special education as a whole and for the 12 special education disability categories currently in use in the NLTS2 age range and reported in this document. Standard errors were to be no more than 3.6%, except for the low-incidence categories of traumatic brain injury and deaf-blindness. Thus, by sampling 1,250 students per disability category (with the two exceptions noted), 402 students per category were expected to have a parent or youth interview in year 9. Assuming a 50% sampling efficiency (which is likely to be exceeded for most disability categories), 402 students would result in a standard error of estimate of slightly less than 3.6%. All students with traumatic brain injury or with deaf-blindness in participating LEAs and special schools were selected. Students were disproportionately sampled by age to assure that there would be an adequate number of students who were age 24 or older at the conclusion of the study. Among the eligible students, 40.2% will be 24 or older as of the final interview.
LEAs and special schools were contacted to obtain their agreement to participate in the study and request rosters of students receiving special education who were ages 13 through 16 on December 1, 2000, and in at least seventh grade.3 Requests for rosters specified that they contain the names and addresses of students receiving special education under the jurisdiction of the LEA, the disability category of each student, and the students’ birth dates or ages. Some LEAs provided only identification numbers for students, along with the corresponding birth dates and disability categories. When students were sampled in these LEAs, identification numbers of selected students were provided to the LEA, along with materials to mail to their parents/guardians (without revealing their identity).
After estimating the number of students receiving special education in the NLTS2 age range, the appropriate fraction of students in each category was selected randomly from each LEA and special school. In cases in which more than one child in a family was included on a roster, only one child was eligible to be selected. LEAs and special schools were notified of the students selected, and contact information for their parents/guardians was requested.
3 Students who were designated as being in ungraded programs also were sampled if they met the age criteria.
A-5
Data Sources Data reported here are drawn from a survey of parents of NLTS2 youth, conducted by
telephone and mail, and mail surveys of staff in schools attended by NLTS2 sample members.
Parent Interview/Survey The NLTS2 conceptual framework suggests that a youth’s nonschool experiences (e.g.,
extracurricular activities and friendships), historical information (e.g., age when disability was first identified), household characteristics (e.g., socioeconomic status), and a family’s level and type of involvement in school-related areas are crucial to student outcomes. Parents/guardians are the most knowledgeable about these aspects of students’ lives. They also are important sources of information on outcomes across domains. Thus, parents/guardians of NLTS2 sample members were interviewed by telephone or surveyed by mail in 2001 as part of Wave 1 data collection.
Matches of names, addresses, and telephone numbers of NLTS2 parents with existing national locator databases were conducted to maximize the completeness and accuracy of contact information and subsequent response rates. A family was required to have a working telephone number and an accurate address to be eligible for the parent interview sample.
Letters were sent to parents to notify them that their child had been selected for NLTS2 and that an interviewer would attempt to contact them by telephone. The letter included a toll-free telephone number for parents to call to be interviewed if they did not have a telephone number where they could be reached reliably or if they wanted to make an appointment for the interview at a specific time.
Computer-assisted telephone interviewing (CATI) was used for parent interviews, which were conducted between mid-May and late September 2001. Ninety-five percent of interviews were conducted in English and 5% in Spanish.
All parents who could not be reached by telephone were mailed a self-administered questionnaire in a survey period that extended from September through December 2001. The questionnaire contained a subset of key items from the telephone interview. Exhibit A-1 reports the responses to the telephone and mail surveys.
Overall, 91% of respondents reported that they were parents of sample members (biological, adoptive, or step), and 1% were foster parents. Six percent were relatives other than parents, 2% were nonrelative legal guardians, and fewer than 1% reported other relationships to sample members.
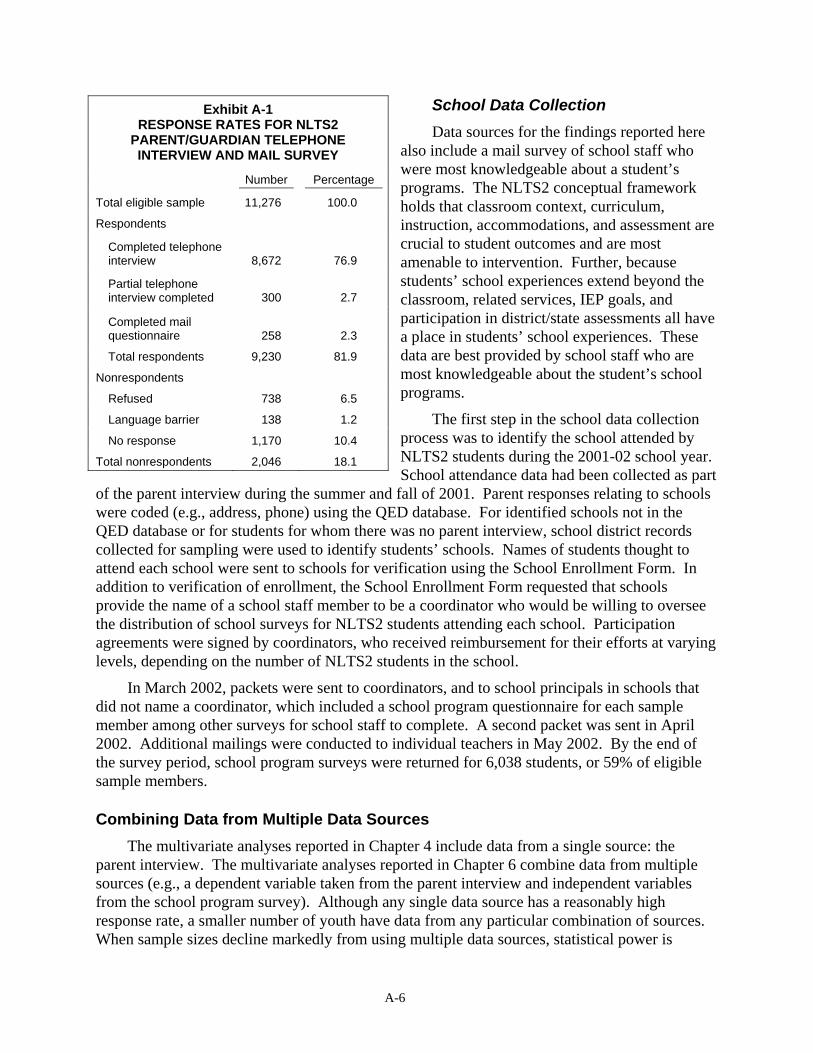
A-6
School Data Collection Data sources for the findings reported here
also include a mail survey of school staff who were most knowledgeable about a student’s programs. The NLTS2 conceptual framework holds that classroom context, curriculum, instruction, accommodations, and assessment are crucial to student outcomes and are most amenable to intervention. Further, because students’ school experiences extend beyond the classroom, related services, IEP goals, and participation in district/state assessments all have a place in students’ school experiences. These data are best provided by school staff who are most knowledgeable about the student’s school programs.
The first step in the school data collection process was to identify the school attended by NLTS2 students during the 2001-02 school year. School attendance data had been collected as part
of the parent interview during the summer and fall of 2001. Parent responses relating to schools were coded (e.g., address, phone) using the QED database. For identified schools not in the QED database or for students for whom there was no parent interview, school district records collected for sampling were used to identify students’ schools. Names of students thought to attend each school were sent to schools for verification using the School Enrollment Form. In addition to verification of enrollment, the School Enrollment Form requested that schools provide the name of a school staff member to be a coordinator who would be willing to oversee the distribution of school surveys for NLTS2 students attending each school. Participation agreements were signed by coordinators, who received reimbursement for their efforts at varying levels, depending on the number of NLTS2 students in the school.
In March 2002, packets were sent to coordinators, and to school principals in schools that did not name a coordinator, which included a school program questionnaire for each sample member among other surveys for school staff to complete. A second packet was sent in April 2002. Additional mailings were conducted to individual teachers in May 2002. By the end of the survey period, school program surveys were returned for 6,038 students, or 59% of eligible sample members.
Combining Data from Multiple Data Sources The multivariate analyses reported in Chapter 4 include data from a single source: the
parent interview. The multivariate analyses reported in Chapter 6 combine data from multiple sources (e.g., a dependent variable taken from the parent interview and independent variables from the school program survey). Although any single data source has a reasonably high response rate, a smaller number of youth have data from any particular combination of sources. When sample sizes decline markedly from using multiple data sources, statistical power is
Exhibit A-1 RESPONSE RATES FOR NLTS2
PARENT/GUARDIAN TELEPHONE INTERVIEW AND MAIL SURVEY
Number Percentage
Total eligible sample 11,276 100.0
Respondents
Completed telephone interview 8,672 76.9
Partial telephone interview completed 300 2.7
Completed mail questionnaire 258 2.3
Total respondents 9,230 81.9
Nonrespondents
Refused 738 6.5
Language barrier 138 1.2
No response 1,170 10.4
Total nonrespondents 2,046 18.1
A-7
reduced and it is difficult for relationships to attain statistical significance even when they are quite large. Hence, it is important to maintain the analytic sample size to the maximum extent possible.
Two approaches are used in NLTS2 to maintain the size of the sample used in analyses that combine data from multiple sources: constructing composite measures and imputing missing values.
Constructing composite measures. Several variables in NLTS2 analyses can be measured by using data from more than one source. For example, parents were asked to describe students’ overall grades, and school staff were asked to report students’ grades in specific general education academic and special education classes. In understanding the factors that are related to variation in students’ grades, parents’ reports were the preferred measure because they were considered the broadest indicator of students’ overall grades. However, if a student was missing the grades item from the parent interview, the school-reported grade measure was used, with preference given to the setting (general or special education class) in which the student spent the largest part of his or her school day, as indicated on the school program survey. Thus, the grades variable includes students who have either a parent interview, a school program survey (on which grades are reported for a special education class), or a general education teacher survey, which results in a much larger number of youth included in analyses of grades than would result from including those with a single data source. The other variable constructed from a combination of parent and school data is the measure of whether students have been declassified from special education. In that case, preference was given to school-provided information, with parents’ reports used if the school program survey item was missing.
Imputing missing values. Missing values for particular variables occur either because an entire data source is missing for a given student (e.g., a student does not have a parent interview) or a respondent refused to answer or did not know the answer to a given item. Multivariate analyses exclude cases for which there are missing data for any variable included in them, resulting in the difficulties associated with reduced sample sizes already discussed.
Thus, it can be beneficial to impute values on key variables for youth who otherwise would be excluded from analyses because of missing data. Imputation procedures involve assigning a value for a youth with missing data that is the best prediction for that youth given what else is known about him or her. Although there are a variety of procedures for imputation, NLTS2 has employed a straightforward assignment of mean values that are calculated for a subset of youth who resemble the youth with missing values on specified dimensions that are relevant to the variable in question.
Although imputation can be a significant help in maintaining the analytic sample size, it also reduces the amount of variation in the variables chosen for imputation, thus reducing the strength of their relationships to other variables. Therefore, no dependent variables included imputed values. In selecting independent variables for imputation, careful judgment was used in weighing the trade-offs between maintaining sample size and maintaining maximum variability and selecting only those that have a fairly limited number of missing values. Exhibit A-2 identifies the independent variables for which missing values were imputed, the criteria for imputation, and the number and percentage of cases across the multivariate analyses that had imputed values for each variable. For a given variable, the models with the smallest number of imputed values are those with a dependent variable that came from the same data source (i.e.,
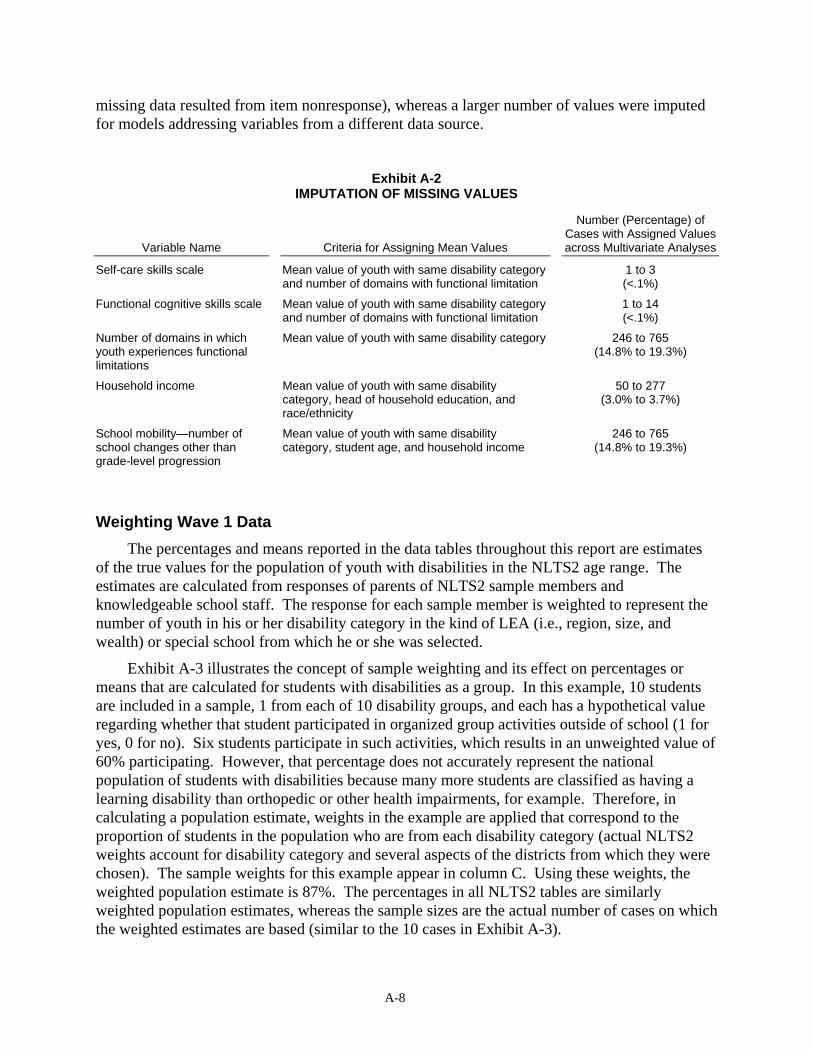
A-8
missing data resulted from item nonresponse), whereas a larger number of values were imputed for models addressing variables from a different data source.
Exhibit A-2 IMPUTATION OF MISSING VALUES
Variable Name Criteria for Assigning Mean Values
Number (Percentage) of Cases with Assigned Values across Multivariate Analyses
Self-care skills scale Mean value of youth with same disability category and number of domains with functional limitation
1 to 3 (<.1%)
Functional cognitive skills scale Mean value of youth with same disability category and number of domains with functional limitation
1 to 14 (<.1%)
Number of domains in which youth experiences functional limitations
Mean value of youth with same disability category 246 to 765 (14.8% to 19.3%)
Household income Mean value of youth with same disability category, head of household education, and race/ethnicity
50 to 277 (3.0% to 3.7%)
School mobility—number of school changes other than grade-level progression
Mean value of youth with same disability category, student age, and household income
246 to 765 (14.8% to 19.3%)
Weighting Wave 1 Data The percentages and means reported in the data tables throughout this report are estimates
of the true values for the population of youth with disabilities in the NLTS2 age range. The estimates are calculated from responses of parents of NLTS2 sample members and knowledgeable school staff. The response for each sample member is weighted to represent the number of youth in his or her disability category in the kind of LEA (i.e., region, size, and wealth) or special school from which he or she was selected.
Exhibit A-3 illustrates the concept of sample weighting and its effect on percentages or means that are calculated for students with disabilities as a group. In this example, 10 students are included in a sample, 1 from each of 10 disability groups, and each has a hypothetical value regarding whether that student participated in organized group activities outside of school (1 for yes, 0 for no). Six students participate in such activities, which results in an unweighted value of 60% participating. However, that percentage does not accurately represent the national population of students with disabilities because many more students are classified as having a learning disability than orthopedic or other health impairments, for example. Therefore, in calculating a population estimate, weights in the example are applied that correspond to the proportion of students in the population who are from each disability category (actual NLTS2 weights account for disability category and several aspects of the districts from which they were chosen). The sample weights for this example appear in column C. Using these weights, the weighted population estimate is 87%. The percentages in all NLTS2 tables are similarly weighted population estimates, whereas the sample sizes are the actual number of cases on which the weighted estimates are based (similar to the 10 cases in Exhibit A-3).
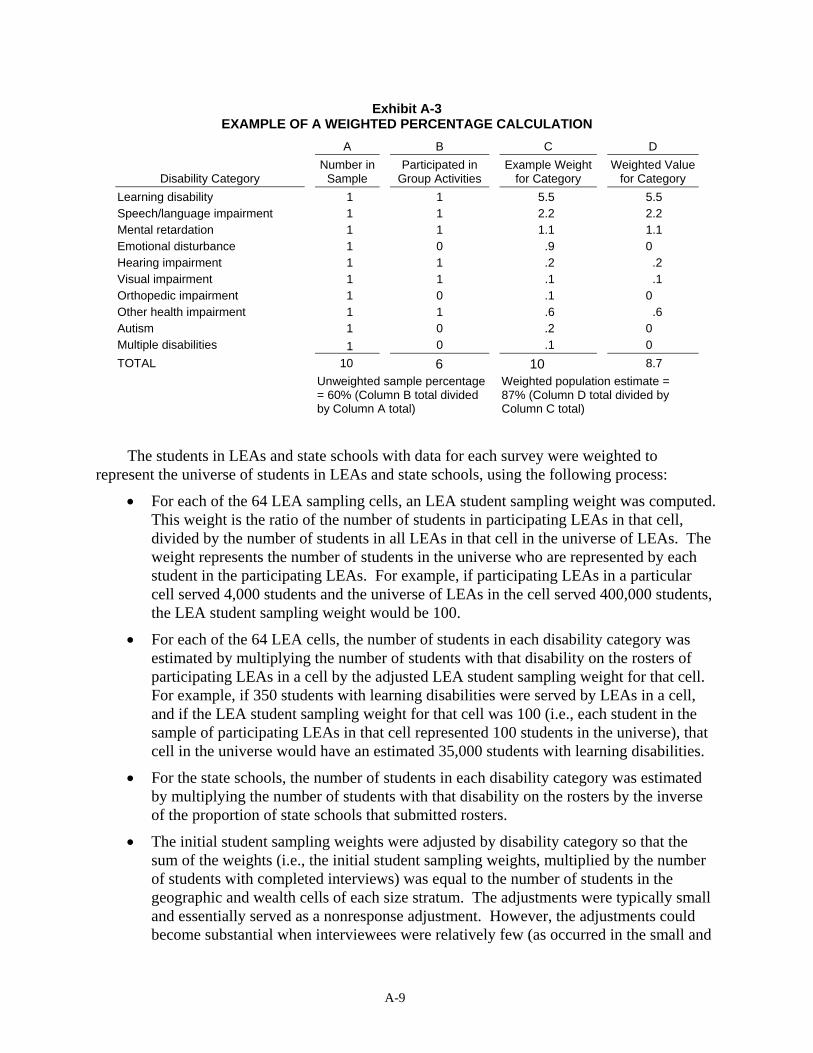
A-9
Exhibit A-3 EXAMPLE OF A WEIGHTED PERCENTAGE CALCULATION
A B C D
Disability Category Number in
Sample Participated in
Group Activities Example Weight
for Category Weighted Value
for Category Learning disability 1 1 5.5 5.5 Speech/language impairment 1 1 2.2 2.2 Mental retardation 1 1 1.1 1.1 Emotional disturbance 1 0 .9 0 Hearing impairment 1 1 .2 .2 Visual impairment 1 1 .1 .1 Orthopedic impairment 1 0 .1 0 Other health impairment 1 1 .6 .6 Autism 1 0 .2 0 Multiple disabilities 1 0 .1 0 TOTAL 10 6 10 8.7 Unweighted sample percentage
= 60% (Column B total divided by Column A total)
Weighted population estimate = 87% (Column D total divided by Column C total)
The students in LEAs and state schools with data for each survey were weighted to represent the universe of students in LEAs and state schools, using the following process:
• For each of the 64 LEA sampling cells, an LEA student sampling weight was computed. This weight is the ratio of the number of students in participating LEAs in that cell, divided by the number of students in all LEAs in that cell in the universe of LEAs. The weight represents the number of students in the universe who are represented by each student in the participating LEAs. For example, if participating LEAs in a particular cell served 4,000 students and the universe of LEAs in the cell served 400,000 students, the LEA student sampling weight would be 100.
• For each of the 64 LEA cells, the number of students in each disability category was estimated by multiplying the number of students with that disability on the rosters of participating LEAs in a cell by the adjusted LEA student sampling weight for that cell. For example, if 350 students with learning disabilities were served by LEAs in a cell, and if the LEA student sampling weight for that cell was 100 (i.e., each student in the sample of participating LEAs in that cell represented 100 students in the universe), that cell in the universe would have an estimated 35,000 students with learning disabilities.
• For the state schools, the number of students in each disability category was estimated by multiplying the number of students with that disability on the rosters by the inverse of the proportion of state schools that submitted rosters.
• The initial student sampling weights were adjusted by disability category so that the sum of the weights (i.e., the initial student sampling weights, multiplied by the number of students with completed interviews) was equal to the number of students in the geographic and wealth cells of each size stratum. The adjustments were typically small and essentially served as a nonresponse adjustment. However, the adjustments could become substantial when interviewees were relatively few (as occurred in the small and
A-10
medium strata for the lowest-incidence disabilities); in those cases, some cells might not include any interviewees, and it was necessary to adjust the weights of other interviewees to compensate. Two constraints were imposed on the adjustments: (1) within each size stratum, the cells’ weights could not vary from the average weight by more than a factor of 2, and (2) the average weight within each size stratum could not be larger than 4 times the overall average weight. These constraints substantially increased the efficiency of the sample at the cost of introducing a small amount of weighting bias (discussed below).
• In a final step, the weights were adjusted so that they summed to the number of students in each disability category, as reported to the Office of Special Education Programs (OSEP) by the states for the 2000-01 school year (U.S. Department of Education, 2002).
The imposition of constraints on the adjusted weights increased sampling efficiency at the cost of introducing a small amount of bias. The average efficiency increased from 51.7% to 67.4%; the largest increases in sampling efficiency occurred for youth with emotional disturbances (from 44.4% to 81.0%) and for those with multiple disabilities (from 32.1% to 56.8%). Biases introduced by the imposition of constraints on the student weights generally were very small. The largest bias in size distribution was for youth with visual impairments (decreasing from 17.1% in the smallest size stratum to 11.6%) and those with autism (decreasing from 21.3% in the smallest size stratum to 17.5%). All other changes in the size distribution were 1.5% or less, and the average absolute change was only .4%. The largest bias in wealth distribution was for those with multiple disabilities (from 22.2% in wealth stratum 3 to 16.6%, and from 18.3% in wealth stratum 4 to 22.0%). All other changes were 2.1% or less, and the average absolute change was only .6%. All biases in regional distribution were 2.1% or less, and the average absolute change was only .5%. Considering the increase in sampling efficiency, these biases are considered acceptable.
The reason for the reduction in the proportion of students represented in the cells mentioned above is that those cells had relatively few students with interview/survey data. For example, small LEAs had only 21 students with visual impairments with data, requiring that they represent an estimated 1,701 students with visual impairments from small LEAs. The weighting program determined that the average weight required (i.e., 81.0) violated the constraints and therefore reduced these weights to a more reasonable value (i.e., 56.2).
Estimating Standard Errors Each estimate reported in the data tables is accompanied by a standard error. A standard
error acknowledges that any population estimate that is calculated from a sample will only approximate the true value for the population. The true population value will fall within the range demarcated by the estimate, plus or minus the standard error, 95% of the time. For example, if the estimate for youth’s having families who help them with homework five or more times a week is 21.3%, with a standard error of 1.4 (as reported in Exhibit 2-1), one can be 95% confident that the true percentage of receiving this level of homework help for the population is between 19.9% and 22.7%.
Because the NLTS2 sample is both stratified and clustered, calculating standard errors by formula is not straightforward. Standard errors for means and proportions were estimated using pseudo-replication, a procedure that is widely used by the U.S. Census Bureau and other federal
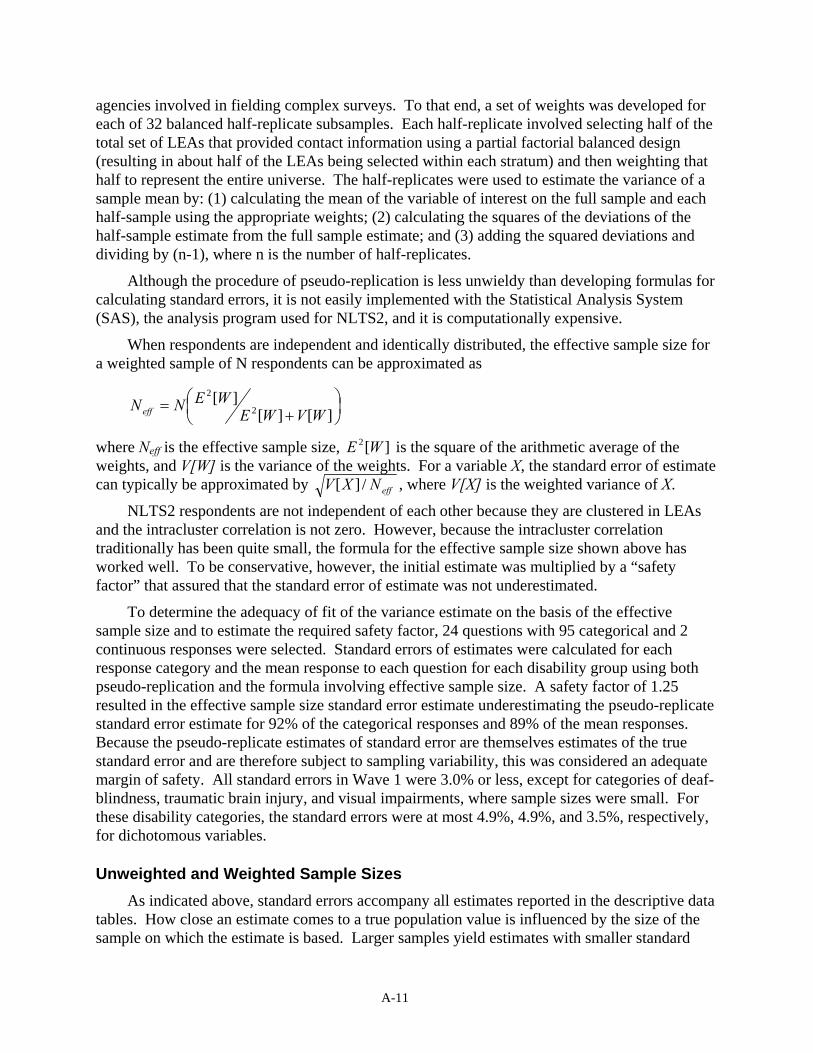
A-11
agencies involved in fielding complex surveys. To that end, a set of weights was developed for each of 32 balanced half-replicate subsamples. Each half-replicate involved selecting half of the total set of LEAs that provided contact information using a partial factorial balanced design (resulting in about half of the LEAs being selected within each stratum) and then weighting that half to represent the entire universe. The half-replicates were used to estimate the variance of a sample mean by: (1) calculating the mean of the variable of interest on the full sample and each half-sample using the appropriate weights; (2) calculating the squares of the deviations of the half-sample estimate from the full sample estimate; and (3) adding the squared deviations and dividing by (n-1), where n is the number of half-replicates.
Although the procedure of pseudo-replication is less unwieldy than developing formulas for calculating standard errors, it is not easily implemented with the Statistical Analysis System (SAS), the analysis program used for NLTS2, and it is computationally expensive.
When respondents are independent and identically distributed, the effective sample size for a weighted sample of N respondents can be approximated as
⎟⎠⎞
⎜⎝⎛
+= ][][
][2
2
WVWEWENNeff
where Neff is the effective sample size, ][2 WE is the square of the arithmetic average of the weights, and V[W] is the variance of the weights. For a variable X, the standard error of estimate can typically be approximated by effNXV /][ , where V[X] is the weighted variance of X.
NLTS2 respondents are not independent of each other because they are clustered in LEAs and the intracluster correlation is not zero. However, because the intracluster correlation traditionally has been quite small, the formula for the effective sample size shown above has worked well. To be conservative, however, the initial estimate was multiplied by a “safety factor” that assured that the standard error of estimate was not underestimated.
To determine the adequacy of fit of the variance estimate on the basis of the effective sample size and to estimate the required safety factor, 24 questions with 95 categorical and 2 continuous responses were selected. Standard errors of estimates were calculated for each response category and the mean response to each question for each disability group using both pseudo-replication and the formula involving effective sample size. A safety factor of 1.25 resulted in the effective sample size standard error estimate underestimating the pseudo-replicate standard error estimate for 92% of the categorical responses and 89% of the mean responses. Because the pseudo-replicate estimates of standard error are themselves estimates of the true standard error and are therefore subject to sampling variability, this was considered an adequate margin of safety. All standard errors in Wave 1 were 3.0% or less, except for categories of deaf-blindness, traumatic brain injury, and visual impairments, where sample sizes were small. For these disability categories, the standard errors were at most 4.9%, 4.9%, and 3.5%, respectively, for dichotomous variables.
Unweighted and Weighted Sample Sizes As indicated above, standard errors accompany all estimates reported in the descriptive data
tables. How close an estimate comes to a true population value is influenced by the size of the sample on which the estimate is based. Larger samples yield estimates with smaller standard
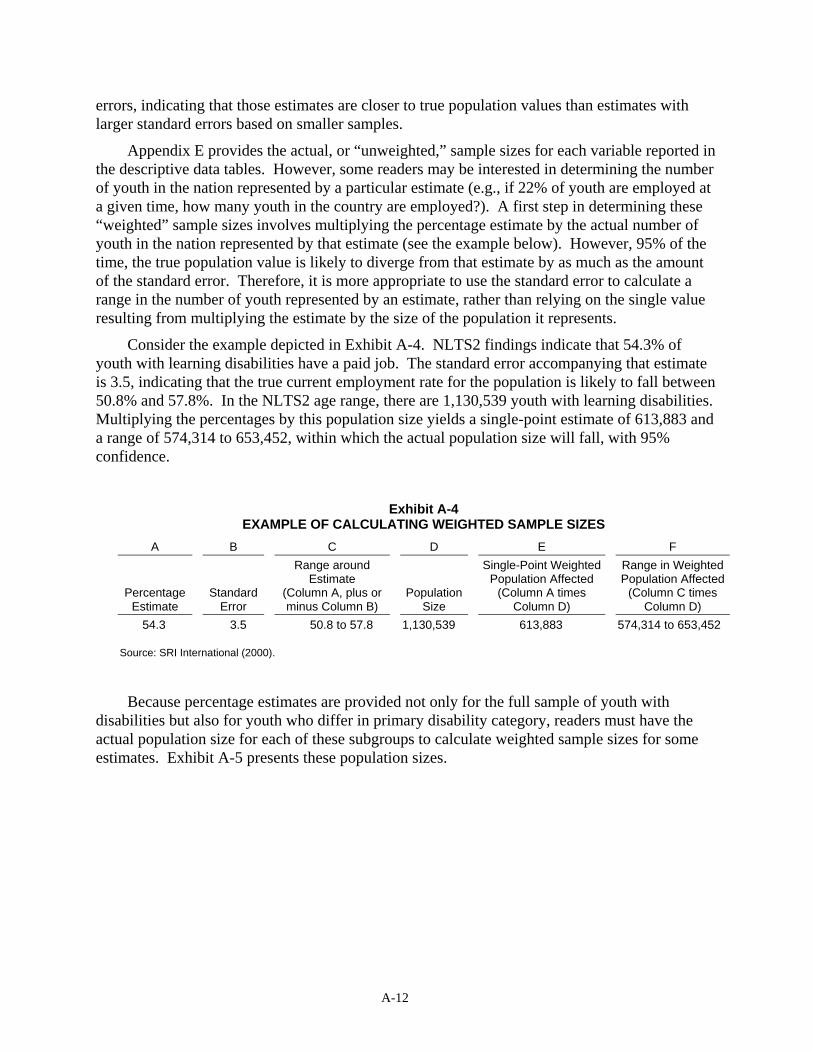
A-12
errors, indicating that those estimates are closer to true population values than estimates with larger standard errors based on smaller samples.
Appendix E provides the actual, or “unweighted,” sample sizes for each variable reported in the descriptive data tables. However, some readers may be interested in determining the number of youth in the nation represented by a particular estimate (e.g., if 22% of youth are employed at a given time, how many youth in the country are employed?). A first step in determining these “weighted” sample sizes involves multiplying the percentage estimate by the actual number of youth in the nation represented by that estimate (see the example below). However, 95% of the time, the true population value is likely to diverge from that estimate by as much as the amount of the standard error. Therefore, it is more appropriate to use the standard error to calculate a range in the number of youth represented by an estimate, rather than relying on the single value resulting from multiplying the estimate by the size of the population it represents.
Consider the example depicted in Exhibit A-4. NLTS2 findings indicate that 54.3% of youth with learning disabilities have a paid job. The standard error accompanying that estimate is 3.5, indicating that the true current employment rate for the population is likely to fall between 50.8% and 57.8%. In the NLTS2 age range, there are 1,130,539 youth with learning disabilities. Multiplying the percentages by this population size yields a single-point estimate of 613,883 and a range of 574,314 to 653,452, within which the actual population size will fall, with 95% confidence.
Exhibit A-4
EXAMPLE OF CALCULATING WEIGHTED SAMPLE SIZES A B C D E F
Percentage Estimate
Standard Error
Range around Estimate
(Column A, plus or minus Column B)
Population Size
Single-Point Weighted Population Affected
(Column A times Column D)
Range in Weighted Population Affected
(Column C times Column D)
54.3 3.5 50.8 to 57.8 1,130,539 613,883 574,314 to 653,452 Source: SRI International (2000).
Because percentage estimates are provided not only for the full sample of youth with disabilities but also for youth who differ in primary disability category, readers must have the actual population size for each of these subgroups to calculate weighted sample sizes for some estimates. Exhibit A-5 presents these population sizes.
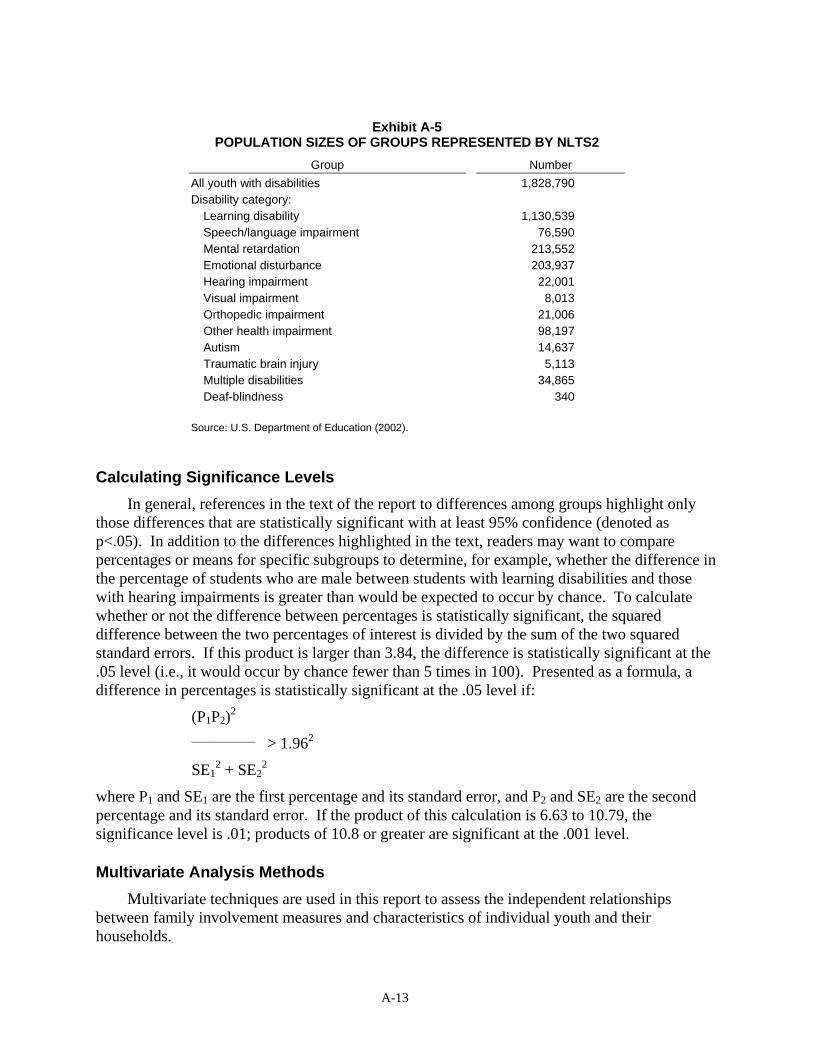
A-13
Exhibit A-5
POPULATION SIZES OF GROUPS REPRESENTED BY NLTS2 Group Number
All youth with disabilities 1,828,790 Disability category:
Learning disability 1,130,539 Speech/language impairment 76,590 Mental retardation 213,552 Emotional disturbance 203,937 Hearing impairment 22,001 Visual impairment 8,013 Orthopedic impairment 21,006 Other health impairment 98,197 Autism 14,637 Traumatic brain injury 5,113 Multiple disabilities 34,865 Deaf-blindness 340
Source: U.S. Department of Education (2002).
Calculating Significance Levels In general, references in the text of the report to differences among groups highlight only
those differences that are statistically significant with at least 95% confidence (denoted as p<.05). In addition to the differences highlighted in the text, readers may want to compare percentages or means for specific subgroups to determine, for example, whether the difference in the percentage of students who are male between students with learning disabilities and those with hearing impairments is greater than would be expected to occur by chance. To calculate whether or not the difference between percentages is statistically significant, the squared difference between the two percentages of interest is divided by the sum of the two squared standard errors. If this product is larger than 3.84, the difference is statistically significant at the .05 level (i.e., it would occur by chance fewer than 5 times in 100). Presented as a formula, a difference in percentages is statistically significant at the .05 level if:
(P1P2)2 ____________ > 1.962
SE12 + SE2
2
where P1 and SE1 are the first percentage and its standard error, and P2 and SE2 are the second percentage and its standard error. If the product of this calculation is 6.63 to 10.79, the significance level is .01; products of 10.8 or greater are significant at the .001 level.
Multivariate Analysis Methods Multivariate techniques are used in this report to assess the independent relationships
between family involvement measures and characteristics of individual youth and their households.
A-14
Multiple linear regression analysis is used to examine the variation in ordinal dependent variables (e.g., frequency of helping with homework and participation in school-based activities scale score). Multiple linear regression equations involve a linear combination of a set of independent variables in the following algebraic form: Y′ = a + b1X1 + b2X2 + ... + bnXn, where Y′ is the predicted value of the dependent variable, a is the constant or Y intercept, bs are the partial regression coefficients, and Xs are the values of the independent variables. When the dependent variables are dichotomous (e.g., whether families attended IEP meetings), logistic regression is used [e.g., log(probability of attending/not attending IEP meetings) = a + b1X1 + b2X2 + ... + bnXn]. Both types of regression allow the modeling of the simultaneous influence of predictor variables on the dependent variable and provide estimates of model fit. For ease of interpretation, coefficients of logistic regression analyses are transformed into differences in the probabilities of the dependent variables’ occurring, given a specified increment of difference in the independent variables.
NLTS2 multivariate analyses and correlations are unweighted. Results are reported for analyses that include the full set of individual and family factors simultaneously. Appendix C includes the estimated differences for the models presented in Chapter 4.
Correlations among Types of Family Involvement Multivariate analyses presented in Chapter 4 related to frequency of participating in school-
based activities combine parent responses to questions about the three types of involvement that are most highly correlated: frequency of attending a school meeting, attending a school or class event, and volunteering at the school. Participation in parent-teacher conferences is not included in the scale because family involvement in parent-teacher conferences is less correlated with each of the other types of school-based activities than they are with each other. Exhibit A-6 presents correlations among types of family involvement.
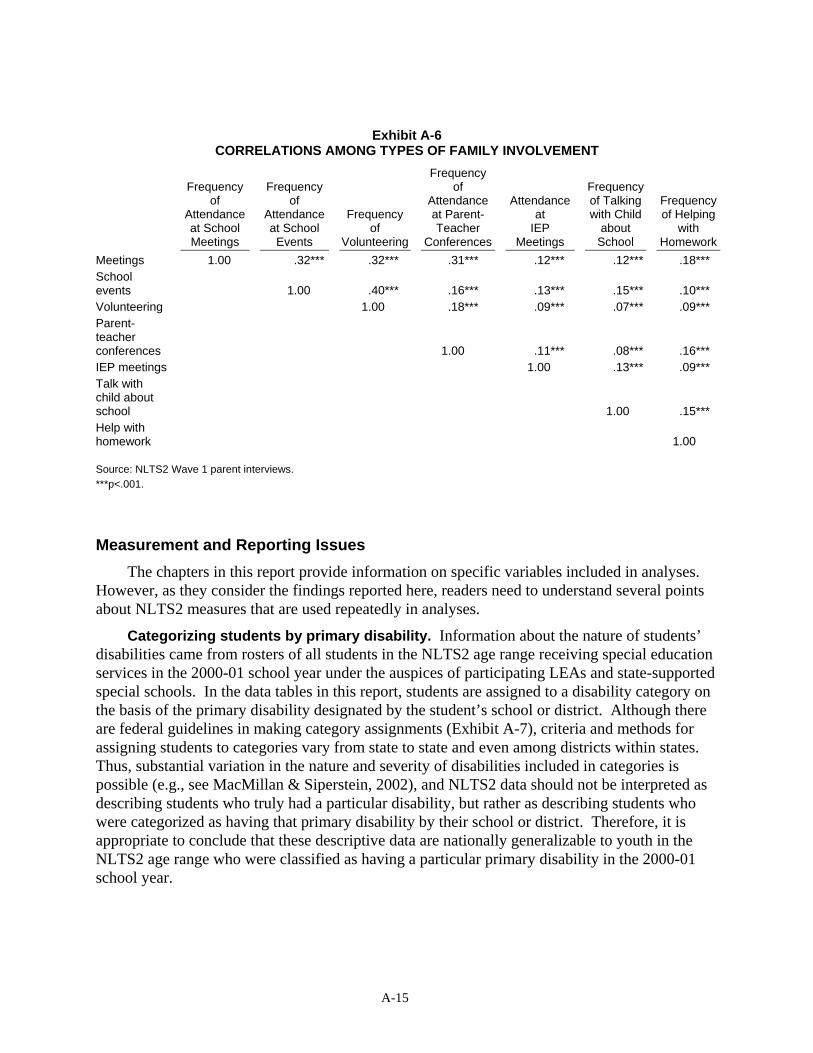
A-15
Exhibit A-6
CORRELATIONS AMONG TYPES OF FAMILY INVOLVEMENT
Frequency of
Attendance at School Meetings
Frequency of
Attendance at School Events
Frequency of
Volunteering
Frequency of
Attendance at Parent-Teacher
Conferences
Attendance at
IEP Meetings
Frequency of Talking with Child
about School
Frequency of Helping
with Homework
Meetings 1.00 .32*** .32*** .31*** .12*** .12*** .18*** School events 1.00 .40*** .16*** .13*** .15*** .10*** Volunteering 1.00 .18*** .09*** .07*** .09*** Parent-teacher conferences 1.00 .11*** .08*** .16*** IEP meetings 1.00 .13*** .09*** Talk with child about school 1.00 .15*** Help with homework 1.00 Source: NLTS2 Wave 1 parent interviews. ***p<.001.
Measurement and Reporting Issues The chapters in this report provide information on specific variables included in analyses.
However, as they consider the findings reported here, readers need to understand several points about NLTS2 measures that are used repeatedly in analyses.
Categorizing students by primary disability. Information about the nature of students’ disabilities came from rosters of all students in the NLTS2 age range receiving special education services in the 2000-01 school year under the auspices of participating LEAs and state-supported special schools. In the data tables in this report, students are assigned to a disability category on the basis of the primary disability designated by the student’s school or district. Although there are federal guidelines in making category assignments (Exhibit A-7), criteria and methods for assigning students to categories vary from state to state and even among districts within states. Thus, substantial variation in the nature and severity of disabilities included in categories is possible (e.g., see MacMillan & Siperstein, 2002), and NLTS2 data should not be interpreted as describing students who truly had a particular disability, but rather as describing students who were categorized as having that primary disability by their school or district. Therefore, it is appropriate to conclude that these descriptive data are nationally generalizable to youth in the NLTS2 age range who were classified as having a particular primary disability in the 2000-01 school year.
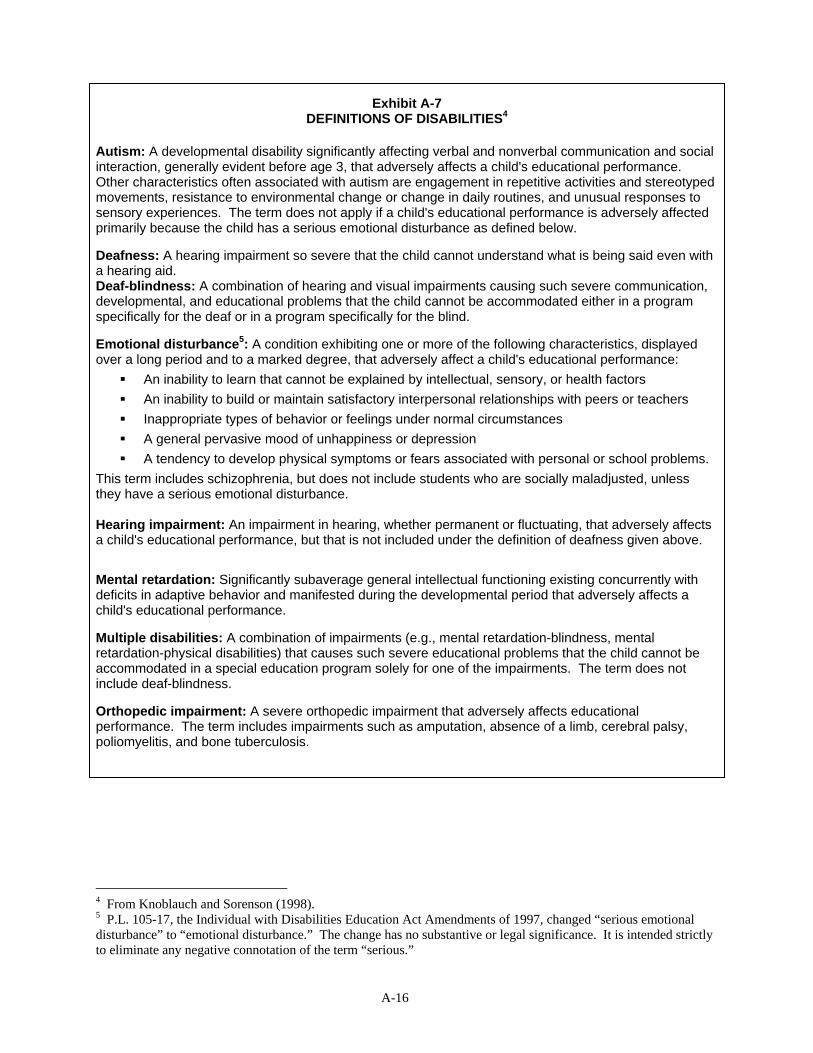
A-16
Exhibit A-7 DEFINITIONS OF DISABILITIES4
Autism: A developmental disability significantly affecting verbal and nonverbal communication and social interaction, generally evident before age 3, that adversely affects a child's educational performance. Other characteristics often associated with autism are engagement in repetitive activities and stereotyped movements, resistance to environmental change or change in daily routines, and unusual responses to sensory experiences. The term does not apply if a child's educational performance is adversely affected primarily because the child has a serious emotional disturbance as defined below. Deafness: A hearing impairment so severe that the child cannot understand what is being said even with a hearing aid. Deaf-blindness: A combination of hearing and visual impairments causing such severe communication, developmental, and educational problems that the child cannot be accommodated either in a program specifically for the deaf or in a program specifically for the blind. Emotional disturbance5: A condition exhibiting one or more of the following characteristics, displayed over a long period and to a marked degree, that adversely affect a child's educational performance:
An inability to learn that cannot be explained by intellectual, sensory, or health factors
An inability to build or maintain satisfactory interpersonal relationships with peers or teachers
Inappropriate types of behavior or feelings under normal circumstances
A general pervasive mood of unhappiness or depression
A tendency to develop physical symptoms or fears associated with personal or school problems.
This term includes schizophrenia, but does not include students who are socially maladjusted, unless they have a serious emotional disturbance. Hearing impairment: An impairment in hearing, whether permanent or fluctuating, that adversely affects a child's educational performance, but that is not included under the definition of deafness given above.
Mental retardation: Significantly subaverage general intellectual functioning existing concurrently with deficits in adaptive behavior and manifested during the developmental period that adversely affects a child's educational performance. Multiple disabilities: A combination of impairments (e.g., mental retardation-blindness, mental retardation-physical disabilities) that causes such severe educational problems that the child cannot be accommodated in a special education program solely for one of the impairments. The term does not include deaf-blindness. Orthopedic impairment: A severe orthopedic impairment that adversely affects educational performance. The term includes impairments such as amputation, absence of a limb, cerebral palsy, poliomyelitis, and bone tuberculosis.
4 From Knoblauch and Sorenson (1998). 5 P.L. 105-17, the Individual with Disabilities Education Act Amendments of 1997, changed “serious emotional disturbance” to “emotional disturbance.” The change has no substantive or legal significance. It is intended strictly to eliminate any negative connotation of the term “serious.”
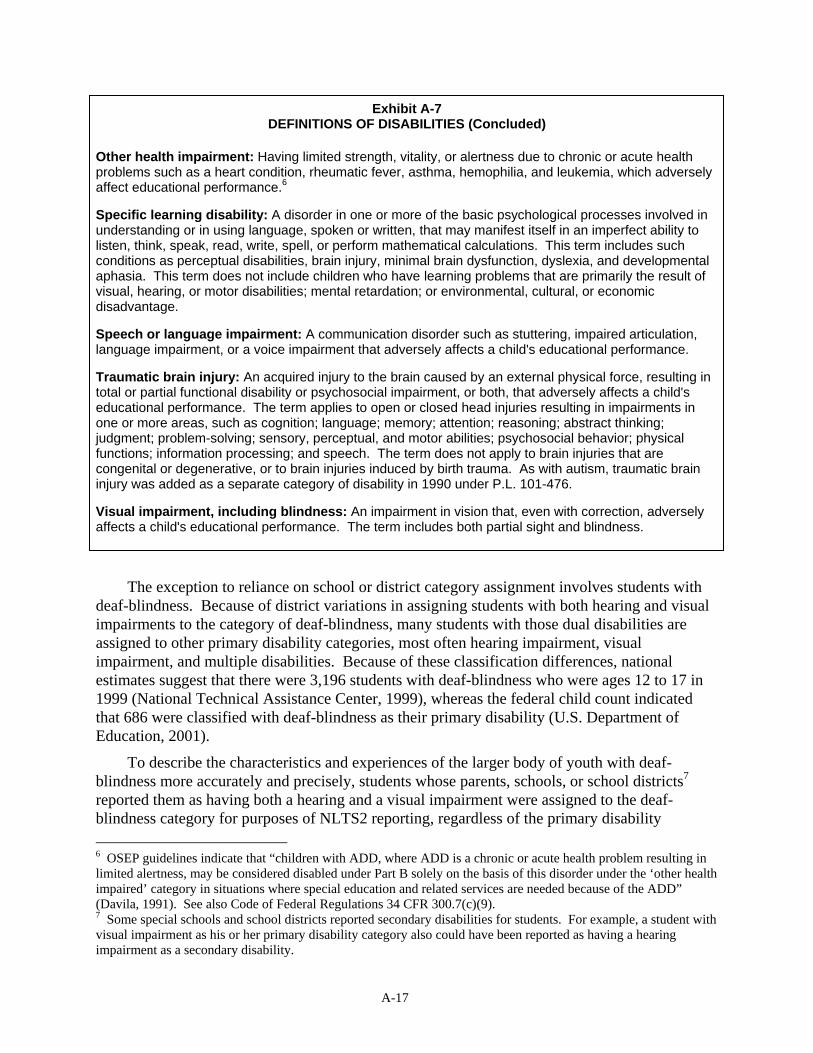
A-17
Exhibit A-7 DEFINITIONS OF DISABILITIES (Concluded)
Other health impairment: Having limited strength, vitality, or alertness due to chronic or acute health problems such as a heart condition, rheumatic fever, asthma, hemophilia, and leukemia, which adversely affect educational performance.6 Specific learning disability: A disorder in one or more of the basic psychological processes involved in understanding or in using language, spoken or written, that may manifest itself in an imperfect ability to listen, think, speak, read, write, spell, or perform mathematical calculations. This term includes such conditions as perceptual disabilities, brain injury, minimal brain dysfunction, dyslexia, and developmental aphasia. This term does not include children who have learning problems that are primarily the result of visual, hearing, or motor disabilities; mental retardation; or environmental, cultural, or economic disadvantage. Speech or language impairment: A communication disorder such as stuttering, impaired articulation, language impairment, or a voice impairment that adversely affects a child's educational performance. Traumatic brain injury: An acquired injury to the brain caused by an external physical force, resulting in total or partial functional disability or psychosocial impairment, or both, that adversely affects a child's educational performance. The term applies to open or closed head injuries resulting in impairments in one or more areas, such as cognition; language; memory; attention; reasoning; abstract thinking; judgment; problem-solving; sensory, perceptual, and motor abilities; psychosocial behavior; physical functions; information processing; and speech. The term does not apply to brain injuries that are congenital or degenerative, or to brain injuries induced by birth trauma. As with autism, traumatic brain injury was added as a separate category of disability in 1990 under P.L. 101-476. Visual impairment, including blindness: An impairment in vision that, even with correction, adversely affects a child's educational performance. The term includes both partial sight and blindness.
The exception to reliance on school or district category assignment involves students with deaf-blindness. Because of district variations in assigning students with both hearing and visual impairments to the category of deaf-blindness, many students with those dual disabilities are assigned to other primary disability categories, most often hearing impairment, visual impairment, and multiple disabilities. Because of these classification differences, national estimates suggest that there were 3,196 students with deaf-blindness who were ages 12 to 17 in 1999 (National Technical Assistance Center, 1999), whereas the federal child count indicated that 686 were classified with deaf-blindness as their primary disability (U.S. Department of Education, 2001).
To describe the characteristics and experiences of the larger body of youth with deaf-blindness more accurately and precisely, students whose parents, schools, or school districts7 reported them as having both a hearing and a visual impairment were assigned to the deaf-blindness category for purposes of NLTS2 reporting, regardless of the primary disability 6 OSEP guidelines indicate that “children with ADD, where ADD is a chronic or acute health problem resulting in limited alertness, may be considered disabled under Part B solely on the basis of this disorder under the ‘other health impaired’ category in situations where special education and related services are needed because of the ADD” (Davila, 1991). See also Code of Federal Regulations 34 CFR 300.7(c)(9). 7 Some special schools and school districts reported secondary disabilities for students. For example, a student with visual impairment as his or her primary disability category also could have been reported as having a hearing impairment as a secondary disability.
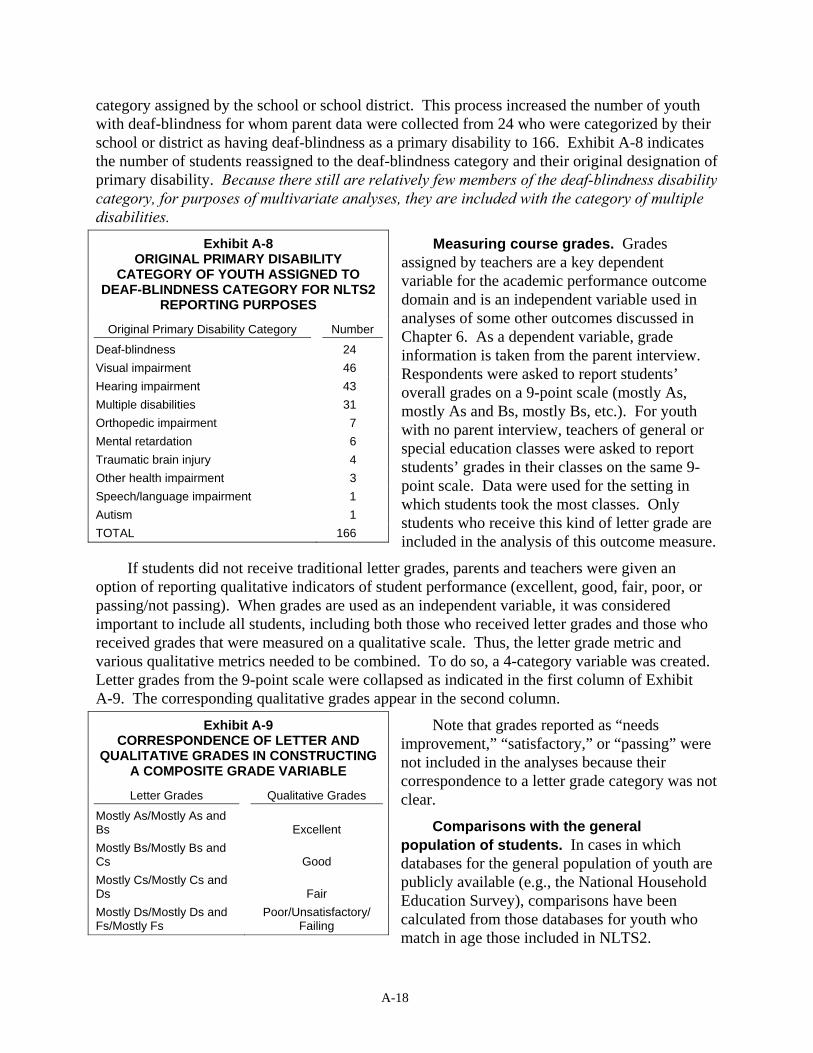
A-18
category assigned by the school or school district. This process increased the number of youth with deaf-blindness for whom parent data were collected from 24 who were categorized by their school or district as having deaf-blindness as a primary disability to 166. Exhibit A-8 indicates the number of students reassigned to the deaf-blindness category and their original designation of primary disability. Because there still are relatively few members of the deaf-blindness disability category, for purposes of multivariate analyses, they are included with the category of multiple disabilities.
Measuring course grades. Grades assigned by teachers are a key dependent variable for the academic performance outcome domain and is an independent variable used in analyses of some other outcomes discussed in Chapter 6. As a dependent variable, grade information is taken from the parent interview. Respondents were asked to report students’ overall grades on a 9-point scale (mostly As, mostly As and Bs, mostly Bs, etc.). For youth with no parent interview, teachers of general or special education classes were asked to report students’ grades in their classes on the same 9-point scale. Data were used for the setting in which students took the most classes. Only students who receive this kind of letter grade are included in the analysis of this outcome measure.
If students did not receive traditional letter grades, parents and teachers were given an option of reporting qualitative indicators of student performance (excellent, good, fair, poor, or passing/not passing). When grades are used as an independent variable, it was considered important to include all students, including both those who received letter grades and those who received grades that were measured on a qualitative scale. Thus, the letter grade metric and various qualitative metrics needed to be combined. To do so, a 4-category variable was created. Letter grades from the 9-point scale were collapsed as indicated in the first column of Exhibit A-9. The corresponding qualitative grades appear in the second column.
Note that grades reported as “needs improvement,” “satisfactory,” or “passing” were not included in the analyses because their correspondence to a letter grade category was not clear.
Comparisons with the general population of students. In cases in which databases for the general population of youth are publicly available (e.g., the National Household Education Survey), comparisons have been calculated from those databases for youth who match in age those included in NLTS2.
Exhibit A-8 ORIGINAL PRIMARY DISABILITY
CATEGORY OF YOUTH ASSIGNED TO DEAF-BLINDNESS CATEGORY FOR NLTS2
REPORTING PURPOSES
Original Primary Disability Category Number
Deaf-blindness 24 Visual impairment 46 Hearing impairment 43 Multiple disabilities 31 Orthopedic impairment 7 Mental retardation 6 Traumatic brain injury 4 Other health impairment 3 Speech/language impairment 1 Autism 1 TOTAL 166
Exhibit A-9 CORRESPONDENCE OF LETTER AND
QUALITATIVE GRADES IN CONSTRUCTING A COMPOSITE GRADE VARIABLE
Letter Grades Qualitative Grades
Mostly As/Mostly As and Bs Excellent Mostly Bs/Mostly Bs and Cs Good Mostly Cs/Mostly Cs and Ds Fair Mostly Ds/Mostly Ds and Fs/Mostly Fs
Poor/Unsatisfactory/ Failing

A-19
However, some comparisons have been made by using published data. For some of these comparisons, differences in samples (e.g., ages of students) or measurement (e.g., question wording on surveys) reduce the direct comparability of NLTS2 and general population data. When these limitations affect the comparisons, they are pointed out in the text, and their implications for the comparisons are noted.
Reporting statistics. Statistics are not reported for groups with fewer than 35 members. Statistics with a decimal of .5 are rounded to the nearest even number.
A-20
References
Davila, R. R. (1991). Clarification of policy to address the needs of children with attention deficit disorders within general and/or special education. Memorandum to Chief State School Officers. Washington, DC: U.S. Department of Education, Office of Special Education and Rehabilitative Services.
Fisher, G. M. (1992). The development and history of the poverty thresholds. Social Security Bulletin, 55(4), 314.
Knoblauch, B., & Sorenson, B. (1998). IDEA’s definition of disabilities (ERIC Digest E560). (ERIC Document Reproduction Service No. ED429396). Available at: http://www.eric.ed.gov/ERICWebPortal/contentdelivery/servlet/ERICServlet?accno=ED429396
MacMillan, D. L., & Siperstein, G. N. (2002). Learning disabilities as operationally defined by schools. In R. Bradley, L. Danielson, & D. P. Hallahan (Eds.), Identification of learning disabilities. Research to practice. Mahwah, NJ: Lawrence Erlbaum Associates Publishers.
National Technical Assistance Center. (1999). National deaf-blind child count summary. Monmouth, OR: Teaching Research Division, Western Oregon University.
SRI International. (2000). National Longitudinal Transition Study II (NLTS2): Sampling plan. Menlo Park, CA: SRI International.
Quality Education Data. (QED, 2000). National education database, Data users guide, Version 4.8. Denver, CO: Author.
U.S. Department of Education. (2001). Table AA6: Number of children served under IDEA, Part B by disability and age, during the 1999-2000 school year. Twenty-third annual report to Congress on the implementation of the Individuals with Disabilities Education Act (Appendix A, p. A14). Washington, DC: Author.
U.S. Department of Education. (2002). Table AA7: Number of children served under IDEA, Part B by disability and age, during the 2000-01 school year. Twenty-fourth annual report to Congress on the implementation of the Individuals with Disabilities Education Act (Appendix A, p. A17). Washington, DC: Author.

B-1
Appendix B
DEMOGRAPHIC CHARACTERISTICS OF YOUTH WITH DISABILITIES AND THEIR HOUSEHOLDS
Understanding the characteristics of youth with disabilities is a crucial foundation for serving them well. Youth bring to their educational experiences a complex history and background that are shaped by demographic characteristics, such as age, gender, and ethnicity; by family background and circumstances, such as parents’ education and household income; and by the nature of the students’ disabilities. These factors help structure the involvement of youth at home, at school, and in the community, as well as the ways in which they, their parents, school staff, and other service personnel work together toward positive results for youth. Thus, individual and household characteristics are essential elements of the context for many major life experiences of youth, and understanding that context will inform how these experiences are interpreted.
A brief summary of selected individual characteristics and household risk factors of youth with disabilities is presented below.1
Individual Characteristics For youth, age is a major determinant of development that influences their competence and
independence. Yet, the rate of maturation among teens varies considerably, resulting in sizable differences in abilities and activities among youth of the same age. Gender is a defining human characteristic, and during adolescence, when young people are exploring their sexuality and gender roles, it can shape their experiences and choices in powerful ways. In addition, racial/ethnic and language background can be associated with rich cultural traditions, patterns of relationships within families and communities, and strong group identification, which can generate important differences in values, perspectives, expectations, and practices.
The importance of understanding the demographic makeup of the population of youth with disabilities is crucial in interpreting NLTS2 findings for the group as a whole and for youth with particular disability classifications. That makeup also serves as a foundation for interpreting comparisons between youth with disabilities and those in the general population.
The primary disability classifications among youth with disabilities are reported below, and other traits that are important to their experiences are described. These classifications and traits are presented for youth with disabilities as a whole, compared with the general population when possible, and then described as they vary for youth with different primary disability classifications.
1 A more detailed discussion of these characteristics can be found in Levine, Wagner, and Marder (2003) and Levine, Marder, Wagner, and Cardoso (2003).
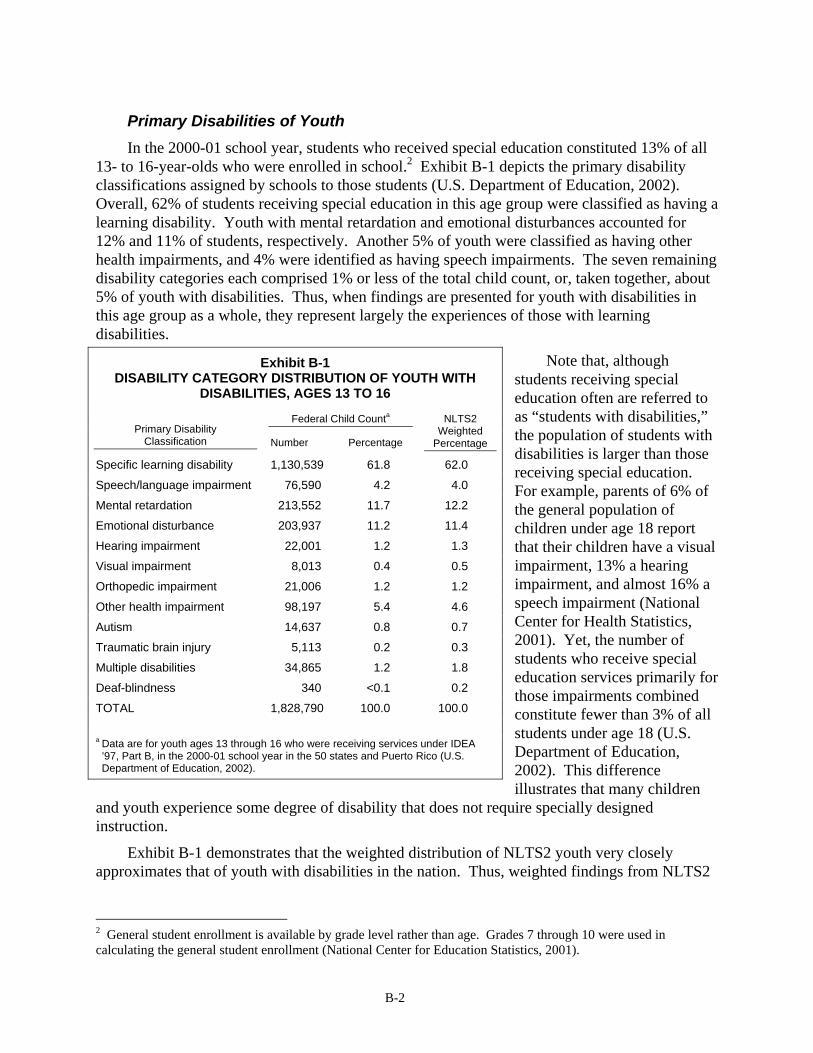
B-2
Primary Disabilities of Youth In the 2000-01 school year, students who received special education constituted 13% of all
13- to 16-year-olds who were enrolled in school.2 Exhibit B-1 depicts the primary disability classifications assigned by schools to those students (U.S. Department of Education, 2002). Overall, 62% of students receiving special education in this age group were classified as having a learning disability. Youth with mental retardation and emotional disturbances accounted for 12% and 11% of students, respectively. Another 5% of youth were classified as having other health impairments, and 4% were identified as having speech impairments. The seven remaining disability categories each comprised 1% or less of the total child count, or, taken together, about 5% of youth with disabilities. Thus, when findings are presented for youth with disabilities in this age group as a whole, they represent largely the experiences of those with learning disabilities.
Note that, although students receiving special education often are referred to as “students with disabilities,” the population of students with disabilities is larger than those receiving special education. For example, parents of 6% of the general population of children under age 18 report that their children have a visual impairment, 13% a hearing impairment, and almost 16% a speech impairment (National Center for Health Statistics, 2001). Yet, the number of students who receive special education services primarily for those impairments combined constitute fewer than 3% of all students under age 18 (U.S. Department of Education, 2002). This difference illustrates that many children
and youth experience some degree of disability that does not require specially designed instruction.
Exhibit B-1 demonstrates that the weighted distribution of NLTS2 youth very closely approximates that of youth with disabilities in the nation. Thus, weighted findings from NLTS2
2 General student enrollment is available by grade level rather than age. Grades 7 through 10 were used in calculating the general student enrollment (National Center for Education Statistics, 2001).
Exhibit B-1 DISABILITY CATEGORY DISTRIBUTION OF YOUTH WITH
DISABILITIES, AGES 13 TO 16
Federal Child Counta Primary Disability
Classification Number Percentage
NLTS2 Weighted
Percentage
Specific learning disability 1,130,539 61.8 62.0
Speech/language impairment 76,590 4.2 4.0
Mental retardation 213,552 11.7 12.2
Emotional disturbance 203,937 11.2 11.4
Hearing impairment 22,001 1.2 1.3
Visual impairment 8,013 0.4 0.5
Orthopedic impairment 21,006 1.2 1.2
Other health impairment 98,197 5.4 4.6
Autism 14,637 0.8 0.7
Traumatic brain injury 5,113 0.2 0.3
Multiple disabilities 34,865 1.2 1.8
Deaf-blindness 340 <0.1 0.2
TOTAL 1,828,790 100.0 100.0 a Data are for youth ages 13 through 16 who were receiving services under IDEA
’97, Part B, in the 2000-01 school year in the 50 states and Puerto Rico (U.S. Department of Education, 2002).
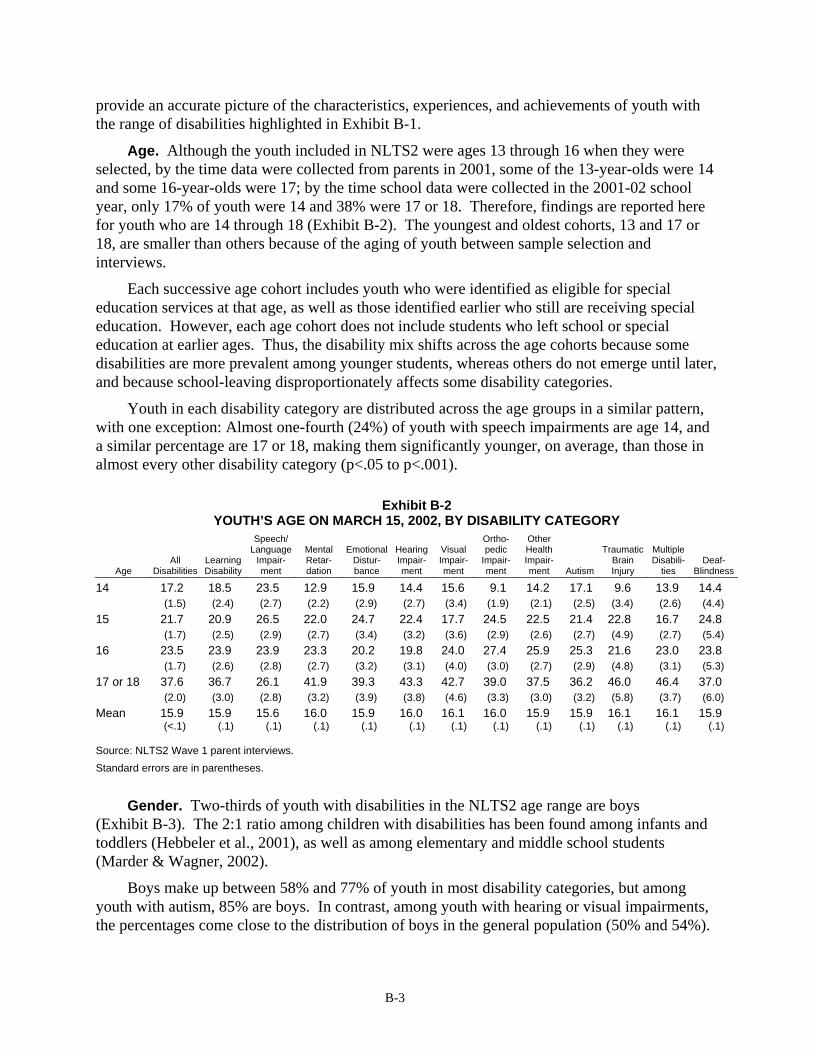
B-3
provide an accurate picture of the characteristics, experiences, and achievements of youth with the range of disabilities highlighted in Exhibit B-1.
Age. Although the youth included in NLTS2 were ages 13 through 16 when they were selected, by the time data were collected from parents in 2001, some of the 13-year-olds were 14 and some 16-year-olds were 17; by the time school data were collected in the 2001-02 school year, only 17% of youth were 14 and 38% were 17 or 18. Therefore, findings are reported here for youth who are 14 through 18 (Exhibit B-2). The youngest and oldest cohorts, 13 and 17 or 18, are smaller than others because of the aging of youth between sample selection and interviews.
Each successive age cohort includes youth who were identified as eligible for special education services at that age, as well as those identified earlier who still are receiving special education. However, each age cohort does not include students who left school or special education at earlier ages. Thus, the disability mix shifts across the age cohorts because some disabilities are more prevalent among younger students, whereas others do not emerge until later, and because school-leaving disproportionately affects some disability categories.
Youth in each disability category are distributed across the age groups in a similar pattern, with one exception: Almost one-fourth (24%) of youth with speech impairments are age 14, and a similar percentage are 17 or 18, making them significantly younger, on average, than those in almost every other disability category (p<.05 to p<.001).
Exhibit B-2 YOUTH’S AGE ON MARCH 15, 2002, BY DISABILITY CATEGORY
Age All
Disabilities Learning Disability
Speech/ Language
Impair-ment
Mental Retar- dation
Emotional Distur-bance
Hearing Impair-ment
Visual Impair-ment
Ortho-pedic
Impair-ment
Other Health Impair-ment Autism
Traumatic Brain Injury
Multiple Disabili-
ties Deaf-
Blindness
14 17.2 18.5 23.5 12.9 15.9 14.4 15.6 9.1 14.2 17.1 9.6 13.9 14.4 (1.5) (2.4) (2.7) (2.2) (2.9) (2.7) (3.4) (1.9) (2.1) (2.5) (3.4) (2.6) (4.4) 15 21.7 20.9 26.5 22.0 24.7 22.4 17.7 24.5 22.5 21.4 22.8 16.7 24.8 (1.7) (2.5) (2.9) (2.7) (3.4) (3.2) (3.6) (2.9) (2.6) (2.7) (4.9) (2.7) (5.4) 16 23.5 23.9 23.9 23.3 20.2 19.8 24.0 27.4 25.9 25.3 21.6 23.0 23.8 (1.7) (2.6) (2.8) (2.7) (3.2) (3.1) (4.0) (3.0) (2.7) (2.9) (4.8) (3.1) (5.3) 17 or 18 37.6 36.7 26.1 41.9 39.3 43.3 42.7 39.0 37.5 36.2 46.0 46.4 37.0 (2.0) (3.0) (2.8) (3.2) (3.9) (3.8) (4.6) (3.3) (3.0) (3.2) (5.8) (3.7) (6.0) Mean 15.9 15.9 15.6 16.0 15.9 16.0 16.1 16.0 15.9 15.9 16.1 16.1 15.9 (<.1) (.1) (.1) (.1) (.1) (.1) (.1) (.1) (.1) (.1) (.1) (.1) (.1)
Source: NLTS2 Wave 1 parent interviews. Standard errors are in parentheses.
Gender. Two-thirds of youth with disabilities in the NLTS2 age range are boys (Exhibit B-3). The 2:1 ratio among children with disabilities has been found among infants and toddlers (Hebbeler et al., 2001), as well as among elementary and middle school students (Marder & Wagner, 2002).
Boys make up between 58% and 77% of youth in most disability categories, but among youth with autism, 85% are boys. In contrast, among youth with hearing or visual impairments, the percentages come close to the distribution of boys in the general population (50% and 54%).
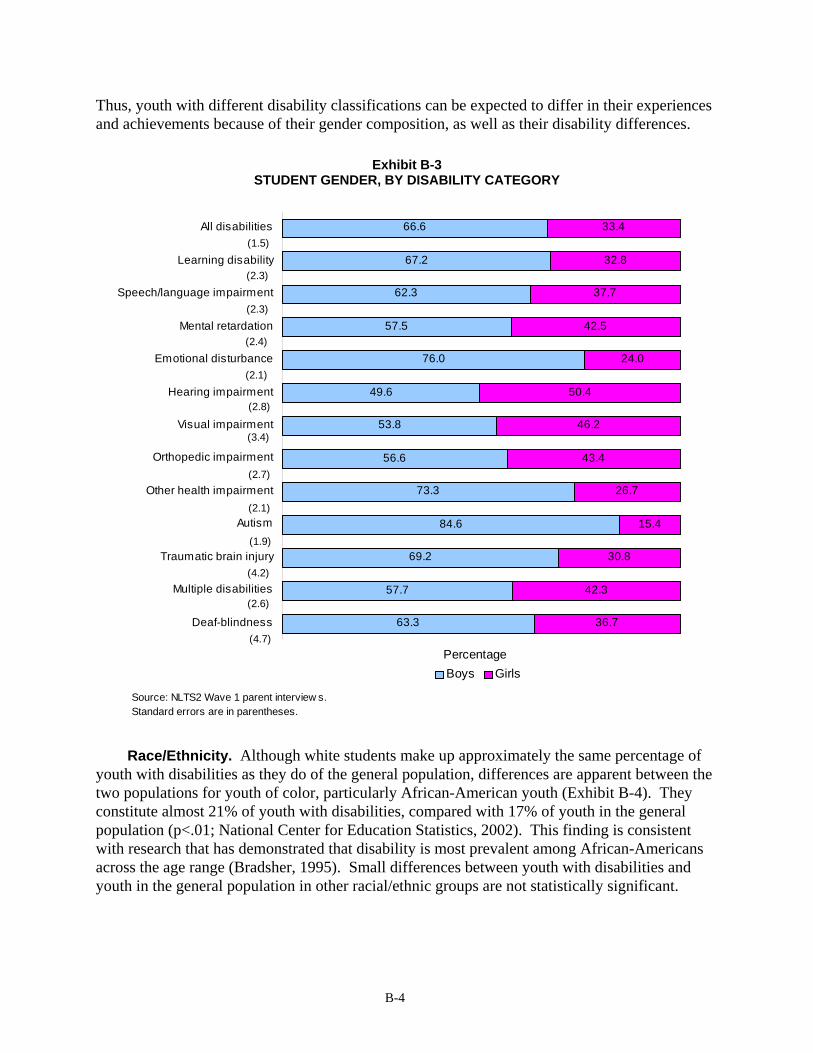
B-4
Thus, youth with different disability classifications can be expected to differ in their experiences and achievements because of their gender composition, as well as their disability differences.
Exhibit B-3 STUDENT GENDER, BY DISABILITY CATEGORY
Race/Ethnicity. Although white students make up approximately the same percentage of youth with disabilities as they do of the general population, differences are apparent between the two populations for youth of color, particularly African-American youth (Exhibit B-4). They constitute almost 21% of youth with disabilities, compared with 17% of youth in the general population (p<.01; National Center for Education Statistics, 2002). This finding is consistent with research that has demonstrated that disability is most prevalent among African-Americans across the age range (Bradsher, 1995). Small differences between youth with disabilities and youth in the general population in other racial/ethnic groups are not statistically significant.
63.3
57.7
69.2
84.6
73.3
56.6
53.8
49.6
76.0
57.5
62.3
67.2
66.6
36.7
42.3
30.8
15.4
26.7
43.4
46.2
50.4
24.0
42.5
37.7
32.8
33.4
Deaf-blindness
Multiple disabilities
Traumatic brain injury
Autism
Other health impairment
Orthopedic impairment
Visual impairment
Hearing impairment
Emotional disturbance
Mental retardation
Speech/language impairment
Learning disability
All disabilities
Boys Girls
Source: NLTS2 Wave 1 parent interview s.Standard errors are in parentheses.
(1.5)
(2.3)
(2.4)
(2.3)
(2.1)
(2.8)
(3.4)
(2.7)
(2.1)
(1.9)
(4.2)
(2.6)
(4.7)Percentage

B-5
Exhibit B-4
RACIAL/ETHNIC BACKGROUNDS OF YOUTH, BY DISABILITY CATEGORY
All
Disabilities Learning Disability
Speech/ Language
Impair-ment
Mental Retarda-
tion
Emotional Distur-bance
Hearing Impair-ment
Visual Impair-ment
Ortho-pedic
Impair-ment
Other Health Impair-ment Autism
Traumatic Brain Injury
Multiple Dis-
abilities
Deaf-Blind-ness
Percentage whose race/ ethnicity is:
White 62.1 62.3 64.7 54.8 61.4 59.9 62.1 64.3 76.6 62.0 68.5 65.6 62.4 (1.5) (2.3) (2.3) (2.4) (2.4) (2.8) (3.4) (2.6) (2.0) (2.6) (4.2) (2.5) (4.7)African-American
20.7 (1.3)
18.4 (1.9)
17.7 (1.8)
33.3 (2.3)
25.0 (2.2)
17.5(2.1)
20.1(2.8)
15.5(2.0)
13.3 (1.6)
23.7 (2.3)
17.9 (3.5)
18.4(2.1)
14.7(3.4)
Hispanic 14.1 16.2 14.2 9.6 10.2 17.3 14.0 16.4 7.7 8.9 10.0 11.6 19.5 (1.1) (1.8) (1.7) (1.4) (1.5) (2.1) (2.4) (2.0) (1.2) (1.5) (2.7) (1.7) (3.9)Asian/Pacific Islander
1.3 (.4)
1.0 (.5)
2.1 (.7)
1.2 (.5)
1.4 (.6)
4.1(1.1)
3.0(1.2)
3.2(1.0)
1.2 (.5)
4.0 (1.0)
2.3 (1.4)
1.8(.7)
2.9(1.6)
American Indian/Alaska Native
1.2 (.3)
1.3 (.5)
0.9 (.5)
0.5 (.3)
1.6 (.6)
1.2(.6)
0.3(.4)
0.4(.3)
0.7 (.4)
0.7 (.4)
1.2 (1.0)
2.3(.8)
0.0(.0)
Source: NLTS2 Wave 1 parent interviews. Standard errors are in parentheses.
The disproportionality of African-Americans among youth with disabilities is concentrated in a few categories. Whereas the racial/ethnic composition of youth with learning disabilities; speech, hearing, or orthopedic impairments; or multiple disabilities resembles that of the general population, African-Americans comprise significantly larger percentages of youth with mental retardation (33%) and emotional disturbances (25%). The percentage of Hispanic youth is particularly small among those with other health impairments (8%) or autism (9%). These racial/ethnic differences among disability categories may contribute to differences in the experiences of youth, apart from their differences in disability.
Household Risk Factors A child’s household is his or her first educational setting. At home, children form their first
emotional attachments, achieve their early developmental milestones, and acquire the foundation for their subsequent growth and learning. During adolescence, the family can be the context within which a youth wrestles with his or her desire for independence and separation and the need to stay connected to family and home. Thus, as children mature, what they need from their families and others who share their households may change, but children and youth continue to have their values, expectations, and preferences shaped by their experiences at home.
This section examines several aspects of households that can be risk factors in children’s development: living with other than two parents, having a poorly educated or unemployed head of household, or living in a low-income household (e.g., see Duncan & Brooks-Gunn, 1997). These factors are described for youth with disabilities as a whole, compared with the general population, and then for youth who differ in their primary disability classification.
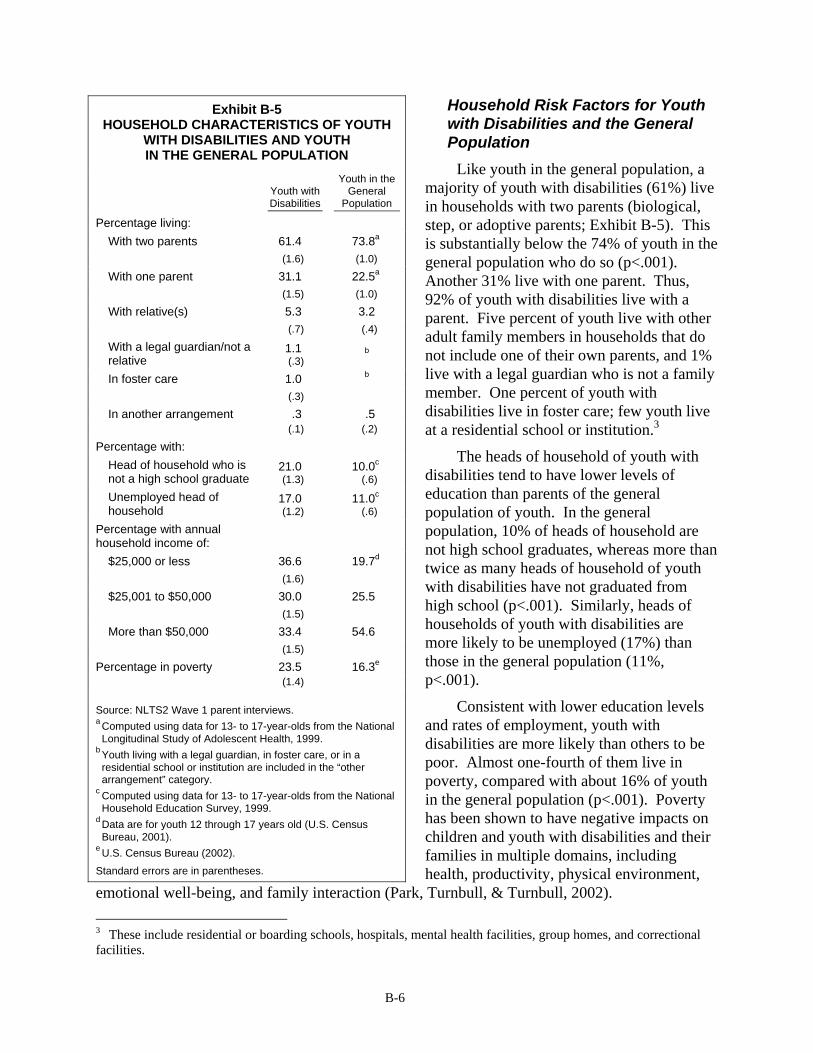
B-6
Household Risk Factors for Youth with Disabilities and the General Population
Like youth in the general population, a majority of youth with disabilities (61%) live in households with two parents (biological, step, or adoptive parents; Exhibit B-5). This is substantially below the 74% of youth in the general population who do so (p<.001). Another 31% live with one parent. Thus, 92% of youth with disabilities live with a parent. Five percent of youth live with other adult family members in households that do not include one of their own parents, and 1% live with a legal guardian who is not a family member. One percent of youth with disabilities live in foster care; few youth live at a residential school or institution.3
The heads of household of youth with disabilities tend to have lower levels of education than parents of the general population of youth. In the general population, 10% of heads of household are not high school graduates, whereas more than twice as many heads of household of youth with disabilities have not graduated from high school (p<.001). Similarly, heads of households of youth with disabilities are more likely to be unemployed (17%) than those in the general population (11%, p<.001).
Consistent with lower education levels and rates of employment, youth with disabilities are more likely than others to be poor. Almost one-fourth of them live in poverty, compared with about 16% of youth in the general population (p<.001). Poverty has been shown to have negative impacts on children and youth with disabilities and their families in multiple domains, including health, productivity, physical environment,
emotional well-being, and family interaction (Park, Turnbull, & Turnbull, 2002). 3 These include residential or boarding schools, hospitals, mental health facilities, group homes, and correctional facilities.
Exhibit B-5 HOUSEHOLD CHARACTERISTICS OF YOUTH
WITH DISABILITIES AND YOUTH IN THE GENERAL POPULATION
Youth with Disabilities
Youth in the General
Population
Percentage living: With two parents 61.4 73.8a (1.6) (1.0)
With one parent 31.1 22.5a (1.5) (1.0)
With relative(s) 5.3 3.2 (.7) (.4)
With a legal guardian/not a relative
1.1 (.3)
b
In foster care 1.0 b
(.3)
In another arrangement .3 .5 (.1) (.2)
Percentage with: Head of household who is not a high school graduate
21.0 (1.3)
10.0c (.6)
Unemployed head of household
17.0 (1.2)
11.0c (.6)
Percentage with annual household income of:
$25,000 or less 36.6 19.7d (1.6)
$25,001 to $50,000 30.0 25.5 (1.5)
More than $50,000 33.4 54.6 (1.5)
Percentage in poverty 23.5 16.3e (1.4)
Source: NLTS2 Wave 1 parent interviews. a Computed using data for 13- to 17-year-olds from the National
Longitudinal Study of Adolescent Health, 1999. b Youth living with a legal guardian, in foster care, or in a
residential school or institution are included in the “other arrangement” category.
c Computed using data for 13- to 17-year-olds from the National Household Education Survey, 1999.
d Data are for youth 12 through 17 years old (U.S. Census Bureau, 2001).
e U.S. Census Bureau (2002).
Standard errors are in parentheses.
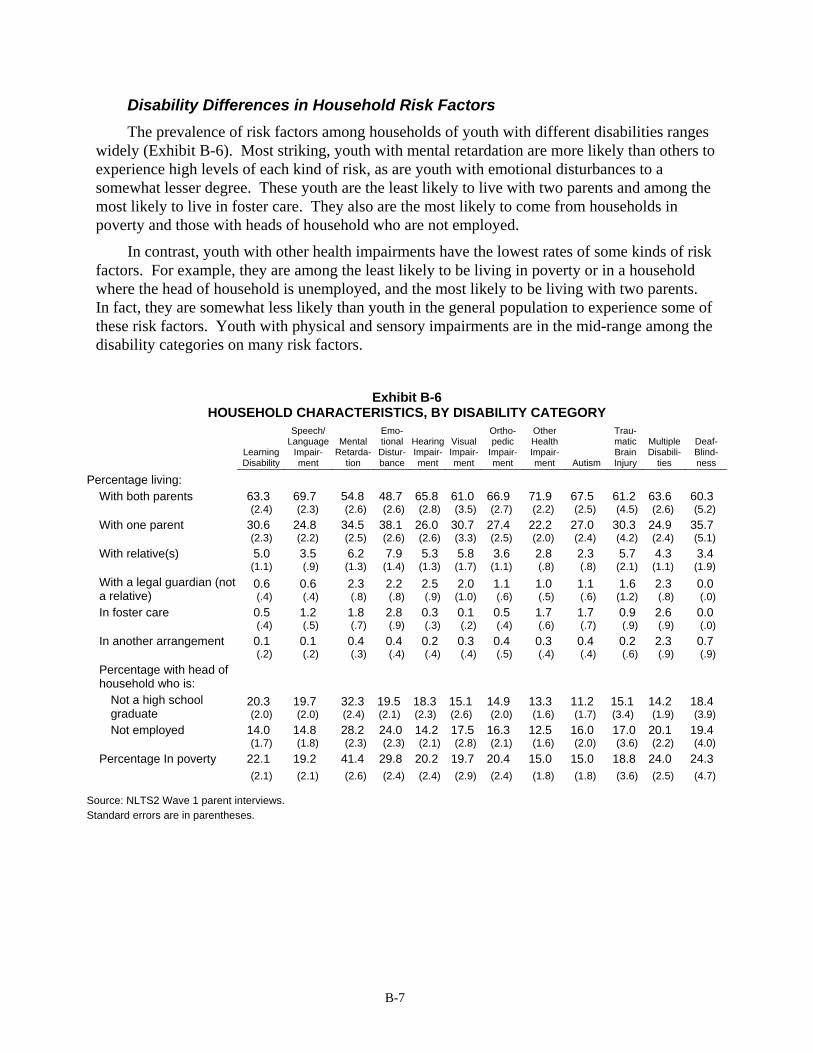
B-7
Disability Differences in Household Risk Factors The prevalence of risk factors among households of youth with different disabilities ranges
widely (Exhibit B-6). Most striking, youth with mental retardation are more likely than others to experience high levels of each kind of risk, as are youth with emotional disturbances to a somewhat lesser degree. These youth are the least likely to live with two parents and among the most likely to live in foster care. They also are the most likely to come from households in poverty and those with heads of household who are not employed.
In contrast, youth with other health impairments have the lowest rates of some kinds of risk factors. For example, they are among the least likely to be living in poverty or in a household where the head of household is unemployed, and the most likely to be living with two parents. In fact, they are somewhat less likely than youth in the general population to experience some of these risk factors. Youth with physical and sensory impairments are in the mid-range among the disability categories on many risk factors.
Exhibit B-6
HOUSEHOLD CHARACTERISTICS, BY DISABILITY CATEGORY
Learning Disability
Speech/ Language
Impair-ment
Mental Retarda-
tion
Emo-tional Distur-bance
Hearing Impair-ment
Visual Impair-ment
Ortho-pedic
Impair-ment
Other Health Impair-ment Autism
Trau-matic Brain Injury
Multiple Disabili-
ties
Deaf-Blind-ness
Percentage living: With both parents 63.3 69.7 54.8 48.7 65.8 61.0 66.9 71.9 67.5 61.2 63.6 60.3 (2.4) (2.3) (2.6) (2.6) (2.8) (3.5) (2.7) (2.2) (2.5) (4.5) (2.6) (5.2) With one parent 30.6 24.8 34.5 38.1 26.0 30.7 27.4 22.2 27.0 30.3 24.9 35.7 (2.3) (2.2) (2.5) (2.6) (2.6) (3.3) (2.5) (2.0) (2.4) (4.2) (2.4) (5.1) With relative(s) 5.0 3.5 6.2 7.9 5.3 5.8 3.6 2.8 2.3 5.7 4.3 3.4 (1.1) (.9) (1.3) (1.4) (1.3) (1.7) (1.1) (.8) (.8) (2.1) (1.1) (1.9) With a legal guardian (not a relative)
0.6 (.4)
0.6 (.4)
2.3(.8)
2.2(.8)
2.5(.9)
2.0(1.0)
1.1 (.6)
1.0 (.5)
1.1 (.6)
1.6 (1.2)
2.3 (.8)
0.0 (.0)
In foster care 0.5 1.2 1.8 2.8 0.3 0.1 0.5 1.7 1.7 0.9 2.6 0.0 (.4) (.5) (.7) (.9) (.3) (.2) (.4) (.6) (.7) (.9) (.9) (.0) In another arrangement 0.1 0.1 0.4 0.4 0.2 0.3 0.4 0.3 0.4 0.2 2.3 0.7 (.2) (.2) (.3) (.4) (.4) (.4) (.5) (.4) (.4) (.6) (.9) (.9) Percentage with head of household who is:
Not a high school graduate
20.3 (2.0)
19.7 (2.0)
32.3(2.4)
19.5(2.1)
18.3(2.3)
15.1(2.6)
14.9 (2.0)
13.3 (1.6)
11.2 (1.7)
15.1 (3.4)
14.2 (1.9)
18.4 (3.9)
Not employed 14.0 14.8 28.2 24.0 14.2 17.5 16.3 12.5 16.0 17.0 20.1 19.4 (1.7) (1.8) (2.3) (2.3) (2.1) (2.8) (2.1) (1.6) (2.0) (3.6) (2.2) (4.0) Percentage In poverty 22.1 19.2 41.4 29.8 20.2 19.7 20.4 15.0 15.0 18.8 24.0 24.3 (2.1) (2.1) (2.6) (2.4) (2.4) (2.9) (2.4) (1.8) (1.8) (3.6) (2.5) (4.7)
Source: NLTS2 Wave 1 parent interviews. Standard errors are in parentheses.
B-8
Summary Youth with disabilities constitute 13% of all 13- to 16-year-olds who were enrolled in
school in the 2000-01 school year. Although they include students with 12 different primary disability classifications, 85% are classified as having learning disabilities, mental retardation, or emotional disturbances as their primary disabilities.
NLTS2 youth were 13 to 17 years old when parent interview data were collected and 13 to 18 years old when school survey data were collected. Youth with speech/language impairments include a larger proportion of younger students, whereas visual impairment has a larger proportion of older students.
Almost two-thirds of youth with disabilities are boys. Boys account for slightly more than half of youth with sensory impairments, but they account for about three-fourths of youth with emotional disturbances and other health impairments and for 85% of youth with autism.
African-American youth constitute a larger proportion of youth with disabilities than of youth in the general population. This difference between the two populations of youth is consistent with patterns found among infants and toddlers with disabilities or developmental delays, as well as among elementary- and middle-school-age students receiving special education. However, disproportionality is concentrated among youth in a limited number of disability categories. African-Americans make up particularly large proportions of those with mental retardation or emotional disturbances. The percentage of Hispanic youth is particularly small among those with other health impairments or autism.
The households of youth with disabilities also differ significantly from the general population in the prevalence of several risk factors for poor outcomes. Of particular note is the significantly higher rate of low-income households among youth with disabilities, probably a reflection, in part, of the overall lower levels of education and employment among heads of households of youth with disabilities. Several risk factors are particularly prominent among youth with mental retardation and emotional disturbances.
Awareness of these important differences between youth with disabilities and those in the general population, and of the highlighted differences between youth with different primary disability classifications, is an important foundation for understanding the experiences described in this report.
B-9
References
Bradsher, J. E. (1995). Disability among racial and ethnic groups. Disability Statistics Abstract, 10, 1-4.
Duncan, G. J., & Brooks-Gunn, J. (1997). Consequences of growing up poor. New York: Russell Sage Foundation.
Hebbeler, K., Wagner, M., Spiker, D., Scarborough, A., Simeonsson, R., & Collier, M. (2001). A first look at the characteristics of children and families entering early intervention services. Menlo Park, CA: SRI International.
Levine, P., Marder, C., Wagner, M., & Cardoso, D. (2003). Characteristics of students’ households. In M. Wagner, P. Levine, R. Cameto, T. W. Cadwallader, C. Marder, & J., Blackorby, The individual and household characteristics of youth with disabilities. Menlo Park, CA: SRI International.
Levine, P., Wagner, M., & Marder, C. (2003). Demographic characteristics of youth with disabilities. In M. Wagner, P. Levine, R. Cameto, T. W. Cadwallader, C. Marder, & J. Blackorby, The individual and household characteristics of youth with disabilities. Menlo Park, CA: SRI International.
Marder, C., & Wagner, M. (2002). Demographic characteristics of elementary and middle school students receiving special education. In M. Wagner, C. Marder, & J. Blackorby, The children we serve: The demographic characteristics of elementary and middle school students with disabilities and their families. Menlo Park, CA: SRI International.
National Center for Education Statistics. (2001). Digest of education statistics 2000. Washington, DC: Author.
National Center for Education Statistics. (2002). Table 4. Public school membership, by race/ethnicity and state: School year 2000-01. Education Statistics Quarterly, 4(2), 68. Available at http://nces.ed.gov/pubs2002/2002609.pdf
National Center for Health Statistics. (2001). Disabilities and impairments. Retrieved from http://www.cdc.gov/nchs/fastats/disable.htm
Park, J., Turnbull, A. P., & Turnbull, K. R. (2002). Impacts of poverty on quality of life in families of children with disabilities. Exceptional Children, 68, 151-170.
U.S. Census Bureau. (2001). CPS annual demographic survey, March supplement. HINC-03. People in households—Households, by total money income in 2000. Available at http://ferret.bls.census.gov/macro/032001/hhinc/toc.htm
U.S. Census Bureau. (2002). Poverty: 2001 highlights. Available at http://www.census.gov/hhes/poverty/poverty01/pov01hi.html
U.S. Department of Education. (2002). Table AA7: Number of children served under IDEA, Part B by disability and age, during the 2000-01 school year. Twenty-fourth annual report to Congress on the implementation of the Individuals with Disabilities Education Act (Appendix A, p. A17). Washington DC: Author.


C-1
Appendix C
ESTIMATED DIFFERENCES FOR THE MODELS PRESENTED IN CHAPTER 4
This appendix presents the full findings, including disability category variables, coefficients, and r², related to the three regression models included in Chapter 4.
Exhibit C-1
DIFFERENCES IN FAMILY INVOLVEMENT ASSOCIATED WITH DISABILITY CHARACTERISTICS OF YOUTH WITH DISABILITIESa
Estimated Difference in:
Frequency of Helping
with Homework
Participation in School-Based Activities Scale
Score
Participation in Individualized
Education Program For Increment
Disability characteristics Youth classified with:
Speech/language impairment -.02 -.22* -3.17* vs. learning disabilityb Mental retardation .12 -.18 .37 vs. learning disability Emotional disturbance -.27*** -.37* 2.72* vs. learning disability Hearing impairment -.06 -.20 .69 vs. learning disability Visual impairment -.16 -.22 .36 vs. learning disability Orthopedic impairment .27*** -.19 1.81 vs. learning disability Other health impairment .02 -.08 3.95*** vs. learning disability Autism .07 -.31** 1.54 vs. learning disability Traumatic brain injury .10 -.20 3.80* vs. learning disability Multiple disabilities/deaf-blindness .00 -.14 1.88 vs. learning disability
Number of problem domains .07 .02 .38 3 vs. 1 domain Functioning
Self-care skills .15* NA -1.22 High vs. low (8 vs. 4) Functional cognitive skills -.31*** NA -.96 High vs. low (15 vs. 7)
Behavior at home .25*** .29** -.85 Very often vs. rarely (8 vs. 1)
Source: NLTS2 Wave 1 parent interviews. a Statistics in this exhibit are calculated from models that include all characteristics included in this table, as well as the characteristics included in other exhibits in Appendix C. b Multivariate analyses require that for categorical variables, such as disability category, each category be compared with another specified category. Learning disability was chosen as the category against which to compare the relationships for other disabilities because it is the largest disability category and, therefore, most closely resembles the characteristics of students with disabilities as a whole. Table reads: The frequency of helping with homework for families of youth with emotional disturbance is .27 points lower on a 5-point scale than for families of youth with learning disabilities, controlling for other factors. The frequency of participating in school-based activities for families of youth with autism is .31 points lower on a 6-point scale than for families of youth with learning disabilities, other factors held constant. The probability of attending an IEP meeting is 3.95 percentage points higher for families of students with other health impairments than for families of students with learning disabilities, other factors being equal. *p<.05; **p<.01; ***p<.001. NA = not included in analysis.
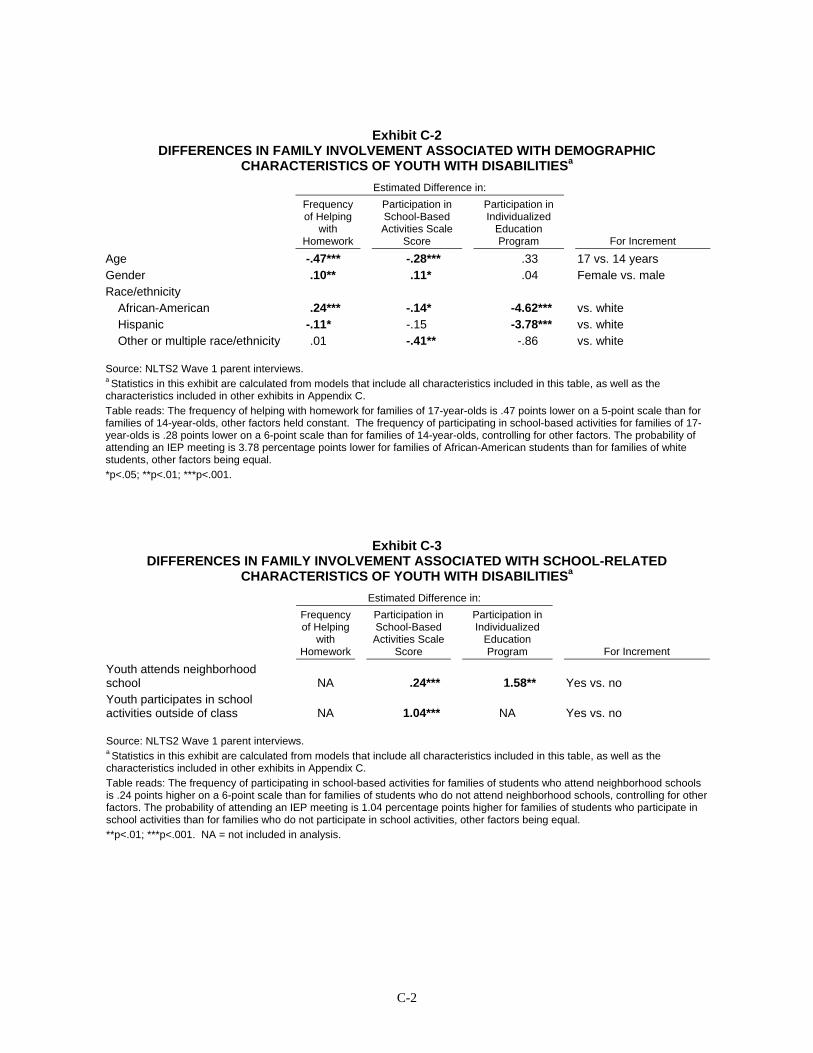
C-2
Exhibit C-2
DIFFERENCES IN FAMILY INVOLVEMENT ASSOCIATED WITH DEMOGRAPHIC CHARACTERISTICS OF YOUTH WITH DISABILITIESa
Estimated Difference in:
Frequency of Helping
with Homework
Participation in School-Based Activities Scale
Score
Participation in Individualized
Education Program For Increment
Age -.47*** -.28*** .33 17 vs. 14 years Gender .10** .11* .04 Female vs. male Race/ethnicity
African-American .24*** -.14* -4.62*** vs. white Hispanic -.11* -.15 -3.78*** vs. white Other or multiple race/ethnicity .01 -.41** -.86 vs. white
Source: NLTS2 Wave 1 parent interviews. a Statistics in this exhibit are calculated from models that include all characteristics included in this table, as well as the characteristics included in other exhibits in Appendix C. Table reads: The frequency of helping with homework for families of 17-year-olds is .47 points lower on a 5-point scale than for families of 14-year-olds, other factors held constant. The frequency of participating in school-based activities for families of 17-year-olds is .28 points lower on a 6-point scale than for families of 14-year-olds, controlling for other factors. The probability of attending an IEP meeting is 3.78 percentage points lower for families of African-American students than for families of white students, other factors being equal. *p<.05; **p<.01; ***p<.001.
Exhibit C-3 DIFFERENCES IN FAMILY INVOLVEMENT ASSOCIATED WITH SCHOOL-RELATED
CHARACTERISTICS OF YOUTH WITH DISABILITIESa Estimated Difference in:
Frequency of Helping
with Homework
Participation in School-Based Activities Scale
Score
Participation in Individualized
Education Program For Increment
Youth attends neighborhood school NA .24*** 1.58** Yes vs. no Youth participates in school activities outside of class NA 1.04*** NA Yes vs. no Source: NLTS2 Wave 1 parent interviews. a Statistics in this exhibit are calculated from models that include all characteristics included in this table, as well as the characteristics included in other exhibits in Appendix C. Table reads: The frequency of participating in school-based activities for families of students who attend neighborhood schools is .24 points higher on a 6-point scale than for families of students who do not attend neighborhood schools, controlling for other factors. The probability of attending an IEP meeting is 1.04 percentage points higher for families of students who participate in school activities than for families who do not participate in school activities, other factors being equal. **p<.01; ***p<.001. NA = not included in analysis.
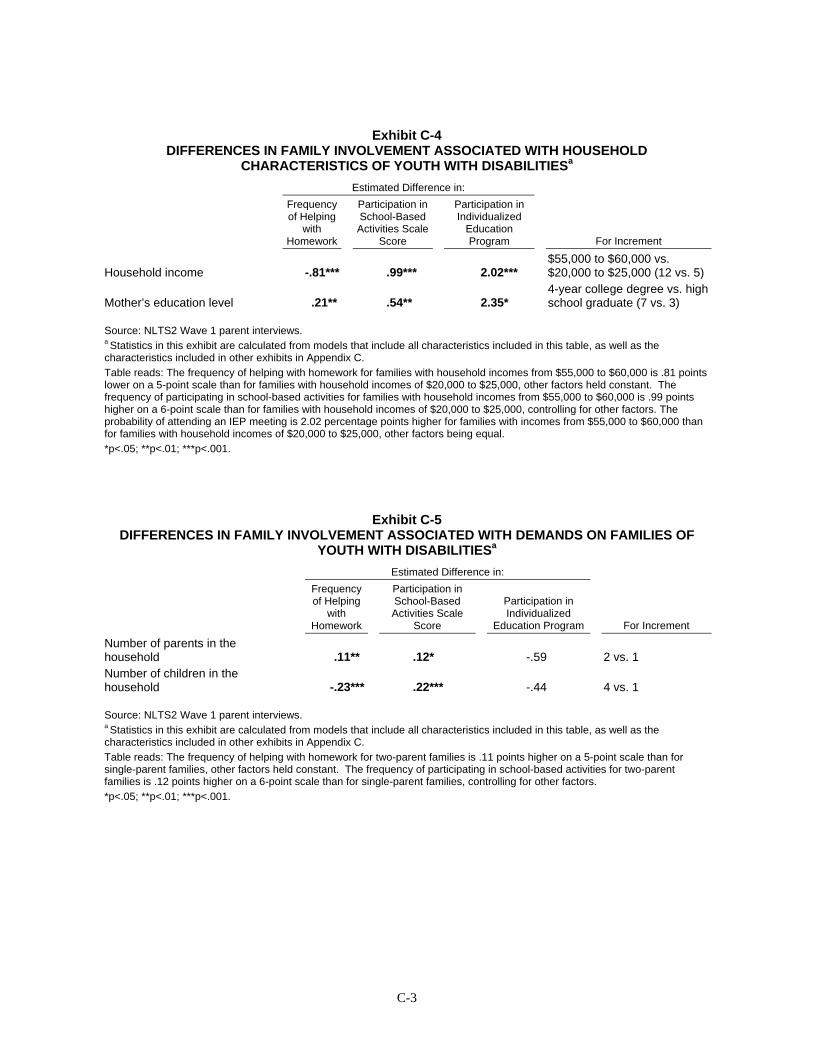
C-3
Exhibit C-4
DIFFERENCES IN FAMILY INVOLVEMENT ASSOCIATED WITH HOUSEHOLD CHARACTERISTICS OF YOUTH WITH DISABILITIESa
Estimated Difference in:
Frequency of Helping
with Homework
Participation in School-Based Activities Scale
Score
Participation in Individualized
Education Program For Increment
Household income -.81*** .99*** 2.02*** $55,000 to $60,000 vs. $20,000 to $25,000 (12 vs. 5)
Mother’s education level .21** .54** 2.35* 4-year college degree vs. high school graduate (7 vs. 3)
Source: NLTS2 Wave 1 parent interviews. a Statistics in this exhibit are calculated from models that include all characteristics included in this table, as well as the characteristics included in other exhibits in Appendix C. Table reads: The frequency of helping with homework for families with household incomes from $55,000 to $60,000 is .81 points lower on a 5-point scale than for families with household incomes of $20,000 to $25,000, other factors held constant. The frequency of participating in school-based activities for families with household incomes from $55,000 to $60,000 is .99 points higher on a 6-point scale than for families with household incomes of $20,000 to $25,000, controlling for other factors. The probability of attending an IEP meeting is 2.02 percentage points higher for families with incomes from $55,000 to $60,000 than for families with household incomes of $20,000 to $25,000, other factors being equal. *p<.05; **p<.01; ***p<.001.
Exhibit C-5 DIFFERENCES IN FAMILY INVOLVEMENT ASSOCIATED WITH DEMANDS ON FAMILIES OF
YOUTH WITH DISABILITIESa Estimated Difference in:
Frequency of Helping
with Homework
Participation in School-Based Activities Scale
Score
Participation in Individualized
Education Program For Increment
Number of parents in the household .11** .12* -.59 2 vs. 1 Number of children in the household -.23*** .22*** -.44 4 vs. 1 Source: NLTS2 Wave 1 parent interviews. a Statistics in this exhibit are calculated from models that include all characteristics included in this table, as well as the characteristics included in other exhibits in Appendix C. Table reads: The frequency of helping with homework for two-parent families is .11 points higher on a 5-point scale than for single-parent families, other factors held constant. The frequency of participating in school-based activities for two-parent families is .12 points higher on a 6-point scale than for single-parent families, controlling for other factors. *p<.05; **p<.01; ***p<.001.
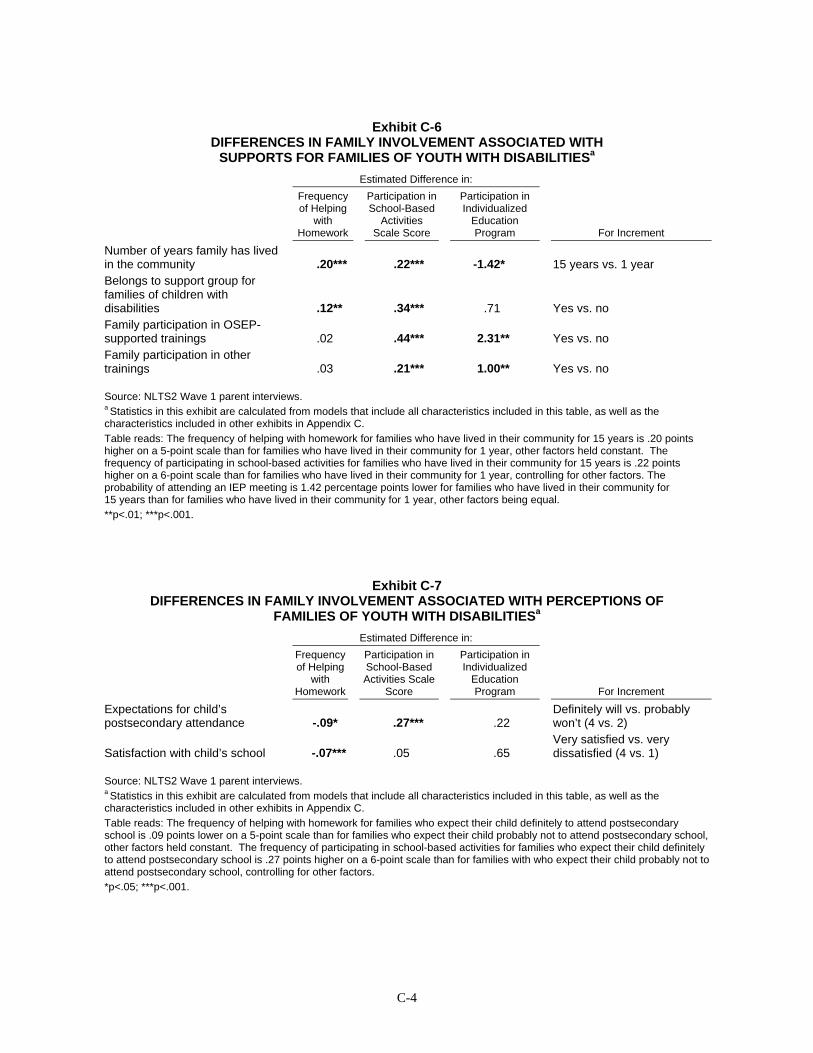
C-4
Exhibit C-6
DIFFERENCES IN FAMILY INVOLVEMENT ASSOCIATED WITH SUPPORTS FOR FAMILIES OF YOUTH WITH DISABILITIESa
Estimated Difference in:
Frequency of Helping
with Homework
Participation in School-Based
Activities Scale Score
Participation in Individualized
Education Program For Increment
Number of years family has lived in the community .20*** .22*** -1.42* 15 years vs. 1 year Belongs to support group for families of children with disabilities .12** .34*** .71 Yes vs. no Family participation in OSEP-supported trainings .02 .44*** 2.31** Yes vs. no Family participation in other trainings .03 .21*** 1.00** Yes vs. no Source: NLTS2 Wave 1 parent interviews. a Statistics in this exhibit are calculated from models that include all characteristics included in this table, as well as the characteristics included in other exhibits in Appendix C. Table reads: The frequency of helping with homework for families who have lived in their community for 15 years is .20 points higher on a 5-point scale than for families who have lived in their community for 1 year, other factors held constant. The frequency of participating in school-based activities for families who have lived in their community for 15 years is .22 points higher on a 6-point scale than for families who have lived in their community for 1 year, controlling for other factors. The probability of attending an IEP meeting is 1.42 percentage points lower for families who have lived in their community for 15 years than for families who have lived in their community for 1 year, other factors being equal. **p<.01; ***p<.001.
Exhibit C-7 DIFFERENCES IN FAMILY INVOLVEMENT ASSOCIATED WITH PERCEPTIONS OF
FAMILIES OF YOUTH WITH DISABILITIESa Estimated Difference in:
Frequency of Helping
with Homework
Participation in School-Based Activities Scale
Score
Participation in Individualized
Education Program For Increment
Expectations for child’s postsecondary attendance -.09* .27*** .22
Definitely will vs. probably won’t (4 vs. 2)
Satisfaction with child’s school -.07*** .05 .65 Very satisfied vs. very dissatisfied (4 vs. 1)
Source: NLTS2 Wave 1 parent interviews. a Statistics in this exhibit are calculated from models that include all characteristics included in this table, as well as the characteristics included in other exhibits in Appendix C. Table reads: The frequency of helping with homework for families who expect their child definitely to attend postsecondary school is .09 points lower on a 5-point scale than for families who expect their child probably not to attend postsecondary school, other factors held constant. The frequency of participating in school-based activities for families who expect their child definitely to attend postsecondary school is .27 points higher on a 6-point scale than for families with who expect their child probably not to attend postsecondary school, controlling for other factors. *p<.05; ***p<.001.
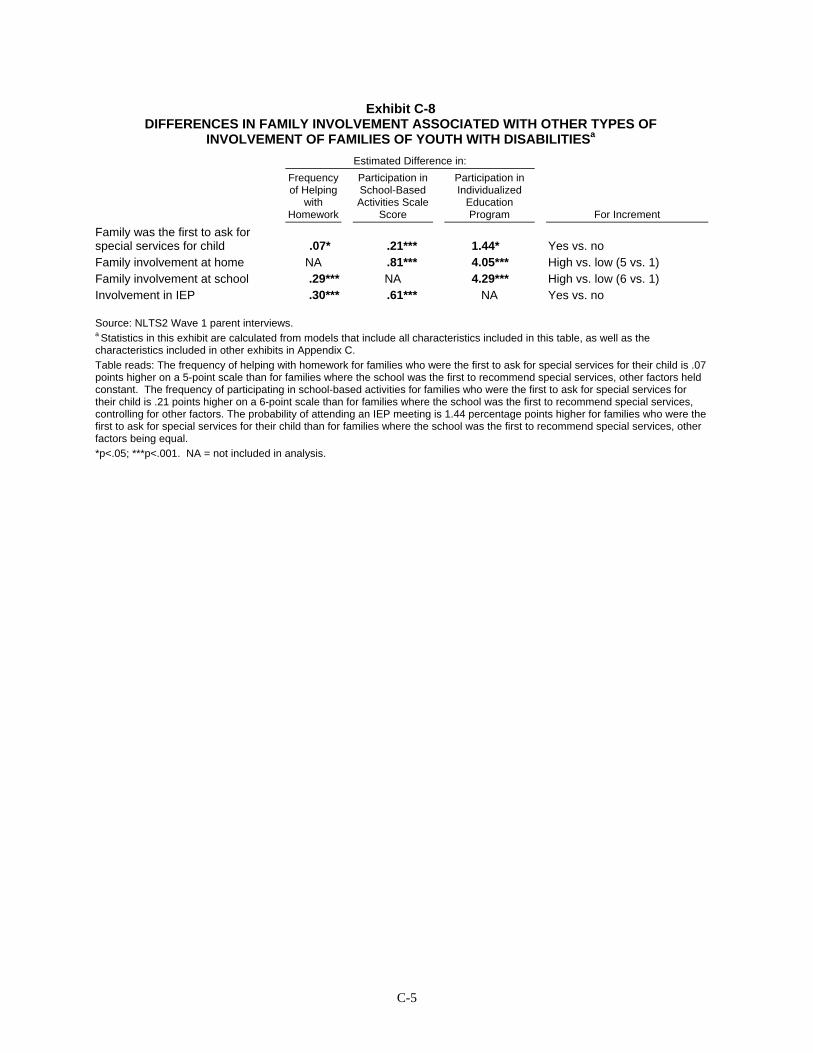
C-5
Exhibit C-8 DIFFERENCES IN FAMILY INVOLVEMENT ASSOCIATED WITH OTHER TYPES OF
INVOLVEMENT OF FAMILIES OF YOUTH WITH DISABILITIESa Estimated Difference in:
Frequency of Helping
with Homework
Participation in School-Based Activities Scale
Score
Participation in Individualized
Education Program For Increment
Family was the first to ask for special services for child .07* .21*** 1.44* Yes vs. no Family involvement at home NA .81*** 4.05*** High vs. low (5 vs. 1) Family involvement at school .29*** NA 4.29*** High vs. low (6 vs. 1) Involvement in IEP .30*** .61*** NA Yes vs. no Source: NLTS2 Wave 1 parent interviews. a Statistics in this exhibit are calculated from models that include all characteristics included in this table, as well as the characteristics included in other exhibits in Appendix C. Table reads: The frequency of helping with homework for families who were the first to ask for special services for their child is .07 points higher on a 5-point scale than for families where the school was the first to recommend special services, other factors held constant. The frequency of participating in school-based activities for families who were the first to ask for special services for their child is .21 points higher on a 6-point scale than for families where the school was the first to recommend special services, controlling for other factors. The probability of attending an IEP meeting is 1.44 percentage points higher for families who were the first to ask for special services for their child than for families where the school was the first to recommend special services, other factors being equal. *p<.05; ***p<.001. NA = not included in analysis.
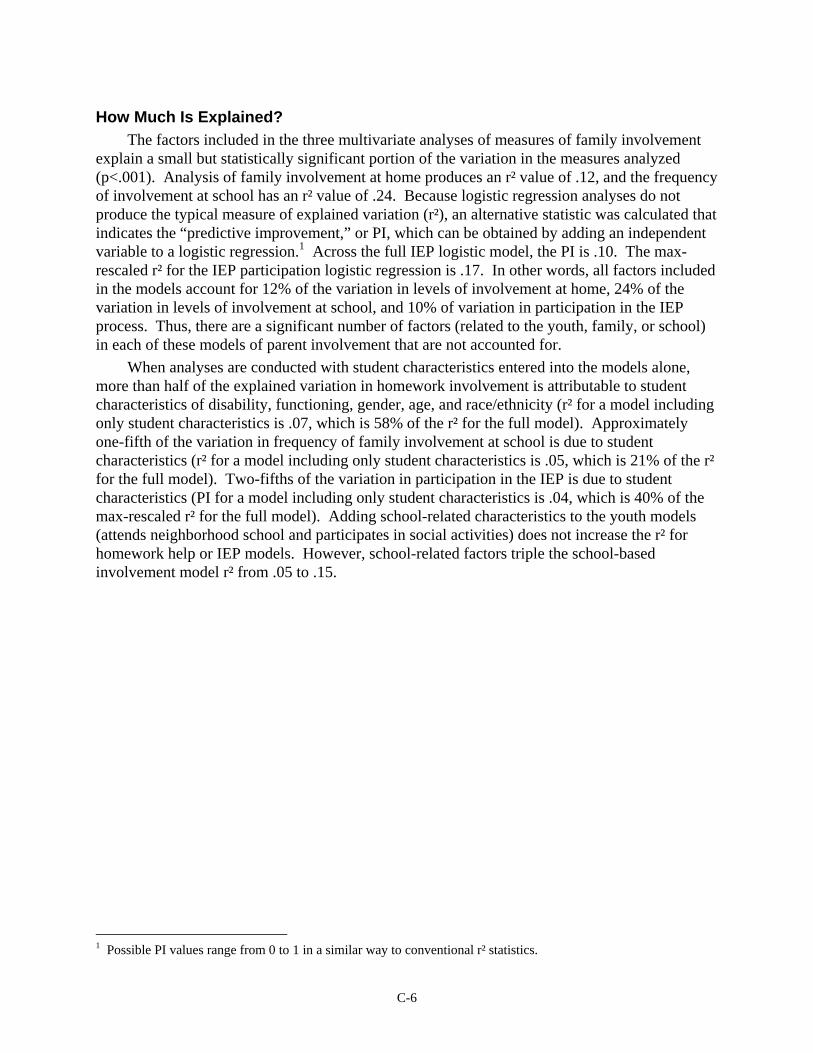
C-6
How Much Is Explained? The factors included in the three multivariate analyses of measures of family involvement
explain a small but statistically significant portion of the variation in the measures analyzed (p<.001). Analysis of family involvement at home produces an r² value of .12, and the frequency of involvement at school has an r² value of .24. Because logistic regression analyses do not produce the typical measure of explained variation (r²), an alternative statistic was calculated that indicates the “predictive improvement,” or PI, which can be obtained by adding an independent variable to a logistic regression.1 Across the full IEP logistic model, the PI is .10. The max-rescaled r² for the IEP participation logistic regression is .17. In other words, all factors included in the models account for 12% of the variation in levels of involvement at home, 24% of the variation in levels of involvement at school, and 10% of variation in participation in the IEP process. Thus, there are a significant number of factors (related to the youth, family, or school) in each of these models of parent involvement that are not accounted for.
When analyses are conducted with student characteristics entered into the models alone, more than half of the explained variation in homework involvement is attributable to student characteristics of disability, functioning, gender, age, and race/ethnicity (r² for a model including only student characteristics is .07, which is 58% of the r² for the full model). Approximately one-fifth of the variation in frequency of family involvement at school is due to student characteristics (r² for a model including only student characteristics is .05, which is 21% of the r² for the full model). Two-fifths of the variation in participation in the IEP is due to student characteristics (PI for a model including only student characteristics is .04, which is 40% of the max-rescaled r² for the full model). Adding school-related characteristics to the youth models (attends neighborhood school and participates in social activities) does not increase the r² for homework help or IEP models. However, school-related factors triple the school-based involvement model r² from .05 to .15.
1 Possible PI values range from 0 to 1 in a similar way to conventional r² statistics.
D-1
Appendix D
INDEPENDENT VARIABLES INCLUDED IN MULTIVARIATE ANALYSES PRESENTED IN CHAPTER 6
This appendix describes the independent variables included with family involvement
variables in analyses of student achievements, as presented in Chapter 6, Exhibit 6-1. Only variables that have not already been described in Chapter 4 are included in this appendix.
• Age at identification of disability. Parents reported the age at which youth first exhibited a physical, learning, or other disability or problem for which they eventually were diagnosed. Although the average age is 5.7 years, approximately one in five youth have disabilities that first were diagnosed when they were infants or toddlers, and another 11% have disabilities or delays that were identified in their preschool years. School entry, at age 5 or 6, was when almost one-third of youth first had their disabilities identified, whereas 19% did not have their disabilities identified until they were at least 9 years old.
• Students’ general health. Parents report that youth with disabilities are about as healthy as youth in the general population, with 70% reported to be in excellent or very good health and 8% in fair or poor health.
• Membership in school or community group. Parents report that most youth with disabilities are fairly socially engaged. Approximately two-thirds (65%) belong to some type of school or community group.
• Extent of participation in general education classes. School staff reported an overview of the settings in which students with disabilities take 11 kinds of courses, enabling a calculation of the percentage of the types of courses students with disabilities take that are in general education classes.
• Participation in vocational education. As part of the course-taking overview provided in the NLTS2 student’s school program survey, school staff indicated whether each student was taking a prevocational or occupationally specific vocational education course at the time of the survey; 70% of students with disabilities were reported to be taking one or more vocational education courses that semester. In addition, school staff indicated whether the student’s school program included school- or community-based work experience activities; 19% of students with disabilities had such experience as part of their school programs.
• Receiving social adjustment support services. These services and programs and the percentage of youth receiving them include mental health services (20%), social work services (12%), a behavior management plan (13%), an anger management or conflict resolution program (27%), substance abuse education or treatment (39%), and services from a behavioral interventionist (13%). In some analyses, the sum of these services is included; it ranges from 0 to 6. Youth receive a mean of 1.1 such services.
• Tutoring. Tutoring has been shown to have beneficial effects on students’ academic performance and behavior. Analyses of students’ academic performance include whether students receive help from an adult or peer tutor, as indicated by school staff or
D-2
parents. Although receiving such help would be expected to relate to better academic performance for the students who need it, the confounding of need with service receipt makes expectations regarding the direction of the relationship unclear. Overall, one-third of students with disabilities are reported to receive help from a tutor.
• Receiving instructional accommodations or modifications. School staff indicated whether youth received the following: more time to take tests, tests read to the student, modified tests, alternative assessments, modified grading standards, slower-paced instruction, more time to complete assignments, shorter or different assignments, or help with learning strategies or study assistance. A scale of the extensiveness of such support was constructed by summing the number of supports provided each student; the scale ranges from 0 to 9. Youth receive a mean of 3.3 such supports.
• Absenteeism. As indicated by school staff, on average, students with disabilities miss 2.6 days of school in a 4-week period.
• In-class behaviors. To elicit information about youth’s social behavior in the classroom, NLTS2 asked teachers or school staff the extent to which youth get along well with other students in the classroom, follow directions, and control their behavior to act appropriately in class. According to teachers and other school staff, about one-third of students with disabilities get along “very well” with other students, and another half get along “well.” Almost one in five students with disabilities control their behavior “not very well” or “not at all well.” Somewhat more youth appear to have difficulty following directions; school staff report that one-fourth do so “very well,” and a similar percentage follow directions “not very well” or “not at all well.” As an overall measure of classroom behaviors, a scale was created by summing the answers to the three questions. The scale ranges from 3 (does all of the behaviors “not at all well”) to 12 (does all of the behaviors “very well”). The mean score for youth with disabilities on this scale is 9.2.
• Grades. Although the measure of grades that is used as a dependent measure includes only students who receive regular letter grades, the measure used as an independent variable is defined more broadly so that it also includes students who receive such grades as “excellent,” “good,” “fair,” and “poor”; grades in this form were converted to correspond to the same scale as letter grades.
• Average class size. NLTS2 asked school staff to report the number of general and special education students in each student’s general education academic, vocational education, and special education class. For students who take classes in both general education and special education settings, the setting in which he or she spends the most time was used to select the class size value to use in analyses. If those items were missing but class size had been reported for a vocational education class, that measure was used. Across settings, class size averages 15.4 students.
• Declassification. Students with disabilities who meet their IEP goals or who otherwise are found no longer to need special education services are declassified from those services and return to the status of other students in general education. NLTS2 data

D-3
indicate that, according to school staff, in a 1-year period, about 4% of secondary-school-age students with disabilities are declassified from special education.1
• Grade retention. NLTS2 analyses include a measure of parents’ reports of whether youth have ever been retained at grade level. According to parents, more than one-third (36%) of youth with disabilities repeated at least one grade level.
• Disciplinary actions. School staff were asked whether youth had been suspended, expelled, or involved in any other type of disciplinary action, such as a referral to the office or detention, during the current school year. More than one-third of youth with disabilities (35%) have been involved in some type of disciplinary action in a school year.
1 Although some students are declassified from special education services each year and thus no longer are considered to have a disability for educational purposes, all youth continue to be referred to in NLTS2 as “youth with disabilities.” Regardless of their participation in special education services, all youth selected for NLTS2 continue to be considered part of the study.

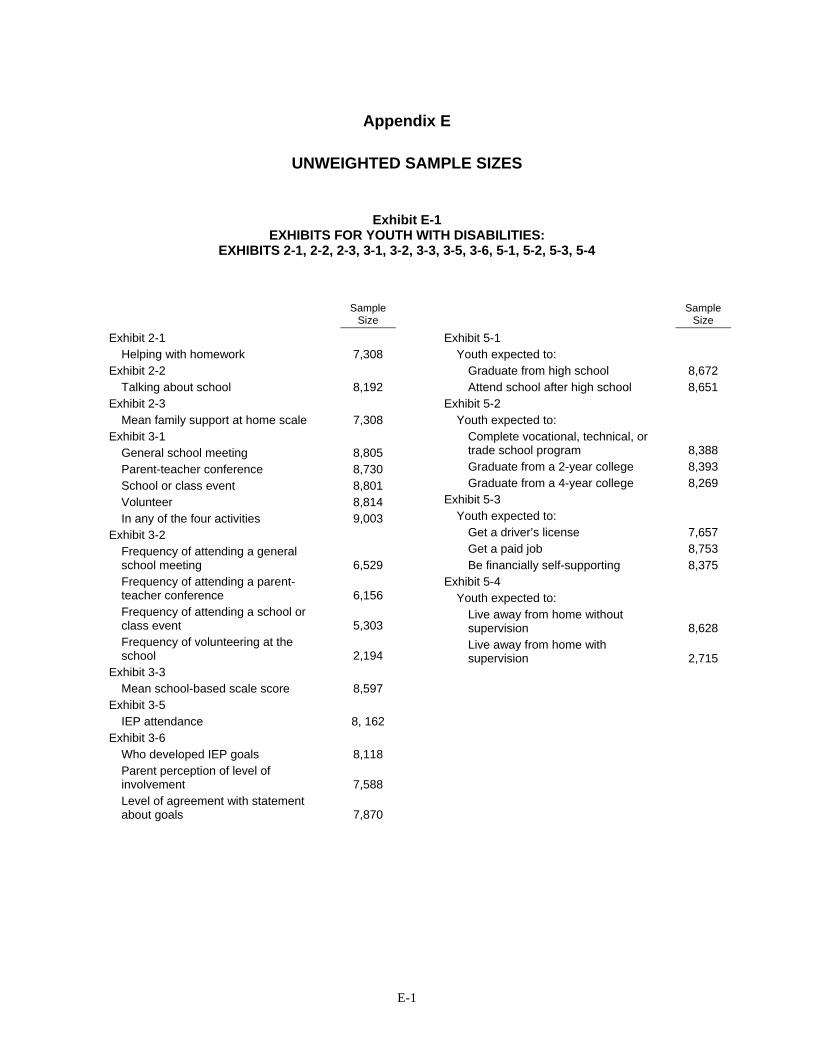
E-1
Appendix E
UNWEIGHTED SAMPLE SIZES
Exhibit E-1
EXHIBITS FOR YOUTH WITH DISABILITIES: EXHIBITS 2-1, 2-2, 2-3, 3-1, 3-2, 3-3, 3-5, 3-6, 5-1, 5-2, 5-3, 5-4
Sample Size
Exhibit 2-1 Helping with homework 7,308
Exhibit 2-2 Talking about school 8,192
Exhibit 2-3 Mean family support at home scale 7,308
Exhibit 3-1 General school meeting 8,805 Parent-teacher conference 8,730 School or class event 8,801 Volunteer 8,814 In any of the four activities 9,003
Exhibit 3-2 Frequency of attending a general school meeting 6,529 Frequency of attending a parent-teacher conference 6,156 Frequency of attending a school or class event 5,303 Frequency of volunteering at the school 2,194
Exhibit 3-3 Mean school-based scale score 8,597
Exhibit 3-5 IEP attendance 8, 162
Exhibit 3-6 Who developed IEP goals 8,118 Parent perception of level of involvement 7,588 Level of agreement with statement about goals 7,870
Sample
Size
Exhibit 5-1 Youth expected to:
Graduate from high school 8,672 Attend school after high school 8,651
Exhibit 5-2 Youth expected to:
Complete vocational, technical, or trade school program 8,388 Graduate from a 2-year college 8,393 Graduate from a 4-year college 8,269
Exhibit 5-3 Youth expected to:
Get a driver’s license 7,657 Get a paid job 8,753 Be financially self-supporting 8,375
Exhibit 5-4 Youth expected to:
Live away from home without supervision 8,628 Live away from home with supervision 2,715
E-2
Exhibit E-2 EXHIBITS FOR DISABILITY CATEGORIES:
EXHIBITS 2-5, 3-9, 5-5, 5-6
Learning Disability
Speech/ Language
Impair-ment
Mental Retar-dation
Emo-tional
Disturb-ance
Hearing Impair-ment
Visual Impair-ment
Ortho-pedic
Impair-rment
Other Health Impair-ment Autism
Trau-matic Brain Injury
Multiple Disabili-
ties
Deaf-Blind-ness
Exhibit 2-5 Helping with homework 809 803 691 664 614 421 790 829 673 338 579 97 Talking about school 840 820 803 753 632 453 863 875 860 362 817 114
Exhibit 3-9 Attend a general school meeting 855 846 839 778 826 634 882 892 883 358 861 151 Attend a school or class event 854 846 837 777 826 634 881 893 882 358 861 152 Volunteer at the school 855 845 840 778 828 636 884 893 883 358 862 152 Attend a parent-teacher conference 838 822 809 790 809 648 871 881 877 364 879 142 Involved in any of the 4 school-based activities 862 851 847 813 838 662 898 908 902 367 896 157 Mean school-based scale score 846 824 807 758 811 627 856 871 858 356 843 138 IEP attendance 745 653 775 708 779 624 832 830 866 347 855 139
Exhibit 5-5 Expected to:
Graduate from high school 825 818 801 780 809 646 860 882 871 356 872 152 Attend postsecondary school 822 812 799 772 813 644 865 879 866 352 869 158 Complete a technical, vocational, or trade school program 801 782 784 748 780 617 839 843 844 340 857 153 Graduate from a 2-year college 793 782 774 751 787 621 841 845 848 342 856 153 Graduate from a 4-year college 774 768 774 734 774 605 831 838 839 328 854 150
Exhibit 5-6 Expected to:
Get a driver’s license 646 691 747 654 632 681 774 679 837 299 852 165 Get a paid job 846 825 809 796 817 649 866 896 872 359 867 151 Be financially self-supporting 822 803 772 760 784 614 820 863 822 342 826 147 Live independently without supervision 839 808 787 784 805 631 850 884 860 349 877 154 Live independently with supervision 70 95 337 128 113 209 357 108 554 91 571 82
E-3
Exhibit E-3
UNWEIGHTED SAMPLE SIZES FOR EXHIBITS BY AGE: EXHIBITS 5-7, 5-8
13 or 14 15 16 17
Exhibit 5-7 Expected to:
Graduate from high school 2,979 2,148 2,166 1,374 Attend postsecondary school 2,978 2,139 2,164 1,367 Completed a technical, vocational, or trade school program 2,874 2,085 2,093 1,333 Graduate from a 2-year college 2,872 2,085 2,101 1,332 Graduate from a 4-year college 2,819 2,057 2,082 1,308
Exhibit 5-8 Expected to:
Get a driver’s license 3,005 2,020 1,690 939 Get a paid job 3,012 2,165 2,196 1,376 Be financially independent 2,887 2,073 2,101 1,311 Live independently without supervision 2,970 2,147 2,154 1,354 Live independently with supervision 896 710 696 412
Exhibit E-4
UNWEIGHTED SAMPLE SIZES FOR EXHIBITS BY HOUSEHOLD INCOME: EXHIBITS 5-9, 5-10
$25,000 or Less
$25,001 to $50,000
More than $50,000
Exhibit 5-9 Expected to:
Graduate from high school 2,780 2,450 2,832 Attend postsecondary school 2,760 2,465 2,824 Complete a technical, vocational, or trade school program 2,676 2,400 2,744 Graduate from a 2-year college 2,672 2,392 2,765 Graduate from a 4-year college 2,630 2,353 2,725
Exhibit 5-10 Expected to:
Get a driver’s license 2,603 2,167 2,326 Get a paid job 2,810 2,479 2,844 Be financially self-supporting 2,661 2,390 2,753 Live independently without supervision 2,753 2,453 2,824 Live independently with supervision 999 710 792
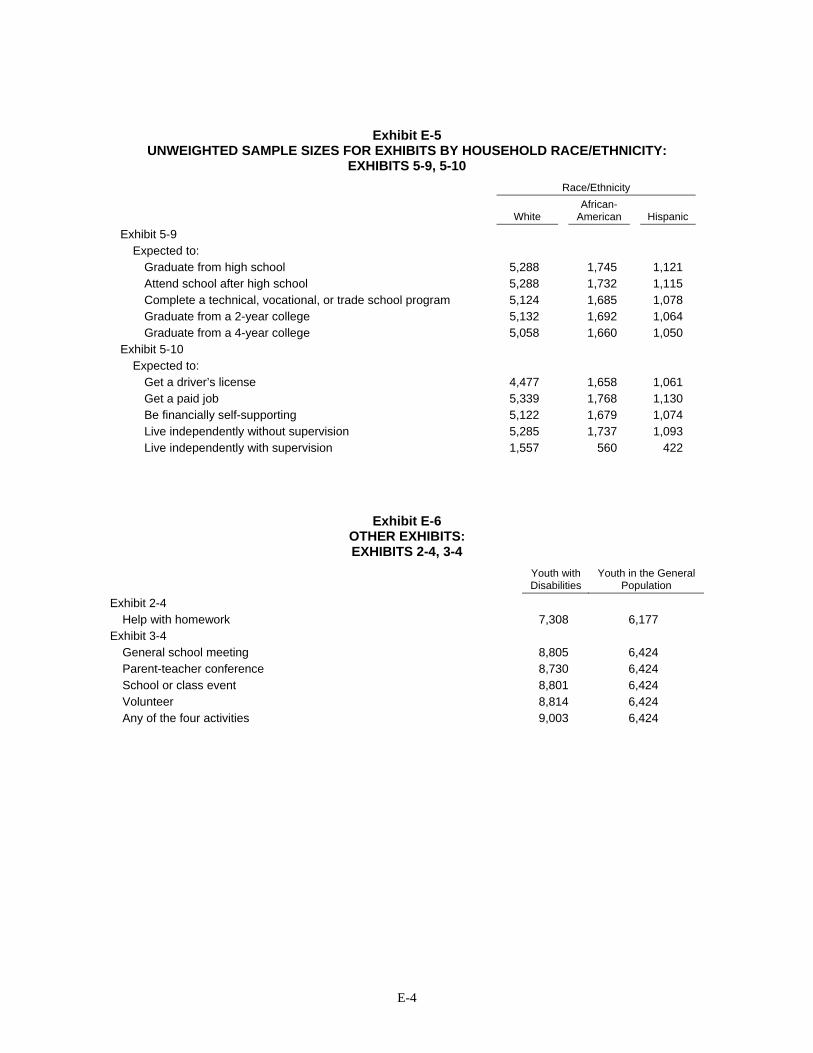
E-4
Exhibit E-5 UNWEIGHTED SAMPLE SIZES FOR EXHIBITS BY HOUSEHOLD RACE/ETHNICITY:
EXHIBITS 5-9, 5-10
Race/Ethnicity
White African-
American Hispanic
Exhibit 5-9 Expected to:
Graduate from high school 5,288 1,745 1,121 Attend school after high school 5,288 1,732 1,115 Complete a technical, vocational, or trade school program 5,124 1,685 1,078 Graduate from a 2-year college 5,132 1,692 1,064 Graduate from a 4-year college 5,058 1,660 1,050
Exhibit 5-10 Expected to:
Get a driver’s license 4,477 1,658 1,061 Get a paid job 5,339 1,768 1,130 Be financially self-supporting 5,122 1,679 1,074 Live independently without supervision 5,285 1,737 1,093 Live independently with supervision 1,557 560 422
Exhibit E-6
OTHER EXHIBITS: EXHIBITS 2-4, 3-4
Youth with Disabilities
Youth in the General Population
Exhibit 2-4 Help with homework 7,308 6,177
Exhibit 3-4 General school meeting 8,805 6,424 Parent-teacher conference 8,730 6,424 School or class event 8,801 6,424 Volunteer 8,814 6,424 Any of the four activities 9,003 6,424
Related Documents