USAID Learning Activity Family Health Indicators Data Quality Assessment (DQA) Report Submission Date: November 1, 2019 Agreement Number: AID – 72061719C00003 COR Name: Martin Muwaga Submitted by: Anant Singh, Chief of Party QED Group Embassy Plaza 1 st Floor, Plot 1188-1190 Ggaba Road This document was produced for review by the United States Agency for International Development Uganda Mission (USAID/Uganda).

Welcome message from author
This document is posted to help you gain knowledge. Please leave a comment to let me know what you think about it! Share it to your friends and learn new things together.
Transcript

Uganda Literacy Achievement and Retention Activity, Annual Report (October 1, 2017 – September 30, 2018) 1
TABLE OF CONTENTS Acronyms and Abbreviations iii List of Tables iv
List of Figures Error! Bookmark not defined.
Executive summary v
1. Introduction 1
2. DQA Methodology 3
2.1 Desk Review 3
2.2 Field Work 3
2.3 DQA Scoring 4
2.4 DQA Team Error! Bookmark not defined.
2.5 Documentation and Report Writing 4
3. Findings 6
1.1.1. Validity ............................................................. Error! Bookmark not defined. 1.1.2. Reliability ......................................................... Error! Bookmark not defined. 1.1.3. Timeliness ........................................................ Error! Bookmark not defined. 1.1.4. Precision .......................................................... Error! Bookmark not defined. 1.1.5. Integrity ........................................................... Error! Bookmark not defined.
4. Conclusions 17
5. Recommendations 18
Annexes 21
Annex 1. USAID DQA Checklists 31
Annex 2. MEL Systems Assessment Tool Error! Bookmark not defined.
Annex 3. Data Validation FORM/Results 79
USAID Learning Activity
Family Health Indicators Data Quality Assessment (DQA) Report
Submission Date: November 1, 2019 Agreement Number: AID – 72061719C00003 COR Name: Martin Muwaga Submitted by: Anant Singh, Chief of Party
QED Group Embassy Plaza 1st Floor, Plot 1188-1190 Ggaba Road This document was produced for review by the United States Agency for International Development Uganda Mission (USAID/Uganda).

ii
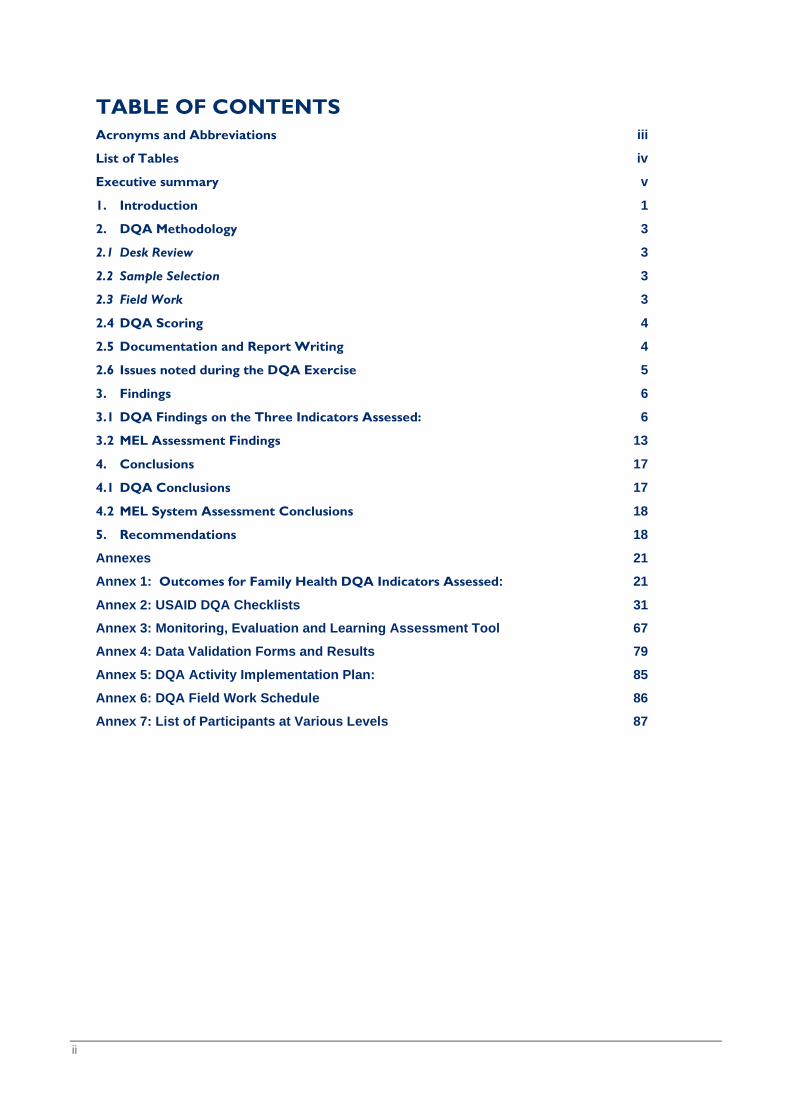
TABLE OF CONTENTS Acronyms and Abbreviations iii List of Tables iv
Executive summary v
1. Introduction 1
2. DQA Methodology 3
2.1 Desk Review 3
2.2 Sample Selection 3
2.3 Field Work 3
2.4 DQA Scoring 4
2.5 Documentation and Report Writing 4
2.6 Issues noted during the DQA Exercise 5
3. Findings 6
3.1 DQA Findings on the Three Indicators Assessed: 6
3.2 MEL Assessment Findings 13
4. Conclusions 17
4.1 DQA Conclusions 17
4.2 MEL System Assessment Conclusions 18
5. Recommendations 18
Annexes 21
Annex 1: Outcomes for Family Health DQA Indicators Assessed: 21
Annex 2: USAID DQA Checklists 31 Annex 3: Monitoring, Evaluation and Learning Assessment Tool 67
Annex 4: Data Validation Forms and Results 79
Annex 5: DQA Activity Implementation Plan: 85
Annex 6: DQA Field Work Schedule 86
Annex 7: List of Participants at Various Levels 87
iii
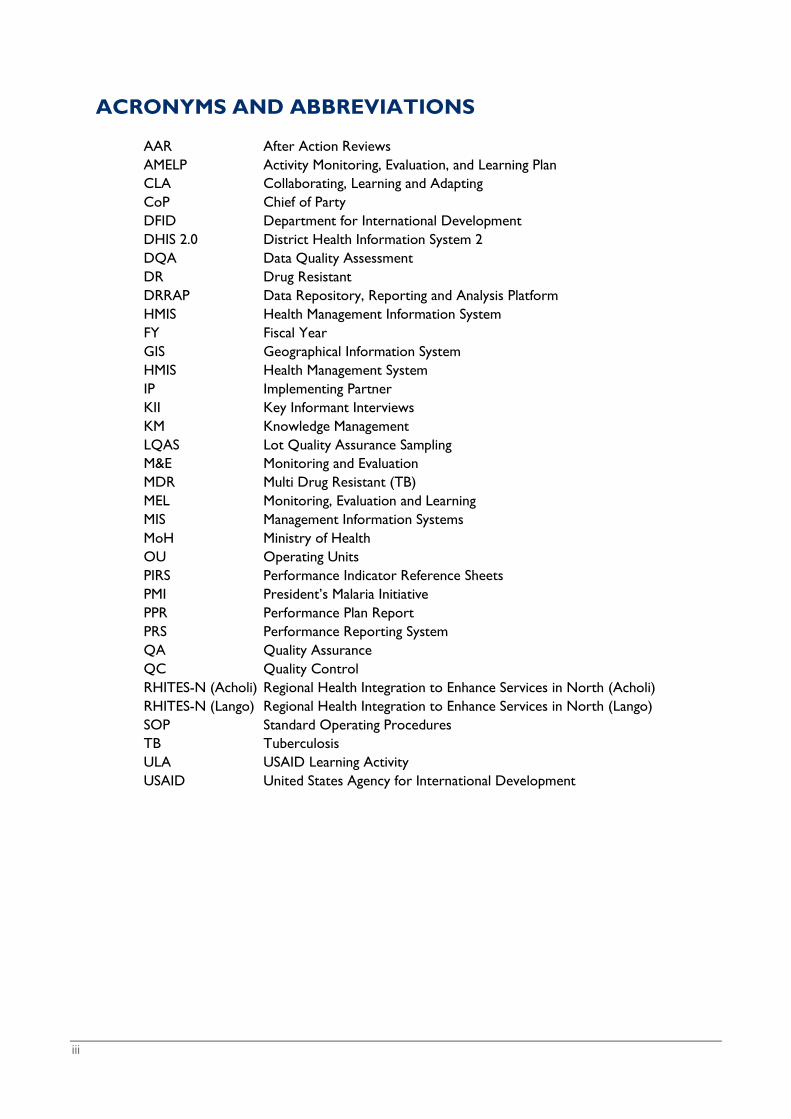
ACRONYMS AND ABBREVIATIONS
AAR After Action Reviews AMELP Activity Monitoring, Evaluation, and Learning Plan CLA Collaborating, Learning and Adapting CoP Chief of Party DFID Department for International Development DHIS 2.0 District Health Information System 2 DQA Data Quality Assessment DR Drug Resistant DRRAP Data Repository, Reporting and Analysis Platform HMIS Health Management Information System FY Fiscal Year GIS Geographical Information System HMIS Health Management System IP Implementing Partner KII Key Informant Interviews KM Knowledge Management LQAS Lot Quality Assurance Sampling M&E Monitoring and Evaluation MDR Multi Drug Resistant (TB) MEL Monitoring, Evaluation and Learning MIS Management Information Systems MoH Ministry of Health OU Operating Units PIRS Performance Indicator Reference Sheets PMI President’s Malaria Initiative PPR Performance Plan Report PRS Performance Reporting System QA Quality Assurance QC Quality Control RHITES-N (Acholi) Regional Health Integration to Enhance Services in North (Acholi) RHITES-N (Lango) Regional Health Integration to Enhance Services in North (Lango) SOP Standard Operating Procedures TB Tuberculosis ULA USAID Learning Activity USAID United States Agency for International Development
iv
LIST OF TABLES
Table: 1: Indicators assessed and the corresponding Activities: ............................................... 1 Table: 2: Distribution of the Health Facilities visited across districts and Activities ................ 3 Table: 3: Data Quality Rating ..................................................................................................... 4 Table: 4: Summary of Indicator Data Quality Rating by Activity .............................................. 6 Table: 5: Outcomes for Family Health DQA Indicators Assessed ......................................... 21
v
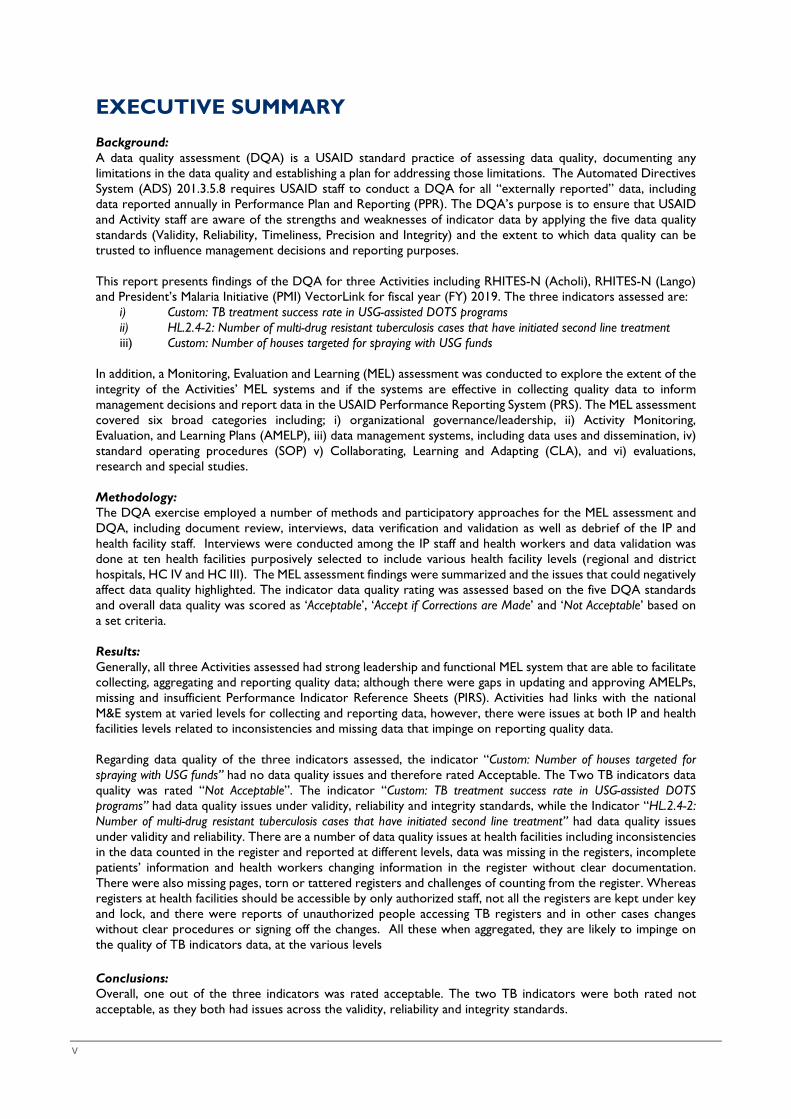
EXECUTIVE SUMMARY Background: A data quality assessment (DQA) is a USAID standard practice of assessing data quality, documenting any limitations in the data quality and establishing a plan for addressing those limitations. The Automated Directives System (ADS) 201.3.5.8 requires USAID staff to conduct a DQA for all “externally reported” data, including data reported annually in Performance Plan and Reporting (PPR). The DQA’s purpose is to ensure that USAID and Activity staff are aware of the strengths and weaknesses of indicator data by applying the five data quality standards (Validity, Reliability, Timeliness, Precision and Integrity) and the extent to which data quality can be trusted to influence management decisions and reporting purposes. This report presents findings of the DQA for three Activities including RHITES-N (Acholi), RHITES-N (Lango) and President’s Malaria Initiative (PMI) VectorLink for fiscal year (FY) 2019. The three indicators assessed are:
i) Custom: TB treatment success rate in USG-assisted DOTS programs ii) HL.2.4-2: Number of multi-drug resistant tuberculosis cases that have initiated second line treatment iii) Custom: Number of houses targeted for spraying with USG funds
In addition, a Monitoring, Evaluation and Learning (MEL) assessment was conducted to explore the extent of the integrity of the Activities’ MEL systems and if the systems are effective in collecting quality data to inform management decisions and report data in the USAID Performance Reporting System (PRS). The MEL assessment covered six broad categories including; i) organizational governance/leadership, ii) Activity Monitoring, Evaluation, and Learning Plans (AMELP), iii) data management systems, including data uses and dissemination, iv) standard operating procedures (SOP) v) Collaborating, Learning and Adapting (CLA), and vi) evaluations, research and special studies. Methodology: The DQA exercise employed a number of methods and participatory approaches for the MEL assessment and DQA, including document review, interviews, data verification and validation as well as debrief of the IP and health facility staff. Interviews were conducted among the IP staff and health workers and data validation was done at ten health facilities purposively selected to include various health facility levels (regional and district hospitals, HC IV and HC III). The MEL assessment findings were summarized and the issues that could negatively affect data quality highlighted. The indicator data quality rating was assessed based on the five DQA standards and overall data quality was scored as ‘Acceptable’, ‘Accept if Corrections are Made’ and ‘Not Acceptable’ based on a set criteria. Results: Generally, all three Activities assessed had strong leadership and functional MEL system that are able to facilitate collecting, aggregating and reporting quality data; although there were gaps in updating and approving AMELPs, missing and insufficient Performance Indicator Reference Sheets (PIRS). Activities had links with the national M&E system at varied levels for collecting and reporting data, however, there were issues at both IP and health facilities levels related to inconsistencies and missing data that impinge on reporting quality data. Regarding data quality of the three indicators assessed, the indicator “Custom: Number of houses targeted for spraying with USG funds” had no data quality issues and therefore rated Acceptable. The Two TB indicators data quality was rated “Not Acceptable”. The indicator “Custom: TB treatment success rate in USG-assisted DOTS programs” had data quality issues under validity, reliability and integrity standards, while the Indicator “HL.2.4-2: Number of multi-drug resistant tuberculosis cases that have initiated second line treatment” had data quality issues under validity and reliability. There are a number of data quality issues at health facilities including inconsistencies in the data counted in the register and reported at different levels, data was missing in the registers, incomplete patients’ information and health workers changing information in the register without clear documentation. There were also missing pages, torn or tattered registers and challenges of counting from the register. Whereas registers at health facilities should be accessible by only authorized staff, not all the registers are kept under key and lock, and there were reports of unauthorized people accessing TB registers and in other cases changes without clear procedures or signing off the changes. All these when aggregated, they are likely to impinge on the quality of TB indicators data, at the various levels Conclusions: Overall, one out of the three indicators was rated acceptable. The two TB indicators were both rated not acceptable, as they both had issues across the validity, reliability and integrity standards.
vi
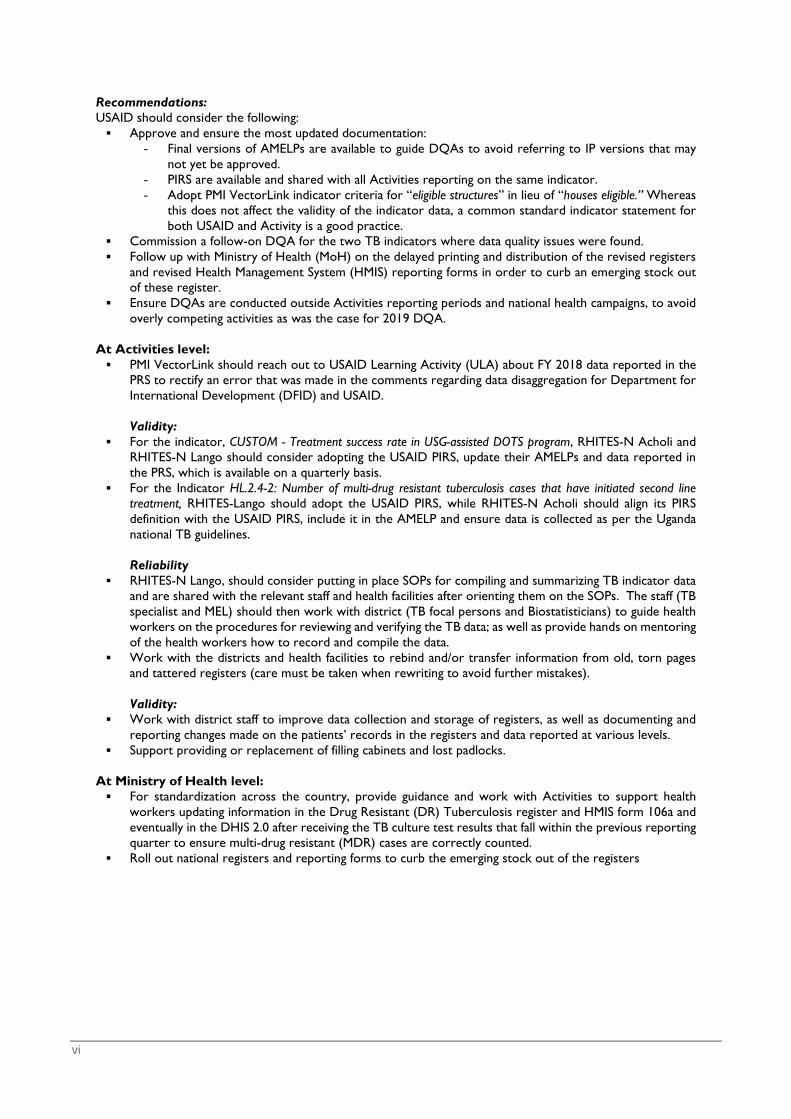
Recommendations: USAID should consider the following: Approve and ensure the most updated documentation:
- Final versions of AMELPs are available to guide DQAs to avoid referring to IP versions that may not yet be approved.
- PIRS are available and shared with all Activities reporting on the same indicator. - Adopt PMI VectorLink indicator criteria for “eligible structures” in lieu of “houses eligible.” Whereas
this does not affect the validity of the indicator data, a common standard indicator statement for both USAID and Activity is a good practice.
Commission a follow-on DQA for the two TB indicators where data quality issues were found. Follow up with Ministry of Health (MoH) on the delayed printing and distribution of the revised registers
and revised Health Management System (HMIS) reporting forms in order to curb an emerging stock out of these register.
Ensure DQAs are conducted outside Activities reporting periods and national health campaigns, to avoid overly competing activities as was the case for 2019 DQA.
At Activities level: PMI VectorLink should reach out to USAID Learning Activity (ULA) about FY 2018 data reported in the
PRS to rectify an error that was made in the comments regarding data disaggregation for Department for International Development (DFID) and USAID.
Validity:
For the indicator, CUSTOM - Treatment success rate in USG-assisted DOTS program, RHITES-N Acholi and RHITES-N Lango should consider adopting the USAID PIRS, update their AMELPs and data reported in the PRS, which is available on a quarterly basis.
For the Indicator HL.2.4-2: Number of multi-drug resistant tuberculosis cases that have initiated second line treatment, RHITES-Lango should adopt the USAID PIRS, while RHITES-N Acholi should align its PIRS definition with the USAID PIRS, include it in the AMELP and ensure data is collected as per the Uganda national TB guidelines.
Reliability
RHITES-N Lango, should consider putting in place SOPs for compiling and summarizing TB indicator data and are shared with the relevant staff and health facilities after orienting them on the SOPs. The staff (TB specialist and MEL) should then work with district (TB focal persons and Biostatisticians) to guide health workers on the procedures for reviewing and verifying the TB data; as well as provide hands on mentoring of the health workers how to record and compile the data.
Work with the districts and health facilities to rebind and/or transfer information from old, torn pages and tattered registers (care must be taken when rewriting to avoid further mistakes). Validity:
Work with district staff to improve data collection and storage of registers, as well as documenting and reporting changes made on the patients’ records in the registers and data reported at various levels.
Support providing or replacement of filling cabinets and lost padlocks.
At Ministry of Health level: For standardization across the country, provide guidance and work with Activities to support health
workers updating information in the Drug Resistant (DR) Tuberculosis register and HMIS form 106a and eventually in the DHIS 2.0 after receiving the TB culture test results that fall within the previous reporting quarter to ensure multi-drug resistant (MDR) cases are correctly counted.
Roll out national registers and reporting forms to curb the emerging stock out of the registers
1
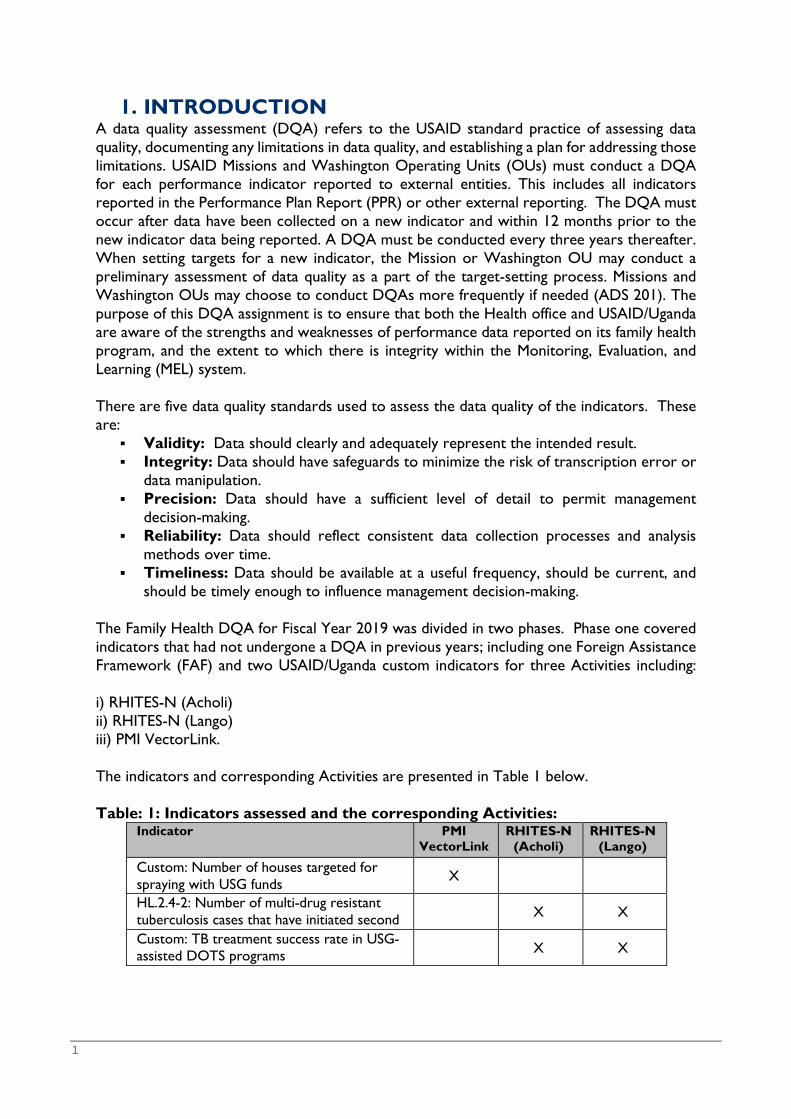
1. INTRODUCTION A data quality assessment (DQA) refers to the USAID standard practice of assessing data quality, documenting any limitations in data quality, and establishing a plan for addressing those limitations. USAID Missions and Washington Operating Units (OUs) must conduct a DQA for each performance indicator reported to external entities. This includes all indicators reported in the Performance Plan Report (PPR) or other external reporting. The DQA must occur after data have been collected on a new indicator and within 12 months prior to the new indicator data being reported. A DQA must be conducted every three years thereafter. When setting targets for a new indicator, the Mission or Washington OU may conduct a preliminary assessment of data quality as a part of the target-setting process. Missions and Washington OUs may choose to conduct DQAs more frequently if needed (ADS 201). The purpose of this DQA assignment is to ensure that both the Health office and USAID/Uganda are aware of the strengths and weaknesses of performance data reported on its family health program, and the extent to which there is integrity within the Monitoring, Evaluation, and Learning (MEL) system. There are five data quality standards used to assess the data quality of the indicators. These are:
Validity: Data should clearly and adequately represent the intended result. Integrity: Data should have safeguards to minimize the risk of transcription error or
data manipulation. Precision: Data should have a sufficient level of detail to permit management
decision-making. Reliability: Data should reflect consistent data collection processes and analysis
methods over time. Timeliness: Data should be available at a useful frequency, should be current, and
should be timely enough to influence management decision-making. The Family Health DQA for Fiscal Year 2019 was divided in two phases. Phase one covered indicators that had not undergone a DQA in previous years; including one Foreign Assistance Framework (FAF) and two USAID/Uganda custom indicators for three Activities including: i) RHITES-N (Acholi) ii) RHITES-N (Lango) iii) PMI VectorLink. The indicators and corresponding Activities are presented in Table 1 below. Table: 1: Indicators assessed and the corresponding Activities:
Indicator PMI VectorLink
RHITES-N (Acholi)
RHITES-N (Lango)
Custom: Number of houses targeted for spraying with USG funds X
HL.2.4-2: Number of multi-drug resistant tuberculosis cases that have initiated second
X X
Custom: TB treatment success rate in USG-assisted DOTS programs
X X
2
It is important to note that while this DQA was focused on the three Activities, there are other Activities reporting on the two TB indicators. These were previously assessed and had data quality issues for follow up. These will be reviewed in phase two of the DQA. The DQA focused on data reported during FY 2018 and FY 2019, that is October 1, 2017 to September 30, 2018, and three quarters of the FY 2019 (October 2018 - June 2019). This is because Activities had not yet reported data for quarter four FY 2019. Additionally, the DQA team conducted a MEL system assessment to explore the extent to which the integrity of the MEL systems are effective in supporting quality data collection that informs management decisions. The assessment looked at the Activities MEL systems and structures that support data management in order to appreciate the strength and weaknesses in the data collection, analysis, reporting, as well dissemination. The findings were used to identify corrective actions needed to address systematic and structural limitations. Likewise, the team would leverage organization-wide learning opportunities and management adaptations across organizations. This report presents high-level findings from the DQA exercise as well as the MEL assessment for three Activities.
3
2. DQA METHODOLOGY To implement the DQA and MEL system assessment, ULA employed a number of methods and participatory approaches, including a comprehensive document review, key informant interviews, data verification, validation, as well as debrief clarifications at the Activities and health facility level.
2.1 Desk Review The DQA team conducted a desk review of pertinent Activities documentation that outlines data collection, management, quality assurance (QA) and quality control (QC) processes. Documents reviewed include the AMELP, 2018 annual and 2019 quarterly reports submitted to USAID, organograms, SOPs, data collection and analysis tools, and data reported in the PRS for each indicator. The DQA team also reviewed and observed additional documents at Activity level to corroborate information shared by the Activities. Additionally, the USAID PIRS were reviewed for relevant and appropriate indicator definition, methodology, construction, data source, and reporting frequency.
2.2 Sample Selection For RHITES N Lango and RHITES N Acholi, sites were purposively selected in order to get a combination of health facilities at regional and district levels, as well as health center IVs and IIIs where TB services are provided. The two regional referral hospitals that treat MDR cases (Gulu and Lira) were purposively selected, while the additional eight health facilities were randomly selected. A summary of health facilities visited are presented in Table 2.
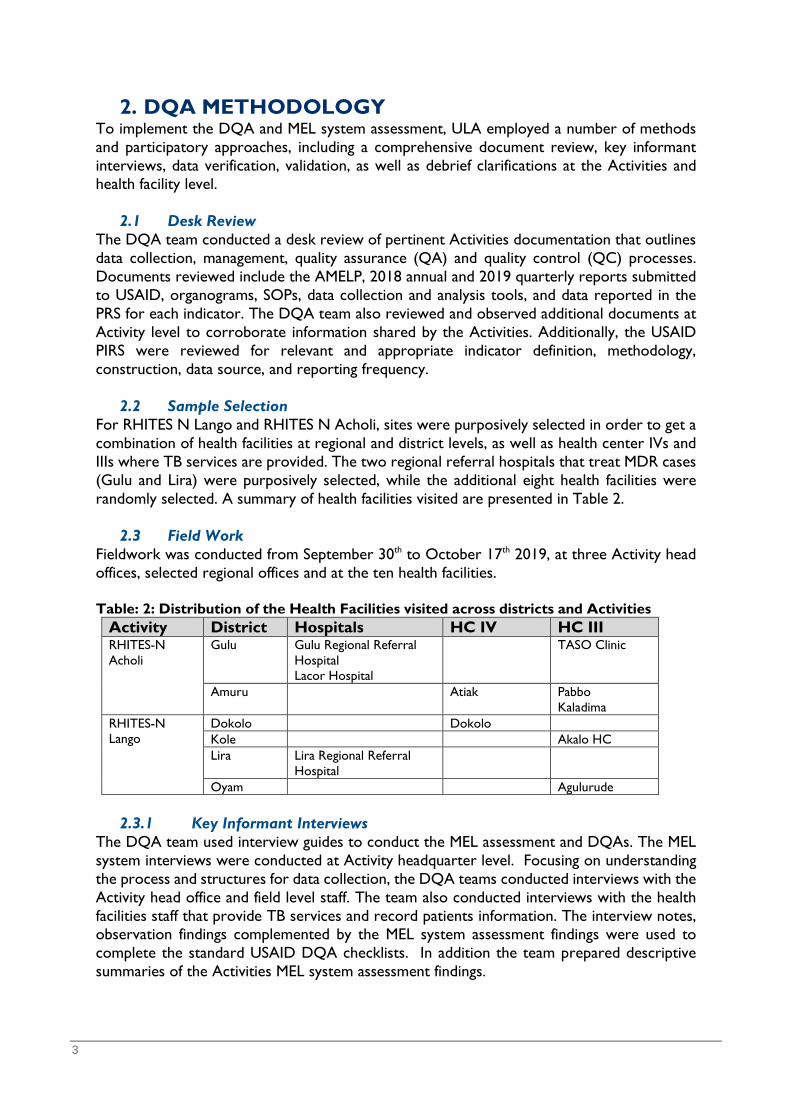
2.3 Field Work Fieldwork was conducted from September 30th to October 17th 2019, at three Activity head offices, selected regional offices and at the ten health facilities. Table: 2: Distribution of the Health Facilities visited across districts and Activities
Activity District Hospitals HC IV HC III RHITES-N Acholi
Gulu Gulu Regional Referral Hospital Lacor Hospital
TASO Clinic
Amuru Atiak Pabbo Kaladima
RHITES-N Lango
Dokolo Dokolo Kole Akalo HC Lira Lira Regional Referral
Hospital
Oyam Agulurude
2.3.1 Key Informant Interviews The DQA team used interview guides to conduct the MEL assessment and DQAs. The MEL system interviews were conducted at Activity headquarter level. Focusing on understanding the process and structures for data collection, the DQA teams conducted interviews with the Activity head office and field level staff. The team also conducted interviews with the health facilities staff that provide TB services and record patients information. The interview notes, observation findings complemented by the MEL system assessment findings were used to complete the standard USAID DQA checklists. In addition the team prepared descriptive summaries of the Activities MEL system assessment findings.

4
2.3.2 Data Verification and Validation The DQA Team carried out data verification and validation by comparing data reported in the respective PIRS with the data in Activity narratives, annual and quarterly reports, databases and the DHIS 2.0. For the TB indicators, physical data counts done from the data collection registers, including the Unit TB and DR register at the respective health facilities were compared with data reported in DHIS 2.0.
2.3.3 Debrief with Activities At the end of the field exercise for each Activity, the DQA team conducted a debrief session for MEL staff, technical staff, and health facility staff. During debrief, the team highlighted good practices, initial DQA findings, and recommended actions for improvement. The DQA team used a participatory approach in order for Activity staff to appreciate their efforts in data quality and the required actions.
2.4 DQA Scoring Indicator data quality was assessed against five quality standards; Validity, Reliability, Timeliness, Precision and Integrity. Each specific indicator data quality is rated as ‘Acceptable’, ‘Acceptable if corrections are made’ or ‘Not acceptable’, based on the criteria presented below in Table 3. Table: 3: Data Quality Rating Rating Criteria Acceptable The indicator had no data quality issues identified Acceptable if corrections are made
The indicator had data quality issues on one of the standard that did not significantly affect the quality of the data
Not acceptable The indicator had data quality issues that are likely to have a significant impact on the data quality
2.5 Documentation and Report Writing
Following the field work, the DQA team completed five USAID DQA checklists, one for each indicator reviewed per Activity (Annex 2). The team consolidated checklists for the two TB indicators that were reported on by RHITES-N Activities to complete indicator-level DQA checklists. The team also reviewed and completed the MEL system assessment tool and prepared a draft report. The products were reviewed internally with ULA and presented to the USAID/Uganda Health Office. The DQA team used the feedback from the presentation to prepare a final report with recommendations for data quality improvement. The detailed activity schedule including fieldwork and report writing is outlined in Annex 5 and 6. The DQA team comprised the following persons:
• Esther N. Sempiira, DQA Team Lead, • Emilly Kemigisha-Ssali, Health Specialist, • Heiwote Aberra, MEL Specialist, • Erika Dunmire, Team Advisor • David Mawejje, PRS Database Manager
The team was responsible for the DQA process, including document reviews, Activity interviews and visits to the selected health facilities. The team worked with Activities staff in a participatory manner, including joint site visits and group counts. By accessing data from

5
health registers, the DQA team verified data. These validation and verification exercises led to collaborative discussions on approaches to mitigate data quality issues. Following these systematic data quality processes helped Activity staff to appreciate the DQA findings and recommendations during the debrief sessions.
2.6 Issues noted during the DQA Exercise i) The team was only able to get Pre-2016 PIRS for this indicator while the MDR PIRS had
outdated data sources. The DQA team was tasked to request Activities to provide documentation for the DQA exercise, however the responsible Activity did not have the updated USAID PIRS - “Number of houses targeted for spraying with USG funds”.
ii) The Family Health 2019 DQA was conducted at the end of quarter 4, a period when Activities are heavily involved in collecting and compiling data for annual reporting. There was serious competition for MEL staff time involvement in both the data collection for reporting and the DQA exercise. There was also a national Measles-Rubella and Polio campaign for the period October 16-21, 2018; involving various health workers right from the health facilities to districts level. This in a way limited on selection and increasing the selection of facilities across districts in the RHITES-N Acholi region as had been proposed by USAID. There was a challenge of ensuring the responsible health workers were available at the selected sites for the DQA exercise.
iii) The Ministry of Health (MoH) is in the process of printing and rolling out updated registers and HMIS reporting forms, with some period of waiting for these forms, leading to scarcity and stock-outs at some health facilities. There are also very old, torn and tattered registers that need immediate replacement and/or transcribing the records on new pages, in order mitigate against loss of information that would be in future needed for reporting, validation and comparison.
iv) The MEL assessment tool was noted to be long, had repetitive questions that possibly need revising. It was also noted that a MEL system is easier to administer, relates more to data management processes of Activities with one or fewer service areas, such as VectorLink. The tool tended to be bulky, repetitive and confusing when exploring Activities with multiple services, such as the RHITES-N and does not readily show the sought link between the findings of the MEL Assessment and the selected indicator DQA.
6
3. FINDINGS This section provides the detailed analysis and summary of the findings of the DQA and MEL system assessment.
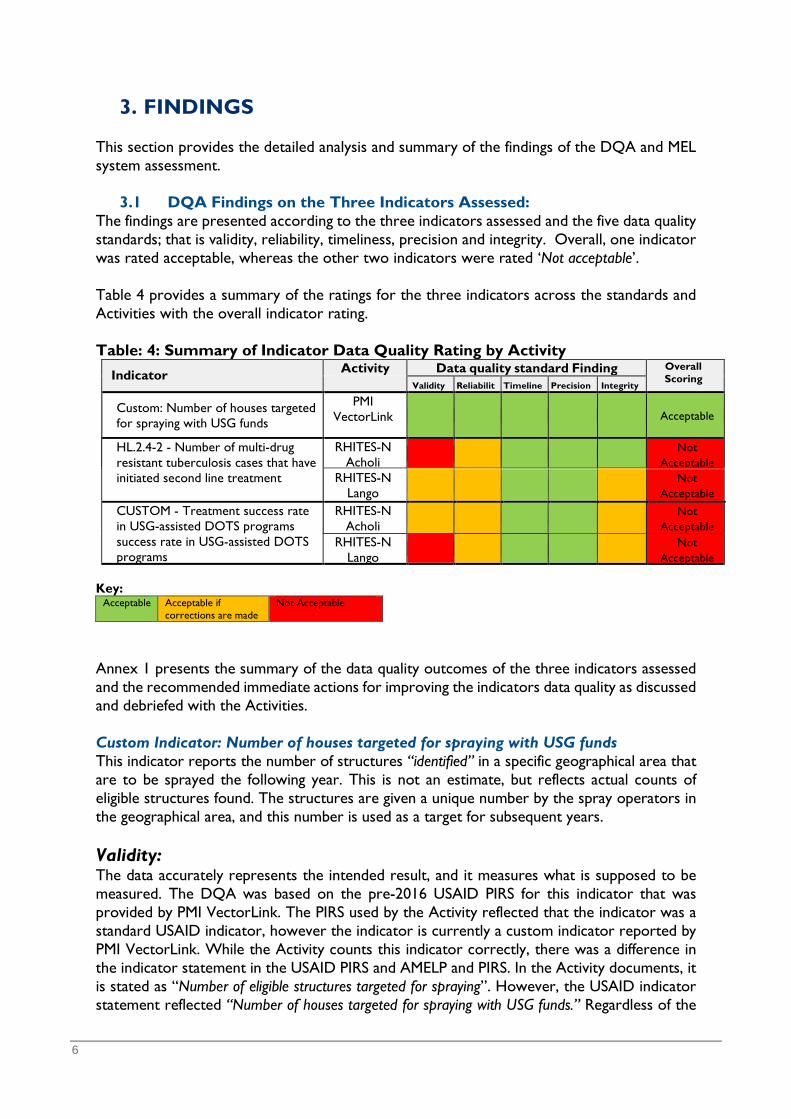
3.1 DQA Findings on the Three Indicators Assessed: The findings are presented according to the three indicators assessed and the five data quality standards; that is validity, reliability, timeliness, precision and integrity. Overall, one indicator was rated acceptable, whereas the other two indicators were rated ‘Not acceptable’. Table 4 provides a summary of the ratings for the three indicators across the standards and Activities with the overall indicator rating. Table: 4: Summary of Indicator Data Quality Rating by Activity
Indicator Activity Data quality standard Finding Overall Scoring
Validity Reliabilit
Timeline
Precision Integrity
Custom: Number of houses targeted for spraying with USG funds
PMI VectorLink Acceptable
HL.2.4-2 - Number of multi-drug resistant tuberculosis cases that have initiated second line treatment
RHITES-N Acholi
Not Acceptable
RHITES-N Lango
Not Acceptable
CUSTOM - Treatment success rate in USG-assisted DOTS programs success rate in USG-assisted DOTS programs
RHITES-N Acholi Not
Acceptable RHITES-N
Lango
Not Acceptable
Key:
Acceptable Acceptable if corrections are made
Not Acceptable
Annex 1 presents the summary of the data quality outcomes of the three indicators assessed and the recommended immediate actions for improving the indicators data quality as discussed and debriefed with the Activities. Custom Indicator: Number of houses targeted for spraying with USG funds This indicator reports the number of structures “identified” in a specific geographical area that are to be sprayed the following year. This is not an estimate, but reflects actual counts of eligible structures found. The structures are given a unique number by the spray operators in the geographical area, and this number is used as a target for subsequent years. Validity: The data accurately represents the intended result, and it measures what is supposed to be measured. The DQA was based on the pre-2016 USAID PIRS for this indicator that was provided by PMI VectorLink. The PIRS used by the Activity reflected that the indicator was a standard USAID indicator, however the indicator is currently a custom indicator reported by PMI VectorLink. While the Activity counts this indicator correctly, there was a difference in the indicator statement in the USAID PIRS and AMELP and PIRS. In the Activity documents, it is stated as “Number of eligible structures targeted for spraying”. However, the USAID indicator statement reflected “Number of houses targeted for spraying with USG funds.” Regardless of the

7
difference in the wording, the Activity’s documentation states that the definition of houses is the same as eligible structures, and therefore the indicator count is not affected. This activity is funded by PMI and DFID, hence the Activity disaggregates data by these two funding streams. In the USAID/Uganda PRS, the Activity only reports data from USAID supported districts. However, there is a written comment stating that the number reported includes both PMI and DFID funding streams. This comment originates from the Activity end of spray report of 2018 and PRS. During data verification, the DQA team established the number reported in the PRS for 2018 was only for PMI funding. So, the statement regarding the inclusion of DFID was an error. The indicator count is straight forward, as it looks at the structures eligible for spraying. The eligible structures are counted during IRS campaigns, using a unique identification number on each structure. Every house that is identified as eligible for spraying is based on documented Activity’s criteria, whether it is sprayed or not. These eligible structures are included in the count for this indicator and recorded in the Daily Spray Operator form, which is the primary data collection tool. The data from the daily spray forms is entered into the Activity database, which aggregates the number of eligible structures. This aggregate is used to report on this indicator. The DQA team compared the number in the PRS and Activity records, including the IRS Activity Report and the figure was the same. The Activity SOPs and robust data quality controls, including daily reviews of the primary data collection tool, quick data verification within two days of data collection, and supervision at the various levels (village, sub-county, district and Activity level), strengthen the data quality for this indicator. The validation checks in the reporting database help to flag inconsistencies during data entry and ensures there is no under/over counting. There is also a post-spray validation exercise, which is conducted for about 30% of the eligible structures. Reliability: PMI VectorLink has been using the same data collection tools and aggregation methods since 2018. The primary data collection tool, the Daily Spray Operator’s Form, captures the unique ID number used to count this indicator. The spray operators are trained prior to each spray period and provided with detailed SOPs to guide collection of data for this indicator. There are checks in the PMI VectorLink IRS database to ensure data quality that is reliable. Timeliness: PMI VectorLink data is available on a daily and weekly basis during spray campaigns. Data that is collected on a specific day is entered into the system by the next day, and therefore available to stakeholders almost instantaneously. Data is used by various Activity staff to plan for the required logistics and human resources needed during the spray campaign. The data is aggregated for planning and reporting in the PMI IRS database and reported annually in PRS. The Activity has been consistent and on time in submitting data for this indicator. Precision: The data for this indicator is a routine program data captured from Activity records. The primary data collection tool is fine-tuned enough to capture the unique Id-number for a structure, which is the required information for this indicator. There are no disaggregates required for this indicator in the PRS.
8
Integrity: Data collection by the spray operators is monitored by supervisors who oversee teams of 4 to 5 sprayers. The supervisors use the Daily Team Leader Summary form to review the data collected in the primary data collection tool. During data cleaning and entry, the data entry staff and supervisors review and sign off corrections made in red ink, therefore any changes in the data at all levels can be traced back to the source. In addition, the Activity database features internal controls to ensure that data are correctly aggregated. The computers of the data clerks are password-protected, where the passwords are changed every 90 days during the spray period to limit unauthorized access. The Activity also uses stores’ records to triangulate the data after the spraying exercise. The multiple internal data verification and controls in place ensure independence in data collection and entry. HL.2.4-2 - Number of multi-drug resistant tuberculosis cases that have initiated second line treatment Validity: The Number of multi-drug resistant (MDR) tuberculosis cases that have initiated second line treatment is a standard Foreign Assistance Indicator. The Mission PIRS provides a clear definition for this indicator and associated data collection methods. There is limited information on how to collect the data for reporting in the PRS, as both Activities reporting on this indicator did not have the USAID Uganda PIRS. RHITES-N Lango was unable to provide a PIRS, while RHITES-N Acholi provided a modified PIRS lacking details found in the USAID Uganda PIRS. Furthermore, RHITES-N Acholi Performance Indicator Table in the AMELP did not feature this indicator. The absence of a standard PIRS at Activity level has created variances in how they count data for this indicator. The USAID definition for this indicator states that the count should include TB cases resistant to isoniazid and rifampicin, who were reported as starting second line treatment in a specific period. However, the definition also states: Where countries have determined that rifampicin resistant tuberculosis is an indication for second line treatment and cases with rifampicin resistance initiate treatment, these cases should also be included in the count. However, the Uganda National TB and Leprosy Management and Control Guideline; March 2017 indicates that rifampicin resistant (RR) cases should also be included in the count for second line of treatment. The two Activities s had a different understanding of the definition and data reporting methods for this indicator. Whereas RHITES-N Lango did not have a copy of the PIRS, the Activity and health facilities had an accurate understanding of the data requirement for this indicator, as verified by the DQA team. They were also aware of the requirement to include both RR and MDR cases, while reporting into the PRS. On the other hand, RHITES-N Acholi had a PIRS that did not include a definition of the indicator, and therefore their understanding of reporting on this indicator did not include RR cases while reporting in the USAID PRS. This exclusion produced systematically biased data for RHITES-N Acholi. Data for this indicator is collected and reported only at treatment sites, the regional referral and selected district hospitals. These include Lira Regional Referral Hospital for RHITES-N Lango, Gulu Regional Referral Hospital and Kitgum District Hospital for RHITES-N Acholi.
9
The lower level health facilities refer patients to the treatment centres. They have a clear understanding of how to handle and refer MDR cases, but do not report on this indicator. Data for this indicator is collected through the national HMIS, using the Drug Resistant TB Register (HMIS 096a) that has a job aid on the cover page to guide filling patient information in the register. The information is summarized on the HMIS 106a quarterly report form and is reported in the DHIS 2.0. The HMIS 106a provides disaggregates by RR, MDR and XDR cases reported in the DHIS 2.0, where the Activities extract the data. When DR cases are identified, a culture-test is completed in order to classify the DRs. This is a Ministry of Health requirement, and it is done at the reference Laboratory in Kampala. The culture test results may take up to three months. This creates a time lag for recording and updating the DR classification (RR and MDR) in the register. For the case of RHITES-N Acholi, the delay of the culture test results created a gap in the count for this indicator, since they only consider MDRs and exclude RRs. The DQA Team determined that there is risk of undercounting for this indicator, as they wait for the DR disaggregation. This is due to the gap in the indicator definition. Reliability: The Drug Resistant TB Register is used to collect data for this indicator, and data is summarized on the HMIS 106a quarterly report form and reported into DHIS 2.0. The data collection process has remained consistent for the last three years, and the register measures the same result if used correctly. There was a shared understanding of data collection for this indicator at all levels. TB focal persons and health workers recording data in the register had a good understanding of which columns (section 32, 32.1) to review to collect the data to report in the national HMIS 106a form and DHIS 2.0. In RHITES-N Acholi, the health facilities visited, used team counting as a means to ensure data accuracy. While the DR TB Register provides guidance on data collection, there are no TB specific SOPs for the guidance of counting and summarizing data for this indicator for RHITES-N Lango. However, RHITES-N Acholi had a SOP on TB reporting, “Common Mistakes and Solutions for TB reporting” disseminated at the health facilities visited by the DQA team. TB patients are assigned a district and health facility unique number, which helps to track inter-facility and ultra-facility transfers for TB patients, and this helps to minimize double counting. These numbers were missing in the register at Gulu regional referral Hospital. The number is assigned by the District TB and Leprosy (DTL) focal persons, but sometimes there are delays in visiting the health facility to assign the numbers. Timeliness: Data for this indicator is available for monthly and quarterly reviews and reporting, yet required for planning purposes. Data for this indicator is summarized and reported on a weekly basis in the DRTBMIS (every Tuesday), monthly through the national HMIS 105 form (every 7th of the following month) and quarterly through the HMIS 106a form (by 15th of the following month after end of quarter). This is an annual indicator reported in the PRS. Both RHITES-N Acholi and RHITES-N Lango had reported data for this indicator in the PRS for FY 2018.

10
In RHITES-N Lango, at the facility and Activity level, there is a clear understanding and adherence to reporting timelines. The guidelines to ensure timely reporting are available and shared by the Activity across relevant teams. Additionally, short instant messages (SMS) are used for reminder to health workers timely reporting. In Gulu Regional Referral Hospital, for every DR patient, the health workers first record RR in the DR TB Register and it takes time up to more than three months to get the culture test that classifies for DRs as RR and MDR. If the culture test is MDR, the patient’s initial diagnosis of RR is whitewashed and replaced with “MDR”. While reporting is done on a timely basis, for RHITES-N Acholi, the RR cases are excluded in the indicator count, if the culture results have not yet been returned to the facility and the register updated within the specified quarterly reporting period. Since data is updated on the date the patient was first registered in the DR TB register, there’s potential for error in reporting if the information is updated after the reporting period. When the health worker was asked how the changes are accounted for in the reporting, they were unable to provide a clear response. Precision: The data collection tool, the DR TB register at the health facility is detailed and has all the data variables required to record, collect and report the required data for this indicator. The non-unique identifier relevant variables in the register for this indicator include GeneXpert results, date of diagnosis, bacteriologically confirmed RR/MDR/XDR and patient initiated on 2nd Line Regiment. These variables can measure the expected change over time. While there are no disaggregates required for PRS reporting for the national system disaggregates by RR, MDR and XDR, by gender and new or previous cases. The disaggregation by types of resistance, allows the national reporting system to provide a more precise measurement. Integrity: There were various processes in place to minimize transcription errors at the health facilities visited regarding this indicator. Each patient is given unique identification number both at the health facility that guides counting. The number of patients for this indicator is relatively small and transcription errors are quite minimal. The DQA team noted team counting was used at Gulu Regional Hospital to ensure agreement in the numbers reported from the DR TB Register into the national reporting system. The national reporting system (DHIS 2.0) has system checks to ensure correct aggregations of data reported. While changes to the records in the register require sign off, in Gulu Regional Referral Hospital, the changes in the DR TB Register after the culture test results returned, often times after a period exceeding a month, the updates were made without any process to ensure similar changes on the HMIS 106 a report form and in the DHIS 2.0. There are systems in place to ensure independence in completing the data in the register. The DHIS 2.0 is password protected and the Activities only have viewing rights. DR TB Registers are kept in secure places, in the TB ward that’s only accessible by relevant staff. CUSTOM - Treatment success rate in USG-assisted DOTS programs Validity: The two Activities assessed, that is RHITES-N Acholi and RHITES-N Lango had good understanding of the indicator requirements and the information collected measures what it
11
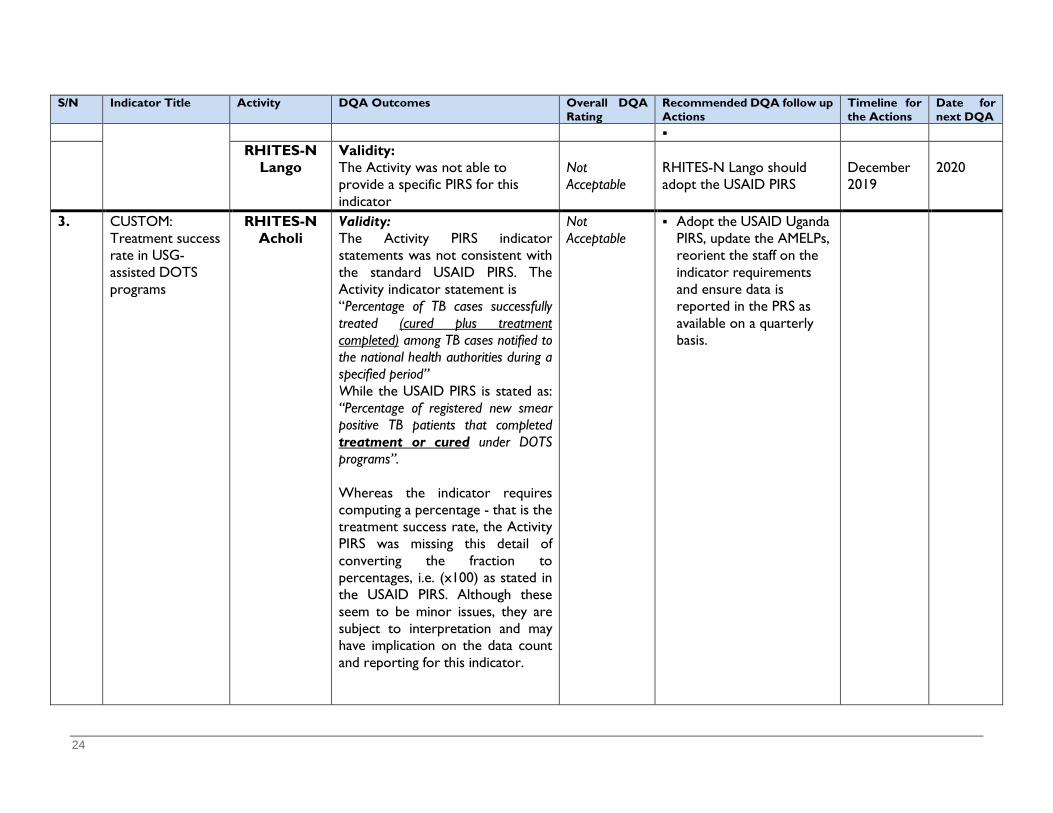
is supposed to measure. However both Activities PIRS indicator statements were not consistent with the standard USAID PIRS. The Activities indicator statement is RHITES-N Acholi: Percentage of TB cases successfully treated (cured plus treatment completed) among TB
cases notified to the national health authorities during a specified period RHITES-N Lango: Percent of registered new smear positive pulmonary TB cases that were cured and
completed treatment under DOTs nationally (TB Treatment Success Rate), While the USAID PIRS is stated as:
Percentage of registered new smear positive TB patients that completed treatment or cured under DOTS programs.
The indicator definitions for the numerator and denominator are the same among the Activities and standard USAID Uganda PIRS and the Activities have the same calculation for this indicator. Whereas this indicator requires computing a percentage - that is the treatment success rate, the Activities PIRS are missing this detail of converting the fraction to percentages, i.e. (x100) as stated in the USAID PIRS. Although these seem to be a minor issues, they are subject to interpretation and may have implication on the data count and reporting for this indicator. There were discrepancies in the data count from the register and that reported in DHIS 2.0 resulting from whether or not to include relapses and failed cases while counting for this indicator. At Lacor Hospital for example, they exclude failures, yet the health facilities visited in RHITES-N Lango region, only counted new and excluded relapses in the calculation. Data for this indicator is collected within the national HMIS process, using a standard tool the Health Unit TB register (HMIS 096a), which collects all the required data variables. The register has documented job aid on the cover page that guides the recording of information in the register. Aggregation is done by tallying data from the register and reported using HMIS 106b, the quarterly report form and data entered into DHIS 2.0, where Activities extract data to compute the indicator value reported in the USAID PRS. There are SOPs to guide the analysis of data for this indicator at the facility level and it is available to all staff that need it. RHITES-N Acholi further provided their supported facilities with a tool to report on the treatment success rate on a quarterly basis, which is captured in their weekly dash board for reporting. The same tool and data collection procedures have been in place for over three years and there is reasonable assurance that the data collection method does not produce systematically biased data. Across all the 10 health facilities visited, there were variations in the data counted in the TB registers and either that reported on the HMIS 106a quarterly report or the data reported in DHIS 2.0. At TASO Clinic Gulu, there was a notable difference in the numerator for the indicator of 12 patients count from the register and the data reported in DHIS 2.0. The difference was explained as a later update in the register which was not eventually captured in the DHIS 2.0, At Dokolo HC IV, the numerator and denominator count for the indicator for quarter 2 FY19 was 26/32 compared to 52/55 in DHIS 2.0; thus the number reported doubled in the same period. This was explained that the TB focal person included the district figure in the HC IV report. There were also inconsistencies in data reported in the PRS and that in DHIS 2.0. The validation and verification counts at the various health facilities visited are presented in Annex 4. There were other data quality issues related to the TB registers include missing data, the extreme being data for an entire quarter missing, yet the facility went ahead to report for that specific quarter, without any mention or acknowledgement of this anomaly either on in the
12
register or HMIS quarterly report form. In one health facility, the health worker reported the registers were taken away by various other health workers, leading to the data neither being entered on time nor entered at all. Other issues include incomplete patients’ information, health workers changing data in the register based on memory without any documentation or signing off the changes; a situation that was observed during the visit at two health facilities. There were missing pages, torn or tattered registers at various health facilities. The previous July 2013 version of the TB register were too long to easily count data across adjacent pages. The DQA team observed that it was difficult to follow a patient record across the adjacent pages, as the rows were not aligned, occasionally leading to miscounting. The current version of the register, the lines separating each patient case are clearer and the variables easier to count. The TB register includes a header for the entry of dates (month/year) for the reporting period. However some registers had incomplete or did not have header information; making it difficult to accurately count across months. All these issues have an impact on the quality of data at the various levels of reporting. Reliability: Data for this indicator is collected using the health facility TB register and summarized on HMIS 106a quarterly reporting form. The data collection tool is stable and the same procedures have been in place since 2014. Data for this indicator is compiled based on patients initiated on treatment a year before (a 12 month cohort). For instance data for quarter 2 (January-March 2018), the count and record comes from the January - March 2017 register records. At the various health facilities visited, they reported a team involved in the counting to minimize errors. The TB register is very wide, which makes it hard to follow the same record across the two adjacent pages when counting the data, which was observed during the data verification at Atiak HC IV. The data analysis processes for this indicator were stable over time. Data quality challenges were reported and shared during staff and district quarterly review meetings. RHITES-N Acholi and health facilities had SOPs to guide the TB services and data collection processes. A notable SOP by was “TB mistakes and their solutions” found displayed at all the health facilities visited. On the other hand, RHITES-N Lango had generalized SOPs, with only a section on SOPs in the AMELP, which does not give sufficient guidance for counting and summarizing data for this indicator at both the Activity and health facilities levels. Regarding unique identifiers, the TB patients are assigned both a district and health facility unique number, which helps to track inter-facility and ultra-facility transfers for TB patients which should help to minimize double counting. The district number is assigned by the District TB and Leprosy (DTL) focal persons, but sometimes there are delays of the focal person visiting the health facility to assign the numbers. The DQA noticed these were missing in the register at Gulu regional referral Hospital. Timeliness: The most current data for this indicator is available for the Activities reporting and decision-making. At site level, registers are filled in on a daily basis, summarized and reported on a weekly basis in on TB-Info, a database established by another Activity, Defeat TB. All the health facilities are able to report on time, because of the Activities support. The District TB and Leprosy focal person updates the district TB registers on a monthly basis. Activities are able to extract data from DHIS 2.0 on a monthly and quarterly basis, to inform the Activities program management decisions as well as reporting in the PRS and completion of quarterly narrative reports. However RHITES-N Lango was not sure of the reporting timeline in the PRS for this indicator, whether it is quarterly or annual, but they report on the indicator in

13
the quarterly narrative report and were planning for the annual reporting for FY 2019 in the PRS. Precision: The data collection method and t is fine-tuned and exact enough to measure the expected change. The TB register is able to capture the number of new TB cases at the facility within a specified period and the number of patients that were cured or completed treatment. The TB register is also able to captures the age and gender disaggregates for this indicator. There are no disaggregates required for reporting in the PRS and the margin of error is also not necessary for this indicator. Integrity: At the health facilities, the health workers use tallies to summarize data from the register into the HMIS 106a quarterly reporting form. This is independently done without any influence and there are procedures to guide and document changes at the various levels, although not a common practice. Data is checked by the in-charge at the health facility and Activity staff before submission to the district for the lower level health facilities (HCIII) and directly entered in the DHIS 2.0 for higher level health facilities (HC IV and hospitals). The Activity support the biostatisticians at district levels for the verification and confirmation of data entered in DHIS 2.0. The RHITES-N Lango DRRAP has a provision to compare with DHIS 2.0 data and flag inconsistences based on a logical comparison of related indicators. The Activity databases and DHIS 2.0 are password protected. The Activity level data is stored in password-protected computers, only accessible by the authorized staff. Only the district Biostatistician has data editing rights in the DHIS 2.0; the Activity staff only have viewing rights. RHITES-N Lango provided the 52 health facilities in the region with lockable filing racks for storage of HIV and TB patient records. Whereas at health facilities, the registers should be accessible by only the staff required to use them, not all the registers are kept under key and lock. At Gulu Regional Referral Hospital, there were no locks to the files cabinets and the TB Unit door and the TB register would be easily picked by other health workers, and the TB staff had to look for it. At 4 of the health facilities visited, data was changed without clear procedures and authorization, with observed on-the-spot changing of data without signing off the changes
3.2 MEL Assessment Findings The MEL system assessment covered six broad areas including; i) Organizational governance/leadership, ii) AMELP, iii) Data Management Systems including data use and dissemination, iv) Standard Operating Procedures (SOP), v) Collaborating, Learning and Adapting (CLA) and vi) Evaluations, Research and Special Studies. The summary of findings are presented under these broad areas:
3.2.1 PMI VectorLink Activity Overall, PMI has a comprehensive MEL system with functional structures in place. Highlights of the MEL system are: Organizational Governance/Leadership: The PMI VectorLink Activity has an effective
MEL staffing structure, composed of four full-time staff headed by the M&E Manager who is part of the senior management team. The Activity hires approximately 60 seasonal M&E Assistants and data clerks during the spraying period. The Activity has a capacity building

14
plan in place which includes providing M&E training at the start of the spraying period. The activity carries out intensive M&E training, ranging from three days to two weeks depending on the role of the MEL and implementation staff. The DQA team noted that all levels of staff involved in collecting, analyzing and reporting the data clearly understood indicator requirements and data flow.
AMELP: The PMI VectorLink Activity has a comprehensive AMELP in place with all the
required sections included. However, the DQA team received two versions of the AMELP; one version from USAID and another from the Activity, both of which had a submission date of April 14, 2019, but the content differed in some areas.
Data Management systems: The PMI VectorLink Activity has a well laid out and functional data management system, with data collection tools that effectively collect all the required variables for most indicators including the one under review. During the spray campaign period, data is collected on a daily basis and submitted through the four data centers in Lira, Mbale, Tororo and Soroti. Data clerks enter data daily into the PMI IRS database, a database housed on the DHIS 2 platform. The Activity closely works with district biostatisticians at various stages of data collection and supervision during the spray campaign.
Data use and dissemination: During spray campaigns, data is available on a daily basis
and consequently used to inform daily planning for field logistics and to highlight any gaps in data collection. This information is used to determine the number of required trainings and number of spray teams needed in the exercise. There was also evidence of data analysis and use as seen posted around the office during the DQA. Furthermore, there are annual review meetings held at district level, where various stakeholders, mostly district staff, review the data to assess their performance, share lessons and best practices for the subsequent spraying period. The last review meeting was held in June 2019. PMI works with RHITES-N Lango specifically on the integration of malaria activities in the region.
Existence and use of SOPs: PMI has a number of SOPs in place that guide data collection
and entry at all levels. However, they did not have SOPs for the dissemination and use of data, confidentiality and security. The DQA team observed the Activity had adequate infrastructures in place to facilitate data collection, entry and analysis.
Collaboration, Learning and Adaptation (CLA): PMI VectorLink has a CLA plan in the
AMELP and the team interviewed confirmed that the CLA components are integrated into annual planning and budgeting.
3.2.2 RHITES-N Acholi Generally, RHITES-N Acholi has a comprehensive and functional MEL system. The highlights of the system are summarized below:
Governance and Leadership: Overall, RHITES-N Acholi has a robust MEL System which includes dedicated MEL staff with comprehensive knowledge of MEL functions and who received adequate training relevant to their area of work. MEL staff involved in management, data reporting, analysis, collection and cleaning had a thorough understanding of the indicator definition and had a clear understanding of the data flow.
15
Below are the highlights of the RHITES-N Acholi MEL system as well as areas for improvement.
AMELP: RHITES-N Acholi has a comprehensive AMELP, which includes a results
framework, performance indicator table, capacity building schedule, data quality assurance, MEL task schedule and budget. The AMELP was approved by USAID/Uganda in July 2018. The Activity submitted a revised AMELP in July 2019 and were waiting for its approval. In reviewing the available AMELP, the DQA team noted the PIRS were not included in the AMELP. Additionally, the performance indicator table did not include all the indicators the Activity is reporting on such as the Number of multi-drug resistance tuberculosis cases that have initiated second line treatment.
Data Management System: RHITES-N Acholi has a strong linkage to the national M&E
system and data collection is done largely through national HMIS tools and reported into the DHIS 2.0. However there are some data requirements that are not fulfilled by the national HMIS tools and the Activity improvised in order to be able to collect the required data. For example, the family planning register does not capture a necessary population; DREAMs girls, and they’ve had to train health facility workers to use the current family planning register and mark the DREAMS cases. During the MEL Systems Assessment interview the MEL staff noted this was not always done correctly. The Activity also works closely with district Biostatisticians during quarterly data reviews and data quality exercises to review data from the primary data collection tools and compare it to data entered in the national DHIS 2.0 to ensure alignment. The Activity also participates in national technical working groups to share data management practices and experiences; contributing to the revision of national HMIS and DHIS 2.0 tools.
The activity uses the PIRS to guide data collection and reporting and the USAID and PEPFAR reporting guidelines and requirements. However the current PIRS for the MDR indicator under review was not updated under the reporting requirements. The Activity uses an online shared folder to store data and key MEL documents. There’s routine backup and MEL staff have a clear understanding of the electronic filing systems. Data collection tools are stored at the health facilities. However, at one of the health facilities visited it was noted the data collection tool was stored in a room without any padlock.
Data Use and dissemination: RHITES-N Acholi makes routine presentations of data for various service areas. As the Activity waits to implement a digital dashboard, they have created a robust excel dashboard highlighting key performance indicators with relevant disaggregates such as sex, district and health facility. The data can also be broken into different time periods for trend analysis. This has been tremendously useful for the Activity staff that reviews the dashboard on a weekly basis and focus on specific indicators of interest based on requests from stakeholders, such as the technical team. The DQA team observed the dashboard presented during the weekly presentation (in this case, week 39 Q4 2019) showing data for TB treatment indicators and trends.
SOP: RHITES-N Acholi have detailed and relevant SOPs on data storage, data quality and
data collection. These SOPs have been shared with relevant stakeholders at various levels. The DQA team noted, RHITES-N Acholi have developed creative ways to share pertinent information within the SOP. For example, there are common mistakes in TB reporting that have been identified by RHITES-N Acholi staff and to support the facilities in improved data collection, the Activity has provided a one page SOP outlining these common

16
mistakes and ways to mitigate them. The DQA team noticed this SOP in all health facilities visited. Training occurs at multiple levels right from the Activity, down to the staff at the health facilities. The Activity identifies training needs for staff based on area of work and gaps identified and then provides required training. For example, there was greater need to understand the use and interpretation of GIS data, and the Activity facilitated a training for the technical team on GIS.
CLA: RHITES-N Acholi has a strong learning plan and has multiple learning activities. Collaborating, Learning and Adapting (CLA) activities are implemented by a sub-partner who has recruited a dedicated Knowledge Management (KM) Advisor to lead KM and CLA efforts. RHITES-N Acholi applies After Action Reviews (AAR) to determine successes and lessons learned from implementation, and disseminates newsletters internally. Success stories are submitted to the COR. While internal CLA is strong, RHITES-N Acholi has limited interaction with other Activities to reinforce learning. When the DQA team probed on how lessons learned are shared across Activities, the Activity only mentioned the sharing of branding guidelines with RHITES-N Lango.
3.2.3 RHITES-N Lango:
Overall, RHITES-N Lango has a comprehensive and functional MEL system. The highlights of the system are summarized below: Organizational governance and leadership: RHITES-N Lango has functional
governance, leadership and MEL structures. The Activity has a documented organizational chart depicting the MEL responsibilities including a Senior MEL Advisor and four M&E Managers, each responsible for a component including CLA. The activity also has MEL officers each responsible for a district in the Activity region. All the staff have job descriptions that guide the implementation of MEL activities. The Senior MEL Advisor represents the MEL team on the senior management team. The MEL FY19 budget was 8% of the total Activity budget.
AMELP: The Activity has an approved AMELP with the required key sections. The AMELP
was initially approved in June 2018, but was updated and revised to include expanded staffing and data collection procedures. The most recent AMELP was approved just before the DQA exercise in September 2019, and some staff were not yet aware of the approval. However the DQA team noted, the AMELP was missing the PIRS. When the Activity was asked to provide indicator PIRS, the document shared by the Activity did not include PIRS for all indicators the Activity reports on.
Data management system: The Activity has strong links with the national M&E system,
where various indicators data is collected, aggregated and summarized. The Activity extract data from DHIS 2.0 for reporting in the USAID PIRS. The Activity supports the national data collection processes through working in close collaboration with the district Biostatisticians. RHITES-N Lango had a documented data collection plan in the AMELP stating the periods for data collection, type of data and a task schedules for collecting the data; based on USAID reporting requirements and the national HMIS manual. The data collection tools have all the relevant variables needed to compile the required USAID data. There are instructions in the registers to guide the data collection and staff are always oriented on new indicators, however the Activity lacked SOPs to guide the data analysis and disaggregation for TB indicators. Data are reviewed by the MEL and technical staff before final aggregation and submitted to the Senior MEL Advisor for review and the Chief of Party (COP) for approval and/or submission to USAID or share with other

17
stakeholders. The MEL team conducts data entry in the USAID PRS and data is regularly shared internally for program management.
Data use and dissemination: RHITES-N Lango has an effective internal data dashboard;
DRRAP, which visually tracks performance by indicator and displays key data points to monitor performance. DRRAP is used to track progress against targets and is built in consultation with technical teams to ensure data use. There were other visuals and displays including LQAS charts for 2013-2018, including TB indicators printed products and presentations shared. Data is also shared with partners and districts during the quarterly reviews and annual planning processes.
SOPs: The Activity has a documented plan to ensure data quality. After data entry in the
DHIS 2.0, the Activity staff review the data and share the gaps identified with the district Biostatisticians in the region. On a quarterly basis the Activity support the Biostatisticians to review and clean data in the DHIS 2.0. The team uses queries to check inconsistencies in the data, and if they are identified, they are followed up to the respective data sources at the health facility and also recorded in a log book. The Activity conducts data supervision and internal quarterly DQAs, with the last one conducted in December 2018, focusing on the poor performing indicators. There are data quality checks in the DHIS 2, the Activity - Data Repository, Reporting and Analysis Platform (DRRAP) and TB-Info; used to run checks on TB related indicators and issues found are communicated to the Biostatisticians for corrective actions. Data is also reviewed by the MEL managers and Senior MEL Advisor before it is externally shared with partners. The Activity had sufficient IT infrastructure, including computers, internet connectivity required to carry out data management, analysis, storage and sharing. The Activity has an updated MEL capacity building plan and all the MEL staff were trained on their functions and whenever challenges arise, they are supported by their supervisors and seek support amongst the team. MEL staff regularly engage in continuous professional development sessions on topics relevant to their area of wok.
Collaboration, Learning and Adaptation: RHITES-N Lango has a CLA plan and
activities include after-action reviews, learning visits and quarterly and annual performance reviews involving the districts and partners. However, the MEL team has not carried out CLA activities since the team first wanted to institutionalize CLA within the Activity, and this has not been completed yet. The Activity has an evaluation plan outlining the various evaluations and assessments to be conducted; so far it has conducted a baseline assessment using PRS, LQAS and DHIS 2.0 data, a gender and social inclusion survey, HIV retention survey and adherence to treatment study. The activity plan to conduct a client satisfaction survey in project year 3 (PY3).
4. CONCLUSIONS
This section provides conclusions about the DQA for the three indicators as well as MEL systems of the three Activities. 4.1 DQA Conclusions Based on the five data quality standards criteria rating, two out of the three indicators had data quality issues,
18
The indicator Custom: Number of houses targeted for spraying with USG funds was rated acceptable. Although there were no data quality issues for this indicator, the DQA team made suggestions that could strengthen the indicator definition and USAID PIRS. The two TB indicators were rated not acceptable; indicator HL.2.4-2 - Number of multi-drug resistant tuberculosis cases that have initiated second line treatment had data quality issues under validity, reliability and integrity standards. The CUSTOM indicator - Treatment success rate in USG-assisted DOTS programs success rate in USG-assisted DOTS programs had data quality issues under validity and reliability standards. RHITES-N Lango lacked documented SOPs to guide data aggregation and reporting for both TB indicators. There were a number of data quality issues related to TB registers; including inconsistencies in the data counted in the register and that reported on HMIS forms, DHIS 2.0 and PRS, data was missing in the registers, incomplete patients’ information and health workers changing information in the register without clear documentation. There were also missing pages, torn or tattered registers at various health facilities and challenges of counting from the register. Whereas registers at health facilities should be accessible by only authorized staff, not all the registers are kept under key and lock, and there were instances of registers being removed by other health workers or changes made to the information without clear procedures, authorization or signing off the changes. All these issues, when aggregated impinge on the TB indicators data quality at the various levels of reporting. 4.2 MEL System Assessment Conclusions Overall, the three Activities assessed have functional MEL systems that are able to facilitate collecting, aggregating and reporting quality data. However, there were gaps in approval of AMELPs, missing and insufficient PIRS in terms of indicator statements, definitions and data aggregation. The Activities had links with the national M&E system, at varied levels where various indicator data is collected, aggregated and summarized before the Activities extract and report into the USAID PRS. All three Activities had sound data management, analysis, reporting, and data use as well as dissemination systems in place and data quality assurance procedures. The Activities had CLA plans and activities being implemented at varied levels. However, one Activity lacked SOPs needed to guide aggregation, reporting and dissemination of the data. There were also issues at health facilities related to inconsistent and incomplete data, torn, missing pages, missing tattered registers that are likely to impinge on reporting quality data. The delayed roll out of the updated registers and HMIS tools and DHIS 2.0 is creating an emerging stock out of registers.
5. RECOMMENDATIONS
This section provides recommendations based on the findings of the DQA findings and MEL system assessment. The recommendations are outlined according to level, including USAID, Activities and MoH. At USAID Level: USAID should consider the following recommendations: Approve and ensure the most updated documentation:
- Final versions of AMELPs are available to guide DQAs to avoid referring to Activity versions that may not yet be approved.
19
- PIRS are available and shared with all Activities reporting on the same indicator. - Adopt PMI VectorLink indicator criteria for “eligible structures” in lieu of “houses
eligible.” Whereas this does not affect the validity of the indicator data, a common standard indicator statement for both USAID and Activity is a good practice.
Commission a follow-on DQA for the two TB indicators where data quality issues were found.
Follow up with MoH on the printing and distribution of the revised registers and revised HMIS reporting forms in order to mitigate against an emerging stock out of these registers.
Ensure DQAs are conducted outside Activities reporting periods and national health campaigns, to avoid overly competing activities for Activities’ staff and health workers time. DQAs can take place earlier in the year, for example the end of quarter 1 or during quarter 2, after completing, reviewing and reconciling data in the PRS and annual reports, which also provides a clear complete period for the data review. Also take note of national campaigns and events that engage health workers.
At Activity Level: PMI VectorLink should reach out to ULA about FY 2018 data reported in the PRS to
rectify an error that was made in the comments regarding data disaggregation for DFID and USAID.
Validity: The indicator: CUSTOM - Treatment success rate in USG-assisted DOTS program, RHITES-N
Acholi and Lango should adopt the USAID Uganda PIRS, update their AMELPs, reorient the staff on the indicator requirements and ensure data is reported in the PRS as available on a quarterly basis.
For the Indicator HL.2.4-2: Number of multi-drug resistant tuberculosis cases that have initiated second line treatment, RHITES-Lango should adopt the USAID PIRS, while RHITES-N Acholi should align its PIRS to the USAID PIRS, include it in the AMELP and ensure data is collected according to the Uganda national TB guidelines.
The staff (TB specialist and MEL) should then work with district (TB focal persons and Biostatisticians) to emphasize and guide health workers on the procedures for reviewing and verifying the TB data; as well as provide hands on mentoring of the health workers on how to record and compile the data.
Work with districts and health facilities to rebind and/or transfer information from old, torn pages and tattered registers (care must be taken when rewriting to avoid further mistakes)
Reliability:
RHITES-N Lango, should consider putting in place SOPs for compiling and summarizing TB indicator data that are shared with the relevant staff and health facilities after orienting them on the SOPs.
Integrity: Work with district staff to improve data collection and storage of registers, as well as
documenting and reporting changes made on the patients’ records in the registers and data reported at various levels.
Support the health facilities to ensure that the primary data collection tools are kept safely and securely.
20
At Ministry of Health level: For standardization across the country, provide guidance and work with Activities to
support health workers update information in the DR register, HMIS form 106a and eventually in the DHIS 2 after receiving the culture test results that are falling within the previous reporting quarter to ensure MDR cases are correctly counted.
Roll the revised registers and HMIS reporting forms in order to curb an emerging stock out of these registers.
21
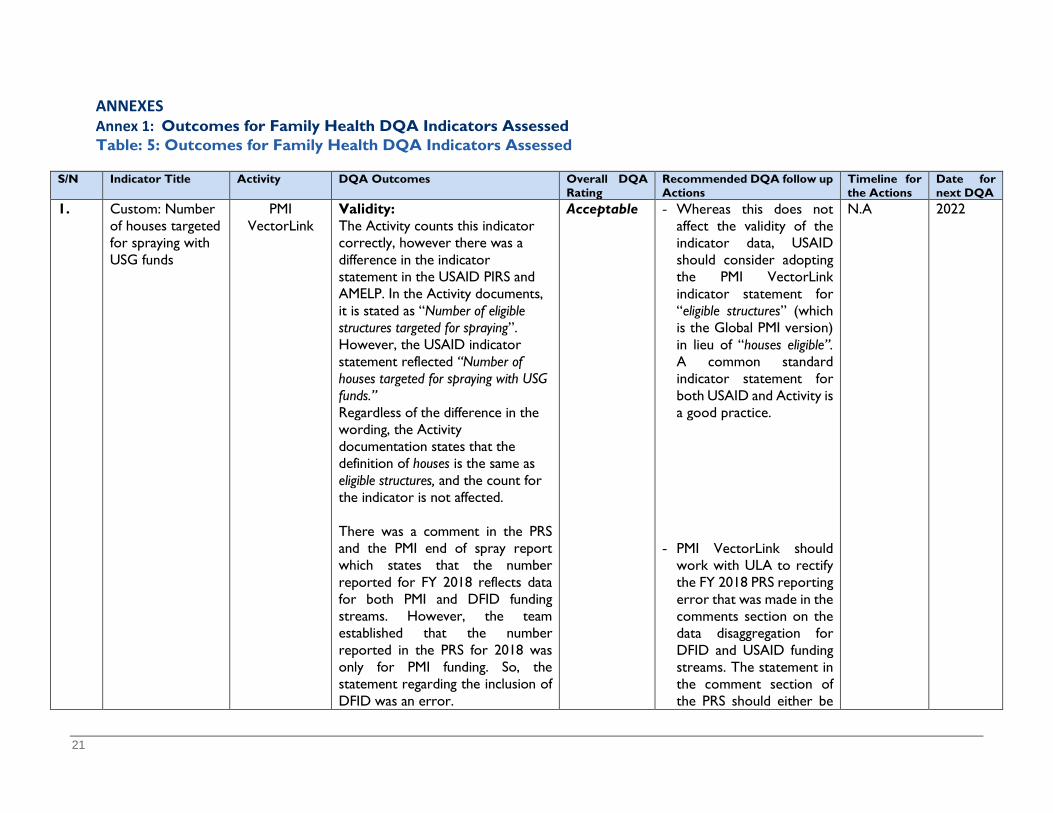
ANNEXES Annex 1: Outcomes for Family Health DQA Indicators Assessed Table: 5: Outcomes for Family Health DQA Indicators Assessed
S/N Indicator Title Activity DQA Outcomes Overall DQA Rating
Recommended DQA follow up Actions
Timeline for the Actions
Date for next DQA
1. Custom: Number of houses targeted for spraying with USG funds
PMI VectorLink
Validity: The Activity counts this indicator correctly, however there was a difference in the indicator statement in the USAID PIRS and AMELP. In the Activity documents, it is stated as “Number of eligible structures targeted for spraying”. However, the USAID indicator statement reflected “Number of houses targeted for spraying with USG funds.” Regardless of the difference in the wording, the Activity documentation states that the definition of houses is the same as eligible structures, and the count for the indicator is not affected. There was a comment in the PRS and the PMI end of spray report which states that the number reported for FY 2018 reflects data for both PMI and DFID funding streams. However, the team established that the number reported in the PRS for 2018 was only for PMI funding. So, the statement regarding the inclusion of DFID was an error.
Acceptable - Whereas this does not affect the validity of the indicator data, USAID should consider adopting the PMI VectorLink indicator statement for “eligible structures” (which is the Global PMI version) in lieu of “houses eligible”. A common standard indicator statement for both USAID and Activity is a good practice.
- PMI VectorLink should
work with ULA to rectify the FY 2018 PRS reporting error that was made in the comments section on the data disaggregation for DFID and USAID funding streams. The statement in the comment section of the PRS should either be
N.A 2022

22
S/N Indicator Title Activity DQA Outcomes Overall DQA Rating
Recommended DQA follow up Actions
Timeline for the Actions
Date for next DQA
removed or state that the data reported only includes results from PMI funding.
2. HL.2.4-2 - Number of multi-drug resistant tuberculosis cases that have initiated second line treatment
RHITES-N Acholi
Validity: The Activity provided a modified PIRS lacking details found in the USAID Uganda PIRS. The performance indicator table in the AMELP did not feature this indicator. The absence of a standard PIRS at Activity level has created variances in how the IP counts for this indicator. The Activity understanding of reporting on this indicator did not include RR cases while reporting in the USAID PRS. This exclusion produced systematically biased data. The culture test results which classify the DR cases more often take up to three months before they are returned to the treatment centres. This creates a time lag for recording and updating the DR classification (RR and MDR) in the register. This therefore created a gap in the count for this indicator, since they only consider MDRs and exclude RRs. There is risk of undercounting for this indicator, as they wait for the DR
Not Acceptable
Adopt the Standard
USAID PIRS and include it in the AMELP and ensure data is collected according to the Uganda national TB guidelines; that is, include RR in the count for this indicator.
For standardization
across the country, The Ministry of Health should provide guidance and work with Activities to support health workers update information in the DR register, HMIS form 106a and eventually in the DHIS 2 after receiving the culture test results that are falling within the previous reporting quarter to ensure MDR
November 2019
2020
23
S/N Indicator Title Activity DQA Outcomes Overall DQA Rating
Recommended DQA follow up Actions
Timeline for the Actions
Date for next DQA
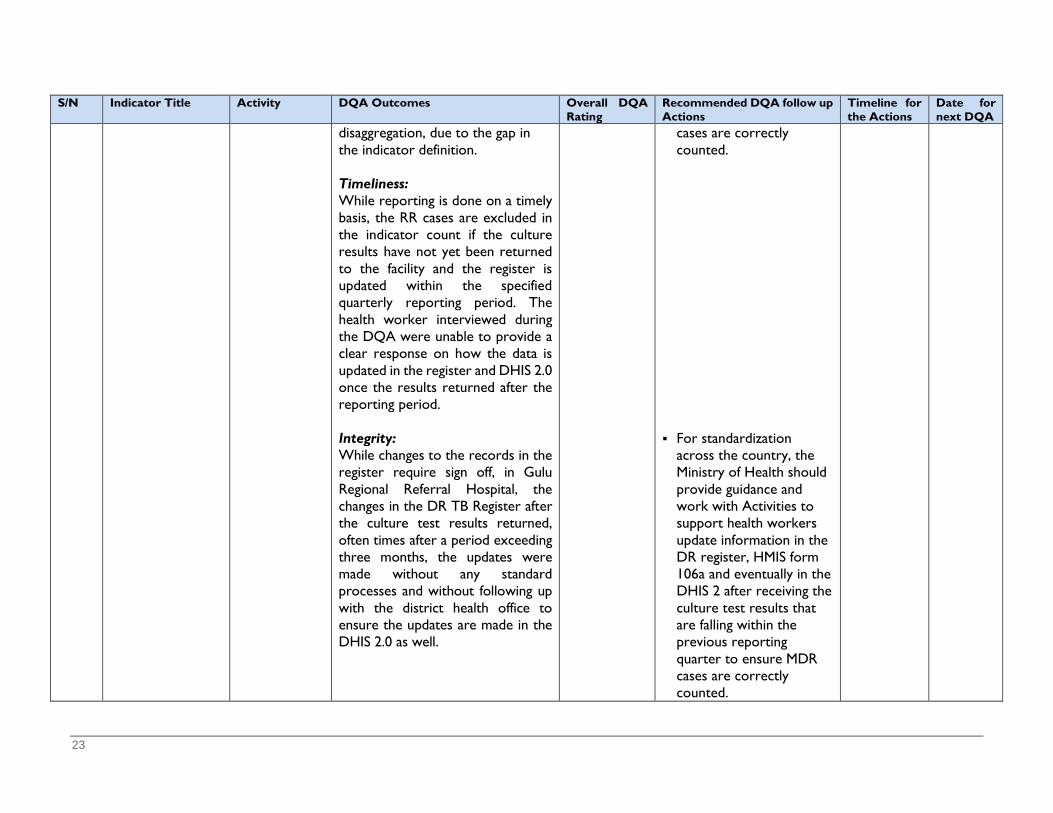
disaggregation, due to the gap in the indicator definition. Timeliness: While reporting is done on a timely basis, the RR cases are excluded in the indicator count if the culture results have not yet been returned to the facility and the register is updated within the specified quarterly reporting period. The health worker interviewed during the DQA were unable to provide a clear response on how the data is updated in the register and DHIS 2.0 once the results returned after the reporting period. Integrity: While changes to the records in the register require sign off, in Gulu Regional Referral Hospital, the changes in the DR TB Register after the culture test results returned, often times after a period exceeding three months, the updates were made without any standard processes and without following up with the district health office to ensure the updates are made in the DHIS 2.0 as well.
cases are correctly counted.
For standardization
across the country, the Ministry of Health should provide guidance and work with Activities to support health workers update information in the DR register, HMIS form 106a and eventually in the DHIS 2 after receiving the culture test results that are falling within the previous reporting quarter to ensure MDR cases are correctly counted.
24
S/N Indicator Title Activity DQA Outcomes Overall DQA Rating
Recommended DQA follow up Actions
Timeline for the Actions
Date for next DQA
RHITES-N
Lango Validity: The Activity was not able to provide a specific PIRS for this indicator
Not Acceptable
RHITES-N Lango should adopt the USAID PIRS
December 2019
2020
3. CUSTOM: Treatment success rate in USG-assisted DOTS programs
RHITES-N Acholi
Validity: The Activity PIRS indicator statements was not consistent with the standard USAID PIRS. The Activity indicator statement is “Percentage of TB cases successfully treated (cured plus treatment completed) among TB cases notified to the national health authorities during a specified period” While the USAID PIRS is stated as: “Percentage of registered new smear positive TB patients that completed treatment or cured under DOTS programs”. Whereas the indicator requires computing a percentage - that is the treatment success rate, the Activity PIRS was missing this detail of converting the fraction to percentages, i.e. (x100) as stated in the USAID PIRS. Although these seem to be minor issues, they are subject to interpretation and may have implication on the data count and reporting for this indicator.
Not Acceptable
Adopt the USAID Uganda PIRS, update the AMELPs, reorient the staff on the indicator requirements and ensure data is reported in the PRS as available on a quarterly basis.
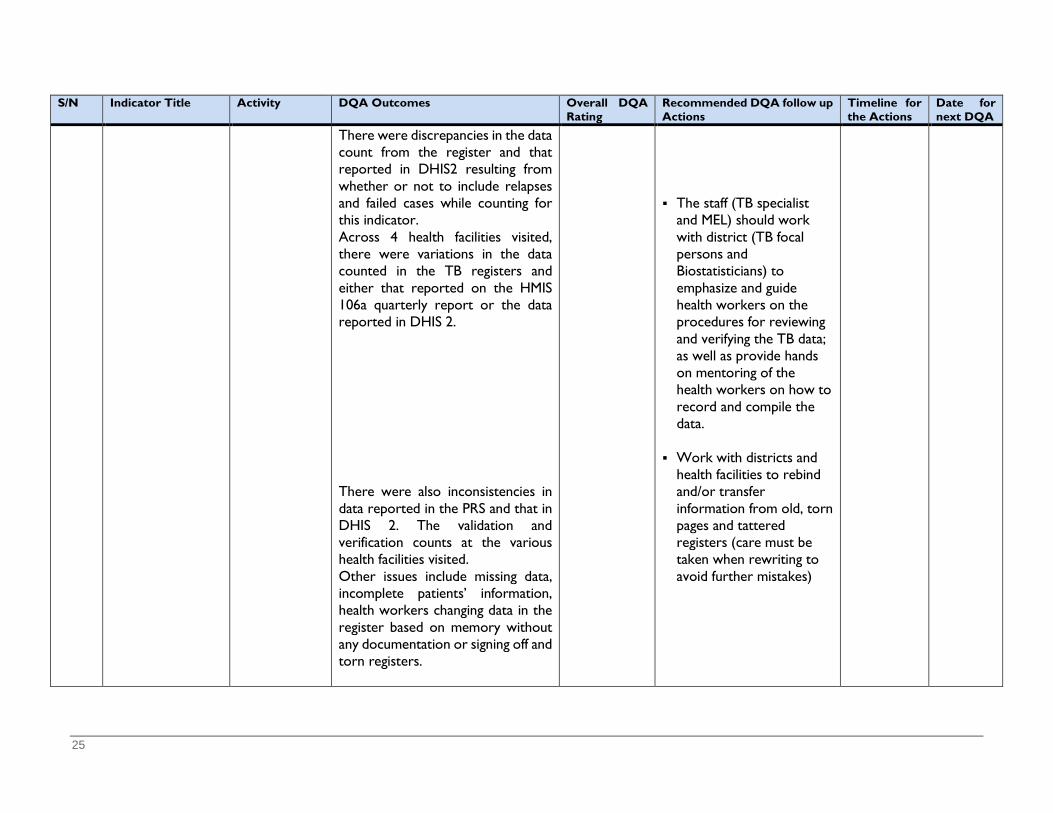
25
S/N Indicator Title Activity DQA Outcomes Overall DQA Rating
Recommended DQA follow up Actions
Timeline for the Actions
Date for next DQA
There were discrepancies in the data count from the register and that reported in DHIS2 resulting from whether or not to include relapses and failed cases while counting for this indicator. Across 4 health facilities visited, there were variations in the data counted in the TB registers and either that reported on the HMIS 106a quarterly report or the data reported in DHIS 2. There were also inconsistencies in data reported in the PRS and that in DHIS 2. The validation and verification counts at the various health facilities visited. Other issues include missing data, incomplete patients’ information, health workers changing data in the register based on memory without any documentation or signing off and torn registers.
The staff (TB specialist
and MEL) should work with district (TB focal persons and Biostatisticians) to emphasize and guide health workers on the procedures for reviewing and verifying the TB data; as well as provide hands on mentoring of the health workers on how to record and compile the data.
Work with districts and
health facilities to rebind and/or transfer information from old, torn pages and tattered registers (care must be taken when rewriting to avoid further mistakes)
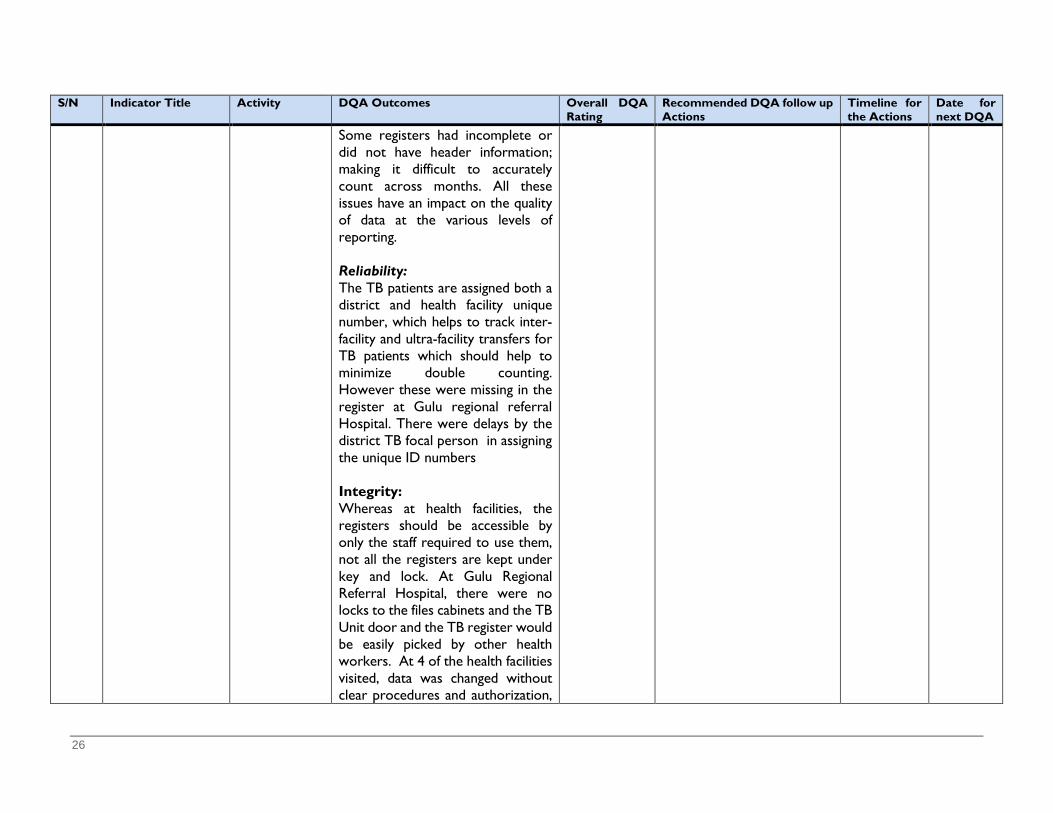
26
S/N Indicator Title Activity DQA Outcomes Overall DQA Rating
Recommended DQA follow up Actions
Timeline for the Actions
Date for next DQA
Some registers had incomplete or did not have header information; making it difficult to accurately count across months. All these issues have an impact on the quality of data at the various levels of reporting. Reliability: The TB patients are assigned both a district and health facility unique number, which helps to track inter-facility and ultra-facility transfers for TB patients which should help to minimize double counting. However these were missing in the register at Gulu regional referral Hospital. There were delays by the district TB focal person in assigning the unique ID numbers Integrity: Whereas at health facilities, the registers should be accessible by only the staff required to use them, not all the registers are kept under key and lock. At Gulu Regional Referral Hospital, there were no locks to the files cabinets and the TB Unit door and the TB register would be easily picked by other health workers. At 4 of the health facilities visited, data was changed without clear procedures and authorization,
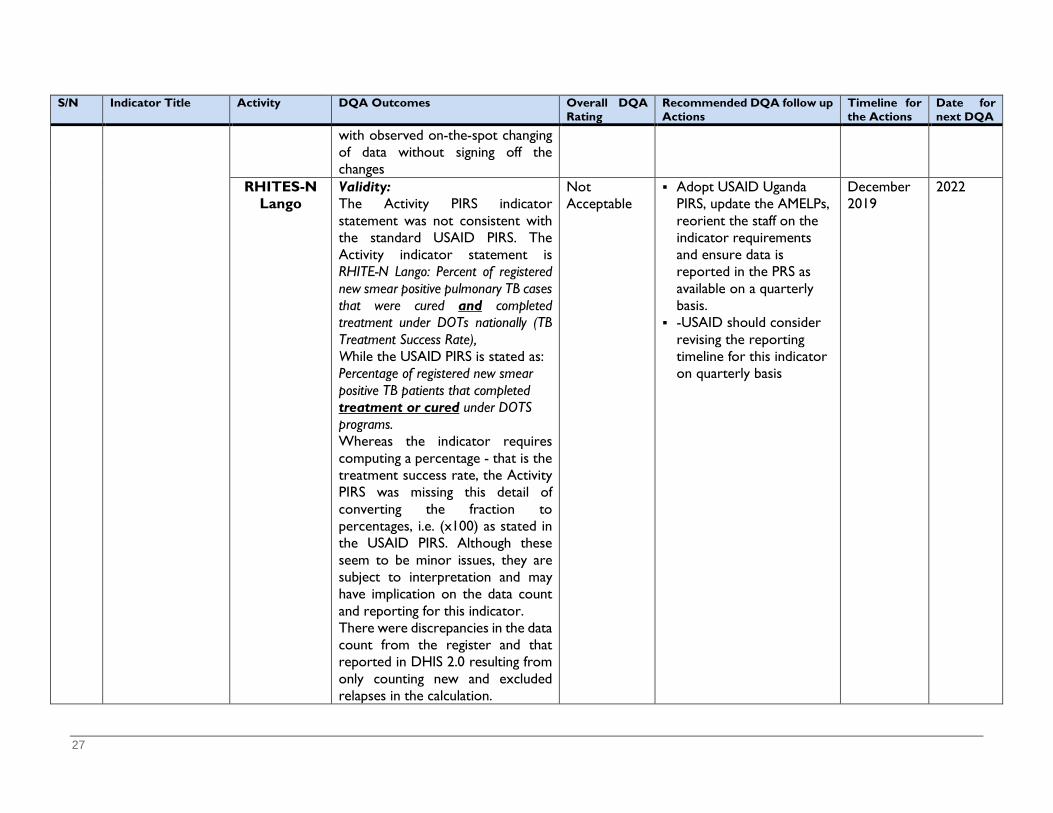
27
S/N Indicator Title Activity DQA Outcomes Overall DQA Rating
Recommended DQA follow up Actions
Timeline for the Actions
Date for next DQA
with observed on-the-spot changing of data without signing off the changes
RHITES-N Lango
Validity: The Activity PIRS indicator statement was not consistent with the standard USAID PIRS. The Activity indicator statement is RHITE-N Lango: Percent of registered new smear positive pulmonary TB cases that were cured and completed treatment under DOTs nationally (TB Treatment Success Rate), While the USAID PIRS is stated as: Percentage of registered new smear positive TB patients that completed treatment or cured under DOTS programs. Whereas the indicator requires computing a percentage - that is the treatment success rate, the Activity PIRS was missing this detail of converting the fraction to percentages, i.e. (x100) as stated in the USAID PIRS. Although these seem to be minor issues, they are subject to interpretation and may have implication on the data count and reporting for this indicator. There were discrepancies in the data count from the register and that reported in DHIS 2.0 resulting from only counting new and excluded relapses in the calculation.
Not Acceptable
Adopt USAID Uganda PIRS, update the AMELPs, reorient the staff on the indicator requirements and ensure data is reported in the PRS as available on a quarterly basis.
-USAID should consider revising the reporting timeline for this indicator on quarterly basis
December 2019
2022

28
S/N Indicator Title Activity DQA Outcomes Overall DQA Rating
Recommended DQA follow up Actions
Timeline for the Actions
Date for next DQA
Across all the 6 health facilities visited, there were variations in the data counted in the TB registers and either that reported on the HMIS 106a quarterly report or the data reported in DHIS 2.0. There were also inconsistencies in data reported in the PRS and that in DHIS 2 as well as the validation and verification counts at the various health facilities visited. There were inconsistencies in data reported in the PRS and that in DHIS 2.0. The validation and verification counts at the various health facilities visited. Other issues include missing data, incomplete patients’ information, health workers changing data in the register based on memory without any documentation or signing off the changes and torn registers. Some registers had incomplete or did not have header information; making it difficult to accurately count across months. All these issues have an impact on the quality of data at the various levels of reporting. Reliability:
The Activity staff (TB
specialist and MEL) should then work with district (TB focal persons and Biostatisticians) to emphasize and guide health workers on the procedures for reviewing and verifying the TB data; as well as provide hands on mentoring of the health workers on how to record and compile the data.

29
S/N Indicator Title Activity DQA Outcomes Overall DQA Rating
Recommended DQA follow up Actions
Timeline for the Actions
Date for next DQA
The Activity did not have SOPS to guide counting of data for this indicator; they had generalized SOPs, with only a section on SOPs in the AMELP, which does not give sufficient guidance for counting and summarizing data at both the IP and health facilities levels. Timeliness: The Activity was not sure of the reporting timeline in the PRS for this indicator, whether it is quarterly or annual, but they report on the indicator in the quarterly narrative report and were planning for annual reporting FY 2019 data in the PRS.
Work with the districts and health facilities to rebind and/or transfer information from old, torn pages and tattered registers (care must be taken when rewriting to avoid further mistakes)
Consider putting in place SOPs for compiling and summarizing TB indicator data that are shared with the relevant staff and health facilities after orienting them on the SOPs. Seek USAID/ULA guidance on reporting guidelines
Issues Related to the Activity MEL System Process and Structures Vector Link The Activity had different versions of the AMELP; one from USAID and another at Activity level, both of which had a
submission date of April 14, 2019 but the content differed in some areas. The Activity did not have SOPs for the dissemination and use of data, confidentiality and security.
RHITES-N Acholi
The PIRS were not included in the AMELP. Additionally, the performance indicator table did not include all the indicators the IP is reporting on such as the Number of multi-drug resistance tuberculosis cases that have initiated second line treatment and the current PIRS was not updated under the reporting requirements.
Data Management - There are some data requirements that are not fulfilled by the national HMIS tools, such as dreams data. The Activity improvised in order to be able to collect the required data. At one of the health facilities visited it was noted the data collection tool was stored in a room without any padlock.
RHITES-N Lango
The AMELP was missing the PIRS and the PIRS document shared did not include PIRS for all indictors the IP reports on.
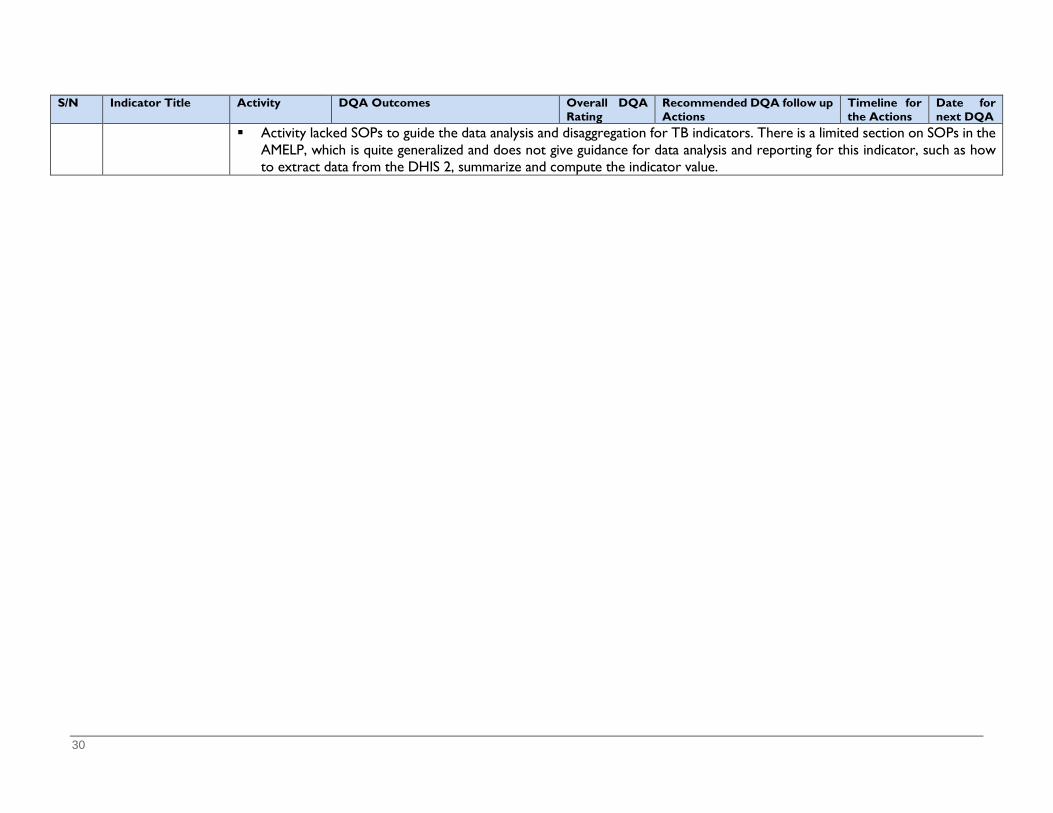
30
S/N Indicator Title Activity DQA Outcomes Overall DQA Rating
Recommended DQA follow up Actions
Timeline for the Actions
Date for next DQA
Activity lacked SOPs to guide the data analysis and disaggregation for TB indicators. There is a limited section on SOPs in the AMELP, which is quite generalized and does not give guidance for data analysis and reporting for this indicator, such as how to extract data from the DHIS 2, summarize and compute the indicator value.
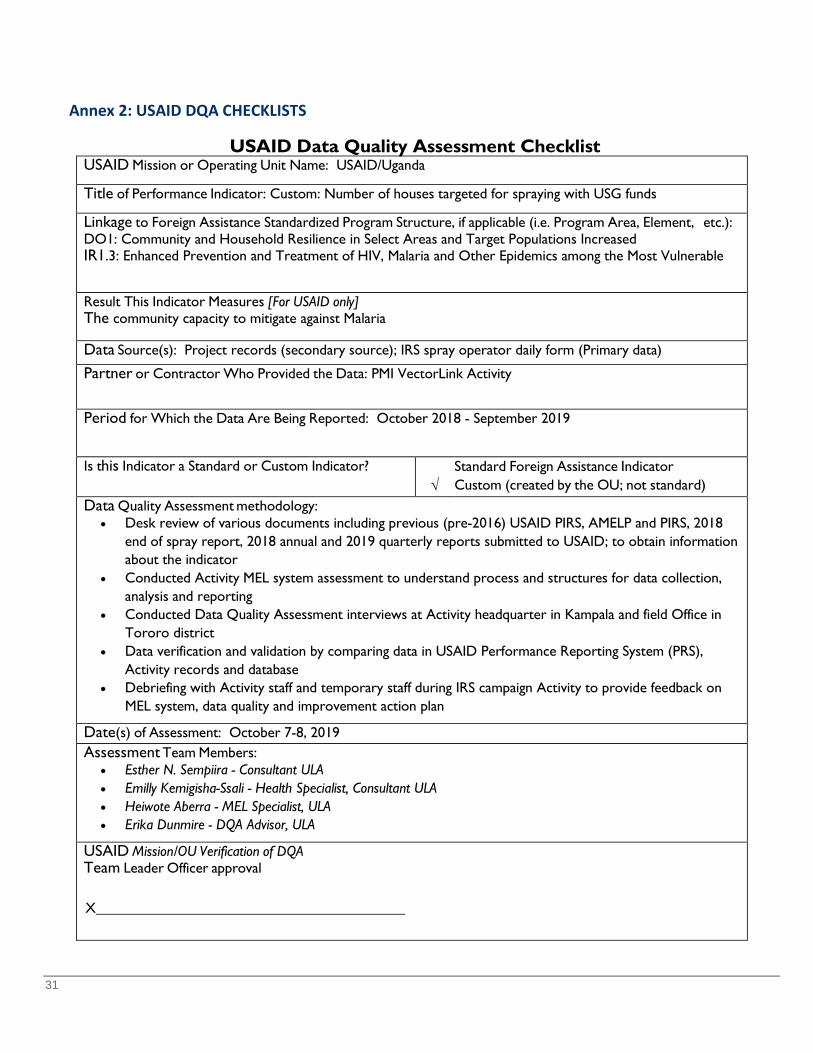
31
Annex 2: USAID DQA CHECKLISTS
USAID Data Quality Assessment Checklist USAID Mission or Operating Unit Name: USAID/Uganda
Title of Performance Indicator: Custom: Number of houses targeted for spraying with USG funds
Linkage to Foreign Assistance Standardized Program Structure, if applicable (i.e. Program Area, Element, etc.): DO1: Community and Household Resilience in Select Areas and Target Populations Increased IR1.3: Enhanced Prevention and Treatment of HIV, Malaria and Other Epidemics among the Most Vulnerable
Result This Indicator Measures [For USAID only] The community capacity to mitigate against Malaria
Data Source(s): Project records (secondary source); IRS spray operator daily form (Primary data) Partner or Contractor Who Provided the Data: PMI VectorLink Activity
Period for Which the Data Are Being Reported: October 2018 - September 2019
Is this Indicator a Standard or Custom Indicator? √
Standard Foreign Assistance Indicator Custom (created by the OU; not standard)
Data Quality Assessment methodology: • Desk review of various documents including previous (pre-2016) USAID PIRS, AMELP and PIRS, 2018
end of spray report, 2018 annual and 2019 quarterly reports submitted to USAID; to obtain information about the indicator
• Conducted Activity MEL system assessment to understand process and structures for data collection, analysis and reporting
• Conducted Data Quality Assessment interviews at Activity headquarter in Kampala and field Office in Tororo district
• Data verification and validation by comparing data in USAID Performance Reporting System (PRS), Activity records and database
• Debriefing with Activity staff and temporary staff during IRS campaign Activity to provide feedback on MEL system, data quality and improvement action plan
Date(s) of Assessment: October 7-8, 2019 Assessment Team Members:
• Esther N. Sempiira - Consultant ULA • Emilly Kemigisha-Ssali - Health Specialist, Consultant ULA • Heiwote Aberra - MEL Specialist, ULA • Erika Dunmire - DQA Advisor, ULA
USAID Mission/OU Verification of DQA Team Leader Officer approval
X
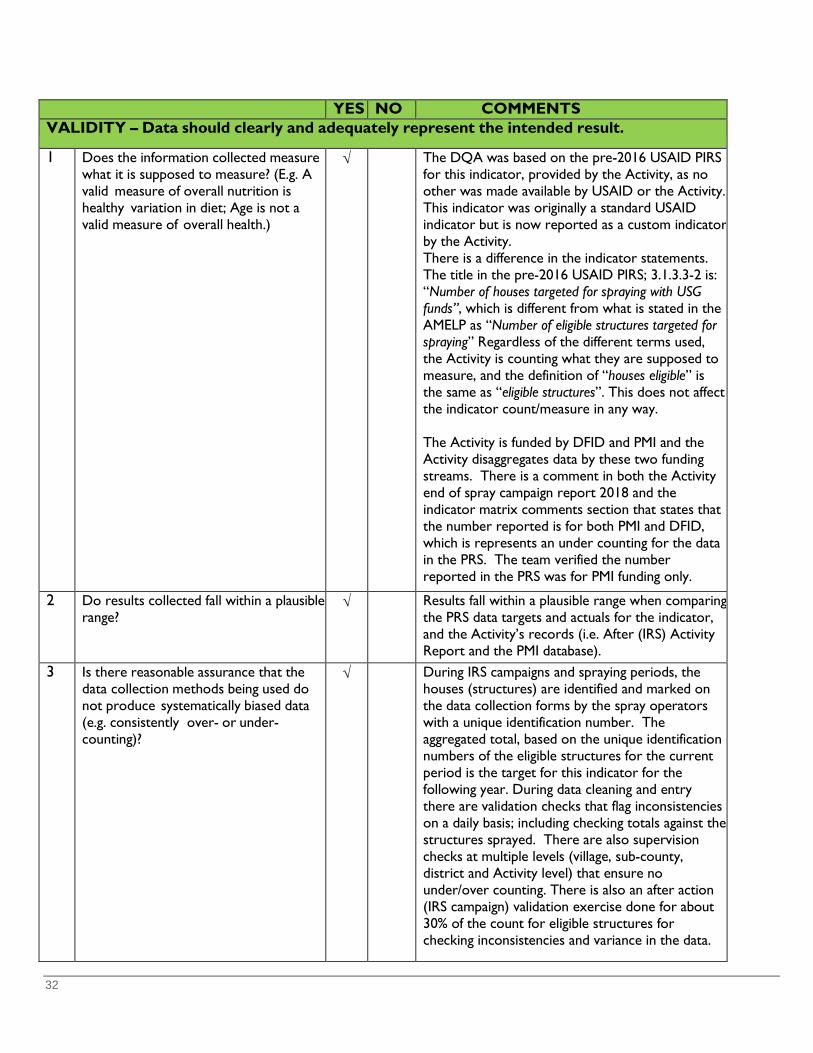
32
YES NO COMMENTS VALIDITY – Data should clearly and adequately represent the intended result.
1 Does the information collected measure what it is supposed to measure? (E.g. A valid measure of overall nutrition is healthy variation in diet; Age is not a valid measure of overall health.)
√ The DQA was based on the pre-2016 USAID PIRS for this indicator, provided by the Activity, as no other was made available by USAID or the Activity. This indicator was originally a standard USAID indicator but is now reported as a custom indicator by the Activity. There is a difference in the indicator statements. The title in the pre-2016 USAID PIRS; 3.1.3.3-2 is: “Number of houses targeted for spraying with USG funds”, which is different from what is stated in the AMELP as “Number of eligible structures targeted for spraying” Regardless of the different terms used, the Activity is counting what they are supposed to measure, and the definition of “houses eligible” is the same as “eligible structures”. This does not affect the indicator count/measure in any way. The Activity is funded by DFID and PMI and the Activity disaggregates data by these two funding streams. There is a comment in both the Activity end of spray campaign report 2018 and the indicator matrix comments section that states that the number reported is for both PMI and DFID, which is represents an under counting for the data in the PRS. The team verified the number reported in the PRS was for PMI funding only.
2 Do results collected fall within a plausible range?
√ Results fall within a plausible range when comparing the PRS data targets and actuals for the indicator, and the Activity’s records (i.e. After (IRS) Activity Report and the PMI database).
3 Is there reasonable assurance that the data collection methods being used do not produce systematically biased data (e.g. consistently over- or under-counting)?
√ During IRS campaigns and spraying periods, the houses (structures) are identified and marked on the data collection forms by the spray operators with a unique identification number. The aggregated total, based on the unique identification numbers of the eligible structures for the current period is the target for this indicator for the following year. During data cleaning and entry there are validation checks that flag inconsistencies on a daily basis; including checking totals against the structures sprayed. There are also supervision checks at multiple levels (village, sub-county, district and Activity level) that ensure no under/over counting. There is also an after action (IRS campaign) validation exercise done for about 30% of the count for eligible structures for checking inconsistencies and variance in the data.
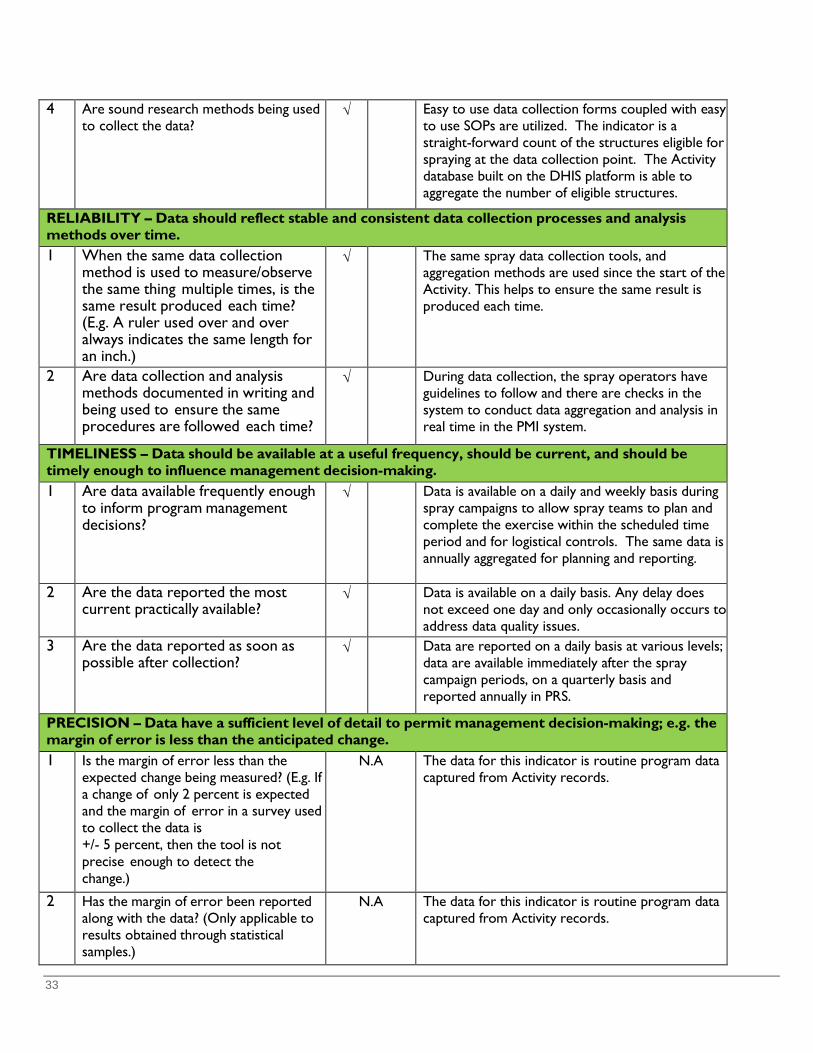
33
4 Are sound research methods being used to collect the data?
√ Easy to use data collection forms coupled with easy to use SOPs are utilized. The indicator is a straight-forward count of the structures eligible for spraying at the data collection point. The Activity database built on the DHIS platform is able to aggregate the number of eligible structures.
RELIABILITY – Data should reflect stable and consistent data collection processes and analysis methods over time. 1 When the same data collection
method is used to measure/observe the same thing multiple times, is the same result produced each time? (E.g. A ruler used over and over always indicates the same length for an inch.)
√ The same spray data collection tools, and aggregation methods are used since the start of the Activity. This helps to ensure the same result is produced each time.
2 Are data collection and analysis methods documented in writing and being used to ensure the same procedures are followed each time?
√ During data collection, the spray operators have guidelines to follow and there are checks in the system to conduct data aggregation and analysis in real time in the PMI system.
TIMELINESS – Data should be available at a useful frequency, should be current, and should be timely enough to influence management decision-making.
1 Are data available frequently enough to inform program management decisions?
√ Data is available on a daily and weekly basis during spray campaigns to allow spray teams to plan and complete the exercise within the scheduled time period and for logistical controls. The same data is annually aggregated for planning and reporting.
2 Are the data reported the most current practically available?
√ Data is available on a daily basis. Any delay does not exceed one day and only occasionally occurs to address data quality issues.
3 Are the data reported as soon as possible after collection?
√ Data are reported on a daily basis at various levels; data are available immediately after the spray campaign periods, on a quarterly basis and reported annually in PRS.
PRECISION – Data have a sufficient level of detail to permit management decision-making; e.g. the margin of error is less than the anticipated change.
1 Is the margin of error less than the expected change being measured? (E.g. If a change of only 2 percent is expected and the margin of error in a survey used to collect the data is +/- 5 percent, then the tool is not precise enough to detect the change.)
N.A The data for this indicator is routine program data captured from Activity records.
2 Has the margin of error been reported along with the data? (Only applicable to results obtained through statistical samples.)
N.A The data for this indicator is routine program data captured from Activity records.
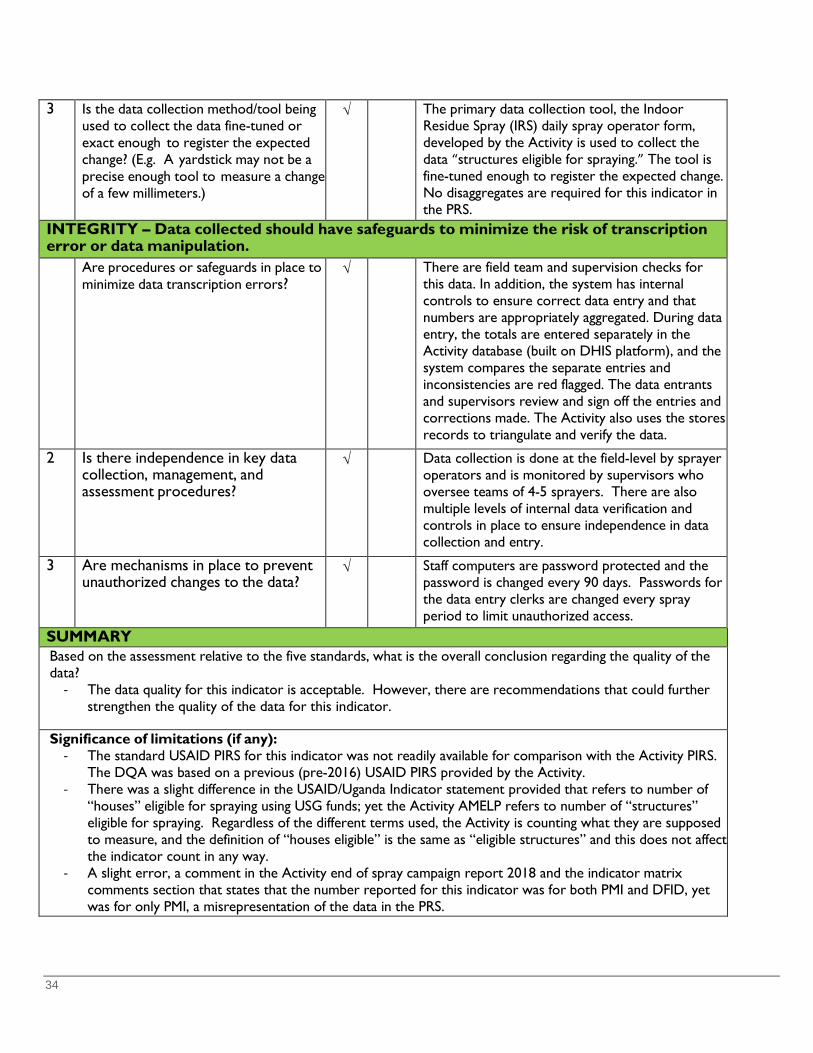
34
3 Is the data collection method/tool being used to collect the data fine-tuned or exact enough to register the expected change? (E.g. A yardstick may not be a precise enough tool to measure a change of a few millimeters.)
√ The primary data collection tool, the Indoor Residue Spray (IRS) daily spray operator form, developed by the Activity is used to collect the data “structures eligible for spraying.” The tool is fine-tuned enough to register the expected change. No disaggregates are required for this indicator in the PRS.
INTEGRITY – Data collected should have safeguards to minimize the risk of transcription error or data manipulation.
Are procedures or safeguards in place to minimize data transcription errors?
√ There are field team and supervision checks for this data. In addition, the system has internal controls to ensure correct data entry and that numbers are appropriately aggregated. During data entry, the totals are entered separately in the Activity database (built on DHIS platform), and the system compares the separate entries and inconsistencies are red flagged. The data entrants and supervisors review and sign off the entries and corrections made. The Activity also uses the stores records to triangulate and verify the data.
2 Is there independence in key data collection, management, and assessment procedures?
√ Data collection is done at the field-level by sprayer operators and is monitored by supervisors who oversee teams of 4-5 sprayers. There are also multiple levels of internal data verification and controls in place to ensure independence in data collection and entry.
3 Are mechanisms in place to prevent unauthorized changes to the data?
√ Staff computers are password protected and the password is changed every 90 days. Passwords for the data entry clerks are changed every spray period to limit unauthorized access.
SUMMARY Based on the assessment relative to the five standards, what is the overall conclusion regarding the quality of the data?
- The data quality for this indicator is acceptable. However, there are recommendations that could further strengthen the quality of the data for this indicator.
Significance of limitations (if any): - The standard USAID PIRS for this indicator was not readily available for comparison with the Activity PIRS.
The DQA was based on a previous (pre-2016) USAID PIRS provided by the Activity. - There was a slight difference in the USAID/Uganda Indicator statement provided that refers to number of
“houses” eligible for spraying using USG funds; yet the Activity AMELP refers to number of “structures” eligible for spraying. Regardless of the different terms used, the Activity is counting what they are supposed to measure, and the definition of “houses eligible” is the same as “eligible structures” and this does not affect the indicator count in any way.
- A slight error, a comment in the Activity end of spray campaign report 2018 and the indicator matrix comments section that states that the number reported for this indicator was for both PMI and DFID, yet was for only PMI, a misrepresentation of the data in the PRS.
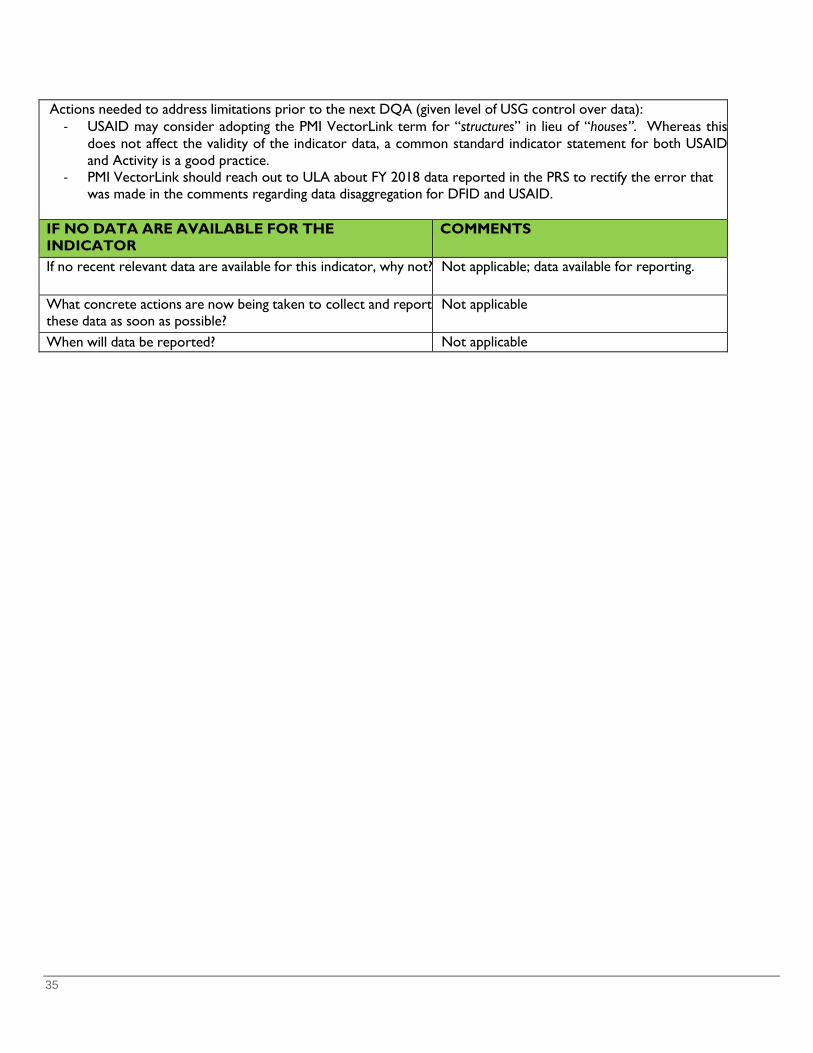
35
Actions needed to address limitations prior to the next DQA (given level of USG control over data): - USAID may consider adopting the PMI VectorLink term for “structures” in lieu of “houses”. Whereas this
does not affect the validity of the indicator data, a common standard indicator statement for both USAID and Activity is a good practice.
- PMI VectorLink should reach out to ULA about FY 2018 data reported in the PRS to rectify the error that was made in the comments regarding data disaggregation for DFID and USAID.
IF NO DATA ARE AVAILABLE FOR THE INDICATOR
COMMENTS
If no recent relevant data are available for this indicator, why not? Not applicable; data available for reporting.
What concrete actions are now being taken to collect and report these data as soon as possible?
Not applicable
When will data be reported? Not applicable
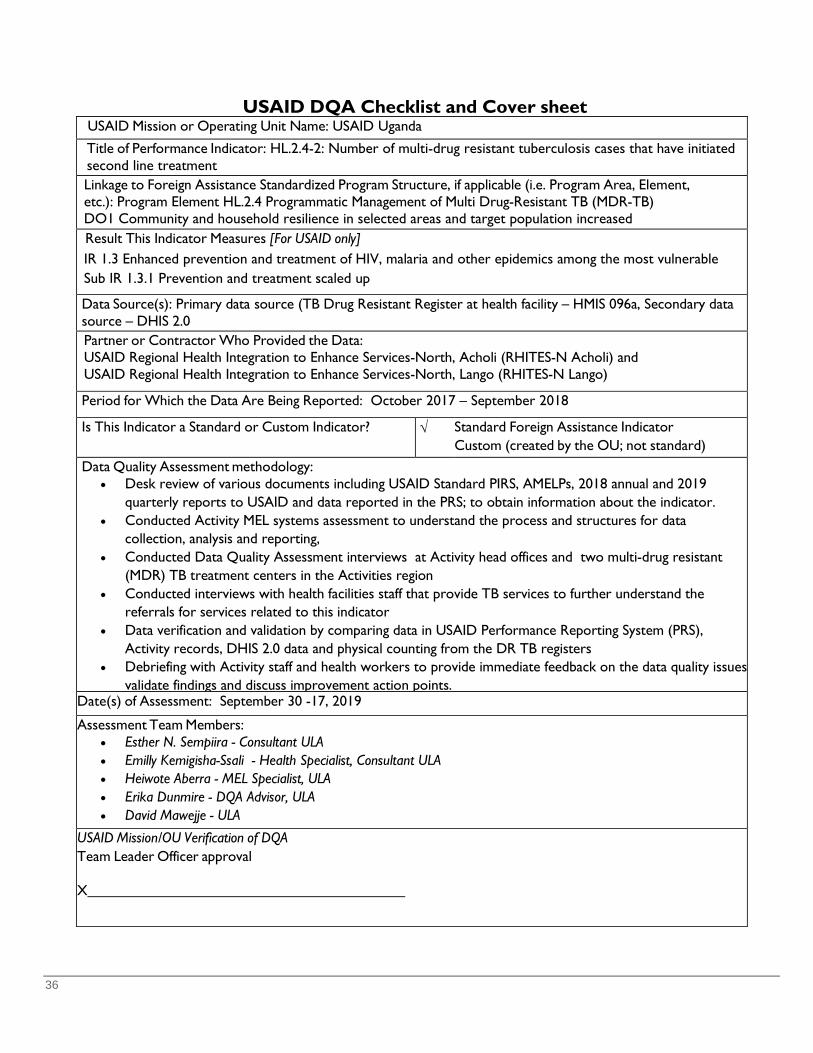
36
USAID DQA Checklist and Cover sheet USAID Mission or Operating Unit Name: USAID Uganda
Title of Performance Indicator: HL.2.4-2: Number of multi-drug resistant tuberculosis cases that have initiated second line treatment
Linkage to Foreign Assistance Standardized Program Structure, if applicable (i.e. Program Area, Element, etc.): Program Element HL.2.4 Programmatic Management of Multi Drug-Resistant TB (MDR-TB) DO1 Community and household resilience in selected areas and target population increased
Result This Indicator Measures [For USAID only] IR 1.3 Enhanced prevention and treatment of HIV, malaria and other epidemics among the most vulnerable Sub IR 1.3.1 Prevention and treatment scaled up
Data Source(s): Primary data source (TB Drug Resistant Register at health facility – HMIS 096a, Secondary data source – DHIS 2.0
Partner or Contractor Who Provided the Data: USAID Regional Health Integration to Enhance Services-North, Acholi (RHITES-N Acholi) and USAID Regional Health Integration to Enhance Services-North, Lango (RHITES-N Lango)
Period for Which the Data Are Being Reported: October 2017 – September 2018 Is This Indicator a Standard or Custom Indicator? √ Standard Foreign Assistance Indicator
Custom (created by the OU; not standard) Data Quality Assessment methodology:
• Desk review of various documents including USAID Standard PIRS, AMELPs, 2018 annual and 2019 quarterly reports to USAID and data reported in the PRS; to obtain information about the indicator.
• Conducted Activity MEL systems assessment to understand the process and structures for data collection, analysis and reporting,
• Conducted Data Quality Assessment interviews at Activity head offices and two multi-drug resistant (MDR) TB treatment centers in the Activities region
• Conducted interviews with health facilities staff that provide TB services to further understand the referrals for services related to this indicator
• Data verification and validation by comparing data in USAID Performance Reporting System (PRS), Activity records, DHIS 2.0 data and physical counting from the DR TB registers
• Debriefing with Activity staff and health workers to provide immediate feedback on the data quality issues validate findings and discuss improvement action points.
Date(s) of Assessment: September 30 -17, 2019 Assessment Team Members:
• Esther N. Sempiira - Consultant ULA • Emilly Kemigisha-Ssali - Health Specialist, Consultant ULA • Heiwote Aberra - MEL Specialist, ULA • Erika Dunmire - DQA Advisor, ULA • David Mawejje - ULA
USAID Mission/OU Verification of DQA Team Leader Officer approval X
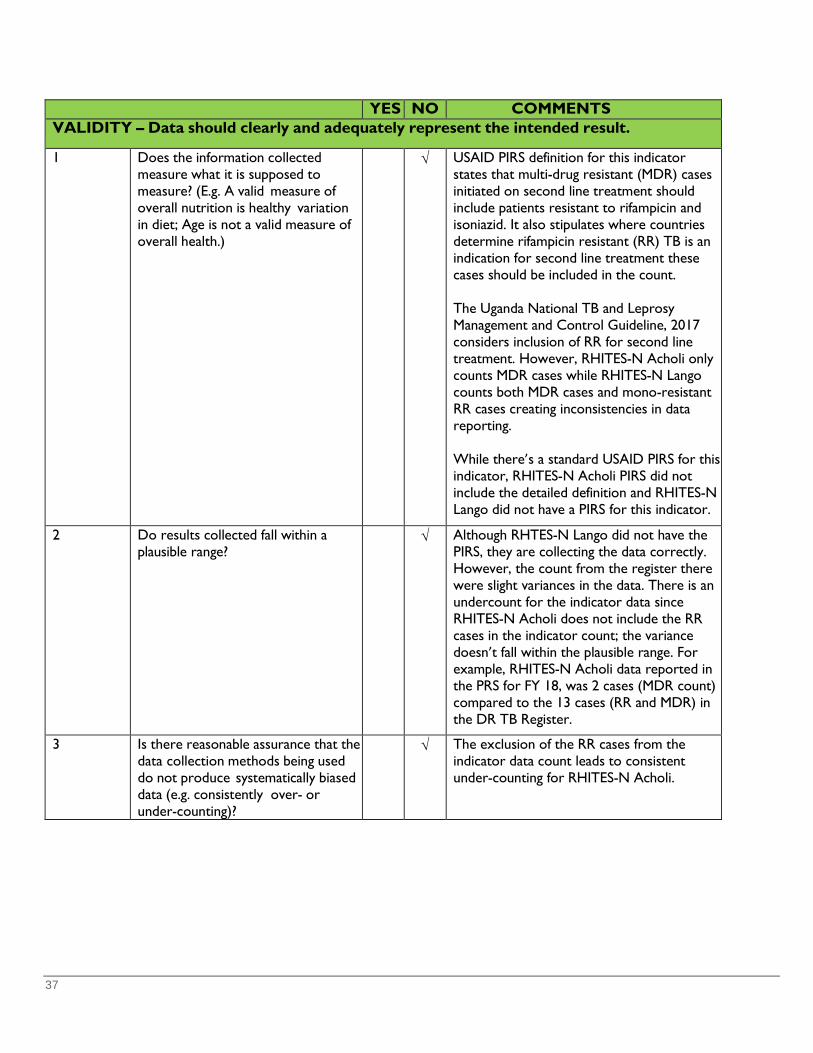
37
YES NO COMMENTS VALIDITY – Data should clearly and adequately represent the intended result.
1 Does the information collected measure what it is supposed to measure? (E.g. A valid measure of overall nutrition is healthy variation in diet; Age is not a valid measure of overall health.)
√ USAID PIRS definition for this indicator states that multi-drug resistant (MDR) cases initiated on second line treatment should include patients resistant to rifampicin and isoniazid. It also stipulates where countries determine rifampicin resistant (RR) TB is an indication for second line treatment these cases should be included in the count.
The Uganda National TB and Leprosy Management and Control Guideline, 2017 considers inclusion of RR for second line treatment. However, RHITES-N Acholi only counts MDR cases while RHITES-N Lango counts both MDR cases and mono-resistant RR cases creating inconsistencies in data reporting.
While there’s a standard USAID PIRS for this indicator, RHITES-N Acholi PIRS did not include the detailed definition and RHITES-N Lango did not have a PIRS for this indicator.
2 Do results collected fall within a plausible range?
√ Although RHTES-N Lango did not have the PIRS, they are collecting the data correctly. However, the count from the register there were slight variances in the data. There is an undercount for the indicator data since RHITES-N Acholi does not include the RR cases in the indicator count; the variance doesn’t fall within the plausible range. For example, RHITES-N Acholi data reported in the PRS for FY 18, was 2 cases (MDR count) compared to the 13 cases (RR and MDR) in the DR TB Register.
3 Is there reasonable assurance that the data collection methods being used do not produce systematically biased data (e.g. consistently over- or under-counting)?
√ The exclusion of the RR cases from the indicator data count leads to consistent under-counting for RHITES-N Acholi.

38
4 Are sound research methods being used to collect the data?
√ Data for this indicator is collected within the national HMIS process using the DR TB Register, HMIS 096b which has documented guidance on the cover page to aid the recording of information in the register. However, there’s a time lag of over three months before culture test results that classify DR cases are recorded in the register. For the case of RHITES-N Acholi, the delay of the culture test results created a gap in the count for this indicator, since they only consider MDRs and exclude RRs, when the culture test results are released outside the reporting quarter. This leads to under counting for this indicator, as they waited for the DR classification; because of the gap in the indicator definition.
RELIABILITY – Data should reflect stable and consistent data collection processes and analysis methods over time. 1 When the same data collection
method is used to measure/observe the same thing multiple times, is the same result produced each time? (E.g. A ruler used over and over always indicates the same length for an inch.)
√ The DR TB register (HMIS 096b) is used to collect data for this indicator and report quarterly using HMIS 106a and this information is entered into DHIS 2.0. The Activities use this data to report on the indicator. The DR TB register is long, following one patient along the line is not necessarily easy, especially given that more than 2 variables (patients with confirmatory results of MDR TB and initiation of second line treatment) located across two pages on the register are reviewed to qualify the patient to be included in the count. There are possibilities of miscounting if this is not carefully done by the person reporting. This challenge was b d b th t t th it 2 Are data collection and analysis
methods documented in writing and being used to ensure the same procedures are followed each time?
√ The DR TB register includes a job aid on the first page that provide guidance in data collection. However, IPs either did not have an internal PIRS or did not have access to USAID PIRS on this indicator to provide clarification on inclusions for this count. TIMELINESS – Data should be available at a useful frequency, should be current, and should be
timely enough to influence management decision-making.
1 Are data available frequently enough to inform program management decisions?
√ Data for this indicator is available on a quarterly basis for program management decisions.
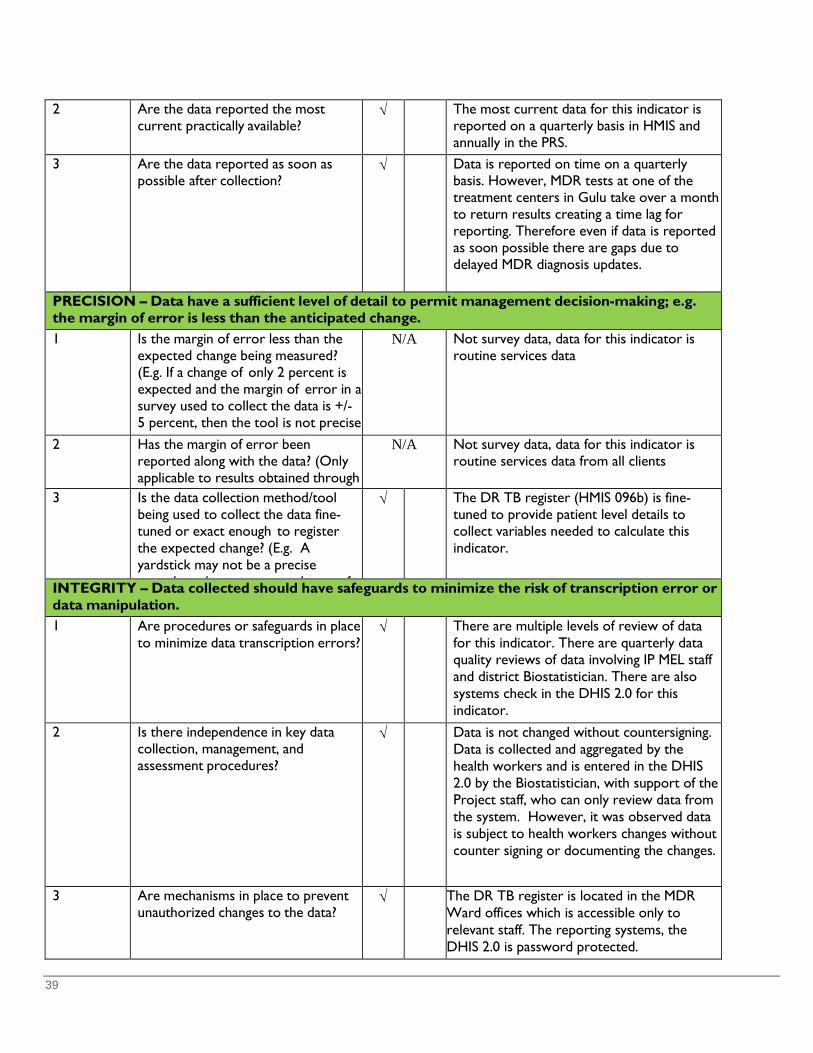
39
2 Are the data reported the most current practically available?
√ The most current data for this indicator is reported on a quarterly basis in HMIS and annually in the PRS.
3 Are the data reported as soon as possible after collection?
√ Data is reported on time on a quarterly basis. However, MDR tests at one of the treatment centers in Gulu take over a month to return results creating a time lag for reporting. Therefore even if data is reported as soon possible there are gaps due to delayed MDR diagnosis updates.
PRECISION – Data have a sufficient level of detail to permit management decision-making; e.g. the margin of error is less than the anticipated change.
1 Is the margin of error less than the expected change being measured? (E.g. If a change of only 2 percent is expected and the margin of error in a survey used to collect the data is +/- 5 percent, then the tool is not precise
h d h h )
N/A Not survey data, data for this indicator is routine services data
2 Has the margin of error been reported along with the data? (Only applicable to results obtained through
N/A Not survey data, data for this indicator is routine services data from all clients
3 Is the data collection method/tool being used to collect the data fine-tuned or exact enough to register the expected change? (E.g. A yardstick may not be a precise
h t l t h f
√ The DR TB register (HMIS 096b) is fine- tuned to provide patient level details to collect variables needed to calculate this indicator.
INTEGRITY – Data collected should have safeguards to minimize the risk of transcription error or data manipulation.
1 Are procedures or safeguards in place to minimize data transcription errors?
√ There are multiple levels of review of data for this indicator. There are quarterly data quality reviews of data involving IP MEL staff and district Biostatistician. There are also systems check in the DHIS 2.0 for this indicator.
2 Is there independence in key data collection, management, and assessment procedures?
√ Data is not changed without countersigning. Data is collected and aggregated by the health workers and is entered in the DHIS 2.0 by the Biostatistician, with support of the Project staff, who can only review data from the system. However, it was observed data is subject to health workers changes without counter signing or documenting the changes.
3 Are mechanisms in place to prevent unauthorized changes to the data?
√ The DR TB register is located in the MDR Ward offices which is accessible only to relevant staff. The reporting systems, the DHIS 2.0 is password protected.
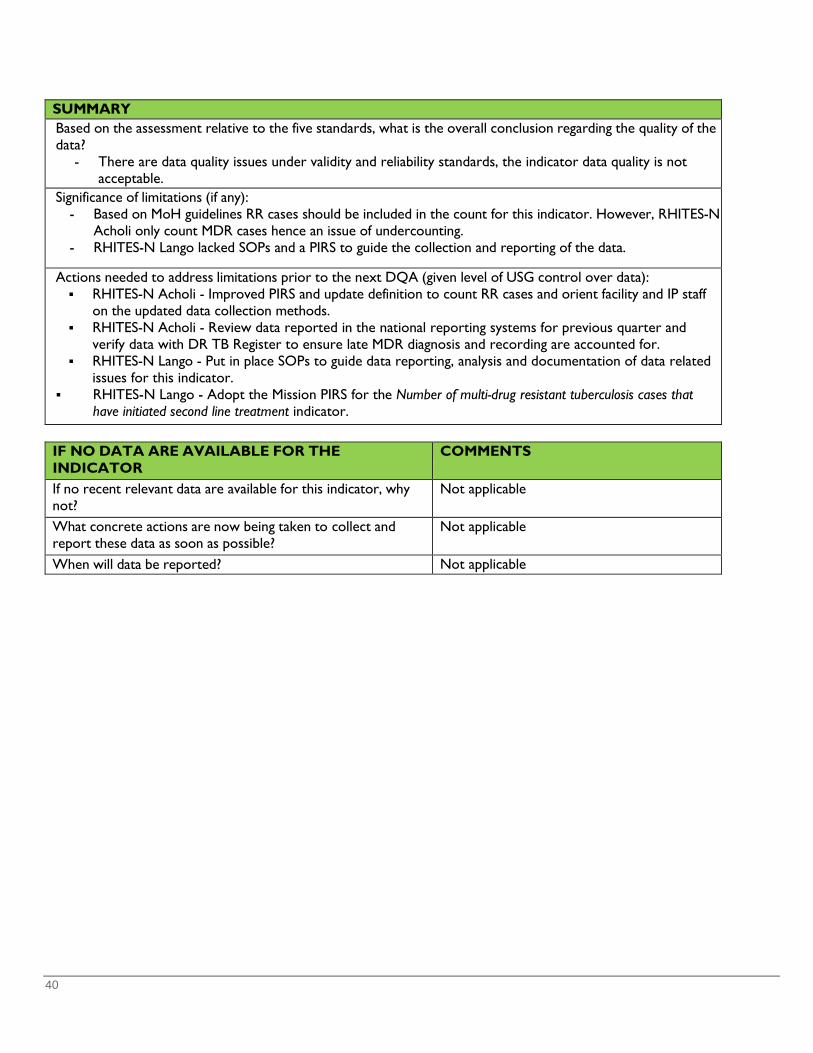
40
SUMMARY Based on the assessment relative to the five standards, what is the overall conclusion regarding the quality of the data?
- There are data quality issues under validity and reliability standards, the indicator data quality is not acceptable.
Significance of limitations (if any): - Based on MoH guidelines RR cases should be included in the count for this indicator. However, RHITES-N
Acholi only count MDR cases hence an issue of undercounting. - RHITES-N Lango lacked SOPs and a PIRS to guide the collection and reporting of the data.
Actions needed to address limitations prior to the next DQA (given level of USG control over data):
RHITES-N Acholi - Improved PIRS and update definition to count RR cases and orient facility and IP staff on the updated data collection methods.
RHITES-N Acholi - Review data reported in the national reporting systems for previous quarter and verify data with DR TB Register to ensure late MDR diagnosis and recording are accounted for.
RHITES-N Lango - Put in place SOPs to guide data reporting, analysis and documentation of data related issues for this indicator.
RHITES-N Lango - Adopt the Mission PIRS for the Number of multi-drug resistant tuberculosis cases that have initiated second line treatment indicator.
IF NO DATA ARE AVAILABLE FOR THE INDICATOR
COMMENTS
If no recent relevant data are available for this indicator, why not?
Not applicable
What concrete actions are now being taken to collect and report these data as soon as possible?
Not applicable
When will data be reported? Not applicable

41
USAID DQA Checklist and Cover sheet
USAID Mission or Operating Unit Name: USAID Uganda
Title of Performance Indicator: HL.2.4-2: Number of multi-drug resistant tuberculosis cases that have initiated second line treatment
Linkage to Foreign Assistance Standardized Program Structure, if applicable (i.e. Program Area, Element, etc.): Program Element HL.2.4 Programmatic Management of Multi Drug-Resistant TB (MDR-TB) DO1 Community and household resilience in selected areas and target population increased
Result This Indicator Measures [For USAID only] IR 1.3 Enhanced prevention and treatment of HIV, malaria and other epidemics among the most vulnerable Sub IR 1.3.1 Prevention and treatment scaled up
Data Source(s): Primary data source (TB Drug Resistant Register (096a) at health facility, Secondary data source – DHIS 2.0
Partner or Contractor Who Provided the Data: USAID Regional Health Integration to Enhance Services-North, Acholi (RHITES-N Acholi)
Period for Which the Data Are Being Reported: October 2017 – September 2018 Is This Indicator a Standard or Custom Indicator? √ Standard Foreign Assistance Indicator
Custom (created by the OU; not standard) Data Quality Assessment methodology:
• Desk review of various documents including USAID Standard PIRS, IP AMELP, 2018 annual and 2019 quarterly reports to USAID and data reported in the Performance Reporting System (PRS); to obtain information about the indicator.
• Conducted IP MEL system assessment to understand the process and structures for data collection, analysis and reporting,
• Conducted Data Quality Assessment interviews at IP headquarters and Gulu Regional Referral Hospital which is one of two multi-drug resistant (MDR) TB treatment center in the IP region
• Conducted brief interviews with 5 health facilities that provide TB services to further understand the referrals for services related to this indicator,
• Data verification and validation by comparing data in USAID’s PRS, IP records, DHIS 2.0 data and physical counting from the DR TB register at Gulu Hospital providing the MDR services
• Debriefing with IP staff and health workers to provide immediate feedback on the data quality issues, validate findings and discuss improvement action points.
Date(s) of Assessment: October 14 -17, 2019 Assessment Team Members:
• Esther N. Sempiira - Consultant ULA • Emilly Kemigisha-Ssali - Health Specialist, Consultant ULA • Heiwote Aberra - MEL Specialist, ULA • David Mawejje - ULA
USAID Mission/OU Verification of DQA Team Leader Officer approval X
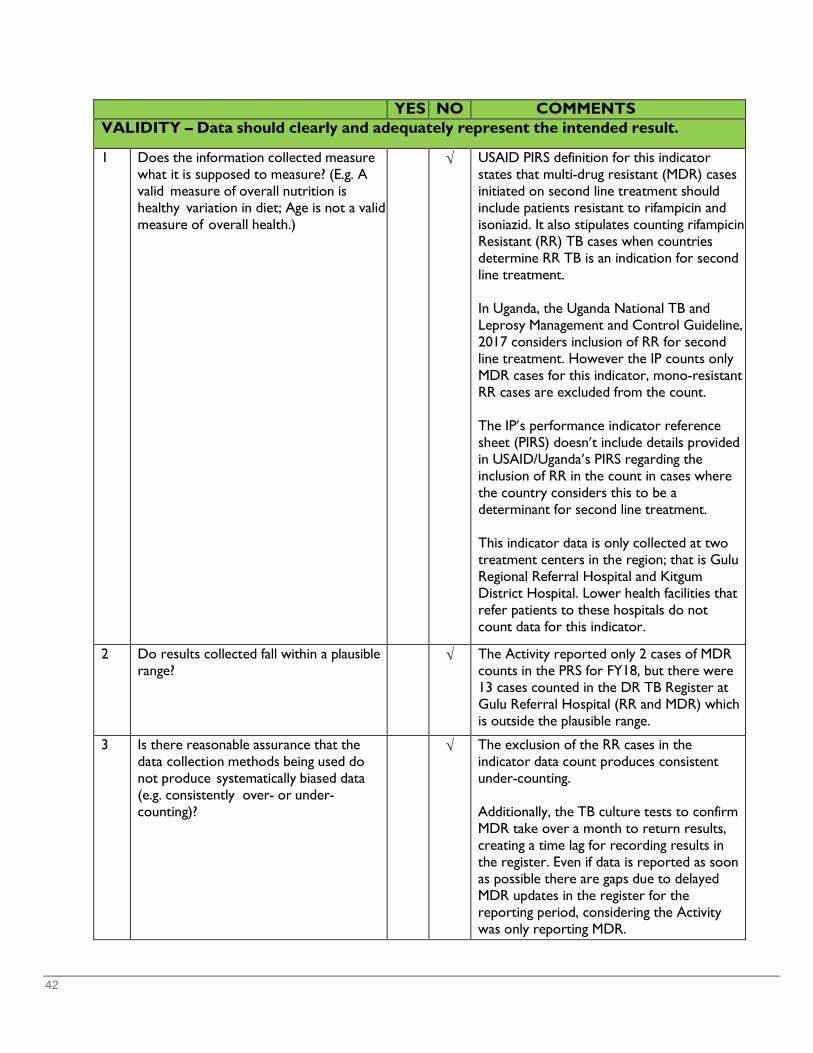
42
YES NO COMMENTS VALIDITY – Data should clearly and adequately represent the intended result.
1 Does the information collected measure what it is supposed to measure? (E.g. A valid measure of overall nutrition is healthy variation in diet; Age is not a valid measure of overall health.)
√ USAID PIRS definition for this indicator states that multi-drug resistant (MDR) cases initiated on second line treatment should include patients resistant to rifampicin and isoniazid. It also stipulates counting rifampicin Resistant (RR) TB cases when countries determine RR TB is an indication for second line treatment. In Uganda, the Uganda National TB and Leprosy Management and Control Guideline, 2017 considers inclusion of RR for second line treatment. However the IP counts only MDR cases for this indicator, mono-resistant RR cases are excluded from the count. The IP’s performance indicator reference sheet (PIRS) doesn’t include details provided in USAID/Uganda’s PIRS regarding the inclusion of RR in the count in cases where the country considers this to be a determinant for second line treatment. This indicator data is only collected at two treatment centers in the region; that is Gulu Regional Referral Hospital and Kitgum District Hospital. Lower health facilities that refer patients to these hospitals do not count data for this indicator.
2 Do results collected fall within a plausible range?
√ The Activity reported only 2 cases of MDR counts in the PRS for FY18, but there were 13 cases counted in the DR TB Register at Gulu Referral Hospital (RR and MDR) which is outside the plausible range.
3 Is there reasonable assurance that the data collection methods being used do not produce systematically biased data (e.g. consistently over- or under-counting)?
√ The exclusion of the RR cases in the indicator data count produces consistent under-counting. Additionally, the TB culture tests to confirm MDR take over a month to return results, creating a time lag for recording results in the register. Even if data is reported as soon as possible there are gaps due to delayed MDR updates in the register for the reporting period, considering the Activity was only reporting MDR.
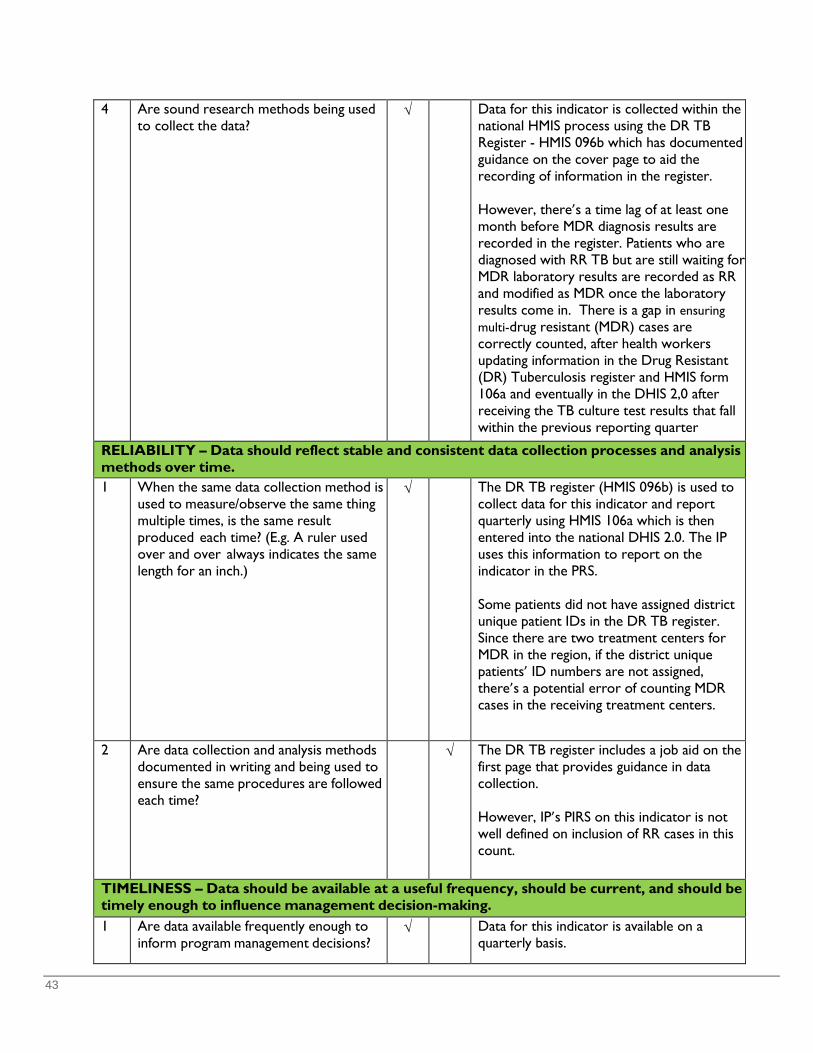
43
4 Are sound research methods being used to collect the data?
√ Data for this indicator is collected within the national HMIS process using the DR TB Register - HMIS 096b which has documented guidance on the cover page to aid the recording of information in the register. However, there’s a time lag of at least one month before MDR diagnosis results are recorded in the register. Patients who are diagnosed with RR TB but are still waiting for MDR laboratory results are recorded as RR and modified as MDR once the laboratory results come in. There is a gap in ensuring multi-drug resistant (MDR) cases are correctly counted, after health workers updating information in the Drug Resistant (DR) Tuberculosis register and HMIS form 106a and eventually in the DHIS 2,0 after receiving the TB culture test results that fall within the previous reporting quarter
RELIABILITY – Data should reflect stable and consistent data collection processes and analysis methods over time. 1 When the same data collection method is
used to measure/observe the same thing multiple times, is the same result produced each time? (E.g. A ruler used over and over always indicates the same length for an inch.)
√ The DR TB register (HMIS 096b) is used to collect data for this indicator and report quarterly using HMIS 106a which is then entered into the national DHIS 2.0. The IP uses this information to report on the indicator in the PRS. Some patients did not have assigned district unique patient IDs in the DR TB register. Since there are two treatment centers for MDR in the region, if the district unique patients’ ID numbers are not assigned, there’s a potential error of counting MDR cases in the receiving treatment centers.
2 Are data collection and analysis methods documented in writing and being used to ensure the same procedures are followed each time?
√ The DR TB register includes a job aid on the first page that provides guidance in data collection. However, IP’s PIRS on this indicator is not well defined on inclusion of RR cases in this count.
TIMELINESS – Data should be available at a useful frequency, should be current, and should be timely enough to influence management decision-making.
1 Are data available frequently enough to inform program management decisions?
√ Data for this indicator is available on a quarterly basis.
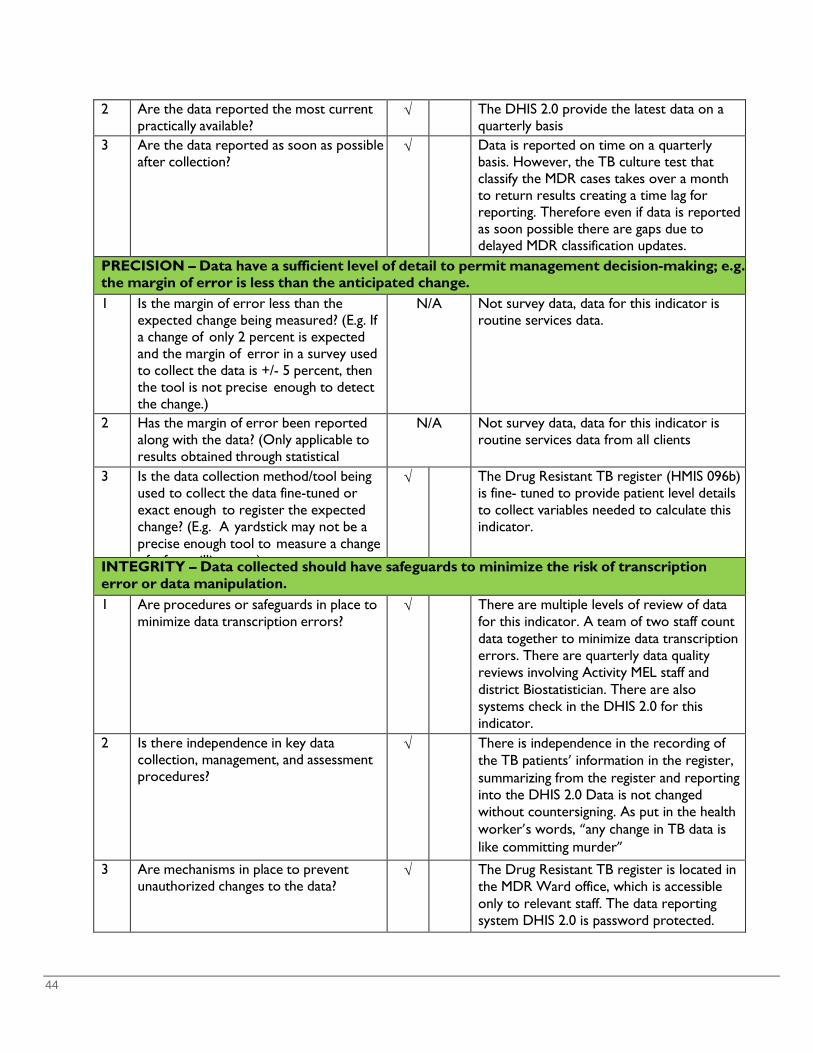
44
2 Are the data reported the most current practically available?
√ The DHIS 2.0 provide the latest data on a quarterly basis
3 Are the data reported as soon as possible after collection?
√ Data is reported on time on a quarterly basis. However, the TB culture test that classify the MDR cases takes over a month to return results creating a time lag for reporting. Therefore even if data is reported as soon possible there are gaps due to delayed MDR classification updates.
PRECISION – Data have a sufficient level of detail to permit management decision-making; e.g. the margin of error is less than the anticipated change.
1 Is the margin of error less than the expected change being measured? (E.g. If a change of only 2 percent is expected and the margin of error in a survey used to collect the data is +/- 5 percent, then the tool is not precise enough to detect the change.)
N/A Not survey data, data for this indicator is routine services data.
2 Has the margin of error been reported along with the data? (Only applicable to results obtained through statistical
N/A Not survey data, data for this indicator is routine services data from all clients
3 Is the data collection method/tool being used to collect the data fine-tuned or exact enough to register the expected change? (E.g. A yardstick may not be a precise enough tool to measure a change f f illi t )
√ The Drug Resistant TB register (HMIS 096b) is fine- tuned to provide patient level details to collect variables needed to calculate this indicator.
INTEGRITY – Data collected should have safeguards to minimize the risk of transcription error or data manipulation.
1 Are procedures or safeguards in place to minimize data transcription errors?
√ There are multiple levels of review of data for this indicator. A team of two staff count data together to minimize data transcription errors. There are quarterly data quality reviews involving Activity MEL staff and district Biostatistician. There are also systems check in the DHIS 2.0 for this indicator. 2 Is there independence in key data
collection, management, and assessment procedures?
√ There is independence in the recording of the TB patients’ information in the register, summarizing from the register and reporting into the DHIS 2.0 Data is not changed without countersigning. As put in the health worker’s words, “any change in TB data is like committing murder”
3 Are mechanisms in place to prevent unauthorized changes to the data?
√ The Drug Resistant TB register is located in the MDR Ward office, which is accessible only to relevant staff. The data reporting system DHIS 2.0 is password protected.
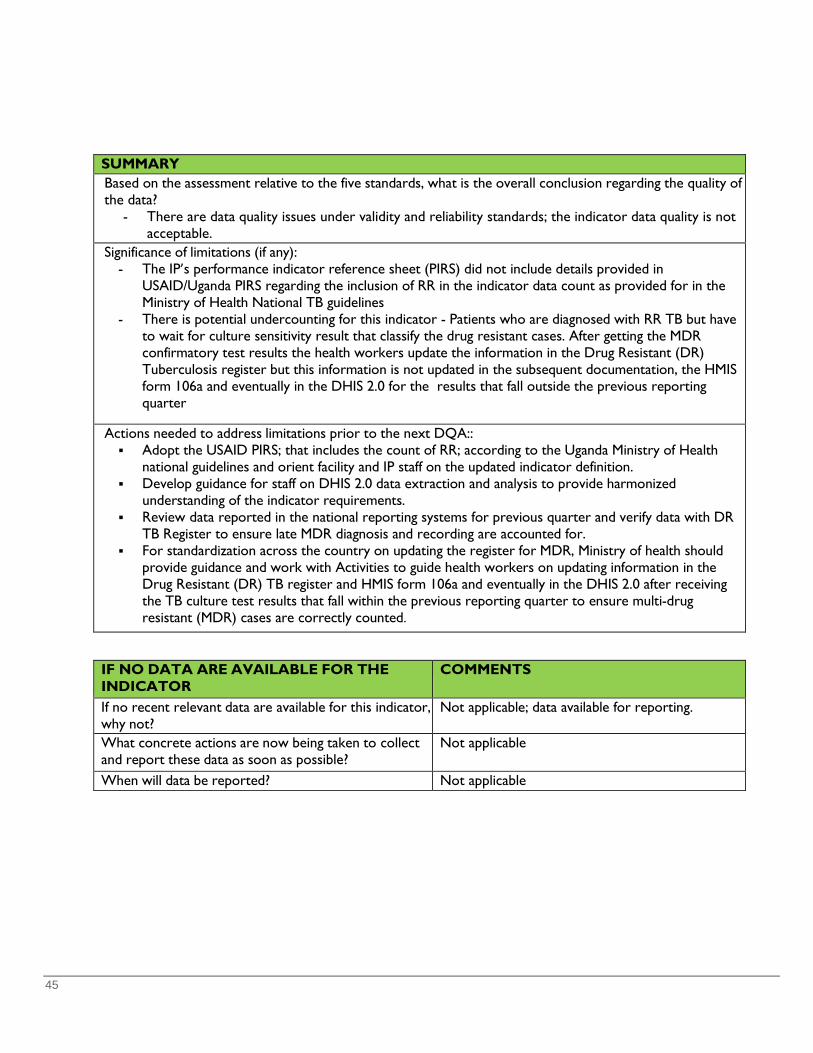
45
SUMMARY Based on the assessment relative to the five standards, what is the overall conclusion regarding the quality of the data?
- There are data quality issues under validity and reliability standards; the indicator data quality is not acceptable.
Significance of limitations (if any): - The IP’s performance indicator reference sheet (PIRS) did not include details provided in
USAID/Uganda PIRS regarding the inclusion of RR in the indicator data count as provided for in the Ministry of Health National TB guidelines
- There is potential undercounting for this indicator - Patients who are diagnosed with RR TB but have to wait for culture sensitivity result that classify the drug resistant cases. After getting the MDR confirmatory test results the health workers update the information in the Drug Resistant (DR) Tuberculosis register but this information is not updated in the subsequent documentation, the HMIS form 106a and eventually in the DHIS 2.0 for the results that fall outside the previous reporting quarter
Actions needed to address limitations prior to the next DQA:: Adopt the USAID PIRS; that includes the count of RR; according to the Uganda Ministry of Health
national guidelines and orient facility and IP staff on the updated indicator definition. Develop guidance for staff on DHIS 2.0 data extraction and analysis to provide harmonized
understanding of the indicator requirements. Review data reported in the national reporting systems for previous quarter and verify data with DR
TB Register to ensure late MDR diagnosis and recording are accounted for. For standardization across the country on updating the register for MDR, Ministry of health should
provide guidance and work with Activities to guide health workers on updating information in the Drug Resistant (DR) TB register and HMIS form 106a and eventually in the DHIS 2.0 after receiving the TB culture test results that fall within the previous reporting quarter to ensure multi-drug resistant (MDR) cases are correctly counted.
IF NO DATA ARE AVAILABLE FOR THE INDICATOR
COMMENTS
If no recent relevant data are available for this indicator, why not?
Not applicable; data available for reporting.
What concrete actions are now being taken to collect and report these data as soon as possible?
Not applicable
When will data be reported? Not applicable
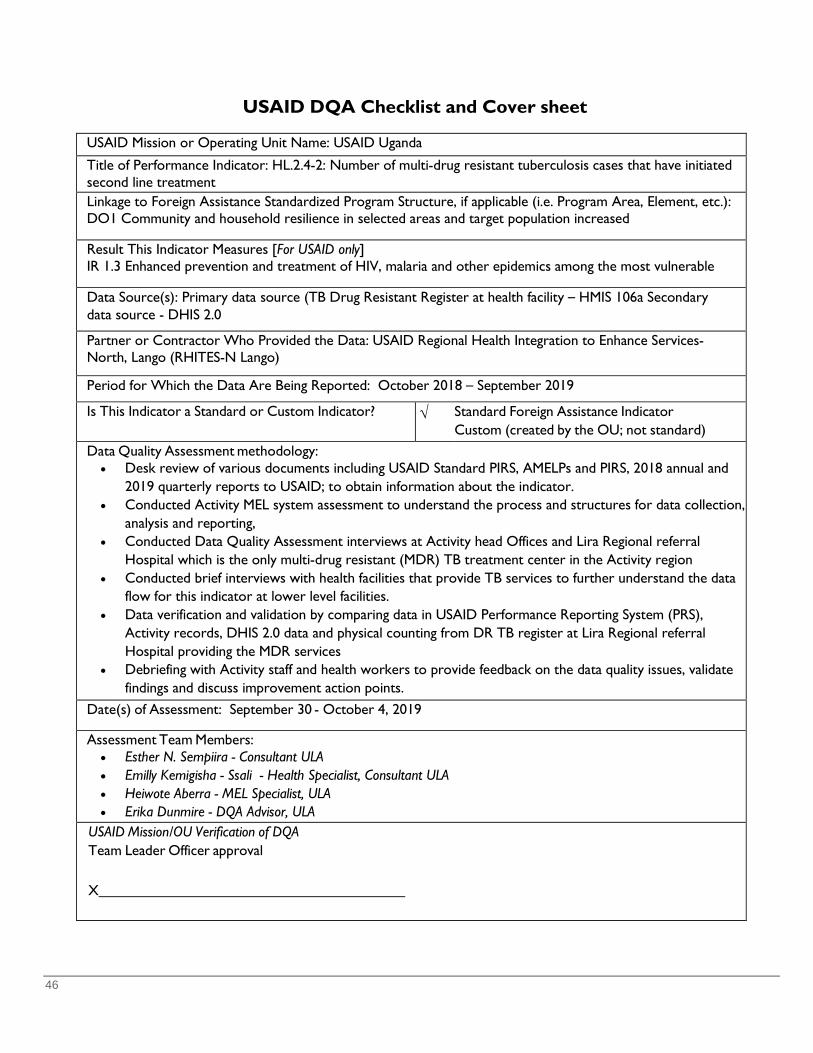
46
USAID DQA Checklist and Cover sheet
USAID Mission or Operating Unit Name: USAID Uganda
Title of Performance Indicator: HL.2.4-2: Number of multi-drug resistant tuberculosis cases that have initiated second line treatment
Linkage to Foreign Assistance Standardized Program Structure, if applicable (i.e. Program Area, Element, etc.): DO1 Community and household resilience in selected areas and target population increased Result This Indicator Measures [For USAID only] IR 1.3 Enhanced prevention and treatment of HIV, malaria and other epidemics among the most vulnerable Data Source(s): Primary data source (TB Drug Resistant Register at health facility – HMIS 106a Secondary data source - DHIS 2.0 Partner or Contractor Who Provided the Data: USAID Regional Health Integration to Enhance Services-North, Lango (RHITES-N Lango) Period for Which the Data Are Being Reported: October 2018 – September 2019 Is This Indicator a Standard or Custom Indicator? √ Standard Foreign Assistance Indicator
Custom (created by the OU; not standard) Data Quality Assessment methodology:
• Desk review of various documents including USAID Standard PIRS, AMELPs and PIRS, 2018 annual and 2019 quarterly reports to USAID; to obtain information about the indicator.
• Conducted Activity MEL system assessment to understand the process and structures for data collection, analysis and reporting,
• Conducted Data Quality Assessment interviews at Activity head Offices and Lira Regional referral Hospital which is the only multi-drug resistant (MDR) TB treatment center in the Activity region
• Conducted brief interviews with health facilities that provide TB services to further understand the data flow for this indicator at lower level facilities.
• Data verification and validation by comparing data in USAID Performance Reporting System (PRS), Activity records, DHIS 2.0 data and physical counting from DR TB register at Lira Regional referral Hospital providing the MDR services
• Debriefing with Activity staff and health workers to provide feedback on the data quality issues, validate findings and discuss improvement action points.
Date(s) of Assessment: September 30 - October 4, 2019
Assessment Team Members: • Esther N. Sempiira - Consultant ULA • Emilly Kemigisha - Ssali - Health Specialist, Consultant ULA • Heiwote Aberra - MEL Specialist, ULA • Erika Dunmire - DQA Advisor, ULA
USAID Mission/OU Verification of DQA Team Leader Officer approval
X
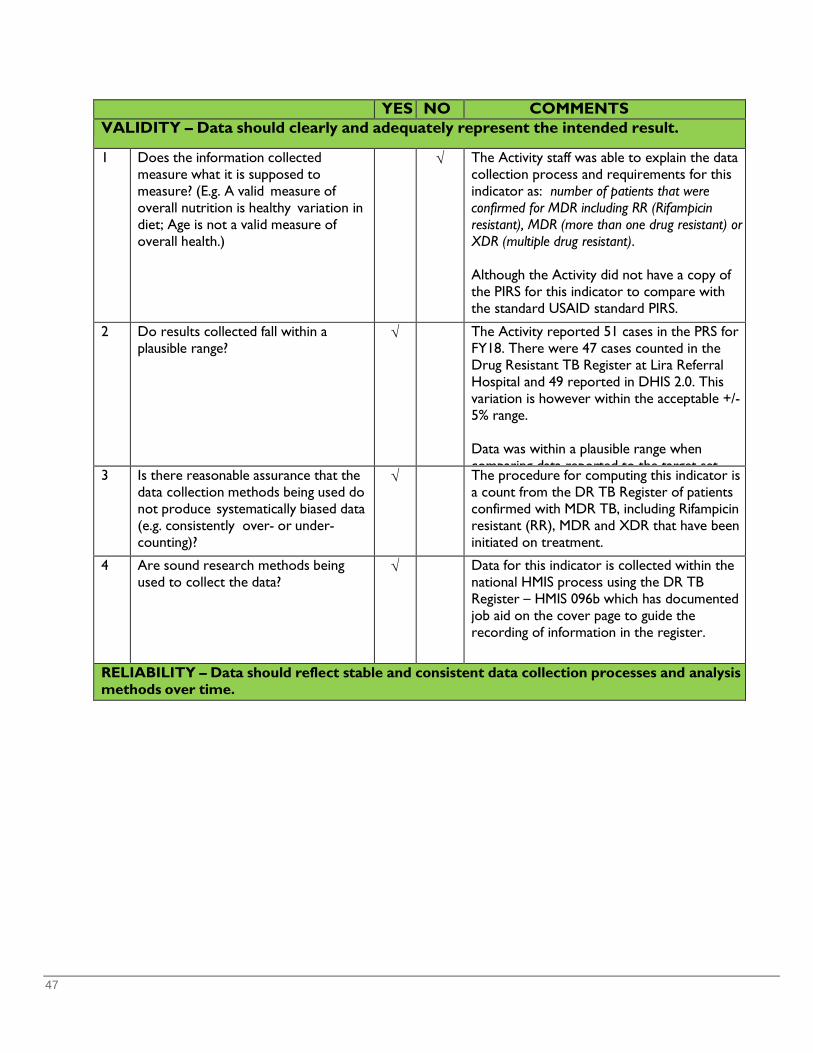
47
YES NO COMMENTS VALIDITY – Data should clearly and adequately represent the intended result.
1 Does the information collected measure what it is supposed to measure? (E.g. A valid measure of overall nutrition is healthy variation in diet; Age is not a valid measure of overall health.)
√ The Activity staff was able to explain the data collection process and requirements for this indicator as: number of patients that were confirmed for MDR including RR (Rifampicin resistant), MDR (more than one drug resistant) or XDR (multiple drug resistant). Although the Activity did not have a copy of the PIRS for this indicator to compare with the standard USAID standard PIRS.
2 Do results collected fall within a plausible range?
√ The Activity reported 51 cases in the PRS for FY18. There were 47 cases counted in the Drug Resistant TB Register at Lira Referral Hospital and 49 reported in DHIS 2.0. This variation is however within the acceptable +/- 5% range. Data was within a plausible range when comparing data reported to the target set
3 Is there reasonable assurance that the data collection methods being used do not produce systematically biased data (e.g. consistently over- or under-counting)?
√ The procedure for computing this indicator is a count from the DR TB Register of patients confirmed with MDR TB, including Rifampicin resistant (RR), MDR and XDR that have been initiated on treatment.
4 Are sound research methods being used to collect the data?
√ Data for this indicator is collected within the national HMIS process using the DR TB Register – HMIS 096b which has documented job aid on the cover page to guide the recording of information in the register.
RELIABILITY – Data should reflect stable and consistent data collection processes and analysis methods over time.
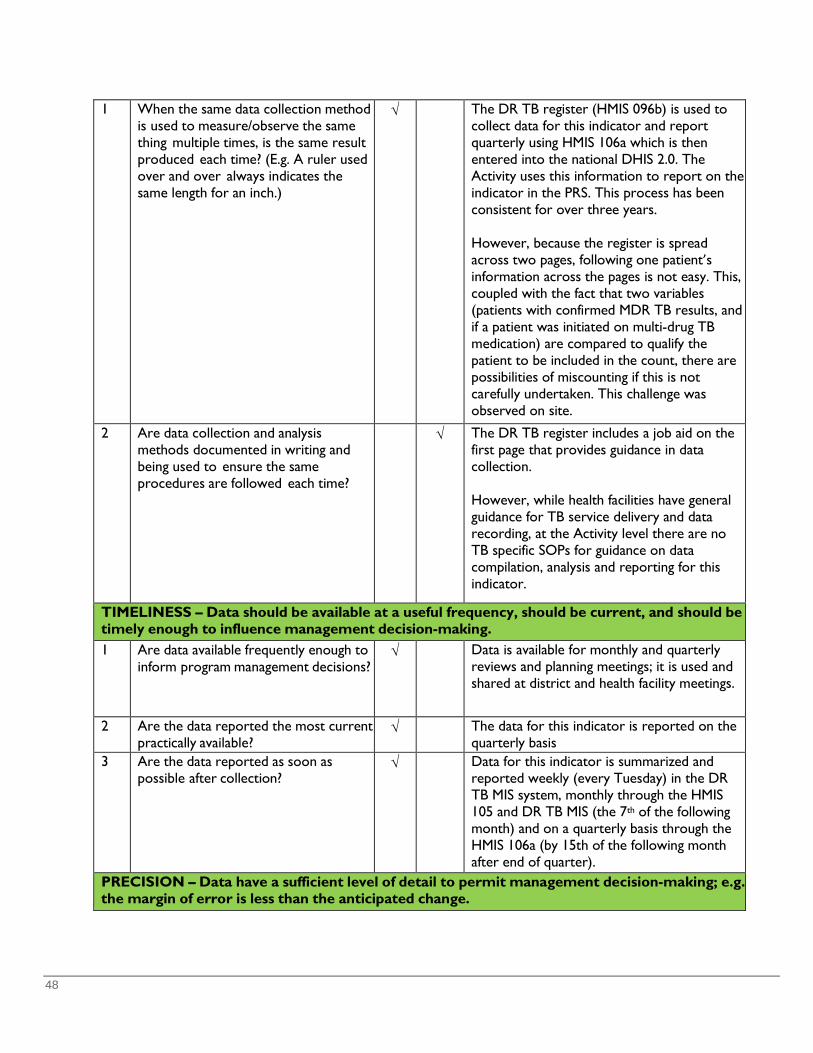
48
1 When the same data collection method is used to measure/observe the same thing multiple times, is the same result produced each time? (E.g. A ruler used over and over always indicates the same length for an inch.)
√ The DR TB register (HMIS 096b) is used to collect data for this indicator and report quarterly using HMIS 106a which is then entered into the national DHIS 2.0. The Activity uses this information to report on the indicator in the PRS. This process has been consistent for over three years. However, because the register is spread across two pages, following one patient’s information across the pages is not easy. This, coupled with the fact that two variables (patients with confirmed MDR TB results, and if a patient was initiated on multi-drug TB medication) are compared to qualify the patient to be included in the count, there are possibilities of miscounting if this is not carefully undertaken. This challenge was observed on site.
2 Are data collection and analysis methods documented in writing and being used to ensure the same procedures are followed each time?
√ The DR TB register includes a job aid on the first page that provides guidance in data collection. However, while health facilities have general guidance for TB service delivery and data recording, at the Activity level there are no TB specific SOPs for guidance on data compilation, analysis and reporting for this indicator.
TIMELINESS – Data should be available at a useful frequency, should be current, and should be timely enough to influence management decision-making.
1 Are data available frequently enough to inform program management decisions?
√ Data is available for monthly and quarterly reviews and planning meetings; it is used and shared at district and health facility meetings.
2 Are the data reported the most current practically available?
√ The data for this indicator is reported on the quarterly basis
3 Are the data reported as soon as possible after collection?
√ Data for this indicator is summarized and reported weekly (every Tuesday) in the DR TB MIS system, monthly through the HMIS 105 and DR TB MIS (the 7th of the following month) and on a quarterly basis through the HMIS 106a (by 15th of the following month after end of quarter).
PRECISION – Data have a sufficient level of detail to permit management decision-making; e.g. the margin of error is less than the anticipated change.
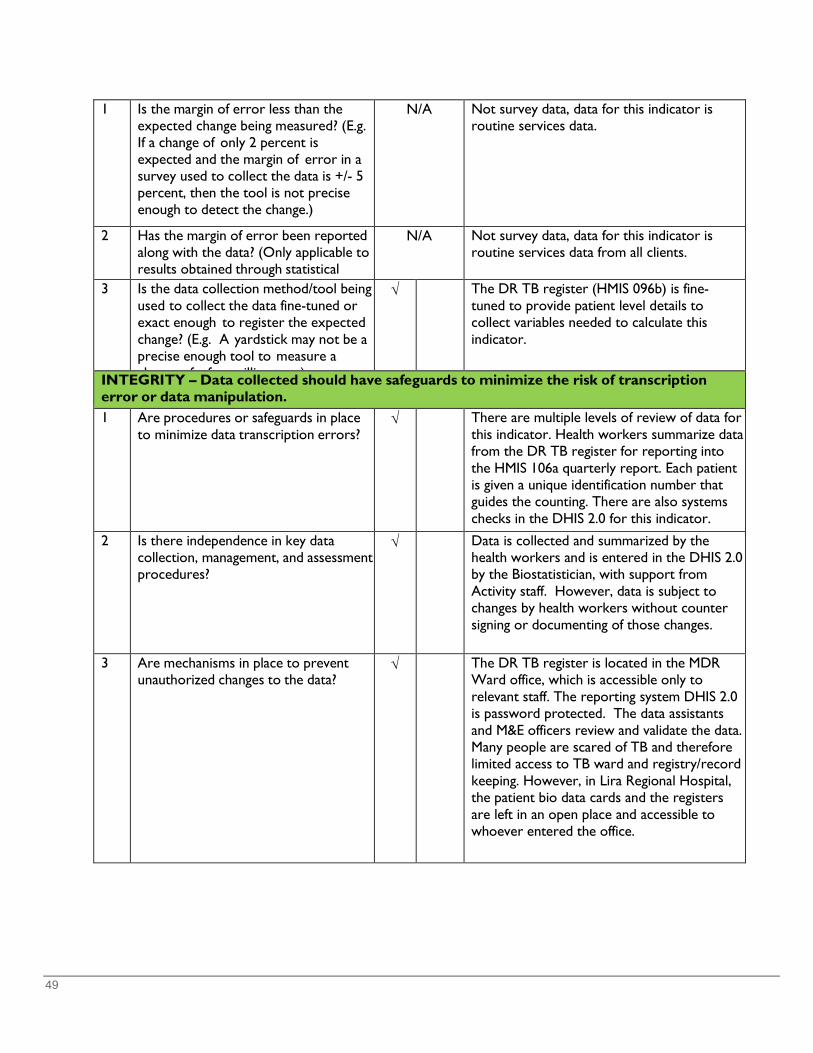
49
1 Is the margin of error less than the expected change being measured? (E.g. If a change of only 2 percent is expected and the margin of error in a survey used to collect the data is +/- 5 percent, then the tool is not precise enough to detect the change.)
N/A Not survey data, data for this indicator is routine services data.
2 Has the margin of error been reported along with the data? (Only applicable to results obtained through statistical
N/A Not survey data, data for this indicator is routine services data from all clients.
3 Is the data collection method/tool being used to collect the data fine-tuned or exact enough to register the expected change? (E.g. A yardstick may not be a precise enough tool to measure a h f f illi t )
√ The DR TB register (HMIS 096b) is fine- tuned to provide patient level details to collect variables needed to calculate this indicator.
INTEGRITY – Data collected should have safeguards to minimize the risk of transcription error or data manipulation.
1 Are procedures or safeguards in place to minimize data transcription errors?
√ There are multiple levels of review of data for this indicator. Health workers summarize data from the DR TB register for reporting into the HMIS 106a quarterly report. Each patient is given a unique identification number that guides the counting. There are also systems checks in the DHIS 2.0 for this indicator. 2 Is there independence in key data
collection, management, and assessment procedures?
√ Data is collected and summarized by the health workers and is entered in the DHIS 2.0 by the Biostatistician, with support from Activity staff. However, data is subject to changes by health workers without counter signing or documenting of those changes.
3 Are mechanisms in place to prevent unauthorized changes to the data?
√ The DR TB register is located in the MDR Ward office, which is accessible only to relevant staff. The reporting system DHIS 2.0 is password protected. The data assistants and M&E officers review and validate the data. Many people are scared of TB and therefore limited access to TB ward and registry/record keeping. However, in Lira Regional Hospital, the patient bio data cards and the registers are left in an open place and accessible to whoever entered the office.
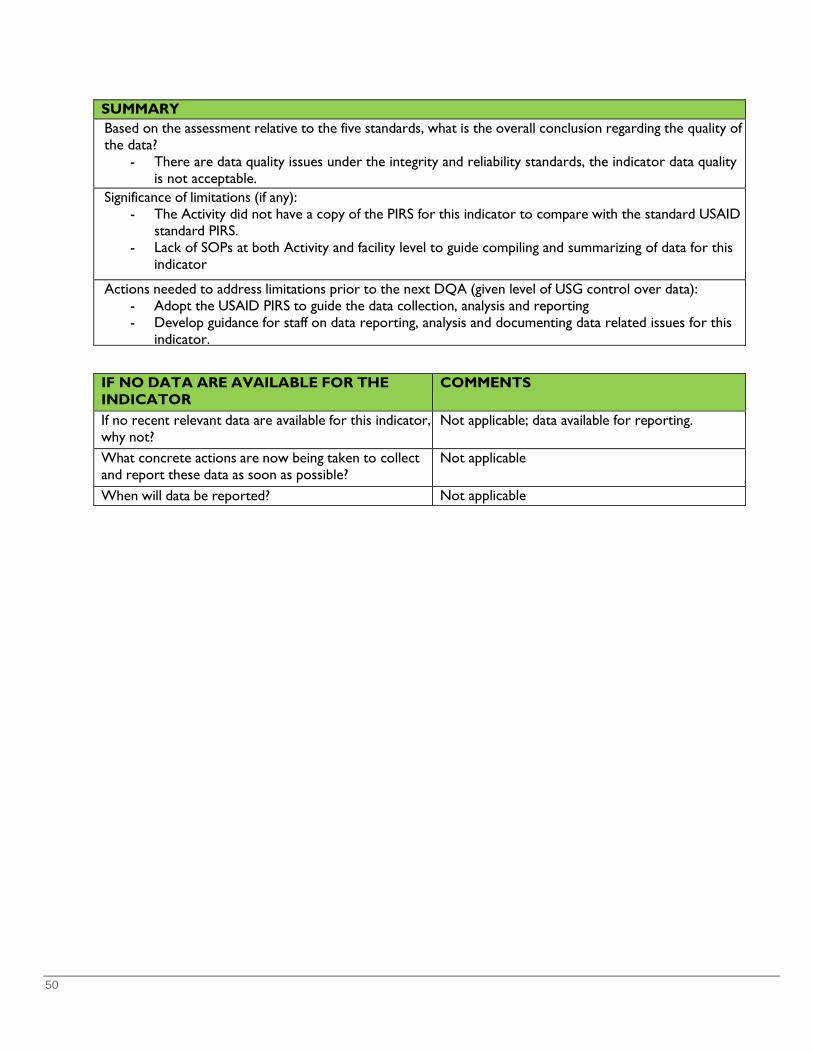
50
SUMMARY Based on the assessment relative to the five standards, what is the overall conclusion regarding the quality of the data?
- There are data quality issues under the integrity and reliability standards, the indicator data quality is not acceptable.
Significance of limitations (if any): - The Activity did not have a copy of the PIRS for this indicator to compare with the standard USAID
standard PIRS. - Lack of SOPs at both Activity and facility level to guide compiling and summarizing of data for this
indicator
Actions needed to address limitations prior to the next DQA (given level of USG control over data): - Adopt the USAID PIRS to guide the data collection, analysis and reporting - Develop guidance for staff on data reporting, analysis and documenting data related issues for this
indicator.
IF NO DATA ARE AVAILABLE FOR THE INDICATOR
COMMENTS
If no recent relevant data are available for this indicator, why not?
Not applicable; data available for reporting.
What concrete actions are now being taken to collect and report these data as soon as possible?
Not applicable
When will data be reported? Not applicable

51
USAID DQA Checklist and Cover sheet USAID Mission or Operating Unit Name: USAID Uganda
Title of Performance Indicator: Custom: TB treatment success rate in USG-assisted DOTs Programs
Linkage to Foreign Assistance Standardized Program Structure, if applicable (i.e. Program Area, Element, etc.): DO1 Community and household resilience in selected areas and target population increased
Result This Indicator Measures [For USAID only] IR 1.3 Enhanced prevention and treatment of HIV, malaria and other epidemics among the most vulnerable Sub IR 1.3.1 Prevention and treatment scaled up
Data Source(s): Primary data source - Unit TB Drug Resistant Register at health facility – HMIS 096a, Secondary data source - DHIS 2.0
Partner or Contractor Who Provided the Data: USAID Regional Health Integration to Enhance Services-North, Acholi (RHITES-N Acholi) USAID Regional Health Integration to Enhance Services-North, Lango (RHITES-N Lango)
Period for Which the Data Are Being Reported: October 2017 – September 2018
Is This Indicator a Standard or Custom Indicator?
√
Standard Foreign Assistance Indicator Custom (created by the OU; not standard)
Data Quality Assessment methodology: • Desk review of various documents including USAID Standard PIRS, AMELPs, 2018 annual and 2019
quarterly reports to USAID and data reported in the Performance Reporting System (PRS); to obtain information about the indicator.
• Conducted the MEL system assessment to further understand the process and structures for data collection, analysis and reporting,
• Conducted Data Quality Assessment interviews at Activity headquarters and selected health facilities providing TB treatment services; six in the RHITES-N Acholi region and four in the RHITES-N Lango region; including two regional referral hospital, one Private Not For Profit hospital, two heath center IVs and five health center IIIs
• Data verification and validation by comparing data in USAID PRS,, Activity records, DHIS 2.0 data and physical counting from the Unit TB registers at the ten selected health facilities
• Debriefing with both Activities’ staff and health workers to provide immediate feedback on the data quality, validate and discuss improvement actions needed.
Date(s) of Assessment: September 30th - October 4 and October 14-16, 2019 Assessment Team Members:
• Esther N. Sempiira - Consultant ULA • Emilly Kemigisha-Ssali - Health Specialist, Consultant ULA • Heiwote Aberra - MEL Specialist, ULA • Erika Dunmire - DQA Advisor, ULA • David Mawejje - PRS Data base Administrator ULA
USAID Mission/OU Verification of DQA Team Leader Officer approval
X
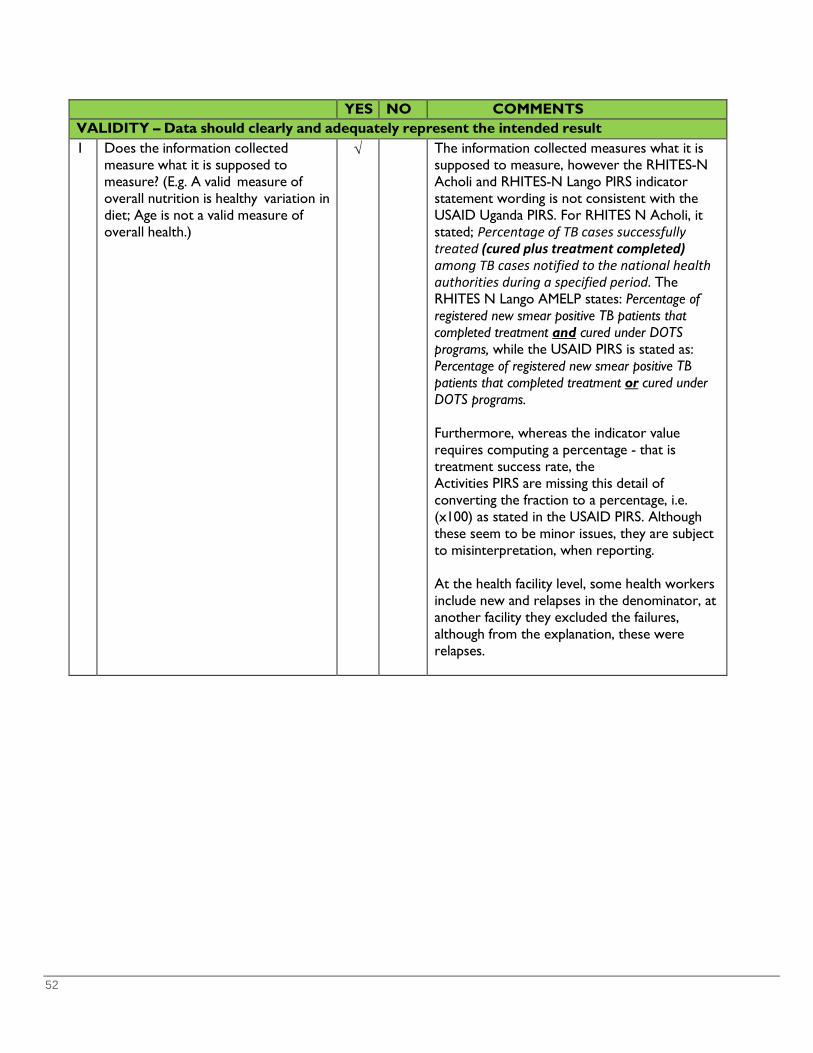
52
YES NO COMMENTS VALIDITY – Data should clearly and adequately represent the intended result 1 Does the information collected
measure what it is supposed to measure? (E.g. A valid measure of overall nutrition is healthy variation in diet; Age is not a valid measure of overall health.)
√ The information collected measures what it is supposed to measure, however the RHITES-N Acholi and RHITES-N Lango PIRS indicator statement wording is not consistent with the USAID Uganda PIRS. For RHITES N Acholi, it stated; Percentage of TB cases successfully treated (cured plus treatment completed) among TB cases notified to the national health authorities during a specified period. The RHITES N Lango AMELP states: Percentage of registered new smear positive TB patients that completed treatment and cured under DOTS programs, while the USAID PIRS is stated as: Percentage of registered new smear positive TB patients that completed treatment or cured under DOTS programs. Furthermore, whereas the indicator value requires computing a percentage - that is treatment success rate, the Activities PIRS are missing this detail of converting the fraction to a percentage, i.e. (x100) as stated in the USAID PIRS. Although these seem to be minor issues, they are subject to misinterpretation, when reporting. At the health facility level, some health workers include new and relapses in the denominator, at another facility they excluded the failures, although from the explanation, these were relapses.
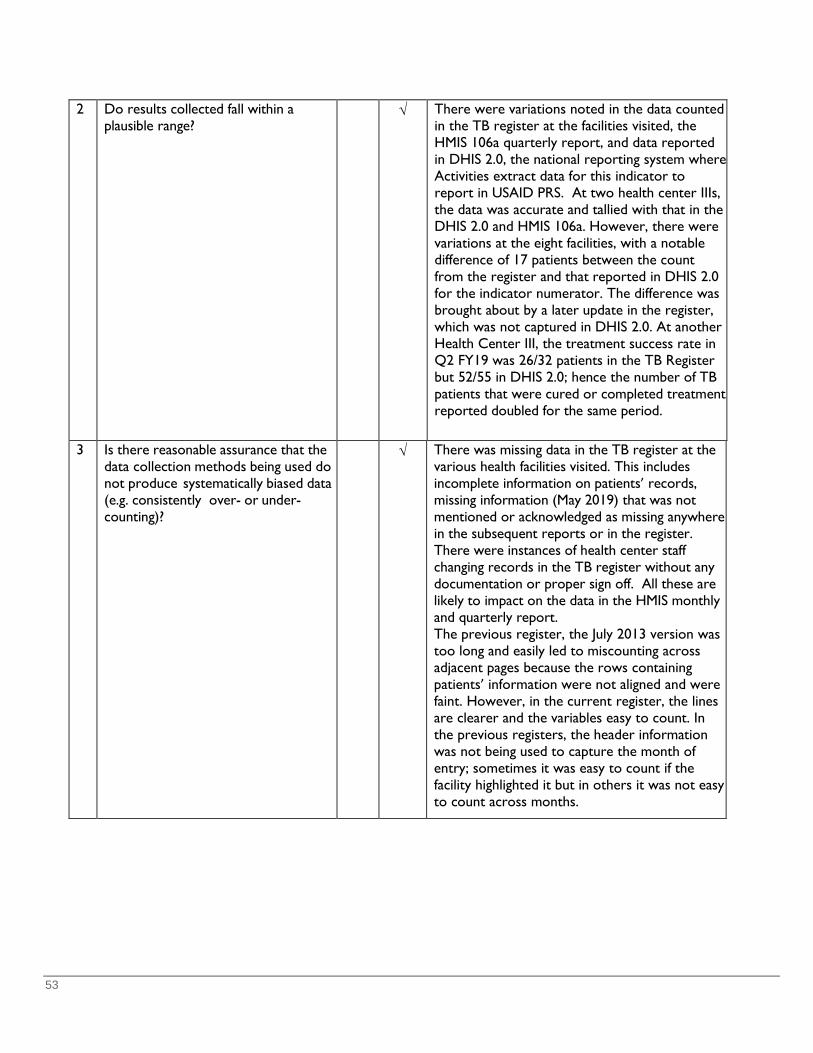
53
2 Do results collected fall within a plausible range?
√ There were variations noted in the data counted in the TB register at the facilities visited, the HMIS 106a quarterly report, and data reported in DHIS 2.0, the national reporting system where Activities extract data for this indicator to report in USAID PRS. At two health center IIIs, the data was accurate and tallied with that in the DHIS 2.0 and HMIS 106a. However, there were variations at the eight facilities, with a notable difference of 17 patients between the count from the register and that reported in DHIS 2.0 for the indicator numerator. The difference was brought about by a later update in the register, which was not captured in DHIS 2.0. At another Health Center III, the treatment success rate in Q2 FY19 was 26/32 patients in the TB Register but 52/55 in DHIS 2.0; hence the number of TB patients that were cured or completed treatment reported doubled for the same period.
3 Is there reasonable assurance that the data collection methods being used do not produce systematically biased data (e.g. consistently over- or under-counting)?
√ There was missing data in the TB register at the various health facilities visited. This includes incomplete information on patients’ records, missing information (May 2019) that was not mentioned or acknowledged as missing anywhere in the subsequent reports or in the register. There were instances of health center staff changing records in the TB register without any documentation or proper sign off. All these are likely to impact on the data in the HMIS monthly and quarterly report. The previous register, the July 2013 version was too long and easily led to miscounting across adjacent pages because the rows containing patients’ information were not aligned and were faint. However, in the current register, the lines are clearer and the variables easy to count. In the previous registers, the header information was not being used to capture the month of entry; sometimes it was easy to count if the facility highlighted it but in others it was not easy to count across months.
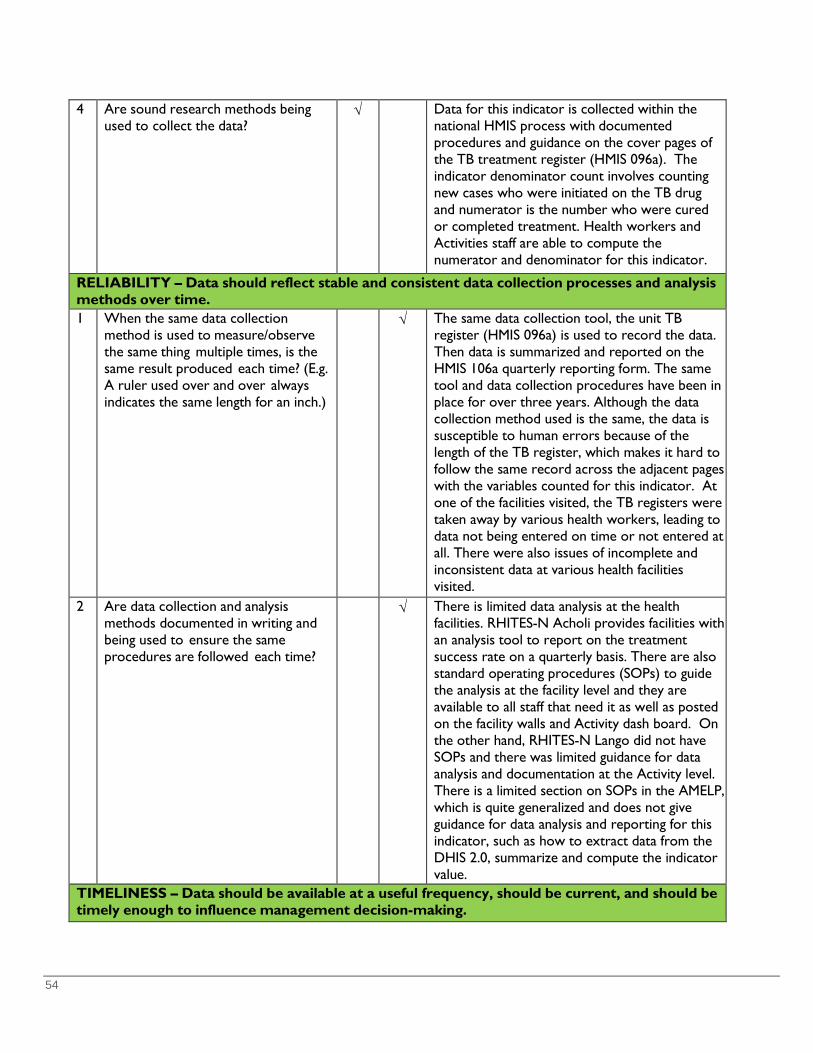
54
4 Are sound research methods being used to collect the data?
√ Data for this indicator is collected within the national HMIS process with documented procedures and guidance on the cover pages of the TB treatment register (HMIS 096a). The indicator denominator count involves counting new cases who were initiated on the TB drug and numerator is the number who were cured or completed treatment. Health workers and Activities staff are able to compute the numerator and denominator for this indicator.
RELIABILITY – Data should reflect stable and consistent data collection processes and analysis methods over time. 1 When the same data collection
method is used to measure/observe the same thing multiple times, is the same result produced each time? (E.g. A ruler used over and over always indicates the same length for an inch.)
√ The same data collection tool, the unit TB register (HMIS 096a) is used to record the data. Then data is summarized and reported on the HMIS 106a quarterly reporting form. The same tool and data collection procedures have been in place for over three years. Although the data collection method used is the same, the data is susceptible to human errors because of the length of the TB register, which makes it hard to follow the same record across the adjacent pages with the variables counted for this indicator. At one of the facilities visited, the TB registers were taken away by various health workers, leading to data not being entered on time or not entered at all. There were also issues of incomplete and inconsistent data at various health facilities visited.
2 Are data collection and analysis methods documented in writing and being used to ensure the same procedures are followed each time?
√ There is limited data analysis at the health facilities. RHITES-N Acholi provides facilities with an analysis tool to report on the treatment success rate on a quarterly basis. There are also standard operating procedures (SOPs) to guide the analysis at the facility level and they are available to all staff that need it as well as posted on the facility walls and Activity dash board. On the other hand, RHITES-N Lango did not have SOPs and there was limited guidance for data analysis and documentation at the Activity level. There is a limited section on SOPs in the AMELP, which is quite generalized and does not give guidance for data analysis and reporting for this indicator, such as how to extract data from the DHIS 2.0, summarize and compute the indicator value. TIMELINESS – Data should be available at a useful frequency, should be current, and should be
timely enough to influence management decision-making.

55
1 Are data available frequently enough to inform program management decisions?
√ Data is available for the Activities’ monthly and quarterly reviews and planning. The RHITES-N Acholi weekly review meetings provide opportunity to discuss the various indicator data including this indicator. There are also district quarterly monthly and reviews. However RHITES-N Lango was not sure of the reporting timeline for this indicator data in the PRS, whether quarterly or annual.
2 Are the data reported the most current practically available?
√ The data is included in the Activities quarterly narrative report. TB Info (DEFEAT TB database) captured data on a weekly basis and also reported in the HYBRID on a weekly basis. It is sent in a timely manner. Data for this indicator is compiled based on patients initiated on treatment a year before (12 month cohort). For instance, for data for quarter 2 (January-March 2019), the count and record is picked from data for January - March 2018. For RHITES-N Acholi, although no data was reported in the USAID PRS, data was reported in the Activity’s previous quarterly reports.
3 Are the data reported as soon as possible after collection?
√ Data for this indicator is summarized and reported on a weekly basis (every Tuesday) in the Drug Resistant TB Management Information System (DRTBMIS), monthly (every 7th of the following month) in the HMIS 105 and on a quarterly basis (by the 15th of the following month after end of quarter) in the HMIS 106a. However, Activities were not aware of the reporting timelines in the PRS. However they were reporting the indicator data in their quarterly
i Th PIRS i d b
PRECISION – Data have a sufficient level of detail to permit management decision-making; e.g. the margin of error is less than the anticipated change.
1 Is the margin of error less than the expected change being measured? (E.g. If a change of only 2 percent is expected and the margin of error in a survey used to collect the data is +/- 5 percent, then the tool is not precise enough to detect the change.)
N.A Not survey data, data for this indicator is routine services data
2 Has the margin of error been reported along with the data? (Only applicable to results obtained through
N.A Not survey data, data for this indicator is routine services data

56
3 Is the data collection method/tool being used to collect the data fine-tuned or exact enough to register the expected change? (E.g. A yardstick may not be a precise enough tool to measure a change of a few millimeters.)
√ The Unit TB register (HMIS 96a) includes details to capture and collect the required data for all the variables required for this indicator. This includes registering new TB cases at the facility at a given period of time and capturing information of patients that were cured or completed treatment. The primary data collection tool is able to measure the expected change.
INTEGRITY – Data collected should have safeguards to minimize the risk of transcription error or data manipulation.
1 Are procedures or safeguards in place to minimize data transcription errors?
√ Health workers use tallies to summarize data from the register onto the quarterly HMIS 106a reporting form. These are checked by the in-charges and Activity staff for verification, confirmation and signing off of the monthly and quarterly reports. The RHITES-N Lango internal data base, the Data Repository Reporting and Performance (DRRAP) also compares and validates the DHIS 2.0 data and is able to highlight obvious errors identified in the system. Although there are procedures in place to guide the summaries, sometimes they are not followed, especially at the health facility level. Generally, the TB registers are safely locked up and accessible to only the staff required to use them. However, in one of the health facilities visited, there were no locks to the files cabinets and the TB Unit door. The health worker reported that sometimes she had to look for the register, as she did not know who had taken it
2 Is there independence in key data
collection, management, and assessment procedures?
√ The health workers are able to enter data without any influence and there are procedures for changing data at the various levels, which is usually done through DHIS 2.0 and health facility staff.
3 Are mechanisms in place to prevent unauthorized changes to the data?
√ The electronic data in the DHIS 2.0 and the Activities’ data bases and excel sheets are password protected. The Activity staff and health workers said all changes must be communicated to the district Biostatistician and the change is notified at all levels. However, sometimes the procedures are not followed. The DQA team observed changes in the registers at two health facilities that were not acknowledged and signed off by a relevant authority.

57
SUMMARY Based on the assessment relative to the five standards, what is the overall conclusion regarding the quality of the data? There were notable data quality issues under validity, reliability and integrity standards, therefore the
data quality for this indicator is not acceptable.
Significance of limitations (if any): Activities’ PIRS indicator statement are not consistent with USAID Uganda PIRS. While the difference
seems to be a minor, it is subject to mis-interpretation, which has implications on the data count for this indicator.
Discrepancy in data counted from the register, summarized in the HMIS form 106a, and the DHIS 2.0. Incomplete information in the TB registers, missing information, changes to patients’ information without being acknowledged or signed off
RHITES-N Lango did not have SOPs to guide the extraction, summaries and computation for this indicator value
Integrity of the data compromised by the changes made to the data without documentation or signing off the changes
Actions needed to address limitations prior to the next DQA (given level of USG control over data): The two Activities should adopt the USAID Uganda PIRS, update their AMELPs, reorient the staff on the
indicator requirements and ensure data is reported in the PRS, which is available on a quarterly basis. RHITES-N Lango, should consider putting in place SOPs for computation of the indicator value that and
are shared with the relevant staff and health facilities after orienting them on the SOPs The Activity staff (TB specialist and MEL) should work with district (TB focal persons and Biostatisticians)
to emphasize and guide health workers on the procedures for recording, reviewing and compiling the TB data; as well as provide hands on mentoring for these health workers
Work the districts and health facilities to rebind and/or transfer information from old, torn pages and tattered registers (care must be taken when rewriting to avoid further mistakes)
IF NO DATA ARE AVAILABLE FOR THE INDICATOR
COMMENTS
If no recent relevant data are available for this indicator, why not?
Not applicable; data available for reporting.
What concrete actions are now being taken to collect and report these data as soon as possible?
Not applicable
When will data be reported? Not applicable
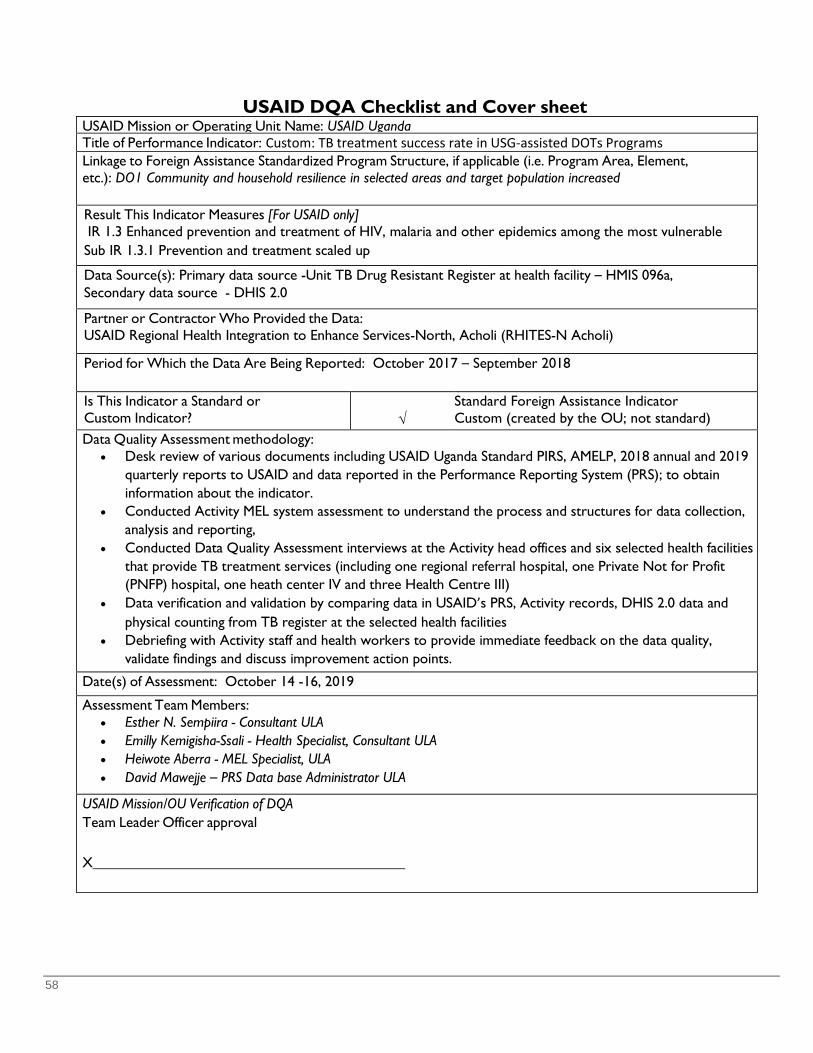
58
USAID DQA Checklist and Cover sheet USAID Mission or Operating Unit Name: USAID Uganda Title of Performance Indicator: Custom: TB treatment success rate in USG-assisted DOTs Programs Linkage to Foreign Assistance Standardized Program Structure, if applicable (i.e. Program Area, Element, etc.): DO1 Community and household resilience in selected areas and target population increased Result This Indicator Measures [For USAID only] IR 1.3 Enhanced prevention and treatment of HIV, malaria and other epidemics among the most vulnerable Sub IR 1.3.1 Prevention and treatment scaled up
Data Source(s): Primary data source -Unit TB Drug Resistant Register at health facility – HMIS 096a, Secondary data source - DHIS 2.0
Partner or Contractor Who Provided the Data: USAID Regional Health Integration to Enhance Services-North, Acholi (RHITES-N Acholi)
Period for Which the Data Are Being Reported: October 2017 – September 2018
Is This Indicator a Standard or Custom Indicator?
√
Standard Foreign Assistance Indicator Custom (created by the OU; not standard)
Data Quality Assessment methodology: • Desk review of various documents including USAID Uganda Standard PIRS, AMELP, 2018 annual and 2019
quarterly reports to USAID and data reported in the Performance Reporting System (PRS); to obtain information about the indicator.
• Conducted Activity MEL system assessment to understand the process and structures for data collection, analysis and reporting,
• Conducted Data Quality Assessment interviews at the Activity head offices and six selected health facilities that provide TB treatment services (including one regional referral hospital, one Private Not for Profit (PNFP) hospital, one heath center IV and three Health Centre III)
• Data verification and validation by comparing data in USAID’s PRS, Activity records, DHIS 2.0 data and physical counting from TB register at the selected health facilities
• Debriefing with Activity staff and health workers to provide immediate feedback on the data quality, validate findings and discuss improvement action points.
Date(s) of Assessment: October 14 -16, 2019
Assessment Team Members: • Esther N. Sempiira - Consultant ULA • Emilly Kemigisha-Ssali - Health Specialist, Consultant ULA • Heiwote Aberra - MEL Specialist, ULA • David Mawejje – PRS Data base Administrator ULA
USAID Mission/OU Verification of DQA Team Leader Officer approval
X
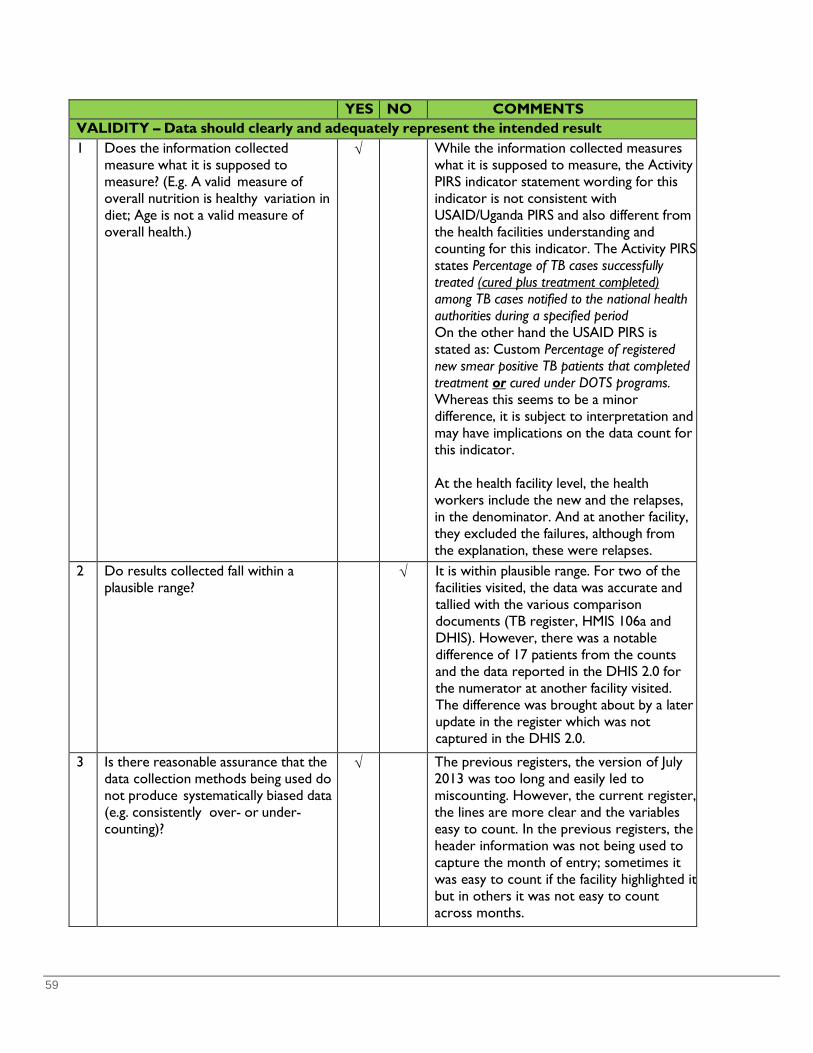
59
YES NO COMMENTS VALIDITY – Data should clearly and adequately represent the intended result 1 Does the information collected
measure what it is supposed to measure? (E.g. A valid measure of overall nutrition is healthy variation in diet; Age is not a valid measure of overall health.)
√ While the information collected measures what it is supposed to measure, the Activity PIRS indicator statement wording for this indicator is not consistent with USAID/Uganda PIRS and also different from the health facilities understanding and counting for this indicator. The Activity PIRS states Percentage of TB cases successfully treated (cured plus treatment completed) among TB cases notified to the national health authorities during a specified period On the other hand the USAID PIRS is stated as: Custom Percentage of registered new smear positive TB patients that completed treatment or cured under DOTS programs. Whereas this seems to be a minor difference, it is subject to interpretation and may have implications on the data count for this indicator. At the health facility level, the health workers include the new and the relapses, in the denominator. And at another facility, they excluded the failures, although from the explanation, these were relapses.
2 Do results collected fall within a plausible range?
√ It is within plausible range. For two of the facilities visited, the data was accurate and tallied with the various comparison documents (TB register, HMIS 106a and DHIS). However, there was a notable difference of 17 patients from the counts and the data reported in the DHIS 2.0 for the numerator at another facility visited. The difference was brought about by a later update in the register which was not captured in the DHIS 2.0.
3 Is there reasonable assurance that the data collection methods being used do not produce systematically biased data (e.g. consistently over- or under-counting)?
√ The previous registers, the version of July 2013 was too long and easily led to miscounting. However, the current register, the lines are more clear and the variables easy to count. In the previous registers, the header information was not being used to capture the month of entry; sometimes it was easy to count if the facility highlighted it but in others it was not easy to count across months.
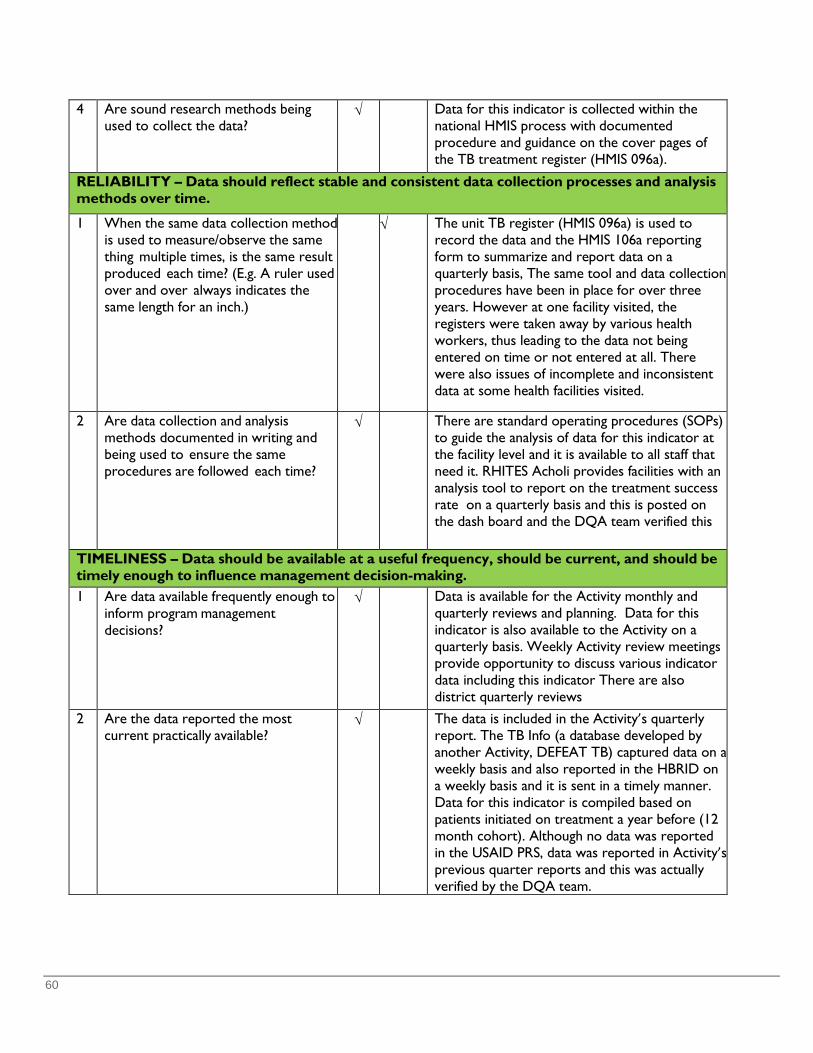
60
4 Are sound research methods being used to collect the data?
√ Data for this indicator is collected within the national HMIS process with documented procedure and guidance on the cover pages of the TB treatment register (HMIS 096a).
RELIABILITY – Data should reflect stable and consistent data collection processes and analysis methods over time.
1 When the same data collection method is used to measure/observe the same thing multiple times, is the same result produced each time? (E.g. A ruler used over and over always indicates the same length for an inch.)
√ The unit TB register (HMIS 096a) is used to record the data and the HMIS 106a reporting form to summarize and report data on a quarterly basis, The same tool and data collection procedures have been in place for over three years. However at one facility visited, the registers were taken away by various health workers, thus leading to the data not being entered on time or not entered at all. There were also issues of incomplete and inconsistent data at some health facilities visited.
2 Are data collection and analysis methods documented in writing and being used to ensure the same procedures are followed each time?
√ There are standard operating procedures (SOPs) to guide the analysis of data for this indicator at the facility level and it is available to all staff that need it. RHITES Acholi provides facilities with an analysis tool to report on the treatment success rate on a quarterly basis and this is posted on the dash board and the DQA team verified this
TIMELINESS – Data should be available at a useful frequency, should be current, and should be timely enough to influence management decision-making.
1 Are data available frequently enough to inform program management decisions?
√ Data is available for the Activity monthly and quarterly reviews and planning. Data for this indicator is also available to the Activity on a quarterly basis. Weekly Activity review meetings provide opportunity to discuss various indicator data including this indicator There are also district quarterly reviews
2 Are the data reported the most current practically available?
√ The data is included in the Activity’s quarterly report. The TB Info (a database developed by another Activity, DEFEAT TB) captured data on a weekly basis and also reported in the HBRID on a weekly basis and it is sent in a timely manner. Data for this indicator is compiled based on patients initiated on treatment a year before (12 month cohort). Although no data was reported in the USAID PRS, data was reported in Activity’s previous quarter reports and this was actually verified by the DQA team.
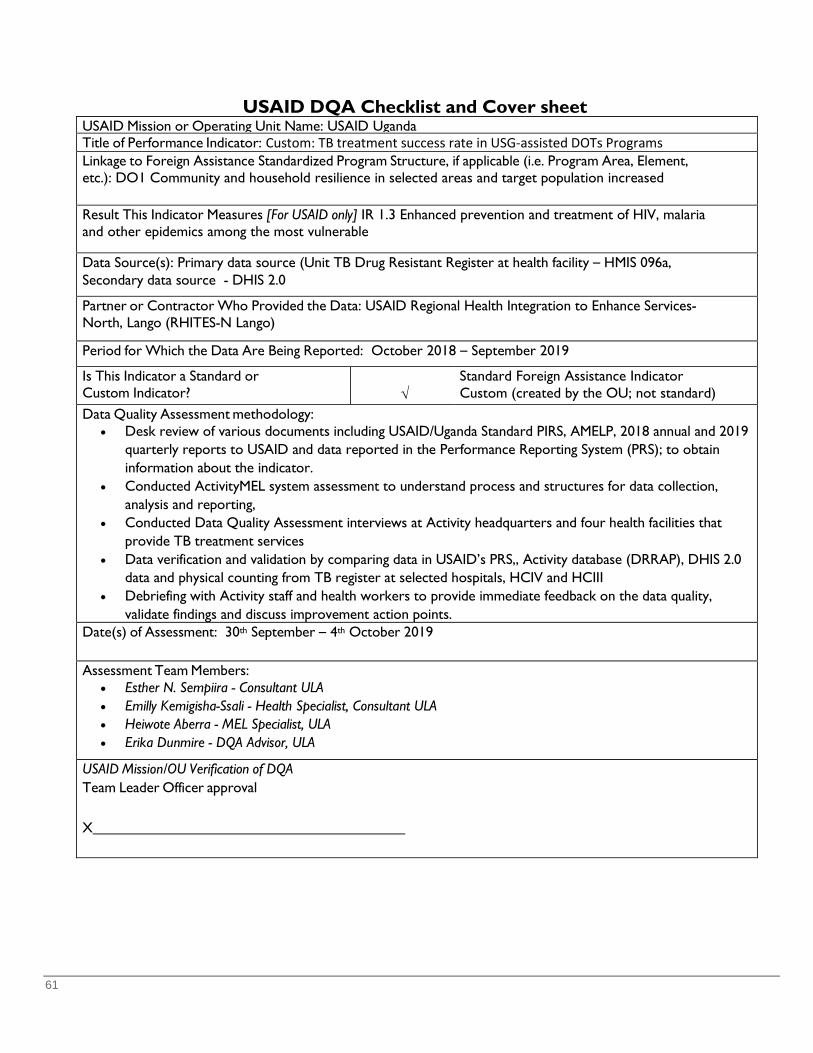
61
USAID DQA Checklist and Cover sheet USAID Mission or Operating Unit Name: USAID Uganda Title of Performance Indicator: Custom: TB treatment success rate in USG-assisted DOTs Programs Linkage to Foreign Assistance Standardized Program Structure, if applicable (i.e. Program Area, Element, etc.): DO1 Community and household resilience in selected areas and target population increased Result This Indicator Measures [For USAID only] IR 1.3 Enhanced prevention and treatment of HIV, malaria and other epidemics among the most vulnerable Data Source(s): Primary data source (Unit TB Drug Resistant Register at health facility – HMIS 096a, Secondary data source - DHIS 2.0 Partner or Contractor Who Provided the Data: USAID Regional Health Integration to Enhance Services-North, Lango (RHITES-N Lango) Period for Which the Data Are Being Reported: October 2018 – September 2019 Is This Indicator a Standard or Custom Indicator?
√
Standard Foreign Assistance Indicator Custom (created by the OU; not standard)
Data Quality Assessment methodology: • Desk review of various documents including USAID/Uganda Standard PIRS, AMELP, 2018 annual and 2019
quarterly reports to USAID and data reported in the Performance Reporting System (PRS); to obtain information about the indicator.
• Conducted ActivityMEL system assessment to understand process and structures for data collection, analysis and reporting,
• Conducted Data Quality Assessment interviews at Activity headquarters and four health facilities that provide TB treatment services
• Data verification and validation by comparing data in USAID’s PRS,, Activity database (DRRAP), DHIS 2.0 data and physical counting from TB register at selected hospitals, HCIV and HCIII
• Debriefing with Activity staff and health workers to provide immediate feedback on the data quality, validate findings and discuss improvement action points.
Date(s) of Assessment: 30th September – 4th October 2019 Assessment Team Members:
• Esther N. Sempiira - Consultant ULA • Emilly Kemigisha-Ssali - Health Specialist, Consultant ULA • Heiwote Aberra - MEL Specialist, ULA • Erika Dunmire - DQA Advisor, ULA
USAID Mission/OU Verification of DQA Team Leader Officer approval
X
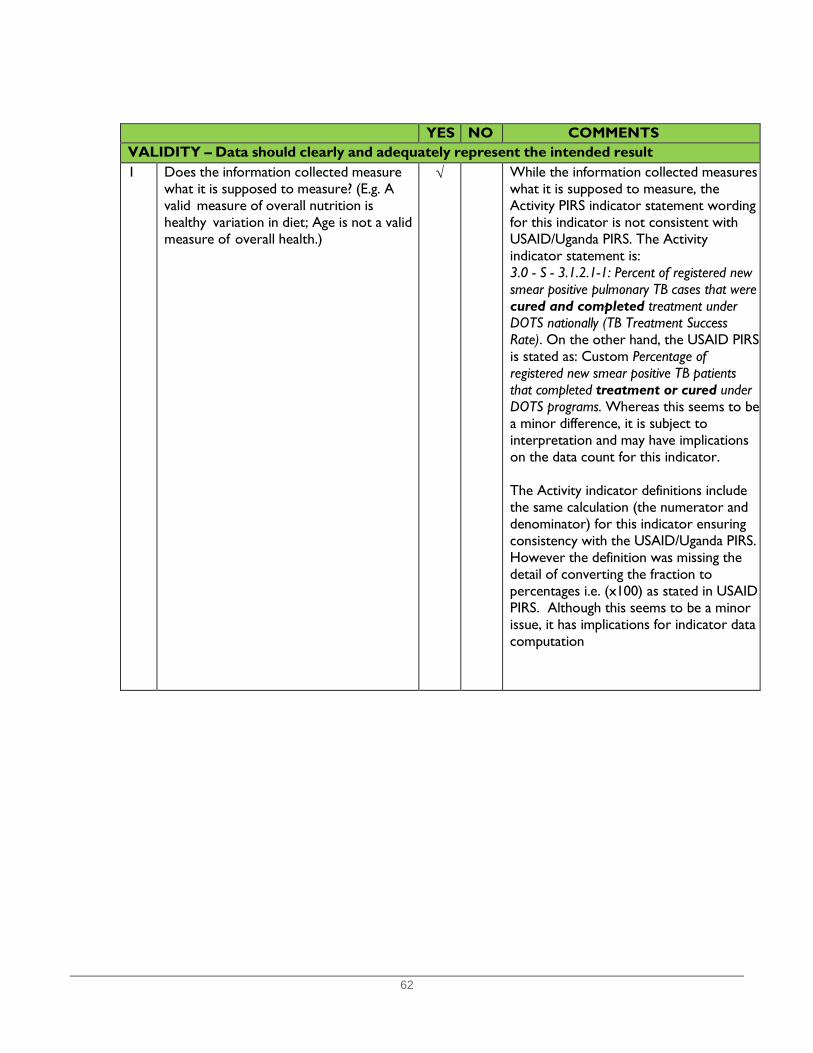
62
YES NO COMMENTS VALIDITY – Data should clearly and adequately represent the intended result 1 Does the information collected measure
what it is supposed to measure? (E.g. A valid measure of overall nutrition is healthy variation in diet; Age is not a valid measure of overall health.)
√ While the information collected measures what it is supposed to measure, the Activity PIRS indicator statement wording for this indicator is not consistent with USAID/Uganda PIRS. The Activity indicator statement is: 3.0 - S - 3.1.2.1-1: Percent of registered new smear positive pulmonary TB cases that were cured and completed treatment under DOTS nationally (TB Treatment Success Rate). On the other hand, the USAID PIRS is stated as: Custom Percentage of registered new smear positive TB patients that completed treatment or cured under DOTS programs. Whereas this seems to be a minor difference, it is subject to interpretation and may have implications on the data count for this indicator.
The Activity indicator definitions include the same calculation (the numerator and denominator) for this indicator ensuring consistency with the USAID/Uganda PIRS. However the definition was missing the detail of converting the fraction to percentages i.e. (x100) as stated in USAID PIRS. Although this seems to be a minor issue, it has implications for indicator data computation
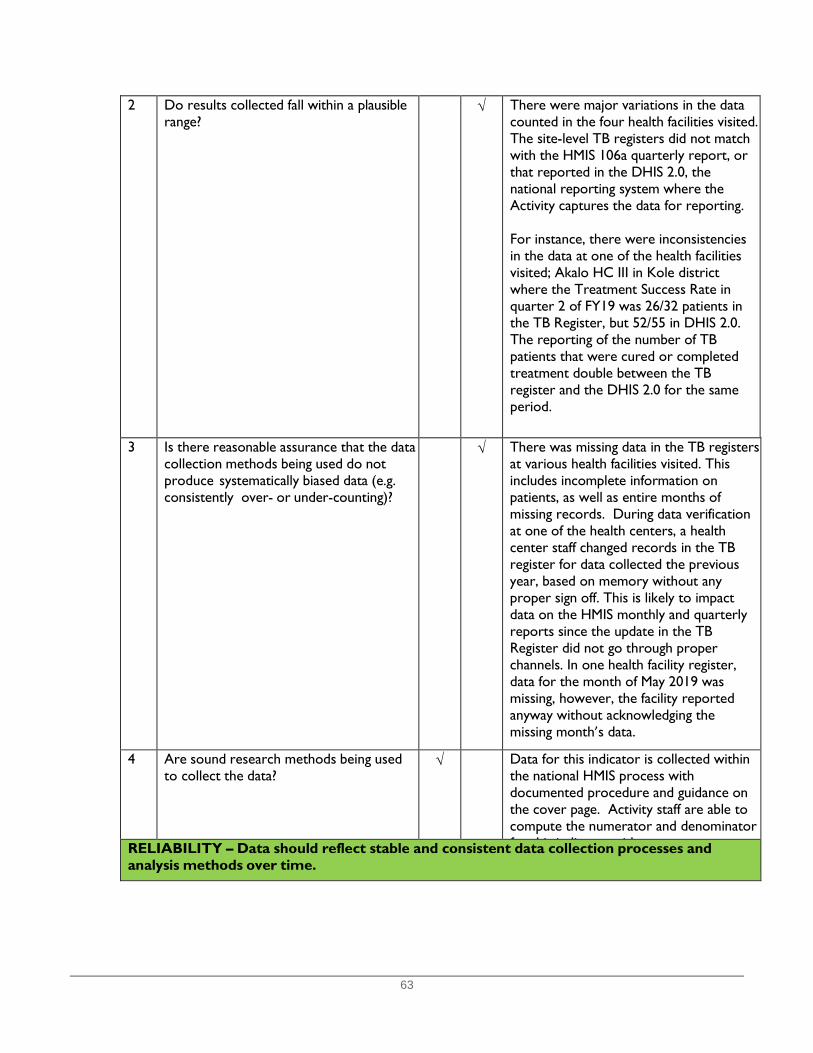
63
2 Do results collected fall within a plausible range?
√ There were major variations in the data counted in the four health facilities visited. The site-level TB registers did not match with the HMIS 106a quarterly report, or that reported in the DHIS 2.0, the national reporting system where the Activity captures the data for reporting. For instance, there were inconsistencies in the data at one of the health facilities visited; Akalo HC III in Kole district where the Treatment Success Rate in quarter 2 of FY19 was 26/32 patients in the TB Register, but 52/55 in DHIS 2.0. The reporting of the number of TB patients that were cured or completed treatment double between the TB register and the DHIS 2.0 for the same period.
3 Is there reasonable assurance that the data collection methods being used do not produce systematically biased data (e.g. consistently over- or under-counting)?
√ There was missing data in the TB registers at various health facilities visited. This includes incomplete information on patients, as well as entire months of missing records. During data verification at one of the health centers, a health center staff changed records in the TB register for data collected the previous year, based on memory without any proper sign off. This is likely to impact data on the HMIS monthly and quarterly reports since the update in the TB Register did not go through proper channels. In one health facility register, data for the month of May 2019 was missing, however, the facility reported anyway without acknowledging the missing month’s data.
4 Are sound research methods being used to collect the data?
√ Data for this indicator is collected within the national HMIS process with documented procedure and guidance on the cover page. Activity staff are able to compute the numerator and denominator f hi i di i h RELIABILITY – Data should reflect stable and consistent data collection processes and
analysis methods over time.
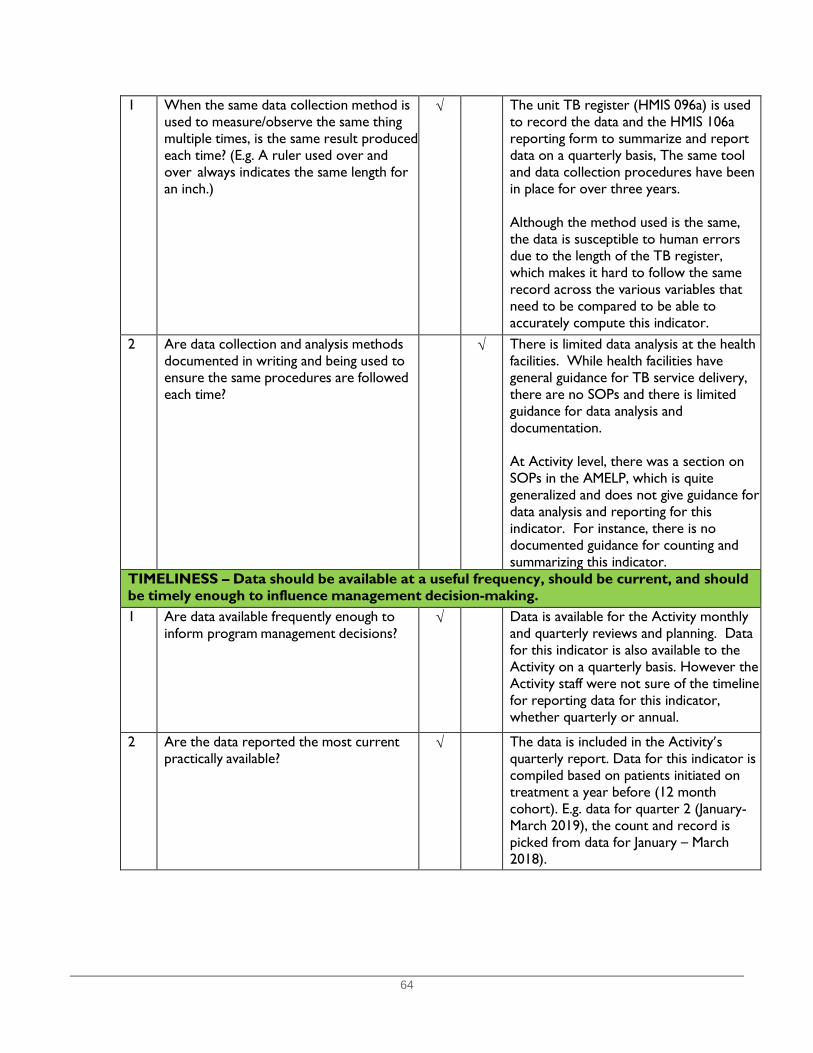
64
1 When the same data collection method is used to measure/observe the same thing multiple times, is the same result produced each time? (E.g. A ruler used over and over always indicates the same length for an inch.)
√ The unit TB register (HMIS 096a) is used to record the data and the HMIS 106a reporting form to summarize and report data on a quarterly basis, The same tool and data collection procedures have been in place for over three years. Although the method used is the same, the data is susceptible to human errors due to the length of the TB register, which makes it hard to follow the same record across the various variables that need to be compared to be able to accurately compute this indicator.
2 Are data collection and analysis methods documented in writing and being used to ensure the same procedures are followed each time?
√ There is limited data analysis at the health facilities. While health facilities have general guidance for TB service delivery, there are no SOPs and there is limited guidance for data analysis and documentation. At Activity level, there was a section on SOPs in the AMELP, which is quite generalized and does not give guidance for data analysis and reporting for this indicator. For instance, there is no documented guidance for counting and summarizing this indicator.
TIMELINESS – Data should be available at a useful frequency, should be current, and should be timely enough to influence management decision-making.
1 Are data available frequently enough to inform program management decisions?
√ Data is available for the Activity monthly and quarterly reviews and planning. Data for this indicator is also available to the Activity on a quarterly basis. However the Activity staff were not sure of the timeline for reporting data for this indicator, whether quarterly or annual.
2 Are the data reported the most current practically available?
√ The data is included in the Activity’s quarterly report. Data for this indicator is compiled based on patients initiated on treatment a year before (12 month cohort). E.g. data for quarter 2 (January-March 2019), the count and record is picked from data for January – March 2018).
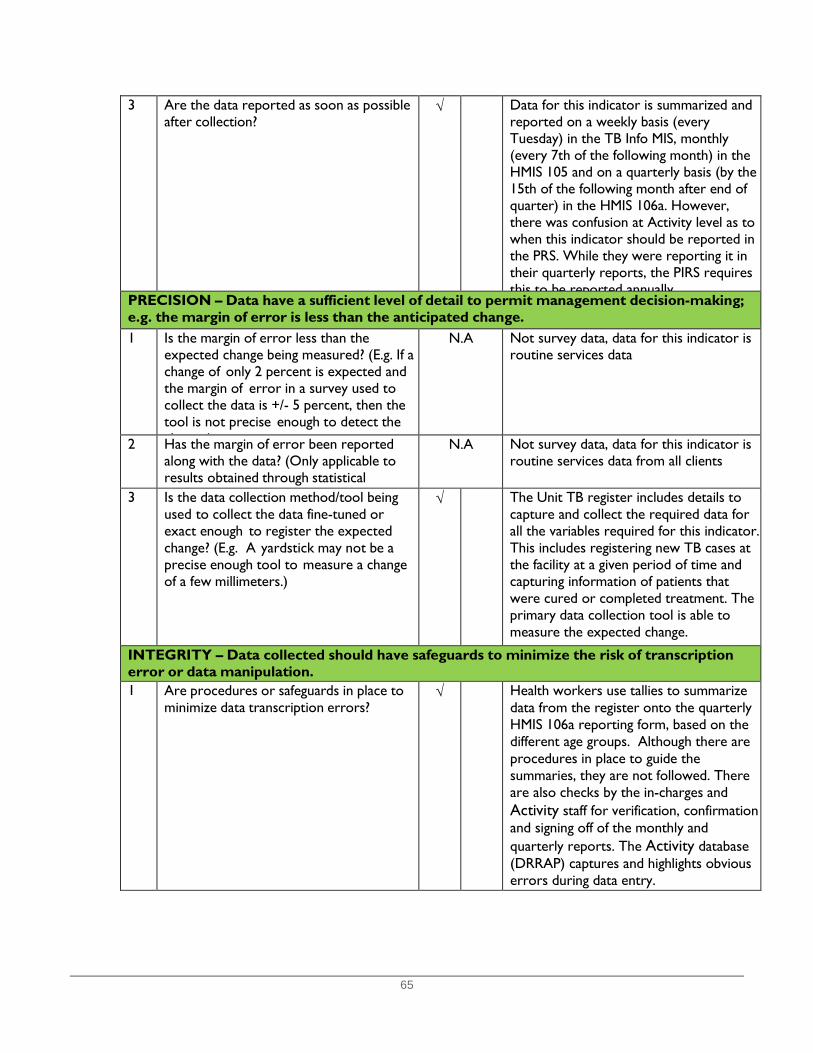
65
3 Are the data reported as soon as possible after collection?
√ Data for this indicator is summarized and reported on a weekly basis (every Tuesday) in the TB Info MIS, monthly (every 7th of the following month) in the HMIS 105 and on a quarterly basis (by the 15th of the following month after end of quarter) in the HMIS 106a. However, there was confusion at Activity level as to when this indicator should be reported in the PRS. While they were reporting it in their quarterly reports, the PIRS requires this to be reported annually
PRECISION – Data have a sufficient level of detail to permit management decision-making; e.g. the margin of error is less than the anticipated change.
1 Is the margin of error less than the expected change being measured? (E.g. If a change of only 2 percent is expected and the margin of error in a survey used to collect the data is +/- 5 percent, then the tool is not precise enough to detect the h )
N.A Not survey data, data for this indicator is routine services data
2 Has the margin of error been reported along with the data? (Only applicable to results obtained through statistical
N.A Not survey data, data for this indicator is routine services data from all clients
3 Is the data collection method/tool being used to collect the data fine-tuned or exact enough to register the expected change? (E.g. A yardstick may not be a precise enough tool to measure a change of a few millimeters.)
√ The Unit TB register includes details to capture and collect the required data for all the variables required for this indicator. This includes registering new TB cases at the facility at a given period of time and capturing information of patients that were cured or completed treatment. The primary data collection tool is able to measure the expected change.
INTEGRITY – Data collected should have safeguards to minimize the risk of transcription error or data manipulation.
1 Are procedures or safeguards in place to minimize data transcription errors?
√ Health workers use tallies to summarize data from the register onto the quarterly HMIS 106a reporting form, based on the different age groups. Although there are procedures in place to guide the summaries, they are not followed. There are also checks by the in-charges and Activity staff for verification, confirmation and signing off of the monthly and quarterly reports. The Activity database (DRRAP) captures and highlights obvious errors during data entry.
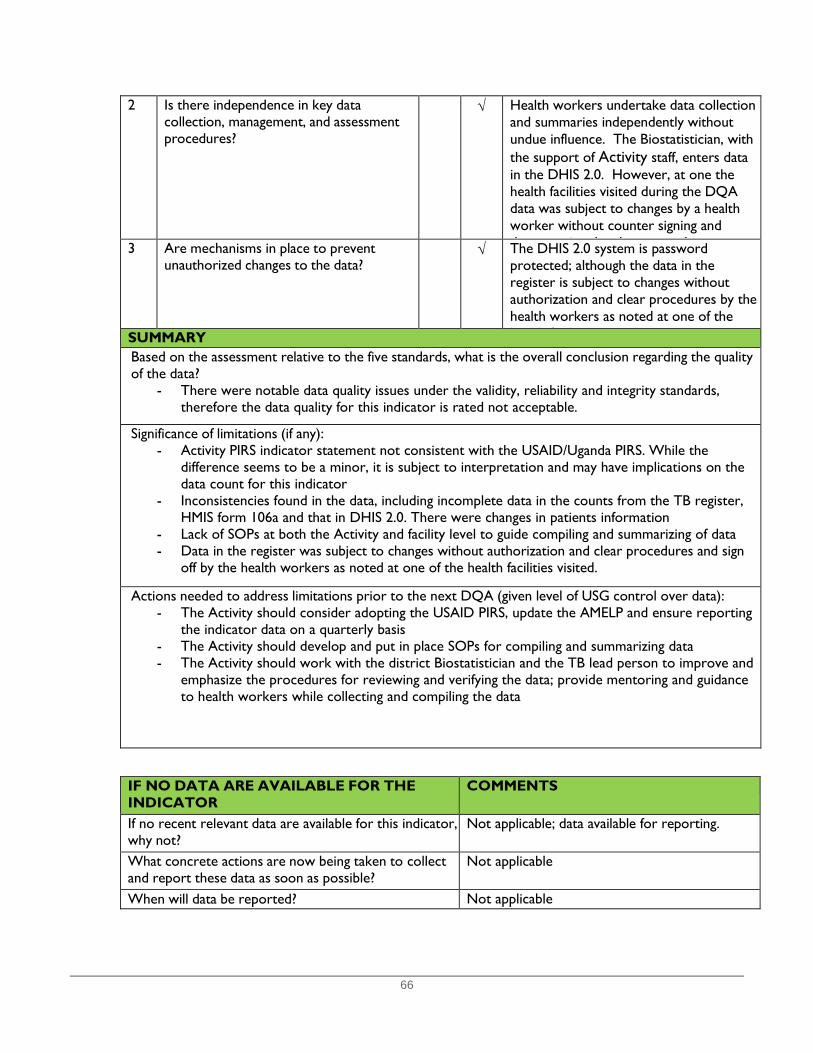
66
2 Is there independence in key data collection, management, and assessment procedures?
√ Health workers undertake data collection and summaries independently without undue influence. The Biostatistician, with the support of Activity staff, enters data in the DHIS 2.0. However, at one the health facilities visited during the DQA data was subject to changes by a health worker without counter signing and d i h h d 3 Are mechanisms in place to prevent
unauthorized changes to the data? √ The DHIS 2.0 system is password
protected; although the data in the register is subject to changes without authorization and clear procedures by the health workers as noted at one of the h l h f l d SUMMARY
Based on the assessment relative to the five standards, what is the overall conclusion regarding the quality of the data?
- There were notable data quality issues under the validity, reliability and integrity standards, therefore the data quality for this indicator is rated not acceptable.
Significance of limitations (if any):
- Activity PIRS indicator statement not consistent with the USAID/Uganda PIRS. While the difference seems to be a minor, it is subject to interpretation and may have implications on the data count for this indicator
- Inconsistencies found in the data, including incomplete data in the counts from the TB register, HMIS form 106a and that in DHIS 2.0. There were changes in patients information
- Lack of SOPs at both the Activity and facility level to guide compiling and summarizing of data - Data in the register was subject to changes without authorization and clear procedures and sign
off by the health workers as noted at one of the health facilities visited.
Actions needed to address limitations prior to the next DQA (given level of USG control over data): - The Activity should consider adopting the USAID PIRS, update the AMELP and ensure reporting
the indicator data on a quarterly basis - The Activity should develop and put in place SOPs for compiling and summarizing data - The Activity should work with the district Biostatistician and the TB lead person to improve and
emphasize the procedures for reviewing and verifying the data; provide mentoring and guidance to health workers while collecting and compiling the data
IF NO DATA ARE AVAILABLE FOR THE INDICATOR
COMMENTS
If no recent relevant data are available for this indicator, why not?
Not applicable; data available for reporting.
What concrete actions are now being taken to collect and report these data as soon as possible?
Not applicable
When will data be reported? Not applicable

67
Annex 3: Monitoring, Evaluation and Learning Assessment Tool
Prepare a new data sheet for each Activity/Implementing Partner (IP/ Implementing Mechanism (IM) or Sub-partner Date: Activity/IP Sub-Partner: Assessment team members:
IP/IM Staff participating in the MEL Assessment Name Title Contact Signature
68
Instructions: INTRODUCTION: The purpose of this tool is to enable USAID Contract Officer's Representatives (COR)/Agreement Officer's Representatives (AOR), Monitoring, Evaluation and Learning (MEL) Contractors and Activities/Implementing Mechanisms (IMs) to assess the MEL system of a specific Activities/IMs in order to ensure quality data is produced for program improvement. A: STEPS IN THE ASSESSMENT: A. PLANNING: The Activity/IM should be informed of the impending assessment in advance and requested to avail the relevant management and MEL staff as well as relevant documentation on the assessment day. Adequate copies of the tools and logistics should be prepared. B: COMPLETING THE TOOL: 1) In conducting the exercise start by visiting the Activity/IM's Headquarters and/or Regional Offices then together with the Activity/IM staff, visit their sub-partner(s) offices. For each entity visited, complete the Systems Assessments tool for that level: Activity/IM or Sub-partner. Use the options provided to indicate the numeric value of your response for each question. Put your answer in the spaces provided for the responses. 2) Please fill one tool per Activity/IM or Sub-partner. 3) An appreciative inquiry and supportive supervision approach should be applied throughout the process. After introducing the purpose of the visit to the staff at the Activity/IM’s offices or sub-partner's offices, the assessment team should discuss with the relevant staff the status of each standard, agree on the score and complete the assessment tool appropriately. The emphasis should be on direct observation of processes and existing infrastructure, and review of required documents - in relation to the application of standards. 4) Summarise your findings for each entity in the corresponding 'Summary of Findings' sheet and document the best practices and action points in the corresponding 'Recommendations' sheet. Copy the summarized findings and recommendations onto hard copies of the tools and leave a copy with the Activity/IM and/or sub-partner. If possible, send a soft copy of the completed tool to relevant staff after each level assessed. C. FEEDBACK, DOCUMENTATION & FOLLOW UP ON FINDINGS: Verbal feedback should be given to the staff at the site or MEL unit individually during the assessment and as a group before the assessment team departs. A report using the provided template should be completed and a copy left at the site and also with the Activity MEL management team. The report summarizes the findings in terms of strengths and weaknesses of the MEL system and documents an action list for addressing the gaps. Using the action list, all MEL staff should conduct follow up visits to assess implementation of the suggested solutions to identified gaps. Concurrently, the USAID Activity managers and Activity/IP should also follow up to ensure solutions are implemented and any learning from the assessments are incorporated into program improvement.
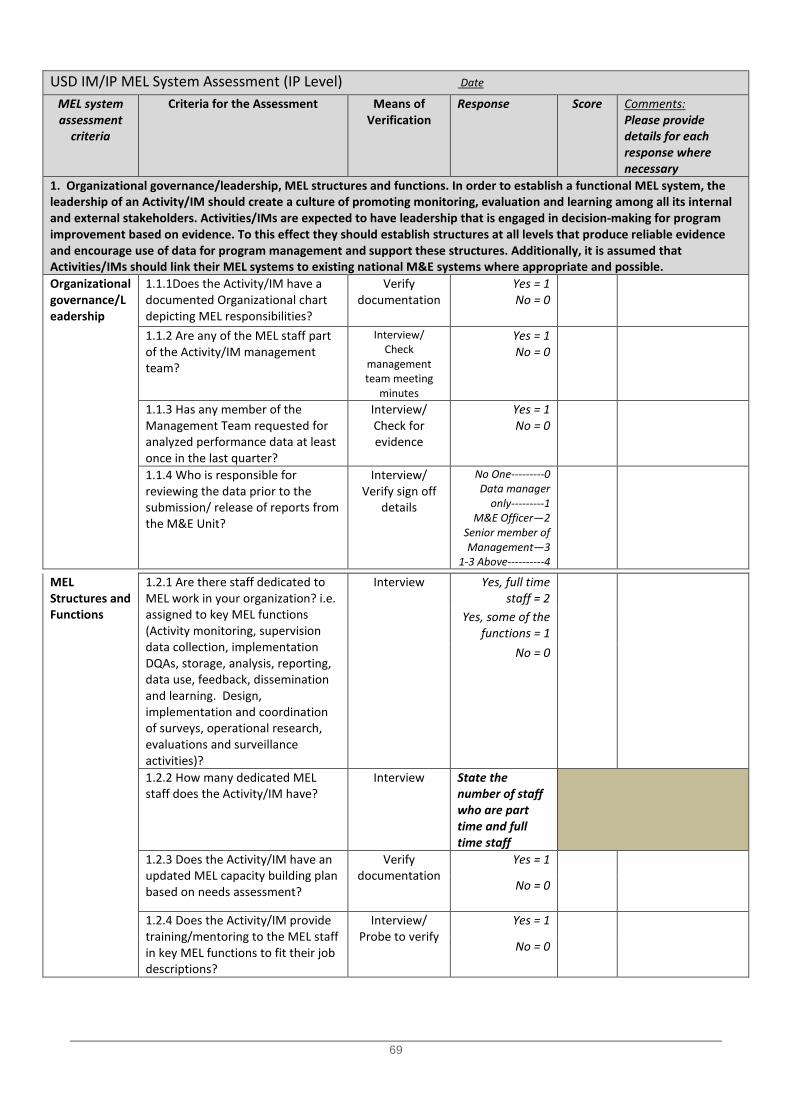
69
USD IM/IP MEL System Assessment (IP Level) Date
MEL system assessment
criteria
Criteria for the Assessment Means of Verification
Response Score Comments: Please provide details for each response where necessary
1. Organizational governance/leadership, MEL structures and functions. In order to establish a functional MEL system, the leadership of an Activity/IM should create a culture of promoting monitoring, evaluation and learning among all its internal and external stakeholders. Activities/IMs are expected to have leadership that is engaged in decision-making for program improvement based on evidence. To this effect they should establish structures at all levels that produce reliable evidence and encourage use of data for program management and support these structures. Additionally, it is assumed that Activities/IMs should link their MEL systems to existing national M&E systems where appropriate and possible. Organizational governance/Leadership
1.1.1Does the Activity/IM have a documented Organizational chart depicting MEL responsibilities?
Verify documentation
Yes = 1 No = 0
1.1.2 Are any of the MEL staff part of the Activity/IM management team?
Interview/ Check
management team meeting
minutes
Yes = 1 No = 0
1.1.3 Has any member of the Management Team requested for analyzed performance data at least once in the last quarter?
Interview/ Check for evidence
Yes = 1 No = 0
1.1.4 Who is responsible for reviewing the data prior to the submission/ release of reports from the M&E Unit?
Interview/ Verify sign off
details
No One---------0 Data manager
only---------1 M&E Officer—2
Senior member of Management—3
1-3 Above----------4
MEL Structures and Functions
1.2.1 Are there staff dedicated to MEL work in your organization? i.e. assigned to key MEL functions (Activity monitoring, supervision data collection, implementation DQAs, storage, analysis, reporting, data use, feedback, dissemination and learning. Design, implementation and coordination of surveys, operational research, evaluations and surveillance activities)?
Interview Yes, full time staff = 2
Yes, some of the functions = 1
No = 0
1.2.2 How many dedicated MEL staff does the Activity/IM have?
Interview State the number of staff who are part time and full time staff
1.2.3 Does the Activity/IM have an updated MEL capacity building plan based on needs assessment?
Verify documentation
Yes = 1
No = 0
1.2.4 Does the Activity/IM provide training/mentoring to the MEL staff in key MEL functions to fit their job descriptions?
Interview/ Probe to verify
Yes = 1
No = 0

70
1.2.5 Have all MEL staff been trained in the appropriate MEL functions?
Interview/ Probe to verify
Yes = 1
No = 0
Partially = 0.5 1.2.6 Do the MEL staff have sufficient skills to perform data management, data analysis, and interpretation for program use and learning? (self-reported sufficiency)
Interview/ Probe to verify
Yes = 1
No = 0
Partially = 0.5
1.2.7 Is there evidence of data analysis and use by the Activity/IM - Are there observable analytical products e.g. reports website content, maps, charts among others available at the Activity/IM MEL unit?
Verify documentation
Yes = 1
No = 0
1.2.8 Does the Activity/IM have sufficient IT infrastructure to carry out data management, data analysis, and interpretation? (Database and computers for key MEL staff)
Verify documentation
Yes = 1
No = 0
Link with National M&E systems
1.3.1 Does the Activity/IM have linkages with the National M&E system i.e.: Does the Activity/IM: - receive data from the National M&E system OR - provide technical or financial support at the national/subnational level OR - collaborate technically or financially with the national M&E system at national or sub-national level (If the Activity/IM does not have linkages RECORD "No" and SKIP to Question 2.1)
Interview Yes = 1 No = 0
1.3.2 Has any of the Activity/IM staff been trained/oriented on the use of the required National system?
Interview Yes = 1
No = 0
1.3.3 Is there a point of contact at the district or national level that the Activity/IM regularly liaises with on data related issues?
Interview/ Verify who is
point of contact
Yes = 1
No = 0
Score Organizational governance/ leadership, MEL structures and functions
Rating Organizational
Adequate: Score = 14-18
Acceptable Score: Score = 10-13
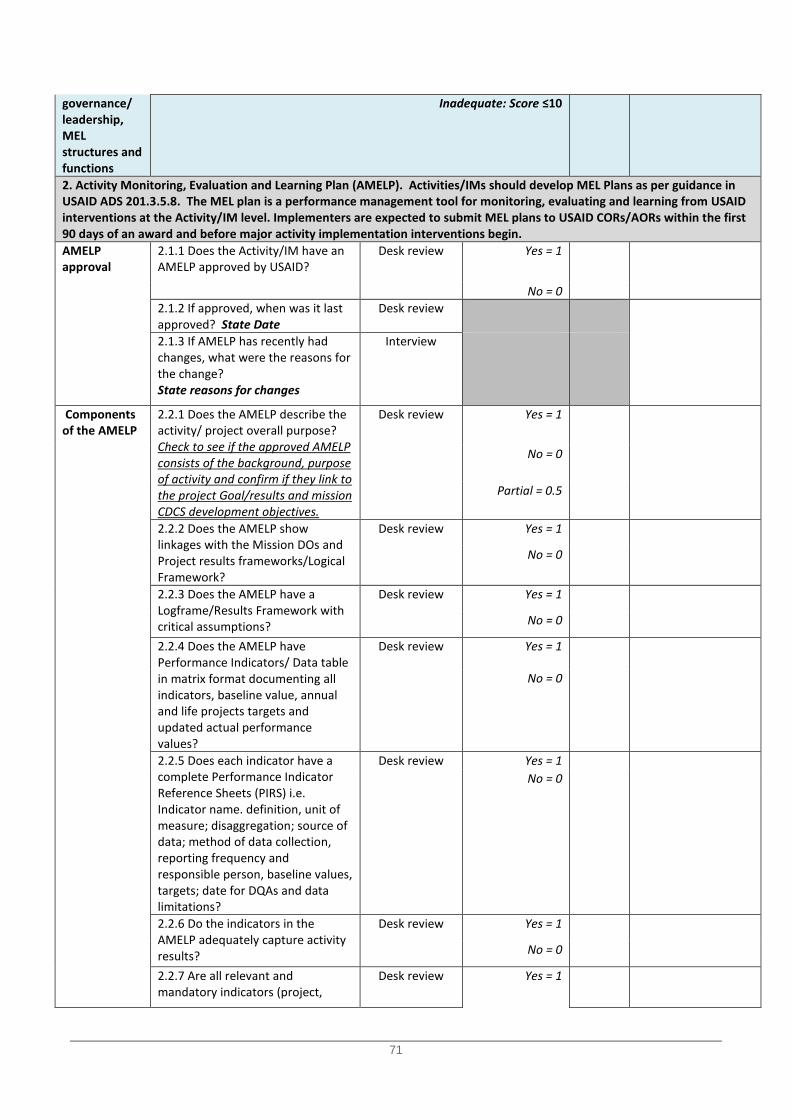
71
governance/ leadership, MEL structures and functions
Inadequate: Score ≤10
2. Activity Monitoring, Evaluation and Learning Plan (AMELP). Activities/IMs should develop MEL Plans as per guidance in USAID ADS 201.3.5.8. The MEL plan is a performance management tool for monitoring, evaluating and learning from USAID interventions at the Activity/IM level. Implementers are expected to submit MEL plans to USAID CORs/AORs within the first 90 days of an award and before major activity implementation interventions begin. AMELP approval
2.1.1 Does the Activity/IM have an AMELP approved by USAID?
Desk review Yes = 1
No = 0 2.1.2 If approved, when was it last approved? State Date
Desk review
2.1.3 If AMELP has recently had changes, what were the reasons for the change? State reasons for changes
Interview
Components of the AMELP
2.2.1 Does the AMELP describe the activity/ project overall purpose? Check to see if the approved AMELP consists of the background, purpose of activity and confirm if they link to the project Goal/results and mission CDCS development objectives.
Desk review Yes = 1
No = 0
Partial = 0.5
2.2.2 Does the AMELP show linkages with the Mission DOs and Project results frameworks/Logical Framework?
Desk review Yes = 1
No = 0
2.2.3 Does the AMELP have a Logframe/Results Framework with critical assumptions?
Desk review Yes = 1
No = 0
2.2.4 Does the AMELP have Performance Indicators/ Data table in matrix format documenting all indicators, baseline value, annual and life projects targets and updated actual performance values?
Desk review Yes = 1
No = 0
2.2.5 Does each indicator have a complete Performance Indicator Reference Sheets (PIRS) i.e. Indicator name. definition, unit of measure; disaggregation; source of data; method of data collection, reporting frequency and responsible person, baseline values, targets; date for DQAs and data limitations?
Desk review Yes = 1
No = 0
2.2.6 Do the indicators in the AMELP adequately capture activity results?
Desk review Yes = 1
No = 0
2.2.7 Are all relevant and mandatory indicators (project,
Desk review Yes = 1
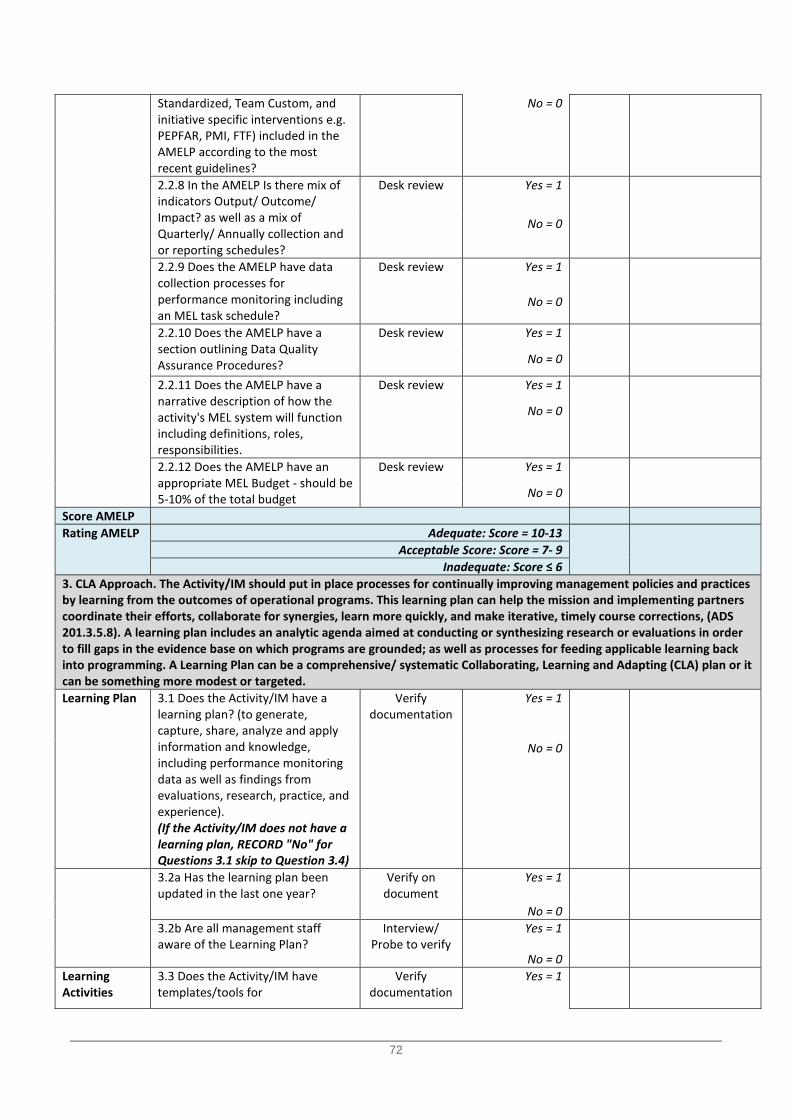
72
Standardized, Team Custom, and initiative specific interventions e.g. PEPFAR, PMI, FTF) included in the AMELP according to the most recent guidelines?
No = 0
2.2.8 In the AMELP Is there mix of indicators Output/ Outcome/ Impact? as well as a mix of Quarterly/ Annually collection and or reporting schedules?
Desk review Yes = 1
No = 0
2.2.9 Does the AMELP have data collection processes for performance monitoring including an MEL task schedule?
Desk review Yes = 1
No = 0
2.2.10 Does the AMELP have a section outlining Data Quality Assurance Procedures?
Desk review Yes = 1
No = 0
2.2.11 Does the AMELP have a narrative description of how the activity's MEL system will function including definitions, roles, responsibilities.
Desk review Yes = 1
No = 0
2.2.12 Does the AMELP have an appropriate MEL Budget - should be 5-10% of the total budget
Desk review Yes = 1
No = 0
Score AMELP Rating AMELP Adequate: Score = 10-13
Acceptable Score: Score = 7- 9 Inadequate: Score ≤ 6
3. CLA Approach. The Activity/IM should put in place processes for continually improving management policies and practices by learning from the outcomes of operational programs. This learning plan can help the mission and implementing partners coordinate their efforts, collaborate for synergies, learn more quickly, and make iterative, timely course corrections, (ADS 201.3.5.8). A learning plan includes an analytic agenda aimed at conducting or synthesizing research or evaluations in order to fill gaps in the evidence base on which programs are grounded; as well as processes for feeding applicable learning back into programming. A Learning Plan can be a comprehensive/ systematic Collaborating, Learning and Adapting (CLA) plan or it can be something more modest or targeted. Learning Plan 3.1 Does the Activity/IM have a
learning plan? (to generate, capture, share, analyze and apply information and knowledge, including performance monitoring data as well as findings from evaluations, research, practice, and experience). (If the Activity/IM does not have a learning plan, RECORD "No" for Questions 3.1 skip to Question 3.4)
Verify documentation
Yes = 1
No = 0
3.2a Has the learning plan been updated in the last one year?
Verify on document
Yes = 1
No = 0 3.2b Are all management staff
aware of the Learning Plan? Interview/
Probe to verify Yes = 1
No = 0 Learning Activities
3.3 Does the Activity/IM have templates/tools for
Verify documentation
Yes = 1
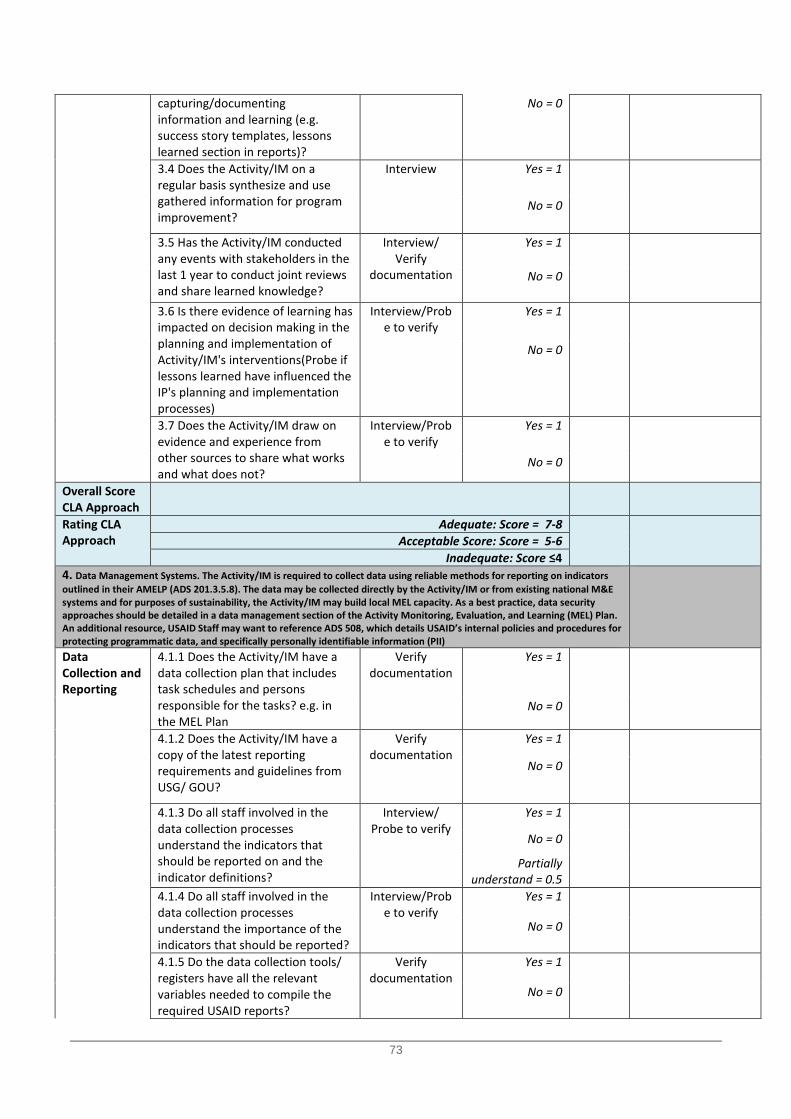
73
capturing/documenting information and learning (e.g. success story templates, lessons learned section in reports)?
No = 0
3.4 Does the Activity/IM on a regular basis synthesize and use gathered information for program improvement?
Interview Yes = 1
No = 0
3.5 Has the Activity/IM conducted any events with stakeholders in the last 1 year to conduct joint reviews and share learned knowledge?
Interview/ Verify
documentation
Yes = 1
No = 0
3.6 Is there evidence of learning has impacted on decision making in the planning and implementation of Activity/IM's interventions(Probe if lessons learned have influenced the IP's planning and implementation processes)
Interview/Probe to verify
Yes = 1
No = 0
3.7 Does the Activity/IM draw on evidence and experience from other sources to share what works and what does not?
Interview/Probe to verify
Yes = 1
No = 0
Overall Score CLA Approach
Rating CLA Approach
Adequate: Score = 7-8
Acceptable Score: Score = 5-6
Inadequate: Score ≤4 4. Data Management Systems. The Activity/IM is required to collect data using reliable methods for reporting on indicators outlined in their AMELP (ADS 201.3.5.8). The data may be collected directly by the Activity/IM or from existing national M&E systems and for purposes of sustainability, the Activity/IM may build local MEL capacity. As a best practice, data security approaches should be detailed in a data management section of the Activity Monitoring, Evaluation, and Learning (MEL) Plan. An additional resource, USAID Staff may want to reference ADS 508, which details USAID’s internal policies and procedures for protecting programmatic data, and specifically personally identifiable information (PII)
Data Collection and Reporting
4.1.1 Does the Activity/IM have a data collection plan that includes task schedules and persons responsible for the tasks? e.g. in the MEL Plan
Verify documentation
Yes = 1
No = 0
4.1.2 Does the Activity/IM have a copy of the latest reporting requirements and guidelines from USG/ GOU?
Verify documentation
Yes = 1
No = 0
4.1.3 Do all staff involved in the data collection processes understand the indicators that should be reported on and the indicator definitions?
Interview/ Probe to verify
Yes = 1
No = 0
Partially understand = 0.5
4.1.4 Do all staff involved in the data collection processes understand the importance of the indicators that should be reported?
Interview/Probe to verify
Yes = 1
No = 0
4.1.5 Do the data collection tools/ registers have all the relevant variables needed to compile the required USAID reports?
Verify documentation
Yes = 1
No = 0
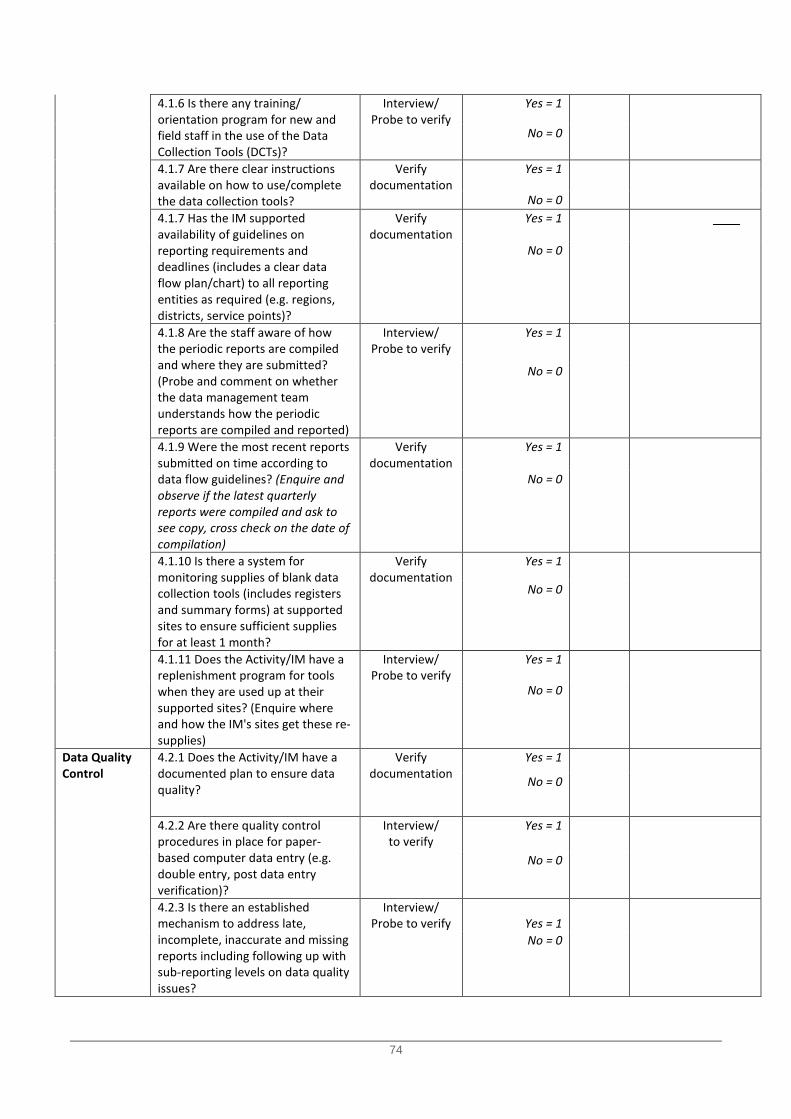
74
4.1.6 Is there any training/ orientation program for new and field staff in the use of the Data Collection Tools (DCTs)?
Interview/ Probe to verify
Yes = 1
No = 0
4.1.7 Are there clear instructions available on how to use/complete the data collection tools?
Verify documentation
Yes = 1
No = 0 4.1.7 Has the IM supported
availability of guidelines on reporting requirements and deadlines (includes a clear data flow plan/chart) to all reporting entities as required (e.g. regions, districts, service points)?
Verify documentation
Yes = 1
No = 0
4.1.8 Are the staff aware of how the periodic reports are compiled and where they are submitted? (Probe and comment on whether the data management team understands how the periodic reports are compiled and reported)
Interview/ Probe to verify
Yes = 1
No = 0
4.1.9 Were the most recent reports submitted on time according to data flow guidelines? (Enquire and observe if the latest quarterly reports were compiled and ask to see copy, cross check on the date of compilation)
Verify documentation
Yes = 1
No = 0
4.1.10 Is there a system for monitoring supplies of blank data collection tools (includes registers and summary forms) at supported sites to ensure sufficient supplies for at least 1 month?
Verify documentation
Yes = 1
No = 0
4.1.11 Does the Activity/IM have a replenishment program for tools when they are used up at their supported sites? (Enquire where and how the IM's sites get these re-supplies)
Interview/ Probe to verify
Yes = 1
No = 0
Data Quality Control
4.2.1 Does the Activity/IM have a documented plan to ensure data quality?
Verify documentation
Yes = 1
No = 0
4.2.2 Are there quality control procedures in place for paper-based computer data entry (e.g. double entry, post data entry verification)?
Interview/ to verify
Yes = 1
No = 0
4.2.3 Is there an established mechanism to address late, incomplete, inaccurate and missing reports including following up with sub-reporting levels on data quality issues?
Interview/ Probe to verify
Yes = 1
No = 0
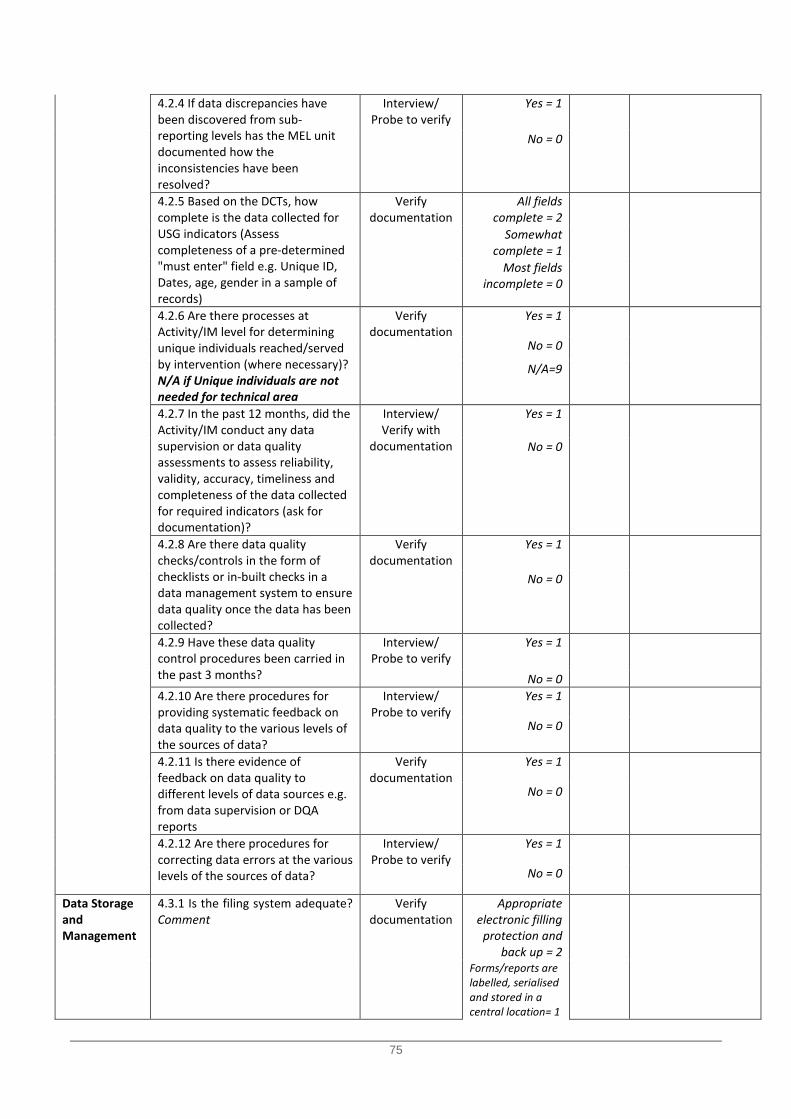
75
4.2.4 If data discrepancies have been discovered from sub-reporting levels has the MEL unit documented how the inconsistencies have been resolved?
Interview/ Probe to verify
Yes = 1
No = 0
4.2.5 Based on the DCTs, how complete is the data collected for USG indicators (Assess completeness of a pre-determined "must enter" field e.g. Unique ID, Dates, age, gender in a sample of records)
Verify documentation
All fields complete = 2
Somewhat complete = 1
Most fields incomplete = 0
4.2.6 Are there processes at Activity/IM level for determining unique individuals reached/served by intervention (where necessary)? N/A if Unique individuals are not needed for technical area
Verify documentation
Yes = 1
No = 0
N/A=9
4.2.7 In the past 12 months, did the Activity/IM conduct any data supervision or data quality assessments to assess reliability, validity, accuracy, timeliness and completeness of the data collected for required indicators (ask for documentation)?
Interview/ Verify with
documentation
Yes = 1
No = 0
4.2.8 Are there data quality checks/controls in the form of checklists or in-built checks in a data management system to ensure data quality once the data has been collected?
Verify documentation
Yes = 1
No = 0
4.2.9 Have these data quality control procedures been carried in the past 3 months?
Interview/ Probe to verify
Yes = 1
No = 0 4.2.10 Are there procedures for providing systematic feedback on data quality to the various levels of the sources of data?
Interview/ Probe to verify
Yes = 1
No = 0
4.2.11 Is there evidence of feedback on data quality to different levels of data sources e.g. from data supervision or DQA reports
Verify documentation
Yes = 1
No = 0
4.2.12 Are there procedures for correcting data errors at the various levels of the sources of data?
Interview/ Probe to verify
Yes = 1
No = 0
Data Storage and Management
4.3.1 Is the filing system adequate? Comment
Verify documentation
Appropriate electronic filling
protection and back up = 2
Forms/reports are labelled, serialised and stored in a central location= 1
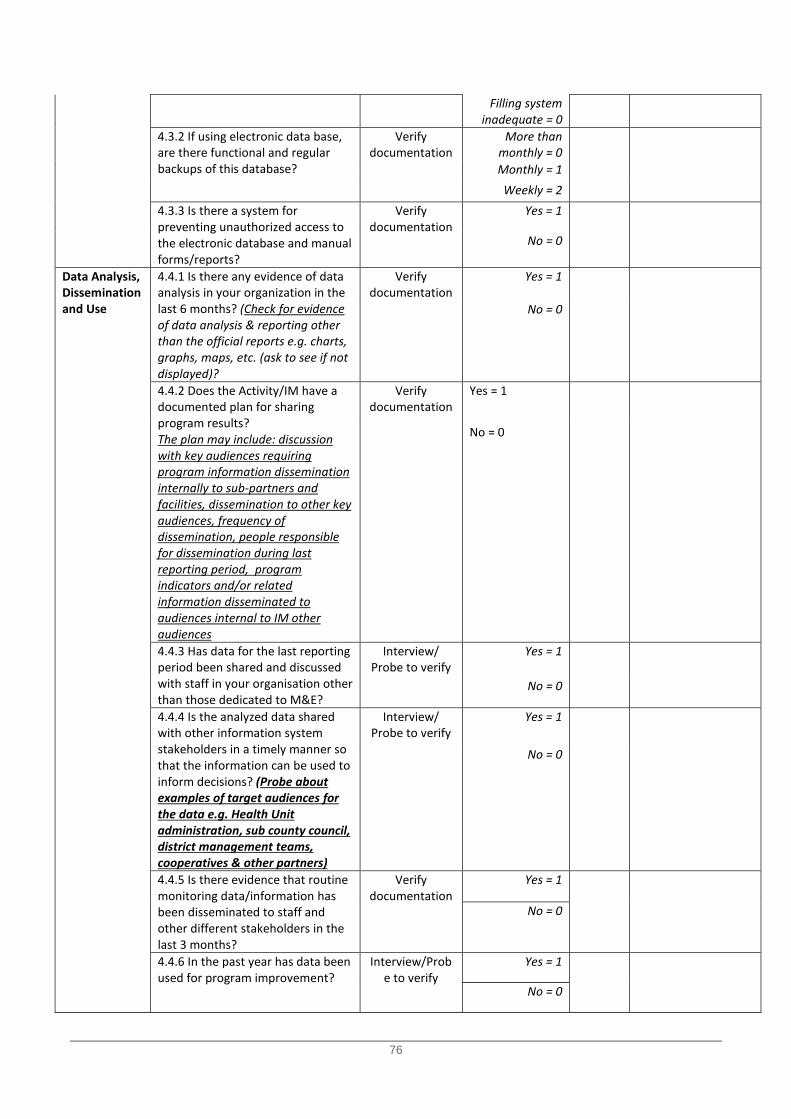
76
Filling system inadequate = 0
4.3.2 If using electronic data base, are there functional and regular backups of this database?
Verify documentation
More than monthly = 0
Monthly = 1 Weekly = 2
4.3.3 Is there a system for preventing unauthorized access to the electronic database and manual forms/reports?
Verify documentation
Yes = 1
No = 0
Data Analysis, Dissemination and Use
4.4.1 Is there any evidence of data analysis in your organization in the last 6 months? (Check for evidence of data analysis & reporting other than the official reports e.g. charts, graphs, maps, etc. (ask to see if not displayed)?
Verify documentation
Yes = 1
No = 0
4.4.2 Does the Activity/IM have a documented plan for sharing program results? The plan may include: discussion with key audiences requiring program information dissemination internally to sub-partners and facilities, dissemination to other key audiences, frequency of dissemination, people responsible for dissemination during last reporting period, program indicators and/or related information disseminated to audiences internal to IM other audiences
Verify documentation
Yes = 1
No = 0
4.4.3 Has data for the last reporting period been shared and discussed with staff in your organisation other than those dedicated to M&E?
Interview/ Probe to verify
Yes = 1
No = 0
4.4.4 Is the analyzed data shared with other information system stakeholders in a timely manner so that the information can be used to inform decisions? (Probe about examples of target audiences for the data e.g. Health Unit administration, sub county council, district management teams, cooperatives & other partners)
Interview/ Probe to verify
Yes = 1
No = 0
4.4.5 Is there evidence that routine monitoring data/information has been disseminated to staff and other different stakeholders in the last 3 months?
Verify documentation
Yes = 1
No = 0
4.4.6 In the past year has data been used for program improvement?
Interview/Probe to verify
Yes = 1
No = 0
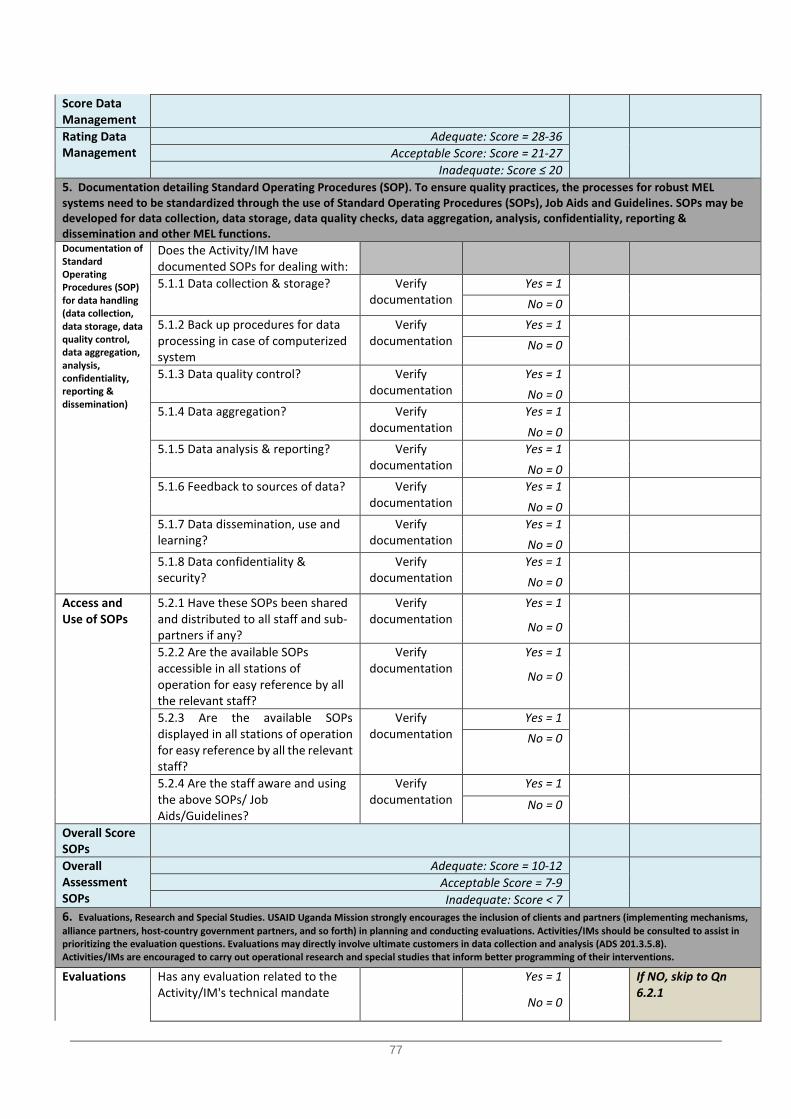
77
Score Data Management
Rating Data Management
Adequate: Score = 28-36
Acceptable Score: Score = 21-27
Inadequate: Score ≤ 20 5. Documentation detailing Standard Operating Procedures (SOP). To ensure quality practices, the processes for robust MEL systems need to be standardized through the use of Standard Operating Procedures (SOPs), Job Aids and Guidelines. SOPs may be developed for data collection, data storage, data quality checks, data aggregation, analysis, confidentiality, reporting & dissemination and other MEL functions. Documentation of Standard Operating Procedures (SOP) for data handling (data collection, data storage, data quality control, data aggregation, analysis, confidentiality, reporting & dissemination)
Does the Activity/IM have documented SOPs for dealing with:
5.1.1 Data collection & storage? Verify documentation
Yes = 1
No = 0
5.1.2 Back up procedures for data processing in case of computerized system
Verify documentation
Yes = 1
No = 0
5.1.3 Data quality control? Verify documentation
Yes = 1
No = 0
5.1.4 Data aggregation? Verify documentation
Yes = 1
No = 0
5.1.5 Data analysis & reporting? Verify documentation
Yes = 1
No = 0
5.1.6 Feedback to sources of data? Verify documentation
Yes = 1
No = 0
5.1.7 Data dissemination, use and learning?
Verify documentation
Yes = 1
No = 0
5.1.8 Data confidentiality & security?
Verify documentation
Yes = 1
No = 0
Access and Use of SOPs
5.2.1 Have these SOPs been shared and distributed to all staff and sub-partners if any?
Verify documentation
Yes = 1
No = 0
5.2.2 Are the available SOPs accessible in all stations of operation for easy reference by all the relevant staff?
Verify documentation
Yes = 1
No = 0
5.2.3 Are the available SOPs displayed in all stations of operation for easy reference by all the relevant staff?
Verify documentation
Yes = 1
No = 0
5.2.4 Are the staff aware and using the above SOPs/ Job Aids/Guidelines?
Verify documentation
Yes = 1
No = 0
Overall Score SOPs
Overall Assessment SOPs
Adequate: Score = 10-12
Acceptable Score = 7-9 Inadequate: Score < 7
6. Evaluations, Research and Special Studies. USAID Uganda Mission strongly encourages the inclusion of clients and partners (implementing mechanisms, alliance partners, host-country government partners, and so forth) in planning and conducting evaluations. Activities/IMs should be consulted to assist in prioritizing the evaluation questions. Evaluations may directly involve ultimate customers in data collection and analysis (ADS 201.3.5.8). Activities/IMs are encouraged to carry out operational research and special studies that inform better programming of their interventions. Evaluations Has any evaluation related to the
Activity/IM's technical mandate Yes = 1
If NO, skip to Qn 6.2.1
No = 0
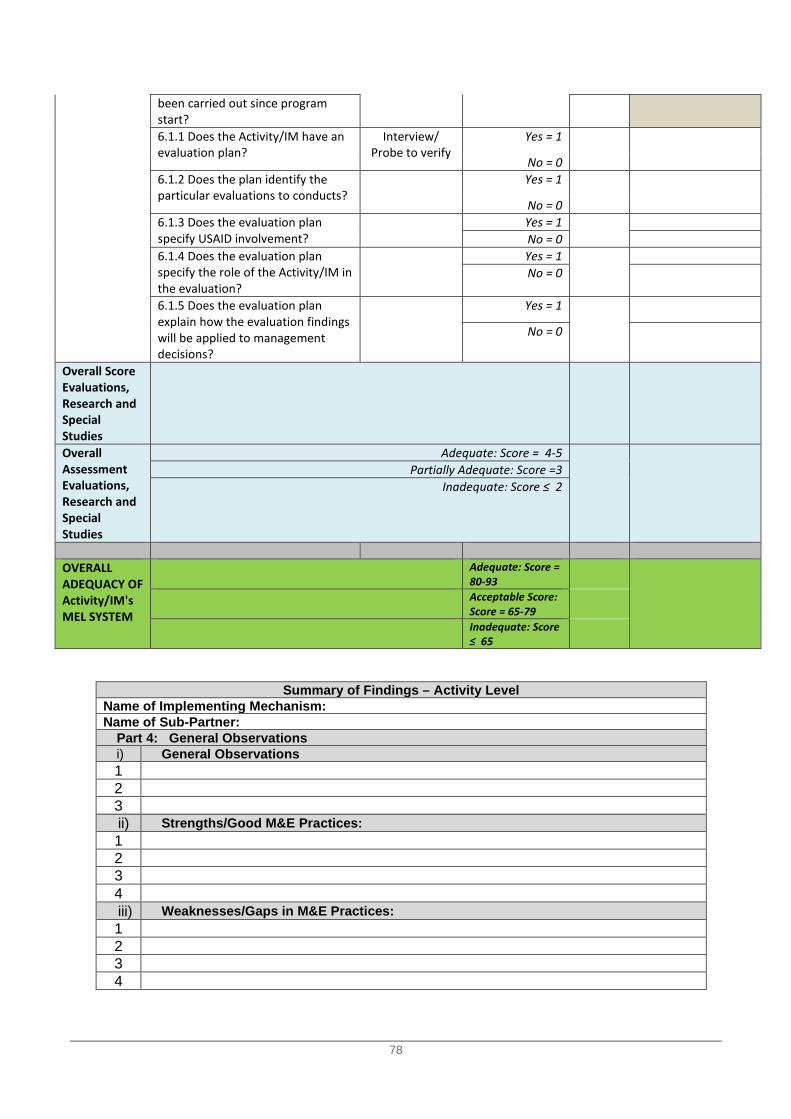
78
Summary of Findings – Activity Level Name of Implementing Mechanism: Name of Sub-Partner:
Part 4: General Observations i) General Observations 1 2 3 ii) Strengths/Good M&E Practices: 1 2 3 4 iii) Weaknesses/Gaps in M&E Practices: 1 2 3 4
been carried out since program start? 6.1.1 Does the Activity/IM have an evaluation plan?
Interview/ Probe to verify
Yes = 1
No = 0 6.1.2 Does the plan identify the particular evaluations to conducts?
Yes = 1
No = 0 6.1.3 Does the evaluation plan specify USAID involvement?
Yes = 1
No = 0
6.1.4 Does the evaluation plan specify the role of the Activity/IM in the evaluation?
Yes = 1
No = 0
6.1.5 Does the evaluation plan explain how the evaluation findings will be applied to management decisions?
Yes = 1
No = 0
Overall Score Evaluations, Research and Special Studies
Overall Assessment Evaluations, Research and Special Studies
Adequate: Score = 4-5
Partially Adequate: Score =3
Inadequate: Score ≤ 2
OVERALL ADEQUACY OF Activity/IM's MEL SYSTEM
Adequate: Score = 80-93
Acceptable Score: Score = 65-79
Inadequate: Score ≤ 65
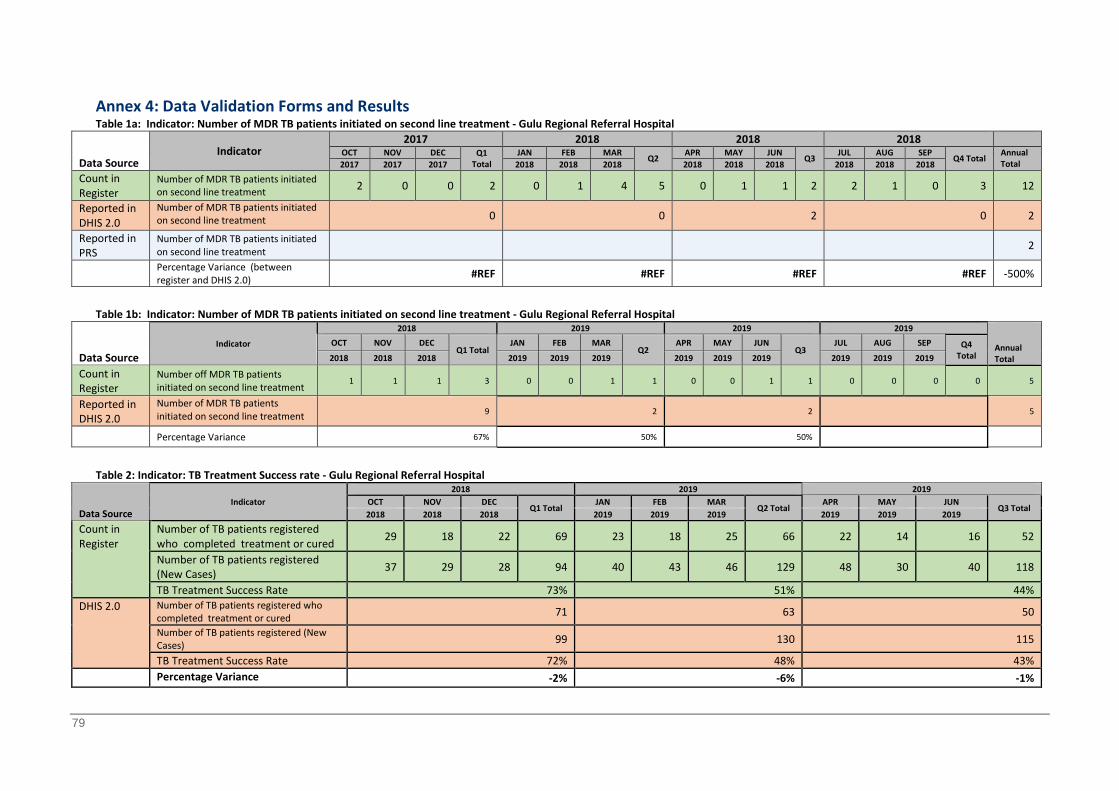
79
Annex 4: Data Validation Forms and Results Table 1a: Indicator: Number of MDR TB patients initiated on second line treatment - Gulu Regional Referral Hospital
Data Source Indicator
2017 2018 2018 2018 OCT NOV DEC Q1
Total JAN FEB MAR
Q2 APR MAY JUN
Q3 JUL AUG SEP
Q4 Total Annual Total 2017 2017 2017 2018 2018 2018 2018 2018 2018 2018 2018 2018
Count in Register
Number of MDR TB patients initiated on second line treatment 2 0 0 2 0 1 4 5 0 1 1 2 2 1 0 3 12
Reported in DHIS 2.0
Number of MDR TB patients initiated on second line treatment 0 0 2 0 2
Reported in PRS
Number of MDR TB patients initiated on second line treatment 2
Percentage Variance (between register and DHIS 2.0) #REF #REF #REF #REF -500%
Table 1b: Indicator: Number of MDR TB patients initiated on second line treatment - Gulu Regional Referral Hospital
Data Source Indicator
2018 2019 2019 2019 Annual Total
OCT NOV DEC Q1 Total
JAN FEB MAR Q2
APR MAY JUN Q3
JUL AUG SEP Q4 Total 2018 2018 2018 2019 2019 2019 2019 2019 2019 2019 2019 2019
Count in Register
Number off MDR TB patients initiated on second line treatment
1 1 1 3 0 0 1 1 0 0 1 1 0 0 0 0 5
Reported in DHIS 2.0
Number of MDR TB patients initiated on second line treatment 9 2 2 5
Percentage Variance 67% 50% 50% Table 2: Indicator: TB Treatment Success rate - Gulu Regional Referral Hospital
Data Source Indicator
2018 2019 2019 OCT NOV DEC
Q1 Total JAN FEB MAR
Q2 Total APR MAY JUN
Q3 Total 2018 2018 2018 2019 2019 2019 2019 2019 2019
Count in Register
Number of TB patients registered who completed treatment or cured 29 18 22 69 23 18 25 66 22 14 16 52
Number of TB patients registered (New Cases) 37 29 28 94 40 43 46 129 48 30 40 118
TB Treatment Success Rate 73% 51% 44% DHIS 2.0 Number of TB patients registered who
completed treatment or cured 71 63 50
Number of TB patients registered (New Cases) 99 130 115
TB Treatment Success Rate 72% 48% 43% Percentage Variance -2% -6% -1%
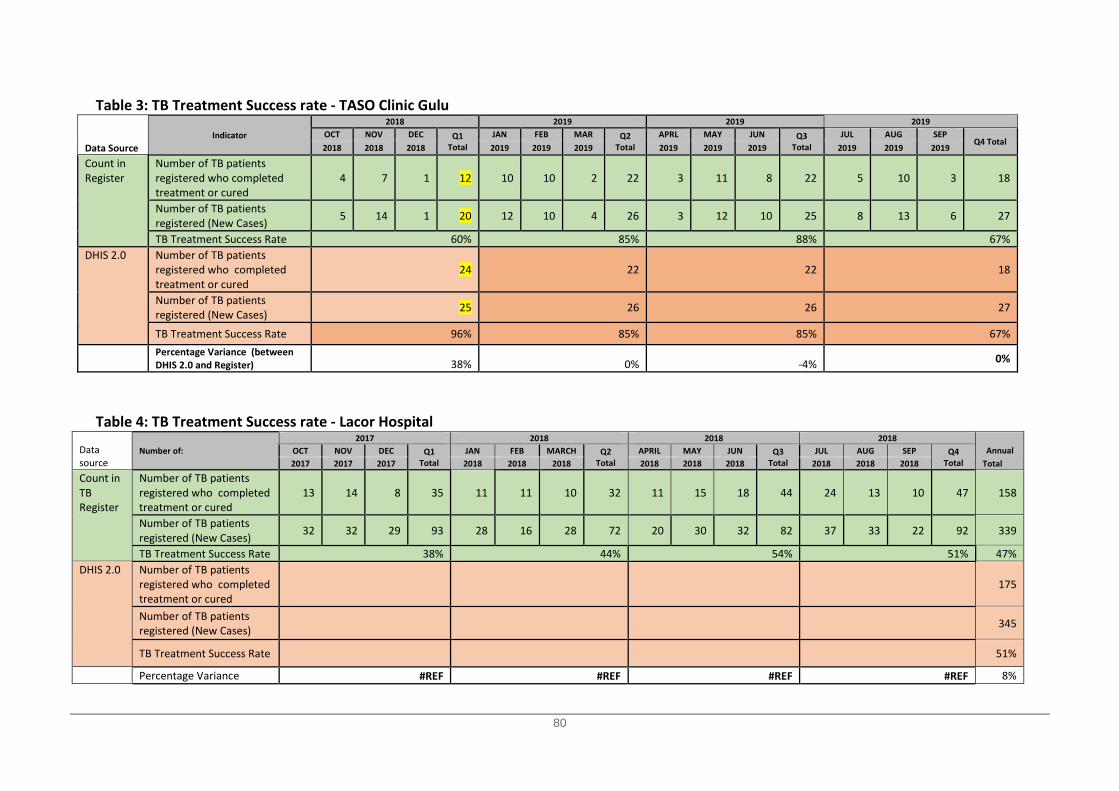
80
Table 3: TB Treatment Success rate - TASO Clinic Gulu
Data Source Indicator
2018 2019 2019 2019 OCT NOV DEC Q1
Total JAN FEB MAR Q2
Total APRL MAY JUN Q3
Total JUL AUG SEP
Q4 Total 2018 2018 2018 2019 2019 2019 2019 2019 2019 2019 2019 2019
Count in Register
Number of TB patients registered who completed treatment or cured
4 7 1 12 10 10 2 22 3 11 8 22 5 10 3 18
Number of TB patients registered (New Cases) 5 14 1 20 12 10 4 26 3 12 10 25 8 13 6 27
TB Treatment Success Rate 60% 85% 88% 67% DHIS 2.0 Number of TB patients
registered who completed treatment or cured
24 22 22 18
Number of TB patients registered (New Cases) 25 26 26 27
TB Treatment Success Rate 96% 85% 85% 67%
Percentage Variance (between DHIS 2.0 and Register) 38% 0% -4% 0%
Table 4: TB Treatment Success rate - Lacor Hospital
Data source
Number of: 2017 2018 2018 2018
Annual Total
OCT NOV DEC Q1 Total
JAN FEB MARCH Q2 Total
APRIL MAY JUN Q3 Total
JUL AUG SEP Q4 Total 2017 2017 2017 2018 2018 2018 2018 2018 2018 2018 2018 2018
Count in TB Register
Number of TB patients registered who completed treatment or cured
13 14 8 35 11 11 10 32 11 15 18 44 24 13 10 47 158
Number of TB patients registered (New Cases) 32 32 29 93 28 16 28 72 20 30 32 82 37 33 22 92 339
TB Treatment Success Rate 38% 44% 54% 51% 47% DHIS 2.0 Number of TB patients
registered who completed treatment or cured
175
Number of TB patients registered (New Cases) 345
TB Treatment Success Rate 51%
Percentage Variance #REF #REF #REF #REF 8%
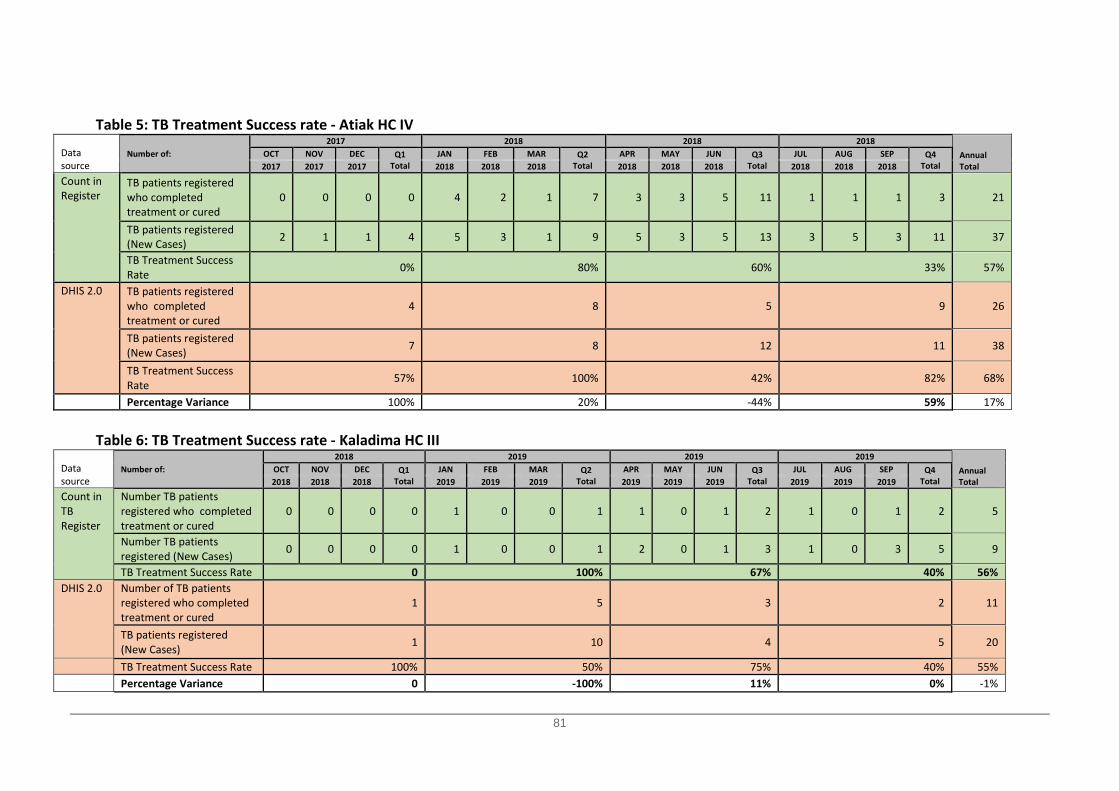
81
Table 5: TB Treatment Success rate - Atiak HC IV
Data source
Number of: 2017 2018 2018 2018
Annual Total
OCT NOV DEC Q1 Total
JAN FEB MAR Q2 Total
APR MAY JUN Q3 Total
JUL AUG SEP Q4 Total 2017 2017 2017 2018 2018 2018 2018 2018 2018 2018 2018 2018
Count in Register
TB patients registered who completed treatment or cured
0 0 0 0 4 2 1 7 3 3 5 11 1 1 1 3 21
TB patients registered (New Cases) 2 1 1 4 5 3 1 9 5 3 5 13 3 5 3 11 37
TB Treatment Success Rate 0% 80% 60% 33% 57%
DHIS 2.0 TB patients registered who completed treatment or cured
4 8 5 9 26
TB patients registered (New Cases) 7 8 12 11 38
TB Treatment Success Rate 57% 100% 42% 82% 68%
Percentage Variance 100% 20% -44% 59% 17%
Table 6: TB Treatment Success rate - Kaladima HC III
Data source
Number of: 2018 2019 2019 2019
Annual Total
OCT NOV DEC Q1 Total
JAN FEB MAR Q2 Total
APR MAY JUN Q3 Total
JUL AUG SEP Q4 Total 2018 2018 2018 2019 2019 2019 2019 2019 2019 2019 2019 2019
Count in TB Register
Number TB patients registered who completed treatment or cured
0 0 0 0 1 0 0 1 1 0 1 2 1 0 1 2 5
Number TB patients registered (New Cases) 0 0 0 0 1 0 0 1 2 0 1 3 1 0 3 5 9
TB Treatment Success Rate 0 100% 67% 40% 56% DHIS 2.0 Number of TB patients
registered who completed treatment or cured
1 5 3 2 11
TB patients registered (New Cases) 1 10 4 5 20
TB Treatment Success Rate 100% 50% 75% 40% 55%
Percentage Variance 0 -100% 11% 0% -1%
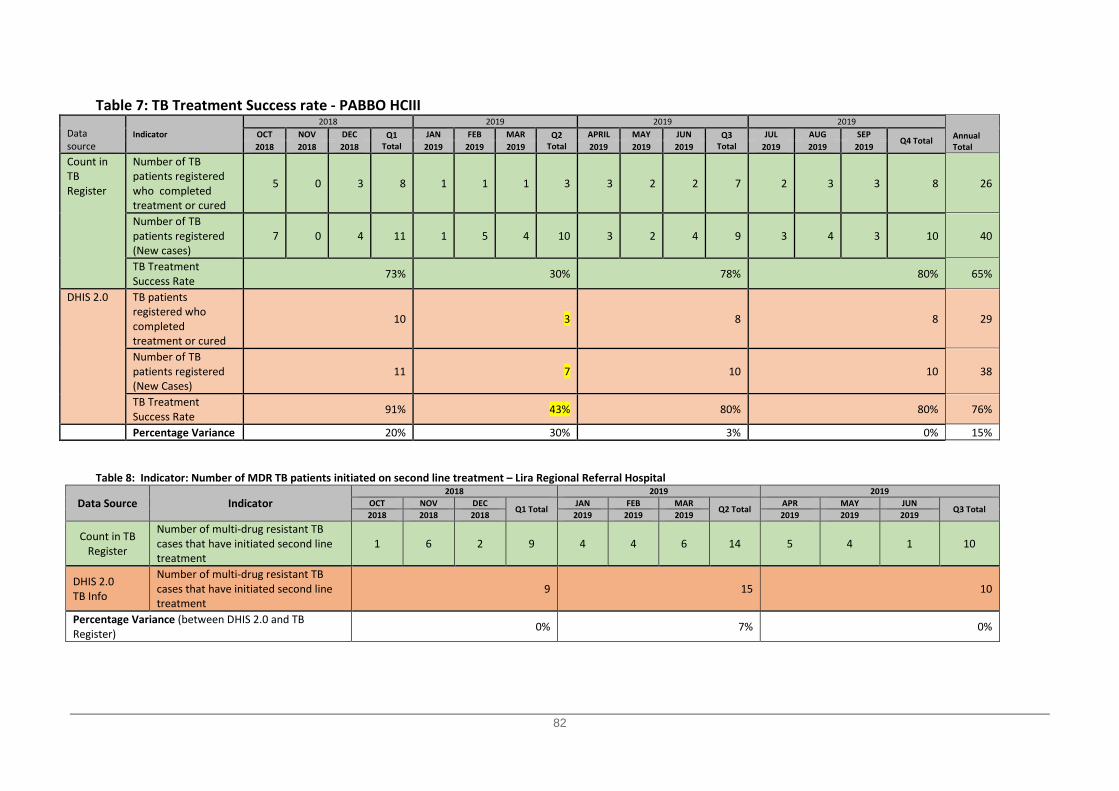
82
Table 7: TB Treatment Success rate - PABBO HCIII
Data source
Indicator 2018 2019 2019 2019
Annual Total
OCT NOV DEC Q1 Total
JAN FEB MAR Q2 Total
APRIL MAY JUN Q3 Total
JUL AUG SEP Q4 Total
2018 2018 2018 2019 2019 2019 2019 2019 2019 2019 2019 2019
Count in TB Register
Number of TB patients registered who completed treatment or cured
5 0 3 8 1 1 1 3 3 2 2 7 2 3 3 8 26
Number of TB patients registered (New cases)
7 0 4 11 1 5 4 10 3 2 4 9 3 4 3 10 40
TB Treatment Success Rate 73% 30% 78% 80% 65%
DHIS 2.0 TB patients registered who completed treatment or cured
10 3 8 8 29
Number of TB patients registered (New Cases)
11 7 10 10 38
TB Treatment Success Rate 91% 43% 80% 80% 76%
Percentage Variance 20% 30% 3% 0% 15% Table 8: Indicator: Number of MDR TB patients initiated on second line treatment – Lira Regional Referral Hospital
Data Source Indicator 2018 2019 2019
OCT NOV DEC Q1 Total
JAN FEB MAR Q2 Total
APR MAY JUN Q3 Total
2018 2018 2018 2019 2019 2019 2019 2019 2019
Count in TB Register
Number of multi-drug resistant TB cases that have initiated second line treatment
1 6 2 9 4 4 6 14 5 4 1 10
DHIS 2.0 TB Info
Number of multi-drug resistant TB cases that have initiated second line treatment
9 15 10
Percentage Variance (between DHIS 2.0 and TB Register) 0% 7% 0%
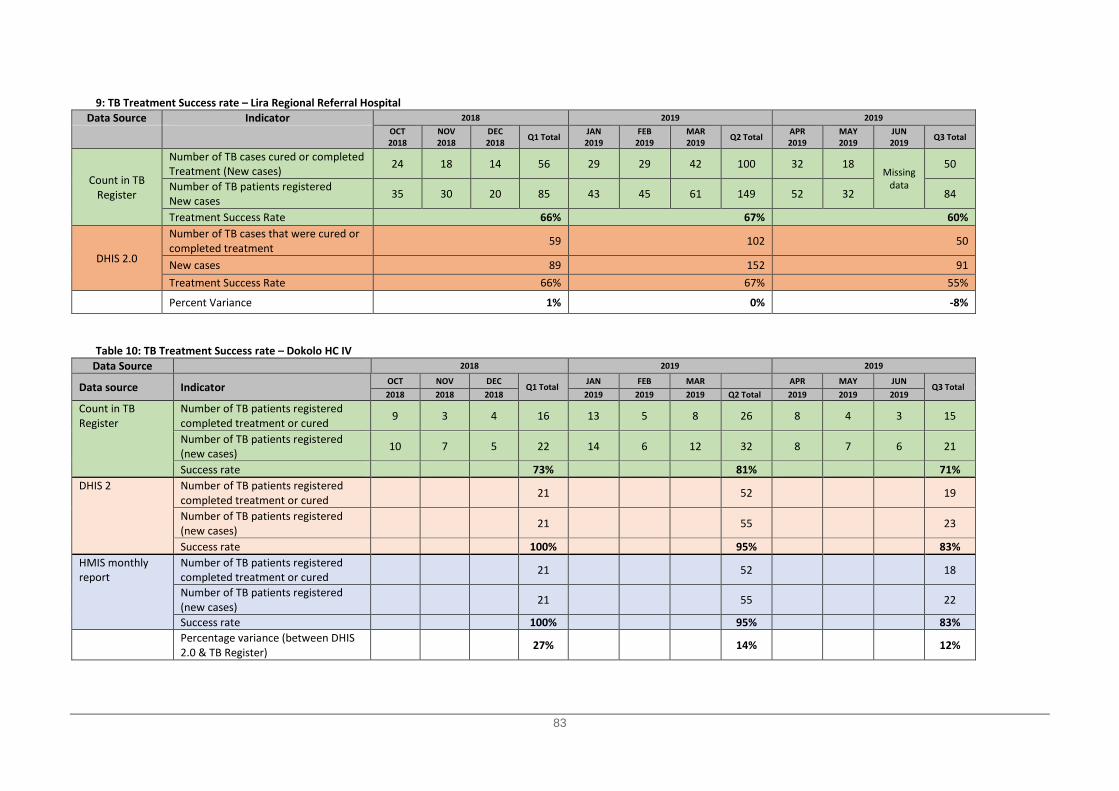
83
9: TB Treatment Success rate – Lira Regional Referral Hospital Data Source Indicator 2018 2019 2019
OCT NOV DEC Q1 Total JAN FEB MAR Q2 Total APR MAY JUN Q3 Total 2018 2018 2018 2019 2019 2019 2019 2019 2019
Count in TB Register
Number of TB cases cured or completed Treatment (New cases) 24 18 14 56 29 29 42 100 32 18
Missing data
50
Number of TB patients registered New cases 35 30 20 85 43 45 61 149 52 32 84
Treatment Success Rate 66% 67% 60%
DHIS 2.0
Number of TB cases that were cured or completed treatment 59 102 50
New cases 89 152 91 Treatment Success Rate 66% 67% 55%
Percent Variance 1% 0% -8%
Table 10: TB Treatment Success rate – Dokolo HC IV
Data Source 2018 2019 2019
Data source Indicator OCT NOV DEC Q1 Total JAN FEB MAR APR MAY JUN
Q3 Total 2018 2018 2018 2019 2019 2019 Q2 Total 2019 2019 2019
Count in TB Register
Number of TB patients registered completed treatment or cured 9 3 4 16 13 5 8 26 8 4 3 15
Number of TB patients registered (new cases) 10 7 5 22 14 6 12 32 8 7 6 21
Success rate 73% 81% 71% DHIS 2 Number of TB patients registered
completed treatment or cured 21 52 19
Number of TB patients registered (new cases) 21 55 23
Success rate 100% 95% 83% HMIS monthly report
Number of TB patients registered completed treatment or cured 21 52 18
Number of TB patients registered (new cases) 21 55 22
Success rate 100% 95% 83%
Percentage variance (between DHIS 2.0 & TB Register) 27% 14% 12%

84
Table 11: TB Treatment Success rate – Akalo HC III Data Source Indicator 2018 2019 2019
OCT NOV DEC Q1 Total JAN FEB MAR Q2 Total APR MAY JUN Q3 Total 2018 2018 2018 2019 2019 2019 2019 2019 2019
Count in TB Register
Number of TB patients registered completed treatment or cured 1 0 1 2 1 3 2 6 5 2 0 7
Number of TB patients registered (new cases) 1 0 1 2 1 3 2 6 5 2 0 7
TB Success rate 100% 100% 100%
DHIS 2.0
Number of TB patients registered completed treatment or cured 0 7 5
Number of TB patients registered (new cases) 2 7 5
Success rate 0% 100% 100%
HMIS
Number of TB patients registered completed treatment or cured 2 Report missing at the time of DQA visit Report missing at the time of DQA visit
Number of TB patients registered (new cases) 2 Report missing at the time of DQA visit Report missing at the time of DQA visit
TB Success Rate 100% Not computed Not computed
Percentage Variance (between DHIS 2.0 and TB Register) 0 14.3% -40.0% Table 12: TB Treatment Success rate – Agulurude HC III
Data source Indicator
2018 2019 2019 OCT NOV DEC
Q1 Total JAN FEB MAR
Q2 Total APR MAY JUN
Q3 Total 2018 2018 2018 2019 2019 2019 2019 2019 2019
Count in TB Register
Number of TB patients registered completed treatment or cured 3 0 0 3 0 1 1 2 1 0 0 1
Number of TB patients registered (new cases) 3 0 0 3 0 2 2 4 2 0 0 2 TB Success rate 100% 50% 50%
DHIS 2.0
Number of TB patients registered completed treatment or cured 8 3 2
Number of TB patients registered (new cases) 8 8 4 TB Success rate 100% 38% 50%
HMIS
Number of TB patients registered completed treatment or cured Data missing Data missing Data missing
Number of TB patients registered (new cases) 6 6 1 TB Success rate - - -
Percentage Variance (between DHIS 2.0 and TB Register) 0 -33% 0%
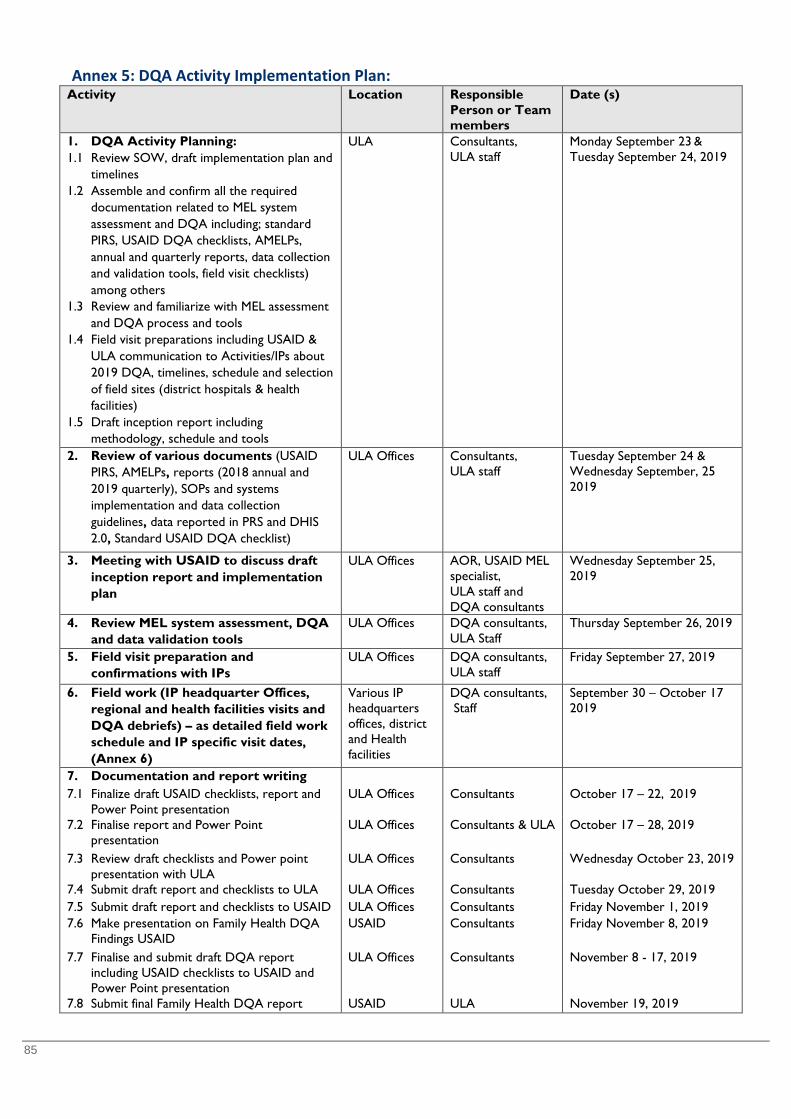
85
Annex 5: DQA Activity Implementation Plan: Activity Location Responsible
Person or Team members
Date (s)
1. DQA Activity Planning: 1.1 Review SOW, draft implementation plan and
timelines 1.2 Assemble and confirm all the required
documentation related to MEL system assessment and DQA including; standard PIRS, USAID DQA checklists, AMELPs, annual and quarterly reports, data collection and validation tools, field visit checklists) among others
1.3 Review and familiarize with MEL assessment and DQA process and tools
1.4 Field visit preparations including USAID & ULA communication to Activities/IPs about 2019 DQA, timelines, schedule and selection of field sites (district hospitals & health facilities)
1.5 Draft inception report including methodology, schedule and tools
ULA Consultants, ULA staff
Monday September 23 & Tuesday September 24, 2019
2. Review of various documents (USAID PIRS, AMELPs, reports (2018 annual and 2019 quarterly), SOPs and systems implementation and data collection guidelines, data reported in PRS and DHIS 2.0, Standard USAID DQA checklist)
ULA Offices Consultants, ULA staff
Tuesday September 24 & Wednesday September, 25 2019
3. Meeting with USAID to discuss draft inception report and implementation plan
ULA Offices AOR, USAID MEL specialist, ULA staff and DQA consultants
Wednesday September 25, 2019
4. Review MEL system assessment, DQA and data validation tools
ULA Offices DQA consultants, ULA Staff
Thursday September 26, 2019
5. Field visit preparation and confirmations with IPs
ULA Offices DQA consultants, ULA staff
Friday September 27, 2019
6. Field work (IP headquarter Offices, regional and health facilities visits and DQA debriefs) – as detailed field work schedule and IP specific visit dates, (Annex 6)
Various IP headquarters offices, district and Health facilities
DQA consultants, Staff
September 30 – October 17 2019
7. Documentation and report writing
7.1 Finalize draft USAID checklists, report and Power Point presentation
ULA Offices Consultants October 17 – 22, 2019
7.2 Finalise report and Power Point presentation
ULA Offices Consultants & ULA October 17 – 28, 2019
7.3 Review draft checklists and Power point presentation with ULA
ULA Offices Consultants Wednesday October 23, 2019
7.4 Submit draft report and checklists to ULA ULA Offices Consultants Tuesday October 29, 2019 7.5 Submit draft report and checklists to USAID ULA Offices Consultants Friday November 1, 2019 7.6 Make presentation on Family Health DQA
Findings USAID USAID Consultants Friday November 8, 2019
7.7 Finalise and submit draft DQA report including USAID checklists to USAID and Power Point presentation
ULA Offices Consultants November 8 - 17, 2019
7.8 Submit final Family Health DQA report USAID ULA November 19, 2019
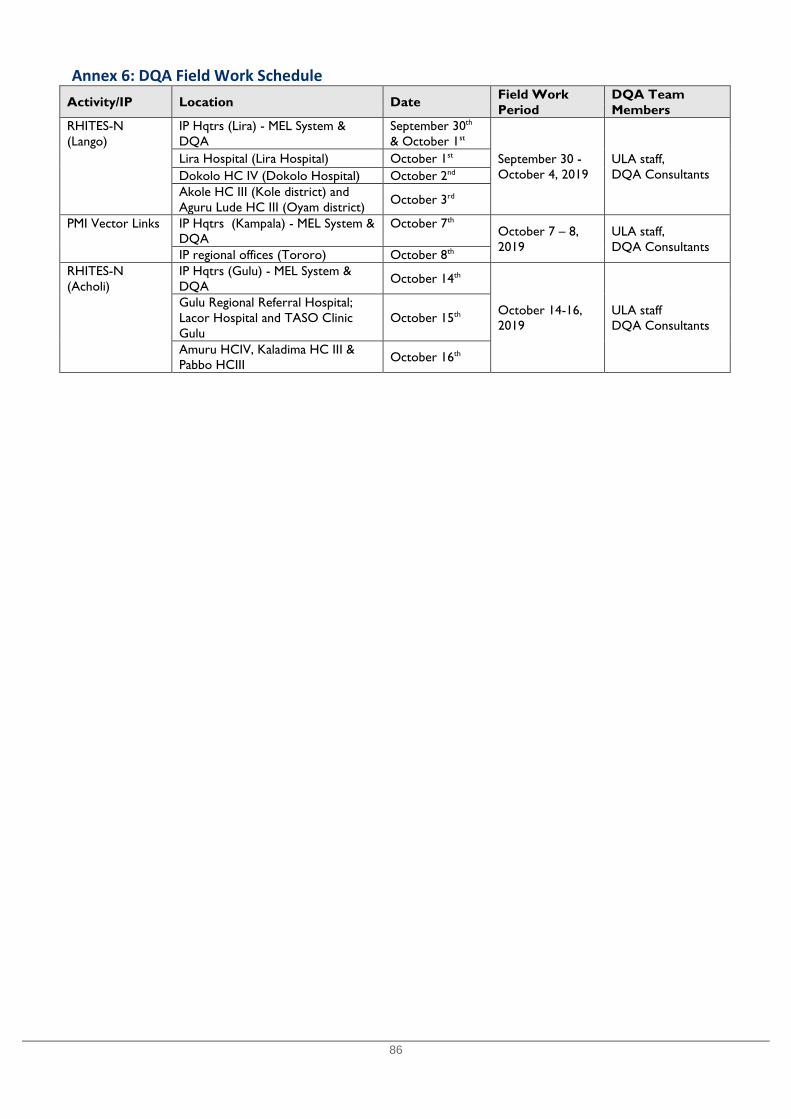
86
Annex 6: DQA Field Work Schedule Activity/IP Location Date Field Work
Period DQA Team Members
RHITES-N (Lango)
IP Hqtrs (Lira) - MEL System & DQA
September 30th & October 1st
September 30 - October 4, 2019
ULA staff, DQA Consultants
Lira Hospital (Lira Hospital) October 1st Dokolo HC IV (Dokolo Hospital) October 2nd Akole HC III (Kole district) and Aguru Lude HC III (Oyam district) October 3rd
PMI Vector Links IP Hqtrs (Kampala) - MEL System & DQA
October 7th October 7 – 8, 2019
ULA staff, DQA Consultants
IP regional offices (Tororo) October 8th
RHITES-N (Acholi)
IP Hqtrs (Gulu) - MEL System & DQA October 14th
October 14-16, 2019
ULA staff DQA Consultants
Gulu Regional Referral Hospital; Lacor Hospital and TASO Clinic Gulu
October 15th
Amuru HCIV, Kaladima HC III & Pabbo HCIII October 16th
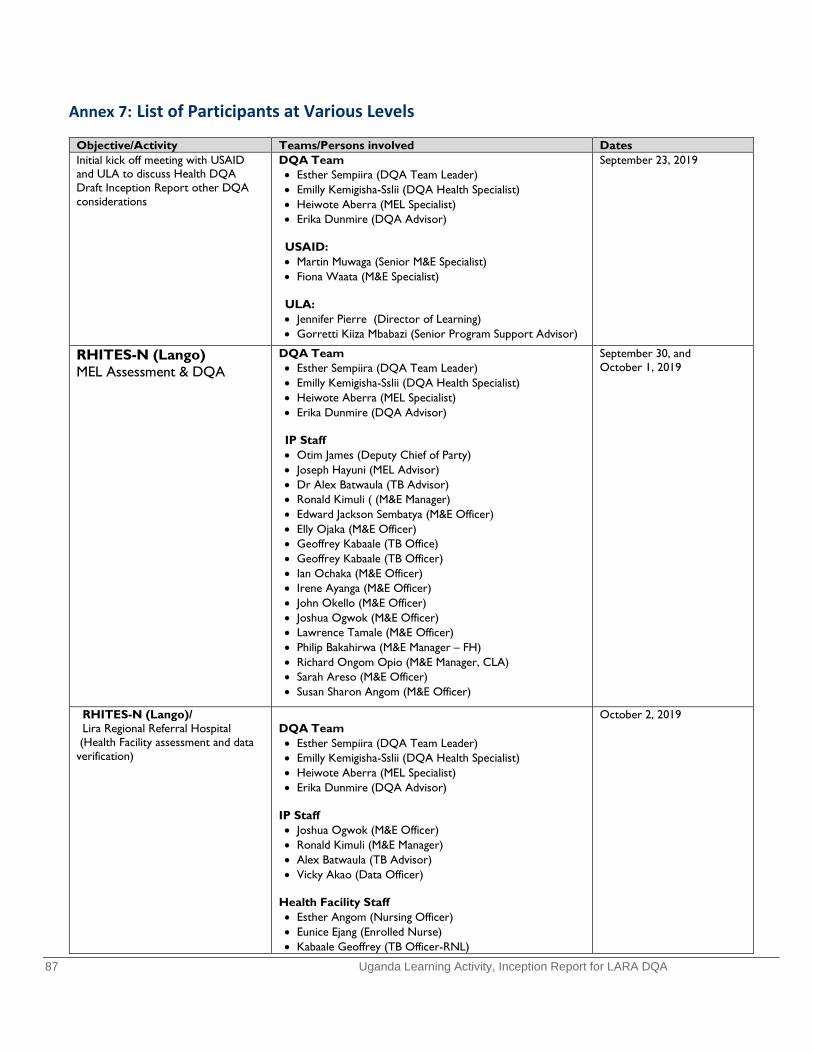
87 Uganda Learning Activity, Inception Report for LARA DQA
Annex 7: List of Participants at Various Levels
Objective/Activity Teams/Persons involved Dates Initial kick off meeting with USAID and ULA to discuss Health DQA Draft Inception Report other DQA considerations
DQA Team • Esther Sempiira (DQA Team Leader) • Emilly Kemigisha-Sslii (DQA Health Specialist) • Heiwote Aberra (MEL Specialist) • Erika Dunmire (DQA Advisor)
USAID: • Martin Muwaga (Senior M&E Specialist) • Fiona Waata (M&E Specialist)
ULA: • Jennifer Pierre (Director of Learning) • Gorretti Kiiza Mbabazi (Senior Program Support Advisor)
September 23, 2019
RHITES-N (Lango) MEL Assessment & DQA
DQA Team • Esther Sempiira (DQA Team Leader) • Emilly Kemigisha-Sslii (DQA Health Specialist) • Heiwote Aberra (MEL Specialist) • Erika Dunmire (DQA Advisor)
IP Staff • Otim James (Deputy Chief of Party) • Joseph Hayuni (MEL Advisor) • Dr Alex Batwaula (TB Advisor) • Ronald Kimuli ( (M&E Manager) • Edward Jackson Sembatya (M&E Officer) • Elly Ojaka (M&E Officer) • Geoffrey Kabaale (TB Office) • Geoffrey Kabaale (TB Officer) • Ian Ochaka (M&E Officer) • Irene Ayanga (M&E Officer) • John Okello (M&E Officer) • Joshua Ogwok (M&E Officer) • Lawrence Tamale (M&E Officer) • Philip Bakahirwa (M&E Manager – FH) • Richard Ongom Opio (M&E Manager, CLA) • Sarah Areso (M&E Officer) • Susan Sharon Angom (M&E Officer)
September 30, and October 1, 2019
RHITES-N (Lango)/ Lira Regional Referral Hospital
(Health Facility assessment and data verification)
DQA Team • Esther Sempiira (DQA Team Leader) • Emilly Kemigisha-Sslii (DQA Health Specialist) • Heiwote Aberra (MEL Specialist) • Erika Dunmire (DQA Advisor)
IP Staff • Joshua Ogwok (M&E Officer) • Ronald Kimuli (M&E Manager) • Alex Batwaula (TB Advisor) • Vicky Akao (Data Officer)
Health Facility Staff • Esther Angom (Nursing Officer) • Eunice Ejang (Enrolled Nurse) • Kabaale Geoffrey (TB Officer-RNL)
October 2, 2019
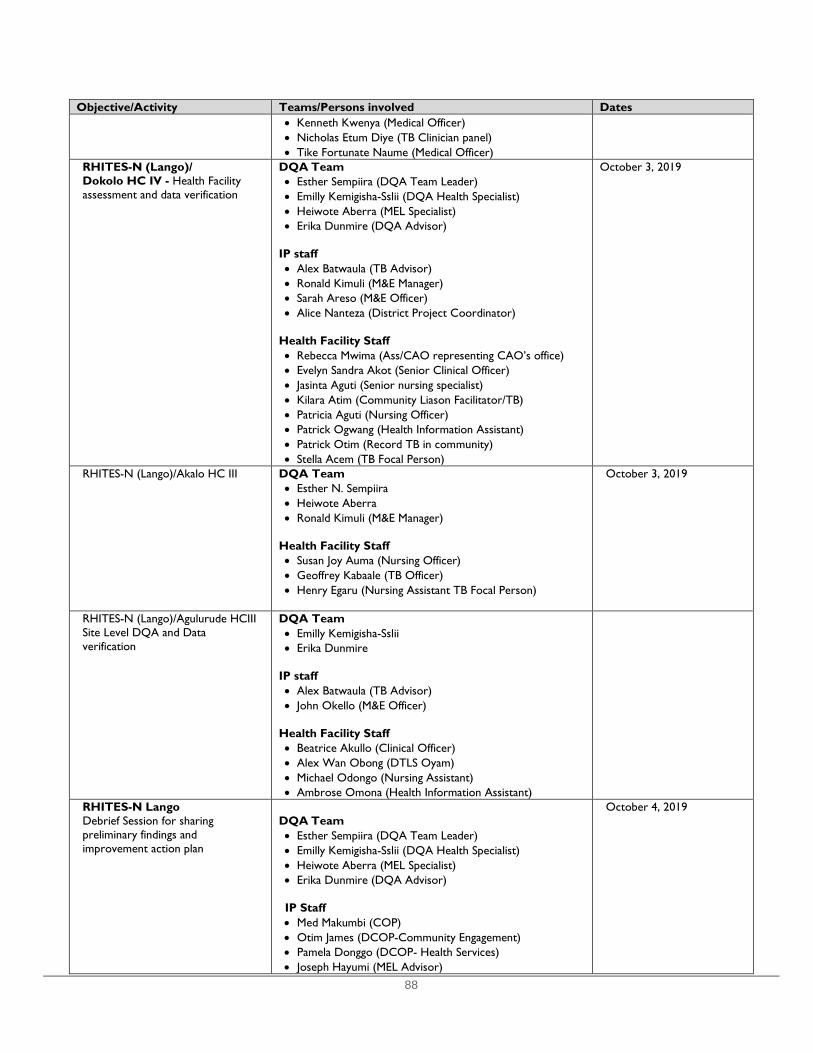
88
Objective/Activity Teams/Persons involved Dates • Kenneth Kwenya (Medical Officer) • Nicholas Etum Diye (TB Clinician panel) • Tike Fortunate Naume (Medical Officer)
RHITES-N (Lango)/ Dokolo HC IV - Health Facility assessment and data verification
DQA Team • Esther Sempiira (DQA Team Leader) • Emilly Kemigisha-Sslii (DQA Health Specialist) • Heiwote Aberra (MEL Specialist) • Erika Dunmire (DQA Advisor)
IP staff • Alex Batwaula (TB Advisor) • Ronald Kimuli (M&E Manager) • Sarah Areso (M&E Officer) • Alice Nanteza (District Project Coordinator)
Health Facility Staff • Rebecca Mwima (Ass/CAO representing CAO’s office) • Evelyn Sandra Akot (Senior Clinical Officer) • Jasinta Aguti (Senior nursing specialist) • Kilara Atim (Community Liason Facilitator/TB) • Patricia Aguti (Nursing Officer) • Patrick Ogwang (Health Information Assistant) • Patrick Otim (Record TB in community) • Stella Acem (TB Focal Person)
October 3, 2019
RHITES-N (Lango)/Akalo HC III
DQA Team • Esther N. Sempiira • Heiwote Aberra • Ronald Kimuli (M&E Manager)
Health Facility Staff • Susan Joy Auma (Nursing Officer) • Geoffrey Kabaale (TB Officer) • Henry Egaru (Nursing Assistant TB Focal Person)
October 3, 2019
RHITES-N (Lango)/Agulurude HCIII Site Level DQA and Data verification
DQA Team • Emilly Kemigisha-Sslii • Erika Dunmire
IP staff • Alex Batwaula (TB Advisor) • John Okello (M&E Officer)
Health Facility Staff • Beatrice Akullo (Clinical Officer) • Alex Wan Obong (DTLS Oyam) • Michael Odongo (Nursing Assistant) • Ambrose Omona (Health Information Assistant)
RHITES-N Lango Debrief Session for sharing preliminary findings and improvement action plan
DQA Team • Esther Sempiira (DQA Team Leader) • Emilly Kemigisha-Sslii (DQA Health Specialist) • Heiwote Aberra (MEL Specialist) • Erika Dunmire (DQA Advisor) IP Staff • Med Makumbi (COP) • Otim James (DCOP-Community Engagement) • Pamela Donggo (DCOP- Health Services) • Joseph Hayumi (MEL Advisor)
October 4, 2019

89
Objective/Activity Teams/Persons involved Dates • Alex Batwaula (TB Advisor) • Abias Asiimwe (Q1 Advisor) • Agnes Namagembe (DPC-Kwania) • Ambrose Okite (Social & Behavioral Communication
Officer) • Betty Asire (District Project Coordinator) • Christine Amati (Project Officer L&R Kole) • Denis Kintu (RMNAH Advisor) • Florence Aryema (WASH and Infrastructure Advisor) • Geoffrey Kabaale (TB Officer) • Ismail Mbabali (DREAMS Program Manager) • Jasper Abor (Project Officer – R&L) • Jennifer Acello (Nutrition Officer) • Jimmy Mujuni Ketimbo (WASH and Infrastructure
Advisor) • Joseph Katetemera (Program Officer-RMNCAH) • Joseph SSebwana (Digital Health Advisor) • Maureen Kwikiriza (Advisor HIV prevention services) • Milly Nalugwa (Project Assistant-VMMC) • Owomuhangi Jennifer (RMNCH Project Officer) • Peter Okila (District Project Coordinator) • Philip Bakahirwa (M&E Manager – FH) • Rebecca Nasambu (Advisor C/T) • Robert Ikawa (SBC Consultant) • Ronald Kibira (District Project Coordinator) • Ronald Kimuli ( (M&E Manager) • Sam Ebiot (Project Assistant -Voluntary Medical Male
Circumcision) • Samuel Baker Lukwiya (Supply Chain Officer) • Samuel Engulu (Project Offcier, HCs and Prevention) • Solomon Opio (Project Assistant Voluntary Medical Male
Circumcision) • Suzan Sharon Angom (M&E Officer)
PMI VectorLink DQA Team • Esther Sempiira (DQA Team Leader) • Emilly Kemigisha-Sslii (DQA Health Specialist) • Heiwote Aberra (MEL Specialist) • Erika Dunmire (DQA Advisor) PMI Vector Link (Kampala) • Ruth Nanyonga (M&E Manager) • Dr. Joseph Shililu (COP) PMI Vector Link (Tororo) • Asaph Muhanguzi (Deputy CoP) • Ruth Nanyonga (M&E Manager • Bernard Abwang (Operations Manager) • Charles Ewechu (District Coordinator) • Daniel Eniwu (IEC/BCC Coordinator) • Donald Bajungu (District Coordinator) • Evaline Ajwang (M&E Coordinator) • Jacqueline Larumu (District Coordinator) • James Kirunda (Entomology Field Coordinator/Capacity
Building) • Jennnifer Tumwebaze (District Coordinator) • Julius Peter Okello (District Coordinator) • Kenneth Ssaka (District Coordinator) • Peter Awona (IT Specialist)

90
Objective/Activity Teams/Persons involved Dates Field Level Staff • Agembi Oliver Theopister (M&E Assistant) • Diana Watsemba (Data Entry Clerk) • Immaculate Awino (M&E Assistant) • Kalenda Scovia (Spray Operator) • Kameli Bridget (Data Entry Clerk) • Opanga Laktari Musa (Spray Operator)
RHITES-N (Acholi) MEL Assessment and DQA
DQA Team members • Esther N. Sempiira • Emilly Kemigisha-Ssali • Heiwote Aberra • David Mawejje
IP Staff • Brenda Nalwadda (MEL Director) • Stephen Amayo (TB Specialist) • Nathan Lubowa (M&E Advisor) • Jennifer Bakyawa (Knowledge Management Officer) • Richard Kagimu (New Born Advisor) • Peter Erem (M&E Advisor) • Joshua Senfuka (SI Officer) • Rebecca Emong (Data Assistant Amuru) • Ronald Ojok (Data Assistant Gulu)
RHITES-N Acholi MEL Assessment and DQA
DQA Team • Esther Sempiira (DQA Team Leader) • Emilly Kemigisha-Sslii (DQA Health Specialist) • Heiwote Aberra (MEL Specialist)
IP Staff • Brenda Nalwadda (MEL Director) • Stephen Amayo (TB Specialist) • Nathan Lubowa (M&E Advisor) • Jennifer Bakyawa (Knowledge Management Officer) • Richard Kagimu (New Born Advisor) • Peter Erem (M&E Advisor) • Joshua Senfuka (SI Officer)
RHITES-N Acholi Gulu Regional Referral Hospital
DQA Team • Esther N. Sempiira • David Mawejje (ULA) • Emily Kemigisha-Ssali • Heiwote Aberra
Health Facility Staff & IP Venis Frobisa Omona (Community Coordinator) Sarah Aluko (Data Officer) Peter Erem (M&E Officer) Ronald Steward Ojok (M&E Officer/IP) Stephen Amayo (TB Specialist) Ocen Simon (Medical Officer TB) Ruth Angucia (Registered Nurse) Louis Omona (Community Facilitator) Godfrey Ray Okello (Data Clerk)
October 16, 2019
RHITES-N Acholi Lacor Hospital
DQA Team • Esther Sempiira • David Mawejje (ULA)
October 16, 2019
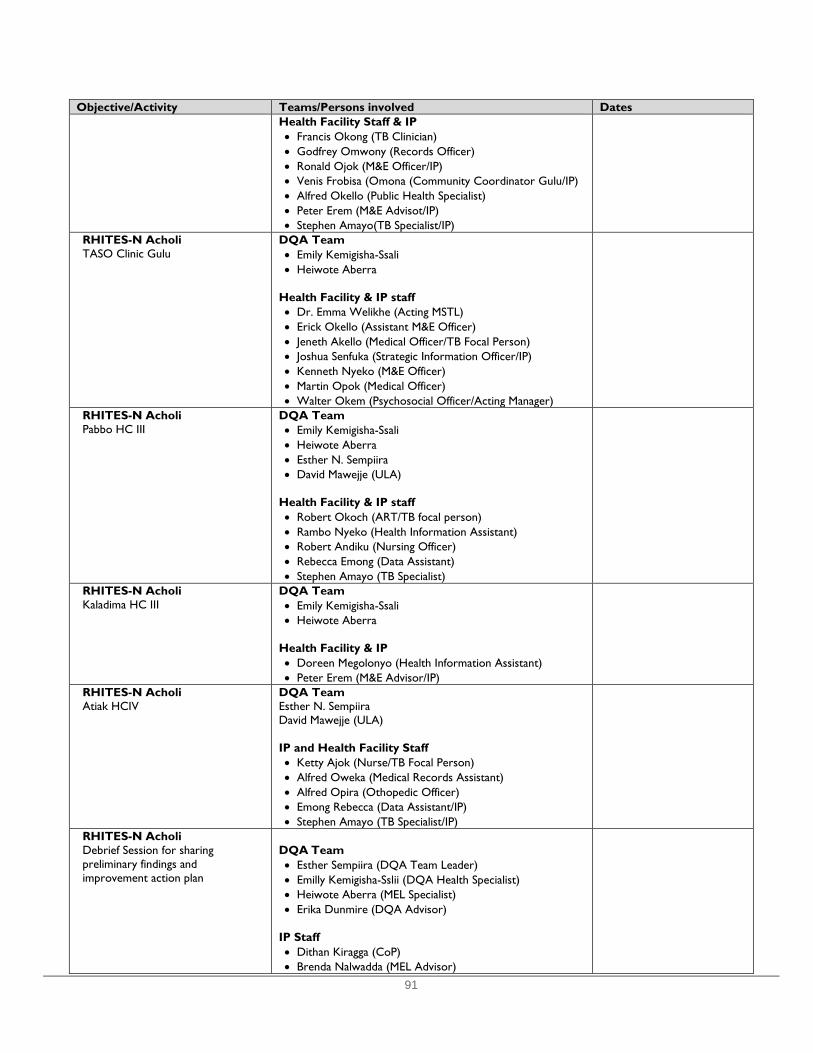
91
Objective/Activity Teams/Persons involved Dates Health Facility Staff & IP • Francis Okong (TB Clinician) • Godfrey Omwony (Records Officer) • Ronald Ojok (M&E Officer/IP) • Venis Frobisa (Omona (Community Coordinator Gulu/IP) • Alfred Okello (Public Health Specialist) • Peter Erem (M&E Advisot/IP) • Stephen Amayo(TB Specialist/IP)
RHITES-N Acholi TASO Clinic Gulu
DQA Team • Emily Kemigisha-Ssali • Heiwote Aberra
Health Facility & IP staff • Dr. Emma Welikhe (Acting MSTL) • Erick Okello (Assistant M&E Officer) • Jeneth Akello (Medical Officer/TB Focal Person) • Joshua Senfuka (Strategic Information Officer/IP) • Kenneth Nyeko (M&E Officer) • Martin Opok (Medical Officer) • Walter Okem (Psychosocial Officer/Acting Manager)
RHITES-N Acholi Pabbo HC III
DQA Team • Emily Kemigisha-Ssali • Heiwote Aberra • Esther N. Sempiira • David Mawejje (ULA)
Health Facility & IP staff • Robert Okoch (ART/TB focal person) • Rambo Nyeko (Health Information Assistant) • Robert Andiku (Nursing Officer) • Rebecca Emong (Data Assistant) • Stephen Amayo (TB Specialist)
RHITES-N Acholi Kaladima HC III
DQA Team • Emily Kemigisha-Ssali • Heiwote Aberra
Health Facility & IP • Doreen Megolonyo (Health Information Assistant) • Peter Erem (M&E Advisor/IP)
RHITES-N Acholi Atiak HCIV
DQA Team Esther N. Sempiira David Mawejje (ULA) IP and Health Facility Staff • Ketty Ajok (Nurse/TB Focal Person) • Alfred Oweka (Medical Records Assistant) • Alfred Opira (Othopedic Officer) • Emong Rebecca (Data Assistant/IP) • Stephen Amayo (TB Specialist/IP)
RHITES-N Acholi Debrief Session for sharing preliminary findings and improvement action plan
DQA Team • Esther Sempiira (DQA Team Leader) • Emilly Kemigisha-Sslii (DQA Health Specialist) • Heiwote Aberra (MEL Specialist) • Erika Dunmire (DQA Advisor)
IP Staff • Dithan Kiragga (CoP) • Brenda Nalwadda (MEL Advisor)
92
Objective/Activity Teams/Persons involved Dates • Bonface Bongomin (District Technical Coordinator) • Hillary Alima (Senior HIV Advisor) • Immaculate Agedo (Project Officer PNFP) • Jennifer Bakyawa (Knowledge Management Officer) • Martin Ndifuna (Voluntary Medical Male Circumcision
Advisor) • Nathan Lubowa (M&E Advisor) • Nicholas Mwanja (PMTCT Technical Advisor) • Peter Erem (M&E Advisor) • Rebecca Emong (Data Assistant Amuru) • Silvester Okot (SBCC Advisor) • Stephen Amayo (TB Specialist)
Related Documents