Falkland Islands Holdings plc Annual Report 2013

Welcome message from author
This document is posted to help you gain knowledge. Please leave a comment to let me know what you think about it! Share it to your friends and learn new things together.
Transcript

Falkland Islands Holdings plc
Annual Report 2013

Contents
1 Financial Highlights
2 Chairman’s Statement
4 Managing Director’s Business Review
11 Managing Director’s Financial Review
16 Board of Directors and Secretary
17 Directors’ Report
21 Independent Auditor’s Report
22 Consolidated Income Statement
23 Consolidated Statement of Comprehensive Income
24 Consolidated Balance Sheet
25 Company Balance Sheet
26 Consolidated Cash Flow Statement
27 Company Cash Flow Statement
28 Consolidated Statement of Changes in Shareholders’ Equity
29 Company Statement of Changes in Shareholders’ Equity
30 Notes to the Financial Statements
72 Directors and Corporate Information

FALKLAND ISLANDS HOLDINGS PLC 1
Financial HighlightsFOR THE YEAR ENDED 31 MARCH 2013
*Defined as profit before tax, amortisation and non-trading items.
2013
£m
2012
£m
Change
%
Turnover from continuing operations 35.60 34.11 4.4
Profit before tax 2.80 2.84 (1.4)
Underlying profit before tax* 3.29 3.23 1.9
Diluted earnings per share before goodwill amortisation and non-trading items 21.3p 26.2p (18.7)
Dividend per share 11.5p 11.0p 4.5
Cash flow from operations 3.47 4.61 (24.7)
Net asset value per share 276p 317p (12.9)
2009 2010 2011 2012 2013 2010 20112009 2012 2013
Diluted earnings per share (pence)before goodwill amortisation and non-recurring items
Dividend per share (pence)
18.8
21.720.6
26.2
21.3
8.00
9.009.50
11.0011.50
Turnover (from continuing operations
2009 2010 2011 2012
34.11
2013
35.60
32.25
29.2231.84
Underlying profit before tax* (£m
2.31
2010
2.69
20112009
2.73
3.23
2012
3.29
2013
£m) )

ANNUAL REPORT 20132
Chairman’s Statement
David Hudd Chairman
Operations
For the Falkland Islands Company (FIC), retail profits were maintained and fishing activity was at reasonable levels but tourism declined following disruption to cruise schedules. Additional management and consultancy costs of £0.2 million were incurred in planning for the future, accounting for the reduction in contribution of 12% to £1.33 million (2012: £1.51 million).
Momart enjoyed a very good year and achieved a 24% increase in contribution to £1.19 million (2012: £0.96 million) even after incurring relocation and restructuring expenses of £0.2 million. Each of the three business streams; exhibitions, commercial and storage, increased their profits.
The Portsmouth Harbour Ferry Company (PHFC) suffered a 9% fall in passenger journeys much of which we believe was attributable to changes in military travel arrangements. As a result of this, the operating profit fell by 10% to £0.98 million (2012: £1.09 million).
Let me thank our staff for their contribution to our successful year.
Falkland Oil and Gas Limited (FOGL)
The Group owns 12,825,000 shares in FOGL which represents 4% of the issued share capital of that company; equivalent to one FOGL share for each issued share in Falkland Islands Holdings. In June 2012 we sold 1,175,000 shares to recoup the investment we had made in supporting the cash call in January 2012. The share sale generated a profit for the Group of £0.8 million. At 31 March 2013 the remaining holding had a market value of £3.4 million (26.5p per share) compared with a cost of £2.6 million (20p per share).
In 2012 FOGL drilled exploration wells on the Loligo and Scotia prospects. Both wells encountered substantial volumes of gas in place; confirming the presence of a working petroleum system within the South and East Falklands Basins. The farm-ins with Noble Energy Falklands (Noble) and Edison International were a major achievement
2012-13 was another period
of pleasing performance
for the Group, during which
strong cash generation continued
and we raised equity funds to
position us for the growth the
Falkland Islands will experience
in the build up to oil production.
We are unique in the Falkland Islands with a platform of
leading retail and support service businesses, a significant
land bank and the funds to develop them.
Financial
Underlying Group operating profit, before amortisation,
interest and non-trading items was £3.5 million (2012:
£3.6 million) after incurring some £0.4 million of one-off
costs. Basic earnings per share has fallen from 26.3p in
2012 to 21.6p as a result of the 33% increase to share
capital resulting from the equity capital raising in July 2012.
Reflecting our confidence in the outlook, we are pleased
to recommend an increased final dividend of 7.5p per
share which makes a total dividend of 11.5p per share, a
4.5% increase on the Group’s 2012 dividend (11p).
The Group ended the year in a strong financial position
with cash balances of £11.4 million and £2.0 million
of bank debt as a result of the good trading and the
£10.0 million equity raised in July 2012.

FALKLAND ISLANDS HOLDINGS PLC 3
and mean that FOGL with cash resources of $220 million
at 31 December 2012 is in the fortunate position of
having secured funding for its share of the planned
seismic and drilling programme.
In the 10 years from 2002 and the award of FOGL’s
licences, a total of $380 million has been spent in
exploration; shooting 35,000 km of 2D seismic and drilling
three wells. The pace of exploration is accelerating under
the operatorship of Noble; and over the next three years a
further $400-$500 million is expected to be invested. It is
anticipated that over 10,000 sq km of 3D seismic will be
shot, of which 6,000 sq km has recently been completed.
This seismic data is focussing on oil potential and will
identify the prospects for the next drilling campaign which
is targeted to commence in 2014.
The scale of further work being undertaken is such that
we remain optimistic about the prospects for FOGL and
expect to retain a substantial shareholding until the
outcome of this drilling programme is known.
Corporate Matters
I am delighted to welcome Edmund Rowland to the Board
as a non-executive director representing our largest
shareholder, Blackfish Capital, who subscribed £8.0
million in our July 2012 placing.
In addition to the items which have become regular
business at our Annual General Meetings, this year we are
proposing a re-organisation of the share capital under
which the holdings of shareholders who hold less than
100 shares will be bought back by the Company, any
such shareholders wishing to retain their holdings will be
able to do so. For historical reasons we have a
disproportionately large number of small shareholders
and the proposed re-organisation will reduce the size
of the shareholder register, and as a consequence the
costs faced by the Company. At the same time it will
provide a means for small shareholders to dispose of their
shares for a fair price without incurring brokerage
commission. Full details of the re-organisation are given in
the Circular to shareholders accompanying the Notice of
Annual General Meeting.
The notice of the Annual General Meeting and the full
results for the year will be posted to shareholders and
published on the website on 28 June 2013.
Outlook
The Falklands economy is on the threshold of a decade of
dramatic growth as the Sea Lion discovery is developed.
Projections prepared for the Falkland Islands Government
show an increase in GDP from £140 million in 2012 to
£1 billion in 2018, and on the basis of current oil prices
related tax revenues are forecast to average £150 million
a year for 30 years.
FIC will participate in the growth in the economy in a
number of ways. Retail operations, which are central to
our business are being extended and modernised. We are
also investing the cash we raised last year in developing
our property assets including the plans for construction of
housing, offices and warehousing. With our construction
partners we are tendering for infrastructure contracts,
some of which will be awarded this year, and the new
port planned for Port William represents a significant
opportunity as we own 300 acres, adjoining the site.
The continued strength of the global art market and an
increase in the number of major exhibitions provides
Momart with good opportunities for further growth in the
current year. A better year is expected for PHFC with a
modest reduction in passenger numbers and we are
looking forward to the introduction of a new ferry which
is being commissioned for delivery in 2014.
We have an exciting future in prospect.
David Hudd
Chairman
10 June 2013

ANNUAL REPORT 20134
Managing Director’s Business Review
John Foster Managing Director
Group OverviewI am pleased to report another good year of trading for the Group, with a 4.4% increase in revenues to £35.6 million (2012: £34.1 million) and a 1.9% increase in underlying pre tax profits to £3.29 million (2012: £3.23 million).
In the current year the Group benefited from interest of £0.16 million earned on the £10.0 million share subscription from shareholders in July 2012.
Underlying operating profits for the Group (before amortisation and financing costs) were a little lower at £3.50 million (2012: £3.57 million).
Review of operationsGroup revenue and operating profits are analysed below:
Group revenue
Year ended 31 March 2013
£m
2012
£m
Change
%
Falkland Islands Company 15.22 14.98 1.6
Portsmouth Harbour Ferry 4.08 4.16 (1.9)
Momart 16.30 14.97 8.9
Total 35.60 34.11 4.4
Group underlying operating profit
Year ended 31 March 2013
£m
2012
£m
Change
%
Falkland Islands Company 1.33 1.52 (12.5)
Portsmouth Harbour Ferry 0.98 1.09 (10.1)
Momart 1.19 0.96 24.0
Total 3.50 3.57 (1.9)
Group revenue
2013
2012
Underlying operating profit
2013
2012
Momart46%
PHFC11%
FIC43%
Momart34%
PHFC28%
FIC38%
Momart27%
PHFC31%
FIC42%Momart
44%
PHFC12%
FIC44%

FALKLAND ISLANDS HOLDINGS PLC 5
Leiv Erikson oil rig in the Falkland’s waters.
Falkland Islands Company (FIC)The announcement in July 2012 of the farm-in by Premier Oil Plc to Rockhopper’s Sea Lion discovery in the North Falklands basin added a new level of certainty to the likelihood of oil production in the Falklands. Development work on Sea Lion is expected to commence in mid-2014 with the first oil scheduled to flow in 2017. Oil production will have a dramatic impact on the Falkland Islands economy with GDP projected to increase sevenfold from 2012 to over £1 billion in 2018 and Government oil tax revenues projected to exceed £800 million over the first five years of production. Employment is expected to soar with an increase of over 25% in onshore employment.
In the year to 31 March 2013 the focus has been on preparing FIC to exploit the opportunities by strengthening the management team and modernising operations. The resultant revenue investment of some £0.2 million has meant that with little growth in the economy, operating profits were £0.19 million lower at £1.33 million on revenues marginally up at £15.22 million (2012: £14.98 million).
Total retail sales grew by 3.0% but revenues from the West Store in Stanley which accounts for more than half of sales were unchanged as a result of a significant reduction in clothing sales caused by the insolvency of the supplier in June 2012. BHS clothing was introduced in the last quarter and its wider range led to a recovery in sales. Good features were a 39% sales increase from the expanded West Store at the Mount Pleasant complex and a 6% increase from warehouse sales resulting from offshore drilling and seismic contracts. The Capstan gift
FIC operating results
Year ended 31 March 2013
£m
2012
£m
Change
%
Revenues
Retail 9.73 9.45 3.0
Falklands 4x4 1.87 1.57 19.1
Freight and port services 1.65 2.01 (17.9)
Support services 1.21 1.28 (5.5)
Property and construction 0.76 0.67 13.4
Total FIC revenue 15.22 14.98 1.6
FIC underlying operating profit 1.33 1.52 (12.5)
Underlying operating profit margin (%) 8.7 10.1 (13.9)
2012
Property sales2%
Retail65%
Motor13%
Other services19%
FIC revenues
2013
Property sales0%
Retail62%
Motor10%
Other services28%
ANNUAL REPORT 20136
STANLEY
ProposedNew PortFacility
ProposedNew LinkRoad
FIPASS
7 Fairy Cove
4
1
6
5
23
Managing Director’s Business ReviewCONTINUED
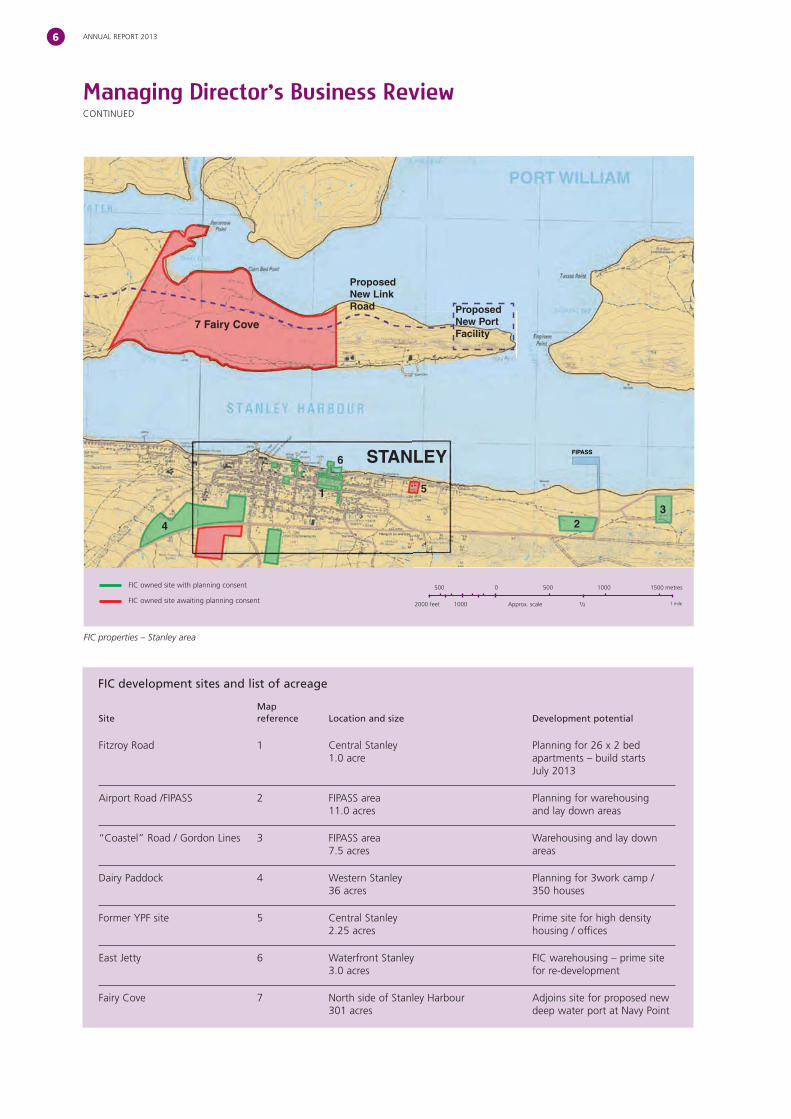
FIC development sites and list of acreage
Site Map reference Location and size Development potential
Fitzroy Road 1 Central Stanley 1.0 acre
Planning for 26 x 2 bed apartments – build starts July 2013
Airport Road /FIPASS 2 FIPASS area 11.0 acres
Planning for warehousing and lay down areas
“Coastel” Road / Gordon Lines 3 FIPASS area 7.5 acres
Warehousing and lay down areas
Dairy Paddock 4 Western Stanley 36 acres
Planning for 3work camp / 350 houses
Former YPF site 5 Central Stanley 2.25 acres
Prime site for high density housing / offices
East Jetty 6 Waterfront Stanley 3.0 acres
FIC warehousing – prime site for re-development
Fairy Cove 7 North side of Stanley Harbour 301 acres
Adjoins site for proposed new deep water port at Navy Point
FIC properties – Stanley area
2000 feet 1000
500 500 1000 1500 metres0
Approx. scale 1 mile1/2
FIC owned site with planning consent
FIC owned site awaiting planning consent

FALKLAND ISLANDS HOLDINGS PLC 7
Surveys were undertaken on a number of FIC sites in preparation for development. Planning permission has been obtained and work is in progress on the following projects:
apartments.
Place – including space for external tenants.
Other projects currently being progressed are:
18.5 acres site above the FIPASS port facility in East Stanley.
Stanley.
Capital expenditure of £1.3 million was incurred in the Falklands in the year including the building of the Falklands 4x4 showroom and construction plant and equipment and vehicles.
FIC’s property rental portfolio currently comprises nine houses in Marmont Row and a further 23 properties in Stanley which are let to corporate clients, private individuals and staff. With the departure of the Leiv Eirikkson rig in December 2012 the demand for corporate lettings has temporarily decreased and rental income fell by 14% to £0.3 million in the year to 31 March 2013.
shop traded well despite a 15% fall in the number of cruise ship visitors and DIY and building material sales were little changed.
The motor business now branded as Falklands 4x4 benefited from the opening in November 2012 of the new Land Rover show room in central Stanley and sales increased by 19% despite a lack of military orders. Vehicle hire also performed well.
Revenues from third party freight and port services fell by 18% without the benefit of the demobilisation of the Ocean Guardian rig in December 2011 which had boosted revenues last year.
Support services saw revenues fall by 5% largely as a result of the reduction in the number of cruise ship visitors; although the problem had largely been resolved by the year end. FIC’s Fishing Agency had another encouraging year and insurance broking and FIC’s international removals business maintained their contribution.
The increasing demand for building services has led to a rapid expansion in Falkland Building Services (FBS) which is working on internal projects and smaller external contracts: revenues grew by 13% to £0.76 million in the year. The Government’s provision of subsidised housing plots in Stanley has created a market for house building and during the year FBS successfully completed its first two houses; levels of interest for further work are encouragingly high. These jobs and internal projects mean that FBS already has over 30 employees.
In addition in June 2012 a joint venture, the South Atlantic Construction Company, (SATCO) was set up with Trant Construction; SATCO will be bidding for some of the infrastructure contracts generated by oil development.
ANNUAL REPORT 20138
PHFC operating results
Year ended 31 March 2013
£m
2012
£m
Change
%
Revenues
Ferry fares 3.89 3.97 (2.0)
Cruising and Other revenue 0.19 0.19 0.0
Total PHFC revenue 4.08 4.16 (1.9)
Underlying PHFC operating profit 0.98* 1.09* (10.1)
Underlying operating profit margin (%) 24.0 26.2 (8.4)
Passengers carried (000s) 3,033 3,328 (8.9)
* Operating profit is shown before charging finance lease interest of £0.24 million (2012 £0.18 million) relating to the new Pontoon.
Managing Director’s Business ReviewCONTINUED
Portsmouth Harbour Ferry Company (PHFC )In 2012-13 changes to travel allowances for Ministry Of Defence employees led to an unexpected decline in commuter traffic and total passengers carried fell by 9%. This followed a decline of 2.1% in the prior year which was achieved despite a substantial increase in fares to fund the lease costs of the Gosport pontoon. Ferry fare revenues declined by 2% and operating profits, (before pontoon lease finance costs of £0.24 million) decreased by £0.11 million to £0.98 million (2012: £1.09 million).
Passenger numbers fell from the start of the financial year when the MoD changed its policy of reimbursing “Home to Duty” ferry fares for its staff at the Portsmouth
Dockyard. As a result, some MoD commuters changed to travelling around the harbour by car and bus causing an estimated decline of 3,500 passenger journeys a week and leading to a fall in peak working week ferry traffic of 11.4%. Weekends were much less affected and fell by 3.3%.
We expect the impact of the MoD change to have been a one off step change and no further such changes to the ferry’s customer base are anticipated. Discussions are being held with MoD officials to explore the options for changing their policy which is costly to the Treasury and leads to increased road congestion and pollution.
Ferry fares were increased by an average of 3.5% in June 2012, bringing the total cost of an adult return to £2.80. Discounted fares for regular customers, and lower tariffs for senior citizens and children (£1.80 return) reinforce the excellent value for money offered by the ferry service compared to bus and car travel. The ferry’s record for reliability was maintained with on time departures at 99.5% for its 70,000 departures
The 50 year lease that secures PHFC’s use of the new landing stage in Gosport was completed in December 2012. We now plan to complete the modernisation of the ferry fleet and a third modern ferry is being commissioned for delivery in Q3 2014. It is anticipated that the cost of some £3.3 million will be financed by a 10 year bank loan. The new vessel will offer improved passenger facilities and will have an estimated working life of over 30 years. No further significant expenditure on new vessels is anticipated in the next decade.
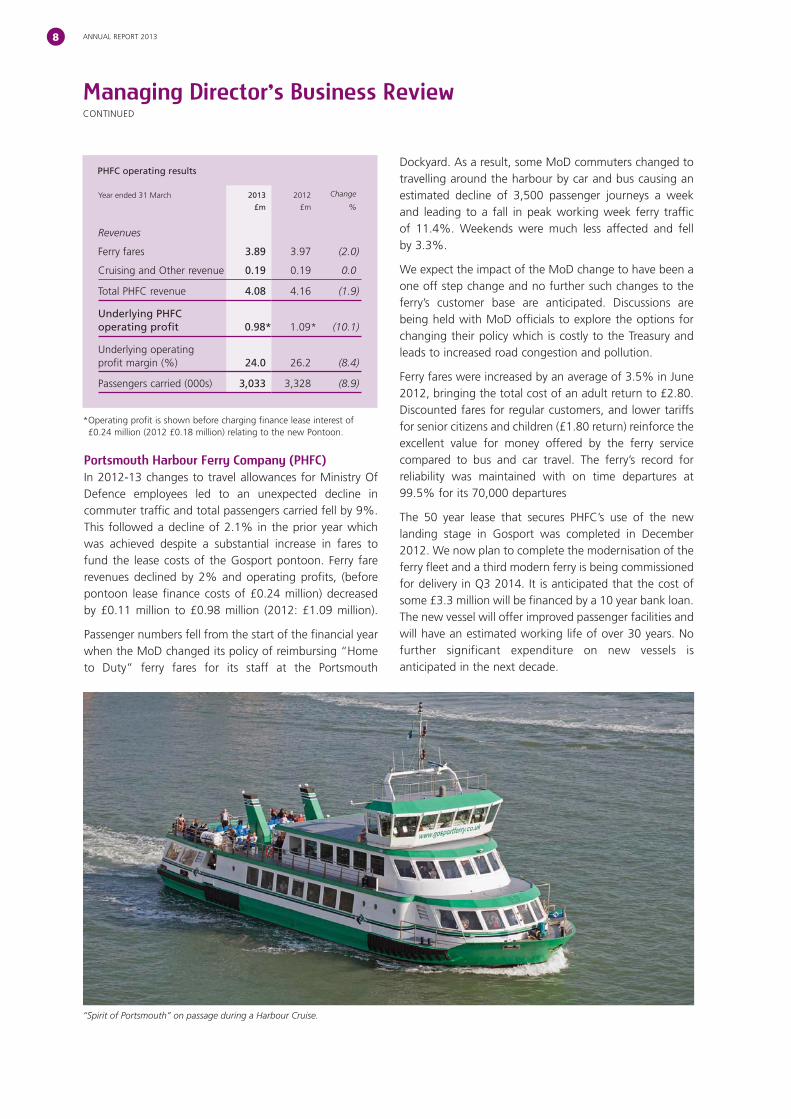
“Spirit of Portsmouth” on passage during a Harbour Cruise.
FALKLAND ISLANDS HOLDINGS PLC 9
MomartRecent record auction results confirm the continuing strength of the global art market and Momart has continued to build on its expertise and capability as a world class art handler and installer. A presence has been maintained at the major international fairs including Art Basel, Frieze London and Miami Basel, relationships have been strengthened with leading auction houses and galleries and major international exhibitions have been secured. With a strong network of international partners and an enviable reputation for quality Momart is expected to enjoy further growth.
Momart Operating results
Year ended 31 March 2013
£m
2012
£m
Change
%
RevenuesMuseums and public exhibitions 9.01 7.05 27.8
Commercial gallery services 5.50 6.30 (12.7)
Storage 1.79 1.62 10.5
Total Momart revenue 16.30 14.97 8.9
Underlying Momart operating profit 1.19 0.96 24.0
Underlying operating profit margin (%) 7.3 6.4 14.1
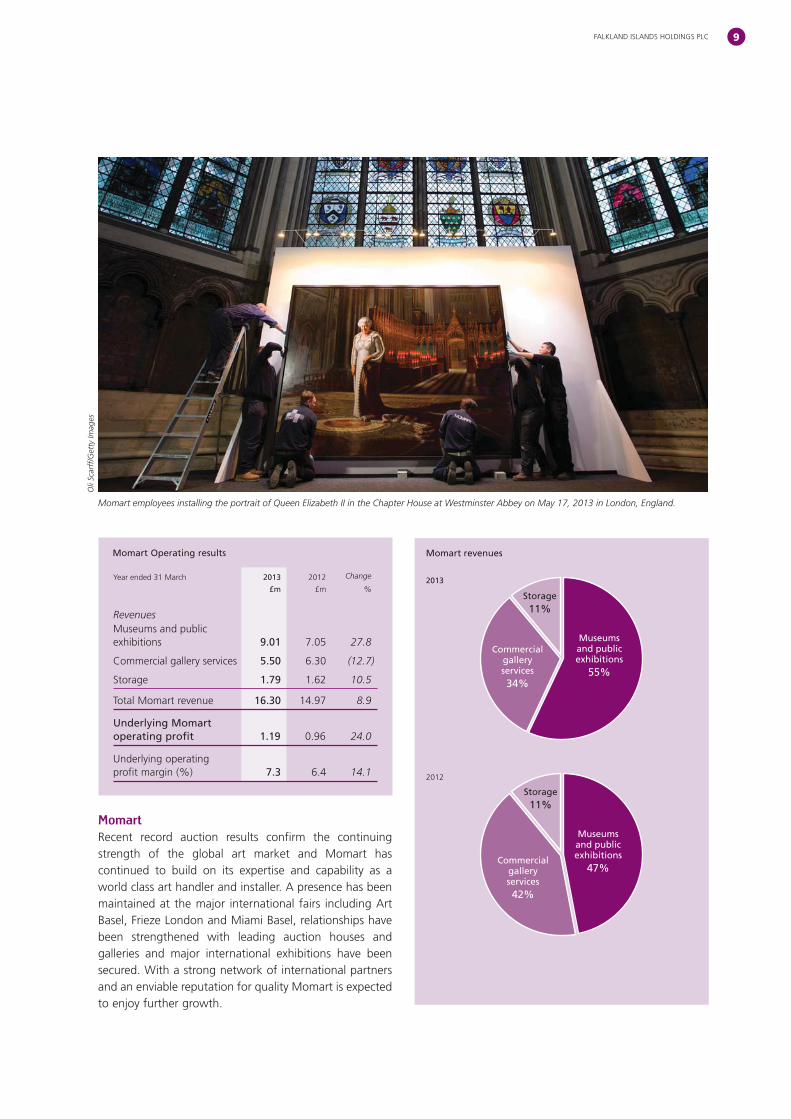
Momart employees installing the portrait of Queen Elizabeth II in the Chapter House at Westminster Abbey on May 17, 2013 in London, England.
Oli
Scar
ff/G
etty
Imag
es
2013
2012
Momart revenues
Storage11%
Museums and public exhibitions
55%
Commercial gallery services34%
Storage11%
Museums and public exhibitions
47%Commercial
gallery services42%

ANNUAL REPORT 201310
Momart produced another strong trading performance. The growth seen in the first half of the year continued into 2013 and total revenue for the year increased by 9% to £16.3 million (2012: £15.0 million) while underlying operating profit increased by 24% to £1.19 million from £0.96 million in 2012. This was arrived at, after charging the costs of moving to new offices and staff re-organisation costs of £0.2 million.
ExhibitionsExhibition activity remained buoyant throughout the year with revenues increasing by 28% to £9 million. Momart’s reputation for quality of service and technical mastery of complex installations helped deliver prestigious major contracts including the Bronze and Manet exhibitions at the Royal Academy, Ice Age Art and Pompeii at the British Museum, Schwitters at Tate Britain and Man Ray at the National Portrait Gallery. Improved operational efficiency helped by the introduction of the first modules of a new ERP system saw gross margins improve despite continued pressure on pricing. As a result the profit contribution from Exhibitions matched that of Gallery Services for the first time in many years.
Gallery ServicesGallery Services (GS) revenues were 13% lower than 2012 but a large one-off international contract benefitted last year and excluding this, GS revenues grew by 2%. More importantly gross margins increased by 4% as resources were concentrated on more complex added value contracts.
StorageStorage revenues continued to increase with annual revenues up by 10% at £1.79 million. With full occupancy achieved in the year, plans are being progressed for additional warehouse facilities.
FOGL investmentDetails of the Group’s shareholding in FOGL are set out below:
31 March 2013
Number of shares held 12,825,000
FOGL share price (bid price) 26.5p
Market value of holding £3.4m
Cost £2.6m
Book cost per share 20.0p
The market value of the shareholding on 7 June 2013 was £3.3 million.
Trading outlookThe Group’s prospects for growth in the medium term are outstanding; Momart is expected to maintain its positive momentum and FIC is uniquely positioned to benefit as the Falkland Islands prepares for oil.
At PHFC the arrival of a new ferry in 2014 will complete the modernisation of the fleet and underpin operations for the future, while passenger numbers will be dependent on the economic climate in the Portsmouth area.
In the Falklands, the absence of a drilling rig will constrain growth this year, although this may be offset by an early start to infrastructure projects. However, once work on the Sea Lion project commences onshore, the Falklands economy will experience dramatic growth. The Group is in a strong financial position and is investing now in order to be able to take advantage of opportunities.
John Foster
Managing Director
10 June 2013
Managing Director’s Business ReviewCONTINUED

FALKLAND ISLANDS HOLDINGS PLC 11
Managing Director’s Financial Review
Summary income statement
Year ended 31 March 2013
£m
2012
£m
Change
%
Group revenue 35.60 34.11 4.4
Underlying operating profit 3.50 3.57 (2.0)
Net financing costs (0.21) (0.33) (36.4)
Underlying profit before tax 3.29 3.24 1.5
Less: Fund raising costs (0.68) – –
Gain on sale of FOGL shares 0.77 – –
Net settlement loss on disposal of the PHFC pension scheme (0.18) – –
Amortisation of intangibles (0.40) (0.40) –
Profit before tax as reported 2.80 2.84 (1.4)
Revenue and underlying operating profitGroup revenue rose to £35.6 million and Group underlying operating profit fell slightly to £3.5 million in the year ended 31 March 2013. These are discussed in more detail above in the Review of Operations.
Non-trading items Non-trading items comprise a profit of £0.77 million on the sale in June 2012 of 1,175,000 FOGL shares, costs of £0.68 million relating to the £10.0 million equity fund raising in July 2012, and a £0.18 million settlement loss incurred on the disposal of the PHFC pension scheme to Legal and General during the year.
Net financing costsThe Group’s net financing costs fell to £0.21 million from £0.33 million after crediting a £0.16 million increase in interest earned on bank deposits, and a decrease in bank interest payable reflecting the reduction of £1 million in bank loans. This was partially offset by a full year of finance costs on the Gosport pontoon.
Underlying pre-tax profit The Group’s underlying pre-tax profits (PBT) increased by £0.05 million (1.5%) to £3.29 million (2012: £3.23 million).
Reported pre-tax profit After charging £0.4 million for the amortisation of intangible assets (2012: £0.4 million), and the other non-trading items noted above, reported profit before tax for the Group decreased by 1.4% to £2.80 million (2012: £2.84 million).
Taxation The Group pays corporation tax at 24% on its UK earnings and 26% on its Falkland Islands earnings. In previous years, the Falklands Islands Company Limited (FIC) was taxed in both jurisdictions, however from 1 April 2012 FIC has elected to apply a foreign branch exemption, and as a result of this will no longer be required to pay UK corporation tax and will gain full benefit of the tax allowability in the Falkland Islands of expenditure on commercial and industrial buildings.
Earnings per share
Year ended 31 March 2013
£m
2012
£m
Change
%
Underlying profit before tax 3.29 3.24 1.5
Taxation on underlying profit (0.80) (0.82) (2.4)
Underlying profit after tax 2.49 2.42 2.9
Diluted average number of shares in issue (thousands) 11,704 9,239 26.7
Effective underlying tax rate 24.2% 25.3% (4.3)
Diluted EPS 21.3p 26.2p (18.7)
Fully diluted Earnings per Share (EPS) derived from underlying profits, decreased by 18.7% to 21.3p (2012: 26.2p). This reflects the 26.7% increase in the diluted average number of shares, which has increased due to the 33% increase in the share capital of the Company resulting from the share subscription and fund raising in July 2012.
ANNUAL REPORT 201312
Balance sheetThe Group’s Balance Sheet remains strong. Total net assets increased by £4.8 million from £29.5 million in the prior year to £34.3 million as at 31 March 2013 due to the net £9.9 million increase in share capital from the July equity raise, offset by a £4.9 million fall in the market value of the Group’s investment in FOGL whose share price fell over the year from 64.5 pence to 26.5 pence.
Retained earnings after the payment of tax and dividends increased by £0.3 million to £13.6 million (2013: £13.3 million). Bank borrowings fell to £2.0 million (2012: £3.0 million) and the Group had UK cash balances of £11.4 million (2012: £2.8 million).
The carrying value of intangible assets was reduced by annual amortisation charges of £0.4 million to £12.3 million as at 31 March 2013 (2012: £12.7 million) (see note 11).
The net book value of property, plant and equipment increased by £0.8 million to £13.7 million (2012: £12.9 million) after capital investment of £2.2 million, including £1.3 million in the Falkland Islands (see note 12).
The Group owns investment properties comprising commercial and residential properties in the Falkland Islands held for rental, together with approximately 400 acres of undeveloped land in and around Stanley. This includes 18 acres for industrial development, 25 acres of prime mixed-use land and potentially 300 acres for future port related development. FIC has planning consent for approximately 30 residential units which are being built to augment the company’s rental portfolio and consent for the development of warehousing and storage areas on its industrial land in East Stanley.
During the year, the Marmont Row heritage cottages (book value £1.0 million) were transferred from current assets to investment properties, reflecting the decision to retain them in the rental portfolio. At 31 March 2013 the net book value of land and investment properties, following this transfer was £2.8 million (2012: £1.5 million).
The value of the investment properties owned by FIC has been reviewed by a Director of FIC who is a Chartered Surveyor and is resident in the Falkland Islands using guidelines provided by the Royal Institution of Chartered Surveyors (RICS) (Red Book). At 31 March 2013 the fair value of this property portfolio was estimated at £5.7 million (31 March 2012: £3.9 million). This valuation includes £1.5 million for the Marmont Row properties. As oil development proceeds, the value of these properties is expected to increase significantly.
The Group’s 4% shareholding in FOGL is discussed in the Chairman’s Statement and Managing Director’s Business Review.
Deferred tax assets relating to future pension liabilities increased to £0.67 million (2012: £0.59 million). These deferred tax assets relating to future pension liabilities now only include the deferred tax on the FIC unfunded scheme calculated by applying the 26% Falklands tax rate. In the prior year, in accordance with IFRS requirements, the deferred tax was based on the UK tax rate of 24%.
Non-property related inventories largely representing stock held for resale in the Group’s retail operations in the Falkland Islands increased by £1.1 million to £5.1 million at 31 March 2013. The increase in stock results from FBS stock and the timing of shipments to the Islands.
Trade and Other Receivables increased by £0.5 million to £6.1 million at 31 March 2013. Average debtor days outstanding were 57.1 (2012: 57.7).
Outstanding finance leases totalled £5.3 million (2012: £5.3 million). £4.9 million of which is in respect of the 50 year Gosport Pontoon lease.
Corporation tax due for payment within the next 12 months is £0.4 million (2012: £0.5 million).
This is lower than the £0.8 million taxation charge on trading, as £0.3 million of the 2013 tax charge has been paid in installments in advance as required by HMRC.
Managing Director’s Financial ReviewCONTINUED

FALKLAND ISLANDS HOLDINGS PLC 13
Trade and other payables increased from £8.8 million to £10.0 million at 31 March 2013 reflecting increased trading activity.
At 31 March 2013 the liability due in respect of the Group’s defined benefit pension schemes was £2.6 million (2012: £2.5 million). The pension scheme in the Falkland Islands, which was closed to new entrants in 1988 and to further accrual in 2007, is unfunded and liabilities are met as they fall due from operating cash flow. Responsibility for the obligations under the defined benefit scheme for the Portsmouth Harbour Ferry Company was transferred to Legal and General during the year and the Group has no remaining liability.
The net deferred tax liabilities, excluding the pension asset at 31 March 2013 increased by £0.6 million to £1.7 million (2012: £1.1 million) due principally to the a £0.6 million increased deferred tax charge on the fixed assets held in the Falklands arising from timing differences on commercial industrial buildings calculated in accordance with IFRS. Falklands tax legislation permits capital allowances of 10% to be claimed on the majority of the FIC properties. With such assets depreciated over 20-50 years a temporary timing difference is produced on which deferred tax must be provided. In previous years because UK legislation had abolished Industrial buildings allowances expenditure on such buildings was disallowed and as a result higher levels of tax were paid. Following the foreign branch exemption the Group will now gain the benefit of tax allowability on buildings in the Islands reducing the total amount of tax paid in the future.
Net assets per share were 276p at 31 March 2013 (2012: 317p) largely as a result of the lower carrying value of the Group’s holding in FOGL at the year end.
Cash flows
Operating cash flow Net cash flow from operating activities decreased from £4.6 million last year to £3.5 million, primarily due to an increase in working capital as Falkland Islands prepared for future growth.
The Group’s Cash Flow can be summarised as follows:
Year ended 31 March 2013
£m
2012
£m
Underlying PBT 3.3 3.2
Depreciation 1.2 1.1
Net Interest payable 0.2 0.3
Underlying EBITDA 4.7 4.6
(Increase)/decrease in working capital (0.5) 0.8
Tax paid (0.7) (0.9)
Other – 0.1
Net cash flow from operating activities 3.5 4.6
Net proceeds of fund raising 9.2 0.3
Sale of 1.2 million FOGL shares 1.0 –
Less:
Capital expenditure (2.4) (1.3)
Purchase of 2 million FOGL shares – (0.9)
Disposal of PHFC pension scheme (0.3) –
Loan repayments and net bank interest received/(paid) (1.0) (1.2)
Dividends paid (1.4) (0.9)
Other – 0.1
Net inflow/(outflow) from financing and investing activities 5.1 (3.9)
Net cash flow 8.6 0.7
Cash balance b/fwd 2.8 2.1
Cash balance c/fwd 11.4 2.8
ANNUAL REPORT 201314
Financing outflows During the year the Group received £9.9 million from the issue of new shares and £1.0 million from the sale of 1.2 million FOGL shares. The Group paid increased dividends of £1.4 million (2012: £0.9 million) and capital investment totalled £2.4 million (2012: £1.3 million); of which £1.3 million was invested in Stanley including in the new 4x4 show room, further property development and the purchase of construction equipment. At Momart capital expenditure included replacement vehicles and the fitting out of new offices at Canary Wharf.
Expenses related to the share subscription were £0.7 million and closure costs required to buy out the PHFC pension scheme amounted to £0.3 million. (Under IFRS £0.18 million of the costs of the scheme’s closure was charged in the income statement and the balance taken through reserves).
Scheduled loan repayments of £1.1 million were made reducing bank debt to £2.0 million.
With a net inflow from financing and investment of £5.1 million (2012: £3.9 million outflow) the Group generated a net cash inflow for the year of £8.6 million (2012: £0.7 million).
Business drivers, risk factors and key performance indicators
Business driversAll the Group’s businesses are consumer oriented and their success is linked to general economic conditions in their markets. Inflation, employment levels, interest rates and government spending programmes all have an effect on disposable incomes and consumer confidence.
The Group’s businesses in the Falkland Islands and Gosport are based on local demand for their goods and services. In addition, demand is boosted by tourists and both locations have been affected by a cyclical reduction in the number of tourists and in the Falkland Islands by Argentinian pressure on cruise ship operators. In the Falklands the economy has been closely linked to the fishing industry which accounts for over 60% of GDP. The level of squid catches is variable and in particular Illex
squid, has experienced very large variations. Loligo, is more important to the economy because Falkland Companies own the fishing licences, and these catches are less variable. Since the start of exploration drilling in the north Falkland basin in 2010, offshore oil exploration has had a significant impact on the economy and this is expected to decline in the current year following the departure of the Leiv Eiriksson rig, however drilling activity is expected to resume in 2014. If oil exploration were to stop, this stimulus would cease and activity would revert to pre-2010 levels, conversely if hydrocarbon exploitation progresses as expected the positive impact on the Falkland Islands economy will be very significant.
For Momart, activity in the art market is linked to the performance of the world economy with increasing influence attributable to emerging economies in the Middle East, China, India and South America. Despite subdued economic conditions in the UK and Europe the global art market is still experiencing growth with continued demand for high quality artworks. In this market, the appetite for art from ultra high net worth individuals is the key driver. In the museums sector government funding and commercial sponsorship remain under pressure but attendances and interest in major exhibitions has continued to grow and helped museums maintain their income and attendances.
Income generated from cultural exports through travelling exhibitions is an important source of revenue for museums and galleries although in the near term privately sponsored exhibitions are likely to increase more than government funded exhibitions.
Risk factorsBoth the PHFC and FIC businesses are sensitive to changes in local economic conditions and employment levels in local government and businesses. The level of competition also affects performance. FIC faces competition in almost every area of its operations but due to the company’s long history and accumulated expertise, in most sectors in which it operates FIC has a leading market position. Maintaining leadership depends on continued innovation, investment and a commitment to customer service.
Managing Director’s Financial ReviewCONTINUED
FALKLAND ISLANDS HOLDINGS PLC 15
Argentina continues to claim sovereignty over the Falkland Islands. The British Government continues to re-affirm its commitment to defend the islands sovereignty in unequivocal terms and this stance was reinforced by the Falklands referendum in March 2013 where an overwhelming vote was recorded in favour of the maintenance of the Falklands status as a British Overseas Territory. Despite this Argentina has continued to protest and their attitude makes the development of commercial links with other South American countries difficult although the key trade and logistic links with the UK are unaffected. Argentina’s military capacity is much diminished since the conflict of 1982, whereas the Islands defences are much stronger. Argentina has expressly ruled out military action against the Falklands and the risk of such action is considered to be negligible. Diplomatic activity by Argentina is likely to continue, but for the foreseeable future it is not expected to have any impact on the status of the Falkland Islands or on the exploitation of hydrocarbons.
Although there is no directly competing service to the Portsmouth Harbour Ferry between Gosport and Portsmouth, customers are able to travel around the harbour by car or bus. Maintaining and promoting the relative attractions of using the ferry whether for commuting to work, shopping or for tourism is a key strategic focus. PHFC will continue to work closely with local government and other public transport providers to reinforce its advantages as the faster, more cost effective, and environmentally friendly alternative to travelling by car.
For Momart the physical security of artworks is of paramount importance and the company goes to great lengths to guard against the risk of theft or damage to the works in its care. The other risks faced by Momart are those factors which might impact the global art market. For instance a reduction in the personal wealth of collectors and investors could result in a contraction of personal or institutional budgets which would lead to a reduction in the movement and display of art. The emergence of new competitors could also affect the
business adversely. In addition, because much of Momart’s business involves working with overseas partners, volatility in the Sterling/Dollar and Sterling/Euro exchange rates has an impact on its cost base and profitability.
Key performance indicatorsAt Group level management attention is focussed on revenue, costs and the contribution generated by each business.
In the Falkland Islands businesses like-for-like revenue growth is a key measure of performance, especially for the retail outlets which account for two thirds of revenues. In addition to sales trends, gross margins by product costs are kept under close review.
At PHFC, passenger numbers and the average fare yield are monitored daily and weekly. Other key concerns are ferry reliability and passenger safety and operating costs and net profitability.
At Momart, forward sales projections order intake and conversion rates are constantly monitored and these are an important predictive indicator which facilitates forward planning. Direct costs and contribution from individual contracts are reviewed as are the level of indirect costs and overtime.
John Foster
Managing Director
10 June 2013

ANNUAL REPORT 201316
Board of Directors and Secretary
David Hudd (68) Chairman
David joined the Board as Chairman in 2002 and is also Chairman of the Nominations Committee. He is a Chartered
Accountant and was a partner in Price Waterhouse until 1982. Since then, he has been Chairman or Chief Executive
and a non-executive Director of a number of listed and unlisted companies. He was a founder director of Falkland Oil
and Gas Limited and remains a non-executive Director of that company.
John Foster (55) Managing Director
John joined the Board in 2005. He is a Chartered Accountant and previously served as Finance Director for software
company Macro 4 plc and toy retailer, Hamleys plc. Prior to joining Hamleys, he spent three years in charge of acquisitions
and disposals at FTSE 250 company Ascot plc and before that worked for nine years as a venture capitalist with a leading
investment bank in the City.
Mike Killingley (62) Non-executive Director
Mike joined the Board in 2005, having previously been appointed non-executive Chairman of the Portsmouth Harbour
Ferry Company Limited, following the Company’s successful bid. He is also a non-executive Director of an investment
trust, Amati VCT 2 plc, and Treasurer of the University of Southampton. He is a Chartered Accountant and was a partner
of KPMG (and predecessor firms) until 1998. Since then he has been non-executive Chairman of several quoted and
unquoted companies. He is Chairman of the Audit Committee and a member of the Remuneration Committee.
Jeremy Brade (51) Non-executive Director
Jeremy joined the Board in 2009. He is a Director of Harwood Capital Management where he is the senior private equity
partner. Jeremy has served on the boards of several private and publicly listed international companies. Formerly Jeremy
was a diplomat in the Foreign and Commonwealth Office, and before that an Army officer. He is Chairman of the
Remuneration Committee.
Edmund Rowland (27) Non-executive Director
Edmund was appointed to the Board on 16 April 2013. He currently serves as a Director of Blackfish Capital
Management, a specialist asset manager based in London and as an employee of Banque Havilland S.A (London
Branch), previously having gained experience in London and Hong Kong, as an analyst and investment manager
with BNP Paribas and Blackfish. He has broad experience of principal investing in both equity and credit capital
markets, with a focus on special situations.
Carol Bishop (39) Company Secretary
Carol Bishop joined the Company in December 2011. She is a Chartered Accountant and has previously worked for
London Mining plc, an AIM listed company as Group Reporting manager. Prior to this she spent three years at Hanson
plc and six years at the Peninsular and Oriental Steam Navigation Company.

FALKLAND ISLANDS HOLDINGS PLC 17
Directors’ Report
The Directors present their annual report and the financial statements for the Company and for the Group for the year ended
31 March 2013.
Results and dividend
The Group’s result for the year is set out in the Group Income Statement on page 22. The Group profit for the year after taxation
amounted to £1,604,000 (2012: £2,256,000). Underlying basic earnings per share were 21.6p (2012: 26.3p). The Directors recommend
a dividend of 7.5p per share (2012: 7.0p) which, if approved by shareholders at the forthcoming Annual General Meeting will be paid
on 18 September 2013 to shareholders on the register at close of business on 30 August 2013. With the interim dividend of 4.0p paid
in January 2013 (2012: 4.0p) this will take the total dividend for the year to 11.5p per share (2012: 11.0p) The proposed final dividend
has not been included in creditors as it was not approved before the year end. Dividends paid during the year comprise a dividend
of 7.0p per share in respect of the previous year ended 31 March 2012 and an interim dividend of 4.0p per share in respect of the
current year.
Principal activities and business review
The business of the Group during the year ended 31 March 2013 was general trading in the Falkland Islands, the operation of a ferry
across Portsmouth Harbour and the provision of international arts logistics and storage services. The principal activities of the Group are
discussed in more detail in the Business Review on pages 4 to 10 and should be considered as part of the Directors’ Report for the
purposes of the requirements of the enhanced Directors’ Report guidance.
The principal activity of the Company is that of a holding company.
Directors
On 16 April 2013, Mr. Edmund Rowland was appointed as a non-executive Director of the Company, representing Blackfish Capital
Management Limited, the fund manager of Blackfish Capital Alpha Fund SPC – Blackfish Talisman Fund, which is a 20.1% shareholder
in FIH.
Directors’ interests
The interests of the Directors in the issued shares and share options over the shares of the Company are set out below under the
heading “Directors’ interests in shares” on page 19. During the year no Director had an interest in any significant contract relating to
the business of the Company or its subsidiaries other than his own service contract.
Health and safety
The Group is committed to the health, safety and welfare of its employees and third parties who may be affected by the Group’s
operations. The focus of the Group’s effort is to prevent accidents and incidents occurring by identifying risks and employing
appropriate control strategies. This is supplemented by a policy of investigating and recording all incidents.
Employees
The Board is aware of the importance of good relationships and communication with employees. Where appropriate, employees are
consulted about matters which affect the progress of the Group and which are of interest and concern to them as employees. Within
this framework, emphasis is placed on developing greater awareness of the financial and economic factors which affect the performance
of the Group. Employment policy and practices in the Group are based on non-discrimination and equal opportunity irrespective of age,
race, religion, sex, colour and marital status. In particular, the Group recognises its responsibilities towards disabled persons and does
not discriminate against them in terms of job offers, training or career development and prospects. If an existing employee were to
become disabled during the course of employment, every practical effort would be made to retain the employee’s services with
whatever retraining is appropriate. The Group’s pension arrangements for employees are summarised in note 25 on pages 55 to 60.
Share capital and substantial interests in shares
During the year the Group issued 3,119,837 shares by means of a placing and open offer at 320 pence per share to raise £10.0 million
before expenses to provide funds to invest in the Group’s businesses in the Falkland Islands. In addition 14,219 share options were
exercised (2012: 77,153).
Further information about the Company’s share capital is given in note 27 on page 62. Details of the Company’s executive share option
scheme and employee ownership plan can be found on page 19 and in note 26 on pages 61 and 62.

ANNUAL REPORT 201318
Directors’ ReportCONTINUED
The Company has been notified of the following interests in 3% or more of the issued ordinary shares of the Company as at 31 March 2013.
Number of shares Percentage of shares in issue
Blackfish Capital Alpha Fund SPC – Blackfish Talisman Fund 2,500,000 20.1
Fidelity Investments International 809,914 6.5
L S Licht 734,810 5.9
Payments to suppliers
The policy of the Company and each of its trading subsidiaries, in relation to all its suppliers, is to settle the terms of payment when
agreeing the terms of the transaction and to abide by those terms, provided that it is satisfied that the supplier has provided the goods
or services in accordance with agreed terms and conditions. The Group does not follow any code or standard payment practice. As a
holding company, the Company had no trade creditors at either 31 March 2013 or 31 March 2012.
Charitable and political donations
Charitable donations made by the Group during the year amounted to £19,443 (2012: £15,560), largely to local community charities
in Gosport and the Falkland Islands. There were no political donations in the year (2012: nil).
Disclosure of information to auditors
The Directors who held office at the date of this Directors’ Report confirm that, so far as they are each aware, there is no relevant audit
information of which the Company’s auditor is unaware; and each Director has taken all the steps that they ought to have taken as a
Director to make themselves aware of any relevant audit information and to establish that the Company’s auditor is are aware of that
information.
Auditors
KPMG Audit Plc have notified the company that they are not seeking reappointment. A resolution proposing the appointment of KPMG LLP
will be put to shareholders at the Annual General Meeting.
Annual General Meeting
The Company’s Annual General Meeting will be held at the London offices of FTI Consulting, Holborn Gate, 26 Southampton Buildings,
WC2A 1PB at 14:30 on 20 August 2013. The Notice of the Annual General Meeting and a description of the special business to be put
to the meeting are considered in a separate Circular to Shareholders which accompanies this document.
Details of Directors’ remuneration and emoluments
The remuneration of non-executive Directors consists only of annual fees for their services both as members of the Board and of
Committees on which they serve.
An analysis of the remuneration and taxable benefits in kind (excluding share options) provided for and received by each Director
during the year to 31 March 2013 and in the preceding year follows:
Salary
£’000
Bonuses
£’000
2013
Total
£’000
2012
Total
£’000
David Hudd 125 90 215 166
John Foster 191 87 278 272
Mike Killingley 35 – 35 30
Jeremy Brade 30 – 30 25
381 177 558 493

FALKLAND ISLANDS HOLDINGS PLC 19
None of the Directors of the Company receive any pension contributions or benefit from any Group pension scheme.
The Executive Directors participate in annual performance related bonus arrangements. The Chairman had the potential during the year
of earning up to 80% of his salary and the Managing Director up to 75%. The bonuses are subject to the achievements of specified
corporate and personal objectives.
Directors’ interests in sharesAs at 31 March 2013 and 31 March 2012, the share options of executive Directors may be summarised as follows:
Date of grant
Number of shares
D L Hudd
Number of shares
J L Foster Exercise price Exercisable from Expiry date
10 Feb 2005 – 57,692 £5.200 10 Feb 2008 9 Feb 2015
14 Jun 2005 49,411 14,117 £4.250 14 Jun 2008 13 Jun 2015
7 Aug 2007 – 27,517 £3.300 7 Aug 2010 6 Aug 2017
15 Jul 2009 43,674 44,550 £2.900 15 Jul 2013 14 Jul 2019
21 Dec 2010 20,000 20,000 £3.425 21 Dec 2013 20 Dec 2020
13 Aug 2012 61,881 76,700 £4.040 13 Aug 2015 13 Aug 2022
Total 174,966 240,576
The mid-market price of the Company’s shares on 31 March 2013 was 332.5 pence and the range in the year was 300.0 pence to
413.2 pence.
The Directors’ options extant at 31 March 2013 totalled 415,542 and represented 3.3% of the Company’s issued share capital. The
445,802 remaining options are held by 52 other employees of the Group including subsidiary directors and senior management. Under
the Company’s executive share option scheme, executive Directors and senior executives have been granted options to acquire ordinary
shares in the Company after a period of three years from the date of the grant. All outstanding options have been granted at an option
price of not less than market value at the date of the grant. The exercise of options is subject to various performance conditions, which
have been determined by the remuneration committee after discussion with the Company’s advisors.
In addition to the share options set out above, the interests of the Directors, their immediate families and related trusts in the shares
of the Company according to the register kept pursuant to the Companies Act 2006 were as shown below:
Ordinary shares
as at 31 March 2013
Ordinary shares
as at 31 March 2012
David Hudd 110,630 100,000
John Foster 25,584 15,000
Mike Killingley 16,000 10,000
Jeremy Brade 10,000 4,000
Edmund Rowland 2,500,000* –
* Edmund Rowland is a Director of Blackfish Capital Management Limited, the fund manager of Blackfish Capital Alpha Fund SPC – Blackfish Talisman Fund, which holds 2,500,000 shares. He does not hold any shares directly in the Company.
Share Incentive Plan
In November 2012, the Company implemented an HMRC approved Share Incentive Plan (SIP) available to employees of the Group, which
enables UK and Falklands staff to acquire shares in the Company through monthly purchases of up to £125 per month or 5%
of salary, whichever is lower. For each three shares purchased by the employee, the Company contributes one free matching share. These
shares are placed in trust and if they are left in trust for at least five years, they can be removed free of UK income tax and national insurance
contributions. During the year ended 31 March 2013 the Company purchased £500 of matching shares for Mr D Hudd and Mr J Foster.

ANNUAL REPORT 201320
Directors’ ReportCONTINUED
Statement of Directors’ responsibilities in respect of the Directors’ Report and financial statements
The Directors are responsible for preparing the Annual Report and the Group and Company financial statements in accordance with
applicable law and regulations.
Company law requires the Directors to prepare Group and Company financial statements for each financial year. As required by
the AIM rules of the London Stock Exchange, they are required to prepare the Group financial statements in accordance with IFRSs
as adopted by the European Union and applicable laws and have elected to prepare the Parent Company financial statements on the
same basis.
Under company law the Directors must not approve the financial statements unless they are satisfied that they give a true and fair view
of the state of affairs of the Group and Company and of their profit or loss for that period.
In preparing each of the Group and Company financial statements, the Directors are required to:
will continue in business.
The Directors are responsible for keeping adequate accounting records that are sufficient to show and explain the Company’s
transactions and disclose with reasonable accuracy at any time the financial position of the Company and enable them to ensure that
its financial statements comply with the Companies Act 2006. They have a general responsibility for taking such steps as are reasonably
open to them to safeguard the assets of the Group and to prevent and detect fraud and other irregularities.
Under applicable law and regulations the Directors are also responsible for preparing a Directors’ Report, Directors’ Remuneration
Report and Corporate Governance Statement that comply with that law and those regulations.
The Directors are responsible for the maintenance and integrity of the corporate and financial information included on the Company’s
website. Legislation in the UK governing the preparation and dissemination of financial statements may differ from legislation in other
jurisdictions.
The Directors confirm, to the best of their knowledge that:
assets, liabilities, financial position and profit of the Company and the undertakings included in the consolidation as a whole; and
development and performance of the business and of the position of the Company and the undertakings included in the
consolidation taken as a whole, together with a description of the principal risks and uncertainties that they face.
Approved by the Board and signed on its behalf by:
Carol Bishop Kenburgh Court
Company Secretary 133-137 South Street
10 June 2013 Bishop’s Stortford
Hertfordshire
CM23 3HX
FALKLAND ISLANDS HOLDINGS PLC 21
Independent Auditor’s Report to the members of Falkland Islands Holdings plc
We have audited the financial statements of Falkland Islands Holdings plc for the year ended 31 March 2013 set out on pages 22 to 71.
The financial reporting framework that has been applied in their preparation is applicable law and International Financial Reporting
Standards (IFRSs) as adopted by the EU and, as regards the parent company financial statements, as applied in accordance with the
provisions of the Companies Act 2006.
This report is made solely to the company’s members, as a body, in accordance with Chapter 3 of Part 16 of the Companies Act 2006.
Our audit work has been undertaken so that we might state to the company’s members those matters we are required to state to them
in an auditor’s report and for no other purpose. To the fullest extent permitted by law, we do not accept or assume responsibility to
anyone other than the company and the company’s members, as a body, for our audit work, for this report, or for the opinions we have
formed.
Respective responsibilities of Directors and auditors
As explained more fully in the Directors’ Responsibilities Statement (set out on page 20) the directors are responsible for the preparation
of the financial statements and for being satisfied that they give a true and fair view. Our responsibility is to audit, and express an
opinion on, the financial statements in accordance with applicable law and International Standards on Auditing (UK and Ireland). Those
standards require us to comply with the Auditing Practices Board’s (APB’s) Ethical Standards for Auditors.
Scope of the audit of the financial statements
A description of the scope of an audit of financial statements is provided on the Financial Reporting Council’s website at
www.frc.org.uk/auditscopeukprivate.
Opinion on financial statements
In our opinion:
2013 and of the group’s profit for the year then ended;
applied in accordance with the provisions of the Companies Act 2006; and
Opinion on other matter prescribed by the Companies Act 2006In our opinion the information given in the Directors’ Report for the financial year for which the financial statements are prepared is
consistent with the financial statements.
Matters on which we are required to report by exception
We have nothing to report in respect of the following matters where the Companies Act 2006 requires us to report to you if,
in our opinion:
from branches not visited by us; or
Wayne Cox (Senior Statutory Auditor)
For and on behalf of KPMG Audit Plc, Statutory Auditor
Chartered Accountants
St Nicholas House
Park Row
Nottingham NG1 6FQ
10 June 2013

ANNUAL REPORT 201322
Consolidated Income StatementFOR THE YEAR ENDED 31 MARCH 2013
Notes
Before
amortisation
and non-
trading items
2013
£’000
Amortisation
of intangibles
and non-
trading items
(note 5)
2013
£’000
Total
2013
£’000
Before
amortisation
of intangibles
2012
£’000
Amortisation
of intangibles
and non-
trading items
(note 5)
2012
£’000
Total
2012
£’000
4 Revenue 35,596 – 35,596 34,109 – 34,109
Cost of sales (21,178) – (21,178) (20,131) – (20,131)
Gross profit 14,418 – 14,418 13,978 – 13,978
Other administrative expenses (10,916) – (10,916) (10,410) – (10,410)
Fund raising expenses – (682) (682) – – –
15 Gain on sale of FOGL shares – 768 768 – – –
25
Net settlement loss on the transfer of the PHFC pension scheme – (182) (182) – – –
11 Amortisation of intangible assets – (398) (398) – (398) (398)
Operating expenses (10,916) (494) (11,410) (10,410) (398) (10,808)
Operating profit 3,502 (494) 3,008 3,568 (398) 3,170
Finance income 280 – 280 123 – 123
Finance expense (491) – (491) (457) – (457)
8 Net financing costs (211) – (211) (334) – (334)
Profit / (loss) before tax from continuing operations 3,291 (494) 2,797 3,234 (398) 2,836
9 Taxation (796) (397) (1,193) (817) 237 (580)
Profit / (loss) for the year attributable to equity holders of the Company 2,495 (891) 1,604 2,417 (161) 2,256
10 Earnings per share
Basic 21.6p 13.9p 26.3p 24.5p
Diluted 21.3p 13.7p 26.2p 24.4p
FALKLAND ISLANDS HOLDINGS PLC 23
Consolidated Statement of Comprehensive IncomeFOR THE YEAR ENDED 31 MARCH 2013
2013
£’000
2012
£’000
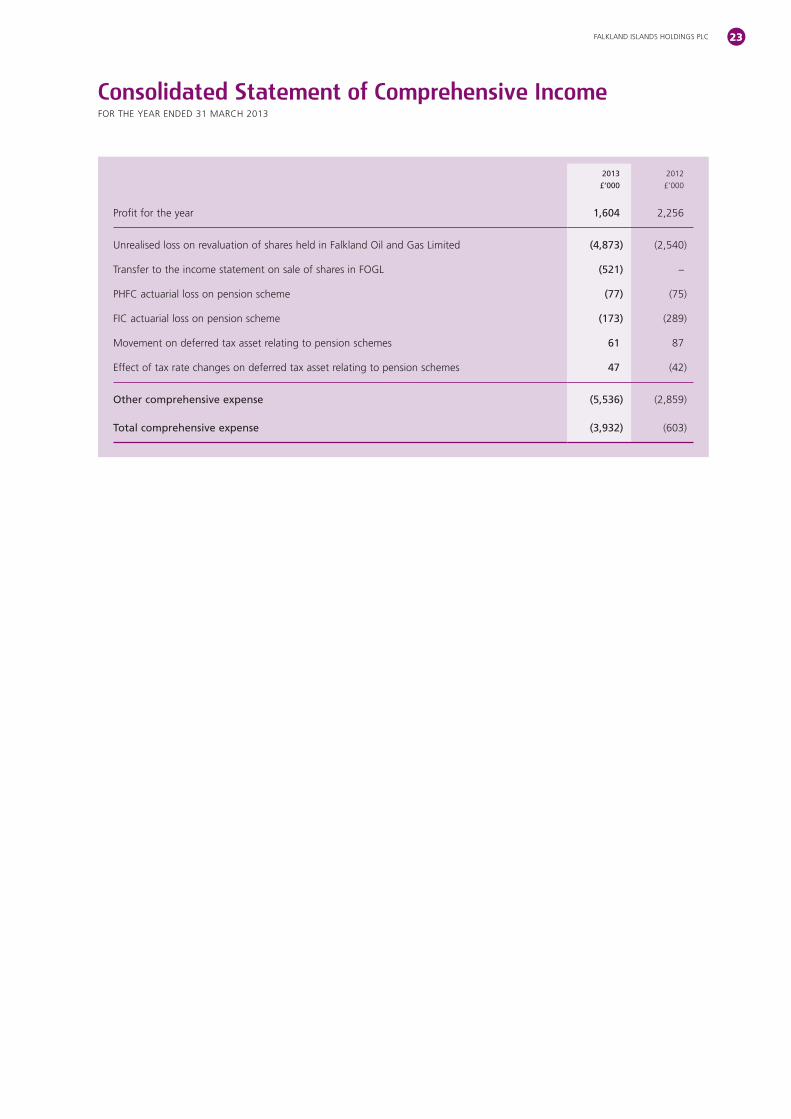
Profit for the year 1,604 2,256
Unrealised loss on revaluation of shares held in Falkland Oil and Gas Limited (4,873) (2,540)
Transfer to the income statement on sale of shares in FOGL (521) –
PHFC actuarial loss on pension scheme (77) (75)
FIC actuarial loss on pension scheme (173) (289)
Movement on deferred tax asset relating to pension schemes 61 87
Effect of tax rate changes on deferred tax asset relating to pension schemes 47 (42)
Other comprehensive expense (5,536) (2,859)
Total comprehensive expense (3,932) (603)

ANNUAL REPORT 201324
Notes
2013
£’000
2012
£’000
Non-current assets11 Intangible assets 12,315 12,713
12 Property, plant and equipment 13,725 12,911
13 Investment properties 2,786 1,452
15 Shares held in Falkland Oil and Gas Limited 3,399 9,030
16 Investment in Joint Venture 50 –
17 Non-current assets held-for-sale 20 20
18 Hire purchase debtors due in more than one year 121 150
19 Deferred tax assets 671 593
Total non-current assets 33,087 36,869
Current assets
Trading inventories 5,099 3,991
Property inventories – 1,010
20 Inventories 5,099 5,001
21 Trade and other receivables 6,133 5,620
18 Hire purchase debtors due in less than one year 486 385
22 Cash and cash equivalents 11,416 2,751
Total current assets 23,134 13,757
TOTAL ASSETS 56,221 50,626
Current liabilities
23 Interest-bearing loans and borrowings (1,149) (1,140)
Corporation tax payable (364) (508)
24 Trade and other payables (10,012) (8,753)
Total current liabilities (11,525) (10,401)
Non-current liabilities
23 Interest-bearing loans and borrowings (6,139) (7,145)
25 Employee benefits (2,584) (2,470)
19 Deferred tax liabilities (1,694) (1,122)
Total non-current liabilities (10,417) (10,737)
TOTAL LIABILITIES (21,942) (21,138)
Net assets 34,279 29,488
27 Capital and reserves
Equity share capital 1,243 930
Share premium account 17,447 7,871
Other reserves 1,162 1,162
Retained earnings 13,612 13,316
Financial assets fair value reserve 815 6,209
Total equity 34,279 29,488
Consolidated Balance SheetAS AT 31 MARCH 2013
These financial statements were approved by the Board of Directors on 10 June 2013 and were signed on its behalf by:
J L Foster
Director

FALKLAND ISLANDS HOLDINGS PLC 25
Company Balance SheetAS AT 31 MARCH 2013
Notes
2013
£’000
2012
£’000
Non-current assets
14 Financial assets – investments in subsidiaries 29,097 31,488
21 Other receivables 1,709 4,925
19 Deferred tax 4 5
Total non-current assets 30,810 36,418
Current assets
21 Trade and other receivables 21 25
22 Cash and cash equivalents 10,554 –
Total current assets 10,575 25
TOTAL ASSETS 41,385 36,443
Current liabilities
23 Interest-bearing loans and borrowings (800) (800)
22 Bank overdraft – (1,409)
Corporation tax payable (51) (18)
24 Trade and other payables (461) (511)
Total current liabilities (1,312) (2,738)
Non-current liabilities
23 Interest-bearing loans and borrowings (769) (1,553)
24 Other payables (582) (556)
Total non-current liabilities (1,351) (2,109)
TOTAL LIABILITIES (2,663) (4,847)
Net assets 38,722 31,596
27 Capital and reserves
Called up share capital 1,243 930
Share premium account 17,447 7,871
Other reserves 6,910 6,910
Retained earnings 13,122 15,885
Total equity 38,722 31,596
These financial statements were approved by the Board of Directors on 10 June 2013 and were signed on its behalf by:
J L Foster
Director
Registered company number: 03416346
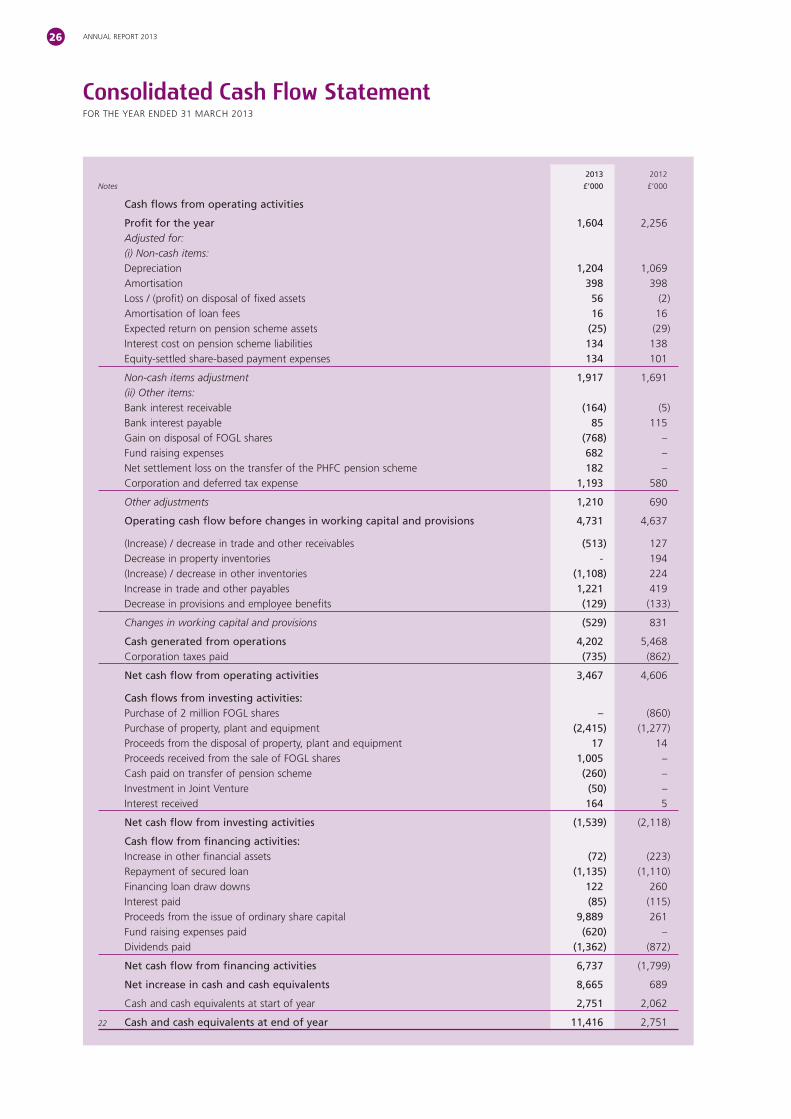
ANNUAL REPORT 201326
Notes
2013
£’000
2012
£’000
Cash flows from operating activities
Profit for the year 1,604 2,256Adjusted for:(i) Non-cash items:Depreciation 1,204 1,069Amortisation 398 398Loss / (profit) on disposal of fixed assets 56 (2)Amortisation of loan fees 16 16Expected return on pension scheme assets (25) (29)Interest cost on pension scheme liabilities 134 138Equity-settled share-based payment expenses 134 101
Non-cash items adjustment 1,917 1,691(ii) Other items:Bank interest receivable (164) (5)Bank interest payable 85 115Gain on disposal of FOGL shares (768) –Fund raising expenses 682 –Net settlement loss on the transfer of the PHFC pension scheme 182 –Corporation and deferred tax expense 1,193 580
Other adjustments 1,210 690
Operating cash flow before changes in working capital and provisions 4,731 4,637
(Increase) / decrease in trade and other receivables (513) 127Decrease in property inventories - 194(Increase) / decrease in other inventories (1,108) 224Increase in trade and other payables 1,221 419Decrease in provisions and employee benefits (129) (133)
Changes in working capital and provisions (529) 831
Cash generated from operations 4,202 5,468Corporation taxes paid (735) (862)
Net cash flow from operating activities 3,467 4,606
Cash flows from investing activities:Purchase of 2 million FOGL shares – (860)Purchase of property, plant and equipment (2,415) (1,277)Proceeds from the disposal of property, plant and equipment 17 14Proceeds received from the sale of FOGL shares 1,005 –Cash paid on transfer of pension scheme (260) –Investment in Joint Venture (50) –Interest received 164 5
Net cash flow from investing activities (1,539) (2,118)
Cash flow from financing activities:Increase in other financial assets (72) (223)Repayment of secured loan (1,135) (1,110)Financing loan draw downs 122 260Interest paid (85) (115)Proceeds from the issue of ordinary share capital 9,889 261Fund raising expenses paid (620) –Dividends paid (1,362) (872)
Net cash flow from financing activities 6,737 (1,799)
Net increase in cash and cash equivalents 8,665 689
Cash and cash equivalents at start of year 2,751 2,062
22 Cash and cash equivalents at end of year 11,416 2,751
Consolidated Cash Flow StatementFOR THE YEAR ENDED 31 MARCH 2013

FALKLAND ISLANDS HOLDINGS PLC 27
Company Cash Flow StatementFOR THE YEAR ENDED 31 MARCH 2013
Notes
2013
£’000
2012
£’000
Cash flows from operating activities
(Loss) / profit for the year (1,597) 1,948
Adjusted for:
Net financing costs 64 86
Amortisation of loan fees 16 16
Equity-settled share-based payment expenses 52 39
Impairment in Erebus 3,766 –
Fund raising expenses 682 –
Corporation and deferred tax expense 57 16
Operating cash flow before changes in working capital and provisions 3,040 2,105
Decrease in trade and other receivables 4 5
(Decrease) / increase in trade and other payables (50) 135
Cash generated from operations 2,994 2,245
Corporation taxes (paid) (23) (22)
Net cash flow from operating activities 2,971 2,223
Cash flow from financing activities:
Repayment of inter-company borrowing 1,949 (717)
Repayment of secured loan (800) (800)
Interest paid (64) (86)
Proceeds from the issue of ordinary share capital 9,889 261
Fund raising expenses paid (620) –
Dividends paid (1,362) (872)
Net cash flow from financing activities 8,992 (2,214)
Net increase in cash and cash equivalents 11,963 9
Cash and cash equivalents at start of year (1,409) (1,418)
22 Cash and cash equivalents at end of year 10,554 (1,409)

ANNUAL REPORT 201328
Notes
Reconciliation of movement in capital and reserves – Group
Called up
share
capital
£’000
Financial
assets fair
value
revaluation
reserve
£’000
Share
premium
account
£’000
Other
reserves
£’000
Retained
earnings
£’000
Total
equity
£’000
Balance as at 1 April 2011 922 8,749 7,618 1,162 12,150 30,601
Profit for the year – – – – 2,256 2,256
Share-based payments – – – – 101 101
Dividends – – – – (872) (872)
Issue of shares 8 – 253 – – 261
Change in fair value of shares in Falkland Oil and Gas Limited – (2,540) – – – (2,540)
Actuarial loss on pension, net of tax – – – – (277) (277)
Effect of tax rate changes on deferred tax asset relating to pension schemes – – – – (42) (42)
Balance as at 31 March 2012 930 6,209 7,871 1,162 13,316 29,488
Profit for the year – – – – 1,604 1,604
Share based payments granted to employees – – – – 134 134
27
Share based payments on warrants granted to Banque Havilland SA on Fund raising – – – – 62 62
Dividends – – – – (1,362) (1,362)
Issue of shares 313 – 9,576 – – 9,889
Change in fair value of shares in Falkland Oil and Gas Limited – (4,873) – – – (4,873)
Transfer to the income statement on sale of shares in FOGL – (521) – – – (521)
Actuarial loss on pension, net of tax – – – – (189) (189)
Effect of tax rate changes on deferred tax asset relating to pension schemes – – – – 47 47
Balance as at 31 March 2013 1,243 815 17,447 1,162 13,612 34,279
Consolidated Statement of Changes in Shareholders’ EquityFOR THE YEAR ENDED 31 MARCH 2013

FALKLAND ISLANDS HOLDINGS PLC 29
Company Statement of Changes in Shareholders’ EquityFOR THE YEAR ENDED 31 MARCH 2013
Notes
Reconciliation of movement in capital and reserves – Company
Called up
share
capital
£’000
Share
premium
account
£’000
Other
reserves
£’000
Retained
earnings
£’000
Total
equity
£’000
Balance as at 1 April 2011 922 7,618 6,910 14,708 30,158
Profit for the year – – – 1,948 1,948
Share based payments – – – 101 101
Dividends – – – (872) (872)
Issue of shares 8 253 – – 261
Balance as at 31 March 2012 930 7,871 6,910 15,885 31,596
Loss for the year – – – (1,597) (1,597)
Share based payments granted to employees – – – 134 134
27
Share based payments on warrants granted to Banque Havilland SA on Fund raising – – – 62 62
Dividends – – – (1,362) (1,362)
Issue of shares 313 9,576 – – 9,889
Balance as at 31 March 2013 1,243 17,447 6,910 13,122 38,722
A loss of £1,597,000 (2012 profit: £1,948,000) has been dealt with in the accounts of the Parent Company. As permitted by Section 408
of the Companies Act 2006, the Company has not presented its individual profit and loss account.

ANNUAL REPORT 201330
Notes to the Financial StatementsFOR THE YEAR ENDED 31 MARCH 2013
1 Accounting policies
General information
Falkland Islands Holdings plc (the “Company”) is a company incorporated and domiciled in the UK.
Reporting entity
The Group financial statements consolidate those of the Company and its subsidiaries (together referred to as the “Group”). The Parent
Company financial statements present information about the Company as a separate entity and not about its group.
Basis of preparation
Both the Parent Company financial statements and the Group financial statements have been prepared and approved by the Directors
in accordance with International Financial Reporting Standards as adopted by the EU (Adopted IFRS). On publishing the Parent Company
financial statements here together with the Group financial statements, the Company is taking advantage of the exemption in s408 of
the Companies Act 2006 not to present its individual income statement and related notes that form a part of these approved financial
statements.
The accounting policies set out below have, unless otherwise stated, been applied consistently to all periods presented in these
consolidated financial statements.
The management and development of the Group’s property portfolio in the Falkland Islands is a significant part of the Group’s trading
activity. Associated gains and losses on the disposal of rental properties and property developments are accordingly recognised within
gross profit.
Judgements made by the Directors in the application of these accounting policies that have a significant effect on the financial
statements and estimates with a significant risk of material adjustment next year are discussed in note 32.
The financial statements are presented in pounds sterling, rounded to the nearest thousand. They are prepared on the historical cost
basis except that available-for-sale financial instruments and derivative financial instruments are stated at their fair value.
The Directors are responsible for ensuring that the Group has adequate financial resources to meet its projected liquidity requirements
and also for ensuring forecast earnings are sufficient to meet the covenants associated with the Group’s banking facilities.
As in prior years the Directors have reviewed the Group’s medium term forecasts and considered a number of possible trading scenarios
and are satisfied the Group’s existing resources (including committed banking facilities) are sufficient to meet its needs. As a consequence
the Directors believe the Group is well placed to manage its business risk.
The Group’s business activities, together with the factors likely to affect its future development, performance and position are set out
in the Managing Director’s Business Review. The financial position of the Group, its cash flows, liquidity position and borrowing facilities
are also described in the Managing Director’s Financial Review. In addition, note 28 to the financial statements includes the Group’s
objectives, policies and processes for managing its capital; its financial risk management objectives; details of its financial instruments
and hedging activities; and its exposures to credit risk and liquidity risk.
The Group has considerable financial resources. As a consequence, the Directors believe that the Group is well placed to manage its
business risks successfully despite the current uncertain economic outlook.
After making enquiries the Directors have a reasonable expectation that the Company and Group have adequate reserves to continue
in operational existence for the foreseeable future, and have continued to adopt the going concern basis in preparing the financial
statements.
Basis of consolidation
The consolidated financial statements comprise the financial statements of Falkland Islands Holdings plc and its subsidiaries (the
“Group”). A subsidiary is any entity Falkland Islands Holdings plc has the power to control the financial and operating policies of so as
to obtain benefits from its activities. The financial statements of subsidiaries are prepared for the same reporting period as the Parent
Company. The accounting policies of subsidiaries have been changed when necessary to align them with the policies adopted by
the Group.
Subsidiaries are consolidated from the date on which control is transferred to the Group and cease to be consolidated from the date
on which control is transferred out of the Group.
All intra-company balances and transactions, including unrealised profits arising from intra-group transactions, are eliminated in full in
preparing the consolidated financial statements.
Investments in subsidiaries not classified as held-for-sale within the Company balance sheet are stated at cost.

FALKLAND ISLANDS HOLDINGS PLC 31
Presentation of income statement
Due to the non-prescriptive nature under IFRS as to the format of the income statement, the format used by the Group is explained
below.
Operating profit is the pre-finance profit of continuing activities and acquisitions of the Group, and in order to achieve consistency and
comparability, is analysed to show separately the results of normal trading performance (underlying profit), individually significant
charges and credits, changes in the fair value of derivative financial instruments and amortisation of intangible assets on acquisition.
Such items arise because of their size or nature, and in 2013 comprise:
In 2012, this comprised the amortisation of intangible assets.
Foreign currencies
Transactions in foreign currencies are translated to the functional currencies of Group entities at exchange rates ruling at the dates of
the transactions. Monetary assets and liabilities denominated in foreign currencies are retranslated to the functional currency using the
relevant rates of exchange ruling at the balance sheet date and the gains or losses thereon are included in the income statement.
Non-monetary assets and liabilities are translated using the exchange rate at the date of the initial transaction.
Property, plant and equipment
Property, plant and equipment are measured at cost less accumulated depreciation and impairment losses. Cost comprises purchase
price and directly attributable expenses. Depreciation is charged to the income statement on a straight-line basis over the estimated
useful lives of each part of an item of property, plant and equipment. The estimated useful lives are as follows:
Vehicles, plant and equipment 4 – 10 years
The carrying value of assets and their useful lives are reviewed, and adjusted if appropriate, at each balance sheet date. If an indication
of impairment exists, the assets are written down to their recoverable amount and the impairment is charged to the income statement
in the period in which it arises.
Freehold land and assets-in-construction are not depreciated.
Investment properties
Investment properties are properties held either to earn rental income or for capital appreciation or for both. Investment properties are
stated at cost less any accumulated depreciation (calculated on useful economic lives in line with accounting policy, property, plant and
equipment above) and any impairment losses.
Intangible assets
Goodwill
Goodwill arises on the acquisition of subsidiaries.
Acquisitions prior to 1 April 2006
In respect to acquisitions prior to transition to IFRS, goodwill is recorded on the basis of deemed cost, which represents the amount
recorded under previous Generally Accepted Accounting Principles (GAAP) as at the date of transition. The classification and accounting
treatment of business combinations which occurred prior to transition has not been reconsidered in preparing the Group’s opening IFRS
balance sheet at 1 April 2006. Goodwill is not amortised but reviewed for impairment annually or more frequently if events or changes
in circumstances indicate that the carrying value may be impaired.
1 Accounting policies CONTINUED

Notes to the Financial StatementsCONTINUED
ANNUAL REPORT 201332
Acquisitions on or after 1 April 2006
Goodwill on acquisition is initially measured at cost, being the excess of the cost of the business combination over the acquirer’s interest
in the fair value of the identifiable assets, liabilities and contingent liabilities of the acquired business. Following initial recognition,
goodwill is measured at cost less any accumulated impairment losses. Goodwill is not amortised but reviewed for impairment annually
or more frequently if events or changes in circumstances indicate that the carrying value may be impaired.
Amortisation is charged to the income statement on a straight-line basis over the estimated useful lives of intangible assets unless such
lives are indefinite. Other intangible assets are amortised from the date they are available for use. The estimated useful lives are as
follows:
Trade name 20 years
Customer relationships 6 – 10 years
Computer software
Acquired computer software is capitalised as an intangible asset on the basis of the cost incurred to acquire and bring the specific
software into use. Amortisation is charged to the income statement on a straight-line basis over the estimated useful lives of intangible
assets from the date that they are available for use. The estimated useful life of computer software is seven years.
Impairment of non-financial assets
At each reporting date the Group assesses whether there is any indication that an asset may be impaired. Goodwill and intangible assets
with indefinite lives are tested for impairment annually. Where an indicator of impairment exists or the asset requires annual impairment
testing, the Group makes a formal estimate of the recoverable amount. Where the carrying amount of an asset exceeds its recoverable
amount the asset is considered impaired and is written down to its recoverable amount. Impairment losses are recognised in the income
statement.
Recoverable amount is the greater of an asset’s or cash-generating unit’s fair value less cost to sell or value in use. It is determined for
an individual asset, unless the asset’s value in use cannot be estimated and it does not generate cash inflows that are largely independent
of those from other assets or groups of assets, in which case the recoverable amount is determined for the cash-generating unit to
which the asset belongs.
In assessing value in use, the estimated future cash flows are discounted to their present value using a discount rate that reflects current
market assessments of the time value of money and risks specific to the asset.
An impairment loss in respect of goodwill is not reversed. In respect of other assets, impairment losses are reversed if there has been a
change in the estimates used to determine the recoverable amount. An impairment loss is reversed only to the extent that the asset’s
carrying amount does not exceed the carrying amount that would have been determined, net of depreciation or amortisation, if no
impairment loss had been recognised.
Finance income and expense
Net financing costs comprise interest payable, interest receivable, and foreign exchange gains and losses that are recognised in the
income statement.
Interest income and interest payable are recognised as a profit or loss as they accrue, using the effective interest method.
Financial instruments
Certain financial instruments held by the Group are classified as being available-for-sale and are stated at fair value, with any resultant
gain or loss being recognised in other comprehensive income and presented in the fair value reserve in equity, except for impairment
losses. When these items are derecognised, the cumulative gain or loss previously recognised directly in equity is recycled to profit and
loss.
Financial instruments classified as available-for-sale are initially recognised at fair value less directly attributable transaction costs.
1 Accounting policies CONTINUED

FALKLAND ISLANDS HOLDINGS PLC 33
The Group does not use derivative financial instruments for speculative purposes. Derivative financial instruments are initially measured
at fair value. Changes in the fair value of derivative financial instruments are recognised in the income statement as they arise. The
Group has not applied hedge accounting to its derivative financial instruments.
Employee share awards
The Group provides benefits to certain employees (including Directors) in the form of share-based payment transactions, whereby the
recipient renders service in return for shares or rights over future shares (equity settled transactions). The cost of these equity settled
transactions with employees is measured by reference to an estimate of their fair value at the date on which they were granted using
an option input pricing model taking into account the terms and conditions upon which the options were granted. The amount
recognised as an expense is adjusted to reflect the actual number of share options for which the related service and non-market
performance conditions are expected to be met, such that the amount ultimately recognised as an expense is based on the number of
share options that meet the related service and non-market performance conditions at the vesting date. For share-based payment
awards with non-vesting conditions, the grant date fair value of the share-based payments is measured to reflect such conditions and
there is no true up for differences between expected and actual outcomes.
The cost of equity settled transactions is recognised, together with a corresponding increase in reserves, over the period in which the
performance conditions are fulfilled, ending on the date that the option vests.
Where the Company grants options over its own shares to the employees of subsidiaries, it recognises, in its individual financial
statements, an increase in the cost of investment in its subsidiaries equal to the equity settled share-based payment charge recognised
in its consolidated financial statements with the corresponding credit being recognised directly in equity.
Inventories
Inventories are stated at the lower of cost and net realisable value. Cost includes all costs incurred in bringing each product to its present
location and condition, as follows:
The cost of raw materials, consumables and goods for resale comprises purchase cost, on a first-in, first-out basis and where applicable
includes expenditure incurred in transportation to the Falkland Islands.
Work-in-progress and finished goods cost includes direct materials and labour plus attributable overheads based on a normal level
of activity.
Construction-in-progress and properties-held-for-sale relating to the Group’s property trading portfolio in the Falkland Islands are stated
at the lower of cost and net realisable value.
Net realisable value is estimated at selling price in the ordinary course of business less costs of disposal.
Revenue
Revenue is measured at the fair value of the consideration received or receivable and represents the amount receivable by the Group
for goods supplied and services rendered in the normal course of business, net of discounts and excluding VAT. Revenue principally
arises from retail sales, the provision of ferry services and the provision of storage and transportation services for fine art works. In the
Falkland Islands revenue also includes proceeds from property sales, property rental income, insurance commissions, revenues billed for
shipping and agency activities and port services. Revenue from sale of goods is recognised at the point of sale or dispatch, whilst that
of the ferry, fine art logistics and other services is recognised when the service is provided. Revenue from property sales is recognised
on completion.
For fine art exhibition logistical work undertaken the amount of profit attributable to the stage of completion of a contract is recognised
when the outcome of the contract can be seen with reasonable certainty, typically upon successful opening. Revenue for such contracts
is stated at the cost appropriate to their stage of completion plus attributable profit, less amounts already recognised. Provision is made
for losses as soon as they are foreseeable.
Pensions
Defined contribution pension schemes
The Group operates three defined contribution schemes. The assets of the schemes are held separately from those of the Group in
independently administered funds. The amount charged to the income statement represents the contributions payable to the schemes
in respect to the accounting period.
1 Accounting policies CONTINUED
Notes to the Financial StatementsCONTINUED
ANNUAL REPORT 201334
Defined benefit pension schemes
During the year to 31 March 2013, the Group also operated two pension schemes providing benefits based on final pensionable pay.
at the 31 March 2013, the Group has one remaining pension scheme in the Falkland Islands providing benefits based on final
pensionable pay, which is unfunded and closed to future accrual.
The Group’s net obligation in respect of each defined benefit pension plan is calculated by estimating the amount of future benefit that
employees have earned in return for their service in the current and prior periods; that benefit is discounted to its present value; and
any unrecognised past service costs and the fair value of the plan assets (at bid price) are deducted. The liability discount rate is the
yield at the balance sheet date on AA credit-rated bonds that have maturity dates approximating the terms of the Group’s obligations.
The calculation is performed by a qualified actuary using the projected unit credit method. When the calculation results in a benefit to
the Group, the asset recognised is limited to the net total of any unrecognised past service costs and the present value of any future
refunds from the plan or reductions in future contributions to the plan.
The current service cost and costs from settlements and curtailments are charged against operating profit.
Past service costs are spread over the period until the benefit increases vest. Interest charged on the scheme liabilities and the expected
return on scheme assets are included in other finance costs.
Actuarial gains and losses are recognised in full in the period in which they arise in the statement of comprehensive income.
Trade and other receivables
Trade receivables are carried at amortised cost, less provision for impairment. Any change in their value through impairment or reversal
of impairment is recognised in the income statement.
Trade and other payables
Trade and other payables are stated at their cost less payments made.
Dividends on funds presented within shareholders’ funds
Dividends unpaid at the balance sheet date are only recognised as liabilities at that date to the extent that they are appropriately
authorised and are no longer at the discretion of the Company.
Cash and cash equivalents
Cash and cash equivalents in the balance sheet comprise cash balances and call deposits with an original maturity of three months or
less. Bank overdrafts that are repayable on demand and form an integral part of the Group’s cash management are included as a
component of cash and cash equivalents for the purpose of the statement of cash flows.
Interest-bearing borrowings
Interest-bearing borrowings are recognised initially at fair value less directly attributable transaction costs. Subsequent to initial
recognition, interest-bearing borrowings are stated at amortised cost with any difference between cost and redemption value being
recognised in the income statement over the period of the borrowings on an effective interest basis.
Income Tax
Income tax on the profit or loss for the year comprises current and deferred tax. Income tax is recognised in the income statement,
except to the extent that it relates to items recognised directly in equity, in which case it is recognised directly in equity or in other
comprehensive income.
Current tax is the expected tax payable on the taxable income for the year, using tax rates enacted, or substantively enacted at the
balance sheet date, and any adjustment to tax payable in respect of previous years.
Deferred tax is provided using the balance sheet method, providing for temporary differences between the carrying amounts of assets
and liabilities for financial reporting purposes and the amounts used for taxation purposes. The following temporary timing differences
are not recognised:
taxable profits.
foreseeable future.
1 Accounting policies CONTINUED

FALKLAND ISLANDS HOLDINGS PLC 35
A deferred tax asset is recognised to the extent that it is probable that future taxable profits will be available against which the
temporary differences can be utilised. Deferred tax assets are reviewed at each reporting date and are reduced to the extent that it is
no longer probable that the related tax benefit will be realised.
Deferred tax is recognised at the tax rates that are expected to be applied to the temporary differences when they reverse, based on
rates that have been enacted or substantially enacted by the reporting date.
Leased assets
are classified as operating leases.
As lessee
Rentals in respect of all operating leases are charged to the income statement on a straight-line basis over the lease term.
As lessor
Assets under hire purchase agreements are shown in the balance sheet under current assets to the extent they are due within one year,
and under non-current assets to the extent that they are due after more than one year, and are stated at the value of the net investment
in the agreements. The income from such agreements is credited to the income statement each year so as to give a constant rate of
return on the funds invested.
Assets held for leasing out under operating leases are included in investment property (where they constitute land and buildings) or in
property, plant and equipment (where they do not constitute land and buildings) at cost less accumulated depreciation and impairment
income.
Finance lease payments
Minimum lease payments are apportioned between the finance charge and reduction of the outstanding liability. The finance charge is
allocated to each period of the lease term so as to produce a constant periodic rate of interest on the remaining balance of the liability.
Non-current assets held for sale and discontinued operations
Non-current assets and discontinued operations are classified as held for sale when their carrying values will be recovered principally
through sale. They are generally measured at the lower of carrying amount and fair value less costs to sell.
Provisions
Provisions are recognised in the balance sheet when the Group has a present legal or constructive obligation as a result of a past event,
and it is probable that an outflow of economic benefits will be required to settle the obligation and a reliable estimate can be made of
the amount of the obligation. If the effect is material, provisions are determined by discounting the expected cash flows at an
appropriate pre-tax risk free rate.
New, amended and revised IFRSs and International Financial Reporting Interpretations Committee pronouncements (IFRICs)
There were no amendments or revisions to IFRSs effective for the first time in the year ended 31 March 2013 which had an impact on
the consolidated financial statements.
The following amendments and revisions to IFRSs which were effective for the first time in the year ended 31 March 2013 did not have
any material impact on the consolidated financial statements:
Amendments and revisions to IFRSs
IAS 12 Income Taxes
1 Accounting policies CONTINUED

Notes to the Financial StatementsCONTINUED
ANNUAL REPORT 201336
The following IFRSs and amendments and revisions to IFRSs, other than IFRS 9 have been adopted by the EU, and were available for
early adoption but have not yet been applied in the preparation of the consolidated financial statements:
Effective date
New IFRSs (accounting periods commencing on or after):
IFRS 10 Consolidated Financial Statements 1 January 2014
IFRS 11 Joint Arrangements 1 January 2014
IFRS 12 Disclosure of Interests in Other Entities 1 January 2014
IFRS 13 Fair Value Measurement 1 January 2013
Amendments and revisions to IFRSs
IAS 1 Presentation of Financial Statements 1 July 2012
IAS 19 Employee Benefits 1 January 2013
IAS 28 Investments in Associates and Joint Ventures 1 January 2013
IAS 32 Financial Instruments: Presentation 1 January 2014
Various Improvements to IFRSs – minor amendments various
The Directors do not anticipate that the adoption of these new IFRSs and amendments and revisions to IFRSs will have a material impact
on the consolidated financial statements in the period of initial application with the exception of IFRS 9, where classification and
measurement amendments may be required to assets currently classified as available-for-sale.
2 Segmental analysis
The Group is organised into three operating segments, and information on these segments is reported to the chief operating decision
maker (‘CODM’) for the purposes of resource allocation and assessment of performance. The CODM has been identified as the Board
of Directors.
The operating segments offer different products and services and are determined by business type: goods and essential services in the
Falkland Islands, the provision of ferry services and art logistics and storage.
Segment results, assets and liabilities include items directly attributable to a segment as well as those that can be allocated on a
reasonable basis.
Segment capital expenditure is the total cost incurred during the period to acquire property, plant and equipment and intangible assets
other than goodwill.
1 Accounting policies CONTINUED

FALKLAND ISLANDS HOLDINGS PLC 37
2013
Goods and
essential services
(Falklands)
£’000
Ferry
services
(Portsmouth)
£’000
Art logistics
and storage
(UK)
£’000
Unallocated
£’000
To tal
£’000
Revenue 16,298 – 35,596
Segment operating profit before tax and amortisation 984 1,193 – 3,502
Fund raising costs – – – (682) (682)
– – – 768
Net settlement loss on the PHFC pension scheme – – – (182) (182)
Amortisation – – (398) – (398)
Segment operating profit 984 (96) 3,008
Interest income 246 28 6 – 280
Interest expense (118) (286) – (491)
Segment profit before tax (96) 2,797
Assets and liabilities
Segment assets 14,838 56,221
Segment liabilities (8,664) (2,031) (21,942)
Segment net assets 6,142 34,279
Other segmental information
Capital expenditure:
Property, plant, equipment 1,332 223 – 2,153
Investment properties 262 – – – 262
Depreciation – property, plant and equipment 466 301 414 – 1,181
Depreciation – investment properties 23 – – – 23
Amortisation – – 398 – 398
Underlying profit before tax
Segment operating profit 984 1,193 – 3,502
Interest income 246 28 6 – 280
Interest expense (118) (286) – (491)
Underlying profit before tax 1,112 – 3,291
2 Segmental analysis CONTINUED

Notes to the Financial StatementsCONTINUED
ANNUAL REPORT 201338
2012
Goods and
essential services
(Falklands)
£’000
Ferry
services
(Portsmouth)
£’000
Art logistics
and storage
(UK)
£’000
Unallocated
£’000
To tal
£’000
Revenue 4,160 – 34,109
Segment operating profit before tax and amortisation 1,094 964 – 3,568
Amortisation – – (398) – (398)
Segment operating profit 1,094 – 3,170
Interest income 86 33 4 – 123
Interest expense (142) (263) – (457)
Segment profit before tax 864 – 2,836
Assets and liabilities
Segment assets 12,302 50,626
Segment liabilities (4,261) (2,811) (21,138)
Segment net assets 9,289 8,996 29,488
Other segmental information
Capital expenditure:
Property, plant, equipment 632 – 6,236
Depreciation – property, plant and equipment 303 331 – 1,059
Depreciation – investment properties 10 – – – 10
Amortisation and goodwill impairment – – 398 – 398
Underlying profit before tax
Segment operating profit 1,094 964 – 3,568
Interest income 86 33 4 – 123
Interest expense (142) (263) – (457)
Underlying profit before tax 864 916 – 3,234
2 Segmental analysis CONTINUED

FALKLAND ISLANDS HOLDINGS PLC 39
3 Geographical analysis
The tables below analyse revenue and other information by geography:
2013
United
Kingdom
£’000
Falkland
Islands
£’000
Total
£’000
Revenue (by source) 35,596
Assets and liabilities
Segment assets 41,162 56,221
Other segment information
Capital expenditure 821 2,415
2012
United
Kingdom
£’000
Falkland
Islands
£’000
Total
£’000
Revenue (by source) 19,130 34,109
Assets and liabilities
Segment assets 38,324 12,302 50,626
Other segment information
Capital expenditure 632 1,279
Assets acquired through finance leases – 4,957
Total fixed assets acquired 632 6,236
4 Revenue
2013
£’000
2012
£’000
Sale of goods 12,345
Rendering of services 23,251 22,829
Property sales in the Falkland Islands –
Total revenue 35,596 34,109

Notes to the Financial StatementsCONTINUED
ANNUAL REPORT 201340
5 Amortisation of intangible assets and non-trading items
2013
£’000
2012
£’000
Amortisation charge on Momart intangible assets acquired (398) (398)
Amortisation charge (398) (398)
Profit before tax as reported 2,797 2,836
Adjusted for amortisation 398 398
Fund raising expenses 682 –
(768) –
Net settlement loss on the transfer of the PHFC pension scheme 182 –
Underlying profit before tax 3,291 3,234
6 Expenses and auditor’s remuneration
Included in profit / loss are the following expenses / (income): Group Company
2013
£’000
2012
£’000
2013
£’000
2012
£’000
Direct operating expenses arising from investment properties
which generated rental income in the period 102 114 – –
Depreciation 1,204 1,069 – –
Amortisation of intangible assets 398 398 – –
Foreign currency differences (153) – –
Impairment loss on trade and other receivables 61 82 – –
Cost of inventories recognised as an expense 8,368 8,061 – –
Operating lease payments 773 – –
Auditor’s remuneration:
2013
£’000
2012
£’000
Audit of these financial statements 28
and amounts receivable by auditors and their associates in respect of:
Audit of subsidiaries’ financial statements pursuant to legislation 61 62
Other services relating to taxation 37
Total auditor’s remuneration 126 148
Amounts paid to the Company’s auditors and their associates in respect of services to the Company, other than the audit of the
Company’s financial statements, have not been disclosed as the information is required instead to be disclosed on a consolidated basis.

FALKLAND ISLANDS HOLDINGS PLC 41
7 Staff numbers and cost
The average number of persons employed by the Group (including Directors) during the year, analysed by category, was as follows:
Number of employees
Group
Number of employees
Company
2013 2012 2013 2012
Ferry services 38 39 – –
Falklands Islands: in Stanley 123 – –
Falklands Islands: in UK 5 – –
Art logistics and storage 116 110 – –
Head office 5 4 5 4
Total average staff numbers 287 5 4
The aggregate payroll cost of these persons was as follows:
Group Company
2013
£’000
2012
£’000
2013
£’000
2012
£’000
Wages and salaries 8,747 583
Share-based payments (see note 26) 196 101 52 39
Social security costs 802 76
Contributions to defined contribution plans 222 229 8 31
Total employment costs 9,967 719 641
Details of Directors’ remuneration are provided in the Directors’ Report, under the heading “Details of Directors’ Remuneration and
Emoluments”.
8 Finance income and expense
2013
£’000
2012
£’000
Bank interest receivable 164
Finance lease interest receivable 91 89
Expected return on pension scheme assets 25 29
Total financial income 280 123
Interest payable on bank loans (85)
Interest cost on pension scheme liabilities (134) (138)
Amortisation of loan fees (16) (16)
Finance lease interest payable (256) (188)
Total financial expense (491)
Net financing cost (211) (334)

Notes to the Financial StatementsCONTINUED
ANNUAL REPORT 201342
2013
£’000
2012
£’000
Bank interest receivable 164
Interest payable on bank loans (85)
Net bank interest 79 (110)
Other financing charges (from above) (290) (224)
Net financing cost (211) (334)
9 Taxation
Recognised in the income statement
2013
£’000
2012
£’000
Current tax expense:
Current year 665 842
Adjustments for prior years (74) 23
Current tax expense 591
Deferred tax expense:
Origination and reversal of temporary differences 620 (2)
Reduction in tax rate (60) (112)
Adjustments for prior years 42
Deferred tax expense / (credit) 602
Total tax expense 1,193
Reconciliation of effective tax rate
2013
£’000
2012
£’000
Profit on ordinary activities before tax 2,797 2,836
Tax using the UK corporation tax rate of 24% (2012: 26%) 671
Expenses not deductible for tax purposes 53 119
Non taxable income on disposals – (1)
Deduction in respect of exercised stock options (6) (10)
Marginal relief (1) –
Effect of higher tax rate overseas 4
Reduction in deferred tax rate (60) (112)
Deferred tax arising on change in tax regime 564 –
Adjustments to tax charge in respect of previous years (32) (148)
Total tax expense 1,193
8 Finance income and expense CONTINUED
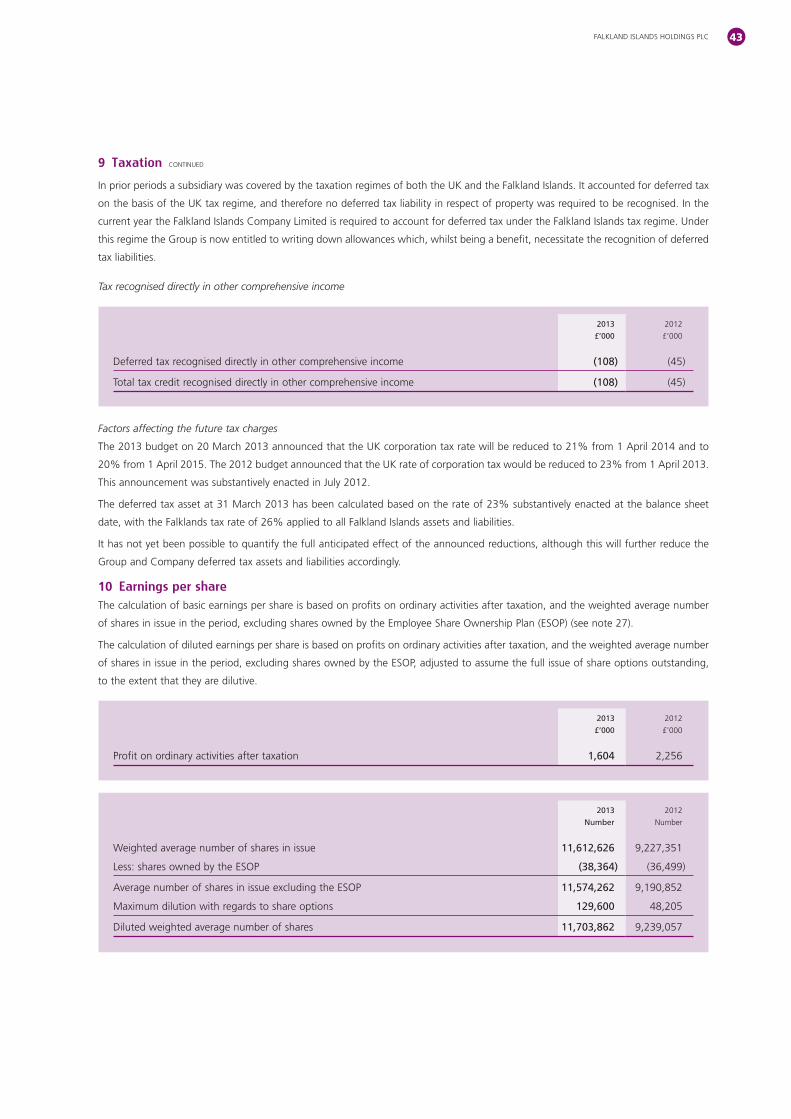
FALKLAND ISLANDS HOLDINGS PLC 43
In prior periods a subsidiary was covered by the taxation regimes of both the UK and the Falkland Islands. It accounted for deferred tax
on the basis of the UK tax regime, and therefore no deferred tax liability in respect of property was required to be recognised. In the
this regime the Group is now entitled to writing down allowances which, whilst being a benefit, necessitate the recognition of deferred
tax liabilities.
Tax recognised directly in other comprehensive income
2013
£’000
2012
£’000
Deferred tax recognised directly in other comprehensive income (108)
Total tax credit recognised directly in other comprehensive income (108)
Factors affecting the future tax charges
The 2013 budget on 20 March 2013 announced that the UK corporation tax rate will be reduced to 21% from 1 April 2014 and to
This announcement was substantively enacted in July 2012.
The deferred tax asset at 31 March 2013 has been calculated based on the rate of 23% substantively enacted at the balance sheet
date, with the Falklands tax rate of 26% applied to all Falkland Islands assets and liabilities.
It has not yet been possible to quantify the full anticipated effect of the announced reductions, although this will further reduce the
Group and Company deferred tax assets and liabilities accordingly.
10 Earnings per share
The calculation of basic earnings per share is based on profits on ordinary activities after taxation, and the weighted average number
The calculation of diluted earnings per share is based on profits on ordinary activities after taxation, and the weighted average number
of shares in issue in the period, excluding shares owned by the ESOP, adjusted to assume the full issue of share options outstanding,
to the extent that they are dilutive.
2013
£’000
2012
£’000
Profit on ordinary activities after taxation 1,604
2013
Number
2012
Number
Weighted average number of shares in issue 11,612,626
(38,364) (36,499)
Average number of shares in issue excluding the ESOP 11,574,262
Maximum dilution with regards to share options 129,600
Diluted weighted average number of shares 11,703,862
9 Taxation CONTINUED

Notes to the Financial StatementsCONTINUED
ANNUAL REPORT 201344
2013 2012
Basic earnings per share 13.9p
Diluted earnings per share 13.7p 24.4p
To provide a comparison of earnings per share on underlying performance, the calculation below sets out basic and diluted earnings
per share based on underlying profits.
Earnings per share on underlying profit 2013
£’000
2012
£’000
3,291 3,234
Taxation (796)
Underlying profit after tax 2,495
Effective tax rate on underlying profits 24.2%
Weighted average number of shares in issue excluding ESOP (from above) 11,574,262
Diluted weighted average number of shares (from above) 11,703,862
Basic earnings per share on underlying profit 21.6p 26.3p
Diluted earnings per share on underlying profit 21.3p 26.2p
11 Intangible assets
Group
Customer
relationships
£’000
Brand
names
£’000
Non-compete
Agreements
£’000
Goodwill
£’000
Total
£’000
Cost:
At 1 April 2011 1,882 2,823 16,316
At 31 March 2012 and 31 March 2013 1,882 2,823 16,316
Accumulated amortisation:
At 1 April 2011 433 43 1,983 3,205
Amortisation for the year 243 141 14 – 398
At 31 March 2012 989 1,983 3,603
Amortisation for the year 243 141 14 – 398
At 31 March 2013 1,232 1,983 4,001
Net book value:
At 31 March 2011 1,136 2,390 29 13,111
At 31 March 2012 893 2,249 12,713
At 31 March 2013 2,108 1 12,315
Amortisation and impairment charges are recognised in operating expenses in the income statement.
Customer relationships – are on-going relationships, both contractual and otherwise, with customers considered to be of future
economic benefit to the Group with estimated economic lives of 6 – 10 years.
10 Earnings per share CONTINUED
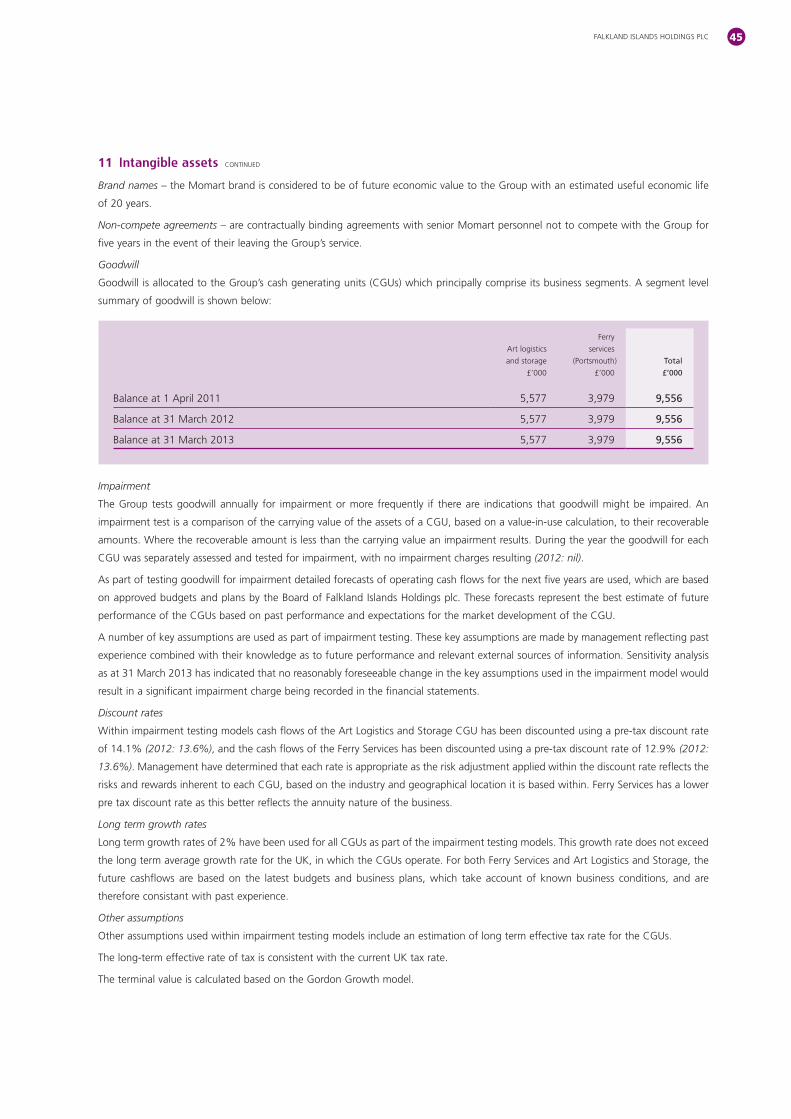
FALKLAND ISLANDS HOLDINGS PLC 45
Brand names – the Momart brand is considered to be of future economic value to the Group with an estimated useful economic life
of 20 years.
Non-compete agreements – are contractually binding agreements with senior Momart personnel not to compete with the Group for
five years in the event of their leaving the Group’s service.
Goodwill
Goodwill is allocated to the Group’s cash generating units (CGUs) which principally comprise its business segments. A segment level
summary of goodwill is shown below:
Art logistics
and storage
£’000
Ferry
services
(Portsmouth)
£’000
Total
£’000
Balance at 1 April 2011 9,556
Balance at 31 March 2012 9,556
Balance at 31 March 2013 9,556
Impairment
The Group tests goodwill annually for impairment or more frequently if there are indications that goodwill might be impaired. An
impairment test is a comparison of the carrying value of the assets of a CGU, based on a value-in-use calculation, to their recoverable
amounts. Where the recoverable amount is less than the carrying value an impairment results. During the year the goodwill for each
CGU was separately assessed and tested for impairment, with no impairment charges resulting (2012: nil).
As part of testing goodwill for impairment detailed forecasts of operating cash flows for the next five years are used, which are based
on approved budgets and plans by the Board of Falkland Islands Holdings plc. These forecasts represent the best estimate of future
performance of the CGUs based on past performance and expectations for the market development of the CGU.
A number of key assumptions are used as part of impairment testing. These key assumptions are made by management reflecting past
experience combined with their knowledge as to future performance and relevant external sources of information. Sensitivity analysis
as at 31 March 2013 has indicated that no reasonably foreseeable change in the key assumptions used in the impairment model would
result in a significant impairment charge being recorded in the financial statements.
Discount rates
of 14.1% (2012: 13.6%), and the cash flows of the Ferry Services has been discounted using a pre-tax discount rate of 12.9% (2012:
13.6%). Management have determined that each rate is appropriate as the risk adjustment applied within the discount rate reflects the
risks and rewards inherent to each CGU, based on the industry and geographical location it is based within. Ferry Services has a lower
pre tax discount rate as this better reflects the annuity nature of the business.
Long term growth rates
future cashflows are based on the latest budgets and business plans, which take account of known business conditions, and are
therefore consistant with past experience.
Other assumptions
Other assumptions used within impairment testing models include an estimation of long term effective tax rate for the CGUs.
The long-term effective rate of tax is consistent with the current UK tax rate.
The terminal value is calculated based on the Gordon Growth model.
11 Intangible assets CONTINUED

Notes to the Financial StatementsCONTINUED
ANNUAL REPORT 201346
Sensitivity to changes in assumptions
Using a discounted cash flow methodology necessarily involves making numerous estimates and assumptions regarding growth,
operating margins, tax rates, appropriate discount rates, capital expenditure levels and working capital requirements. These estimates
will likely differ from future actual results of operations and cash flows, and it is possible that these differences could be material. In
addition, judgements are applied by the Directors in determining the level of cash generating units and the criteria used to determine
which assets should be aggregated. A difference in testing levels could further affect whether an impairment is recorded and the extent
of impairment loss.
Assumptions specific to ferry services (Portsmouth)
Value in use was determined by discounting future cash flows in line with the other assumptions discussed above. Management have
forecast consistent growth in cash flows of 2% in both the short and long term. The value in use was determined to exceed the carrying
amount and no impairment has been recognised (2012: £nil). It is not considered that a reasonably possible change in any of these
assumptions would generate a different impairment test outcome to the one included in this annual report. The key assumptions made
in the estimation of future cashflows are the passenger numbers and the average revenue per passenger.
Assumptions specific to arts logistics and storage (UK)
Value in use was determined by discounting future cash flows in line with the other assumptions as discussed above. Cash flows were
projected based on approved budgets and plans which foresee growth rates in excess of 10% over the forecast period. The long term
growth rate is projected to be 2% thereafter. The carrying value of the unit was determined to not be higher than its recoverable
amount and no impairment was recognised (2012: nil). It is not considered that a reasonably possible change in any of these
assumptions would generate a different impairment test outcome to the one included in this annual report. The key assumptions made
in the estimation of future cashflows are in relation to revenue.
11 Intangible assets CONTINUED

FALKLAND ISLANDS HOLDINGS PLC 47
12 Property, plant and equipment
Group
Freehold
land and
buildings
£’000
leasehold
land and
buildings
£’000
Ships
£’000
Vehicles,
plant and
equipment
£’000
Total
£’000
Cost:
At 1 April 2011 4,140 964 3,309 14,101
Additions in year 40 23 6,236
Transfer from investment properties 292 292
Disposals – – – (42) (42)
At 31 March 2012 4,180 3,332 6,623 20,587
Additions in year 382 146 201 1,424 2,153
Transfer to investment properties (218) – – – (218)
Disposals – (149) – (522)
At 31 March 2013 4,344 6,449 22,000
Accumulated depreciation:
At 1 April 2011 811 6,612
Charge for the year 108 181 143 1,059
Transfer from investment properties – – – 35
Disposals – – – (30) (30)
At 31 March 2012 4,412 7,676
Charge for the year 116 232 138 1,181
Transfer to investment properties (133) – – – (133)
Disposals – (94) – (449)
At 31 March 2013 669 1,092 8,275
Net book value:
At 1 April 2011 2,469 649 2,498 7,489
At 31 March 2012 2,401 2,211 12,911
At 31 March 2013 2,441 2,922 13,725
The Company has no tangible fixed assets.
At 31 March 2013 the net carrying amount of leased long leasehold land and buildings and vehicles, plant and equipment was
(2012: £4,881,000 and £382,000). During the year to 31 March 2013 the Group acquired
leased assets of £122,000 (2012: £5,217.000).

Notes to the Financial StatementsCONTINUED
ANNUAL REPORT 201348
13 Investment properties
Group
Residential and
commercial
property
£’000
Freehold
land
£’000
Total
£’000
At 1 April 2011 1,101 1,821
Transfer to long leasehold (292) – (292)
Disposals – (2) (2)
At 31 March 2012 809 1,527
Transfer from freehold land and buildings 163 218
Transfer from properties held as stock 1,010 – 1,010
Additions 262 – 262
At 31 March 2013 2,244 3,017
Accumulated depreciation:
At 1 April 2011 100 – 100
Charge for the year 10 – 10
Transfer to long leasehold – (35)
At 31 March 2012 – 75
Charge for the year 23 – 23
Transfer from freehold land and buildings 133 – 133
At 31 March 2013 231 – 231
Net book value:
At 1 April 2011 1,001 1,721
At 31 March 2012 1,452
At 31 March 2013 2,013 2,786
The investment properties comprise residential and commercial property held for rental in the Falkland Islands. These together with
the site of the intended deep water port at Port William. These investment properties owned by FIC have been reviewed by a Director
of FIC who is a Chartered Surveyor and is resident in the Falkland Islands using guidelines provided by the Royal Institution of Chartered
Marmont Row properties transferred in from stock at the £1,010,000 net book value during the year. As oil development proceeds, the
value of these properties is expected to increase significantly.
During the year to 31 March 2013, the Group received rental income of £296,000 (2012: £344,000) on these properties.
The Company does not own any investment properties.
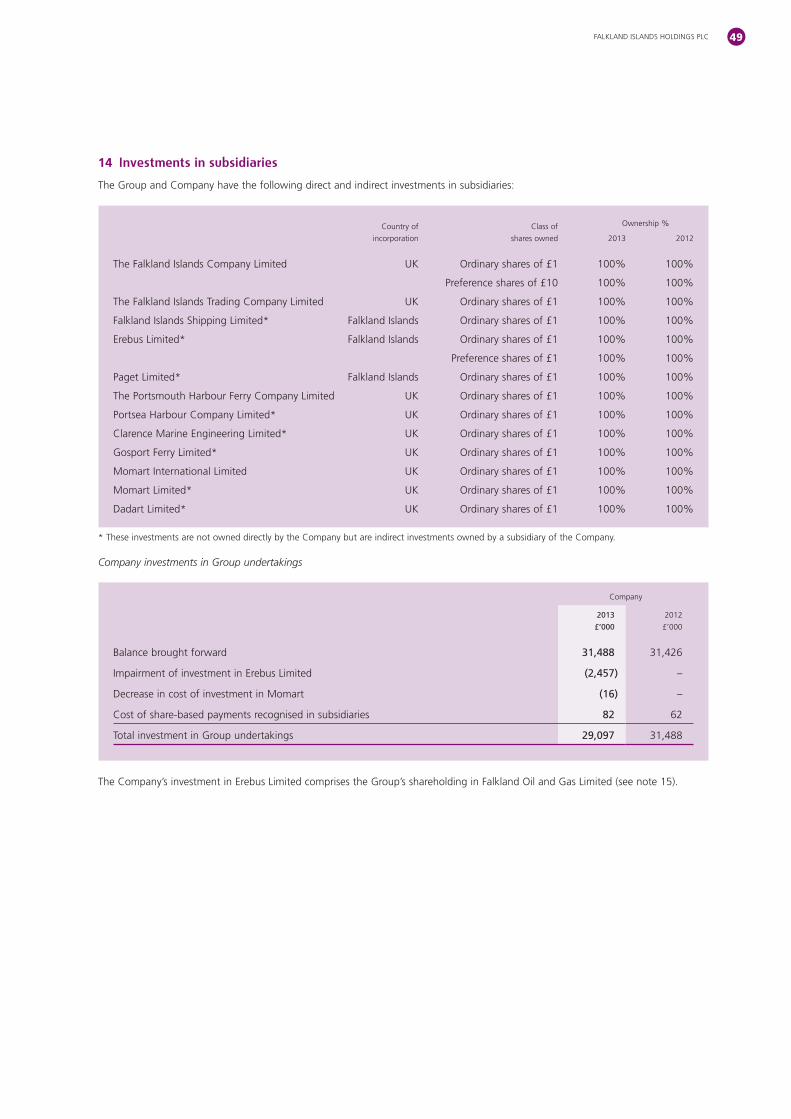
FALKLAND ISLANDS HOLDINGS PLC 49
14 Investments in subsidiaries
The Group and Company have the following direct and indirect investments in subsidiaries:
Country of
incorporation
Class of
shares owned
Ownership %
2013 2012
UK Ordinary shares of £1 100% 100%
Preference shares of £10 100% 100%
UK Ordinary shares of £1 100% 100%
Falkland Islands Ordinary shares of £1 100% 100%
Falkland Islands Ordinary shares of £1 100% 100%
Preference shares of £1 100% 100%
Falkland Islands Ordinary shares of £1 100% 100%
UK Ordinary shares of £1 100% 100%
UK Ordinary shares of £1 100% 100%
UK Ordinary shares of £1 100% 100%
UK Ordinary shares of £1 100% 100%
UK Ordinary shares of £1 100% 100%
UK Ordinary shares of £1 100% 100%
UK Ordinary shares of £1 100% 100%
Company investments in Group undertakings
Company
2013
£’000
2012
£’000
Balance brought forward 31,488 31,426
(2,457) –
Decrease in cost of investment in Momart (16) –
Cost of share-based payments recognised in subsidiaries 82 62
Total investment in Group undertakings 29,097 31,488

Notes to the Financial StatementsCONTINUED
ANNUAL REPORT 201350
15 Shares held in Falkland Oil and Gas Limited – available-for-sale equity securities
2013 2012
Available-for-sale equity securities £’000 3,399 9,030
Falkland Oil and Gas share price 26.5p
Shareholding at 31 March 12,825,000 14,000,000
4.0% 4.4%
Historic cost of shareholding to the Group £’000 2,586 2,823
Cost per share 20p 20p
16 Investment in Joint Ventures
the larger infrastructure contracts which are expected to be generated by oil activity. Both Trant Construction and Falkland Islands
17 Non-current assets held-for-sale
Group
2013
£’000
2012
£’000
Non-current assets held-for-sale 20 20
The assets were recognised at estimated fair value on acquisition and as a result no gain or loss arose on their being classified as
held-for-sale.
18 Other financial assets
Finance lease receivables relate to finance leases on the sale of vehicles and customer goods. No allowances for uncollectible minimum
lease payments have been deemed necessary. No contingent rents have been recognised as income in the period. No residual values
accrue to the benefit of the lessor.
Group
2013
£’000
2012
£’000
Non-current:
Finance lease debtors due after more than one year 121
Current:
Finance lease debtors due within one year 486
Total other financial assets 607
The difference between the gross investment in the hire purchase leases and the present value of future lease payments due represents
(2012: £58,000).
The cost of assets acquired for the purpose of letting under hire purchase agreements by the Group during the period amounted to
(2012: £675,000).
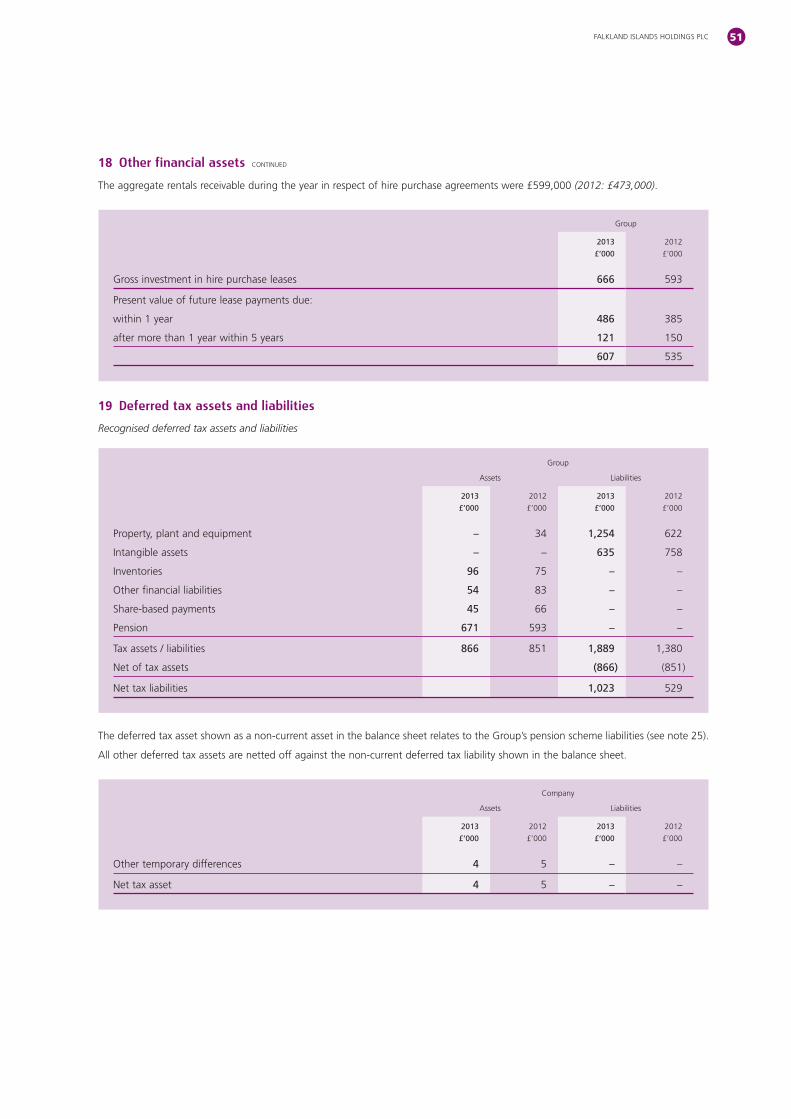
FALKLAND ISLANDS HOLDINGS PLC 51
(2012: £473,000).
Group
2013
£’000
2012
£’000
Gross investment in hire purchase leases 666
Present value of future lease payments due:
within 1 year 486
121
607
19 Deferred tax assets and liabilities
Recognised deferred tax assets and liabilities
Group
Assets
2013
£’000
2012
£’000
2013
£’000
2012
£’000
Property, plant and equipment – 34 1,254 622
Intangible assets – – 635
Inventories 96 – –
Other financial liabilities 54 83 – –
Share-based payments 45 66 – –
Pension 671 – –
Tax assets / liabilities 866 1,889 1,380
Net of tax assets (866)
Net tax liabilities 1,023
All other deferred tax assets are netted off against the non-current deferred tax liability shown in the balance sheet.
Company
Assets
2013
£’000
2012
£’000
2013
£’000
2012
£’000
Other temporary differences 4 – –
Net tax asset 4 – –
18 Other financial assets CONTINUED

Notes to the Financial StatementsCONTINUED
ANNUAL REPORT 201352
Movement in deferred tax in the year
Group
1 April
2012
£’000
Recognised
in income
£’000
Recognised
in equity
£’000
31 March
2013
£’000
Property, plant and equipment 666 – 1,254
Intangible assets (123) – 635
Inventories (21) – (96)
Other financial liabilities (83) 29 – (54)
Share-based payments (66) 21 – (45)
Pension 30 (108) (671)
Deferred tax movements 602 (108) 1,023
Unrecognised deferred tax assets
A deferred tax asset of £132,000 (2012: £132,000) in respect of capital losses have not been recognised as it is not considered more
likely than not that there will be suitable taxable profits in the foreseeable future from which the underlying capital losses will reverse.
Company
1 April
2012
£’000
Recognised
in income
£’000
Recognised
in equity
£’000
31 March
2013
£’000
Other temporary differences (1) – 4
Deferred tax movements (1) – 4
Movement in deferred tax in the prior year
Group
1 April
2011
£’000
Recognised
in income
£’000
Recognised
in equity
£’000
31 March
2012
£’000
Property, plant and equipment 689 (101) – 588
Intangible assets – 758
Inventories (113) 38 – (75)
Other financial liabilities (119) 36 – (83)
Share-based payments (39) – (66)
Pension 6 (593)
Deferred tax movements 529
Company
1 April
2011
£’000
Recognised
in income
£’000
Recognised
in equity
£’000
31 March
2013
£’000
Other temporary differences 8 (3) – 5
Deferred tax movements 8 (3) – 5
19 Deferred tax assets and liabilities CONTINUED
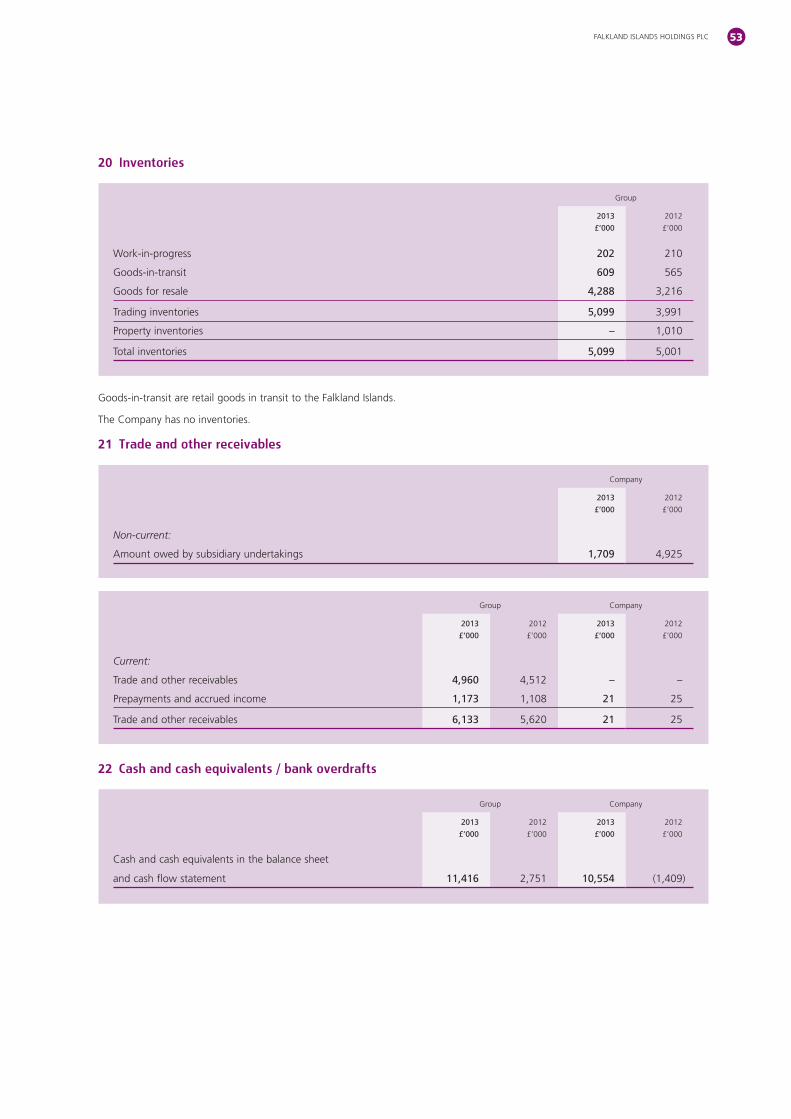
FALKLAND ISLANDS HOLDINGS PLC 53
20 Inventories
Group
2013
£’000
2012
£’000
Work-in-progress 202 210
Goods-in-transit 609
Goods for resale 4,288 3,216
Trading inventories 5,099 3,991
Property inventories – 1,010
Total inventories 5,099
Goods-in-transit are retail goods in transit to the Falkland Islands.
The Company has no inventories.
21 Trade and other receivables
Company
2013
£’000
2012
£’000
Non-current:
Amount owed by subsidiary undertakings 1,709
Group Company
2013
£’000
2012
£’000
2013
£’000
2012
£’000
Current:
Trade and other receivables 4,960 – –
Prepayments and accrued income 1,173 1,108 21
Trade and other receivables 6,133 21
22 Cash and cash equivalents / bank overdrafts
Group Company
2013
£’000
2012
£’000
2013
£’000
2012
£’000
Cash and cash equivalents in the balance sheet
and cash flow statement 11,416 10,554 (1,409)

Notes to the Financial StatementsCONTINUED
ANNUAL REPORT 201354
23 Interest-bearing loans and borrowings
This note provides information about the contractual terms of the Group and Company’s interest-bearing loans and borrowings, which
are stated at amortised cost. For more information regarding the maturity of the Group and Company’s interest-bearing loans and
borrowings and about the Group and Company’s exposure to interest rate and foreign currency risk, see note 28.
Group Company
2013
£’000
2012
£’000
2013
£’000
2012
£’000
Non-current liabilities:
Secured bank loans 1,003 769
Finance lease liabilities 5,136 – –
Total non-current interest-bearing loans and borrowings 6,139 769
Current liabilities:
Current portfolio of secured bank loans 1,000 1,000 800 800
Finance lease liabilities 149 140 – –
Total current interest-bearing loans and borrowings 1,149 1,140 800 800
Net debt
Group Company
2013
£’000
2012
£’000
2013
£’000
2012
£’000
Total interest-bearing loans and borrowings 7,288 1,569
(11,416) (10,554) 1,409
Net (cash) / debt (4,128) (8,985)
24 Trade and other payables
Company
2013
£’000
2012
£’000
Non-current:
Amount owed to subsidiary undertakings 582
Group Company
2013
£’000
2012
£’000
2013
£’000
2012
£’000
Current:
Trade payables 6,031 – –
Other creditors, including taxation and social security 825 58
Accruals and deferred income 3,156 403
Total trade and other payables 10,012 461

FALKLAND ISLANDS HOLDINGS PLC 55
25 Employee benefits: pension plans
The Group operates three defined contribution pension schemes. In addition, it also operates two defined benefit pension schemes,
both of which have been closed to new members and to future accrual. In March 2013, the PHFC scheme was closed and the Group
Defined contribution schemes
The Group operates three defined contribution pension schemes. The pension cost charge for the year represents contributions payable
by the Group to the schemes and amounted to £222,000 (2012: £229,000). The Group anticipates paying contributions amounting to
£240,000 during the year ending 31 March 2013.
There were no outstanding or prepaid contributions at either the beginning or end of the financial year.
Defined benefit pension schemes
A summary of the fair value of the net pension schemes deficit is set out below:
2013
£’000
2012
£’000
Pension scheme deficit:
(2,584) (2,411)
–
(2,584)
Deferred tax 671
Net pension scheme deficit (1,913)
The Falkland Islands Company Limited Scheme
the normal retirement age.
Actuarial reports for IAS 19 purposes as at 31 March 2013, 31 March 2012, 31 March 2011, 31 March 2010 and 31 March 2009 were
2013 2012
Rate of increase in salaries 2.6%
Rate of increase in pensions in payment and deferred pensions 3.0% 3.0%
Discount rate applied to scheme liabilities 4.3%
Inflation assumption 3.4% 3.2%
The assumptions used by the actuary are chosen from a range of possible actuarial assumptions which, due to the timescale covered,
may not necessarily be borne out in practice.

Notes to the Financial StatementsCONTINUED
ANNUAL REPORT 201356
Scheme liabilities
The present value of the scheme’s liabilities, which are derived from cash flow projections over long periods and thus inherently
uncertain, were:
Value at
2013
£’000
Value at
2012
£’000
Value at
2011
£’000
Value at
2010
£’000
Value at
2009
£’000
Present value of scheme liabilities (2,584) (2,411) (2,013)
Related deferred tax asset 671 449
Net pension liability (1,913) (1,832) (1,348)
Movement in deficit during the year:
2013
£’000
2012
£’000
Deficit in scheme at beginning of the year (2,411)
Pensions paid 111 98
Other finance costs (111) (113)
Actuarial loss (173) (289)
Deficit in scheme at end of the year (2,584) (2,411)
Analysis of amounts included in other finance costs:
2013
£’000
2012
£’000
Interest on pension scheme liabilities (111) (113)
Analysis of amount recognised in statement of comprehensive income:
2013
£’000
2012
£’000
Experience losses arising on scheme liabilities (34) (30)
Changes in assumptions underlying the present value of scheme liabilities (139)
Actuarial loss recognised in statement of comprehensive income (173) (289)
25 Employee benefits: pension plans CONTINUED

FALKLAND ISLANDS HOLDINGS PLC 57
History of experience gains and losses:
2013 2012 2011 2010 2009
Experience (losses) / gains on scheme liabilities:
Amount (£’000) (34) (30) 89 (2)
Percentage of year end present value of
scheme liabilities 1.3% 1.2% 0.3% (4.4%) 0.1%
Total amount recognised in statement of
comprehensive income:
Amount (£’000) (173) (289) (82)
Percentage of year end present value of
scheme liabilities 6.7% 12.0% 3.9% (2.8%)
Payments to pensioners (£’000) 111 98 98 98
Portsmouth Harbour Ferry Company Plc Scheme
This Company operated a defined benefit scheme. The scheme has been closed for many years and none of the current employees
The major assumptions used in the valuations were:
2013 2012
Rate of increase in pensions in payment and deferred pensions 3.4% 3.2%
Discount rate applied to scheme liabilities 4.3%
Inflation assumption 3.4% 3.2%
The assumptions used by the actuary are chosen from a range of possible actuarial assumptions which, due to the timescale covered,
may not necessarily be borne out in practice.
25 Employee benefits: pension plans CONTINUED

Notes to the Financial StatementsCONTINUED
ANNUAL REPORT 201358
Scheme assets
The fair value of the scheme's assets, which for the years ending 31 March 2009 to 31 March 2012 were not intended to be realised
in the short term and therefore may have been subject to significant change should they have been realised, and the present value of
the scheme's liabilities, which, for the years ended 31 March 2009 to 31 March 2012 were derived from cash flow projections over
long periods and thus inherently uncertain, were:
Value at
2013
£’000
Value at
2012
£’000
Value at
2011
£’000
Value at
2010
£’000
Value at
2009
£’000
Equities – 286 301 328
Fixed interest – 101 64
Other – 29 30 18 18
Total market value of assets – 460 432 410
Present value of scheme liabilities – (634) (492)
Deficit in the scheme – (23) (224) (239)
Related deferred tax asset – 14 6 63
Net pension liability – (161)
The expected rates of return on the assets in the scheme were:
Long term
rate of return
2013
rate of return
2012
Equities –
Fixed interest –
Other –
25 Employee benefits: pension plans CONTINUED

FALKLAND ISLANDS HOLDINGS PLC 59
Movement in deficit during the year:
2013
£’000
2012
£’000
Projected benefit obligations:
Opening projected benefit obligations (519)
Interest thereon (23)
Distributions 56 13
Actuarial loss (44)
530 –
Projected benefit obligations at 31 March –
Plan assets:
Opening plan assets 460 432
Distributions (56) (13)
Contributions 316
Return on assets 25 29
Actuarial loss (33) (23)
Assets discharged on settlement (712) –
Plan assets at 31 March – 460
Deficit in scheme at 31 March –
Analysis of amounts included in other finance costs:
2013
£’000
2012
£’000
Expected return on pension scheme assets 25 29
Interest on pension scheme liabilities (23)
Included in other finance costs 2 4
Analysis of amounts included in other operating expenses:
2013
£’000
2012
£’000
Net settlement loss on the transfer of the PHFC pension scheme (182) –
Included in other operating expenses (182) –
25 Employee benefits: pension plans CONTINUED

Notes to the Financial StatementsCONTINUED
ANNUAL REPORT 201360
Analysis of amount recognised in statement of comprehensive income:
2013
£’000
2012
£’000
Actual return less expected return on scheme assets (33) (23)
Changes in assumptions underlying the present value of scheme liabilities (44)
Actuarial loss recognised in statement of comprehensive income (77)
History of experience gains and losses:
2013 2012 2011 2010 2009
Difference between the expected and actual return
on scheme assets:
Amount (£’000) (33) (23) (8) 86 (99)
Percentage of year end scheme assets – (1.9%) 21.0% (39.1%)
Experience gains and losses on scheme liabilities:
Amount (£’000) – – – (1) –
Percentage of year end present value of
scheme liabilities – – – 0.2% –
Total amount recognised in statement of
comprehensive income:
Amount (£’000) (77) (10) (86)
Percentage of year end present value of
scheme liabilities – 2.2%
25 Employee benefits: pension plans CONTINUED

FALKLAND ISLANDS HOLDINGS PLC 61
26 Employee benefits: share-based payments
The following options were outstanding at 31 March 2013:
Date of issue Number
Exercise
price
£
Share
price at
grant date
£
Fair
value per
share
£
Total fair
value
£
Earliest
exercise
date
exercise
date
142,499 10 Feb 08
166.0 14 Jun 08
214.0 14 Jun 08
330.0
319.0 340.0 119.0 4 Dec 10
3 Apr 08 131.0 3 Apr 11 2 Apr 18
8 Apr 09 86,634 8 Apr 12
98,224 290.0 290.0 14 Jul 19
9 Dec 09 390.0 9 Dec 12 8 Dec 19
21 Dec 10 100,000 124.0 124,000 21 Dec 13 20 Dec 20
28 Apr 11 6,390 313.0 313.0 106.0 28 Apr 14 28 Apr 21
94.0
16 Dec 11 142,190 68.0 96,689 16 Dec 14 16 Dec 21
13 Aug 12 404.0 404.0 92.0 12 Aug 22
13 Aug 12 404.0 404.0 12 Aug 22
18 Dec 12 92.0 18 Dec 22
861,344
The fair values of the options are estimated at the date of grant using appropriate option pricing models and are charged to the profit
and loss account over the expected life of the options. The following table gives the assumptions made in determining the fair value
of the unvested options. Expected volatility is determined by reference to past performance of the Company’s share price.
21 Dec 10 28 Apr 11 16 Dec 11 13 Aug 12 18 Dec 12
Expected volatility (%) 44 40 40 39 39 39
Risk-free interest rate (%) 2.90 2.94 1.42 1.31
Expected life of options (years)
Dividend yield (%) 2.40 2.60 3.10 3.60 3.31
Share price at grant date (£) 313.0 404.0
Share options issued without share price conditions attached have been valued using the Black-Scholes model. Share price options
issued with share price conditions attached have been valued using a Monte Carlo simulation model making explicit allowance for share
price targets.

Notes to the Financial StatementsCONTINUED
ANNUAL REPORT 201362
During the year ended 31 March 2013, 14,219 options (2012: 77,153) were exercised over ordinary shares.
The number and weighted average exercise prices of share options are as follows:
Weighted
average
exercise
price (£)
2013
Number of
options
2013
Weighted
average
exercise
price (£)
2012
Number of
options
2012
Outstanding at the beginning of the year 3.28 730,510 3.40
Forfeited during the year 3.40 (19,657) 3.34 (61,069)
Exercised during the year 2.08 (14,219) 3.39
Granted during the year 3.99 164,710
– – (88,186)
Outstanding at the year end 3.43 861,344 3.28
Vested options exercisable at the year end 3.50 417,376 4.30 221,299
27 Capital and reserves
Share capital
Ordinary shares of 10p each
2013 2012
Issued at 1 April 9,297,567 9,220,414
Shares issued in fund raising 3,119,837 –
Save as you earn and Share options exercised during the year 14,219
Issued at 31 March – fully paid 12,431,623
2013
£’000
2012
£’000
Allotted, called up and fully paid
Ordinary shares of 10p each 1,243 930
By special resolution at an Annual General Meeting on 9 September 2010 the Company adopted new articles of association principally
to take account of the various changes in company law brought in by the Companies Act 2006. As a consequence the Company no
longer has an authorised share capital.
The holders of ordinary shares are entitled to receive dividends as declared from time to time and are entitled to one vote per share at
meetings of the Company.
before expenses to provide funds to invest in the Group’s businesses in the Falkland Islands. In addition 14,219 share options were
exercised (2012: 77,153).
On 31 March 2000, an Employee Share Ownership Plan was established. At 31 March 2013 the plan owned 39,021 (2012: 36,499)
(2012: £68,542)
(2012: £133,769). Shares owned by the ESOP receive a nominal 0.01p per share in each dividend payment, as in prior years.
For more information on share options please see note 26.
26 Employee benefits: share-based payments CONTINUED
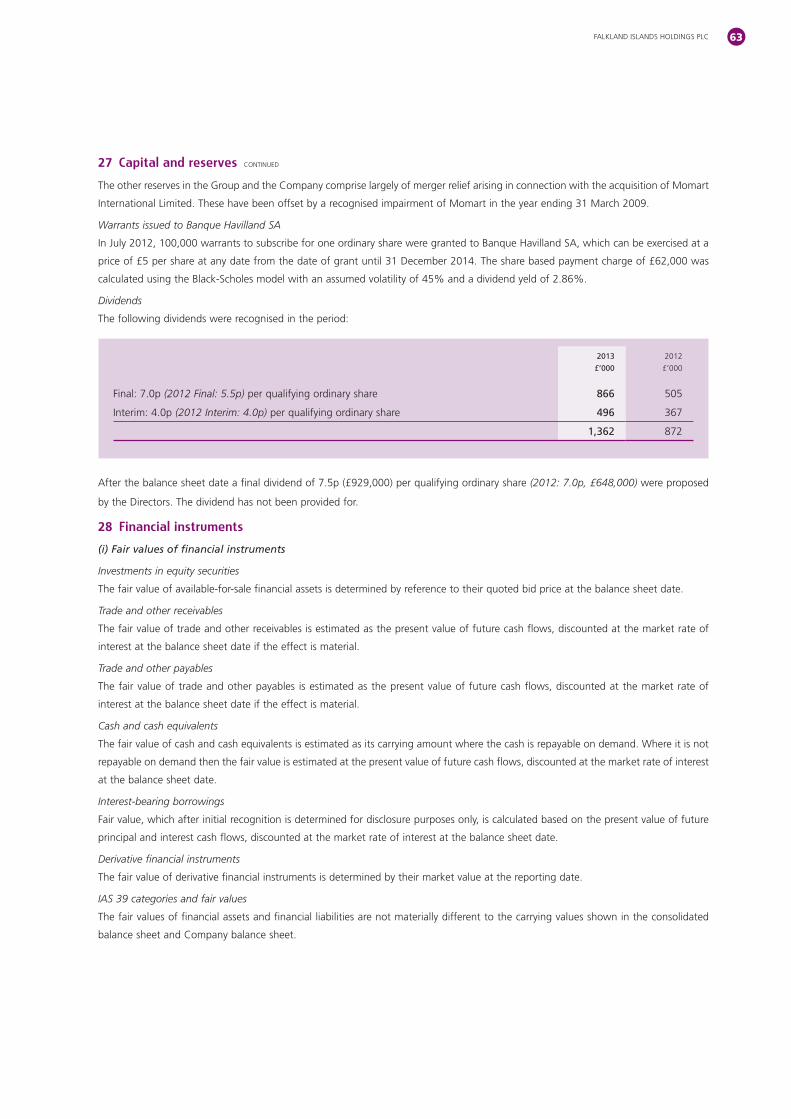
FALKLAND ISLANDS HOLDINGS PLC 63
The other reserves in the Group and the Company comprise largely of merger relief arising in connection with the acquisition of Momart
Warrants issued to Banque Havilland SA
In July 2012, 100,000 warrants to subscribe for one ordinary share were granted to Banque Havilland SA, which can be exercised at a
Dividends
The following dividends were recognised in the period:
2013
£’000
2012
£’000
(2012 Final: 5.5p) per qualifying ordinary share 866
Interim: 4.0p (2012 Interim: 4.0p) per qualifying ordinary share 496
1,362
(2012: 7.0p, £648,000) were proposed
by the Directors. The dividend has not been provided for.
28 Financial instruments
(i) Fair values of financial instruments
Investments in equity securities
The fair value of available-for-sale financial assets is determined by reference to their quoted bid price at the balance sheet date.
Trade and other receivables
The fair value of trade and other receivables is estimated as the present value of future cash flows, discounted at the market rate of
interest at the balance sheet date if the effect is material.
Trade and other payables
The fair value of trade and other payables is estimated as the present value of future cash flows, discounted at the market rate of
interest at the balance sheet date if the effect is material.
Cash and cash equivalents
The fair value of cash and cash equivalents is estimated as its carrying amount where the cash is repayable on demand. Where it is not
repayable on demand then the fair value is estimated at the present value of future cash flows, discounted at the market rate of interest
at the balance sheet date.
Interest-bearing borrowings
Fair value, which after initial recognition is determined for disclosure purposes only, is calculated based on the present value of future
principal and interest cash flows, discounted at the market rate of interest at the balance sheet date.
Derivative financial instruments
The fair value of derivative financial instruments is determined by their market value at the reporting date.
IAS 39 categories and fair values
The fair values of financial assets and financial liabilities are not materially different to the carrying values shown in the consolidated
balance sheet and Company balance sheet.
27 Capital and reserves CONTINUED
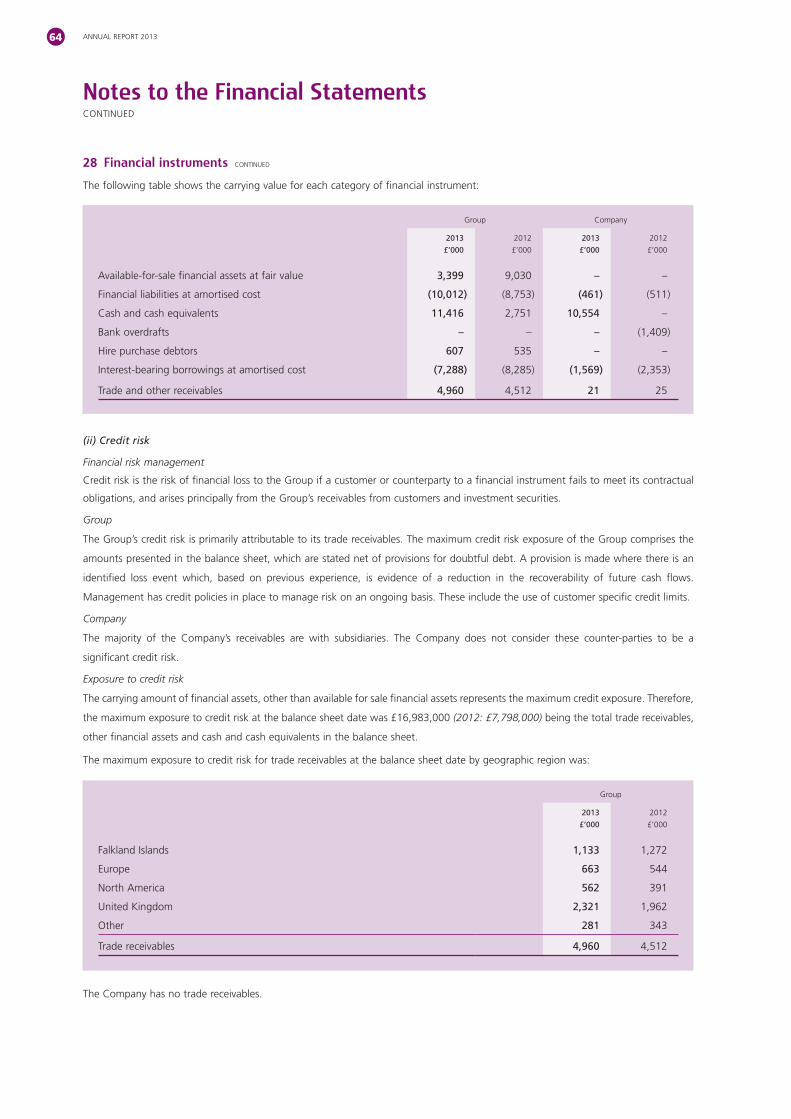
Notes to the Financial StatementsCONTINUED
ANNUAL REPORT 201364
The following table shows the carrying value for each category of financial instrument:
Group Company
2013
£’000
2012
£’000
2013
£’000
2012
£’000
Available-for-sale financial assets at fair value 3,399 9,030 – –
Financial liabilities at amortised cost (10,012) (461)
Cash and cash equivalents 11,416 10,554 –
Bank overdrafts – – – (1,409)
Hire purchase debtors 607 – –
Interest-bearing borrowings at amortised cost (7,288) (1,569)
Trade and other receivables 4,960 21
(ii) Credit risk
Financial risk management
Credit risk is the risk of financial loss to the Group if a customer or counterparty to a financial instrument fails to meet its contractual
obligations, and arises principally from the Group’s receivables from customers and investment securities.
Group
The Group’s credit risk is primarily attributable to its trade receivables. The maximum credit risk exposure of the Group comprises the
amounts presented in the balance sheet, which are stated net of provisions for doubtful debt. A provision is made where there is an
identified loss event which, based on previous experience, is evidence of a reduction in the recoverability of future cash flows.
Management has credit policies in place to manage risk on an ongoing basis. These include the use of customer specific credit limits.
Company
The majority of the Company’s receivables are with subsidiaries. The Company does not consider these counter-parties to be a
significant credit risk.
Exposure to credit risk
The carrying amount of financial assets, other than available for sale financial assets represents the maximum credit exposure. Therefore,
the maximum exposure to credit risk at the balance sheet date was £16,983,000 (2012: £7,798,000) being the total trade receivables,
other financial assets and cash and cash equivalents in the balance sheet.
The maximum exposure to credit risk for trade receivables at the balance sheet date by geographic region was:
Group
2013
£’000
2012
£’000
Falkland Islands 1,133
Europe 663
North America 562 391
United Kingdom 2,321 1,962
Other 281 343
Trade receivables 4,960
The Company has no trade receivables.
28 Financial instruments CONTINUED

FALKLAND ISLANDS HOLDINGS PLC 65
Credit quality of trade receivables and impairment losses
Group
Gross
2013
£’000
Impairment
2013
£’000
Net
2013
£’000
Gross
2012
£’000
Impairment
2012
£’000
Net
2012
£’000
Not past due 2,745 – 2,745 –
Past due 0 – 30 days 1,689 – 1,689 1,216 – 1,216
Past due 31 – 120 days 272 – 272 464 – 464
More than 120 days 656 (402) 254 382 (341) 41
5,362 (402) 4,960 (341)
The movement in the allowances for impairment in respect of trade receivables during the year was:
Group
2013
£’000
2012
£’000
Balance as at 1 April 2012 341
Impairment loss recognised 61 82
Utilisation of provision – –
Balance as at 31 March 2013 402 341
The allowance account for trade receivables is used to record impairment losses unless the Group is satisfied that no recovery of the
amount owing is possible; at that point the amounts considered irrecoverable are written off against the trade receivables directly.
No further analysis has been provided for cash and cash equivalents, trade receivables from Group companies, other receivables and
other financial assets as there is limited exposure to credit risk and no provisions for impairment have been recognised.
(iii) Liquidity risk
Financial risk management
Group and Company
At the beginning of the period the Group had outstanding bank loans of £3 million. All payments due during the year with respect to
these agreements were met as they fell due.
The Group manages its cash balances centrally at head office and prepares rolling cash flow forecasts to ensure funds are available to
meet its secured and unsecured commitments as and when they fall due.
28 Financial instruments CONTINUED

Notes to the Financial StatementsCONTINUED
ANNUAL REPORT 201366
Liquidity risk – Group
The following are the contractual maturities of financial liabilities, including estimated interest payments and excluding the effects of
netting agreements:
2013
Carrying
amount
£’000
Contractual
cash flows
£’000
1 year or less
£’000
1 to 2 years
£’000 £’000
and over
£’000
Non-derivative financial instruments:
Secured bank loans 2,003 1,026 1,010 –
Finance leases 12,963 396 366
Trade and other payables 10,012 10,012 10,012 – – –
11,434 991
The contractual cash flows for finance leases in the years ended 31 March 2013 and 31 March 2012 are significantly higher than the
2012
Carrying
amount
£’000
Contractual
cash flows
£’000
1 year or less
£’000
1 to 2 years
£’000 £’000
and over
£’000
Non-derivative financial instruments:
Secured bank loans 3,080 1,031 1,034 –
Finance leases
Trade and other payables – – –
24,998 1,814
28 Financial instruments CONTINUED

FALKLAND ISLANDS HOLDINGS PLC 67
Liquidity risk – Company
The following are the contractual maturities of financial liabilities, including estimated interest payments and excluding the effects of
netting agreements:
2013
Carrying
amount
£’000
Contractual
cash flows
£’000
1 year or less
£’000
1 to 2 years
£’000 £’000
and over
£’000
Non-derivative financial instruments:
Secured bank loans 1,636 826 810 – –
Trade and other payables 461 461 461 – – –
2,030 810 – –
2012
Carrying
amount
£’000
Contractual
cash flows
£’000
1 year or less
£’000
1 to 2 years
£’000 £’000
and over
£’000
Non-derivative financial instruments:
Secured bank loans 831 –
Bank overdrafts 1,409 1,409 1,409 – – –
Trade and other payables – – –
–
(iv) Market risk
Financial risk management
Market risk is the risk that changes in market prices, such as foreign exchange rates, interest rates and equity prices will affect the
Group’s income or the value of its holdings of financial instruments.
Market risk – Foreign currency risk
The Group has exposure to foreign currency risk arising from trade and other payables which are denominated in foreign currencies.
The Group is not, however, exposed to any significant transactional foreign currency risk. The Group’s exposure to foreign currency risk
is as follows and is based on carrying amounts for monetary financial instruments.
Group
As at 31 March 2013EUR
£’000
USD
£’000
Other
£’000
Total
£’000
Cash and cash equivalents 32 204 243
Debtors – 38 – 38
Trade and other payables (321) (261) (679)
Balance sheet exposure (289) (19) (90) (398)
28 Financial instruments CONTINUED
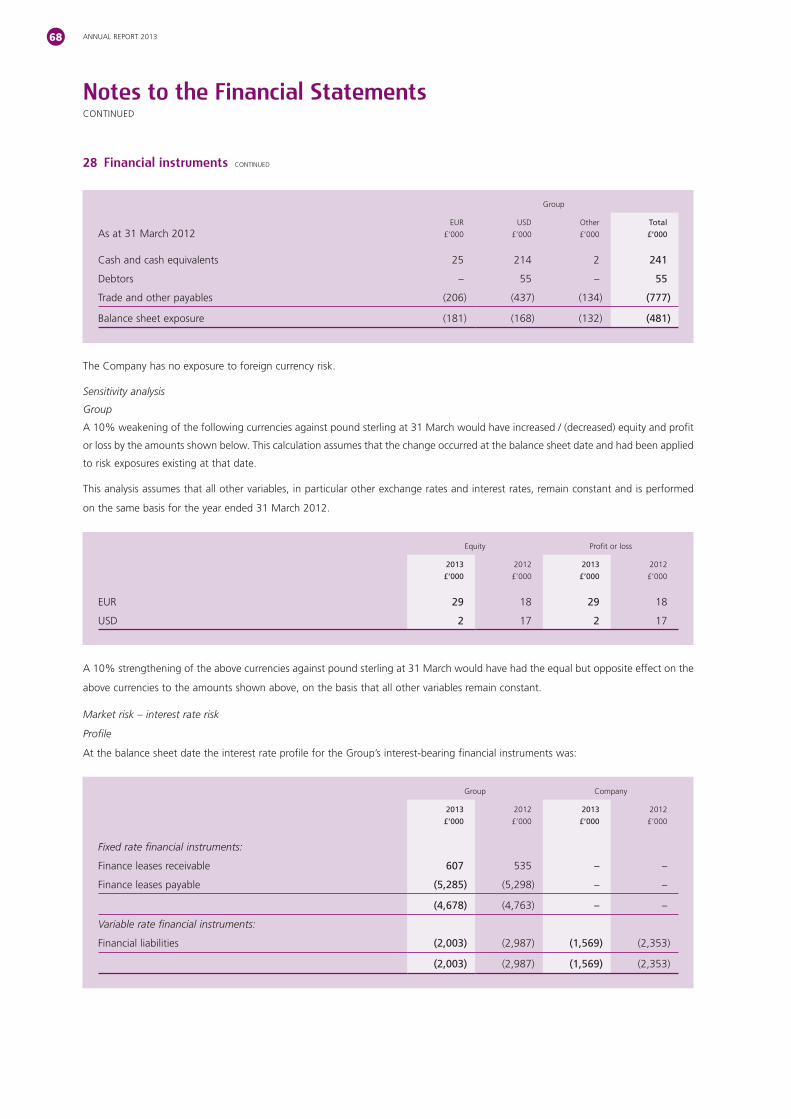
Notes to the Financial StatementsCONTINUED
ANNUAL REPORT 201368
Group
As at 31 March 2012EUR
£’000
USD
£’000
Other
£’000
Total
£’000
Cash and cash equivalents 214 2 241
Debtors – – 55
Trade and other payables (206) (134) (777)
Balance sheet exposure (181) (168) (132) (481)
The Company has no exposure to foreign currency risk.
Sensitivity analysis
Group
A 10% weakening of the following currencies against pound sterling at 31 March would have increased / (decreased) equity and profit
or loss by the amounts shown below. This calculation assumes that the change occurred at the balance sheet date and had been applied
to risk exposures existing at that date.
This analysis assumes that all other variables, in particular other exchange rates and interest rates, remain constant and is performed
on the same basis for the year ended 31 March 2012.
Equity Profit or loss
2013
£’000
2012
£’000
2013
£’000
2012
£’000
EUR 29 18 29 18
USD 2 2
A 10% strengthening of the above currencies against pound sterling at 31 March would have had the equal but opposite effect on the
above currencies to the amounts shown above, on the basis that all other variables remain constant.
Market risk – interest rate risk
Profile
At the balance sheet date the interest rate profile for the Group’s interest-bearing financial instruments was:
Group Company
2013
£’000
2012
£’000
2013
£’000
2012
£’000
Fixed rate financial instruments:
Finance leases receivable 607 – –
Finance leases payable (5,285) – –
(4,678) – –
Variable rate financial instruments:
Financial liabilities (2,003) (1,569)
(2,003) (1,569)
28 Financial instruments CONTINUED

FALKLAND ISLANDS HOLDINGS PLC 69
The Group has a loan of £0.4 million (2012: £0.6 million)
The Group has a further loan of £1.6 million (2012: £2.4 million)
Sensitivity analysis
An increase of 100 basis points in interest rates at the balance sheet date would have increased / (decreased) equity and profit or loss
by the amounts shown below. This calculation assumes that the change occurred at the balance sheet date and had been applied to
risk exposures existing at that date.
This analysis assumes that all other variables, in particular foreign currency rates, remain constant and considers the effect of financial
instruments with variable interest rates and financial instruments at fair value through profit or loss or available-for-sale with fixed
interest rates. The analysis is performed on the same basis for 31 March 2012.
Group Company
2013
£’000
2012
£’000
2013
£’000
2012
£’000
Equity:
Decrease (20) (30) (16) (24)
Profit or loss:
Decrease (20) (30) (16) (24)
Market risk – equity price risk
The Group’s and Company’s exposure to equity price risk arises from its investments in equity securities which are classified in the
Sensitivity analysis
Based upon this share price history the value of available-for-sale financial assets owned at the balance sheet date could have varied
between a low of £3,399,000 (2012: £6,009,000) (2012: £12,222,000).
(v) Capital Management
£29,488,000), are to safeguard its ability to continue as a going concern, so that it can continue to provide returns to shareholders and
benefits to other stakeholders.
28 Financial instruments CONTINUED

Notes to the Financial StatementsCONTINUED
ANNUAL REPORT 201370
29 Operating leases
Non-cancellable operating lease rentals are payable as follows:
Group
2013
£’000
2012
£’000
611
Between one and five years 2,975 2,630
More than five years 8,759
12,345
The Group leases three office premises and a number of storage warehouses under operating leases. Office leases typically run for a
an option to renew the lease after that date.
Group
(2012: £670,000).
The Company had no operating lease commitments.
30 Capital commitments
At the end of the year the Group had no capital commitments not provided for in these financial statements.
31 Related parties
The Company has a related party relationship with its subsidiaries (see note 14) and with its Directors and executive officers.
Directors of the Company and their immediate relatives control 21.4% of the voting shares of the Company.
The compensation of key management personnel (including Directors) is as follows:
Group Company
2013
£’000
2012
£’000
2013
£’000
2012
£’000
Key management emoluments including social security costs 1,536 1,244 560 488
Company contributions to defined contribution pension plans 83 100 – 26
Share-related awards 155 46 127 –
Total key management personnel compensation 1,774 1,390 687

FALKLAND ISLANDS HOLDINGS PLC 71
32 Accounting estimates and judgements
The preparation of financial statements in conformity with adopted IFRS requires management to make judgements, estimates and
assumptions that effect the application of policies and reported amounts of assets and liabilities, income and expenses. The estimates
and associated assumptions are based upon historical experience and various other factors that are believed to be reasonable under the
circumstances, the results of which form the basis of the judgements as to asset and liability carrying values which are not readily
apparent from other sources. Actual results may vary from these estimates, and taken into account in periodic reviews of the application
of such estimates and assumptions.
Revisions to accounting estimates are recognised in the period in which the estimate is revised if the revision affects only that period,
or in the period of revision and future periods if the revision affects both current and future periods.
Actuarial assumptions have been used to value the defined benefit pension liabilities. Management have selected these assumptions
from a range of possible options following consultations with independent actuarial advisors.
Impairment tests have been undertaken with respect to intangible assets (see note 11 for further details) using commercial judgement
and a number of assumptions and estimates have been made to support their carrying amounts. In determining the fair value of
intangible asset valuation advisors.

ANNUAL REPORT 201372
Directors and Corporate Information
Registered Office
Kenburgh Court,
Bishop’s Stortford,
Hertfordshire CM23 3HX
Email: [email protected]
Registered number 03416346
Website: www.fihplc.com
Auditor
KPMG Audit Plc
St. Nicholas House, Park Row,
Nottingham NG1 6FQ
Financial PR
FTI Consulting
Holborn Gate,
26 Southampton Buildings,
Divisional Management
The Falkland Islands Company
Roger Spink Director and General Manager
Email: [email protected]
Website: www.the-falkland-islands-co.com
Portsmouth Harbour Ferry Company
Keith Edwards Director and General Manager
Email: [email protected]
Website: www.gosportferry.co.uk
Momart Limited
Kenneth Burgon Director
Anna Maris Director
Email: [email protected]
Website: www.momart.co.uk
Directors
David Hudd Chairman
John Foster Managing Director
*Non-executive Directors
Company Secretary
Carol Bishop
Corporate Information
Stockbroker and Nominated Adviser
Solicitors
Westminster,
Banker
HSBC Bank plc
18 North Street,
Bishop’s Stortford,
Registrar
Capita Registrars
The Registry, 34 Beckenham Road,
Beckenham,
Kent BR3 4TU


www.fihplc.com
Related Documents