Failure Mechanics of Nonlinear, Heterogeneous, Anisotropic Cardiovascular Tissues: Implications for Ascending Thoracic Aortic Aneurysms A THESIS SUBMITTED TO THE FACULTY OF THE UNIVERSITY OF MINNESOTA BY Christopher E. Korenczuk IN PARTIAL FULFILLMENT OF THE REQUIREMENTS FOR THE DEGREE OF DOCTOR OF PHILOSOPHY Victor H. Barocas, Adviser June 2019

Welcome message from author
This document is posted to help you gain knowledge. Please leave a comment to let me know what you think about it! Share it to your friends and learn new things together.
Transcript
Failure Mechanics of Nonlinear, Heterogeneous, Anisotropic Cardiovascular Tissues:Implications for Ascending Thoracic Aortic Aneurysms
A THESISSUBMITTED TO THE FACULTY OF THE
UNIVERSITY OF MINNESOTABY
Christopher E. Korenczuk
IN PARTIAL FULFILLMENT OF THE REQUIREMENTSFOR THE DEGREE OF
DOCTOR OF PHILOSOPHY
Victor H. Barocas, Adviser
June 2019

© Christopher E. Korenczuk June 2019
Acknowledgments
First, I’d like to thank my adviser, Victor Barocas. Victor, you have been an excep-
tional mentor and friend throughout my graduate tenure. Thank you for constantly
showing me how exciting and rewarding academic research can be. I can truly say
that both the quality of my PhD research, and my entire graduate school experience,
would not be the same without you. You have instilled formative scientific practices,
and have helped me develop a framework for research that I will carry with me for
the rest of my life. You have always tried to “do what is best for the student”, and I
can honestly say that you have been unwavering in this tenant for my entire tenure.
Thank you for helping me process both scientific and personal topics, and for always
having an open mind to engage in other thoughts and worldviews outside of research.
Know that I am forever grateful to have worked with you on this PhD thesis, and I
look forward to any future collaborations we might have.
To all of the Barocas Lab members, past and present, thank you for being a
welcoming family to share graduate school with. Vic Lai - you were the first lab
member I was able to work with, thank you for helping me grow accustomed to the
changes graduate life presented and for introducing me to Hope Community Church.
I will always appreciate your mentorship and friendship. Thank you for always being
a great sounding board and strong encouragement. Colleen - thank you for passing
along this project and mentoring me in the short time that we were able to work with
each other. Your aptitude and hard work ethic have been particularly motivational
for me in my career. Amy, Inka, and Sarah - thank you for the example you set as
senior lab members. You were all instrumental in helping me choose the Barocas
Lab and welcoming me in. Julia, Rohit, and Vahab - the experiences we shared hold
some of my most fond memories during this season. Thank you all for making the lab
i

(and office) truly an enjoyable place to work every day, I can’t thank you all enough
for your help. Whether it was related to classwork, research, or a personal topic,
you three were always there to process anything that arose, and you were always
supportive. I’m grateful to have shared this experience with you, and I value our
friendships. Shannen, Lauren, Emily, Ryan, Hernan, Liz, Tiffany, David, and Jae - I
can’t thank you all enough for helping me throughout these last few years. We have
shared countless, memorable discussions and experiences, all of which I will carry
with me. Thank you all for your support, our friendships have played a significant
role in my growth and experience throughout graduate school. Continue to make the
Barocas Lab a welcoming place, where ideas and challenges are always approached
as a collective team.
To the community at Anselm House (Andrew, Erin, Matt, Cheri, Danica, Bryan,
and the rest of AH staff) - thank you all for work you do pouring into students
at the University of Minnesota. My time in the MacLaurin Fellows Program was
one of the most formative experiences during my graduate tenure, and I will leave
graduate school equipped with not only scientific training, but also with a more
comprehensive worldview. I cannot stress enough how pivotal AH was in guiding my
personal development during graduate school, allowing me to carry these principles
into my future career and life. Thank you for showing me how intertwined faith and
work are, and for always living out the Gospel in your words and actions.
To my Small Group and friends at Hope Community Church - thank you all for
making Minnesota home. You have all been the exception to the idea that finding
community in a new location is never easy. It would be impossible for me to state all
the ways you have helped throughout my time in graduate school. I’m so grateful to
walk through life with all of you, thank you for your continued love and support.
To my family and friends - Kevin, thank you for being a great example and role
ii
model, taking time and effort to show a new college student how interesting academic
research can be. Without you, I would have never considered the field of Biomedical
Engineering, and consequently would have never pursued this research. Thank you
for your mentorship during my undergraduate years. Jordan, thank you for your
advice and support throughout graduate school, especially during these final months.
I know our undergraduate selves looked forward to the day our theses would finally
be complete, and that day has arrived. Thank you for journeying with me throughout
undergraduate and graduate work. Mom and Dad, thank you for always being a great
example of hard work and determination. Your guidance has equipped me with so
much, and without it I would never have finished - or even started - this work. Thank
you for your constant love and encouragement, I know it was not easy to watch me
move halfway across the country (to somewhere cold, nonetheless). You have given
me unwavering support in every possible way, and the quality of character you both
lead with has been imprinted on me. This work is the culmination of all the effort
you put into my education throughout the years, for which I am eternally grateful.
Lastly, to my wife. Mal - meeting you was the highlight of my entire graduate
school tenure. We’ve shared all of the ups and downs of my grad school experience
together. You have journeyed with me through the stresses and joys of qualifying
exams, conferences, publications, and finally, my thesis and defense. Most of these
required late nights and early mornings, resulting in time away from you, especially
during this final year. Thank you not only for your understanding, but your constant
and unchanging support. Thank you for listening to me, helping me process, making
me laugh, and, most importantly, challenging me to pursue excellence in all areas,
especially my work. I cannot express what you mean to me, and I could not be more
grateful to have you by my side during this season. This work would not be what it
is without you.
iii

Credo ut intelligam.
“For I do not seek to understand in order that I may
believe, but I believe in order to understand. For this also
I believe - that unless I believe I shall not understand.”
St. Anselm of Canterbury
Colossians 1:9-14
Philippians 2:12-14
Philippians 4:11-12
iv
Contents
List of Tables x
List of Figures xi
1 Introduction 1
1.1 Cardiovascular System . . . . . . . . . . . . . . . . . . . . . . . . . . 2
1.1.1 Healthy Cardiac Function and Anatomy . . . . . . . . . . . . 2
1.1.2 Myocardial Infarctions . . . . . . . . . . . . . . . . . . . . . . 5
1.1.3 Ascending Thoracic Aortic Aneurysms . . . . . . . . . . . . . 6
1.2 Motivation for Current Work . . . . . . . . . . . . . . . . . . . . . . . 10
1.2.1 Previous Work . . . . . . . . . . . . . . . . . . . . . . . . . . 10
1.2.2 Outline of Current Work . . . . . . . . . . . . . . . . . . . . . 12
2 Isotropic Failure Criteria are not Appropriate for Anisotropic Fi-
brous Biological Tissues 18
2.1 Introduction . . . . . . . . . . . . . . . . . . . . . . . . . . . . . . . . 18
2.2 Methods . . . . . . . . . . . . . . . . . . . . . . . . . . . . . . . . . . 22
2.2.1 Experiment . . . . . . . . . . . . . . . . . . . . . . . . . . . . 22
2.2.2 Failure Criteria . . . . . . . . . . . . . . . . . . . . . . . . . . 25
2.2.3 Finite Element Modeling . . . . . . . . . . . . . . . . . . . . . 26
v
2.2.4 2D Failure Propagation Simulations . . . . . . . . . . . . . . . 28
2.2.5 Failure Calculations in 2-D Simulations . . . . . . . . . . . . . 29
2.3 Results . . . . . . . . . . . . . . . . . . . . . . . . . . . . . . . . . . . 31
2.4 Discussion . . . . . . . . . . . . . . . . . . . . . . . . . . . . . . . . . 33
2.5 Acknowledgment . . . . . . . . . . . . . . . . . . . . . . . . . . . . . 37
3 Effects of Collagen Heterogeneity on Myocardial Infarct Mechanics
in a Multiscale Fiber Network Model 47
3.1 Introduction . . . . . . . . . . . . . . . . . . . . . . . . . . . . . . . . 47
3.2 Methods . . . . . . . . . . . . . . . . . . . . . . . . . . . . . . . . . . 49
3.2.1 Fiber Map Generation from Scar Samples . . . . . . . . . . . 49
3.2.2 Fiber Network Model Generation . . . . . . . . . . . . . . . . 50
3.2.3 Model Simulations . . . . . . . . . . . . . . . . . . . . . . . . 52
3.2.4 Statistics . . . . . . . . . . . . . . . . . . . . . . . . . . . . . . 52
3.3 Results . . . . . . . . . . . . . . . . . . . . . . . . . . . . . . . . . . . 53
3.4 Discussion . . . . . . . . . . . . . . . . . . . . . . . . . . . . . . . . . 55
3.4.1 Heterogeneous Collagen Structure Produces Heterogeneous
Stresses and Strains . . . . . . . . . . . . . . . . . . . . . . . . 55
3.4.2 Effect of Heterogeneity on Scar Tissue Anisotropy . . . . . . . 56
3.4.3 Effect of Heterogeneity on Scar Tissue Failure . . . . . . . . . 57
3.4.4 Limitations of Current Study . . . . . . . . . . . . . . . . . . 58
3.4.5 Conclusions . . . . . . . . . . . . . . . . . . . . . . . . . . . . 60
3.5 Acknowledgment . . . . . . . . . . . . . . . . . . . . . . . . . . . . . 60
4 Ex Vivo Mechanical Tests and Multiscale Computational Modeling
Highlight the Importance of Intramural Shear Stress in Ascending
Thoracic Aortic Aneurysms 69
vi
4.1 Introduction . . . . . . . . . . . . . . . . . . . . . . . . . . . . . . . . 70
4.2 Methods . . . . . . . . . . . . . . . . . . . . . . . . . . . . . . . . . . 73
4.2.1 Experiments . . . . . . . . . . . . . . . . . . . . . . . . . . . . 73
4.2.2 Multiscale Model . . . . . . . . . . . . . . . . . . . . . . . . . 75
4.2.3 Multiscale Inflation . . . . . . . . . . . . . . . . . . . . . . . . 77
4.3 Results . . . . . . . . . . . . . . . . . . . . . . . . . . . . . . . . . . . 78
4.3.1 Experiments . . . . . . . . . . . . . . . . . . . . . . . . . . . . 78
4.3.2 Modeling . . . . . . . . . . . . . . . . . . . . . . . . . . . . . 80
4.4 Discussion . . . . . . . . . . . . . . . . . . . . . . . . . . . . . . . . . 82
4.5 Acknowledgment . . . . . . . . . . . . . . . . . . . . . . . . . . . . . 85
4.6 Supplemental Results . . . . . . . . . . . . . . . . . . . . . . . . . . . 97
4.6.1 Experimental . . . . . . . . . . . . . . . . . . . . . . . . . . . 97
5 The Contribution of Individual Microstructural Components in Ar-
terial Mechanics and Failure 100
5.1 Introduction . . . . . . . . . . . . . . . . . . . . . . . . . . . . . . . . 100
5.2 Methods . . . . . . . . . . . . . . . . . . . . . . . . . . . . . . . . . . 103
5.2.1 Experiments . . . . . . . . . . . . . . . . . . . . . . . . . . . . 103
5.3 Results . . . . . . . . . . . . . . . . . . . . . . . . . . . . . . . . . . . 105
5.3.1 Experiments . . . . . . . . . . . . . . . . . . . . . . . . . . . . 105
5.4 Discussion . . . . . . . . . . . . . . . . . . . . . . . . . . . . . . . . . 106
5.5 Future Work . . . . . . . . . . . . . . . . . . . . . . . . . . . . . . . . 108
5.6 Acknowledgment . . . . . . . . . . . . . . . . . . . . . . . . . . . . . 109
6 Conclusions and Future Work 118
6.1 Major Findings and Conclusions . . . . . . . . . . . . . . . . . . . . . 118
6.2 Future Directions . . . . . . . . . . . . . . . . . . . . . . . . . . . . . 120
vii

References 146
Appendices 147
A Failure of the Porcine Ascending Aorta: Multidirectional Experi-
ments and a Unifying Microstructural Model 147
A.1 Background . . . . . . . . . . . . . . . . . . . . . . . . . . . . . . . . 147
A.2 Methods . . . . . . . . . . . . . . . . . . . . . . . . . . . . . . . . . . 151
A.2.1 Experiments . . . . . . . . . . . . . . . . . . . . . . . . . . . . 151
A.2.2 Statistical analysis and presentation . . . . . . . . . . . . . . . 154
A.2.3 Model . . . . . . . . . . . . . . . . . . . . . . . . . . . . . . . 155
A.3 Results . . . . . . . . . . . . . . . . . . . . . . . . . . . . . . . . . . . 160
A.3.1 Uniaxial extension to failure . . . . . . . . . . . . . . . . . . . 161
A.3.2 Equibiaxial extension . . . . . . . . . . . . . . . . . . . . . . . 162
A.3.3 Peel to failure . . . . . . . . . . . . . . . . . . . . . . . . . . . 163
A.3.4 Shear lap failure . . . . . . . . . . . . . . . . . . . . . . . . . 164
A.3.5 Summary comparison of model and experiment . . . . . . . . 166
A.3.6 Uniaxial extension to failure in the radial direction . . . . . . 166
A.4 Discussion . . . . . . . . . . . . . . . . . . . . . . . . . . . . . . . . . 167
A.5 Acknowledgment . . . . . . . . . . . . . . . . . . . . . . . . . . . . . 171
B Dicer1 Deficiency in the Idiopathic Pulmonary Fibrosis Fibroblastic
Focus Promotes Fibrosis by Suppressing MicroRNA Biogenesis 182
B.1 Introduction . . . . . . . . . . . . . . . . . . . . . . . . . . . . . . . . 183
B.2 Methods . . . . . . . . . . . . . . . . . . . . . . . . . . . . . . . . . . 185
B.2.1 Statistical Analysis . . . . . . . . . . . . . . . . . . . . . . . . 185
B.3 Results . . . . . . . . . . . . . . . . . . . . . . . . . . . . . . . . . . . 186
viii

B.3.1 IPF-ECM Suppresses miR-29 Expression and Upregulates
Collagen Production . . . . . . . . . . . . . . . . . . . . . . . 186
B.3.2 Stiffness Increases miR-29 Expression on Two-Dimensional
Hydrogels . . . . . . . . . . . . . . . . . . . . . . . . . . . . . 187
B.3.3 IPF-ECM Negatively Regulates YAP and Suppresses miR-
29 Transcription . . . . . . . . . . . . . . . . . . . . . . . . . 187
B.3.4 Enforced YAP Expression in Fibroblasts Does Not Restore
Mature miR-29 Expression on IPF-ECM . . . . . . . . . . . . 188
B.3.5 IPF-ECM Suppresses the MicroRNA Processing Machinery . . 189
B.3.6 Dicer1 Expression Is Reduced in Cells Comprising the Myofibroblast-
Rich Core of the Fibroblastic Focus . . . . . . . . . . . . . . . 190
B.3.7 IPF-ECM Increases the Association of the Dicer1 Transcript
with the RNABinding Protein AUF1 . . . . . . . . . . . . . . 191
B.3.8 Dicer1 Knockdown Decreases Mature miR-29 Abundance
and Increases Expression of miR-29 Target Genes on Ctrl-ECM 192
B.3.9 Dicer1 Knockdown Imparts Fibroblasts with Fibrogenicity
In Vivo . . . . . . . . . . . . . . . . . . . . . . . . . . . . . . 193
B.4 Discussion . . . . . . . . . . . . . . . . . . . . . . . . . . . . . . . . . 194
B.5 Acknowledgment . . . . . . . . . . . . . . . . . . . . . . . . . . . . . 198
B.6 Supplemental Material . . . . . . . . . . . . . . . . . . . . . . . . . . 199
B.6.1 Methods . . . . . . . . . . . . . . . . . . . . . . . . . . . . . . 199
ix
List of Tables
3.1 The average angle and degree of alignment for each of the 15 samples. 62
4.1 The manually adjusted parameters for the multiscale model fit to
all loading conditions (uniaxial, lap, biaxial). Initial guesses for
parameters were based off of previous work with healthy porcine
tissue [Witzenburg et al., 2017]. . . . . . . . . . . . . . . . . . . . . . 86
A.1 Governing equations applied within the multiscale model, as well
as the length scale at which each equation was applied. . . . . . . . . 156
A.2 Model parameter values and sources . . . . . . . . . . . . . . . . . . . 158
B.1 List of primary antibodies used for immunoblot. Conditions as
recommended by manufacturer. . . . . . . . . . . . . . . . . . . . . . 209
B.2 List of validated qPCR primers from Qiagen. . . . . . . . . . . . . . . 210
B.3 List of primary antibodies used for immunochemistry. Antigen-heat
retrieval (AHR) or Protienase-K (Prot-K) . . . . . . . . . . . . . . . 211
x
List of Figures
1.1 Anatomy of the heart [Gray, 1918]. . . . . . . . . . . . . . . . . . . . 15
1.2 Arterial structure, adapted from [Gasser et al., 2006]. . . . . . . . . . 16
1.3 A magnetic resonance angiogram of an ATAA [Cruz et al., 2007].
Arrows indicate enlarged diameter. . . . . . . . . . . . . . . . . . . . 17
2.1 A. Outlines of dogbone sample geometries are shown along the ax-
ial length of the vessel (not drawn to scale). Angles were taken to
be relative to the circumferential orientation (0o). Scale bar shown
in white. B. A representative stress-stretch curve for one uniaxial
sample, with corresponding tissue images during testing. C. Out-
line of the shear lap sample geometry (not drawn to scale). D. A
representative force-displacement curve for one shear lap sample.
Failure initiated near the overlap region of the sample and propa-
gated across the overlap region (lap across failure). . . . . . . . . . . 38
2.2 Finite element mesh for one shear lap sample with applied boundary
conditions. The nodes on the right face were fixed in all directions,
while the nodes on the left face were fixed in the vertical and out of
plane directions, and given prescribed displacements based on the
experiment. . . . . . . . . . . . . . . . . . . . . . . . . . . . . . . . . 39
2.3 Failure stresses at each sample angle (n> 9 for each angle). ANOVA
xi
showed that change in sample angle had a statistically significant
effect on failure stress (p = 0.0003). Error bars show 95% CI’s. . . . . 40
2.4 Experiment (points) and failure criteria fits. A. The von Mises fail-
ure criterion (solid green line, 95% CI shaded) fit to the mean peak
stresses does not capture the anisotropic response of the tissue. B.
Tsai-Hill maximum-work theory model (solid line, 95% CI shaded).
Black error bars indicate 95% CI’s on experimental points. . . . . . . 41
2.5 Strain tracking results from one shear lap sample. Large shear
strains (∼40%) were exhibited in the overlap region of the sample. . . 42
2.6 A. Representative force-displacement curve for one shear lap sam-
ple (black dots), with a simulation force-displacement curve (red
line) using optimized parameters. B. Failure propagation for one
shear lap sample, shown at three different displacements. The onset
of failure began near the overlap region of the sample (indicated by
the arrow), and propagated across the center (lap across failure).
C. Failure simulation using the Tsai-Hill criterion. Propagation oc-
curred through the overlap region of the sample, and eventually tore
in the overlap region (lap across failure). D. Failure simulation us-
ing the von Mises criterion, where σyield = σavg. Failure propagated
across the sample arm, and tore the arm off (arm failure). Failure
simulations are shown at similar failure points to the experiment,
but not at the same displacement as the experiment. . . . . . . . . . 43
2.7 Area fraction for the experimental shear lap samples, along with
the Tsai-Hill and von Mises (avg) failure cases. Averages shown
with 95% CI bars. . . . . . . . . . . . . . . . . . . . . . . . . . . . . 44
2.8 A. One experimental sample immediately prior to total failure. B.
xii
Sample in the undeformed domain. White dotted line indicates
calculated crack propagation location and direction in undeformed
domain. Lap arm failure occurred in the experimental sample. C,
D. Typical failure comparison between the Tsai-Hill and von Mises
failure criteria in the undeformed domain. The Tsai-Hill failure cri-
terion predicted lap arm failure, while the von Mises failure criterion
predicted arm failure. . . . . . . . . . . . . . . . . . . . . . . . . . . . 45
2.9 Average failure location (dots) and crack propagation angle (solid
line) with 95%CI (dotted lines and shaded region) for experimental
samples, Tsai-Hill, and von Mises (avg) failure simulations. Shown
in black is the average shear lap sample geometry calculated using
radius-based averaging from sample outlines (linear approximation
was used for noisy regions of the average sample outline). Samples
were rotated (if needed) so that failure occurred in the left arm for
comparison purposes. . . . . . . . . . . . . . . . . . . . . . . . . . . . 46
3.1 A) Excised rat scar samples stained with picrosirius red to show
collagen fiber orientations in the circumferential (C) - longitudinal
(L) plane. B) Collagen fiber orientation extracted from the tissue
sample using gradient-based image processing. Each pixel was as-
signed an angle from -90o to 90o, representing the angle deviation
from the circumferential direction (C = 0o, L = -90o or 90o). C) A
2D finite-element mesh was created to encompass the entire tissue
area, and a nearest-neighbor linear interpolation was performed to
complete the data set where fiber angle data was previously miss-
ing in B). D) The 2D mesh was extruded into the 3rd dimension
xiii
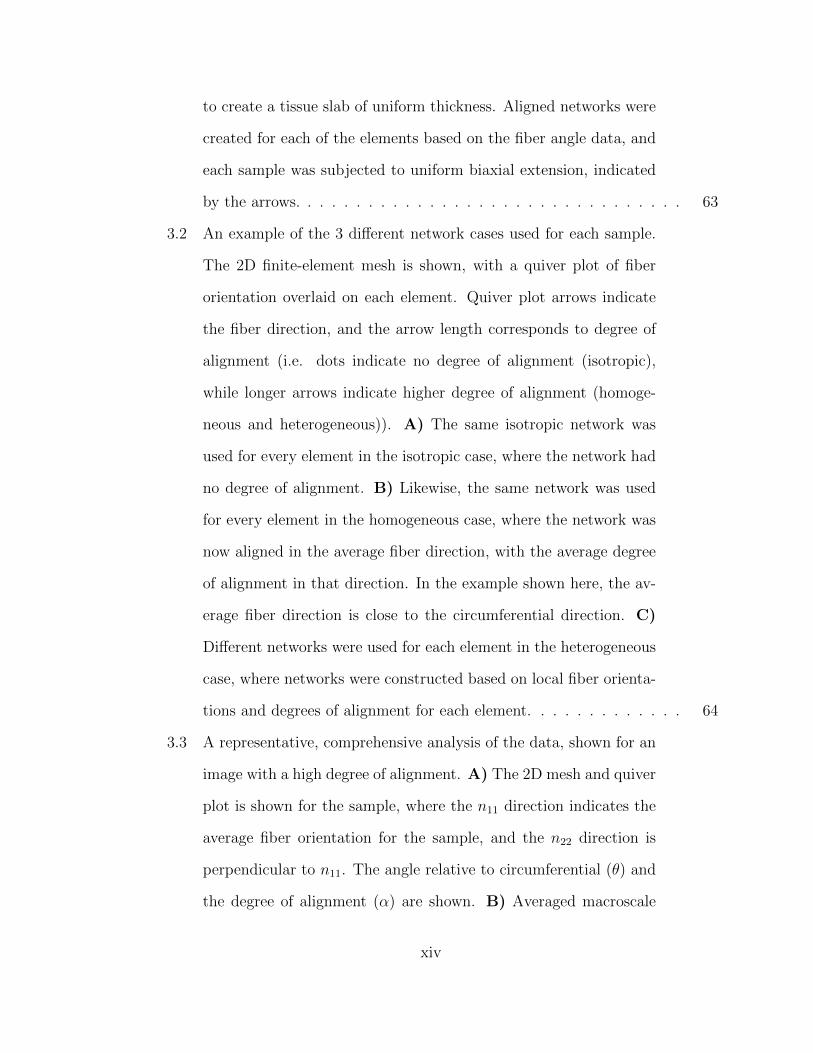
to create a tissue slab of uniform thickness. Aligned networks were
created for each of the elements based on the fiber angle data, and
each sample was subjected to uniform biaxial extension, indicated
by the arrows. . . . . . . . . . . . . . . . . . . . . . . . . . . . . . . . 63
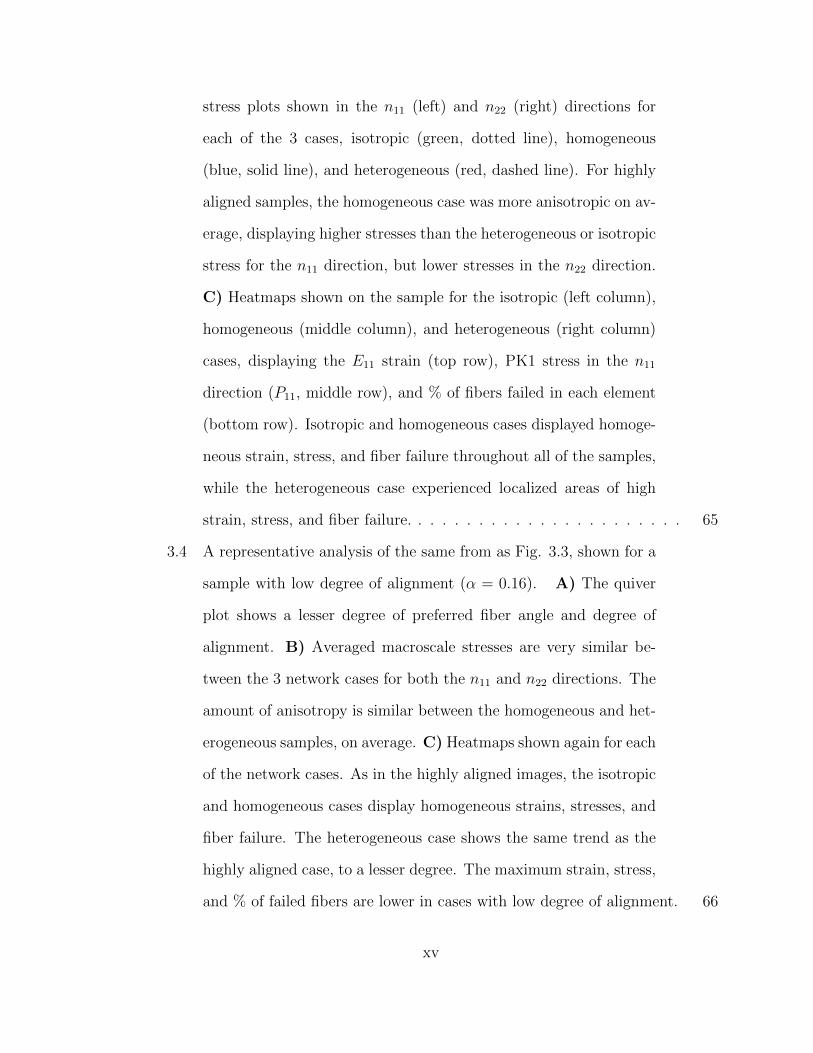
3.2 An example of the 3 different network cases used for each sample.
The 2D finite-element mesh is shown, with a quiver plot of fiber
orientation overlaid on each element. Quiver plot arrows indicate
the fiber direction, and the arrow length corresponds to degree of
alignment (i.e. dots indicate no degree of alignment (isotropic),
while longer arrows indicate higher degree of alignment (homoge-
neous and heterogeneous)). A) The same isotropic network was
used for every element in the isotropic case, where the network had
no degree of alignment. B) Likewise, the same network was used
for every element in the homogeneous case, where the network was
now aligned in the average fiber direction, with the average degree
of alignment in that direction. In the example shown here, the av-
erage fiber direction is close to the circumferential direction. C)
Different networks were used for each element in the heterogeneous
case, where networks were constructed based on local fiber orienta-
tions and degrees of alignment for each element. . . . . . . . . . . . . 64
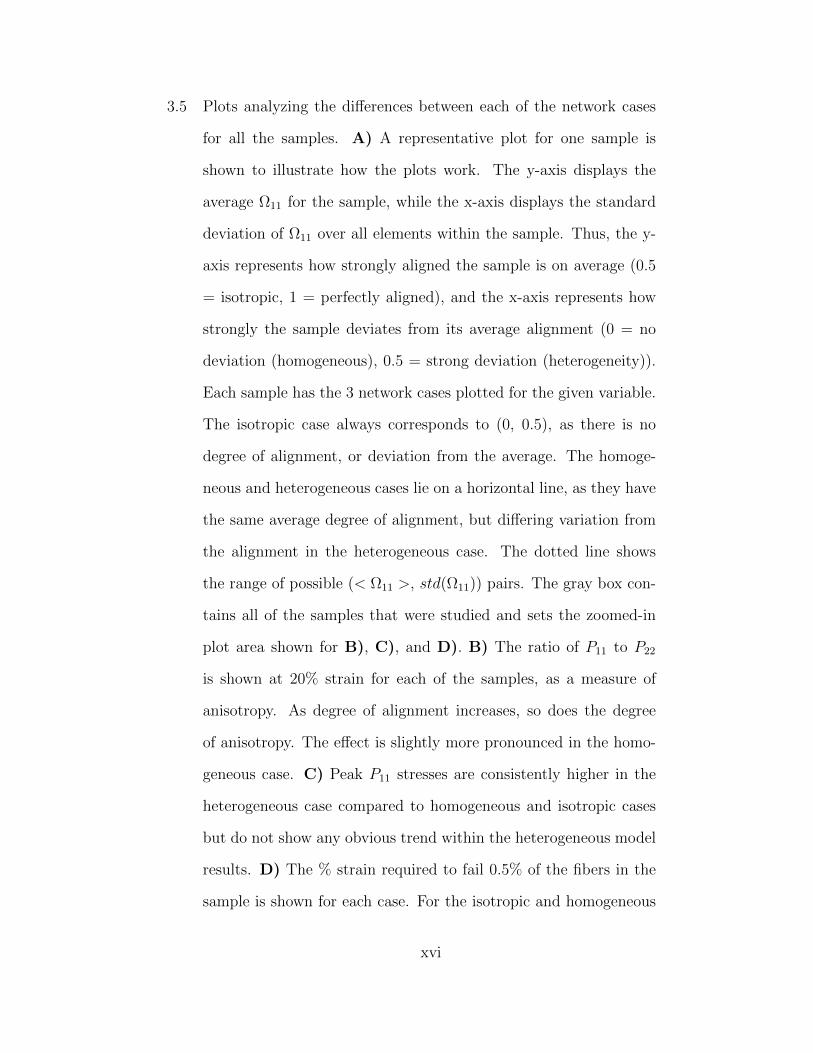
3.3 A representative, comprehensive analysis of the data, shown for an
image with a high degree of alignment. A) The 2D mesh and quiver
plot is shown for the sample, where the n11 direction indicates the
average fiber orientation for the sample, and the n22 direction is
perpendicular to n11. The angle relative to circumferential (θ) and
the degree of alignment (α) are shown. B) Averaged macroscale
xiv
stress plots shown in the n11 (left) and n22 (right) directions for
each of the 3 cases, isotropic (green, dotted line), homogeneous
(blue, solid line), and heterogeneous (red, dashed line). For highly
aligned samples, the homogeneous case was more anisotropic on av-
erage, displaying higher stresses than the heterogeneous or isotropic
stress for the n11 direction, but lower stresses in the n22 direction.
C) Heatmaps shown on the sample for the isotropic (left column),
homogeneous (middle column), and heterogeneous (right column)
cases, displaying the E11 strain (top row), PK1 stress in the n11
direction (P11, middle row), and % of fibers failed in each element
(bottom row). Isotropic and homogeneous cases displayed homoge-
neous strain, stress, and fiber failure throughout all of the samples,
while the heterogeneous case experienced localized areas of high
strain, stress, and fiber failure. . . . . . . . . . . . . . . . . . . . . . . 65
3.4 A representative analysis of the same from as Fig. 3.3, shown for a
sample with low degree of alignment (α = 0.16). A) The quiver
plot shows a lesser degree of preferred fiber angle and degree of
alignment. B) Averaged macroscale stresses are very similar be-
tween the 3 network cases for both the n11 and n22 directions. The
amount of anisotropy is similar between the homogeneous and het-
erogeneous samples, on average. C) Heatmaps shown again for each
of the network cases. As in the highly aligned images, the isotropic
and homogeneous cases display homogeneous strains, stresses, and
fiber failure. The heterogeneous case shows the same trend as the
highly aligned case, to a lesser degree. The maximum strain, stress,
and % of failed fibers are lower in cases with low degree of alignment. 66
xv
3.5 Plots analyzing the differences between each of the network cases
for all the samples. A) A representative plot for one sample is
shown to illustrate how the plots work. The y-axis displays the
average Ω11 for the sample, while the x-axis displays the standard
deviation of Ω11 over all elements within the sample. Thus, the y-
axis represents how strongly aligned the sample is on average (0.5
= isotropic, 1 = perfectly aligned), and the x-axis represents how
strongly the sample deviates from its average alignment (0 = no
deviation (homogeneous), 0.5 = strong deviation (heterogeneity)).
Each sample has the 3 network cases plotted for the given variable.
The isotropic case always corresponds to (0, 0.5), as there is no
degree of alignment, or deviation from the average. The homoge-
neous and heterogeneous cases lie on a horizontal line, as they have
the same average degree of alignment, but differing variation from
the alignment in the heterogeneous case. The dotted line shows
the range of possible (< Ω11 >, std(Ω11)) pairs. The gray box con-
tains all of the samples that were studied and sets the zoomed-in
plot area shown for B), C), and D). B) The ratio of P11 to P22
is shown at 20% strain for each of the samples, as a measure of
anisotropy. As degree of alignment increases, so does the degree
of anisotropy. The effect is slightly more pronounced in the homo-
geneous case. C) Peak P11 stresses are consistently higher in the
heterogeneous case compared to homogeneous and isotropic cases
but do not show any obvious trend within the heterogeneous model
results. D) The % strain required to fail 0.5% of the fibers in the
sample is shown for each case. For the isotropic and homogeneous
xvi
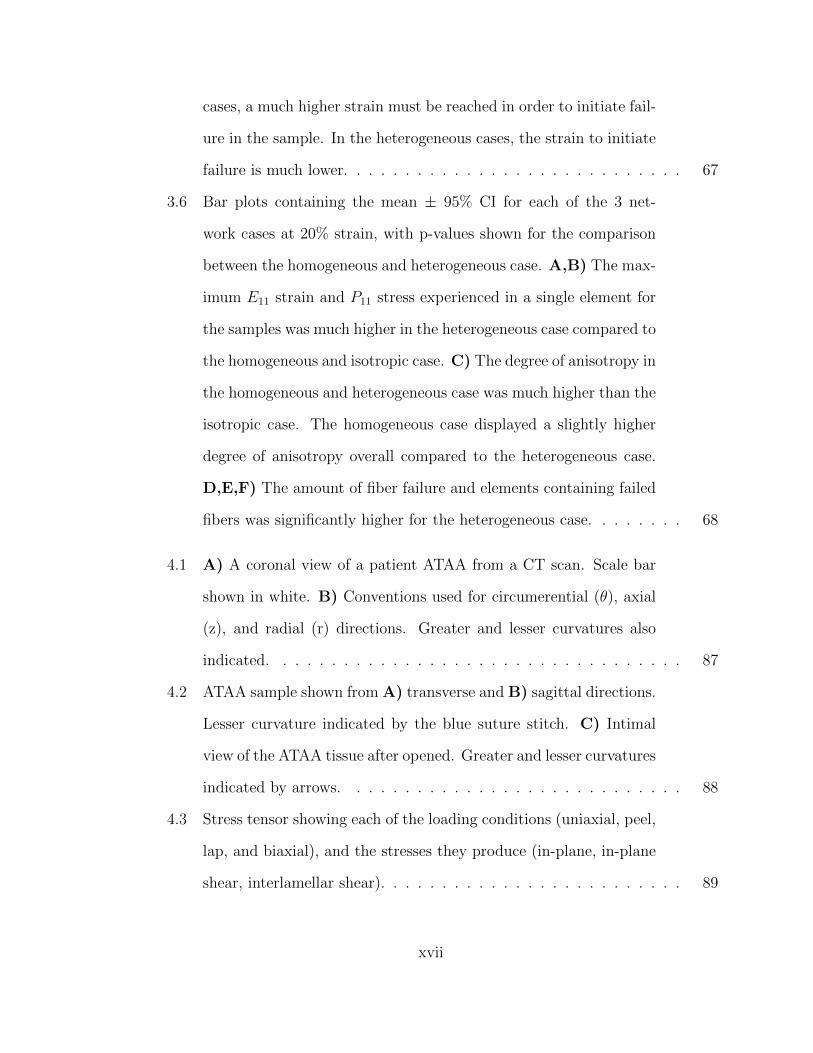
cases, a much higher strain must be reached in order to initiate fail-
ure in the sample. In the heterogeneous cases, the strain to initiate
failure is much lower. . . . . . . . . . . . . . . . . . . . . . . . . . . . 67
3.6 Bar plots containing the mean ± 95% CI for each of the 3 net-
work cases at 20% strain, with p-values shown for the comparison
between the homogeneous and heterogeneous case. A,B) The max-
imum E11 strain and P11 stress experienced in a single element for
the samples was much higher in the heterogeneous case compared to
the homogeneous and isotropic case. C) The degree of anisotropy in
the homogeneous and heterogeneous case was much higher than the
isotropic case. The homogeneous case displayed a slightly higher
degree of anisotropy overall compared to the heterogeneous case.
D,E,F) The amount of fiber failure and elements containing failed
fibers was significantly higher for the heterogeneous case. . . . . . . . 68
4.1 A) A coronal view of a patient ATAA from a CT scan. Scale bar
shown in white. B) Conventions used for circumerential (θ), axial
(z), and radial (r) directions. Greater and lesser curvatures also
indicated. . . . . . . . . . . . . . . . . . . . . . . . . . . . . . . . . . 87
4.2 ATAA sample shown from A) transverse and B) sagittal directions.
Lesser curvature indicated by the blue suture stitch. C) Intimal
view of the ATAA tissue after opened. Greater and lesser curvatures
indicated by arrows. . . . . . . . . . . . . . . . . . . . . . . . . . . . 88
4.3 Stress tensor showing each of the loading conditions (uniaxial, peel,
lap, and biaxial), and the stresses they produce (in-plane, in-plane
shear, interlamellar shear). . . . . . . . . . . . . . . . . . . . . . . . . 89
xvii
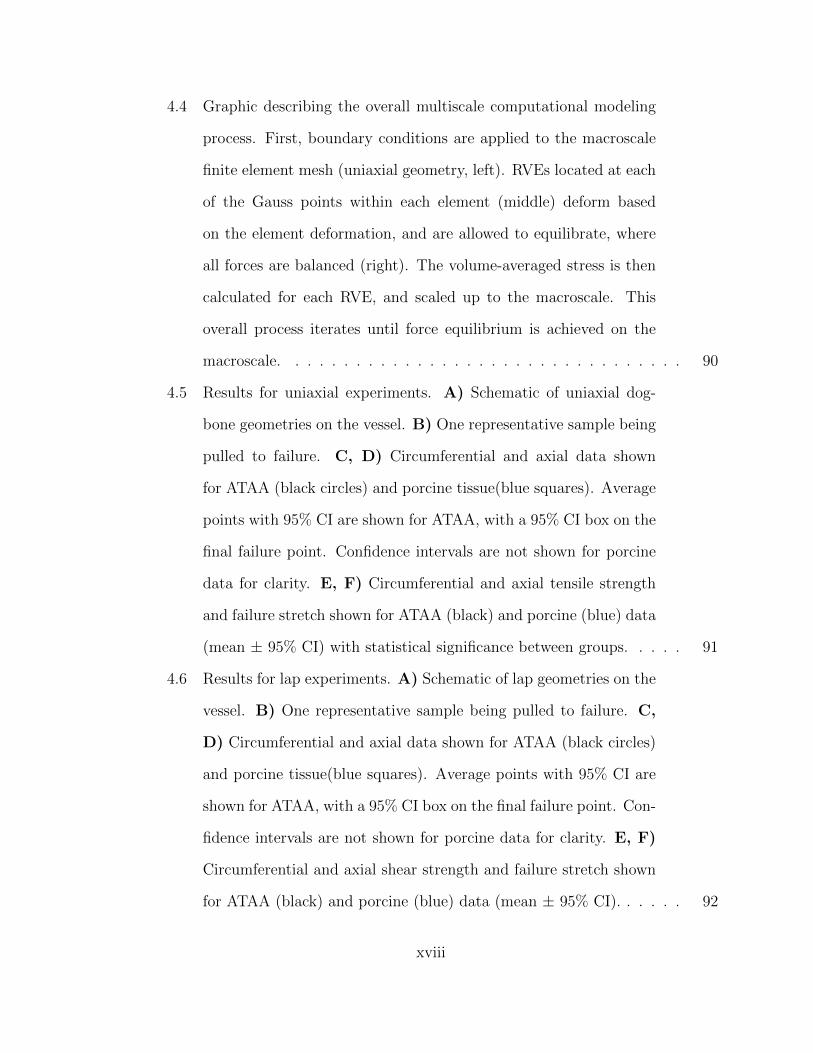
4.4 Graphic describing the overall multiscale computational modeling
process. First, boundary conditions are applied to the macroscale
finite element mesh (uniaxial geometry, left). RVEs located at each
of the Gauss points within each element (middle) deform based
on the element deformation, and are allowed to equilibrate, where
all forces are balanced (right). The volume-averaged stress is then
calculated for each RVE, and scaled up to the macroscale. This
overall process iterates until force equilibrium is achieved on the
macroscale. . . . . . . . . . . . . . . . . . . . . . . . . . . . . . . . . 90
4.5 Results for uniaxial experiments. A) Schematic of uniaxial dog-
bone geometries on the vessel. B) One representative sample being
pulled to failure. C, D) Circumferential and axial data shown
for ATAA (black circles) and porcine tissue(blue squares). Average
points with 95% CI are shown for ATAA, with a 95% CI box on the
final failure point. Confidence intervals are not shown for porcine
data for clarity. E, F) Circumferential and axial tensile strength
and failure stretch shown for ATAA (black) and porcine (blue) data
(mean ± 95% CI) with statistical significance between groups. . . . . 91
4.6 Results for lap experiments. A) Schematic of lap geometries on the
vessel. B) One representative sample being pulled to failure. C,
D) Circumferential and axial data shown for ATAA (black circles)
and porcine tissue(blue squares). Average points with 95% CI are
shown for ATAA, with a 95% CI box on the final failure point. Con-
fidence intervals are not shown for porcine data for clarity. E, F)
Circumferential and axial shear strength and failure stretch shown
for ATAA (black) and porcine (blue) data (mean ± 95% CI). . . . . . 92
xviii
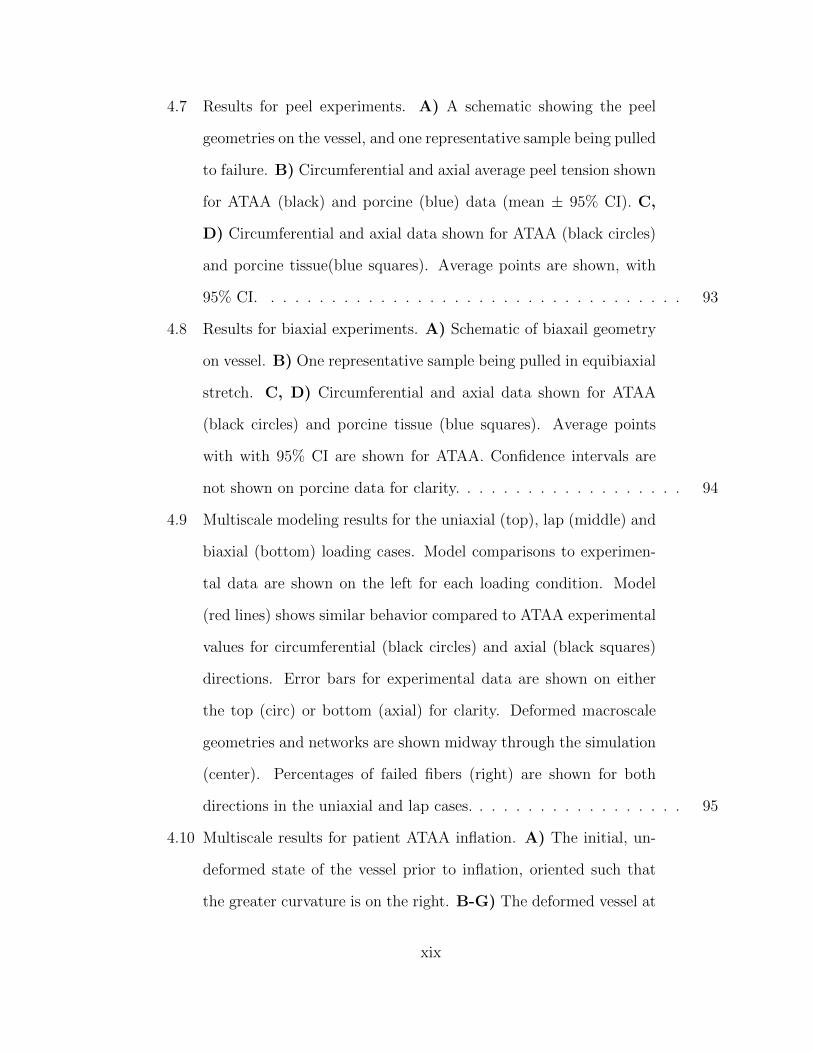
4.7 Results for peel experiments. A) A schematic showing the peel
geometries on the vessel, and one representative sample being pulled
to failure. B) Circumferential and axial average peel tension shown
for ATAA (black) and porcine (blue) data (mean ± 95% CI). C,
D) Circumferential and axial data shown for ATAA (black circles)
and porcine tissue(blue squares). Average points are shown, with
95% CI. . . . . . . . . . . . . . . . . . . . . . . . . . . . . . . . . . . 93
4.8 Results for biaxial experiments. A) Schematic of biaxail geometry
on vessel. B) One representative sample being pulled in equibiaxial
stretch. C, D) Circumferential and axial data shown for ATAA
(black circles) and porcine tissue (blue squares). Average points
with with 95% CI are shown for ATAA. Confidence intervals are
not shown on porcine data for clarity. . . . . . . . . . . . . . . . . . . 94
4.9 Multiscale modeling results for the uniaxial (top), lap (middle) and
biaxial (bottom) loading cases. Model comparisons to experimen-
tal data are shown on the left for each loading condition. Model
(red lines) shows similar behavior compared to ATAA experimental
values for circumferential (black circles) and axial (black squares)
directions. Error bars for experimental data are shown on either
the top (circ) or bottom (axial) for clarity. Deformed macroscale
geometries and networks are shown midway through the simulation
(center). Percentages of failed fibers (right) are shown for both
directions in the uniaxial and lap cases. . . . . . . . . . . . . . . . . . 95
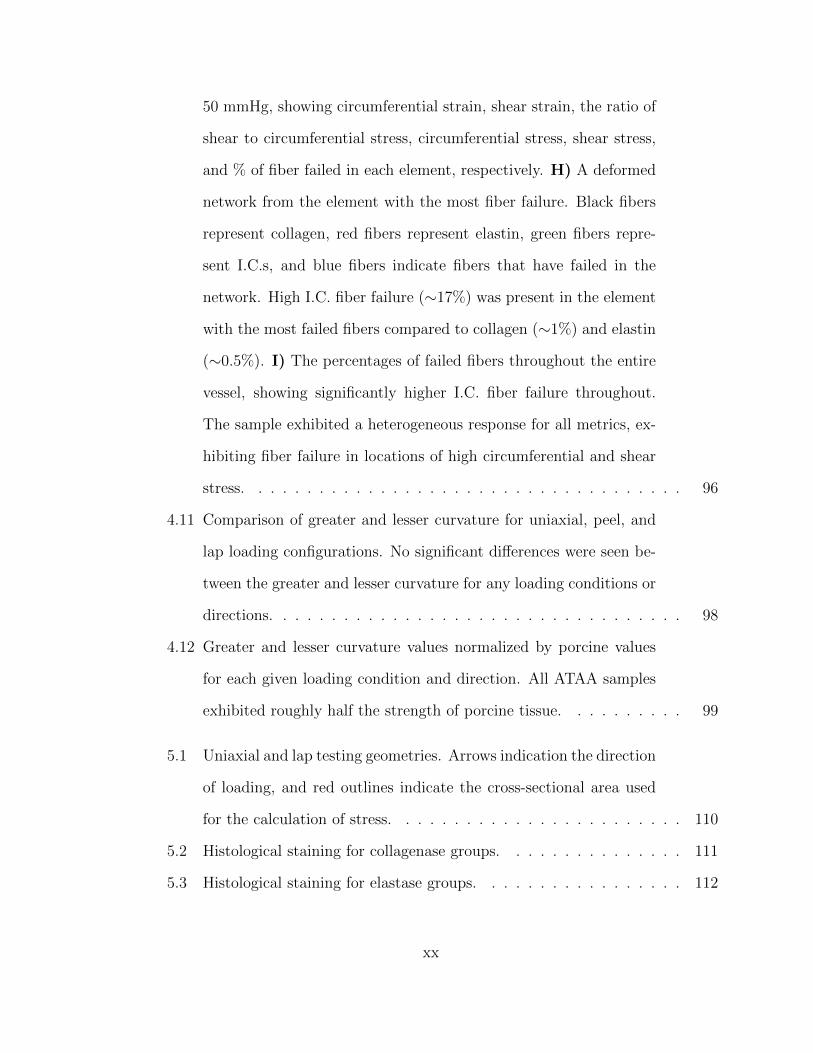
4.10 Multiscale results for patient ATAA inflation. A) The initial, un-
deformed state of the vessel prior to inflation, oriented such that
the greater curvature is on the right. B-G) The deformed vessel at
xix
50 mmHg, showing circumferential strain, shear strain, the ratio of
shear to circumferential stress, circumferential stress, shear stress,
and % of fiber failed in each element, respectively. H) A deformed
network from the element with the most fiber failure. Black fibers
represent collagen, red fibers represent elastin, green fibers repre-
sent I.C.s, and blue fibers indicate fibers that have failed in the
network. High I.C. fiber failure (∼17%) was present in the element
with the most failed fibers compared to collagen (∼1%) and elastin
(∼0.5%). I) The percentages of failed fibers throughout the entire
vessel, showing significantly higher I.C. fiber failure throughout.
The sample exhibited a heterogeneous response for all metrics, ex-
hibiting fiber failure in locations of high circumferential and shear
stress. . . . . . . . . . . . . . . . . . . . . . . . . . . . . . . . . . . . 96
4.11 Comparison of greater and lesser curvature for uniaxial, peel, and
lap loading configurations. No significant differences were seen be-
tween the greater and lesser curvature for any loading conditions or
directions. . . . . . . . . . . . . . . . . . . . . . . . . . . . . . . . . . 98
4.12 Greater and lesser curvature values normalized by porcine values
for each given loading condition and direction. All ATAA samples
exhibited roughly half the strength of porcine tissue. . . . . . . . . . 99
5.1 Uniaxial and lap testing geometries. Arrows indication the direction
of loading, and red outlines indicate the cross-sectional area used
for the calculation of stress. . . . . . . . . . . . . . . . . . . . . . . . 110
5.2 Histological staining for collagenase groups. . . . . . . . . . . . . . . 111
5.3 Histological staining for elastase groups. . . . . . . . . . . . . . . . . 112
xx
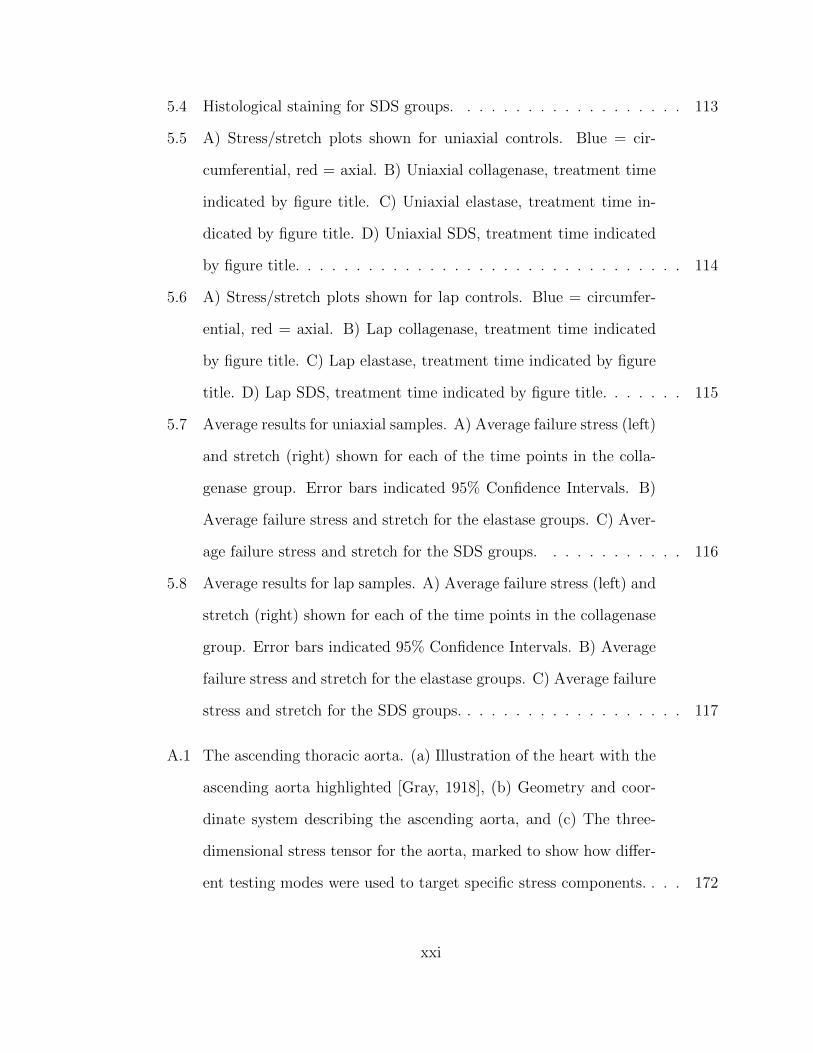
5.4 Histological staining for SDS groups. . . . . . . . . . . . . . . . . . . 113
5.5 A) Stress/stretch plots shown for uniaxial controls. Blue = cir-
cumferential, red = axial. B) Uniaxial collagenase, treatment time
indicated by figure title. C) Uniaxial elastase, treatment time in-
dicated by figure title. D) Uniaxial SDS, treatment time indicated
by figure title. . . . . . . . . . . . . . . . . . . . . . . . . . . . . . . . 114
5.6 A) Stress/stretch plots shown for lap controls. Blue = circumfer-
ential, red = axial. B) Lap collagenase, treatment time indicated
by figure title. C) Lap elastase, treatment time indicated by figure
title. D) Lap SDS, treatment time indicated by figure title. . . . . . . 115
5.7 Average results for uniaxial samples. A) Average failure stress (left)
and stretch (right) shown for each of the time points in the colla-
genase group. Error bars indicated 95% Confidence Intervals. B)
Average failure stress and stretch for the elastase groups. C) Aver-
age failure stress and stretch for the SDS groups. . . . . . . . . . . . 116
5.8 Average results for lap samples. A) Average failure stress (left) and
stretch (right) shown for each of the time points in the collagenase
group. Error bars indicated 95% Confidence Intervals. B) Average
failure stress and stretch for the elastase groups. C) Average failure
stress and stretch for the SDS groups. . . . . . . . . . . . . . . . . . . 117
A.1 The ascending thoracic aorta. (a) Illustration of the heart with the
ascending aorta highlighted [Gray, 1918], (b) Geometry and coor-
dinate system describing the ascending aorta, and (c) The three-
dimensional stress tensor for the aorta, marked to show how differ-
ent testing modes were used to target specific stress components. . . . 172
xxi
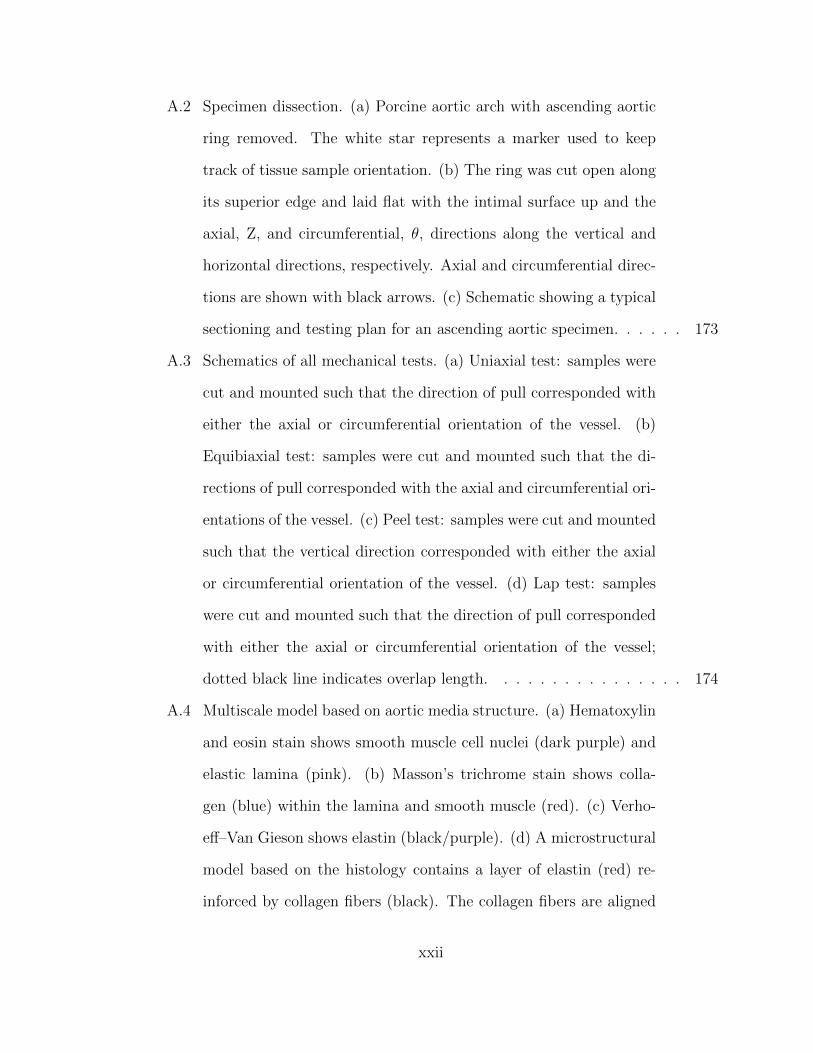
A.2 Specimen dissection. (a) Porcine aortic arch with ascending aortic
ring removed. The white star represents a marker used to keep
track of tissue sample orientation. (b) The ring was cut open along
its superior edge and laid flat with the intimal surface up and the
axial, Z, and circumferential, θ, directions along the vertical and
horizontal directions, respectively. Axial and circumferential direc-
tions are shown with black arrows. (c) Schematic showing a typical
sectioning and testing plan for an ascending aortic specimen. . . . . . 173
A.3 Schematics of all mechanical tests. (a) Uniaxial test: samples were
cut and mounted such that the direction of pull corresponded with
either the axial or circumferential orientation of the vessel. (b)
Equibiaxial test: samples were cut and mounted such that the di-
rections of pull corresponded with the axial and circumferential ori-
entations of the vessel. (c) Peel test: samples were cut and mounted
such that the vertical direction corresponded with either the axial
or circumferential orientation of the vessel. (d) Lap test: samples
were cut and mounted such that the direction of pull corresponded
with either the axial or circumferential orientation of the vessel;
dotted black line indicates overlap length. . . . . . . . . . . . . . . . 174
A.4 Multiscale model based on aortic media structure. (a) Hematoxylin
and eosin stain shows smooth muscle cell nuclei (dark purple) and
elastic lamina (pink). (b) Masson’s trichrome stain shows colla-
gen (blue) within the lamina and smooth muscle (red). (c) Verho-
eff–Van Gieson shows elastin (black/purple). (d) A microstructural
model based on the histology contains a layer of elastin (red) re-
inforced by collagen fibers (black). The collagen fibers are aligned
xxii
preferentially in the circumferential direction, and the elastin sheet
is isotropic. Lamellae are connected by interlamellar connections
(green) representing the combined contribution of fibrillin and smooth
muscle. The interlamellar connections are aligned primarily in the
radial direction but also have some preference for circumferential
alignment to match smooth muscle alignment in vivo. (e) An RVE
with eight gauss points. (f) FE geometry showing a uniaxial shaped
sample (equibiaxial, lap, and peel geometries were also used). . . . . . 175
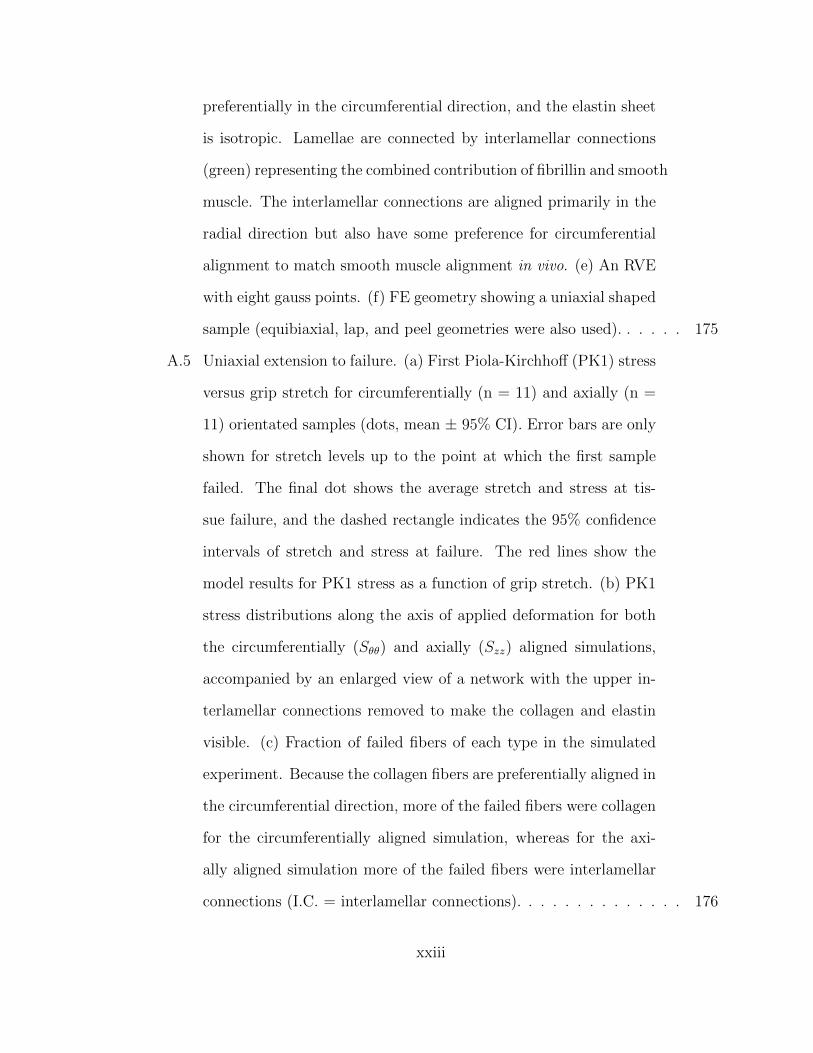
A.5 Uniaxial extension to failure. (a) First Piola-Kirchhoff (PK1) stress
versus grip stretch for circumferentially (n = 11) and axially (n =
11) orientated samples (dots, mean ± 95% CI). Error bars are only
shown for stretch levels up to the point at which the first sample
failed. The final dot shows the average stretch and stress at tis-
sue failure, and the dashed rectangle indicates the 95% confidence
intervals of stretch and stress at failure. The red lines show the
model results for PK1 stress as a function of grip stretch. (b) PK1
stress distributions along the axis of applied deformation for both
the circumferentially (Sθθ) and axially (Szz) aligned simulations,
accompanied by an enlarged view of a network with the upper in-
terlamellar connections removed to make the collagen and elastin
visible. (c) Fraction of failed fibers of each type in the simulated
experiment. Because the collagen fibers are preferentially aligned in
the circumferential direction, more of the failed fibers were collagen
for the circumferentially aligned simulation, whereas for the axi-
ally aligned simulation more of the failed fibers were interlamellar
connections (I.C. = interlamellar connections). . . . . . . . . . . . . . 176
xxiii

A.6 Equibiaxial extension. (a) Mean PK1 stress as a function of grip
stretch (dots) for equibiaxial extension. The 95% CI was 30–35%
of the measured value but was omitted from the figure to improve
visual clarity. The red lines show the model results for PK1 stress
versus grip stretch. (b) Circumferential (Sθθ) and axial (Szz) PK1
stress distributions predicted by the model. (c) Enlarged view of a
micronetwork with the upper interlamellar connections removed to
make the collagen and elastin visible. . . . . . . . . . . . . . . . . . . 177
A.7 Peel to failure. (a) Peel tension versus grip stretch for both cir-
cumferentially and axially oriented samples (dots, mean ± 95%
CI). The red lines indicate the model results. (b) PK1 stress (Srr)
distributions along the axis of applied deformation for both the cir-
cumferentially and axially aligned simulations, accompanied by an
enlarged view of a network with the upper interlamellar connections
removed to make the collagen and elastin visible. . . . . . . . . . . . 178
A.8 Kinematics of the shear lap test. (a) Displacement of a representa-
tive shear lap sample, adjusted to zero displacement at the center.
(b) Strain of the representative sample in the XY-direction. (c)
Dotted line showing overlap surface edge and vectors with normal
and tangential directions. (d) Average strain on the overlap sur-
face edge for both axially (n = 15) and circumferentially (n = 19)
oriented samples. Error bars indicate 95% confidence intervals. +p
< 0.10, ++p < 0.05, and +++p < 0.01. . . . . . . . . . . . . . . . . . 179
A.9 Shear lap failure. (a) PK1 stress versus grip stretch for circumfer-
entially (n = 28) and axially (n = 26) orientated samples (dots,
mean ± 95% CI). Error bars are only shown for stretch levels up
xxiv
to the point at which the first sample failed. The final dot shows
the average stretch and stress at tissue failure and the dashed rect-
angle indicates the 95% confidence intervals of stretch and stress
at failure. The red lines show the model results. (b) Shear stress
distributions along the axis of applied deformation for both the cir-
cumferentially (Srθ) and axially (Srz) aligned simulations, accompa-
nied by an enlarged view of a network with the upper interlamellar
connections removed to make the collagen and elastin visible. (c)
Fraction of failed fibers of each type in the simulated experiment
(I.C. = interlamellar connections). . . . . . . . . . . . . . . . . . . . . 180
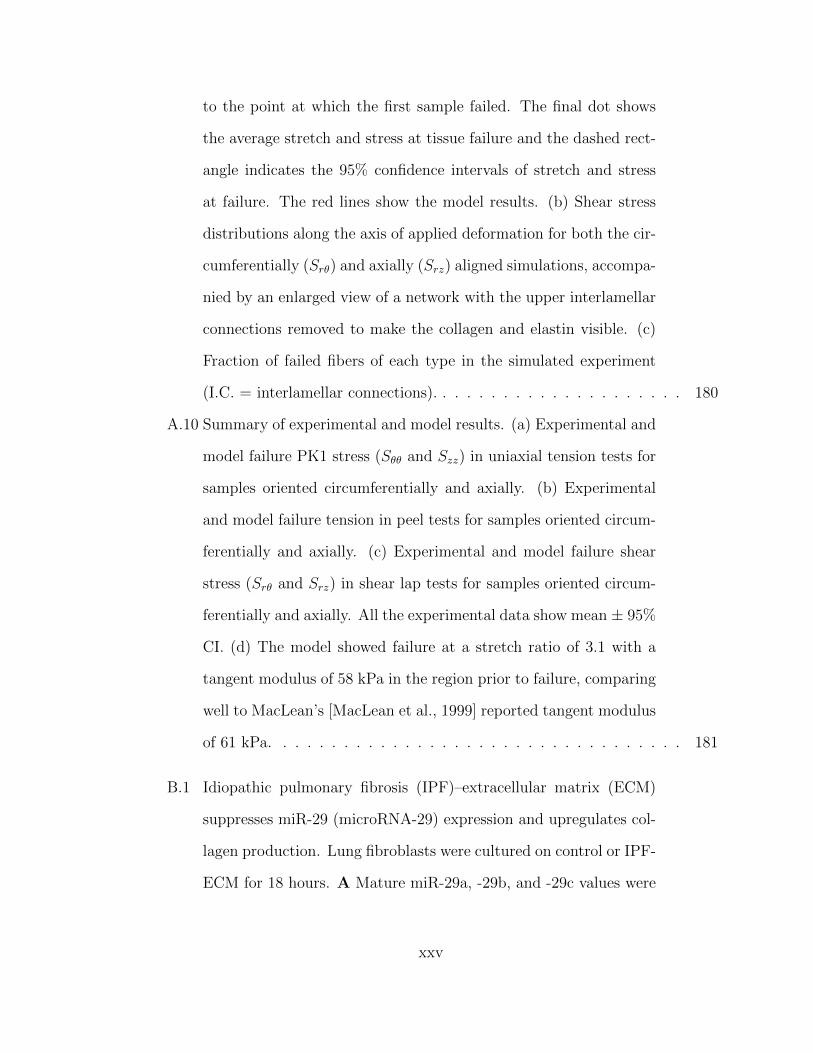
A.10 Summary of experimental and model results. (a) Experimental and
model failure PK1 stress (Sθθ and Szz) in uniaxial tension tests for
samples oriented circumferentially and axially. (b) Experimental
and model failure tension in peel tests for samples oriented circum-
ferentially and axially. (c) Experimental and model failure shear
stress (Srθ and Srz) in shear lap tests for samples oriented circum-
ferentially and axially. All the experimental data show mean ± 95%
CI. (d) The model showed failure at a stretch ratio of 3.1 with a
tangent modulus of 58 kPa in the region prior to failure, comparing
well to MacLean’s [MacLean et al., 1999] reported tangent modulus
of 61 kPa. . . . . . . . . . . . . . . . . . . . . . . . . . . . . . . . . . 181
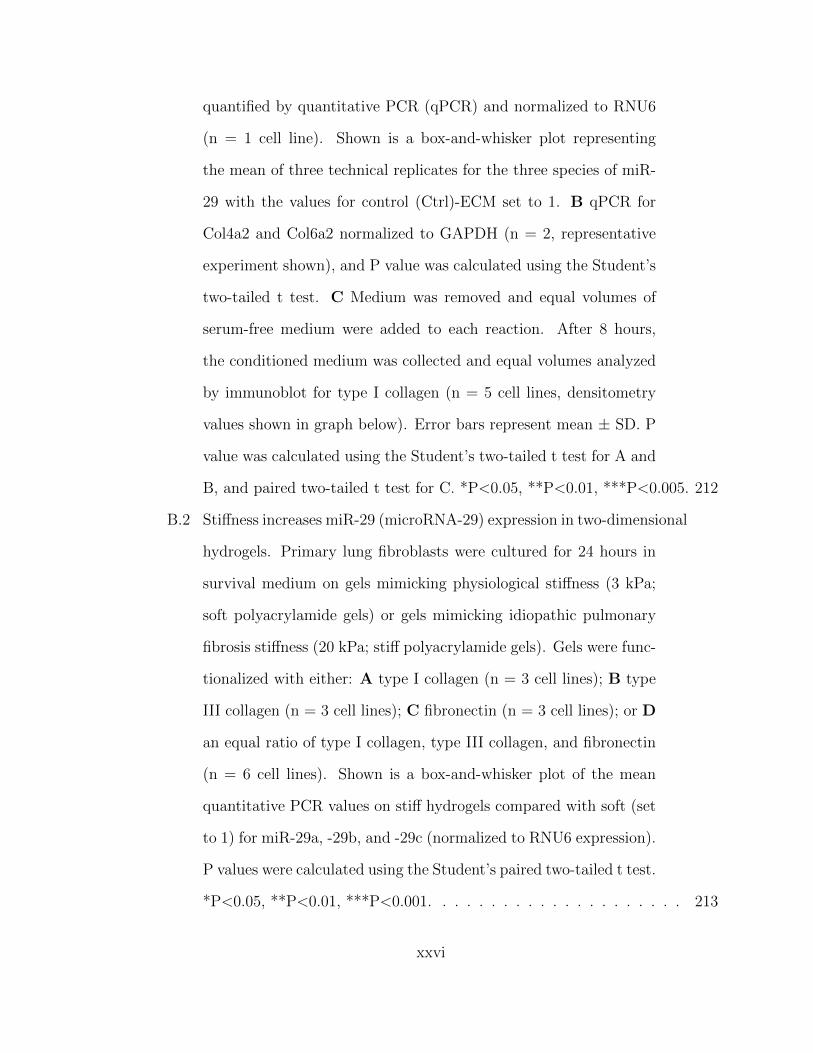
B.1 Idiopathic pulmonary fibrosis (IPF)–extracellular matrix (ECM)
suppresses miR-29 (microRNA-29) expression and upregulates col-
lagen production. Lung fibroblasts were cultured on control or IPF-
ECM for 18 hours. A Mature miR-29a, -29b, and -29c values were
xxv
quantified by quantitative PCR (qPCR) and normalized to RNU6
(n = 1 cell line). Shown is a box-and-whisker plot representing
the mean of three technical replicates for the three species of miR-
29 with the values for control (Ctrl)-ECM set to 1. B qPCR for
Col4a2 and Col6a2 normalized to GAPDH (n = 2, representative
experiment shown), and P value was calculated using the Student’s
two-tailed t test. C Medium was removed and equal volumes of
serum-free medium were added to each reaction. After 8 hours,
the conditioned medium was collected and equal volumes analyzed
by immunoblot for type I collagen (n = 5 cell lines, densitometry
values shown in graph below). Error bars represent mean ± SD. P
value was calculated using the Student’s two-tailed t test for A and
B, and paired two-tailed t test for C. *P<0.05, **P<0.01, ***P<0.005. 212
B.2 Stiffness increases miR-29 (microRNA-29) expression in two-dimensional
hydrogels. Primary lung fibroblasts were cultured for 24 hours in
survival medium on gels mimicking physiological stiffness (3 kPa;
soft polyacrylamide gels) or gels mimicking idiopathic pulmonary
fibrosis stiffness (20 kPa; stiff polyacrylamide gels). Gels were func-
tionalized with either: A type I collagen (n = 3 cell lines); B type
III collagen (n = 3 cell lines); C fibronectin (n = 3 cell lines); or D
an equal ratio of type I collagen, type III collagen, and fibronectin
(n = 6 cell lines). Shown is a box-and-whisker plot of the mean
quantitative PCR values on stiff hydrogels compared with soft (set
to 1) for miR-29a, -29b, and -29c (normalized to RNU6 expression).
P values were calculated using the Student’s paired two-tailed t test.
*P<0.05, **P<0.01, ***P<0.001. . . . . . . . . . . . . . . . . . . . . 213
xxvi
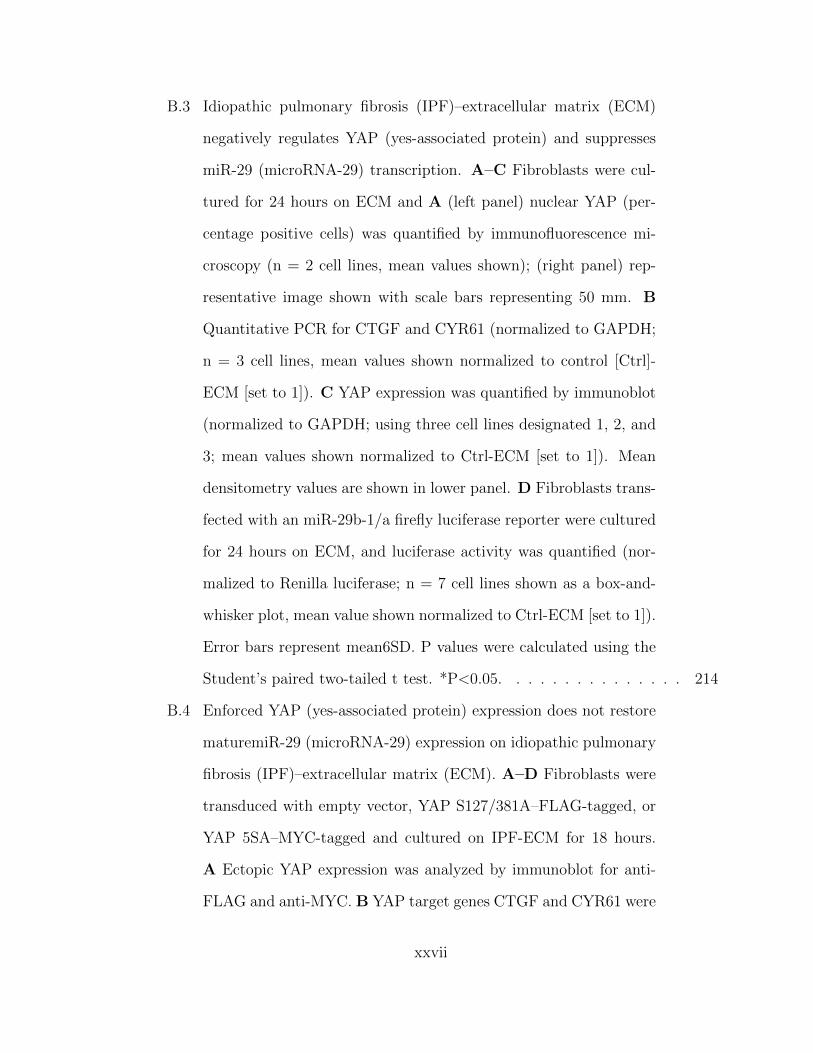
B.3 Idiopathic pulmonary fibrosis (IPF)–extracellular matrix (ECM)
negatively regulates YAP (yes-associated protein) and suppresses
miR-29 (microRNA-29) transcription. A–C Fibroblasts were cul-
tured for 24 hours on ECM and A (left panel) nuclear YAP (per-
centage positive cells) was quantified by immunofluorescence mi-
croscopy (n = 2 cell lines, mean values shown); (right panel) rep-
resentative image shown with scale bars representing 50 mm. B
Quantitative PCR for CTGF and CYR61 (normalized to GAPDH;
n = 3 cell lines, mean values shown normalized to control [Ctrl]-
ECM [set to 1]). C YAP expression was quantified by immunoblot
(normalized to GAPDH; using three cell lines designated 1, 2, and
3; mean values shown normalized to Ctrl-ECM [set to 1]). Mean
densitometry values are shown in lower panel. D Fibroblasts trans-
fected with an miR-29b-1/a firefly luciferase reporter were cultured
for 24 hours on ECM, and luciferase activity was quantified (nor-
malized to Renilla luciferase; n = 7 cell lines shown as a box-and-
whisker plot, mean value shown normalized to Ctrl-ECM [set to 1]).
Error bars represent mean6SD. P values were calculated using the
Student’s paired two-tailed t test. *P<0.05. . . . . . . . . . . . . . . 214
B.4 Enforced YAP (yes-associated protein) expression does not restore
maturemiR-29 (microRNA-29) expression on idiopathic pulmonary
fibrosis (IPF)–extracellular matrix (ECM). A–D Fibroblasts were
transduced with empty vector, YAP S127/381A–FLAG-tagged, or
YAP 5SA–MYC-tagged and cultured on IPF-ECM for 18 hours.
A Ectopic YAP expression was analyzed by immunoblot for anti-
FLAG and anti-MYC. B YAP target genes CTGF and CYR61 were
xxvii
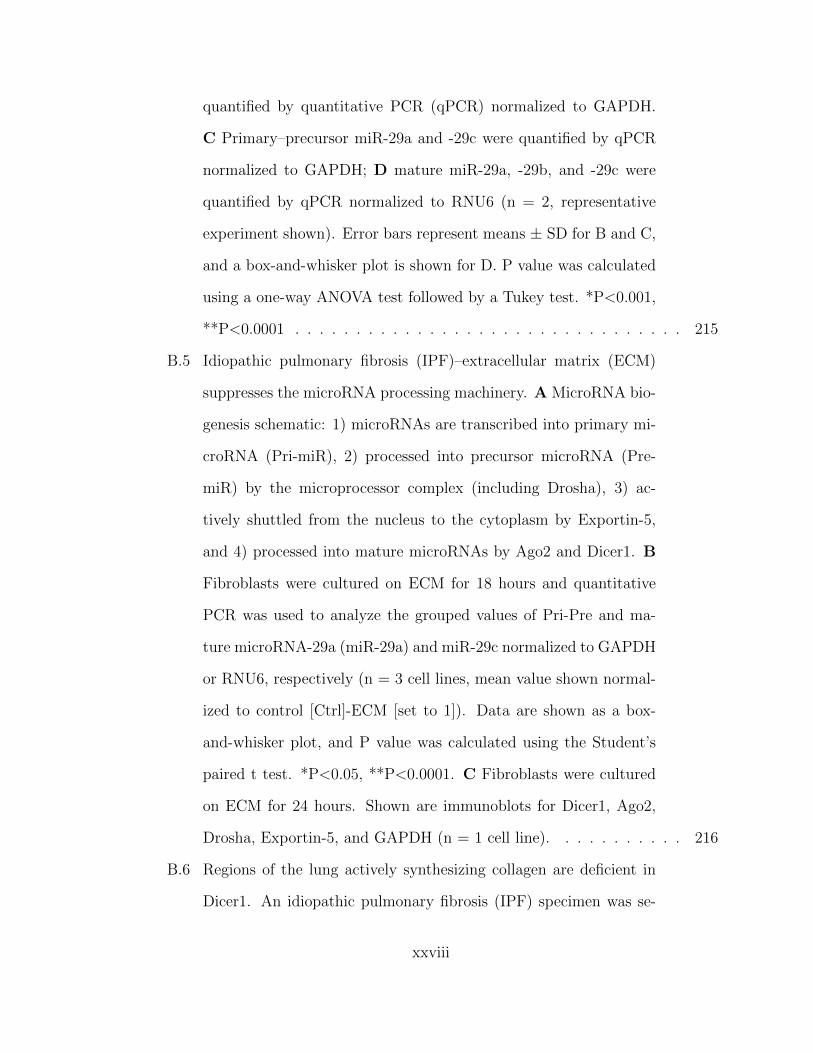
quantified by quantitative PCR (qPCR) normalized to GAPDH.
C Primary–precursor miR-29a and -29c were quantified by qPCR
normalized to GAPDH; D mature miR-29a, -29b, and -29c were
quantified by qPCR normalized to RNU6 (n = 2, representative
experiment shown). Error bars represent means ± SD for B and C,
and a box-and-whisker plot is shown for D. P value was calculated
using a one-way ANOVA test followed by a Tukey test. *P<0.001,
**P<0.0001 . . . . . . . . . . . . . . . . . . . . . . . . . . . . . . . . 215
B.5 Idiopathic pulmonary fibrosis (IPF)–extracellular matrix (ECM)
suppresses the microRNA processing machinery. A MicroRNA bio-
genesis schematic: 1) microRNAs are transcribed into primary mi-
croRNA (Pri-miR), 2) processed into precursor microRNA (Pre-
miR) by the microprocessor complex (including Drosha), 3) ac-
tively shuttled from the nucleus to the cytoplasm by Exportin-5,
and 4) processed into mature microRNAs by Ago2 and Dicer1. B
Fibroblasts were cultured on ECM for 18 hours and quantitative
PCR was used to analyze the grouped values of Pri-Pre and ma-
ture microRNA-29a (miR-29a) and miR-29c normalized to GAPDH
or RNU6, respectively (n = 3 cell lines, mean value shown normal-
ized to control [Ctrl]-ECM [set to 1]). Data are shown as a box-
and-whisker plot, and P value was calculated using the Student’s
paired t test. *P<0.05, **P<0.0001. C Fibroblasts were cultured
on ECM for 24 hours. Shown are immunoblots for Dicer1, Ago2,
Drosha, Exportin-5, and GAPDH (n = 1 cell line). . . . . . . . . . . 216
B.6 Regions of the lung actively synthesizing collagen are deficient in
Dicer1. An idiopathic pulmonary fibrosis (IPF) specimen was se-
xxviii
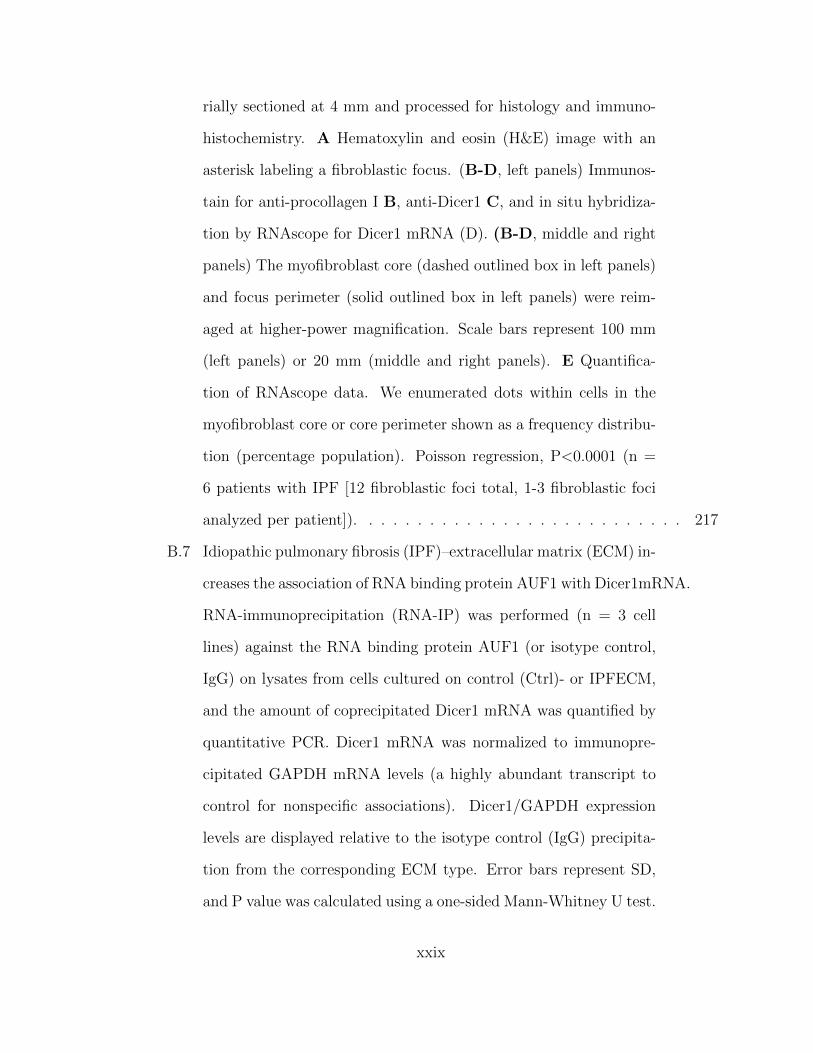
rially sectioned at 4 mm and processed for histology and immuno-
histochemistry. A Hematoxylin and eosin (H&E) image with an
asterisk labeling a fibroblastic focus. (B-D, left panels) Immunos-
tain for anti-procollagen I B, anti-Dicer1 C, and in situ hybridiza-
tion by RNAscope for Dicer1 mRNA (D). (B-D, middle and right
panels) The myofibroblast core (dashed outlined box in left panels)
and focus perimeter (solid outlined box in left panels) were reim-
aged at higher-power magnification. Scale bars represent 100 mm
(left panels) or 20 mm (middle and right panels). E Quantifica-
tion of RNAscope data. We enumerated dots within cells in the
myofibroblast core or core perimeter shown as a frequency distribu-
tion (percentage population). Poisson regression, P<0.0001 (n =
6 patients with IPF [12 fibroblastic foci total, 1-3 fibroblastic foci
analyzed per patient]). . . . . . . . . . . . . . . . . . . . . . . . . . . 217
B.7 Idiopathic pulmonary fibrosis (IPF)–extracellular matrix (ECM) in-
creases the association of RNA binding protein AUF1 with Dicer1mRNA.
RNA-immunoprecipitation (RNA-IP) was performed (n = 3 cell
lines) against the RNA binding protein AUF1 (or isotype control,
IgG) on lysates from cells cultured on control (Ctrl)- or IPFECM,
and the amount of coprecipitated Dicer1 mRNA was quantified by
quantitative PCR. Dicer1 mRNA was normalized to immunopre-
cipitated GAPDH mRNA levels (a highly abundant transcript to
control for nonspecific associations). Dicer1/GAPDH expression
levels are displayed relative to the isotype control (IgG) precipita-
tion from the corresponding ECM type. Error bars represent SD,
and P value was calculated using a one-sided Mann-Whitney U test.
xxix

*P = 0.05. . . . . . . . . . . . . . . . . . . . . . . . . . . . . . . . . . 218
B.8 Dicer1 knockdown in fibroblasts decreases mature miR-29 (microRNA-
29) abundance on control extracellular matrix. Fibroblasts were
transduced with Dicer1 shRNA or scrambled control to establish
stable expression. A Shown is an immunoblot for Dicer1. (B
and C) Equal numbers of transduced cells were cultured on con-
trol extracellular matrix for 18 hours. Medium was removed and
equal volume of serum-free medium was added to each reaction
for 8 additional hours. B Quantitative PCR for mature miR-29a,
-29b, and -29c normalized to miR-451. Data are shown as a box-
and-whisker plot, and P value was calculated using the Student’s
two-tailed t test. C Equal volumes of conditioned medium were
analyzed by immunoblot for collagen I and MMP-2 (n = 2, rep-
resentative experiment shown in triplicate). Densitometry values
are shown in the lower panel, with error bars representing the SD,
and P value was calculated using the Student’s two-tailed t test.
*P<0.01, **P<0.001, ***P<0.0001. KD = knockdown. . . . . . . . . 219
B.9 Dicer1 knockdown imparts fibroblasts with fibrogenicity in vivo.
A-C Zebrafish xenograft assay: 102 scrambled control or Dicer1-
knockdown (KD) fibroblasts (cells from the same population of lung
fibroblasts used in Figure B.8 were xenografted into each zebrafish
embryo, which was incubated for 46 hours, anesthetized, and fixed
before analysis. Representative xenograft images of A scrambled
control or B Dicer1-KD fibroblasts immunostained for human pro-
collagen I (red) counterstained with DAPI (graft DAPI-positive
area outlined by dotted white line, scale bar represents 50 mm,
xxx
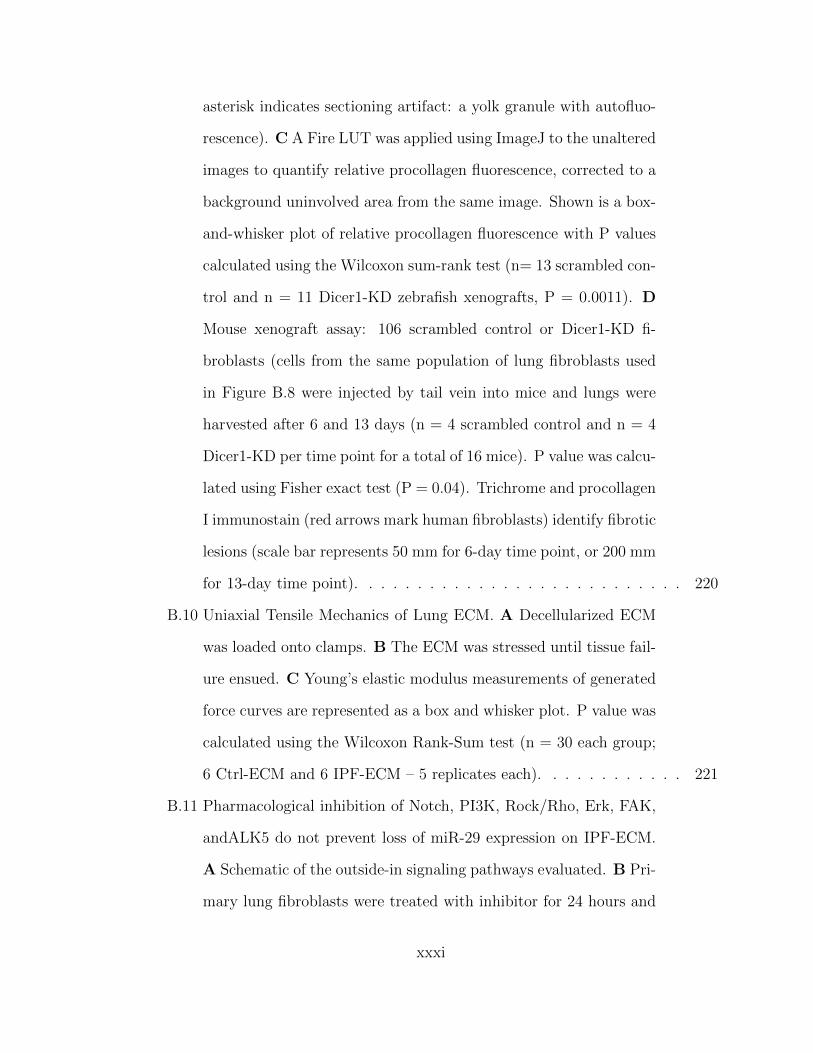
asterisk indicates sectioning artifact: a yolk granule with autofluo-
rescence). C A Fire LUT was applied using ImageJ to the unaltered
images to quantify relative procollagen fluorescence, corrected to a
background uninvolved area from the same image. Shown is a box-
and-whisker plot of relative procollagen fluorescence with P values
calculated using the Wilcoxon sum-rank test (n= 13 scrambled con-
trol and n = 11 Dicer1-KD zebrafish xenografts, P = 0.0011). D
Mouse xenograft assay: 106 scrambled control or Dicer1-KD fi-
broblasts (cells from the same population of lung fibroblasts used
in Figure B.8 were injected by tail vein into mice and lungs were
harvested after 6 and 13 days (n = 4 scrambled control and n = 4
Dicer1-KD per time point for a total of 16 mice). P value was calcu-
lated using Fisher exact test (P = 0.04). Trichrome and procollagen
I immunostain (red arrows mark human fibroblasts) identify fibrotic
lesions (scale bar represents 50 mm for 6-day time point, or 200 mm
for 13-day time point). . . . . . . . . . . . . . . . . . . . . . . . . . . 220
B.10 Uniaxial Tensile Mechanics of Lung ECM. A Decellularized ECM
was loaded onto clamps. B The ECM was stressed until tissue fail-
ure ensued. C Young’s elastic modulus measurements of generated
force curves are represented as a box and whisker plot. P value was
calculated using the Wilcoxon Rank-Sum test (n = 30 each group;
6 Ctrl-ECM and 6 IPF-ECM – 5 replicates each). . . . . . . . . . . . 221
B.11 Pharmacological inhibition of Notch, PI3K, Rock/Rho, Erk, FAK,
andALK5 do not prevent loss of miR-29 expression on IPF-ECM.
A Schematic of the outside-in signaling pathways evaluated. B Pri-
mary lung fibroblasts were treated with inhibitor for 24 hours and
xxxi
immunoblotted for p-FAK (Y397)), total FAK, p-Akt (ser473), total
Akt, p-Erk (T202 \Y204), and total Erk. C-G Primary lung fibrob-
lasts were cultured on ECM for 18 hours with the indicated phar-
macological agent and analyzed by qPCR for the grouped values of
mature miR-29a, 29b, and 29c (normalized to RNU6). Shown as
box and whisker plot. C Notch inhibitor: DAPT (5 µM which sup-
pressed Notch downstream transcriptional targets in primary lung
fibroblasts [data not shown], n = 1 cell line), D PI3 kinase inhibitor:
LY294002 (10 µM previously shown to suppress p-Akt activation in
primary lung fibroblasts, n = 3 cell lines; mean value shown normal-
ized to Ctrl-ECM [set to 1]), E Rock and RhoA inhibitor: Y27632
(10 µM previously shown to suppress ROCK/RhoA in primary lung
fibroblast [Huang et al., 2012] (n = 1 cell line), and F Erk inhibitor:
SCH772984 (10 µM, n = 1 cell line) or FAK inhibitor: PF562271
(10 µM, n = 1 cell line). G ALK5 inhibitor: A83-01 (20 nM as pre-
viously used in primary lung fibroblasts [Booth et al., 2012] (n = 1
cell line). H MRTF inhibitor: CCG-100602 (10 µM, n = 1 cell line)
normalized to miR-484 which we verified to be stably expressed in
our system (RNU6 was unstable with CCG-100602 treatment and
therefore not suitable for normalization). * p<0.05, ** p<0.01, ***
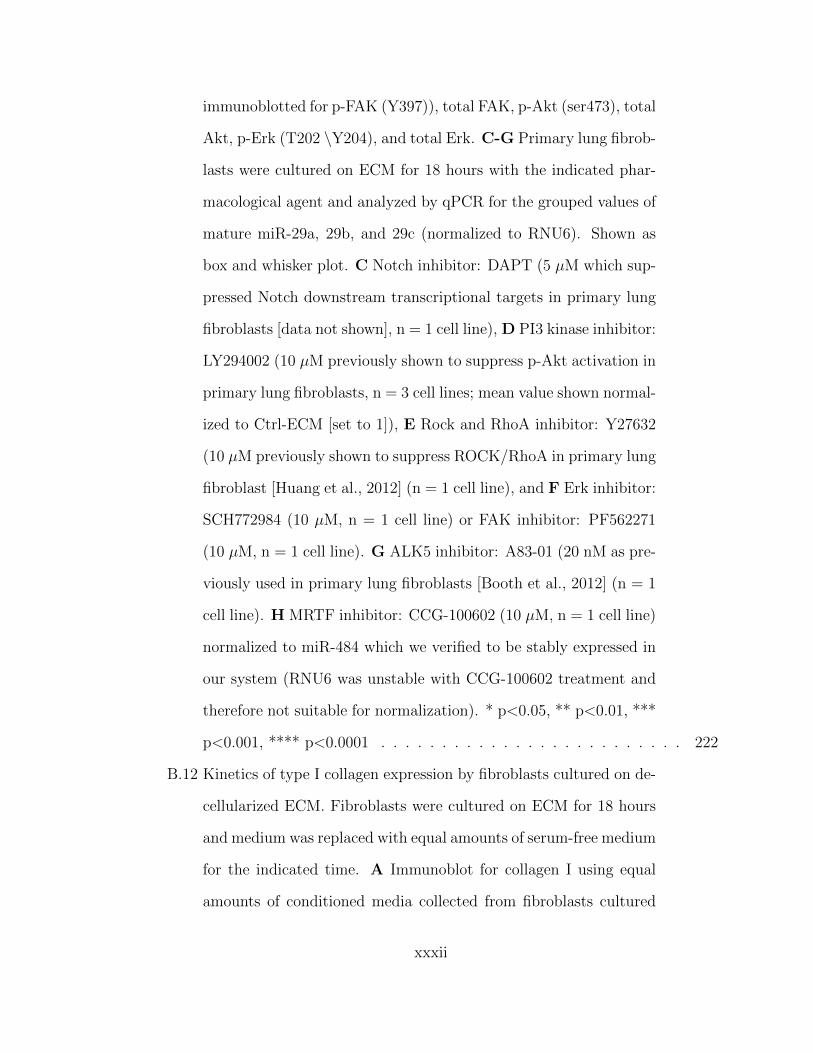
p<0.001, **** p<0.0001 . . . . . . . . . . . . . . . . . . . . . . . . . 222
B.12 Kinetics of type I collagen expression by fibroblasts cultured on de-
cellularized ECM. Fibroblasts were cultured on ECM for 18 hours
and medium was replaced with equal amounts of serum-free medium
for the indicated time. A Immunoblot for collagen I using equal
amounts of conditioned media collected from fibroblasts cultured
xxxii

on Ctrl-ECM or IPF-ECM. 24-hour cell-free lanes (boxed in red
dotted lines) were included to evaluate the contribution collagen I
leaching out of the decellularized ECM (arrow). B Using equal vol-
umes of conditioned medium for each time-point, the immunoblot
was probed for type I collagen and signal was quantified by densit-
ometry. (n = 1). Error bars represent means ± S.E.M. P value was
calculated using the student two-tailed T-test. * p<0.05 . . . . . . . 223
B.13 Stiffness upregulates αSMA expression in lung fibroblasts. Lung
fibroblasts were cultured on soft or stiff PA gels functionalized with
type I collagen for 24 hours and immunoblot was performed for
αSMA and GAPDH. (n = 2, representative blot shown). . . . . . . . 224
B.14 Stiffness drives YAP activation on polyacrylamide (PA) hydrogels.
Primary lung fibroblasts were cultured on soft or stiff PA gels for
24 hours. A Immunoblots for YAP and GAPDH (n = 3 cell lines,
densitometry on right panel normalized to soft gels set to a value
of 1). B YAP immunofluorescence in fibroblasts on soft or stiff
PA gels (n = 3 cell lines, quantification on right panel with mean
values shown). C qPCR of CTGF and CYR61 (YAP transcriptional
targets) normalized to GAPDH (n = 3 cell lines, mean values shown
normalized to soft). Error bars represent means ± S.D. P value was
calculated using the student paired two-tailed T-test. * p<0.05, **
p<0.001 . . . . . . . . . . . . . . . . . . . . . . . . . . . . . . . . . . 225
B.15 YAP loss-of-function does not alter miR-29 expression on Ctrl-
ECM. Fibroblasts transduced with YAP shRNA or scrambled shRNA
control were cultured on Ctrl-ECM for 18 hours. A Immunoblot
for YAP and GAPDH B qPCR for CTGF and CYR61 (YAP tran-
xxxiii
scriptional targets) normalized to GAPDH, C qPCR for the group
values of Pri-Pre miR-29a and -29c normalized to GAPDH, and D
qPCR for the group values of mature miR-29a, -29b, -29c normal-
ized to RNU6 (n = 3, representative experiment shown). Error bars
represent means ± S.D. for B and box and whisker plots for C-D.
P value was calculated using the student two-tailed T-test for (B &
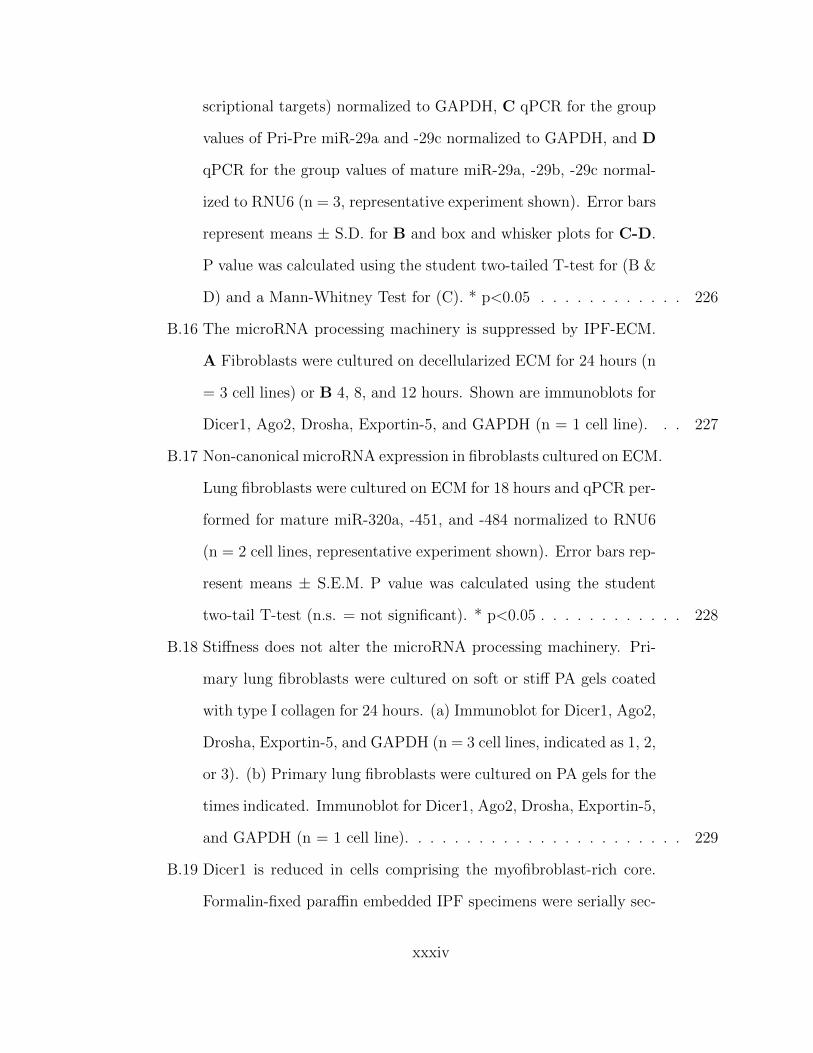
D) and a Mann-Whitney Test for (C). * p<0.05 . . . . . . . . . . . . 226
B.16 The microRNA processing machinery is suppressed by IPF-ECM.
A Fibroblasts were cultured on decellularized ECM for 24 hours (n
= 3 cell lines) or B 4, 8, and 12 hours. Shown are immunoblots for
Dicer1, Ago2, Drosha, Exportin-5, and GAPDH (n = 1 cell line). . . 227
B.17 Non-canonical microRNA expression in fibroblasts cultured on ECM.
Lung fibroblasts were cultured on ECM for 18 hours and qPCR per-
formed for mature miR-320a, -451, and -484 normalized to RNU6
(n = 2 cell lines, representative experiment shown). Error bars rep-
resent means ± S.E.M. P value was calculated using the student
two-tail T-test (n.s. = not significant). * p<0.05 . . . . . . . . . . . . 228
B.18 Stiffness does not alter the microRNA processing machinery. Pri-
mary lung fibroblasts were cultured on soft or stiff PA gels coated
with type I collagen for 24 hours. (a) Immunoblot for Dicer1, Ago2,
Drosha, Exportin-5, and GAPDH (n = 3 cell lines, indicated as 1, 2,
or 3). (b) Primary lung fibroblasts were cultured on PA gels for the
times indicated. Immunoblot for Dicer1, Ago2, Drosha, Exportin-5,
and GAPDH (n = 1 cell line). . . . . . . . . . . . . . . . . . . . . . . 229
B.19 Dicer1 is reduced in cells comprising the myofibroblast-rich core.
Formalin-fixed paraffin embedded IPF specimens were serially sec-
xxxiv
tioned at 4 µm and processed for H & E, procollagen I, Ago2,
Dicer1, Exportin-5, and Drosha. (scale bar represents 50 µm). The
red dotted line on Dicer1 image outlines the myofibroblast-rich core
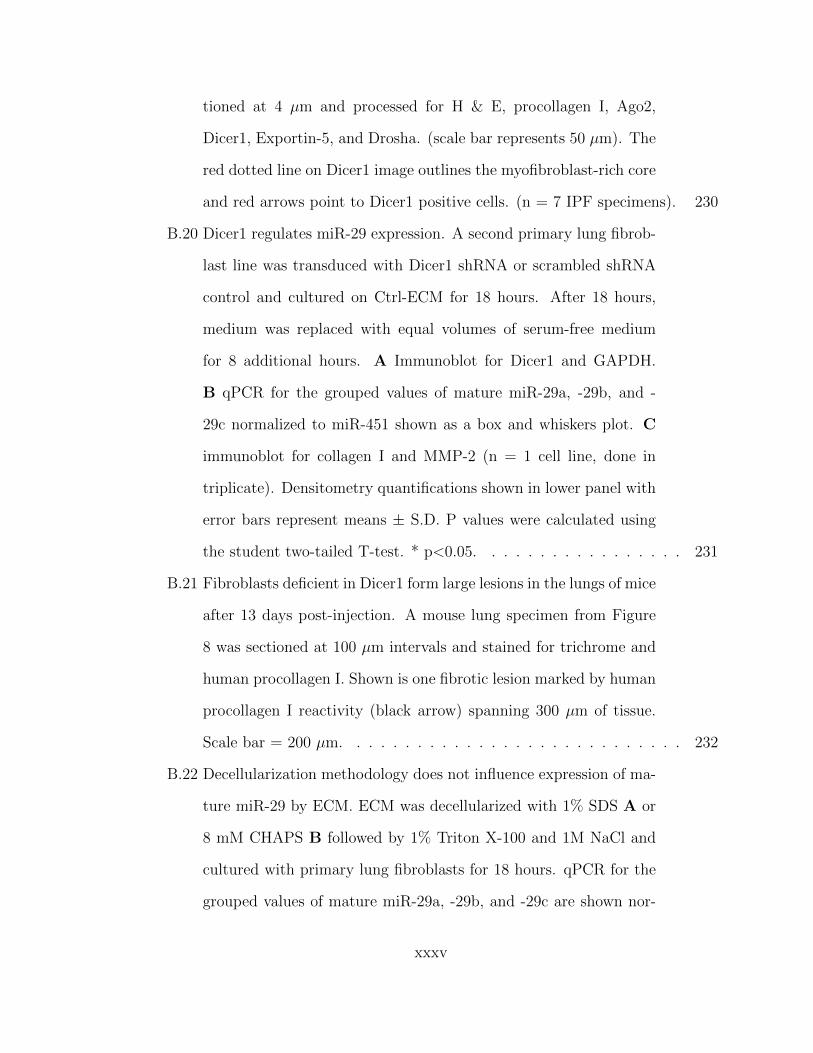
and red arrows point to Dicer1 positive cells. (n = 7 IPF specimens). 230
B.20 Dicer1 regulates miR-29 expression. A second primary lung fibrob-
last line was transduced with Dicer1 shRNA or scrambled shRNA
control and cultured on Ctrl-ECM for 18 hours. After 18 hours,
medium was replaced with equal volumes of serum-free medium
for 8 additional hours. A Immunoblot for Dicer1 and GAPDH.
B qPCR for the grouped values of mature miR-29a, -29b, and -
29c normalized to miR-451 shown as a box and whiskers plot. C
immunoblot for collagen I and MMP-2 (n = 1 cell line, done in
triplicate). Densitometry quantifications shown in lower panel with
error bars represent means ± S.D. P values were calculated using
the student two-tailed T-test. * p<0.05. . . . . . . . . . . . . . . . . 231
B.21 Fibroblasts deficient in Dicer1 form large lesions in the lungs of mice
after 13 days post-injection. A mouse lung specimen from Figure
8 was sectioned at 100 µm intervals and stained for trichrome and
human procollagen I. Shown is one fibrotic lesion marked by human
procollagen I reactivity (black arrow) spanning 300 µm of tissue.
Scale bar = 200 µm. . . . . . . . . . . . . . . . . . . . . . . . . . . . 232
B.22 Decellularization methodology does not influence expression of ma-
ture miR-29 by ECM. ECM was decellularized with 1% SDS A or
8 mM CHAPS B followed by 1% Triton X-100 and 1M NaCl and
cultured with primary lung fibroblasts for 18 hours. qPCR for the
grouped values of mature miR-29a, -29b, and -29c are shown nor-
xxxv
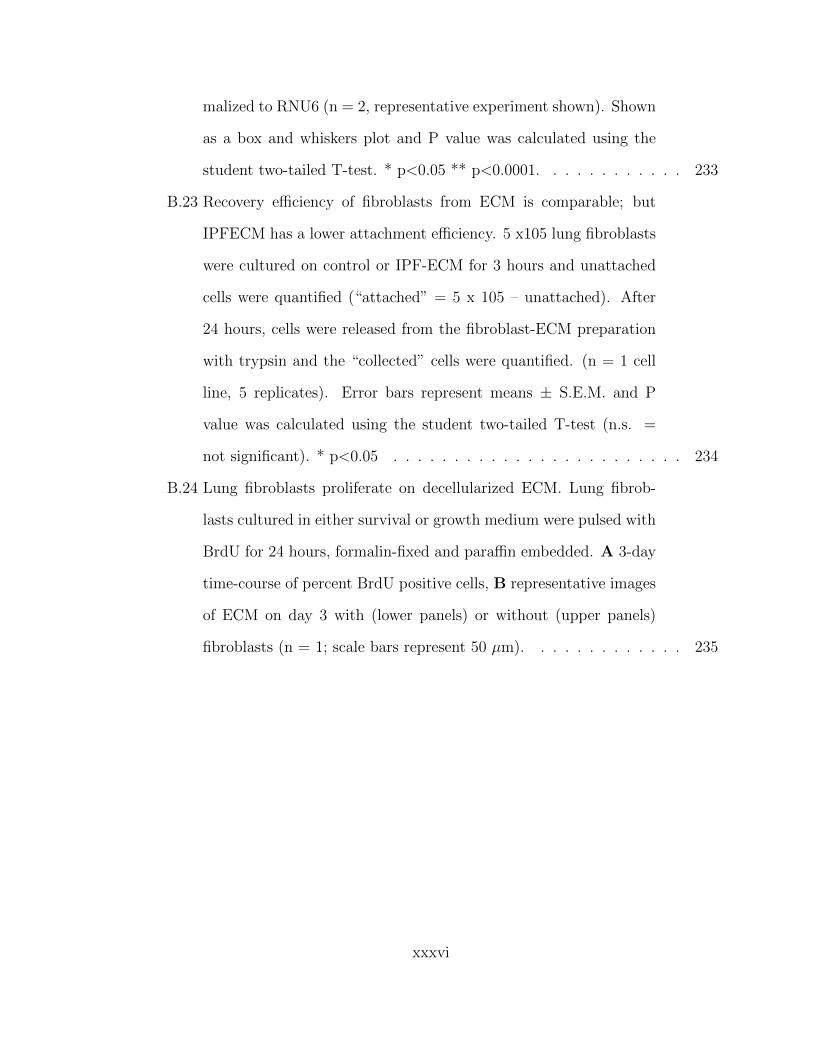
malized to RNU6 (n = 2, representative experiment shown). Shown
as a box and whiskers plot and P value was calculated using the
student two-tailed T-test. * p<0.05 ** p<0.0001. . . . . . . . . . . . 233
B.23 Recovery efficiency of fibroblasts from ECM is comparable; but
IPFECM has a lower attachment efficiency. 5 x10⁵ lung fibroblasts
were cultured on control or IPF-ECM for 3 hours and unattached
cells were quantified (“attached” = 5 x 10⁵ – unattached). After
24 hours, cells were released from the fibroblast-ECM preparation
with trypsin and the “collected” cells were quantified. (n = 1 cell
line, 5 replicates). Error bars represent means ± S.E.M. and P
value was calculated using the student two-tailed T-test (n.s. =
not significant). * p<0.05 . . . . . . . . . . . . . . . . . . . . . . . . 234
B.24 Lung fibroblasts proliferate on decellularized ECM. Lung fibrob-
lasts cultured in either survival or growth medium were pulsed with
BrdU for 24 hours, formalin-fixed and paraffin embedded. A 3-day
time-course of percent BrdU positive cells, B representative images
of ECM on day 3 with (lower panels) or without (upper panels)
fibroblasts (n = 1; scale bars represent 50 µm). . . . . . . . . . . . . 235
xxxvi
Chapter 1
Introduction
“It is the first, and in a way the most important task of
science to enable us to predict future experience, so that
we may direct our present activities accordingly.”
H.R. Hertz, 1857-1894
I open with the same quote Jay Humphrey does in his book titled, Cardiovascular
Solid Mechanics [Humphrey, 2002], as it provides a fitting mindset for the work to
follow. The work herein seeks to understand and predict the complex phenomenon
that is soft tissue failure, particularly as it relates to pathological cardiovascular
tissue. Each of the following chapters looks to grapple with both the mechanism and
characterization of tissue failure in various scenarios, with the hope of improving our
understanding of these situations. Tissue failure, after all, is an event easy to identify
once it occurs, but challenging to predict a priori. Yet, nearly all human beings
will experience some form of soft tissue failure within their lifetime. In some cases,
failure is non-debilitating and addressed naturally by the body’s healing processes.
In others, however, such as myocardial infarctions and aortic aneurysms, predicting
and understanding tissue failure is crucial, as failure of these tissues can be harmful
1
at best and fatal at worst. By understanding how and when these tissues fail, we
create a strong foundation of knowledge that informs diagnoses, and in turn affects
patient outcomes. The work contained here is certainly not exhaustive, but rather
an addition to the growing field of cardiovascular soft tissue mechanics and failure.
1.1 Cardiovascular System
1.1.1 Healthy Cardiac Function and Anatomy
The cardiovascular system exists as a vital component within the human body, provid-
ing a closed loop for blood transport to and from all major organs and tissues. During
normal functioning, a highly organized network of arteries and veins coherently works
to allow for oxygen and nutrient delivery, as well as waste and CO2 removal. The
heart sits centrally, both physically and functionally, within the cardiovascular sys-
tem as the driving pump, contracting upwards of 2.5 billion times within an average
human life [Humphrey, 2002]. The contraction of the heart is constantly regulated,
adapting to demands made necessary by the rest of the body. Each component of the
cardiovascular system is uniquely fit to accomplish the unified goal of transporting
blood throughout the body.
In the healthy heart (Fig. 1.1), deoxygenated blood enters the right atrium via the
super and inferior vena cava during ventricular systole. As the conduction system of
the heart initiates, atrial myocytes contract and increase atrial pressure, causing the
tricuspid valve to open and allow blood to fill the right ventricle. Once conduction
reaches the ventricles, causing them to contract, blood is pumped through the pul-
monary valve into the pulmonary arteries. Deoxygenated blood then travels through
the pulmonary arteries to the lungs, where CO2 is exchanged for oxygen during simple
diffusion. Now oxygenated blood returns to the left atrium via the pulmonary veins,
2
filling the left atrium during ventricular systole. The conduction process mentioned
previously causes atrial contraction once again, allowing blood in the left atrium to fill
the left ventricle, flowing through the mitral valve. Once full, the left ventricle con-
tracts, pumping blood out through the aortic valve into the ascending aorta, allowing
it to travel to the rest of the body.
Throughout the cardiac cycle, both the heart and aorta experience complex load-
ing, acting as both passive and active tissues at different times. The heart experiences
both contractile and torsional loading, along with rotation, due to the contraction of
myocytes and their orientation [Nakatani, 2011, Omar et al., 2015] while the aorta
experiences significant expansion (∼11% area change [Mao et al., 2008]) due to the
blood pressure, followed by active contraction to pump blood to the extremities. The
ability of both these essential tissues to bear repetitive stress and strain relies entirely
on their underlying tissue composition.
The myocardium of the heart is comprised of myocytes, fibroblasts, and an ex-
tracellular matrix (ECM) [Humphrey, 2002]. Myofibrils reside within the cytoplasm
of the myocytes, providing the mechanism by which the myocardium can contract.
The myocytes are oriented in a helical manner, allowing for counterclockwise apical
rotation and twisting during ventricular systole, and clockwise rotation during dias-
tole [Omar et al., 2015]. Fibroblasts, the must abundant cell type in the heart, aid in
healing and remodelling, laying down collagen in response to changes in mechanical
loading or damage. Collagen (type I) makes up a majority of the ECM composition,
providing structural support for the loading experienced during the cardiac cycle.
Arteries (particularly the ascending aorta, which is of primary focus in this work)
are comprised of 3 layers (Fig. 1.2). The innermost layer, known as the tunica
intima, contains a lumen lined with endothelial cells in constant contact with blood
flow, anchored to an internal elastic lamina composed of connective elements and
3
collagen fibers [Wagenseil and Mecham, 2009]. The middle layer, known as the tunica
media, contains concentric lamellar layers of collagen and elastin, held together by
vascular smooth muscle cells (VSMCs) and other ECM components (such as fibrillin-1
and proteoglycans). The outermost layer, known as the tunic adventitia, is comprised
primarily of collagen fibers, along with myofibroblasts [Wagenseil and Mecham, 2009].
The unique ECM composition of arteries allows them to expand during diastole and
to recoil elastically during systole, shifting significant blood pressure load away from
the heart, and helping to pump blood throughout the body. The primary load-
bearing layer within the vascular wall is the media, due to its high collagen and elastin
fiber concentration and highly-aligned fiber architecture. Collagen fibers exhibit a
preferred alignment in the circumferential direction, providing structural integrity to
the vessel during expansion and contraction. Elastin is primarily isotropic, having a
lower stiffness and higher failure stretch than collagen, yielding an elastic response in
the vessel and stability during large deformations. VSMCs help to give the lamellar
layers support, along with providing the active contractility of the vessel. In a healthy
state, the ascending aorta bears significant and repetitive loading during the cardiac
cycle, playing a crucial role in the overall functionality of the cardiovascular system.
The inherent behavior of these underlying components gives rise to the overall
macroscale behavior of the tissues, and consequently, the title given to this work.
Each one of these attributes: nonlinearity, heterogeneity, and anisotropy, plays an
essential role in the overall tissue behavior, and understanding how these contribute
is crucial to understanding both the mechanical response and the mechanisms of
tissue failure. Nonlinearity, common to all soft tissues, is specified by the nonlinear
relationship between stress and strain. In contrast to materials such as metals, which
typically reside in low strain regimes, biological tissues undergo a significant amount
of strain during normal use. The inherent response of load-bearing fibers such as
4
collagen and elastin is particularly nonlinear, resulting in a nonlinear tissue response.
Heterogeneity is the unique characteristic of soft tissues, particularly the heart and
aorta, to have a spatially varying microstructure throughout. The difference in cell
and fiber density, along with alignment, yields spatially varying mechanical behavior
in the tissue. Anisotropy is the characteristic of the heart and aorta to exhibit a
preferred fiber alignment, usually in a load bearing direction. By orienting fibers
in a different manner, tissue loaded in different situations will respond based on the
underlying fiber directions, producing higher stress in preferred fiber directions. Each
of these aspects is unique, and varying, within soft tissues, and must be considering
when attempting to understand tissue mechanics.
So far, we have observed how the cardiovascular system, namely the heart and
aorta, operate in a healthy, idealized manner. This, however, is not always the case.
A variety of trauma events and pathologies can negatively impact the tissue, caus-
ing subsequent remodeling and change in response. These situations are of primary
concern in the work to follow, specifically, myocardial infarctions and ascending tho-
racic aortic aneurysms. Most importantly, when and how does failure occur in these
situations? What factors contribute to failure? What is the threshold, or location
of failure? These questions are of utmost importance as we consider the impact
detrimental remodeling has on native tissues.
1.1.2 Myocardial Infarctions
A myocardial infarction (MI) occurs when an ischemic event causes cardiac myocyte
death, affecting upwards of 1 million Americans every year [Benjamin et al., 2018]. As
cardiac musculature is a nondividing tissue, trauma response depends on fibroblasts
laying down collagen fibers to replace necrotic areas, resulting in scar tissue. The
subsequent outcome of native tissue replacement with stiff collagen fibers, is altered
5
cardiac behavior. Scar formation can impede normal cardiac function, and cause
future complications such as cardiac rupture or heart failure [Richardson et al., 2015].
As such, the orientation and density of new collagen fiber deposition plays a large
role in the resulting mechanics of the surrounding cardiac tissue. Factors such as
fiber heterogeneity and anisotropy can affect stress and strain redistribution under
normal cardiac loading, creating locations at a higher risk of failure. Much is still
unknown about the risks scar healing creates in the case of MI, as well as how to
improve post-MI tissue mechanics. Consequently, a fundamental understanding of
the effect scar mechanics have on native tissue due to their underlying microstructure
is needed.
1.1.3 Ascending Thoracic Aortic Aneurysms
The healthy ascending aorta of an average adult is 2-3 cm in diameter and experiences
pressures of 100-140 mmHg during systole and 60-90 mmHg during diastole [Iaizzo,
2009], undergoing large deformation during the cardiac cycle. Ascending thoracic
aortic aneurysms (ATAAs) occur when the aorta abnormally enlarges in diameter
between the aortic root and aortic arch (Fig. 1.3) [Cruz et al., 2007]. ATAAs pose
a significant risk as the vessel can 1) rupture, causing likely mortality, or 2) dissect,
allowing blood to enter the vessel wall, causing further expansion and the possible
formation of intraluminal thrombus. ATAAs occur in over 15,000 people throughout
the United States each year [Cleveland Clinic, 2014], with 60% of thoracic aneurysms
occurring in the ascending region [Isselbacher, 2005]. If not surgically corrected,
ATAAs have a high rate of rupture (21% to 74%), with a mortality rate of ∼100% in
those with ruptured ATAAs [Davies et al., 2002,Olsson et al., 2006]. Surgical repair
also presents a relatively high mortality rate of 5-9%, with emergency operations
reaching as high as 57% [Davies et al., 2002]. ATAAs present a unique situation,
6
as aberrant remodeling and disease progression typically happen slowly over time,
allowing for careful diagnostic assessment prior to surgical recommendations.
Enlargement of the ascending aorta negatively impacts the vessel’s mechanical
integrity. Though mechanical differences in pathological aortic tissue are evident and
well-known [Isselbacher, 2005,Garcıa-Herrera et al., 2012,Vorp et al., 2003,Okamoto
et al., 2002], current diagnostic methods for surgical treatment are based solely on
morphology (diameter size or growth rate), neglecting mechanical considerations. The
current threshold for surgical intervention is a diameter larger than 5-6 cm [Davies
et al., 2002, Elefteriades, 2002, Coady et al., 1999], or a growth rate greater than 1
cm/year [Saliba and Sia, 2015]. Diagnosis based on diameter measurements, however,
is prone to subjectivity and discrepancies, shown by inconsistencies among common
imaging techniques [12]. More importantly, the current diameter-based diagnostic
threshold proves to be inefficient in predicting aneurysm failure, as mortality is preva-
lent on both sides of the threshold. Vorp et. al [Vorp et al., 2003] have shown a
5-year mortality rate of 39% for ATAAs smaller than 6 cm, and 62% for those greater
than 6 cm, along with no correlation between aneurysm diameter and mechanical
strength [Vorp et al., 2003]. Their study emphasizes the fact that failure is complex
process, unique to each individual, that involves many key factors which may not be
captured by morphology. Taken collectively, this information highlights the critical
need to better understand the mechanical behavior and failure of ATAAs, in order to
appropriately predict risk of failure in the ATAA pathology.
Recent Studies
Remodeling during aneurysm development causes nonuniform expansion and thin-
ning of the vessel wall, imposing local heterogeneity and altered stiffness. Though
some studies have reported no significant difference in vessel wall thickness between
7
diseased and healthy tissue [Vorp et al., 2003], typical progression of the pathology
results in a thinner vessel wall lacking elastin and smooth muscle cells [Humphrey,
2002]. Previous studies have quantified non-aneurysmal and aneurysmal aortic tis-
sue mechanical response through various loading configurations including bulge infla-
tion [Trabelsi et al., 2015,Romo et al., 2014], uniaxial extension [Garcıa-Herrera et al.,
2012, Vorp et al., 2003, Okamoto et al., 2002, Iliopoulos et al., 2009a, Duprey et al.,
2010,Khanafer et al., 2011], biaxial extension [Okamoto et al., 2002,Choudhury et al.,
2009, Matsumoto et al., 2009, Azadani et al., 2013, Geest et al., 2004, Duprey et al.,
2016], peel [Pasta et al., 2012,Noble et al., 2016], and shear [Sommer et al., 2016] test-
ing regimes. Results have shown an anisotropic response, producing higher stresses
in the circumferential direction compared to axial [Okamoto et al., 2002, Humphrey,
2002,Duprey et al., 2016]. Studies have also highlighted the decreased tensile strength
of pathological tissue compared to healthy tissue [Vorp et al., 2003, Phillippi et al.,
2011a, Duprey et al., 2016] in both circumferential and axial directions, making the
tissue more susceptible to rupture or dissection [Phillippi et al., 2011a]. It has also
been reported that ATAA wall stiffness is higher compared to control tissue [Vorp
et al., 2003, Phillippi et al., 2011a], which may be caused by elastin degradation in
the aneurysm pathology [Campa et al., 1987]. Regional heterogeneity of healthy
and diseased tissue has also been reported, with variation between the lesser and
greater curvature of the aortic arch being observed [Duprey et al., 2016, Gao et al.,
2006,Thubrikar et al., 1999,Poullis et al., 2008]. The anterior region of the ATAA has
been shown to be weaker and less stiff in the axial direction, which may be related to
clinical data that reports preferential aneurysm bulging in the anterior location [Il-
iopoulos et al., 2009b].
Peel testing, in which layers of the vessel wall are peeled apart, has been performed
to quantify delamination between wall layers as a method of ATAA dissection [Pasta
8
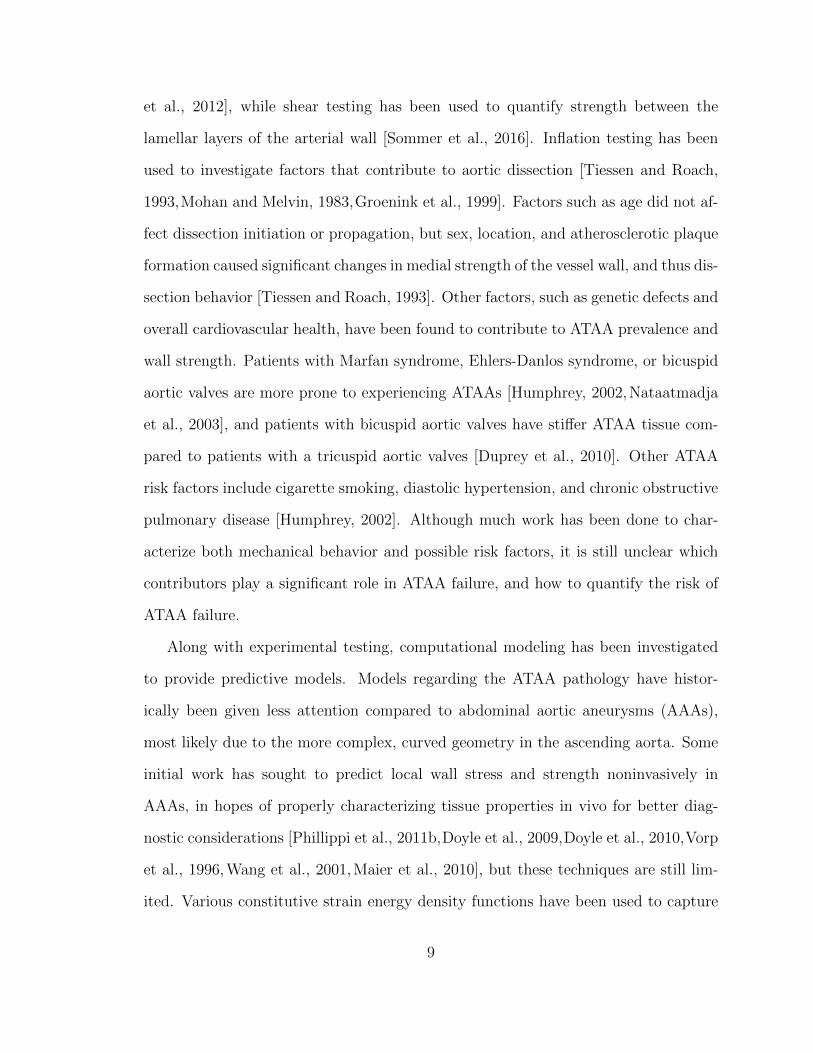
et al., 2012], while shear testing has been used to quantify strength between the
lamellar layers of the arterial wall [Sommer et al., 2016]. Inflation testing has been
used to investigate factors that contribute to aortic dissection [Tiessen and Roach,
1993,Mohan and Melvin, 1983,Groenink et al., 1999]. Factors such as age did not af-
fect dissection initiation or propagation, but sex, location, and atherosclerotic plaque
formation caused significant changes in medial strength of the vessel wall, and thus dis-
section behavior [Tiessen and Roach, 1993]. Other factors, such as genetic defects and
overall cardiovascular health, have been found to contribute to ATAA prevalence and
wall strength. Patients with Marfan syndrome, Ehlers-Danlos syndrome, or bicuspid
aortic valves are more prone to experiencing ATAAs [Humphrey, 2002,Nataatmadja
et al., 2003], and patients with bicuspid aortic valves have stiffer ATAA tissue com-
pared to patients with a tricuspid aortic valves [Duprey et al., 2010]. Other ATAA
risk factors include cigarette smoking, diastolic hypertension, and chronic obstructive
pulmonary disease [Humphrey, 2002]. Although much work has been done to char-
acterize both mechanical behavior and possible risk factors, it is still unclear which
contributors play a significant role in ATAA failure, and how to quantify the risk of
ATAA failure.
Along with experimental testing, computational modeling has been investigated
to provide predictive models. Models regarding the ATAA pathology have histor-
ically been given less attention compared to abdominal aortic aneurysms (AAAs),
most likely due to the more complex, curved geometry in the ascending aorta. Some
initial work has sought to predict local wall stress and strength noninvasively in
AAAs, in hopes of properly characterizing tissue properties in vivo for better diag-
nostic considerations [Phillippi et al., 2011b,Doyle et al., 2009,Doyle et al., 2010,Vorp
et al., 1996, Wang et al., 2001, Maier et al., 2010], but these techniques are still lim-
ited. Various constitutive strain energy density functions have been used to capture
9
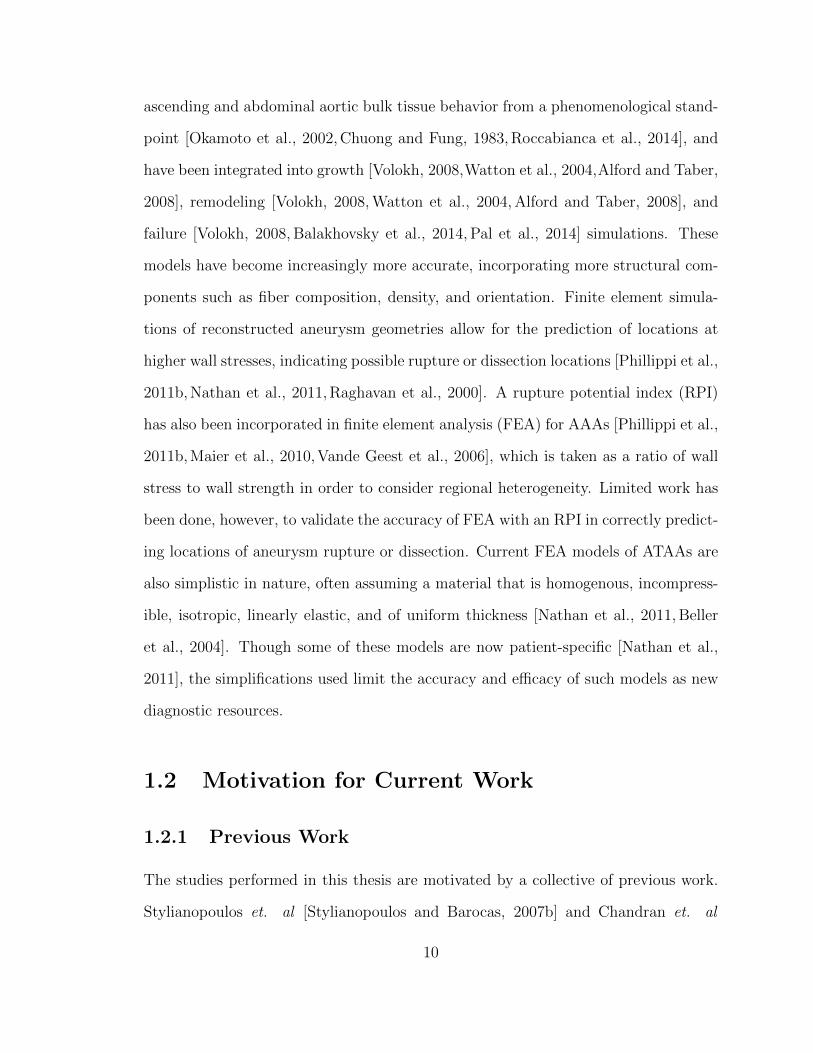
ascending and abdominal aortic bulk tissue behavior from a phenomenological stand-
point [Okamoto et al., 2002, Chuong and Fung, 1983, Roccabianca et al., 2014], and
have been integrated into growth [Volokh, 2008,Watton et al., 2004,Alford and Taber,
2008], remodeling [Volokh, 2008, Watton et al., 2004, Alford and Taber, 2008], and
failure [Volokh, 2008, Balakhovsky et al., 2014, Pal et al., 2014] simulations. These
models have become increasingly more accurate, incorporating more structural com-
ponents such as fiber composition, density, and orientation. Finite element simula-
tions of reconstructed aneurysm geometries allow for the prediction of locations at
higher wall stresses, indicating possible rupture or dissection locations [Phillippi et al.,
2011b, Nathan et al., 2011, Raghavan et al., 2000]. A rupture potential index (RPI)
has also been incorporated in finite element analysis (FEA) for AAAs [Phillippi et al.,
2011b, Maier et al., 2010, Vande Geest et al., 2006], which is taken as a ratio of wall
stress to wall strength in order to consider regional heterogeneity. Limited work has
been done, however, to validate the accuracy of FEA with an RPI in correctly predict-
ing locations of aneurysm rupture or dissection. Current FEA models of ATAAs are
also simplistic in nature, often assuming a material that is homogenous, incompress-
ible, isotropic, linearly elastic, and of uniform thickness [Nathan et al., 2011, Beller
et al., 2004]. Though some of these models are now patient-specific [Nathan et al.,
2011], the simplifications used limit the accuracy and efficacy of such models as new
diagnostic resources.
1.2 Motivation for Current Work
1.2.1 Previous Work
The studies performed in this thesis are motivated by a collective of previous work.
Stylianopoulos et. al [Stylianopoulos and Barocas, 2007b] and Chandran et. al
10
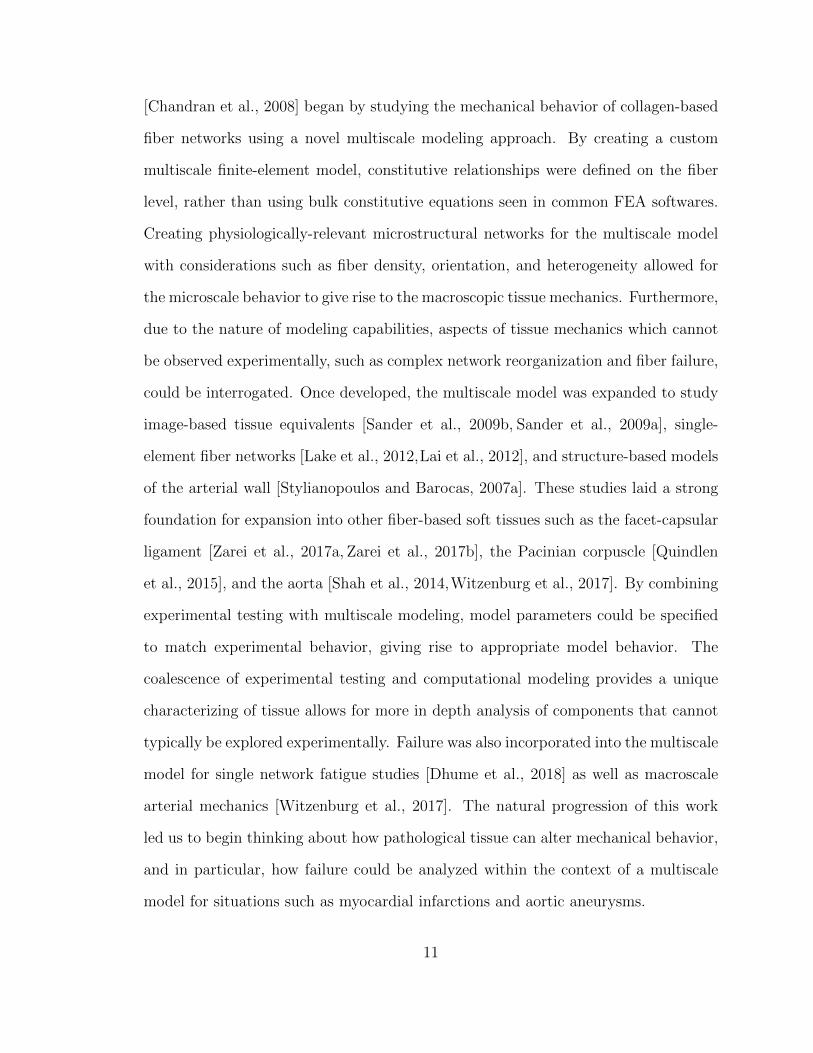
[Chandran et al., 2008] began by studying the mechanical behavior of collagen-based
fiber networks using a novel multiscale modeling approach. By creating a custom
multiscale finite-element model, constitutive relationships were defined on the fiber
level, rather than using bulk constitutive equations seen in common FEA softwares.
Creating physiologically-relevant microstructural networks for the multiscale model
with considerations such as fiber density, orientation, and heterogeneity allowed for
the microscale behavior to give rise to the macroscopic tissue mechanics. Furthermore,
due to the nature of modeling capabilities, aspects of tissue mechanics which cannot
be observed experimentally, such as complex network reorganization and fiber failure,
could be interrogated. Once developed, the multiscale model was expanded to study
image-based tissue equivalents [Sander et al., 2009b, Sander et al., 2009a], single-
element fiber networks [Lake et al., 2012,Lai et al., 2012], and structure-based models
of the arterial wall [Stylianopoulos and Barocas, 2007a]. These studies laid a strong
foundation for expansion into other fiber-based soft tissues such as the facet-capsular
ligament [Zarei et al., 2017a, Zarei et al., 2017b], the Pacinian corpuscle [Quindlen
et al., 2015], and the aorta [Shah et al., 2014,Witzenburg et al., 2017]. By combining
experimental testing with multiscale modeling, model parameters could be specified
to match experimental behavior, giving rise to appropriate model behavior. The
coalescence of experimental testing and computational modeling provides a unique
characterizing of tissue allows for more in depth analysis of components that cannot
typically be explored experimentally. Failure was also incorporated into the multiscale
model for single network fatigue studies [Dhume et al., 2018] as well as macroscale
arterial mechanics [Witzenburg et al., 2017]. The natural progression of this work
led us to begin thinking about how pathological tissue can alter mechanical behavior,
and in particular, how failure could be analyzed within the context of a multiscale
model for situations such as myocardial infarctions and aortic aneurysms.
11
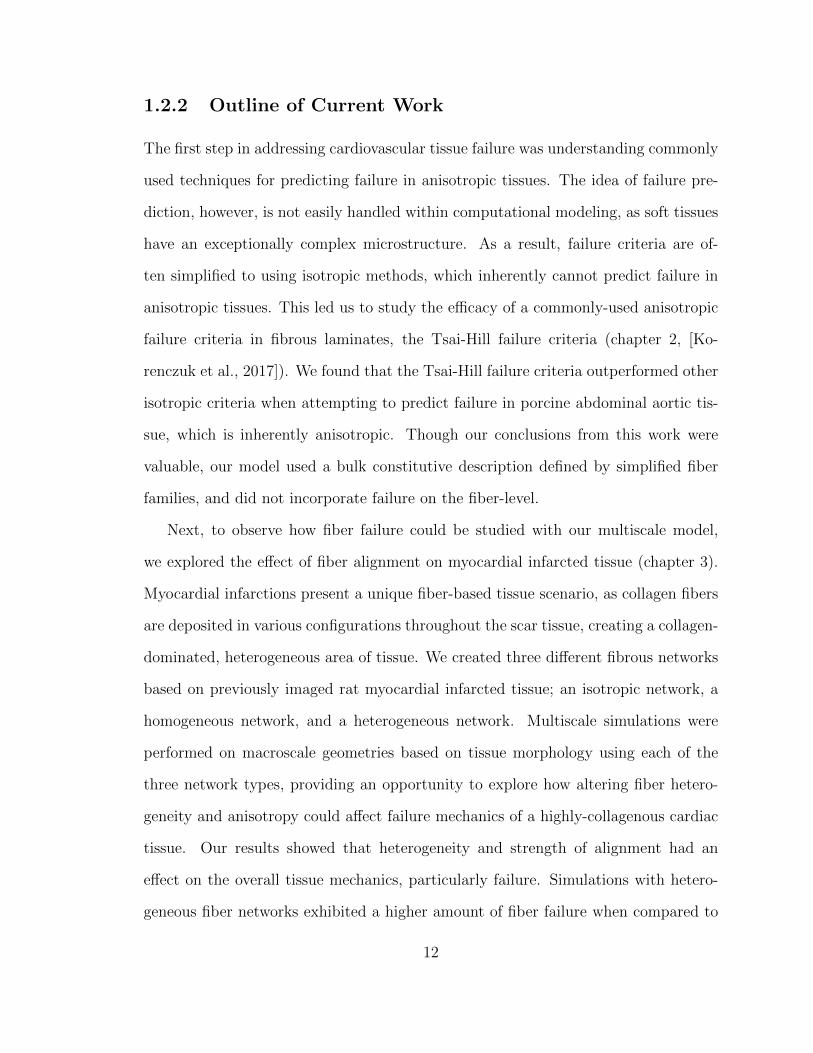
1.2.2 Outline of Current Work
The first step in addressing cardiovascular tissue failure was understanding commonly
used techniques for predicting failure in anisotropic tissues. The idea of failure pre-
diction, however, is not easily handled within computational modeling, as soft tissues
have an exceptionally complex microstructure. As a result, failure criteria are of-
ten simplified to using isotropic methods, which inherently cannot predict failure in
anisotropic tissues. This led us to study the efficacy of a commonly-used anisotropic
failure criteria in fibrous laminates, the Tsai-Hill failure criteria (chapter 2, [Ko-
renczuk et al., 2017]). We found that the Tsai-Hill failure criteria outperformed other
isotropic criteria when attempting to predict failure in porcine abdominal aortic tis-
sue, which is inherently anisotropic. Though our conclusions from this work were
valuable, our model used a bulk constitutive description defined by simplified fiber
families, and did not incorporate failure on the fiber-level.
Next, to observe how fiber failure could be studied with our multiscale model,
we explored the effect of fiber alignment on myocardial infarcted tissue (chapter 3).
Myocardial infarctions present a unique fiber-based tissue scenario, as collagen fibers
are deposited in various configurations throughout the scar tissue, creating a collagen-
dominated, heterogeneous area of tissue. We created three different fibrous networks
based on previously imaged rat myocardial infarcted tissue; an isotropic network, a
homogeneous network, and a heterogeneous network. Multiscale simulations were
performed on macroscale geometries based on tissue morphology using each of the
three network types, providing an opportunity to explore how altering fiber hetero-
geneity and anisotropy could affect failure mechanics of a highly-collagenous cardiac
tissue. Our results showed that heterogeneity and strength of alignment had an
effect on the overall tissue mechanics, particularly failure. Simulations with hetero-
geneous fiber networks exhibited a higher amount of fiber failure when compared to
12
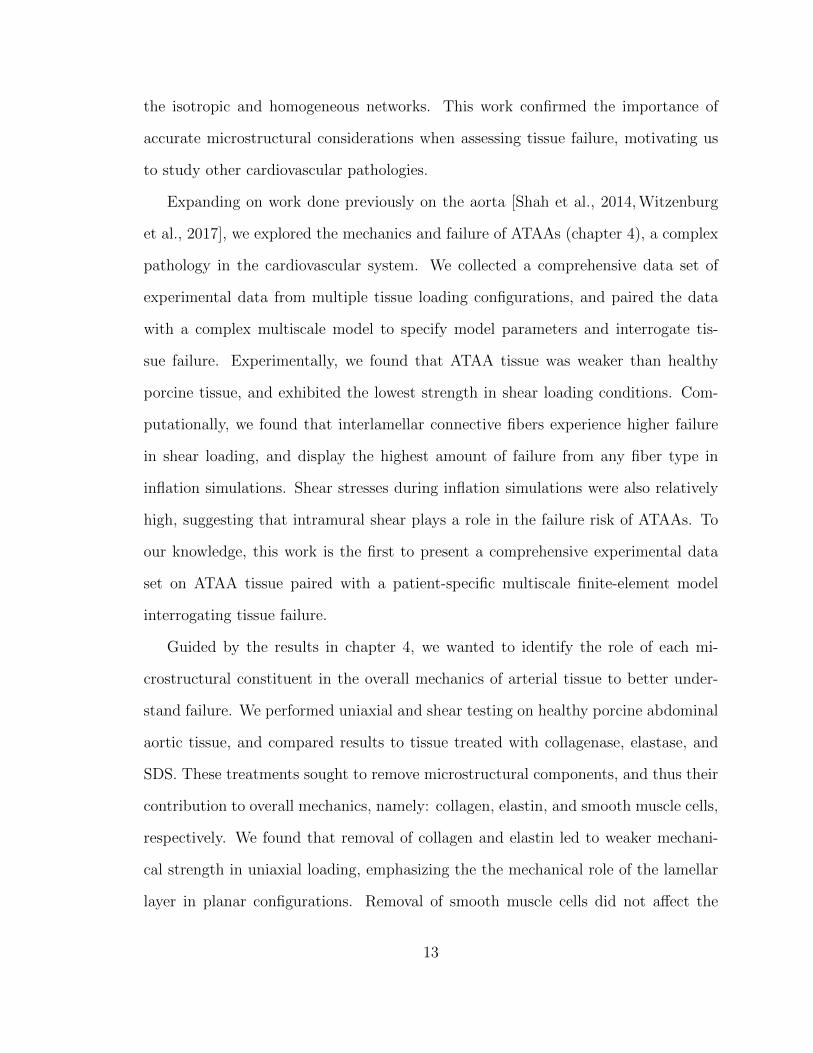
the isotropic and homogeneous networks. This work confirmed the importance of
accurate microstructural considerations when assessing tissue failure, motivating us
to study other cardiovascular pathologies.
Expanding on work done previously on the aorta [Shah et al., 2014, Witzenburg
et al., 2017], we explored the mechanics and failure of ATAAs (chapter 4), a complex
pathology in the cardiovascular system. We collected a comprehensive data set of
experimental data from multiple tissue loading configurations, and paired the data
with a complex multiscale model to specify model parameters and interrogate tis-
sue failure. Experimentally, we found that ATAA tissue was weaker than healthy
porcine tissue, and exhibited the lowest strength in shear loading conditions. Com-
putationally, we found that interlamellar connective fibers experience higher failure
in shear loading, and display the highest amount of failure from any fiber type in
inflation simulations. Shear stresses during inflation simulations were also relatively
high, suggesting that intramural shear plays a role in the failure risk of ATAAs. To
our knowledge, this work is the first to present a comprehensive experimental data
set on ATAA tissue paired with a patient-specific multiscale finite-element model
interrogating tissue failure.
Guided by the results in chapter 4, we wanted to identify the role of each mi-
crostructural constituent in the overall mechanics of arterial tissue to better under-
stand failure. We performed uniaxial and shear testing on healthy porcine abdominal
aortic tissue, and compared results to tissue treated with collagenase, elastase, and
SDS. These treatments sought to remove microstructural components, and thus their
contribution to overall mechanics, namely: collagen, elastin, and smooth muscle cells,
respectively. We found that removal of collagen and elastin led to weaker mechani-
cal strength in uniaxial loading, emphasizing the the mechanical role of the lamellar
layer in planar configurations. Removal of smooth muscle cells did not affect the
13

mechanical strength in uniaxial loading, but did play a role in shear loading condi-
tions, weakening the vessel’s strength and increasing the failure stretch. The results
substantiate similar conclusions found in chapter 4, namely, that VSMCs and other
interlamellar components play a role in shear mechanical strength.
These chapters, taken collectively, provide a versatile foundation for further work
in the space of cardiovascular tissue failure.
14
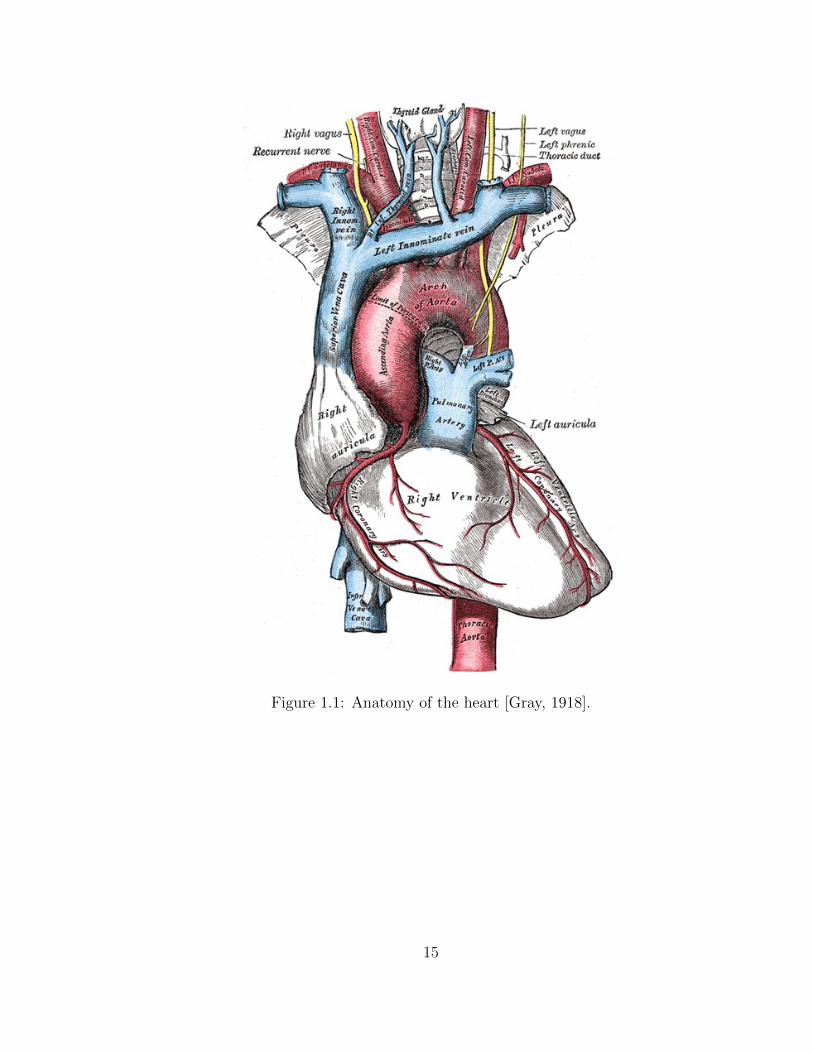
Figure 1.1: Anatomy of the heart [Gray, 1918].
15
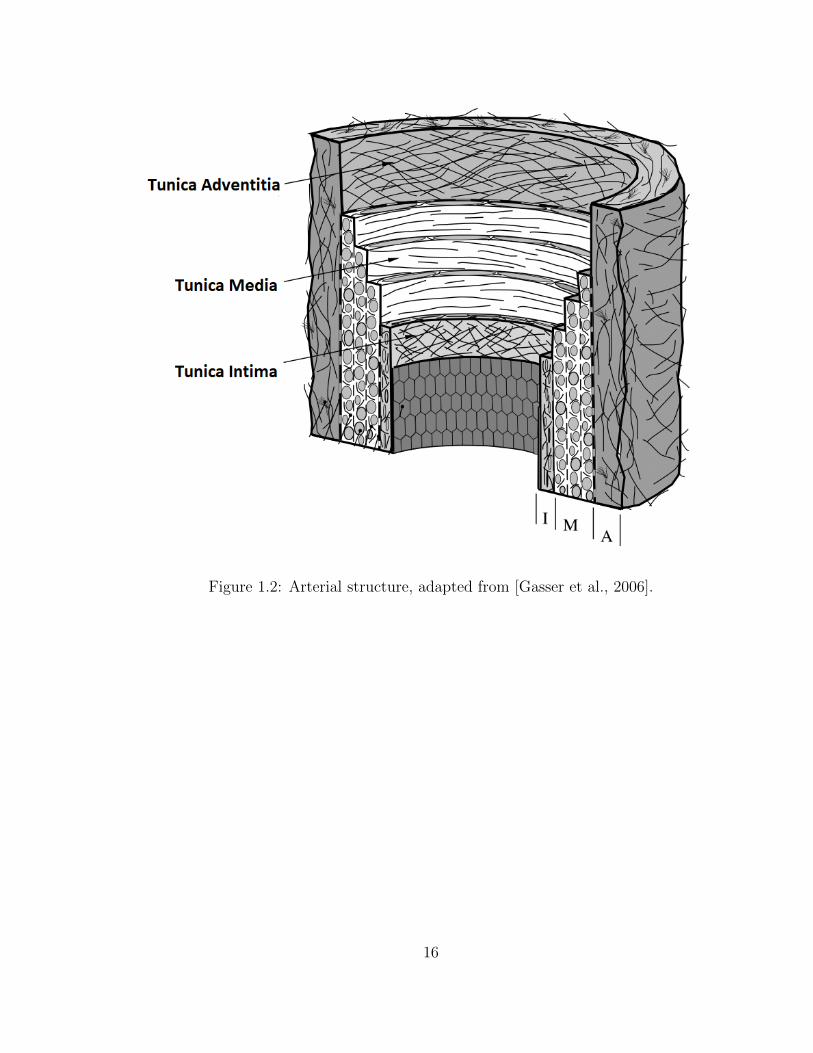
Figure 1.2: Arterial structure, adapted from [Gasser et al., 2006].
16
Figure 1.3: A magnetic resonance angiogram of an ATAA [Cruz et al., 2007]. Arrowsindicate enlarged diameter.
17
Chapter 2
Isotropic Failure Criteria are not
Appropriate for Anisotropic
Fibrous Biological Tissues
The content of this chapter was published as a research article in the Journal of
Biomechanical Engineering by Korenczuk, Votava, Dhume, Kizilski, Brown, Narain,
and Barocas [Korenczuk et al., 2017]. My contribution to the work was performing
experimental testing on aortic tissue, data processing, computational modeling, and
a majority of the writing.
2.1 Introduction
Accurate failure prediction techniques are essential to assess and understand biological
tissues at risk of failure. In the case of adverse physiological conditions (i.e. traumatic
injury, repetitive use, pathological states, etc.), tissue failure is often unprecedented
and always unfavorable. When tissue function is compromised, preventive actions
18
such as surgical resection, replacement, or repair can be used to correct and/or fortify
the damaged tissue. Without the ability to assess tissues at risk of failure properly,
however, corrective action may be misguided or incomplete. As a result, failure
analysis and modeling have become increasingly active research areas [Grosse et al.,
2014,Sanyal et al., 2014,Zwahlen et al., 2015,Clouthier et al., 2015].
Many fibrous soft tissues exhibit anisotropic mechanical behavior, including ar-
teries [Holzapfel et al., 2005, Vorp et al., 2003, Duprey et al., 2016, Luo et al., 2016],
ligaments [Woo et al., 1983, Woo et al., 1991, Little and Khalsa, 2005, Claeson and
Barocas, 2017], tendons [Nicholls et al., 1983, Natali et al., 2005], and skeletal mus-
cle [Takaza et al., 2012, Gennisson et al., 2010]. Directionally-dependent material
strength is central to tissue function, allowing for proper load bearing during the
complex loading situations brought on by bodily processes and movement. For ex-
ample, the anterior cruciate ligament (ACL) is composed of elastin, extracellular pro-
teins, and highly aligned collagen (type I) fibers in the longitudinal direction, which
gives rise to a strong connection between the femur and tibia, providing resistance of
anterior-tibial translation and rotation during various loading schemes [Duthon et al.,
2006]. As collagen fibers are highly aligned in the direction of tensile loading, large
forces are permitted during such movements, allowing the ACL to function as a vital
mechanical stabilizer in the knee.
Showing the von Mises stress in computer simulations of a fibrous tissue at risk of
failure has become a routine practice (e.g., [Volokh, 2011, Karimi et al., 2014, Wood
et al., 2011, Phillippi et al., 2011a, Nathan et al., 2011, Humphrey and Holzapfel,
2012]). The von Mises stress incorporates the 6 components of the Cauchy stress
tensor into a single, easily visualized, scalar value. While its ease of calculation and
its availability as a standard output in most finite-element software packages make
the von Mises stress attractive, its use is accompanied by the implicit assumption
19
that the von Mises failure criterion is applicable to the tissue in question. The von
Mises criterion, however, is isotropic, in that the von Mises stress depends equally
on stresses in all directions. By showing the von Mises stress within a tissue, one
implicitly treats it as isotropic.
The maximum principal stress (MPS) is also commonly reported in finite element
simulations of biological tissue [Hwang et al., 2015,Quental et al., 2016]. Like the von
Mises stress, the MPS depends equally on stresses in all directions, thus making it
inherently isotropic as well. The MPS may also be a poor stress metric to use when
considering anisotropic tissues because the tissue is generally designed to bear the
largest loads in the strongest direction. Another direction, however, may experience
stress smaller than the MPS but greater than the material strength in that direction.
For many fibrous tissues (e.g. Achilles tendon), loading most often occurs along
the direction of highest material strength, so considerations of an anisotropic failure
criterion may not be necessary. For tissues that undergo complex loading situations,
where failure may occur in multiple directions and ways, directional strength must
be accounted for. As anisotropy plays a significant role in the proper mechanical
functioning of these tissues, it is imperative that directional strength be considered
when predicting failure of anisotropic tissues.
Typically, isotropic failure criteria have been used when assessing soft biological
tissues. Volokh et al. [Volokh, 2011] explored the use of isotropic failure criteria,
including the von Mises failure criterion, when assessing arteries using various con-
stitutive models. They found that the von Mises failure criterion was incapable of
accurately predicting failure in the case of biaxial loading situations, as expected,
and suggested that anisotropic alternatives must be used. Nathan et al. [Nathan
et al., 2011] assessed thoracic aorta wall stress in patients using the von Mises stress,
without any failure considerations. Their conclusions focused on identifying locations
20
of high wall stress, however, all results were based solely on the von Mises stress,
assuming that it is a meaningful measure of stress in the aortic wall. These studies,
among others [Karimi et al., 2014,Wood et al., 2011,Phillippi et al., 2011a,Humphrey
and Holzapfel, 2012], exemplify how common it has become to use the isotropic von
Mises stress and failure criterion when tissues well known to be anisotropic.
Extensive work has been done to analyze the failure behavior of non-biological
anisotropic fiber composites [Agarwal et al., 2006, Matzenmiller et al., 1995, Derrien
et al., 2000,Nuismer and Whitney, 1975,Fuchs et al., 2006,Aktas and Karakuzu, 1999].
For example, the Tsai-Hill theory [Tsai, 1968, Hill, 1950] is a popular maximum-
work theory to characterize the in-plane failure of orthotropic lamina. For a given
stress state, the theory provides a single scalar failure criterion based on the principal
material direction strengths and the shear strength. The Tsai-Hill theory has been
used to study reinforced polymer-polymer composites [Fuchs et al., 2006], carbon-
epoxy composites [Aktas and Karakuzu, 1999], and simulations of fiber composites
[Arola and Ramulu, 1997], along with other fibrous materials [Liu, 2007, Woo and
Whitcomb, 1996], and has proven effective as a failure criterion for such materials.
Thus, unlike the von Mises failure criterion, the Tsai-Hill failure criterion provides
a potential platform to analyze how off-axis loading affects an anisotropic fibrous ma-
terial. This advantage, however, is not without cost. The Tsai-Hill criterion requires
three parameters for full model specification, in contrast to the single parameter of
the von Mises criterion, so additional testing is needed. An additional advantage of
the von Mises stress is that it can be calculated without foreknowledge of the failure
behavior of the tissue.
Clearly, the choice of failure model depends on the specific system under study
and the question(s) to be answered, but the validity of the von Mises stress as a
metric of the stress state in an anisotropic tissue must be challenged. In the present
21
work, we conducted a series of failure experiments on a representative anisotropic
tissue (porcine aorta) and analyzed the results using both an isotropic (von Mises)
and an anisotropic (Tsai-Hill) failure criterion.
2.2 Methods
The porcine abdominal aorta is an anisotropic tissue that contains an underlying
fiber laminate structure comprised mainly of collagen and elastin. The primary load-
bearing layer, the tunica media, consists of lamellar sheets of elastin and collagen
connected by vascular smooth muscle cells and extracellular proteins such as fibrillin-
1 [Wagenseil and Mecham, 2009]. The collagen fibers exhibit a strong preferential
alignment in the circumferential direction, along with a weaker, but still significant
preference for the axial over the radial direction [Gasser et al., 2006], making these two
fiber alignments the assumed principal material directions. Thus, the porcine arterial
wall provided an excellent representative system on which to study the efficacy of
different failure criteria.
2.2.1 Experiment
Uniaxial Dog-Bones
Porcine abdominal aortas (11.35 ± 1.67 cm in length, mean ± SD) were obtained
from 6-9 month old pigs (n=7, 83.6 ± 10.0kg in weight) following an unrelated study
and stored in a 1x phosphate-buffer saline (PBS) solution at 4° C. The aorta was
cleaned of excess connective tissue on the adventitial surface, and in some cases a
small amount of adventitia was inadvertently removed during the dissection process.
Each aorta was cut open axially along the posterior region where it was anchored
to the vertebral column. Uniaxial dog-bone samples (approximately 5 mm in width
22
and 10 mm in length with a 3 mm wide neck region) were cut from the opened aorta
with sample angles ranging from 0° (circumferential) to 90° (axial) with respect to the
vessel circumference in increments of 15° (Fig. 2.1A, n > 9 for each angle). Sample
orientation was randomized along the length of the vessel to minimize error due to
any regional heterogeneity. Each sample was photographed prior to testing, and the
undeformed sample width and thickness were measured using ImageJ. Samples were
speckled with powdered, dry Verhoeff’s stain in order to produce a distinct surface
texture for full-field displacement tracking analysis via digital image correlation (DIC)
[Raghupathy et al., 2011]. Samples were loaded into custom grips and subjected to
uniaxial tensile loading tests (Instron 8800 Microtester) at 10 mm/min until failure
(Fig. 2.1B) in a 1x PBS bath at room temperature. Loads were recorded by a 500N
load cell. All experiments were performed within 48 hours of harvest.
The measured force was divided by the undeformed cross-sectional area to cal-
culate the 1st Piola-Kirchhoff stress. Due to speckle adherence issues in the PBS
bath, a significant number of uniaxial samples (> 40) did not have a usable, dis-
tinct speckle pattern for DIC. Strain tracking of selected dogbones (n=5) showed a
maximum error of 10% between the grip stretch and the neck region stretch, so grip
stretch was used to convert 1st Piola-Kirchhoff stresses into Cauchy stresses under the
assumption of tissue incompressibility. To validate this method, Cauchy stresses for
6 samples with usable speckle patterns from one sample angle were calculated based
on neck stretch obtained via DIC as well as grip stretch. Cauchy stresses calculated
with the grip stretch were within 10% of the stresses calculated with the neck stretch
throughout the entire loading curve, and some samples exhibited even as low as 1-
2% error throughout the entire loading curve. Statistical analyses (one-way ANOVA
and Tukey’s multiple comparisons) of failure stresses were performed using GraphPad
Prism 6.
23
Uniaxial Shear Lap Samples
Shear lap samples were prepared (n=7 from 2 porcine aortas) with sample arms
oriented in the circumferential direction (Fig. 2.1C). Samples were approximately 35
mm long with an arm width of 3 mm. The overlap region was approximately 5 mm
wide at the largest point. The sample geometry was selected due to the large amount
of shear that would be imposed in the overlap region of the sample during mechanical
testing (c.f. [Witzenburg et al., 2017, Gregory et al., 2011]), yielding a challenging
problem for failure predictors.
Samples underwent the same procedure as specified for the uniaxial dog-bones
regarding tissue dissection, storage, photographing, and speckling. Shear lap samples
were clamped in custom grips, submerged in a 1x PBS bath at room temperature,
and pulled in strain-to-failure experiments on a uniaxial testing machine (MTS, Eden
Prairie, MN) at a rate of 3 mm/min. Forces were recorded by a static 10N load cell.
The displacement at the onset of failure was determined by correlating the sample
video time with the recorded data.
Area fraction of the smaller remaining piece post-failure was calculated using an
image of the sample immediately prior to total failure. A crack propagation line was
selected for each experimental sample by connecting the start and end points of the
crack. Samples were then manually outlined, and the pixel area was calculated for
the entire sample and the two pieces on both sides of the crack propagation line. A
pixel area average from 5 manual outlines was used for each piece. Area fraction was
calculated as the pixel area of the smaller torn piece divided by the total pixel area
of the sample.
The crack propagation angle was calculated in the undeformed domain for each
shear lap sample. The line of crack propagation on the image prior to total failure was
projected back to the undeformed domain using the deformation gradient (obtained by
24
strain tracking methods described earlier) for an element along the crack propagation
line. The crack propagation angle was then calculated between the crack propagation
line in the undeformed domain and the horizontal direction.
2.2.2 Failure Criteria
The von Mises failure criterion takes the form
[(σ1−σ2)2+(σ2−σ3)2+(σ3−σ1)2+6(τ212+τ
223+τ
231)
2
]1/2≤ σyield (2.1)
where σi are the normal Cauchy stresses with respect to the coordinate directions. In
the case of uniaxial extension (in the 11 direction),
σ2 = σ3 = 0 (2.2)
τ12 = τ23 = τ31 = 0 (2.3)
which reduces the von Mises failure criterion to the form
σ1 ≤ σyield (2.4)
When σ1 reaches the failure threshold, σyield, failure is predicted. As the choice
of uniaxial yield stress for the von Mises failure criterion is ambiguous, three cases
were explored, where the yield stress was equal to 1) the overall average uniaxial
failure stress, 2) the average uniaxial circumferential failure stress, and 3) the average
uniaxial axial failure stress.
25
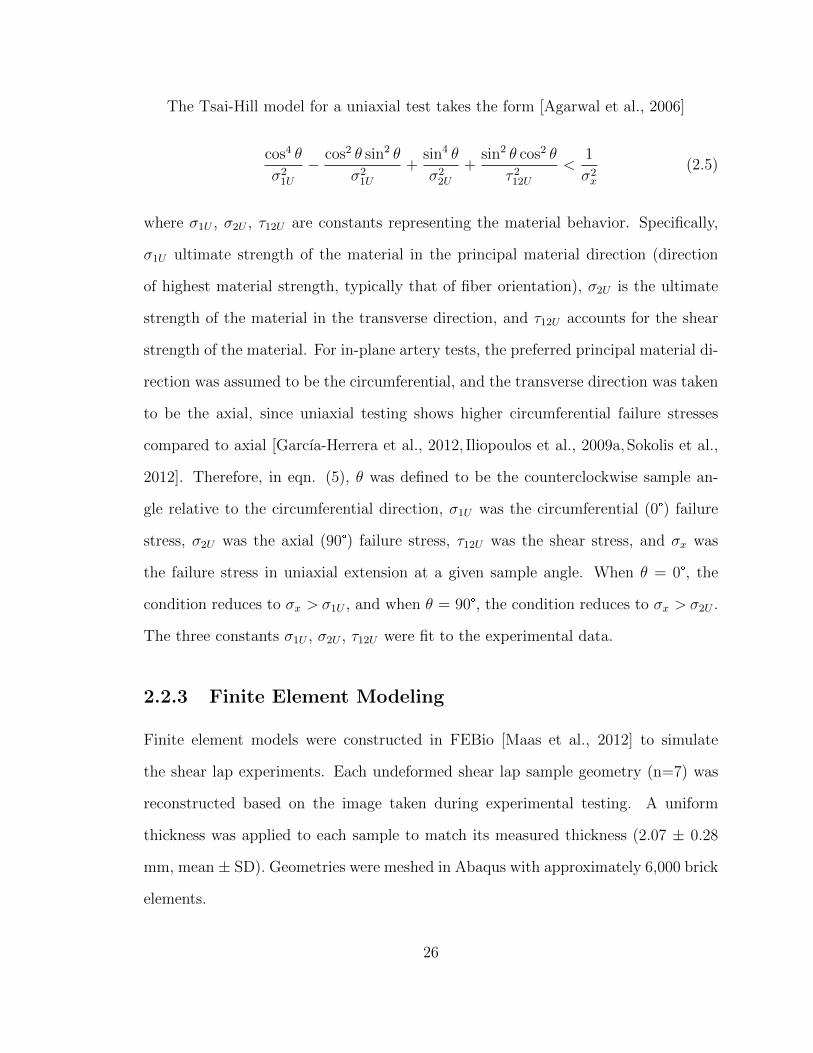
The Tsai-Hill model for a uniaxial test takes the form [Agarwal et al., 2006]
cos4 θ
σ21U
− cos2 θ sin2 θ
σ21U
+sin4 θ
σ22U
+sin2 θ cos2 θ
τ 212U<
1
σ2x
(2.5)
where σ1U , σ2U , τ12U are constants representing the material behavior. Specifically,
σ1U ultimate strength of the material in the principal material direction (direction
of highest material strength, typically that of fiber orientation), σ2U is the ultimate
strength of the material in the transverse direction, and τ12U accounts for the shear
strength of the material. For in-plane artery tests, the preferred principal material di-
rection was assumed to be the circumferential, and the transverse direction was taken
to be the axial, since uniaxial testing shows higher circumferential failure stresses
compared to axial [Garcıa-Herrera et al., 2012, Iliopoulos et al., 2009a,Sokolis et al.,
2012]. Therefore, in eqn. (5), θ was defined to be the counterclockwise sample an-
gle relative to the circumferential direction, σ1U was the circumferential (0°) failure
stress, σ2U was the axial (90°) failure stress, τ12U was the shear stress, and σx was
the failure stress in uniaxial extension at a given sample angle. When θ = 0°, the
condition reduces to σx > σ1U , and when θ = 90°, the condition reduces to σx > σ2U .
The three constants σ1U , σ2U , τ12U were fit to the experimental data.
2.2.3 Finite Element Modeling
Finite element models were constructed in FEBio [Maas et al., 2012] to simulate
the shear lap experiments. Each undeformed shear lap sample geometry (n=7) was
reconstructed based on the image taken during experimental testing. A uniform
thickness was applied to each sample to match its measured thickness (2.07 ± 0.28
mm, mean ± SD). Geometries were meshed in Abaqus with approximately 6,000 brick
elements.
26
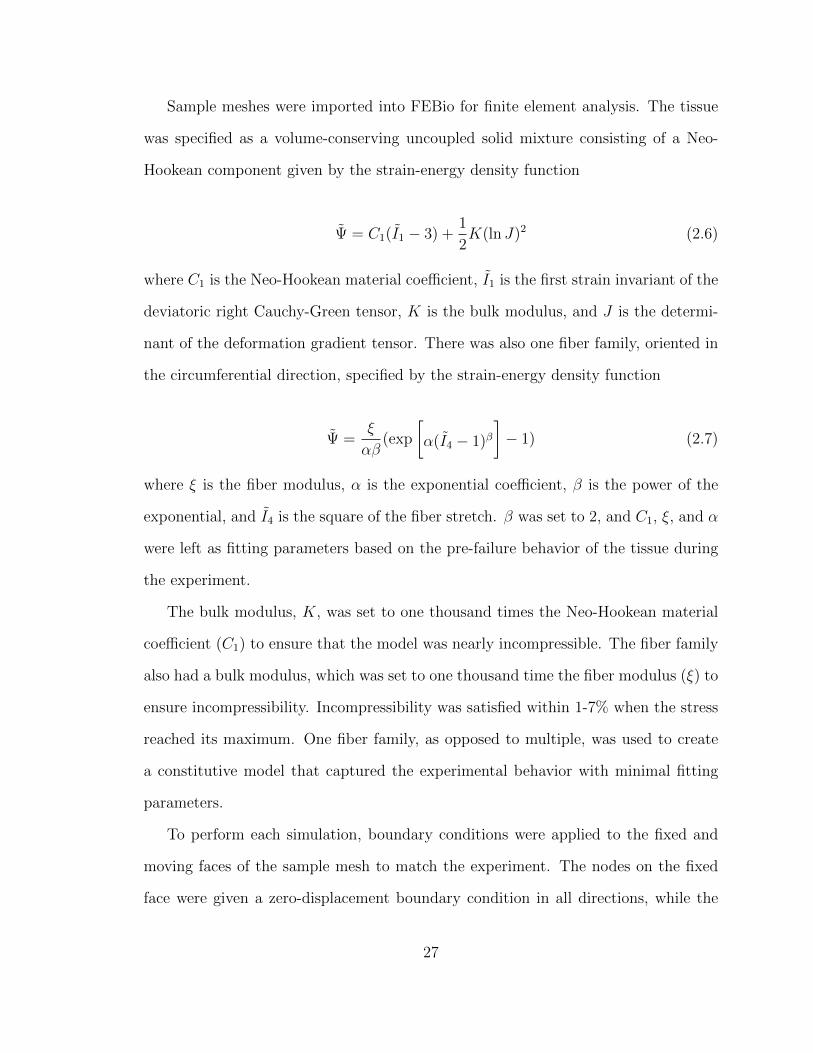
Sample meshes were imported into FEBio for finite element analysis. The tissue
was specified as a volume-conserving uncoupled solid mixture consisting of a Neo-
Hookean component given by the strain-energy density function
Ψ = C1(I1 − 3) +1
2K(ln J)2 (2.6)
where C1 is the Neo-Hookean material coefficient, I1 is the first strain invariant of the
deviatoric right Cauchy-Green tensor, K is the bulk modulus, and J is the determi-
nant of the deformation gradient tensor. There was also one fiber family, oriented in
the circumferential direction, specified by the strain-energy density function
Ψ =ξ
αβ(exp
[α(I4 − 1)β
]− 1) (2.7)
where ξ is the fiber modulus, α is the exponential coefficient, β is the power of the
exponential, and I4 is the square of the fiber stretch. β was set to 2, and C1, ξ, and α
were left as fitting parameters based on the pre-failure behavior of the tissue during
the experiment.
The bulk modulus, K, was set to one thousand times the Neo-Hookean material
coefficient (C1) to ensure that the model was nearly incompressible. The fiber family
also had a bulk modulus, which was set to one thousand time the fiber modulus (ξ) to
ensure incompressibility. Incompressibility was satisfied within 1-7% when the stress
reached its maximum. One fiber family, as opposed to multiple, was used to create
a constitutive model that captured the experimental behavior with minimal fitting
parameters.
To perform each simulation, boundary conditions were applied to the fixed and
moving faces of the sample mesh to match the experiment. The nodes on the fixed
face were given a zero-displacement boundary condition in all directions, while the
27
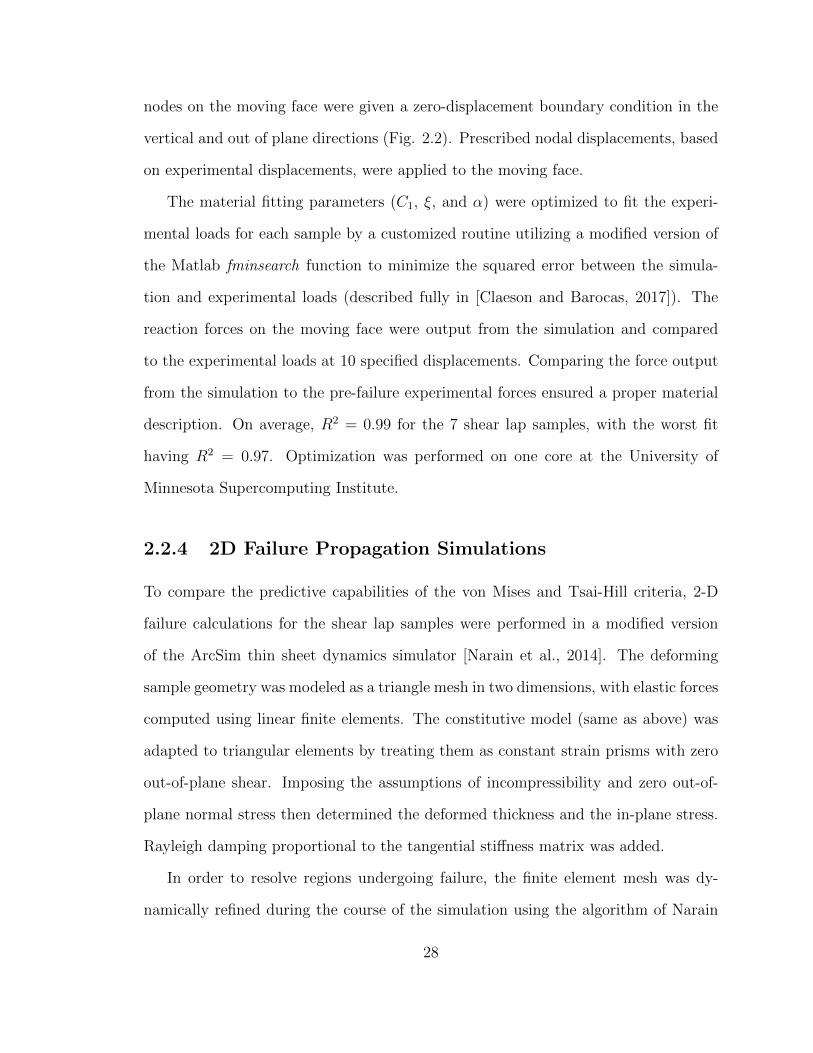
nodes on the moving face were given a zero-displacement boundary condition in the
vertical and out of plane directions (Fig. 2.2). Prescribed nodal displacements, based
on experimental displacements, were applied to the moving face.
The material fitting parameters (C1, ξ, and α) were optimized to fit the experi-
mental loads for each sample by a customized routine utilizing a modified version of
the Matlab fminsearch function to minimize the squared error between the simula-
tion and experimental loads (described fully in [Claeson and Barocas, 2017]). The
reaction forces on the moving face were output from the simulation and compared
to the experimental loads at 10 specified displacements. Comparing the force output
from the simulation to the pre-failure experimental forces ensured a proper material
description. On average, R2 = 0.99 for the 7 shear lap samples, with the worst fit
having R2 = 0.97. Optimization was performed on one core at the University of
Minnesota Supercomputing Institute.
2.2.4 2D Failure Propagation Simulations
To compare the predictive capabilities of the von Mises and Tsai-Hill criteria, 2-D
failure calculations for the shear lap samples were performed in a modified version
of the ArcSim thin sheet dynamics simulator [Narain et al., 2014]. The deforming
sample geometry was modeled as a triangle mesh in two dimensions, with elastic forces
computed using linear finite elements. The constitutive model (same as above) was
adapted to triangular elements by treating them as constant strain prisms with zero
out-of-plane shear. Imposing the assumptions of incompressibility and zero out-of-
plane normal stress then determined the deformed thickness and the in-plane stress.
Rayleigh damping proportional to the tangential stiffness matrix was added.
In order to resolve regions undergoing failure, the finite element mesh was dy-
namically refined during the course of the simulation using the algorithm of Narain
28
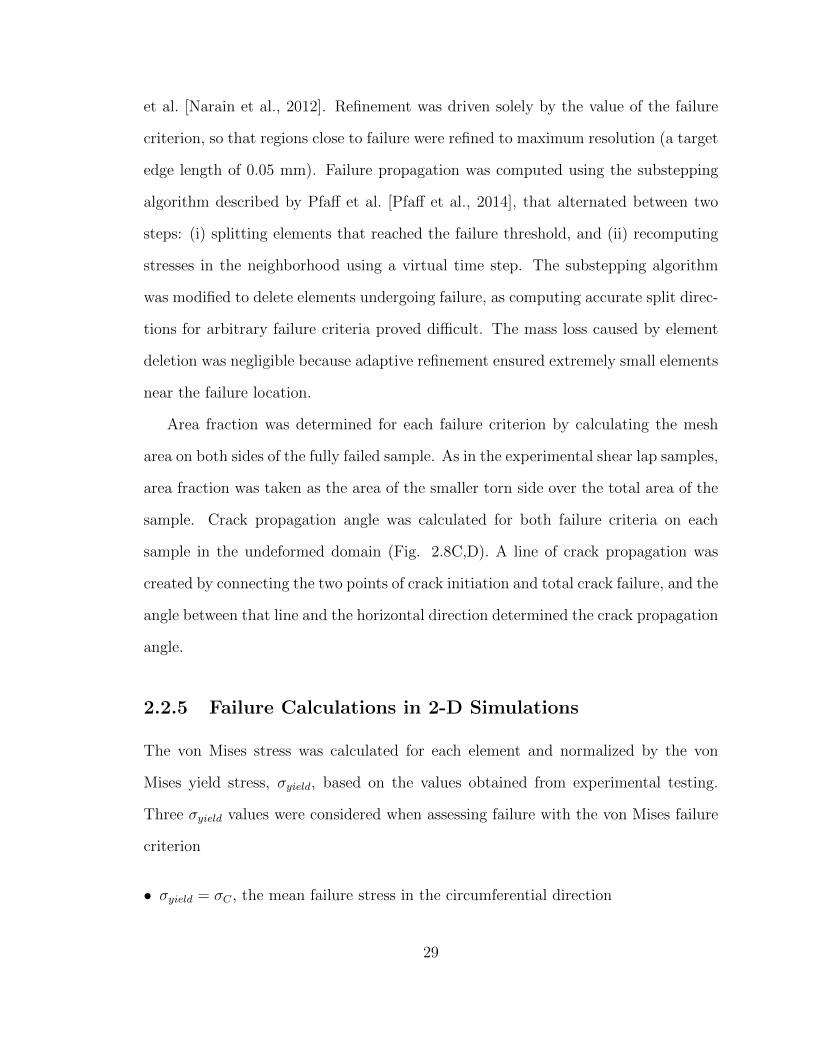
et al. [Narain et al., 2012]. Refinement was driven solely by the value of the failure
criterion, so that regions close to failure were refined to maximum resolution (a target
edge length of 0.05 mm). Failure propagation was computed using the substepping
algorithm described by Pfaff et al. [Pfaff et al., 2014], that alternated between two
steps: (i) splitting elements that reached the failure threshold, and (ii) recomputing
stresses in the neighborhood using a virtual time step. The substepping algorithm
was modified to delete elements undergoing failure, as computing accurate split direc-
tions for arbitrary failure criteria proved difficult. The mass loss caused by element
deletion was negligible because adaptive refinement ensured extremely small elements
near the failure location.
Area fraction was determined for each failure criterion by calculating the mesh
area on both sides of the fully failed sample. As in the experimental shear lap samples,
area fraction was taken as the area of the smaller torn side over the total area of the
sample. Crack propagation angle was calculated for both failure criteria on each
sample in the undeformed domain (Fig. 2.8C,D). A line of crack propagation was
created by connecting the two points of crack initiation and total crack failure, and the
angle between that line and the horizontal direction determined the crack propagation
angle.
2.2.5 Failure Calculations in 2-D Simulations
The von Mises stress was calculated for each element and normalized by the von
Mises yield stress, σyield, based on the values obtained from experimental testing.
Three σyield values were considered when assessing failure with the von Mises failure
criterion
• σyield = σC , the mean failure stress in the circumferential direction
29
• σyield = σA, the mean failure stress in the axial direction
• σyield = σavg, the overall average failure stress based on the mean failure stresses at
each sample angle
By normalizing the von Mises stress to each one of these σyield values, failure was
considered when the normalized stress in any element reached 1.
In order to evaluate the Tsai-Hill failure criterion, a modified form of (5) was
used [Agarwal et al., 2006], in which a failure metric Φ was defined,
Φ =( σ1σ1U
)2−( σ1σ1U
)( σ2σ1U
)+( σ2σ2U
)2+( τ12τ12U
)2(2.8)
where σ1U , σ2U , and τ12U are the same as previously stated, and σ1, σ2, and τ12 are
the stresses in the primary fiber, transverse, and shear directions, respectively. When
Φ reached 1, failure was predicted. The model fiber family was oriented in the 1
direction (circumferential) in the undeformed tissue (i.e., the unit fiber vector N (1)
points in the horizontal direction). Based on the deformation of each element during
the simulation, however, the fiber direction changed. Thus, to calculate the Tsai-
Hill failure metric, the Cauchy stress tensor was double-contracted with the affinely
rotated unit vectors to calculate σ1, σ2, and τ12. Specifically,
n(1)i =
FijN(1)j
‖FijN (1)j ‖
(2.9)
n(2)i =
FijN(2)j
‖FijN (2)j ‖
(2.10)
where N(1)j is the primary fiber direction in the undeformed domain, N
(2)j is the
transverse direction in the undeformed domain, Fij is the deformation gradient of the
30
element, and n(1)i , n
(2)i are the primary fiber and transverse directions in the deformed
domain, respectively. Therefore, the stress calculations were as follows,
σ1 = σijn(1)i n
(1)j (2.11)
σ2 = σijn(2)i n
(2)j (2.12)
τ12 = σijn(1)i n
(2)j (2.13)
where σij is the Cauchy stress for each element, calculated by ArcSim. Based on (8),
failure was predicted when the value of Φ in any element reached 1.
2.3 Results
Experimental testing (n > 9 for each dogbone orientation angle) showed that the
largest failure stress occurred in the circumferentially aligned tests (0°) at 2.67 ±
0.67 MPa (mean ± 95% CI), as expected based on previous studies [Witzenburg
et al., 2017, Garcıa-Herrera et al., 2012]. A decrease in failure stress was seen with
increasing sample angle to the fully axially aligned case (90°) at 1.46 ± 0.59 MPa
(Fig. 2.3). The smallest failure stress was seen in the 75° case at 1.41 ± 0.51 MPa,
but that value was not significantly lower than the failure stress at 90°. A one-way
ANOVA showed that the effect of sample angle change on the failure stress was highly
significant (p = 0.0003), and a Tukey-HSD comparison showed a significant difference
between the 0° and 90° alignment cases (p = 0.01).
The von Mises failure criterion did not fit the experimental data well, as the von
Mises stress reduces to a single value in the uniaxial case (eqn. 4). Although the
31
95% confidence interval range encompassed most of the failure stresses when using
σyield = σavg = 1.87 MPa (Fig. 2.4A), the von Mises criterion could not capture the
anisotropic response of the tissue. The data were also not fit when using both σyield
= σC = 2.67 MPa and σyield = σA = 1.46 MPa. The Tsai-Hill model (eqn. 5), in
contrast, showed an excellent fit to the experimental data (R2 = 0.986, Fig. 2.4B).
Fitting the model provided σ1U = 2.71 ± 0.19 MPa (mean ± 95% CI) , σ2U = 1.40
± 0.14 MPa, and τ12U = 1.04 ± 0.12 MPa.
The shear lap samples (n = 7) all exhibited nonlinear behavior until failure (Fig.
2.1D). Digital image correlation showed a large amount of shear strain (∼40%) in the
overlap region of the sample (Fig. 2.5). The onset of tissue failure was calculated to
occur at an average displacement of 19.73 ± 1.03 mm (mean ± 95% CI) and load of
3.14 ± 0.22 N, and the total failure of the tissue occurred at an average displacement
of 21.53 ± 0.89 mm and load of 3.77 ± 0.33 N. Experimental shear lap samples failed
in two different manners: 1) failure began on the arm near the overlap region and
propagated into the overlap region of the sample until the sample failed (deemed “lap
across” failure, Fig. 2.6B) and 2) failure began on the arm near the overlap region of
the sample and propagated towards the overlap region, but ultimately the arm ripped
off and failure did not occur in the overlap region (“lap arm” failure, Fig. 2.8A). 4
experimental samples experienced lap across failure, while 3 samples experienced lap
arm failure. The crack propagation angle was calculated to be 28.13°± 9.13° (mean
± 95%CI) relative to horizontal (Fig. 2.9), and the area fraction was calculated as
0.33 ± 0.52 (mean ± 95%CI, Fig. 2.7).
Failure simulations exhibited both types of failure (lap across and lap arm) seen
experimentally, along with another, where failure began in the sample arm far away
from the overlap region and propagated vertically, only in the arm region (“arm”
failure, Fig. 2.6D, Fig. 2.8D). The von Mises failure propagation simulations (σyield
32
= σavg) predicted arm failure for all 7 samples. The crack propagation angle was
calculated as 80.50°± 6.52° (mean ± 95%CI, Fig. 2.9) and the area fraction was
calculated as 0.09 ± 0.06 (Fig. 2.7). The Tsai-Hill failure propagation simulations
predicted 1 lap across failure, 4 lap arm failures, and 2 arm failures. The crack
propagation angle was 59.86°± 14.57° (mean ± 95%CI, Fig. 9) and the area fraction
was 0.16 ± 0.06 (Fig. 2.7).
Both the von Mises and Tsai-Hill failure criteria severely underpredicted the
amount of displacement needed to produce initial failure in the samples. The von
Mises failure criterion (σyield = σavg) predicted the onset of failure at 11.97 ± 0.94
mm (mean ± 95%CI) of displacement, and the Tsai-Hill failure criterion predicted
the onset of failure at 11.86 ± 0.85 mm.
2.4 Discussion
Our results indicate that an isotropic failure criterion, such as the von Mises criterion,
is not acceptable when assessing anisotropic tissues. Although the von Mises stress
is convenient for visualization of finite element results, one must recognize that the
anisotropy of the tissue is not addressed by the von Mises stress. Furthermore, tissues
undergo complex loading situations that are unknown a priori, so it is unclear which
von Mises yield stress to select for a given tissue. As a result, reporting the von Mises
stress risks leading to conclusions that are at best quantitatively inaccurate and at
worst misleading or outright wrong when tissue failure is being considered.
The degree of anisotropy in failure mechanics of the aortic wall is highly variable
across studies, with different results arising for abdominal vs. thoracic aorta and
for healthy vs. aneurysmal tissue [Vorp et al., 2003,Witzenburg et al., 2017,Garcıa-
Herrera et al., 2012, Mohan and Melvin, 1983, Kim et al., 2012, Teng et al., 2015,
33
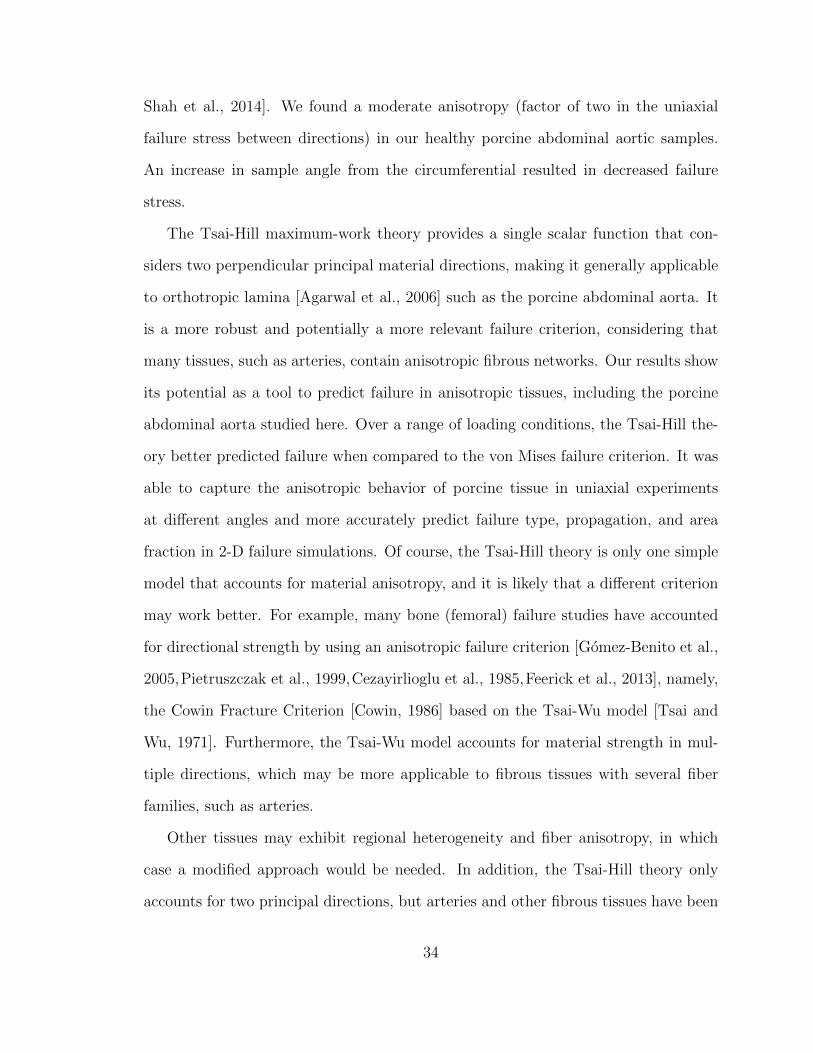
Shah et al., 2014]. We found a moderate anisotropy (factor of two in the uniaxial
failure stress between directions) in our healthy porcine abdominal aortic samples.
An increase in sample angle from the circumferential resulted in decreased failure
stress.
The Tsai-Hill maximum-work theory provides a single scalar function that con-
siders two perpendicular principal material directions, making it generally applicable
to orthotropic lamina [Agarwal et al., 2006] such as the porcine abdominal aorta. It
is a more robust and potentially a more relevant failure criterion, considering that
many tissues, such as arteries, contain anisotropic fibrous networks. Our results show
its potential as a tool to predict failure in anisotropic tissues, including the porcine
abdominal aorta studied here. Over a range of loading conditions, the Tsai-Hill the-
ory better predicted failure when compared to the von Mises failure criterion. It was
able to capture the anisotropic behavior of porcine tissue in uniaxial experiments
at different angles and more accurately predict failure type, propagation, and area
fraction in 2-D failure simulations. Of course, the Tsai-Hill theory is only one simple
model that accounts for material anisotropy, and it is likely that a different criterion
may work better. For example, many bone (femoral) failure studies have accounted
for directional strength by using an anisotropic failure criterion [Gomez-Benito et al.,
2005,Pietruszczak et al., 1999,Cezayirlioglu et al., 1985,Feerick et al., 2013], namely,
the Cowin Fracture Criterion [Cowin, 1986] based on the Tsai-Wu model [Tsai and
Wu, 1971]. Furthermore, the Tsai-Wu model accounts for material strength in mul-
tiple directions, which may be more applicable to fibrous tissues with several fiber
families, such as arteries.
Other tissues may exhibit regional heterogeneity and fiber anisotropy, in which
case a modified approach would be needed. In addition, the Tsai-Hill theory only
accounts for two principal directions, but arteries and other fibrous tissues have been
34
characterized by four or more fiber families [Humphrey and Yin, 1987] and/or a
continuous fiber distribution [Gasser et al., 2006, Cortes et al., 2010, Sacks, 2003],
so a more extensive model could be explored. Furthermore, the Tsai-Hill theory
is 2-dimensional, and would require significant experimental effort to expand to 3
dimensions, as extensive material characterization in 3 dimensions would be required.
2-dimensional restrictions currently limit the potential application of the Tsai-Hill
theory to complex 3-dimensional failure problems, such as aortic aneurysms, in which
failure mechanisms are clearly 3-dimensional [Witzenburg et al., 2017,Pal et al., 2014,
Sommer et al., 2008].
In our uniaxial experiments, the minimum failure stress occurred at an angle of
75° from the preferred direction, but that failure stress was not significantly different
from the failure stress at 90° (p > 0.5). The Tsai-Hill criterion can support a non-
monotonic failure-angle relation, as is often seen in synthetic fiber composites [Agar-
wal et al., 2006]. Whether the minimum at 75° was real or noise, and whether other
tissues do or do not exhibit a local minimum in failure stress, are questions that merit
further exploration.
The assumption of constant failure through the thickness of the shear lap samples
and the use of a 2-dimensional failure code are questionable and likely incorrect. Fur-
thermore, the constitutive equation is rather simplistic, the optimization only fit the
forces on the moving face of the experimental sample, and no strain field data were
used to help optimize constitutive parameters [Nagel et al., 2014]. An inadequate
constitutive model most likely resulted in an inaccurate stress field, which may have
contributed to the incorrect failure prediction results. The use of alternative con-
stitutive models (i.e. the Holzapfel-Gasser-Ogden model [Gasser et al., 2006] or the
four-fiber family model [Baek et al., 2007]) may prove more effective. The underpre-
diction of displacement may be due to the extreme non-linearity of the exponentials,
35
leading to artificially high stresses as the strains increase, and a constitutive model
which incorporates plasticity could potentially address this issue. The material was
also treated as perfectly elastic, resulting in brittle failure. Furthermore, the von
Mises and Tsai-Hill failure criteria do not address the idea of crack initiation and
propagation in their formulation, which may be the main factor contributing to in-
adequate model predictions. These assumptions are the most likely causes for the
limited ability of the models to accurately predict the displacement at the onset of
failure, crack initiation, and crack propagation for all experimental samples.
It should also be noted that the use of a particular stress or failure criterion is
dependent upon the objectives of a given study. Often, there is sufficient reasoning
for using the von Mises stress when analyzing anisotropic tissues, such as comparing
different tissue types, where the importance of comparison outweighs the need for
accuracy; the von Mises failure criterion captures the failure behavior of porcine
abdominal aorta with relatively mild error (Fig. 2.4A), which may meet the needs
of a specific study. It is also often the case that extensive material strength data for
anisotropic tissues are not readily available. Furthermore, available resources and the
complexity of certain problems require computational simplifications, as in the case of
large geometries comprised of multiple types of materials, in which case the von Mises
stress would be better suited. Even in those cases, however, it is essential to recognize
that if the tissue is anisotropic, its failure behavior will surely be anisotropic, and an
isotropic failure criterion may be misleading.
Tissue failure is a very complex process, as demonstrated by experimental work
[Vorp et al., 2003, Tong et al., 2016] and microstructural theory [Witzenburg et al.,
2017,Pal et al., 2014,Balakhovsky et al., 2014]. Accurately characterizing tissue fail-
ure requires an adequate understanding of tissue behavior, particularly in relation to
directional material strength and failure methods. Ignoring well-known tissue prop-
36

erties that contribute to failure (e.g., the mechanical anisotropy explored here) yields
incorrect assessments, and ultimately limits the potential use of failure-predicting
tools in applications such as patient diagnosis.
2.5 Acknowledgment
This material is based upon work supported by the National Science Foundation Grad-
uate Research Fellowship Program under Grant No. 00039202 (CEK). Any opinions,
findings, and conclusions or recommendations expressed in this material are those of
the author(s) and do not necessarily reflect the views of the National Science Founda-
tion. This work was supported by the National Institutes of Health (R01EB005813),
and CEK is a recipient of the Richard Pyle Scholar Award from the ARCS Foundation.
Tissue was provided by the Visible Heart Laboratory at the University of Minnesota.
The authors acknowledge the Minnesota Supercomputing Institute (MSI) at the Uni-
versity of Minnesota for providing resources that contributed to the research results
reported within this paper. We also gratefully acknowledge the assistance of Vahhab
Zarei and Jacob Solinksy.
37
Figure 2.1: A. Outlines of dogbone sample geometries are shown along the axiallength of the vessel (not drawn to scale). Angles were taken to be relative to thecircumferential orientation (0o). Scale bar shown in white. B. A representativestress-stretch curve for one uniaxial sample, with corresponding tissue images duringtesting. C. Outline of the shear lap sample geometry (not drawn to scale). D. Arepresentative force-displacement curve for one shear lap sample. Failure initiatednear the overlap region of the sample and propagated across the overlap region (lapacross failure).
38

Figure 2.2: Finite element mesh for one shear lap sample with applied boundaryconditions. The nodes on the right face were fixed in all directions, while the nodeson the left face were fixed in the vertical and out of plane directions, and givenprescribed displacements based on the experiment.
39
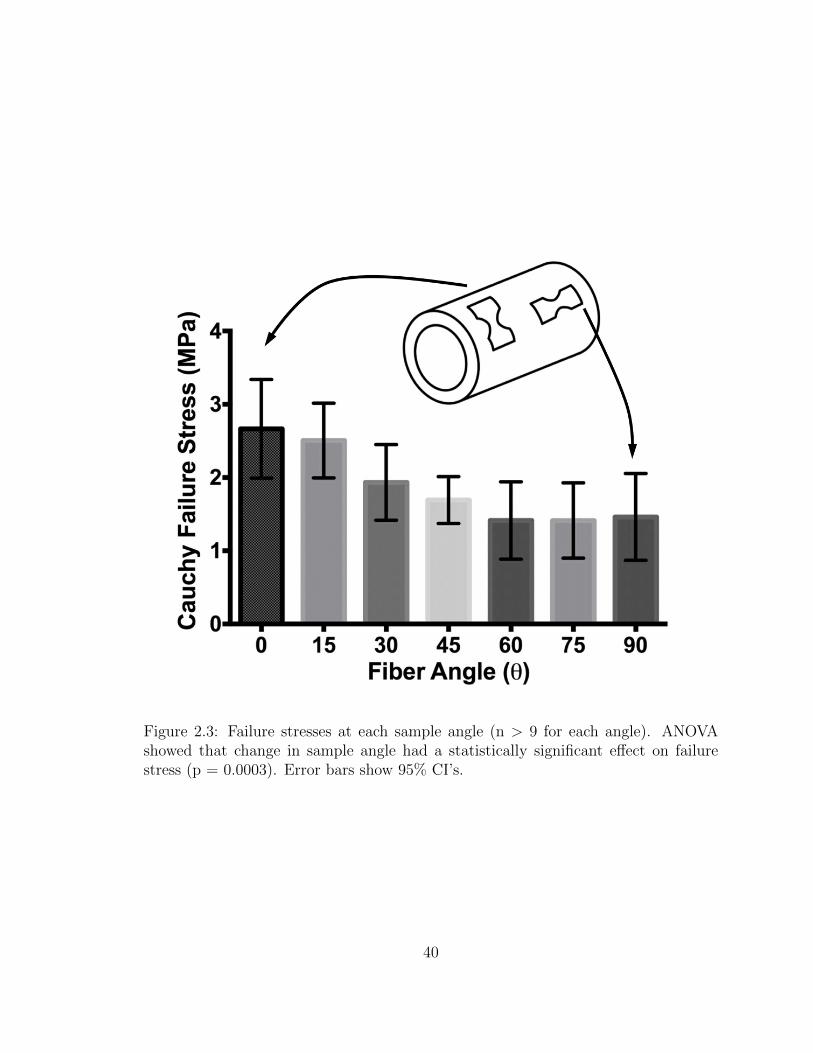
Figure 2.3: Failure stresses at each sample angle (n > 9 for each angle). ANOVAshowed that change in sample angle had a statistically significant effect on failurestress (p = 0.0003). Error bars show 95% CI’s.
40
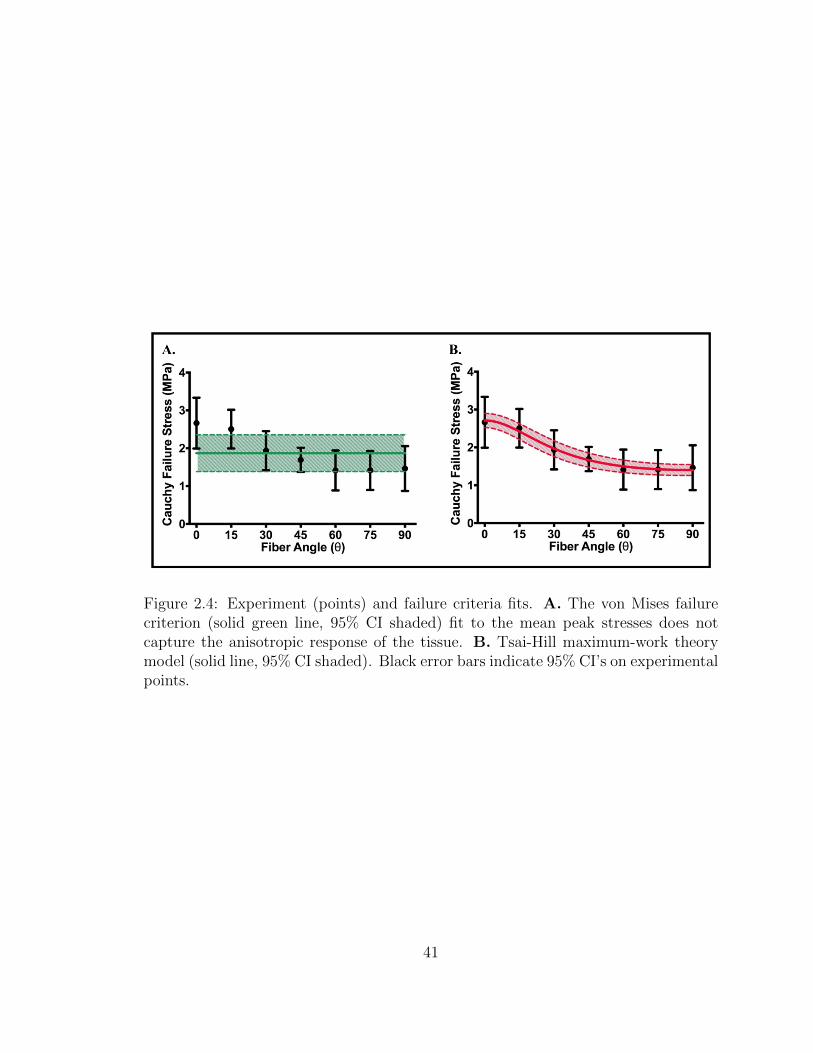
Figure 2.4: Experiment (points) and failure criteria fits. A. The von Mises failurecriterion (solid green line, 95% CI shaded) fit to the mean peak stresses does notcapture the anisotropic response of the tissue. B. Tsai-Hill maximum-work theorymodel (solid line, 95% CI shaded). Black error bars indicate 95% CI’s on experimentalpoints.
41
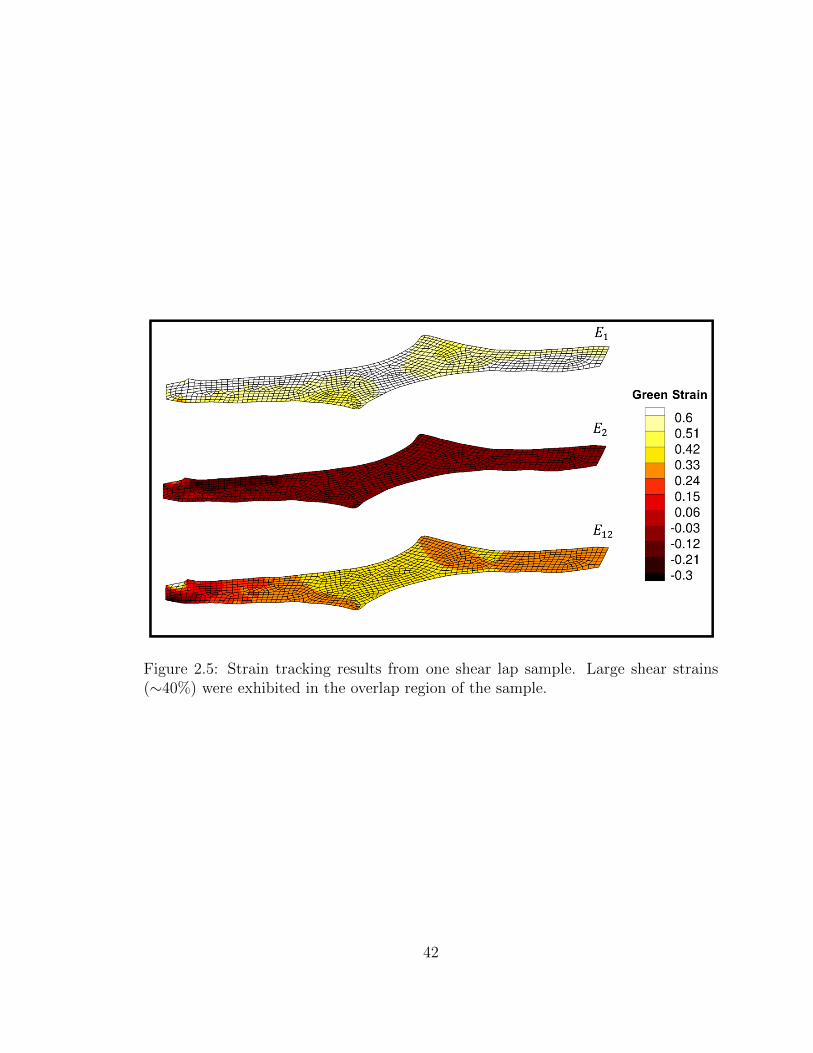
Figure 2.5: Strain tracking results from one shear lap sample. Large shear strains(∼40%) were exhibited in the overlap region of the sample.
42
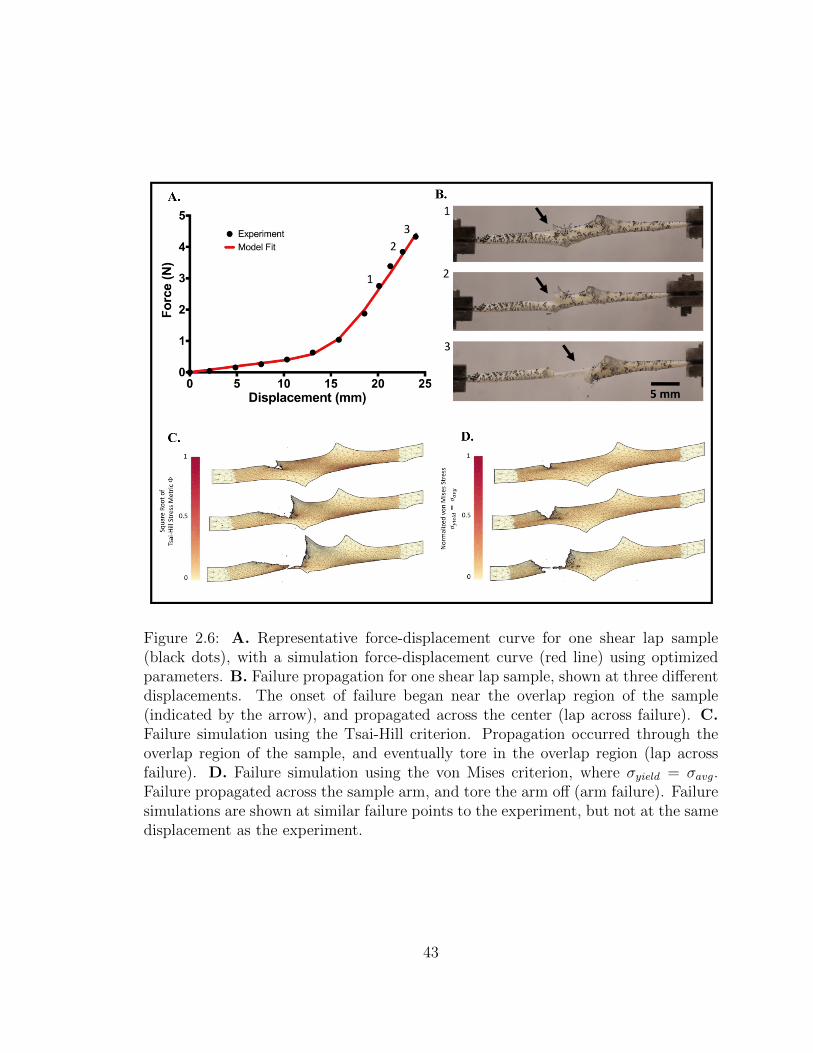
Figure 2.6: A. Representative force-displacement curve for one shear lap sample(black dots), with a simulation force-displacement curve (red line) using optimizedparameters. B. Failure propagation for one shear lap sample, shown at three differentdisplacements. The onset of failure began near the overlap region of the sample(indicated by the arrow), and propagated across the center (lap across failure). C.Failure simulation using the Tsai-Hill criterion. Propagation occurred through theoverlap region of the sample, and eventually tore in the overlap region (lap acrossfailure). D. Failure simulation using the von Mises criterion, where σyield = σavg.Failure propagated across the sample arm, and tore the arm off (arm failure). Failuresimulations are shown at similar failure points to the experiment, but not at the samedisplacement as the experiment.
43
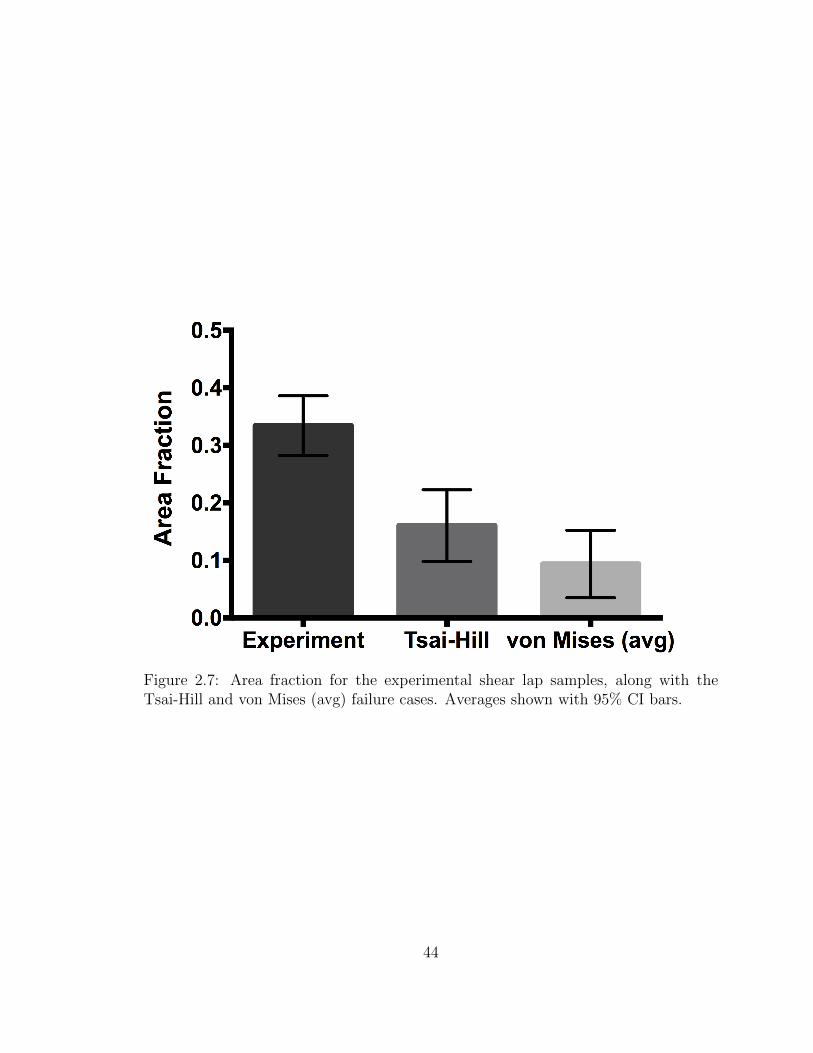
Figure 2.7: Area fraction for the experimental shear lap samples, along with theTsai-Hill and von Mises (avg) failure cases. Averages shown with 95% CI bars.
44
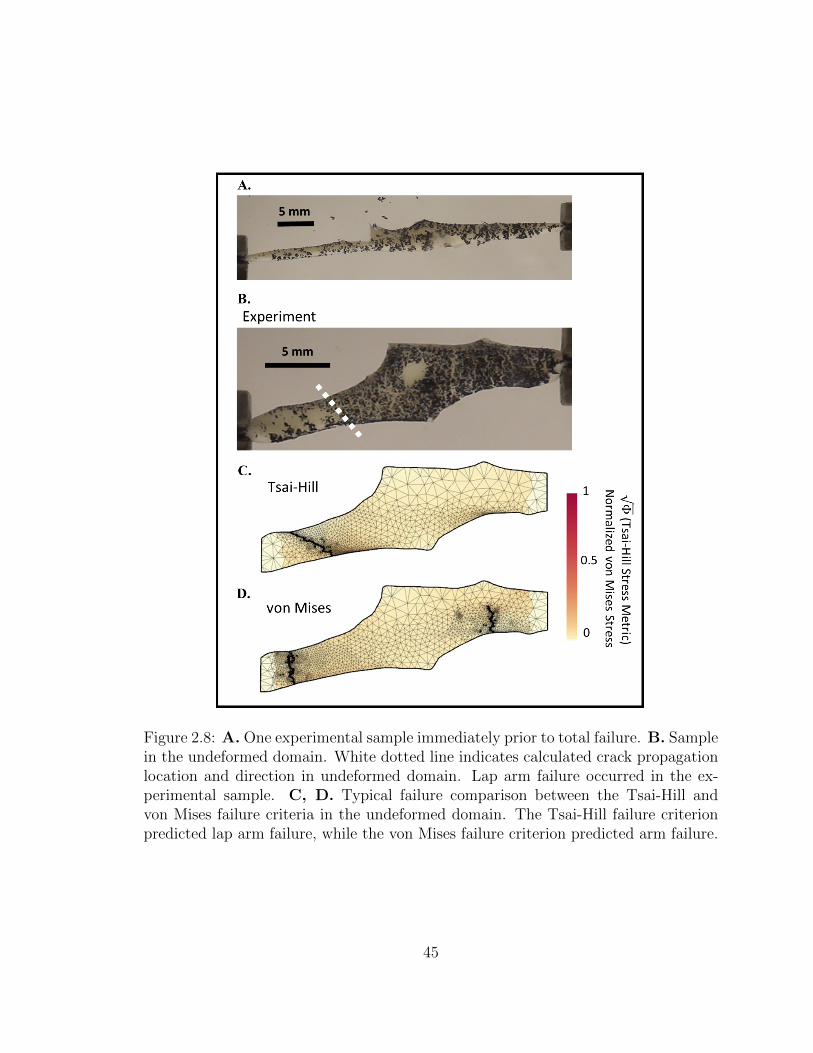
Figure 2.8: A. One experimental sample immediately prior to total failure. B. Samplein the undeformed domain. White dotted line indicates calculated crack propagationlocation and direction in undeformed domain. Lap arm failure occurred in the ex-perimental sample. C, D. Typical failure comparison between the Tsai-Hill andvon Mises failure criteria in the undeformed domain. The Tsai-Hill failure criterionpredicted lap arm failure, while the von Mises failure criterion predicted arm failure.
45
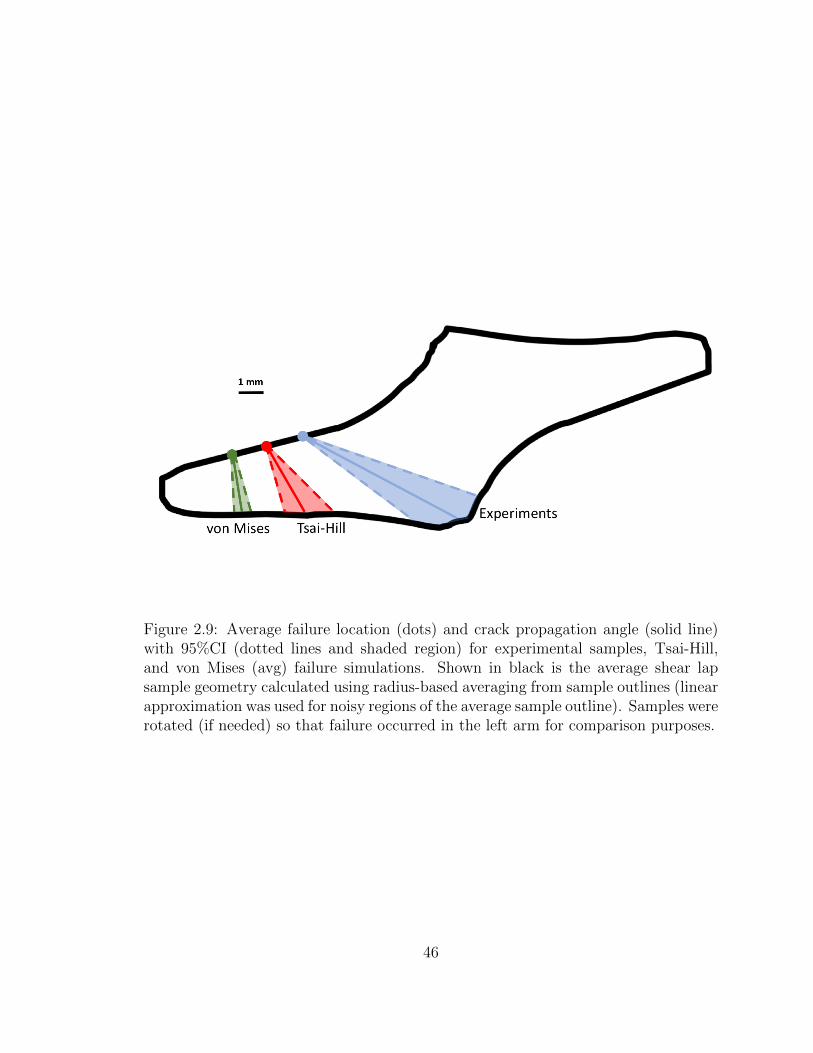
Figure 2.9: Average failure location (dots) and crack propagation angle (solid line)with 95%CI (dotted lines and shaded region) for experimental samples, Tsai-Hill,and von Mises (avg) failure simulations. Shown in black is the average shear lapsample geometry calculated using radius-based averaging from sample outlines (linearapproximation was used for noisy regions of the average sample outline). Samples wererotated (if needed) so that failure occurred in the left arm for comparison purposes.
46
Chapter 3
Effects of Collagen Heterogeneity
on Myocardial Infarct Mechanics in
a Multiscale Fiber Network Model
The content of this chapter was submitted as a research article to the Journal
of Biomechanical Engineering by Korenczuk, Barocas, and Richardson [Korenczuk,
Christopher et al., 2019], and is currently under review. My contribution to the
work related to image processing to extract fiber orientations and generate fiber net-
works, along with completing the multiscale modeling simulations, data processing,
and writing.
3.1 Introduction
Each year, nearly 1 million Americans experience a myocardial infarction (MI),
wherein a region of myocardial ischemia results in cardiomyocyte death and sub-
sequent replacement by collagenous scar tissue [Benjamin et al., 2018]. Past work
47
has shown that the mechanical properties of the resulting scar are important for
determining long-term cardiac function and risk for post-MI complications such as
cardiac rupture and heart failure [Clarke et al., 2016, Richardson et al., 2015]. As
is the case for many collagenous tissues, the particular mechanical properties of MI
scar are largely determined by the underlying structure of its primary matrix com-
ponent - collagen fibers. Therefore, many studies have extensively measured healing
infarcts for global properties such as bulk collagen density, cross-linking, orienta-
tion, and alignment [Jugdutt et al., 1996,McCormick et al., 2017,Zimmerman et al.,
2001, Holmes et al., 1997, Fomovsky et al., 2012b, Fomovsky et al., 2012a, Fomovsky
and Holmes, 2009]. Recently, we also assessed localized variations in collagen struc-
tures and found stark spatial heterogeneities of fiber orientations [Richardson and
Holmes, 2016]. Specifically, collagen fibers from rat infarct scar samples displayed
high alignment within small sub-regions (∼250 x 250 µm), but the orientation of
those fibers varied greatly from sub-region to sub-region such that the global align-
ment for the bulk scar appeared more random.
Structural heterogeneity has been observed in a variety of tissues including heart
valves, facet capsular ligaments, aortic aneurysms, and tendon-to-bone insertion
points [Joyce et al., 2009, Ban et al., 2017, Thomopoulos et al., 2003, Hurks et al.,
2012]. Aneurysms, for example, exhibit significant variation in matrix and cellular
compositions around the circumferential direction, which is consistent with similar
spatial variation in matrix protease activity and spatial variation in the tensile mod-
uli and strengths of aneurysm samples taken from different regions [Hurks et al.,
2012, Gilling-Smith et al., 2005]. From a mechanical perspective, fiber heterogene-
ity could likely alter how infarct scar material redistributes stress and strain under
loading, potentially giving rise to stress/strain concentrations, failure points, altered
apparent stiffness, and/or altered degrees of anisotropy. Thus, the objective of the
48
current study was to test the effects of collagen fiber orientation heterogeneity on
both local and global mechanical responses of infarct scar tissue. Herein, we applied
a previously-published, computational model of multiscale fiber network mechanics
to explore the mechanical responses of subject-specific scar orientation maps obtained
from rat MI tissue sections.
3.2 Methods
3.2.1 Fiber Map Generation from Scar Samples
In a previously reported study, Fomovsky and Holmes obtained scar samples from
healing rats at 1, 2, 3, and 6 weeks after permanent coronary artery ligation [Fomovsky
and Holmes, 2009]. Upon sacrifice of each animal, they arrested and excised the
rat hearts, then sectioned samples (7µm thick) in parallel to the epicardial plane,
and stained collagen fibers with picrosirius red. In a follow-up study, we previously
imaged a selection of those mid-wall sections under 20X magnification with automated
stitching (Aperio ScanScope), and used a gradient-based image processing method
(MatFiber, code freely available at http://bme.virginia.edu/holmes, and implemented
in MATLAB) to generate collagen orientation maps for each sample (Fig. 3.1A)
[Richardson and Holmes, 2016].
Due to sectioning artifacts in the samples, tissue was not present in some areas,
leading to gaps in the raw fiber maps (Fig. 3.1B). To fill the entirety of the tissue
geometry and prepare the sample for our finite-element simulations, the 2D outline
of each tissue piece was traced, extruded into 3D, and then meshed with roughly
600 hexahedral elements to create a finite-element mesh of the tissue sample (Fig.
3.1C). Each sample had an extruded thickness of 0.25mm, to represent a myocardial
tissue slab of uniform thickness. A linear interpolation was performed on the 2D fiber
49

orientation scatter data to produce a full fiber orientation map for the entire sample
within the finite-element mesh (Fig. 3.1C). After the image analysis, a fiber-based
multiscale finite element model was generated and solved (Fig. 3.1D) as described in
the next section.
3.2.2 Fiber Network Model Generation
Three different types of networks (Fig. 3.2) were created to compare the effects of
network orientation:
1. The same isotropic network used for every element (the isotropic case, Fig.
3.2A)
2. The same aligned network used for every element, where the network was aligned
in the average fiber direction (θ) for the whole sample with the average degree
of alignment (α) (the homogeneous case, Fig. 3.2B)
3. Differently aligned networks for each finite element (the heterogeneous case, Fig.
3.2C).
Networks were comprised of collagen fibers defined by the constitutive relation
F =EA
B(e(B∗εG) − 1) (3.1)
where F was fiber force, E was fiber modulus, A was fiber cross-sectional area, B
was fiber nonlinearity, and εG was the fiber green strain. Each fiber also had a
critical failure stretch, λf , where the fiber failed if it exceeded the critical stretch, and
was removed from the network by reducing its modulus 10 orders of magnitude. A
neo-Hookean component was also included in parallel to collagen fibers, resembling
nonfibrous material. Collagen fiber parameters were based on previous values used
50
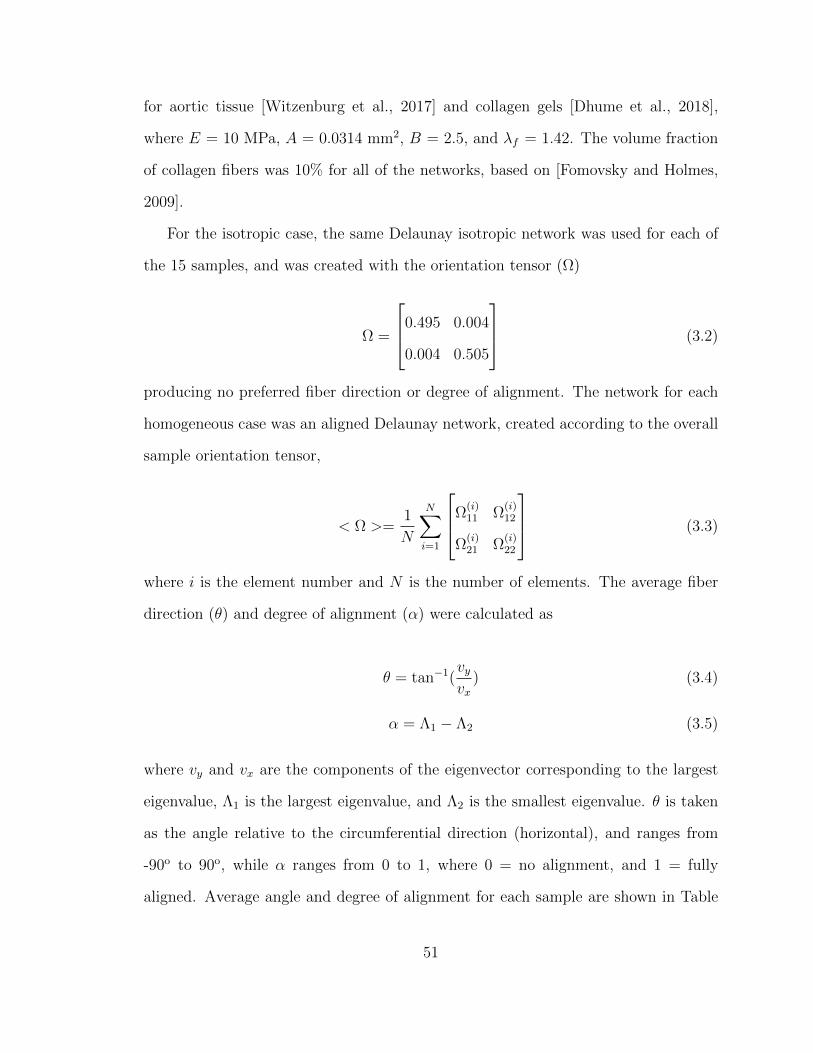
for aortic tissue [Witzenburg et al., 2017] and collagen gels [Dhume et al., 2018],
where E = 10 MPa, A = 0.0314 mm2, B = 2.5, and λf = 1.42. The volume fraction
of collagen fibers was 10% for all of the networks, based on [Fomovsky and Holmes,
2009].
For the isotropic case, the same Delaunay isotropic network was used for each of
the 15 samples, and was created with the orientation tensor (Ω)
Ω =
0.495 0.004
0.004 0.505
(3.2)
producing no preferred fiber direction or degree of alignment. The network for each
homogeneous case was an aligned Delaunay network, created according to the overall
sample orientation tensor,
< Ω >=1
N
N∑i=1
Ω(i)11 Ω
(i)12
Ω(i)21 Ω
(i)22
(3.3)
where i is the element number and N is the number of elements. The average fiber
direction (θ) and degree of alignment (α) were calculated as
θ = tan−1(vyvx
) (3.4)
α = Λ1 − Λ2 (3.5)
where vy and vx are the components of the eigenvector corresponding to the largest
eigenvalue, Λ1 is the largest eigenvalue, and Λ2 is the smallest eigenvalue. θ is taken
as the angle relative to the circumferential direction (horizontal), and ranges from
-90o to 90o, while α ranges from 0 to 1, where 0 = no alignment, and 1 = fully
aligned. Average angle and degree of alignment for each sample are shown in Table
51
3.1. The heterogenous networks were created according to the orientation tensor and
degree of alignment for each element, Ω(i) and α(i), where Ω is of the same form as
the homogeneous case, created by averaging over the space of each individual finite
element instead of the entire sample. Thus, the heterogeneous case contains differing
local angles and degrees of alignment for each element, but on average has the same
overall preferred fiber direction and degree of alignment as the homogeneous case.
3.2.3 Model Simulations
A custom multiscale finite-element model [Witzenburg et al., 2017,Dhume et al., 2018]
was used to simulate each sample (n = 15) in uniform biaxial extension by displacing
the boundary nodes of the mesh outward (Fig. 3.1D), with no shear stress on the
boundaries. Results were considered at 20% strain to allow for comparison among
all samples, as this was the maximum strain reached prior to failure in one sample.
Simulations were run on 256-core parallel processors at the University of Minnesota
Supercomputing Institute.
3.2.4 Statistics
Paired t-tests were performed (Graphpad, Prism 6) on the homogeneous and hetero-
geneous data to compare results, as the differences between these two groups is of
primary concern. A linear regression was performed on the homogeneous and hetero-
geneous data to determine the strength of trends for the anisotropy ratio and peak
stress in the sample.
52
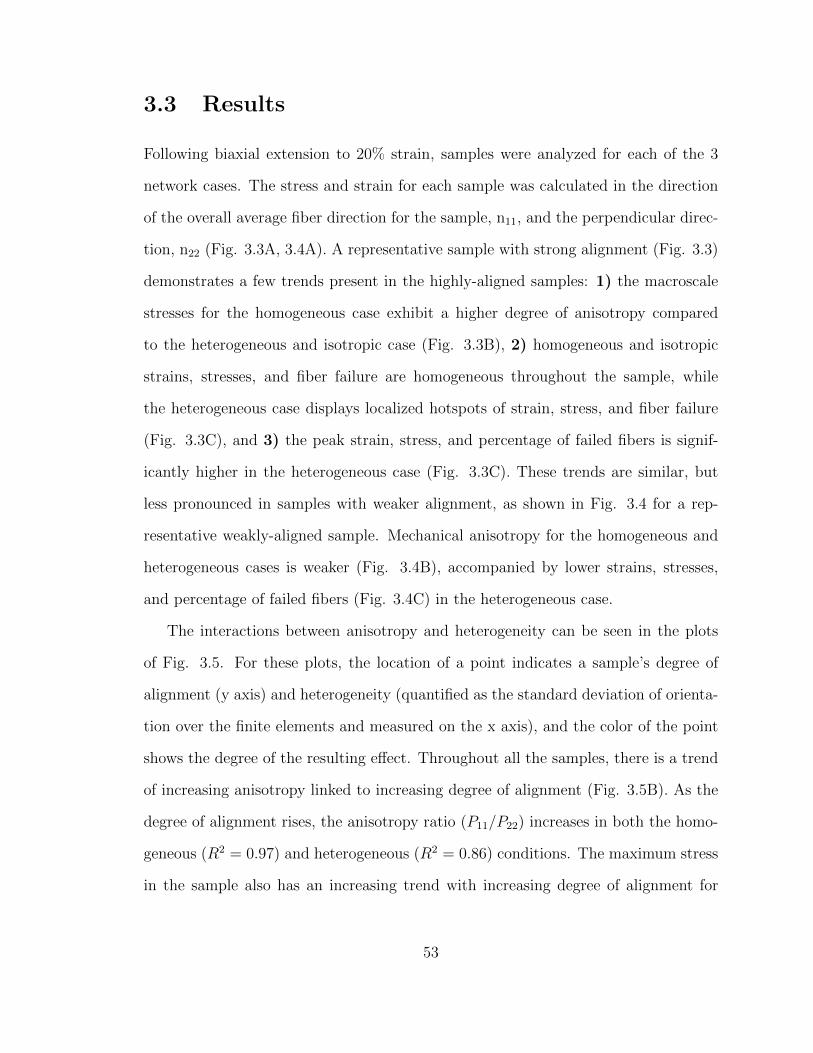
3.3 Results
Following biaxial extension to 20% strain, samples were analyzed for each of the 3
network cases. The stress and strain for each sample was calculated in the direction
of the overall average fiber direction for the sample, n11, and the perpendicular direc-
tion, n22 (Fig. 3.3A, 3.4A). A representative sample with strong alignment (Fig. 3.3)
demonstrates a few trends present in the highly-aligned samples: 1) the macroscale
stresses for the homogeneous case exhibit a higher degree of anisotropy compared
to the heterogeneous and isotropic case (Fig. 3.3B), 2) homogeneous and isotropic
strains, stresses, and fiber failure are homogeneous throughout the sample, while
the heterogeneous case displays localized hotspots of strain, stress, and fiber failure
(Fig. 3.3C), and 3) the peak strain, stress, and percentage of failed fibers is signif-
icantly higher in the heterogeneous case (Fig. 3.3C). These trends are similar, but
less pronounced in samples with weaker alignment, as shown in Fig. 3.4 for a rep-
resentative weakly-aligned sample. Mechanical anisotropy for the homogeneous and
heterogeneous cases is weaker (Fig. 3.4B), accompanied by lower strains, stresses,
and percentage of failed fibers (Fig. 3.4C) in the heterogeneous case.
The interactions between anisotropy and heterogeneity can be seen in the plots
of Fig. 3.5. For these plots, the location of a point indicates a sample’s degree of
alignment (y axis) and heterogeneity (quantified as the standard deviation of orienta-
tion over the finite elements and measured on the x axis), and the color of the point
shows the degree of the resulting effect. Throughout all the samples, there is a trend
of increasing anisotropy linked to increasing degree of alignment (Fig. 3.5B). As the
degree of alignment rises, the anisotropy ratio (P11/P22) increases in both the homo-
geneous (R2 = 0.97) and heterogeneous (R2 = 0.86) conditions. The maximum stress
in the sample also has an increasing trend with increasing degree of alignment for
53

the homogeneous case (R2 = 0.96, Fig. 3.5C). There was no trend, however, related
to the peak stress experienced in the sample with increasing degree of alignment for
the heterogeneous case (R2 = 0.03, Fig. 3.5C). When considering fiber failure, the
heterogeneous case consistently required less strain (22.2% ± 0.79%, mean ± 95%
CI) to initiate failure in the sample compared to homogeneous (31.4%± 1.27%) and
isotropic (32%± 0%) cases (Fig. 3.5D).
When pooling all samples and comparing differences between the network cases,
the heterogeneous condition exhibited a significant difference in maximum strain (Fig.
3.6A) and stress (Fig. 3.6B) compared to the isotropic and homogeneous conditions.
The isotropic and homogeneous cases showed a similar maximum strain, but the ho-
mogeneous case displayed higher peak stress than the isotropic case. As seen above,
the homogeneous and heterogeneous cases present higher anisotropy compared to the
isotropic case, with the homogeneous case showing a trend of higher anisotropy com-
pared to the heterogeneous case (Fig. 3.6C). Furthermore, fiber failure is overwhelm-
ingly more present in the heterogeneous case, exhibiting higher total fibers failed (Fig.
3.6D), percentage of elements with failed fibers (Fig. 3.6E), and percentage of fibers
failed within the worst element (Fig. 3.6F) compared to the homogeneous case which
has limited fiber failure at 20% strain. The isotropic case experienced no fiber failure
in any elements at 20% strain.
Overall, the results show that fiber heterogeneity vastly affects the mechanical
behavior of the tissue on the macroscopic level. Despite the same average fiber direc-
tion and degree of alignment in the homogeneous and heterogeneous cases, the results
show a decrease in anisotropy for the heterogeneous case, joined by an increase in lo-
cal peak strains, stress, and fiber failure. These localized events of high strain, stress,
and fiber failure within the heterogeneous samples emphasize the notion that over-
all tissue behavior (and thus, tissue failure), is highly dependent on the underlying
54
fibrous structure.
3.4 Discussion
3.4.1 Heterogeneous Collagen Structure Produces Heteroge-
neous Stresses and Strains
After an MI, ischemic myocardium is infiltrated by a swift and large inflammatory
wave that serves to degrade necrotic myocytes and recruit cardiac fibroblasts into
the wound site for collagen production [Jugdutt, 2003, Dewald et al., 2004]. The
resulting fiber network structure within the collagenous scar is a key determinant
of infarct mechanical properties and critically affects cardiac performance. Prior
studies have observed a range of scar structures with variable collagen densities and
alignments across infarcts from different cardiac locations and different experimental
models, but these reported structures typically represented bulk measurements of
the global, aggregate scar [Holmes et al., 1997, Fomovsky et al., 2012b, Fomovsky
et al., 2012a, Fomovsky and Holmes, 2009]. Recently, we observed and quantified
regional heterogeneity of collagen fiber orientations within individual scar samples
[Richardson and Holmes, 2016]. We specifically found that both collagen fibers and
cells demonstrated strong alignment in small sub-regions of rat scars from 1-6 weeks
post-MI, but fiber and cell orientations varied greatly from sub-region to sub-region
resulting in clearly observable spatial heterogeneities.
From an electrical perspective, previous work has shown that spatial variations in
scar geometry can lead to dangerous arrhythmias in the heart as tortuous paths can
produce nonuniform and reentrant currents [Richardson et al., 2015]. But, no other
study (to our knowledge) has examined the effects of heterogeneity on mechanical
55
properties of the scar, so our current objective was to test mechanical behaviors of
subject-specific infarct orientation maps. In the current fiber network simulations,
heterogeneous fiber orientations resulted in corresponding heterogeneous stress and
strain fields. While homogeneous scars exhibited uniformly low stresses/strains, het-
erogeneous scars led to high regional variations with some sub-regions under very low
stress/strain and other sub-regions under very high stress/strain likely due to the
redistribution of loads (e.g., stress shielding).
It is currently unknown how fiber heterogeneity emerges and evolves in healing
scars. Collagen is deposited and arranged by fibroblasts that infiltrate the wound
during the healing cascade, and it is of course possible that the wound environment
presents heterogeneous chemical gradients or heterogeneous pre-existing structural
cues that direct fibroblasts into a heterogeneous arrangement, which the collagen
network then follows. However, we previously used an agent-based computational
model to support an alternative hypothesis that structural heterogeneity can emerge
even from an initially homogeneous environment due to cell-cell and cell-matrix in-
teractions within the system [Richardson and Holmes, 2016]. Specifically, long-range
cell sensing and long-range remodeling were predicted to produce local self-reinforcing
pockets of cell and matrix alignment. Perturbing these interactions, therefore, may
offer a therapeutic approach for controlling the degree of fiber heterogeneity. To
guide potential therapeutic modulation of this heterogeneity, we sought to test the
mechanical implications of fiber orientation heterogeneity on tissue anisotropy and
failure.
3.4.2 Effect of Heterogeneity on Scar Tissue Anisotropy
Isotropic samples displayed isotropic material properties (i.e. same stress-strain be-
havior in all directions) whereas the homogeneous samples displayed anisotropic prop-
56

erties with stiffer behavior parallel to the direction of global fiber alignment (i.e.,
higher P11 vs. P22 at the same levels of strain). Not surprisingly, the samples
with higher degrees of alignment demonstrated higher degrees of anisotropy. Scar
anisotropy is clinically interesting as a potential therapeutic target - both computa-
tional and experimental reports have indicated that highly anisotropic scars oriented
in the longitudinal direction may benefit left ventricular function much more than
isotropic scars [Fomovsky et al., 2012a,Fomovsky et al., 2011].
Heterogeneity within sample orientations usually dampened anisotropy. In other
words, the anisotropic stress ratio P11/P22 was lower in the majority (11/15) of het-
erogeneous samples compared to their corresponding homogeneous counterparts, even
though both samples across each pair demonstrated identical global fiber alignment.
This finding is consistent with previous results and presumably due to the ability for
stiff and compliant regions to redistribute loads/displacements [Picu, 2011, Hatami-
Marbini and Picu, 2009]. Given that a high degree of anisotropy may provide a
therapeutic benefit for improving MI properties, our current results suggest that ori-
entation heterogeneity in the infarct may act as a deterrent to achieving this benefit.
3.4.3 Effect of Heterogeneity on Scar Tissue Failure
Infarct rupture is a rare but catastrophic event occurring when the infarct is too weak
to support the ventricle’s cavity pressure, leading to mechanical failure of the tissue.
Though it only afflicts <3% of infarct patients, left ventricle free wall rupture carries
a 60-90% mortality rate, and typically occurs very early in the healing time-course
within the first few days [Gao et al., 2012]. The early occurrence is thought to coincide
with a narrow window when inflammation and protease-mediated degradation of the
necrotic myocardium has peaked but prior to the influx of fibroblasts and newly
generated matrix material [Clarke et al., 2016].
57
While the imbalance in infarct mass turnover is likely to contribute to scar tissue
vulnerability, our current results suggest that fiber orientation heterogeneity might
also lead to infarct rupture. Heterogeneous samples exhibited substantially higher
failure rates compared to their homogeneous counterparts, measured by total per-
centage of failed fibers across the sample, percentage of elements with failed fibers,
and percentage of failed fibers in the weakest element. Such failure rates were not sur-
prising given the elevated peak stresses in heterogeneous vs. homogeneous samples.
The fiber failure rate was very high in just a few elements that corresponded to the
locations of peak stresses and strains (i.e., failure was a localized event). However,
we should note that the degree of stretch subjected in our simulations (∼20%) is
considerably higher than most in vivo strains measured in these healing rat infarcts,
which averaged ∼5% (though some infarcts did reach up to 16% in vivo) [Fomovsky
and Holmes, 2009]. Also, since the earliest obtained samples were acquired at 1
week post-MI, it is unknown whether fiber heterogeneity actually emerged during the
rupture-prone window around 2-3 days.
3.4.4 Limitations of Current Study
There are a few important limitations to our model predictions. First, since the goal
of this study was to explore the effects of orientation heterogeneity on scar mechanics,
we chose to ignore other structural heterogeneities like spatial variations in collagen
density and other coronary blood vessels. These other heterogeneous inclusions may
also contribute interesting and important roles in scar mechanics. We also assumed
each sample had identical collagen densities, which we know is not true, but enabled us
to isolate the role of fiber orientation heterogeneity alone. Now that we have isolated
the effects of orientation heterogeneity, future work can combine other sources of
heterogeneous mechanics for improved predictions.
58
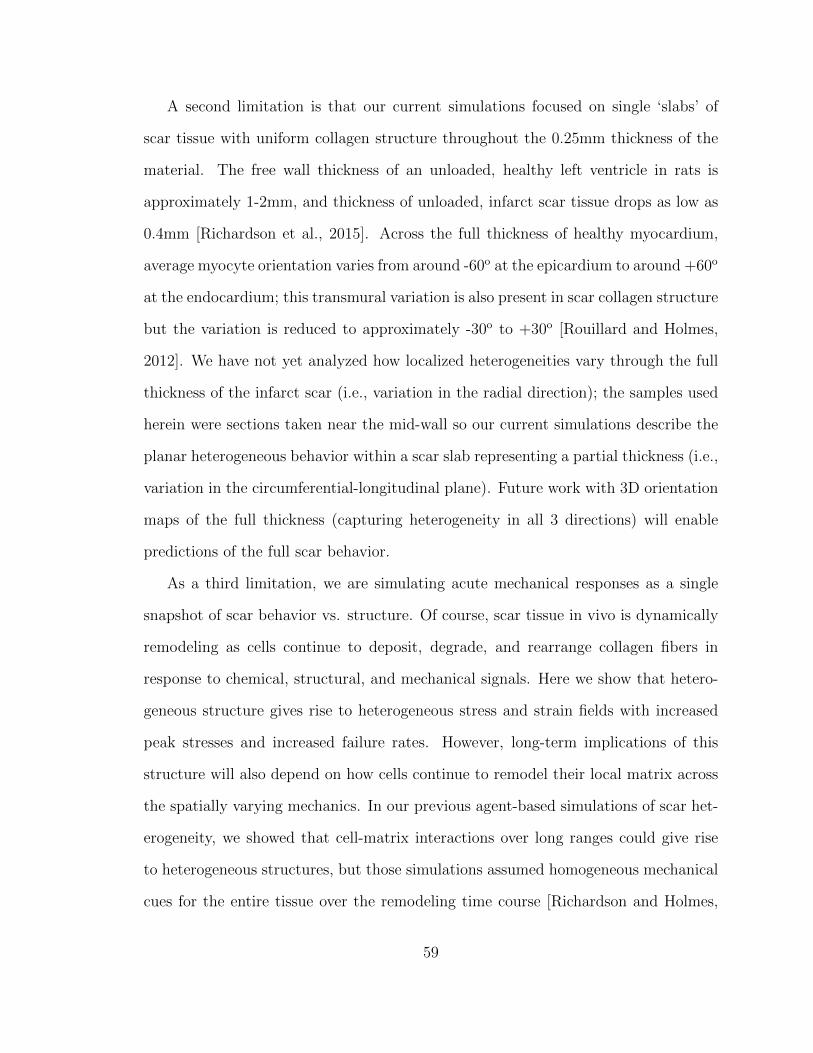
A second limitation is that our current simulations focused on single ‘slabs’ of
scar tissue with uniform collagen structure throughout the 0.25mm thickness of the
material. The free wall thickness of an unloaded, healthy left ventricle in rats is
approximately 1-2mm, and thickness of unloaded, infarct scar tissue drops as low as
0.4mm [Richardson et al., 2015]. Across the full thickness of healthy myocardium,
average myocyte orientation varies from around -60o at the epicardium to around +60o
at the endocardium; this transmural variation is also present in scar collagen structure
but the variation is reduced to approximately -30o to +30o [Rouillard and Holmes,
2012]. We have not yet analyzed how localized heterogeneities vary through the full
thickness of the infarct scar (i.e., variation in the radial direction); the samples used
herein were sections taken near the mid-wall so our current simulations describe the
planar heterogeneous behavior within a scar slab representing a partial thickness (i.e.,
variation in the circumferential-longitudinal plane). Future work with 3D orientation
maps of the full thickness (capturing heterogeneity in all 3 directions) will enable
predictions of the full scar behavior.
As a third limitation, we are simulating acute mechanical responses as a single
snapshot of scar behavior vs. structure. Of course, scar tissue in vivo is dynamically
remodeling as cells continue to deposit, degrade, and rearrange collagen fibers in
response to chemical, structural, and mechanical signals. Here we show that hetero-
geneous structure gives rise to heterogeneous stress and strain fields with increased
peak stresses and increased failure rates. However, long-term implications of this
structure will also depend on how cells continue to remodel their local matrix across
the spatially varying mechanics. In our previous agent-based simulations of scar het-
erogeneity, we showed that cell-matrix interactions over long ranges could give rise
to heterogeneous structures, but those simulations assumed homogeneous mechanical
cues for the entire tissue over the remodeling time course [Richardson and Holmes,
59

2016]. Future modeling work that couples cell behaviors with heterogeneous mechan-
ics will help predict the evolving interplay of scar structure and properties over the
chronic, healing time course.
3.4.5 Conclusions
In summary, this work highlights the importance of microenvironment considerations
within the larger scope of macroscopic infarct tissue mechanics. Our results show a
striking dependence on local fiber orientation and degree of alignment, where sam-
ples with heterogeneous networks exhibit significantly different deformation patterns
and overall mechanics when compared to samples with homogeneous and isotropic
networks. Most notably, while homogeneous and heterogeneous cases share the same
average fiber direction and degree of alignment for the entire sample, several factors,
such as anisotropy, peak strain, peak stress, and fiber failure differ between the two
cases. These results support the conclusion that infarct mechanics depend on the
underlying fiber orientation and degree of alignment, which affect the tissue behavior
and tissue failure on a whole.
3.5 Acknowledgment
We gratefully acknowledge Jeff Holmes (Department of Biomedical Engineering at
the University of Virginia) for originally sharing infarct histology images, and the fol-
lowing funding sources: NIH COBRE 1P20GM130451 (WJR), NIH R01 EB005813
(VHB, CEK), and U01 HL139471 (VHB, CEK). This material is based upon work
supported by the National Science Foundation Graduate Research Fellowship Pro-
gram under Grant No. 00039202 (CEK). Any opinions, findings, and conclusions or
recommendations expressed in this material are those of the author(s) and do not
60

necessarily reflect the views of the National Science Foundation. CEK is a recipient
of the Richard Pyle Scholar Award from the ARCS Foundation. The authors also
acknowledge the technical support of Shannen Kizilski, and computational resources
provided by the University of Minnesota Supercomputing Institute.
61
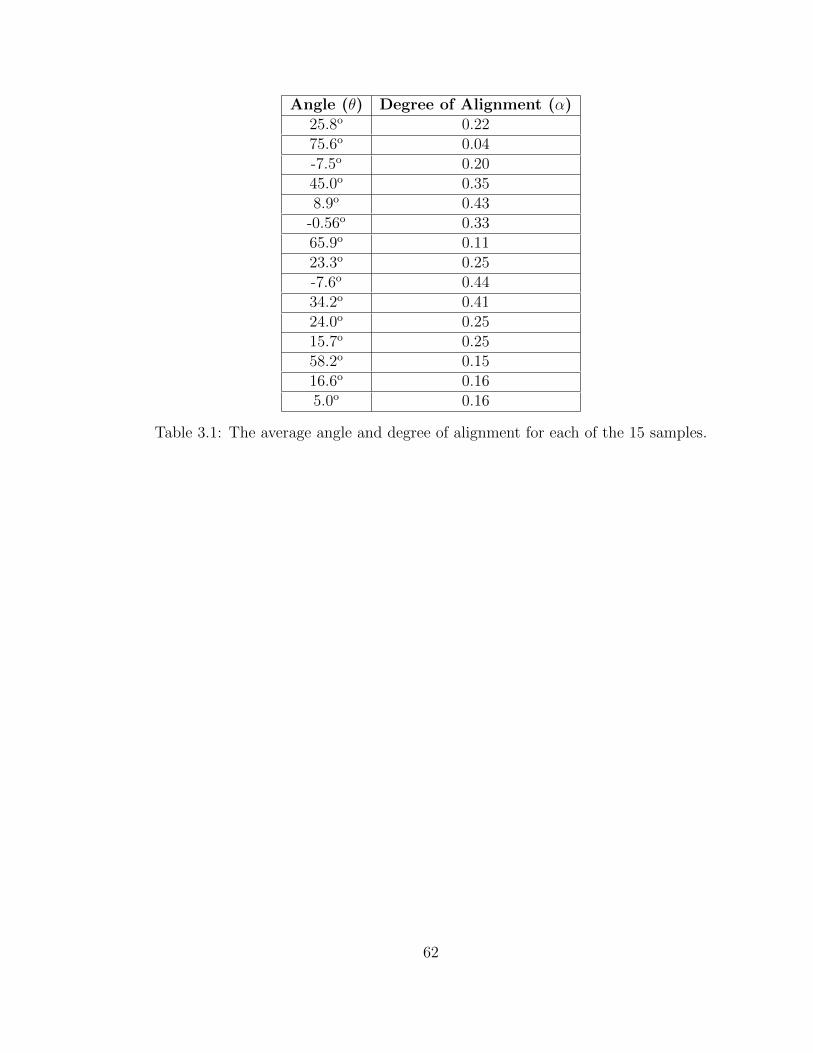
Angle (θ) Degree of Alignment (α)25.8o 0.2275.6o 0.04-7.5o 0.2045.0o 0.358.9o 0.43
-0.56o 0.3365.9o 0.1123.3o 0.25-7.6o 0.4434.2o 0.4124.0o 0.2515.7o 0.2558.2o 0.1516.6o 0.165.0o 0.16
Table 3.1: The average angle and degree of alignment for each of the 15 samples.
62
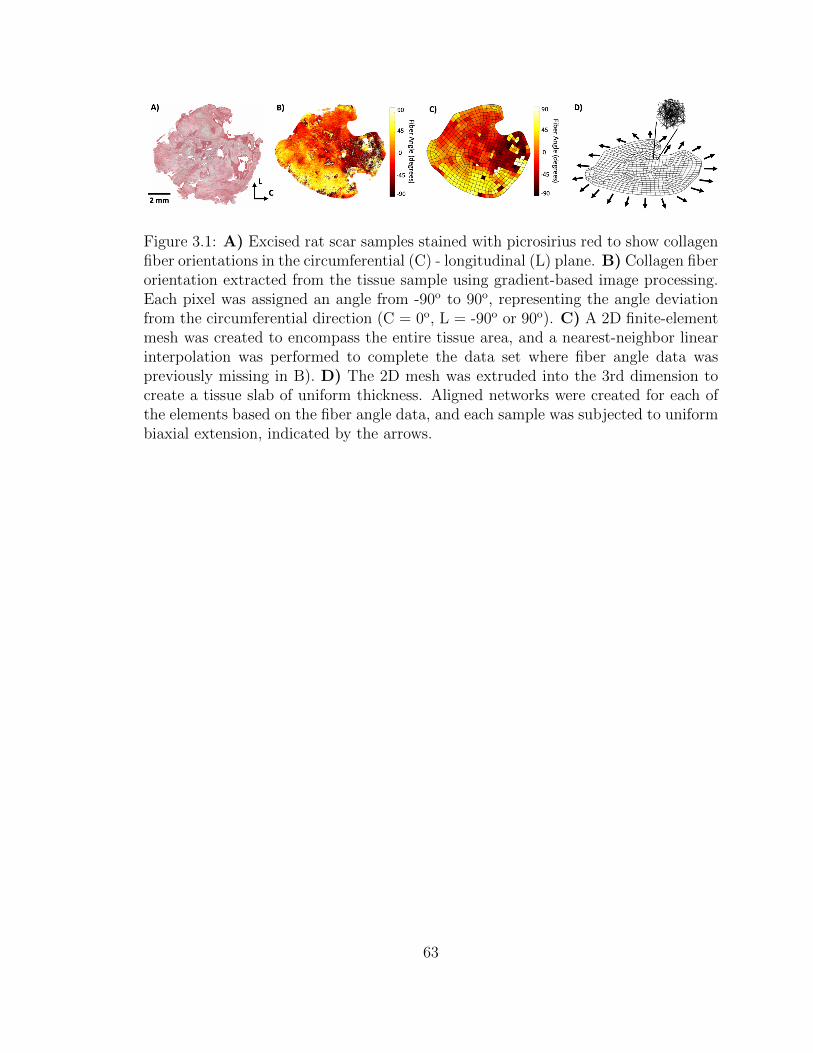
Figure 3.1: A) Excised rat scar samples stained with picrosirius red to show collagenfiber orientations in the circumferential (C) - longitudinal (L) plane. B) Collagen fiberorientation extracted from the tissue sample using gradient-based image processing.Each pixel was assigned an angle from -90o to 90o, representing the angle deviationfrom the circumferential direction (C = 0o, L = -90o or 90o). C) A 2D finite-elementmesh was created to encompass the entire tissue area, and a nearest-neighbor linearinterpolation was performed to complete the data set where fiber angle data waspreviously missing in B). D) The 2D mesh was extruded into the 3rd dimension tocreate a tissue slab of uniform thickness. Aligned networks were created for each ofthe elements based on the fiber angle data, and each sample was subjected to uniformbiaxial extension, indicated by the arrows.
63
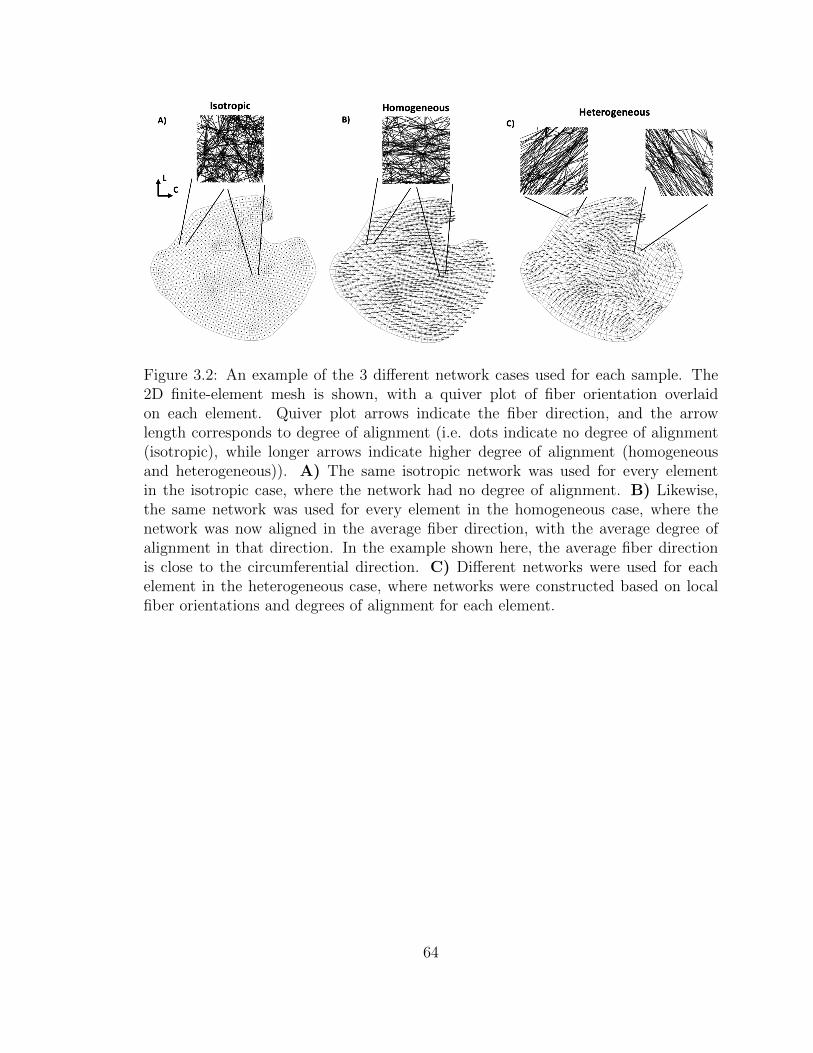
Figure 3.2: An example of the 3 different network cases used for each sample. The2D finite-element mesh is shown, with a quiver plot of fiber orientation overlaidon each element. Quiver plot arrows indicate the fiber direction, and the arrowlength corresponds to degree of alignment (i.e. dots indicate no degree of alignment(isotropic), while longer arrows indicate higher degree of alignment (homogeneousand heterogeneous)). A) The same isotropic network was used for every elementin the isotropic case, where the network had no degree of alignment. B) Likewise,the same network was used for every element in the homogeneous case, where thenetwork was now aligned in the average fiber direction, with the average degree ofalignment in that direction. In the example shown here, the average fiber directionis close to the circumferential direction. C) Different networks were used for eachelement in the heterogeneous case, where networks were constructed based on localfiber orientations and degrees of alignment for each element.
64

Figure 3.3: A representative, comprehensive analysis of the data, shown for an imagewith a high degree of alignment. A) The 2D mesh and quiver plot is shown for thesample, where the n11 direction indicates the average fiber orientation for the sample,and the n22 direction is perpendicular to n11. The angle relative to circumferential(θ) and the degree of alignment (α) are shown. B) Averaged macroscale stress plotsshown in the n11 (left) and n22 (right) directions for each of the 3 cases, isotropic(green, dotted line), homogeneous (blue, solid line), and heterogeneous (red, dashedline). For highly aligned samples, the homogeneous case was more anisotropic onaverage, displaying higher stresses than the heterogeneous or isotropic stress for then11 direction, but lower stresses in the n22 direction. C) Heatmaps shown on thesample for the isotropic (left column), homogeneous (middle column), and heteroge-neous (right column) cases, displaying the E11 strain (top row), PK1 stress in then11 direction (P11, middle row), and % of fibers failed in each element (bottom row).Isotropic and homogeneous cases displayed homogeneous strain, stress, and fiber fail-ure throughout all of the samples, while the heterogeneous case experienced localizedareas of high strain, stress, and fiber failure.
65
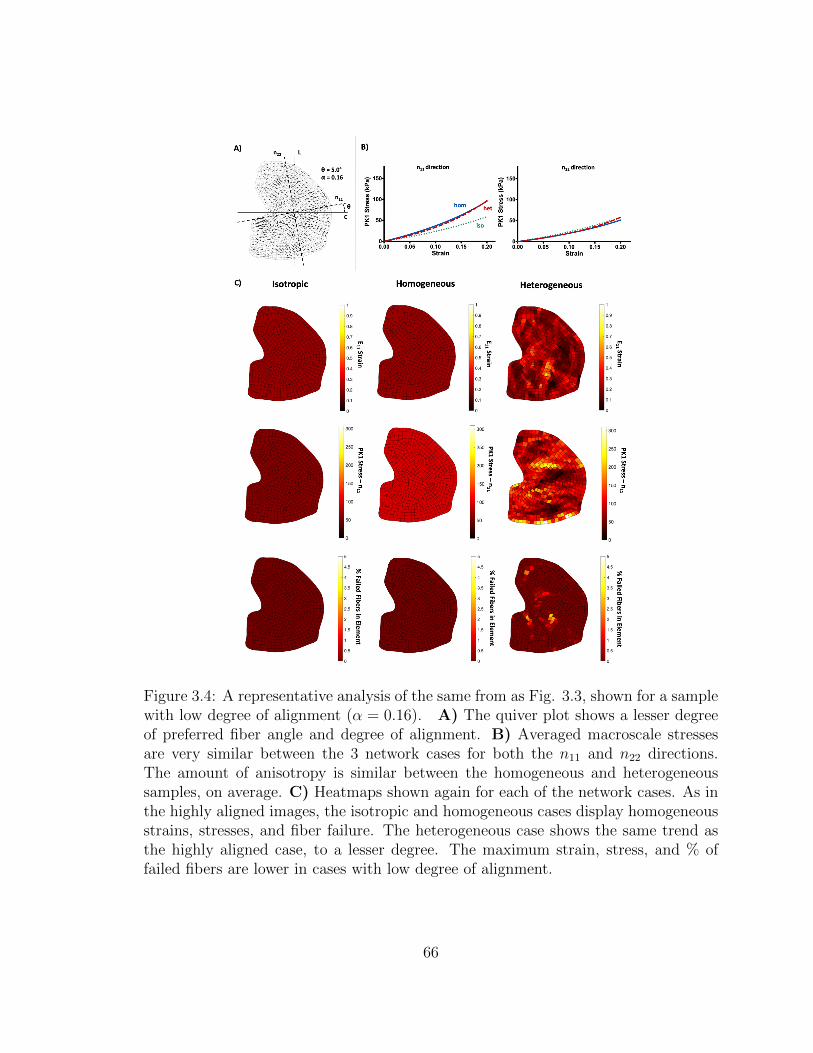
Figure 3.4: A representative analysis of the same from as Fig. 3.3, shown for a samplewith low degree of alignment (α = 0.16). A) The quiver plot shows a lesser degreeof preferred fiber angle and degree of alignment. B) Averaged macroscale stressesare very similar between the 3 network cases for both the n11 and n22 directions.The amount of anisotropy is similar between the homogeneous and heterogeneoussamples, on average. C) Heatmaps shown again for each of the network cases. As inthe highly aligned images, the isotropic and homogeneous cases display homogeneousstrains, stresses, and fiber failure. The heterogeneous case shows the same trend asthe highly aligned case, to a lesser degree. The maximum strain, stress, and % offailed fibers are lower in cases with low degree of alignment.
66
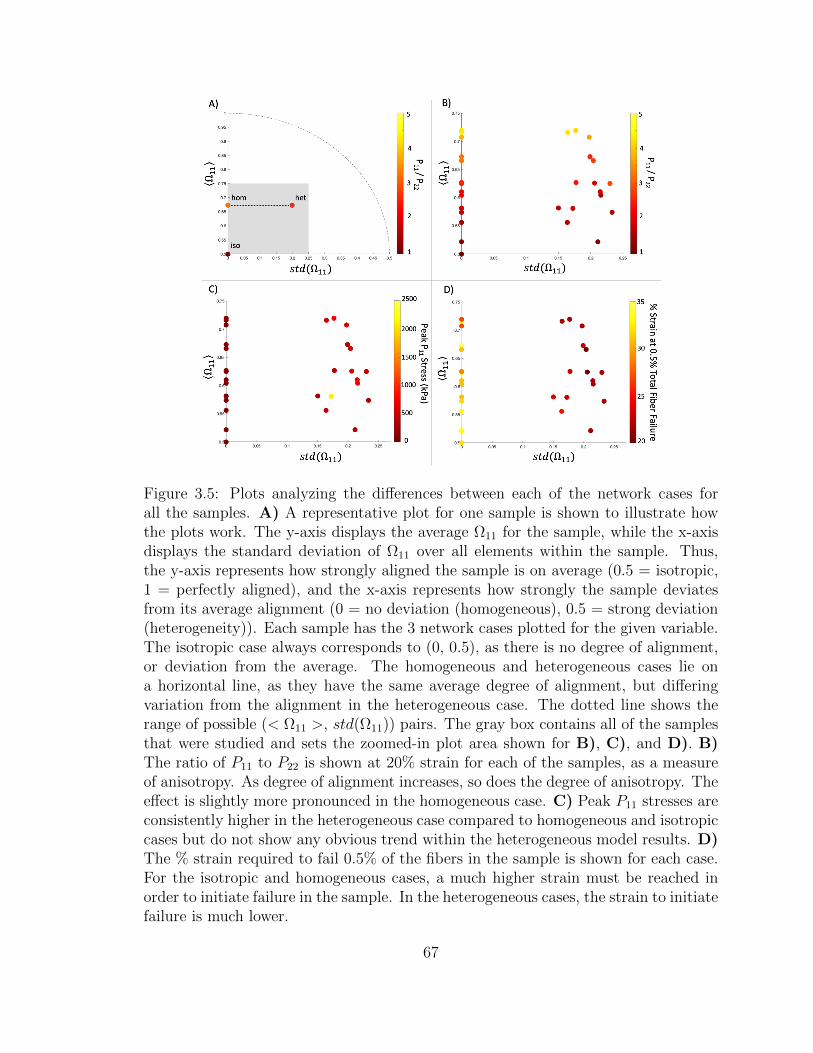
Figure 3.5: Plots analyzing the differences between each of the network cases forall the samples. A) A representative plot for one sample is shown to illustrate howthe plots work. The y-axis displays the average Ω11 for the sample, while the x-axisdisplays the standard deviation of Ω11 over all elements within the sample. Thus,the y-axis represents how strongly aligned the sample is on average (0.5 = isotropic,1 = perfectly aligned), and the x-axis represents how strongly the sample deviatesfrom its average alignment (0 = no deviation (homogeneous), 0.5 = strong deviation(heterogeneity)). Each sample has the 3 network cases plotted for the given variable.The isotropic case always corresponds to (0, 0.5), as there is no degree of alignment,or deviation from the average. The homogeneous and heterogeneous cases lie ona horizontal line, as they have the same average degree of alignment, but differingvariation from the alignment in the heterogeneous case. The dotted line shows therange of possible (< Ω11 >, std(Ω11)) pairs. The gray box contains all of the samplesthat were studied and sets the zoomed-in plot area shown for B), C), and D). B)The ratio of P11 to P22 is shown at 20% strain for each of the samples, as a measureof anisotropy. As degree of alignment increases, so does the degree of anisotropy. Theeffect is slightly more pronounced in the homogeneous case. C) Peak P11 stresses areconsistently higher in the heterogeneous case compared to homogeneous and isotropiccases but do not show any obvious trend within the heterogeneous model results. D)The % strain required to fail 0.5% of the fibers in the sample is shown for each case.For the isotropic and homogeneous cases, a much higher strain must be reached inorder to initiate failure in the sample. In the heterogeneous cases, the strain to initiatefailure is much lower.
67

Figure 3.6: Bar plots containing the mean ± 95% CI for each of the 3 network casesat 20% strain, with p-values shown for the comparison between the homogeneousand heterogeneous case. A,B) The maximum E11 strain and P11 stress experiencedin a single element for the samples was much higher in the heterogeneous case com-pared to the homogeneous and isotropic case. C) The degree of anisotropy in thehomogeneous and heterogeneous case was much higher than the isotropic case. Thehomogeneous case displayed a slightly higher degree of anisotropy overall compared tothe heterogeneous case. D,E,F) The amount of fiber failure and elements containingfailed fibers was significantly higher for the heterogeneous case.
68

Chapter 4
Ex Vivo Mechanical Tests and
Multiscale Computational
Modeling Highlight the
Importance of Intramural Shear
Stress in Ascending Thoracic
Aortic Aneurysms
The content of this chapter was submitted as a research article to the Journal of
Biomechanical Engineering by Korenczuk, Dhume, Liao, and Barocas [Korenczuk,
Christopher et al., 2019], and is currently under review. My contribution to the work
was performing experimental testing, data processing, computational modeling, and
writing.
69

4.1 Introduction
Ascending thoracic aortic aneurysms (ATAAs) are characterized by abnormal dilation
of the ascending aorta, where the vessel exceeds its normal diameter of 2-3 cm [Iaizzo,
2009]. ATAA is a high-risk pathology, with aneurysm rupture or dissection likely to
occur in untreated patients (21%-74%) [Davies et al., 2002], and with rupture in par-
ticular having high mortality rates (94%-100%) [Olsson et al., 2006]. Evaluating the
failure risk of ATAAs is exceptionally difficult due to the nonuniform microstructural,
geometric, and mechanical changes that occur in the vessel during disease progres-
sion. Aneurysms are often affected by wall thinning, structural disorganization, loss
of vascular smooth muscle cells, and extracellular matrix components such as elastin,
collagen and fibrillin [Humphrey, 2013]. The complex remodeling during aneurysm
formation and growth undoubtedly gives rise to several underlying risk contributors,
many of which may still be largely unidentified, making it difficult to determine ac-
curately the likelihood of aneurysm failure.
Current risk assessment and patient diagnosis are based primarily on vessel diame-
ter. If the ATAA diameter exceeds a threshold of approximately 5-6 cm [Davies et al.,
2002,Elefteriades, 2002,Coady et al., 1999] or a growth rate of 0.5 cm/year [Saliba and
Sia, 2015], surgical intervention is recommended. When ATAA risk is assessed solely
with measurement-based techniques, however, mechanical and structural changes,
which are well-known to occur in the ATAA pathology [Isselbacher, 2005, Garcıa-
Herrera et al., 2012, Vorp et al., 2003, Okamoto et al., 2002], cannot be considered.
The inefficiency of measurement-based diagnosis was shown by Vorp et al. [Vorp
et al., 2003], who reported a 5-year mortality rate of 39% for ATAAs below the 6
cm diameter threshold and 62% for those above the 6 cm diameter threshold. Fur-
thermore, Vorp et al. found no correlation between aneurysm diameter and tensile
70
strength [Vorp et al., 2003]. Clearly, failure contributors in the ATAA pathology
must be better understood to help inform physician decisions and improve patient
outcomes.
Morphological detail, typically obtained from CT, is invaluable and constantly im-
proving as imaging science advances. The critical question, then, is how can we use
our understanding of vascular mechanics to improve on a diameter-based guideline?
Since dissection and rupture are mechanical events, a mechanical approach is justified,
which requires exploring both the strength of the tissue and the stresses generated
by the blood pressure. Regarding ATAA mechanics, recent studies have quantified
non-aneurysmal and aneurysmal aortic tissue mechanical response through various
loading configurations including bulge inflation [Trabelsi et al., 2015, Romo et al.,
2014], uniaxial extension [Garcıa-Herrera et al., 2012,Vorp et al., 2003,Okamoto et al.,
2002,Iliopoulos et al., 2009a,Duprey et al., 2010,Khanafer et al., 2011], biaxial exten-
sion [Okamoto et al., 2002, Choudhury et al., 2009, Matsumoto et al., 2009, Azadani
et al., 2013, Geest et al., 2004, Duprey et al., 2016], peel [Pasta et al., 2012, Noble
et al., 2016], and shear [Sommer et al., 2016] testing regimes. As a general rule, those
studies found significant anisotropy, with the tissue stronger in the circumferential
than in the axial direction [Humphrey, 2013, Okamoto et al., 2002, Duprey et al.,
2010]. Aneurysm tissue is generally stiffer [Vorp et al., 2003, Phillippi et al., 2011a]
but weaker [Vorp et al., 2003,Duprey et al., 2010,Phillippi et al., 2011a] than healthy
tissue, perhaps due to elastin degradation in the aneurysm pathology [Campa et al.,
1987]. Regional heterogeneity has also been observed, with differences between the
lesser and greater curvature wall mechanics [Duprey et al., 2010, Khanafer et al.,
2011, Gao et al., 2006, Thubrikar et al., 1999, Poullis et al., 2008]. Although none of
these trends was absolute, they provide extensive insight on aneurysm mechanics.
For stress estimation, finite-element modeling has been the most popular approach
71
[Trabelsi et al., 2015,Liang et al., 2017,Kim et al., 2012,Nathan et al., 2011,Pal et al.,
2014]. These models, taken collectively, describe a complex, heterogeneous stress
field in the tissue. Bulk constitutive equations, such as the HGO model [Liang et al.,
2017,Gasser et al., 2006], 2-fiber family model [Kim et al., 2012,Holzapfel et al., 2005],
and Demiray model [Trabelsi et al., 2015], have become commonly used to describe
the material behavior of the tissue. While these constitutive models have advantages
such as reducing computational energy, they fail to incorporate fully the underlying
tissue composition and structure, which is essential to macroscale tissue behavior,
especially in the ATAA pathology, where microstructural changes are undoubtedly
present. Furthermore, parameter values are often fit to experimental data from only
one or two loading conditions (i.e. uniaxial, biaxial), which may overlook the complex
mechanical behavior given by the comprehensive multidirectional response of the
tissue (i.e. incorporating radial and shear directions). Without the consideration of
multiple loading conditions in parameter fitting, these models will lack the information
needed to produce accurate predictive results for the complex behavior of ATAAs.
Despite much progress in understanding ATAA mechanics using both experimen-
tal testing and computational modelling, the comprehensive mechanical strength of
ATAA tissue in all directions, all regions, and all loading configurations has not been
well documented. Furthermore, the mechanisms of aneurysm rupture and dissection
are still largely unknown. It has been proposed, however, that interlaminal strength
(i.e. between wall layers) plays a significant role in the failure process [Pal et al., 2014].
Interlamellar strength has been studied in a peel [Pasta et al., 2012,Noble et al., 2016]
and uniaxial [MacLean et al., 1999, Sommer et al., 2016] geometry, with significant
lower strength found than in the in-plane circumferential or axial direction. The one
previous study of ATAA tissue in interlamellar shear [Sommer et al., 2016], like our
own work on the porcine ascending thoracic aorta [Witzenburg et al., 2017], showed a
72
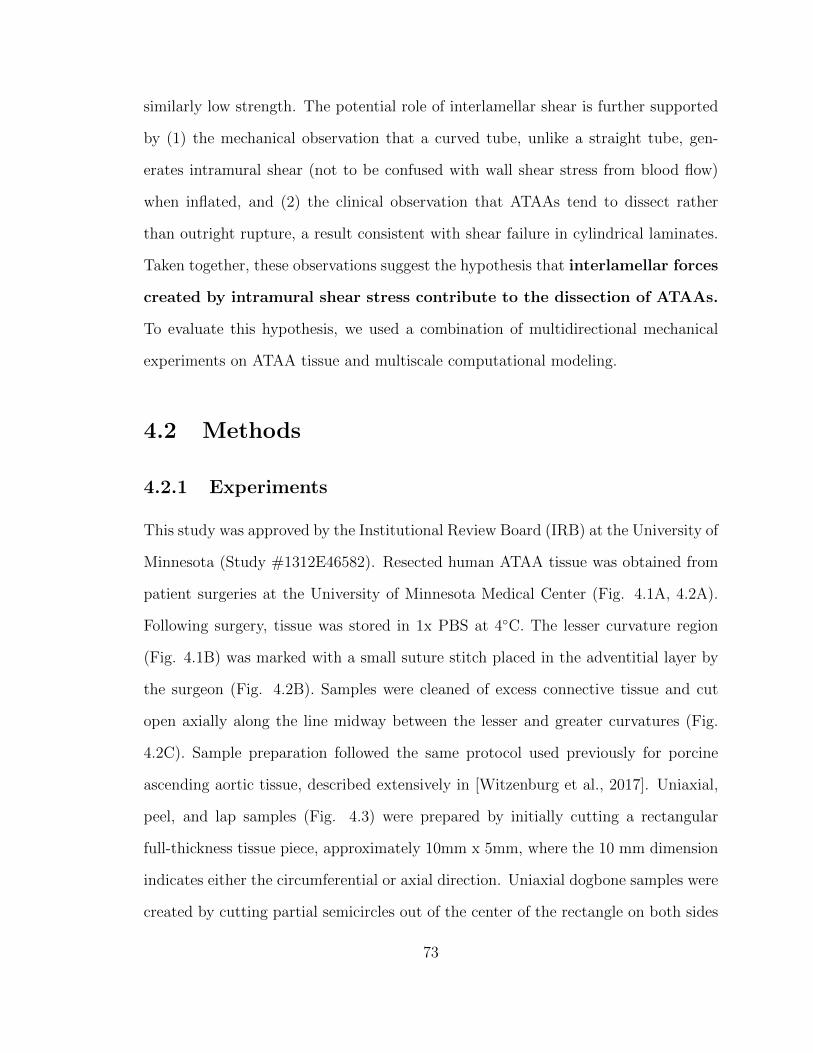
similarly low strength. The potential role of interlamellar shear is further supported
by (1) the mechanical observation that a curved tube, unlike a straight tube, gen-
erates intramural shear (not to be confused with wall shear stress from blood flow)
when inflated, and (2) the clinical observation that ATAAs tend to dissect rather
than outright rupture, a result consistent with shear failure in cylindrical laminates.
Taken together, these observations suggest the hypothesis that interlamellar forces
created by intramural shear stress contribute to the dissection of ATAAs.
To evaluate this hypothesis, we used a combination of multidirectional mechanical
experiments on ATAA tissue and multiscale computational modeling.
4.2 Methods
4.2.1 Experiments
This study was approved by the Institutional Review Board (IRB) at the University of
Minnesota (Study #1312E46582). Resected human ATAA tissue was obtained from
patient surgeries at the University of Minnesota Medical Center (Fig. 4.1A, 4.2A).
Following surgery, tissue was stored in 1x PBS at 4C. The lesser curvature region
(Fig. 4.1B) was marked with a small suture stitch placed in the adventitial layer by
the surgeon (Fig. 4.2B). Samples were cleaned of excess connective tissue and cut
open axially along the line midway between the lesser and greater curvatures (Fig.
4.2C). Sample preparation followed the same protocol used previously for porcine
ascending aortic tissue, described extensively in [Witzenburg et al., 2017]. Uniaxial,
peel, and lap samples (Fig. 4.3) were prepared by initially cutting a rectangular
full-thickness tissue piece, approximately 10mm x 5mm, where the 10 mm dimension
indicates either the circumferential or axial direction. Uniaxial dogbone samples were
created by cutting partial semicircles out of the center of the rectangle on both sides
73
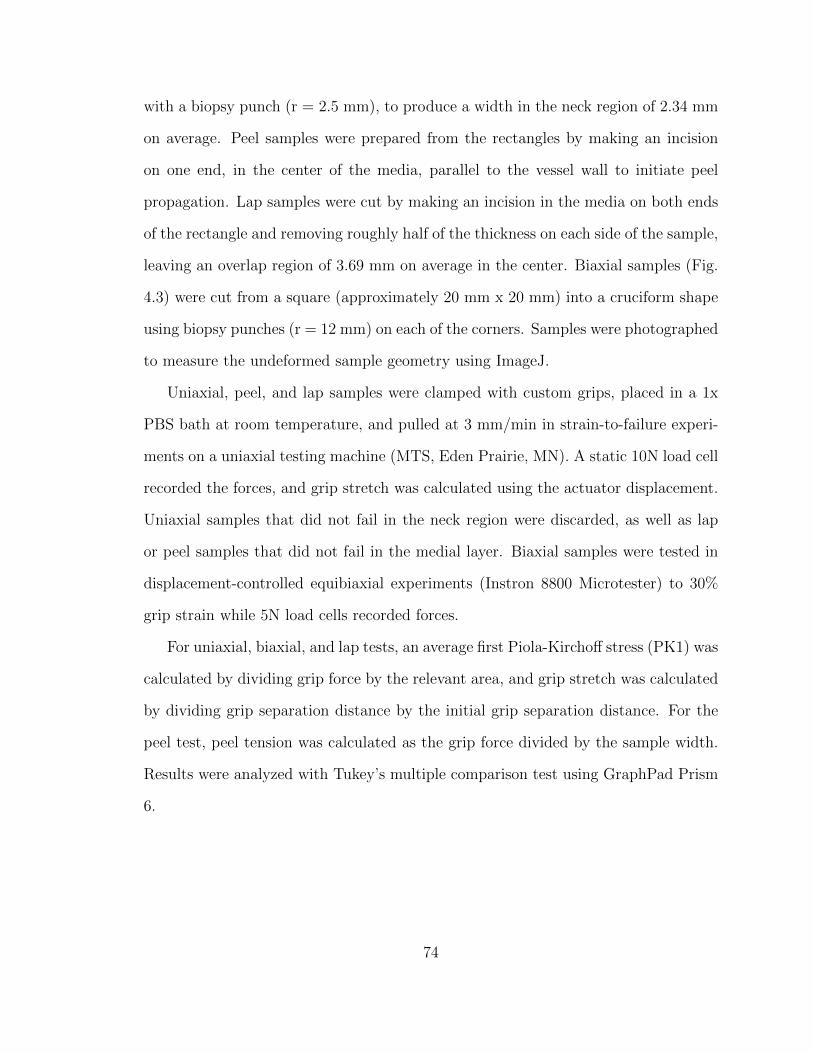
with a biopsy punch (r = 2.5 mm), to produce a width in the neck region of 2.34 mm
on average. Peel samples were prepared from the rectangles by making an incision
on one end, in the center of the media, parallel to the vessel wall to initiate peel
propagation. Lap samples were cut by making an incision in the media on both ends
of the rectangle and removing roughly half of the thickness on each side of the sample,
leaving an overlap region of 3.69 mm on average in the center. Biaxial samples (Fig.
4.3) were cut from a square (approximately 20 mm x 20 mm) into a cruciform shape
using biopsy punches (r = 12 mm) on each of the corners. Samples were photographed
to measure the undeformed sample geometry using ImageJ.
Uniaxial, peel, and lap samples were clamped with custom grips, placed in a 1x
PBS bath at room temperature, and pulled at 3 mm/min in strain-to-failure experi-
ments on a uniaxial testing machine (MTS, Eden Prairie, MN). A static 10N load cell
recorded the forces, and grip stretch was calculated using the actuator displacement.
Uniaxial samples that did not fail in the neck region were discarded, as well as lap
or peel samples that did not fail in the medial layer. Biaxial samples were tested in
displacement-controlled equibiaxial experiments (Instron 8800 Microtester) to 30%
grip strain while 5N load cells recorded forces.
For uniaxial, biaxial, and lap tests, an average first Piola-Kirchoff stress (PK1) was
calculated by dividing grip force by the relevant area, and grip stretch was calculated
by dividing grip separation distance by the initial grip separation distance. For the
peel test, peel tension was calculated as the grip force divided by the sample width.
Results were analyzed with Tukey’s multiple comparison test using GraphPad Prism
6.
74
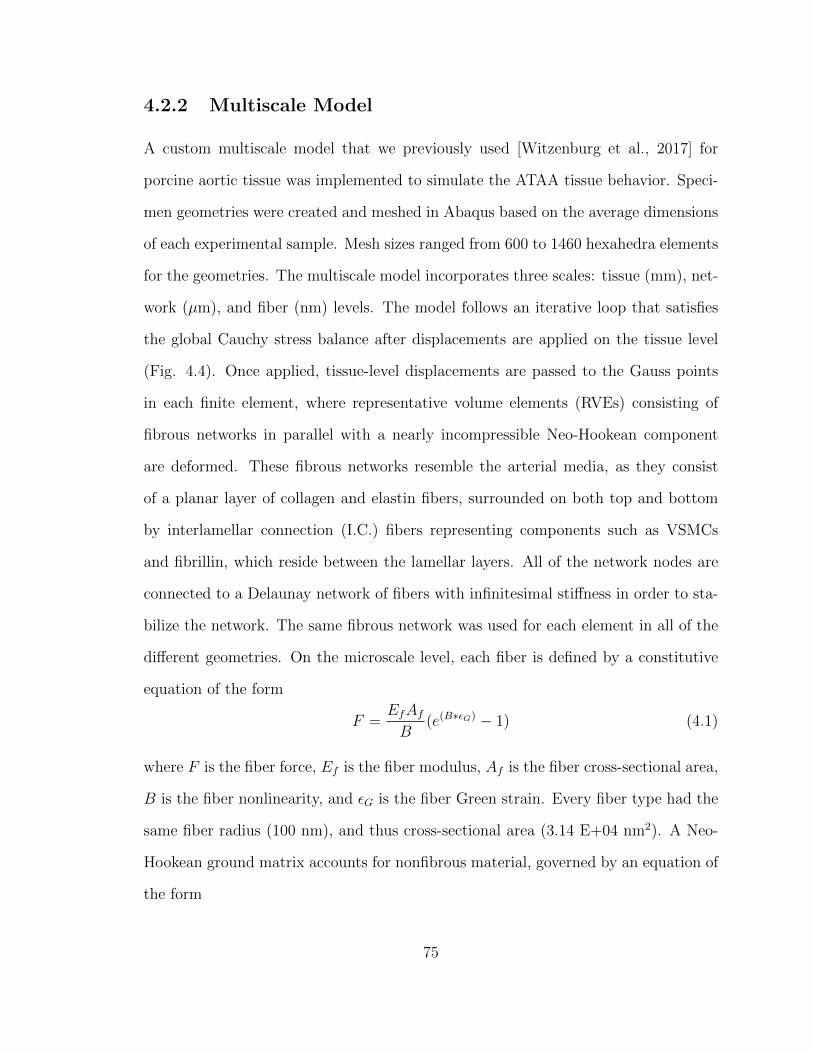
4.2.2 Multiscale Model
A custom multiscale model that we previously used [Witzenburg et al., 2017] for
porcine aortic tissue was implemented to simulate the ATAA tissue behavior. Speci-
men geometries were created and meshed in Abaqus based on the average dimensions
of each experimental sample. Mesh sizes ranged from 600 to 1460 hexahedra elements
for the geometries. The multiscale model incorporates three scales: tissue (mm), net-
work (µm), and fiber (nm) levels. The model follows an iterative loop that satisfies
the global Cauchy stress balance after displacements are applied on the tissue level
(Fig. 4.4). Once applied, tissue-level displacements are passed to the Gauss points
in each finite element, where representative volume elements (RVEs) consisting of
fibrous networks in parallel with a nearly incompressible Neo-Hookean component
are deformed. These fibrous networks resemble the arterial media, as they consist
of a planar layer of collagen and elastin fibers, surrounded on both top and bottom
by interlamellar connection (I.C.) fibers representing components such as VSMCs
and fibrillin, which reside between the lamellar layers. All of the network nodes are
connected to a Delaunay network of fibers with infinitesimal stiffness in order to sta-
bilize the network. The same fibrous network was used for each element in all of the
different geometries. On the microscale level, each fiber is defined by a constitutive
equation of the form
F =EfAfB
(e(B∗εG) − 1) (4.1)
where F is the fiber force, Ef is the fiber modulus, Af is the fiber cross-sectional area,
B is the fiber nonlinearity, and εG is the fiber Green strain. Every fiber type had the
same fiber radius (100 nm), and thus cross-sectional area (3.14 E+04 nm2). A Neo-
Hookean ground matrix accounts for nonfibrous material, governed by an equation of
the form
75
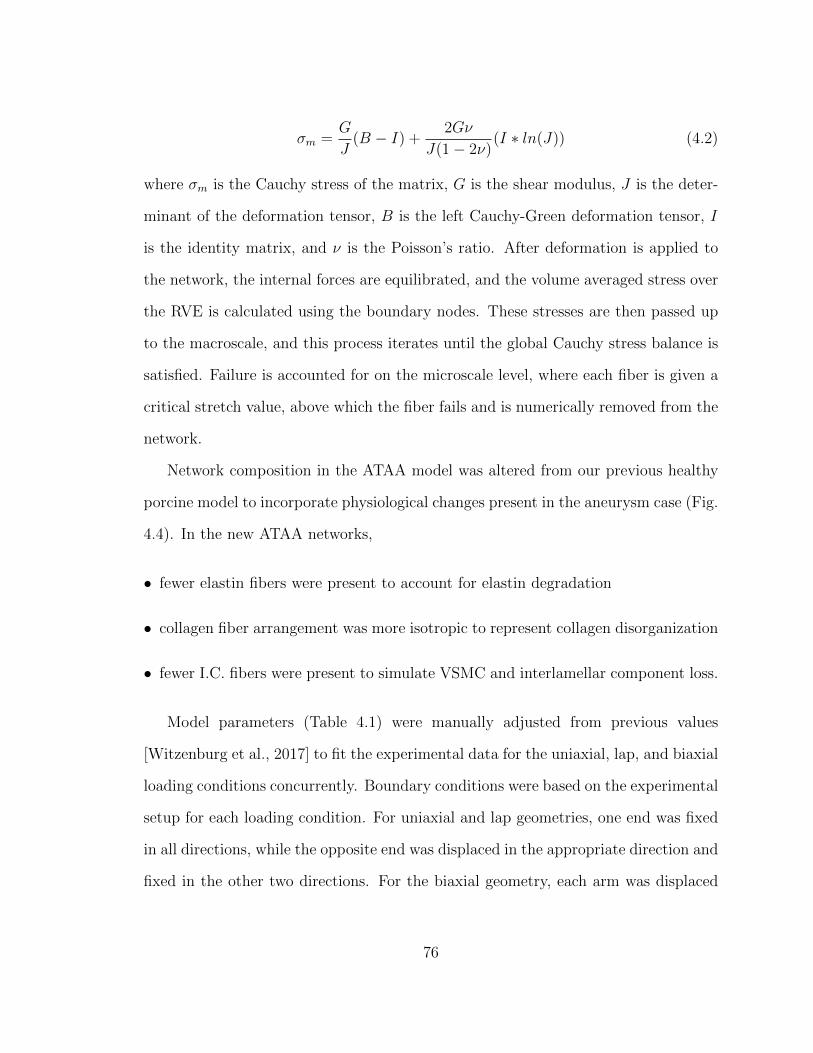
σm =G
J(B − I) +
2Gν
J(1− 2ν)(I ∗ ln(J)) (4.2)
where σm is the Cauchy stress of the matrix, G is the shear modulus, J is the deter-
minant of the deformation tensor, B is the left Cauchy-Green deformation tensor, I
is the identity matrix, and ν is the Poisson’s ratio. After deformation is applied to
the network, the internal forces are equilibrated, and the volume averaged stress over
the RVE is calculated using the boundary nodes. These stresses are then passed up
to the macroscale, and this process iterates until the global Cauchy stress balance is
satisfied. Failure is accounted for on the microscale level, where each fiber is given a
critical stretch value, above which the fiber fails and is numerically removed from the
network.
Network composition in the ATAA model was altered from our previous healthy
porcine model to incorporate physiological changes present in the aneurysm case (Fig.
4.4). In the new ATAA networks,
• fewer elastin fibers were present to account for elastin degradation
• collagen fiber arrangement was more isotropic to represent collagen disorganization
• fewer I.C. fibers were present to simulate VSMC and interlamellar component loss.
Model parameters (Table 4.1) were manually adjusted from previous values
[Witzenburg et al., 2017] to fit the experimental data for the uniaxial, lap, and biaxial
loading conditions concurrently. Boundary conditions were based on the experimental
setup for each loading condition. For uniaxial and lap geometries, one end was fixed
in all directions, while the opposite end was displaced in the appropriate direction and
fixed in the other two directions. For the biaxial geometry, each arm was displaced
76
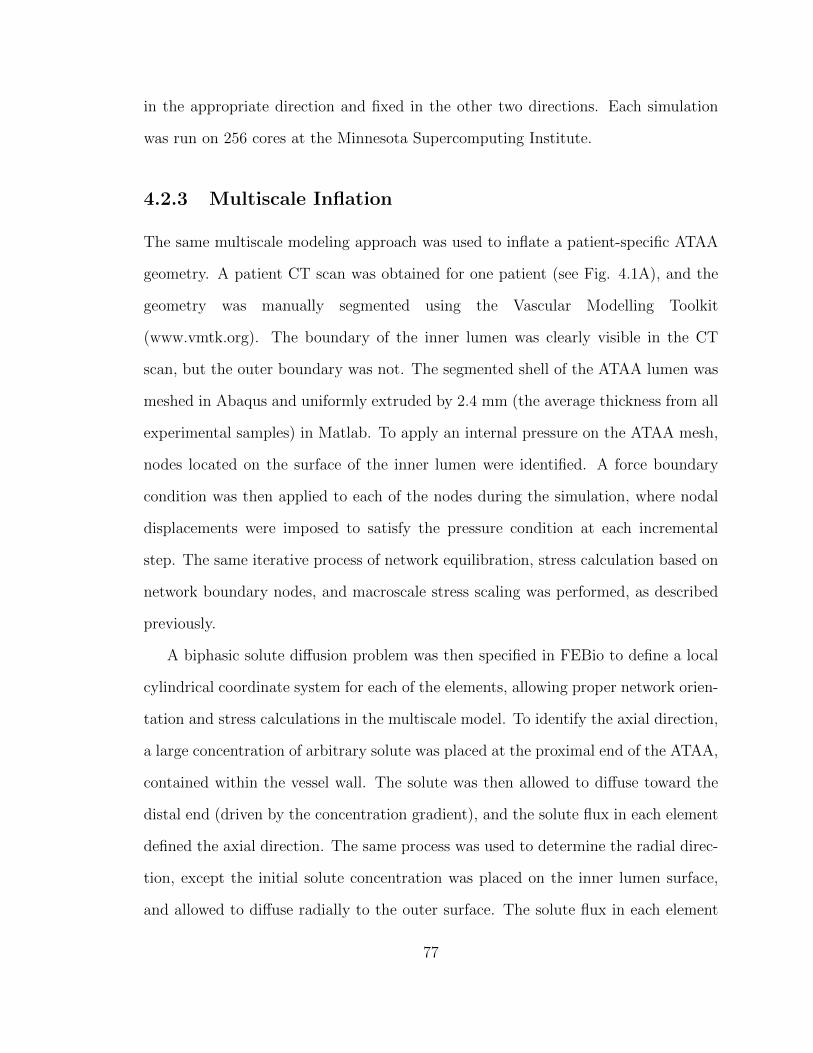
in the appropriate direction and fixed in the other two directions. Each simulation
was run on 256 cores at the Minnesota Supercomputing Institute.
4.2.3 Multiscale Inflation
The same multiscale modeling approach was used to inflate a patient-specific ATAA
geometry. A patient CT scan was obtained for one patient (see Fig. 4.1A), and the
geometry was manually segmented using the Vascular Modelling Toolkit
(www.vmtk.org). The boundary of the inner lumen was clearly visible in the CT
scan, but the outer boundary was not. The segmented shell of the ATAA lumen was
meshed in Abaqus and uniformly extruded by 2.4 mm (the average thickness from all
experimental samples) in Matlab. To apply an internal pressure on the ATAA mesh,
nodes located on the surface of the inner lumen were identified. A force boundary
condition was then applied to each of the nodes during the simulation, where nodal
displacements were imposed to satisfy the pressure condition at each incremental
step. The same iterative process of network equilibration, stress calculation based on
network boundary nodes, and macroscale stress scaling was performed, as described
previously.
A biphasic solute diffusion problem was then specified in FEBio to define a local
cylindrical coordinate system for each of the elements, allowing proper network orien-
tation and stress calculations in the multiscale model. To identify the axial direction,
a large concentration of arbitrary solute was placed at the proximal end of the ATAA,
contained within the vessel wall. The solute was then allowed to diffuse toward the
distal end (driven by the concentration gradient), and the solute flux in each element
defined the axial direction. The same process was used to determine the radial direc-
tion, except the initial solute concentration was placed on the inner lumen surface,
and allowed to diffuse radially to the outer surface. The solute flux in each element
77
then defined the radial direction. Following the simulations, the cross product of the
axial and radial directions was taken to define the circumferential direction for each
element. In order to ensure an orthogonal coordinate system, the cross product of the
circumferential and axial directions was performed to define the final radial direction.
Networks of the same specifications used during optimization were then generated and
rotated appropriately for each element, based on the calculated coordinate systems.
Fiber parameters were set as the values obtained from the optimization to the
experimental data, specified above. Since the patient CT was captured with the
tissue in a loaded configuration in vivo, the unloaded length of each fiber was set
to be 80% of its initial length, to simulate fiber prestretch. The nodes residing on
the lumen of the proximal end of the vessel were fixed in all directions to resemble
anchoring at the aortic root, while the rest of the vessel was allowed to move freely
in all other directions. The ATAA geometry was inflated to a pressure of 50 mmHg,
a value well below the normal blood pressure but sufficient to produce significant
expansion of the vessel in this adventitia-free model, and to allow us to focus on the
initial stages of tissue damage, which could drive subsequent remodeling.
4.3 Results
4.3.1 Experiments
Strain-to-failure experiments for the uniaxial, lap, and peel loading conditions showed
a few notable trends. First, ATAA tissue displayed similar nonlinear, anisotropic,
prefailure behavior to healthy porcine tissue, but was weaker in most loading cases,
failing at a lower stress and stretch. Second, ATAA tissue was strongest in the
uniaxial loading condition, and weakest in the shear lap loading condition. There
was no significant difference between tissue from the greater vs. lesser curvature
78

regions in any test (data in supplement), so results for the two regions were pooled
in all subsequent analysis.
ATAA uniaxial samples exhibited significantly lower strength in the circumfer-
ential direction compared to porcine tissue (Fig. 4.5C, 4.5E), similar to previous
studies [Garcıa-Herrera et al., 2012,Vorp et al., 2003,Witzenburg et al., 2017]. There
was, however, no difference in tensile strength between ATAA and porcine tissue in
the axial direction (Fig. 4.5D, 4.5E). In both ATAA directions, the failure stretch
was lower than for porcine samples (Fig. 4.5F).
Lap samples were significantly stronger in the circumferential direction compared
to the axial direction (Fig. 4.6C-E), similar to results seen by [Sommer et al., 2016].
ATAA samples showed a significantly lower failure strength (Fig. 4.6E) compared
to porcine samples. All orientations and locations exhibited a lower failure stretch
compared to porcine data.
ATAA peel samples exhibited a significantly higher peel tension in the axial di-
rection compared to circumferential (Fig. 4.7B) in agreement with previous stud-
ies [Pasta et al., 2012]. Both the circumferential and axial directions showed a signif-
icantly lower peel tension compared to porcine samples (Fig. 4.7B).
Biaxial samples showed a slight increase in nonlinearity for both the circumferen-
tial and axial directions compared to porcine data (Fig. 4.8C, 4.8D). The similarity
between ATAA and porcine aortic tissue in biaxial tests is consistent with the simi-
lar prefailure curves in Figures 4.5 and 4.6. The biaxial samples also displayed tissue
anisotropy in favor of the circumferential direction, in the same fashion as the uniaxial
and lap testing.
Overall, ATAA tissue showed the highest strength in uniaxial loading conditions
and the lowest strength in shear for both circumferential and axial orientations. The
prefailure data for uniaxial, lap, and biaxial samples were similar to porcine tissue, but
79
the uniaxial and lap samples exhibited lower failure stresses and stretches for ATAA
tissue, with ATAA tensile strength and peel tension roughly half of the corresponding
values for porcine aorta. The failure stretch for uniaxial tests was also considerably
lower for the ATAA samples under uniaxial and shear loading. Taking the data
collectively, we conclude that the ATAA tissue shows comparable mechanics to the
healthy porcine tissue at subfailure loads, but fails at significantly lower stretch/load.
4.3.2 Modeling
One set of network parameters (Table 4.1) was determined to fit the experimental data
from the uniaxial, lap, and biaxial loading configurations. For the uniaxial case (Fig.
4.9, top), the model captured the anisotropic behavior prior to failure quite well, but
it showed some inaccuracy in the prediction of the failure stretch. For the lap tests
(Fig. 4.9, middle), the model showed similar good performance prior to failure and
matched the failure points more closely. The model, when properly parameterized,
also captured the 10-fold difference in failure stress between the uniaxial and lap
experiments. Finally, for the biaxial experiments (Fig. 4.9, bottom), the model
overpredicted the stress, but correctly described the anisotropy of the tissue. We
know of no other computational model that has been applied to such a wide range of
experimental data.
Certain other features that are not measurable experimentally can be interrogated
by the model. These include the stress field in each experiment, visualized in the
middle column of Fig. 4.9. The regions of highest stress correspond to the locations
of tissue failure, as investigated by us earlier [Korenczuk et al., 2017] in the context
of a continuum anisotropic failure model. Perhaps most important is the ability of
the model to examine micro-mechanics, as shown in the enlarged images of individual
networks, and in the pie charts in the right hand column of Fig. 4.9. An important
80
difference between uniaxial and shear loading can be seen: in the uniaxial tests,
between 55-60% of the failed fibers in the model are collagen and elastin, and only
40-45% of the failed fibers are interlamellar connections. In the shear lap case, in
contrast, 49-78% of the failed fibers are interlamellar connections, suggesting that in
the shear case, the lamellae may not fail at all, but rather they are allowed to slide
relative to each other because of failed connections between them.
Inflation of the patient ATAA geometry yielded two major findings, (1) the sample
exhibited a high amount of shear stress relative to its shear strength and (2) I.C.
fibers were the primary fiber type to fail in the sample. During inflation, the sample
exhibited the highest circumferential and shear strain near the greater curvature of
the vessel (Fig. 4.10B, 4.10C), and a heterogeneous stress field throughout (Fig.
4.10D-F). The circumferential stress was higher than shear stress, with both stresses
being highest in the regions of fiber failure (Fig. 4.10E-G). Although shear stress
did not reach the same magnitude overall as stress in the circumferential direction,
shear stress values were quite high, especially considering the tissue is much weaker
in shear (c.f. experimental results). In certain locations, particularly near elements
with high fiber failure, shear stress was even higher than circumferential stress (Fig.
4.10D). The importance of shear stress is particularly highlighted by the fact that
I.C. fibers showed a much higher percentage of fiber failure compared to collagen
and elastin fibers (Fig. 4.10H, 4.10I). In fact, the fraction of failed fibers that were
interlamellar connections was greater in the inflation simulations (Fig. 4.10I) than
in any of the simulated mechanical tests (Fig. 4.9). It is noted that the difference
may be due to incomplete failure of the simulated vessel (i.e. the collagen and elastin
would eventually fail). These results provide a comprehensive look into the mechanics
and failure of ATAA tissue, and strongly suggest that shear loading plays a large role
in the failure process.
81

4.4 Discussion
The three key results from this work are (1) that ATAA tissue shows similar prefailure
behavior to porcine aorta, but has consistently lower strength, (2) that ATAA tissue is
extremely weak in shear, to the point that even though shear stresses are not as large
as tensile stresses in the vessel, shear failure may in fact be an important mechanism,
and (3) a comprehensive approach considering multiple loading configurations must
be used when assessing ATAA failure, as the vessel exhibits complex mechanical
behavior.
Human ATAA tissue exhibited markedly different responses in all loading con-
ditions and orientations compared to non-aneurysmal porcine tissue. The relative
change of failure stress between ATAA and porcine samples however, showed no de-
pendence on location or orientation. Rather, the ATAA failure stress (or peel tension)
was roughly 50% of the corresponding value for porcine tissue in all cases. These re-
sults suggest that aneurysm disease progression may not favor any specific direction,
but rather that it homogeneously compromises the structural integrity of the tissue,
at least on average. Lap samples showed the lowest strength out of all loading condi-
tions, suggesting that failure could most easily occur in the shear loading condition.
This finding emphasizes the importance of interlaminar shear strength in the me-
chanical stability of the aneurysm pathology, and implicates its consideration as a
possible risk factor. Shear may also be important in terms of tissue remodeling be-
cause of the load it places on the interlamellar connections, which represent, in part,
the smooth muscle cells. Unlike circumferential and axial loads, which can be borne
in significant part by the collagen and elastin in the aortic wall, shear stresses must be
borne by the cells and thus could be a major driver for pathological remodeling of the
tissue. Furthermore, the interlamellar failure in the inflation simulation is consistent
82

with dissection rather than outright rupture of ATAAs [Davies et al., 2002,Pal et al.,
2014].
Human ATAA results for uniaxial and biaxial samples were in agreement with pre-
vious studies [Vorp et al., 2003, Okamoto et al., 2002]. Shear failure results showed
the same trend in anisotropy (circumferential > axial) compared to [Sommer et al.,
2016], but exhibited lower failure stresses, particularly in the axial direction. Peel
samples exhibited lower average peel tension (∼ 65 N/m) for both the circumferen-
tial and axial directions compared to [Pasta et al., 2012], but showed a similar trend
in anisotropy (axial > circumferential). Here, we have presented a comprehensive re-
source for understanding experimental prefailure and failure behavior of ATAA tissue,
particularly documenting the strength of the tissue in loading conditions previously
less studied (i.e. shear).
Considering the stark differences in mechanical response and failure between ex-
perimental loading conditions, the multiscale model captured the overall behavior
well. Using multiple loading configurations to optimize model parameters and in-
corporating the anatomical structure when creating network architecture allowed our
multiscale model to provide unique insight on the comprehensive mechanical response
of ATAA tissue to subfailure and failure loads across multiple length scales. The uni-
axial loading condition exhibited high fiber failure in the planar layer of collagen and
elastin, while the lap loading condition experienced high levels of I.C. failure, sug-
gesting that the I.C.s bear a significant amount of the mechanical responsibility in
the shear loading configuration. Furthermore, multiscale inflation simulations showed
high shear stresses and I.C. failure, suggesting that shear is an important factor to
consider when analyzing ATAA modes of failure. More work must clearly be done to
quantify the importance of shear in predicting vessel failure, but these results suggest
a new possible mode of failure and risk factor when considering ATAAs.
83

Though useful, our multiscale model still presented a variety of limitations. Mi-
croscale networks were constructed as simplified representations of the ATAA mi-
croenvironment, and oversimplified aspects such as vascular smooth muscle cells and
fibrillin by only using one fiber type to describe the interlamellar space. Only passive
mechanics were studied and modeled, neglecting the clearly present role of active
contractility within the vessel wall, which may significantly affect the simulated tis-
sue behavior, and thus our conclusions. Furthermore, the medial layer of the vessel
wall was the only layer modeled, even though the adventitial layer is known to con-
tribute mechanical stability [Holzapfel et al., 2000], and carries more than 50% of
the pressure load at higher pressures [Schulze-Bauer et al., 2002]. The combination
of modeling only passive mechanics and excluding the adventitial layer explains the
large deformation observed during simulated inflation at a relatively low maximum
pressure (50 mmHg).
Overall, several noteworthy differences were observed between human ATAA and
porcine tissue, most of which suggest that the disease remodeling and weakening may
involve multiple components. Tissue composition is clearly affected in different ways,
meriting further exploration of the constituents’ orientation and composition. Our
findings also suggest that shear plays an important role in the failure of ATAAs, and
must not be overlooked. These results emphasize the importance of fully understand-
ing the structural and mechanical changes that occur in ATAAs, especially in terms of
multidirectional failure, as the tissue is constantly under complex loading conditions
in vivo where risk is not fully captured by current diameter-based methods.
84
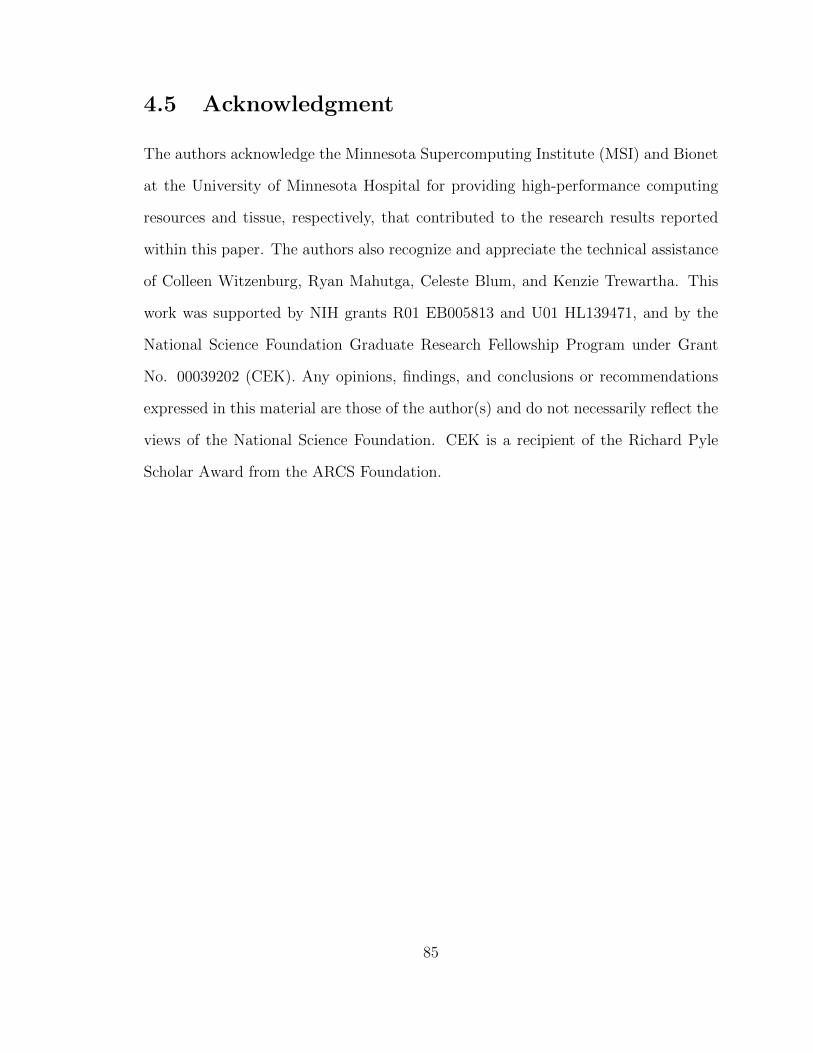
4.5 Acknowledgment
The authors acknowledge the Minnesota Supercomputing Institute (MSI) and Bionet
at the University of Minnesota Hospital for providing high-performance computing
resources and tissue, respectively, that contributed to the research results reported
within this paper. The authors also recognize and appreciate the technical assistance
of Colleen Witzenburg, Ryan Mahutga, Celeste Blum, and Kenzie Trewartha. This
work was supported by NIH grants R01 EB005813 and U01 HL139471, and by the
National Science Foundation Graduate Research Fellowship Program under Grant
No. 00039202 (CEK). Any opinions, findings, and conclusions or recommendations
expressed in this material are those of the author(s) and do not necessarily reflect the
views of the National Science Foundation. CEK is a recipient of the Richard Pyle
Scholar Award from the ARCS Foundation.
85
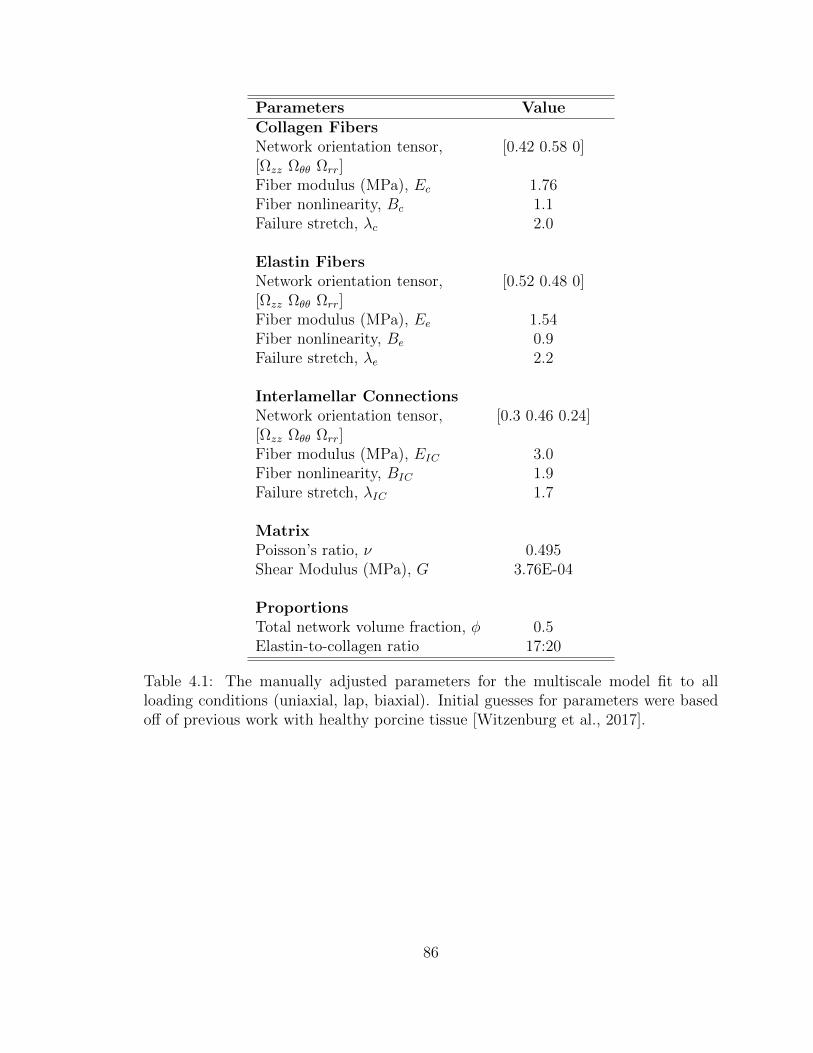
Parameters ValueCollagen FibersNetwork orientation tensor, [0.42 0.58 0][Ωzz Ωθθ Ωrr]Fiber modulus (MPa), Ec 1.76Fiber nonlinearity, Bc 1.1Failure stretch, λc 2.0
Elastin FibersNetwork orientation tensor, [0.52 0.48 0][Ωzz Ωθθ Ωrr]Fiber modulus (MPa), Ee 1.54Fiber nonlinearity, Be 0.9Failure stretch, λe 2.2
Interlamellar ConnectionsNetwork orientation tensor, [0.3 0.46 0.24][Ωzz Ωθθ Ωrr]Fiber modulus (MPa), EIC 3.0Fiber nonlinearity, BIC 1.9Failure stretch, λIC 1.7
MatrixPoisson’s ratio, ν 0.495Shear Modulus (MPa), G 3.76E-04
ProportionsTotal network volume fraction, φ 0.5Elastin-to-collagen ratio 17:20
Table 4.1: The manually adjusted parameters for the multiscale model fit to allloading conditions (uniaxial, lap, biaxial). Initial guesses for parameters were basedoff of previous work with healthy porcine tissue [Witzenburg et al., 2017].
86
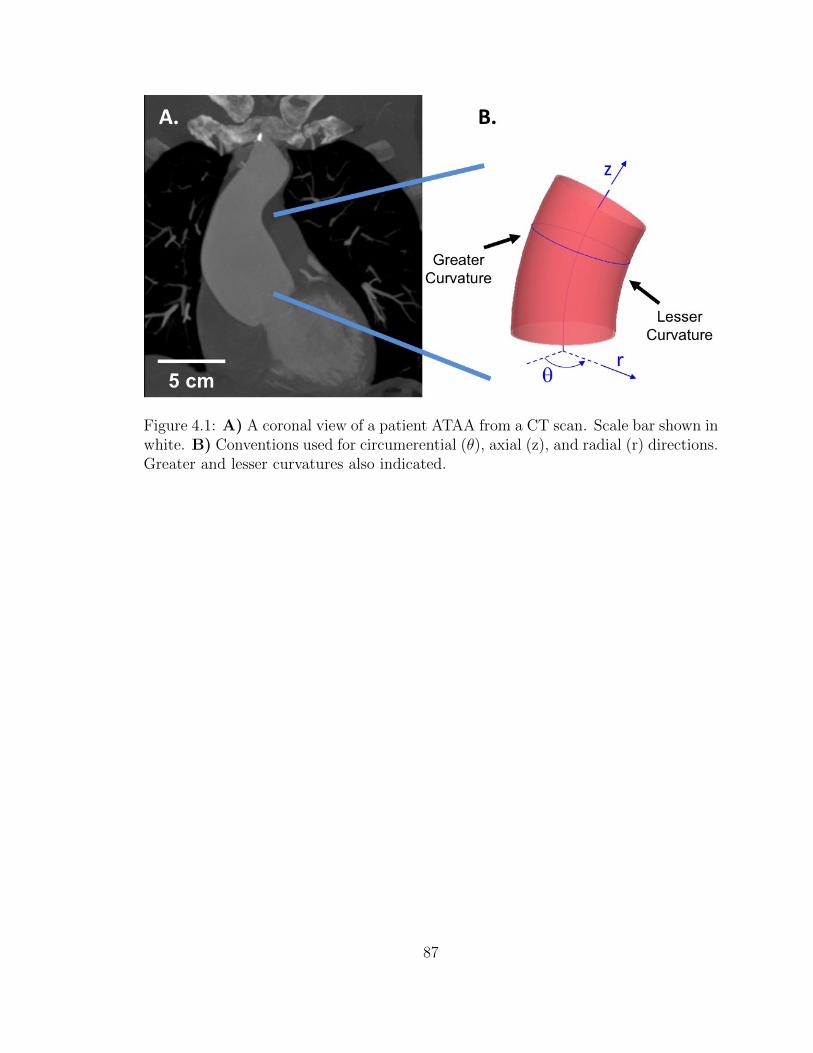
Figure 4.1: A) A coronal view of a patient ATAA from a CT scan. Scale bar shown inwhite. B) Conventions used for circumerential (θ), axial (z), and radial (r) directions.Greater and lesser curvatures also indicated.
87
Figure 4.2: ATAA sample shown from A) transverse and B) sagittal directions.Lesser curvature indicated by the blue suture stitch. C) Intimal view of the ATAAtissue after opened. Greater and lesser curvatures indicated by arrows.
88
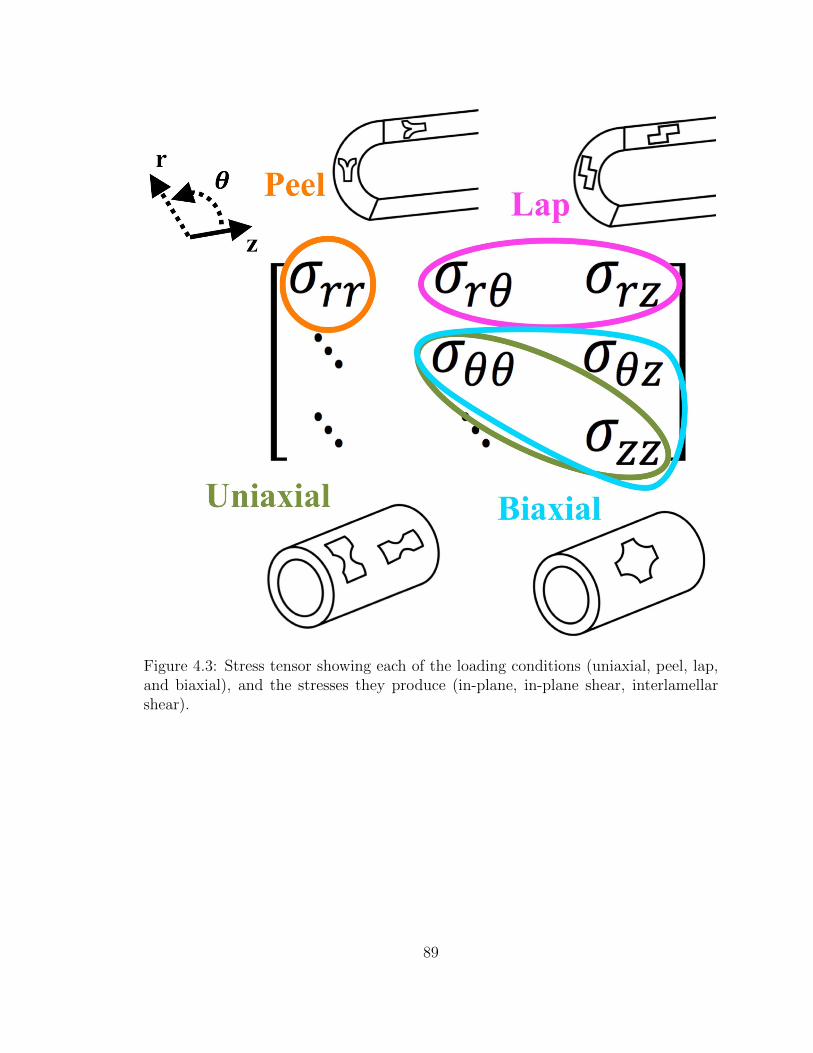
Figure 4.3: Stress tensor showing each of the loading conditions (uniaxial, peel, lap,and biaxial), and the stresses they produce (in-plane, in-plane shear, interlamellarshear).
89
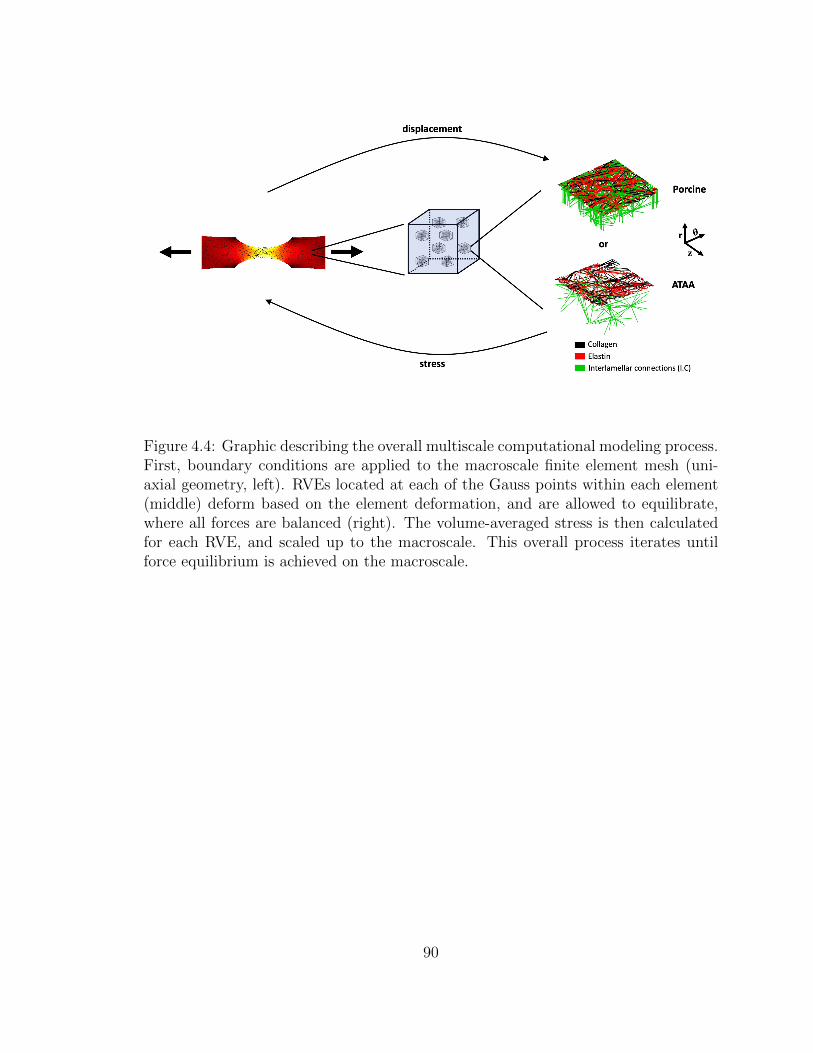
Figure 4.4: Graphic describing the overall multiscale computational modeling process.First, boundary conditions are applied to the macroscale finite element mesh (uni-axial geometry, left). RVEs located at each of the Gauss points within each element(middle) deform based on the element deformation, and are allowed to equilibrate,where all forces are balanced (right). The volume-averaged stress is then calculatedfor each RVE, and scaled up to the macroscale. This overall process iterates untilforce equilibrium is achieved on the macroscale.
90
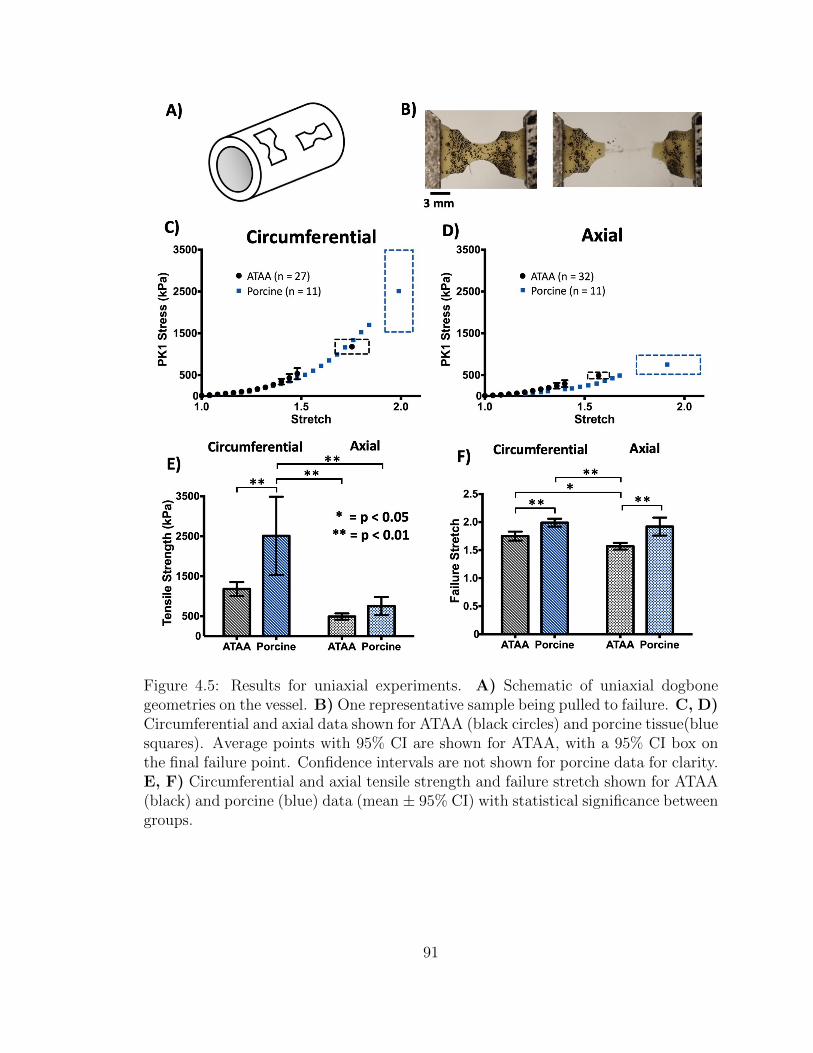
Figure 4.5: Results for uniaxial experiments. A) Schematic of uniaxial dogbonegeometries on the vessel. B) One representative sample being pulled to failure. C, D)Circumferential and axial data shown for ATAA (black circles) and porcine tissue(bluesquares). Average points with 95% CI are shown for ATAA, with a 95% CI box onthe final failure point. Confidence intervals are not shown for porcine data for clarity.E, F) Circumferential and axial tensile strength and failure stretch shown for ATAA(black) and porcine (blue) data (mean ± 95% CI) with statistical significance betweengroups.
91
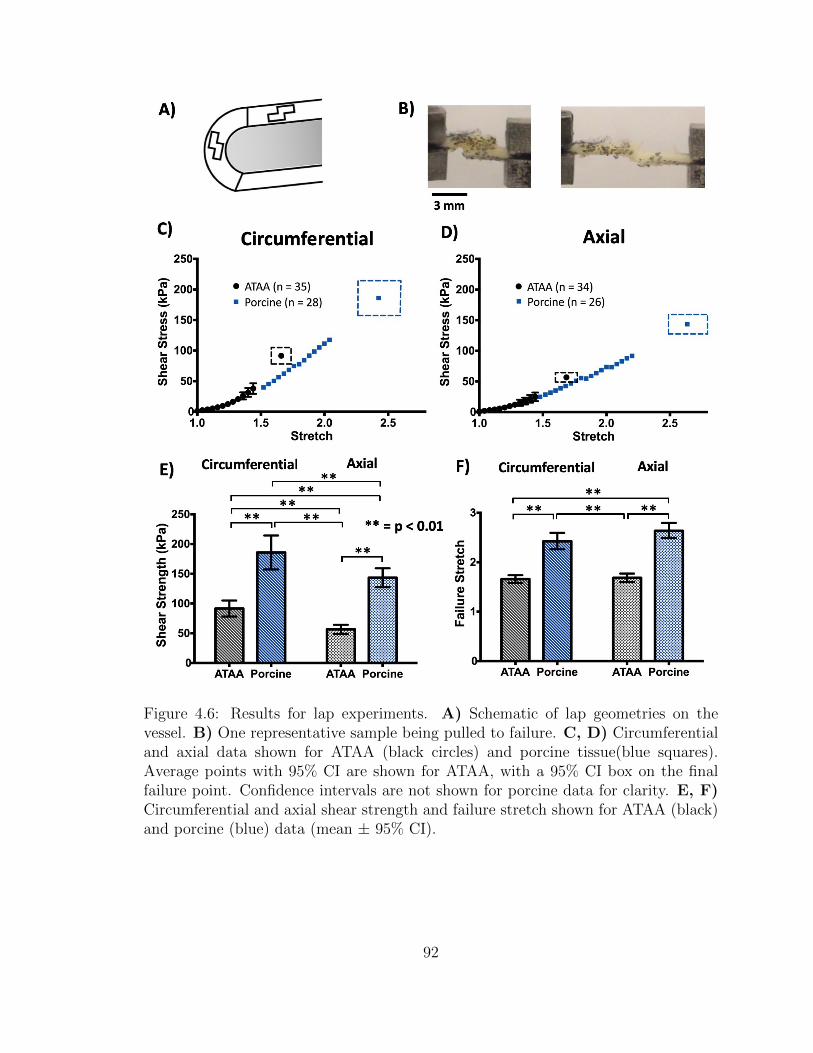
Figure 4.6: Results for lap experiments. A) Schematic of lap geometries on thevessel. B) One representative sample being pulled to failure. C, D) Circumferentialand axial data shown for ATAA (black circles) and porcine tissue(blue squares).Average points with 95% CI are shown for ATAA, with a 95% CI box on the finalfailure point. Confidence intervals are not shown for porcine data for clarity. E, F)Circumferential and axial shear strength and failure stretch shown for ATAA (black)and porcine (blue) data (mean ± 95% CI).
92
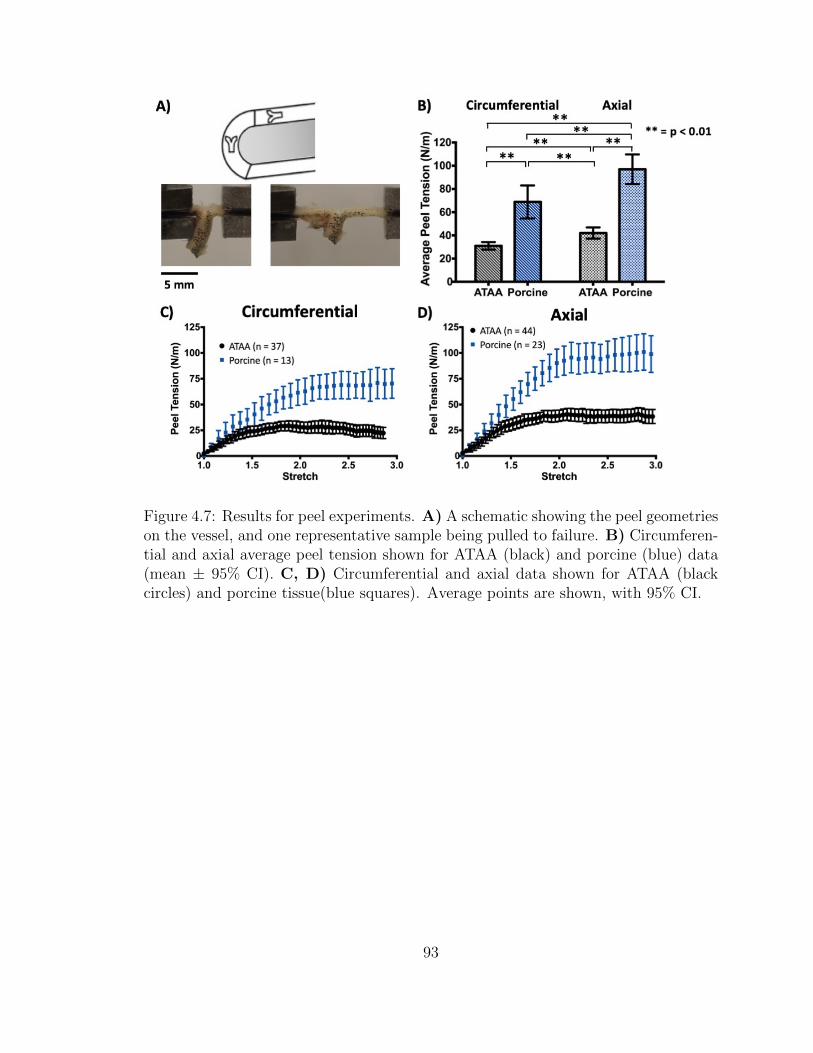
Figure 4.7: Results for peel experiments. A) A schematic showing the peel geometrieson the vessel, and one representative sample being pulled to failure. B) Circumferen-tial and axial average peel tension shown for ATAA (black) and porcine (blue) data(mean ± 95% CI). C, D) Circumferential and axial data shown for ATAA (blackcircles) and porcine tissue(blue squares). Average points are shown, with 95% CI.
93
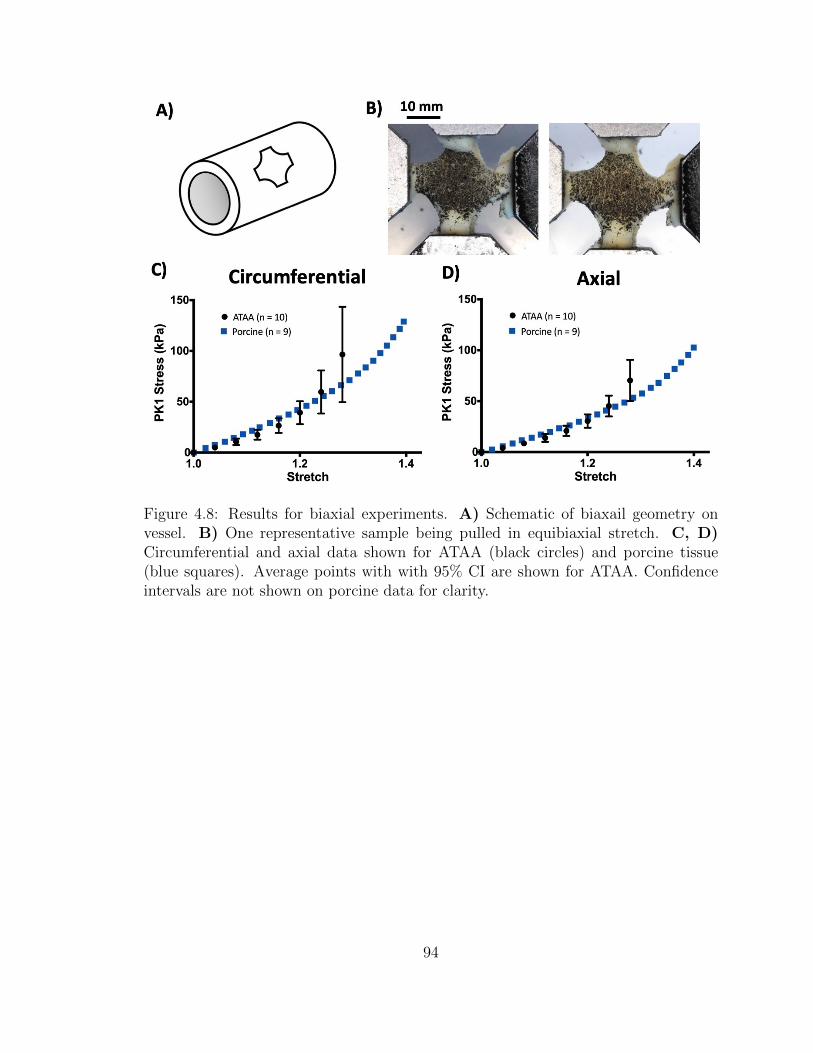
Figure 4.8: Results for biaxial experiments. A) Schematic of biaxail geometry onvessel. B) One representative sample being pulled in equibiaxial stretch. C, D)Circumferential and axial data shown for ATAA (black circles) and porcine tissue(blue squares). Average points with with 95% CI are shown for ATAA. Confidenceintervals are not shown on porcine data for clarity.
94
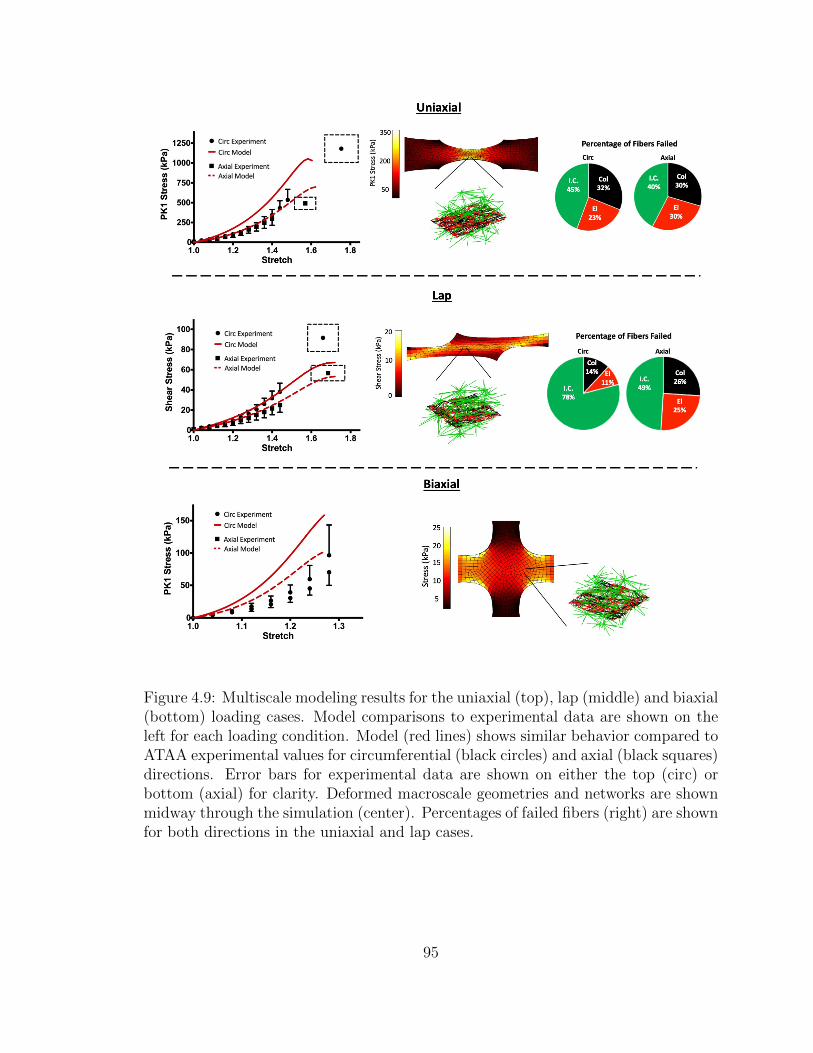
Figure 4.9: Multiscale modeling results for the uniaxial (top), lap (middle) and biaxial(bottom) loading cases. Model comparisons to experimental data are shown on theleft for each loading condition. Model (red lines) shows similar behavior compared toATAA experimental values for circumferential (black circles) and axial (black squares)directions. Error bars for experimental data are shown on either the top (circ) orbottom (axial) for clarity. Deformed macroscale geometries and networks are shownmidway through the simulation (center). Percentages of failed fibers (right) are shownfor both directions in the uniaxial and lap cases.
95
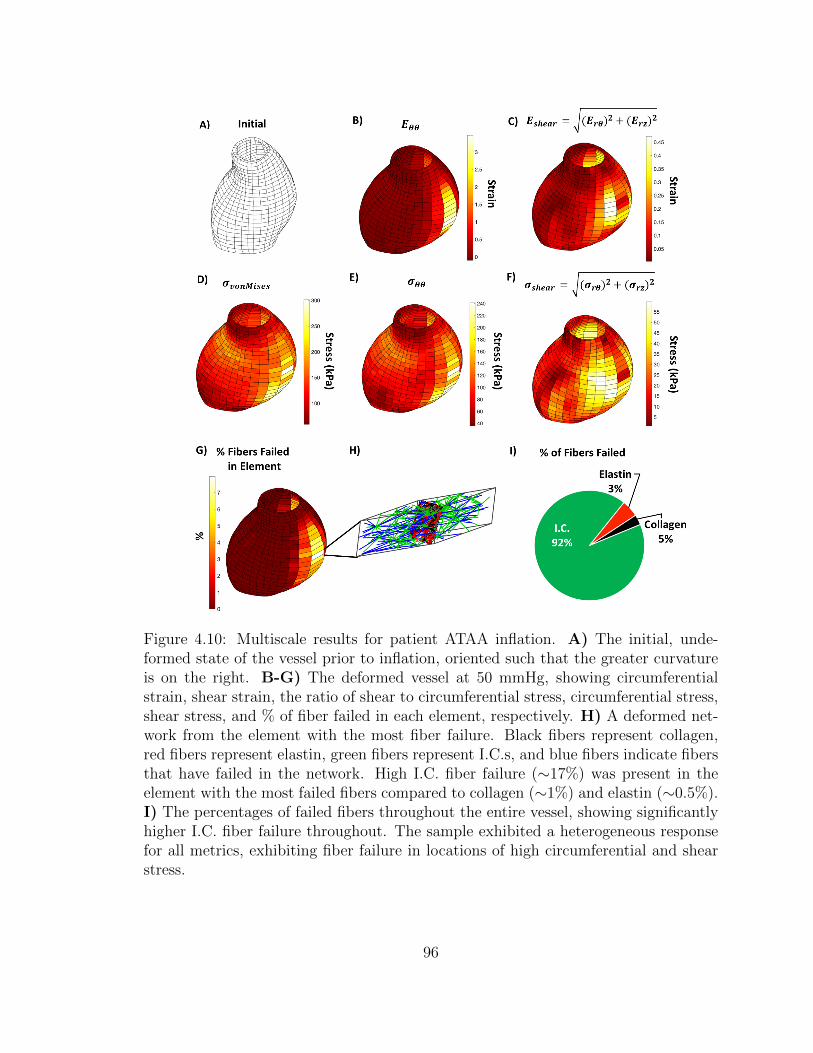
Figure 4.10: Multiscale results for patient ATAA inflation. A) The initial, unde-formed state of the vessel prior to inflation, oriented such that the greater curvatureis on the right. B-G) The deformed vessel at 50 mmHg, showing circumferentialstrain, shear strain, the ratio of shear to circumferential stress, circumferential stress,shear stress, and % of fiber failed in each element, respectively. H) A deformed net-work from the element with the most fiber failure. Black fibers represent collagen,red fibers represent elastin, green fibers represent I.C.s, and blue fibers indicate fibersthat have failed in the network. High I.C. fiber failure (∼17%) was present in theelement with the most failed fibers compared to collagen (∼1%) and elastin (∼0.5%).I) The percentages of failed fibers throughout the entire vessel, showing significantlyhigher I.C. fiber failure throughout. The sample exhibited a heterogeneous responsefor all metrics, exhibiting fiber failure in locations of high circumferential and shearstress.
96

4.6 Supplemental Results
4.6.1 Experimental
Uniaxial samples showed a significant difference (p < 0.01) in tensile strength between
the circumferential and axial directions (Fig. 4.11A), σθθ = 1308.6±226.5 kPa, σzz =
527.8±117.5 kPa (mean ± 95%CI) for the greater curvature and σθθ = 1044.2±307.6
kPa, σzz = 449.4± 113.3 kPa for the lesser curvature).
ATAA peel samples showed no significant difference in peel tension between the
circumferential and axial direction on the greater curvature (Fig. 4.11B, T peelθθ =
31.96± 4.93 N/m, T peelzz = 39.86± 5.82 N/m), but did show a statistically significant
(p < 0.01) difference in favor of the axial direction on the lesser curvature (T peelθθ =
30.0±4.45 N/m, T peelzz = 45.0±8.7 N/m). No significant difference was found between
the greater and lesser curvatures for either orientation.
When ATAA failure stresses and peel tension were normalized by respective
porcine values for the uniaxial, peel, and lap tests, there were no significant differences
between any of the orientations or loading conditions. Each sample exhibited roughly
half of the porcine tissue strength in every testing geometry and location (Fig. 4.12).
97
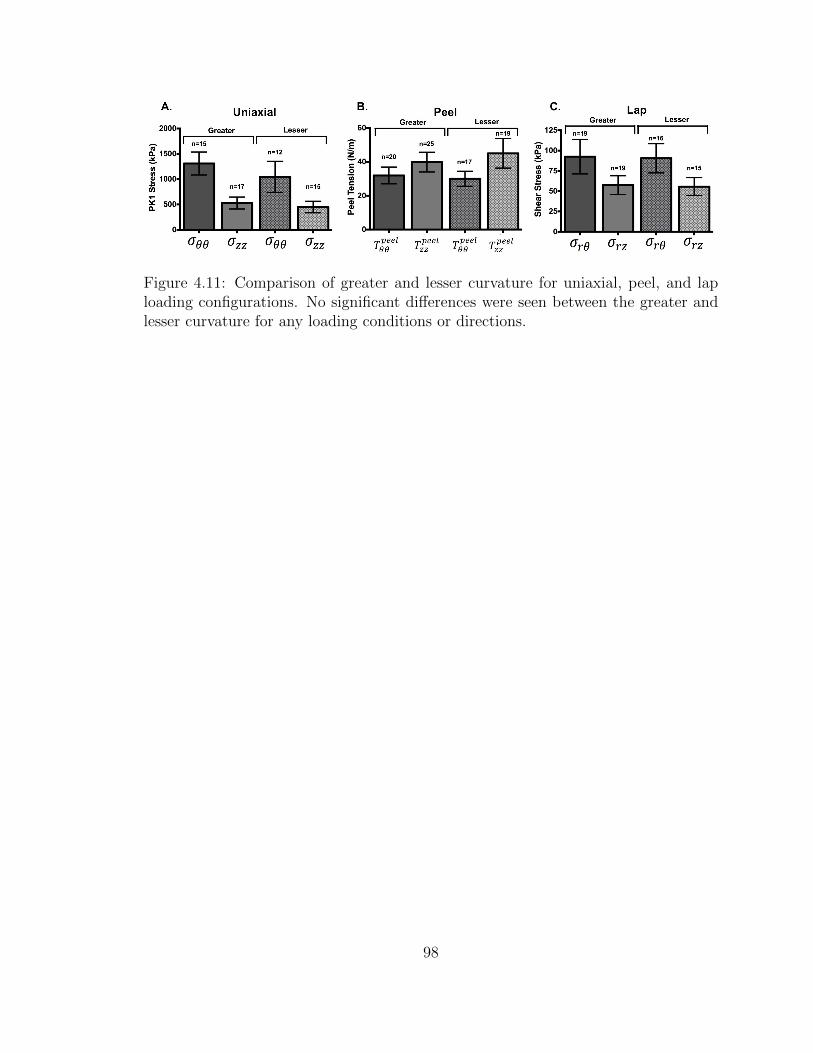
Figure 4.11: Comparison of greater and lesser curvature for uniaxial, peel, and laploading configurations. No significant differences were seen between the greater andlesser curvature for any loading conditions or directions.
98
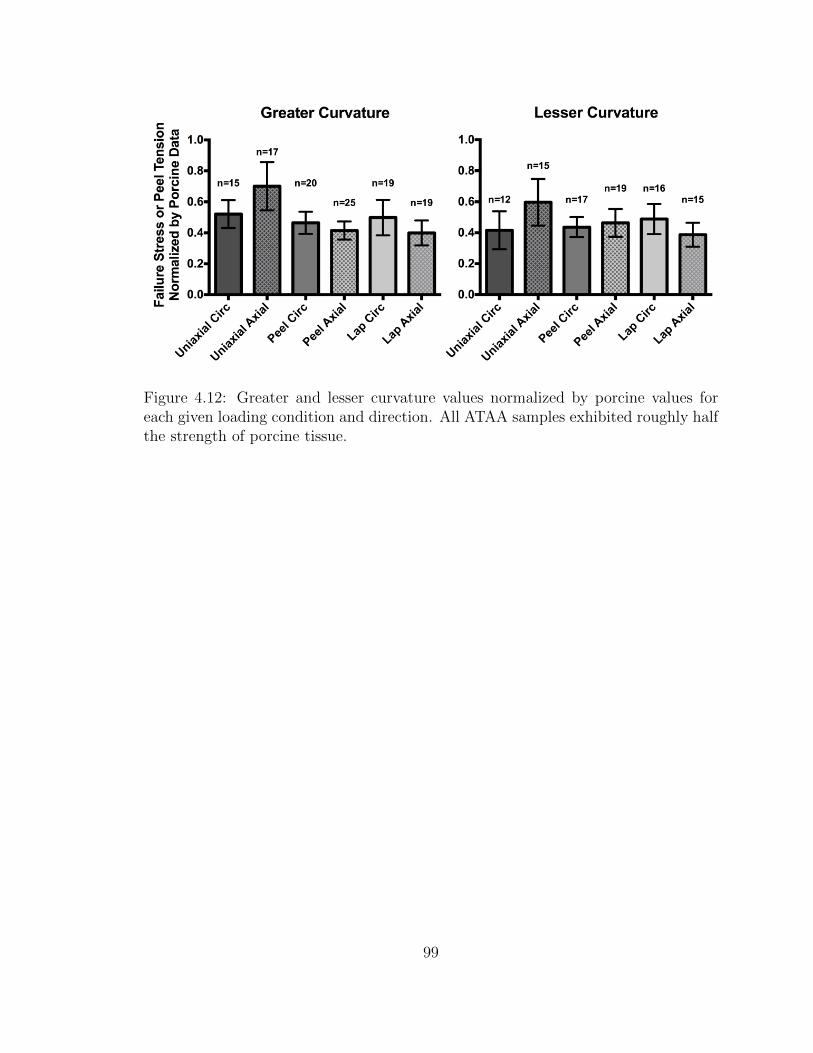
Figure 4.12: Greater and lesser curvature values normalized by porcine values foreach given loading condition and direction. All ATAA samples exhibited roughly halfthe strength of porcine tissue.
99
Chapter 5
The Contribution of Individual
Microstructural Components in
Arterial Mechanics and Failure
The content of this chapter is in preparation for a manuscript to submit by Korenczuk,
Blum, and Barocas. My contribution to the work was aiding in experimental testing
and data processing, along with preparing computational models.
5.1 Introduction
Elastin, collagen, and vascular smooth muscle cells (VSMCs) are the primary compo-
nents that comprise the microstructure of the arterial medial layer, playing a signifi-
cant role in the vessel’s mechanical response [Wagenseil and Mecham, 2009]. During
the course of the cardiac cycle, varying loading configurations are imposed on the
vessel wall, causing each microstructural component to experience different amounts
of combined loading. While macroscopic mechanical behavior, such as nonlinearity
100
and anisotropy, has been observed in vessel studies [Ferruzzi et al., 2011,Vorp et al.,
2003, Okamoto et al., 2002], the contribution of each individual constituent to the
overall vessel mechanics is still relatively unclear. Furthermore, it is unknown how
the responsibility of loading between these constituents shifts during aberrant remod-
eling, as in ascending thoracic aortic aneurysms (ATAAs), and how this changes the
overall failure mechanics of the vessel.
In the native aortic media, collagen and elastin comprise planar lamellar layers
that span the vessel thickness. Collagen exhibits a preferred orientation in the circum-
ferential direction, giving rise to vessel anisotropy, while elastin is relatively isotropic.
In cylindrical vessels, the planar layers bear a significant amount of loading during
expansion and contraction, as the vessel does not experience high amounts of shear.
In curved geometries, however, such as the ascending aorta, the loading imposed on
the vessel wall changes, introducing intramural shear (chapter 4, [Korenczuk et al.,
2019]). Intramural shear mechanically engages the interlamellar components, namely
VSMCs and fibrillin-1, and introduces them to the complex mechanical response of
the vessel. As these components do not typically bear mechanical load, the ves-
sel exhibits a much weaker response in shear loading conditions compared to tensile
loading [Witzenburg et al., 2017,Korenczuk et al., 2019].
In the pathological case of ATAAs, remodeling of the microstructural components
occurs. Typically, along with diameter enlargement and wall thinning, the pathology
is accompanied by disorganization or loss of elastin, collagen, VSMCs, and fibrillin
[Campa et al., 1987, Humphrey, 2013]. Due to the complex nature of the ATAA
pathology, it is difficult to understand how mechanical loading changes on the tissue,
and thus its underlying components. Previous work (chapter 4, [Korenczuk et al.,
2019]) has shown that the vessel is strongest in uniaxial loading, but weakest in shear
lap loading. Furthermore, during simulations of inflation, ATAAs experience a high
101
amount of shear loading, and exhibit high interlamellar fiber failure. These results
demand further interrogation of the mechanical contribution each constituent within
the vessel wall, to help understanding mechanical loading in cases such as ATAAs.
Selectively removing components via enzymatic digestion allows demarcation be-
tween constituent contributions to various loading configurations. Previous diges-
tion studies have removed collagen and/or elastin from aortic tissue [Gundiah et al.,
2007,Weisbecker et al., 2013,Schriefl et al., 2015] or carotid tissue [Fonck et al., 2007],
followed by uniaxial testing or pressurization. These studies found that elastin bore
more mechanical loading at low-stretch regimes, transitioning to collagen load bearing
at higher stretches. Furthermore, collagen was identified as the primary component in
tissue softening/damage [Weisbecker et al., 2013,Schriefl et al., 2015]. Though these
studies provide insight on the contribution of individual components in the arterial
wall, only one loading condition and 1-2 digestion groups were studied. This trend
is also seen in non-digestion studies on arterial mechanics, often exploring uniaxial
testing [Macrae et al., 2016, Garcıa-Herrera et al., 2012, Vorp et al., 2003, Okamoto
et al., 2002, Iliopoulos et al., 2009a, Duprey et al., 2010, Khanafer et al., 2011], but
showing a deficiency in shear testing [Sommer et al., 2016]. Testing shear loading
configurations is highly important, as the vessel may experience shear during infla-
tion, and many disease etiologies begin between the artery layers [Mazurek et al.,
2017]. Despite much progress in understanding vessel mechanics, there remains a
need to explore the role of each arterial component, in order to grasp the underlying
mechanisms behind important vascular diseases. Here, we use enzymatic digestion
to explore the role of collagen, elastin, and VSMCs on the mechanical composition
of porcine abdominal aortas in uniaxial and shear lap loading configurations. These
two test protocols were chosen to evaluate both normal and shear stress effects on
the tissue.
102
5.2 Methods
5.2.1 Experiments
Sample Preparation
Porcine abdominal aorta samples were sourced from the University of Minnesota’s
Visible Heart Lab and stored in 1x PBS solution for no longer than 24 hours post-
dissection. A total of (n=11) pigs were utilized over the course of this study, and
sample locations were randomized to account for animal variability.
Tissue thickness was measured using calipers by taking six measurements at dif-
ferent positions along the artery and calculating an average thickness. Uniaxial and
lap samples were prepared in a similar fashion to previous studies [Witzenburg et al.,
2017, Korenczuk et al., 2019]. All arteries were cut open along their axial lengths
to produce planar sections, allowing for uniaxial and lap samples to be cut in the
circumferential (θ) and axial (z) directions (Fig. 5.1).
Digestion Techniques
Different incubation times of collagenase, elastase, and SDS were chosen as inde-
pendent variables to observe the degradation rate of vessels under a single solution
concentration, attempting to isolate digestion of collagen, elastin, and VSMCs, re-
spectively.
Collagenase and elastase solutions were prepared (500 U ml-1, Type IV, Wor-
thington Biochemicals, NJ, USA, and 10 U ml-1, porcine pancreatic elastase, Wor-
thington Biochemicals, NJ, USA, respectively) in 1X Dulbecco’s phosphate-buffered
saline solution (Quality Biological, MD, USA). Samples were thoroughly cleaned and
incubated at 37° C for either 1, 3, 5, 7, or 9 hours [Mazurek et al., 2017]. All tissue was
103

completely submerged in buffered-media and thoroughly washed in 1X PBS following
treatments. SDS solutions were prepared in 1X phosphate-buffered saline solution
(PBS, Quality Biological, MD, USA). Samples were subjected to 2 cycles of 1 hour
in solution followed by a 5-minute rinse with PBS, then for a third cycle of 2 hours
in solution and a 5-minute rinse in PBS at room temperature on a rocker. Samples
were subsequently incubated at 4° C for either 24, 48, 72, or 96 hours. All samples
were imaged in their undeformed configuration and reserved for later analysis. Small
portions from each artery segment were collected after each digestion for histological
review.
Uniaxial Strain-to-Failure
Uniaxial and lap data was collected using a Microbionix Uniaxial Tester (University
of Minnesota, Tissue Mechanics Lab) and a 10 N load cell (MTS) attached to a
stationary backing. Samples were clamped into machined grips lined with sandpaper
to prevent slippage of the tissue. After the samples had been placed into the uniaxial
grips, the load cell was zeroed, and the actuator arm was moved so a 0.2 N pre-load
was measured. Once the preload was applied, each sample was imaged, and the initial
grip gauge length was measured via ImageJ. Samples were then pulled to failure at a
constant rate of 0.045 mm/s. To maintain tissue hydration during the experiments,
samples were placed in a 1X PBS bath at room temperature. Mechanical testing
of untreated tissue was conducted as a control. The Microbionix Uniaxial Tester
recorded the force and position from the 10N MTS load cell and the actuator arm.
The First Piola-Kirchhoff stress of uniaxial samples was calculated by dividing
the grip force by the original cross-sectional area of the neck. For lap samples, the
average shear stress was calculated as the force divided by the original overlap area
of the sample. Grip stretch was calculated for both samples by dividing the deformed
104
grip length by the original length.
5.3 Results
5.3.1 Experiments
Histology is shown for collagenase (Fig. 5.2), elastase (Fig. 5.3), and SDS (Fig.
5.4) groups. Control data (Fig. 5.5A, 5.6A, n = 4-5 for each) were used to estab-
lish baseline stress and strain values in the absence of matrix degradation enzymes
and validate the testing methods. As expected, the circumferential direction showed
greater stiffness in both the uniaxial and the lap tests. Individual data curves for
each of the digestion cases in uniaxial (Fig. 5.5) and lap (Fig. 5.6) configurations
showed a trend of decreasing mechanical strength with increasing digestion time, as
expected (n = 1-4 for each digestion case). In the subsequent examination of the
digested samples, we focused on the failure point, defined as the maximum stress,
and we calculated the average failure stress and failure stretch.
The average failure stresses and stretches are shown in Figs. 5.7 and 5.8. For the
collagenase and elastase groups (Figs. 5.7A,B and 5.8A,B), after an initial rise in fail-
ure stress at the 1-hour time point, especially in the uniaxial tests, further digestion
led to a gradual decline in failure stress indicative of a degraded collagen matrix. The
early strengthening can be attributed to a preliminary cross-linking of amino acids
located near the enzyme binding sites in the collagen [Snedeker and Gautieri, 2014].
This effect was most notable in the circumferential direction. Collagen and elastin
digestion showed little effect on failure stretch for either the uniaxial or the lap ge-
ometry. Besides a slight drop in the axial failure stretch for the collagenase case (Fig.
5.7A), the only notable trend is in the lap collagenase case. Here, the circumferential
direction saw an initial increase in failure stretch, followed by a declining trend, and
105
finally a sharp increase. The axial direction also experienced the same trend, only
with a longer initial increase, and quicker decrease in failure stretch with exceeding
digestion time. Whether these can be attributed to actual behavior, or noise due to
sample and test method variability, is unknown.
SDS treatment did not make any significant impact on the uniaxial loading case
for either failure stress or stretch (Fig. 5.7C). In the lap loading case (Fig. 5.8C),
however, the circumferential failure stress caused a declining trend (similar to the
lap collagenase and elastase groups), while the axial failure stress remained constant
until 96 hrs, where there was a sharp increase. Failure stretch was also affected, with
both circumferential and axial direction experiences upward trends with increasing
digestion time.
An additional observation, whose significance is not clear, is that while control lap
samples (circ and axial) and digested (collagenase and elastase) lap samples in the
circumferential direction failed in the overlap region, axial digested samples failed in
the sample arms. Since the arms of a lap sample are in extension during the test, this
shift in the location of the failure point may be driven by weakening of the tissue in
uniaxial extension as seen in Figure 5.5. Similarly, the drop-in failure stress during
lap testing (Fig. 5.6) is not necessarily an indication of weakening in shear but rather
a consequence of extreme weakening of the arms.
5.4 Discussion
Much is understood about the biological and biomechanical mechanisms that con-
tribute to vascular disease progression, but many aspects of mechanical contribution
remain unknown. The lack of available tissue from the onset of vascular disease to
its end stages makes ex-vivo digestion experiments a critical substitute. This study
106

examined the contributions of collagen, elastin, and VSMCs to the failure behavior
of the tissue in both shear and uniaxial extension.
When treating with collagenase, uniaxial testing showed a failure stress of half for
both directions compared to when treating with elastase. This trend highlights the
mechanical importance of collagen as a primary load-bearer within the vessel wall.
As collagen is degraded, the mechanical strength of the vessel decreases much more
compared to when elastin is degraded, similar to other studies [Schriefl et al., 2015].
Failure stretches for the two cases remained similar. Lap samples did not exhibit
as stark of a trend, with both collagenase and elastase groups showing very similar
failure stresses. Some trends may be present in the failure stretches of lap collagenase
samples (as mentioned previously), but overall there seems to be minimal effect on
the lap failure stretch with either collagenase or elastase treament.
SDS treatments seem to have minimal effect on the uniaxial strength of the vessel,
which affirms the primary mechanical role of the lamellar layer. As VSMCs were di-
gested, the uniaxial failure stress and stretch remained relatively constant. In the lap
loading case, however, some interesting trends did present themselves. Axial failure
stress remained constant, followed by a significant increase at 96 hrs of digestion. The
reason for this increase is unknown, but could be due to significant digestion effects
at long time points, where more than just VSMCs are digested after long periods
of exposure, causing unknown reorganization. Lap samples in the circumferential
direction, on the other hand, exhibited decreased failure stress with increased SDS
treatment. Though the amplitude of decline was about half as strong as the collage-
nase and elastase treatments, the decline is still present. This result confirms previous
results (chapter 4, [Korenczuk et al., 2019]) that suggest VSMCs (and other inter-
lamellar components) play a larger role in the mechanical response of the vessel in
shear than tensile loading. Furthermore, the failure stretch for both circumferential
107
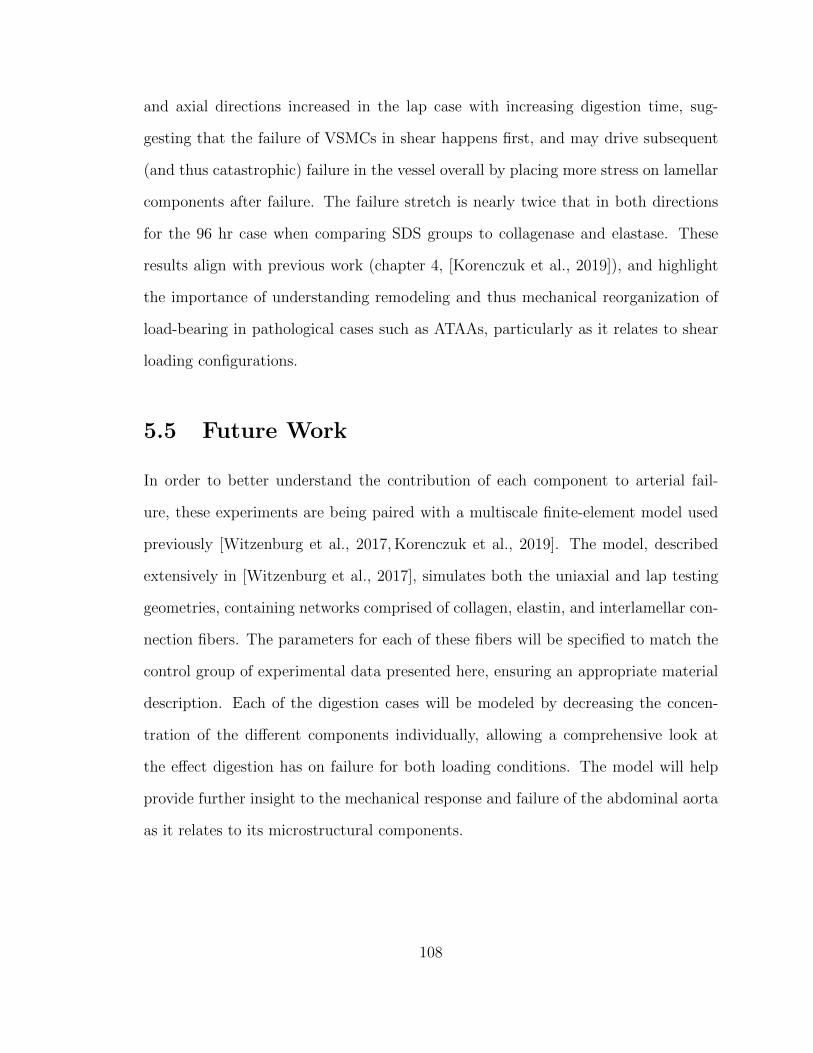
and axial directions increased in the lap case with increasing digestion time, sug-
gesting that the failure of VSMCs in shear happens first, and may drive subsequent
(and thus catastrophic) failure in the vessel overall by placing more stress on lamellar
components after failure. The failure stretch is nearly twice that in both directions
for the 96 hr case when comparing SDS groups to collagenase and elastase. These
results align with previous work (chapter 4, [Korenczuk et al., 2019]), and highlight
the importance of understanding remodeling and thus mechanical reorganization of
load-bearing in pathological cases such as ATAAs, particularly as it relates to shear
loading configurations.
5.5 Future Work
In order to better understand the contribution of each component to arterial fail-
ure, these experiments are being paired with a multiscale finite-element model used
previously [Witzenburg et al., 2017, Korenczuk et al., 2019]. The model, described
extensively in [Witzenburg et al., 2017], simulates both the uniaxial and lap testing
geometries, containing networks comprised of collagen, elastin, and interlamellar con-
nection fibers. The parameters for each of these fibers will be specified to match the
control group of experimental data presented here, ensuring an appropriate material
description. Each of the digestion cases will be modeled by decreasing the concen-
tration of the different components individually, allowing a comprehensive look at
the effect digestion has on failure for both loading conditions. The model will help
provide further insight to the mechanical response and failure of the abdominal aorta
as it relates to its microstructural components.
108
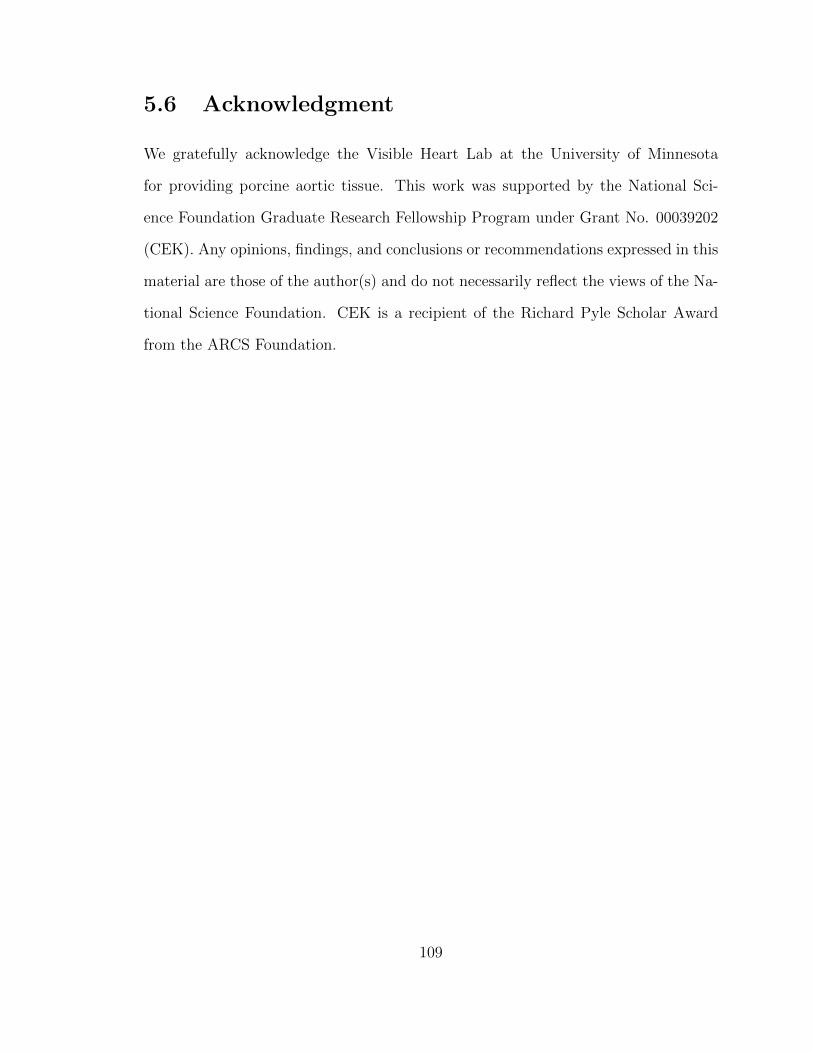
5.6 Acknowledgment
We gratefully acknowledge the Visible Heart Lab at the University of Minnesota
for providing porcine aortic tissue. This work was supported by the National Sci-
ence Foundation Graduate Research Fellowship Program under Grant No. 00039202
(CEK). Any opinions, findings, and conclusions or recommendations expressed in this
material are those of the author(s) and do not necessarily reflect the views of the Na-
tional Science Foundation. CEK is a recipient of the Richard Pyle Scholar Award
from the ARCS Foundation.
109
Figure 5.1: Uniaxial and lap testing geometries. Arrows indication the direction ofloading, and red outlines indicate the cross-sectional area used for the calculation ofstress.
110
Fig
ure
5.2:
His
tolo
gica
lst
ainin
gfo
rco
llag
enas
egr
oups.
111
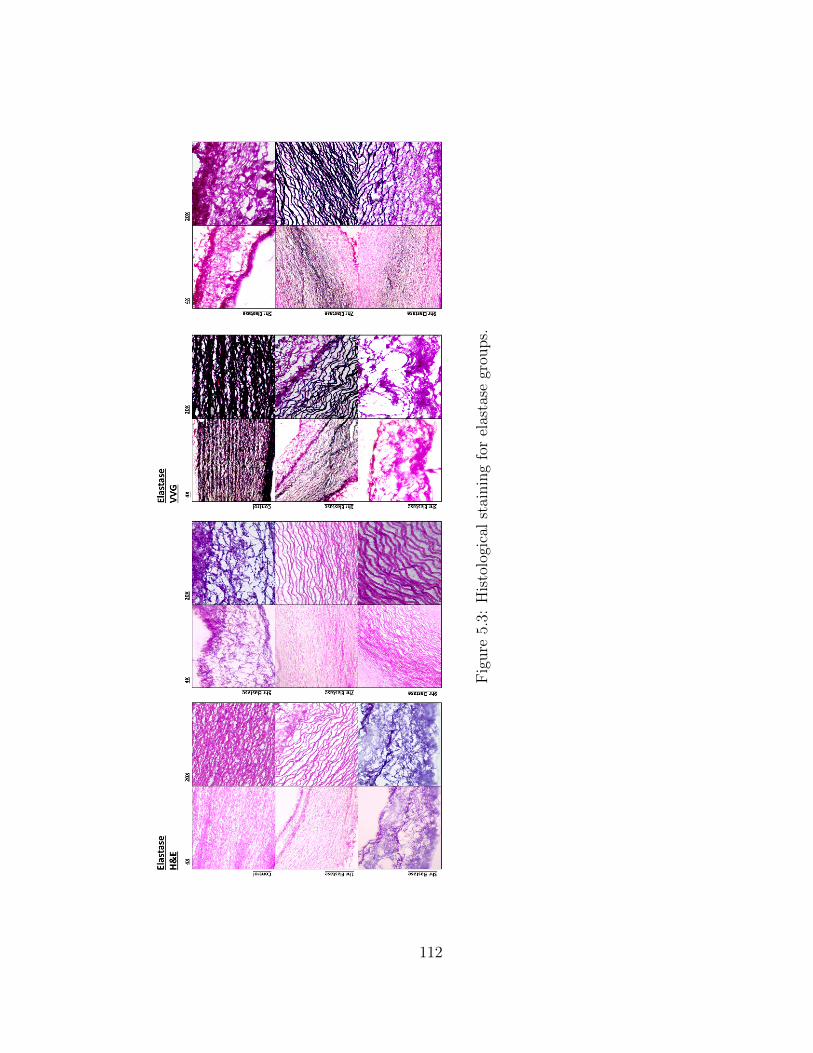
Fig
ure
5.3:
His
tolo
gica
lst
ainin
gfo
rel
asta
segr
oups.
112
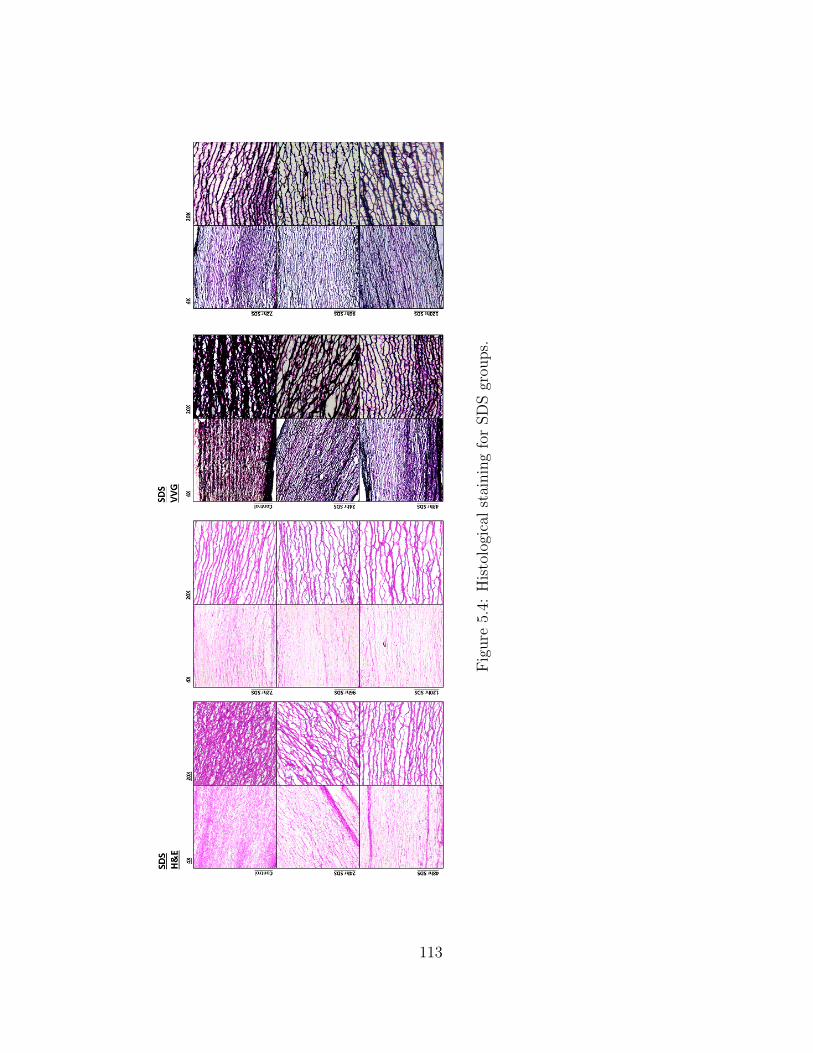
Fig
ure
5.4:
His
tolo
gica
lst
ainin
gfo
rSD
Sgr
oups.
113

Fig
ure
5.5:
A)
Str
ess/
stre
tch
plo
tssh
own
for
unia
xia
lco
ntr
ols.
Blu
e=
circ
um
fere
nti
al,
red
=ax
ial.
B)
Unia
xia
lco
llag
e-nas
e,tr
eatm
ent
tim
ein
dic
ated
by
figu
reti
tle.
C)
Unia
xia
lel
asta
se,
trea
tmen
tti
me
indic
ated
by
figu
reti
tle.
D)
Unia
xia
lSD
S,
trea
tmen
tti
me
indic
ated
by
figu
reti
tle.
114
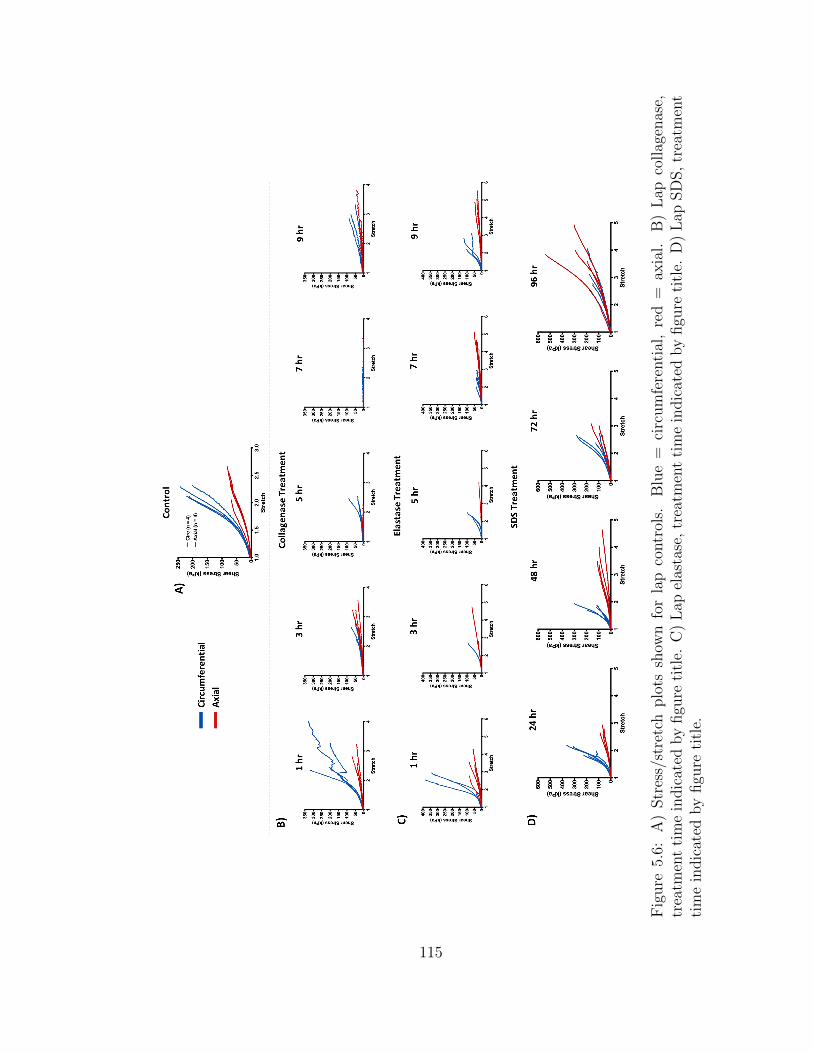
Fig
ure
5.6:
A)
Str
ess/
stre
tch
plo
tssh
own
for
lap
contr
ols.
Blu
e=
circ
um
fere
nti
al,
red
=ax
ial.
B)
Lap
collag
enas
e,tr
eatm
ent
tim
ein
dic
ated
by
figu
reti
tle.
C)
Lap
elas
tase
,tr
eatm
ent
tim
ein
dic
ated
by
figu
reti
tle.
D)
Lap
SD
S,
trea
tmen
tti
me
indic
ated
by
figu
reti
tle.
115
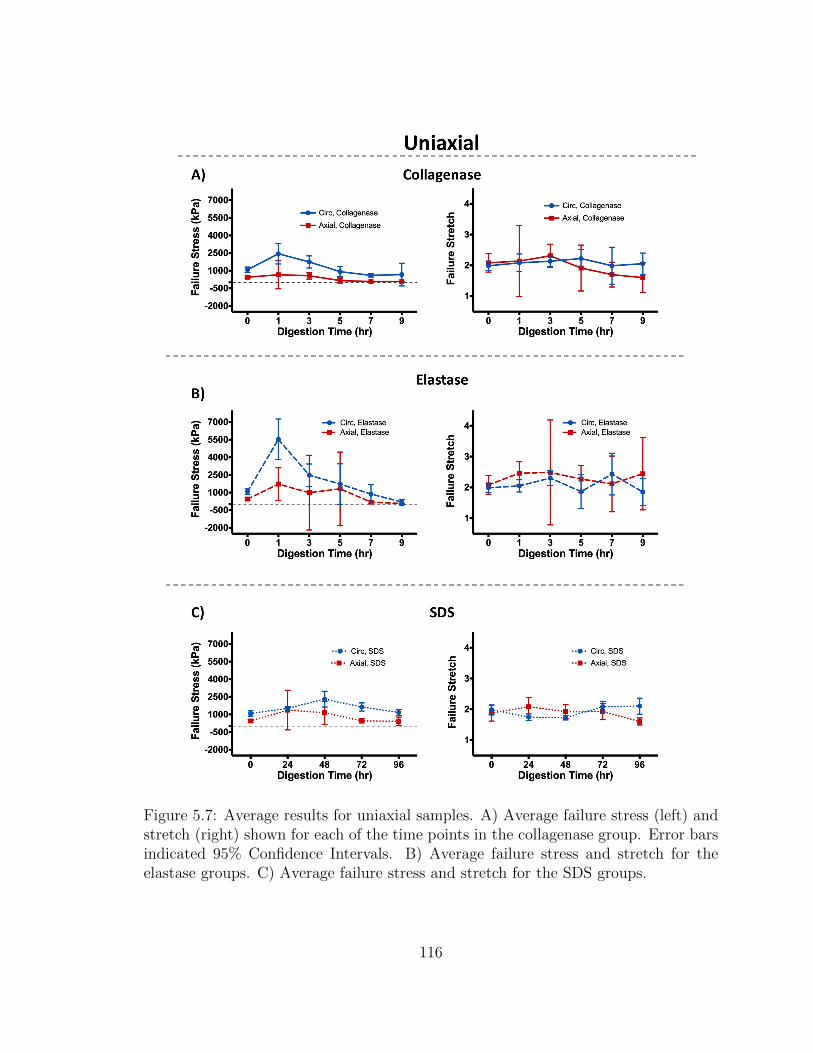
Figure 5.7: Average results for uniaxial samples. A) Average failure stress (left) andstretch (right) shown for each of the time points in the collagenase group. Error barsindicated 95% Confidence Intervals. B) Average failure stress and stretch for theelastase groups. C) Average failure stress and stretch for the SDS groups.
116
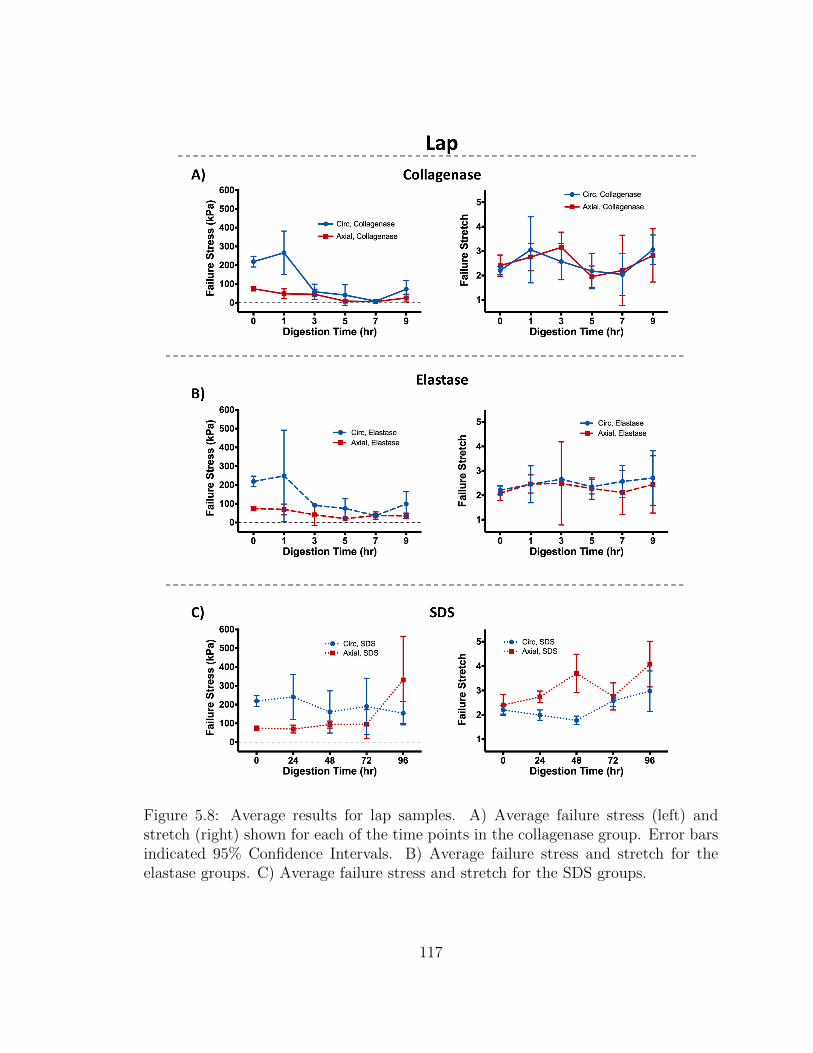
Figure 5.8: Average results for lap samples. A) Average failure stress (left) andstretch (right) shown for each of the time points in the collagenase group. Error barsindicated 95% Confidence Intervals. B) Average failure stress and stretch for theelastase groups. C) Average failure stress and stretch for the SDS groups.
117

Chapter 6
Conclusions and Future Work
6.1 Major Findings and Conclusions
The field of soft tissue mechanics, specifically the area of failure prediction, has made
significant strides over the past few decades as modeling capabilities continue to
increase. Predictive tools are becoming more accurate, and computational models
more readily available. The work presented here adds to a continuously growing field,
taking a systematic approach to analyze failure of cardiovascular tissues.
First, the practice of using isotropic failure criteria for anisotropic tissues was chal-
lenged in chapter 2, by exploring the Tsai-Hill failure criterion. We found that the
Tsai-Hill failure criterion, though relatively simplistic by definition, was able to pre-
dict failure in porcine abdominal aortic tissue more accurately than other commonly
used isotropic failure criteria. The Tsai-Hill failure criterion had better prediction in
the particular case of complex tissue loading, where shear stresses and strength play
a larger role.
Next, we explored the role of microstructural fiber alignment and density by in-
terrogating failure of myocardial infarcted tissue through a multiscale modeling ap-
118
proach in chapter 3. As cardiovascular tissues such as the heart and aorta rely heav-
ily on their microstructural components and organization, understanding how fiber
orientation affects failure in myocardial tissue is crucial. Our results showed that
heterogeneous fiber networks have a significant effect on the overall tissue response,
producing locations of high stress and strain within the tissue. Furthermore, tissue
simulations that incorporated heterogeneous networks saw drastically higher rates of
failure, highlighting the important role that fiber orientation plays in tissue response
and subsequent failure. Even when tissue samples with homogeneous and heteroge-
neous fiber networks shared the same average fiber direction and degree of alignment
for the overall sample, characteristics such as anisotropy, peak strain, peak stress,
and fiber failure differ greatly between the two cases.
In chapter 4, we expanded upon this modeling work, focusing on the complex
pathology of ATAAs. Our model considered several crucial factors which contribute
to ATAA failure, incorporating complex loading situations to specify accurate model
parameters, and simulating patient-specific ATAA failure. Our results highlighted
the lack of innate intramural shear strength in the tissue, and significant impact
shear stress may have on tissue failure. The tissue exhibited the lowest strength in
shear loading conditions, and also experienced high shear stresses during inflation
simulations, suggesting that shear strength and stress play a role in the delamination
and failure of ATAAs. Interlamellar connections also experienced the highest amount
of failure during inflation simulations, revealing that vessel response relies heavily on
the interlamellar components to bear mechanical load.
Lastly, in chapter 5, we explored the mechanical responsibility of each microstruc-
tural component within the aortic wall. Our preliminary results show that collagen
and elastin bear a large responsibility of the load in uniaxial loading conditions,
while VSMCs play a much larger role in shear loading conditions. These results,
119
taken collectively, exemplify the importance of accurate material descriptions and
failure criteria when predicting failure in complex tissues such as ATAAs. With the
understanding that both myocardial infarctions and ATAA tissue experience severe
microstructural remodeling, predictive tools should consider these aspects during me-
chanical assessment, as they play a significant role in the tissue response.
6.2 Future Directions
Though novel and important, the work here is certainly not exhaustive. The potential
for future studies to further develop and expand upon these results remains endless.
As a majority of my research has been spent studying the ATAA pathology, I will
provide some thoughts on possible next steps.
In chapter 4, we were able to produce one of the first multiscale computational
models of a patient ATAA geometry. The results provided extensive insight to the
behavior of ATAA tissue under inflation, but only one geometry was observed. In
order to better understand how shear plays a role, and whether the risk of failure can
be capture via modeling, more inflation simulations need to be performed. By growing
a larger database of inflation simulations, other potential risk factors may also be
observed, such as curvature, wall thickness, and tissue heterogeneity (i.e. calcifications
or other tissue defects). Furthermore, our model specified fiber parameters based
on an average of data collected from a variety of patients, and every network in
the model was similar in fiber density and orientation (i.e. spatial heterogeneity
was not considered). Future models could specify parameters to fit different patient
demographics and tissue conditions, creating a more patient-specific approach.
Additionally, inflation simulations can be performed on patients with longitudinal
CT scans. Due to the often slow-progressing failure or delamination of ATAAs, there
120
are times when the location of failure initiation can be observed via CT. By simulating
the geometry in a state prior to failure, risk factors, such as shear stress, can be
examined to see if they can predict locations of actual patient tissue failure. The
ability to observe failure progression and initiation is often unavailable when analyzing
soft tissue failure, making the ATAA pathology a unique case of failure development.
Furthermore, the multiscale model could be expanded to incorporate other aspects,
such as fiber remodeling (i.e. deposition and removal) and active cell contraction,
which both play a role in the progression and response of ATAAs.
While the multiscale model presents an in-depth look into tissue failure by incor-
porating fibrous components, the ultimate goal is to provide better predictive tools
to inform physician risk assessment. Large mesh geometries paired with extensive fi-
brous networks yields a rather computational expensive tool that requires substantial
user input. Once key risk contributors are identified, the implications can be distilled
into a simpler model that allows for more clinical impact. The potential of using a
simplified hyper-elastic model through automated segmentation and inflation would
be tangibly beneficial to the medical field, given that risk contributors can be easily
assessed, and a comprehensive risk assessment compiled.
It is clear that measurements of aneurysm size do not fully capture the risk of
failure, nor the role of each mechanical contributor during the complex remodeling of
the pathology. It is also clear that the ATAA condition imposes a severely detrimental
impact on the quality and survival of human life. It remains my hope that one day,
the work compiled here can contribute to the creation of better predictive tools for
assessing the risk of ATAA failure, ultimately improving patient outcomes.
121

Bibliography
[Abdelmohsen et al., 2012] Abdelmohsen, K., Tominaga-Yamanaka, K., Srikantan,S., Yoon, J. H., Kang, M. J., and Gorospe, M. (2012). RNA-binding protein AUF1represses Dicer expression. Nucleic Acids Research.
[Agarwal et al., 2006] Agarwal, B., Broutman, L., and Chandrashekhara, K. (2006).Analysis and performance of fiber composites. John Wiley & Sons.
[Aktas and Karakuzu, 1999] Aktas, A. and Karakuzu, R. (1999). Failure Analysisof Two-Dimensional Carbon-Epoxy Composite Plate Pinned Joint. Mechanics ofComposite Materials and Structures, 6:347–361.
[Alford et al., 2008] Alford, P. W., Humphrey, J. D., and Taber, L. A. (2008). Growthand remodeling in a thick-walled artery model: Effects of spatial variations in wallconstituents. Biomechanics and Modeling in Mechanobiology.
[Alford and Taber, 2008] Alford, P. W. and Taber, L. A. (2008). Computationalstudy of growth and remodelling in the aortic arch. Computer Methods in Biome-chanics and Biomedical Engineering.
[Arola and Ramulu, 1997] Arola, D. and Ramulu, M. (1997). Orthogonal cutting offiber-reinforced composites: A finite element analysis. International Journal ofMechanical Sciences, 39(5):597–613.
[ASTM, 2001] ASTM (2001). Standard Test Method for Lap Shear Adhesion forFiber Reinforced Plastic (FRP) Bonding. Standards.
[Avanzini et al., 2014] Avanzini, A., Battini, D., Bagozzi, L., and Bisleri, G. (2014).Biomechanical Evaluation of Ascending Aortic Aneurysms. BioMed Research In-ternational.
[Azadani et al., 2013] Azadani, A. N., Chitsaz, S., Mannion, A., Mookhoek, A., Wis-neski, A., Guccione, J. M., Hope, M. D., Ge, L., and Tseng, E. E. (2013). Biome-chanical Properties of Human Ascending Thoracic Aortic Aneurysms. Annals ofThoracic Surgery, 96(1):50–58.
122
[Babu et al., 2015] Babu, A. R., Byju, A. G., and Gundiah, N. (2015). BiomechanicalProperties of Human Ascending Thoracic Aortic Dissections. Journal of Biome-chanical Engineering.
[Baek et al., 2007] Baek, S., Gleason, R. L., Rajagopal, K. R., and Humphrey, J. D.(2007). Theory of small on large: Potential utility in computations of fluid-solidinteractions in arteries. Computer Methods in Applied Mechanics and Engineering,196(31-32):3070–3078.
[Balakhovsky et al., 2014] Balakhovsky, K., Jabareen, M., and Volokh, K. Y. (2014).Modeling rupture of growing aneurysms. Journal of Biomechanics, 47(3):653–658.
[Ban et al., 2017] Ban, E., Zhang, S., Zarei, V., Barocas, V., Winkelstein, B., andPicu, C. (2017). Collagen organization in facet capsular ligaments varies withspinal region and with ligament deformation. Journal of Biomechanical Engineer-ing, 139(7):071009.
[Beisang et al., 2012] Beisang, D., Rattenbacher, B., Vlasova-St Louis, I. A., andBohjanens, P. R. (2012). Regulation of CUG-Binding Protein 1 (CUGBP1) bindingto target transcripts upon T cell activation. Journal of Biological Chemistry.
[Beller et al., 2004] Beller, C. J., Labrosse, M. R., Thubrikar, M. J., and Robicsek,F. (2004). Role of aortic root motion in the pathogenesis of aortic dissection.Circulation, 109(6):763–769.
[Benjamin et al., 2018] Benjamin, E., Virani, S., Callaway, C., Chamberlain, A.,Chang, A., Cheng, S., Chiuve, S., Cushman, M., Delling, F., Deo, R., de Fer-ranti, S., Ferguson, J., Fornage, M., Gillespie, C., Isasi, C., Jimenez, M., Jordan,L., Judd, S., Lackland, D., Lichtman, J., Lisabeth, L., Liu, S., Longnecker, C.,Lutsey, P., Mackey, J., Matchar, D., Matsushita, K., Mussolino, M., Nasir, K.,O’Flaherty, M., Palaniappan, L., Pandey, A., Pandey, D., Reeves, M., Ritchey,M., Rodrigues, C., Roth, G., Rosamond, W., Sampson, U., Satou, G., Shah, S.,Spartano, N., Tirschwell, D., Tsao, C., Jenifer, V., Willey, J., Wilkins, J., Wu,J., Alger, H., Wong, S., and Muntner, P. (2018). Heart disease and stroke statis-tics - 2018 update: A report from the American Heart Association. Circulation,137(12):e67–e492.
[Benyumov et al., 2012] Benyumov, A. O., Hergert, P., Herrera, J., Peterson, M.,Henke, C., and Bitterman, P. B. (2012). A Novel Zebrafish Embryo Xenotransplan-tation Model to Study Primary Human Fibroblast Motility in Health and Disease.Zebrafish.
[Berger and Elefteriades, 2012] Berger, J. A. and Elefteriades, J. A. (2012). Towarduniformity in reporting of thoracic aortic diameter.
123

[Booth et al., 2012] Booth, A. J., Hadley, R., Cornett, A. M., Dreffs, A. A., Matthes,S. A., Tsui, J. L., Weiss, K., Horowitz, J. C., Fiore, V. F., Barker, T. H., Moore,B. B., Martinez, F. J., Niklason, L. E., and White, E. S. (2012). Acellular normaland fibrotic human lung matrices as a culture system for in vitro investigation.American Journal of Respiratory and Critical Care Medicine.
[Caliari et al., 2016] Caliari, S. R., Vega, S. L., Kwon, M., Soulas, E. M., and Burdick,J. A. (2016). Dimensionality and spreading influence MSC YAP/TAZ signaling inhydrogel environments. Biomaterials.
[Campa et al., 1987] Campa, J. S., Greenhalgh, R. M., and Powell, J. T. (1987).Elastin degradation in abdominal aortic aneurysms. Atherosclerosis, 65(1):13–21.
[Cezayirlioglu et al., 1985] Cezayirlioglu, H., Bahniuk, E., Davy, D. T., and Heiple,K. G. (1985). Anisotropic yield behavior of bone under combined axial force andtorque. Journal of Biomechanics, 18(1):61–69.
[Chandran et al., 2008] Chandran, P. L., Stylianopoulos, T., and Barocas, V. H.(2008). Microstructure-Based, Multiscale Modeling for the Mechanical Behaviorof Hydrated Fiber Networks. Multiscale Modeling & Simulation.
[Chaudhuri et al., 2015] Chaudhuri, O., Gu, L., Darnell, M., Klumpers, D.,Bencherif, S. A., Weaver, J. C., Huebsch, N., and Mooney, D. J. (2015). Sub-strate stress relaxation regulates cell spreading. Nature Communications.
[Chaudhuri et al., 2016] Chaudhuri, O., Gu, L., Klumpers, D., Darnell, M.,Bencherif, S. A., Weaver, J. C., Huebsch, N., Lee, H. P., Lippens, E., Duda, G. N.,and Mooney, D. J. (2016). Hydrogels with tunable stress relaxation regulate stemcell fate and activity. Nature Materials.
[Chaulk et al., 2014] Chaulk, S. G., Lattanzi, V. J., Hiemer, S. E., Fahlman, R. P.,and Varelas, X. (2014). The hippo pathway effectors TAZ/YAP regulate dicer ex-pression and MicroRNA biogenesis through Let-7. Journal of Biological Chemistry.
[Chen et al., 2015] Chen, Y., Mohammed, A., Oubaidin, M., Evans, C. A., Zhou,X., Luan, X., Diekwisch, T. G., and Atsawasuwan, P. (2015). Cyclic stretch andcompression forces alter microRNA-29 expression of human periodontal ligamentcells. Gene.
[Choudhury et al., 2009] Choudhury, N., Bouchot, O., Rouleau, L., Tremblay, D.,Cartier, R., Butany, J., Mongrain, R., and Leask, R. L. (2009). Local mechanicaland structural properties of healthy and diseased human ascending aorta tissue.Cardiovascular Pathology, 18(2):83–91.
[Chuong and Fung, 1983] Chuong, C. J. and Fung, Y. C. (1983). Three-dimensionalstress distribution in arteries. Journal of Biomechanical Engineering, 105(3):268–274.
124
[Claeson and Barocas, 2017] Claeson, A. A. and Barocas, V. H. (2017). Planar biaxialextension of the lumbar facet capsular ligament reveals significant in-plane shearforces. Journal of the Mechanical Behavior of Biomedical Materials, 65:127–136.
[Clark and Glagov, 1985] Clark, J. M. and Glagov, S. (1985). Transmural organiza-tion of the arterial media. The lamellar unit revisited. Arteriosclerosis: An OfficialJournal of the American Heart Association, Inc., 5(1):19–34.
[Clarke et al., 2016] Clarke, S. A., Richardson, W. J., and Holmes, J. W. (2016).Modifying the mechanics of healing infarcts: Is better the enemy of good? Journalof Molecular and Cellular Cardiology, 93:115–124.
[Cleveland Clinic, 2014] Cleveland Clinic (2014). Thoracic Aortic Aneurysm.
[Clouthier et al., 2015] Clouthier, A. L., Hosseini, H. S., Maquer, G., and Zysset,P. K. (2015). Finite element analysis predicts experimental failure patterns invertebral bodies loaded via intervertebral discs up to large deformation. MedicalEngineering and Physics, 37(6):599–604.
[Coady et al., 1999] Coady, M. A., Rizzo, J. A., Hammond, G. L., Kopf, G. S.,and Elefteriades, J. A. (1999). Surgical intervention criteria for thoracic aorticaneurysms: a study of growth rates and complications. The Annals of ThoracicSurgery, 67(6):1922–1926.
[Codelia et al., 2014] Codelia, V. A., Sun, G., and Irvine, K. D. (2014). Regulationof YAP by mechanical strain through Jnk and Hippo signaling. Current Biology.
[Conrad et al., 2014] Conrad, T., Marsico, A., Gehre, M., and Ørom, U. A. (2014).Microprocessor activity controls differential miRNA biogenesis in vivo. Cell Re-ports.
[Cortes et al., 2010] Cortes, D. H., Lake, S. P., Kadlowec, J. A., Soslowsky, L. J.,and Elliott, D. M. (2010). Characterizing the mechanical contribution of fiberangular distribution in connective tissue: Comparison of two modeling approaches.Biomechanics and Modeling in Mechanobiology, 9(5):651–658.
[Cosgrove et al., 2016] Cosgrove, B. D., Mui, K. L., Driscoll, T. P., Caliari, S. R.,Mehta, K. D., Assoian, R. K., Burdick, J. A., and Mauck, R. L. (2016). N-cadherinadhesive interactions modulate matrix mechanosensing and fate commitment ofmesenchymal stem cells. Nature Materials.
[Cowin, 1986] Cowin, S. C. (1986). Fabric Dependence of an Anistropic StrengthCriterion. Mechanics of Materials, 5:251–260.
[Cretu et al., 2010] Cretu, A., Castagnino, P., and Assoian, R. (2010). Studying theEffects of Matrix Stiffness on Cellular Function using Acrylamide-based Hydrogels.Journal of Visualized Experiments.
125
[Cruz et al., 2007] Cruz, C., Sousa, A. R., Madureira, A. J., Pinho, T., Ramos, I.,Pinho, P., Silva Cardoso, J., and Maciel, M. J. (2007). Number 13-07: An Impor-tant Tool Before A Tetralogy of Fallot Reoperation.
[Davies et al., 2006] Davies, R. R., Gallo, A., Coady, M. A., Tellides, G., Botta,D. M., Burke, B., Coe, M. P., Kopf, G. S., and Elefteriades, J. A. (2006). Novelmeasurement of relative aortic size predicts rupture of thoracic aortic aneurysms.Annals of Thoracic Surgery.
[Davies et al., 2002] Davies, R. R., Goldstein, L. J., Coady, M. A., Tittle, S. L., Rizzo,J. A., Kopf, G. S., and Elefteriades, J. A. (2002). Yearly rupture or dissectionrates for thoracic aortic aneurysms: simple prediction based on size. The Annalsof Thoracic Surgery, 73(1):17–28.
[Derrien et al., 2000] Derrien, K., Fitoussi, J., Guo, G., and Baptiste, D. (2000).Prediction of the effective damage properties and failure properties of nonlinearanisotropic discontinuous reinforced composites. Computer Methods in AppliedMechanics and Engineering, 185(2-4):93–107.
[Dewald et al., 2004] Dewald, O., Ren, G., Duerr, G. D., Zoerlein, M., Klemm, C.,Gersch, C., Tincey, S., Michael, L. H., Entman, M. L., and Frangogiannis, N. G.(2004). Of mice and dogs: species-specific differences in the inflammatory responsefollowing myocardial infarction. The American journal of pathology, 162(4):665–677.
[Dhume et al., 2018] Dhume, R. Y., Shih, E. D., and Barocas, V. H. (2018). Multi-scale model of fatigue of collagen gels. Biomechanics and Modeling in Mechanobi-ology, 18(1):175–187.
[Dingemans et al., 2000] Dingemans, K. P., Teeling, P., Lagendijk, J. H., and Becker,A. E. (2000). Extracellular matrix of the human aortic media: An ultrastructuralhistochemical and immunohistochemical study of the adult aortic media. Anatom-ical Record.
[Dobrin, 1978] Dobrin, P. B. (1978). Mechanical Properties of Arteries. PhysiologicalReviews, 58(2):397–460.
[Dotter et al., 1950] Dotter, C. T., Roberts, D. J., and Steinberg, I. (1950). Aorticlength: angiocardiographic measurements. Circulation.
[Doyle et al., 2009] Doyle, B. J., Callanan, A., Burke, P. E., Grace, P. A., Walsh,M. T., Vorp, D. A., and McGloughlin, T. M. (2009). Vessel asymmetry as anadditional diagnostic tool in the assessment of abdominal aortic aneurysms. Journalof Vascular Surgery, 49(2):443–454.
126
[Doyle et al., 2010] Doyle, B. J., Cloonan, A. J., Walsh, M. T., Vorp, D. A., and Mc-Gloughlin, T. M. (2010). Identification of rupture locations in patient-specific ab-dominal aortic aneurysms using experimental and computational techniques. Jour-nal of Biomechanics, 43(7):1408–1416.
[Dufort et al., 2011] Dufort, C. C., Paszek, M. J., and Weaver, V. M. (2011). Bal-ancing forces: Architectural control of mechanotransduction.
[Duprey et al., 2010] Duprey, A., Khanafer, K., Schlicht, M., Avril, S., Williams, D.,and Berguer, R. (2010). In vitro characterisation of physiological and maximumelastic modulus of ascending thoracic aortic aneurysms using uniaxial tensile test-ing. European Journal of Vascular and Endovascular Surgery, 39(6):700–707.
[Duprey et al., 2016] Duprey, A., Trabelsi, O., Vola, M., Favre, J. P., and Avril, S. S.(2016). Biaxial rupture properties of ascending thoracic aortic aneurysms. ActaBiomaterialia, 42:273–285.
[Duthon et al., 2006] Duthon, V. B., Barea, C., Abrassart, S., Fasel, J. H., Fritschy,D., and Menetrey, J. (2006). Anatomy of the anterior cruciate ligament. KneeSurgery, Sports Traumatology, Arthroscopy, 14(3):204–213.
[Elefteriades, 2002] Elefteriades, J. A. (2002). Natural history of thoracic aorticaneurysms: indications for surgery, and surgical versus nonsurgical risks. TheAnnals of Thoracic Surgery, 74(5):S1877–S1880.
[Elefteriades, 2010] Elefteriades, J. A. (2010). Indications for aortic replacement. InJournal of Thoracic and Cardiovascular Surgery.
[Etz et al., 2012] Etz, C. D., Misfeld, M., Borger, M. A., Luehr, M., Strotdrees, E.,and Mohr, F. W. (2012). Current indications for surgical repair in patients withbicuspid aortic valve and ascending Aortic Ectasia.
[Feerick et al., 2013] Feerick, E. M., Liu, X. C., and McGarry, P. (2013). Anisotropicmode-dependent damage of cortical bone using the extended finite element method(XFEM). Journal of the Mechanical Behavior of Biomedical Materials, 20:77–89.
[Ferrara and Pandolfi, 2008] Ferrara, A. and Pandolfi, A. (2008). Numerical mod-elling of fracture in human arteries. Computer Methods in Biomechanics andBiomedical Engineering.
[Ferruzzi et al., 2011] Ferruzzi, J., Vorp, D. A., and Humphrey, J. D. (2011). Onconstitutive descriptors of the biaxial mechanical behaviour of human abdominalaorta and aneurysms. Journal of the Royal Society Interface.
[Fomovsky et al., 2012a] Fomovsky, G. M., Clark, S. A., Parker, K. M., Ailawadi,G., and Holmes, J. W. (2012a). Anisotropic reinforcement of acute anteroapicalinfarcts improves pump function. Circulation: Heart Failure, 5(4):515–522.
127
[Fomovsky and Holmes, 2009] Fomovsky, G. M. and Holmes, J. W. (2009). Evolu-tion of scar structure, mechanics, and ventricular function after myocardial infarc-tion in the rat. American Journal of Physiology-Heart and Circulatory Physiology,298(1):H221–H228.
[Fomovsky et al., 2011] Fomovsky, G. M., MacAdangdang, J. R., Ailawadi, G., andHolmes, J. W. (2011). Model-based design of mechanical therapies for myocardialinfarction. Journal of Cardiovascular Translational Research, 4(1):82–91.
[Fomovsky et al., 2012b] Fomovsky, G. M., Rouillard, A. D., and Holmes, J. W.(2012b). Regional mechanics determine collagen fiber structure in healing my-ocardial infarcts. Journal of Molecular and Cellular Cardiology, 52(5):1083–1090.
[Fonck et al., 2007] Fonck, E., Prod’hom, G., Roy, S., Augsburger, L., Rufenacht,D. A., and Stergiopulos, N. (2007). Effect of elastin degradation on carotid wallmechanics as assessed by a constituent-based biomechanical model. American Jour-nal of Physiology-Heart and Circulatory Physiology, 292(6):H2754–H2763.
[Francia et al., 2012] Francia, S., Michelini, F., Saxena, A., Tang, D., De Hoon, M.,Anelli, V., Mione, M., Carninci, P., and D’adda Di Fagagna, F. (2012). Site-specificDICER and DROSHA RNA products control the DNA-damage response. Nature.
[Fuchs et al., 2006] Fuchs, C., Bhattacharyya, D., and Fakirov, S. (2006). Microfib-ril reinforced polymer-polymer composites: Application of Tsai-Hill equation toPP/PET composites. Composites Science and Technology, 66(16):3161–3171.
[Gao et al., 2006] Gao, F., Watanabe, M., and Matsuzawa, T. (2006). Stress analysisin a layered aortic arch model under pulsatile blood flow. Biomed Eng Online,5(25):1–11.
[Gao et al., 2012] Gao, X. M., White, D. A., Dart, A. M., and Du, X. J. (2012).Post-infarct cardiac rupture: Recent insights on pathogenesis and therapeutic in-terventions. Pharmacology and Therapeutics, 134(2):156–179.
[Garcıa-Herrera et al., 2012] Garcıa-Herrera, C. M., Atienza, J. M., Rojo, F. J.,Claes, E., Guinea, G. V., Celentano, D. J., Garcıa-Montero, C., and Burgos, R. L.(2012). Mechanical behaviour and rupture of normal and pathological human as-cending aortic wall. Medical & biological engineering & computing, 50(6):559–566.
[Gasser and Holzapfel, 2006] Gasser, T. C. and Holzapfel, G. A. (2006). Modelingthe propagation of arterial dissection. European Journal of Mechanics, A/Solids.
[Gasser et al., 2006] Gasser, T. C., Ogden, R. W., and Holzapfel, G. A. (2006). Hy-perelastic modelling of arterial layers with distributed collagen fibre orientations.Journal of the Royal Society, Interface / the Royal Society, 3(6):15–35.
128
[Geest et al., 2004] Geest, J. P. V., Sacks, M. S., and Vorp, D. A. (2004). Age Depen-dency of the Biaxial Biomechanical Behavior of Human Abdominal Aorta. Journalof Biomechanical Engineering, 126(6):815.
[Gennisson et al., 2010] Gennisson, J. L., Deffieux, T., Mace, E., Montaldo, G., Fink,M., and Tanter, M. (2010). Viscoelastic and anisotropic mechanical properties ofin vivo muscle tissue assessed by supersonic shear imaging. Ultrasound in Medicineand Biology, 36(5):789–801.
[Gilling-Smith et al., 2005] Gilling-Smith, G. L., Vallabhaneni, S. R., How, T. V.,Brennan, J. A., Harris, P. L., and Carter, S. D. (2005). Heterogeneity of TensileStrength and Matrix Metalloproteinase Activity in the Wall of Abdominal AorticAneurysms. Journal of Endovascular Therapy, 11(4):494–502.
[Gleason et al., 2004] Gleason, R. L., Taber, L. A., and Humphrey, J. D. (2004). A2-D Model of Flow-Induced Alterations in the Geometry, Structure, and Propertiesof Carotid Arteries. Journal of Biomechanical Engineering, 126(3):371–381.
[Gomez-Benito et al., 2005] Gomez-Benito, M. J., Garcıa-Aznar, J. M., and Doblare,M. (2005). Finite element prediction of proximal femoral fracture patterns underdifferent loads. Journal of biomechanical engineering, 127(1):9–14.
[Gray, 1918] Gray, H. (1918). Anatomy of the Human Body. Lea and Febiger,Philadelphia.
[Gregory et al., 2011] Gregory, D. E., Veldhuis, J. H., Horst, C., Wayne Brodland, G.,and Callaghan, J. P. (2011). Novel lap test determines the mechanics of delamina-tion between annular lamellae of the intervertebral disc. Journal of Biomechanics,44(1):97–102.
[Groenink et al., 1999] Groenink, M., Langerak, S. E., Vanbavel, E., van der Wall,E. E., Mulder, B. J., van der Wal, A. C., and Spaan, J. A. (1999). The influence ofaging and aortic stiffness on permanent dilation and breaking stress of the thoracicdescending aorta. Cardiovascular research, 43(2):471–480.
[Grosse et al., 2014] Grosse, I., Huang, L., Davis, J., and Cullinane, D. (2014). AMulti-Level Hierarchical Finite Element Model for Capillary Failure in Soft Tissue.Journal of biomechanical engineering, 136(August):1–8.
[Gundiah et al., 2007] Gundiah, N., B Ratcliffe, M., and A Pruitt, L. (2007). Deter-mination of strain energy function for arterial elastin: Experiments using histologyand mechanical tests. Journal of Biomechanics, 40(3):586–594.
[Hadi and Barocas, 2013] Hadi, M. F. and Barocas, V. H. (2013). Microscale FiberNetwork Alignment Affects Macroscale Failure Behavior in Simulated CollagenTissue Analogs. Journal of Biomechanical Engineering.
129
[Hadi et al., 2012] Hadi, M. F., Sander, E. A., and Barocas, V. H. (2012). MultiscaleModel Predicts Tissue-Level Failure From Collagen Fiber-Level Damage. Journalof Biomechanical Engineering.
[Haskett et al., 2012] Haskett, D., Speicher, E., Fouts, M., Larson, D., Azhar, M.,Utzinger, U., and Vande Geest, J. (2012). The effects of angiotensin II on the cou-pled microstructural and biomechanical response of C57BL/6 mouse aorta. Journalof Biomechanics.
[Hatami-Marbini and Picu, 2009] Hatami-Marbini, H. and Picu, R. C. (2009). Het-erogeneous long-range correlated deformation of semiflexible random fiber net-works. Physical Review E - Statistical, Nonlinear, and Soft Matter Physics,80(4):046703.
[He et al., 2013] He, Y., Huang, C., Lin, X., and Li, J. (2013). MicroRNA-29 family,a crucial therapeutic target for fibrosis diseases.
[Herrera et al., 2018a] Herrera, J., Beisang, D. J., Peterson, M., Forster, C., Gilbert-sen, A., Benyumov, A., Smith, K., Korenczuk, C. E., Barocas, V. H., Guenther,K., Hite, R., Zhang, L., Henke, C. A., and Bitterman, P. B. (2018a). Dicer1 defi-ciency in the idiopathic pulmonary fibrosis fibroblastic focus promotes fibrosis bysuppressing MicroRNA biogenesis. American Journal of Respiratory and CriticalCare Medicine.
[Herrera et al., 2018b] Herrera, J., Henke, C. A., and Bitterman, P. B. (2018b). Ex-tracellular matrix as a driver of progressive fibrosis.
[Herrera et al., 2015] Herrera, J., Peterson, M., Parker, M., Smith, K., Henke, C.,and Bitterman, P. (2015). Hippo signaling pathway deregulation in IPF controlsmicroRNA-29 expression [abstract]. Am J Respir Crit Care Med, 191:A5337.
[Hill, 1950] Hill, R. (1950). The Mathematical Theory of Plasticity.
[Holmes et al., 1997] Holmes, J. W., Nunez, J. A., and Covell, J. W. (1997). Func-tional implications of myocardial scar structure. The American journal of physiol-ogy, 272(5):H2123–H2130.
[Holmes et al., 2013] Holmes, K. W., Maslen, C. L., Kindem, M., Kroner, B. L., Song,H. K., Ravekes, W., Dietz, H. C., Weinsaft, J. W., Roman, M. J., Devereux, R. B.,Pyeritz, R. E., Bavaria, J., Milewski, K., Milewicz, D., Lemaire, S. A., Hendershot,T., Eagle, K. A., Tolunay, H. E., Desvigne-Nickens, P., and Silberbach, M. (2013).GenTAC registry report: Gender differences among individuals with geneticallytriggered thoracic aortic aneurysm and dissection. American Journal of MedicalGenetics, Part A.
130
[Holzapfel et al., 2000] Holzapfel, G. A., Schulze-Bauer, C. A. J., and Stadler, M.(2000). Mechanics of angioplasty: Wall, balloon and stent. Mechanics in Biology,30:141–156.
[Holzapfel et al., 2005] Holzapfel, G. A., Sommer, G., Gasser, C. T., and Regitnig, P.(2005). Determination of layer-specific mechanical properties of human coronary ar-teries with nonatherosclerotic intimal thickening and related constitutive modeling.American Journal of Physiology Heart and Circulatory Physiology, 289(5):2048–2058.
[Huang et al., 2012] Huang, X., Yang, N., Fiore, V. F., Barker, T. H., Sun, Y., Mor-ris, S. W., Ding, Q., Thannickal, V. J., and Zhou, Y. (2012). Matrix stiffness-induced myofibroblast differentiation is mediated by intrinsic mechanotransduction.American Journal of Respiratory Cell and Molecular Biology.
[Humphrey and Yin, 1987] Humphrey, J. and Yin, F. (1987). On constitutive rela-tions and finite deformations of passive cardiac tissue - I. A pseudostrain-energyfunction. Journal of Biomechanical Engineering, 109(4):298–304.
[Humphrey, 1995] Humphrey, J. D. (1995). Mechanics of the arterial wall: reviewand directions. Critical reviews in biomedical engineering.
[Humphrey, 2002] Humphrey, J. D. (2002). Cardiovascular solid mechanics: cells,tissues, and organs. Springer Science & Business Media, New York.
[Humphrey, 2013] Humphrey, J. D. (2013). Cardiovascular solid mechanics: cells,tissues, and organs. Springer Science & Business Media.
[Humphrey and Holzapfel, 2012] Humphrey, J. D. and Holzapfel, G. A. (2012). Me-chanics, mechanobiology, and modeling of human abdominal aorta and aneurysms.Journal of Biomechanics, 45(5):805–814.
[Humphrey and Rajagopal, 2003] Humphrey, J. D. and Rajagopal, K. R. (2003). Aconstrained mixture model for arterial adaptations to a sustained step change inblood flow. Biomechanics and modeling in mechanobiology.
[Hurks et al., 2012] Hurks, R., Pasterkamp, G., Vink, A., Hoefer, I. E., Bots, M. L.,Van De Pavoordt, H. D., De Vries, J. P. P., and Moll, F. L. (2012). Circumferentialheterogeneity in the abdominal aortic aneurysm wall composition suggests lateralsides to be more rupture prone. Journal of Vascular Surgery, 55(1):203–209.
[Hwang et al., 2015] Hwang, E., Hughes, R. E., Palmer, M. L., and Carpenter, J. E.(2015). Effects of biceps tension on the torn superior glenoid labrum. Journal ofOrthopaedic Research, 33(10):1545–1551.
[Iaizzo, 2009] Iaizzo, P. A. (2009). Handbook of cardiac anatomy, physiology, anddevices. Springer Science & Business Media.
131
[Iliopoulos et al., 2009a] Iliopoulos, D. C., Deveja, R. P., Kritharis, E. P., Perrea, D.,Sionis, G. D., Toutouzas, K., Stefanadis, C., and Sokolis, D. P. (2009a). Regionaland directional variations in the mechanical properties of ascending thoracic aorticaneurysms. Medical engineering & physics, 31(1):1–9.
[Iliopoulos et al., 2009b] Iliopoulos, D. C., Kritharis, E. P., Giagini, A. T., Pa-padodima, S. A., and Sokolis, D. P. (2009b). Ascending thoracic aortic aneurysmsare associated with compositional remodeling and vessel stiffening but not weak-ening in age-matched subjects. Journal of Thoracic and Cardiovascular Surgery.
[Isselbacher, 2005] Isselbacher, E. M. (2005). Thoracic and abdominal aorticaneurysms. Circulation, 111(6):816–828.
[Joyce et al., 2009] Joyce, E. M., Liao, J., Schoen, F. J., Mayer, J. E., and Sacks,M. S. (2009). Functional Collagen Fiber Architecture of the Pulmonary HeartValve Cusp. Annals of Thoracic Surgery, 87(4):1240–1249.
[Jugdutt, 2003] Jugdutt, B. I. (2003). Ventricular remodeling after infarction and theextracellular collagen matrix: When is enough enough? Circulation, 108(11):1395–1403.
[Jugdutt et al., 1996] Jugdutt, B. I., Joljart, M. J., and Khan, M. I. (1996). Rate ofCollagen Deposition during Healing and Ventricular Remodeling after MyocardialInfarction in Rat and Dog Models. Circulation, 94(1):94–101.
[Kaiser et al., 2008] Kaiser, T., Kellenberger, C. J., Albisetti, M., Bergstrasser, E.,and Buechel, E. R. (2008). Normal values for aortic diameters in children andadolescents - Assessment in vivo by contrast-enhanced CMR-angiography. Journalof Cardiovascular Magnetic Resonance.
[Karimi et al., 2014] Karimi, A., Navidbakhsh, M., and Razaghi, R. (2014). Plaqueand arterial vulnerability investigation in a three-layer atherosclerotic human coro-nary artery using computational fluid-structure interaction method. Journal ofApplied Physics, 116(6).
[Khanafer et al., 2011] Khanafer, K., Duprey, A., Zainal, M., Schlicht, M., Williams,D., and Berguer, R. (2011). Determination of the elastic modulus of ascending tho-racic aortic aneurysm at different ranges of pressure using uniaxial tensile testing.Journal of Thoracic and Cardiovascular Surgery, 142(3):682–686.
[Kim et al., 2012] Kim, J.-H., Avril, S., Duprey, A., and Favre, J.-P. (2012). Ex-perimental characterization of rupture in human aortic aneurysms using a full-field measurement technique. Biomechanics and Modeling in Mechanobiology,11(6):841–853.
132
[Kim et al., 2016] Kim, Y.-K., Kim, B., and Kim, V. N. (2016). Re-evaluation of theroles of DROSHA, Export in 5, and DICER in microRNA biogenesis. Proceedingsof the National Academy of Sciences of the United States of America.
[Koch et al., 2014] Koch, R. G., Tsamis, A., D’Amore, A., Wagner, W. R., Watkins,S. C., Gleason, T. G., and Vorp, D. A. (2014). A custom image-based analysis toolfor quantifying elastin and collagen micro-architecture in the wall of the humanaorta from multi-photon microscopy. Journal of Biomechanics.
[Korenczuk et al., 2017] Korenczuk, C., Votava, L., Dhume, R., Kizilski, S., Brown,G., Narain, R., and Barocas, V. (2017). Isotropic failure criteria are not appropriatefor anisotropic fibrous biological tissues. Journal of Biomechanical Engineering,139(7).
[Korenczuk et al., 2019] Korenczuk, C. E., Dhume, R. Y., Liao, K. K., and Barocas,V. H. (2019). Ex Vivo Mechanical Tests and Multiscale Computational ModelingHighlight the Importance of Intramural Shear Stress in Ascending Thoracic AorticAneurysms. Journal of Biomechanical Engineering, Under Revi.
[Korenczuk, Christopher et al., 2019] Korenczuk, Christopher, E., Barocas, V. H.,and Richardson, W. J. (2019). Effects of Collagen Heterogeneity on MyocardialInfarct Mechanics in a Multiscale Fiber Network Model. Journal of BiomechanicalEngineering, (Under Review).
[Kozun, 2016] Kozun, M. (2016). Delamination properties of the human thoracicarterial wall with early stage of atherosclerosis lesions. Journal of Theoretical andApplied Mechanics.
[Krishnan et al., 2015] Krishnan, K., Ge, L., Haraldsson, H., Hope, M. D., Saloner,D. A., Guccione, J. M., and Tseng, E. E. (2015). Ascending thoracic aorticaneurysm wall stress analysis using patient-specific finite element modeling ofin vivo magnetic resonance imaging. In Interactive Cardiovascular and ThoracicSurgery.
[Kumar et al., 2009] Kumar, M. S., Pester, R. E., Chen, C. Y., Lane, K., Chin, C.,Lu, J., Kirsch, D. G., Golub, T. R., and Jacks, T. (2009). Dicer1 functions as ahaploinsufficient tumor suppressor. Genes and Development.
[Kurzynska-Kokorniak et al., 2015] Kurzynska-Kokorniak, A., Koralewska, N., Poko-rnowska, M., Urbanowicz, A., Tworak, A., Mickiewicz, A., and Figlerowicz, M.(2015). The many faces of Dicer: The complexity of the mechanisms regulatingDicer gene expression and enzyme activities. Nucleic Acids Research.
[Lai et al., 2012] Lai, V. K., Lake, S. P., Frey, S. P., Tranquillo, R. T., and Barocas,V. H. (2012). Mechanical Behavior of Collagen-Fibrin Co-Gels Reflects Transition
133
From Series to Parallel Interactions With Increasing Collagen Content. Journal ofBiomechanical Engineering, 134(1):011004.
[Lake et al., 2012] Lake, S. P., Hadi, M. F., Lai, V. K., and Barocas, V. H. (2012).Mechanics of a fiber network within a non-fibrillar matrix: Model and comparisonwith collagen-agarose co-gels. Annals of Biomedical Engineering.
[Lake et al., 2010] Lake, S. P., Miller, K. S., Elliott, D. M., and Soslowsky, L. J.(2010). Tensile properties and fiber alignment of human supraspinatus tendonin the transverse direction demonstrate inhomogeneity, nonlinearity, and regionalisotropy. Journal of Biomechanics.
[Liang et al., 2017] Liang, L., Liu, M., Martin, C., Elefteriades, J. A., and Sun, W.(2017). A machine learning approach to investigate the relationship between shapefeatures and numerically predicted risk of ascending aortic aneurysm. Biomechanicsand Modeling in Mechanobiology, 16(5):1519–1533.
[Lin and Gregory, 2015] Lin, S. and Gregory, R. I. (2015). MicroRNA biogenesispathways in cancer.
[Little and Khalsa, 2005] Little, J. S. and Khalsa, P. S. (2005). Material propertiesof the human lumbar facet joint capsule. J Biomech Eng, 127(1):15–24.
[Liu et al., 2015] Liu, F., Lagares, D., Choi, K. M., Stopfer, L., Marinkovic, A., Vr-banac, V., Probst, C. K., Hiemer, S. E., Sisson, T. H., Horowitz, J. C., Rosas,I. O., Fredenburgh, L. E., Feghali-Bostwick, C., Varelas, X., Tager, A. M., andTschumperlin, D. J. (2015). Mechanosignaling through YAP and TAZ drives fi-broblast activation and fibrosis. American Journal of Physiology-Lung Cellular andMolecular Physiology.
[Liu, 2007] Liu, J. Y. (2007). Analysis of off-axis tension test of wood specimens.Wood and Fiber Science, 34(2):205–211.
[Luo et al., 2016] Luo, Y., Duprey, A., Avril, S., and Lu, J. (2016). Characteristicsof thoracic aortic aneurysm rupture in vitro. Acta Biomaterialia, 42:286–295.
[Lv et al., 2013] Lv, L.-L., Cao, Y.-H., Ni, H.-F., Xu, M., Liu, D., Liu, H., Chen,P.-S., and Liu, B.-C. (2013). MicroRNA-29c in urinary exosome/microvesicle as abiomarker of renal fibrosis. American Journal of Physiology-Renal Physiology.
[Maas et al., 2012] Maas, S. A., Ellis, B. J., Ateshian, G. A., and Weiss, J. A. (2012).FEBio: Finite Elements for Biomechanics. Journal of Biomechanical Engineering,134(1):011005.
[MacLean et al., 1999] MacLean, N. F., Dudek, N. L., and Roach, M. R. (1999). Therole of radial elastic properties in the development of aortic dissections. Journal ofVascular Surgery, 29(4):703–710.
134
[Macrae et al., 2016] Macrae, R. A., Miller, K., and Doyle, B. J. (2016). Methods inMechanical Testing of Arterial Tissue: A Review.
[Maier et al., 2010] Maier, A., Gee, M. W., Reeps, C., Pongratz, J., Eckstein, H.-H., and Wall, W. A. (2010). A comparison of diameter, wall stress, and rupturepotential index for abdominal aortic aneurysm rupture risk prediction. Annals ofBiomedical Engineering, 38(10):3124–3134.
[Mao et al., 2008] Mao, S. S., Ahmadi, N., Shah, B., Beckmann, D., Chen, A., Ngo,L., Flores, F. R., lin Gao, Y., and Budoff, M. J. (2008). Normal Thoracic AortaDiameter on Cardiac Computed Tomography in Healthy Asymptomatic Adults.Impact of Age and Gender. Academic Radiology.
[Marinkovic et al., 2013] Marinkovic, A., Liu, F., and Tschumperlin, D. J. (2013).Matrices of physiologic stiffness potently inactivate idiopathic pulmonary fibrosisfibroblasts. American Journal of Respiratory Cell and Molecular Biology.
[Martin et al., 2015] Martin, C., Sun, W., and Elefteriades, J. (2015). Patient-specific finite element analysis of ascending aorta aneurysms. American Journal ofPhysiology-Heart and Circulatory Physiology.
[Martufi et al., 2014] Martufi, G., Gasser, T. C., Appoo, J. J., and Di Martino, E. S.(2014). Mechano-biology in the thoracic aortic aneurysm: a review and case study.
[Matsumoto et al., 2009] Matsumoto, T., Fukui, T., Tanaka, T., Ikuta, N., Ohashi,T., Kumagai, K., Akimoto, H., Tabayashi, K., and Sato, M. (2009). Biaxial tensileproperties of thoracic aortic aneurysm tissues. Journal of Biomechanical Scienceand Engineering, 4(4):518–529.
[Matura et al., 2007] Matura, L. A., Ho, V. B., Rosing, D. R., and Bondy, C. A.(2007). Aortic dilatation and dissection in Turner syndrome. Circulation.
[Matzenmiller et al., 1995] Matzenmiller, A., Lubliner, J., and Taylor, R. L. (1995).A constitutive model for anisotropic damage in fiber-composites. Mechanics ofMaterials, 20(2):125–152.
[Mazurek et al., 2017] Mazurek, R., Dave, J. M., Chandran, R. R., Misra, A., Sheikh,A. Q., and Greif, D. M. (2017). Vascular Cells in Blood Vessel Wall Developmentand Disease. In Advances in Pharmacology.
[McCloy et al., 2014] McCloy, R. A., Rogers, S., Caldon, C. E., Lorca, T., Castro,A., and Burgess, A. (2014). Partial inhibition of Cdk1 in G2 phase overrides theSAC and decouples mitotic events. Cell Cycle.
[McCormick et al., 2017] McCormick, R. J., Musch, T. I., Bergman, B. C., andThomas, D. P. (2017). Regional differences in LV collagen accumulation and mature
135
cross-linking after myocardial infarction in rats. American Journal of Physiology-Heart and Circulatory Physiology, 266(1):H354–H359.
[Melo et al., 2014] Melo, E., Garreta, E., Luque, T., Cortiella, J., Nichols, J., Nava-jas, D., and Farre, R. (2014). Effects of the Decellularization Method on the LocalStiffness of Acellular Lungs. Tissue Engineering Part C: Methods.
[Mohan and Melvin, 1983] Mohan, D. and Melvin, J. W. (1983). Failure propertiesof passive human aortic tissue. II—Biaxial tension tests. Journal of Biomechanics,16(1):31–44.
[Mori et al., 2014] Mori, M., Triboulet, R., Mohseni, M., Schlegelmilch, K., Shrestha,K., Camargo, F. D., and Gregory, R. I. (2014). Hippo signaling regulates micro-processor and links cell-density-dependent mirna biogenesis to cancer. Cell.
[Mott et al., 2010] Mott, J. L., Kurita, S., Cazanave, S. C., Bronk, S. F., Werneburg,N. W., and Fernandez-Zapico, M. E. (2010). Transcriptional suppression of mir-29b-1/mir-29a promoter by c-Myc, hedgehog, and NF-kappaB. Journal of CellularBiochemistry.
[Nagel et al., 2014] Nagel, T. M., Hadi, M. F., Claeson, A. a., Nuckley, D. J., andBarocas, V. H. (2014). Combining displacement field and grip force informationto determine mechanical properties of planar tissue with complicated geometry.Journal of biomechanical engineering, 136(11):1–5.
[Nakatani, 2011] Nakatani, S. (2011). Left Ventricular Rotation and Twist: WhyShould We Learn? Journal of Cardiovascular Ultrasound.
[Narain et al., 2012] Narain, R., Samii, A., and O’Brien, J. F. (2012). Adaptiveanisotropic remeshing for cloth simulation. ACM Transactions on Graphics,31(6):1.
[Narain et al., 2014] Narain, R., Samii, A., Pfaff, T., and O’Brien, J. (2014). ARC-Sim: Adaptive Refining and Coarsening Simulator.
[Nataatmadja et al., 2003] Nataatmadja, M., West, M., West, J., Summers, K.,Walker, P., Nagata, M., and Watanabe, T. (2003). Abnormal extracellular ma-trix protein transport associated with increased apoptosis of vascular smooth mus-cle cells in marfan syndrome and bicuspid aortic valve thoracic aortic aneurysm.Circulation, 108 Suppl:II329–34.
[Natali et al., 2005] Natali, A. N., Pavan, P. G., Carniel, E. L., Lucisano, M. E.,and Taglialavoro, G. (2005). Anisotropic elasto-damage constitutive model for thebiomechanical analysis of tendons. Medical Engineering and Physics, 27(3):209–214.
136
[Nathan et al., 2011] Nathan, D. P., Xu, C., Gorman, J. H., Fairman, R. M., Bavaria,J. E., Gorman, R. C., Chandran, K. B., and Jackson, B. M. (2011). Pathogenesisof acute aortic dissection: a finite element stress analysis. The Annals of ThoracicSurgery, 91(2):458–463.
[Nicholls et al., 1983] Nicholls, S. P., Gathereole, L. J., Keller, A., and Shah, J. S.(1983). Crimping in rat tail tendon collagen: morphology and transverse mechan-ical anisotropy. International Journal of Biological Macromolecules, 5(5):283–288.
[Nijs et al., 2014] Nijs, J., Gelsomino, S., Luca, F., Parise, O., Maessen, J. G., andMeir, M. L. (2014). Unreliability of aortic size index to predict risk of aorticdissection in a patient with Turner syndrome. World journal of cardiology.
[Noble et al., 2016] Noble, C., Smulders, N., Lewis, R., Carre, M. J., Franklin, S. E.,MacNeil, S., and Taylor, Z. A. (2016). Controlled peel testing of a model tissue fordiseased aorta. Journal of Biomechanics, 49(15):3667–3675.
[Nuismer and Whitney, 1975] Nuismer, R. J. and Whitney, J. M. (1975). Uniaxialfailure of composite laminates containing stress concentrations. Fracture mechanicsof composites, ASTM Inter.
[Oak et al., 2011] Oak, S. R., Murray, L., Herath, A., Sleeman, M., Anderson, I.,Joshi, A. D., Coelho, A. L., Flaherty, K. R., Toews, G. B., Knight, D., Martinez,F. J., and Hogaboam, C. M. (2011). A micro RNA processing defect in rapidlyprogressing idiopathic pulmonary fibrosis. PLoS ONE.
[Okamoto et al., 2002] Okamoto, R. J., Wagenseil, J. E., DeLong, W. R., Peterson,S. J., Kouchoukos, N. T., and Sundt III, T. M. (2002). Mechanical properties ofdilated human ascending aorta. Annals of Biomedical Engineering, 30(5):624–635.
[Olsson et al., 2006] Olsson, C., Thelin, S., Stahle, E., Ekbom, A., and Granath,F. (2006). Thoracic aortic aneurysm and dissection: increasing prevalence andimproved outcomes reported in a nationwide population-based study of more than14,000 cases from 1987 to 2002. Circulation, 114(24):2611–2618.
[Omar et al., 2015] Omar, A. M. S., Vallabhajosyula, S., and Sengupta, P. P. (2015).Left Ventricular Twist and Torsion. Circulation: Cardiovascular Imaging.
[Pal et al., 2014] Pal, S., Tsamis, A., Pasta, S., D’Amore, A., Gleason, T. G., Vorp,D. A., and Maiti, S. (2014). A mechanistic model on the role of “radially-running”collagen fibers on dissection properties of human ascending thoracic aorta. Journalof Biomechanics, 47(5):981–988.
[Pandit et al., 2010] Pandit, K. V., Corcoran, D., Yousef, H., Yarlagadda, M., Tzou-velekis, A., Gibson, K. F., Konishi, K., Yousem, S. A., Singh, M., Handley, D.,Richards, T., Selman, M., Watkins, S. C., Pardo, A., Ben-Yehudah, A., Bouros,
137
D., Eickelberg, O., Ray, P., Benos, P. V., and Kaminski, N. (2010). Inhibition androle of let-7d in idiopathic pulmonary fibrosis. American Journal of Respiratoryand Critical Care Medicine.
[Pandit et al., 2011] Pandit, K. V., Milosevic, J., and Kaminski, N. (2011). MicroR-NAs in idiopathic pulmonary fibrosis.
[Pape et al., 2007] Pape, L. A., Tsai, T. T., Isselbacher, E. M., Oh, J. K., O’gara,P. T., Evangelista, A., Fattori, R., Meinhardt, G., Trimarchi, S., Bossone, E.,Suzuki, T., Cooper, J. V., Froehlich, J. B., Nienaber, C. A., Eagle, K. A., andInvestigators, I. R. o. A. A. D. I. (2007). Aortic diameter >or = 5.5 cm is nota good predictor of type A aortic dissection: observations from the InternationalRegistry of Acute Aortic Dissection (IRAD). Circulation, 116(10):1120–1127.
[Parker et al., 2014] Parker, M. W., Rossi, D., Peterson, M., Smith, K., Sikstrom,K., White, E. S., Connett, J. E., Henke, C. A., Larsson, O., and Bitterman, P. B.(2014). Fibrotic extracellular matrix activates a profibrotic positive feedback loop.Journal of Clinical Investigation.
[Pasta et al., 2012] Pasta, S., Phillippi, J. A., Gleason, T. G., and Vorp, D. A. (2012).Effect of aneurysm on the mechanical dissection properties of the human ascendingthoracic aorta. The Journal of thoracic and cardiovascular surgery, 143(2):460–467.
[Pfaff et al., 2014] Pfaff, T., Narain, R., De Joya, J. M., and O’Brien, J. F. (2014).Adaptive Tearing and Cracking of Thin Sheets. ACM Transactions on Graphics,33(4):1–9.
[Phillippi et al., 2011a] Phillippi, J. A., Pasta, S., and Vorp, D. A. (2011a). Biome-chanics and pathobiology of aortic aneurysms. In Biomechanics and Mechanobiol-ogy of Aneurysms, pages 67–118. Springer.
[Phillippi et al., 2011b] Phillippi, J. A., Pasta, S., and Vorp, D. A. (2011b). Biome-chanics and pathobiology of aortic aneurysms. In Biomechanics and Mechanobiol-ogy of Aneurysms, pages 67–118. Springer.
[Pichamuthu et al., 2013] Pichamuthu, J. E., Phillippi, J. A., Cleary, D. A., Chew,D. W., Hempel, J., Vorp, D. A., and Gleason, T. G. (2013). Differential tensilestrength and collagen composition in ascending aortic aneurysms by aortic valvephenotype. Annals of Thoracic Surgery.
[Picu, 2011] Picu, R. C. (2011). Mechanics of random fiber networks - A review. SoftMatter, 7(15):6768–6785.
[Pierce et al., 2007] Pierce, E. M., Carpenter, K., Jakubzick, C., Kunkel, S. L., Fla-herty, K. R., Martinez, F. J., and Hogaboam, C. M. (2007). Therapeutic targetingof CC ligand 21 or CC chemokine receptor 7 abrogates pulmonary fibrosis induced
138
by the adoptive transfer of human pulmonary fibroblasts to immunodeficient mice.American Journal of Pathology.
[Pietruszczak et al., 1999] Pietruszczak, S., Inglis, D., and Pande, G. N. (1999). Afabric-dependent fracture criterion for bone. Journal of Biomechanics, 32(10):1071–1079.
[Poullis et al., 2008] Poullis, M. P., Warwick, R., Oo, A., and Poole, R. J. (2008).Ascending aortic curvature as an independent risk factor for type A dissection, andascending aortic aneurysm formation: a mathematical model. European journal ofcardio-thoracic surgery : official journal of the European Association for Cardio-thoracic Surgery, 33(6):995–1001.
[Quental et al., 2016] Quental, C., Folgado, J., Monteiro, J., and Sarmento, M.(2016). Full-thickness tears of the supraspinatus tendon: A three-dimensional finiteelement analysis. Journal of Biomechanics, 49(16):3962–3970.
[Quindlen et al., 2015] Quindlen, J. C., Lai, V. K., and Barocas, V. H. (2015). Mul-tiscale Mechanical Model of the Pacinian Corpuscle Shows Depth and AnisotropyContribute to the Receptor’s Characteristic Response to Indentation. PLoS Com-putational Biology.
[Raghavan et al., 2000] Raghavan, M. L., Vorp, D. A., Federle, M. P., Makaroun,M. S., and Webster, M. W. (2000). Wall stress distribution on three-dimensionallyreconstructed models of human abdominal aortic aneurysm. Journal of vascularsurgery, 31(4):760–769.
[Raghupathy et al., 2011] Raghupathy, R., Witzenburg, C., Lake, S. P., Sander, E. a.,and Barocas, V. H. (2011). Identification of Regional Mechanical Anisotropyin Soft Tissue Analogs. Journal of Biomechanical Engineering, 133(September2011):091011.
[Rahaman et al., 2014] Rahaman, S. O., Grove, L. M., Paruchuri, S., Southern, B. D.,Abraham, S., Niese, K. A., Scheraga, R. G., Ghosh, S., Thodeti, C. K., Zhang,D. X., Moran, M. M., Schilling, W. P., Tschumperlin, D. J., and Olman, M. A.(2014). TRPV4 mediates myofibroblast differentiation and pulmonary fibrosis inmice. Journal of Clinical Investigation.
[Rangarajan and Weinberg, 2003] Rangarajan, A. and Weinberg, R. A. (2003). Com-parative biology of mouse versus human cells: Modelling human cancer in mice.
[Rattenbacher et al., 2010] Rattenbacher, B., Beisang, D., Wiesner, D. L., Jeschke,J. C., von Hohenberg, M., St. Louis-Vlasova, I. A., and Bohjanen, P. R. (2010).Analysis of CUGBP1 Targets Identifies GU-Repeat Sequences That Mediate RapidmRNA Decay. Molecular and Cellular Biology.
139
[Richardson et al., 2015] Richardson, W. J., Clarke, S. A., Alexander Quinn, T., andHolmes, J. W. (2015). Physiological implications of myocardial scar structure.Comprehensive Physiology, 5(4):1877–1909.
[Richardson and Holmes, 2016] Richardson, W. J. and Holmes, J. W. (2016). Emer-gence of Collagen Orientation Heterogeneity in Healing Infarcts and an Agent-Based Model. Biophysical Journal, 110(10):2266–2277.
[Roccabianca et al., 2014] Roccabianca, S., Figueroa, C. A., Tellides, G., andHumphrey, J. D. (2014). Quantification of regional differences in aortic stiffnessin the aging human. Journal of the mechanical behavior of biomedical materials,29:618–634.
[Roderburg et al., 2011] Roderburg, C., Urban, G. W., Bettermann, K., Vucur, M.,Zimmermann, H., Schmidt, S., Janssen, J., Koppe, C., Knolle, P., Castoldi, M.,Tacke, F., Trautwein, C., and Luedde, T. (2011). Micro-RNA profiling reveals arole for miR-29 in human and murine liver fibrosis. Hepatology.
[Romo et al., 2014] Romo, A., Badel, P., Duprey, A., Favre, J. P., and Avril, S.(2014). In vitro analysis of localized aneurysm rupture. Journal of Biomechanics,47(3).
[Rouillard and Holmes, 2012] Rouillard, A. D. and Holmes, J. W. (2012). Mechanicalregulation of fibroblast migration and collagen remodelling in healing myocardialinfarcts. Journal of Physiology, 590(18):4585–4602.
[Sacks, 2003] Sacks, M. S. (2003). Incorporation of experimentally-derived fiber ori-entation into a structural constitutive model for planar collagenous tissues. Journalof biomechanical engineering, 125(2):280–7.
[Saliba and Sia, 2015] Saliba, E. and Sia, Y. (2015). The ascending aortic aneurysm:When to intervene? IJC Heart and Vasculature, 6:91–100.
[Sander et al., 2009a] Sander, E., Stylianopoulos, T., Tranquillo, R., and Barocas,V. (2009a). Image-based biomechanics of collagen-based tissue equivalents. IEEEEngineering in Medicine and Biology Magazine.
[Sander et al., 2009b] Sander, E. A., Stylianopoulos, T., Tranquillo, R. T., and Baro-cas, V. H. (2009b). Image-based multiscale modeling predicts tissue-level andnetwork-level fiber reorganization in stretched cell-compacted collagen gels. Pro-ceedings of the National Academy of Sciences.
[Sanyal et al., 2014] Sanyal, A., Scheffelin, J., and Keaveny, T. M. (2014). The Quar-tic Piecewise-Linear Criterion for the Multiaxial Yield Behavior of Human Trabec-ular Bone. Journal of Biomechanical Engineering, 137(1):011009.
140
[Schafer et al., 2017] Schafer, M. J., White, T. A., Iijima, K., Haak, A. J., Ligresti,G., Atkinson, E. J., Oberg, A. L., Birch, J., Salmonowicz, H., Zhu, Y., Mazula,D. L., Brooks, R. W., Fuhrmann-Stroissnigg, H., Pirtskhalava, T., Prakash, Y. S.,Tchkonia, T., Robbins, P. D., Aubry, M. C., Passos, J. F., Kirkland, J. L.,Tschumperlin, D. J., Kita, H., and LeBrasseur, N. K. (2017). Cellular senescencemediates fibrotic pulmonary disease. Nature Communications.
[Schriefl et al., 2015] Schriefl, A. J., Schmidt, T., Balzani, D., Sommer, G., andHolzapfel, G. A. (2015). Selective enzymatic removal of elastin and collagen fromhuman abdominal aortas: Uniaxial mechanical response and constitutive modeling.Acta Biomaterialia, 17:125–136.
[Schulze-Bauer et al., 2002] Schulze-Bauer, C. A. J., Regitnig, P., and Holzapfel,G. A. (2002). Mechanics of the human femoral adventitia including the high-pressure response. American Journal of Physiology - Heart and Circulatory Phys-iology, 282(6):H2427–H2440.
[Shah et al., 2014] Shah, S., Witzenburg, C., Hadi, M. F., Wagner, H., Goodrich, J.,Alford, P., and Barocas, V. H. (2014). Prefailure and Failure Mechanics of thePorcine Ascending Thoracic Aorta: Experiments and a Multiscale Model. Journalof biomechanical engineering, 136(February):4–10.
[Snedeker and Gautieri, 2014] Snedeker, J. G. and Gautieri, A. (2014). The role ofcollagen crosslinks in ageing and diabetes - the good, the bad, and the ugly. Muscles,ligaments and tendons journal.
[Snowhill et al., 2004] Snowhill, P. B., Foran, D. J., and Silver, F. H. (2004). A me-chanical model of porcine vascular tissues - Part I: Determination of macromolec-ular component arrangement and volume fractions. Cardiovascular Engineering.
[Sokolis et al., 2008] Sokolis, D. P., Boudoulas, H., and Karayannacos, P. E. (2008).Segmental differences of aortic function and composition: clinical implications.Hellenic journal of cardiology : HJC = Hellenike kardiologike epitheorese.
[Sokolis et al., 2012] Sokolis, D. P., Kritharis, E. P., and Iliopoulos, D. C. (2012).Effect of layer heterogeneity on the biomechanical properties of ascending thoracicaortic aneurysms. Medical and Biological Engineering and Computing, 50(12):1227–1237.
[Sommer et al., 2008] Sommer, G., Gasser, T. C., Regitnig, P., Auer, M., andHolzapfel, G. A. (2008). Dissection properties of the human aortic media: anexperimental study. Journal of biomechanical engineering, 130(2):021007.
[Sommer et al., 2016] Sommer, G., Sherifova, S., Oberwalder, P. J., Dapunt, O. E.,Ursomanno, P. A., DeAnda, A., Griffith, B. E., and Holzapfel, G. A. (2016). Me-
141
chanical strength of aneurysmatic and dissected human thoracic aortas at differentshear loading modes. Journal of Biomechanics, 49:2374–2382.
[Stylianopoulos and Barocas, 2007a] Stylianopoulos, T. and Barocas, V. H. (2007a).Multiscale, Structure-Based Modeling for the Elastic Mechanical Behavior of Ar-terial Walls. Journal of Biomechanical Engineering, 129(4):611–618.
[Stylianopoulos and Barocas, 2007b] Stylianopoulos, T. and Barocas, V. H. (2007b).Volume-averaging theory for the study of the mechanics of collagen networks. Com-puter Methods in Applied Mechanics and Engineering.
[Sulli et al., 2012] Sulli, G., Di Micco, R., and Di Fagagna, F. D. A. (2012). Crosstalkbetween chromatin state and DNA damage response in cellular senescence andcancer.
[Svensson et al., 2003] Svensson, L. G., Kim, K. H., Lytle, B. W., and Cosgrove,D. M. (2003). Relationship of aortic cross-sectional area to height ratio and therisk of aortic dissection in patients with bicuspid aortic valves. Journal of Thoracicand Cardiovascular Surgery.
[Swahari et al., 2016] Swahari, V., Nakamura, A., Baran-Gale, J., Garcia, I.,Crowther, A. J., Sons, R., Gershon, T. R., Hammond, S., Sethupathy, P., andDeshmukh, M. (2016). Essential Function of Dicer in Resolving DNA Damagein the Rapidly Dividing Cells of the Developing and Malignant Cerebellum. CellReports.
[Takaza et al., 2012] Takaza, M., Moerman, K. M., Gindre, J., Lyons, G., and Simms,C. K. (2012). The anisotropic mechanical behaviour of passive skeletal muscle tissuesubjected to large tensile strain. Journal of the Mechanical Behavior of BiomedicalMaterials, 17:209–220.
[Teng et al., 2015] Teng, Z., Feng, J., Zhang, Y., Huang, Y., Sutcliffe, M. P. F.,Brown, A. J., Jing, Z., Gillard, J. H., and Lu, Q. (2015). Layer- and Direction-Specific Material Properties, Extreme Extensibility and Ultimate Material Strengthof Human Abdominal Aorta and Aneurysm: A Uniaxial Extension Study. Annalsof Biomedical Engineering, 43(11):2745–2759.
[Thomopoulos et al., 2003] Thomopoulos, S., Williams, G. R., Gimbel, J. A., Favata,M., and Soslowsky, L. J. (2003). Variation of biomechanical, structural, and compo-sitional properties along the tendon to bone insertion site. Journal of OrthopaedicResearch, 21(3):413–419.
[Thubrikar et al., 1999] Thubrikar, M. J., Agali, P., and Robicsek, F. (1999). Wallstress as a possible mechanism for the development of transverse intimal tears inaortic dissections. Journal of medical engineering & technology, 23(4):127–134.
142

[Tiessen and Roach, 1993] Tiessen, I. M. and Roach, M. R. (1993). Factors in theinitiation and propagation of aortic dissections in human autopsy aortas. Journalof Biomechanical Engineering, 115(1):123–125.
[Timmins et al., 2010] Timmins, L. H., Moore, J. E., Wu, Q., Yeh, A. T., and Green-wald, S. E. (2010). Structural inhomogeneity and fiber orientation in the innerarterial media. American Journal of Physiology-Heart and Circulatory Physiology.
[Todorovich-Hunter et al., 1988] Todorovich-Hunter, L., Johnson, D. J., Ranger, P.,Keeley, F. W., and Rabinovitch, M. (1988). Altered elastin and collagen synthesisassociated with progressive pulmonary hypertension induced by monocrotaline. Abiochemical and ultrastructural study. Lab Invest.
[Tonar et al., 2015] Tonar, Z., Kubıkova, T., Prior, C., Demjen, E., Liska, V.,Kralıckova, M., and Witter, K. (2015). Segmental and age differences in the elastinnetwork, collagen, and smooth muscle phenotype in the tunica media of the porcineaorta. Annals of Anatomy.
[Tong et al., 2016] Tong, J., Cheng, Y., and Holzapfel, G. A. (2016). Mechanical as-sessment of arterial dissection in health and disease: Advancements and challenges.Journal of Biomechanics, 49(12):2366–2373.
[Tong et al., 2011] Tong, J., Sommer, G., Regitnig, P., and Holzapfel, G. A. (2011).Dissection properties and mechanical strength of tissue components in humancarotid bifurcations. Annals of Biomedical Engineering.
[Trabelsi et al., 2015] Trabelsi, O., Davis, F. M., Rodriguez-Matas, J. F., Duprey,A., and Avril, S. (2015). Patient specific stress and rupture analysis of ascendingthoracic aneurysms. Journal of Biomechanics, 48(10):1836–1843.
[Tsai, 1968] Tsai, S. W. (1968). Fundamental aspects of fiber reinforced plastic com-posites. Interscience, N.Y.
[Tsai and Wu, 1971] Tsai, S. W. and Wu, E. M. (1971). A General Theory of Strengthfor Anisotropic Materials. Journal of Composite Materials, 5(1):58–80.
[Tsamis et al., 2014] Tsamis, A., Pal, S., Phillippi, J. A., Gleason, T. G., Maiti,S., and Vorp, D. A. (2014). Effect of aneurysm on biomechanical properties of”radially-oriented” collagen fibers in human ascending thoracic aortic media. Jour-nal of Biomechanics.
[Tsamis et al., 2013] Tsamis, A., Phillippi, J. A., Koch, R. G., Pasta, S., D’Amore,A., Watkins, S. C., Wagner, W. R., Gleason, T. G., and Vorp, D. A. (2013). Fibermicro-architecture in the longitudinal-radial and circumferential-radial planes ofascending thoracic aortic aneurysm media. Journal of Biomechanics.
143
[Tumaneng et al., 2012] Tumaneng, K., Schlegelmilch, K., Russell, R. C., Yimlamai,D., Basnet, H., Mahadevan, N., Fitamant, J., Bardeesy, N., Camargo, F. D., andGuan, K. L. (2012). YAP mediates crosstalk between the Hippo and PI(3)K-TORpathways by suppressing PTEN via miR-29. Nature Cell Biology.
[van Baardwijk and Roach, 1987] van Baardwijk, C. and Roach, M. R. (1987). Fac-tors in the propagation of aortic dissections in canine thoracic aortas. Journal ofBiomechanics.
[van Rooij et al., 2008] van Rooij, E., Sutherland, L. B., Thatcher, J. E., DiMaio,J. M., Naseem, R. H., Marshall, W. S., Hill, J. A., and Olson, E. N. (2008).Dysregulation of microRNAs after myocardial infarction reveals a role of miR-29in cardiac fibrosis. Proceedings of the National Academy of Sciences.
[Vande Geest et al., 2006] Vande Geest, J. P., Sacks, M. S., and Vorp, D. A. (2006).The effects of aneurysm on the biaxial mechanical behavior of human abdominalaorta. Journal of Biomechanics, 39(7):1324–1334.
[Volokh, 2008] Volokh, K. Y. (2008). Prediction of arterial failure based on a mi-crostructural bi-layer fiber-matrix model with softening. Journal of Biomechanics.
[Volokh, 2011] Volokh, K. Y. (2011). Modeling failure of soft anisotropic materi-als with application to arteries. Journal of the mechanical behavior of biomedicalmaterials, 4(8):1582–1594.
[Vorp et al., 1996] Vorp, D. A., Raghavan, M. L., Muluk, S. C., Makaroun, M. S.,Steed, D. L., Shapiro, R., and Webster, M. W. (1996). Wall strength and stiffness ofaneurysmal and nonaneurysmal abdominal aorta. Annals of the New York Academyof Sciences, 800(1):274–276.
[Vorp et al., 2003] Vorp, D. A., Schiro, B. J., Ehrlich, M. P., Juvonen, T. S., Ergin,M. A., and Griffith, B. P. (2003). Effect of aneurysm on the tensile strength andbiomechanical behavior of the ascending thoracic aorta. The Annals of ThoracicSurgery, 75(4):1210–1214.
[Wagenseil and Mecham, 2009] Wagenseil, J. and Mecham, R. (2009). VascularExtracellular Matrix and Arterial Mechanics. American Physiological Society,89(3):957–989.
[Wang et al., 2001] Wang, D. H. J., Makaroun, M. S., and Vorp, D. A. (2001).Noninvasive estimation of wall strength distribution in human abdominal aorticaneurysm. ASME-PUBLICATIONS-BED, 51:35–36.
[Wang et al., 2015] Wang, L., Roper, S. M., Luo, X. Y., and Hill, N. A. (2015).Modelling of tear propagation and arrest in fibre-reinforced soft tissue subject tointernal pressure. Journal of Engineering Mathematics.
144

[Watton et al., 2004] Watton, P. N., Hill, N. A., and Heil, M. (2004). A mathemat-ical model for the growth of the abdominal aortic aneurysm. Biomechanics andmodeling in mechanobiology, 3(2):98–113.
[Weaver, 2017] Weaver, V. M. (2017). Cell and tissue mechanics: the new cell biologyfrontier. Molecular Biology of the Cell.
[Weisbecker et al., 2013] Weisbecker, H., Viertler, C., Pierce, D. M., and Holzapfel,G. A. (2013). The role of elastin and collagen in the softening behavior of thehuman thoracic aortic media. Journal of Biomechanics, 46(11).
[White et al., 2017] White, E. J., Matsangos, A. E., and Wilson, G. M. (2017). AUF1regulation of coding and noncoding RNA.
[Wisneski et al., 2014] Wisneski, A. D., Mookhoek, A., Chitsaz, S., Hope, M. D.,Guccione, J. M., Ge, L., and Tseng, E. E. (2014). Patient-specific finite elementanalysis of ascending thoracic aortic aneurysm. The Journal of heart valve disease.
[Witzenburg et al., 2012] Witzenburg, C., Raghupathy, R., Kren, S. M., Taylor,D. A., and Barocas, V. H. (2012). Mechanical changes in the rat right ventri-cle with decellularization. Journal of Biomechanics.
[Witzenburg et al., 2017] Witzenburg, C. M., Dhume, R. Y., Shah, S. B., Korenczuk,C. E., Wagner, H. P., Alford, P. W., and Barocas, V. H. (2017). Failure of thePorcine Ascending Aorta: Multidirectional Experiments and a Unifying Model.Journal of Biomechanical Engineering, 139(3):031005.
[Woo and Whitcomb, 1996] Woo, K. and Whitcomb, J. (1996). Three-DimensionalFailure Analysis of Plain Weave Textile Composites Using a Global/Local FiniteElement Method. Journal of Composite Materials, 30(9):984–1003.
[Woo et al., 1983] Woo, S. L., Gomez, M. a., Seguchi, Y., Endo, C. M., and Ake-son, W. H. (1983). Measurement of mechanical properties of ligament substancefrom a bone-ligament-bone preparation. Journal of orthopaedic research : officialpublication of the Orthopaedic Research Society, 1(1):22–29.
[Woo et al., 1991] Woo, S. L., Hollis, J. M., Adams, D. J., Lyon, R. M., and Takai,S. (1991). Tensile properties of the human femur-anterior cruciate ligament-tibiacomplex. The effects of specimen age and orientation. The American journal ofsports medicine, 19(3):217–225.
[Wood et al., 2011] Wood, S. A., Strait, D. S., Dumont, E. R., Ross, C. F., andGrosse, I. R. (2011). The effects of modeling simplifications on craniofacial finiteelement models: The alveoli (tooth sockets) and periodontal ligaments. Journal ofBiomechanics, 44(10):1831–1838.
145
[Xia et al., 2014] Xia, H., Bodempudi, V., Benyumov, A., Hergert, P., Tank, D., Her-rera, J., Braziunas, J., Larsson, O., Parker, M., Rossi, D., Smith, K., Peterson, M.,Limper, A., Jessurun, J., Connett, J., Ingbar, D., Phan, S., Bitterman, P. B., andHenke, C. A. (2014). Identification of a cell-of-origin for fibroblasts comprising thefibrotic reticulum in idiopathic pulmonary fibrosis. American Journal of Pathology.
[Xia et al., 2017] Xia, H., Gilbertsen, A., Herrera, J., Racila, E., Smith, K., Peterson,M., Griffin, T., Benyumov, A., Yang, L., Bitterman, P. B., and Henke, C. A. (2017).Calcium-binding protein S100A4 confers mesenchymal progenitor cell fibrogenicityin idiopathic pulmonary fibrosis. Journal of Clinical Investigation.
[Zarei et al., 2017a] Zarei, V., Liu, C. J., Claeson, A. A., Akkin, T., and Barocas,V. H. (2017a). Image-based multiscale mechanical modeling shows the importanceof structural heterogeneity in the human lumbar facet capsular ligament. Biome-chanics and Modeling in Mechanobiology.
[Zarei et al., 2017b] Zarei, V., Zhang, S., Winkelstein, B. A., and Barocas, V. H.(2017b). Tissue loading and microstructure regulate the deformation of embeddednerve fibres: Predictions from single-scale and multiscale simulations. Journal ofthe Royal Society Interface.
[Zhao et al., 2010] Zhao, B., Li, L., Tumaneng, K., Wang, C. Y., and Guan, K. L.(2010). A coordinated phosphorylation by Lats and CK1 regulates YAP stabilitythrough SCFβ-TRCP. Genes and Development.
[Zimmerman et al., 2001] Zimmerman, S. D., Thomas, D. P., Velleman, S. G., Li,X., Hansen, T. R., and McCormick, R. J. (2001). Time course of collagen anddecorin changes in rat cardiac and skeletal muscle post-MI. Am J Physiol HeartCirc Physiol, 281(4):H1816–H1822.
[Zulliger et al., 2004] Zulliger, M. A., Fridez, P., Hayashi, K., and Stergiopulos, N.(2004). A strain energy function for arteries accounting for wall composition andstructure. Journal of Biomechanics.
[Zwahlen et al., 2015] Zwahlen, A., Christen, D., Ruffoni, D., Schneider, P., Schmolz,W., and Muller, R. (2015). Inverse Finite Element Modeling for Characterization ofLocal Elastic Properties in Image-Guided Failure Assessment of Human TrabecularBone. Journal of biomechanical engineering, 137(1):011012.
146
Appendix A
Failure of the Porcine Ascending
Aorta: Multidirectional
Experiments and a Unifying
Microstructural Model
The content of this chapter was published as a research article in the Journal of
Biomechanical Engineering by Witzenburg, Dhume, Shah, Korenczuk, Wagner, Al-
ford, and Barocas [Witzenburg et al., 2017]. My contribution was aiding in experi-
mental testing and data processing, along with analyzing and processing simulation
results.
A.1 Background
The ascending thoracic aorta (Figure A.1(a)) supports tremendous hemodynamic
loading, expanding (∼11% area change [Mao et al., 2008]) during systole and elas-
147
tically recoiling during diastole to augment the forward flow of blood and coronary
perfusion [Humphrey, 2002]. Although it is only about 5 cm long [Gray, 1918,Dotter
et al., 1950] (15% of the total length of the thoracic aorta), the ascending aorta is
involved in 60% of all thoracic aortic aneurysms [Isselbacher, 2005]. Aneurysm dissec-
tion and rupture (resulting in imminent death) are the primary risks associated with
ascending thoracic aortic aneurysm (ATAA), occurring when the remodeled tissue is
no longer able to withstand the stresses generated by the arterial pressure. Unfortu-
nately, surgical repair of an ATAA also involves considerable risk. Statistically, death
from rupture becomes more likely than death during surgery at an ATAA diameter
over 5.5 cm, setting the current interventional guidelines [Isselbacher, 2005, Davies
et al., 2002, Davies et al., 2006, Elefteriades, 2010]. Aortic dissection and rupture
remain difficult to predict, however, occurring in a significant number of patients
with smaller aneurysms [Isselbacher, 2005,Davies et al., 2006,Pape et al., 2007] while
many patients with ATAA diameters above 5.5 cm do not experience aortic dissection
or rupture. New surgical guidelines have been proposed based on aneurysm growth
rate [Davies et al., 2002, Elefteriades, 2010] and normalized aneurysm size [Davies
et al., 2006, Svensson et al., 2003, Kaiser et al., 2008], but growth rates can be dif-
ficult to determine and require sequential imaging studies [Berger and Elefteriades,
2012], and normalizing aneurysm size is still a controversial strategy [Matura et al.,
2007, Nijs et al., 2014, Holmes et al., 2013, Etz et al., 2012]. A better understanding
of aortic wall mechanics, especially failure mechanics, is imperative.
Because of the complex geometry of the aortic arch (aggravated in the case of
aneurysm) and the complex mechanical environment surrounding an intimal tear,
the stress field in a dissecting aorta involves many different shear and tensile stresses.
It is therefore necessary to study tissue failure under as many loading conditions as
possible. Tissue from the ascending aorta has been tested in a variety of configurations
148
(reviewed by Avanzini et al. [Avanzini et al., 2014]), with uniaxial and equibiaxial
stretch tensile tests being the most common. In-plane uniaxial [Vorp et al., 2003, Il-
iopoulos et al., 2009b,Pichamuthu et al., 2013] and biaxial tension tests [Shah et al.,
2014, Okamoto et al., 2002, Azadani et al., 2013, Babu et al., 2015] provide informa-
tion on tensile failure in the plane of the medial lamella (σθθ, σzz), and the biaxial
tests can provide some additional information on in-plane shear (σθz). Although the
dominant stresses in these tests may be the primary stresses during vessel rupture,
they are not those driving dissection. Stresses near an advancing dissection include
a combination of radial tension (σrr) and transmural shear (σrθ, σrz) [van Baard-
wijk and Roach, 1987], which are more difficult to test experimentally. Peel tests on
pieces of artery [Sommer et al., 2008, Tong et al., 2011, Tsamis et al., 2014, Kozun,
2016] or aneurysm [Pasta et al., 2012] provide insight into the failure behavior of the
tissue in radial tension (σrr), loading perpendicular to the medial lamella, as does
direct extension to failure in the radial direction [Sommer et al., 2008]. To examine
transmural shear stresses (σrθ, σrz), the shear lap test, well established in the field of
adhesives [ASTM, 2001] and used by Gregory et al. [Gregory et al., 2011] to study
interlamellar mechanics of the annulus fibrosus of the intervertebral disk, is an attrac-
tive option. In the present work, our first objective was to obtain a more complete
picture of artery failure mechanics by using a combination of in- plane uniaxial and
equibiaxial, shear lap, and peel tests to cover all three-dimensional loading modalities
(Figs. A.1(b) and A.1(c)). To the best of our knowledge, this study was the first to
generate data on the interlamellar shear strength of aortic tissue in this manner.
The need for better experiments is complemented by the need for better computa-
tional models of tissue failure. Many theoretical models have been utilized to describe
ATAAs, but only a few have addressed failure and dissection [Volokh, 2008, Gasser
and Holzapfel, 2006,Ferrara and Pandolfi, 2008,Wang et al., 2015]. Volokh [Volokh,
149
2008] used a softening hyperelastic material model and a two-fiber family strain en-
ergy density function within the context of a bilayer arterial model to examine the
failure of arteries during inflation. This model yields valuable results concerning rup-
ture but does not address dissection. An impressive model of dissection mechanics
was put forward by Gasser and Holzapfel [Gasser and Holzapfel, 2006], employing
a finite-element (FE) model with independent continuous and cohesive zones. The
Gasser-Holzapfel model combines a nonlinear continuum mechanical framework with
a cohesive zone model to investigate the propagation of arterial dissection, and it
agreed well with experimental peel test results [Sommer et al., 2008]. However, the
reliance on the a priori definition of the location and size of the cohesive zone, the
zone in which microcrack initialization and coalescence are confined, limits the model.
In addition, the model does not address microscale failure; that is, it does not capture
the complex fiber–fiber and fiber–matrix interactions during dissection and does not
account for the lamellar structure of the vessel wall. Similar results to those of Gasser
and Holzapfel were found by Ferrara and Pandolfi [Ferrara and Pandolfi, 2008], who
investigated the impacts of mesh refinement and cohesive strength on dissection. Al-
ternatively, Wang et al. [Wang et al., 2015] used an energy approach, rather than
a cohesive zone, to simulate dissection in two dimensions. In addition to tear prop-
agation, Wang’s model was capable of simulating tear arrest, reflecting the clinical
observation that dissection often occurs in stages. The energy approach presented,
however, requires a priori definition of crack direction, does not allow changes in
propagation direction, and does not address microscale failure. Advantages of a mul-
tiscale model include its ability to link observed macroscale properties to changes in
microscale structure and its allowance of spontaneous failure initiation location and
growth.
Recently, we utilized a multiscale model to describe ex vivo testing results of
150
porcine ascending aorta in both uniaxial and equibiaxial extension [Shah et al., 2014].
The tissue microstructure was idealized as a single network of uniform-diameter fibers
functioning in parallel with a neo-Hookean component that accounted for all nonfib-
rillar contributions. Although that model worked well for in-plane behavior, the
lack of an accurate representation of the lamellar structure rendered it inaccurate
for out-of-plane data and failed to take advantage of the full capabilities of the mul-
tiscale computational framework. It was clearly necessary to modify the simplified
microstructural organization of our earlier work and consider the layered structure
of the medial lamellae, including in particular the interlamellar connections, in order
to capture the tissue’s biomechanics in all loading conditions more relevant to dis-
section. Therefore, the second and third objectives of this study were to generate a
tissue-specific microstructure based on the layered structure of the aorta and to utilize
the new microstructure to build a multiscale model capable of replicating experimen-
tal results from all the mechanical tests (uniaxial extension to failure, equibiaxial
extension, peel to failure, and shear lap failure) performed.
A.2 Methods
A.2.1 Experiments
Ascending aortic tissue was obtained from healthy adolescent male swine (∼6 months;
87.4 ± 9.6 kg, mean ± SD) following an unrelated in vivo study on right atrial radio
frequency ablation and stored in 1% phosphate-buffered saline (PBS) solution at
4° C. Tissue specimens were tested within 48 h of harvest while immersed in 1% PBS
at room temperature. Per our previous study [Shah et al., 2014], a ring of tissue
was dissected from the ascending aorta and cut open along its superior edge (Figs.
A.2(a) and A.2(b)). The tissue specimen was cut into small samples, both axially
151
and circumferentially aligned, for mechanical testing. Several samples were obtained
from each aorta (a typical dissection and testing plan is shown in Figure A.2(c)).
Four different loading modalities were utilized to characterize the tissue mechan-
ically: uniaxial, equibiaxial, peel, and lap tests (Figure A.3). Planar uniaxial and
equibiaxial tests, which characterized the tissue in tension along the medial lamella
(σθθ, σzz, σθz), were performed and described previously [Shah et al., 2014]. The
intima, adipose tissue, and adventitia were removed from samples tested uniaxially
and biaxially. While these testing modalities are relevant to the rupture of the vessel,
dissection of the ascending aorta occurs when the medial lamellae separates into two
layers and thus is highly dependent on the behavior of the tissue across lamellae.
Thus, two additional mechanical testing modes were utilized. Peel tests (cf. [Sommer
et al., 2008, Tong et al., 2011, Pasta et al., 2012]) were performed to quantify the
tissues’ tensile response perpendicular to the medial lamellae (σrr) and subsequent
dissection of the media into two layers. Shear lap tests were performed to quantify
the tissues’ response when exposed to shear along the medial lamella (σrz, σrθ). The
two protocols are described in detail below.
Peel Tests. The peel test (Figure A.3(c)) measures the adhesive force between
two layers as they are pulled apart. For each rectangular sample designated for
peel testing, a ∼4 mm incision was made parallel to the plane of the aortic wall to
initiate delamination. The incision was made such that the delamination plane was
approximately centered within the medial layer, thus separating the sample into two
flaps of approximately equal thickness. Images of the sample were taken to determine
its initial unloaded dimensions. There was a moderate variation in the exact location
of the incision with respect to the center of the media due to sample size and cutting
technique. If the delamination plane was outside the middle third of the sample
thickness, the sample was discarded. Lines were drawn on the side of the sample with
152
Verhoeff’s stain in order to track the progress of failure.
The two flaps of the delaminated section of the tissue sample were then mounted
in a custom gripping system with sandpaper on either side to prevent slipping and
secured to a uniaxial tester. Samples were cut and mounted on a uniaxial testing
machine (MTS, Eden Prairie, MN) such that the vertical direction, as shown in Figure
A.3(c), was either axial or circumferential with respect to the vessel. The two flaps
were peeled apart, causing the tissue sample to delaminate, at a constant displacement
rate of 3 mm/min, and force was measured with a 5 N load cell. Preliminary tests
showed no significant dependence on grip speed in the range of 1-10 mm/min, so a
single velocity was used for all the subsequent experiments. Images of the side of
the sample were recorded every 5 s throughout testing to capture the progression of
failure. Peel tension was computed as force divided by undeformed sample width for
both axially and circumferentially oriented samples.
Shear Lap Failure. The shear lap test (Figure A.3(d)) produces large shear stresses
in the overlap region. Rectangular samples designated for shear lap testing were
specially shaped to test their shear strength. A ∼3.5 mm incision was made on
each end of the sample centered within the medial layer and separating each end of
the sample into two flaps of approximately equal thickness. The flap containing the
intimal surface was removed from one end, and the flap containing the adventitial
surface was removed from the other, resulting in the shear lap sample shape with an
overlap length (black-dotted line in Figure A.3(d)) of 3.0 mm. Images of the sample
were taken to determine its initial unloaded dimensions. Again, there was moderate
variation in incision location with respect to the center of the media due to sample
size and cutting technique; therefore, if either incision surface was measured to be
outside, the middle third of the sample thickness the sample was discarded. Verhoeff’s
stain was used to texture the side of the sample for optical displacement tracking.
153
The specially cut sample was then mounted in a custom gripping system with
sandpaper on either side to prevent slipping and secured to a uniaxial tester (MTS,
Eden Prairie, MN). The height of the grips was adjusted such that the overlap surface
was along the horizontal, and an image of the sample was taken to determine its initial
unloaded dimensions. Each sample was extended to failure at a constant displacement
rate of 3 mm/min, and force was measured with a 5 N load cell. During testing,
digital video of the side of the sample was obtained at 24 fps, 1080p HD resolution,
and spatial resolution of ∼103 pixels/mm. Image analysis and dis- placement tracking
were performed per our previous studies [Raghupathy et al., 2011,Witzenburg et al.,
2012].
Shear stress was computed as force divided by the undeformed overlap area (sam-
ple width multiplied by overlap length). Unlike the peel test, which has been used
previously to investigate aortic tissue [Sommer et al., 2008,Pasta et al., 2012], to the
best of our knowledge the shear lap test has never been used to investigate aorta or
other cardiovascular soft tissues (though Gregory et al. used a similar test to inves-
tigate the shear properties of the annulus fibrosus [Gregory et al., 2011]). Therefore,
displacement tracking was performed to verify that the shear lap test, as applied to
the ascending thoracic aorta, produced large shear strains in the overlap region.
A.2.2 Statistical analysis and presentation
Unless otherwise stated, the p-values are based on unpaired two-tailed t-tests, and
p-values less than 0.05 were deemed significant. Values are reported as mean ± 95%
confidence interval (CI).
154
A.2.3 Model
The multiscale model employed was an extension of the previously presented model
of collagen gel mechanics [Chandran et al., 2008, Hadi et al., 2012] applied recently
to porcine aortic failure during in-plane tests [Shah et al., 2014]. It consisted of
three scales: the FE domain at the millimeter (mm) scale, representative volume
elements (RVEs) at the micrometer (µm) scale, and fibers with radii at the 100
nanometer (nm) scale. Each finite element contained eight Gauss points, and each
Gauss point was associated with an RVE. Each RVE was comprised of a discrete
fiber network in parallel with a nearly incompressible neo-Hookean component (to
represent the nonfibrous material). The governing equations are given in Table A.1.
The major advance to the model was the implementation of a new tissue-specific
network, specifically designed to capture the different components of the aortic wall.
The aorta is organized into thick concentric medial fibrocellular layers which can
be represented by discrete structural and functional units. The lamellar unit, de-
tailed by Clark and Glagov [Clark and Glagov, 1985], consists of an elastic lamina
sandwiched between two sheets of smooth muscle cells. The small-scale network
in our computational model was designed to simulate the architecture of this dis-
crete lamellar unit (Figure A.4), as visualized by histological analysis. Portions of
unloaded porcine ascending aorta were cut such that the transmural structure was
aligned in the circumferential, i.e., horizontal, direction and fixed in 10% buffered
neutral formalin solution overnight, embedded in paraffin, and prepared for histolog-
ical investigation per standard techniques. Sections were stained consecutively with
hematoxylin and eosin (HE) stain (Figure A.4(a)) to visualize smooth-muscle cell
nuclei, Masson’s trichrome stain (Figure A.4(b)) to visualize collagen, and Verhoeff’s
Van Gieson stain (Figure A.4(c)) to visualize elastin. The final network structure is
shown in Figure A.4(d), and the network parameters are given in Table A.2. The
155

Equation Description Scale
σij,j = 1V
∮∂V(σLij − σij
)uk,jnkdS
σ:macroscale averaged Cauchy stressV : RVE volumeσL: microscale stressu: RVE boundary displacementn: normal vector to RVE boundary
Macroscalevolume-averaged stress
balanceTissue
σij = 1V
∫σLijdV = 1
V
∑b fixj
b: RVE boundary cross linksx: boundary coordinatef : force acting on boundary
Volume-averagedRVE stress
Network
Ff = EAβ
(eβ
λ2−12
−1)
Ff : fiber forceE: fiber stiffnessA: fiber cross-sectional areaβ: fiber non-linearityλ: fiber stretch
Fiber constitutiveequation
Fiber
σMij = GJ
(Bij − δij) + 2GνJ(1−2ν)
δijln(J)
σM : matrix Cauchy stressG: matrix shear modulusJ : deformation tensor determinantB: left Cauchy-Green tensorν: Poisson’s ratio
neo-Hookean matrixconstitutive equation
Tissue
Table A.1: Governing equations applied within the multiscale model, as well as thelength scale at which each equation was applied.
156
volume fraction for the tissue-specific network was set to 5% per the porcine aorta
volume fraction measurements of Snowhill et al. [Snowhill et al., 2004]. The elastic
lamina was represented by a 2-D sheet of elastin and collagen fibers. Collagen fibers
within the elastin–collagen sheet were generated such that they exhibited strong cir-
cumferential orientation, based on the known tissue structure [Clark and Glagov,
1985, Tonar et al., 2015, Snowhill et al., 2004, Timmins et al., 2010, Sokolis et al.,
2008]. Histological and compositional studies show more elastin than collagen within
each lamina of the ascending aortic wall. Based on the histological observations of
Sokolis et al. [Sokolis et al., 2008], the overall ratio of elastin-to-collagen within the
2-D sheet was set to 1.6. Elastin fibers were generated such that orientation was
approximately isotropic within the plane. The radial properties of the aorta are less
well established [Dobrin, 1978, MacLean et al., 1999] but are extremely important
because failure of the interlamellar connections dictates delamination and thus aortic
dissection. Within the model network, the interlamellar connections were designed
to encompass the combined effect of all structural components (smooth muscle cells,
fine collagen fibers, and fine elastin fibers) contributing to radial strength.
Smooth-muscle cells within the media exhibit preferential circumferential align-
ment [Clark and Glagov, 1985, Timmins et al., 2010, Dingemans et al., 2000], so in-
terlamellar connections were aligned with circumferential preference. Since the inter-
lamellar connections encompass the combined effect of all the structural components
contributing to radial strength (smooth muscle cells, fine collagen fibers, and fine
elastin fibers), it is somewhat unclear how to define the proportion of interlamellar
connections-to-elastic lamina fibers. Snowhill et al. [Snowhill et al., 2004] determined
the volume ratio of collagen to smooth muscle to be 1:1 in porcine vessels. While
clearly the interlamellar connections encompass some collagen, and the elastic lamina
contains large amounts of elastin, we utilized this 1:1 ratio.
157
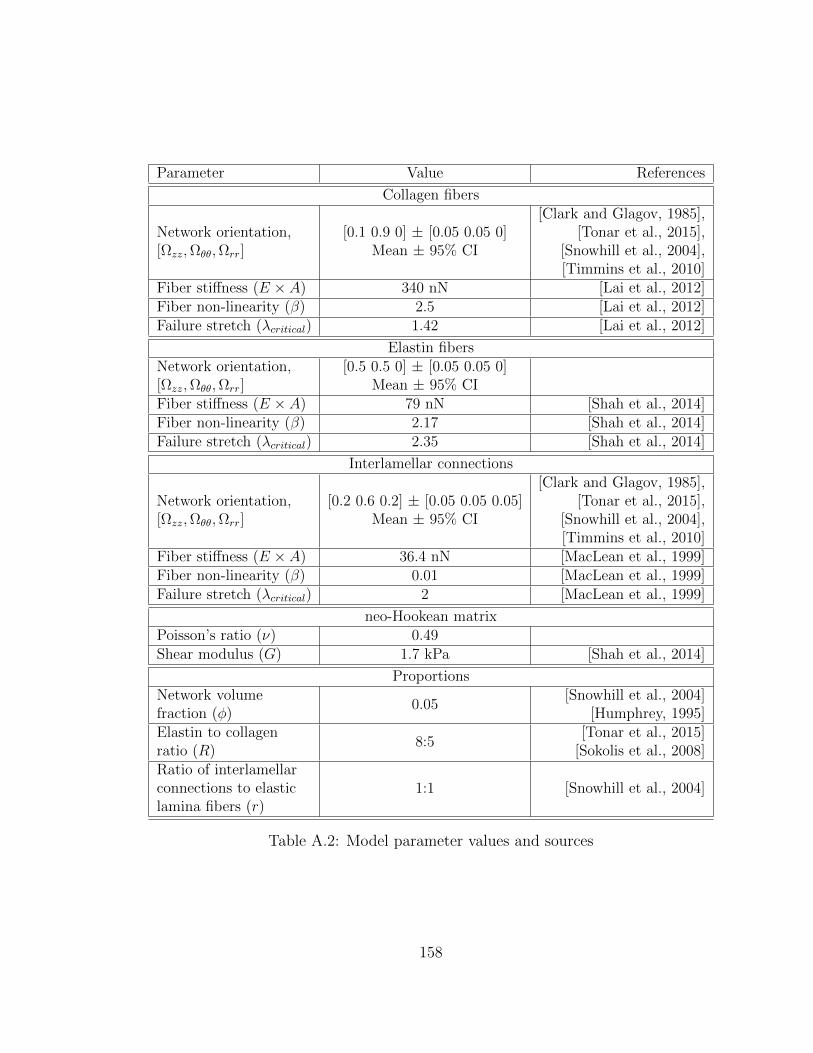
Parameter Value References
Collagen fibers
Network orientation,[Ωzz,Ωθθ,Ωrr]
[0.1 0.9 0] ± [0.05 0.05 0]Mean ± 95% CI
[Clark and Glagov, 1985],[Tonar et al., 2015],
[Snowhill et al., 2004],[Timmins et al., 2010]
Fiber stiffness (E × A) 340 nN [Lai et al., 2012]Fiber non-linearity (β) 2.5 [Lai et al., 2012]Failure stretch (λcritical) 1.42 [Lai et al., 2012]
Elastin fibersNetwork orientation,[Ωzz,Ωθθ,Ωrr]
[0.5 0.5 0] ± [0.05 0.05 0]Mean ± 95% CI
Fiber stiffness (E × A) 79 nN [Shah et al., 2014]Fiber non-linearity (β) 2.17 [Shah et al., 2014]Failure stretch (λcritical) 2.35 [Shah et al., 2014]
Interlamellar connections
Network orientation,[Ωzz,Ωθθ,Ωrr]
[0.2 0.6 0.2] ± [0.05 0.05 0.05]Mean ± 95% CI
[Clark and Glagov, 1985],[Tonar et al., 2015],
[Snowhill et al., 2004],[Timmins et al., 2010]
Fiber stiffness (E × A) 36.4 nN [MacLean et al., 1999]Fiber non-linearity (β) 0.01 [MacLean et al., 1999]Failure stretch (λcritical) 2 [MacLean et al., 1999]
neo-Hookean matrixPoisson’s ratio (ν) 0.49Shear modulus (G) 1.7 kPa [Shah et al., 2014]
ProportionsNetwork volumefraction (φ)
0.05[Snowhill et al., 2004]
[Humphrey, 1995]Elastin to collagenratio (R)
8:5[Tonar et al., 2015]
[Sokolis et al., 2008]Ratio of interlamellarconnections to elasticlamina fibers (r)
1:1 [Snowhill et al., 2004]
Table A.2: Model parameter values and sources
158
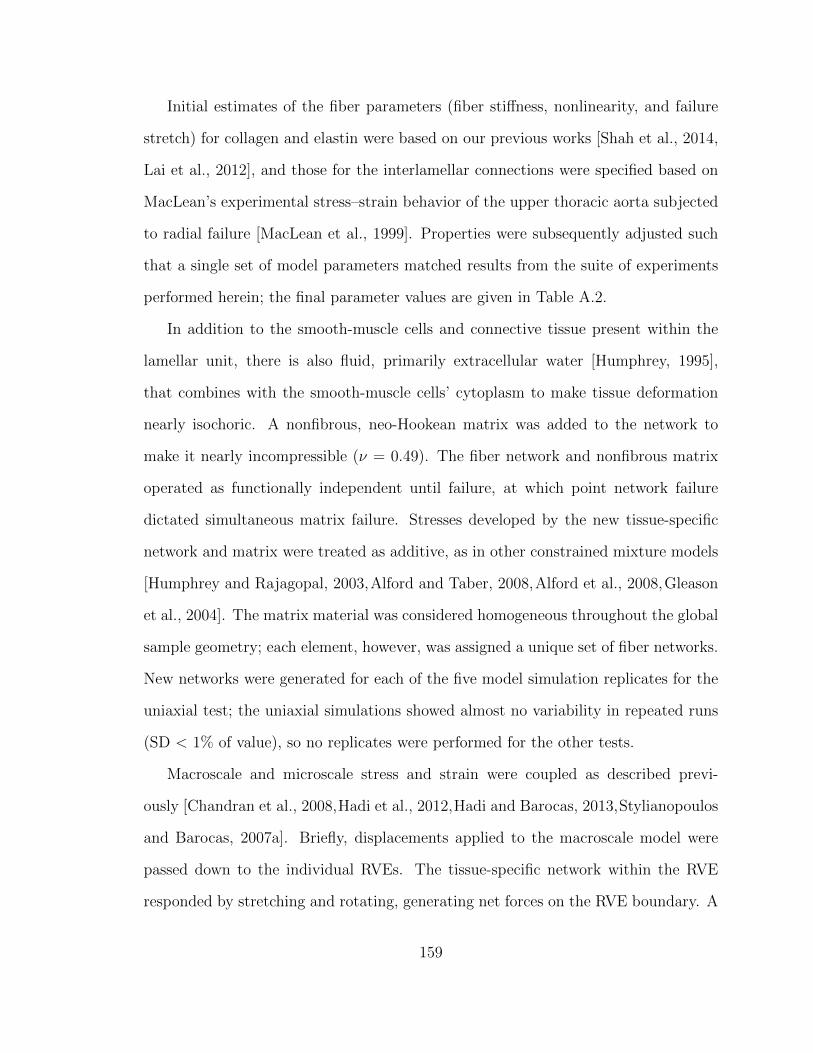
Initial estimates of the fiber parameters (fiber stiffness, nonlinearity, and failure
stretch) for collagen and elastin were based on our previous works [Shah et al., 2014,
Lai et al., 2012], and those for the interlamellar connections were specified based on
MacLean’s experimental stress–strain behavior of the upper thoracic aorta subjected
to radial failure [MacLean et al., 1999]. Properties were subsequently adjusted such
that a single set of model parameters matched results from the suite of experiments
performed herein; the final parameter values are given in Table A.2.
In addition to the smooth-muscle cells and connective tissue present within the
lamellar unit, there is also fluid, primarily extracellular water [Humphrey, 1995],
that combines with the smooth-muscle cells’ cytoplasm to make tissue deformation
nearly isochoric. A nonfibrous, neo-Hookean matrix was added to the network to
make it nearly incompressible (ν = 0.49). The fiber network and nonfibrous matrix
operated as functionally independent until failure, at which point network failure
dictated simultaneous matrix failure. Stresses developed by the new tissue-specific
network and matrix were treated as additive, as in other constrained mixture models
[Humphrey and Rajagopal, 2003,Alford and Taber, 2008,Alford et al., 2008,Gleason
et al., 2004]. The matrix material was considered homogeneous throughout the global
sample geometry; each element, however, was assigned a unique set of fiber networks.
New networks were generated for each of the five model simulation replicates for the
uniaxial test; the uniaxial simulations showed almost no variability in repeated runs
(SD < 1% of value), so no replicates were performed for the other tests.
Macroscale and microscale stress and strain were coupled as described previ-
ously [Chandran et al., 2008,Hadi et al., 2012,Hadi and Barocas, 2013,Stylianopoulos
and Barocas, 2007a]. Briefly, displacements applied to the macroscale model were
passed down to the individual RVEs. The tissue-specific network within the RVE
responded by stretching and rotating, generating net forces on the RVE boundary. A
159

volume-averaged stress was determined for each Gauss point within the element from
the net forces on the network boundary and the nonfibrous resistance to volumetric de-
formation. The macroscopic displacement field was updated until the global Cauchy
stress balance was satisfied. Grip boundaries were enforced using rigid boundary
conditions and the remaining sample surfaces were stress-free. All model simula-
tions were run using 256-core parallel processors at the Minnesota Supercomputing
Institute, Minneapolis, MN; clock times averaged 10 h per simulation.
Finally, we ran a brief simulation of uniaxial extension in the radial direction
to compare with the experimental results of MacLean et al. [MacLean et al., 1999],
who performed uniaxial extension to failure of porcine aorta samples in the radial
direction as noted earlier. The MacLean study represented an important test for our
approach since the experiments were performed on the same tissue (healthy porcine
thoracic ascending aorta) but in a mode that we did not use to generate and fit the
model (radial extension to failure). Although MacLean did not report the tensile
stress at failure, they reported the average tangent modulus at failure as well as the
status of different samples at specific values of stretch; these data provided a basis
for comparison with the model.
A.3 Results
Experiments were performed in four different geometries: uniaxial, biaxial, peel, and
lap. In the uniaxial, peel, and lap tests, samples were prepared and pulled in two
different directions, with some samples being tested in the axial direction and others
in the circumferential direction. The multiscale model was used to describe all of
the different experiments; the same set of model parameters was used for all of the
experiments, including both prefailure and failure behavior.
160

A.3.1 Uniaxial extension to failure
Uniaxial samples (Figure A.5(a)) aligned both circumferentially (n = 11) and axially
(n = 11) were loaded to failure. In Figure A.5(b), the first Piola-Kirchhoff (PK1)
stress, defined as the grip force divided by the undeformed crosssectional area of
the neck of the dogbone, was plotted as a function of grip stretch along with the
best-fit tissue-specific model curves for samples aligned circumferentially and axially,
respectively. The specified and regressed model parameters of Table A.2 allowed the
model to match the experimental prefailure and failure results to within the 95%
confidence intervals for both orientations, matching the roughly threefold difference
in failure stress (2510 ± 979 kPa for samples aligned circumferentially as compared
to 753 ± 228 kPa for those aligned axially) and similar to stretch to failure (1.99
± 0.07 for samples aligned circumferentially as compared to 1.91 ± 0.16 for those
aligned axially) in the circumferential case vis-a-vis the longitudinal case. The neck
region of the simulated uniaxial samples (both circumferential and axial) experienced
the largest stresses (as expected) and also a large degree of fiber reorientation, as can
be seen in Figure A.5(b). For the simulated experiments oriented circumferentially,
the collagen fibers, which were already preferentially aligned in the circumferential
direction, became more strongly aligned and were stretched, leading to the relatively
high stresses observed. In contrast, for the simulated experiments oriented axially, the
collagen fibers tended to pull apart by stretching the surrounding elastin, leading to
a significantly lower stress and more failure of the elastin fibers. In both simulations,
the collagen fibers were most likely to fail due to the extremely large extensibility of
the elastin fibers, but the tendency of the collagen fibers to break was much higher
in the circumferentially aligned simulated experiments (Figure A.5(c)). This shift is
attributed to the collagen fibers being aligned in the direction of the pull and thus
being forced to stretch more during circumferential extension, whereas there is more
161
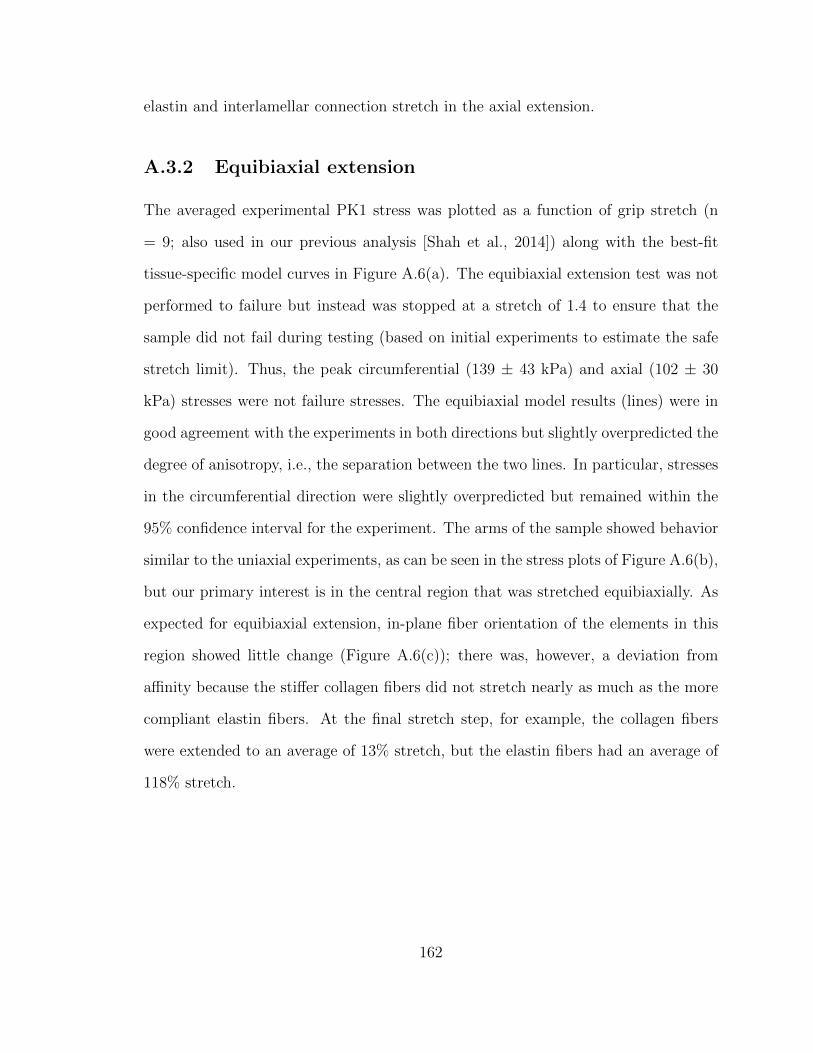
elastin and interlamellar connection stretch in the axial extension.
A.3.2 Equibiaxial extension
The averaged experimental PK1 stress was plotted as a function of grip stretch (n
= 9; also used in our previous analysis [Shah et al., 2014]) along with the best-fit
tissue-specific model curves in Figure A.6(a). The equibiaxial extension test was not
performed to failure but instead was stopped at a stretch of 1.4 to ensure that the
sample did not fail during testing (based on initial experiments to estimate the safe
stretch limit). Thus, the peak circumferential (139 ± 43 kPa) and axial (102 ± 30
kPa) stresses were not failure stresses. The equibiaxial model results (lines) were in
good agreement with the experiments in both directions but slightly overpredicted the
degree of anisotropy, i.e., the separation between the two lines. In particular, stresses
in the circumferential direction were slightly overpredicted but remained within the
95% confidence interval for the experiment. The arms of the sample showed behavior
similar to the uniaxial experiments, as can be seen in the stress plots of Figure A.6(b),
but our primary interest is in the central region that was stretched equibiaxially. As
expected for equibiaxial extension, in-plane fiber orientation of the elements in this
region showed little change (Figure A.6(c)); there was, however, a deviation from
affinity because the stiffer collagen fibers did not stretch nearly as much as the more
compliant elastin fibers. At the final stretch step, for example, the collagen fibers
were extended to an average of 13% stretch, but the elastin fibers had an average of
118% stretch.
162
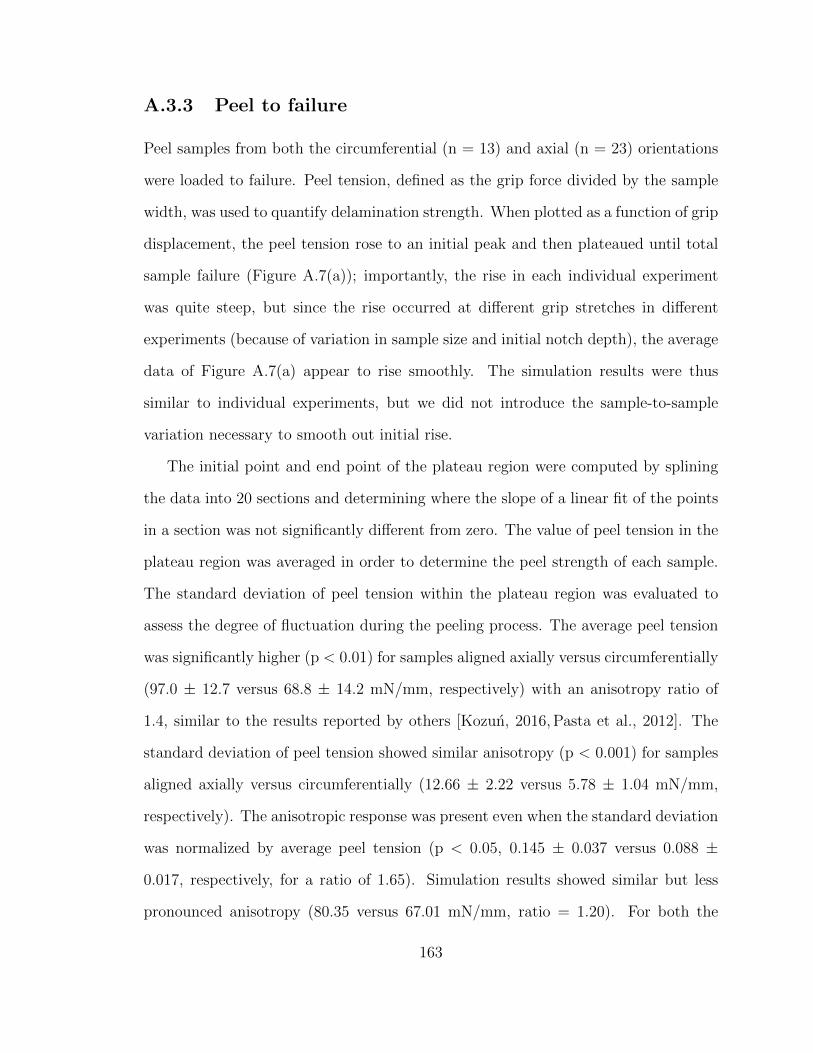
A.3.3 Peel to failure
Peel samples from both the circumferential (n = 13) and axial (n = 23) orientations
were loaded to failure. Peel tension, defined as the grip force divided by the sample
width, was used to quantify delamination strength. When plotted as a function of grip
displacement, the peel tension rose to an initial peak and then plateaued until total
sample failure (Figure A.7(a)); importantly, the rise in each individual experiment
was quite steep, but since the rise occurred at different grip stretches in different
experiments (because of variation in sample size and initial notch depth), the average
data of Figure A.7(a) appear to rise smoothly. The simulation results were thus
similar to individual experiments, but we did not introduce the sample-to-sample
variation necessary to smooth out initial rise.
The initial point and end point of the plateau region were computed by splining
the data into 20 sections and determining where the slope of a linear fit of the points
in a section was not significantly different from zero. The value of peel tension in the
plateau region was averaged in order to determine the peel strength of each sample.
The standard deviation of peel tension within the plateau region was evaluated to
assess the degree of fluctuation during the peeling process. The average peel tension
was significantly higher (p < 0.01) for samples aligned axially versus circumferentially
(97.0 ± 12.7 versus 68.8 ± 14.2 mN/mm, respectively) with an anisotropy ratio of
1.4, similar to the results reported by others [Kozun, 2016, Pasta et al., 2012]. The
standard deviation of peel tension showed similar anisotropy (p < 0.001) for samples
aligned axially versus circumferentially (12.66 ± 2.22 versus 5.78 ± 1.04 mN/mm,
respectively). The anisotropic response was present even when the standard deviation
was normalized by average peel tension (p < 0.05, 0.145 ± 0.037 versus 0.088 ±
0.017, respectively, for a ratio of 1.65). Simulation results showed similar but less
pronounced anisotropy (80.35 versus 67.01 mN/mm, ratio = 1.20). For both the
163
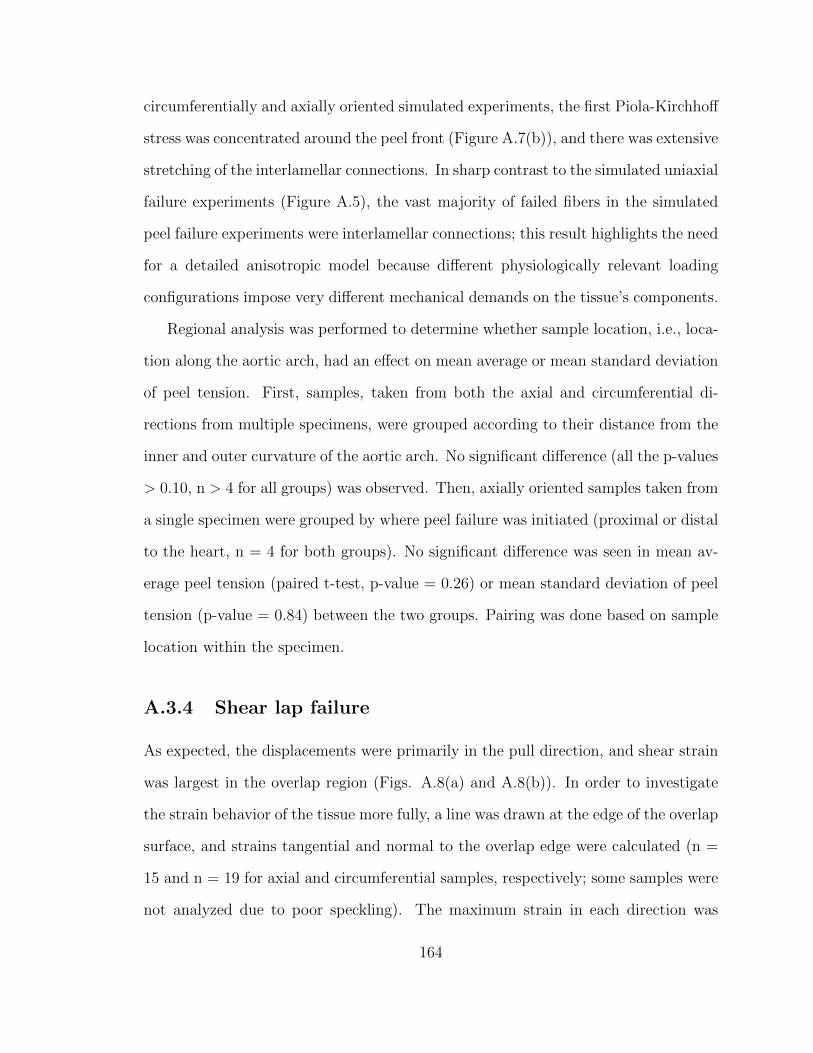
circumferentially and axially oriented simulated experiments, the first Piola-Kirchhoff
stress was concentrated around the peel front (Figure A.7(b)), and there was extensive
stretching of the interlamellar connections. In sharp contrast to the simulated uniaxial
failure experiments (Figure A.5), the vast majority of failed fibers in the simulated
peel failure experiments were interlamellar connections; this result highlights the need
for a detailed anisotropic model because different physiologically relevant loading
configurations impose very different mechanical demands on the tissue’s components.
Regional analysis was performed to determine whether sample location, i.e., loca-
tion along the aortic arch, had an effect on mean average or mean standard deviation
of peel tension. First, samples, taken from both the axial and circumferential di-
rections from multiple specimens, were grouped according to their distance from the
inner and outer curvature of the aortic arch. No significant difference (all the p-values
> 0.10, n > 4 for all groups) was observed. Then, axially oriented samples taken from
a single specimen were grouped by where peel failure was initiated (proximal or distal
to the heart, n = 4 for both groups). No significant difference was seen in mean av-
erage peel tension (paired t-test, p-value = 0.26) or mean standard deviation of peel
tension (p-value = 0.84) between the two groups. Pairing was done based on sample
location within the specimen.
A.3.4 Shear lap failure
As expected, the displacements were primarily in the pull direction, and shear strain
was largest in the overlap region (Figs. A.8(a) and A.8(b)). In order to investigate
the strain behavior of the tissue more fully, a line was drawn at the edge of the overlap
surface, and strains tangential and normal to the overlap edge were calculated (n =
15 and n = 19 for axial and circumferential samples, respectively; some samples were
not analyzed due to poor speckling). The maximum strain in each direction was
164
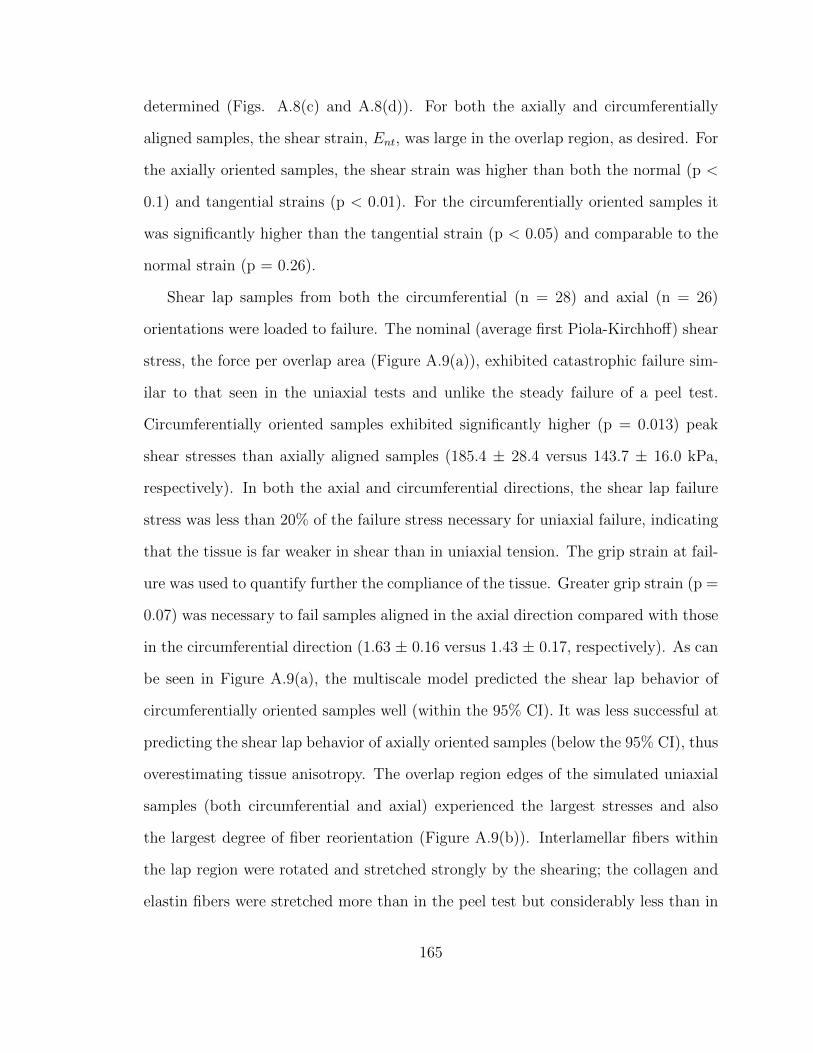
determined (Figs. A.8(c) and A.8(d)). For both the axially and circumferentially
aligned samples, the shear strain, Ent, was large in the overlap region, as desired. For
the axially oriented samples, the shear strain was higher than both the normal (p <
0.1) and tangential strains (p < 0.01). For the circumferentially oriented samples it
was significantly higher than the tangential strain (p < 0.05) and comparable to the
normal strain (p = 0.26).
Shear lap samples from both the circumferential (n = 28) and axial (n = 26)
orientations were loaded to failure. The nominal (average first Piola-Kirchhoff) shear
stress, the force per overlap area (Figure A.9(a)), exhibited catastrophic failure sim-
ilar to that seen in the uniaxial tests and unlike the steady failure of a peel test.
Circumferentially oriented samples exhibited significantly higher (p = 0.013) peak
shear stresses than axially aligned samples (185.4 ± 28.4 versus 143.7 ± 16.0 kPa,
respectively). In both the axial and circumferential directions, the shear lap failure
stress was less than 20% of the failure stress necessary for uniaxial failure, indicating
that the tissue is far weaker in shear than in uniaxial tension. The grip strain at fail-
ure was used to quantify further the compliance of the tissue. Greater grip strain (p =
0.07) was necessary to fail samples aligned in the axial direction compared with those
in the circumferential direction (1.63 ± 0.16 versus 1.43 ± 0.17, respectively). As can
be seen in Figure A.9(a), the multiscale model predicted the shear lap behavior of
circumferentially oriented samples well (within the 95% CI). It was less successful at
predicting the shear lap behavior of axially oriented samples (below the 95% CI), thus
overestimating tissue anisotropy. The overlap region edges of the simulated uniaxial
samples (both circumferential and axial) experienced the largest stresses and also
the largest degree of fiber reorientation (Figure A.9(b)). Interlamellar fibers within
the lap region were rotated and stretched strongly by the shearing; the collagen and
elastin fibers were stretched more than in the peel test but considerably less than in
165
the uniaxial and biaxial tests. As a result (Figure A.9(c)), the distribution of failed
fibers was split more between the different fiber types than during peel or uniaxial
failure. Even though the interlamellar connections, being much weaker than the oth-
ers, were the most common to fail, there was also significant damage to the collagen
and elastin fibers, perhaps due to the tangential component of the strain during the
test (Figure A.8(d)).
A.3.5 Summary comparison of model and experiment
Since a stated goal of this work was construct a multiscale model of aortic tissue me-
chanics that predicts failure in many different physiologically relevant loading modali-
ties, we present a brief summary of the experimental and model failure results. Figure
A.10 shows the failure PK1 stress in uniaxial tests, failure tension in peel tests, and
failure shear stress in shear lap tests for both the experiments and simulations for
samples aligned in both the circumferential and axial directions. A single model
with one set of parameters matches all of the experimental results well. It captures
both the anisotropy exhibited in the different tests as well as the magnitude of stress
or tension. In particular, the model predicts the considerably lower tissue strength
observed in shear lap tests than that seen in uniaxial extension.
A.3.6 Uniaxial extension to failure in the radial direction
MacLean et al. [MacLean et al., 1999] reported that the average tangent modulus
before failure was 61.4 ± 43 kPa. For our simulations, we found that the tangent
modulus before failure was 58 kPa, in obvious good agreement with MacLean’s ex-
perimental result. The stretch ratio at failure in the model was 3.1, and MacLean
reported that “there was noticeable elastin layer separation” at a stretch ratio of 2,
166
and that a stretch ratio of 3.5 was “past the value at which the wall can maintain
stress.” Although the report of MacLean is obviously vague, the model results all ap-
pear to be consistent with MacLean’s observations. The ability to make a reasonable
prediction of an experiment performed using loading modality different from those
used in the creation and specification of the model is a necessary feature for broader
application in the future.
A.4 Discussion
Two important results came from the current work. First, a more complete picture
of the failure behavior of aortic tissue was generated, demonstrating and quantifying
the pronounced difference between the relatively high tissue strength in the lamellar
plane (longitudinal and especially circumferential directions) and the low strength of
the interlamellar connections (radial direction, demonstrated by peel and lap tests).
Second, a novel multiscale, microstructural model was presented that, with proper
adjustment of the model parameters, was able to reproduce the wide range of exper-
imental observations accurately. This section focuses first on the experiments and
then on the model, addressing them in the context of previous work by ourselves and
others.
The current study used two novel test methods, the peel test and the shear lap
test, to measure material failure in radial tension and transmural shear, respectively.
The peel test is relatively new but has been used by others [Sommer et al., 2008,Tong
et al., 2011, Pasta et al., 2012], and our results are consistent with their findings in
terms of peel tension as well as the observation that the anisotropy typically expected
of arteries in in-plane tests (higher circumferential versus axial stiffness) is reversed in
peeling. Sommer et al. [Sommer et al., 2008] suggested that the anisotropic behavior
167
may be a protective mechanism since dissection in the axial direction is often asso-
ciated with failure across elastic laminae, whereas dissection in the circumferential
direction typically prop- agates between adjacent laminae. Pal et al. [Pal et al., 2014]
suggested based on histology of peeled samples that the anisotropy may be due to
stitching of the fibers, with failure in circumferential peeling occurring via a pull-out
mechanism, whereas failure in axial peeling occurs via a tearing mechanism. This in-
teresting conceptual description cannot be captured in our current model but clearly
merits further investigation.
Although the shear lap test has been used on annulus fibrosus [Gregory et al.,
2011], to the best of our knowledge it has not been applied to cardiovascular soft
tissues. The loading curve for the shear lap test of ascending aorta showed catas-
trophic failure similar to that of a uniaxial test rather than the sliding behavior seen
by Gregory et al., perhaps attributable to differences in the structure and properties
between the annulus fibrosus and the ascending aorta. The failure behavior observed
for the shear lap test retained the typical anisotropy expected of arteries, but re-
quired a much lower stress than that of uniaxial failure, presumably because the
failure did not require as much breaking of collagen and elastin fibers. The shear lap
and peel test results directly test the connections between lamellar units, and they
are therefore critical in the case of a dissecting ascending aortic aneurysm. As our
community moves forward to more patient-based geometries and simulations involv-
ing realistic geometries that necessarily lead to complex stress fields, validation of
models in multidimensional loading is crucial. For example, it is common [Wisneski
et al., 2014, Krishnan et al., 2015, Trabelsi et al., 2015, Martin et al., 2015, Martufi
et al., 2014] to report results in terms of principal stresses, which are informative
but do not address the fact that a stress acting radially or in shear is more likely to
lead to tissue failure than one acting circumferentially. Martin et al. [Martin et al.,
168
2015] used a potentially generalizable energy-based failure threshold, but they based
the failure criterion on uniaxial circumferential tests. Although Martin’s work rep-
resents a significant advance and demonstrates the potential of the patient-specific
FE approach, there is clear need for a more accurate failure model, which could be
informed by the current work. Another major challenge is that the tissue proper-
ties surely change during aneurysm formation, growth, and remodeling. The current
work used only healthy porcine tissue, so our results are useful in guiding thought
but should not be considered representative of human aneurysm tissue. There is also
great need to develop better tools to estimate tissue mechanical properties in vivo,
which would allow the construction of patient-specific constitutive models to match
the patient-specific geometries currently in use.
Another goal of this study was to generate a tissue-specific microstructural de-
scription based on the layered structure of the aorta. Such a description, when incor-
porated into our multiscale modeling framework, could replicate mechanical behavior
of arteries in lamellar tension, radial tension, and transmural shear, thereby linking
microscale failure to the macroscale response. The simplified microstructural organi-
zation of our previous work [Shah et al., 2014] was replaced with a new lamellar model
to capture the microstructure more faithfully. The lamella’s structure is an essential
component in modeling dissection of ATAA since radial and shear loading involve fail-
ure of the interlamellar connections rather than the lamina itself. The microstructure
design of Figure A.4 mimics the lamellar unit, detailed by Clark and Glagov [Clark
and Glagov, 1985], and visualized here histologically. The unit is represented by a 2-D
sheet of elastin and collagen fibers (which forms an elastic lamina) attached radially
by interlamellar connections (which collectively encompass smooth-muscle cells and
fine elastin and collagen fibers). Network parameters were selected to reflect the bio-
logical roles of each component and were adjusted to match the experimental results.
169
This approach was successful in matching a wide range of tissue mechanical tests,
including one – radial extension to failure – that was not used during the fitting pro-
cess, and it has the potential to be extended to the more disorganized (and thus more
complex) architecture of the aneurysm, especially as better imaging and image-based
modeling methods emerge [Koch et al., 2014, Tsamis et al., 2013]. The work of Pal
et al. [Pal et al., 2014] represents an excellent example of this approach, developing
a theoretical model of peel failure based on known structure. Pal’s approach could
be extended to a more general stress field using a strategy similar to ours. Finally, it
is important to note that abnormal loading and damage can change tissue structure.
For example, Todorovich-Hunter et al. [Todorovich-Hunter et al., 1988] observed the
formation of islands of elastin within the pulmonary arteries of rats in which they
induced pulmonary hypertension. Thus, moving forward imaging-based alterations
to the network design may be necessary to capture the structure of a damaged or
diseased aorta.
There are, of course, further opportunities to construct a more realistic microme-
chanical model of the healthy and the aneurysmal ascending thoracic aorta. As
already noted, the work of Pal et al. [Pal et al., 2014] provides a different and in-
triguing view of interlamellar failure by tearing versus pull-out effects. Addition-
ally, our current model used collagen orientation tensor with eigenvalues of 0.9 and
1.0, corresponding roughly to collagen aligned within 18 of the circumferential axis
(sin2(18) = 0.1). That number was based on the observed circumferential alignment
of collagen fibers in the vessel wall but is an estimate and could be modified to pro-
vide a better match to the experimental data. In fact, the collagen and elastin fiber
orientations within the zθ plane could also be treated as fitting parameters, which
would likely improve the model fit, but we chose to use the best estimate from struc-
tural data rather than introduce further flexibility to an already highly parameterized
170
model. Finally, the Fung-type model of fiber mechanics (Table A.1, Equation (3))
could be replaced with a recruitment model, e.g., [Zulliger et al., 2004], which would
provide an alternative mechanism to capture the nonlinear behavior associated with
fiber waviness [Haskett et al., 2012] and might provide a better fit of the experimental
data. All of these modifications are possible and could be implemented as additional
data emerge about the arrangement and properties of the components of the arterial
wall.
In summary, a microstructurally based multiscale model of prefailure and failure
behaviors was able to match the experimentally measured properties of the healthy
porcine ascending aorta in four different loading configurations and two different
directions, and it was successful when applied to experiments in the literature that
were not used during the fitting and specification project. This model could provide
new insight into the failure mechanisms involved in aortic dissection and could be
incorporated into patient-specific anatomical models, especially if model parameters
associated with specific patients or patient groups can be obtained.
A.5 Acknowledgment
This work was supported by NIH Grant R01-EB005813. CMW was supported by a
University of Minnesota (UMN) Doctoral Dissertation Fellowship, and CEK is the
recipient of an ARCS Scholar Award. Tissue specimens were generously provided by
the Visible Heart Lab at UMN. The authors gratefully acknowledge the Minnesota
Supercomputing Institute (MSI) at UMN for providing resources that contributed to
the research results reported within this paper.
171
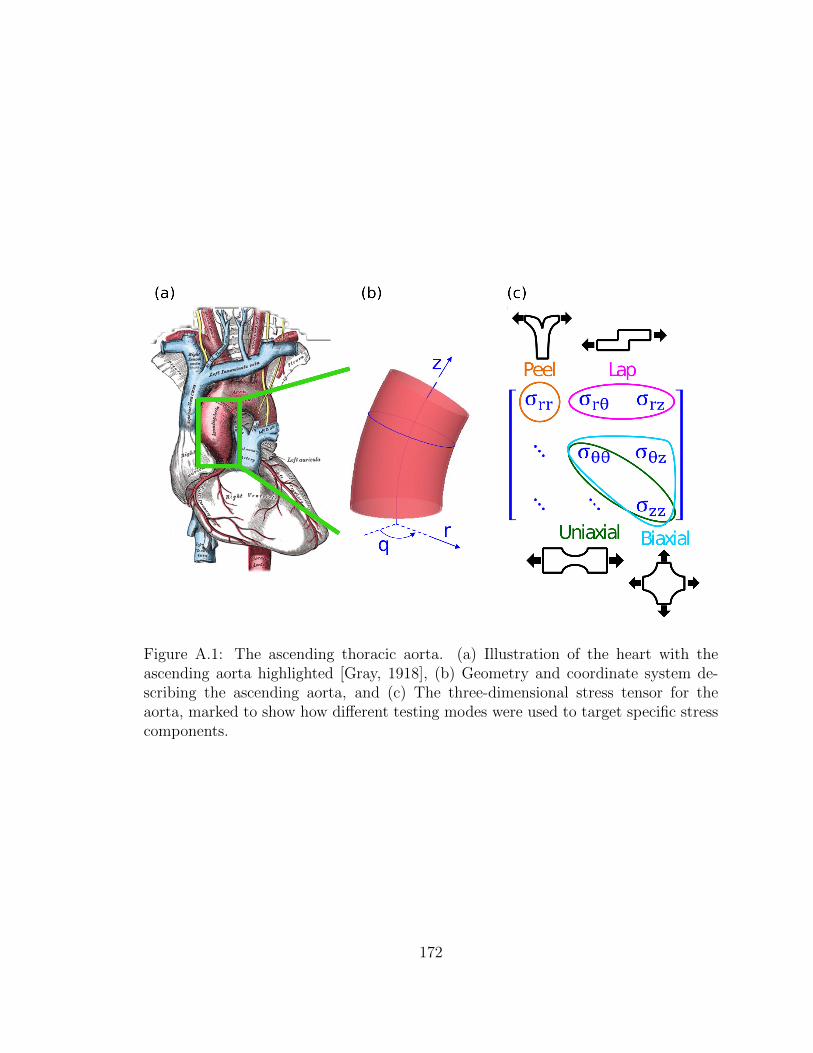
Figure A.1: The ascending thoracic aorta. (a) Illustration of the heart with theascending aorta highlighted [Gray, 1918], (b) Geometry and coordinate system de-scribing the ascending aorta, and (c) The three-dimensional stress tensor for theaorta, marked to show how different testing modes were used to target specific stresscomponents.
172
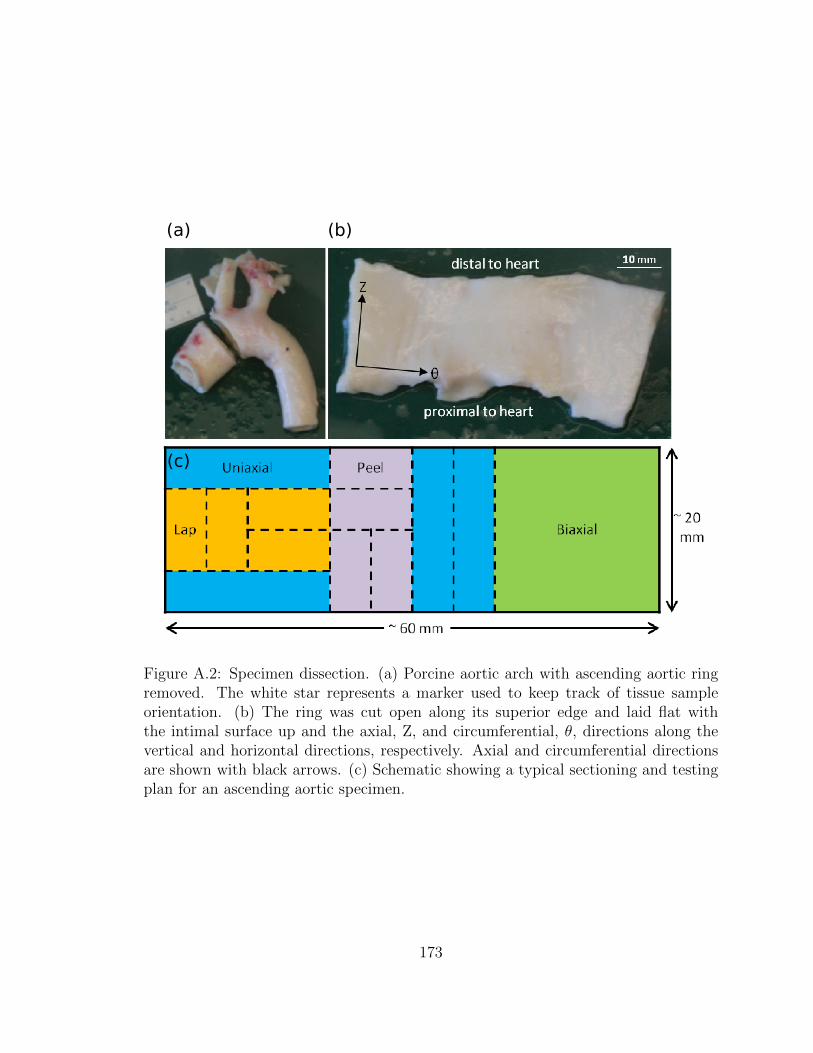
Figure A.2: Specimen dissection. (a) Porcine aortic arch with ascending aortic ringremoved. The white star represents a marker used to keep track of tissue sampleorientation. (b) The ring was cut open along its superior edge and laid flat withthe intimal surface up and the axial, Z, and circumferential, θ, directions along thevertical and horizontal directions, respectively. Axial and circumferential directionsare shown with black arrows. (c) Schematic showing a typical sectioning and testingplan for an ascending aortic specimen.
173
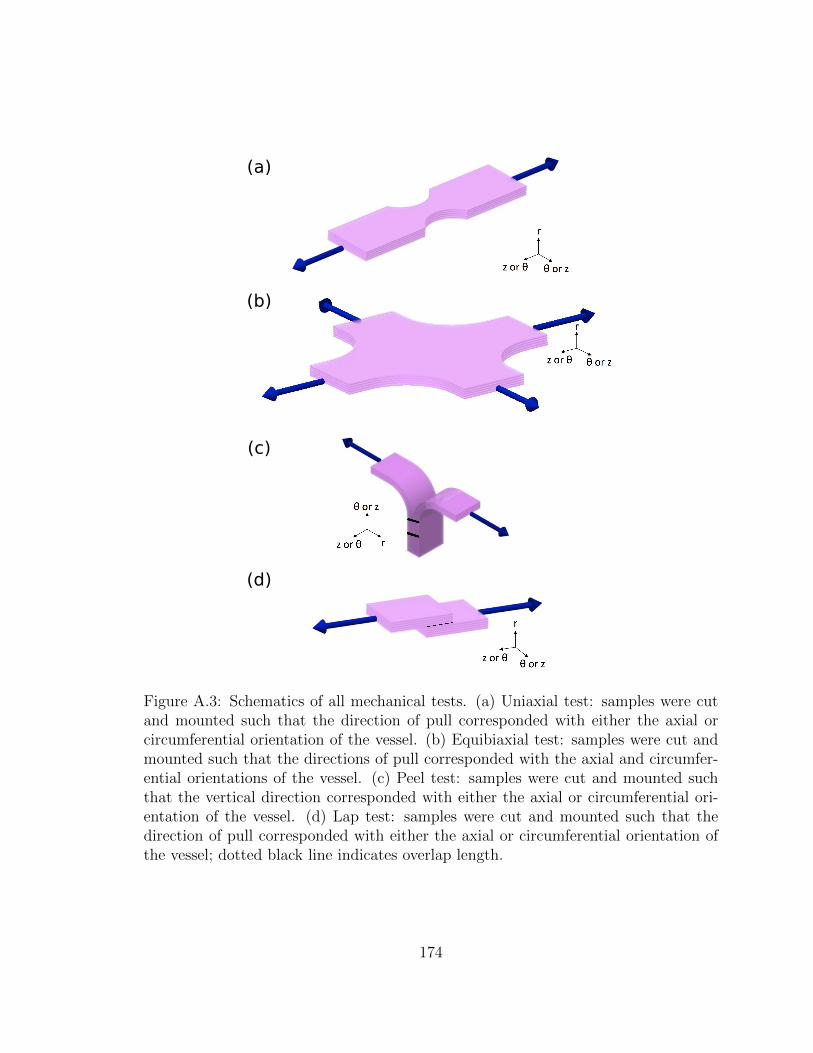
Figure A.3: Schematics of all mechanical tests. (a) Uniaxial test: samples were cutand mounted such that the direction of pull corresponded with either the axial orcircumferential orientation of the vessel. (b) Equibiaxial test: samples were cut andmounted such that the directions of pull corresponded with the axial and circumfer-ential orientations of the vessel. (c) Peel test: samples were cut and mounted suchthat the vertical direction corresponded with either the axial or circumferential ori-entation of the vessel. (d) Lap test: samples were cut and mounted such that thedirection of pull corresponded with either the axial or circumferential orientation ofthe vessel; dotted black line indicates overlap length.
174
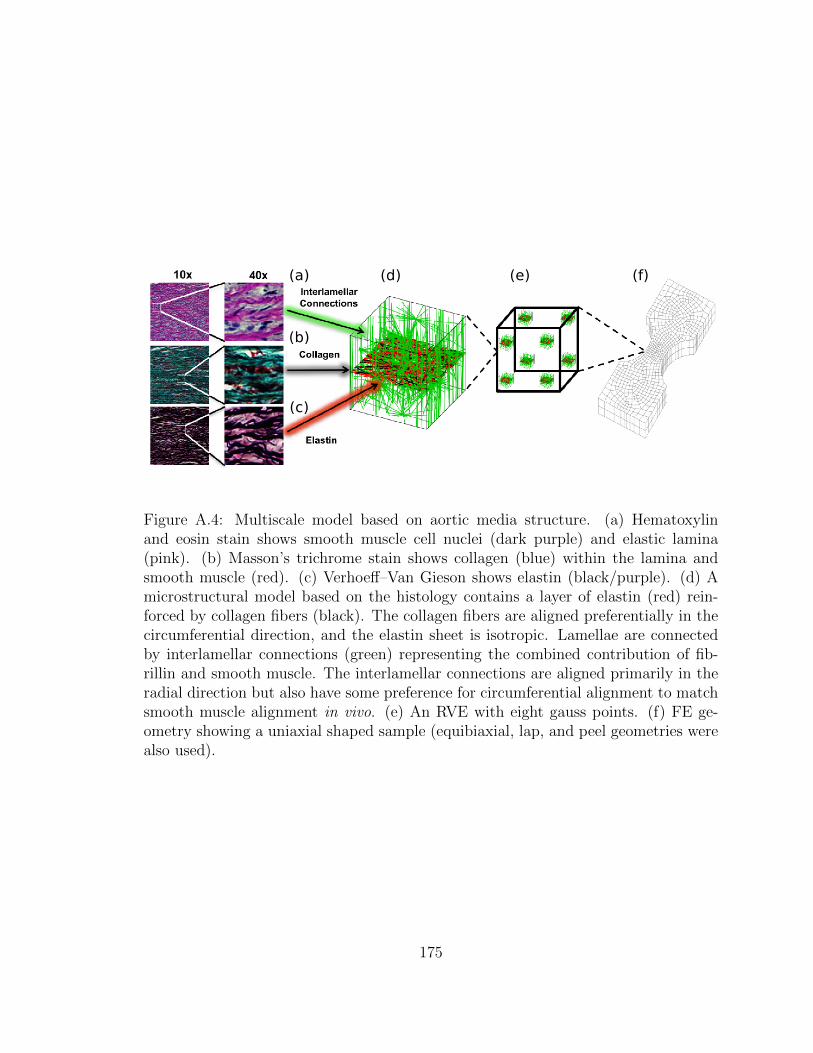
Figure A.4: Multiscale model based on aortic media structure. (a) Hematoxylinand eosin stain shows smooth muscle cell nuclei (dark purple) and elastic lamina(pink). (b) Masson’s trichrome stain shows collagen (blue) within the lamina andsmooth muscle (red). (c) Verhoeff–Van Gieson shows elastin (black/purple). (d) Amicrostructural model based on the histology contains a layer of elastin (red) rein-forced by collagen fibers (black). The collagen fibers are aligned preferentially in thecircumferential direction, and the elastin sheet is isotropic. Lamellae are connectedby interlamellar connections (green) representing the combined contribution of fib-rillin and smooth muscle. The interlamellar connections are aligned primarily in theradial direction but also have some preference for circumferential alignment to matchsmooth muscle alignment in vivo. (e) An RVE with eight gauss points. (f) FE ge-ometry showing a uniaxial shaped sample (equibiaxial, lap, and peel geometries werealso used).
175
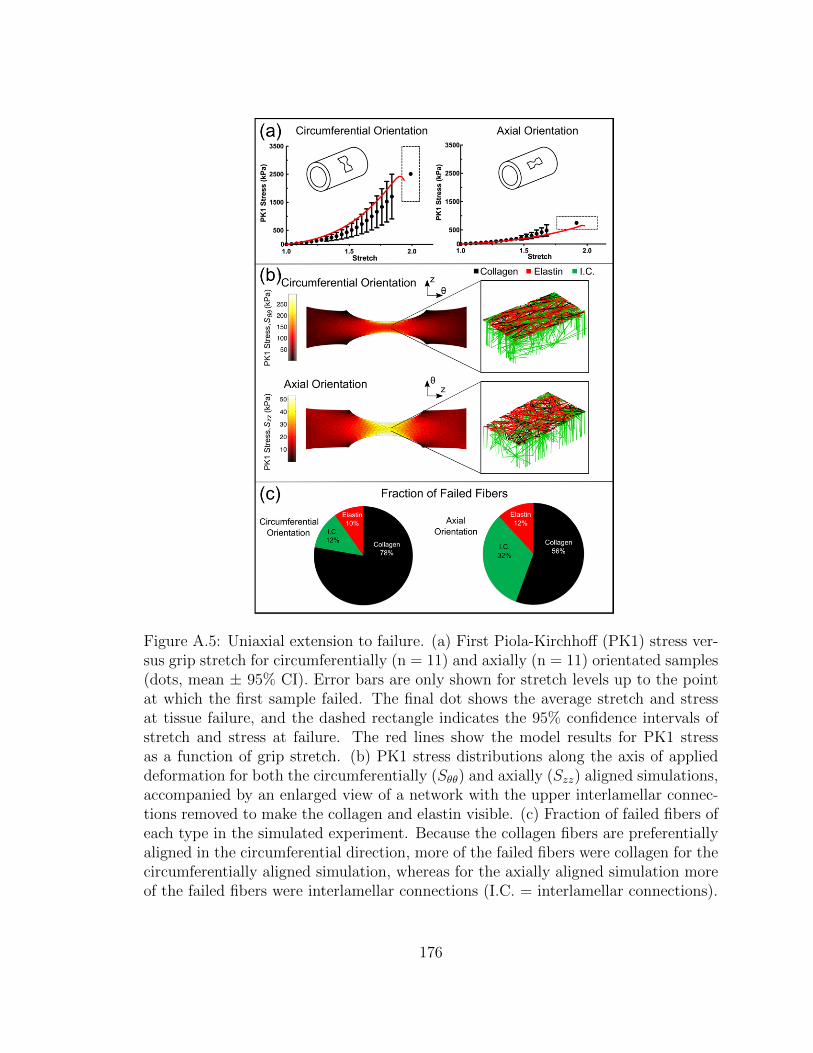
Figure A.5: Uniaxial extension to failure. (a) First Piola-Kirchhoff (PK1) stress ver-sus grip stretch for circumferentially (n = 11) and axially (n = 11) orientated samples(dots, mean ± 95% CI). Error bars are only shown for stretch levels up to the pointat which the first sample failed. The final dot shows the average stretch and stressat tissue failure, and the dashed rectangle indicates the 95% confidence intervals ofstretch and stress at failure. The red lines show the model results for PK1 stressas a function of grip stretch. (b) PK1 stress distributions along the axis of applieddeformation for both the circumferentially (Sθθ) and axially (Szz) aligned simulations,accompanied by an enlarged view of a network with the upper interlamellar connec-tions removed to make the collagen and elastin visible. (c) Fraction of failed fibers ofeach type in the simulated experiment. Because the collagen fibers are preferentiallyaligned in the circumferential direction, more of the failed fibers were collagen for thecircumferentially aligned simulation, whereas for the axially aligned simulation moreof the failed fibers were interlamellar connections (I.C. = interlamellar connections).
176
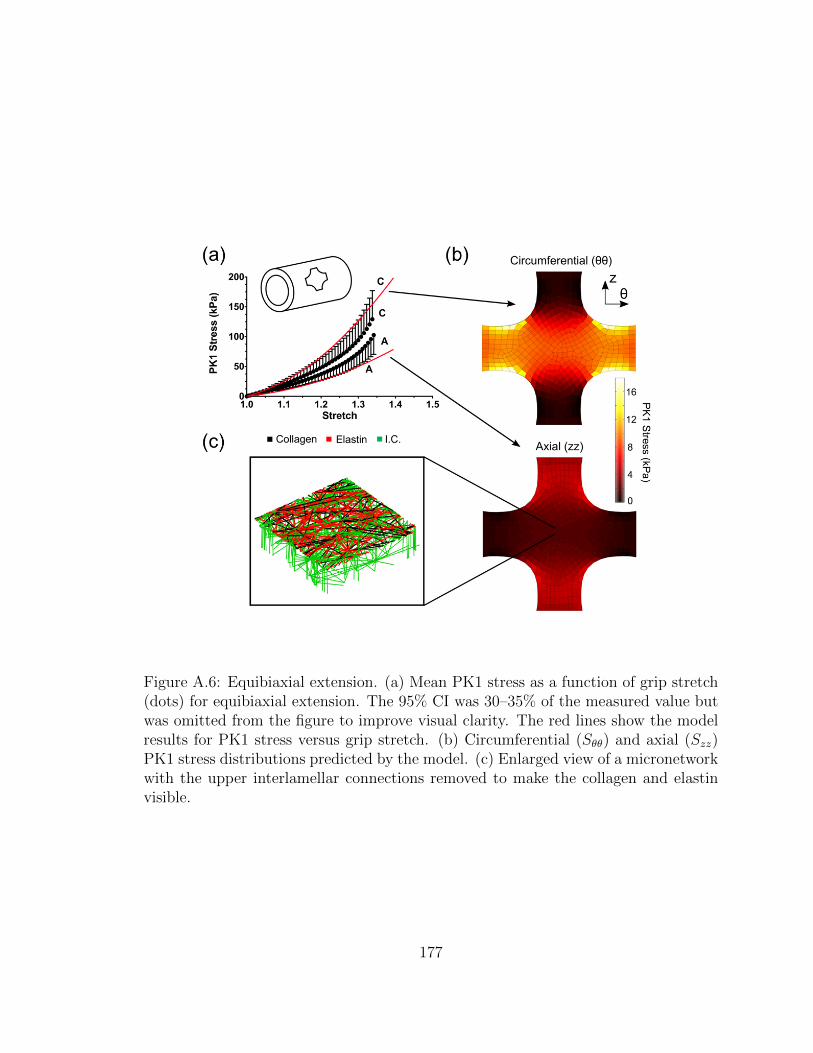
Figure A.6: Equibiaxial extension. (a) Mean PK1 stress as a function of grip stretch(dots) for equibiaxial extension. The 95% CI was 30–35% of the measured value butwas omitted from the figure to improve visual clarity. The red lines show the modelresults for PK1 stress versus grip stretch. (b) Circumferential (Sθθ) and axial (Szz)PK1 stress distributions predicted by the model. (c) Enlarged view of a micronetworkwith the upper interlamellar connections removed to make the collagen and elastinvisible.
177
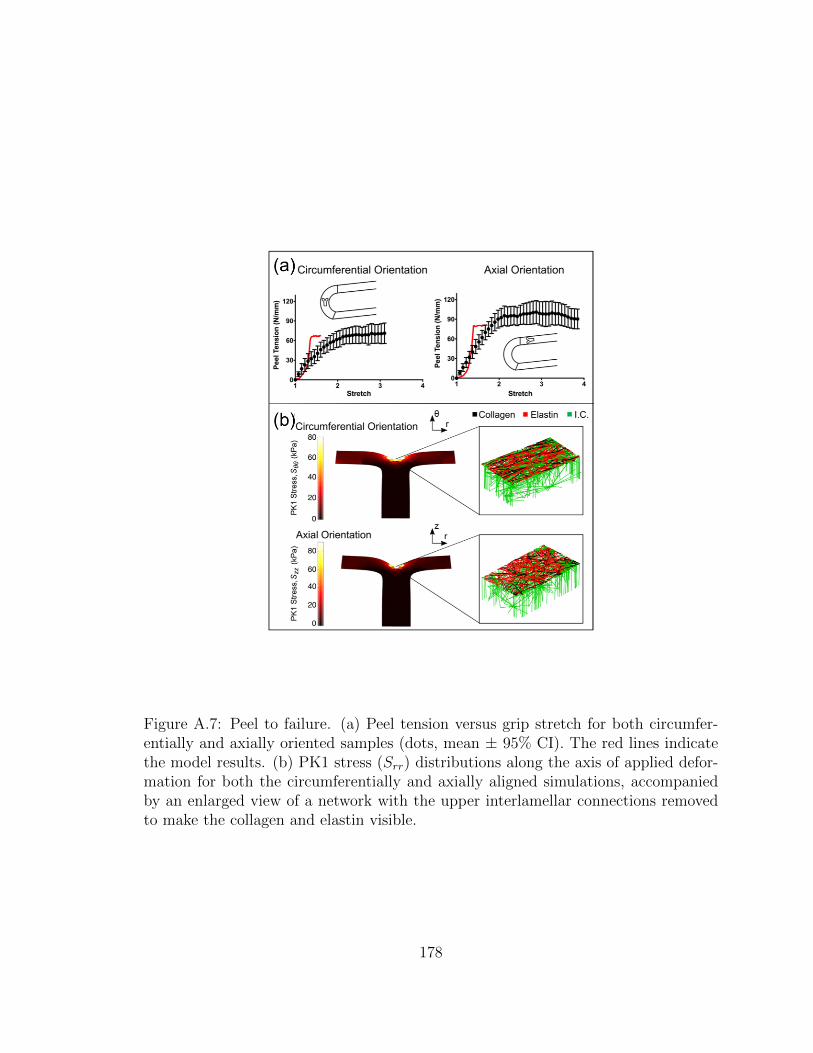
Figure A.7: Peel to failure. (a) Peel tension versus grip stretch for both circumfer-entially and axially oriented samples (dots, mean ± 95% CI). The red lines indicatethe model results. (b) PK1 stress (Srr) distributions along the axis of applied defor-mation for both the circumferentially and axially aligned simulations, accompaniedby an enlarged view of a network with the upper interlamellar connections removedto make the collagen and elastin visible.
178
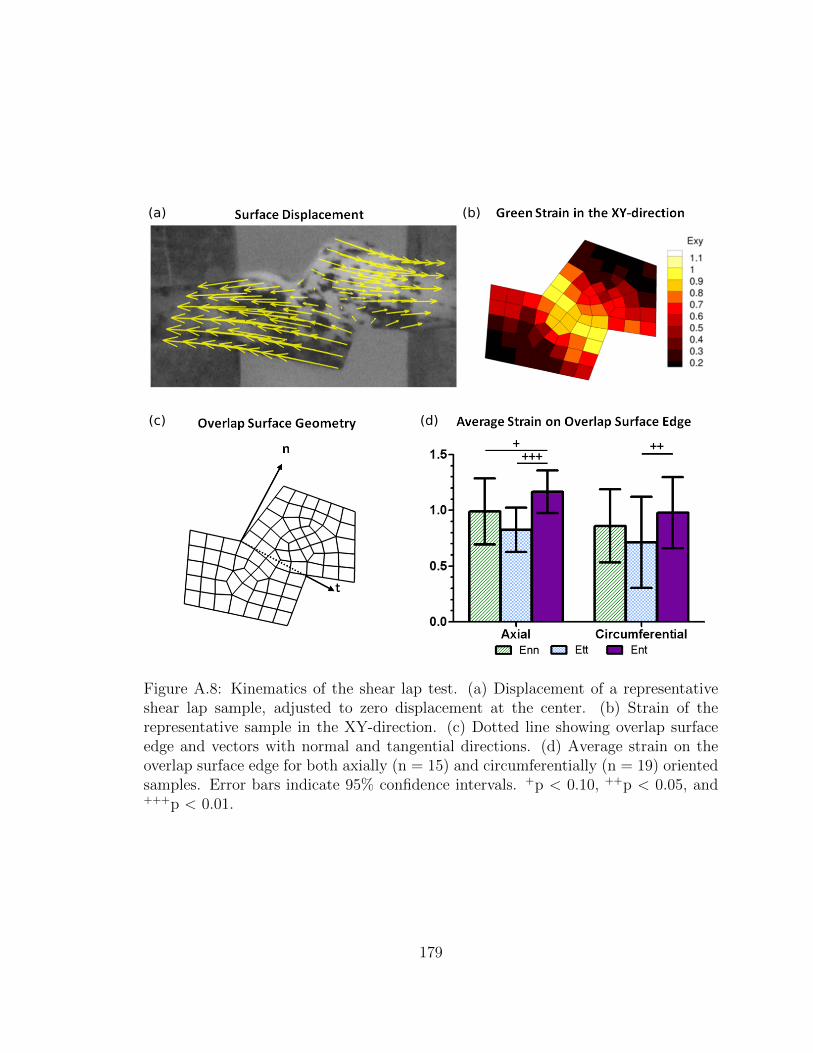
(a) (b)
(c) (d)
Figure A.8: Kinematics of the shear lap test. (a) Displacement of a representativeshear lap sample, adjusted to zero displacement at the center. (b) Strain of therepresentative sample in the XY-direction. (c) Dotted line showing overlap surfaceedge and vectors with normal and tangential directions. (d) Average strain on theoverlap surface edge for both axially (n = 15) and circumferentially (n = 19) orientedsamples. Error bars indicate 95% confidence intervals. +p < 0.10, ++p < 0.05, and+++p < 0.01.
179
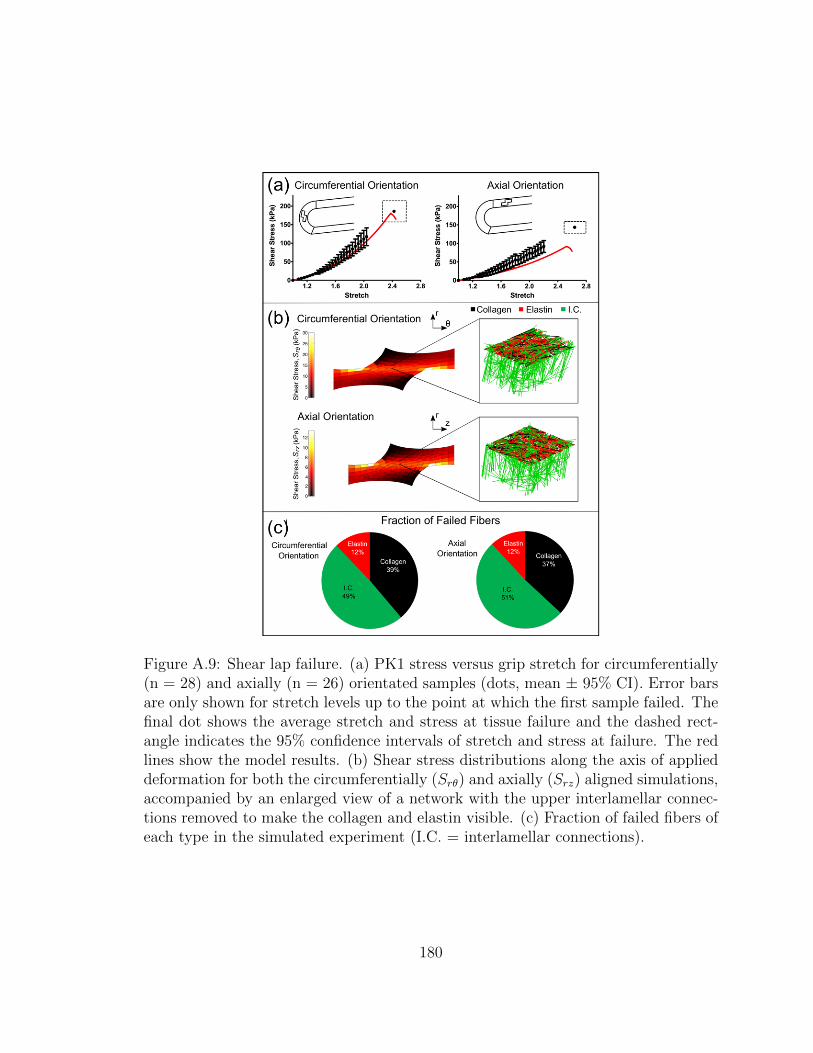
Figure A.9: Shear lap failure. (a) PK1 stress versus grip stretch for circumferentially(n = 28) and axially (n = 26) orientated samples (dots, mean ± 95% CI). Error barsare only shown for stretch levels up to the point at which the first sample failed. Thefinal dot shows the average stretch and stress at tissue failure and the dashed rect-angle indicates the 95% confidence intervals of stretch and stress at failure. The redlines show the model results. (b) Shear stress distributions along the axis of applieddeformation for both the circumferentially (Srθ) and axially (Srz) aligned simulations,accompanied by an enlarged view of a network with the upper interlamellar connec-tions removed to make the collagen and elastin visible. (c) Fraction of failed fibers ofeach type in the simulated experiment (I.C. = interlamellar connections).
180
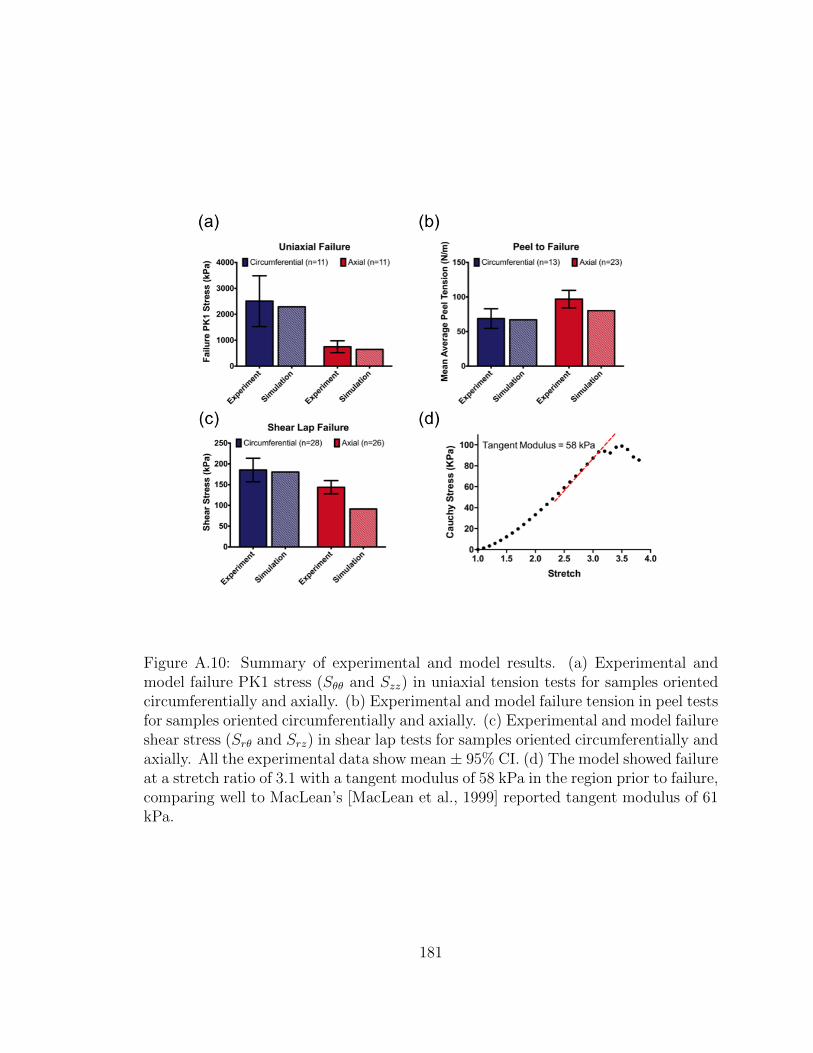
Figure A.10: Summary of experimental and model results. (a) Experimental andmodel failure PK1 stress (Sθθ and Szz) in uniaxial tension tests for samples orientedcircumferentially and axially. (b) Experimental and model failure tension in peel testsfor samples oriented circumferentially and axially. (c) Experimental and model failureshear stress (Srθ and Srz) in shear lap tests for samples oriented circumferentially andaxially. All the experimental data show mean ± 95% CI. (d) The model showed failureat a stretch ratio of 3.1 with a tangent modulus of 58 kPa in the region prior to failure,comparing well to MacLean’s [MacLean et al., 1999] reported tangent modulus of 61kPa.
181

Appendix B
Dicer1 Deficiency in the Idiopathic
Pulmonary Fibrosis Fibroblastic
Focus Promotes Fibrosis by
Suppressing MicroRNA Biogenesis
The content of this chapter was submitted as a research article to the American Jour-
nal of Respiratory and Critical Care Medicine by Herrera, Beisang, Peterson, Forster,
Gillbersten, Benyumov, Smith, Korenczuk, Barocas, Guenther, Hite, Zhang, Henke,
and Bitterman [Herrera et al., 2018a]. My contribution to the work was performing
uniaxial testing on lung tissue and processing results for mechanical comparisons.
Reprinted with permission of the American Thoracic Society. Copyright © 2019
American Thoracic Society.
Cite: Herrera, J., Beisang, D.J., Peterson, M., Forster, C., Gilbertsen, A., Benyu-
mov, A., Smith, K., Korenczuk, C.E., Barocas, V.H., Guenther, K. and Hite, R.,
2018. Dicer1 deficiency in the idiopathic pulmonary fibrosis fibroblastic focus pro-
182
motes fibrosis by suppressing microRNA biogenesis. American journal of respiratory
and critical care medicine, 198(4), pp.486-496.
The American Journal of Respiratory and Critical Care Medicine is an official
journal of the American Thoracic Society
B.1 Introduction
Idiopathic pulmonary fibrosis (IPF) is a relentlessly progressive form of lung scar-
ring. Available data indicate that IPF lung extracellular matrix (ECM) itself is
fibrogenic [Booth et al., 2012, Herrera et al., 2018b, Parker et al., 2014]. Fibroblasts
cultured on decellularized IPF lung ECM (IPFECM) suppresses expression of miR-29
(microRNA-29) (a master negative regulator of stromal genes), leading to increased
ribosome recruitment to hundreds of stromal genes, including: collagens, fibronectin,
and their cognate integrins; matrix metalloproteinases; and proteins controlling pro-
liferation and motility. Restoration of fibroblast miR-29 expression returns transla-
tion of miR-29 target genes back to baseline [Parker et al., 2014]. Although miR-29
suppression has been established in IPF [Pandit et al., 2010] and other fibrotic disor-
ders [Roderburg et al., 2011,Lv et al., 2013,He et al., 2013,van Rooij et al., 2008] for
several years; the underlying mechanisms remain unknown. Here we set out to unveil
the molecular mechanism by which IPF-ECM decreases fibroblast miR-29 expression.
Identifying the ECM properties sensed by fibroblasts to suppress miR-29 has the
potential to unveil new targets that can be exploited to develop therapies that in-
terrupt fibrosis progression. One signature property of IPF lung ECM that distin-
guishes it from normal is its elastic modulus (stiffness). IPF lung ECM is up to an
order of magnitude stiffer than normal, with steep stiffness gradients between fibrotic
and morphologically uninvolved regions of the lung [Booth et al., 2012, Liu et al.,
183

2015]. Mechanotransduction of ECM stiffness has prominent roles in pathological
processes, including cancer progression and fibrosis [Liu et al., 2015,Rahaman et al.,
2014, Marinkovic et al., 2013, Dufort et al., 2011]. Expression of the mechanosen-
sitive Hippo pathway constituent YAP (yes-associated protein) is increased in the
IPF lung, and ectopic expression of activated YAP confers fibroblasts with fibrogenic
properties, including increased ECM production [Liu et al., 2015]. YAP has dual
functions with diametric effects on miR-29 expression. At the singlegene level, YAP
serves as a transcriptional coactivator of miR-29b-1/a [Tumaneng et al., 2012], the
gene encoding miR-29a and miR-29b-1; two of the three molecular species of miR-
29 (a separate gene on chromosome 1 encodes miR-29b-2 [identical to miR-29b-1,
together designated miR-29b] and miR-29c). In contrast, on a genome-wide level,
YAP functions as a negative regulator of microRNA expression by sequestering p72,
an integral component of the microRNA processing machinery [Mori et al., 2014].
Thus, mechanotransduction of ECM stiffness leading to activation of YAP provides
a plausible molecular mechanism by which IPF-ECM regulates miR-29.
To explore this possibility, we combined in situ analysis of IPF lung tissue with ex-
periments using primary human lung fibroblasts studied on decellularized human lung
ECM, ECM functionalized hydrogels of tunable stiffness, and two xenograft models.
Although stiff hydrogels triggered fibroblast YAP activation and increased miR-29 ex-
pression, decellularized IPF-ECM did exactly the opposite, excluding mechanotrans-
duction of stiffness through YAP as the primary mechanism. Instead, we discovered
that IPF-ECM suppresses microRNA biogenesis at the processing step by downreg-
ulating Dicer1 (an integral microRNA processing component) in the myofibroblast
core of the fibroblastic focus, where active ECM synthesis is taking place. Dicer1
deficiency in primary lung fibroblasts decreased mature miR-29 levels and increased
collagen expression on control-ECM (enforced Dicer1 expression was toxic, precluding
184
gain-of-function studies on IPF-ECM). We established a definitive mechanistic link
to Dicer1 deficiency by showing that in both zebrafish and mouse xenografts, Dicer1
deficiency conferred human lung fibroblasts with cell-autonomous fibrogenicity. Our
data show for the first time that ECM-mediated suppression of fibroblast Dicer1 in
the myofibroblast core of the fibroblastic focus is a central step in IPF disease pro-
gression by decreasing the processing of precursor miR-29 into its mature antifibrotic
forms. This finding provides foundational new knowledge that paves the way for
developing novel precision therapeutics targeting fibrosis progression. Some of the
results presented here have been previously reported in abstract form [Herrera et al.,
2015].
B.2 Methods
Detailed methods can be found in the supplemental material.
B.2.1 Statistical Analysis
For analyses of data with sample sizes greater than six, one-sample or two-sample t
tests were used for hypothesis testing on the means of the distributions. For analyses
of data with sample sizes less than six, nonparametric tests such as the Wilcoxon
rank sum test were used to test the medians of distributions. For miR-29 abundance
data under conditions of YAP overexpression, a Kruskal-Wallis test was used for a
nonparametric one-way ANOVA test followed by a Tukey test for pairwise compar-
isons with the P values adjusted for the multiple comparisons. For analysis of AUF-1
pull-down data, a one-sided Mann-Whitney U test was used. All analyses and plots
were conducted in Prism.
185

B.3 Results
B.3.1 IPF-ECM Suppresses miR-29 Expression and Upreg-
ulates Collagen Production
Prior work using atomic force microscopy indicates that regions of the IPF-ECM
are up to an order of magnitude stiffer than control-ECM (Ctrl-ECM) [Booth et al.,
2012]. To interrogate the ECM at a scale approximating the size of the human lung
acinus (3 mm x 10 mm 5 mm), we quantified uniaxial tensile strain in lung tissue
strips and found IPF-ECM to be significantly stiffer than Ctrl-ECM at this scale
of resolution (see Figure B.10 in the online supplement). Our prior studies indicate
that IPF-ECM suppresses miR-29 family member expression in human lung fibrob-
lasts [Parker et al., 2014]. We reexamined this effect with methodological refinements
designed to minimize the effect of serum growth factors (low-serum survival medium)
and controlled for patient-to-patient and lung ECM heterogeneity (Ctrl-ECM prepa-
rations from three patients or IPF-ECM preparations from three patients in each
reaction). Under these more stringent conditions, IPF-ECM significantly decreased
all miR-29 species (Figure B.1A). We next sought to determine whether relevant
outside-in signaling pathways mediated this response. Pharmacologic agents inhibit-
ing Notch (DAPT), PI3 kinase (LY294002), Rock/Rho (Y27632), Erk (SCH772984),
focal adhesion kinase (PF562271), ALK5 (A83-01), or MTRF (CCG-100602) did not
consistently restore fibroblast miR-29 levels on IPF-ECM (Figure B.11.
As a positive control, we examined previously verified miR-29 stromal targets
(type IV collagen and type VI collagen mRNA [Parker et al., 2014]; and type I
collagen protein secretion) in fibroblasts on IPF-ECM. As expected, suppression of
miR-29 by IPFECM increased expression of these miR-29 target genes (Figures B.1B
and B.1C; Figure B.12.
186
B.3.2 Stiffness Increases miR-29 Expression on
Two-Dimensional Hydrogels
To determine whether stiffness and/or composition could account for the suppres-
sion of miR-29 expression on IPF-ECM, we cultured lung fibroblasts on synthetic
two-dimensional (2D) polyacrylamide hydrogels (PA gels) of physiological stiffness
(soft PA gels z3 kPa) or IPF stiffness (stiff PA gels z20 kPa). To validate our model
system, we analyzed the impact of stiffness on a-smooth muscle actin expression. In
accord with published data [Liu et al., 2015,Huang et al., 2012], lung fibroblasts dis-
played increased a-smooth muscle actin on stiff PA gels functionalized with type I
collagen (Figure B.13. We next examined the effect of stiffness on miR-29 expression
and were surprised to find that fibroblast miR-29 expression was increased by stiff
PA gels functionalized with type I collagen, pointing away from stiffness per se as
the property of IPF-ECM downregulating miR-29 (Figure B.2A). The PA gel sys-
tem is versatile, as it allows the gels to be functionalized by coating with any ECM
protein [Cretu et al., 2010]. To test the relative importance of stiffness versus com-
position in regulating miR-29, we supplemented the collagen I data by coating PA
gels with collagen III alone, fibronectin alone, or an equal ratio of collagen I, collagen
III, and fibronectin. Independent of substratum composition, stiffness consistently
upregulated mature miR-29 abundance (Figures B.2B–B.2D), revealing the primacy
of stiffness over composition in the 2D hydrogel model.
B.3.3 IPF-ECM Negatively Regulates YAP and Suppresses
miR-29 Transcription
We next sought to determine whether there was a causal role for YAP in the reg-
ulation of miR-29 by IPF-ECM. In accord with prior work [Liu et al., 2015], when
187
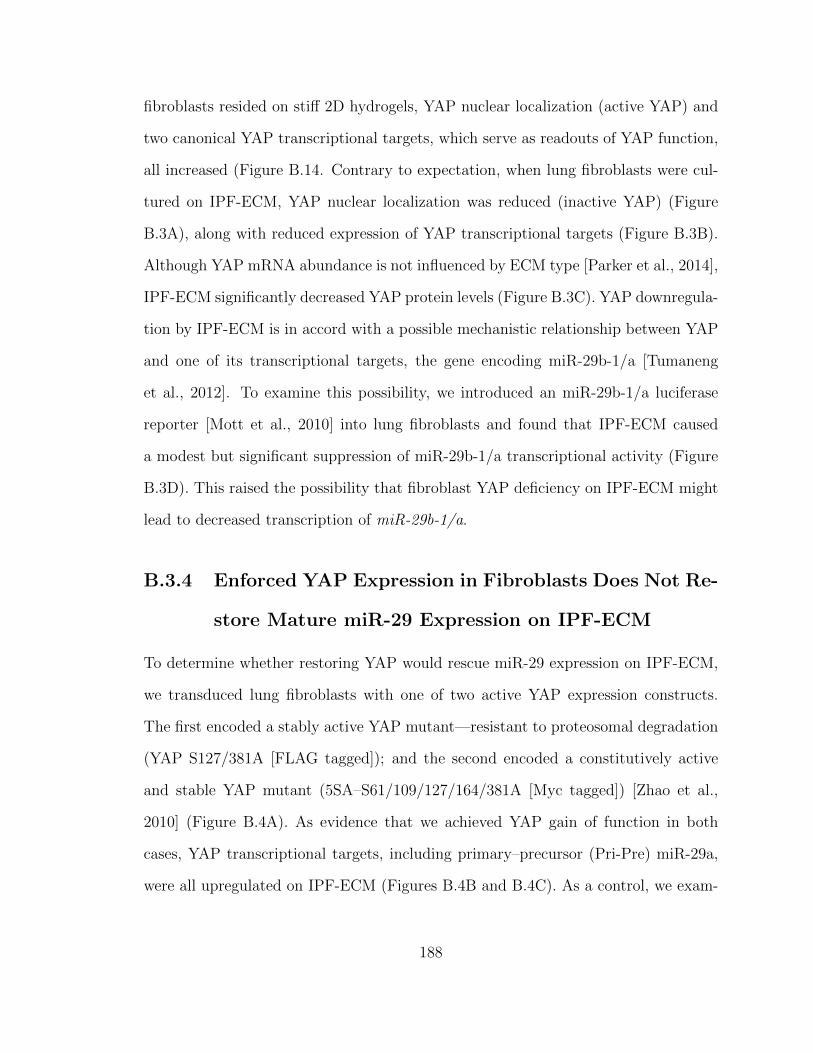
fibroblasts resided on stiff 2D hydrogels, YAP nuclear localization (active YAP) and
two canonical YAP transcriptional targets, which serve as readouts of YAP function,
all increased (Figure B.14. Contrary to expectation, when lung fibroblasts were cul-
tured on IPF-ECM, YAP nuclear localization was reduced (inactive YAP) (Figure
B.3A), along with reduced expression of YAP transcriptional targets (Figure B.3B).
Although YAP mRNA abundance is not influenced by ECM type [Parker et al., 2014],
IPF-ECM significantly decreased YAP protein levels (Figure B.3C). YAP downregula-
tion by IPF-ECM is in accord with a possible mechanistic relationship between YAP
and one of its transcriptional targets, the gene encoding miR-29b-1/a [Tumaneng
et al., 2012]. To examine this possibility, we introduced an miR-29b-1/a luciferase
reporter [Mott et al., 2010] into lung fibroblasts and found that IPF-ECM caused
a modest but significant suppression of miR-29b-1/a transcriptional activity (Figure
B.3D). This raised the possibility that fibroblast YAP deficiency on IPF-ECM might
lead to decreased transcription of miR-29b-1/a.
B.3.4 Enforced YAP Expression in Fibroblasts Does Not Re-
store Mature miR-29 Expression on IPF-ECM
To determine whether restoring YAP would rescue miR-29 expression on IPF-ECM,
we transduced lung fibroblasts with one of two active YAP expression constructs.
The first encoded a stably active YAP mutant—resistant to proteosomal degradation
(YAP S127/381A [FLAG tagged]); and the second encoded a constitutively active
and stable YAP mutant (5SA–S61/109/127/164/381A [Myc tagged]) [Zhao et al.,
2010] (Figure B.4A). As evidence that we achieved YAP gain of function in both
cases, YAP transcriptional targets, including primary–precursor (Pri-Pre) miR-29a,
were all upregulated on IPF-ECM (Figures B.4B and B.4C). As a control, we exam-
188

ined the impact of YAP gain of function on miR-29b-2/c, which does not contain a
YAP-responsive regulatory element [Mott et al., 2010], and found its transcript abun-
dance to be decreased—an effect that may represent an indirect effect of YAP gain
of function. Despite increases in Pri-Pre miR-29a, mature miR-29 species remained
unchanged after YAP gain of function (Figure B.4D). YAP knockdown in lung fi-
broblasts on Ctrl-ECM had no effect (Figure B.15. Thus, the inability of YAP gain
of function to rescue mature miR-29 expression in fibroblasts on IPF-ECM, despite
increasing the levels of its primary/precursor forms, pointed downstream to deregula-
tion of miR-29 processing as a candidate mechanism by which IPF-ECM suppresses
miR-29.
B.3.5 IPF-ECM Suppresses the MicroRNA Processing Ma-
chinery
Processing of microRNA occurs cotranscriptionally, and processing of primary mi-
croRNA into precursor microRNA is a better predictor of mature microRNA abun-
dance than transcriptional regulation alone [Conrad et al., 2014]. Prior work using
mouse fibroblasts indicates that miR-29 expression depends on Drosha, Exportin-5,
and Dicer1 [Kim et al., 2016], key components of the canonical microRNA processing
machinery (Figure B.5A). Of note, Ago2 (Argonaute-2), another component of the
microRNA processing pathway, is reduced in IPF [Oak et al., 2011]. To determine
whether IPF-ECM altered microRNA processing, we measured Pri-Pre and mature
miR-29a and 29c abundance (representing the two miR-29 genes) on ECM (Fig-
ure B.5B). Pri-Pre miR-29 abundance increased on IPFECM, strongly implicating
a downstream block in microRNA processing, particularly in view of the decreased
transcription observed for miR29b-1/a on IPF-ECM. We therefore sought to deter-
189
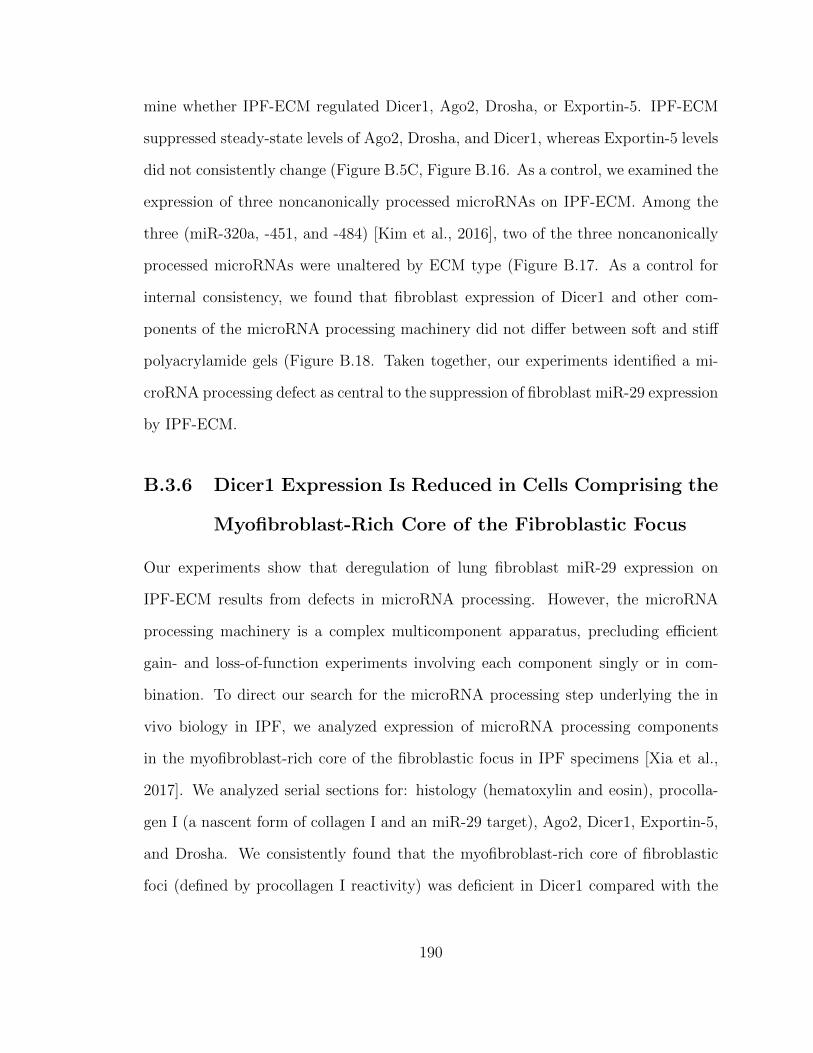
mine whether IPF-ECM regulated Dicer1, Ago2, Drosha, or Exportin-5. IPF-ECM
suppressed steady-state levels of Ago2, Drosha, and Dicer1, whereas Exportin-5 levels
did not consistently change (Figure B.5C, Figure B.16. As a control, we examined the
expression of three noncanonically processed microRNAs on IPF-ECM. Among the
three (miR-320a, -451, and -484) [Kim et al., 2016], two of the three noncanonically
processed microRNAs were unaltered by ECM type (Figure B.17. As a control for
internal consistency, we found that fibroblast expression of Dicer1 and other com-
ponents of the microRNA processing machinery did not differ between soft and stiff
polyacrylamide gels (Figure B.18. Taken together, our experiments identified a mi-
croRNA processing defect as central to the suppression of fibroblast miR-29 expression
by IPF-ECM.
B.3.6 Dicer1 Expression Is Reduced in Cells Comprising the
Myofibroblast-Rich Core of the Fibroblastic Focus
Our experiments show that deregulation of lung fibroblast miR-29 expression on
IPF-ECM results from defects in microRNA processing. However, the microRNA
processing machinery is a complex multicomponent apparatus, precluding efficient
gain- and loss-of-function experiments involving each component singly or in com-
bination. To direct our search for the microRNA processing step underlying the in
vivo biology in IPF, we analyzed expression of microRNA processing components
in the myofibroblast-rich core of the fibroblastic focus in IPF specimens [Xia et al.,
2017]. We analyzed serial sections for: histology (hematoxylin and eosin), procolla-
gen I (a nascent form of collagen I and an miR-29 target), Ago2, Dicer1, Exportin-5,
and Drosha. We consistently found that the myofibroblast-rich core of fibroblastic
foci (defined by procollagen I reactivity) was deficient in Dicer1 compared with the
190
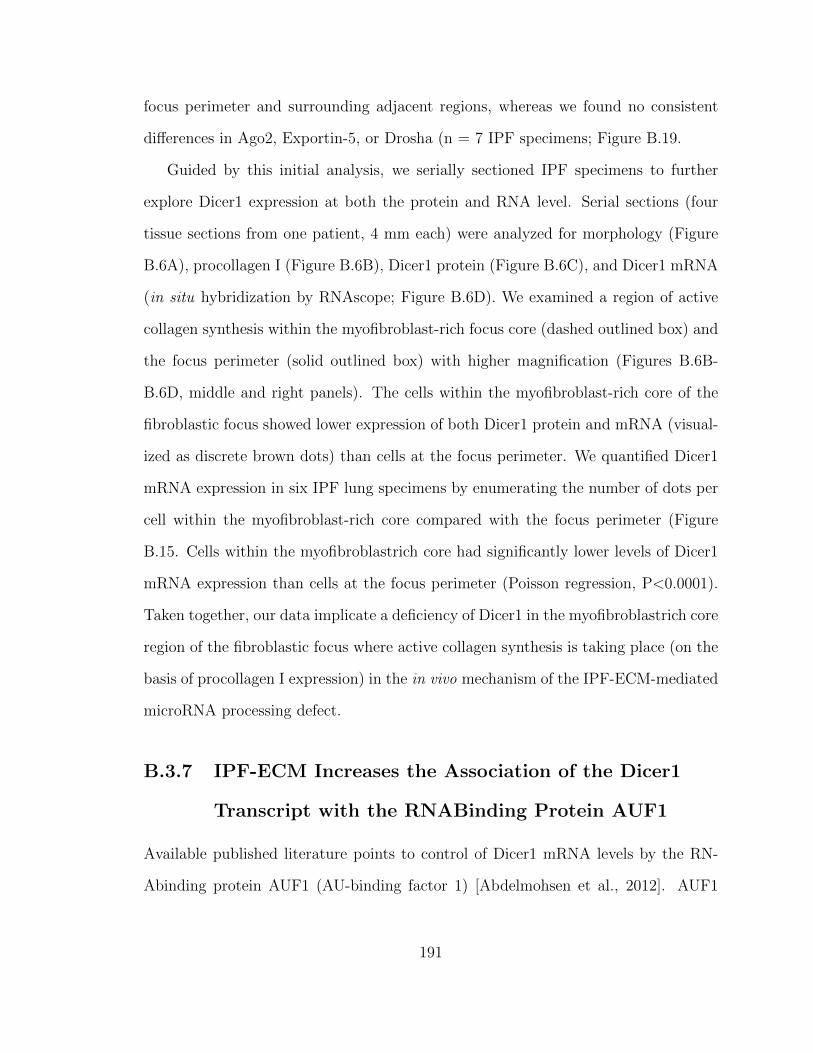
focus perimeter and surrounding adjacent regions, whereas we found no consistent
differences in Ago2, Exportin-5, or Drosha (n = 7 IPF specimens; Figure B.19.
Guided by this initial analysis, we serially sectioned IPF specimens to further
explore Dicer1 expression at both the protein and RNA level. Serial sections (four
tissue sections from one patient, 4 mm each) were analyzed for morphology (Figure
B.6A), procollagen I (Figure B.6B), Dicer1 protein (Figure B.6C), and Dicer1 mRNA
(in situ hybridization by RNAscope; Figure B.6D). We examined a region of active
collagen synthesis within the myofibroblast-rich focus core (dashed outlined box) and
the focus perimeter (solid outlined box) with higher magnification (Figures B.6B-
B.6D, middle and right panels). The cells within the myofibroblast-rich core of the
fibroblastic focus showed lower expression of both Dicer1 protein and mRNA (visual-
ized as discrete brown dots) than cells at the focus perimeter. We quantified Dicer1
mRNA expression in six IPF lung specimens by enumerating the number of dots per
cell within the myofibroblast-rich core compared with the focus perimeter (Figure
B.15. Cells within the myofibroblastrich core had significantly lower levels of Dicer1
mRNA expression than cells at the focus perimeter (Poisson regression, P<0.0001).
Taken together, our data implicate a deficiency of Dicer1 in the myofibroblastrich core
region of the fibroblastic focus where active collagen synthesis is taking place (on the
basis of procollagen I expression) in the in vivo mechanism of the IPF-ECM-mediated
microRNA processing defect.
B.3.7 IPF-ECM Increases the Association of the Dicer1
Transcript with the RNABinding Protein AUF1
Available published literature points to control of Dicer1 mRNA levels by the RN-
Abinding protein AUF1 (AU-binding factor 1) [Abdelmohsen et al., 2012]. AUF1
191
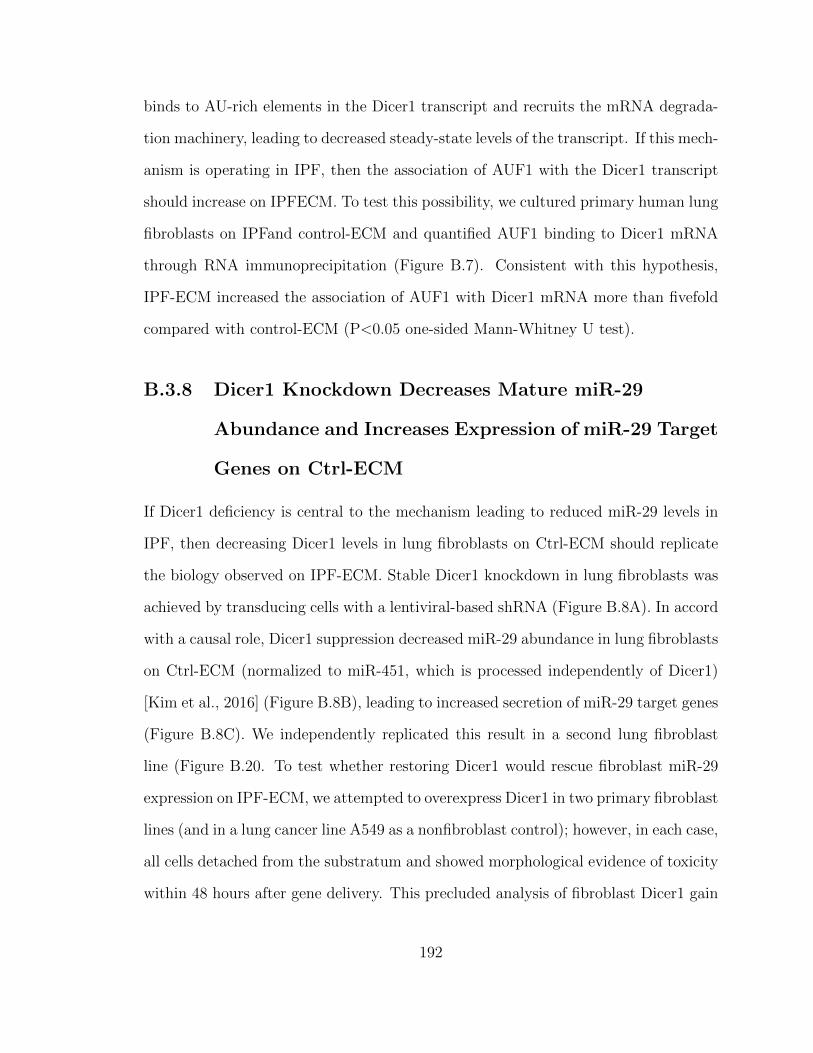
binds to AU-rich elements in the Dicer1 transcript and recruits the mRNA degrada-
tion machinery, leading to decreased steady-state levels of the transcript. If this mech-
anism is operating in IPF, then the association of AUF1 with the Dicer1 transcript
should increase on IPFECM. To test this possibility, we cultured primary human lung
fibroblasts on IPFand control-ECM and quantified AUF1 binding to Dicer1 mRNA
through RNA immunoprecipitation (Figure B.7). Consistent with this hypothesis,
IPF-ECM increased the association of AUF1 with Dicer1 mRNA more than fivefold
compared with control-ECM (P<0.05 one-sided Mann-Whitney U test).
B.3.8 Dicer1 Knockdown Decreases Mature miR-29
Abundance and Increases Expression of miR-29 Target
Genes on Ctrl-ECM
If Dicer1 deficiency is central to the mechanism leading to reduced miR-29 levels in
IPF, then decreasing Dicer1 levels in lung fibroblasts on Ctrl-ECM should replicate
the biology observed on IPF-ECM. Stable Dicer1 knockdown in lung fibroblasts was
achieved by transducing cells with a lentiviral-based shRNA (Figure B.8A). In accord
with a causal role, Dicer1 suppression decreased miR-29 abundance in lung fibroblasts
on Ctrl-ECM (normalized to miR-451, which is processed independently of Dicer1)
[Kim et al., 2016] (Figure B.8B), leading to increased secretion of miR-29 target genes
(Figure B.8C). We independently replicated this result in a second lung fibroblast
line (Figure B.20. To test whether restoring Dicer1 would rescue fibroblast miR-29
expression on IPF-ECM, we attempted to overexpress Dicer1 in two primary fibroblast
lines (and in a lung cancer line A549 as a nonfibroblast control); however, in each case,
all cells detached from the substratum and showed morphological evidence of toxicity
within 48 hours after gene delivery. This precluded analysis of fibroblast Dicer1 gain
192
of function on IPF-ECM. These data identify decreased Dicer1 processing of precursor
forms of miR-29 in the mechanism by which IPF-ECM decreases fibroblast miR-29
expression.
B.3.9 Dicer1 Knockdown Imparts Fibroblasts with Fibro-
genicity In Vivo
Having shown that Dicer1 deficiency in primary human lung fibroblasts is sufficient
to decrease all three species of miR-29 and increase ECM synthesis in vitro, we next
sought to determine whether these same Dicer1-deficient fibroblasts would display
increased ECM production in vivo in the absence of any other cues. We considered
using a lung fibroblast–specific conditional Dicer1 knockout (KO) mouse model for
this purpose but chose not to use this model on the basis of two considerations. First,
the effect of Dicer1 KO in mouse lung fibroblasts may not be comparable to Dicer1 de-
ficiency in primary human lung fibroblasts, which could differ profoundly from those
in mouse cells when modeling cell-autonomous functions [Rangarajan and Weinberg,
2003]. Second, studies in cancer using Dicer1 KO mice show that the Dicer1-null
state inhibits tumor formation, a cell-autonomous function, whereas Dicer1 haploin-
sufficiency is permissive [Swahari et al., 2016, Kumar et al., 2009]. Therefore, we
took a direct approach to test whether Dicer1-deficient primary human lung fibrob-
lasts would display cell intrinsic/autonomous fibrogenicity using two in vivo xenograft
model systems specifically designed for this purpose.
We previously described the use of zebrafish embryos as a simple and rapid in vivo
xenograft system for assessing lung fibroblast fibrogenicity [Xia et al., 2014, Benyu-
mov et al., 2012]. In control xenografts injected with fibroblasts transduced with
nonsilencing scrambled shRNA, there were scattered procollagen I–expressing cells
193
at the periphery of the graft, with only sparse procollagen I expression in the graft
core (Figure B.9A). In contrast, xenografts injected with fibroblasts transduced with
Dicer1 shRNA (Dicer1-KD) displayed prominent procollagen I expression through-
out (Figure B.9B). Quantification by image analysis indicated a significant increase
in human procollagen I expression in xenografts containing Dicer1-KD fibroblasts
compared with those with nonsilencing scrambled shRNA control (Figure B.9C). As
an independent assessment of in vivo fibrogenicity, we tested Dicer1-KD fibroblasts
in a mouse tail vein injection xenograft model. In this model, IPF lung fibroblasts
produce prominent angiocentric fibrotic lesions, whereas control lung fibroblasts do
not [Xia et al., 2014,Pierce et al., 2007]. The lungs of mice receiving fibroblasts trans-
duced with nonsilencing scrambled shRNA (n = 8) produced no morphological lesions
(Figure B.9D, left panels), a result consistent with our prior report using unaltered
primary lung fibroblasts [Xia et al., 2014]. In sharp contrast, the lungs from four out
of eight mice injected with Dicer1-KD fibroblasts developed fibrotic lesions (P<0.04),
similar in morphology to those formed by IPF lung fibroblasts [Xia et al., 2014] (Fig-
ure B.8D, middle and right panels). The largest of these fibrotic lesions spanned 300
mm at the 13- day time point (Figure B.21. Thus, Dicer1 deficiency—even in the
absence of cues from a fibrotic ECM—is sufficient to confer human lung fibroblasts
with cellautonomous fibrogenicity in two in vivo xenograft models.
B.4 Discussion
Here we show that IPF-ECM inhibits lung fibroblast miR-29 expression upstream
at the level of transcription and downstream at the processing step by suppress-
ing Dicer1. Dicer1 deficiency suppresses lung fibroblast miR-29 expression on control
ECM and confers lung fibroblasts with cell-autonomous fibrogenicity in vivo. We pro-
194
vide strong validation for our findings by showing that the cells in the myofibroblast-
rich core of the IPF fibroblastic focus, where active collagen synthesis is taking place,
display reduced levels of Dicer1 compared with cells comprising the focus perimeter.
These data identify Dicer1 deficiency as a critical missing step in the mechanism of
the IPF-ECM–driven profibrotic feedback loop, providing a new pathway to exploit
for stopping fibrosis progression.
Several pathways can regulate miR-29 expression [He et al., 2013]; however, we
began our studies on the basis of the prevailing hypothesis in the field that ECM stiff-
ness transduced through YAP could explain miR-29 deficiency in IPF. This concept
derived from studies showing that stiffness drives lung fibroblast ECM production in
a YAP-dependent manner on hydrogels [Liu et al., 2015], that stiff IPF-ECM drives
fibroblast ECM production by deregulation of miR-29 [Parker et al., 2014], and that
YAP regulates miR-29 expression [Tumaneng et al., 2012] and microRNA process-
ing [Mori et al., 2014], establishing a mechanistic link. When we compared fibroblast
YAP and miR-29 expression on soft versus stiff hydrogels (a 2D system) to YAP and
miR-29 expression on Ctrl-ECM versus IPFECM (a 3D system), stiff 2D hydrogels
activated YAP and increased miR-29 levels, whereas IPF-ECM inactivated YAP and
decreased miR-29 levels. This excluded stiffness as the primary property of IPFECM
transduced by fibroblasts to deregulate YAP and miR-29.
Although these results were unexpected, they point to other ECM and cell sur-
face properties that might play a role. These include dimensionality, viscoelastic-
ity, cell–cell interactions, and cyclic stretch. In experiments examining mesenchymal
stromal cell (MSC) YAP expression in response to substratum dimensionality [Caliari
et al., 2016], stiffness drove YAP activation in a 2D system; whereas stiffness inac-
tivated YAP in a 3D system. This result is in accord with our data, which showed
fibroblast YAP activation on stiff 2D gels but YAP inactivation on IPF-ECM. In ad-
195

dition, independent of substratum stiffness or dimensionality, MSC YAP activation
is driven by increased viscoelasticity [Chaudhuri et al., 2016,Chaudhuri et al., 2015],
a parameter not yet assessed in the IPF lung. As an additional consideration, the
YAP response to MSC mechanosensing of matrix stiffness is dampened by an order of
magnitude when MSC N-cadherin (mimicking cell–cell interactions) is ligated [Cos-
grove et al., 2016]. It is also worth noting that the constant strain and relaxation of
the lungs during respiration represent a potentially important set of forces. Mam-
mary epithelial cells activate YAP in response to cyclic stretch [Codelia et al., 2014],
and cyclic stretch and compression in periodontal ligament cells regulate miR-29 and
downstream gene expression [Chen et al., 2015]. Together, these studies illustrate the
complexity of the mechanosensing–mechanotransduction axis, highlighting a critical
gap in our understanding of fibrosis progression in IPF.
Dicer1 can act as both a tumor suppressor and oncogene [Kurzynska-Kokorniak
et al., 2015]. Global microRNA deregulation due to a microRNA processing defect
is an established theme in cancer [Lin and Gregory, 2015] and has been implicated
in IPF [Oak et al., 2011, Pandit et al., 2011]. In accord with Dicer1 haploinsuffi-
ciency supporting cell autonomy in cancer, we found that experimentally induced
Dicer1 deficiency in human lung fibroblasts decreased miR-29 abundance, increased
collagen production, and supported cell-autonomous fibrogenicity in zebrafish and
mouse xenografts. Thus, both cancer and IPF exploit decreases but not ablation of
the terminal steps in microRNA processing to stabilize cell-autonomous pathology.
Another emerging function of Dicer1 is its role in DNA damage repair [Swahari et al.,
2016,Francia et al., 2012], which we speculate might play a dual role in IPF progres-
sion. Recent data indicate that cellular senescence markers are expressed within the
fibroblastic focus [Schafer et al., 2017], and there is extensive crosstalk between DNA
damage repair and cellular senescence [Sulli et al., 2012]. Thus, our study provides
196
strong support for the concept that the IPF fibroblastic focus is highly polarized,
with Dicer1 deficiency restricted to the myofibroblast-rich core of the fibroblastic
focus functioning as a driver of fibrosis progression.
The mechanisms regulating Dicer1 expression remain incompletely defined. Our
data support a role for the RNA binding protein AUF1, which associates with the 3’
untranslated region of RNA to recruit the RNA degradation machinery [Abdelmohsen
et al., 2012]. We found that IPF-ECM increases binding of AUF1 to the Dicer1 tran-
script more than fivefold, providing an explanation for some of the decrease in Dicer1
transcript we observed. Another possible mechanism is suggested by studies relat-
ing cell density to microRNA processing; nuclear YAP was necessary for processing
precursor microRNAs into their mature forms [Chaulk et al., 2014]. The microRNA
Let-7, however, did not follow this trend. In the absence of nuclear YAP, Let-7 ac-
cumulates and targets Dicer1 mRNA (which contains Let-7 target sites), leading to
a reduction in Dicer1 levels and defective microRNA processing. This is relevant
because Let-7 levels are altered in IPF lung tissue [Pandit et al., 2011]. However, the
focus of studies to date has been whole lung tissue, and it remains to be determined
whether Let-7 is increased within the procollagen I rich focus core where Dicer1 levels
are low.
Although the underlying ECM properties that generate and maintain the polarity
of the fibroblastic focus are not defined, one approach to elucidating this information
would be to develop a comprehensive tissue atlas that combines mechanical mea-
surements with cell identity and cell biology region by region. Although on average
the IPF lung is stiffer than control, and there are some regional data available us-
ing atomic force microscopy, there are no data in IPF in which ECM mechanical
properties (static and dynamic), topography, and chemistry have been coregistered
to cell type and cell biology. Such data have proved highly informative in cancer
197
biology [Weaver, 2017]. Given the spatial heterogeneity of the fibrotic process in IPF,
the importance of mechanotransduction in regulating cellular functions relevant to
fibrosis, and the striking polarity of the fibroblastic focus, we conclude that studies
connecting mechanics to cell biology region by region will be important to understand
the molecular basis for fibrosis progression in IPF.
B.5 Acknowledgment
The authors thank Daniel J. Tschumperlin and Delphine Sicard for assistance in char-
acterizing ECM mechanical properties and Vitaly Polunovsky for helpful suggestions
and critical review of the manuscript. Any opinions, findings, and conclusions or
recommendations expressed in this material are those of the authors.
Reprinted with permission of the American Thoracic Society. Copyright © 2019
American Thoracic Society. Cite: Herrera, J., Beisang, D.J., Peterson, M., Forster,
C., Gilbertsen, A., Benyumov, A., Smith, K., Korenczuk, C.E., Barocas, V.H., Guen-
ther, K. and Hite, R., 2018. Dicer1 deficiency in the idiopathic pulmonary fibrosis
fibroblastic focus promotes fibrosis by suppressing microRNA biogenesis. American
journal of respiratory and critical care medicine, 198(4), pp.486-496.
The American Journal of Respiratory and Critical Care Medicine is an official
journal of the American Thoracic Society.
198
B.6 Supplemental Material
B.6.1 Methods
Patient derived cell lines and decellularized lung
All studies involving patient-derived materials were approved by the University of
Minnesota Institutional Review Board for Human Subjects Research
(IRB # 1504M68341). Human lung tissue was procured and de-identified by the
University of Minnesota CTSI’s Biological Materials Procurement Network (BioNet).
Primary human lung fibroblast lines and culture conditions All cell lines were de-
rived from histologically uninvolved lung tissue adjacent to resected tumors. Tissue
was minced and added to 35 mm plastic tissue culture dishes for 2-3 weeks in explant
growth medium (DMEM + 20%FBS, 200 IU/mL Streptomycin, 200 IU/mL Peni-
cillin). Outgrowth cells were sub-cultivated into 150 mm dishes in fibroblast growth
media (DMEM + 10% FBS, 100 IU/mL Streptomycin, 100 IU/mL Penicillin) and
designated passage 1. Cells were characterized as fibroblasts by their typical spindle
shaped morphology, the expression of vimentin and alpha-smooth muscle actin, and
no expression of factor VIII and surfactant C. Cells were cultured (37° C, 5% CO2)
in fibroblast growth medium and sub-cultivated at a 1:3 split ratio. All experiments
were conducted with cells between passages 3 to 6. In total, 23 primary human lung
cell lines were used.
Experiments utilizing decellularized human lung ECM The study was conducted
using 2 types of patient-derived lung tissue: i) histologically uninvolved tissue adjacent
to resected tumors (Control), or ii) pathologically confirmed IPF (usual interstitial
pneumonia) obtained at the time of biopsy or lung transplantation. Freshly frozen
tissue was sectioned at 200 µm and decellularized in a series of solutions (1% SDS,
199
1% Triton X-100, 1M NaCl) as described [Parker et al., 2014]. Each decellularized
preparation was cut into strips approximating 1 cm2. When choosing tissue regions
for our preparations, we avoided major arteries/veins and airways for both lung types
in our ECM preparations.
To minimize the effect of patient to patient and lung region to lung region vari-
ation, each experiment was conducted in 15 mL conical polypropylene tubes, with
each tube containing decellularized ECM from 3 patient controls or 3 IPF patients.
In total we used 11 patient samples for Ctrl-ECM preparations and 8 patient sam-
ples for IPF-ECM preparations; randomly selecting 3 for each experiment performed.
Technical replicates used the same ECM preparations and the same cell lines; biolog-
ical replicates (independent replication of an experiment) randomized both cell lines
and ECM preparations (within the same class, IPF or Ctrl). To each tube we added
5 x 10⁵ fibroblasts in 2 mL survival medium (DMEM + 1% FBS, 100 IU/mL Strep-
tomycin, 100 IU/mL Penicillin) and incubated the cell-ECM mixture at 37° C in an
atmosphere containing 5% CO2, 95% air while oscillating each tube at 6 revolutions
per minute. Prior reports indicate that the choice of detergents (SDS vs CHAPS) in
the decellularization protocol can affect cell biology [Melo et al., 2014]. We therefore
tested both detergents in parallel and quantified mature miR-29 expression by qPCR
as a biologically relevant readout (Figure B.22. Mature miR-29 was suppressed by
IPF-ECM independent of the detergent protocol used. For all experiments, we used
SDS for decellularization as previously reported by our laboratory [Parker et al.,
2014]. To further characterize the system, we quantified cell attachment and pro-
liferation on each type of ECM. Of the 5 x 10⁵ input fibroblasts, ∼2.1 x 10⁵ cells
attached to Ctrl-ECM and ∼1.1 x 10⁵ attached to IPF-ECM (Figure B.23. Recovery
of attached cells on the 2 types of ECM was comparable. Among attached cells, BrdU
incorporation was similar on the 2 ECM types reaching a steady state value of ∼20%
200
in survival medium and ∼40% in growth medium (Figure B.24.
Polyacrylamide Gels
Polyacrylamide gels of 3 kPa or 20 kPa were cast following an established proto-
col [Cretu et al., 2010]. Gels were functionalized with either 100 µg/mL Type I Col-
lagen (Advanced BioMatrix 5005), 50 µg/mL Type III Collagen (Advanced BioMa-
trix 5021), 10µg/mL Fibronectin (Advanced BioMatrix 5050), or a combination of
all three using 10µg/mL of each. 2 x10⁵ fibroblasts were seeded on each gel and
incubated in survival medium for 24 hours. For lysate preparations, hydrogels were
washed twice in PBS, blotted dry, and placed cell side down into 150 µL lysis buffer
(Cell Signal # 9803) with protease inhibitors (Roche # 11873580001).
Vectors/Plasmids
For YAP gain-of-function experiments, plasmids pQCXIH-Flag-YAPS127\381A (Ad-
dgene # 33069) and pQCXIH-Myc-YAP-5SA (Addgene # 33093) were cloned into
expression plasmid pSIN-EF1α-DEST-pMDG-psPX2 (Addgene # 12260). Cells were
transduced and used for experimentation 48 hours after transduction. For YAP and
Dicer1 loss-of-function, 3 constructs for pGIPZ Human YAP1 shRNA (Dharmacon
# V2LHS 65508, V2LHS 65509, V2LHS 247011), 3 constructs for pGIPZ Human
Dicer1 shRNA (Dharmacon # V2LHS 99123, V2LHS 201823, V3LMM 239140) and
1 construct pGIPZ Non-Silencing (Scrambled) Lentiviral shRNA Control (Dharma-
con # RHS4346) were packaged into the pGIPZ lentivirus systems (GE Health) and
a cocktail of all 3 silencing constructs were used to transduce fibroblasts for 48 hours
(YAP) or 7 days (Dicer1) prior to initiating the experiment.
201
Western blot and antibodies
The protocol we developed to produce and analyze lysates from cells cultured on ECM
minimizes protein contamination from the medium and ECM; and normalizes loading
by accounting for unavoidable differences in the amount of these contaminating pro-
teins from sample to sample. Cell-ECM preparations are washed twice in PBS. Excess
PBS is blotted and preparations are submerged in 150 ∼L of Lysis Buffer (Cell Sig-
nal # 9803) with protease inhibitors (Roche # 11873580001) in a 1.5 mL tube. The
cell-ECM\lysis buffer mixture was mechanically disrupted with a pipette, sonicated,
centrifuged and the liquid phase was retained. To standardize loading in the presence
of contaminating eluted ECM proteins and residual media proteins; in each assay, we
loaded 10 ∼L of lysate, immunoblotted for GAPDH, and quantified GAPDH by den-
sitometry. The densitometry values for GAPDH in each lysate was used to equalize
lysate loading, enabling us to compare the abundance of proteins from sample to sam-
ple. Blots were incubated (4° C) overnight with primary antibodies (Table B.1. Blots
were washed 3X in TBS-T and incubated (1 h, room temperature) with secondary
antibodies (either goat anti-rabbit IgG HRP [Calbiochem 401393; 1:10,000] or Rat
anti-mouse IgG HRP [Calbiochem 401253; 1:2,500]). Blots were developed using ECL
western blotting detection (GE Healthcare W9488333) following the manufacturer’s
protocol.
Reverse Transcription and Quantitative PCR Analysis
RNA was isolated with TRI reagent (Sigma T9424) and chloroform extracted. Iso-
lated RNA was reverse transcribed using miScript II RT Kit (Qiagen 218161) ac-
cording to the manufacturer’s recommendation. NE-PER Nuclear and Cytoplasmic
Extraction Reagent (ThermoScientific # 78833; manufacturer’s recommendation) was
used to fractionate nuclear and cytoplasmic RNA. By using validated primers (Table
202
B.2) that share PCR conditions, we were able to probe for mature miR, Pri-Pre miR,
and mRNA from the same reverse transcription reaction using SYBR – Green PCR
Kit (Qiagen 218073; manufacturers recommendation) and analyzed by Roche Light
Cycler 1.5 (Software Version 3.5).
Luciferase Promoter Assay
The miR29-b-1/a firefly luciferase promoter construct was a kind gift from Justin
Mott, University of Nebraska [Mott et al., 2010]. Plasmids miR29-b-1/a and pRLTK
(Promega E2241) were co-transfected into primary lung fibroblasts using Lipofec-
tamine 3000 (Life Technologies L3000008) according to the manufacturer’s recom-
mendation. Using a dual luciferase reporter assay (Promega E1910), luminescence
was quantified using a Lumat LB 9507 luminometer (Berthold Technologies).
AUF1-Dicer1 mRNA immunoprecipitation
RNA-immunoprecipitations were performed as we previously described [Rattenbacher
et al., 2010,Beisang et al., 2012,White et al., 2017] with the following modifications.
Primary human lung fibroblasts were cultured on tissue culture plastic in DMEM
+ 10% FBS to ∼50% confluence (mid-log phase) and shifted to DMEM + 1% FBS
for 24 h. Cells were added to tubes containing Ctrl- or IPF- ECM and cultures were
continued in DMEM + 1% FBS for 18h. Cells were chemically removed from the ECM
with trypsin, and the cell pellet was collected by centrifugation. Cytoplasmic lysates
were prepared by adding 1 cell pellet volume of NP-40 lysis buffer (10mM Hepes, 100
mM KCl, 5 mM MgCl2, 25 mM EDTA, 0.5% IGEPAL, 2mM DTT, 50U/ml RNase
out and protease inhibitors). Lysates (50µl) of lysates were incubated (1h, 4° C) with
protein A sepharose beads (Santa Cruz) blocked with bovine serum albumen and
coated with antiAUF1 antibody (Millipore) or control rabbit IgG (Millipore) in NT2
203
buffer (50mM Tris–HCl pH 7.5, 150mM NaCl, 1mM MgCl2, 0.05% IGEPAL) with
appropriate inhibitors. Beads were washed 6 times with NT2 buffer, and incubated
with NT2 buffer containing SDS and proteinase K (30 min, 65° C). RNA was extracted
using Trizol reagent and subjected to qPCR for Dicer1 and GAPDH mRNA.
Zebrafish Xenograft Assay
Zebrafish (Danio rerio) wild type embryos were obtained through the University of
Minnesota Zebrafish Research Core Facility with approval from the Institutional Ani-
mal Care and Use Committee (IACUC Protocol 1502-32338A). Human cells, in addi-
tion to GFP labeling, were stained with a vital dye PKH26 (Sigma) and grafted into
the central portion of the zebrafish embryo blastoderm at the oblong-sphere stages
as previously described [Benyumov et al., 2012]. Host-embryos developed at 28.5° C.
46 hours post-grafting, embryos were immobilized with Tricane (Sigma) and fixed
with 4% paraformaldehyde for 48 hours prior to paraffin-embedding (Due to the size
of the fish, a one-hour processing cycle was performed to avoid over-processing and
hardening of tissue).
Mouse Xenograft Assay
Female, age 8 weeks, NOD.Cg-Prkdc scid Il2rg tm1Wjl /SzJ mice (Jackson Labo-
ratory, Farmington, CT, product number 005557) were divided into 2 groups and
inoculated by tail vein injection with 106 primary human fibroblasts transduced with
either Dicer1 shRNA or scrambled shRNA control following IACUC Protocol 1407-
31641A. 4 mice from each group were sacrificed 6-days post inoculation. At the time
of sacrifice, lungs were harvested, formalin-fixed and paraffin-embedded.
204
Immunohistochemistry/Immunofluorescence
Human lung samples or fibroblasts cultured on decellularized ECM and were formalin-
fixed and paraffin-embedded (FFPE). De-paraffinized and rehydrated 4 µm sections
were subjected to antigen-heat retrieval (BioCare RV1000) for 25 minutes at 100° C
(then allowed to cool to room temperature for 20 minutes), followed by 10 minutes in
3% hydrogen peroxide and 1 hour in Background SNIPER (BioCare BS966) blocking
reagent at room temperature. Fibroblasts cultured on 2-D hydrogels were formalin-
fixed and subjected to antigen-heat retrieval followed by a Background SNIPER block-
ing reagent. For anti-procollagen I, we used proteinase K (Millipore 21627; working
strength) for 10 minutes instead of antigen-heat retrieval. After blocking, sections or
gels were exposed overnight (4° C) to primary antibodies (Table B.3) diluted in 10%
Background SNIPER. For permanent staining, Novolink Polymer Detection Systems
(Leica RE7270-RE; manufacturer’s recommendation) was used and developed with
DAB chromagen (Covance SIG-31042; manufacturer’s recommendation). For pro-
collagen type I, biotinylated anti-Rat (Vector Laboratories # BA-4001) was used at
1:500 in 10% Background Sniper followed by Streptavidin-HRP (Covance SIG-32254;
working strength) and DAB chromagen. Slides were counterstained with hematoxylin
and cover-slipped with Permount (FisherSci # SP15). For immunofluorescence, after
overnight primary antibody incubation, anti-Rabbit Cy3 or anti-rat Alexa 594 (Jack-
son 711-165-152; Abcam ab150156) in 10% Background SNIPER was incubated for 2
hours at room temperature and cover-slipped with Prolong Gold Antifade Mountant
w/ DAPI (ThermoFisher P36931).
To quantify procollagen I levels in zebrafish xenografts, a single plane image of
the graft was acquired. Using ImageJ (v1.50i, NIH), an outline was drawn around
each graft and area mean fluorescence measured, along with adjacent background
readings. The total corrected cellular fluorescence (TCCF) = integrated density –
205
(area of selected cell Ö mean fluorescence of background readings), was calculated as
described [McCloy et al., 2014].
RNAscope
Formalin-fixed paraffin-embedded 4 µm sections were used following the manufactur-
ers guidelines (Advanced Cell Diagnostic, ACD). In situ hybridization was performed
for human Dicer1 (ACD, # 403051) using RNAscope 2.5 HD Reagent Kit (ACD,
# 322300). Tissue was counterstained with hematoxylin and coverslipped with per-
mount.
Histological Stains
Formalin-fixed paraffin-embedded 4 µm sections were deparaffinized and rehydrated.
Hematoxylin & Eosin (H&E) and Masson Trichrome histological stains were per-
formed by the Bionet Core Facility at University of Minnesota.
Histological Imaging
Samples containing permanent stains (DAB substrate/H&E/trichrome counterstain)
were imaged using a Leica EC3 microscope and Leica MME camera. Fluorescent
images were collected using a Zeiss Axiovert 200 fluorescence microscope and analyzed
using AxioVision (Release 4.7.2).
Pharmacological Inhibitors
10 µM CCG-100602 (Cayman Chemical: 1207113-889) [MRTF inhibitor], 20 nM A83-
01 (Tocris, # 2939) [ALK5 inhibitor], 10 µM Ly293002 (Cell Signal, # 9901) [PI3K in-
hibitor], 5 µM DAPT (Sigma, # 5942) [Notch inhibitor], 10 µM SCH772984 (AbMole
BioScience, # 942183-80-4) [Erk inhibitor], 10 µM PF562271 (AbMole BioScience,
206
# 717907-75-0) [Focal Adhesion Kinase inhibitor], and 10 µM Y27632 (Sigma, #
Y0503) [Rock inhibitor] were diluted according to the manufacturer’s instructions
and administered to cells at time of ECM culturing.
Uniaxial Extension to Failure
Lung ECM was sectioned using a tissue mold (Electron Microscopy Sciences # 69012)
into rectangular uniaxial strips (3 mm x 5 mm x 15 mm) approximating the dimen-
sions of a human lung acinus. Samples were tested in uniaxial strain to failure ex-
periments on a biaxial machine (Instron, Norwood, MA) in the uniaxial mode using
either ±5N or ±500N load cells and custom grips. Using computer software (Wave-
Matrix version 1.8), we applied a strain rate of 1%/second until failure, and the force
was recorded by the load cells at a sampling rate of 100Hz. Only samples that failed
in the center were included in the analysis. Samples that failed near the testing grip
were discarded.
The force from the static load cell was divided by the undeformed cross-sectional
area to calculate the first Piola-Kirchhoff Stress. The same undeformed cross-sectional
area was used for all samples (15 mm2). Grip strain was calculated using the initial
distance between the grips (10 mm for all samples) and grip displacement during
testing. Each stress-strain curve was processed with a bilinear fitting code using a
least squares method, courtesy of Dr. Spencer Lake (Washington University in St.
Louis, full method described in [Lake et al., 2010], to provide a toe and linear region
modulus.
BrdU labeling
Fibroblasts cultured on decellularized ECM were pulsed with BrdU (Life Technologies
00-0103; per the manufacturer’s recommendation) for 24 hours prior to formalin-
207

fixation and paraffin-embedding.
208

Antibody Company Cat #αSMA Abcam 32575Ago2 Abcam 32381AKT Cell Signal 9272p-AKT-S473 Cell Signal 4060Col1a2 Abcam 34710Dicer1 Cell Signal 3363Drosha Cell Signal 3410ERK Cell Signal 9102p-ERK-T202 \Y204 Cell Signal 9106Exportin-5 Cell Signal 12565FAK Santa Cruz SC-558p-FAK-Y397 Cell Signal 3283FLAG-tag Miullipore MABS1244GAPDH Santa Cruz 25778Myc-Tag Cell Signal 2278MMP-2 Abcam 37150YAP Cell Signal 14074
Table B.1: List of primary antibodies used for immunoblot. Conditions as recom-mended by manufacturer.
209

Mature miR Cat # Precursor miR Cat # mRNA Cat #miR-29a MS00003262 pre-miR-29a MP00001736 Col1a2 QT00037793miR-29b MS00006566 pre-miR-29c MP00001757 Col4a2 QT00231707miR-29c MS000003269 Col6a2 QT00067039miR-320a MS00014707 CTGF QT00052899miR-451 MS00004242 CYR61 QT00003451miR-484 MS00004277 Dicer1 QT00015176RNU6 MS00033740 GAPDH QT00079247
Hes1 QT00039648
Table B.2: List of validated qPCR primers from Qiagen.
210
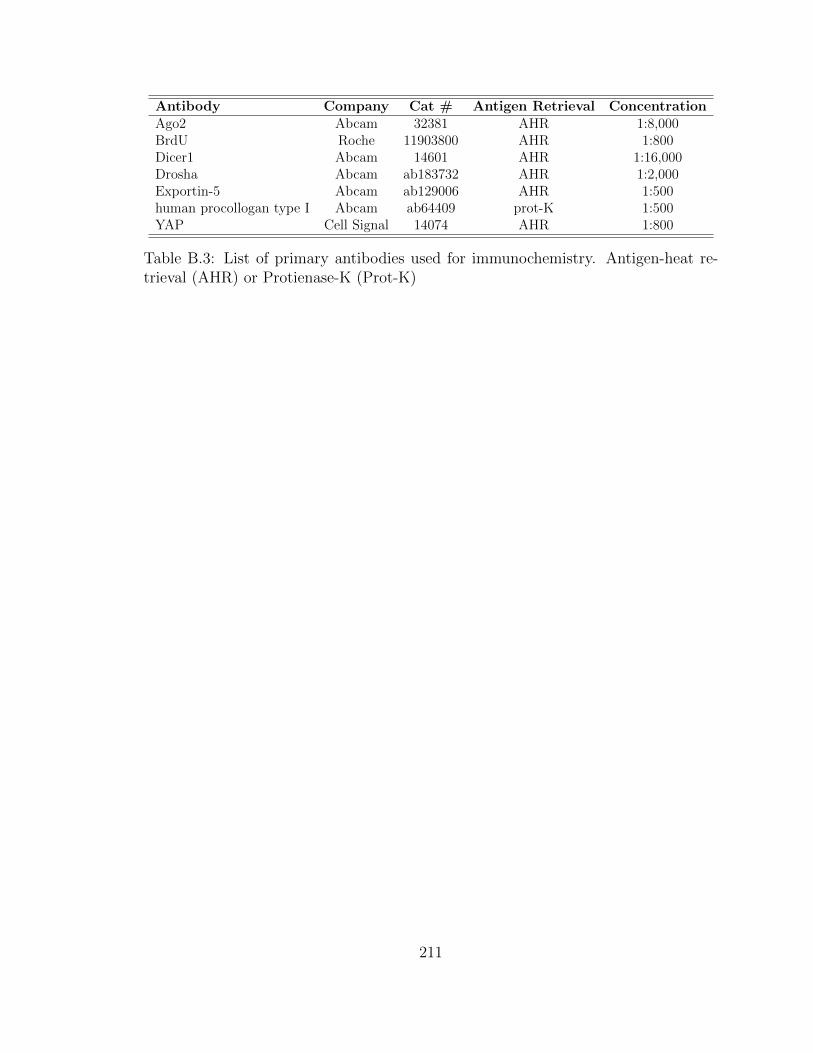
Antibody Company Cat # Antigen Retrieval ConcentrationAgo2 Abcam 32381 AHR 1:8,000BrdU Roche 11903800 AHR 1:800Dicer1 Abcam 14601 AHR 1:16,000Drosha Abcam ab183732 AHR 1:2,000Exportin-5 Abcam ab129006 AHR 1:500human procollogan type I Abcam ab64409 prot-K 1:500YAP Cell Signal 14074 AHR 1:800
Table B.3: List of primary antibodies used for immunochemistry. Antigen-heat re-trieval (AHR) or Protienase-K (Prot-K)
211
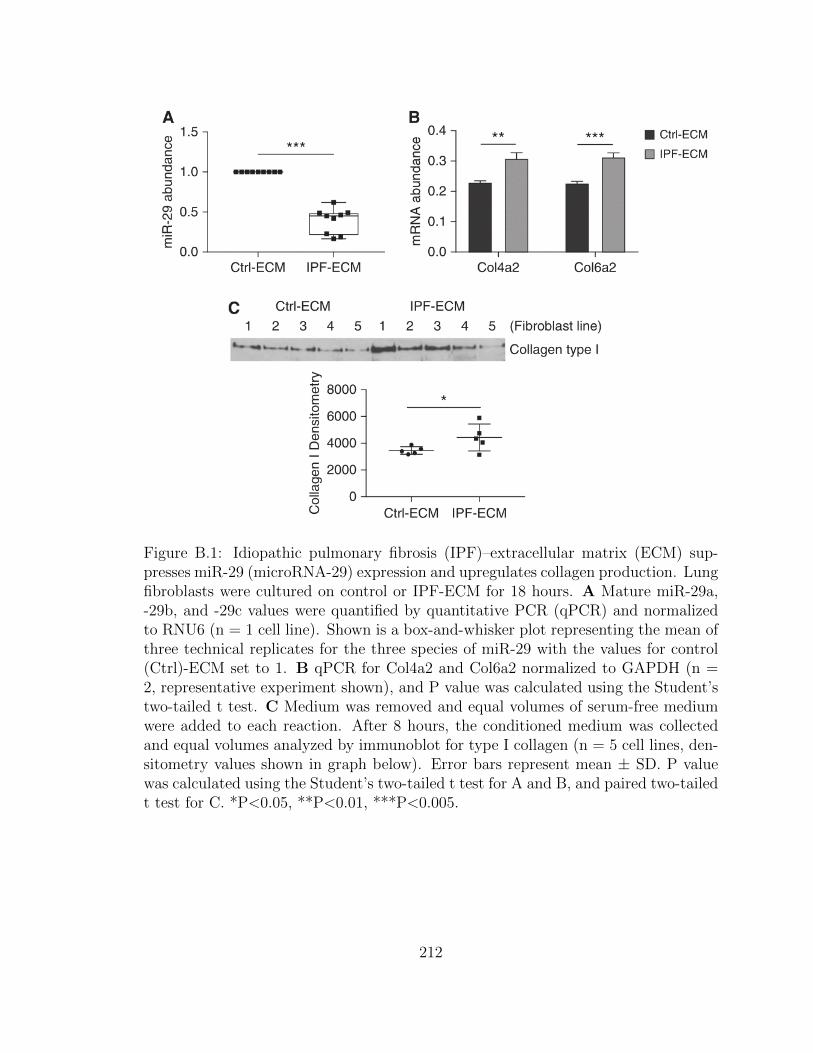
Figure B.1: Idiopathic pulmonary fibrosis (IPF)–extracellular matrix (ECM) sup-presses miR-29 (microRNA-29) expression and upregulates collagen production. Lungfibroblasts were cultured on control or IPF-ECM for 18 hours. A Mature miR-29a,-29b, and -29c values were quantified by quantitative PCR (qPCR) and normalizedto RNU6 (n = 1 cell line). Shown is a box-and-whisker plot representing the mean ofthree technical replicates for the three species of miR-29 with the values for control(Ctrl)-ECM set to 1. B qPCR for Col4a2 and Col6a2 normalized to GAPDH (n =2, representative experiment shown), and P value was calculated using the Student’stwo-tailed t test. C Medium was removed and equal volumes of serum-free mediumwere added to each reaction. After 8 hours, the conditioned medium was collectedand equal volumes analyzed by immunoblot for type I collagen (n = 5 cell lines, den-sitometry values shown in graph below). Error bars represent mean ± SD. P valuewas calculated using the Student’s two-tailed t test for A and B, and paired two-tailedt test for C. *P<0.05, **P<0.01, ***P<0.005.
212
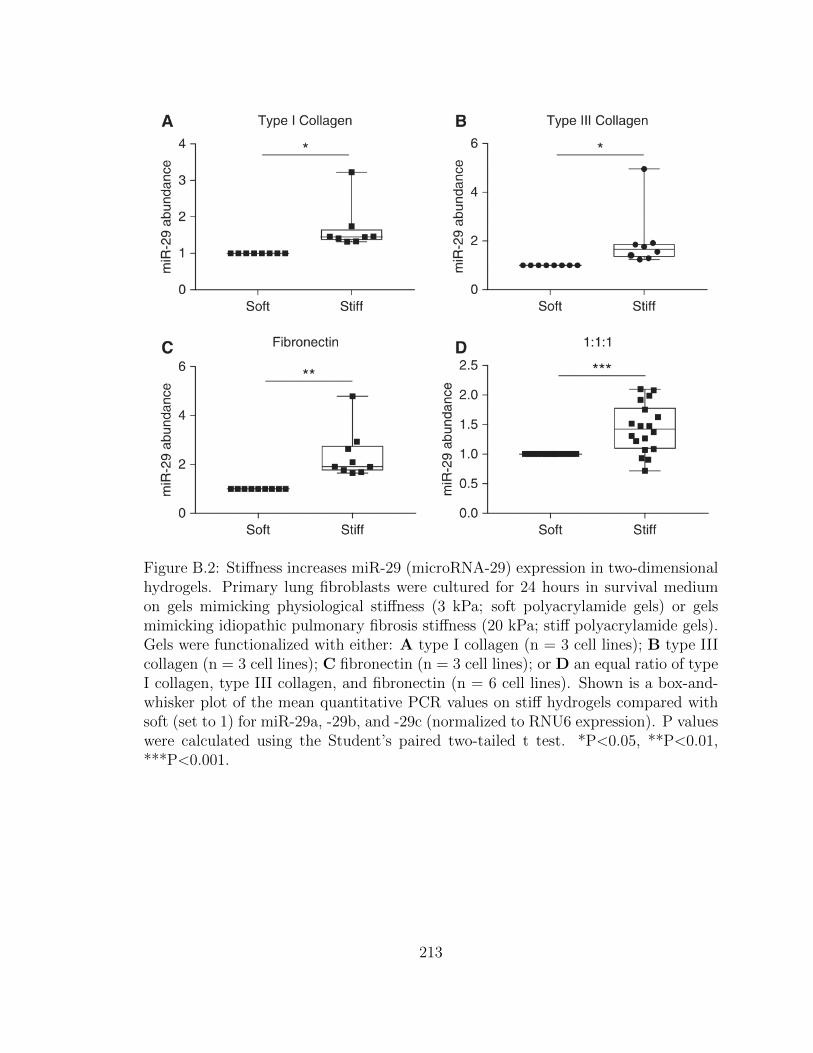
Figure B.2: Stiffness increases miR-29 (microRNA-29) expression in two-dimensionalhydrogels. Primary lung fibroblasts were cultured for 24 hours in survival mediumon gels mimicking physiological stiffness (3 kPa; soft polyacrylamide gels) or gelsmimicking idiopathic pulmonary fibrosis stiffness (20 kPa; stiff polyacrylamide gels).Gels were functionalized with either: A type I collagen (n = 3 cell lines); B type IIIcollagen (n = 3 cell lines); C fibronectin (n = 3 cell lines); or D an equal ratio of typeI collagen, type III collagen, and fibronectin (n = 6 cell lines). Shown is a box-and-whisker plot of the mean quantitative PCR values on stiff hydrogels compared withsoft (set to 1) for miR-29a, -29b, and -29c (normalized to RNU6 expression). P valueswere calculated using the Student’s paired two-tailed t test. *P<0.05, **P<0.01,***P<0.001.
213
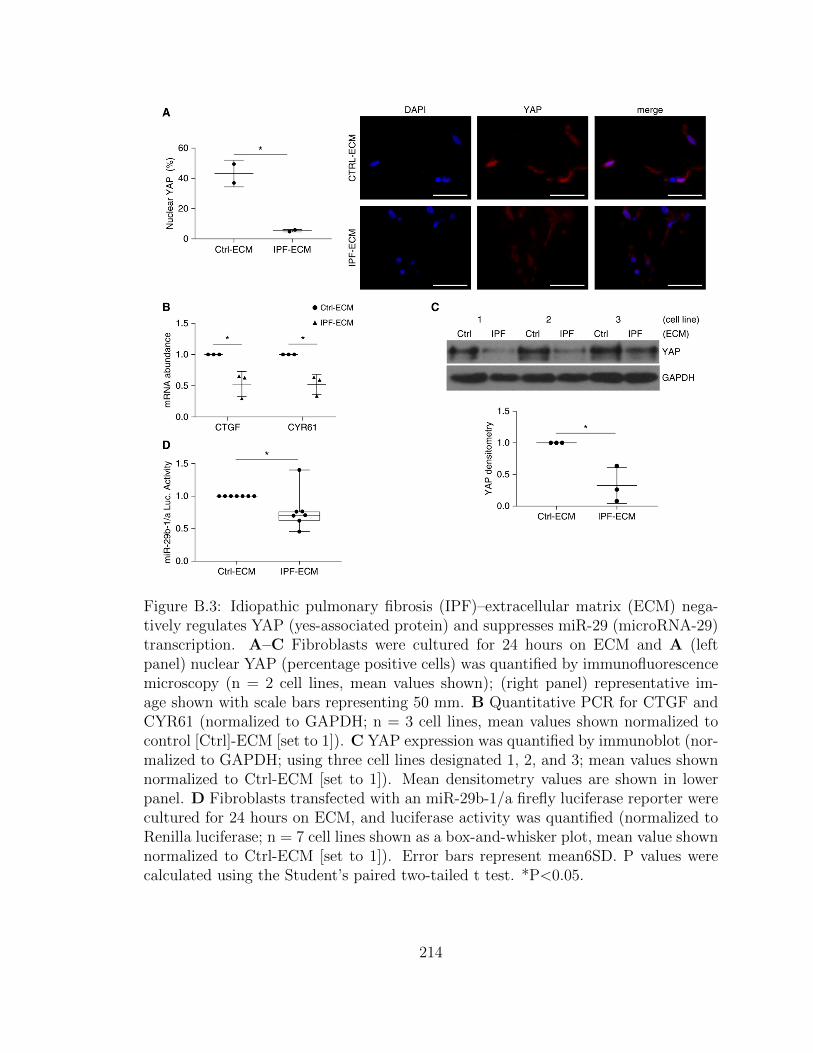
Figure B.3: Idiopathic pulmonary fibrosis (IPF)–extracellular matrix (ECM) nega-tively regulates YAP (yes-associated protein) and suppresses miR-29 (microRNA-29)transcription. A–C Fibroblasts were cultured for 24 hours on ECM and A (leftpanel) nuclear YAP (percentage positive cells) was quantified by immunofluorescencemicroscopy (n = 2 cell lines, mean values shown); (right panel) representative im-age shown with scale bars representing 50 mm. B Quantitative PCR for CTGF andCYR61 (normalized to GAPDH; n = 3 cell lines, mean values shown normalized tocontrol [Ctrl]-ECM [set to 1]). C YAP expression was quantified by immunoblot (nor-malized to GAPDH; using three cell lines designated 1, 2, and 3; mean values shownnormalized to Ctrl-ECM [set to 1]). Mean densitometry values are shown in lowerpanel. D Fibroblasts transfected with an miR-29b-1/a firefly luciferase reporter werecultured for 24 hours on ECM, and luciferase activity was quantified (normalized toRenilla luciferase; n = 7 cell lines shown as a box-and-whisker plot, mean value shownnormalized to Ctrl-ECM [set to 1]). Error bars represent mean6SD. P values werecalculated using the Student’s paired two-tailed t test. *P<0.05.
214
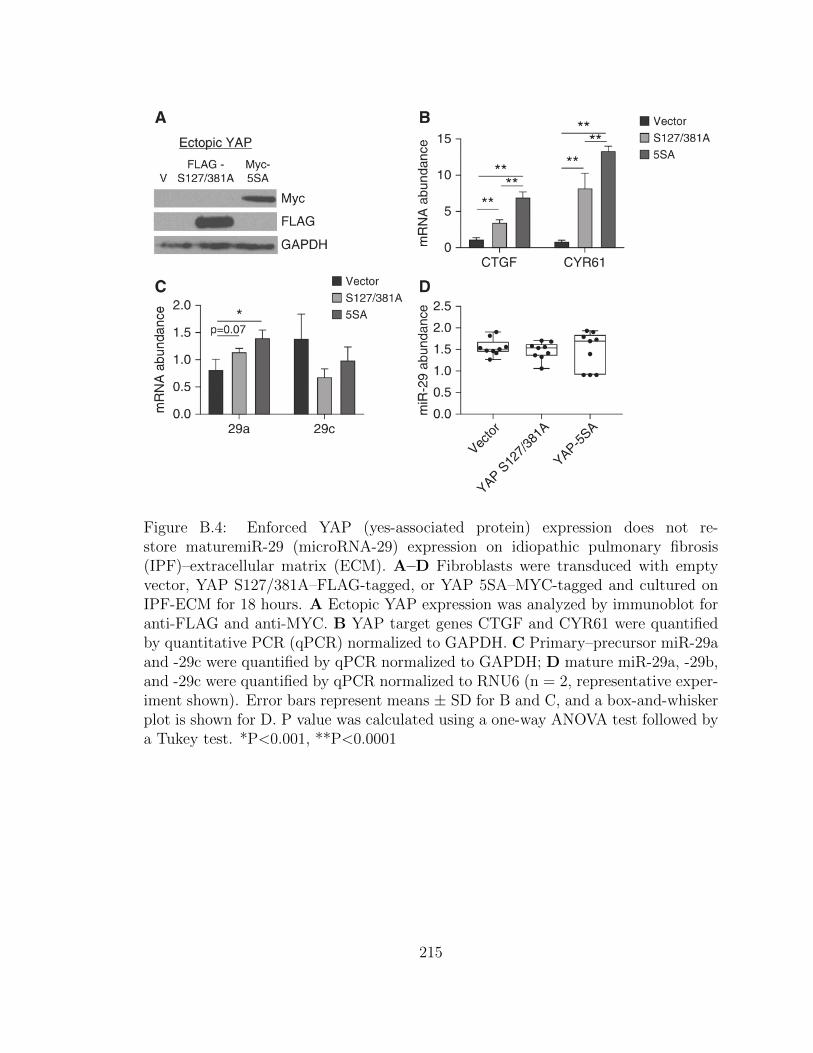
Figure B.4: Enforced YAP (yes-associated protein) expression does not re-store maturemiR-29 (microRNA-29) expression on idiopathic pulmonary fibrosis(IPF)–extracellular matrix (ECM). A–D Fibroblasts were transduced with emptyvector, YAP S127/381A–FLAG-tagged, or YAP 5SA–MYC-tagged and cultured onIPF-ECM for 18 hours. A Ectopic YAP expression was analyzed by immunoblot foranti-FLAG and anti-MYC. B YAP target genes CTGF and CYR61 were quantifiedby quantitative PCR (qPCR) normalized to GAPDH. C Primary–precursor miR-29aand -29c were quantified by qPCR normalized to GAPDH; D mature miR-29a, -29b,and -29c were quantified by qPCR normalized to RNU6 (n = 2, representative exper-iment shown). Error bars represent means ± SD for B and C, and a box-and-whiskerplot is shown for D. P value was calculated using a one-way ANOVA test followed bya Tukey test. *P<0.001, **P<0.0001
215

Figure B.5: Idiopathic pulmonary fibrosis (IPF)–extracellular matrix (ECM) sup-presses the microRNA processing machinery. A MicroRNA biogenesis schematic: 1)microRNAs are transcribed into primary microRNA (Pri-miR), 2) processed into pre-cursor microRNA (Pre-miR) by the microprocessor complex (including Drosha), 3)actively shuttled from the nucleus to the cytoplasm by Exportin-5, and 4) processedinto mature microRNAs by Ago2 and Dicer1. B Fibroblasts were cultured on ECMfor 18 hours and quantitative PCR was used to analyze the grouped values of Pri-Preand mature microRNA-29a (miR-29a) and miR-29c normalized to GAPDH or RNU6,respectively (n = 3 cell lines, mean value shown normalized to control [Ctrl]-ECM[set to 1]). Data are shown as a box-and-whisker plot, and P value was calculatedusing the Student’s paired t test. *P<0.05, **P<0.0001. C Fibroblasts were culturedon ECM for 24 hours. Shown are immunoblots for Dicer1, Ago2, Drosha, Exportin-5,and GAPDH (n = 1 cell line).
216
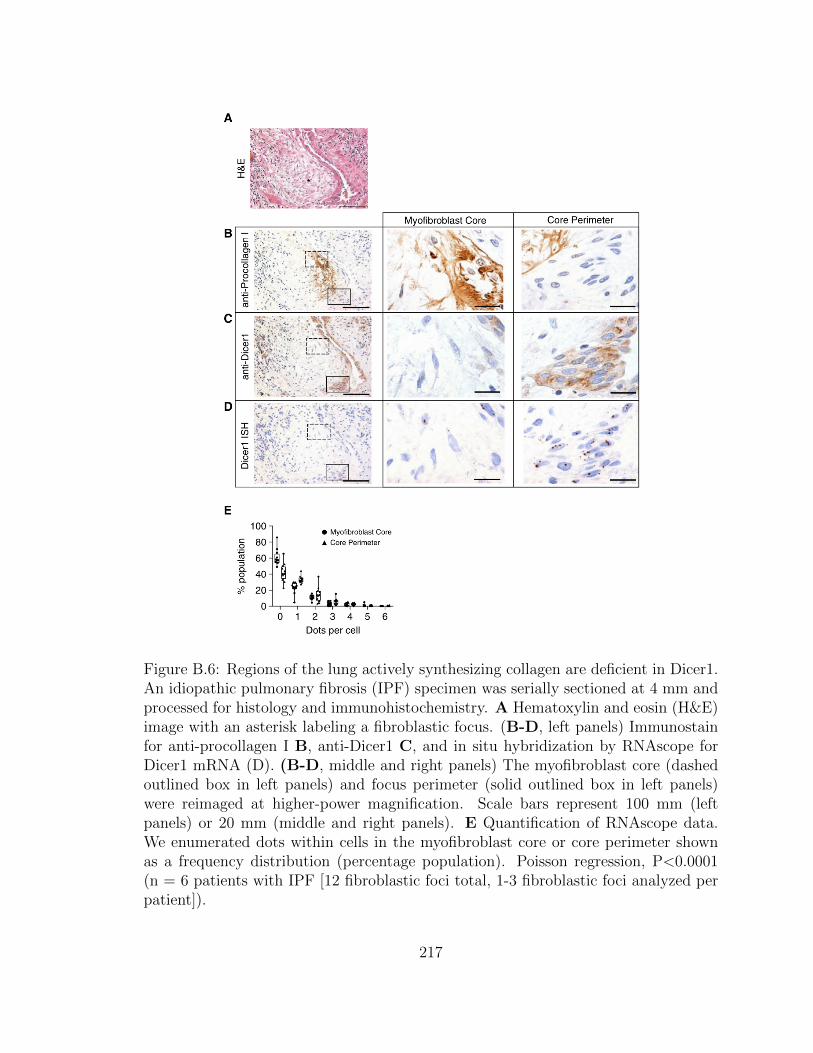
Figure B.6: Regions of the lung actively synthesizing collagen are deficient in Dicer1.An idiopathic pulmonary fibrosis (IPF) specimen was serially sectioned at 4 mm andprocessed for histology and immunohistochemistry. A Hematoxylin and eosin (H&E)image with an asterisk labeling a fibroblastic focus. (B-D, left panels) Immunostainfor anti-procollagen I B, anti-Dicer1 C, and in situ hybridization by RNAscope forDicer1 mRNA (D). (B-D, middle and right panels) The myofibroblast core (dashedoutlined box in left panels) and focus perimeter (solid outlined box in left panels)were reimaged at higher-power magnification. Scale bars represent 100 mm (leftpanels) or 20 mm (middle and right panels). E Quantification of RNAscope data.We enumerated dots within cells in the myofibroblast core or core perimeter shownas a frequency distribution (percentage population). Poisson regression, P<0.0001(n = 6 patients with IPF [12 fibroblastic foci total, 1-3 fibroblastic foci analyzed perpatient]).
217
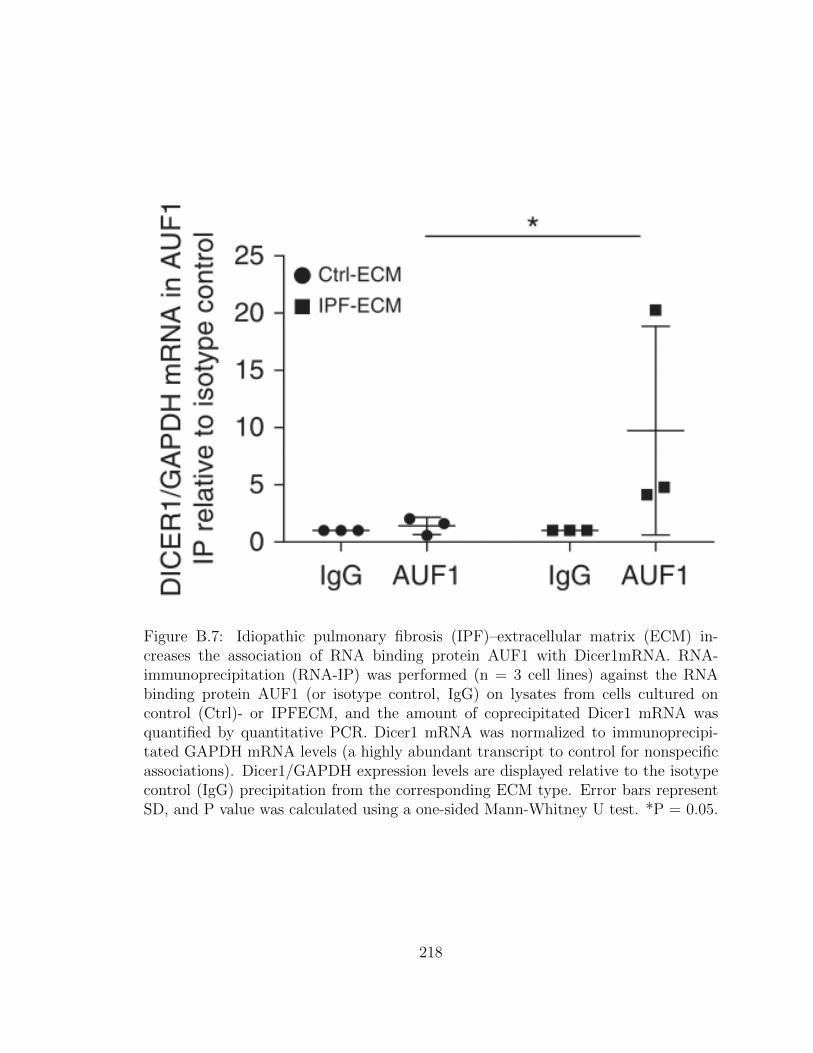
Figure B.7: Idiopathic pulmonary fibrosis (IPF)–extracellular matrix (ECM) in-creases the association of RNA binding protein AUF1 with Dicer1mRNA. RNA-immunoprecipitation (RNA-IP) was performed (n = 3 cell lines) against the RNAbinding protein AUF1 (or isotype control, IgG) on lysates from cells cultured oncontrol (Ctrl)- or IPFECM, and the amount of coprecipitated Dicer1 mRNA wasquantified by quantitative PCR. Dicer1 mRNA was normalized to immunoprecipi-tated GAPDH mRNA levels (a highly abundant transcript to control for nonspecificassociations). Dicer1/GAPDH expression levels are displayed relative to the isotypecontrol (IgG) precipitation from the corresponding ECM type. Error bars representSD, and P value was calculated using a one-sided Mann-Whitney U test. *P = 0.05.
218
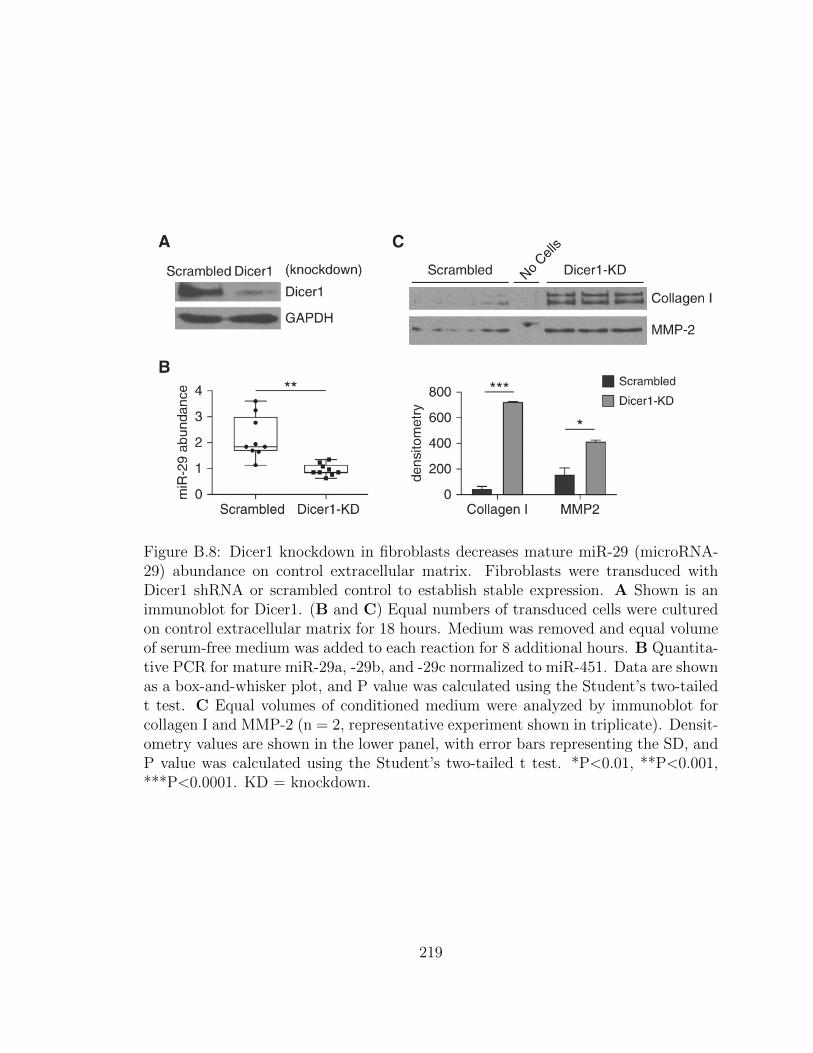
Figure B.8: Dicer1 knockdown in fibroblasts decreases mature miR-29 (microRNA-29) abundance on control extracellular matrix. Fibroblasts were transduced withDicer1 shRNA or scrambled control to establish stable expression. A Shown is animmunoblot for Dicer1. (B and C) Equal numbers of transduced cells were culturedon control extracellular matrix for 18 hours. Medium was removed and equal volumeof serum-free medium was added to each reaction for 8 additional hours. B Quantita-tive PCR for mature miR-29a, -29b, and -29c normalized to miR-451. Data are shownas a box-and-whisker plot, and P value was calculated using the Student’s two-tailedt test. C Equal volumes of conditioned medium were analyzed by immunoblot forcollagen I and MMP-2 (n = 2, representative experiment shown in triplicate). Densit-ometry values are shown in the lower panel, with error bars representing the SD, andP value was calculated using the Student’s two-tailed t test. *P<0.01, **P<0.001,***P<0.0001. KD = knockdown.
219
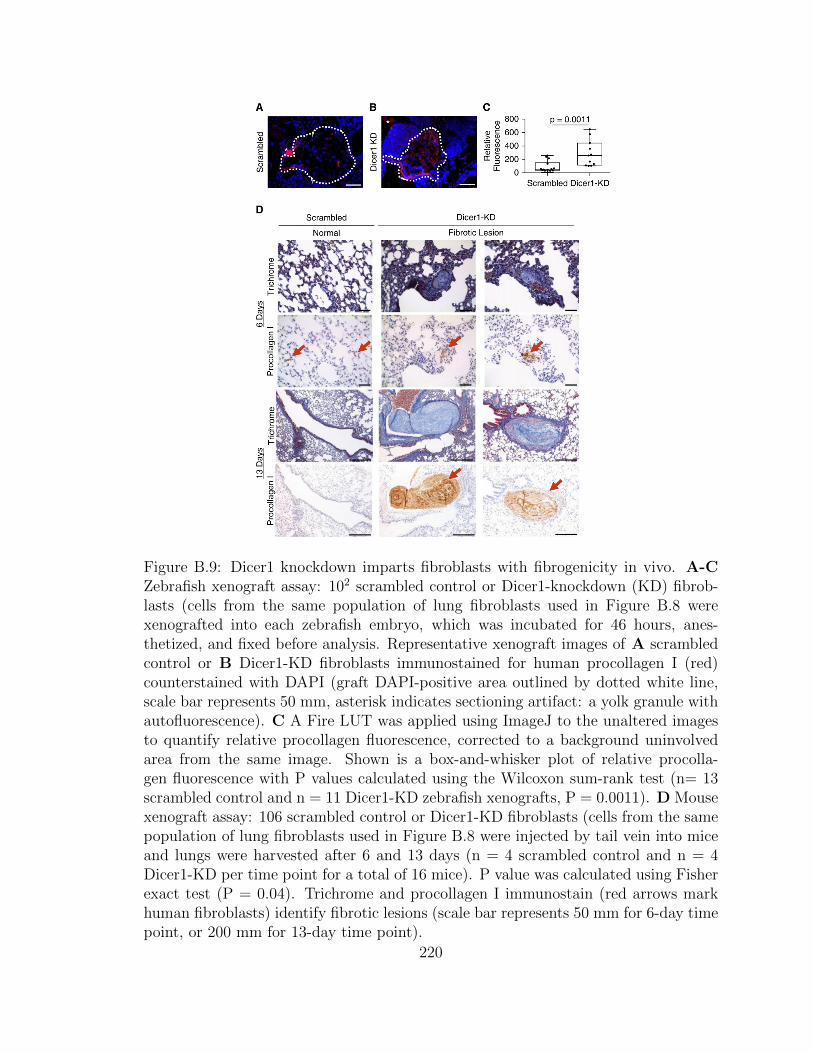
Figure B.9: Dicer1 knockdown imparts fibroblasts with fibrogenicity in vivo. A-CZebrafish xenograft assay: 102 scrambled control or Dicer1-knockdown (KD) fibrob-lasts (cells from the same population of lung fibroblasts used in Figure B.8 werexenografted into each zebrafish embryo, which was incubated for 46 hours, anes-thetized, and fixed before analysis. Representative xenograft images of A scrambledcontrol or B Dicer1-KD fibroblasts immunostained for human procollagen I (red)counterstained with DAPI (graft DAPI-positive area outlined by dotted white line,scale bar represents 50 mm, asterisk indicates sectioning artifact: a yolk granule withautofluorescence). C A Fire LUT was applied using ImageJ to the unaltered imagesto quantify relative procollagen fluorescence, corrected to a background uninvolvedarea from the same image. Shown is a box-and-whisker plot of relative procolla-gen fluorescence with P values calculated using the Wilcoxon sum-rank test (n= 13scrambled control and n = 11 Dicer1-KD zebrafish xenografts, P = 0.0011). D Mousexenograft assay: 106 scrambled control or Dicer1-KD fibroblasts (cells from the samepopulation of lung fibroblasts used in Figure B.8 were injected by tail vein into miceand lungs were harvested after 6 and 13 days (n = 4 scrambled control and n = 4Dicer1-KD per time point for a total of 16 mice). P value was calculated using Fisherexact test (P = 0.04). Trichrome and procollagen I immunostain (red arrows markhuman fibroblasts) identify fibrotic lesions (scale bar represents 50 mm for 6-day timepoint, or 200 mm for 13-day time point).
220

Supplemental Figure B.10: Uniaxial Tensile Mechanics of Lung ECM. A Decellu-larized ECM was loaded onto clamps. B The ECM was stressed until tissue failureensued. C Young’s elastic modulus measurements of generated force curves are rep-resented as a box and whisker plot. P value was calculated using the WilcoxonRank-Sum test (n = 30 each group; 6 Ctrl-ECM and 6 IPF-ECM – 5 replicates each).
221
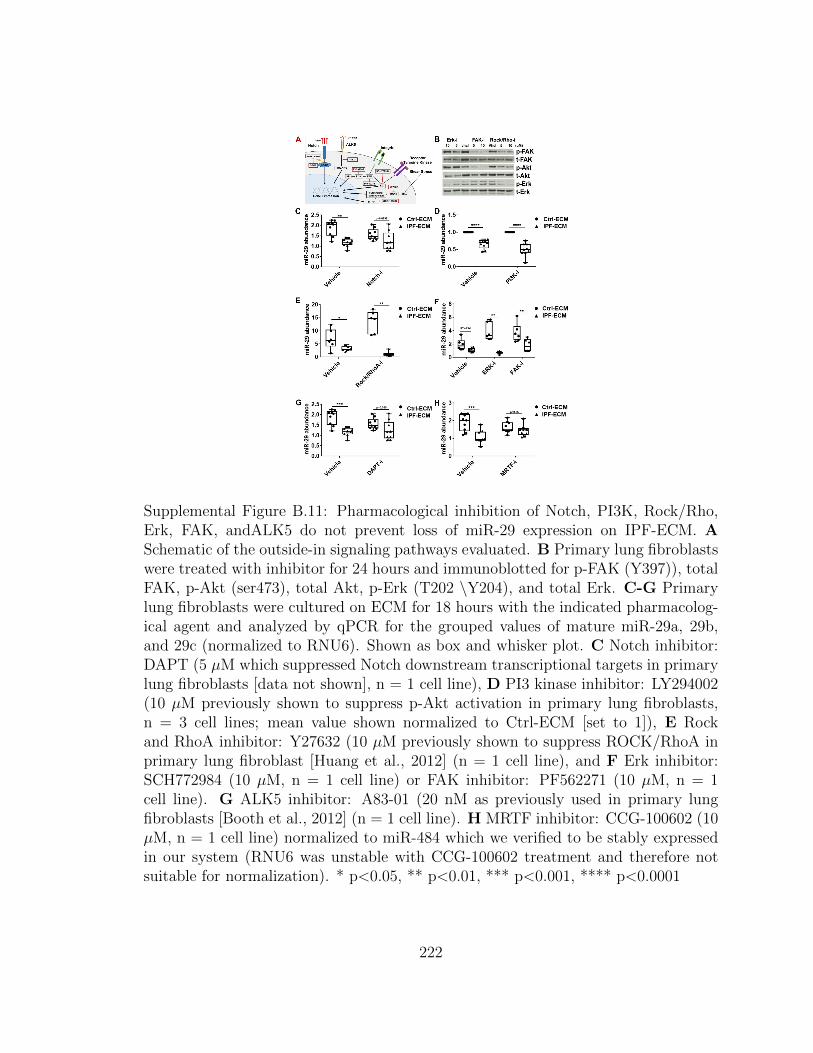
Supplemental Figure B.11: Pharmacological inhibition of Notch, PI3K, Rock/Rho,Erk, FAK, andALK5 do not prevent loss of miR-29 expression on IPF-ECM. ASchematic of the outside-in signaling pathways evaluated. B Primary lung fibroblastswere treated with inhibitor for 24 hours and immunoblotted for p-FAK (Y397)), totalFAK, p-Akt (ser473), total Akt, p-Erk (T202 \Y204), and total Erk. C-G Primarylung fibroblasts were cultured on ECM for 18 hours with the indicated pharmacolog-ical agent and analyzed by qPCR for the grouped values of mature miR-29a, 29b,and 29c (normalized to RNU6). Shown as box and whisker plot. C Notch inhibitor:DAPT (5 µM which suppressed Notch downstream transcriptional targets in primarylung fibroblasts [data not shown], n = 1 cell line), D PI3 kinase inhibitor: LY294002(10 µM previously shown to suppress p-Akt activation in primary lung fibroblasts,n = 3 cell lines; mean value shown normalized to Ctrl-ECM [set to 1]), E Rockand RhoA inhibitor: Y27632 (10 µM previously shown to suppress ROCK/RhoA inprimary lung fibroblast [Huang et al., 2012] (n = 1 cell line), and F Erk inhibitor:SCH772984 (10 µM, n = 1 cell line) or FAK inhibitor: PF562271 (10 µM, n = 1cell line). G ALK5 inhibitor: A83-01 (20 nM as previously used in primary lungfibroblasts [Booth et al., 2012] (n = 1 cell line). H MRTF inhibitor: CCG-100602 (10µM, n = 1 cell line) normalized to miR-484 which we verified to be stably expressedin our system (RNU6 was unstable with CCG-100602 treatment and therefore notsuitable for normalization). * p<0.05, ** p<0.01, *** p<0.001, **** p<0.0001
222

Supplemental Figure B.12: Kinetics of type I collagen expression by fibroblasts cul-tured on decellularized ECM. Fibroblasts were cultured on ECM for 18 hours andmedium was replaced with equal amounts of serum-free medium for the indicatedtime. A Immunoblot for collagen I using equal amounts of conditioned media col-lected from fibroblasts cultured on Ctrl-ECM or IPF-ECM. 24-hour cell-free lanes(boxed in red dotted lines) were included to evaluate the contribution collagen Ileaching out of the decellularized ECM (arrow). B Using equal volumes of condi-tioned medium for each time-point, the immunoblot was probed for type I collagenand signal was quantified by densitometry. (n = 1). Error bars represent means ±S.E.M. P value was calculated using the student two-tailed T-test. * p<0.05
223
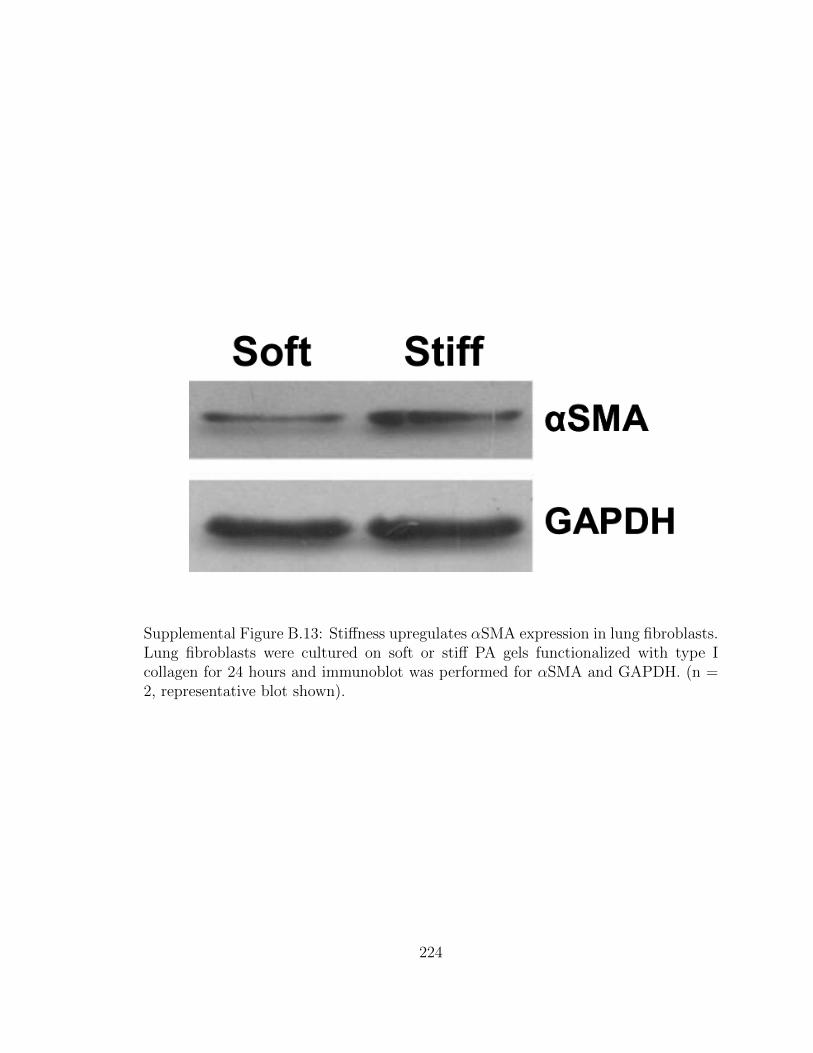
Supplemental Figure B.13: Stiffness upregulates αSMA expression in lung fibroblasts.Lung fibroblasts were cultured on soft or stiff PA gels functionalized with type Icollagen for 24 hours and immunoblot was performed for αSMA and GAPDH. (n =2, representative blot shown).
224
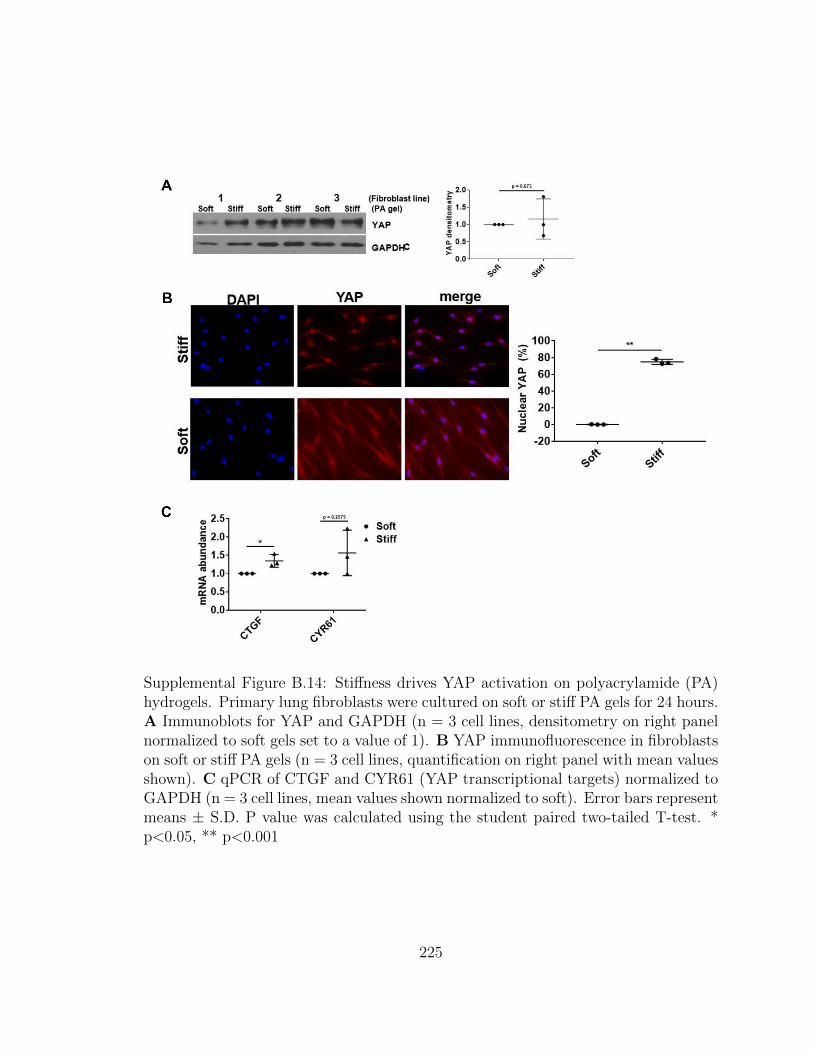
Supplemental Figure B.14: Stiffness drives YAP activation on polyacrylamide (PA)hydrogels. Primary lung fibroblasts were cultured on soft or stiff PA gels for 24 hours.A Immunoblots for YAP and GAPDH (n = 3 cell lines, densitometry on right panelnormalized to soft gels set to a value of 1). B YAP immunofluorescence in fibroblastson soft or stiff PA gels (n = 3 cell lines, quantification on right panel with mean valuesshown). C qPCR of CTGF and CYR61 (YAP transcriptional targets) normalized toGAPDH (n = 3 cell lines, mean values shown normalized to soft). Error bars representmeans ± S.D. P value was calculated using the student paired two-tailed T-test. *p<0.05, ** p<0.001
225
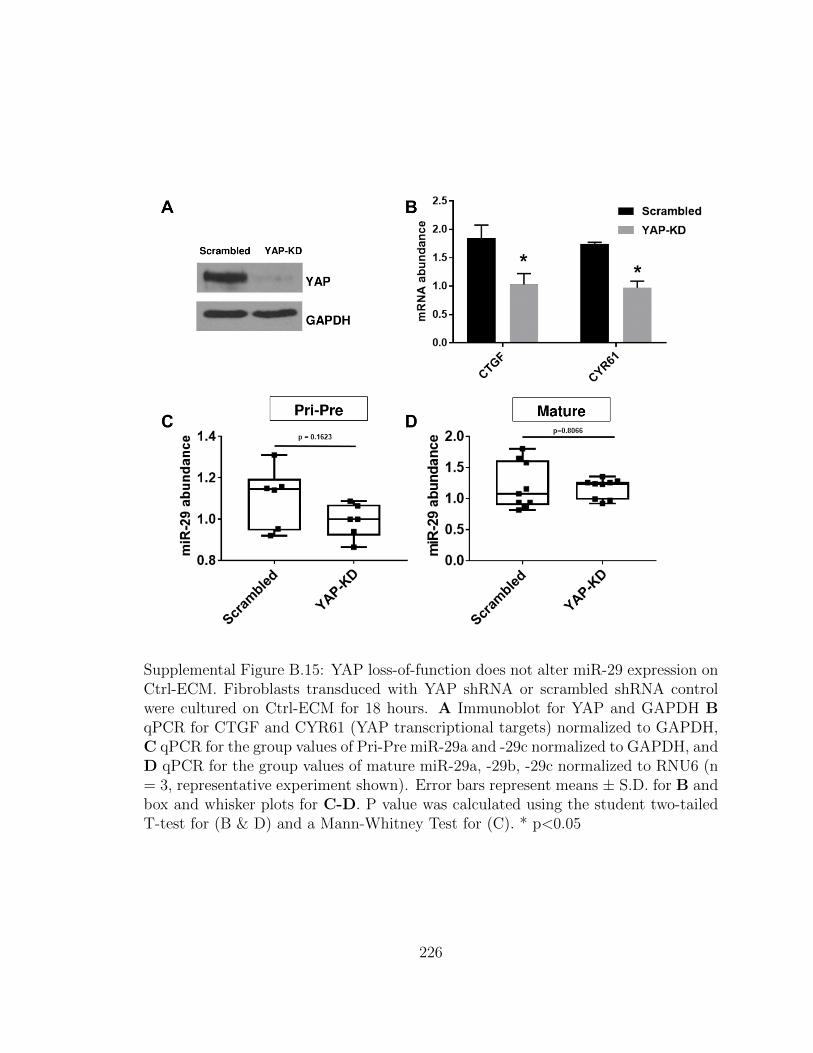
Supplemental Figure B.15: YAP loss-of-function does not alter miR-29 expression onCtrl-ECM. Fibroblasts transduced with YAP shRNA or scrambled shRNA controlwere cultured on Ctrl-ECM for 18 hours. A Immunoblot for YAP and GAPDH BqPCR for CTGF and CYR61 (YAP transcriptional targets) normalized to GAPDH,C qPCR for the group values of Pri-Pre miR-29a and -29c normalized to GAPDH, andD qPCR for the group values of mature miR-29a, -29b, -29c normalized to RNU6 (n= 3, representative experiment shown). Error bars represent means ± S.D. for B andbox and whisker plots for C-D. P value was calculated using the student two-tailedT-test for (B & D) and a Mann-Whitney Test for (C). * p<0.05
226
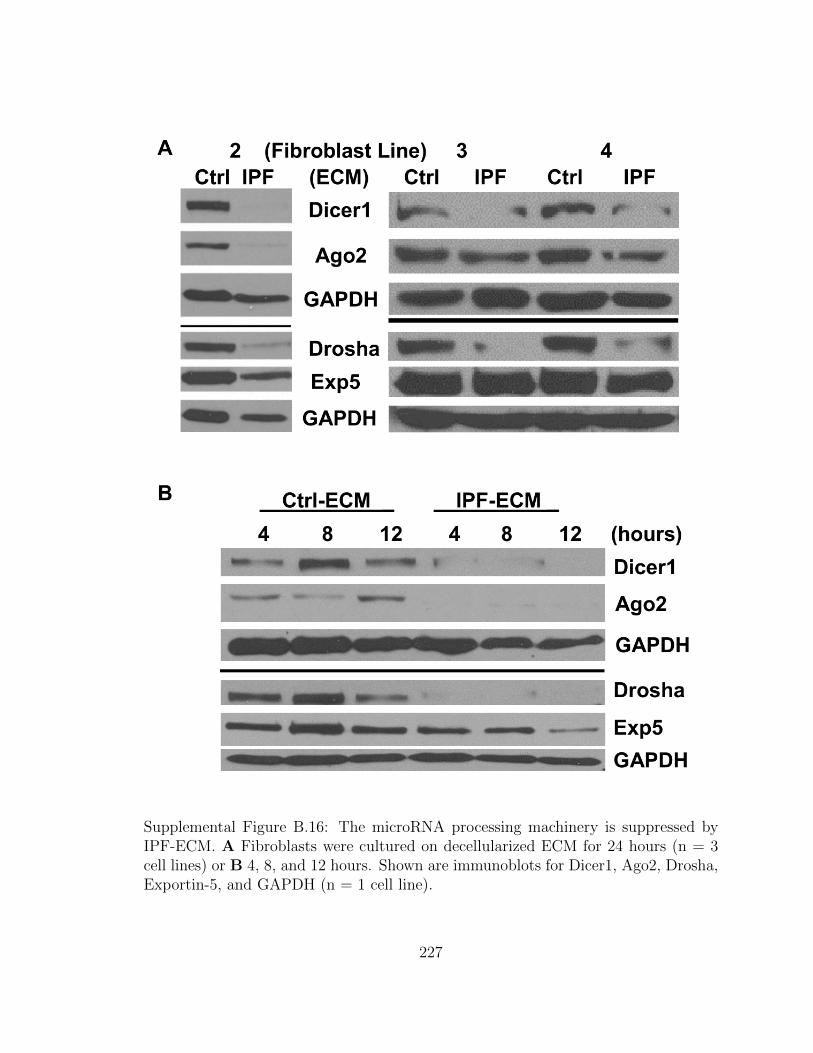
Supplemental Figure B.16: The microRNA processing machinery is suppressed byIPF-ECM. A Fibroblasts were cultured on decellularized ECM for 24 hours (n = 3cell lines) or B 4, 8, and 12 hours. Shown are immunoblots for Dicer1, Ago2, Drosha,Exportin-5, and GAPDH (n = 1 cell line).
227

Supplemental Figure B.17: Non-canonical microRNA expression in fibroblasts cul-tured on ECM. Lung fibroblasts were cultured on ECM for 18 hours and qPCR per-formed for mature miR-320a, -451, and -484 normalized to RNU6 (n = 2 cell lines,representative experiment shown). Error bars represent means ± S.E.M. P value wascalculated using the student two-tail T-test (n.s. = not significant). * p<0.05
228

Supplemental Figure B.18: Stiffness does not alter the microRNA processing machin-ery. Primary lung fibroblasts were cultured on soft or stiff PA gels coated with typeI collagen for 24 hours. (a) Immunoblot for Dicer1, Ago2, Drosha, Exportin-5, andGAPDH (n = 3 cell lines, indicated as 1, 2, or 3). (b) Primary lung fibroblasts werecultured on PA gels for the times indicated. Immunoblot for Dicer1, Ago2, Drosha,Exportin-5, and GAPDH (n = 1 cell line).
229
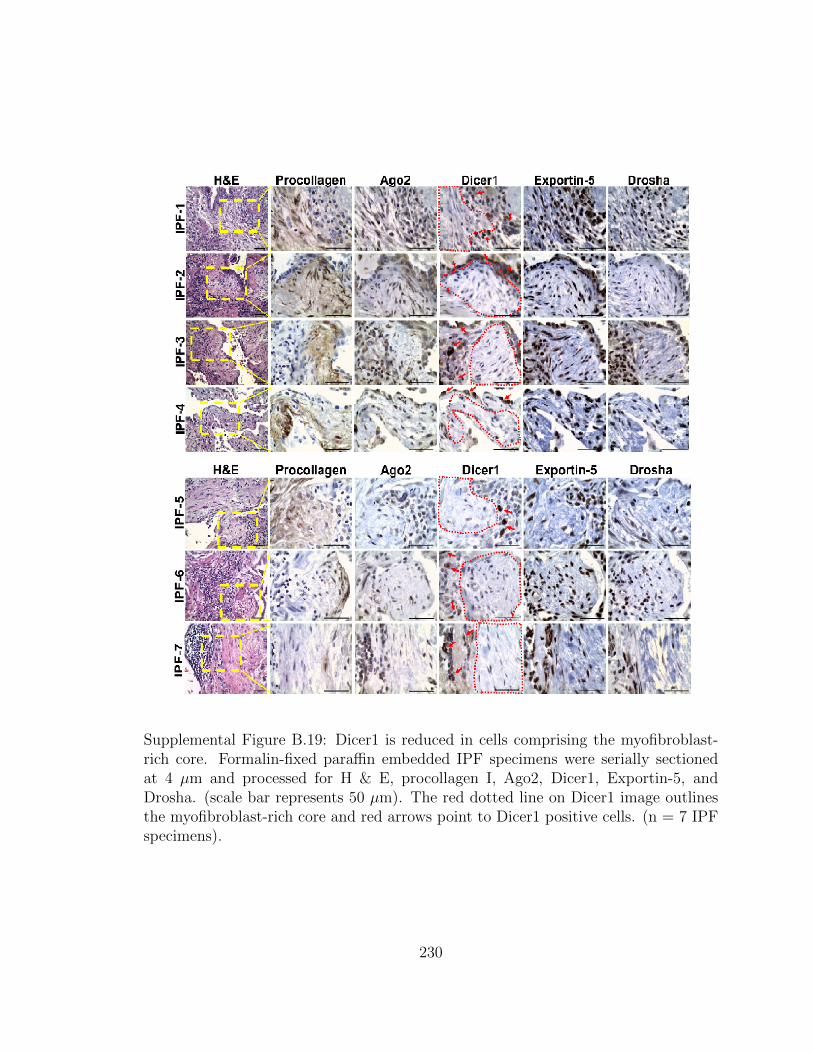
Supplemental Figure B.19: Dicer1 is reduced in cells comprising the myofibroblast-rich core. Formalin-fixed paraffin embedded IPF specimens were serially sectionedat 4 µm and processed for H & E, procollagen I, Ago2, Dicer1, Exportin-5, andDrosha. (scale bar represents 50 µm). The red dotted line on Dicer1 image outlinesthe myofibroblast-rich core and red arrows point to Dicer1 positive cells. (n = 7 IPFspecimens).
230
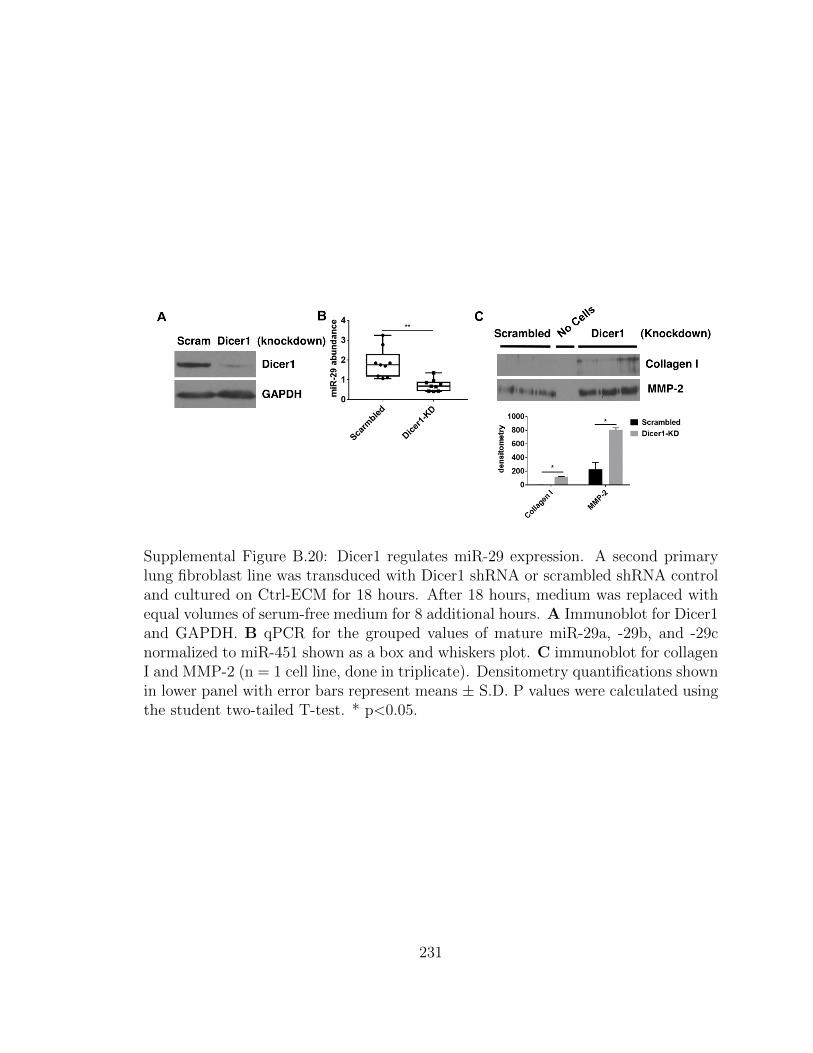
Supplemental Figure B.20: Dicer1 regulates miR-29 expression. A second primarylung fibroblast line was transduced with Dicer1 shRNA or scrambled shRNA controland cultured on Ctrl-ECM for 18 hours. After 18 hours, medium was replaced withequal volumes of serum-free medium for 8 additional hours. A Immunoblot for Dicer1and GAPDH. B qPCR for the grouped values of mature miR-29a, -29b, and -29cnormalized to miR-451 shown as a box and whiskers plot. C immunoblot for collagenI and MMP-2 (n = 1 cell line, done in triplicate). Densitometry quantifications shownin lower panel with error bars represent means ± S.D. P values were calculated usingthe student two-tailed T-test. * p<0.05.
231

Supplemental Figure B.21: Fibroblasts deficient in Dicer1 form large lesions in thelungs of mice after 13 days post-injection. A mouse lung specimen from Figure 8 wassectioned at 100 µm intervals and stained for trichrome and human procollagen I.Shown is one fibrotic lesion marked by human procollagen I reactivity (black arrow)spanning 300 µm of tissue. Scale bar = 200 µm.
232
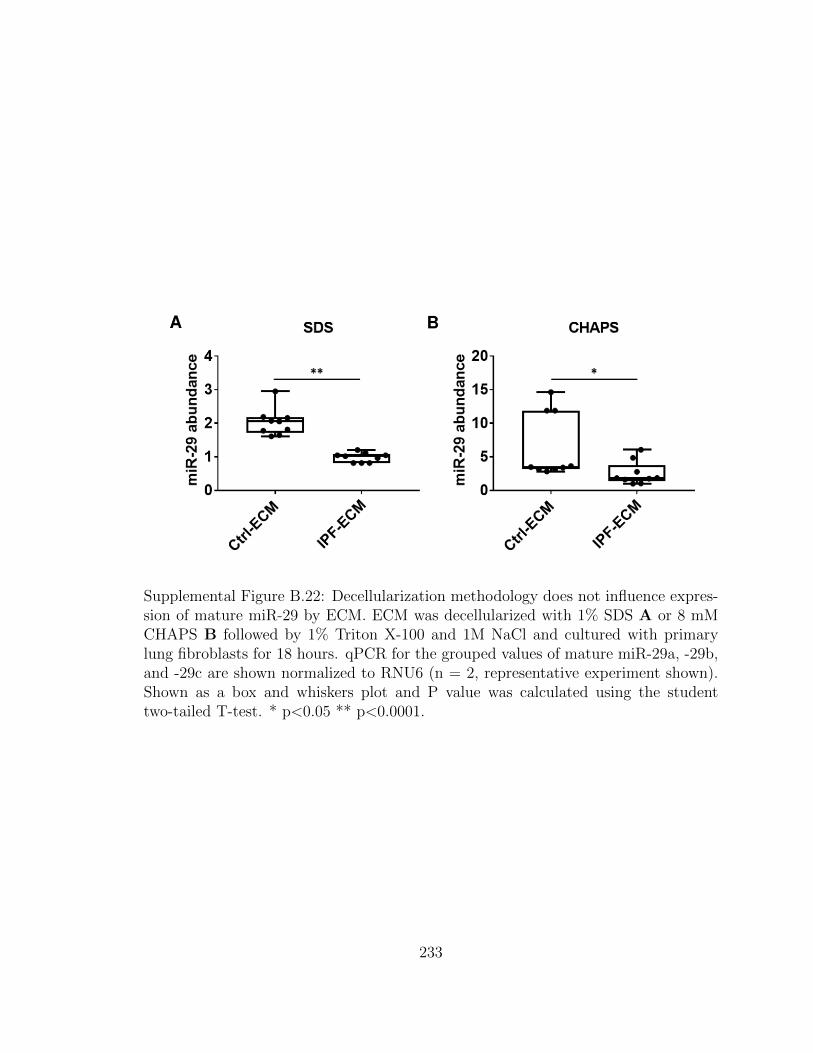
Supplemental Figure B.22: Decellularization methodology does not influence expres-sion of mature miR-29 by ECM. ECM was decellularized with 1% SDS A or 8 mMCHAPS B followed by 1% Triton X-100 and 1M NaCl and cultured with primarylung fibroblasts for 18 hours. qPCR for the grouped values of mature miR-29a, -29b,and -29c are shown normalized to RNU6 (n = 2, representative experiment shown).Shown as a box and whiskers plot and P value was calculated using the studenttwo-tailed T-test. * p<0.05 ** p<0.0001.
233
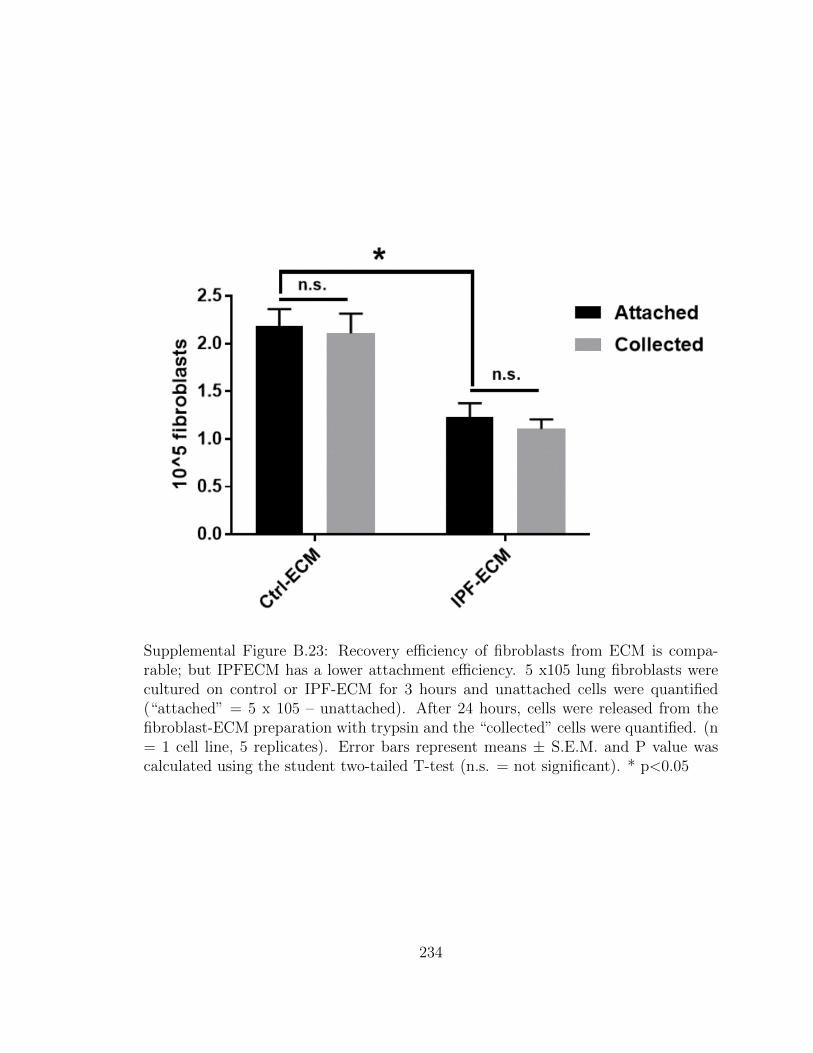
Supplemental Figure B.23: Recovery efficiency of fibroblasts from ECM is compa-rable; but IPFECM has a lower attachment efficiency. 5 x10⁵ lung fibroblasts werecultured on control or IPF-ECM for 3 hours and unattached cells were quantified(“attached” = 5 x 10⁵ – unattached). After 24 hours, cells were released from thefibroblast-ECM preparation with trypsin and the “collected” cells were quantified. (n= 1 cell line, 5 replicates). Error bars represent means ± S.E.M. and P value wascalculated using the student two-tailed T-test (n.s. = not significant). * p<0.05
234

Supplemental Figure B.24: Lung fibroblasts proliferate on decellularized ECM. Lungfibroblasts cultured in either survival or growth medium were pulsed with BrdU for24 hours, formalin-fixed and paraffin embedded. A 3-day time-course of percentBrdU positive cells, B representative images of ECM on day 3 with (lower panels) orwithout (upper panels) fibroblasts (n = 1; scale bars represent 50 µm).
235
Related Documents