DOCUMENT RESUME ED 422 268 SP 037 546 AUTHOR Persichitte, Kay A.; Tharp, Donald D.; Caffarella, Edward P. TITLE The Use of Technology by Schools, Colleges and Departments of Education, 1996. SPONS AGENCY American Association of Colleges for Teacher Education, Washington, DC. PUB DATE 1997-05-08 NOTE 38p. PUB TYPE Reports Evaluative (142) EDRS PRICE MF01/PCO2 Plus Postage. DESCRIPTORS Computer Literacy; *Computer Uses in Education; Elementary Secondary Education; Faculty; Higher Education; Internet; *Preservice Teacher Education; *Technology IDENTIFIERS *Technology Utilization ABSTRACT Access to technology and the effective use of technology within schools, colleges, and departments of education (SCDEs) provide future teachers with the tools to meet the challenges of the classroom. As a part of the AACTE/NCATE Joint Data Collection Survey, 466 SCDEs participated in a technology survey. The results of the survey are reported in this paper in two sections. The first section analyzes the Innovation Component Configuration Maps (ICCMs), resulting in three categories concerned with student use of technology, faculty use of technology, and institutional capacity. The second section describes and analyzes the last five items of the survey: SCDE student access to computers, description of infrastructure and reported levels of use, technology funding for SCDEs, SCDE faculty/17tra.tion computers, Internet connections and required computer purchase, and tialIi=tinle,-scLu:7,--:nt9 and faculty. The report concludes that there is use and potential use of tedhnol SCDEs,.but that there are some areas for improvement: too few students are ekip3.Z.t: technology to share information in the campus classroom settings and most students do not use SCDE Web sites to obtain assignments. The study contains 18 figures in section one and 9 graphs and 10 tables in section two. An appendix contains the SCDE Technology Survey. (Contains 17 references.) (SPM) ******************************************************************************** Reproductions supplied by EDRS are the best that can be made from the original document. ********************************************************************************

Welcome message from author
This document is posted to help you gain knowledge. Please leave a comment to let me know what you think about it! Share it to your friends and learn new things together.
Transcript

DOCUMENT RESUME
ED 422 268 SP 037 546
AUTHOR Persichitte, Kay A.; Tharp, Donald D.; Caffarella, Edward P.TITLE The Use of Technology by Schools, Colleges and Departments
of Education, 1996.SPONS AGENCY American Association of Colleges for Teacher Education,
Washington, DC.PUB DATE 1997-05-08NOTE 38p.
PUB TYPE Reports Evaluative (142)EDRS PRICE MF01/PCO2 Plus Postage.DESCRIPTORS Computer Literacy; *Computer Uses in Education; Elementary
Secondary Education; Faculty; Higher Education; Internet;*Preservice Teacher Education; *Technology
IDENTIFIERS *Technology Utilization
ABSTRACTAccess to technology and the effective use of technology
within schools, colleges, and departments of education (SCDEs) provide futureteachers with the tools to meet the challenges of the classroom. As a part ofthe AACTE/NCATE Joint Data Collection Survey, 466 SCDEs participated in atechnology survey. The results of the survey are reported in this paper intwo sections. The first section analyzes the Innovation ComponentConfiguration Maps (ICCMs), resulting in three categories concerned withstudent use of technology, faculty use of technology, and institutionalcapacity. The second section describes and analyzes the last five items ofthe survey: SCDE student access to computers, description of infrastructureand reported levels of use, technology funding for SCDEs, SCDEfaculty/17tra.tion computers, Internet connections and required computerpurchase, and tialIi=tinle,-scLu:7,--:nt9 and faculty. The report concludes thatthere is use and potential use of tedhnol SCDEs,.but that thereare some areas for improvement: too few students are ekip3.Z.t:technology to share information in the campus classroom settings and moststudents do not use SCDE Web sites to obtain assignments. The study contains18 figures in section one and 9 graphs and 10 tables in section two. Anappendix contains the SCDE Technology Survey. (Contains 17 references.) (SPM)
********************************************************************************
Reproductions supplied by EDRS are the best that can be madefrom the original document.
********************************************************************************
The Use of Technology bySchools, Colleges, and Departments of Education 1996
Kay A. PersichitteDonald D. Tharp
Edward P. CaffarellaUniversity of Northern Colorado
A Report to theAmerican Association of Colleges for Teacher Education
and theResearch and Information Committee
© 8 May 1997
21
PERMISSION TO REPRODUCE ANDDISSEMINATE THIS MATERIAL HAS
BEEN GRANTED BY
D-ANNA;
TO THE EDUCATIONAL RESOURCESINFORMATION CENTER (ERIC)
U.S. DEPARTMENT OF EDUCATIONOffice of Educational Research and ImprovementEDUCATIONAL RESOURCES INFORMATION
CENTER (ERIC)
0 This document has been reproduced asreceived from the person or organizationoriginating it.0 Minor changes have been made to improve
reproduCriOn Quality..
Points of view or opinions stated in this docmenl do not necessarily represent officialOERI position Or policy.
Table of Contents
The use of technology
Page
Introduction . 6
The Innovation Component Configuration Maps 6
Student Use of Technology . . . . . . . 6Figure 1: Percentage of SCDEs reporting each variation for ICCM number 1 7Figure 2: Percentage of SCDEs reporting each variation for ICCM number 2 7Figure 3: Percentage of SCDEs reporting each variation for ICCM number 3 8Figure 4: Percentage of SCDEs reporting each variation for ICCM number 4 9Figure 5: Percentage of SCDEs reporting each variation for ICCM number 5 9Figure 6: Percentage of SCDEs reporting each variation for ICCM number 6 9Figure 7: Percentage of SCDEs reporting each variation for ICCM number 7 10
Faculty Use of Technology . 10
Figure 8: Percentage of SCDEs reporting each variation for ICCM number 8 10Figure 9: Percentage of SCDEs reporting each variation for ICCM number 9 11Figure 10: Percentage of SCDEs reporting each variation for ICCM number 10 11Figure 11: Percentage of SCDEs reporting each variation for ICCM number 11 12Figure 12: Percentage of SCDEs reporting each variation for ICCM number 12 12Figure 13: Percentage of SCDEs reporting each variation for ICCM number 13 13
Institutional Capacity . 13
Figure 14: Percentage of SCDEs reporting each variation for ICCM number 14 13Figure 15: Percentage of SCDEs reporting each variation for ICCM number 15 14Figure 16: Percentage of SCDEs reporting each variation for ICCM number 16 14Figure 17: Percentage of SCDEs reporting each variation for ICCM number 17 15Figure 18: Percentage of SCDEs reporting each variation for ICCM number 18 15
Typical SCDEs 16
SCDE Student Access to Computers 17
Graph 1: Average Total Computers Available for SCDE Student Use by AAC1ERegion . 18
Graph 2: Average Total Computer Labs Available for SCDE Student Use byAAC1E Region . 18
Graph 3: Average Total Computers Available for SCDE Student Use by Typeof Affiliation . 19
Table 1: Average Total Computers for NCATE Institutions 20
Graph 4: Average Total Computers for NCATE Institutions by AAC1b Region 20

The use of technology
Table of Contents (continued)
Page
Description of Infrastructure and Reported Levels of Use . 20
Table 2: Reported Institutional Users and Infrastructure by AAC1E RegionFaculty & Students, Faculty, Infrastructure, Students . 22
Table 3: Reported Institutional Users and Infrastructure by Type of AffiliationFaculty & Students, Faculty, Infrastructure, Students . . 22
Table 4: Reported Institutional Users and Infrastructure by NCATE AffiliationFaculty & Students, Faculty, Infrastructure, Students . . 23
Graph 5: Percentage of Faculty User Institutions for NCATE Affiliates byAACTE Region . . 23
Graph 6: Percentage of Institutions with Adequate Infrastructure for NCATEAffiliates by AACrE Region . 23
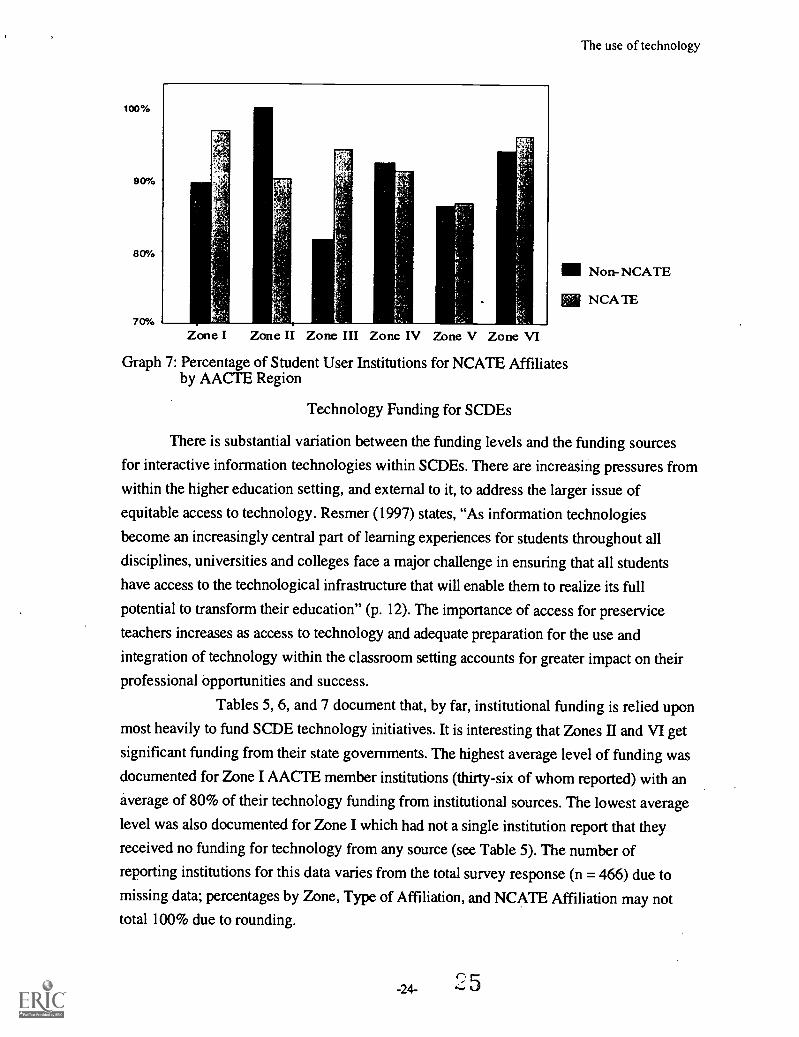
Graph 7: Percentage of Student User Institutions for NCATE Affiliatesby AAC1E Region . 24
Technology Funding for SCDEs . 24
Table 5: Average Percent of Funding for Technology in SCDEs by AAC1ERegion & Source . . 25
Table 6: Average Percent of Funding for Technology in SCDEs by Type ofAffiliation & Source . . . 26
Table 7: Average Percent of Funding for Technology in NCATE SCDEs bySource . 26
SCDE Faculty/Administration Computers 26
Table 8: Summary of Faculty/Administration Computers by AACTERegion . 27
Table 9: Summary of Faculty/Administration Computers by NCATEInstitutions . 28
Internet Connections and Required Computer Purchase . 28
Table 10: Summary of Computers Available in SCDE Computer Labs by Typeof Affiliation, Faculty & Administration Connections to theInternet,Required Computer Purchase, and Total Computer Labs . 29
Full-Time SCDE Students and Faculty . 29
Graph 8: Relationship of Full-Time SCDE Students to Total Available. Computers . 30
-3-
4
Table of Contents (continued)
The use of technology
Page
Graph 9: Relationship of Full-Time SCDE Faculty to Total AvailableComputers . 30
Conclusion 30
References 33
Appendix: SCDE Technology Survey (JDCS-1996) . 35
-4- 5
The use of technology
ACKNOWLEDGMENTS
This research study was commissioned by the American Association of Colleges for
Teacher Education Research and Information Committee.
The authors wish to thank the Association and the members of the
Research and Information Committee for their support.
-5- 6

The use of technology
The Use of Technology bySchools, Colleges, and Departments of Education 1996
Introduction
During the fall of 1996 a technology survey was distributed as part of the
AACTE/NCATE Joint Data Collection Survey. This survey was sent to administrative units of
all AACTE and NCATE member institutions (744) responsible for teacher education programs.
These institutions are commonly referred to as Schools/Colleges/Departments of Education
(SCDEs). The technology survey consisted of twenty-three items. The first eighteen items were
Innovation Component Configuration Maps (ICCMs) for various technology innovations. The
remaining five items dealt with SCDE student access to computers, infrastructure and levels of
use, and technology funding levels. The first section of this report is an analysis of the ICCM
data from that survey. The eighteen items were divided into three categories concerned with
student use of technology, faculty use of technology, and institutional capacity. The second
section of this report is a description and analysis of survey items nineteen through twenty-three.
Usable responses were received from 466 SCDEs; a 63% return rate.
The Innovation Component Configuration Maps
Each ICCM contained three to four variations of the use of a specific technology
innovation. The innovation configurations were designed to address concerns raised by the
Office of Technology Assessment (OTA) report (1995) related to preservice teacher education
and technology use, as well as the recent research related to technology use in institutions of
higher education (Green, 1997, 1996; Green & Eastman, 1994). The variation to the extreme left
described the ideal variation of the innovation. Variations to the right described uses with
progressively less fidelity than the variations to the left. The data were collected and analyzed
across all responding SCDEs (n = 466). The individuals completing the survey were asked to
select the scenario which best described the majority (over 50%) of the SCDE faculty and/or
students (see Appendix).
Student Use of Technology
The first ICCM dealt with use of technology during the student teaching experience. The
responses to this ICCM are shown in Figure 1.

The use of technology
28%Students are required to design
41%Students are required to
31%Students have no requirements
& deliver instruction during demonstrate their use of at to incorporate technologystudent teaching which least one technology during within their instruction duringincorporates various student teaching. student teaching.technologies.
Figure 1: Percentage of SCDEs reporting each variation for ICCM number 1.
At 28% of the SCDEs, students are required to design and deliver instruction which
incorporates various technologies during the student teaching experience. At another 41%
of the SCDEs, the students must demonstrate their use of at least one technology.
Approximately 31% of the SCDEs do not require their student teachers to incorporate
technology in their student teaching instruction. The two extremes represent a somewhat
bipolar distribution with some student teachers required to incorporate a great deal of
technology and others not required to incorporate any technology.
The importance of contextualized practice is a given for professional educational
technologists who design and/or implement preservice teacher education curricula in the use
and integration of technology. In a 1996 report, the National Commission on Teaching and
America's Future (NCTAF) states, "Key elements of teacher learning are disconnected
from each other. Coursework is separate from practice teaching; professional skills are
segmented into separate courses..." (p. 32). Clearly, when a third of the preservice
students are not required to incorporate the use of technology within their student teaching,
the concern of the NCTAF is supported for technology use and integration.
The second ICCM dealt with students taking a required course on computer use,
application, communication, and instructional integration. The results from this ICCM are
shown in Figure 2.
61% 24% 15%Students are required to take a Students are required to take a Students have no coursecourse(s) on computer use,applications, communications,
course(s) on computerapplications.
requirements in technology.
& instructional integration.
Figure 2: Percentage of SCDEs reporting each variation for ICCM number 2.
Eighty-five percent of the responding SCDEs require students to take a course on
computer applications. For 61% of the SCDEs, this course includes the integration of
computer use and applications within instructional activities. This clearly shows that the
vast majority of institutions are providing a course on the use of computers in educational
settings and requiring their students to take the course. In a dissertation study generated
from the 1996 SCDE Technology Survey, Tharp (in press) notes, "...SCDEs bear the

The use of technology
responsibility for providing instruction for preservice teachers which facilitates the
integration of information technologies within their future classrooms and professional
lives" (p. 35). Responses to this innovation configuration indicate that most preservice
students are studying in programs which recognize the importance of developing
technology skills among future educators.
The third ICCM dealt with student use of technology during the on campus portion
of their program. The results from this ICCM are shown in Figure 3.
40% 50% 10%Students are required to design Students are required to Students have no requirements& deliver instruction on demonstrate their use of at to incorporate technologycampus incorporating various least one technology on within their instruction ontechnologies, campus. campus.
Figure 3: Percentage of SCDEs reporting each variation for ICCM number 3.
Students at 40% of SCDEs are required during the on campus part of their program
to design and deliver instruction which incorporates technology. Students at half of the
institutions are required to demonstrate the use of at least one technology during their on
campus classes. These trends for on campus classes are positive. These percentages do
not, however, extend into the student teaching experience as described in ICCM number 1
(see Figure 1). While on campus, 40% of the SCDEs have students designing and
delivering technology rich instruction but during student teaching this number drops to
28%. The utilization and classroom integration of technology can be expected to drop
further when these students become full-time teachers. Willis and Mehlinger (1996) agree
that most teacher preparation programs include courses which emphasize fundamental
computer operation and basic educational uses, but they argue that few programs actively
explore the integration of those technologies within methods courses and student teaching,
and that even fewer have designed a curriculum which integrates technology throughout
preservice professional development. SCDEs must consider the need to identify and
implement instructional strategies within required preparation coursework which scaffolds
technology skill development for their students and which offer SCDE students multiple
opportunities for contextualized practice.
The fourth ICCM dealt with the use of various technologies to share information in
the classroom. The results from this ICCM are shown in Figure 4.
-8- 9
The use of technology
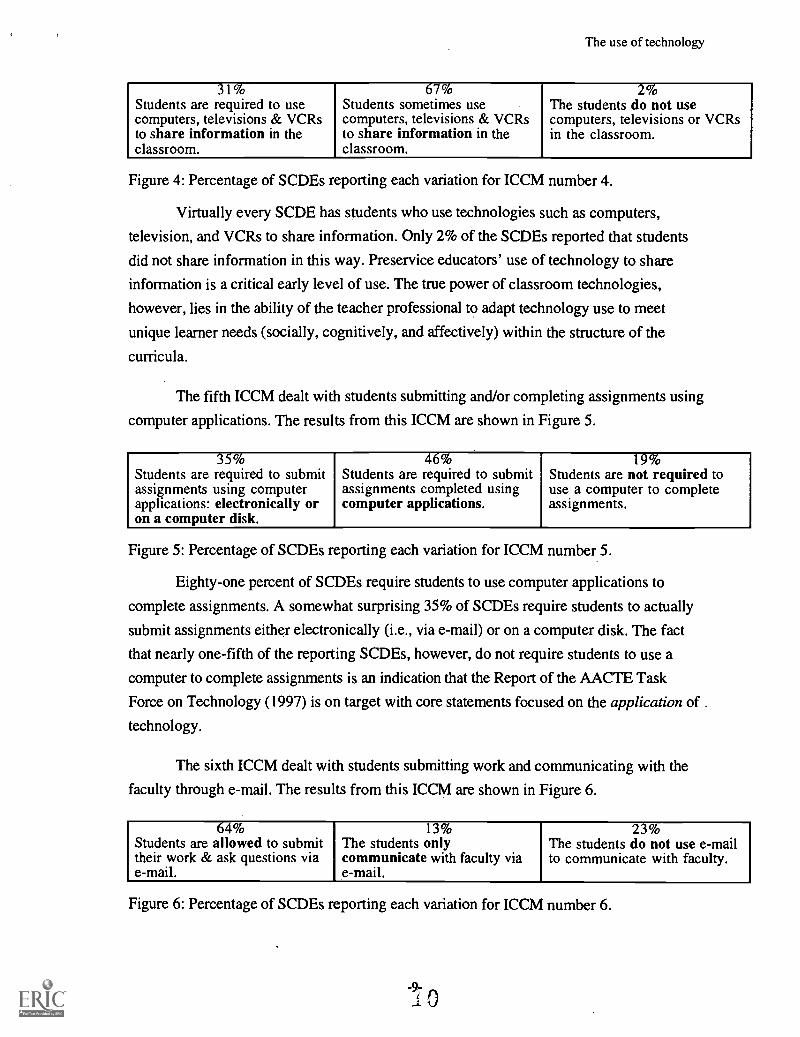
31% 67% 2%Students are required to use Students sometimes use The students do not usecomputers, televisions & VCRs computers, televisions & VCRs computers, televisions or VCRsto share information in the to share information in the in the classroom.classroom. classroom.
Figure 4: Percentage of SCDEs reporting each variation for ICCM number 4.
Virtually every SCDE has students who use technologies such as computers,
television, and VCRs to share information. Only 2% of the SCDEs reported that students
did not share information in this way. Preservice educators' use of technology to share
information is a critical early level of use. The true power of classroom technologies,
however, lies in the ability of the teacher professional to adapt technology use to meet
unique learner needs (socially, cognitively, and affectively) within the structure of the
curricula.
The fifth ICCM dealt with students submitting and/or completing assignments using
computer applications. The results from this ICCM are shown in Figure 5.
35% 46% 19%Students are required to submit Students are required to submit Students are not required toassignments using computer assignments completed using use a computer to completeapplications: electronically oron a computer disk.
computer applications, assignments.
Figure 5: Percentage of SCDEs reporting each variation for ICCM number 5.
Eighty-one percent of SCDEs require students to use computer applications to
complete assignments. A somewhat surprising 35% of SCDEs require students to actually
submit assignments either electronically (i.e., via e-mail) or on a computer disk. The fact
that nearly one-fifth of the reporting SCDEs, however, do not require students to use a
computer to complete assignments is an indication that the Report of the AACTE Task
Force on Technology (1997) is on target with core statements focused on the application of .
technology.
The sixth ICCM dealt with students submitting work and communicating with the
faculty through e-mail. The results from this ICCM are shown in Figure 6.
64% 13% 23%Students are allowed to submit The students only The students do not use e-mailtheir work & ask questions via communicate with faculty via to communicate with faculty.e-mail. e-mail.
Figure 6: Percentage of SCDEs reporting each variation for ICCM number 6.

The use of technology
Also somewhat surprising, students at 77% of the responding SCDEs use e-mail to
communicate with faculty members. Students at 64% of the responding institutions are also
allowed to submit their work via e-mail. Equally surprising, students at 23% of the
institutions do not use e-mail to communicate with faculty members. This is an area of
access and utilization which deserves attention so that all SCDE students have the
alternative to communicate with the faculty via e-mail. There is also a serious need for
SCDE students to see creative, appropriate instructional uses of technology modeled within
their preparatio. n programs.
The seventh ICCM dealt with the use of, and access to, the SCDE Web server. The
results from this ICCM are shown in Figure 7.
26% 55% 20%Students may obtain Students do not use a SCDE Students do not have access toassignments & syllabi from a Web site to obtain assignments a SCDE Web server.SCDE Web site. & syllabi.
Figure 7: Percentage of SCDEs reporting each variation for ICCM number 7.
At 26% of SCDEs, students may obtain assignments and course syllabi from the
SCDE World Wide Web (WWW) site. This is an amazingly high percentage of adopters
given that the WWW, in a real usable form, is only about twenty-four months old. Equally
amazing is the fact that only 20% of institutions do not have access to an SCDE World
Wide Web (WWW) site. While these figures are most impressive, once this baseline level
of use has been established, the more important issue becomes the type of use(s) of the
technology, not the amount.
Faculty Use of Technology
The eighth ICCM dealt with faculty use of computers, televisions, and VCRs as
interactive instructional tools. The results from this ICCM are shown in Figure 8.
45% 53% 1%The faculty regularly uses The faculty occasionally uses The faculty does not usecomputers, televisions & VCRs some electronic technology to electronic technology duringas interactive instructionaltools during class periods,
present information duringclass periods.
class periods,
Figure 8: Percentage of SCDEs reporting each variation for ICCM number 8.
Faculty members at 45% of the SCDEs regularly use computers, televisions, and
VCRs as interactive instructional tools during class periods. Faculty members at another
53% of SCDEs occasionally use some electronic technology to present information during
The use of technology
class periods. Faculty members at only 1% of SCDEs do not use electronic technology
during class. These figures are particularly encouraging as the current literature continues to
stress the importance of the use and modeling of multiple technologies by higher education
faculty responsible for the preparation of future teachers (e.g., Awbrey, 1996; OTA, 1995;
Willis & Mehlinger, 1996).
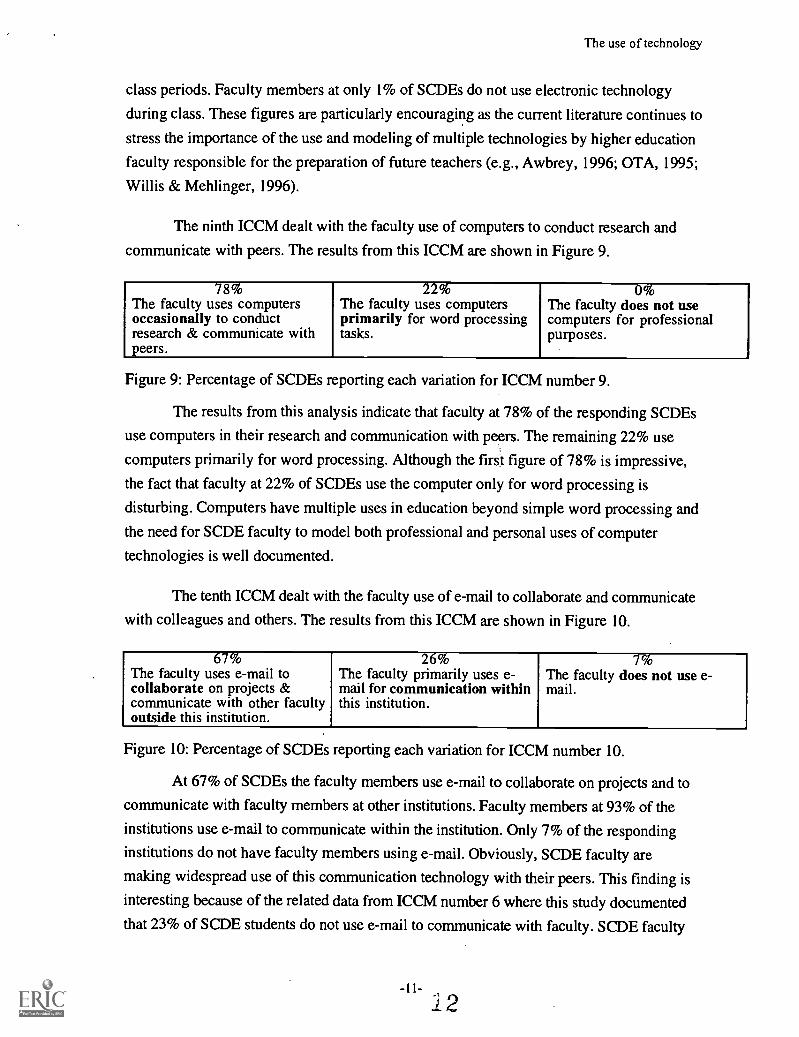
The ninth ICCM dealt with the faculty use of computers to conduct research and
communicate with peers. The results from this ICCM are shown in Figure 9.
78% 22% 0%The faculty uses computers The faculty uses computers The faculty does not useoccasionally to conduct primarily for word processing computers for professionalresearch & communicate withpeers.
tasks. purposes.
Figure 9: Percentage of SCDEs reporting each variation for ICCM number 9.
The results from this analysis indicate that faculty at 78% of the responding SCDEs
use computers in their research and communication with peers. The remaining 22% use
computers primarily for word processing. Although the first figure of 78% is impressive,
the fact that faculty at 22% of SCDEs use the computer only for word processing is
disturbing. Computers have multiple uses in education beyond simple word processing and
the need for SCDE faculty to model both professional and personal uses of computer
technologies is well documented.
The tenth ICCM dealt with the faculty use of e-mail to collaborate and communicate
with colleagues and others. The results from this ICCM are shown in Figure 10.
67% 26% 7%The faculty uses e-mail to The faculty primarily uses e- The faculty does not use e-collaborate on projects & mail for communication within mail.communicate with other facultyoutside this institution.
this institution.
Figure 10: Percentage of SCDEs reporting each variation for ICCM number 10.
At 67% of SCDEs the faculty members use e-mail to collaborate on projects and to
communicate with faculty members at other institutions. Faculty members at 93% of the
institutions use e-mail to communicate within the institution. Only 7% of the responding
institutions do not have faculty members using e-mail. Obviously, SCDE faculty are
making widespread use of this communication technology with their peers. This finding is
interesting because of the related data from ICCM number 6 where this study documented
that 23% of SCDE students do not use e-mail to communicate with faculty. SCDE faculty

The use of technology
should be encouraged to consider alternatives for the use of e-mail to support
peer/instructor interactions and communication.
The eleventh ICCM dealt with the faculty use of the SCDE Web server. The results
from this ICCM are shown in Figure 11.
20% 24% 37% 19%The faculty uses the The faculty uses the The faculty does not No SCDE Web SiteSCDE Web site todisplay articles, articleabstracts & vitae,
SCDE Web site todisplay personalinformation only.
use the SCDE Web site.
Figure 11: Percentage of SCDEs reporting each variation for ICCM number 11.
Faculty members at 44% of SCDEs use the SCDE WWW site to display personal
information. Twenty percent of institutions have faculty members using the WWW site to
display articles, abstracts, and vitae. At 37% of the institutions, the faculty does not use the
SCDE WWW site. Nineteen percent of the responding institutions do not have an SCDE
Web site. A number of surveys, however, had margin notes which stated plans for Web
site development. This is a critical area for improvement in SCDEs.
The twelfth ICCM dealt with the faculty use of the World Wide Web to search for
articles, abstracts, and personal information. The results from this ICCM are shown in
Figure 12.
87% 0% 8% 4%The faculty uses the The faculty uses the The faculty does not No Internet HookupWorld Wide Web to World Wide Web to use the World Widesearch for articles,article abstracts &vitae.
search for personalinformation only.
Web.
Figure 12: Percentage of SCDEs reporting each variation for ICCM number 12.
At 87% of the institutions, faculty members use the World Wide Web to search for
articles and abstracts. Faculty members at 8% of SCDEs do not use the World Wide Web.
Only 4% of the institutions report that their faculty members do not have an Internet
hookup. In a study of 660 two-year and four-year colleges and universities across the
United States, Green (1997) found that Internet/WWW access rated the top priority in
ranking issues related to networking and groupware across institutions of higher education
(6.5 on a scale of 1 "Not Important" to 7 "Very Important"). It is interesting to note that the
percentage of SCDEs with faculty who do not use e-mail (7%; see Figure 10) is quite close
to the percentage of SCDEs with faculty who do not use the WWW (8%).
The use of technology
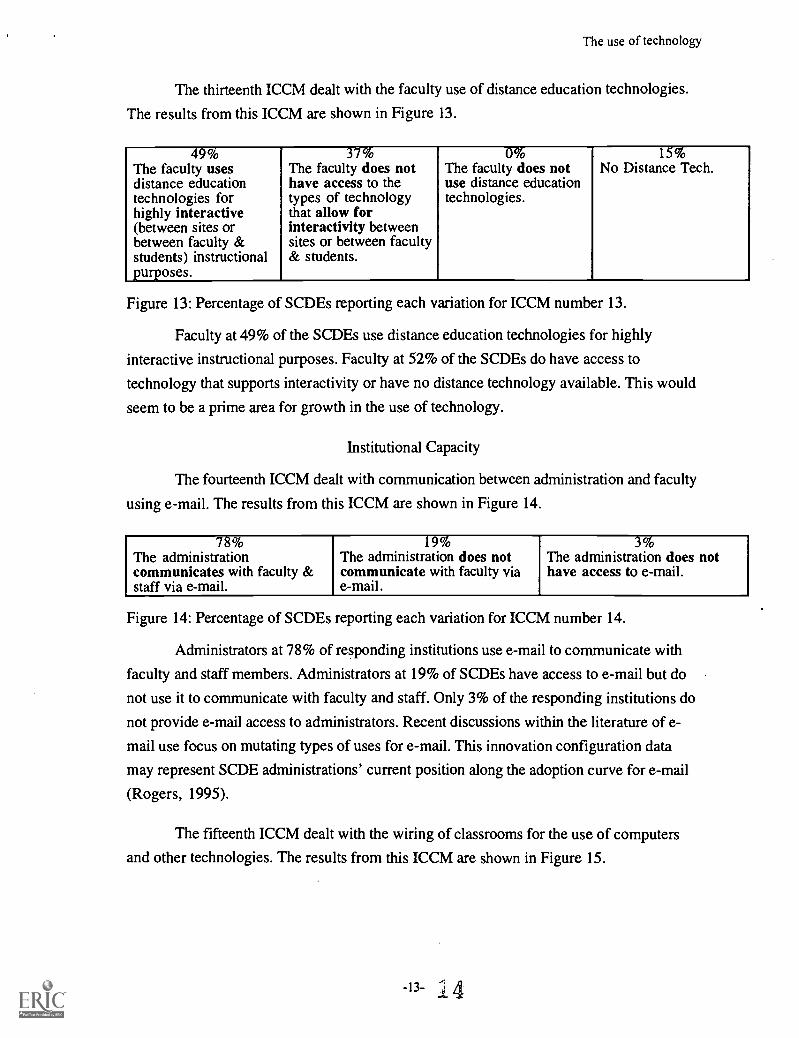
The thirteenth ICCM dealt with the faculty use of distance education technologies.
The results from this ICCM are shown in Figure 13.
49% 37% 0% 15%The faculty uses The faculty does not The faculty does not No Distance Tech.distance education have access to the use distance educationtechnologies forhighly interactive(between sites orbetween faculty &students) instructionalpurposes.
types of technologythat allow forinteractivity betweensites or between faculty& students.
technologies.
Figure 13: Percentage of SCDEs reporting each variation for ICCM number 13.
Faculty at 49% of the SCDEs use distance education technologies for highly
interactive instructional purposes. Faculty at 52% of the SCDEs do have access to
technology that supports interactivity or have no distance technology available. This would
seem to be a prime area for growth in the use of technology.
Institutional Capacity
The fourteenth ICCM dealt with communication between administration and faculty
using e-mail. The results from this ICCM are shown in Figure 14.
78% 1 9% 3%The administration The administration does not The administration does notcommunicates with faculty & communicate with faculty via have access to e-mail.staff via e-mail. e-mail.
Figure 14: Percentage of SCDEs reporting each variation for ICCM number 14.
Administrators at 78% of responding institutions use e-mail to communicate with
faculty and staff members. Administrators at 19% of SCDEs have access to e-mail but do
not use it to communicate with faculty and staff. Only 3% of the responding institutions do
not provide e-mail access to administrators. Recent discussions within the literature of e-
mail use focus on mutating types of uses for e-mail. This innovation configuration data
may represent SCDE administrations' current position along the adoption curve for e-mail
(Rogers, 1995).
The fifteenth ICCM dealt with the wiring of classrooms for the use of computers
and other technologies. The results from this ICCM are shown in Figure 15.
-13-

The use of technology
42% 56% 2%Classrooms are wired for Classrooms have televisions & Classrooms have no computers,Internet, have televisions, VCRs VCRs available for instructional televisions or VCRs available& computers for instructionalpurposes.
purposes. for instructional purposes.
Figure 15: Percentage of SCDEs reporting each variation for ICCM number 15.
Forty-two percent of institutions report that classrooms are wired for Internet
access. Ninety-eight percent of institutions reported that they have classrooms with
televisions and video cassette recorders available for instructional purposes. Only 2% of
SCDEs do not have computers, televisions, or VCRs available for instructional purposes.
As previously noted, this ICCM documents the existence of instructional technologies in
SCDE classrooms, but leaves unanswered the more important question of how the
technologies are being integrated and embedded within preservice teacher preparation
curricula.
The sixteenth ICCM dealt with the delivery of instruction to off-site students using
interactive technologies. The results from this ICCM are shown in Figure 16.
26% 31% 30% 13%The SCDE delivers The SCDE delivers The SCDE does not No Distance Tech.instruction to off-site instruction to off-site deliver instruction tostudents usinginteractivetechnologies,
students usingcomputers, videos,text, or faculty travel.
off-site students.
Figure 16: Percentage of SCDEs reporting each variation for ICCM number 16.
Approximately 26% of SCDE institutions use interactive technologies to deliver
instruction to off-site students. Another 31% of institutions use computers, videos, text, or
faculty travel to deliver off-site instruction. Forty-three percent of institutions either do not
deliver instruction to off-site students or do not have distance technologies available. As
noted for ICCM number 13 (see Figure 13), the use of distance education technologies is a
prime area for growth in SCDE technology use.
The seventeenth ICCM dealt with the availability of the most advanced electronic
technologies and software applications. The results from this ICCM are shown in Figure
17 .
Only 57% of the institutions report that students have access to the most advanced
electronic technologies. Virtually all institutions provide students with access to basic word
processing, spreadsheet, and presentation software. Students at less than 1% of the
institutions do not have access to application software. As SCDEs utilize more technology
-14-
; 5

The use of technology
within their instruction and as public schools continue to seek improved efficiency and
effectiveness through the use and integration of technology, preservice students will have
greater needs for advanced technology skills beyond the basic applications such as word
processing.
57% 43% 1%Students have access to the Students have access to basic Students do not have access tomost advanced electronic word processing, spreadsheet & application software.technologies and softwareapplications.
presentation software.
Figure 17: Percentage of SCDEs reporting each variation for ICCM number 17.
The eighteenth ICCM dealt with the institutional plans for the purchase,
replacement, and upgrade of educational technologies. The results from this ICCM are
shown in Figure 18.
55% 38% 7%The institution has budgeted a The institution has a plan to The institution currently has noplan to purchase, replace & purchase & upgrade specific plan to purchase or upgradeupgrade a variety ofeducational technologies.
educational technologies, educational technologies.
Figure 18: Percentage of SCDEs reporting each variation for ICCM number 18.
Only 55% of the SCDEs have budgeted a plan to purchase, replace, and upgrade
technology. Another 38% of institutions have a plan for technology purchase and upgrade
but the plans do not have a supporting budget. With the rapid changes in technology the
lack of financial support for the plan is troublesome. This finding is even more troublesome
when linked with the previous finding that only slightly more than half of the responding
institutions provide students with access to the most advanced technologies (see Figure
17). Beneski and Waber emphasize the importance of keeping pace with the rapid change:
"The costs associated with providing essential technologies are exacerbated by the fact that
technology, in a very real sense, is a moving target. Over time, virtually all technology is
either in the process of maturing (i.e., improving) or in the process of aging (i.e., slipping
into obsolescence)" (p. 20). This study documents a critical need within most SCDEs to
upgrade hardware and software but acknowledges that the resources are not available for
this purpose. A parallel concern is related to the availability of resources (both technological
and human) necessary to support SCDE faculty use and integration of educational
technologies.

The use of technology
Typical SCDEs
The typical SCDE uses technology in a variety of different ways. The student at a
typical institution will take a required course on computer use, applications,
communications, and instructional integration. The student will demonstrate the use of at
least one technology both on campus and during student teaching. Some students have
access to the most advanced electronic technologies and software applications. Students
sometimes use computers, televisions and VCRs to share information in the classroom
setting. Students submit assignments completed using computer applications and may
submit their work via e-mail. Students do not use a SCDE Web site to obtain assignments
and syllabi.
The faculty at the typical SCDE occasionally use technology to present information
during class, to conduct research, and to communicate with peers. The faculty does use e-
mail to collaborate on projects and communicate with other faculty outside their institution.
The faculty does not use the SCDE Web site, but uses other World Wide Web sources to
search for information. The faculty uses distance education technologies for highly
interactive instructional purposes. The administrators at the typical SCDE communicate
with faculty and staff via e-mail. The SCDE classrooms have televisions and VCRs
available for instructional purposes. The typical SCDE delivers instruction to off-site
students using computers, videos, text, or faculty travel. The SCDE has a budgeted plan to
purchase, replace, and upgrade a variety of educational technologies, but acknowledges
serious concern for the funding of these plans.
The findings from this study of technology use by schools/colleges/departments of
education show both that teacher preparation programs are using contemporary
technologies and that there is need for improvement in the utilization of technology. Some
SCDEs are on the cutting edge of technology use while others are using very little
technology. For those SCDEs on the cutting edge, there is a continuing need to keep those
technologies on the cutting edge. Many SCDEs are already doing this, as evidenced by the
relatively large number of institutions using the new technologies of the World Wide Web.
These SCDEs must continue to struggle with hitting the moving target of improved learning
and teaching through the use of technology (Ely, 1996; National Council for Accreditation
of Teacher Education (NCATE), 1993). Those SCDEs using very little technology need to
make substantial improvements to provide adequate training for classroom teachers of the
twenty-first century. As evidence of the dramatic changes within our public schools, the
National Center for Education Statistics (NCES) (1997) reports that only 35% of all public
schools do not currently have access to the Internet, but 87% of these schools plan to
obtain access by the year 2000. The report also documents that 90% of the U.S. public
-16-
The use of technology
schools with Internet access had e-mail and 89% had access to the WWW. Ninety-four
percent of schools with WWW access made it available to teachers, 86% made it available
for the administration, and 74% made it available to students. The SCDEs which delay
entry into the arena of technological preparation of their students will fall further behind in
their ability to meet social, governmental, discipline-related, and workplace expectations for
future teachers.
SCDE Student Access to Computers
Respondents to the SCDE Technology Survey were asked to describe the types of
computers found in their labs, as well as the number of computer labs designated as SCDE
student labs. Some institutions were not able to identify SCDE student labs. The
researchers wish to note that many institutions reported there were multiple labs available
across the campus' for open use by SCDE students as well as others. Computer lab data is
reported only for those SCDEs which did not note that the labs described were for campus-
wide use. When appropriate, data is reported by AACTE Region* (Zones I through VI),
Type of Affiliation** (ACSESULGC/APU, AILACTE, TECSCU), and by institutions
which identified themselves as NCATE affiliates.
There are differences between several of the AACTE Regions when comparing both
the number of computers available and the total number of computer labs available for
SCDE student use. In both cases, Zone IV had higher means than all others. Means were
calculated across all reporting institutions (n = 466); not relative to the number of SCDE
students within each region (see Graphs 1 and 2).
*Zone I: CT, DE, DC, ME, MA, NH, NJ, NY, PA, RI, VTZone II: FL, GA, MD, MS, NC, PR, SC, VA, VIZone III: AR, IN, KY, OH, TN, WVZone IV: IL, IA, MI, MN, NE, ND, WIZone V: AL, LA, MO, OK, TXZone VI: AK, AZ, CA, CO, GU, HI, ID, KS, MT, NV, NM, OR, SD, UT, WA, WI
** ACSESULGC/APU: Association of Colleges and Schools of Education in StateUniversities and Land-Grant Colleges and Affiliated Private Universities
AILACTE: Association of Independent Liberal Arts Colleges for Teacher EducationTECSCU: Teacher Education Council of State Colleges and Universities

90
BO
AverageTotalComputers
70
60
50.
Zone I Zone II Zone III Zone IV Zone V ZoneVI
The use of technology
Graph 1: Average Total Computers Available for SCDE Student Use by AACTE Region
AverageTotalComputerLabs
3.4
3.2
3.0
26
2_8
2.4
Zone I Zone II Zone III Zone IV Zone V Zone VI
Graph 2: Average Total Computer Labs Available for SCDE Student Useby AAC11, Region
The comparison of average total computers for SCDE student use by AAC1E Type
of Affiliation are displayed in Graph 3. The Teacher Education Council of State Colleges
and Universities (TECSCU) SCDEs average about twenty-five more computers perinstitution than other affiliation types. Averages for the Association of Colleges and
Schools of Education in State Universities and Land-Grant Colleges and Affiliated Private
Universities (ACSESULGC/APU) and the Association of Independent Liberal Arts
Colleges for Teacher Education (AlLACM.) affiliates are not statistically different.
-18-

The use of technology
Of the 466 survey respondents, 334 were NCATE affiliates. On average, students
at NCATE institutions have greater access to computers than do their non-NCATE
counterparts. The NCATE mean (63.71 computers; see Table 1) is just slightly greater than
the mean for all reporting SCDEs (62.2 computers), but nearly eight computers greater than
for non-NCATE institutions. Average total computer labs available for SCDE students at
NCATE institutions is about .4 labs greater than for non-NCATE SCDEs and virtually the
same as the average for all reporting SCDEs.
Graph 4 illustrates the relationship between the average number of computers
available for SCDE students at NCATE institutions and non-NCATE institutions by
AACTE Region. It is interesting that while Zones I and IV continue to have greater average
values than other regions, the contribution of non-NCATE institutions to raising
the average in Zone IV is significant. The opposite effect of non-NCATE institutions is
documented in Zone II. Clearly, there is substantial variance among NCATE and non-
NCATE institutions regarding the availability of computers for SCDE student use and the
variance is not consistent or unique among AACTE Regions.
93
AverageTotalComputers
Nit ACSESULGC/APU
ALLA= TECSCU
Graph 3: Average Total Computers Available for SCDE Student Use by Type of Affiliation
*NI: Reporting SCDEs Not Included within these affiliationsACSESULGC/APU: Association of Colleges and Schools of Education in State Universities
and Land-Grant Colleges and Affiliated Private UniversitiesAILACTE: Association of Independent Liberal Arts Colleges for Teacher EducationTECSCU: Teacher Education Council of State Colleges and Universities

NCATE InstitutionsMean 63.71# of Institutions 334Total Computers 21279
Table 1: Average Total Computers for NCATE Institutions
A ve rageTotalCompute rs
120
100
8 0
60
40
20
The use of technology
Zone I Zone II Zone III Zone IV Zone V Zone VI
Graph 4: Average Total Computers for NCATE Institutions by AAC1E, Region
Non-NCATE
NCATE
Description of Infrastructure and Reported Levels of Use
Many SCDEs have made significant investments in both hardware and software to
establish an appropriate infrastructure for the use and integration of computer technologies
by SCDE faculty and to support the preparation of future educators. Tables 2, 3, and 4
display descriptive data for information technology users (calculated at the institutional
level) in three SCDE groups: Faculty and Students, Faculty, Students, and for
adequate/inadequate infrastructure. Differences in the descriptive data among the three
groups is inconsequential, even when compared across AACTE Region, Type of
Affiliation, and NCATE affiliation. The lowest documented use level is 80%. Eighty
percent of the SCDE institutions in Zone V were classified as users of information
technologies* for the combined faculty and students. The majority of institutional user
percentages exceed 90%.
*For the purposes of this study, information technologies were defined, collectively, as
computers, Internet, e-mail, fax, and World Wide Web (WWW).
-20-
21

The use of technology
Data is also reported specifically for adequate/inadequate infrastructure. Whether
grouped by AACTE Region, Type of Affiliation, or NCATE affiliation, SCDE institutions
have adequate infrastructure for the utilization of information technologies. Zone V
represents the lowest percentage of institutions with adequate infrastructure at ninety-five
percent. Additional chi-square analyses were run on these data which documented:
the number of student user institutions for information technologies is
significantly higher when institutional infrastructure is in place;
the number of faculty user institutions for information technologies is
significantly higher when institutional infrastructure is in place; and
the number of faculty and student user institutions for interactive information
technologies is significantly higher when appropriate infrastructure is in place.
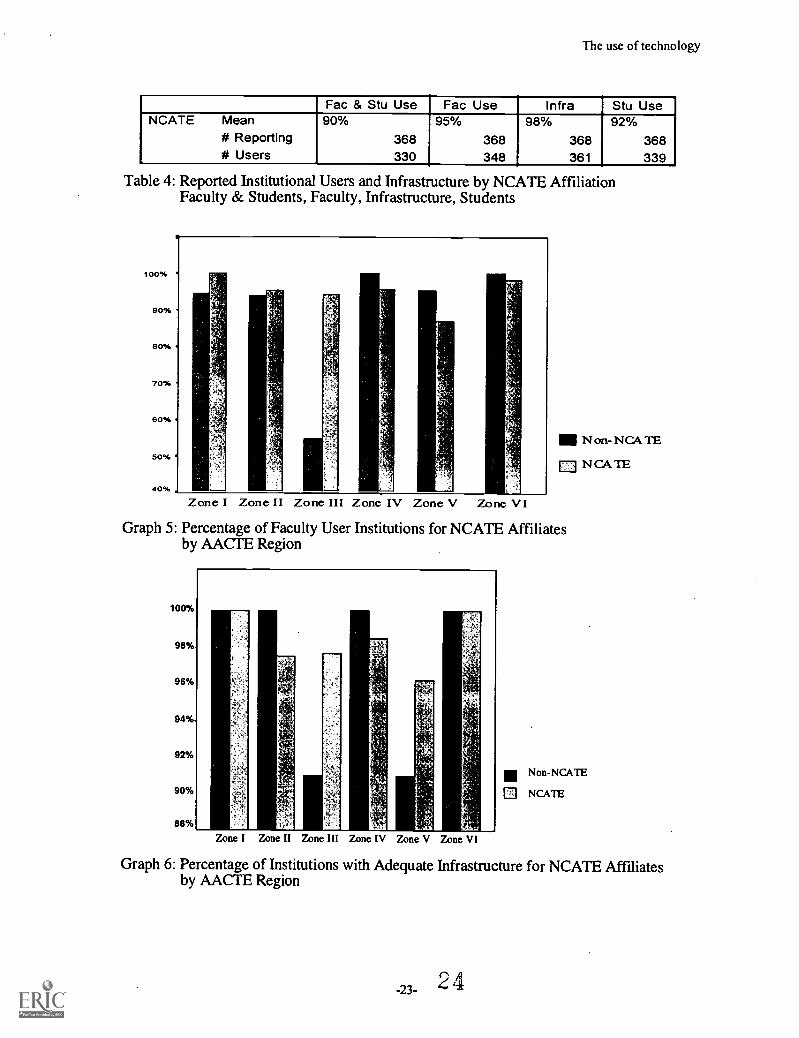
Graphs 5, 6, and 7 compare non-NCATE institutions to NCATE institutions by
AACTE Region for faculty user institutions of information technologies, adequate
institutional infrastructure for information technologies, and student user institutions of
information technologies. There are striking similarities between faculty user institutions
and adequate institutional infrastructure for each region. The implication is that faculty, in
particular, adopt information technologies based upon the ability to access adequate
infrastructure for these technologies. It is also interesting to note that faculty user
institutions outnumber (by percentage) student user institutions in every region and for both
non-NCATE and NCATE affiliates except for non-NCATE institutions in Zone III. Further
exploration would be necessary to determine if this phenomena is related to student access
to adequate infrastructure or if SCDE student adoption of information technologies is
dependent upon SCDE faculty modeling appropriate uses. With the increasing use of
information technologies in K-12 school settings, SCDEs can expect to experience
increased demands on the technological infrastructure by incoming students who expect to
use information technologies for academic and personal productivity.
The number of SCDE faculty user institutions of information technologies is well
above expected levels except for the non-NCATE institutions of Zone III (see Graph 5).
Infrastructure is complete for most SCDEs; even the non-NCATE institutions of Zones III
and IV document 90% of their institutions as having adequate infrastructure
(see Graph 6). The number of student user institutions is least for non-NCATE affiliates
in Zone DI at just over 80% (see Graph 7). In combination, these findings clearly
document the need for institutions to have adequate infrastructure in place for widespread
use of information technologies to occur with any user group.

The use of technology
ZoneVariables
Fac & Stu Use Fac Use Infra Stu UseI Mean 92% 98% 100% 94%
# Reporting 50 50 50 50# Users 46 49 50 47
I I Mean 90% 95% 98% 92%# Reporting 97 97 97 97# Users 87 92 95 89
I I I Mean 85% 90% 97% 93%# Reporting 96 96 96 96# Users 82 86 93 89
IV Mean 90% 96% 99% 91%# Reporting 80 80 80 80# Users 72 77 79 73
V Mean 80% 89% 95% 87%# Reporting 75 75 75 75# Users 60 67 71 65
-V1 Mean 96% 99% 100% 96%# Reporting 68 68 68 67# Users 65 67 68 64
Total Mean 88% 94% 98% 92%# Reporting 466 466 466 465# Users 412 438 456 427
Table 2: Reported Institutional Users and Infrastructure by AACTE RegionFaculty & Students, Faculty, Infrastructure, Students
Type of Affiliation Fac & Stu Use Fac Use Infra Stu UseN I* Mean 85% 95% 100% 89%
# Reporting 20 20 20 19# Users 17 19 20 17
ACSESULGC/APU Mean 90% 94% 100% 92%# Reporting 203 203 203 203# Users 182 190 202 187
AILACTE Mean 86% 92% 94% 92%# Reporting 154 154 154 154# Users 133 142 145 142
TECSCU Mean 90% 98% 100% 91%# Reporting 89 89 89 89# Users 80 87 89 81
Total Mean 88% 94% 94% 92%# Reporting 466 466 466 465# Users 412 438 456 427
Table 3: Reported Institutional Users and Infrastructure by Type of AffiliationFaculty & Students, Faculty, Infrastructure, Students
*NI: Reporting SCDEs Not Included within these affiliations
The use of technology
Fac & Stu Use Fac Use Infra Stu UseNCATE Mean 90% 95% 98% 92%
# Reporting 368 368 368 368# Users 330 348 361 339
Table 4: Reported Institutional Users and Infrastructure by NCATE AffiliationFaculty & Students, Faculty, Infrastructure, Students
Zone I Zone II Zone III Zone IV Zone V Zone VI
III Non-NCATE
Graph 5: Percentage of Faculty User Institutions for NCATE Affiliatesby AACTE Region
100%
98%
96%
94%
92%
90%
88%
Zone I Zone II Zone III Zone IV Zone V Zone VI
NCATE
Non-NCATE
NCATE
Graph 6: Percentage of Institutions with Adequate Infrastructure for NCATE Affiliatesby AACIE Region
100%
90%
80%
70%Zone I Zone II Zone III Zone IV Zone V Zone VI
The use of technology
1111 Non-NCATE
Graph 7: Percentage of Student User Institutions for NCATE Affiliatesby AACTE Region
NCAIE
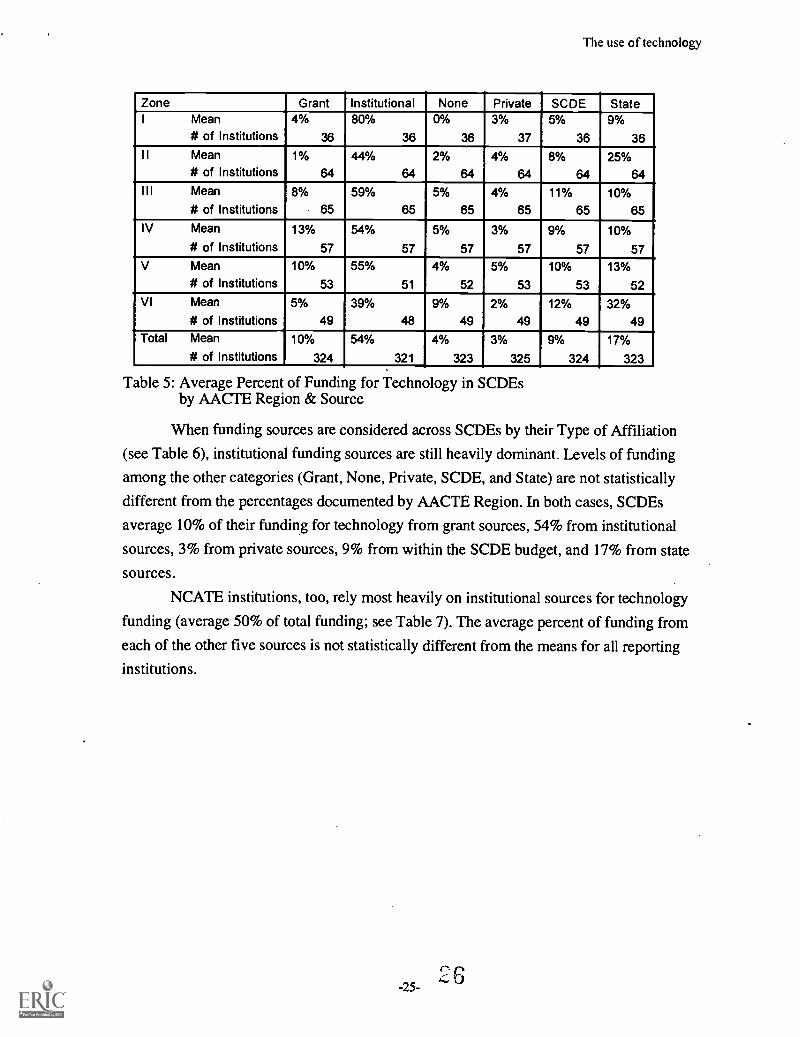
Technology Funding for SCDEs
There is substantial variation between the funding levels and the funding sources
for interactive information technologies within SCDEs. There are increasing pressures from
within the higher education setting, and external to it, to address the larger issue of
equitable access to technology. Resmer (1997) states, "As information technologies
become an increasingly central part of learning experiences for students throughout all
disciplines, universities and colleges face a major challenge in ensuring that all students
have access to the technological infrastructure that will enable them to realize its full
potential to transform their education" (p. 12). The importance of access for preservice
teachers increases as access to technology and adequate preparation for the use and
integration of technology within the classroom setting accounts for greater impact on theirprofessional opportunities and success.
Tables 5, 6, and 7 document that, by far, institutional funding is relied upon
most heavily to fund SCDE technology initiatives. It is interesting that Zones 11 and VI get
significant funding from their state governments. The highest average level of funding was
documented for Zone I AACTE member institutions (thirty-six of whom reported) with an
average of 80% of their technology funding from institutional sources. The lowest average
level was also documented for Zone I which had not a single institution report that they
received no funding for technology from any source (see Table 5). The number of
reporting institutions for this data varies from the total survey response (n = 466) due tomissing data; percentages by Zone, Type of Affiliation, and NCATE Affiliation may nottotal 100% due to rounding.
-24-5
The use of technology
Zone Grant Institutional None Private SCDE StateI Mean
# of Institutions4%
36
80%
36
0%
36
3%
37
5%
36
9%
36I I Mean
# of Institutions1%
64
44%
64
2%
64
4%
64
8%
6425%
64III Mean
# of Institutions8%
65
59%
65
5%
65
4%
65
11%
6510%
65IV Mean
# of Institutions13%
57
54%
57
5%
57
3%
57
9%
57
10%
57V Mean
# of Institutions10%
53
55%
51
4%
52
5%
53
10%
53
13%
52VI Mean
# of Institutions5%
49
39%
489%
492%
49
12%
4932%
49Total Mean
# of Institutions10%
324
54%
321
4%
323
3%
325
9%
324
17%
323
Table 5: Average Percent of Funding for Technology in SCDEsby AACTE Region & Source
When funding sources are considered across SCDEs by their Type of Affiliation
(see Table 6), institutional funding sources are still heavily dominant. Levels of funding
among the other categories (Grant, None, Private, SCDE, and State) are not statistically
different from the percentages documented by AACTE Region. In both cases, SCDEs
average 10% of their funding for technology from grant sources, 54% from institutional
sources, 3% from private sources, 9% from within the SCDE budget, and 17% from state
sources.
NCATE institutions, too, rely most heavily on institutional sources for technology
funding (average 50% of total funding; see Table 7). The average percent of funding from
each of the other five sources is not statistically different from the means for all reporting
institutions.

The use of technology
Type of Affiliation Grant Institutional None Private SC DE StateNI* Mean
# ofInstitutions
8%
13
69%
13
0%
13
4%
13
2%
13
16%
13
ACSESULGC/APU Mean# ofInstitutions
8%
145
46%
144
4%
145
4%
146
12%
145
23%
145
AILACTE Mean
# ofInstitutions
12%
106
68%
105
4%
106
3%
106
6%
106
3%
106
TECSCU Mean
# ofInstitutions
9%
60
43%
59
7%
59
4%
60
10%
60
25%
59
Total Mean
# ofInstitutions
10%
324
54%
321
4%
323
3%
325
9%
324
17%
323
Table 6: Average Percent of Funding for Technology in SCDEsby Type of Affiliation & Source
*NI: Reporting SCDEs Not Included within these affiliations
NCATE Grant Institutional None Private SCDE StateMean
# of Institutions
10%
257
50%
254
5%
256
3%
258
11%
257
18%
256
Table 7: Average Percent of Funding for Technology in NCATE SCDEs by Source
SCDE Faculty/Administration domputers
These researchers were interested in this data to the extent that it presents a general
picture of the capacity of the SCDE program to integrate current information technologies
within professional and instructional activities. For the most part, "other Windows" and
"other Macs" are the predominant operating systems found on the desks of SCDE
faculty/administration (see Tables 8 and 9). These two categories account for 50% of the
total for the 446 reporting SCDEs. There is a reasonably strong percentage of PowerMacs
and Pentiums also documented representing the current upper end for desktop computing
hardware. This data suggests that some SCDEs already recognize the need to support
faculty/administration use and integration of information technologies with adequate
hardware. Eighty-seven percent of the computers used by SCDE faculty/administration are
either "other Windows", "other Macs", PowerMacs, or Pentiums (see Table 8). On
average, 4% of the 446 SCDEs responded that the majority of their faculty/administration
had no computer. This value is not statistically different from the values reported for all
other regions or institutional affiliations.

The use of technology
Several participating institutions reported independent percentages which totaled
more than 100%. Question interpretation or multiple machines per faculty member may
have been the cause. Table 8 displays the greatest value for average percentage of type of
computer available: of the forty-six AAC-11, Zone I institutions which responded to this
item, 34% of the faculty or administration have "other Windows" cOmputers to use.
Faculty/administration at the 355 reporting NCATE institutions (see Table 9) are most
likely to be using "other Windows" (29%), "other Macs" or PowerMacs (20% each), or
Pentiums (16%). It is quite positive that the majority of the percentages in the PowerMac
and Pentium categories are in the neighborhood of 20%.
Green (1997) found that an average of 54.9% of the faculty at the 660 surveyed
institutions of higher education have or own a computer and 50% of the administrators
have or own a computer. The same study documents Windows 3.x (87%) and MS-DOS
(80.6%), respectively, as the recommended /supported computer operating systems.
Green's study also shows heaviest recommendation for Pentium desktop computers
(68.8% of the institutions). Desktop computers ranked by recommended operating system
were: (a) any PC-compatible, 70.5%, (b) any Macintosh, 40.6%, and (c) any UNIX
system, 32.4%.
Table 8:
Summary of SCDE Faculty/Administration Computera by AACTE Region
Zone Mac PortNo
CompOthWin
OthComp
OthMac
Power
Mac Pent
WinPort
I Mean 1% 4% 34% 6% 20% 1% 20% 2%# Reporting 46 46 46 46 46 46 46 46
I I Mean 3% 4% 35% 7% 13% 15% 20% 4%# Reporting 96 96 96 96 96 96 96 96
I I I Mean 3% 4% 28% 5% 23% 16% 19% 3%# Reporting 92 92 92 92 92 92 92 92
IV Mean 4% 3% 23% 4% 22% 29% 12% 4%# Reporting 75 75 75 75 75 75 75 75
V Mean 4% 6% 24% 6% 25% 15% 16% 4%# Reporting 71 71 71 71 71 71 71 71
VI Mean 4% .2% 26% 2% 24% 30% 14% 3%# Reporting 66 66 66 66 66 66 66 66
Total Mean 3% 4% 29% 5% 21% 20% 17% 4%# Reporting 446 446 446 446 446 446 446 446

Table 9:
The use of technology
Summary of SCDE Faculty/Administration Computers for NCATE Institutions
NCATEMacPort
NoComp
OthWin
OthComp
OthMac
PowerMac Pent
WinPort
Mean
# Reporting3%
366
4%
356
29%
355
5%
355
20%
355
20%
355
16%
355
4%
355
Internet Connections and Required Computer Purchase
A summary of the actual numbers of computers available for SCDE students and
the average number of labs available can be found in Table 10. In addition, Table 10
documents two other interesting findings:
Over 80% of all reporting institutions have Internet connections established for
their SCDE faculty and administration; and
Less than ten institutions (1.5% overall) of the 466 reporting SCDEs require
their SCDE students to purchase a computer.
Across institutions of higher education, in general, 76% of faculty and administration have
access to the Internet, 67% of the undergraduates, and 33% of the graduate students
(Green, 1997). According to the NCES (1997), 65% of U.S. public schools had access to
the Internet in fall of 1996, which represented a 15% gain in each of the last two
consecutive years. Also of interest, 13% of all public schools reported that training for
teachers in advanced [emphasis added] telecommunications was mandated by the school,
district, or teacher certification agencies.
Green (1997) also found that 9.7% of the higher education institutions required or
strongly recommended microcomputer ownership for all students and 10.8% required or
strongly recommended microcomputer ownership for students in specific
disciplines/programs. While the first finding of this study is cause for celebration, the
second reminds us that information technologies are not yet accepted within SCDEs as a
necessary tool for the professional preparation and development of SCDE students.
-28-
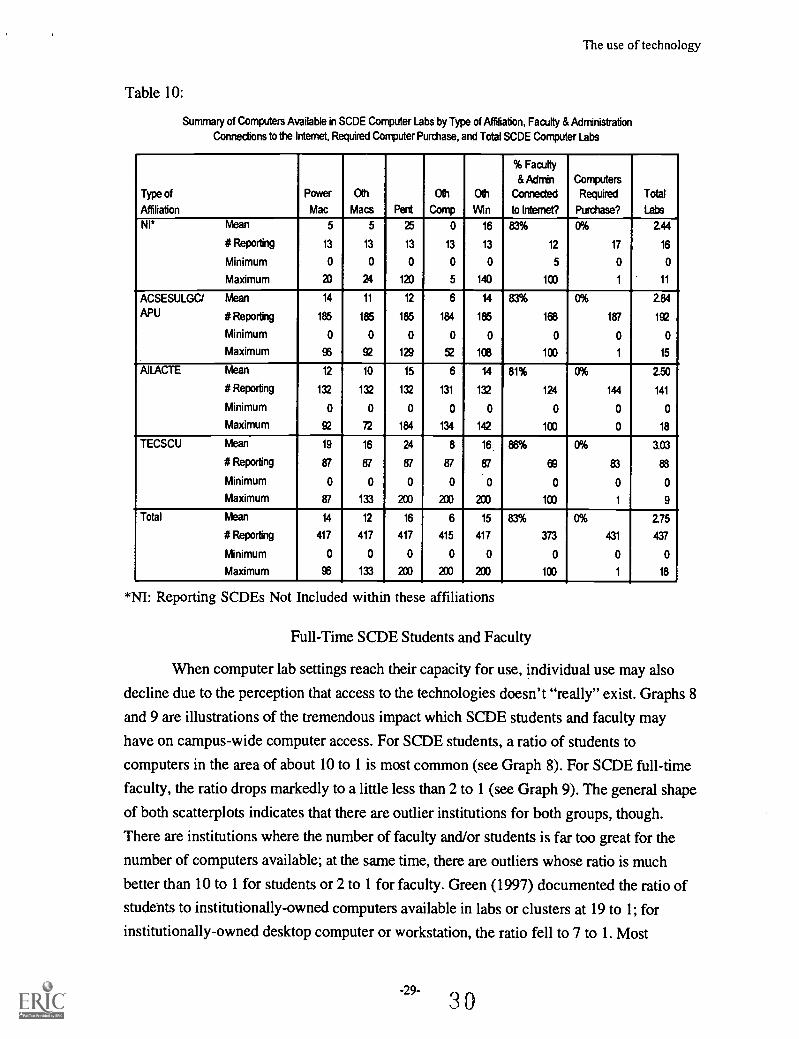
Table 10:
The use of technology
Summary of Computers Available in SCDE Computer LabS by Type of Affitiation, Faculty & Administration
Connections to the Internet, Requited Computer Purchase, and Total SCDE Computer Labs
Type of
Affiliation
Power
Mac
Oth
Macs Pert
Oth
Comp
Olh
1/On
% Faculty
& MminConnected
to Internet?
Computers
Required
Purchase?
Total
Labs
NI* Mean 5 5 25 0 16 83% 0% 2.44
# Reporting 13 13 13 13 13 12 17 16
Minimum 0 0 0 0 0 5 0 0
Maximum 23 24 120 5 140 100 1 11
ACSESULGC/ Mean 14 11 12 6 14 83% 0% 2.84
APU # Reporting 185 185 185 184 185 168 187 192
Minimum 0 0 0 0 0 0 0 0
Maximum 96 92 129 2 106 103 1 15
AILACTE Mean 12 10 15 6 14 81% 0% 2.50
# Reporting 132 132 132 131 132 124 144 141
Minimum 0 0 0 0 0 0 0 0
Maximum 92 72 184 134 142 100 0 18
TECSCU Mean 19 16 24 8 16 86% 0% 3.03
# Reporting 87 87 87 87 87 03 23 88
Minimum 0 0 0 0 0 0 0 0
Maximum 87 133 200 200 200 100 1 9
Total Mean 14 12 16 6 15 83% 0% 2.75
# Reporting 417 417 417 415 417 373 431 437
Minimum 0 0 0 0 0 0 0 0
Maximum 96 133 200 2:0 200 103 1 18
*NI: Reporting SCDEs Not Included within these affiliations
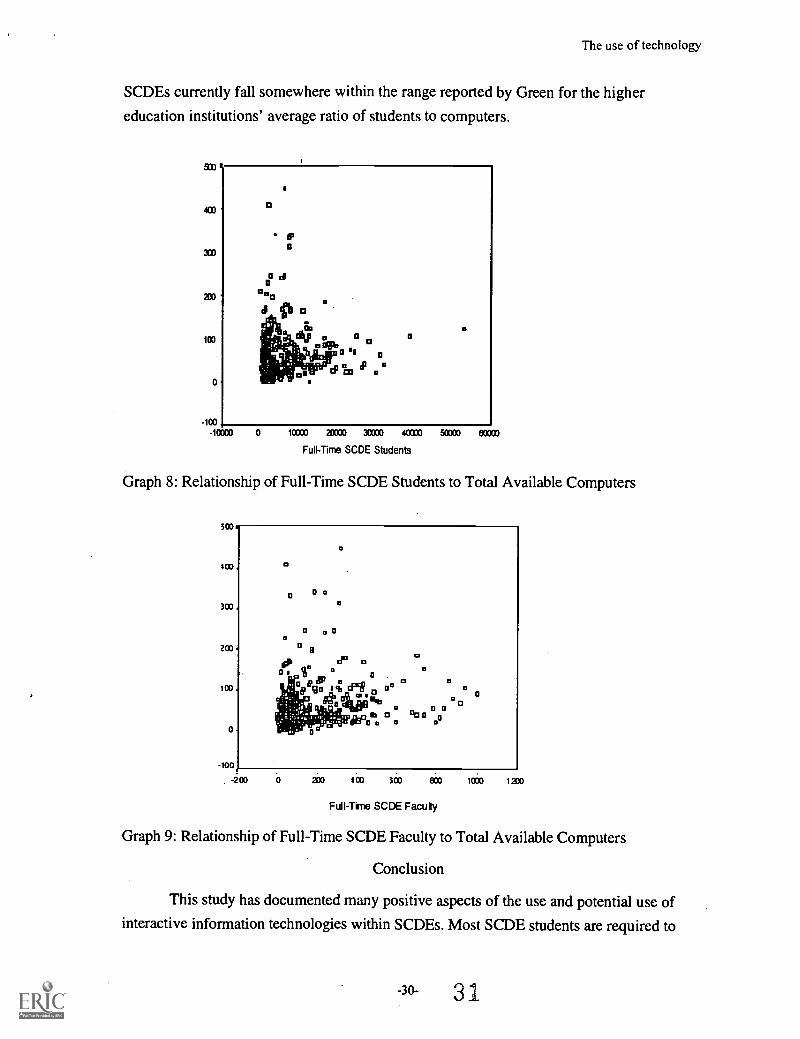
Full-Time SCDE Students and Faculty
When computer lab settings reach their capacity for use, individual use may also
decline due to the perception that access to the technologies doesn't "really" exist. Graphs 8
and 9 are illustrations of the tremendous impact which SCDE students and faculty may
have on campus-wide computer access. For SCDE students, a ratio of students to
computers in the area of about 10 to 1 is most common (see Graph 8). For SCDE full-time
faculty, the ratio drops markedly to a little less than 2 to 1 (see Graph 9). The general shape
of both scatterplots indicates that there are outlier institutions for both groups, though.
There are institutions where the number of faculty and/or students is far too great for the
number of computers available; at the same time, there are outliers whose ratio is much
better than 10 to 1 for students or 2 to 1 for faculty. Green (1997) documented the ratio of
students to institutionally-owned computers available in labs or clusters at 19 to 1; for
institutionally-owned desktop computer or workstation, the ratio fell to 7 to 1. Most
-29-
The use of technology
SCDEs currently fall somewhere within the range reported by Green for the higher
education institutions' average ratio of students to computers.
0 10300 2C030 30000 4CCOD 50030 en°Full-Time SCDE Students
Graph 8: Relationship of Full-Time SCDE Students to Total Available Computers
Full-Tine SCDE Faculty
Graph 9: Relationship of Full-Time SCDE Faculty to Total Available Computers
Conclusion
This study has documented many positive aspects of the use and potential use ofinteractive information technologies within SCDEs. Most SCDE students are required to

The use of technology
take a course on computer use, applications, communications, and instructional integration.
Students typically must demonstrate the use of at least one technology both on and off
campus. The majority of SCDE students have access to some advanced electronic
technologies and software applications. Many students have the opportunity to submit
assignments completed using computer applications and may submit their work via e-mail.
SCDEs generally have very well equipped classrooms and their information infrastructure
is generally part of a budgeted plan for purchase, replacement, and upgrades. In terms of
adequate infrastructure, the AAC1E member institutions which participated in this study are
well prepared to meet this NCTAF (1996) challenge: "Schools of education ...need to
model how to teach for understanding in a multicultural context, how to continuallyassess
and respond to student learning, and how to use new technologies in doing so" (p. 77).
Attention must now turn to designing, implementing, and evaluating preservice preparation
environments which include embedded applications of these new technologies.
This study has also documented some areas for improvement, however. Too few
students are expected to use computers, televisions and VCRs to share information in their
campus classroom settings. Students do not use SCDE Web sites to obtain assignments
and syllabi, implying that SCDE faculty are not making best use of the available
information infrastructure. There is some evidence of higher level uses of the WWW
(beyond searching for information) and appropriate applications of distance education
technologies, but it appears that the majority of faculty have not reached a comfort level
beyond basic user skills with these information technologies. Actual utilization and
contextualized integration of these technologies within personal and workplace settings, for
both SCDE students and faculty, is far from commonplace within SCDEs. These issues are
characteristic of systems struggling to become technologically supported learning
environments. Regarding the preparation of education faculty and education students for
the use of computers in instruction and scholarship, Green (1997) documented current
preparation levels in four areas:
1) institutional preparation of student technology skills over the next decade
(mean = 3.3);
2) faculty preparation for instruction (mean = 3.1);
3) faculty preparation for scholarship (mean = 2.9); and
4) faculty preparation in Intemet/WWW use (mean = 2.9).
(Means were reported based on a scale of 1 "Poor" to 5 "Excellent")
The OTA (1995) report urges SCDEs to look beyond the issues of access totechnology; to, instead, focus on identifying the barriers to effective use of technology
within our schools. In particular, the report makes these suggestions: (a) define a vision for
The use of technology
technology use which takes into account new curricular and professional development
possibilities; (b) develop a system for teacher training and ongoing support for curriculum
integration which utilizes technology; and (c) allow enough time for all teachers to
experiment with new technologies, share experiences with other teachers, plan lessons
using technology, and attend technology courses and meetings. "For schools to improve,
teachers must change. For teachers to change, there must be appropriate and promising
practices and procedures (i.e., innovations) that they develop or adopt, and, when
necessary, adapt. Student achievement and other desired outcomes are enhanced when
teachers improve their practices and use more effective instructional resources" (Hall &
Hord, 1987, p. 5). Funding technology initiatives, incentive plans, faculty preparation, and
maintaining supervision over technology access will continue to plague SCDEs and
institutional planning processes in general.
The holistic solutions to these challenges are complex, as they reside within
complex systems. In a description of the Apple Classrooms of Tomorrow (ACOT) project,
Sandholtz, Ringstaff, and Dwyer (1997) say that, "[T]echnology by itself was not the
silver bullet. In fact, it added another layer of complexity, a whole new set of things for
already overworked and stressed teachers to learn and manage...Its [technology] use in
instruction and learning changed as teachers themselves changed" (p. 36). SCDEs have an
obligation to strive for the effective use and integration of technology within our teacher
preparation programs and our K-12 classrooms. Meeting that obligation will not occur
without pain, planning, patience, and persistence at all levels of the education system.
Positive movement will only occur with input from the human technology consumers:
teachers, students, administrators, business people, politicians, technical experts, parents,
and technologists. SCDEs have made tremendous recent progress toward technology
integrated and supported teacher preparation, but we can't blink; a new millennium is just
around the corner.

The use of technology
References
American Association of Colleges for Teacher Education. (1997). Report of the
AAC1E task force on technology. Washington, DC: American Association of Colleges for
Teacher Education.
Awbry, S. M. (1996, Winter). Successfully integrating new technologies into the
higher education curriculum. Educational Technology Review. 5, 7-17.
Beneski, J. T., & Waber, J. (1997). Virtual laboratories in the sciences. Syllabus,
10(9), pp. 20-27.
Ely, D. P. (1996). Trends in educational technology. Syracuse, NY: ERIC
Clearinghouse on Information & Technology.
Green, K. C. (1997). Campus computing 1996. Encino, CA: Campus Computing.
Green, K. C. (1996). Campus computing 1995. Encino, CA: Campus Computing.
Green, K. C., & Eastman, S. (1994). Campus computing 1993: The USC national
survey of desktop computing in higher education. Los Angeles: University of Southern
California.
Hall, G. E., & Hord, S. M. (1987). Change in schools: Facilitating the process.
Albany, NY: State University of New York Press.
National Center for Education Statistics. (1997). Advanced telecommunications in
U.S. public elementary and secondary schools. fall 1996 (NCES Publication No. NCES
97-944). [On-line] Available: http://www.ed.gov/NCES/pubs/97944.html
National Commission on Teaching and America's Future. (1996). What matters most:
Teaching for America's future. New York: National Commission on Teaching and
America's Future.
National Council for Accreditation of Teacher Education. (1993). Proposed
refinements of NCATE's standards for the accreditation of professional education units.
Washington, DC: National Council for Accreditation of Teacher Education.
The use of technology
Office of Technology Assessment. (1995). Teachers & technology: Making the
connection. Washington, DC: U.S. Government Printing Office.
Resmer, M. (1997). Universal student access to information resource technology.
Syllabus, 10(6), 12-14.
Rogers, E. M. (1995). Diffusion of innovations (4th ed.). New York: Free Press.
Sandholtz, J. H., Ringstaff, C., & Dwyer, D. C. (1997). Teaching with technology:
Creating student-centered classrooms. New York: Teachers College Press.
Tharp, D. D. (in press). Documenting critical mass for the use of interactive
information technologies in schools, colleges, and departments of education (Doctoral
dissertation, University of Northern Colorado, 1997).
Willis, & Mehlinger, (1996). Information technology and teacher education. In J.Ifrs
Sikula (Ed.), Handbook of research on teacher education (2nd ed., pp. 978-1029). New
York: Macmillan.

Appendix
SCDE Technology Survey(JDCS-1996)
3 6-35-
The use of technology

Institution: INSTID: 1996 JDCS Addendum
Schools, Colleges, and Departments of Education (SCDE) Technology Survey
Please circle the scenario which best describes the ma'ority (over 50%) of your SCDE faculty and studentuses of and access to various educational technologies.
Student Use1 Students are required to design Students are required to Students have no requirements Unknown
demonstrate their use of atleast one technology duringstudent teaching.
& deliver instruction duringstudent teaching whichincorporates various technologies.
2 Students are required to take acourse(s) on computer use,applications, communications, &instructional integration.
3 Students are required to design& deliver instruction oncampus incorporating varioustechnologies.
4 Students are required to usecomputers, televisions & VCRsto share information in theclassroom.
5 Students are required to submitassignments using computerapplications: electronically oron a computer disk.
6 Students are allowed to submittheir work & ask questions viaemail.
7 Students may obtainassignments & syllabi from aSCDE Web site.
Faculty Use8 The faculty regularly uses
computers, televisions & VCRsas interactive instructionaltools during class periods.
9 The faculty uses computersoccasionally to conductresearch & communicate withpeers.
10 The faculty uses email tocollaborate on projects &communicate with other facultyoutside this institution.
11 The faculty uses the SCDE Website to display articles, articleabstracts & vitae.
Students are required to take acourse(s) on computerapplications.
Students are required todemonstrate their use of atleast one technology on campus.
Students sometimes usecomputers, televisions & VCRsto share information in theclassroom.
Students are required to submitassignments completed usingcomputer applications.
The students onlycommunicate with faculty viaemail.
Students do not use a SCDEWeb site to obtain assignments& syllabi.
The faculty occasionally usessome electronic technology topresent information during classperiods.
The faculty uses computersprimarily for word processingtasks.
The faculty primarily uses emailfor communication withinthis institution.
The faculty uses the SCDE Website to display personalinformation only.
to incorporate technology withintheir instruction during studentteaching.
Students have no course Unknownrequirements in technology.
Students have no requirementsto incorporate technology withintheir instruction on campus.
The students do not usecomputers, televisions or VCRsin the classroom.
Unknown
Unknown
Students are not required to use Unknowna computer to completeassignments.
The students do not use email Unknownto communicate with faculty.
Students do not have access Unknownto a SCDE Web server.
The faculty does not useelectronic technology during classperiods.
The faculty does not usecomputers for professionalpurposes.
The faculty does not useemail.
The faculty does not use theSCDE Web site.
(Please continue on reverseside)
Unknown
Unknown
Unknown
NoSCDE
-Web Site

Institution: INS TID: 1996 JDCS Addendum
12 The faculty uses the World WideWeb to search for articles,article abstracts & vitae.
13 The faculty uses distanceeducation technologies for highlyinteractive (between sites orbetween faculty & students)instructional purposes.
Institutional Capacity14 The administration
communicates with faculty &staff via email.
15 Classrooms are wired forInternet, have televisions,VCRs & computers forinstructional purposes.
16 The SCDE delivers instruction tooff-site students usinginteractive technologies.
17 Students have access to the mostadvanced electronictechnologies and softwareapplications.
18 The institution has budgeted aplan to purchase, replace &upgrade a variety of educationaltechnologies.
The faculty uses the The faculty does not use the NoWorld Wide Web to search for World Wide Web. Internetpersonal information only. Hookup
The faculty does not have The faculty does not use Noaccess to the types of distance education technologies. Distancetechnology that allow for Tech.interactivity between sites orbetween faculty & students.
The administration does not The administration does not Unknowncommunicate with faculty via have access to email.email.
Classrooms have televisions &VCRs available for instructionalpurposes.
Classrooms have no computers, Unknowntelevisions or VCRs available forinstructional purposes.
The SCDE delivers instruction to The SCDE does not deliveroff-site students using instruction to off-site students.computers, videos, text, orfaculty travel.
Students have access to basicword processing, spreadsheet &presentation software.
The institution has a plan topurchase & upgrade specificeducational technologies.
NoDistance
Tech.
Students do not have access Unknownto application software.
The institution currently has no Unknownplan to purchase or upgradeeducational technologies.
19 For the budgeted technology plans, please indicate the percent of funding from each of these sources:% State Funding % Institutional Funding. % SCDE Funding% Grant Funding % Private Source % No Funds
20 Indicate the percentage of SCDE faculty/administration who have the following computers on their desk:Macintosh Windows Portables% PowerPC Macs % Pentiums/586/686 % Macs % no computer% other Macs % other Windows % Windows % other computers
21 What percentage of the faculty/administration computers are connected to the Internet?,
22 Please complete this table by indicating the number of computers in each SCDE student lab:Computer Lab 1 Lab 2 Lab 3 Lab 4 . Lab 5 Lab 6PowerPC Macs
other MacsPentiums/5861686other Windowsother computers
23 Are SCDE students required to purchase, or supply, their own computer? Yes No
0 8

u
U.S. Department of EducationOffice of Educational Research and Improvement (OERI)
National Library of Education (NLE)Educational Resources Information Center (ERIC)
NOTICE
REPRODUCTION BASIS
®
IC
This document is covered by a signed "Reproduction Release(Blanket) form (on file within the ERIC system), encompassing allor classes of documents from its source organization and, therefore,does not require a "Specific Document" Release form.
This document is Federally-funded, or carries its own permission toreproduce, or is otherwise in the public domain and, therefore, maybe reproduced by ERIC without a signed Reproduction Release form(either "Specific Document" or "Blanket").
EFF-089 (9/97)
Related Documents

![+and destinationjak-stik.ac.id/staff/aqwam/files/keamanan-komputer[3].pdf · Individual computers: modems, ISDN links dan DSL connections](https://static.cupdf.com/doc/110x72/5c869b1909d3f29b298c92a0/and-destinationjak-stikacidstaffaqwamfileskeamanan-komputer3pdf-individual.jpg)