RESEARCH ARTICLE Open Access Factors influencing lysis time stochasticity in bacteriophage l John J Dennehy 1,2* and Ing-Nang Wang 1 Abstract Background: Despite identical genotypes and seemingly uniform environments, stochastic gene expression and other dynamic intracellular processes can produce considerable phenotypic diversity within clonal microbes. One trait that provides a good model to explore the molecular basis of stochastic variation is the timing of host lysis by bacteriophage (phage). Results: Individual lysis events of thermally-inducible l lysogens were observed using a temperature-controlled perfusion chamber mounted on an inverted microscope. Both mean lysis time (MLT) and its associated standard deviation (SD) were estimated. Using the SD as a measure of lysis time stochasticity, we showed that lysogenic cells in controlled environments varied widely in lysis times, and that the level of lysis time stochasticity depended on allelic variation in the holin sequence, late promoter (p R ’) activity, and host growth rate. In general, the MLT was positively correlated with the SD. Both lower p R ’ activities and lower host growth rates resulted in larger SDs. Results from premature lysis, induced by adding KCN at different time points after lysogen induction, showed a negative correlation between the timing of KCN addition and lysis time stochasticity. Conclusions: Taken together with results published by others, we conclude that a large fraction of l lysis time stochasticity is the result of random events following the expression and diffusion of the holin protein. Consequently, factors influencing the timing of reaching critical holin concentrations in the cell membrane, such as holin production rate, strongly influence the mean lysis time and the lysis time stochasticity. Background Some phenotypic variation arises from randomness in cellular processes despite identical environments and genotypes [1-9]. Population heterogeneity, resulting from such molecular stochasticity, has been documented in many microbial organisms including bacteriophage (phage) l [10-13], Escherichia coli [14-16], Bacillus sub- tilis [17,18] and Saccharomyces cerevisiae [19-24]. This within-population variation can have far reaching life history consequences. For example, experimentally redu- cing noise in the expression of ComK decreased the number of competent B. subtilis cells in one study [18]. In another study, mutants of S. cerevisiae showing greater heterogeneity in survival had higher rates of occasional-cell survival during high stress conditions than did wild-type cells [25]. Because of their simplicity and ease of manipulation, phages are excellent models to explore the life history consequences of molecular stochasticity. Many phages use a “holin-endolysin” system to compromise two phy- sical barriers, the cell membrane and the peptidoglycan layer, in order to lyse an infected host cell [26,27]. Although there are some variations on the theme, holin usually forms a hole(s) in the inner membrane, thus either allowing soluble endolysin into the periplasmic space [28,29] or activating the membrane-tethered endo- lysin already translocated to the periplasm [30-32]. Endolysin then digests the peptidoglycan, causing host cell lysis. The most extensively studied lysis system is that of phage l, which consists of four genes: S (encodes holin and antiholin), R (encodes endolysin), Rz , and Rz1 (encode an integral inner membrane protein and an outer membrane lipoprotein, respectively). All genes are co-transcribed from the late promoter p R ’ during the late phase of the lytic cycle [26,27,33,34]. Under typical * Correspondence: [email protected] 1 Department of Biological Sciences, University at Albany, 1400 Washington Avenue, Albany, NY 12222, USA Full list of author information is available at the end of the article Dennehy and Wang BMC Microbiology 2011, 11:174 http://www.biomedcentral.com/1471-2180/11/174 © 2011 Dennehy and Wang; licensee BioMed Central Ltd. This is an Open Access article distributed under the terms of the Creative Commons Attribution License (http://creativecommons.org/licenses/by/2.0), which permits unrestricted use, distribution, and reproduction in any medium, provided the original work is properly cited.

Welcome message from author
This document is posted to help you gain knowledge. Please leave a comment to let me know what you think about it! Share it to your friends and learn new things together.
Transcript
RESEARCH ARTICLE Open Access
Factors influencing lysis time stochasticity inbacteriophage lJohn J Dennehy1,2* and Ing-Nang Wang1
Abstract
Background: Despite identical genotypes and seemingly uniform environments, stochastic gene expression andother dynamic intracellular processes can produce considerable phenotypic diversity within clonal microbes. Onetrait that provides a good model to explore the molecular basis of stochastic variation is the timing of host lysis bybacteriophage (phage).
Results: Individual lysis events of thermally-inducible l lysogens were observed using a temperature-controlledperfusion chamber mounted on an inverted microscope. Both mean lysis time (MLT) and its associated standarddeviation (SD) were estimated. Using the SD as a measure of lysis time stochasticity, we showed that lysogeniccells in controlled environments varied widely in lysis times, and that the level of lysis time stochasticity dependedon allelic variation in the holin sequence, late promoter (pR’) activity, and host growth rate. In general, the MLT waspositively correlated with the SD. Both lower pR’ activities and lower host growth rates resulted in larger SDs.Results from premature lysis, induced by adding KCN at different time points after lysogen induction, showed anegative correlation between the timing of KCN addition and lysis time stochasticity.
Conclusions: Taken together with results published by others, we conclude that a large fraction of l lysis timestochasticity is the result of random events following the expression and diffusion of the holin protein.Consequently, factors influencing the timing of reaching critical holin concentrations in the cell membrane, such asholin production rate, strongly influence the mean lysis time and the lysis time stochasticity.
BackgroundSome phenotypic variation arises from randomness incellular processes despite identical environments andgenotypes [1-9]. Population heterogeneity, resultingfrom such molecular stochasticity, has been documentedin many microbial organisms including bacteriophage(phage) l [10-13], Escherichia coli [14-16], Bacillus sub-tilis [17,18] and Saccharomyces cerevisiae [19-24]. Thiswithin-population variation can have far reaching lifehistory consequences. For example, experimentally redu-cing noise in the expression of ComK decreased thenumber of competent B. subtilis cells in one study [18].In another study, mutants of S. cerevisiae showinggreater heterogeneity in survival had higher rates ofoccasional-cell survival during high stress conditionsthan did wild-type cells [25].
Because of their simplicity and ease of manipulation,phages are excellent models to explore the life historyconsequences of molecular stochasticity. Many phagesuse a “holin-endolysin” system to compromise two phy-sical barriers, the cell membrane and the peptidoglycanlayer, in order to lyse an infected host cell [26,27].Although there are some variations on the theme, holinusually forms a hole(s) in the inner membrane, thuseither allowing soluble endolysin into the periplasmicspace [28,29] or activating the membrane-tethered endo-lysin already translocated to the periplasm [30-32].Endolysin then digests the peptidoglycan, causing hostcell lysis.The most extensively studied lysis system is that of
phage l, which consists of four genes: S (encodes holinand antiholin), R (encodes endolysin), Rz, and Rz1(encode an integral inner membrane protein and anouter membrane lipoprotein, respectively). All genes areco-transcribed from the late promoter pR’ during thelate phase of the lytic cycle [26,27,33,34]. Under typical
* Correspondence: [email protected] of Biological Sciences, University at Albany, 1400 WashingtonAvenue, Albany, NY 12222, USAFull list of author information is available at the end of the article
Dennehy and Wang BMC Microbiology 2011, 11:174http://www.biomedcentral.com/1471-2180/11/174
© 2011 Dennehy and Wang; licensee BioMed Central Ltd. This is an Open Access article distributed under the terms of the CreativeCommons Attribution License (http://creativecommons.org/licenses/by/2.0), which permits unrestricted use, distribution, andreproduction in any medium, provided the original work is properly cited.
laboratory conditions, only S and R are needed for hostlysis, though both Rz and Rz1 are essential in the pre-sence of high concentrations of divalent cations [33-35].The lytic pathway of phage l is commonly divided
into the early, delayed early, and late phases. Transitionsbetween stages are triggered by well-characterized mole-cular actions involving gene transcription and transla-tion [36]. Consequently, the timing of when individualcells enter each phase greatly influences the length ofindividual lysis times. A recent study by Amir et al. [10]showed that 69% of the total lysis time variance is dueto variation in the time interval between the onset ofthe pR’ promoter and the eventual lysis (see APPENDIXA). This observation suggests that a large portion of theobserved lysis time stochasticity is a de novo phenom-enon, confined to the production and accumulation ofholin proteins in the cell membrane, rather than adirect carryover from the various upstream stochasticevents.The formation of the l holin hole in the membrane is
hypothesized to be a multi-step process that starts withthe transcription of the late mRNA and the translation ofthe S holin protein. The resulting holin monomers arethen inserted into the cell membrane, where they dimer-ize, then oligomerize [37], eventually leading to the forma-tion of higher-order holin aggregates, or rafts, in the cellmembrane. At a time that is specific to the holin proteinsequence, the holin rafts are transformed into a membranelesion(s) > 300 nm across [38], which is large enough forthe passage of a 500 KDa protein [28,29]. Lysis ensuesafter endolysin digests the peptidoglycan. Thus, by
regulating endolysin’s access to the peptidoglycan, holincontrols the timing of lysis [26,27].To formalize the heuristic model of holin hole formation
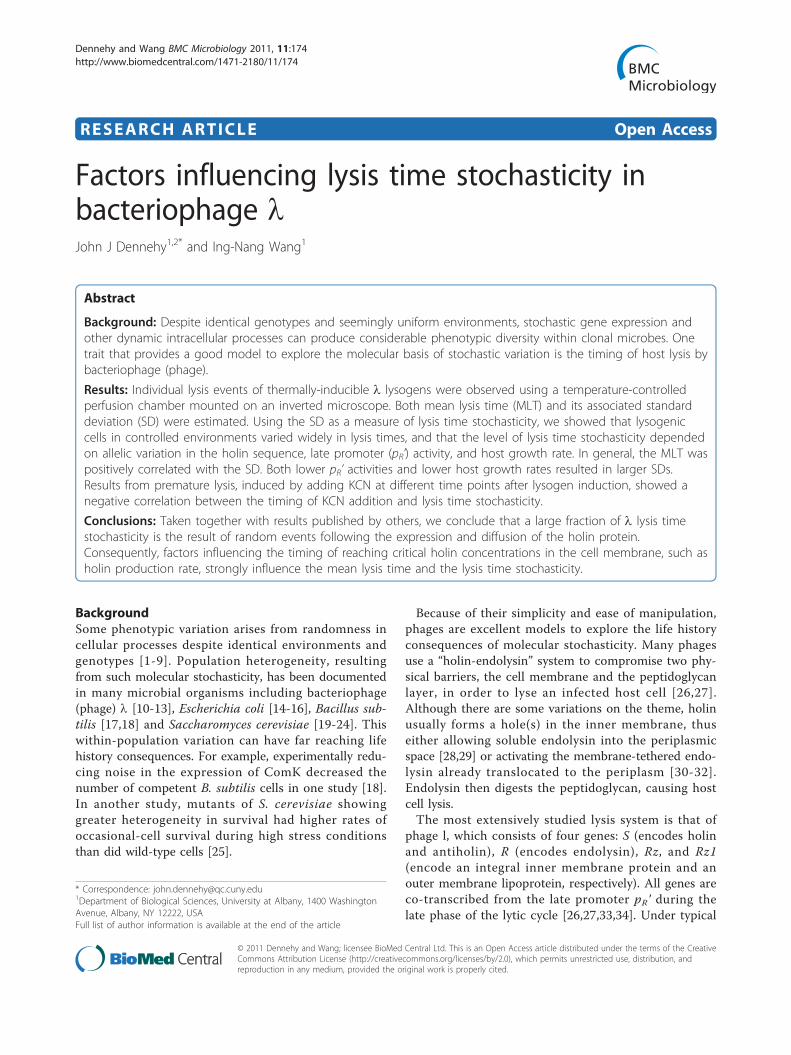
described by Wang et al. [28], Ryan and Rutenberg [39]proposed a two-stage nucleation model, in which the pro-duction rate of the holin monomers and holin self-affinitycontribute to the aggregation of holin rafts. Raft aggrega-tion is opposed by thermal Brownian motion which tendsto disintegrate rafts into their holin constituents. As therafts grow and then exceed a certain critical size (the firststage of nucleation), the probability of a second stagenucleation (triggering to hole formation) increases (Figure1). According to this model, lysis time stochasticity is theinevitable outcome of each infected cell in the populationfollowing its own time course of growth in holin raft size.However, a recent study [40] using C-terminus GFP-fusedl S holin protein showed that, for most of the latent per-iod, holin proteins are distributed uniformly in a relativelymobile state in the cell membrane. At a time that coin-cided with the triggering time, large immobile holin raftssuddenly appeared in the membrane. The transition fromuniformly distributed holin to holin rafts occurred in lessthan a minute. Although it is not clear whether these largerafts correspond to the membrane holes observed bycryoelectron microscopy [38], this study nevertheless castsdoubt on the previously hypothesized importance of holinraft size growth as the determining factor in lysis timing[28,39]. Rather, it is proposed that the lysis time is deter-mined by when a critical holin concentration is reached inthe cell membrane (Figure 1). According to this model,lysis time stochasticity is mainly the result of variation in
Figure 1 Schematic presentation of two models of holin hole formation. Holin monomers (shaded circles) are produced in the cytoplasm,and then transported to the cell membrane (a top-down view of the cell membrane thereafter) where they dimerize. A previous model (openarrows) [28,39] hypothesized that the growth of the holin aggregates ("rafts”) to a critical size that is responsible for the collapse of the protonmotive force (pmf), thus resulting in hole formation. The current model [40] (filled arrows) suggests that the holin proteins are mostly in amobile state, then quite suddenly, aggregates are formed, leading to the formation of holin holes. Addition of the energy poison KCN haltsfurther holin production and abolishes the pmf. This figure is adapted from Wang et al. [28] and White et al. [40].
Dennehy and Wang BMC Microbiology 2011, 11:174http://www.biomedcentral.com/1471-2180/11/174
Page 2 of 12
the timing of reaching the critical holin concentration inthe membrane.Typically, the lysis time of a phage is estimated using a
one-step growth curve [41-43]. In the case of phage l,however, the availability of thermally-inducible E. coli llysogens allows a more precise determination of the lysistime by following the decline of culture turbidity [26,44].Direct observation of the lysis of individual l lysogeniccells [45] confirmed that the precipitous decline of cul-ture turbidity, commonly observed among thermally-induced l lysogen cultures, is a reflection of the saltatorynature of individual lysis events at the microscopic level.However, it is not clear to what extent the seeminglyhigh synchronicity of lysis is influenced by variousaspects of phage biology and host growth conditions. Inthis study, we used a simple experimental setup to assesshow lysis time stochasticity is affected by allelic variationin the S protein, late promoter pR’ activity, host growthrate, and the timing of energy poison KCN addition. Our
results establish the ranges and limits of lysis time sto-chasticity under various conditions.
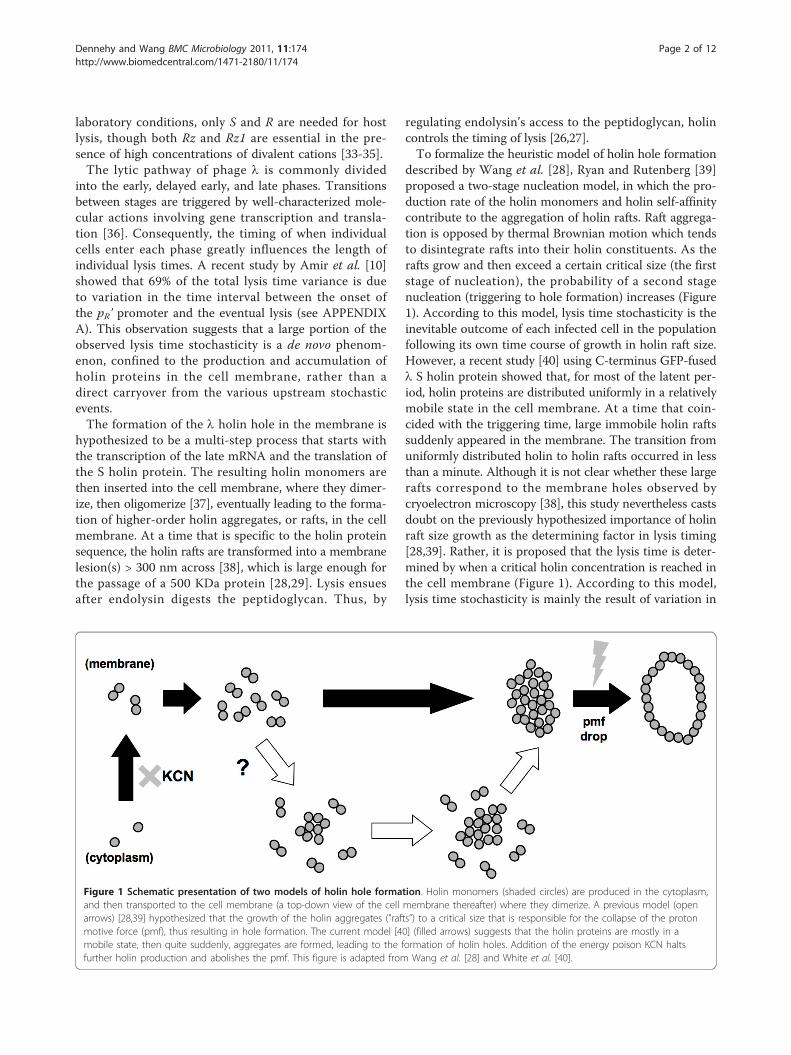
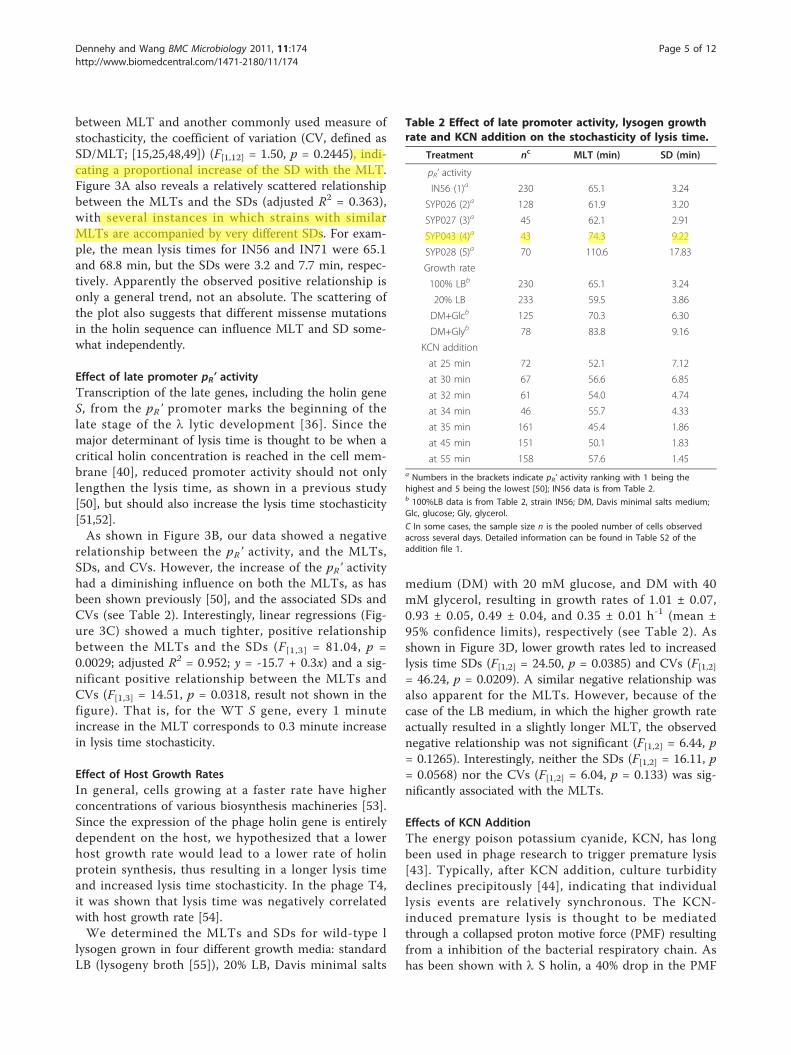
ResultsUsing a microscope-mounted, temperature-controlledperfusion chamber, we observed and recorded individuallysis events of thermally-induced Escherichia coli l lyso-gens (Figure 2A). These observations revealed a consid-erable amount of variation in lysis time for the wild-type (WT) l phage (Table 1; Figure 2B). Although themean lysis time for the WT l phage was 65.1 min, lysistimes for individual lysogenic cells ranged from 45.4 to74.5 min. Given that phage progeny accumulate linearlyat ~7.7 phage per minute beginning ~28 min after lysisinduction [46], the ~30 min range of lysis times couldresult in a three-fold difference in burst size betweenphages that lyse early and those that lyse late. Thisresult motivated further exploration of variation in lysistime among other l strains.
Figure 2 Samples of a lysis recording and frequency distributions of various experimental treatments. (A) Sample recordings from strainIN63. It takes about 5 sec for the upper left cell to disappear from view. (B) Sample frequency distributions of lysis times from strains IN56, IN67,IN68, SYP028, IN56 with KCN added at 55 min after thermal induction, and IN56 grown in glycerol minimal salts medium. The bin size was 2min. Additional data are shown in Tables 1 and 2.
Dennehy and Wang BMC Microbiology 2011, 11:174http://www.biomedcentral.com/1471-2180/11/174
Page 3 of 12
jdennehy7
Sticky Note
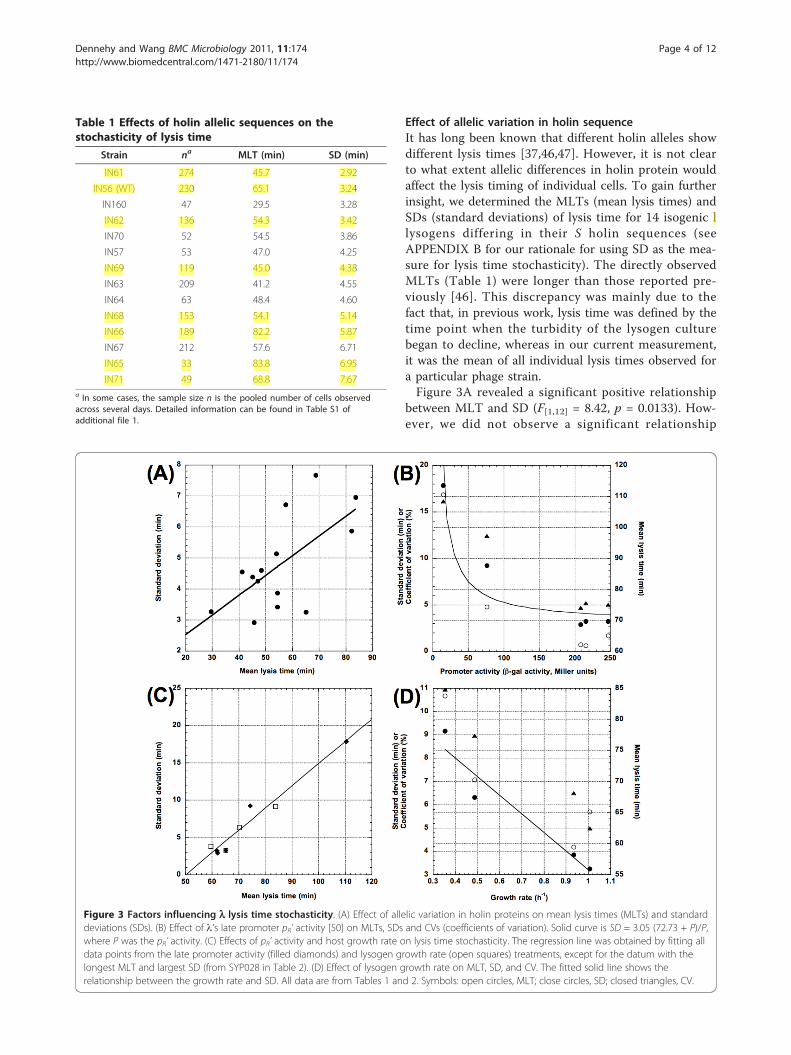
Effect of allelic variation in holin sequenceIt has long been known that different holin alleles showdifferent lysis times [37,46,47]. However, it is not clearto what extent allelic differences in holin protein wouldaffect the lysis timing of individual cells. To gain furtherinsight, we determined the MLTs (mean lysis times) andSDs (standard deviations) of lysis time for 14 isogenic llysogens differing in their S holin sequences (seeAPPENDIX B for our rationale for using SD as the mea-sure for lysis time stochasticity). The directly observedMLTs (Table 1) were longer than those reported pre-viously [46]. This discrepancy was mainly due to thefact that, in previous work, lysis time was defined by thetime point when the turbidity of the lysogen culturebegan to decline, whereas in our current measurement,it was the mean of all individual lysis times observed fora particular phage strain.Figure 3A revealed a significant positive relationship
between MLT and SD (F[1,12] = 8.42, p = 0.0133). How-ever, we did not observe a significant relationship
Figure 3 Factors influencing l lysis time stochasticity. (A) Effect of allelic variation in holin proteins on mean lysis times (MLTs) and standarddeviations (SDs). (B) Effect of l’s late promoter pR’ activity [50] on MLTs, SDs and CVs (coefficients of variation). Solid curve is SD = 3.05 (72.73 + P)/P,where P was the pR’ activity. (C) Effects of pR’ activity and host growth rate on lysis time stochasticity. The regression line was obtained by fitting alldata points from the late promoter activity (filled diamonds) and lysogen growth rate (open squares) treatments, except for the datum with thelongest MLT and largest SD (from SYP028 in Table 2). (D) Effect of lysogen growth rate on MLT, SD, and CV. The fitted solid line shows therelationship between the growth rate and SD. All data are from Tables 1 and 2. Symbols: open circles, MLT; close circles, SD; closed triangles, CV.
Table 1 Effects of holin allelic sequences on thestochasticity of lysis time
Strain na MLT (min) SD (min)
IN61 274 45.7 2.92
IN56 (WT) 230 65.1 3.24
IN160 47 29.5 3.28
IN62 136 54.3 3.42
IN70 52 54.5 3.86
IN57 53 47.0 4.25
IN69 119 45.0 4.38
IN63 209 41.2 4.55
IN64 63 48.4 4.60
IN68 153 54.1 5.14
IN66 189 82.2 5.87
IN67 212 57.6 6.71
IN65 33 83.8 6.95
IN71 49 68.8 7.67a In some cases, the sample size n is the pooled number of cells observedacross several days. Detailed information can be found in Table S1 ofadditional file 1.
Dennehy and Wang BMC Microbiology 2011, 11:174http://www.biomedcentral.com/1471-2180/11/174
Page 4 of 12
jdennehy
Highlight
jdennehy7
Highlight
jdennehy7
Highlight
jdennehy7
Highlight
jdennehy7
Highlight
jdennehy7
Highlight
jdennehy7
Highlight
jdennehy7
Highlight
jdennehy7
Highlight
between MLT and another commonly used measure ofstochasticity, the coefficient of variation (CV, defined asSD/MLT; [15,25,48,49]) (F[1,12] = 1.50, p = 0.2445), indi-cating a proportional increase of the SD with the MLT.Figure 3A also reveals a relatively scattered relationshipbetween the MLTs and the SDs (adjusted R2 = 0.363),with several instances in which strains with similarMLTs are accompanied by very different SDs. For exam-ple, the mean lysis times for IN56 and IN71 were 65.1and 68.8 min, but the SDs were 3.2 and 7.7 min, respec-tively. Apparently the observed positive relationship isonly a general trend, not an absolute. The scattering ofthe plot also suggests that different missense mutationsin the holin sequence can influence MLT and SD some-what independently.
Effect of late promoter pR’ activityTranscription of the late genes, including the holin geneS, from the pR’ promoter marks the beginning of thelate stage of the l lytic development [36]. Since themajor determinant of lysis time is thought to be when acritical holin concentration is reached in the cell mem-brane [40], reduced promoter activity should not onlylengthen the lysis time, as shown in a previous study[50], but should also increase the lysis time stochasticity[51,52].As shown in Figure 3B, our data showed a negative
relationship between the pR’ activity, and the MLTs,SDs, and CVs. However, the increase of the pR’ activityhad a diminishing influence on both the MLTs, as hasbeen shown previously [50], and the associated SDs andCVs (see Table 2). Interestingly, linear regressions (Fig-ure 3C) showed a much tighter, positive relationshipbetween the MLTs and the SDs (F[1,3] = 81.04, p =0.0029; adjusted R2 = 0.952; y = -15.7 + 0.3x) and a sig-nificant positive relationship between the MLTs andCVs (F[1,3] = 14.51, p = 0.0318, result not shown in thefigure). That is, for the WT S gene, every 1 minuteincrease in the MLT corresponds to 0.3 minute increasein lysis time stochasticity.
Effect of Host Growth RatesIn general, cells growing at a faster rate have higherconcentrations of various biosynthesis machineries [53].Since the expression of the phage holin gene is entirelydependent on the host, we hypothesized that a lowerhost growth rate would lead to a lower rate of holinprotein synthesis, thus resulting in a longer lysis timeand increased lysis time stochasticity. In the phage T4,it was shown that lysis time was negatively correlatedwith host growth rate [54].We determined the MLTs and SDs for wild-type l
lysogen grown in four different growth media: standardLB (lysogeny broth [55]), 20% LB, Davis minimal salts
medium (DM) with 20 mM glucose, and DM with 40mM glycerol, resulting in growth rates of 1.01 ± 0.07,0.93 ± 0.05, 0.49 ± 0.04, and 0.35 ± 0.01 h-1 (mean ±95% confidence limits), respectively (see Table 2). Asshown in Figure 3D, lower growth rates led to increasedlysis time SDs (F[1,2] = 24.50, p = 0.0385) and CVs (F[1,2]= 46.24, p = 0.0209). A similar negative relationship wasalso apparent for the MLTs. However, because of thecase of the LB medium, in which the higher growth rateactually resulted in a slightly longer MLT, the observednegative relationship was not significant (F[1,2] = 6.44, p= 0.1265). Interestingly, neither the SDs (F[1,2] = 16.11, p= 0.0568) nor the CVs (F[1,2] = 6.04, p = 0.133) was sig-nificantly associated with the MLTs.
Effects of KCN AdditionThe energy poison potassium cyanide, KCN, has longbeen used in phage research to trigger premature lysis[43]. Typically, after KCN addition, culture turbiditydeclines precipitously [44], indicating that individuallysis events are relatively synchronous. The KCN-induced premature lysis is thought to be mediatedthrough a collapsed proton motive force (PMF) resultingfrom a inhibition of the bacterial respiratory chain. Ashas been shown with l S holin, a 40% drop in the PMF
Table 2 Effect of late promoter activity, lysogen growthrate and KCN addition on the stochasticity of lysis time.
Treatment nc MLT (min) SD (min)
pR’ activity
IN56 (1)a 230 65.1 3.24
SYP026 (2)a 128 61.9 3.20
SYP027 (3)a 45 62.1 2.91
SYP043 (4)a 43 74.3 9.22
SYP028 (5)a 70 110.6 17.83
Growth rate
100% LBb 230 65.1 3.24
20% LB 233 59.5 3.86
DM+Glcb 125 70.3 6.30
DM+Glyb 78 83.8 9.16
KCN addition
at 25 min 72 52.1 7.12
at 30 min 67 56.6 6.85
at 32 min 61 54.0 4.74
at 34 min 46 55.7 4.33
at 35 min 161 45.4 1.86
at 45 min 151 50.1 1.83
at 55 min 158 57.6 1.45a Numbers in the brackets indicate pR’ activity ranking with 1 being thehighest and 5 being the lowest [50]; IN56 data is from Table 2.b 100%LB data is from Table 2, strain IN56; DM, Davis minimal salts medium;Glc, glucose; Gly, glycerol.
C In some cases, the sample size n is the pooled number of cells observedacross several days. Detailed information can be found in Table S2 of theaddition file 1.
Dennehy and Wang BMC Microbiology 2011, 11:174http://www.biomedcentral.com/1471-2180/11/174
Page 5 of 12
jdennehy
Highlight
jdennehy7
Highlight
jdennehy7
Highlight
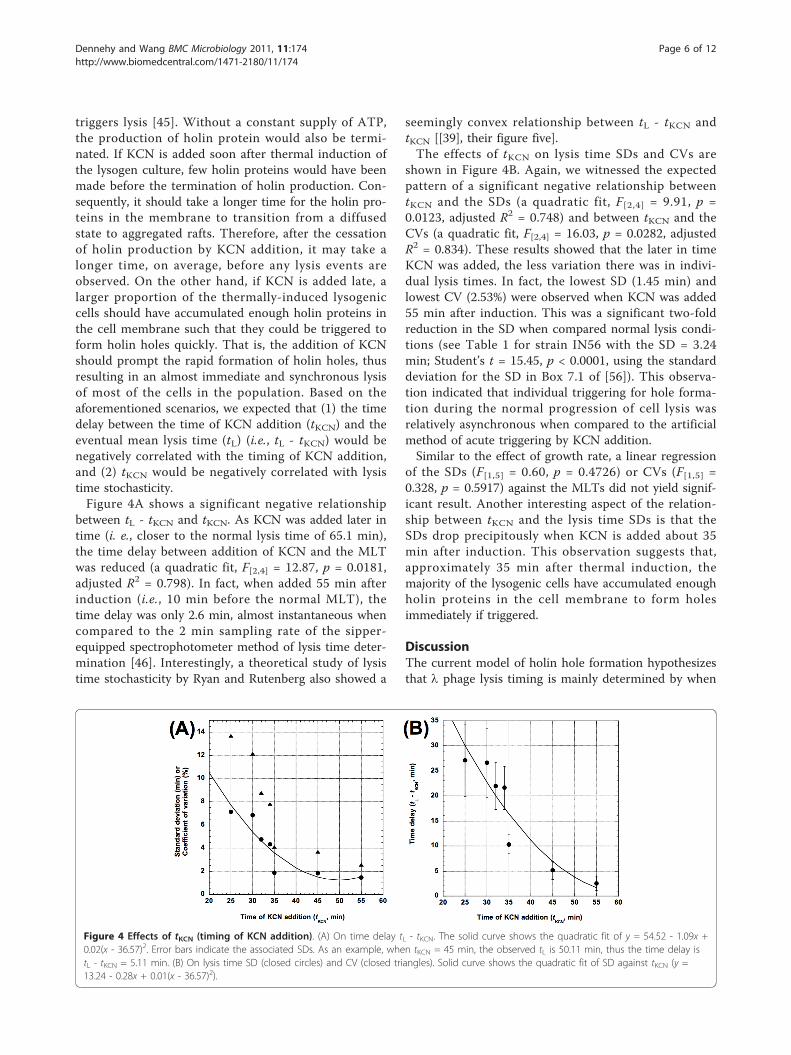
triggers lysis [45]. Without a constant supply of ATP,the production of holin protein would also be termi-nated. If KCN is added soon after thermal induction ofthe lysogen culture, few holin proteins would have beenmade before the termination of holin production. Con-sequently, it should take a longer time for the holin pro-teins in the membrane to transition from a diffusedstate to aggregated rafts. Therefore, after the cessationof holin production by KCN addition, it may take alonger time, on average, before any lysis events areobserved. On the other hand, if KCN is added late, alarger proportion of the thermally-induced lysogeniccells should have accumulated enough holin proteins inthe cell membrane such that they could be triggered toform holin holes quickly. That is, the addition of KCNshould prompt the rapid formation of holin holes, thusresulting in an almost immediate and synchronous lysisof most of the cells in the population. Based on theaforementioned scenarios, we expected that (1) the timedelay between the time of KCN addition (tKCN) and theeventual mean lysis time (tL) (i.e., tL - tKCN) would benegatively correlated with the timing of KCN addition,and (2) tKCN would be negatively correlated with lysistime stochasticity.Figure 4A shows a significant negative relationship
between tL - tKCN and tKCN. As KCN was added later intime (i. e., closer to the normal lysis time of 65.1 min),the time delay between addition of KCN and the MLTwas reduced (a quadratic fit, F[2,4] = 12.87, p = 0.0181,adjusted R2 = 0.798). In fact, when added 55 min afterinduction (i.e., 10 min before the normal MLT), thetime delay was only 2.6 min, almost instantaneous whencompared to the 2 min sampling rate of the sipper-equipped spectrophotometer method of lysis time deter-mination [46]. Interestingly, a theoretical study of lysistime stochasticity by Ryan and Rutenberg also showed a
seemingly convex relationship between tL - tKCN andtKCN [[39], their figure five].The effects of tKCN on lysis time SDs and CVs are
shown in Figure 4B. Again, we witnessed the expectedpattern of a significant negative relationship betweentKCN and the SDs (a quadratic fit, F[2,4] = 9.91, p =0.0123, adjusted R2 = 0.748) and between tKCN and theCVs (a quadratic fit, F[2,4] = 16.03, p = 0.0282, adjustedR2 = 0.834). These results showed that the later in timeKCN was added, the less variation there was in indivi-dual lysis times. In fact, the lowest SD (1.45 min) andlowest CV (2.53%) were observed when KCN was added55 min after induction. This was a significant two-foldreduction in the SD when compared normal lysis condi-tions (see Table 1 for strain IN56 with the SD = 3.24min; Student’s t = 15.45, p < 0.0001, using the standarddeviation for the SD in Box 7.1 of [56]). This observa-tion indicated that individual triggering for hole forma-tion during the normal progression of cell lysis wasrelatively asynchronous when compared to the artificialmethod of acute triggering by KCN addition.Similar to the effect of growth rate, a linear regression
of the SDs (F[1,5] = 0.60, p = 0.4726) or CVs (F[1,5] =0.328, p = 0.5917) against the MLTs did not yield signif-icant result. Another interesting aspect of the relation-ship between tKCN and the lysis time SDs is that theSDs drop precipitously when KCN is added about 35min after induction. This observation suggests that,approximately 35 min after thermal induction, themajority of the lysogenic cells have accumulated enoughholin proteins in the cell membrane to form holesimmediately if triggered.
DiscussionThe current model of holin hole formation hypothesizesthat l phage lysis timing is mainly determined by when
Figure 4 Effects of tKCN (timing of KCN addition). (A) On time delay tL - tKCN. The solid curve shows the quadratic fit of y = 54.52 - 1.09x +0.02(x - 36.57)2. Error bars indicate the associated SDs. As an example, when tKCN = 45 min, the observed tL is 50.11 min, thus the time delay istL - tKCN = 5.11 min. (B) On lysis time SD (closed circles) and CV (closed triangles). Solid curve shows the quadratic fit of SD against tKCN (y =13.24 - 0.28x + 0.01(x - 36.57)2).
Dennehy and Wang BMC Microbiology 2011, 11:174http://www.biomedcentral.com/1471-2180/11/174
Page 6 of 12
a critical concentration of holin proteins is reached inthe cell membrane [40] (Figure 1, dark arrows). Accord-ing to this model, any factor that influences the holinprotein production should also affect the timing of lysis.Furthermore, the realized rate of holin production ineach cell should also be subjected to stochastic influ-ences impacting the various upstream biochemical reac-tions, such as gene transcription and translation, thatlead to holin production. As has been shown by others,the lower the average rates of the biochemical reactions,the more prominent the cell-to-cell variation is [51,52].
Manipulation of holin production rateIn our study, we manipulated the holin production rateby manipulating the l pR’ activity and the lysogengrowth rate. We observed that, in general, treatmentsexpected to result in higher holin production rates (e.g.,high pR’ activity or high lysogen growth rate) alsoresulted in shorter MLTs and smaller SDs (Figure 3Band 3D). Furthermore, it was surprising that the com-bined MLTs and SDs, despite being from two differentexperimental treatments, namely pR’ activity and lysogengrowth rate, showed almost identical positive correla-tions, even after excluding the far-flung data point withthe longest MLT and largest SD (obtained with strainSYP028, see Table 2) from the analysis (Figure 3C). Thisresult suggests that, irrespective of how the MLT wasachieved, as long as the MLTs are the same, we shouldexpect to observe similar SDs. For the wild-type l Sholin sequence, any factor that results in 1.0 minincrease in MLT would be accompanied by a concomi-tant 0.3 min increase in the SD. It would be interestingto conduct a similar experiment with different holinsequences to see if the rate of SD increase is sequence-specific.Regarding the effects of host growth rate on lysis time
stochasticity, it is interesting to note the following. Amiret al. [10] found that the MLTs, SDs, and CVs, follow-ing UV induction, ranged from 72 min, 9 min, and12.5% respectively for l lysogens alone to 99 min, 14min, and 14.1% respectively for l lysogens carrying pR-GFP reporter plasmid and 117 min, 19 min, and 15.8%respectively for l lysogens carrying pR’-tR’-GFP reporterplasmid (all values are extracted from their figures six Aand B). Since their l lysogens were grown in M9 mini-mal salts medium plus various growth factors and 0.4%glucose at 37°C, it is similar to our Davis minimal saltsmedium with glucose, from which we obtained the com-parable values of 70.3 min, 6.3 min, and 8.96% respec-tively (see Table 2). It is not clear whether thedifference between these two SDs is the result of differ-ent methods used for lysogen induction (thermal vs. UVinduction) or different growth media, but the MLTs arevirtually identical. Their result also indirectly confirmed
our current result that host physiology (which is pre-sumably somewhat perturbed in their lysogen strainscarrying the medium-copy reporter plasmids) wouldaffect the overall MLTs and SDs of lysis time.
Manipulation of holin protein sequenceBarring potential post-translational modifications due todifferences in holin protein sequence (e.g., differentialrate in proteolysis), isogenic l strains expressing differ-ent holin sequences would have a similar average rate ofholin accumulation in the membrane and consequentlythe same distribution of holin proteins among the cellsacross different lysogen populations. That is, at anygiven moment, we would expect a certain proportion ofcells to accumulate a certain number of holin moleculesin the membrane, irrespective of the holin sequences.The observed differences in MLTs, as the result of dif-ferences in holin sequence, can be seen as a reflectionof different set-points for critical concentrations in anincreasingly crowded cell membrane [40]. Presumably, asequence with a lower set-point would not only resultin a shorter MLT, but also a smaller SD as well. How-ever, the existence of similar MLTs, but very differentSDs, suggests that missense mutations in the holinsequence not only affect the set-point for spontaneoustriggering, but also impact the robustness of the set-point. For example, some mutations may be relativelyinsensitive to the critical holin concentration, thusresulting in proportionally more cells that are triggeredearlier and later than expected, hence greater lysis timestochasticity.
Effect of energy poison KCNIt is well known that addition of the energy poison,KCN, to induced lysogen cultures will accelerate theonset of lysis [44]. Our results also confirmed thisobservation (see Table 2). However, it is not clear howthis accelerated lysis would affect the lysis time stochas-ticity. From anecdotal observations, the addition of KCNseems to synchronize lysis, thus resulting in a precipi-tous decline of lysogen culture turbidity. Our studyshowed that the timing of KCN addition was inverselyrelated to lysis time stochasticity (see Figure 4B). In fact,the smallest SD (1.45 min) was achieved by adding KCNat 55 min after thermal induction (see Table 2), a timewhere normally only about 1% of the cells have lysed.The almost synchronous lysis when KCN was added 55min post thermal induction suggests that most cellswould have already accumulated enough holin proteinsin the cell membrane to form a hole.Besides collapsing the PMF, the addition of KCN should
also halt the production of holin protein, thus “fixes” theamount of holin proteins on the cell membrane at thetime of addition. The progressive decline in lysis time
Dennehy and Wang BMC Microbiology 2011, 11:174http://www.biomedcentral.com/1471-2180/11/174
Page 7 of 12
jdennehy
Highlight
jdennehy
Highlight
stochasticity as KCN was added later in time (see Figure4B) strongly suggests that a larger supply of holin proteinis a key factor in ensuring synchronous lysis. As moreholin proteins are inserted into the cell membrane, thekinetics of raft formation gradually shifts from stochasticto deterministic and synchronous. In fact, there was anearly five-fold decrease in lysis time stochasticity whenthe PMF was collapsed at 55 min after lysogen inductionwhen compared to collapse at 25 min (see Table 2). It isalso noted that the properties of the normally triggeredand the prematurely triggered holin holes are quite dis-tinct, with the prematurely triggered holes being muchsmaller than the normally triggered holes [28].
Evolutionary implication of lysis time stochasticityBoth theoretical and experimental studies have demon-strated the importance of lysis timing on phage fitness[46,57-61]. However, it is not clear if lysis time stochas-ticity would have any impact on phage fitness. All elsebeing equal, genotypes with reduced variances in off-spring number would, in the long run, have higher fit-ness than genotypes that have the same mean offspringnumber, but larger variances [62,63]. Overall, this sug-gests that natural selection would tend to minimize sto-chasticity in phenotypes that are closely linked toDarwinian fitness. If the phage burst size is positivelylinked with the lysis time, as has been shown previously[46], then selection for reduced burst size stochasticityshould lead to reduced lysis time stochasticity as well.Presumably, this hypothesis can be tested by competingtwo isogenic phage strains that have the same MLTsbut very different lysis time SDs. Interestingly, inspec-tion of Table 1 revealed that mutations introduced intoWT l holin sequence usually result in increased sto-chasticity, except in one case. It is not clear if thisobservation implies that the WT holin sequences havealready been selected for reduced stochasticity in thewild as well. Experiments with more phage holinsshould provide some hints in this respect.
ConclusionsEven in a seemingly uniform environment, the lysis timecan vary greatly among individual l lysogenic cells (lysistime stochasticity). The extent of stochasticity, as quan-tified by the standard deviation, depends on the quality(due to isogenic l lysogens expressing different S pro-tein alleles) and quantity (manipulated by having differ-ent pR’ activities and lysogen growth rates) of the holinprotein, the major determinant of lysis timing in large-genome phages. There is a general positive trendbetween the mean lysis time and the degree of stochasti-city. However, this positive relationship is much tighterwhen difference in mean lysis time is due to holin quan-tity rather than quality. The pattern of lysis time
stochasticity obtained by addition of KCN at varioustime points after lysogen induction showed a negativerelationship between the timing of KCN addition andthe level of lysis time stochasticity.
Appendix AThis section provides the rationale for partitioning lysistime variance found in the study by Amir et al. [10].For each UV-induced l lysogenic cell, the lysis time T
can be divided into three time intervals: (1) t1, the timeinterval between lysogen induction and the onset of pRpromoter, (2) t2, the time interval between the onset ofthe pR promoter and the onset of the pR’ promoter, and(3) t3, the time interval between the onset of the pR’promoter and the eventual lysis. The following relation-ships describe the above time intervals and the empiri-cally determined time intervals by Amir et al. [10]: t1 =tpR, t1 + t2 = tpR’-tR’, t1 + t2 + t3 = tlysis, and t3 = Δt = tly-sis - tpR’-tR’.For, T = t1 + t2 + t3, the variance for the lysis time
can be expressed as VAR(T) = VAR(t1) + VAR(t2) +VAR(t3) + 2COV (t1, t2) + 2COV (t2, t3) + 2COV (t1, t3).While the authors did not provide all possible combina-tions of covariance, it is empirically determined thatCOV(t1 + t2, t3) = 0, as shown in their figure seven E (i.e., no correlation between tpR’-tR’ and Δt). That is, COV(t1 + t2, t3) = COV(t1, t3) + COV(t2, t3) = 0. Althoughnot empirically demonstrated, it seems unlikely that thetiming of turning on either the pR or pR’ promoterwould have a positive or negative effect on the assemblyof lysis apparatus such that their effects would canceleach other out, resulting in the observed COV(t1, t3) +COV(t2, t3) = 0. Most likely, time intervals are mutuallyindependent, i.e., COV(t1, t3) = COV(t2, t3) = 0.The standard deviations ("absolute noise” in their ter-
minology) for tpR’-tR’ and tlysis can be extracted fromtheir figure six A using data determined from cells car-rying the pR’-tR’-GFP plasmid. The estimated SDs fortpR’-tR’ and tlysis are ~10 min and ~18 min, respectively;therefore, VAR(tpR’-tR’) = ~100 and VAR(tlysis) = ~324.The SD for tpR can be estimated by extrapolating theline connecting between lysis and pR’ onset to the 20min mean time at the x-axis (based on the result fromcells carrying the pR-GFP plasmid in their figure six A).The corresponding SD for tpR is ~7 min, thus VAR(tpR)= ~49. Taken together, VAR(t1) = 49, VAR(t2) = 51 (=VAR(t1 + t2) - VAR(t1) = 100 - 49 ), and VAR(t3) = 224(= VAR(t1 + t2 + t3) - VAR(t1 + t2) = 324 - 100). Thatis, VAR(t1), VAR(t2), and VAR(t3) contributed to 15%,16%, and 69% of total lysis time variance, respectively.
Appendix BStudies of molecular stochasticity typically use the coef-ficient of variation (CV) as the measurement for the
Dennehy and Wang BMC Microbiology 2011, 11:174http://www.biomedcentral.com/1471-2180/11/174
Page 8 of 12
degree of stochasticity [15,25,48,49]. Since CV is a com-posite statistic (defined as standard deviation/mean), itis sometimes difficult to discern whether an increase inthe observed stochasticity (as quantified by CV) is dueto decrease in mean or increase in SD. In some cases, adifferent metric, such as phenotypic noise strength(defined as variance/mean) [17,20], or a slight variant ofit (defined as variance/squared mean) [19], has beenused as well. Many times, it is not clear why a particularmetric is used, except in the instance where the pheno-typic noise strength is used to test against an a prioriexpectation of a Poisson distribution, for which var-iance/mean = 1.It is understandable why the CV, or a variant, is used
in certain situations. For example, if the means are dras-tically different from each other or a comparison ismade between measurements using different units [[56],pp. 57-59.]. In our study, however, the means were notvery different and the same measuring unit (i.e., min)was used. Therefore, we presented our means and SDsseparately and then jointly as CVs. Except in oneinstance where presenting stochasticity as SD or CVmakes a difference (i.e., effect of genotype on SD or CVvs. MLT), all the other results showed that SD and CVfollowed the same trend. Since CV can be derived fromSD and mean, no information is lost by presenting themseparately. Furthermore, when the stochasticity (or noisedistribution) is not apparent, it may be advisable to pre-sent results as means and SDs (and if necessary, highermoments like skewness and kurtosis) separately, so thatthe impact of various experimental treatments on thenoise distribution can be fully appreciated.
MethodsBacterial strainsAll bacteria and phage strains used in this study are listedin Table 3. The copy number of l genome was checkedby PCR following the method of Powell et al. [64].
Experimental instrumentationE. coli cells lysogenic for l phage were induced andobserved to lyse in a temperature-controlled perfusionchamber. The experimental apparatus consisted of a 250mL side-arm (on bottom) medium bottle clamped to anelevated support with tubing leading to an inline heater(SH-27B, Warner Instruments, New Haven, CT) thatwas controlled by a dual channel heater controller (TC-344B, Warner Instruments, New Haven, CT). Thegrowth medium, flowing at a rate of ~1 mL/min (drivenby gravity) and heated by the inline heater to the desiredtemperature, was introduced to a 358 μL perfusionchamber (RC-21B, Warner Instruments, New Haven,CT) mounted on a heating platform (PM2, WarnerInstruments, New Haven, CT) that was controlled by
the same dual channel heater controller to maintain thedesired temperature. The internal temperature of theperfusion chamber was independently monitored by athermistor. Waste flowed out of the perfusion chamber,pooled in a reservoir, and was siphoned into a 2 L bottleby a vacuum source. Both the perfusion chamber andthe heating platform were placed on the stage of aninverted microscope (TS100, Nikon) for observation at400× magnification. One of the microscope’s ocularlenses was replaced with a 10X MiniVID™ microscopecamera (LW Scientific, Norcross, GA) to record indivi-dual lysis events onto a laptop computer at the rate of 1frame per second. All data were collected in unit of sec-onds, though the results were presented in minutes.
Sample preparation and lysis time determinationLysogens were cultured overnight in LB or minimal saltsmedia (see below) at 30°C on a rolling drum. Stationaryphase cultures were diluted 100-fold in LB or minimalsalts media, then grown to A550 ~ 0.2. 200 μL of expo-nentially growing cells were immobilized on a 22 mmsquare glass coverslip that has been pretreated with
Table 3 Bacterial strains used in this study
Strain Relevant Genotypea Source
IN56 MC4100 (l cI857 S) [46]
IN57 MC4100 (l cI857 SC51S) unpublishedstrain
IN61 MC4100 (l cI857 S105C51S) [46]
IN62 MC4100 (l cI857 S105) [46]
IN63 MC4100 (l cI857 S105C51S/S76C) [46]
IN64 MC4100 (l cI857 SC51S/F94C) [46]
IN65 MC4100 (l cI857 S105C51S/F94C) unpublishedstrain
IN66 MC4100 (l cI857 SS68C) [46]
IN67 MC4100 (l cI857 S105C51S/I13C) [46]
IN68 MC4100 (l cI857 S105C51S/L14C) [46]
IN69 MC4100 (l cI857 SC51S/L14C) [46]
IN70 MC4100 (l cI857 SC51S/F78C) unpublishedstrain
IN71 MC4100 (l cI857 S105C51S/F78C) unpublishedstrain
IN160 MC4100 (l cI857 SA52G Cam) unpublishedstrain
SYP026 MC4100 (l cI857 pR’-M2), with pR’mutations
[50]
SYP027 MC4100 (l cI857 pR’-M1), with pR’mutations
[50]
SYP028 MC4100 (l cI857 pR’-M5), with pR’mutations
[50]
SYP043 MC4100 (l cI857 pR’-M4), with pR’mutations
[50]
a S denotes wild-type holin gene, when expressed would produce both theS105 holin and S107 antiholin proteins. S105 signifies the mutant holin genewith its first codon altered from ATG (Met) to TTG (Leu), thus only producesthe S105 holin protein.
Dennehy and Wang BMC Microbiology 2011, 11:174http://www.biomedcentral.com/1471-2180/11/174
Page 9 of 12
0.01% tissue-culture tested poly-L-lysine (mol. wt. 150 K- 300 K, Sigma, St. Louis, MO) at room temperature for30 min. After assembling the perfusion chamber, thedevice was immediately placed on the heating platformand infused with heated medium to maintain the cham-ber temperature at 30°C for 30 min to stabilize the cells.To induce lysis, the chamber temperature was raised to42°C for 15 min, and then dropped to 37°C for theduration of the observation period (i.e., until ~95% ofcells are lysed). Video recording was initiated at thetime when the temperature was raised to 42°C. Underthese conditions, it usually takes less than 5 min for thetemperature to rise from 30°C to 42°C, a transition com-parable to shifting culture flasks from a 30°C to 42°Cwaterbath shaker. Some experiments were performed byadding KCN to the growth medium in the sidearm fee-der bottle to a final concentration of 20 mM.Videos were subsequently analyzed using Windows
Media Player™ playback. The times of individual lysisevents were then noted visually and recorded manually.The lysis time was defined as the time from the initia-tion of the first temperature shift to when the image ofthe cell disappeared from view. In general, it takes abouta few seconds (frames) for lysing cells to fully disappearfrom view (Figure 1A).
Determination of lysogen growth rateLysogen growth rate was manipulated by using differ-ent growth medium formulations: (i) full-strength LB(10 g tryptone, 5 g yeast extract, 10 g NaCl per LdH2O), (ii) one-fifth-strength LB (2 g tryptone, 1 gyeast extract, 10 g NaCl per L dH2O), (iii) 20 mM glu-cose in Davis minimal salts (7 g K2HPO4, 2 gKH2PO4, 1 g (NH4)2SO4, 0.5 g sodium citrate•2H2O,and 0.2 g MgSO4•7H2O), and (iv) 40 mM glycerol inDavis minimal salts. We assessed the growth of thelysogen strain IN56 by culturing it overnight at 30°Cin each growth media. The next day, 90 μL of theovernight culture was used to inoculate 25 mL growthmedium and the culture was placed in a 30°C water-bath shaker at 220 rpm. Culture growth was followedwith a sipper-equipped spectrophotometer at A550.The growth rate was calculated as the slope of the lin-ear regression of natural-logarithm transformed A550
values over time.
Statistical analysisIn most cases, data collection for a given strain ortreatment spanned several days. Therefore, even forthe same lysogen strain or experimental treatment themeans and/or variances may be significantly differentamong data collected from different dates. Weconducted a preliminary exploration of our data setusing the software package JMP version 7.0.2, as
implemented in MacOS operating system. For eachlysogen strain or experimental treatment, the meansand standard deviations (SDs) were extracted from thedata set according to the date the data were collectedand were treated as replicates. Pairwise comparisons ofthe means (using the Tukey-Kramer HSD test) showedthat, for more than half of the cases, at least one meanwas significantly different from the others. Since wewere mainly interested in the variation, we subse-quently converted all values into their correspondingresiduals (centered by their corresponding means). Wealso tested the homogeneity of variance from each datereplicate, using O’Brien’s test, Brown-Forsythe test,Levene’s test, and Bartlett’s test, all implemented inJMP. Not surprisingly, more than half of the casesshowed that at least one replicate variance was signifi-cantly different from the others. Although we did nothave an a priori expectation of lysis time distribution,we nonetheless tested to see if the lysis time in eachreplicate is normally distributed or not, using the Sha-piro-Wilk W test. Again, in many cases, the replicatesdo not show a normal distribution. Despite variabilityin our data set, none of our conclusions were funda-mentally changed. Therefore, for the presented results,the mean and standard deviation for each lysogenstrain or experimental treatment were calculated basedon the following criteria: (i) if the means and varianceswere the same among all blocks, then all the datawould be pooled together to estimate the combinedmeans and SDs, (ii) if the means were significantly dif-ferent, but the variances were the same among allblocks, then the mean would be estimated by averagingthe block means while the SDs would be estimated bypooled residuals, and (iii) if the means and varianceswere significantly different among all blocks, then themeans and SDs would be estimated by averaging blockmeans and SDs. For details of our data set, see addi-tional file 1.
Additional material
Additional file 1: Sample sizes and standard deviations. Moredetailed data sets for both Table 1 and Table 2.
AcknowledgementsThe authors are grateful for insightful comments from Tom Caraco, AndrewRutenberg, Gillian Ryan, Samuel Sheppard and several anonymous reviewers.The authors would also like to thank Yongping Shao for the initial setup ofthe experimental apparatus and Kuangnan Xiong for technical assistance.This work was supported by grant GM072815 from the National Institutes ofHealth to INW. During manuscript preparation, JJD was supported by grantsfrom the Professional Staff Congress of the City University of New York andthe National Science Foundation (Division of Environmental Biology Award#0804039 and Division of Molecular and Cellular Biosciences Award#0918199).
Dennehy and Wang BMC Microbiology 2011, 11:174http://www.biomedcentral.com/1471-2180/11/174
Page 10 of 12
Author details1Department of Biological Sciences, University at Albany, 1400 WashingtonAvenue, Albany, NY 12222, USA. 2Biology Department, Queens College, andthe Graduate Center of the City University of New York, Flushing, NY 11367,USA.
Authors’ contributionsJJD was responsible for conducting all the relevant experiments, dataanalyses, and the preparation of the manuscript. INW was responsible forthe supervision, data analyses, and preparation of the manuscript. Bothauthors read and approved the final manuscript.
Competing interestsThe authors declare that they have no competing interests.
Received: 1 December 2010 Accepted: 2 August 2011Published: 2 August 2011
References1. Avery SV: Microbial cell individuality and the underlying sources of
heterogeneity. Nat Rev Microbiol 2006, 4:577-587.2. Longo D, Hasty J: Dynamics of single-cell gene expression. Mol Syst Biol
2006, 2:64.3. Losick R, Desplan C: Stochasticity and cell fate. Science 2008, 320:65-68.4. Rao CV, Wolf DM, Arkin AP: Control, exploitation and tolerance of
intracellular noise. Nature 2002, 420:231-237.5. Raser JM, O’Shea EK: Noise in gene expression: origins, consequences,
and control. Science 2005, 309:2010-2013.6. Davidson CJ, Surette MG: Individuality in bacteria. Annu Rev Genet 2008,
42:253-268.7. Fraser D, Kaern M: A chance at survival: gene expression noise and
phenotypic diversification strategies. Mol Microbiol 2009, 71:1333-1340.8. McAdams HH, Arkin A: It’s a noisy business! Genetic regulation at the
nanomolar scale. Trends Genet 1999, 15:65-69.9. Veening JW, Smits WK, Kuipers OP: Bistability, epigenetics, and bet-
hedging in bacteria. Annu Rev Microbiol 2008, 62:193-210.10. Amir A, Kobiler O, Rokney A, Oppenheim AB, Stavans J: Noise in timing
and precision of gene activities in a genetic cascade. Mol Syst Biol 2007,3:71.
11. Arkin A, Ross J, McAdams HH: Stochastic kinetic analysis ofdevelopmental pathway bifurcation in phage λ-infected Escherichia colicells. Genetics 1998, 149:1633-1648.
12. Pearl S, Gabay C, Kishony R, Oppenheim A, Balaban NQ: Nongeneticindividuality in the host-phage interaction. PLoS Biol 2008, 6:e120.
13. St-Pierre F, Endy D: Determination of cell fate selection during phagelambda infection. Proc Natl Acad Sci USA 2008, 105:20705-20710.
14. Cai L, Friedman N, Xie XS: Stochastic protein expression in individual cellsat the single molecule level. Nature 2006, 440:358-362.
15. Elowitz MB, Levine AJ, Siggia ED, Swain PS: Stochastic gene expression ina single cell. Science 2002, 297:1183-1186.
16. Ito Y, Toyota H, Kaneko K, Yomo T: How selection affects phenotypicfluctuation. Mol Syst Biol 2009, 5:264.
17. Ozbudak EM, Thattai M, Kurtser I, Grossman AD, van Oudenaarden A:Regulation of noise in the expression of a single gene. Nat Genet 2002,31:69-73.
18. Maamar H, Raj A, Dubnau D: Noise in gene expression determines cellfate in Bacillus subtilis. Science 2007, 317:526-529.
19. Bar-Even A, Paulsson J, Maheshri N, Carmi M, O’Shea E, Pilpel Y, Barkai N:Noise in protein expression scales with natural protein abundance. NatGenet 2006, 38:636-643.
20. Blake WJ, M KA, Cantor CR, Collins JJ: Noise in eukaryotic gene expression.Nature 2003, 422:633-637.
21. Fraser HB, Hirsh AE, Giaever G, Kumm J, Eisen MB: Noise minimization ineukaryotic gene expression. PLoS Biol 2004, 2:e137.
22. Acar M, Mettetal JT, van Oudenaarden A: Stochastic switching as asurvival strategy in fluctuating environments. Nat Genet 2008, 40:471-475.
23. Ansel J, Bottin H, Rodriguez-Beltran C, Damon C, Nagarajan M, Fehrmann S,Francois J, Yvert G: Cell-to-cell stochastic variation in gene expression is acomplex genetic trait. PLoS Genet 2008, 4:e1000049.
24. Blake WJ, Balazsi G, Kohanski MA, Isaacs FJ, Murphy KF, Kuang Y, Cantor CR,Walt DR, Collins JJ: Phenotypic consequences of promoter-mediatedtranscriptional noise. Mol Cell 2006, 24:853-865.
25. Bishop AL, Rab FA, Sumner ER, Avery SV: Phenotypic heterogeneity canenhance rare-cell survival in ‘stress-sensitive’ yeast populations. MolMicrobiol 2007, 63:507-520.
26. Wang IN, Smith DL, Young R: HOLINS: The Protein Clocks ofBacteriophage Infections. Annu Rev Microbiol 2000, 54:799-825.
27. Young R, Wang IN, Roof WD: Phages will out: strategies of host cell lysis.Trends Microbiol 2000, 8:120-128.
28. Wang IN, Deaton J, Young R: Sizing the holin lesion with an endolysin-β-galactosidase fusion. J Bacteriol 2003, 185:779-787.
29. Savva CG, Dewey JS, Deaton J, White RL, Struck DK, Holzenburg A,Young R: The holin of bacteriophage lambda forms rings with largediameter. Mol Microbiol 2008, 69:784-793.
30. Park T, Struck DK, Dankenbring CA, Young R: The pinholin of lambdoidphage 21: control of lysis by membrane depolarization. J Bacteriol 2007,189:9135-9139.
31. Xu M, Arulandu A, Struck DK, Swanson S, Sacchettini JC, Young R: Disulfideisomerization after membrane release of its SAR domain activates P1lysozyme. Science 2005, 307:113-117.
32. Xu M, Struck DK, Deaton J, Wang IN, Young R: A signal-arrest-releasesequence mediates export and control of the phage P1 endolysin. ProcNatl Acad Sci USA 2004, 101:6415-6420.
33. Zhang N, Young R: Complementation and characterization of the nestedRz and Rz1 reading frames in the genome of bacteriophage lambda. MolGen Genet 1999, 262:659-667.
34. Berry J, Summer EJ, Struck DK, Young R: The final step in the phageinfection cycle: the Rz and Rz1 lysis proteins link the inner and outermembranes. Mol Microbiol 2008, 70:341-351.
35. Young R, Way J, Way S, Yin J, Syvanen M: Transposition mutagenesis ofbacteriophage lambda: a new gene affecting cell lysis. J Mol Biol 1979,132:307-322.
36. Friedman DI, Gottesman M: Lytic mode of lambda development. InLambda II. Edited by: Hendrix RW,Roberts JW,Stahl FW,Weisberg RA. ColdSpring Harbor, New York: Cold Spring Harbor Laboratory; 1983:21-51.
37. Gründling A, Bläsi U, Young R: Genetic and biochemical analysis of dimerand oligomer interactions of the lambda S holin. J Bacteriol 2000,182:6082-6090.
38. Dewey JS, Savva CG, White RL, Vitha S, Holzenburg A, Young R: Micron-scale holes terminate the phage infection cycle. Proc Natl Acad Sci USA2010, 107:2219-2223.
39. Ryan GL, Rutenberg AD: Clocking out: modeling phage-induced lysis ofEscherichia coli. J Bacteriol 2007, 189:4749-4755.
40. White R, Chiba S, Pang T, Dewey JS, Savva CG, Holzenburg A, Pogliano K,Young R: Holin triggering in real time. Proc Natl Acad Sci USA 2010,108:798-803.
41. Ellis EL, Delbrück M: The growth of bacteriophage. J Gen Physiol 1939,22:365-384.
42. Delbrück M: The growth of bacteriophage and lysis of the host. J GenPhysiol 1940, 23:643-660.
43. Doermann AH: The intracellular growth of bacteriophages. I. Liberationof intracellular bacteriophage T4 by premature lysis with another phageor with cyanide. J Gen Physiol 1952, 35:645-656.
44. Young R: Bacteriophage lysis: mechanism and regulation. Microbiol Rev1992, 56:430-481.
45. Gründling A, Manson MD, Young R: Holins kill without warning. Proc NatlAcad Sci USA 2001, 98:9348-9352.
46. Wang IN: Lysis timing and bacteriophage fitness. Genetics 2006, 172:17-26.47. Raab R, Neal G, Garrett J, Grimaila R, Fusselman R, Young R: Mutational
analysis of bacteriophage lambda lysis gene S. J Bacteriol 1986,167:1035-1042.
48. Swain PS, Elowitz MB, Siggia ED: Intrinsic and extrinsic contributions tostochasticity in gene expression. Proc Natl Acad Sci USA 2002,99:12795-12800.
49. Raj A, Peskin CS, Tranchina D, Vargas DY, Tyagi S: Stochastic mRNAsynthesis in mammalian cells. PLoS Biol 2006, 4:1707-1719.
50. Shao Y, Wang IN: Effect of late promoter activity on bacteriophage λfitness. Genetics 2009, 181:1467-1475.
Dennehy and Wang BMC Microbiology 2011, 11:174http://www.biomedcentral.com/1471-2180/11/174
Page 11 of 12
51. Gillespie DT: Exact stochastic simulation of coupled chemical reactions. JPhys Chem 1977, 81:2340-2361.
52. McAdams HH, Arkin A: Stochastic mechanisms in gene expression. ProcNatl Acad Sci USA 1997, 94:814-819.
53. Bremer H, Dennis PP: Modulation of chemical composition and otherparameters of the cell by growth rate. In Escherichia coli and Salmonellatyphimurium Cellular and Molecular Biology. Volume 2. Edited by: IngrahamJL,Low KB,Magasanik B,Schaechter M,Umbarger HE. Washington, D.C.:American Society for Microbiology; 1987:1527-1542.
54. Hadas H, Einav M, Fishov I, Zaritsky A: Bacteriophage T4 developmentdepends on the physiology of its host Escherichia coli. Microbiology 1997,143:179-185.
55. Bertani G: Lysogeny at mid-twentieth century: P1, P2, and otherexperimental systems. J Bacteriol 2004, 186:595-600.
56. Sokal RR, Rohlf FJ: Biometry. New York, New York: W. H. Freeman andCompany;, 3 1995.
57. Abedon ST: Selection for bacteriophage latent period length by bacterialdensity: A theoretical examination. Microb Ecol 1989, 18:79-88.
58. Abedon ST, Herschler TD, Stopar D: Bacteriophage latent-period evolutionas a response to resource availability. Appl Environ Microbiol 2001,67:4233-4241.
59. Heineman RH, Bull JJ: Testing optimality with experimental evolution:lysis time in a bacteriophage. Evolution 2007, 61:1695-1709.
60. Shao Y, Wang IN: Bacteriophage adsorption rate and optimal lysis time.Genetics 2008, 180:471-482.
61. Wang IN, Dykhuizen DE, Slobodkin LB: The evolution of phage lysistiming. Evol Ecol 1996, 10:545-558.
62. Gillespie JH: Nautural selection for within-generation variance inoffspring number. Genetics 1974, 76:601-606.
63. Gillespie JH: Natural selection for variances in offspring numbers: a newevolutionary principle. Am Nat 1977, 111:1010-1014.
64. Powell BS, Rivas MP, Court DL, Nakamura Y, Turnbough CL Jr: Rapidconfirmation of single copy lambda prophage integration by PCR.Nucleic Acids Res 1994, 22:5765-5766.
doi:10.1186/1471-2180-11-174Cite this article as: Dennehy and Wang: Factors influencing lysis timestochasticity in bacteriophage l. BMC Microbiology 2011 11:174.
Submit your next manuscript to BioMed Centraland take full advantage of:
• Convenient online submission
• Thorough peer review
• No space constraints or color figure charges
• Immediate publication on acceptance
• Inclusion in PubMed, CAS, Scopus and Google Scholar
• Research which is freely available for redistribution
Submit your manuscript at www.biomedcentral.com/submit
Dennehy and Wang BMC Microbiology 2011, 11:174http://www.biomedcentral.com/1471-2180/11/174
Page 12 of 12
Related Documents

![BACTERIOPHAGE-RESISTANT AND BACTERIOPHAGE-SENSITIVE ...halsmith/phagemutantsubmitted_2.pdf · BACTERIOPHAGE-RESISTANT AND BACTERIOPHAGE-SENSITIVE BACTERIA IN A CHEMOSTAT ... [22],](https://static.cupdf.com/doc/110x72/5b3839687f8b9a5a518d2ce1/bacteriophage-resistant-and-bacteriophage-sensitive-halsmithphagemutantsubmitted2pdf.jpg)