•

Welcome message from author
This document is posted to help you gain knowledge. Please leave a comment to let me know what you think about it! Share it to your friends and learn new things together.
Transcript
Loughborough UniversityInstitutional Repository
Factors in�uencing themucosal immune response to
exercise
This item was submitted to Loughborough University's Institutional Repositoryby the/an author.
Additional Information:
• A Doctoral Thesis. Submitted in partial ful�lment of the requirements forthe award of Doctor of Philosophy of Loughborough University
Metadata Record: https://dspace.lboro.ac.uk/2134/12325
Publisher: c© Judith Allgrove
Please cite the published version.
This item was submitted to Loughborough University as a PhD thesis by the author and is made available in the Institutional Repository
(https://dspace.lboro.ac.uk/) under the following Creative Commons Licence conditions.
For the full text of this licence, please go to: http://creativecommons.org/licenses/by-nc-nd/2.5/

University library
11111 Loughborough .. University
Author/Filing Title ...... A.!::b.tf.P9..v..Sj .. :;r.~ ........................................................................................
C · ~ lass Mark .................................................................... .
. •. Please note that fines are charged on ALL . . overdue items.
0403586313
11111111111111111 111111111111111111111111

- - - ----------------------------------------------------------------------
FACTORS INFLUENCING THE MUCOSAL IMMUNE
RESPONSE TO EXERCISE
by
Judith Allgrove
A Doctoral Thesis
Submitted in partial fulfilment of the requirements for the award of Doctor of Philosophy of
Loughborough University
© by J. Allgrove (2007)
Date ~f sf ocr Class
Ace ~~ No. Of'03::::.v~ 31.3
General Abstract
Despite the abundance of research conducted into the effects of exercise on mucosal
immunity the results remain controversial. Much of the inconsistencies arise from the
exercise protocols, the participants studied and their nutritional status, as well as
methodological and analytical differences. The purpose of this thesis was to examine the
influence of some of these factors, and to investigate potential means of enhancing the
mucosal immune response to exercise. In study 1 (Chapter 3) it was shown that a fed or
fasted state 2 h prior to exercise had no effect on the s-IgA concentration or secretion rate
during prolonged exercise. However, when participants were fed during exercise (Chapter 4),
the secretion rate of salivary antimicrobial proteins lysozyme and a-amylase increased, but s
IgA remained unchanged. These changes were likely due to the activation of mechanical and
gustatory receptors leading to a reflex stimulation of protein secretion via the autonomic
nerves, rather than changes in stress hOnliones, since cortisol did not change significantly
during exercise. Study 3 (Chapter 5) extended these findings where it was demonstrated that
chewing flavoured gum during exercise enhanced lysozyme and a-amylase secretion but
resulted in a small reduction in s-IgA secretion rate. Salivary antimicrobial proteins are
affected by the exercise intensity since both s-IgA and lysozyme secretion rate increased
post -exercise following an incremental test to exhaustion, but not after exercise at 50%
Y02max. Moreover, lysozyme secretion rate was also elevated following exercise at 75%
Y02mru<, whereas s-IgA remained unchanged. These effects are thought to be mediated by
increased sympathetic nervous system activity reflected by the concomitant increases in (l
amylase and chromogranin A, rather than the hypothalamic-pituitary-adrenal axis. Resting
mucosal immunity exhibits significant gender differences. In study 1 (Chapter 3) s-IgA
concentration, secretion rate and osmolality were found to be lower in females than in males
at rest. In addition, saliva flow rate was found to be lower in females compared with males in

study 5 (Chapter 7). However, these differences did not appear to influence the salivary
responses to acute exercise or exercise training. Chronic exercise training in elite male and
female swimmers resulted in lower levels of s-IgA secretion rate following periods of intense
training prior to competition compared with post-competition (Chapter 7), but these levels
were not directly associated with reported episodes of respiratory illness.
Key words: saliva flow rate, s-IgA, exercise, lysozyme, a-amylase, nutrition, gender, URTI
ii
Acknowledgments
Firstly, I would like to thank my supervisor Professor Mike Gleeson. It has been a pleasure
and an inspiration to have worked alongside him for three years. His help and guidance
throughout the whole of my PhD has been invaluable. He has always made time to see me
despite his other important commitments, and he has provided me with many exceptional
opportunities and experiences that I will take with me into my professional life. I am very
honoured to have worked with him.
I would also like to thank my fellow colleagues Gary Walker and Glen Davison who were
there at the beginning of my PhD to show me the ropes and lend a helping hand in some of
the studies. I am extremely grateful for their guidance and instruction on some of the
analytical techniques used. I would also like to acknowledge the help of Marta Oliveira who I
worked alongside in Chapters 4 and 5. Her organisational skills and enthusiasm enabled the
successful running of the studies.
My thanks also go to the MSc and undergraduate students who worked on these studies for
their research projects (Chapters 3, 4, 5 and 6). They assisted in collecting some of the
measurements such as respiratory gas, HR, RPE and generally looked after the welfare of the
participants. Some of the data from these studies was then used to write up their dissertations
independently. None of this research would have been possible without the participation of
the volunteers, and my thanks go to them for their dedication and commitment to the studies.
I would also like to thank Dr Mike Peyrebrune, lan Turner and British Swimming for
allowing me to work with them on my research (Chapter 7); and Nestle Ltd and Wrigley Ltd
for their financial support in studies 2 and 3 (Chapters 4 and 5).
iii
---------------------------------------------------------------------------,
Finally, I would like to thank my family and partner Jussi for their support throughout my
studies. Without their help and encouragement, this work would not have been possible.
IV
Publications
Journal articles
Allgrove 1. E., Gomes, E., Hough, 1. and Gleeson, M. (2008). Effect of exercise intensity on
salivary antimicrobial proteins and markers of stress in active men. Journal of Sports
Sciences, 26: 653-661.
Conference contributions
Allgrove, 1. and Gleeson, M. (2006). Effect of a fed or fasted state on the salivary
immunoglobulin A response to exercise. Proceedings of the 11th annual Congress of the
European College of Sport Science, P211.
Allgrove, 1. E., Gomes, E., Hough, 1. and Gleeson, M. (2007). Effect of exercise intensity on
salivary lysozyme, chromogranin A and cortisol in active men. Proceedings of the 12th
annual Congress of the European College of Sport Science.
Allgrove, 1. E, Gallen A. and Gleeson, M. (2007). Effect of stimulating saliva flow on the
changes in salivary secretion of IgA, lysozyme and a-amylase with prolonged exhaustive
exercise. Proceedings of the 8th ISEI Symposium.
Gomes, E., Allgrove 1. E., Hough, 1. and Gleeson, M. (2007). Salivary immunoglobulin A
and a-amylase responses to short duration cycling exercise at different intensities in
moderately active men. Proceedings of the British Association of Sport and Exercise Sciences
Annual Conference.
v
- ---------------------------------------------------------------------------
Contents
General Abstract ........................................................................................................................ i
Acknowledgments .................................................................................................................. iji
Publications ................................................................................................................................. v
Contents ................................................................................................................................... vi
List of Tables ............................................................................................................................. xi
L · fF' .. 1St 0 Igures ............................................................................................................................... Xll
List of Abbreviations ............................................................................................................ xiv
Chapter 1 - Literature Review ................................................................................................ 1
1.1. Exercise and infection risk ........................ ; .................................................................. 1
1.2. Role of the immune system ......................................................................................... 3
1.3. Salivary secretion ......................................................................................................... 4
1.4. Salivary composition and mucosal immunity .............................................................. 5
1.4.1. Immunoglobulin A ....................................................................................................... 6
1.4.2. Lysozyme ..................................................................................................................... 7
1.4.3. Alpha-amylase ............................................................................................................. 7
1.5. Regulation of salivary secretion .................................................................................. 7
1.5.1. Sympathetic nervous system activity ........................................................................... 8
1.5.2. Hypothalamic-pituitary-adrenal axis ......................................................................... 10
1.6. Methods of saliva collection ...................................................................................... 10
1.7. Methods of expressing s-IgA ..................................................................................... 11
1.8. Variability in s-IgA .................................................................................................... 12
1.9. Exercise and saliva flow rate ..................................................................................... 13
1.10. Acute exercise and s-IgA responses .......................................................................... 13
1.1 0.1. Effect of exercise intensity on s-IgA ......................................................................... 19
1.11. Chronic exercise and s-IgA ....................................................................................... 19
1.12. Exercise and other salivary antimicrobial proteins .................................................... 23
vi
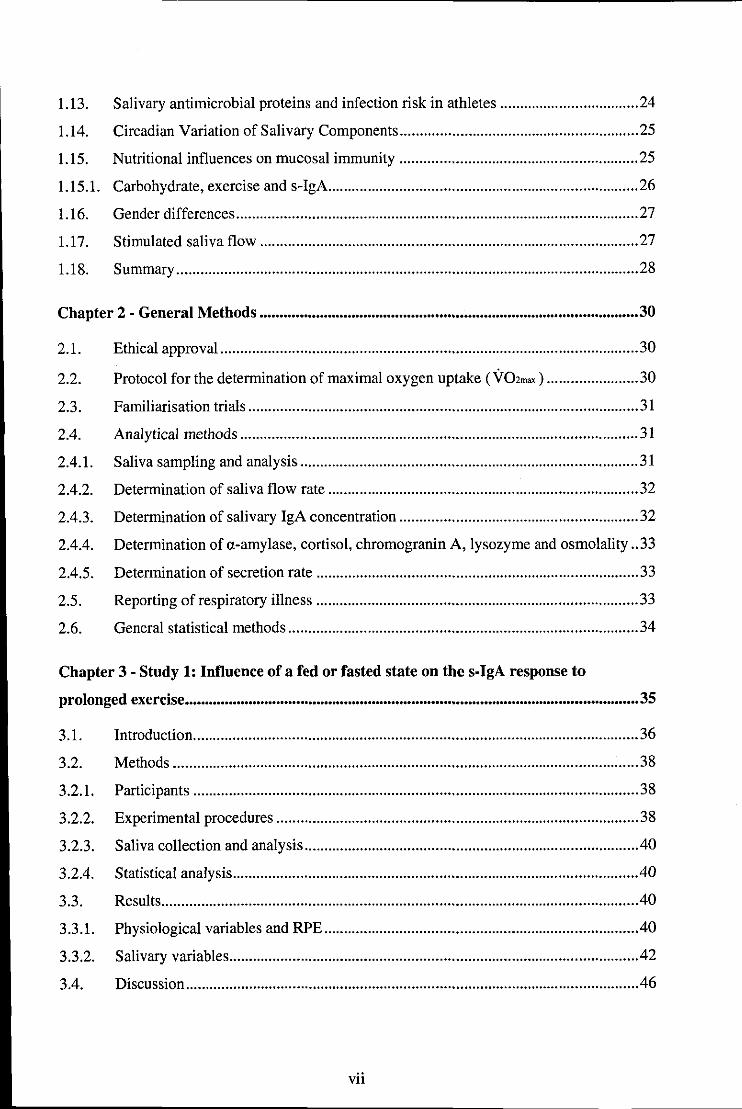
1.13. Salivary antimicrobial proteins and infection risk in athletes ................................... 24
1.14. Circadian Variation of Salivary Components ............................................................ 25
1.15. Nutritional influences on mucosal immunity ............................................................ 25
1.15.1. Carbohydrate, exercise and s-IgA .............................................................................. 26
1.16. Gender differences ..................................................................................................... 27
1.17. Stimulated saliva flow ............................................................................................... 27
1.18. Summary .................................................................................................................... 28
Chapter 2 . General Methods ............................................................................................... 30
2.1. Ethical approval ......................................................................................................... 30
2.2. Protocol for the determination of maximal oxygen uptake (V02""") ....................... 30
2.3. Familiarisation trials .................................................................................................. 31
2.4. Analytical methods .................................................................................................... 31
2.4.1. Saliva sampling and analysis ..................................................................................... 31
2.4.2. Determination of saliva flow rate .............................................................................. 32
2.4.3. Determination of salivary IgA concentration ............................................................ 32
2.4.4. Determination of a-amylase, cortisol, chromogranin A, lysozyme and osmolality .. 33
2.4.5. Determination of secretion rate ................................................................................. 33
2.5. Reporting of respiratory illness ................................................................................. 33
2.6. General statistical methods ........................................................................................ 34
Chapter 3 - Study 1: Influence of a fed or fasted state on the s-IgA response to
prolonged exercise .................................................................................................................. 35
3.1. Introduction ................................................................................................................ 36
3.2. Methods ..................................................................................................................... 38
3.2.1. Participants ................................................................................................................ 38
3.2.2. Experimental procedures ........................................................................................... 38
3.2.3. Saliva collection and analysis .................................................................................... 40
3.2.4. Statistical analysis ...................................................................................................... 40
3.3. Results ........................................................................................................................ 40
3.3.1. Physiological variables and RPE ............................................................................... 40
3.3.2. Salivary variables ....................................................................................................... 42
3.4. Discussion .................................................................................................................. 46
vii
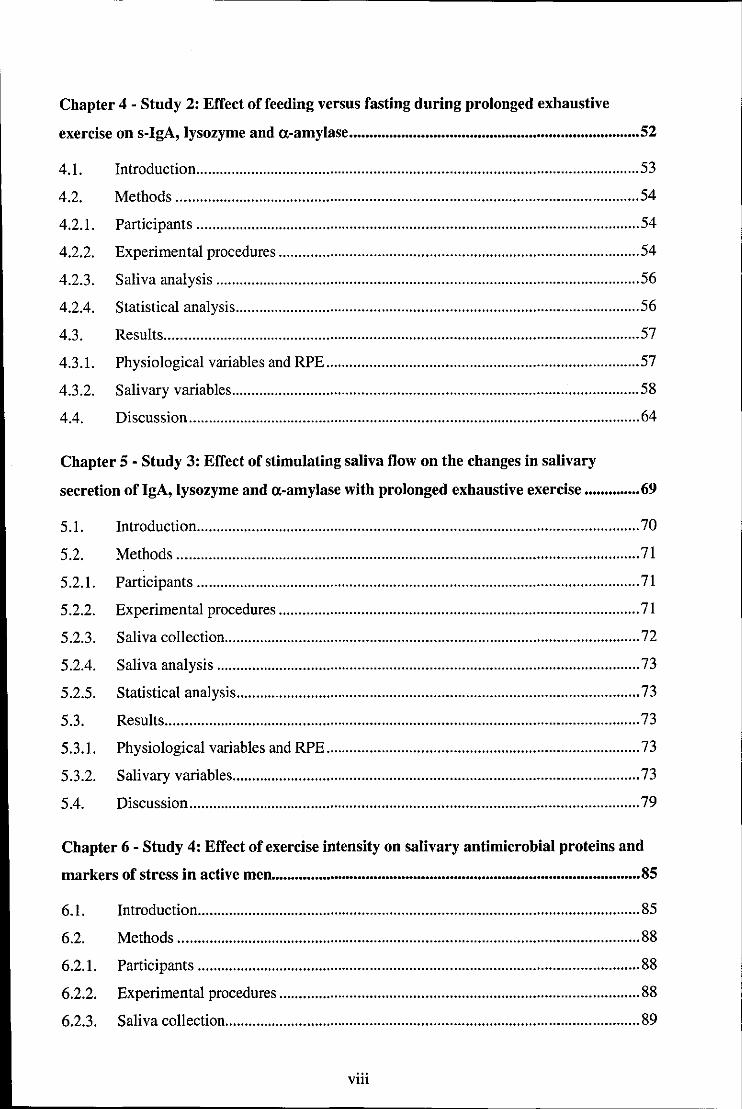
Chapter 4 - Study 2: Effect of feeding versus fasting during prolonged exhaustive
exercise on s-IgA, lysozyme and a-amylase ......................................................................... 52
4.1. Introduction ................................................................................................................ 53
4.2. Methods ..................................................................................................................... 54
4.2.1. Participants ................................................................................................................ 54
4.2.2. Experimental procedures ........................................................................................... 54
4.2.3. Saliva analysis ........................................................................................................... 56
4.2.4. Statistical analysis ...................................................................................................... 56
4.3. Results ........................................................................................................................ 57
4.3.1. Physiological variables and RPE ............................................................................... 57
4.3.2. Salivary variables ....................................................................................................... 58
4.4. Discussion .................................................................................................................. 64
Chapter 5 - Study 3: Effect of stimulating saliva flow on the changes in salivary
secretion of IgA, lysozyme and a.-amylase with prolonged exhaustive exercise .............. 69
5.1. Introduction ................................................................................................................ 70
5.2. Methods ..................................................................................................................... 71
5.2.1. Participants ................................................................................................................ 71
5.2.2. Experimental procedures ........................................................................................... 71
5.2.3. Saliva collection ......................................................................................................... 72
5.2.4. Saliva analysis ........................................................................................................... 73
5.2.5. Statistical analysis ...................................................................................................... 73
5.3. Results ........................................................................................................................ 73
5.3.1. Physiological variables and RPE ............................................................................... 73
5.3.2. Salivary variables ....................................................................................................... 73
5.4. Discussion .................................................................................................................. 79
Chapter 6 - Study 4: Effect of exercise intensity on salivary antimicrobial proteins and
markers of stress in active men ............................................................................................. 85
6.1. Introduction ................................................................................................................ 85
6.2. Methods ..................................................................................................................... 88
6.2.1. Participants ................................................................................................................ 88
6.2.2. Experimental procedures ........................................................................................... 88
6.2.3. Saliva collection ......................................................................................................... 89
viii

6.2.4. Statistical analysis ...................................................................................................... 89
6.3. Results ........................................................................................................................ 89
6.3.1. Physiological variables and RPE ............................................................................... 89
6.4. Salivary variables ....................................................................................................... 90
6.5. Discussion .................................................................................................................. 97
Chapter 7 - Study 5: Salivary IgA and respiratory illness in elite male and female
swimmers during a 6-month period of training and competition ................................... 102
7.1. Introduction .............................................................................................................. 1 03
7.2. Methods ................................................................................................................... 1 05
7.2.1. Participants .............................................................................................................. 105
7.2.2. Study design ............................................................................................................. 106
7.2.3. Training loads .......................................................................................................... 106
7.2.4. Saliva collection and analysis .................................................................................. 1 10
7.2.5. Statistical Analysis ................................................................................................... 110
7.3. Results ...................................................................................................................... 110
7.3 .1. Reported symptoms of URTI.. ................................................................................. 110
7.3.2. Salivary variables ..................................................................................................... 111
7.3.3. Predictors of infection .............................................................................................. 115
7.4. Discussion ................................................................................................................ 115
Chapter 8 - General Discussion ............................................................................................ 122
8.1. Nutritional status ...................................................................................................... 122
8.2. Exercise and saliva flow rate ................................................................................... 123
8.3. Acute exercise and salivary antimicrobial proteins ................................................. 125
8.4. Exercise intensity ..................................................................................................... 126
8.5. Stress markers .......................................................................................................... 127
8.6. Chronic exercise and s-IgA ..................................................................................... 128
8.7. Gender differences ................................................................................................... 129
8.8. Stimulating saliva flow ............................................................................................ 130
8.9. ConcJusions .............................................................................................................. 132
References ............................................................................................................................. 133
Kavanagh, D. A., O'Mullane, D. M., Smeeton, N. (1998). Variation of salivary flow rate in
adolescents. Archives of Oral Biology, 43: 347-352 ........................................... 142
ix

Proctor, G. B. and Carpenter, G. H. (2007). Regulation of salivary gland function by
autonomic nerves. Autonomic Neuroscience: basic & clinical, 30: 133: 3-18 .. 148
Appendix A - Participant Consent Form .......................................................................... 154
Appendix B - Health Screening Questionnaire ................................................................. 156
Appendix C - Physical Activity Questionnaire .................................................................. 159
Appendix D - Health Questionnaire ................................................................................... 161
Appendix E - URTI Symptoms Questionnaire .................................................................. 163
x
-----------------------------------------------------------------------
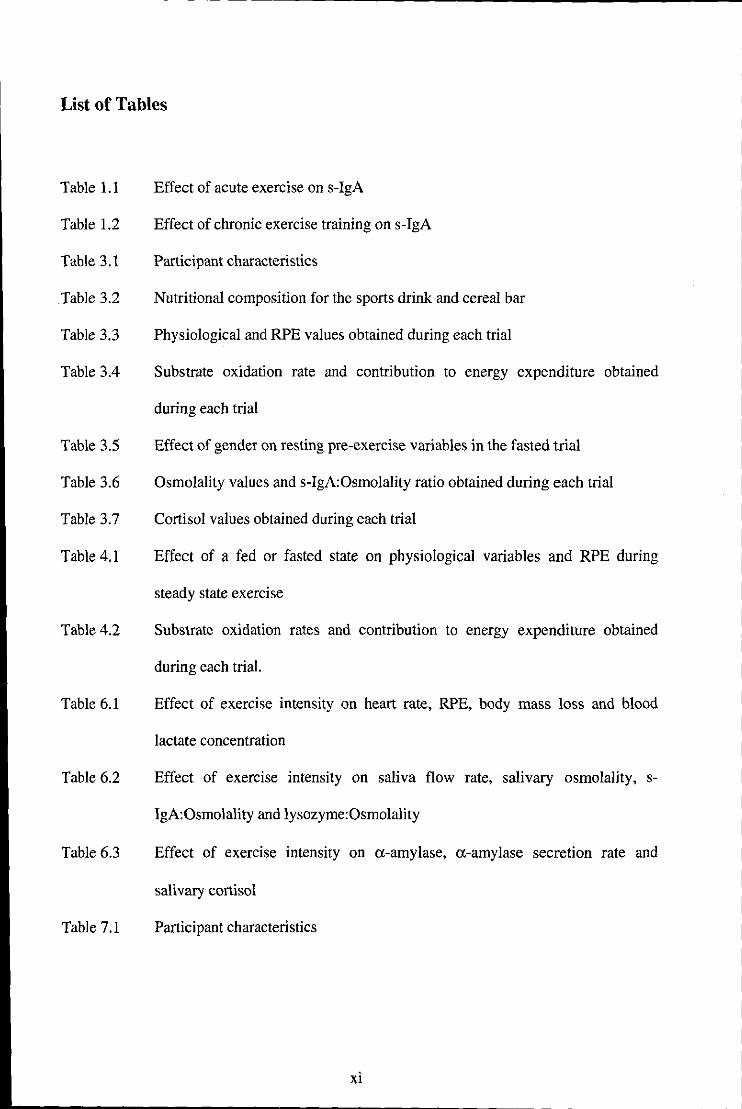
List of Tables
Table 1.1
Table 1.2
Table 3.1
Table 3.2
Table 3.3
Table 3.4
Table 3.5
Table 3.6
Table 3.7
Table 4.1
Table 4.2
Table 6.1
Table 6.2
Table 6.3
Table 7.1
Effect of acute exercise on s-IgA
Effect of chronic exercise training on s-IgA
Participant characteristics
Nutritional composition for the sports drink and cereal bar
Physiological and RPE values obtained during each trial
Substrate oxidation rate and contribution to energy expenditure obtained
during each trial
Effect of gender on resting pre-exercise variables in the fasted trial
Osmolality values and s-IgA:Osmolality ratio obtained during each trial
Cortisol values obtained during each trial
Effect of a fed or fasted state on physiological variables and RPE during
steady state exercise
Substrate oxidation rates and contribution to energy expenditure obtained
during each trial.
Effect of exercise intensity on heart rate, RPE, body mass loss and blood
lactate concentration
Effect of exercise intensity on saliva flow rate, salivary osmolality, s
IgA:Osmolality and lysozyme:Osmolality
Effect of exercise intensity on a-amylase, a-amylase secretion rate and
salivary cortisol
Participant characteristics
xi

List of Figures
Figure 3.1
Figure 3.2
Figure 3.3
Figure 4.1
Figure 4.2
Figure 4.3
Figure 4.4
Figure 4.5
Figure 4.6
Figure 4.7
Figure 4.8
Figure 5.1
Figure 5.2
Figure 5.3
Figure 5.4
Figure 5.5
Figure 5.6
Figure 5.7
Figure 5.8
Figure 6.1
Figure 6.2
Figure 6.3
Figure 6.4
Effect of a fed or fasted state on the saliva flow rate response to exercise
Effect of a fed or fasted state on the s-IgA concentration response to exercise
Effect of a fed or fasted state on the s-IgA secretion response to exercise
Effect of a fed or fasted state on the saliva flow rate response to exercise
Effect of a fed or fasted state on the s-IgA concentration response to exercise
Effect of a fed or fasted state on the s-IgA secretion response to exercise
Effect of a fed or fasted state on the lysozyme concentration
Effect of a fed or fasted state on lysozyme secretion rate
Effect of a fed or fasted state on a-amylase activity
Effect of a fed or fasted state on a-amylase secretion rate
Effect of a fed or fasted state on salivary cortisol
Effect of exercise on stimulated and unstimulated saliva flow rate
Effect of exercise on stimulated and unstimulated s-IgA concentration
Effect of exercise on stimulated and unstimulated s-IgA secretion rate
Effect of exercise on stimulated and unstimulated a-amylase activity
Effect of exercise on stimulated and unstimulated a-amylase secretion rate
Effect of exercise on stimulated and unstimulated lysozyme concentration
Effect of exercise on stimulated and unstimulated lysozyme secretion rate
Effect of exercise on stimulated and unstimulated cortisol
Effect of exercise intensity on s-IgA concentration
Effect of exercise intensity on s-IgA secretion rate
Effect of exercise intensity on lysozyme concentration
Effect of exercise intensity on lysozyme secretion rate
xii
- ------------------------------------------------------------------------
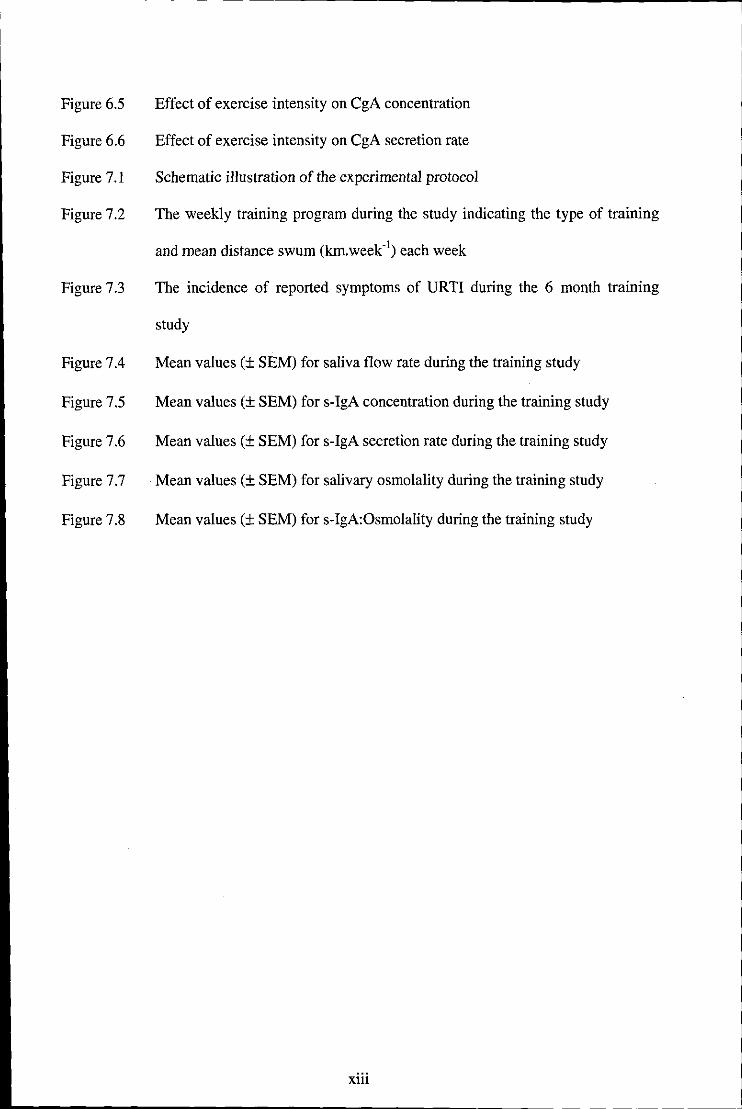
Figure 6.5
Figure 6.6
Figure 7.1
Figure 7.2
Figure 7.3
Figure 7.4
Figure 7.5
Figure 7.6
Figure 7.7
Figure 7.8
Effect of exercise intensity on CgA concentration
Effect of exercise intensity on CgA secretion rate
Schematic illustration of the experimental protocol
The weekly training program during the study indicating the type of training
and mean distance swum (km.week-!) each week
The incidence of reported symptoms of URTI during the 6 month training
study
Mean values (± SEM) for saliva flow rate during the training study
Mean values (± SEM) for s-IgA concentration during the training study
Mean values (± SEM) for s-IgA secretion rate during the training study
Mean values (± SEM) for salivary osmolality during the training study
Mean values (± SEM) for s-IgA:Osmoiality during the training study
xiii
List of Abbreviations
ANOVA Analysis of variance
CRO Carbohydrate
CgA Chromogranin A
CO2 Carbon dioxide
ELlS A Enzyme linked immunosorbant assay
g Grams
h Hours
HPA Hypothalamic-pituitary-adrenal
HR Heart rate
IgA Immunoglobulin A
J Joules
kg Kilogram
km Kilometre
L Litre
m Mili
M Moles per litre
min Minutes
MJ Megajoules
n Nano
02 Oxygen
pIgR Polymeric Ig receptor
RPE Rating of perceived exertion
S Seconds
se Secretory component
xiv
SEM Standard error of the mean
s-IgA Sali vary immunoglobulin A
SNS Sympathetic nervous system
URTI Upper respiratory tract infection
ye02 Rate of carbon dioxide production
YE Rate of ventilation
Y02 Rate of oxygen uptake
Y02mox Maximal oxygen uptake
Qe Degrees celcius
fl Micro
xv

Chapter 1 Literature Review
Chapter 1 - Literature Review
1.1. Exercise and infection risk
Upper respiratory tract infections (URTI) such as coughs, colds and sore throats, form the
most common presentation to general medical practice (Graham, 1990). Such illness can have
a substantial negative impact on the overall health and productivity of the general population,
and can be even more serious for the elite athlete engaged in heavy training and competition.
Any interruption of a tightly planned training schedule due to URTI could have serious
adverse effects on performance, which may even mean the difference between success and
failure (Pyne et al., 2001).
The relationship between exercise and URTI has been modelled into the form of a "J"-shaped
curve. According to this hypothesis, regular moderate exercise enhances immune responses,
reducing susceptibility to URTI. In contrast, excessive prolonged exercise suppresses
immunity initiating a brief period of vulnerability when the risk of URTI is increased
(Nieman, 1994). Indeed, experimental studies conducted in animals have supported the
concept that exhaustive exercise after inoculation with a pathogen leads to a more frequent
appearance of infection and a higher fatality rate compared with sedentary animals, whereas
more moderate training decreases the incidence (Davis et al., 1997).
There are an increasing number of human research studies that have examined the
relationship between exercise and infection risk. The evidence is primarily epidemiological in
nature where the diagnosis of URTI is based upon responses to a questionnaire (defined from
symptoms of sore throat, cough, runny nose, congested sinuses and headache), rather than
clinical assessment (Barrett et al., 2002). In general, the evidence suggests that moderate
1
Chapter 1 Literature Review
habitual exercise IS associated with decreased URTI incidence. For example, in one
randomised, controlled study it was demonstrated that moderate exercise training in
previously sedentary women, was associated with a significant reduction in URTI incidence.
Forty-five min of exercise five times a week at 60% of the heart rate reserve reduced the
number of URTI symptom days (Nieman et al., 1990b). Furthermore, Matthews et al. (2002)
found that habitual physical activity was inversely related to the incidence of colds over a 12
month period.
In contrast, there is a growing body of evidence to suggest that heavy exercise and/or training
increases the prevalence of URTI. The first study to quantify this in an athletic population
was published by Peters and Bateman (1983) in which 140 runners were surveyed for
symptoms of URTI before and after a 56 km ultramarathon. These were compared to age
matched controls, living in the same household and sharing the same environmental
conditions. During the two weeks following the race, 33% of the athletes exhibited symptoms
of URTI compared with only 15% of the control subjects. These findings are consistent with
a subsequent epidemiological study of over 2000 randomly selected runners competing in the
1987 Los Angeles Marathon (Nieman et al., 1990a). When compared to their matched
runners - who did not compete - it was found that the competitors were six times more likely
to suffer from symptoms of URTI. Moreover, those runners who had the highest training load
prior to the event (i.e. more than 96 km per week) were twice as likely to suffer from URTI
as those with a relatively light training load (i.e. 32 km per week).
However, a more recent study failed to confirm this in a group of marathon runners, where no
association was found between training volume over a 6-month period prior to a race and the
post-race incidence of self-reported URTI episodes. Furthermore, there was no difference in
URTI incidence during the 3 weeks post-race compared with before (Ekblom et al., 2006). It
2

· Chapter 1 Literature Review
was noted though that those with infections in the 3 weeks prior to the race had a higher
reported incidence of URTI episodes than the illness free competitors after the race,
suggesting a possible reactivation of viral illness.
It is now widely accepted that following an acute bout of prolonged, intense exercise, many
components of the immune system exhibit change (reviewed by Gleeson, 2007). This has
been termed the 'open window' for infection and during this time, opportunistic viruses and
bacteria may gain a foothold, increasing the susceptibility of infection (Nieman and Pedersen,
1999). This period may last between 3 and 72 h depending on the immune parameter
measured and the exercise protocol employed. Since many competitive athletes train at least
daily, and often twice per day, it is possible that a chronic depression of immune function
may result from the cumulative long-lasting acute effects of each successive bout
(Mackinnon, 2000)
1.2. Role of the immune system
The function of the immune system is to protect against, recognise, attack and destroy
elements that are foreign to the body. The immune system can be broadly separated into two
divisions that work together synergistically: innate (natural or non-specific) and acquired
(adaptive or specific). The innate immune system, the 'first-line of defence' comprises 3
mechanisms with a common goal to restrict the entry of infectious agents into the body: (1)
physical/structural barriers (skin, epithelial linings, mucosal secretions); (2) chemical barriers
(pH of bodily fluids and soluble factors such as lysozymes and complement proteins); and (3)
phagocytic cells (immune cells, e.g. neutrophils and monocytes/macrophages) (Gleeson et
al., 2004b). The cells involved in innate immunity can recognise and act against foreign cells
without prior exposure. However, innate immunity does not improve with repeated exposure.
3

Chapter 1 Literature Review
Should the innate immune system fail to resist the micro-organism, the acquired immune
system is activated. The acquired immune system consists of B-lymphocytes (produced in the
bone marrow) and T-lymphocytes (mature in the thymus). Monocytes or macrophages ingest
and process the invading protein, which is displayed or presented to the T -cells allowing
them to initiate a response specific to that antigen. The T -helper cells produce cytokines that
stimulate the proliferation of T -cells, and B-cells into plasma cells. The plasma cells then
produce antibodies that are able to recognise the antigen and generate memory cells to enable
the immune system to initiate a faster and more effective level of protection with subsequent
exposure to the same agent. The T-cells also stimulate the innate cells: the macrophages,
neutrophils and natural killer (NK) cells. The plasma cells produce the immunoglobulins;
immunoglobulin A (IgA) is the principal antibody at mucosal sites (Gleeson, 2006).
1.3. Salivary secretion
Saliva is a clear, slightly acidic mucoserous exocrine secretion consisting of inorganic and
organic compounds and usually more than 99% water. The average daily flow of whole
saliva varies greatly between 0.5 Land 1.5 L which represents 20% of the total plasma
volume (Chicharro et al., 1998). Thus, salivary flow is a highly individualised measurement.
The secretion of saliva into the mouth originates from three pairs of major salivary glands:
the submandibular (65%), parotid (20%) and the sublingual (7-8%) and numerous minor
salivary glands (less than 10%) found in the lower lip, tongue, palate, cheeks, and pharynx. In
humans, the parotid glands produce mainly serous saliva since the secretion lacks mucin, the
minor glands produce mainly mucous saliva and the sublingual and submandibular glands
produce mixed saliva (Humphrey & Williamson, 2001). The types of cells found in the
salivary glands are acinar cells, various duct system cells and myoepithelial cells. Acinar
cells, from which saliva is first secreted, determine the type of secretion produced from the
4
Chapter 1 Literature Review
different glands. They are connected by intercalated ducts and the secreted saliva is drained
to the oral cavity through striated and excretory ducts. During this passage, the concentrations
of several electrolytes change due to active ion transport (Aps and Martens, 2005).
Myoepithelial cells, which are long cell processes wrapped around acinar cells, contract on
stimulation to constrict the acinar cells. This causes saliva to be squeezed out (Garret!, 1987).
The secretion of saliva is under neural control by three principal mechanisms or stimuli
including mechanical (the act of chewing), gustatory (with acid the most stimulating trigger
and sweet the least stimulating), and olfactory (althougb a surprisingly poor stimulus)
(Humphrey & Williamson, 2001). Stimulating high flow rates can drastically change
percentage contributions from each gland, with the parotid contributing more than 50% of
total salivary secretions compared with only 20% in the unstimulated state (Edgar, 1990).
The value of saliva as a biological fluid for the detection of diagnostic and prognostic
biomarkers has become increasingly well established. Sample collection is non-invasive,
painless, and able to provide accurate and reliable assessments of immune status and the
unbound, biologically active, form of certain hormones and drugs. Thus, it is considered a
valuable tool for investigating the impact of exercise on stress and immune function.
1.4. Salivary composition and mucosal immunity
Saliva secretions protect the oral mucosa via a mechanical washing effect and play an
important role in immunity as the first line of defence against potential pathogens invading
the oral and nasal cavities. Saliva contains several antimicrobial proteins e.g.
immunoglobulins, lysozyme and a-amylase, which play a critical role in defence against
5
Chapter 1 Literature Review
infection and disease by interfering with microbial entry and multiplication (Bosch et al.,
2002).
1.4.1. Immunoglobulin A
Immunoglobulin A is the principal antibody representing the acquired immune system, which
is secreted at mucosal surfaces (Gleeson & Pyne, 2000). IgA is a dimer whose monomers are
held together by a polypeptide structure known as the J-chain containing the secretory
component (SC), the cleaved part of polymeric Ig receptor (pIgR). There are two subclasses
of IgA, IgAI and IgA2, the former accounting for 60-80% of IgA in the salivary glands. IgA
is produced by plasma cells (differentiated B-cells) residing in the submucosa and is secreted
via transport across the epithelial cells by the pIgR, which is inserted into the basal membrane
(Mackinnon, 1999). IgA binds to this receptor and undergoes endocytosis and vesicular
transport across the cell. At the apical surface secretory IgA is cleaved from the receptor and
remains attached to the SC. The covalent binding of the secretory component acts to prevent
the IgA from proteolysis (Gleeson, 2006).
Immunoglobulin A seems to function as a multilayered mucosal defence: it prevents antigens
and microbes from adhering to and penetrating the epithelium (immune exclusion), interrupts
replication of intracellular pathogens during transcytosis through epithelial cells (intracellular
neutralisation), and binds antigens on the lamina propria facilitating their excretion through
the epithelium back into the lumen (immune excretion) (Larnm, 1998). It is therefore
important to host defence against certain viruses that are not carried by the blood especially
those causing URTI. Indeed, low levels of salivary IgA (s-IgA) are associated with a higher
incidence of URTI (Hanson et al., 1983) and high levels of s-IgA are associated with a lower
incidence ofURTI (Rossen et al., 1970).
6

Chapter 1 Literature Review
1.4.2. Lysozyme
Lysozyme represents the main enzyme of the non-specific innate mucosal immune defence. It
has antimicrobial properties and functions to aid the destruction of bacterial cell walls by
cleaving the polysaccharide component (Bosch et al., 2002). Lysozyme also acts to stimulate
neutrophils and macrophages, and works with immunoglobulins to have further antimicrobial
effects (lolles and lolles, 1984; West et aI., 2006). It is produced mainly by the
submandibular and sublingual glands and it is secreted into saliva by mucous membranes and
mononuclear cells entering the oral cavity through gingival crevices (Noble, 2000).
Lysozyme has been shown to be lower in subjects prone to acute bronchitis infection caused
by Haemophilus influenzae (Clancy et al., 1995). Furthermore, patients with chronic
bronchitis who were less prone to acute exacerbations had a greater capacity to aggregate
bacteria and were shown to have higher levels of lysozyme (Taylor et al., 1995).
1.4.3. Alpha-amylase
Alpha-amylase is an enzyme that breaks down starch into maltose and is also important to
host defence by inhibiting the adherence and growth of certain bacteria (Scannapieco et al.,
1994). Alpha-amylase is synthesised locally by the acinar cells mainly from the parotid
gland, accounting for 40 to 50% of the total salivary-gland produced protein (Noble, 2000).
To date, the immunological significance of a-amylase in relation to URTI remains unclear.
1.5. Regulation of salivary secretion
The regulation of salivary antimicrobial proteins is via a short-term (minutes) mobilisation
andlor a long-term (hours - days) modification of protein synthesis (Goodrich and McGee,
7
Chapter 1 Literature Review
1998). This may be influenced by the two branches of the stress response: sympathetic
nervous system (SNS) activity and the hypothalamic-pituitary-adrenal (HPA) axis.
1.5.1. Sympathetic nervous system activity
The salivary glands are innervated by both parasympathetic and sympathetic nerves.
Generally, it is considered that sympathetic stimulation (via noradrenaline) leads to higher
salivary protein concentrations (e.g. a-amylase), whereas increased rates of fluid output
occur in response to parasympathetic stimulation (Chicharro et aI., 1998). However,
parasympathetic stimulation can also affect salivary protein secretion, and protein secretion
of some glands, such as the sublingual and some of the minor glands, may even be entirely
under parasympathetic control. Thus, rather than acting antagonistically, it could be argued
that the two branches of the autonomic nervous system may exert relatively independent
effects in which the activity of one branch may synergistically augment the other (Bosch et
ai.,2002).
Studies carried out in rodents suggest that protein secretion is upregulated into saliva
following autonomic nerve stimulation. Indeed, the secretion of s-IgA was increased rapidly
(within minutes) by both parasympathetic and sympathetic stimulation (Carpenter et ai.,
2000), and adrenaline was shown to increase the entry of human IgA into saliva by rat
salivary cells via increased mobilisation of the pIgR (Carpenter et ai., 2004). Parasympathetic
and sympathetic stimulation in rats has also been shown to increase the secretion of other
stored salivary proteins (e.g. peroxidase and a-amylase) into saliva, which occurs to a much
greater magnitude than s-IgA (Carpenter et al., 2000).
8
Chapter 1 Literature Review
Activation of the sympathetic nervous system leads to the release of catecholamines
(adrenaline and noradrenaline) into the circulation. However, catecholamines measured in
saliva are regarded as a poor index of sympathetic nervous activity (Kennedy et al., 2001),
since they do not accurately reflect changes in circulating catecholamines (Schwab et al.,
1992). As a result, a-amylase has been identified as a potential surrogate marker of SNS
activity in humans under a variety of stressful conditions. Studies have shown that acute
psychological stressors increase salivary a-amylase activity (Bosch et al., 2002; Nater et al.,
2006). Moreover, these increases were positively correlated with serum noradrenaline
(Chatterton et aI., 1996). Thus, the increase in sympathetic tone that occurs during
psychological stress would be similar to that produced during exercise and suggests that
exercise could similarly affect a-amylase secretion. Indeed, a bout of exercise has been
shown to increase a-amylase activity (Chatterton et al., 1996). A five-fold increase in «
amylase activity was found after a 60-min intermittent cycle exercise bout, of twenty 1-min
periods at 100 % of maximum oxygen uptake (VOzma, ) separated by 2 min recovery at 30%
VOzma< (Walsh et al., 1999). However, the use of a-amylase as a non-invasive measure of
SNS activity requires further examination since its secretion is also increased by
parasympathetic stimulation alone or in interaction with sympathetic stimulation (Asking and
Proctor, 1989).
Another potential marker of sympathetic nervous system activity is Chromogranin A (CgA).
Chromogranin A is an acidic secretory protein found in a wide variety of hormone and
neurotransmitter storage vesicles and is co-stored and co-released with catecholamines from
the adrenal medulla and neuronal vesicles during exocytosis (Banks and Helle, 1965). In vitro
experiments have also demonstrated that CgA exhibits antifungal and antibacterial properties
(Stmb et aI., 1996; Lugardon et al., 2000). Salivary CgA concentration has been shown to
9

Chapter 1 Literature Review
increase rapidly under psychosomatic stress (Nakane et al.. 1998). although the response of
CgA to a bout of exercise is yet to be determined.
1.5.2. Hypothalamic-pituitary-adrenal axis
Whereas autonomic stimulation may rapidly affect the secretion of salivary proteins. slower
effects have been reported for pituitary-adrenal hormones. Exercise or stress activates the
hypothalamic-pituitary-adrenal axis. the end product of which is cortisol. Cortisol is well
known for its modulatory effects on immune function (Fleshner. 2000). The potent synthetic
glucocorticoid dexamethasone has been shown to cause a decline in the mobilisation of s-IgA
24 h after a single injection (Wira et aI., 1990), and in the longer term this hormone may
inhibit IgA synthesis by B cells in the submucosa (Saxon et al .• 1978). Cortisol has also been
implicated in modifying other secretory proteins such as lysozyme production and its
secretion into saliva (Perera et al.. 1997). Salivary cortisol has been shown to correlate highly
with circulating levels of cortisol (Chicharro et aI., 1998) making it a reliable marker of HPA
axis activity.
Exercise stimulates SNS activity and the HP A axis to secrete stress hormones, thus increasing
the body' s ability to meet the physical and metabolic demands of exercise. Prolonged intense
exercise is associated with substantially increased secretions of catecholamines and
glucocorticoids which have a strong influence on the immune system. This presents a
potential pathway linking exercise. stress and infectious disease.
1.6. Methods of saliva collection
An important consideration when interpreting exercise studies on saliva flow rate and
composition is the methods that were used to collect samples. There appears to be little
10

Chapter 1 Literature Review
consistency across studies; some researchers have used cotton salivettes (Walsh et aI., 2002,
Bishop et al., 2006), while others have used the passive drool (Li and Gleeson 2004; Sari
Sarraf et al., 2007a) or even a suction tube to draw saliva from the floor of the mouth
(Michishige et aI., 2006). This is noteworthy since it was reported that cotton salivettes
reduced the concentration of s-IgA compared with passive collection of saliva (Strazdins et
al., 2005). In addition, there may be a potential stimulatory effect on saliva production from
introducing something foreign into the mouth, which may preferentially stimulate some
glands more than others; although evidence to support this is lacking (Navazesh and
Christensen, 1982). A previous study examined the reliability of the collection methods of
spitting, draining, suction and swabs and it was found that the spitting and draining methods
gave the most reproducible results (Navazesh, & Christensen, 1982).
1.7. Methods of expressing s-IgA
The methods of expressing s-IgA can also vary greatly making direct comparisons between
studies difficult. S-IgA concentrations have often been expressed not only in absolute
concentrations (Gleeson et al., 1999; Tharp and Bames, 1990), but also as a ratio to total
salivary protein, (Blannin et al.. 1998. Mackinnon et al., 1987; Tomasi et al., 1982). albumin
(Pyne et al.. 2000) or osmolality (Blannin et aI., 1998, Laing et aI., 2005). It has been
suggested that expressing s-IgA relative to total protein is misleading since total protein
secretion rate can increase during exercise (Blannin et al., 1998; Walsh et al., 1999; Sari
Sarraf et al.. 2007a). However, expressing s-IgA relative to osmolality may be a valid
measure when significant variations in saliva flow rate occur (Blannin et aI., 1998). This is
because a reduction in saliva flow rate may have a concentrating effect on s-IgA resulting in
an artificial increase in the s-IgA concentration for a given volume. It is now thought that the
secretion rate of s-IgA (saliva flow rate multiplied by the s-IgA concentration) is the most
11

•
Chapter 1 Literature Review
appropriate measure (Mackinnon and Hooper, 1994; Walsh et al., 1999, Blannin et al., 1998;
Li and Gleeson 2004), since s-IgA secretion rate represents the total amount of s-IgA
delivered to the mucosal surface per unit time and takes into account the saliva flow rate and
IgA concentration, both of which are important for host defence (Mackinnon et al., 1993a).
Indeed, the study by Li and Gleeson (2004) highlights these inconsistencies since it was
shown that cycling at 60% Y02mru< for 2 h significantly increased the concentration of s-IgA
but did not affect its secretion rate. These findings highlight the problems associated with the
different methods of expressing s-IgA which are likely to confound the interpretation of
results.
1.8. Variability in s-IgA
One of the major problems surrounding s-IgA research is the considerable variability that
exists within and between individuals (Burrows et al., 2002, Francis et al., 2005). Francis et
al. (2005) compared this in three populations: elite swimmers, active adults and a sedentary
group and found that the within-individual and between-individual variability differed
substantially in the three populations. For example, the within-subject variability was much
greater in elite swimmers (47%) than the other active (23%) and sedentary (28%) groups.
However, the elite swimmers were a more homogenous group, with lower between-subject
variability (20%) compared with the active (54%) and sedentary (46%) group. The sources of
variation are likely to be multifactorial in nature, including diurnal variation, nutritional status
and psychological stress, but one of the major sources is the saliva flow rate (Gleeson, 2000),
since this can be greatly affected by the hydration status of the individual and indeed
exercise. Such a variation is important since it will impact on the design of studies i.e. the
number of subjects needed and the ability to detect changes in mucosal immune status in
response to exercise (Gleeson et al., 2004).
12

Chapter 1 Literature Review
1.9. Exercise and saliva flow rate
Several investigators have reported a marked decrease in saliva flow rate in response to short
duration (less than 8 min). high intensity exercise (Engels et al., 2003; Fahlman et aI., 2001),
although others have reported no change in saliva flow rate to brief bouts of exercise at sub
maximal or maximal intensities (Dawes, 1981; Pilardeau et al., 1990). Several factors
associated with high-intensity exercise such as removal of parasympathetic vasodilatory
influences (rather than sympathetic mediated vasoconstriction), (Proctor and Carpenter,
2007), or evaporation of saliva through increased ventilation (Pilardeau et al., 1992), have
been proposed to explain this lower secretion in saliva flow rate. Prolonged exercise (> 90
min) also results in a reduction in flow rate (Bishop et al., 2000, Li and Gleeson 2005; Sari
Sarraf et al., 2007a; Walsh et at. 1999), which may be further attributed to dehydration
occurring through sweat loss during exercise (Ford et aI., 1997; Walsh et aI., 2004). This is
supported by evidence where the decrease in saliva flow rate was prevented by providing
fluids to offset losses (Walsh et al., 2004). Changes in saliva flow rate following exercise are
significant since they may not only affect the concentration of s-IgA, but more importantly,
could lead to an increased risk of URTI. This is based on the finding that individuals
suffering from xerostomia (dry mouth syndrome) have a substantially increased incidence of
oral infections and more pathogenic bacteria in the buccal cavity (Fox et al., 1985).
1.10. Acute exercise and s.IgA responses
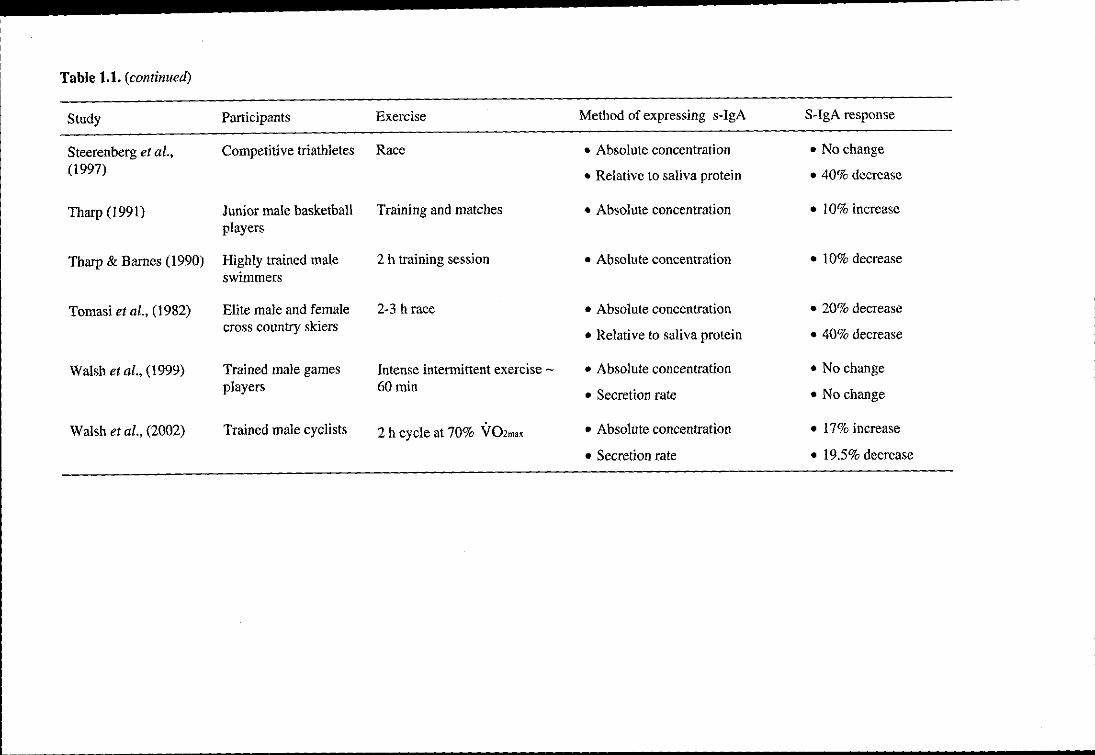
Although there has been an abundance of research conducted on the s-IgA response to acute
exercise in recent years, the results remain inconsistent (Table 1.1). Some have shown
significant decreases post-exercise (Tomasi et al., 1982; Mackinnon & Jenkins, 1993;
Nieman et al., 2002; Steerenberg et aI., 1997; Walsh et al., 2002), some have shown
increases (Blannin et aI., 1998, Reid et aI., 2001, Williams et aI., 2001), and others have
13
Chapter 1 Literature Review
shown no change (Mackinnon and Hooper, 1994; McDowell et al., 1991; Sari-Sarraf et al.,
2007b; Walsh et aI., 1999). The reasons for the inconsistencies are likely to range from the
dissimilarity of exercise protocols, particpant groups, collection methods (whether the sample
was stimulated or unstimulated), how s-IgA was expressed i.e. as a concentration, or
secretion rate and the mode of exercise performed.
Tomasi and colleagues (1982) were the first to report evidence of altered mucosal immunity
following intense exercise. In a cohort of elite cross-country skiers, a 20% reduction in s-IgA
concentration was observed after 2-3 h of competition. Similar findings were reported in elite
male swimmers following a training session (Tharp and Barnes, 1990), and Gleeson and
colleagues have consistently reported reductions (albeit small -10%) in s-IgA concentration
following 2 h of intense swimming in Australian national standard swimmers (Gleeson et al.,
1995; Gleeson et aI., 1999).
Several subsequent laboratory studies also reported decreases in s-IgA levels post -exercise.
Mackinnon et al. (1989) found a 60% decrease in s-IgA concentration and a 65% decrease in
the secretion rate immediately after 2 h high intensity cycling, which remained low for 1 h
and then returned to baseline levels after 24 h. Moreover, McDowell and colleagues (1992)
reported a 25% decrease in s-IgA concentration following an incremental treadmill run to
exhaustion, which recovered at I h post-exercise. In these studies it was not stated whether
fluid ingestion during exercise was restricted or ad libitum which could have had an impact
on the saliva flow rate and resulting s-IgA secretion.
In contrast, there is now growing evidence to suggest that exercise can result in significant
increases in s-IgA concentration. Studies in well-trained cyclists showed a 17% increase in s
IgA concentration following 2 h cycling at 70% V02max (Walsh et aI., 2002) and a 15%
14
Chapter 1 Literature Review
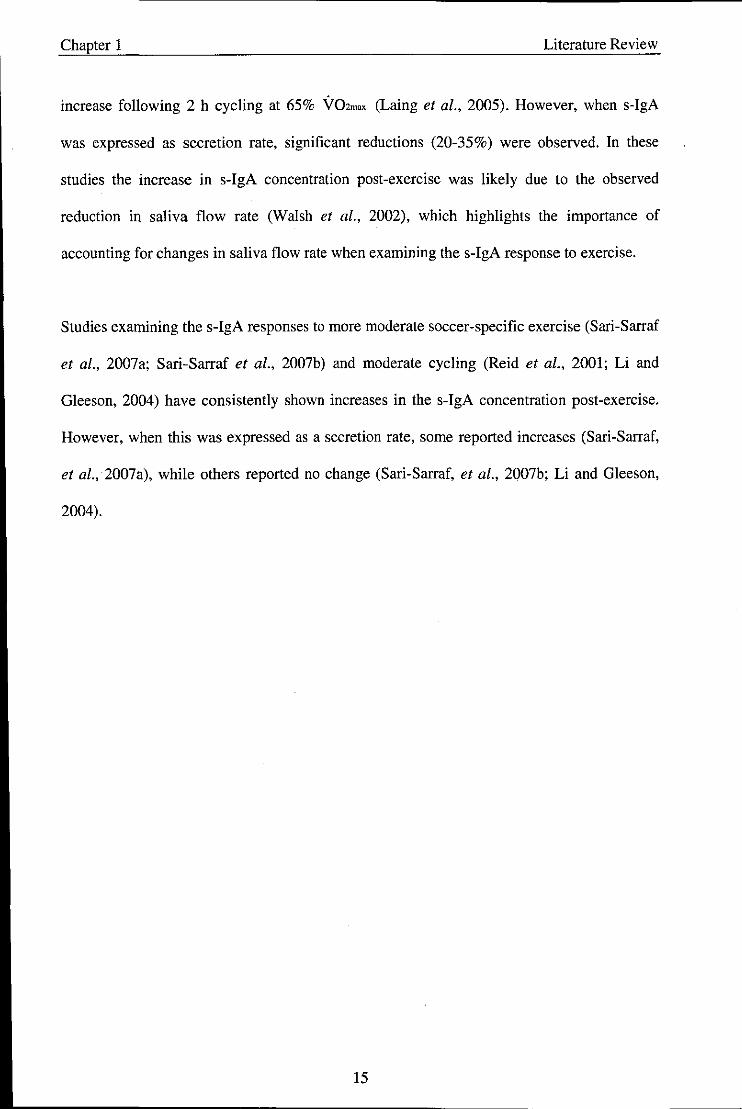
increase following 2 h cycling at 65% Y02m" (Laing et al., 2005). However, when s-IgA
was expressed as secretion rate, significant reductions (20-35%) were observed. In these
studies the increase in s-IgA concentration post-exercise was likely due to the observed
reduction in saliva flow rate (Walsh et al., 2002), which highlights the importance of
accounting for changes in saliva flow rate when examining the s-IgA response to exercise.
Studies examining the s-IgA responses to more moderate soccer-specific exercise (Sari-Sarraf
et aI., 2007a; Sari-Sarraf et al., 2007b) and moderate cycling (Reid et al., 2001; Li and
Gleeson, 2004) have consistently shown increases in the s-IgA concentration post-exercise.
However, when this was expressed as a secretion rate, some reported increases (Sari-Sarraf,
et aI., 2007a), while others reported no change (Sari-Sarraf, et al., 2007b; Li and Gleeson,
2004).
15

Table 1.1. Effect of an acute bout of exercise on salivary IgA
Study Participants Exercise Method of expressing s-IgA S-IgA response
Blannin et al., (1998) Young males mixed Exhaustive cycling at 55% • Absolute concentration • 200% increase fitness VOZmax and 80% V02 .. " • Secretion rate • 60% increase
• Relative to saliva protein • No change
• Relative to saliva osmolality • 70% increase
Gleeson et aI., (1995) Elite swimmers Training sessions • Absolute concentration • 10% decrease
Laing et al., (2005) Trained male cyclists 2 h cycle at 60% V02m" • Absolute concentration • 15% increase
• Secretion rate • 35% decrease
• Relative to saliva osmolality • 25 % decrease
Li and Gleeson (2004) Active men 2 h cycle at 60% V02m" • Absolute concentration • 25% increase
• Secretion rate • No change
Mackinnon and Hooper Recreational joggers Treadmill exercise at 55% and • Secretion rate • No change in either (1994) Competitive distance 75% VOZP"k for 40 min group
runners (Recreational joggers) or 90 min (Competitive runners)
Mackinnon and Jenkins Active men 5 supramaximal 60 s bouts of • Absolute concentration • 15 % increase (1992) cycling
• Secretion rate • 52% decrease
• Relative to saliva protein • 21 % decrease
Mackinnon et al., Competitive male 2 h cycling at 90% of • Absolute concentration • 60% decrease (1989) cyclists ventilatory threshold
• Relative to saliva protein • 65% decrease

........................... -------------------------------Table 1.1. (continued)
Study Participants Exercise Method of expressing s-IgA S-IgA response
McDowell et al., Young active males 15-45 min at 50-80% • Absolute concentration • No change
(1991) Y02m" treadmill test
McDowell et al., Trained males Incremental treadmill test to • Absolute concentration • 25 % decrease
(1992) exhaustion
Nehsen-Cannarella et Elite female rowers 2 h moderate intensity training • Absolute concentration • 50% decrease
aI., (2000) session • Secretion rate • 20% decrease
Nieman et al., (2002) Trained runners Marathon race • Absolute concentration • 21 % decrease
• Secretion rate • 25 % decrease
• Relative to saliva protein • 31 % decrease
Reid et aI., (2001) Physically active Incremental cycle test to fatigue • Absolute concentration • 30% increase participants
• Secretion rate • No change
Sari-Sarraf et al., Moderately trained men Single and repeated bouts of 45 • Absolute concentration • 56% increase
(2007a) min intermittent exercise • Secretion rate • 15 % increase
• Relative to saliva osmolality • 10% increase
Sari-Sarraf et al., Moderately trained men Soccer-specific intermittent • Absolute concentration • 56% increase (2007b) exercise
• Secretion rate • No change
• Relative to saliva osmolality • No change
....................... ----------------------------------,
Table 1.1. (continued)
Study Participants Exercise Method of expressing s-IgA S-IgA response
Steerenberg et al., Competitive triathletes Race • Absolute concentration • No change (1997) • Relative to saliva protein • 40% decrease
Tharp (1991) Junior male basketball Training and matches • Absolute concentration • 10% increase players
Tharp & Barnes (1990) Highly trained male 2 h training session • Absolute concentration • 10% decrease swimmers
Tomasi et al., (1982) Elite male and female 2-3 h race • Absolute concentration • 20% decrease cross country skiers
• Relative to saliva protein • 40% decrease
Walsh et al., (1999) Trained male games Intense intermittent exercise - • Absolute concentration • No change players 60min
• Secretion rate • No change
Walsh et al., (2002) Trained male cyclists 2 h cycle at 70% V02mox • Absolute concentration • 17% increase
• Secretion rate • 19.5% decrease

Chapter 1 Literature Review
1.10.1. Effect of exercise intensity on s-IgA
Previous research conducted in athletes suffering from recurrent infections has shown that
exercise of equal duration performed at 75% V02""" and 100% V02m"" were associated with
a trend for a lower s-IgA concentration post-exercise, while levels increased slightly after
exercise at 50% V02mru< (Williarns et al., 2001). It was concluded that there exists a positive
association between the degree of immune suppression post-exercise and the exercise
intensity level. However, McDowell and colleagues (1991) examined the effect of treadmill
exercise at intensities ranging from 50-80% V02""" for durations of 15-45 min in a group of
college men where no significant changes in s-IgA concentration were observed after
exercise irr~spective of the exercise intensity.
To add further confusion, Blannin et al. (1998) showed that exercise to exhaustion at a higher
intensity (80% V02""") showed a 105% increase in the s-IgA secretion rate compared with
15% increase during moderate intensity (55% V02ma,) exercise. However, these findings
may have been influenced by the exercise duration, which was different between the two
exercise intensities: -30 versus -160 min for the 80% V02_ trial and 55% V02ma, trial,
respectively.
1.11. Chronic exercise and s-IgA
Exercise-induced changes in s-IgA may be cumulative over time since long-term exercise
training has also been suggested to influence s-IgA levels, although the research is still
limited to date (Table 1.2). Results are easier to interpret since studies are more uniform and
the resting measures should not be affected by changes in the saliva flow rate or increases in
salivary protein secretion associated with acute exercise. Longitudinal studies monitoring
elite Australian swimmers over a 7-month training period showed decreased pre- and post-
19

Chapter 1 Literature Review
exercise s-IgA concentrations (Gleeson et aI., 1995; Gleeson et al., 1999), and the resting s
IgA concentration fell by approximately 4.1 % for every month of training (Gleeson et al.,
1999). Additionally, in competitive swimmers, a decrease in both pre- and post-exercise s
IgA a concentration was observed over a 3-month training period (Tharp and Barnes, 1990).
Conversely, increases in pre-exercise s-IgA concentration were observed in another group of
elite swimmers over 12 weeks of training (Gleeson et al., 2000). In this study, the swimmers
had just returned from a 6-week rest period and the authors commented that there may not
have been sufficient time to note any long-term negative change in immune parameters. More
recently it was shown that both s-IgA concentration and secretion rate were reduced in a
cohort of American Footballers during two periods of intense training and competition over a
12-month period (Fahlman and Engels, 2005). However, given that saliva flow rate exhibits a
seasonal variation (decreasing during the warmer summer months; Kavanagh et al., 1998;
Whitham et al., 2006), this may affect the s-IgA concentration during long-term training
studies.
The effects of short periods of intense training on s-IgA are less clear. A short training season
in elite kayakers resulted in reductions in pre-exercise s-IgA concentrations over 3 weeks
(Mackinnon et aI., 1993a) and 4 weeks of training in female hockey players reduced the s
IgA concentration, secretion rate and s-IgA to protein ratio (Mackinnon et aI., 1992). A 3-
week intense military training course induced no change in s-IgA concentration though it was
reduced after the 5-day combat course (Tiollier et al., 2005). However, an increase in pre
and post-exercise s-IgA concentration was observed in junior basketball players measured 3
times over a 2-month training period (Tharp, 1991).
Moderate exercise training has resulted in increases in s-IgA levels in elderly men and
women during 12 weeks of exercise (75% heart rate reserve for 30 min 3 times per week)
20

Chapter 1 Literature Review
(Klentrou et al., 2002). Salivary IgA concentration and s-IgA concentration-salivary albumin
concentration ratio increased significantly in the exercise group in comparison to the control
group.
Collectively, the evidence from these studies suggests that intense training (> 3 months) in
well-trained athletes may be associated with a chronic suppression of s-IgA levels. This is
thought to be an accumulative effect of reduced s-IgA levels following prolonged bouts of
intense exercise. Conversely, more moderate training, particularly in more sedentary groups
could result in increased s-IgA.
21
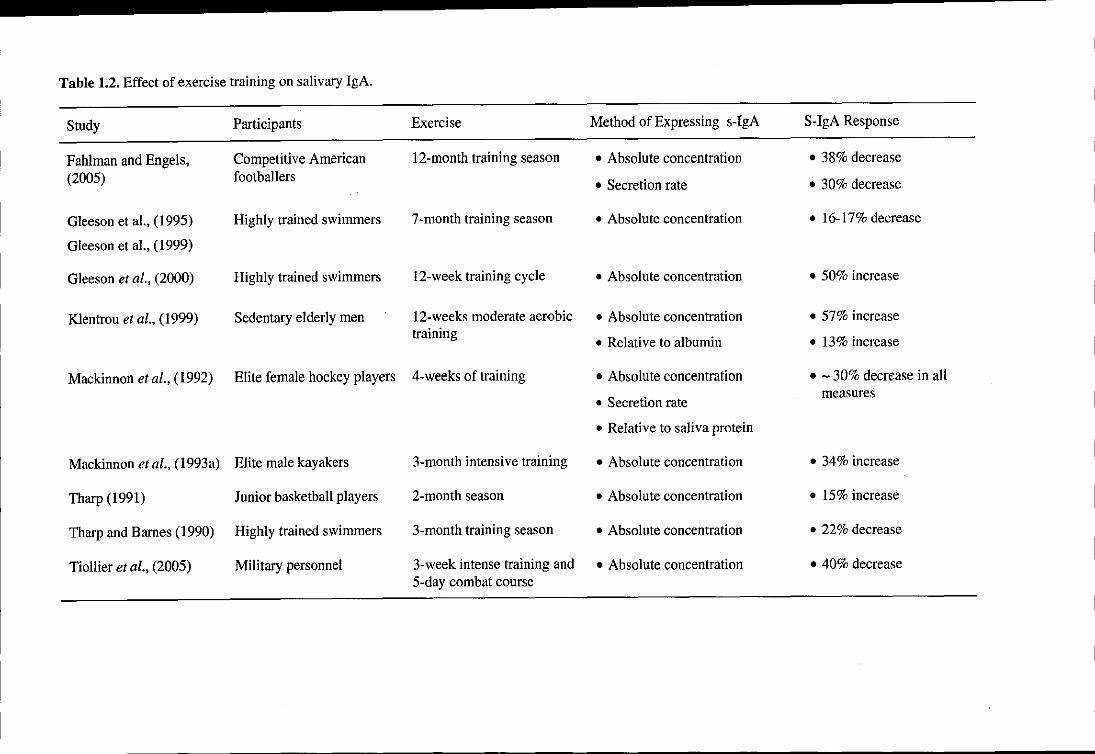
Table 1.2. Effect of exercise training on salivary IgA.
Study Participants Exercise Method of Expressing s-IgA S-IgA Response
Fahlman and Engels, Competitive American 12-month training season • Absolute concentration • 38% decrease
(2005) footballers • Secretion rate • 30% decrease
Gleeson et aI., (1995) Highly trained swimmers 7-month training season • Absolute concentration • 16-17% decrease
Gleeson et aI., (1999)
Gleeson et al., (2000) Highly trained swimmers 12-week training cycle • Absolute concentration • 50% increase
Klentrou et al., (1999) Sedentary elderly men 12-weeks moderate aerobic • Absolute concentration • 57% increase training
• Relative to albumin • 13% increase
Mackinnon et aI., (1992) Elite female hockey players 4-weeks of training • Absolute concentration • - 30% decrease in all
• Secretion rate measures
• Relative to saliva protein
Mackinnon et al., (1993a) Elite male kayakers 3-month intensive training • Absolute concentration • 34% increase
Tharp (1991) Junior basketball players 2-month seaSon • Absolute concentration • 15% increase
Tharp and Barnes (1990) Highly trained swimmers 3-month training season • Absolute concentration • 22% decrease
Tiollier et al., (2005) Military personnel 3-week intense training and • Absolute concentration • 40% decrease 5-day combat course

Chapter 1 Literature Review
1.12. Exercise and other salivary antimicrobial proteins
Presently, the research investigating the influence of exercise on other salivary antimicrobial
proteins is scant, although there have been several published findings of their response to
psychological stress. Lysozyme concentrations have been shown to decrease in final year
students during acute stress immediately prior to an exam, compared with one month after the
end of all examinations (Perera et aI., 1997). Furthermore, lysozyme concentrations have also
shown a negative correlation with perceived stress scores (Perera et al., 1997). In contrast,
significant increases in the antimicrobial protein lactoferrin were found following an acute
laboratory stressor (Bosch et ai., 2003). There is only one published abstract examining the
effects of acute exercise on lysozyme following intense training sessions in elite swimmers
(Koutedakis et al., 1996). In this study, significant reductions in salivary lysozyme
concentration and secretion rate were reported post-exercise. These preliminary findings
highlight the need for further well-controlled studies designed to investigate the responses of
salivary antimicrobial proteins to both acute and chronic exercise.
The response of a-amylase to exercise appears to be more consistent. Generally, it is reported
that it increases following an acute bout of exercise (Bishop et al., 2000; Chatterton et al.,
1996; Walsh et aI., 1999), and this increase is related to the exercise intensity (Bishop et al.,
2000; Ljungberg et aI., 1997; Walsh et aI., 1999). These transient increases in a-amylase are
likely to be induced by the increases in catecholamines and SNS activity with exercise
(Dawes, 1981). However, the relevance of these findings in terms of URTI risk is not fully
understood.
23

Chapter 1 Literature Review
1.13. Salivary antimicrobial proteins and infection risk in athletes
It is well known that individuals with IgA deficiency experience a higher incidence of URTI,
and a significant relationship between s-IgA concentration and URTI incidence in the general
population has been reported (Jemmott and McClelland, 1989). A decrease in salivary IgA
levels has also been implicated as a possible causal factor for the increased susceptibility of
athletes to URTI. In a much cited study by Gleeson and colleagues (1999), this was assessed
in a cohort of elite swimmers during a 7-month training period. S-IgA concentration fell
during this training period and an inverse correlation was found between reported infections
and the pre-session s-IgA concentration. Mackinnon et al. (l993b) also reported that the
levels of s-IgA in squash players decreased on days preceding illness, whereas the levels
were higher on days that did not precede URTI. Significant associations have also been
observed between URTI episodes and s-IgA secretion rate in American college football
players over a 12-month competitive season (Fahlman and Enge!s, 2005).' An increase in s
IgA in elderly subjects in response to moderate exercise was associated with a decreased
incidence of URTI symptoms (Klentrou et al., 2002).
However, several other investigations have been unable to replicate these findings. Following
a marathon, when expressed as a ratio to total saliva protein, post-race levels were lower in
those developing URTI. However, when expressed as absolute s-IgA concentration and s-IgA
secretion rate no association was observed (Nieman et aI., 2002). Furthermore, no significant
correlation between URTI and s-IgA was found in another cohort of swimmers over 12
weeks (Gleeson et al., 2000), in elite female rowers over 2 months (Nehlsen-Cannarella et
al., 2000) or in elite tennis players studied over 12 weeks (Novas et al., 2003). Given the high
degree of variability in s-IgA for an individual, it would appear that s-IgA may only be a
marginal predictor of short-term URTI risk (Pyne et al., 2000). Nonetheless, to date, this is
24

Chapter 1 Literature Review
the only measure of immune function that has been directly linked to URTI susceptibility in
athletes and thus, warrants further investigation.
1.14. Circadian Variation of Salivary Components
Many components of the immune system exhibit rhythmic changes (Shephard and Shek,
1997) and circadian variations in s-IgA and a-amylase have been shown in a number of
previous studies (Gleeson et aI., 2001; Hucklebridge et aI., 1998; Li and Gleeson, 2004). A
significant decrease in s-IgA throughout the day is observed from its highest value in the
early morning to its lowest value in the evening. In contrast, a-amylase secretion rate
increases during the day (Li and Gleeson, 2004). Consequently, reports of a decrease in s-IgA
and an increase a-amylase after prolonged exercise performed in the morning may not give a
clear representation of whether the response was a result of the exercise per se, or a reflection
of the circadian rhythm. The effects of a diurnal variation on the salivary responses were
assessed following prolonged cycling (Li and Gleeson, 2004) and intensive intermittent
swimming (Dimitriou et al., 2002), however, no influence of diurnal variations on the
responses were found.
1.15. Nutritional influences on mucosal immunity
Several researchers have investigated the effects of certain nutritional supplements on the s
IgA response to exercise but with varying success. The supplementation of ginseng (Engels et
al., 2003), Vitamin C (Palmer et aI., 2003) and glutamine (Kreiger et al., 2004) appear to
have little impact on s-IgA. More important perhaps is the effect of carbohydrate (CHO) and
fluid intake (Bishop et aI., 2000; Costa et aI., 2005), bovine colostrum (Crooks et aI., 2006)
and echinacea purpurea (Hall et aI., 2007).
25
Chapter I Literature Review
1.15.1. Carbohydrate, exercise and s-IgA
Carbohydrate ingestion during prolonged exercise has been shown to attenuate the rise in
stress hormones such as plasma catecholamines and cortisol and appears to limit the degree
of exercise-induced immune depression (Glee son and Bishop, 2000). In contrast, an athlete
exercising in a CHO-depleted state experiences larger increases in circulating stress
hormones and a greater perturbation of several immune function indices (Gleeson et al.,
2004b).
Bishop et al. (2000) demonstrated that CHO and fluid intake during prolonged sub-maximal
exercise were important in maintaining the saliva flow rate and s-IgA concentration (but not
secretion rate) when compared with restricted fluid intake. However, there appears to be little
effect of CHO ingestion during exercise on s-IgA when compared with placebo (Bishop et
aI., 2000; Nehlsen-Cannarella et al., 2000; Nieman et aI., 2002). In the longer term, a high
CHO diet appeared to enhance s-IgA levels post-exercise in ironman athletes (Costa et al.,
2005) and it was found that a 24 - 48 h period of combined fluid and energy restriction
decreased the s-IgA secretion rate (Oliver et al., 2007).
Since few studies have quantified the nutritional status of individuals, its effect on the
immune response to exercise cannot be readily determined (Gleeson et al., 2004a). Moreover,
it is thought that the nutritional status of an individual may be a contributing factor to the
large variation of s-IgA observed within-individuals, since fasting saliva was reported to
yield higher and more variable concentrations of s-IgA concentration than non-fasting
samples (Gleeson et al., 1990; Gleeson et aI., 2004a).
26
Chapter 1 Literature Review
1.16. Gender differences
The majority of available literature has focused on male subjects or a mixed gender
population. Very little research has been conducted on females alone (Fahlman et ai., 2001;
Nehlsen-Cannarella et al., 2000). This may be important since significantly lower levels of
resting s-IgA concentrations in females compared with males have been reported in elite
swimmers (Gleeson et al., 1999). Whether these gender differences may influence the
salivary responses to acute exercise or exercise training is yet to be determined. Furthermore,
whether there are gender differences in resting s-IgA levels for other sporting populations
remains unknown.
1.17. Stimulated saliva flow
Stimulating whole mouth saliva secretion can increase the flow rate up to 7 mL.min·1
compared with 0.3 mL.min·1 in unstimulated saliva (Humphrey and Williamson 2(01).
Navazesh & Christensen (1982) compared different methods of salivary stimulation:
gustatory: citric acid drops, straight onto the tongue or onto hardened ashless filter paper, and
masticatory: chewing polyvinyl acetate gum base for one minute. All three methods
successfully increased saliva flow rates. However, despite controlling chewing rate at 20 jaw
strokes per minute, the masticatory method was found to produce the most variable results
which were most likely due to differences in force and duration of force when chewing.
Stimulating saliva flow can also influence the composition of saliva produced. Proctor and
Carpenter (2001) showed that chewing increased the s-IgA secreted into saliva by epithelial
cell trancytosis. Salivary secretion was stimulated by chewing on a tasteless piece of
polythene tube, which therefore only stimulated masticatory salivary secretion. Similar
increases were also found in the secretion rates of total protein and a-amylase. Such changes
27
- -- .--------------------------------------------------------------
Chapter 1 Literature Review
in the quantity and quality of saliva by chewing gum may have potential health benefits, not
only for individuals suffering with xerostomia (dry mouth syndrome), but also for athletes as
a measure of counteracting the reported post-exercise drop in s-IgA secretion rate. This was
examined in one previous study where the effects of stimulated and unstimulated salivary
flow on the s-IgA response to high intensity exercise were compared. Participants cycled at
85% \'02max until volitional fatigue. Saliva secretion was stimulated by sucking a mint (taste
stimulation only) for 1 min prior to saliva collection. S-IgA secretion rate was found to
decrease with exercise but was higher in stimulated compared with unstimulated saliva
(Gleeson et aI., 2003).
1.18. Summary
This chapter presents a review of the effect of exercise on salivary markers of stress and
antimicrobial proteins. Specifically, it highlights the responses of s-IgA and lysozyme to
exercise and how these changes may be related to the salivary markers of adrenal activation:
cortisol and a-amylase. Exercise causes a marked increase in the activity of the SNS and the
HP A-axis which can act to modify both the synthesis and translocation of antimicrobial
proteins into saliva. However, whether this is in a positive or negative manner remains
controversial. It is clear that the s-IgA response to acute and chronic exercise requires further
attention and the response of other antimicrobial proteins to exercise are yet to be fully
investigated. Therefore, the main objectives of the present research studies were to:
1) Investigate the effect of pre-exercise nutritional status (fed versus overnight fasted) on
the s-IgA response to prolonged cycling
2) Investigate the effect of feeding versus fasting during prolonged exhaustive exercise
on salivary antimicrobial proteins
28
Chapter 1 Literature Review
3) Compare the effects of stimulated and unstimulated salivary flow on the s-IgA,
lysozyme and a-amylase responses to prolonged exhaustive cycling
4) Examine the effect of short duration cycling exercise at different intensities on
salivary antimicrobial proteins and markers of adrenal activation
5) Determine the effect of a 6-month period of training and competition on s-IgA and
URTI incidence in elite male and female swimmers
29
Chapter 2 General Methods
Chapter 2 - General Methods
2.1. Ethical approval
Approval of the study protocols included in this thesis was obtained prior to their
commencement by the Loughborough University Ethical Advisory Committee. The aims and
procedures were explained fully to each participant verbally and in writing. All participants
were given an opportunity to ask questions before providing written informed consent
(Appendix A), and were made fully aware that they were free to withdraw from the study at
any time without providing any reason.
Prior to beginning the study, the participants completed a health screen questionnaire
(Appendix B) and a physical activity questionnaire (Appendix C) to confirm that they were
suitable to take part. On each testing day, participants were required to complete a separate
health questionnaire (Appendix D) to confirm that they were not experiencing any symptoms
of illness.
2.2. Protocol for the determination of maximal oxygen uptake (Y02ma,)
Measurements of Y02ma< were conducted within 1-2 weeks before commencing the main
trials. Participants performed a continuous incremental exercise test on an
electromagnetically braked cycle ergometer (Lode Excalibur, Groningen, Netherlands) to
volitional exhaustion to determine their maximal oxygen uptake (Y02ma<). Following a 3-min
warm-up, participants began cycling at 70 W for Chapter 7 and 95 W for all other trials with
increments of 35 Wevery 3 min. Verbal encouragement was provided to each participant to
ensure maximal effort. Samples of expired gas were collected in Douglas bags (Harvard
30

Chapter 2 General Methods
Apparatus, Edenbridge, UK) during the third minute of each work rate increment and heart
rate (HR) was measured continuously using short-range radio telemetry (Polar Beat, Polar
Electro Ltd., Oy, Finland). An oxygen/carbon dioxide analyser (Servomex 1400, Crowbridge,
UK) was used along with a dry gas meter (Harvard Apparatus, Edenbridge, UK) for the
determination of VE, VO, and VCO,. From the VO, work rate relationship, the work rates
equivalent to 65% V02ma, (Chapter 4), 50% and 75% V02max (Chapter 7) and 60% and 75%
VO'max (Chapter 6) for each participant were interpolated.
2.3. Familiarisation trials
In Chapters 4, 5 and 6 participants performed a familiarisation ride prior to their main trials.
The purpose of this was to familiarise them with the exercise protocol and to check that the
correct relative exercise intensity (% V02max) was being performed. Participants cycled at the
specific work rate and amount of time that was to be performed for each of the main trials.
Expired gas samples were collected over a l-min period into Douglas bags after 10 min and
30 min of exercise and then every 30 min thereafter. Heart rate and RPE were also measured
every 15 min. Prior to all main trials the participants were familiarised with the saliva
collection procedure. This enabled them to feel comfortable with the collection method and to
establish individual flow rates and an appropriate collection time to ensure that an adequate
volume (- 1.5 mL) of saliva was collected for analysis.
2.4. Analytical methods
2.4.1. Saliva sampling and analysis
All saliva collections were made with the participants seated, leaning forward and with their
heads tilted down. Participants were instructed to swallow in order to empty the mouth before
31
Chapter 2 General Methods
an unstimulated whole saliva sample was collected over a pre-determined time period into a
pre-weighed, sterile vial. Care was taken to allow saliva to dribble into the collecting tubes
with eyes open making minimal orofacial movement. Samples were then stored at -80°C until
analysis.
2.4.2. Determination of saliva flow rate
Saliva volume was estimated by weighing to the nearest mg and the saliva density was
assumed to be 1.0 g.rnL·1 (Cole and Eastoe, 1988). Saliva flow rate (mL.min'l ) was
determined by dividing the volume of saliva by the collection time.
2.4.3. Determination of salivary IgA concentration
After thawing, the stored saliva samples were analysed for IgA using a sandwich-ELISA
method similar to that described by Gomez et at. (1991). Briefly, flat-bottomed microtitration
plates (Coming medium affinity plates, Sigma, roole Dorset) were coated with the primary
antibody, rabbit anti-human IgA (1-8760, Sigma, Poole, UK) at a dilution of 1 in 800 in
carbonate buffer, pH 9.6. After washing with phosphate buffered saline (PBS, pH 7.2) the
plates were coated with blocking protein solution (2% w/v bovine serum albumin in PBS).
Sample analysis was performed in duplicate using saliva samples diluted 1 in 1000 with PBS
and a range of standards (Human colostrum IgA, 1-2636, Sigma) up to 500 mg.L·1• A set of
standards was incorporated into each micro-well plate, and all samples from a single subject
were analysed on a single plate. The plates were incubated for 90 min at room temperature.
Following a washing step, peroxidase-conjugated goat anti-human IgA (A-4l65, Sigma) was
added and the plate was incubated for a further 90 min at room temperature. Following
another washing step, the substrate, ABTS (Boehringer Mannheim, Lewes, UK) was added
and after 15 min the absorbance was measured at 405nm. Salivary IgA concentration was
32
Chapter 2 General Methods
determined by interpolation from the linear standard calibration curve. The intra-assay
coefficient of variation for s-IgA concentration was 7.2%.
2.4.4. Determination of a-amylase, cortisol, chromogranin A, lysozyme and osmolality
Alpha-amylase activity was measured using a spectrophotometric method as previously
described by Li and Gleeson (2004). Salivary cortisol (DX-SLV-2930, DRG Instruments,
Marburg, Germany), Chromogranin A (CgA) (Cosmo Bio Co., Ltd, Japan) and lysozyme
(Biomedical Technologies Inc., USA) concentration were analysed using commercially
available ELISA kits. Osmolality was determined using a cryoscopic (freezing point
depression) osmometer (Osmomat 030, Gonotec, GbBH, Berlin, Germany) calibrated with
300 mOsmol.kg,1 NaCl solution. The intra-assay coefficient of variation for the analytical
methods used in all studies combined were 2.4%, 1.3%, 7.9% and 8.2% for a-amylase,
cortisol, CgA'and lysozyme, respectively.
2.4.5. Determination of secretion rate
The secretion rate of s-IgA, lysozyme, a-amylase and CgA was calculated by multiplying the
saliva flow rate by the concentration of the measured analyte.
2.5. Reporting of respiratory illness
In Chapter 8 symptoms of URTI were recorded weekly by means of a questionnaire
(Appendix E), adapted from the Wisconsin Upper Respiratory Symptom Survey (WURSS-
21; Barrett et al., 2002). This referred to symptoms of URTI exhibited during the previous
week. A positive incidence of URTI was recorded when two or more symptoms were
exhibited on two consecutive days, at least 1 week apart from a previous episode.
33
Chapter 2 General Methods
2.6. General statistical methods
All statistical analysis was performed using SPSS 12.0 software for Windows (SPSS Inc.,
Chicago IL, USA). Data are presented as mean values and standard error of the mean (±
SEM). Data were checked for normality, homogeneity of variance and sphericity before
statistical analysis. If the data were not normally distributed, analysis was performed on
logarithmic transformed data. In Chapter 8 data were analysed using a one-factor analysis of
variance (ANOV A) with repeated measures design. Chapters 4, 5, 6 and 7 employed a two
factor (trial x timepoint) repeated measures ANOV A. Significant differences were assessed
using Student's paired (-test with Holm-Bonferroni adjustments for multiple comparisons.
Single comparisons between trials were assessed using Student's paired (-tests with Holm
Bonferroni adjustments. Statistical significance was accepted at P < 0.05.
34
Chapter 3 Nutritional status, exercise and s-IgA
Chapter 3 - Study 1: Influence of a fed or fasted state on the s-IgA response
to prolonged exercise
Abstract
It has been previously suggested that the nutritional status of an individual can influence the
levels of salivary immunoglobulin A (s-IgA) at rest, yielding higher and more variable
concentrations in fasting saliva compared to non-fasting saliva (Gleeson et aI., 2004a).
Prolonged, strenuous exercise has been associated with changes in the levels of this antibody
(Gleeson et al., 2003a); however the influence of the fed or fasted state on the s-IgA response
is unknown. Thus, the present study investigated the effect of a fed or fasted state on the s
IgA response to prolonged exercise. Using a randomised cross-over design, 8 males and 8
females of mixed physical fitness, mean ± SEM age 22 ± 1 yr, performed 2 h cycling on a
stationary ergometer at 65% of their maximal oxygen uptake on one occasion following an
overnight fast (FAST) and on another occasion following the consumption of a 2.2 MJ high
carbohydrate meal (FED) 2 h before. Timed, unstimulated whole saliva samples were
collected immediately before ingestion of the meal, immediately pre-exercise, at 5 min before
cessation of exercise, immediately post-exercise and at 1 h post-exercise. The samples were
analysed for s-IgA concentration, osmolality and cortisol and saliva flow rates were
determined to calculate the s-IgA secretion rate. Carbohydrate oxidation was significantly
higher (P < 0.05) and fat oxidation tended to be lower (P = 0.06) in FED compared with
FAST. Saliva flow rate decreased during exercise from 0.50 ± 0.04 mL.min· l to 0.37 ± 0.03
mL.min·] (P < 0.05), s-IgA concentration increased during exercise from 163 ± 20 to 232 ±
24 mg.L·] (P < 0.05) but the s-IgA secretion rate remained unchanged, pre-exercise: 79 ± 11
llg.min·], post-exercise: 74 ± 9 llg.min·1. There was a significant reduction in the s
IgA:osmolality ratio from 2.3 ± 0.2 pre-exercise to 1.5 ± 0.1 post-exercise (P < 0.05).
35

Chapter 3 Nutritional status, exercise and s-IgA
Salivary cortisol increased from 9.9 ± 1.6 pre-exercise to 16.7 ± 2.9 nmol.L-1 post-exercise (P
< 0.05). There was no effect of FED versus FAST on these salivary responses. The
immediately pre-exercise values of s-IgA were 165 ± 27 and 161 ± 27 mg.L-1 in the FED and
FAST trials, respectively. The s-IgA concentration and secretion rate were found to be
significantly lower in females than in males across all time points (P < 0.05); however, there
was no significant difference between genders in the saliva flow rate or the s-IgA:osmolality
ratio. These data demonstrate that the nutritional status does not influence resting s-IgA or the
s-IgA response to prolonged exercise. Furthermore, these data suggest a significant effect of
gender on resting s-IgA levels without affecting the acute response to exercise.
3.1. Introduction
Mucosal secretions protect the oral mucosa via a mechanical washing effect and play an
important role in immunity as the first line of defence against potential pathogens invading
the oral and nasal cavities (Gleeson and Pyne 2000). The principal antibody present in
mucosal fluids is immunoglobulin A (IgA) which functions to inhibit the colonisation of
pathogens, bind antigens for transport across the epithelial barrier and neutralise viruses
(Lamm, 1998). A reduction in the concentration of s-IgA has been implicated as a causal
factor for the reported increased incidence of URTI during heavy training in athletes
(Fahlman and Engels, 2005; Gleeson et al., 1999). Indeed, several studies have reported
significant reductions in s-IgA levels following an acute bout of intense exercise (Gleeson et
al., 1999, Nieman et al., 2002; Steerenberg et al., 1997; Tomasi et al., 1982) and it is thought
that these effects are cumulative over time, since s-IgA concentration fell during a 7-month
training period, and the pre-training levels were inversely correlated with symptoms of URTI
(Gleeson et al., 1999).
36
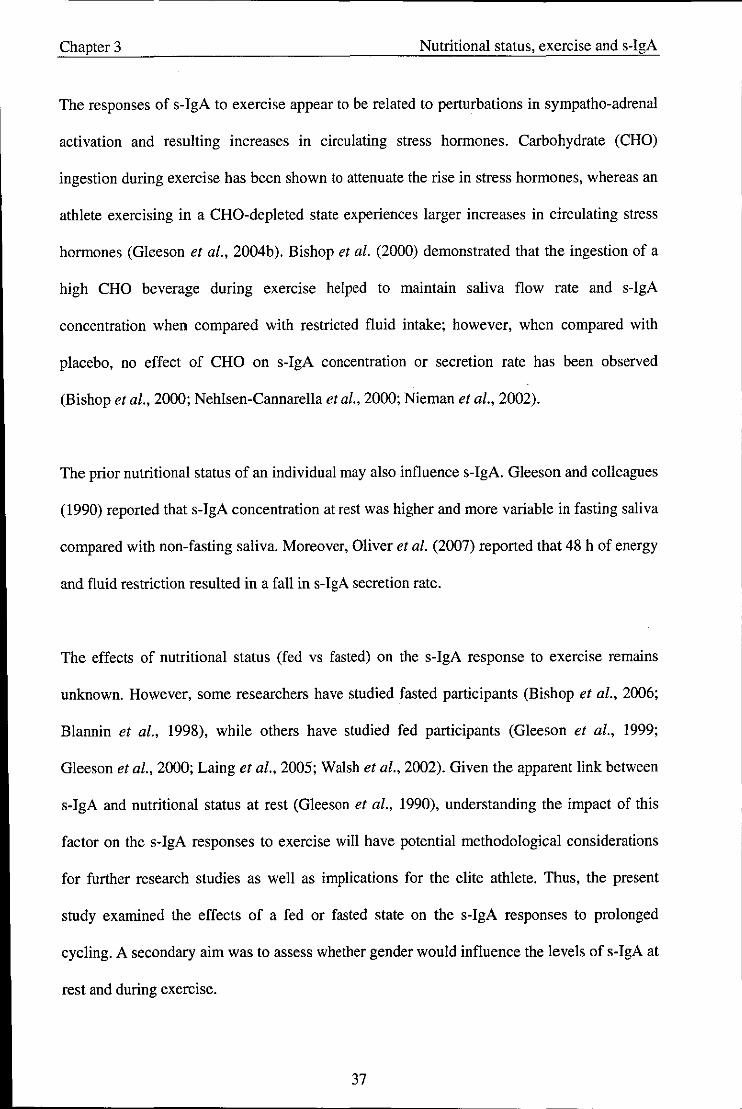
Chapter 3 Nutritional status, exercise and s-IgA
The responses of s-IgA to exercise appear to be related to perturbations in sympatho-adrenal
activation and resulting increases in circulating stress hormones. Carbohydrate (CHO)
ingestion during exercise has been shown to attenuate the rise in stress hormones, whereas an
athlete exercising in a CHO-depleted state experiences larger increases in circulating stress
hormones (Glee son et al., 2004b). Bishop et al. (2000) demonstrated that the ingestion of a
high CHO beverage during exercise helped to maintain saliva flow rate and s-IgA
concentration when compared with restricted fluid intake; however, when compared with
placebo, no effect of CHO on s-IgA concentration or secretion rate has been observed
(Bishop et al., 2000; Nehlsen-Cannarella et aI., 2000; Nieman et al., 2002).
The prior nutritional status of an individual may also influence s-IgA. Gleeson and colleagues
(1990) reported that s-IgA concentration at rest was higher and more variable in fasting saliva
compared with non-fasting saliva. Moreover, Oliver et al. (2007) reported that 48 h of energy
and fluid restriction resulted in a fall in s-IgA secretion rate.
The effects of nutritional status (fed vs fasted) on the s-IgA response to exercise remains
unknown. However, some researchers have studied fasted participants (Bishop et aI., 2006;
Blannin et aI., 1998), while others have studied fed participants (Gleeson et al., 1999;
Gleeson et aI., 2000; Laing et al., 2005; Walsh et al., 2002). Given the apparent link between
s-IgA and nutritional status at rest (Gleeson et al., 1990), understanding the impact of this
factor on the s-IgA responses to exercise will have potential methodological considerations
for further research studies as well as implications for the elite athlete. Thus, the present
study examined the effects of a fed or fasted state on the s-IgA responses to prolonged
cycling. A secondary aim was to assess whether gender would influence the levels of s-IgA at
rest and during exercise.
37

Chapter 3 Nutritional status, exercise and s-IgA
3.2. Methods
3.2.1. Participants
Sixteen fit, healthy men and women (8 males and 8 females) volunteered to take part in the
study. Their physical characteristics are outlined in Table 3.1. Following a preliminary
Y02m" test and familiarisation ride, participants completed 2 main trials in a
counterbalanced order, on separate occasions separated by at least I week.
Table 3.1. Participant Characteristics (N = 16).
Variable
Age (yr)
Body Mass (kg)
Height (cm)
Mean (± SEM)
Males (n=8)
22± I
80.6 ± 5.8
182 ± 1
51.0 ± 3.6
* Significantly different to Males (P < 0.05).
3.2.2. Experimental procedures
Females (n=8)
22± I
60.0±0.9 *
165 ± 1*
39.5 ±O.? *
Participants reported to the laboratory at 09:00 h following an overnight fast (10-12 h). A
resting fingertip blood sample was obtained using an autoclick lancet, and the blood glucose
concentration was analysed using an Accutrend GC (Roche, Germany) glucose analyser. This
was to confirm the participants were in a fasted state. Mean values were 4.4 ± 0.3 mmo1.L·1
on the treatment days. Participants then consumed either: 3 cereal bars and 500 mL of a
commercially available sports drink (FED; total energy content: 2210 kJ) or 500 mL of a
dilute low calorie cordial drink (FAST; total energy content: 60 kJ). The nutritional content
of the breakfast is outlined in Table 3.2. The participants were required to consume the
38
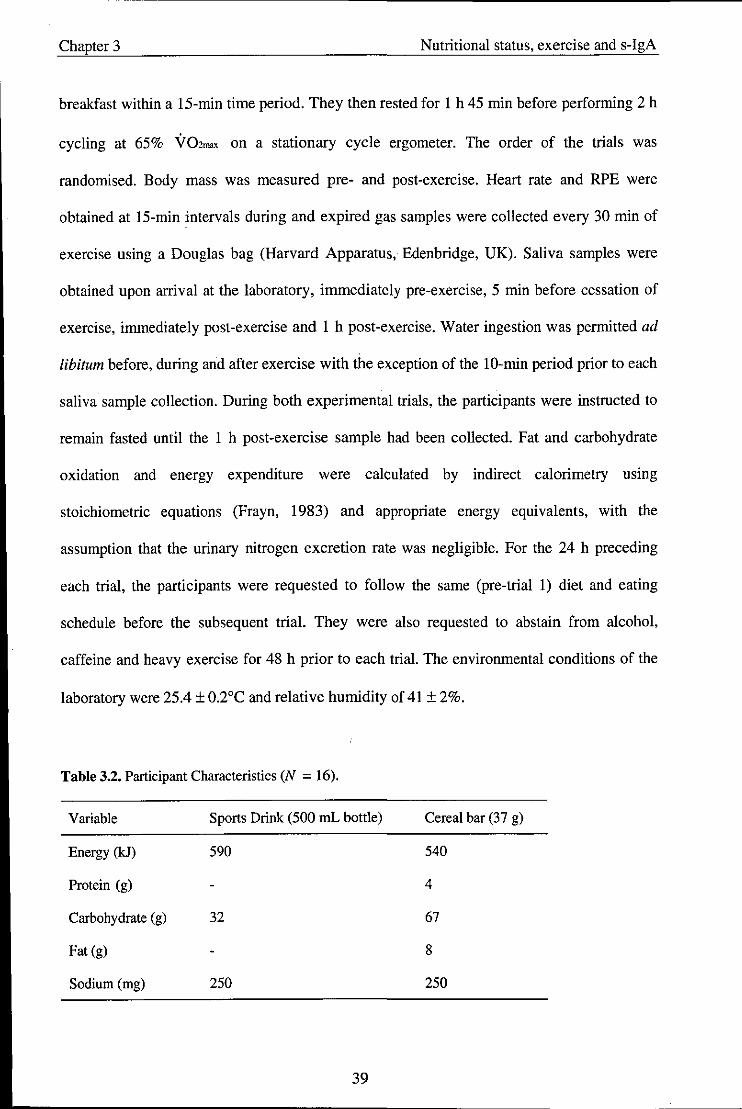
Chapter 3 Nutritional status, exercise and s-IgA
breakfast within a IS-min time period. They then rested for 1 h 45 min before performing 2 h
cycling at 65% VD,,,,,,, on a stationary cycle ergometer. The order of the trials was
randomised. Body mass was measured pre- and post-exercise. Heart rate and RPE were
obtained at 15-min intervals during and expired gas samples were collected every 30 min of
exercise using a Douglas bag (Harvard Apparatus, Edenbridge, UK). Saliva samples were
obtained upon arrival at the laboratory, immediately pre-exercise, 5 min before cessation of
exercise, immediately post-exercise and 1 h post-exercise. Water ingestion was permitted ad
libitum before, during and after exercise with the exception of the 10-min period prior to each
saliva sample collection. During both experimental trials, the participants were instructed to
remain fasted until the 1 h post-exercise sample had been collected. Fat and carbohydrate
oxidation and energy expenditure were calculated by indirect calorimetry using
stoichiometric equations (Frayn, 1983) and appropriate energy equivalents, with the
assumption that the urinary nitrogen excretion rate was negligible. For the 24 h preceding
each trial, the participants were requested to follow the same (pre-trial 1) diet and eating
schedule before the subsequent trial. They were also requested to abstain from alcohol,
caffeine and heavy exercise for 48 h prior to each trial. The environmental conditions of the
laboratory were 25.4 ± 0.2°C and relative humidity of 41 ± 2%.
Table 3.2. Participant Characteristics (N = 16).
Variable Sports Drink (500 mL bottle) Cereal bar (37 g)
Energy (kJ) 590 540
Protein (g) 4
Carbohydrate (g) 32 67
Fat (g) 8
Sodium (mg) 250 250
39
Chapter 3 Nutritional status, exercise and s-IgA
3.2.3. Saliva collection and analysis
All saliva collections and analyses were performed as described in Chapter 2.
3.2.4. Statistical analysis
For comparison of the effects of nutritional status (FED vs FAST) and gender (males vs
females) the data were examined using a 2 (trials) x 5 (times of measurement) repeated
measures ANOV A for saliva flow rate, salivary IgA concentration, salivary IgA secretion
rate, salivary osmolality and salivary cortisol concentration. Significant differences were
assessed using Student's paired t-test with Holm-Bonferroni adjustments for multiple
comparisons. Physiological variables, RPE and blood glucose were examined using Student's
paired t-tests. Gender comparisons at pre-exercise in the fasted trial were made using
Student's unpaired t-tests. Statistical significance was accepted at P < 0.05.
3.3. Results
3.3.1. Physiological variables and RPE
Results for exercise intensity (% Y02m", ), HR, RPE and body mass changes are presented in
Table 3.3. There were no significant differences between trials in any of the physiological
variables.
40
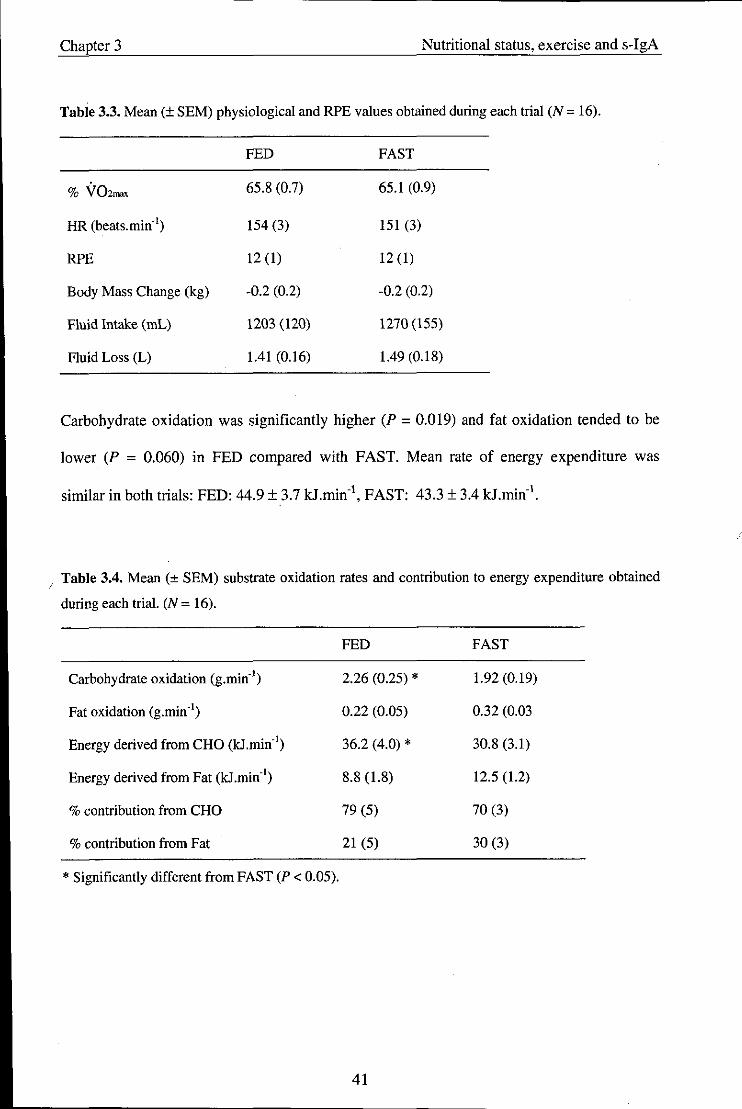
Chapter 3 Nutritional status, exercise and s-IgA
Table 3.3. Mean (± SEM) physiological and RPE values obtained during each trial (N = 16).
FED FAST
% V02_ 65.8 (0.7) 65.1 (0.9)
HR (beats. min") 154 (3) 151 (3)
RPE 12 (1) 12 (1)
Body Mass Change (kg) -0.2 (0.2) -0.2 (0.2)
Fluid Intake (mL) 1203 (120) 1270 (155)
Fluid Loss (L) 1.41 (0.16) 1.49 (0.18)
Carbohydrate oxidation was significantly higher (P = 0.019) and fat oxidation tended to be
lower (P = 0.060) in FED compared with FAST. Mean rate of energy expenditure was
similar in both trials: FED: 44.9 ± 3.7 kJ.min·\ FAST: 43.3 ± 3.4 kJ.min· l.
I Table 3.4. Mean (± SEM) substrate oxidation rates and contribution to energy expenditure obtained
during each trial. (N = 16).
FED FAST
Carbohydrate oxidation (g.min·') 2.26 (0.25) * 1.92 (0.19)
Fat oxidation (g.min") 0.22 (0.05) 0.32 (0.03
Energy derived from CHO (kJ.min·') 36.2 (4.0) * 30.8 (3.1)
Energy derived from Fat (kJ .min·') 8.8 (1.8) 12.5 (1.2)
% contribution from CHO 79 (5) 70 (3)
% contribution from Fat 21 (5) 30 (3)
* Significantly different from FAST (P < 0.05).
41
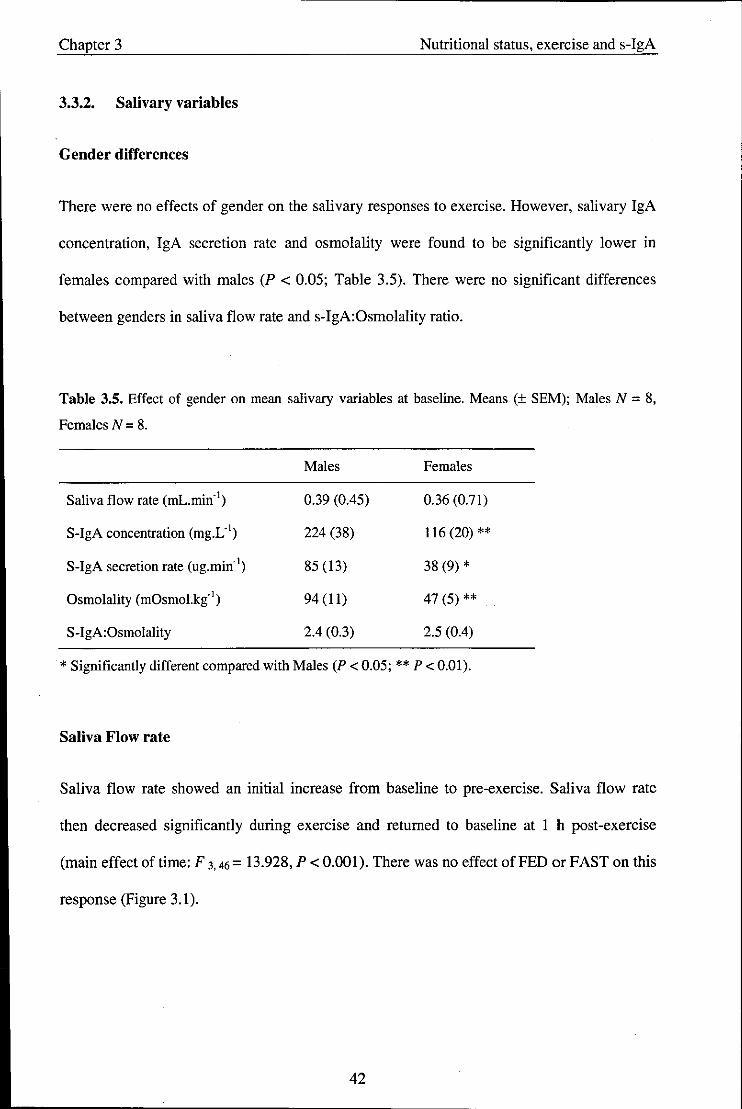
Chapter 3 Nutritional status, exercise and s-IgA
3.3.2. Salivary variables
Gender differences
There were no effects of gender on the salivary responses to exercise. However, salivary IgA
concentration, IgA secretion rate and osmolality were found to be significantly lower in
females compared with males (P < 0.05; Table 3.5). There were no significant differences
between genders in saliva flow rate and s-IgA:Osmolality ratio.
Table 3.5. Effect of gender on mean salivary variables at baseline. Means (± SEM); Males N = 8,
Females N = 8.
Males Females
Saliva flow rate (mL.min-' ) 0.39 (0.45) 0.36 (0.71)
S-IgA concentration (mg.L-' ) 224 (38) 116 (20) **
S-IgA secretion rate (ug.min-1) 85 (13) 38 (9) *
Osmolality (mOsmol.ki' ) 94 (11) 47 (5) **
S-IgA:Osmolality 2.4 (0.3) 2.5 (0.4)
* Significantly different compared with Males (P < 0.05; ** P < 0.01).
Saliva Flow rate
Saliva flow rate showed an initial increase from baseline to pre-exercise. Saliva flow rate
then decreased significantly during exercise and returned to baseline at 1 h post-exercise
(main effect of time: F 3. 46 = 13.928, P < 0.001). There was no effect of FED or FAST on this
response (Figure 3.1).
42
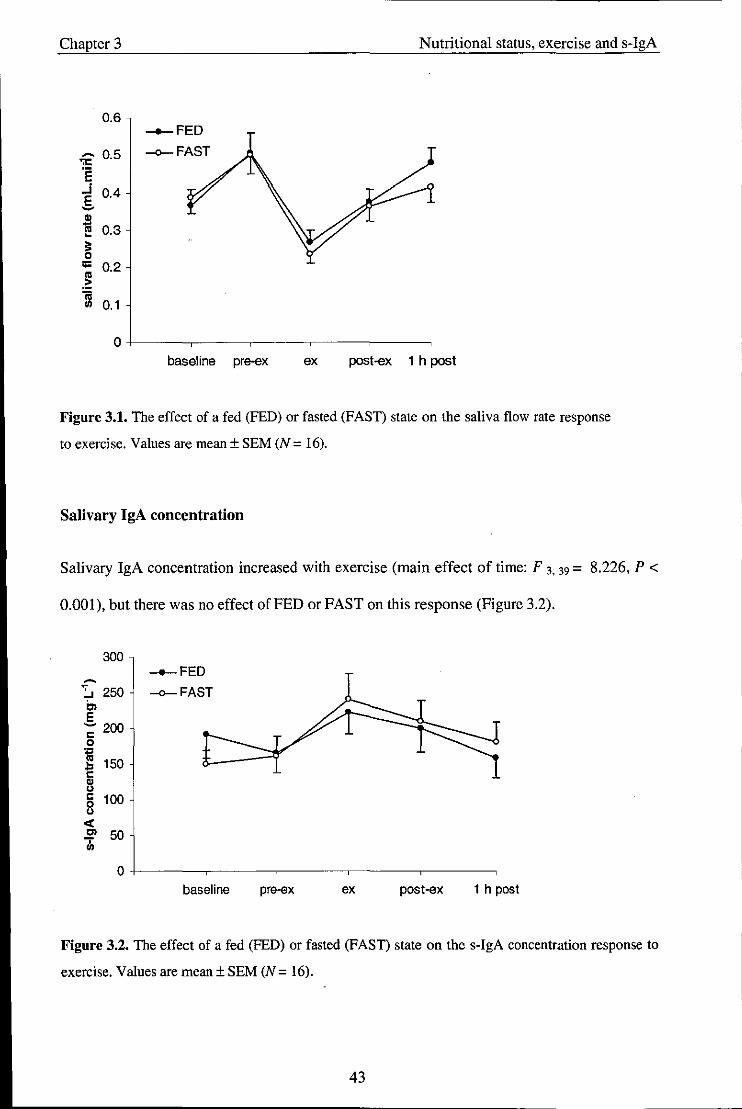
Chapter 3 Nutritional status, exercise and s-IgA
Figure 3.1. The effect of a fed (FED) or fasted (FAST) state on the saliva flow rate response
to exercise. Values are mean ± SEM (N = 16).
Salivary IgA concentration
Salivary IgA concentration increased with exercise (main effect of time: F 3. 39 = 8.226, P <
0.001). but there was no effect of FED or FAST on this response (Figure 3.2).
300 __ FED
~ :. 250 -o-FAST en E ~ 200 I: 0
~ ~ 150 I:
1.: I: 100 0
" <I: en 50 ..,. III
0
baseline pre-ex ex post-ex 1 h post
Figure 3.2. The effect of a fed (FED) or fasted (FAST) state on the s-IgA concentration response to
exercise. Values are mean ± SEM (N = 16).
43

· ._------------------------------------
Chapter 3 Nutritional status, exercise and s-IgA
Salivary IgA secretion rate
The s-IgA secretion rate did not change significantly throughout the exercise protocol (Figure
3.3).
100 ___ FED
90 -o-FAST ~
.,." 80 'E Cl 70 ~ .. - 60
" ~ 50 " .2 - 40 .. ~
u .. 30 .,
..:
.!!' 20 ch
10
0
baseline pre-ex ex post-ex 1 h post
Figure 3.3. The effect of a fed (FED) or fasted (FAST) state on the s-IgA secretion response to
exercise_ Values are mean ± SEM (N = 16).
Salivary osmolality
Salivary osmolality increased with exercise (main effect of time: F 1.21 = 19_587, P < 0.001).
Salivary IgA:Osmolality ratio decreased post-exercise (main effect of time: F 3.44 = 13.830, P
< 0_001). There was no effect of FED or FAST on these responses (Table 3.6).
44

Chapter 3 Nutritional status, exercise and s-IgA
Table 3.6. Mean (± SEM) osmolality values and s-lgA:Osmolality ratio obtained during each trial
(N = 16).
Baseline Pre-ex Ex Post-ex 1 h post-ex
Osmolality (mOsmol.kg")
FED 77 (12) 71 (8) 144 (21) 148 (23) 69 (9)
FAST 64 (6) 66 (8) 152 (25) 152 (24) 73 (11)
s-lgA- to-osmolality ratio
FED 2.6 (0.3) 2.2 (0.2) 1.7 (0.2) 1.5 (0.2) 2.4 (0.4)
FAST 2.4 (0.3) 2.4 (0.3) 1.7 (0.2) 1.5 (0.2) 2.7 (0.3)
Values are means ± SEM (FED, FAST, N = 16).
Salivary cortisol
Salivary cortisol increased post-exercise compared with pre-exercise (main effect of time: F 1.
6 = 6.856, P = 0.040). There was no effect of FED or FAST on this response (Table 3.7).
Table 3.7. Mean (± SEM) cortisol (nmoI.L") values obtained during each trial (N = 16).
FED
FAST
Pre-ex
10.44 (2.16)
9.35 (1.44)
Post-ex
16.65 (3.74)
16.60 (3.82)
45

Chapter 3 Nutritional status, exercise and s-IgA
3.4. Discussion
The primary aim of this study was to examine the influence of a fed or fasted state on the s
IgA response to prolonged cycling. This was based on previous reports from an Australian
laboratory that fasting saliva samples yield higher and more variable s-IgA concentrations
than non-fasting samples (Gleeson et al., 1990; Gleeson et al., 2004a). A secondary aim was
to examine the effects of gender on the s-IgA responses, since this had not previously been
investigated under controlled laboratory conditions.
It has been previously suggested that fasting saliva samples yield higher and more variable s
IgA concentrations than non-fasting samples at rest (Gleeson et aI., 1990; G1eeson et al.,
2004a). The present findings do not support this idea since none of the salivary parameters
were affected by the pre-exercise nutritional status. Furthermore, the spread of the data -
indicated by the SEM - for this group of individuals under the two conditions were very
similar.
It is possible that the differences in s-IgA between fed and fasted states that have been
previously reported (Gleeson et al., 1990) may be related to the amount of fluid ingested,
since this can affect the saliva flow rate and resulting s-IgA concentration (Bishop et al.,
2000). Gleeson and colleagues (1990) did not report the saliva flow rate or whether fluid
ingestion in the fasted state was controlled thus, the increase in s-IgA concentration observed
may have been due to lack of fluid intake and dehydration. In the present study the quantity
of fluid ingested before exercise was the same between conditions (500 mL); however, had
this not been equal, it is possible that higher and more variable samples would result.
46

Chapter 3 Nutritional status, exercise and s-IgA
In addition, it is possible that the timing of the meal is important in determining the s-IgA
response. The present study provided a high CHO meal 2 h before commencing the exercise
as this is what is typically recommended for individuals engaging in physical activity
(Williams and Serratosa, 2006). However, since the timing of meals was not reported in the
previously cited study, a direct comparison cannot be made. Thus, future studies may attempt
to address this. Nevertheless, from a methodological point of view, what these results suggest
is that exercise performed in either a fed or fasted state (of approximately 10 h) would have
little influence on the response pattern or variability of s-IgA.
The present results show a significant reduction (- 50%) in saliva flow rate with exercise
returning to baseline levels at 1 h post-exercise. A decrease in saliva flow rate with exercise
is a consistent finding reported in many studies (Steerenberg et al., 1997; Mackinnon and
Jenkins, 1993; Walsh et al., 2002; Blannin et al., 1998). Salivary secretion is predominantly
under the control of the autonomic nervous system (Chicharro et al., 1998) and is dependent
on both parasympathetic cholinergic nerves and sympathetic adrenergic nerves. It has been
previously suggested that the reduction in saliva flow rate during exercise is a result of an
increase in SNS activity inducing vasoconstriction in the arterioles supplying the salivary
glands (Chicharro et al., 1998). However, since only sympathetic secretomotor. rather than
vasoactive nerve fibres are activated under reflex conditions (Proctor and Carpenter, 2007),
this would suggest that the exercise-induced reduction in saliva flow rate is related to a
removal of parasympathetic vasodilatory influences. Indeed, the saliva flow rate was lowest
at the time point during exercise when parasympathetic activity would be largely inhibited,
and this started to recover upon cessation of exercise when parasympathetic innervation
would return. Although parasympathetic nervous system activity was not directly examined
in the present study, it is likely that the exercise intensity was sufficient to affect this activity
47

Chapter 3 Nutritional status, exercise and s-IgA
and based on this assumption; it is not surprising that significantly lower saliva flow rates
were observed during exercise.
Dehydration can also impact negatively on saliva flow rate (Bishop et aI., 2002; Walsh et al.
2004), which usually occurs following body mass losses of -3% (Walsh et al. 2004). In the
present investigation, fluid intake was permitted ad libitum, which resulted in small body
mass losses (-0.5%) despite this, a decrease in saliva flow rate and an increase in osmolality
was still observed. These findings contrast Bishop et al. (2000) and Walsh et al. (2004),
where fluid intake (to match pre-determined sweat losses in the latter study) prevented the
decrease in flow rate and increase in osmolality. This suggests a greater effect of neural
acti vation on saliva electrolyte secretion and flow rate during exercise rather than dehydration
per se. These findings may question the reliability of salivary osmolality as an indicator of
hydration status post-exercise.
Such a reduction in saliva flow rate can impair the mechanical washing effect of micro
organisms from the oral cavity and may also limit the availability of salivary antimicrobial
proteins such as s-IgA. This is supported by findings showing that people suffering from
xerostomia (dry mouth syndrome) have a substantially increased incidence of oral infections
and more pathogenic bacteria in the buccal cavity (Fox et al., 1985). It is therefore possible
that a reduction in saliva flow rate resulting from exercise may lead to an increased risk of
developing URTI.
It is noteworthy that an initial increase in the saliva flow rate from baseline to the pre
exercise time point (2 h after) was observed. This could be due to a diurnal variation since
saliva flow rate increases throughout the day (Dawes, 1974). On the other hand, it may relate
to an anticipatory increase in SNS activity and inhibition of parasyrnpathetic innervation,
48
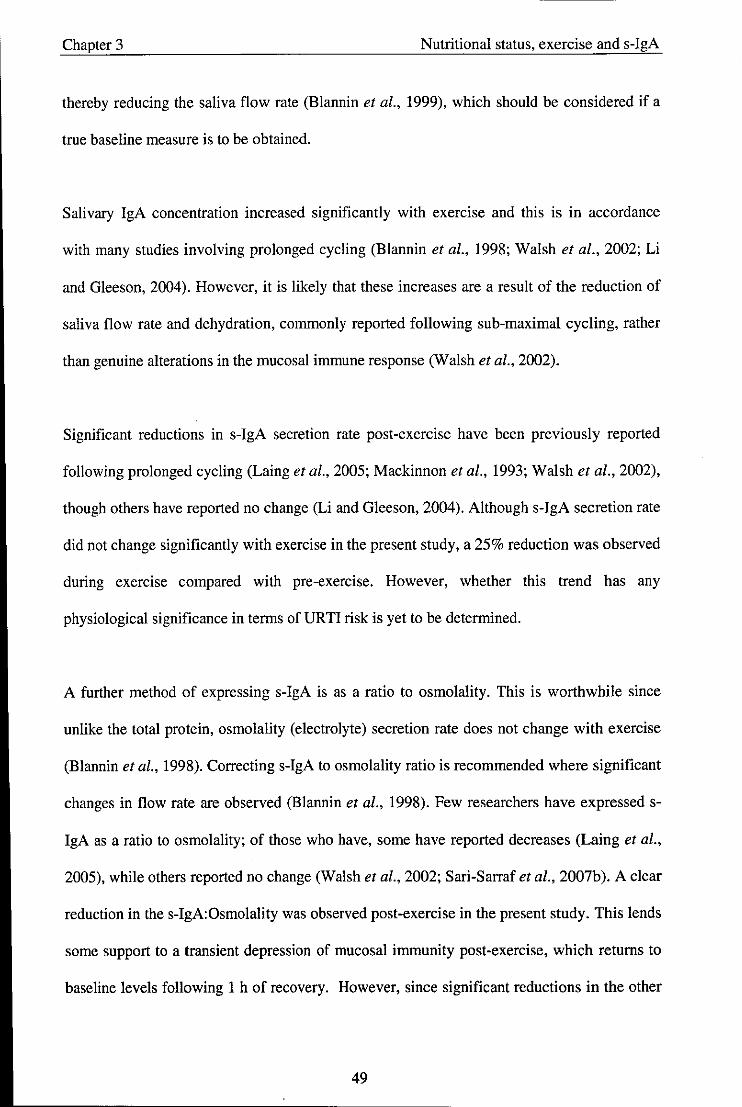
Chapter 3 Nutritional status, exercise and s-IgA
thereby reducing the saliva flow rate (Blannin et al., 1999), which should be considered if a
true baseline measure is to be obtained.
Salivary IgA concentration increased significantly with exercise and this is in accordance
with many studies involving prolonged cycling (Blannin et aI., 1998; Walsh et al., 2002; Li
and Gleeson, 2004). However, it is likely that these increases are a result of the reduction of
saliva flow rate and dehydration, commonly reported following sub-maximal cycling, rather
than genuine alterations in the mucosal immune response (Walsh et aI., 2002).
Significant reductions in s-IgA secretion rate post-exercise have been previously reported
following prolonged cycling (Laing et aI., 2005; Mackinnon et aI., 1993; Walsh et al., 2002),
though others have reported no change (Li and Gleeson, 2004). Although s-IgA secretion rate
did not change significantly with exercise in the present study, a 25% reduction was observed
during exercise compared with pre-exercise. However, whether this trend has any
physiological significance in terms of URTI risk is yet to be determined.
'A further method of expressing s-IgA is as a ratio to osmolality. This is worthwhile since
unlike the total protein, osmolality (electrolyte) secretion rate does not change with exercise
(Blannin et aI., 1998). Correcting s-IgA to osmolality ratio is recommended where significant
changes in flow rate are observed (Blannin et aI., 1998). Few researchers have expressed s
IgA as a ratio to osmolality; of those who have, some have reported decreases (Laing et aI.,
2005), while others reported no change (Walsh et al., 2002; Sari-Sarraf et aI., 2007b). A clear
reduction in the s-IgA:Osmolality was observed post-exercise in the present study. This lends
some support to a transient depression of mucosal immunity post-exercise, which returns to
baseline levels following 1 h of recovery. However, since significant reductions in the other
49
Chapter 3 Nutritional status, exercise and s-IgA
measures of s-IgA were not demonstrated, this highlights the continual discrepancies of
which measure to use when interpreting the effects of exercise on mucosal immune function.
Carbohydrate (CHO) has been shown to attenuate the cortisol response during exercise and it
has been shown that both CHO and fluid intake during prolonged sub-maximal exercise are
important in maintaining the saliva flow rate and s-IgA concentration compared with
restricted fluid intake (Bishop et al., 2000). The present study sought to examine the effect of
a high CHO meal ingested 2 h before exercise on the salivary responses compared with a
control low-energy beverage. Significant increases in salivary cortisol were observed post
exercise; however, no significant effects of treatment on salivary cortisol were observed.
Since alterations in mucosal immune function during exercise have been previously attributed
to the elevation of stress hormones induding cortisol, it is perhaps not surprising that no
differences in the s-IgA responses were observed between the two conditions.
Lower values in resting s-IgA concentration in females compared with males have been
previously demonstrated in elite swimmers (Gleeson et al., 1999); as well as the general
population (Evans et aI., 2000). However, no previous study has reported whether this has an
effect on the s-IgA response to acute exercise. Striking differences between genders were
found in many of the salivary parameters measured. No differences in saliva flow rate were
found between genders; however, significantly higher values of s-IgA concentration were
observed in the males compared with the females. This is in accordance with the above
findings (Evans et aI., 2000; Gleeson et aI., 1999); however, these researchers did not
measure the s-IgA secretion rate or salivary osmolality. Our results extend these findings
since higher values in these measures were also observed in the male group. Although there
was no effect of gender on the acute response to exercise, differences in resting s-IgA levels
between groups would have practical importance if exercise scientists are to use this
50
Chapter 3 Nutritional status, exercise and s-IgA
parameter as. a predictor of infection risk. If laboratories are to establish clinically significant
ranges, such differences would need to be taken into consideration.
The physiological significance of the observed gender differences are yet to be elucidated. It
is known that sex hormones play an important role in the immune system at rest (Timmons et
aI., 2005). However, Burrows et al., (2002) found no differences in s-IgA concentration, s
IgA secretion rate or saliva flow rate in a group of highly trained female endurance athletes
over three consecutive menstrual cycles. Moreover, there was no relationship between s-IgA
concentration and progesterone. It is possible that the differences relate to the absolute
training status of the participants (weight-specific V02ma, was 20% lower in females), as it
has been previously shown that s-IgA concentration is higher in elite athletes compared with
both active and non-active individuals (Francis et al., 2005). Finally, the diet of the
participants may have differed between genders and thus, it is not known whether the
differences were related to deficiencies in certain nutrients such as protein (Chandra, 1997;
Gleeson et aI., 2004a). Given that females appear to be more resistant to viral infections than
males in the general population (Beery, 2003), further research is required to investigate s
IgA in different athletic populations to determine how it might be important in infection risk.
In summary, the results from the present study show that prior nutritional status does not
affect resting s-IgA levels, or their acute response to exercise. Additionally, these results
demonstrate significant gender differences in resting s-IgA levels with no effect on the acute
s-IgA response to exercise.
51

Chapter 4 Feeding during exercise and AMPs
Chapter 4 - Study 2: Effect of feeding versus fasting during prolonged
exhaustive exercise on s-IgA, lysozyme and (X-amylase
Abstract
The purpose of the present study was to investigate the effect of feeding versus fasting during
prolonged exhaustive exercise on salivary antimicrobial proteins. Using a randomised cross
over design and following a 10 - 12 h overnight fast, 24 fit healthy men (mean ± SEM: age
23 ± 1 yr; height 179 ± 2 cm; body mass 73.8 ± 1.6 kg; Y02mox 56.6 ± 1.0 mL.kg·1.min·1)
cycled for 2.5 h at 60% Y02ma, (with regular water ingestion) and then cycled to exhaustion
at 75% Y02mox. Immediately before exercise, and at 55 min and 115 min during the 60%
Y02.,., cycle participants received a placebo beverage of 300 mL of artificial sweetened and
flavoured water (FAST) or a commercially available high CRG cereal bar intended for
nutritional support of athletes (FED). Timed, unstimulated saliva samples were collected
immediately before exercise, mid-exercise, at the end of the 2.5 h moderate exercise bout and
immediately after the exhaustive exercise bout. The samples were analysed for s-IgA
concentration, salivary lysozyme, a-amylase and cortisol and the saliva flow rates were
determined to calculate the secretion rates. Time to exhaustion was 44% longer in FED
compared with FAST (P < 0.05). Saliva flow rate did not change significantly during the
exercise protocol. Exercise was associated with increases in the secretion rates of s-IgA,
lysozyme and a-amylase (P < 0.01). Feeding during exercise caused a higher secretion rate
oflysozyme (43% higher) and a-amylase (15% higher) compared with fasting (P < 0.05), but
the s-IgA levels but were not different between the two treatments. Salivary cortisol increased
post-exhaustion in the FAST trial only (P < 0.05). Increases in lysozyme and a-amylase
suggest that ingesting a high CRG cereal bar during prolonged exhaustive exercise may
acutely enhance oral immune protection.
52

--~. --------------------------
Chapter 4 Feeding during exercise and AMPs
4.1. Introduction
Nutritional strategies are commonly employed by athletes not just to improve performance,
but also to modify the exercise-induced immune response. Carbohydrate (CHO) ingestion
before and during intense prolonged exercise has emerged to date as the most effective
measure to attenuate the stress response which appears to limit the degree of
immunodeppression (Nieman, 2007). Previous research has examined the influence of CHO
ingestion compared with placebo on the s-IgA response to prolonged exercise, but such
studies have shown little effect (Bishop et al., 2000; Nehlsen-Cannarella et aI., 2000; Nieman
et al., 2002). In Chapter 4 it was shown that the feeding of a high CHO meal 2 h before
exercise did not affect s-IgA. Moreover, Nieman et al. (2002) showed s-IgA concentration
and secretion rate were unaffected by the consumption of a CHO beverage during exercise.
However, in this case CHO was administered in the form of a beverage rather than as a meal.
This could be significant in terms of mucosal immunity since eating elicits a large increase in
salivary flow over and above resting levels (Hector and Linden, 1999), and mastication
(chewing) has been shown to temporarily enhance the secretion of s-IgA into saliva (Proctor
and Carpenter, 2001).
Salivary IgA is only one of the many protective proteins secreted in the fluids covering the
mucosa. Other secretory proteins important in mucosal defence include lysozyme and
amylase. They are part of the innate immune system, produced locally in the mucous
membranes and have antimicrobial and antiviral properties (Tenovuo, 1998). Previous
research has shown that salivary lysozyme levels may be affected by psychological stress,
where an inverse correlation between the perceived stress response (by means of a
questionnaire) to an undergraduate examination and lysozyme levels was reported (Perera et
al., 1997). The relationship between exercise and lysozyme is unclear at present although one
53

Chapter 4 Feeding during exercise and AMPs
study reported decreased lysozyme concentration and secretion rate post-exercise in elite
swimmers (Koutedakis et al., 1996). Generally it is accepted that a-amylase increases with
intense exercise (Bishop et al., 2000; Li and Gleeson, 2004; Walsh et al., 1999), and that this
effect is related to the exercise intensity (Ljungberg et ai., 1997). However, the influence of
feeding versus fasting during exercise on these secretory proteins is presently unknown.
Thus, the aims of the present study were to investigate the effect of ingestion of a
commercially available high CHO cereal bar compared with a control low energy, artificially
sweetened beverage during prolonged exhaustive exercise on salivary antimicrobial proteins
and exercise capacity.
4.2. Methods
4.2.1. Participants
Twenty four trained male volunteers (mean ± SEM: age 23 ± 1 yr; height 179 ± 2 cm; body
mass 73.8 ± 1.6 kg; V02max 56.6 ± 1.0 mL.kg·l.min·l; HRmax 190 ± 2 beats.min·l)
volunteered to participate in the study. Participants who regularly engaged in a high level of
exercise (2 h per day at least three times per week), with cycling as one of their main sports,
were recruited to participate. Following preliminary measurements, participants completed 2
main trials, in a counterbalanced order, which were separated by at least 1 week.
4.2.2. Experimental procedures
Participants were asked to abstain from alcohol and chocolate intake for the 24 h prior to each
visit to the lab and to refrain from strenuous exercise for two days prior to each visit.
Participants completed a food diary for the 48 h period prior to the familiarisation trial and
54
Chapter 4 Feeding during exercise and AMPs
were required to follow the same diet during the 48 h prior to each of the 2 main trials. The
participants arrived at the laboratory at 8:30 h following an overnight fast (10-12 h). They
were asked to sit quietly for 5 min, before giving a saliva sample. Immediately after the saliva
collection a blood sample was obtained from an ear lobe, using an autoclick lancet, and the
blood glucose concentration was determined using an Accutrend GC (Roche, Germany)
blood glucose analyser. The participants were then asked to empty their bladders before body
mass was measured wearing their shorts only. Participants then consumed either FED: a
commercially available coconut flavoured cereal bar (Powerbar™, Nestle, Switzerland)
consisting of carbohydrate (44.9 g), protein (5.4 g), fat (3.2 g), fibre (4 g), sodium (0.6 g),
vitamins and minerals or FAST: a placebo beverage of 300 mL of artificial sweetened and
flavoured water intended to not provide energy or nutritional ingredients. The participants
were required to consume the food and drink within a 5-min time period. The order of the
trials was randomised. They then performed 2.5 h cycling at 60% Y02max on a stationary
cycle ergometer. Experimental supplementation of either the 300 mL of the beverage or
cereal bar was administered at 55 and 115 min. In addition, 200 mL of water was consumed
at the beginning of exercise and every 20 min during the exercise bout. Heart rate and RPE
were measured at 20 min intervals and expired gas was collected at 30 min, 90 min and 114
min of exercise using a Douglas bag (Harvard Apparatus, Edenbridge, UK). Ear lobe blood
samples for the analysis of blood glucose were obtained at 65 and 125 min during the
exercise and saliva samples were collected at 70 min and 130 min. It was ensured that fluid
was not consumed during the 10 min before each saliva collection. Fat and carbohydrate
oxidation and energy expenditure were calculated by indirect calorimetry using
stoichiometric equations (Frayn, 1983) and appropriate energy equivalents, with the
assumption that the urinary nitrogen excretion rate was negligible. Following completion of
the 2.5 h cycling, the participants were given a 5-min rest before performing the ride to
exhaustion trial at 75% Y02""" . Participants were instructed to maintain a pedal cadence of
55
Chapter 4 Feeding during exercise and AMPs
more than 50 rpm while cycling, to remain seated at all times and to attempt to cycle for as
long as possible. However, no form of verbal encouragement or information on time elapsed
were given. Heart rate was recorded every 5 min during the exhaustion ride.
Immediately after completion of the exercise to exhaustion, a final saliva sample was
obtained and an earlobe blood sample was collected. Finally, body mass was measured again
in shorts only. Mean laboratory temperature and humidity during the trials were 23 ± 0.5 QC
and 32 ± 4 %, respectively.
4.2.3. Saliva analysis
All saliva collections and analyses were performed as described in Chapter 2.
4.2.4. Statistical analysis
A two-way ANOVA (2 conditions x 4 sample times) with repeated measures design was used
to examine the salivary data. Significant differences were assessed using Student's paired {
tests with Holm-Bonferroni adjustments for multiple comparisons. Physiological variables,
blood glucose and RPE were examined using Students paired t-tests. Statistical significance
was accepted at P < 0.05.
56
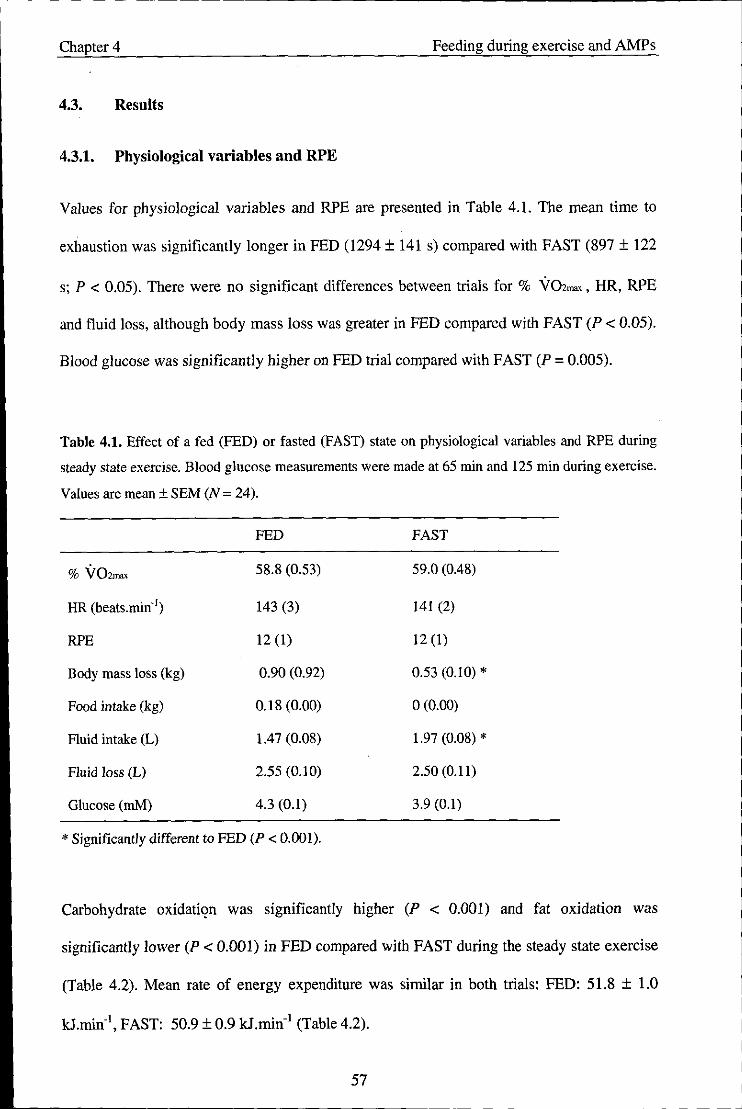
Chapter 4 Feeding during exercise and AMPs
4.3. Results
4.3.1. Physiological variables and RPE
Values for physiological variables and RPE are presented in Table 4.1. The mean time to
exhaustion was significantly longer in FED (1294 ± 141 s) compared with FAST (897 ± 122
s; P < 0.05). There were no significant differences between trials for % V02""" HR, RPE
and fluid loss, although body mass loss was greater in FED compared with FAST (P < 0.05).
Blood glucose was significantly higher on FED trial compared with FAST (P = 0.005).
Table 4.1. Effect of a fed (FED) or fasted (FAST) state on physiological variables and RPE during
steady state exercise. Blood glucose measurements were made at 65 min and 125 min during exercise.
Values are mean ± SEM (N = 24).
FED FAST
% V02mru< 58.8 (0.53) 59.0 (0.48)
HR (beats.min· l) 143 (3) 141 (2)
RPE 12 (1) 12 (1)
Body mass loss (kg) 0.90 (0.92) 0.53 (0.10) *
Food intake (kg) 0.18 (0.00) 0(0.00)
Fluid intake (L) 1.47 (0.08) 1.97 (0.08) *
Fluid loss (L) 2.55 (0.10) 2.50 (0.11)
Glucose (mM) 4.3 (0.1) 3.9 (0.1)
* Significantly different to FED (P < 0.001).
Carbohydrate oxidatil?n was significantly higher (P < 0.001) and fat oxidation was
significantly lower (P < 0.001) in FED compared with FAST during the steady state exercise
(Table 4.2). Mean rate of energy expenditure was similar in both trials: FED: 51.8 ± 1.0
kJ.min·1, FAST: 50.9 ± 0.9 kJ.min-1 (Table 4.2).
57

Chapter 4 Feeding during exercise and AMPs
Table 4.2. Mean (± SEM) substrate oxidation rates and contribution to energy expenditure obtained
during each trial. (N = 24).
FED FAST
Carbohydrate oxidation (g.min·1) 2.47 (0.08) * 2.08 (0.07)
Fat oxidation (g.min·1) 0.31 (0.03) * 0.45 (0.02)
Energy derived from CHO (kJ.min·1) 39.52 (1.26) * 33.26 (1.10)
Energy derived from Fat (kJ.min·1) 12.23 (1.18) * 17.69 (0.94)
% contribution from CHO 76 (2) * 65 (2)
% contribution from Fat 24 (2) * 35 (2)
* Significantly different from FAST (P < 0.001).
4.3.2. Salivary variables
Saliva flow rate
Saliva flow rate was similat between trials and did not change significantly during the
exercise protocol (Figure 4.1). A trend for a higher saliva flow rate in FED compared with
FAST approached significance (P = 0.061).
0.70 __ FAST ~
"" 0.60 ·s ..i 0.50 E ';' 0040 Oi ~ 0.30 o
0;:: 0.20
.~ 'iii 0.10 VI
0.00 +------r---~---~--_,
pre·ex 70min 130 min post-exh
Figure 4.1. Effect of a fed (FED) or fasted (FAST) state on saliva flow rate. Values are mean ± SEM
(N= 24).
58
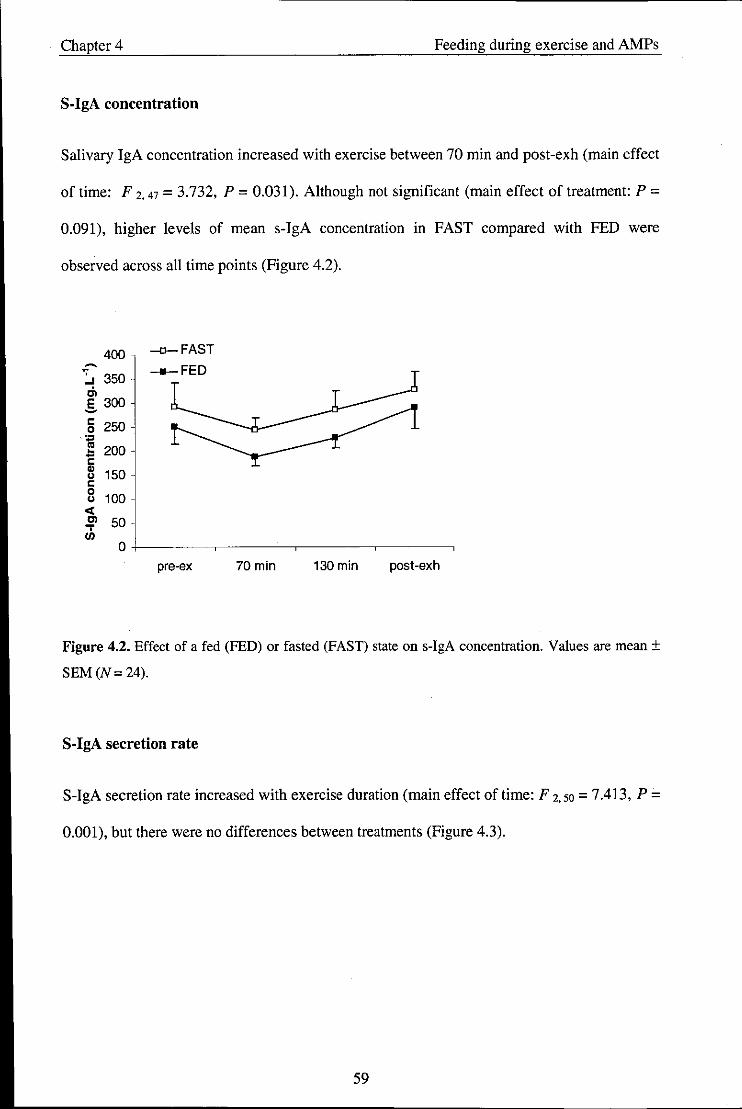
Chapter 4 Feeding during exercise and AMPs
S-IgA concentration
Salivary IgA concentration increased with exercise between 70 min and post-exh (main effect
of time: F 2. 47 = 3.732, P = 0.031). Although not significant (main effect of treatment: P =
0.091), higher levels of mean s-IgA concentration in FAST compared with FED were
observed across all time points (Figure 4.2).
400 --a-FAST ~ __ FED :.s 350 .;, E 300 -I: 250 0
' ... os 200 ~ -I: " 150 " I: 0
100 " <I; Cl 50 ..,. U)
0
pre-ex 70min 130 min post-exh
Figure 4.2. Effect of a fed (FED) or fasted (FAST) state on s-IgA concentration. Values are mean ±
SEM (N= 24).
S-IgA secretion rate
S-IgA secretion rate increased with exercise duration (main effect of time: F 2.50 = 7.413, P =
0.001), but there were no differences between treatments (Figure 4.3).
59

Chapter 4 Feeding during exercise and AMPs
~ 200 -Cl-FAST
"" 180 .~ 160
___ FED Cl -= 140
~ 120 -100 " 0 80 ~ - 60 u " Cl) 40
CC Cl 20 .,. III 0
pre·ex 70min 130 min post-exh
Figure 4.3. Effect of a fed (FED) or fasted (FAST) state on s-IgA secretion rate. Values are mean ±
SEM (N=24).
Lysozyme concentration
Salivary lysozyme concentration increased with exercise duration (main effect of time: F 2. 27
= 28.164, P < 0.001), and was significantly higher in FED compared with FAST across all
time points (main effect of treatment: F 1, 11 = 9.107, P = 0.012; Figure 4.4).
~
.J 16
~ 14 -Cl-FAST Cl ::J ___ FED ~ 12 " 0
10 ~ ~
8 " " u
" 6 0 u
" 4 E >- 2 N 0 fJ)
0 >-.J
pre-ex 70min 130 min post-ex
Figure 4.4. Effect of a fed (FED) or fasted (FAST) state on lysozyme concentration. Values are mean
± SEM (N = 24).
60

Chapter 4 Feeding during exercise and AMPs
Lysozyme secretion rate
Lysozyme secretion rate increased with exercise duration (main effect of time: F 2, 20 =
18,378, P < 0,001) and was significantly higher in FED compared with FAST across all time
points (main effect oftreatment: F 1.11 = 7.496, P = 0,019; Figure 4,5)
~9 ., ,: 8 -o-FAST E ___ FED ';'7 ::I ~
.!! 6 tU ~
c 5 0
~ 4
" Cl) 3 ., Cl)
E 2 ,., N
1 0 ., ,., ... 0
pre-ex 70min 130 min post-ex
Figure 4.5. Effect of a fed (FED) or fasted (FAST) state on lysozyme secretion rate, Values are mean
± SEM (N = 24),
Salivary a-amylase activity
Salivary a-amylase activity increased with exercise duration (main effect of time: F 2,42 =
96.388, P < 0,001), There was also a time x trial interaction in a-amylase (F 2. 56 = 10,254, P
< 0.001), where salivary a-amylase was significantly higher in FED compared with FAST at
the 70 min time point; Figure 4.6),
61
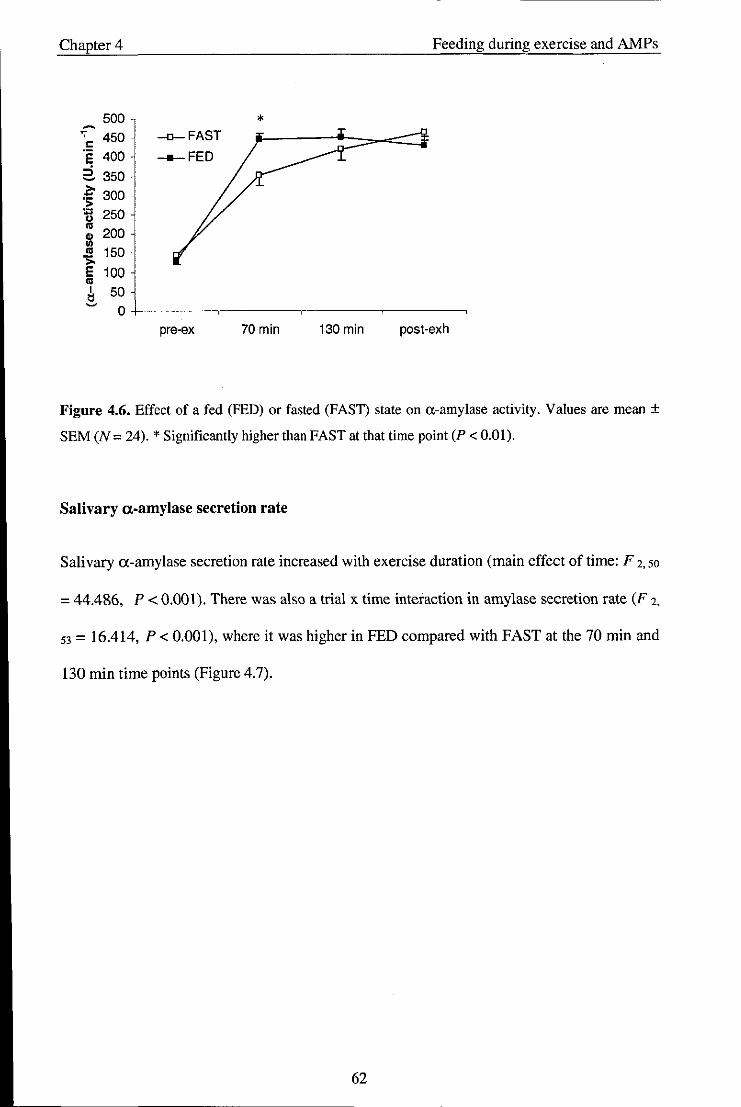
Chapter 4 Feeding during exercise and AMPs
500 * ~
., 450 -<J-FAST " ·s 400 ___ FED
2. 350
~ 300 'il 250
~ 200 III
'" 150 >. e 100 '" I 50 ~
0 pre-ex 70 min 130 min post-exh
Figure 4.6. Effect of a fed (FED) or fasted (FAST) state on a-amylase activity. Values are mean ±
SEM (N = 24). * Significantly higher than FAST at that time point (P < 0.01).
Salivary a-amylase secretion rate
Salivary a-amylase secretion rate increased with exercise duration (main effect of time: F 2, 50
= 44.486, P < 0,001), There was also a trial x time interaction in amylase secretion rate (F 2,
53 = 16.414, P < 0,001), where it was higher in FED compared with FAST at the 70 min and
130 min time points (Figure 4.7).
62

Chapter 4 Feeding during exercise and AMPs
~
';" 300 * * c: -o-FAST ·s
:i 250 ___ FED -J!! 200 '" ..
c: 0 :;:; 150 Cl) .. u Cl)
100 ., Cl) ., '" 50 >. E
'" I 0 1:l - pre-ex 70min 130 min post-exh
Figure 4.7. Effect of a fed (FED) or fasted (FAST) state on a-amylase secretion rate. Values are
mean ± SEM (N = 24). * Significantly higher than FAST at that time point (P < 0.001).
Salivary cortisol
Salivary cortisol increased post-exercise in the FAST trial only (interaction: F 2. 24 = 5.023, P
= 0.013; Figure 4.8).
40
35 -o-FAST * ___ FED
30 ~ -..:. 25 ... c:
::- 20 0 ., t: 15 0 0
10
5
0
pre-ex 70min 130 min post-exh
Figure 4.8. Effect of a fed (FED) or fasted (FAST) state on salivary cortisol. Values are mean ± SEM
(N = 24). * Significantly higher than 70 min and 130 min (P < 0.05).
63

Chapter 4 Feeding during exercise and AMPs
4.4. Discussion
The main findings of the present study were that feeding a high CHO cereal bar during
prolonged exhaustive cycling increased exercise capacity, attenuated the cortisol response but
had no significant effect on s-IgA. In contrast, lysozyme and a-amylase were significantly
higher in FED compared with FAST.
It was previously reported that fasting saliva yields higher levels of s-IgA concentration than
non-fasting saliva at rest (Gleeson et al., 2004a). However, the results in Chapter 4 did not
support this finding since the feeding of a high CHO meal 2 h before exercise had no effect
on the s-IgA response. It was speculated that the timing of the meal might explain in part
these inconsistencies, and hence the present study sought to examine the effect of feeding
during exercise on these responses. Although there was no significant main effect of
treatment in s-IgA (P = 0.091), a definite trend can be seen in that mean s-IgA concentration
was consistently higher in FAST compared with FED across all time points; a pattern similar
to that reported by Gleeson and colleagues (1990). It is likely that the higher s-IgA
concentration in FAST was a result of the concomitant reduction in saliva flow rate, since no
differences in s-IgA secretion rate were observed between treatments. These results suggest
that the timing of the meal may be an important factor when investigating the effect of
nutritional status on s-IgA concentration at rest and during exercise.
The present study found no significant changes in saliva flow rate with exercise. This is in
contrast to the majority of published research, where reductions have often been reported in
response to prolonged exercise (Bishop et al., 2000; Li and G1eeson 2005; Walsh et al. 2002;
Sari-Sarraf et al., 2007b). Although a withdrawal of parasympathetic activity is thought to be
64

Chapter 4 Feeding during exercise and AMPs
responsible for the reduction in saliva flow rate during exercise (Proctor and Carpenter,
2007), it has been argued that it is the hydration status of the individual that has the greatest
impact (Walsh et al., 2004). This group found a significant reduction in saliva flow rate
during exercise when fluid intake was restricted; but when fluid provision was sufficient to
offset fluid losses, no differences were observed. Our results corroborate this, since 200 mL
of water was provided every 20 min which resulted in only small changes in body mass
(-1 %), and suggests that this practice is successful in maintaining the saliva flow rate during
prolonged exercise.
A significant increase in s-IgA secretion rate was observed post-exercise. This is in contrast
to research in trained individuals where decreases (Laing et al., 2005; Walsh et aI., 2002) or
no change (Li and Gleeson, 2004) in s-IgA secretion rate have been previously reported in
response to prolonged cycling. However, since the s-IgA concentration did not show a
decrease in these studies, it is likely that the observed decrease in secretion rate post-exercise
was a result of the decrease in saliva flow rate.
It has been proposed that elevated levels of the stress hormone cortisol can depress certain
aspects of immune function (Nieman, 2007), and it is thought to play a role in inhibiting s
IgA mobilisation and/or production (Hucklebridge et aI., 1998). In the present study, salivary
cortisol was measured as a surrogate marker of the levels in blood (Chicharro et al., 1998). A
significant increase in cortisol was observed post-exhaustion in the FAST trial only,
suggesting that ingestion of the cereal bars was successful in attenuating the cortisol
response. Despite the higher cortisol concentration in the FAST trial, no inhibitory effect on
s-IgA levels occurred. Although there was no inhibition of s-IgA in the short-term, this does
not discount an involvement of cortisol in the longer-term, since previous studies have
65
Chapter 4 Feeding during exercise and AMPs
reported an exercise-induced fall in s-IgA concentration between 2 and 24 h following
particularly long bouts of exercise (Mackinnon et al., 1987; Gleeson et al., 2001).
In contrast to the results for s-IgA, feeding a high CHO cereal bar during exercise resulted in
increases in lysozyme concentration and secretion rate compared with fasting. Lysozyme is a
cationic protein with wide antimicrobial activities (West et al., 2006) and its secretion is
under strong neurohormonal control (Bosch et al., 2002). As noted above, cortisol
concentration was similar between the two treatments during the steady state exercise and
increased significantly in the FAST trial at the post-exhaustion time point only. Since
differences in lysozyme levels· were already apparent during the steady state exercise, an
involvement of cortisol in the acute regulation of this secretory protein seems unlikely.
Moreover, although catecholamines were not measured in this study, the similar heart rate
and RPE responses suggest no obvious differences in sympathetic activity between the two
treatments. One possible explanation for the differences is that the ingestion of the cereal bars
caused activation of mechanical and/or gustatory receptors which would lead to reflex
stimulation of lysozyme protein secretion via the autonomic nerves (Pedersen et aI., 2002).
Furthermore, since higher values in lysozyme remained evident at the post-exhaustion time
point (30 min after the consumption of the final cereal bar), this would suggest that these
effects are relatively long lasting. Further research may seek to address the time course of
these effects as the results may have implications for future studies on salivary antimicrobial
proteins involving food andlor fluid ingestion.
Research investigating lysozyme in response to exercise is limited at present though
lysozyme has been proposed as a potential marker of psychological stress (Perera et al.,
1997) and physical stress (Koutedakis et al., 1996) effects on the innate immune system. The
present findings show a progressive increase in both the lysozyme concentration and
66
Chapter 4 Feeding during exercise and AMPs
secretion rate with exercise duration. As discussed previously, it is unlikely that these effects
are mediated by changes in the stress hormone cortisol. It is more likely that they are initiated
by increases in SNS activity occurring at the onset of exercise, since it is known that the
exocytosis of secretory proteins occurs rapidly (within 15 s) upon neuronal stimulation and
with P.adrenergic stimulation in particular (Carpenter et al., 1998). These results are in
contrast to those reported by Koutedakis et al. (1996) in elite swimmers and provide the first
clear evidence of enhanced lysozyme levels in response to a bout of prolonged exhaustive
exercise.
Significant increases in a-amylase were also observed with exercise. Moreover, higher levels
were observed in FED compared with FAST during the steady state exercise, although this
difference disappeared following the time to exhaustion trial. Since the role of a-amylase is
to break down starch (Scannapieco et al., 1994); it is not surprising that higher. levels were
found in FED compared with FAST during steady state exercise, as this was when the cereal
bars were consumed. Although these results show a positive, stimulatory effect of feeding on
a-amylase activity, it also highlights a possible limitation for those attempting to use this
measure as a marker of SNS activity when other stimulatory factors are present, since
previous studies have suggested that a-amylase activity can be a predictor of plasma
noradrenaline under a variety of stressful conditions including exercise (Chatterton et al.,
1996). This becomes even more apparent since one would expect blood catecholamines (and
resulting surrogate markers of SNS activity) to be blunted with feeding. In this instance, the
timing of the meal must be taken into consideration to prevent any additional stimulatory
effect on a-amylase.
The present study administered an artificially sweetened placebo drink to examine the
additional effect of a high CHO cereal bar - intended for nutritional support of athletes - on
67
Chapter 4 Feeding during exercise and AMPs
exercise capacity. Not surprisingly, the exercise duration was significantly longer in the high
CHO (FED) trial compared with the placebo (FAST) trial. A limitation in doing this was that
the participants consumed -500 mL more fluids in the FAST trial, which may potentially
confound the results, given the potential impact of additional fluids on saliva quantity and
quality. Although body mass losses in the FED trial were significantly greater than in the
FAST trial (1.08 vs 0.53 kg, respectively), suggesting slight differences in hydration status,
this did not appear to have a significant negative effect on any of the salivary variables
measured.
The fact that feeding enhanced lysozyme and a-amylase secretion but had no effect on s-IgA
may be related to the way these proteins are stored and secreted into saliva. Both lysozyme
and a-amylase are stored in secretory granules, which are released spontaneously upon
autonomic stimulation. Unlike these proteins, s-IgA is secreted onto mucosal surfaces across
epithelial cells via pIgR, which is activated by neuronal stimuli that may differ to other
salivary proteins (Proctor and Carpenter 2001). Feeding during exercise appears to activate a
reflex stimulation to enhance the secretion of the stored salivary proteins into saliva but has
little effect on the transport and subsequent secretion of s-IgA.
In summary, the present findings suggest that prolonged exhaustive cycling can increase the
secretion of salivary antimicrobial proteins. In addition, these results show that the feeding of
a high CHO cereal bar during exercise can result in further increases in lysozyme and a
amylase, but has no effect on s-IgA.
68
Chapter 5 Stimulated saliva flow, exercise and AMPs
Chapter 5 - Study 3: Effect of stimulating saliva flow on the changes in
salivary secretion of IgA, lysozyme and a-amylase with prolonged
exhaustive exercise
Abstract
A higher rate of upper respiratory tract infection experienced by some athletes may be due to
an exercise-induced decrease in mucosal immune defences. Stimulating saliva flow during
exercise may potentially increase oral immune protection. Therefore, the aim of the present
study was to investigate the salivary secretion rates of immunoglobulin A (s-IgA), lysozyme
and a-amylase in response to strenuous exercise in both stimulated and unstimulated saliva
flow conditions. Twenty four fit, healthy, men (mean ± SEM age: 23 ± 1 yr; maximal oxygen
uptake, VU'max: 56.6 ± 1.0 ml.kg·1.min·1) cycled for 2.5 h at 60% VO'max (with regular water
ingestion) and then cycled to exhaustion at 75% VO'max. Timed collections of whole saliva
were made immediately before exercise, mid-exercise, after completion of the 2.5 hour
moderate exercise bout and immediately after the exhaustive exercise bout. After each
unstimulated saliva collection a stimulated saliva flow sample was collected following
chewing mint-flavoured gum for one minute. Saliva was analysed for s-IgA, lysozyme and a
amylase and secretion rates were calculated. Saliva flow rate was -3 times higher when saliva
flow was stimulated. Saliva flow rate decreased with exercise for stimulated saliva flow only
(P<O.OI). Exercise was associated with increases in lysozyme and a-amylase concentration
and secretion rates in saliva (P < 0.01). Stimulating saliva flow caused a higher secretion rate
of lysozyme (> 2-fold higher) and a-amylase (> 3-fold higher) compared with unstimulated
saliva flow (both P < 0.01). S-IgA concentration and secretion rate increased with exercise
but were both lower in stimulated saliva compared with unstimulated (P < 0.05). Following
the exhaustive exercise bout, s-IgA secretion rates were 129 ± 92 and 165 ± 97 !-Ig.min-1 in
69

Chapter 5 Stimulated saliva flow, exercise and AMPs
the stimulated and unstimulated saliva flow conditions, respectively (P < 0.05). Stimulating
saliva flow during exercise had positive effects on the quantity of saliva and on the
antimicrobial proteins lysozyme and a-amylase, but resulted in a slightly lower secretion rate
for s-IgA. Increases in lysozyme, a-amylase, and the saliva flow rate suggest that stimulating
saliva flow during exercise by chewing gum may acutely provide increased oral immune
protection.
5.1. Introduction
The study of the mucosal immune response to exercise frequently involves the collection and
analysis of saliva samples. The most common method is by collecting an unstimulated
sample usually by dribbling into a sterile plastic tube; however, some studies have chosen to
stimulate saliva production by either by chewing gum (Horswill et al., 2006; Kreiger et ai.,
2004; Nevzesh et ai, 1982; Proctor and Carpenter., 2001) or sucking on flavoured mints
(Gleeson et ai., 2003b). There is some evidence to show that these methods may result in
differing salivary flow rates and composition. For example, stimulating saliva secretion by
chewing can increase the flow rate by up to 3-fold compared with unstimulated saliva
secretion (Hector and Linden, 1999), and this can also alter the secretion of certain salivary
proteins (Proctor and Carpenter, 2001). It is therefore necessary to understand such
differences between the two methods of collection and to be aware of these when collecting
or interpreting results.
There have been few studies investigating the effect of stimulated versus unstimulated saliva
flow on the oral immune system. Proctor and Carpenter (2001) showed that stimulated saliva
secretion by chewing on a tasteless piece of polythene tube increased s-IgA secreted from the
parotid saliva gland compared with unstimulated saliva secretion, most likely via increased
70

Chapter 5 Stimulated saliva flow, exercise and AMPs
epithelial cell transcytosis. Similar results were found for total protein and a-amylase
secretion. These findings may have important implications for the s-IgA response to exercise,
as stimulating saliva flow could increase s-IgA levels and reduce the risk of URTI. Indeed,
Gleeson et at. (2003b) examined the effects of stimulated and unstimulated salivary flow on
the s-IgA response to high intensity exercise. It was found that sucking a flavoured mint for 1
min during exercise increased the s-IgA secretion rate.
Since exercise may be associated with a reduction in saliva flow rate and/or the secretion of
certain antimicrobial proteins, stimulating saliva flow by chewing may function to counteract
these changes by increasing the oral immune protection and reduce the risk of developing
URTI. Thus, the aims of the present study were to investigate the influence of stimulated
saliva flow on salivary antimicrobial proteins by chewing flavoured gum during prolonged
exhaustive cycling.
5.2. Methods
5.2.1. Participants
The participants and preliminary measurements were as described previously in Chapter 4. At
least 1 week following the preliminary measurements, participants visited the laboratory on
one occasion for the main trial.
5.2.2. Experimental procedures
Participants arrived at the laboratory at 8:30 h following an overnight fast (10 - 12 h). They
were required to sit quietly for 5 min before giving a saliva sample. The participants were
then asked to empty their bladders before body mass was measured wearing their shorts only.
71
Chapter 5 Stimulated saliva flow, exercise and AMPs
They then performed 2.5 h cycling at 60% V02ma, on a stationary cycle ergometer. Heart rate
and RPE were measured at 20 min intervals and expired gas was collected at 30 min, 90 min
and 114 min of exercise using a Douglas bag. Participants were given 200 mL of water every
20 min during exercise; in addition they ingested 300 ml of flavoured water immediately
before the exercise began, and again after 50 min and 110 min of exercise. Saliva samples
were collected at rest, following 70 min and 130 min of exercise and immediately post
exhaustion. It was ensured that no fluid was consumed in the 10 min prior to each saliva
collection.
Following completion of the 2.5 hours cycling, the participants were allowed a 5 min rest
before commencing the ride to exhaustion trial at 75% V02""" with no verbal encouragement
and no information on time elapsed. The time to exhaustion was 897 ± 122 s. A final saliva
sample was obtained immediately after completing the exercise to exhaustion and body mass
was measured. Mean temperature and humidity in the lab during the trial were 23 ± 0.5 DC
and 32 ± 4 % respectively.
5.2.3. Saliva collection
The saliva collection was based on the method described in Chapter 3. An unstimulated
(UNSTlM) sample was collected first which was immediately followed by 1 min of chewing
sugar-free mint flavoured gum (Wrigley Orbit) at an even pace and force. Immediately after
removing the gum the participants provided a second saliva sample (STIM) by dribbling into
the tube for a further 1 min.
72
Chapter 5 Stimulated saliva flow, exercise and AMPs
5.2.4. Saliva analysis
Salivary JgA, lysozyme, a-amylase activity and cortisol were measured as detailed in
Chapter 2.
5.2.5. Statistical analysis
A two-way ANOVA (2 conditions x 4 sample times) with repeated measures design was used
to examine the salivary data. Significant differences were assessed using Student's paired t
test with Holm-Bonferroni adjustments for multiple comparisons. Differences in HR between
the steady state exercise and time to exhaustion trial were assessed using Student's paired t
tests. Statistical significance was accepted at P < 0.05.
5.3. Results
5.3.1. Physiological variables and RPE
Attainment of an average of 60% VO'max was achieved during the steady state exercise;
where mean VOz was 60.1 ± 2.8% of V02"""'. Mean HR was 137 ± 11 beats.min- l and 174 ±
9 beats.min- l during the steady state exercise and the time to exhaustion trial, respectively.
Mean RPE measured during the steady state exercise was 12 ± 2 and the post-exercise body
mass loss was 0.53 ± 0.10 kg.
5.3.2. Salivary variables
Saliva flow rate
Saliva flow rate was significantly higher in STIM compared with UNSTIM across all time
points (main effect of condition: Ft. 23 = 177.1, P < 0.001). Saliva flow rate decreased
73

--- --------------------------------------------------
Chapter 5 Stimulated saliva flow, exercise and AMPs
significantly with exercise duration in the STIM trial only (interaction: F3, 56 = 10.37, P <
0.001; Figure 5.1).
1.8 -o-UNSTIM ___ STIM
1.6 ~ ., c: 1.4 * * ·s
1.2 ..i E ~ 1 .. iii ; 0.8 0
:;::: 0.6 tU .:: 0.4 m UI
0.2
0
pre·ex 70min 130 min post-exh
Figure 5.1. The effect of exercise on stimulated and unstimulated saliva flow rate. Values are means
± SEM (N = 24). * Significantly lower than pre-exercise (P < 0.01).
Salivary IgA concentration
Salivary IgA concentration increased with exercise duration (main effect of time: F 3. 50 =
4.448; P < 0.05) and was significantly higher in UNSTIM compared with STIM across all
time points (main effect of condition: F 1.23 = 44.841; P < 0.001; Figure 5.2).
74

- -~. -- -------------------------------
Chapter 5 Stimulated saliva flow, exercise and AMPs
500 -O-UNSTlM ~ 450 __ STlM
~ 400 '" .s 350 c
300 0
'" .. 250 ~
~ c 1l 200 c 0 150 u
~ 100 !I: ..,. !: !:~ ., 50
0 pre-ex 70min 130 min post-exh
Figure 5.2. Effect of exercise on stimulated and unstimulated s-IgA concentration. Values are means
± SEM (N = 24).
Salivary 19A secretion rate
Salivary IgA secretion rate increased post-exercise compared with baseline levels (main
effect of time: F 3.46 = 9.810; P < 0.001) and was significantly higher in UNSTIM compared
with STIM (main effect of condition: F 1,23 = 5.154; P < 0.05; Figure 5.3)
200
.c 180 -O-UNSTlM c 's 160
__ SllM
* 140 -~ ~ 120
!-=====! ~
100 c 0
~ 80 u 60 ., ., <I; 40
'" ..,. 20 ., 0
pre-ex 70min 130 min post-exh
Figure 5.3. Effect of exercise on stimulated and unstimulated s-IgA secretion rate. Values are means
± SEM (N = 24).
75
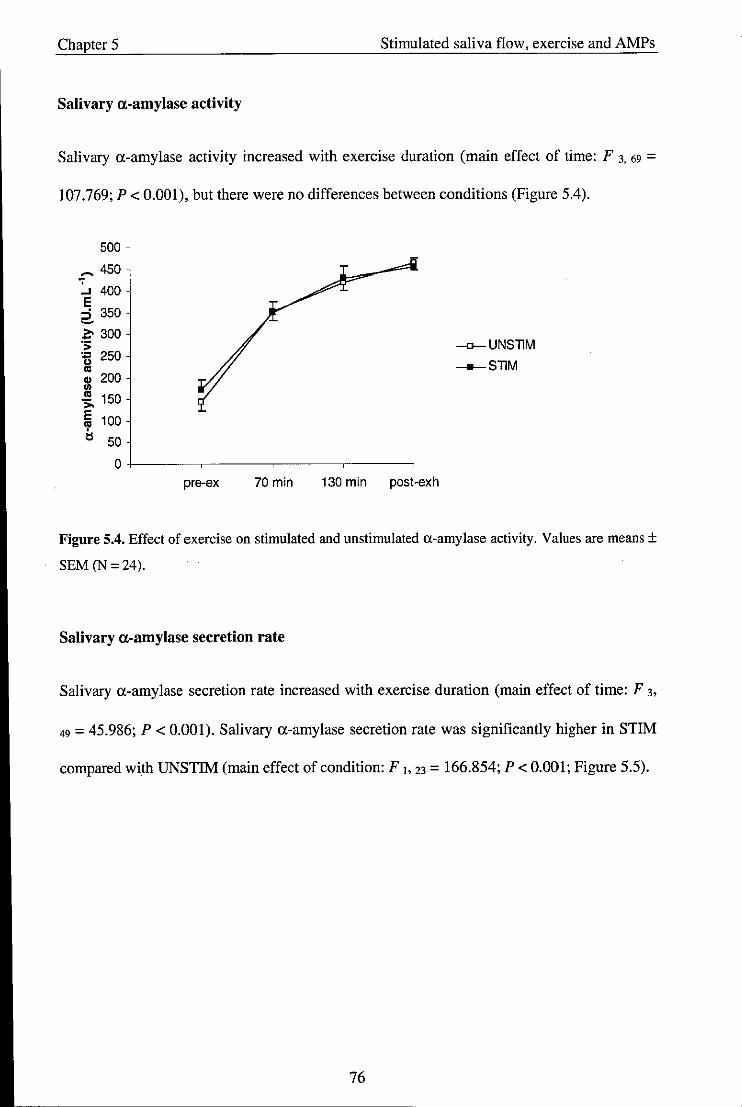
Chapter 5 Stimulated saliva flow, exercise and AMPs
Salivary a-amylase activity
Salivary a-amylase activity increased with exercise duration (main effect of time: F 3. 69 =
107.769; P < 0.001), but there were no differences between conditions (Figure 5.4).
500
~ 450
:... 400 E ::i 350 ~
1:' 300 .;; g 250
4> 200 I/)
.!!! 150 ,., E 100 cp tl 50
o+-----~----~------,_----~
pre-ex 70 min 130 min post-exh
-o-UNSllM __ SllM
Figure 5.4. Effect of exercise on stimulated and unstimulated a-amylase activity. Values are means ±
SEM(N=24).
Salivary a-amylase secretion rate
Salivary a-amylase secretion rate increased with exercise duration (main effect of time: F 3,
49 = 45.986; P < 0.001). Salivary a-amylase secretion rate was significantly higher in STIM
compared with UNSTIM (main effect of condition: F], 23 = 166.854; P < 0.001; Figure 5.5).
76
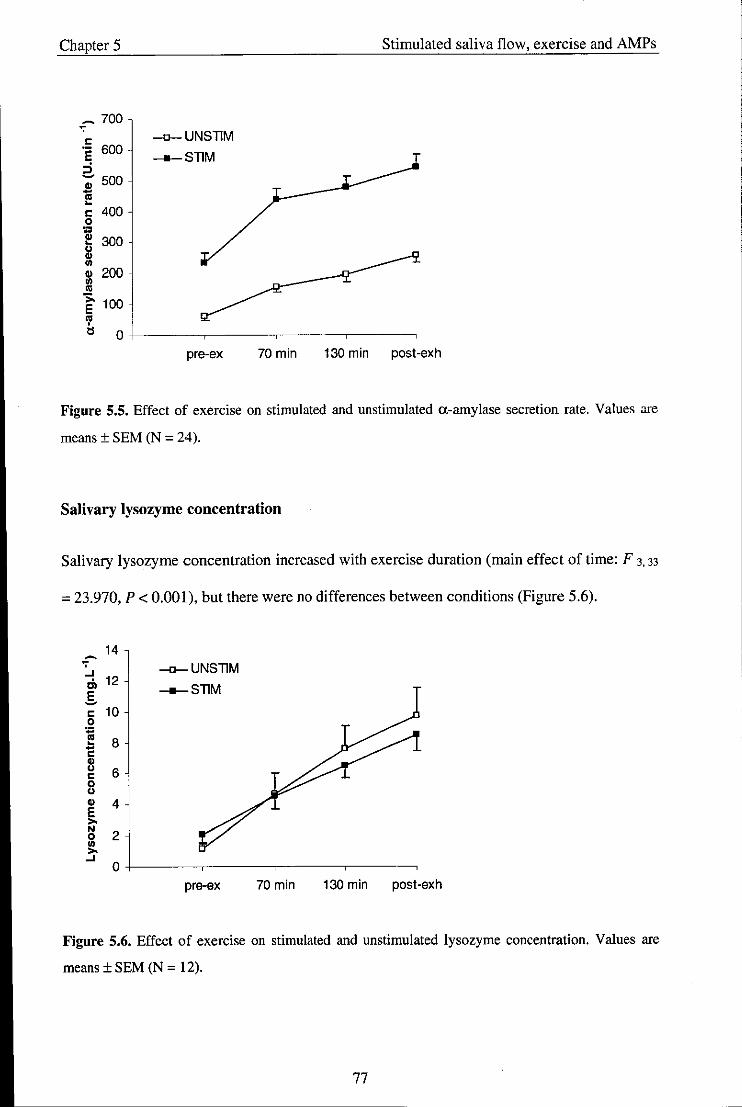
Chapter 5 Stimulated saliva flow, exercise and AMPs
~ 700
c -n-UNSTIM .- 600 E __ STIM :i -; 500 -., ~
c 400 0
~ 300 " Cl> In Cl> 200 In ., >. 100 E 'l' tl 0
pre-ex 70min 130 min post-exh
Figure 5.5. Effect of exercise on stimulated and unstimulated a-amylase secretion rate. Values are
means ± SEM (N = 24).
Salivary lysozyme concentration
Salivary lysozyme concentration increased with exercise duration (main effect of time: F 3. 33
= 23.970, P < 0.001), but there were no differences between conditions (Figure 5.6).
14 ~ .,
-o-UNSllM ..J .;, 12 __ STIM E ~
c 10 0
:;::: I!! 8 -c Cl>
" 6 c 0
" Cl> 4 E '" N
2 0 In
'" ..J 0
pre-ex 70 min 130 min post-exh
Figure 5.6. Effect of exercise on stimulated and unstimulated lysozyme concentration. Values are
means ± SEM (N = 12).
77
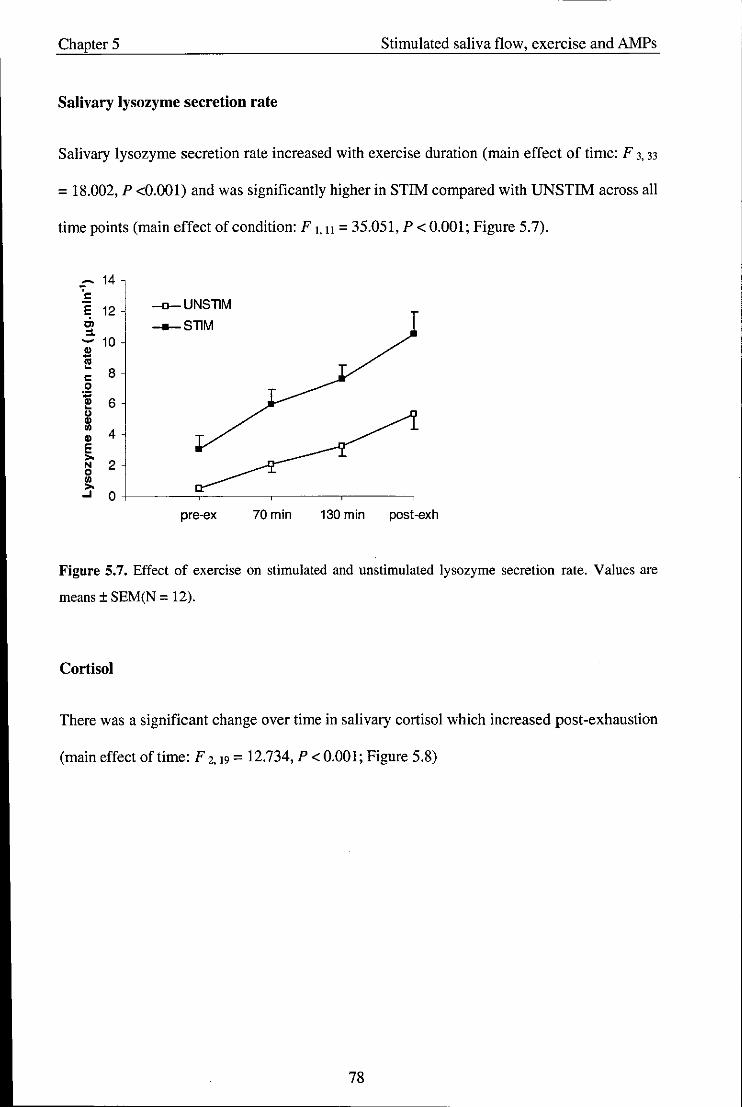
Chapter 5 Stimulated saliva flow, exercise and AMPs
Salivary lysozyme secretion rate
Salivary lysozyme secretion rate increased with exercise duration (main effect of time: F 3, 33
= 18.002, P <0.001) and was significantly higher in STIM compared with UNSTIM across all
time points (main effect of condition: F 1.11 = 35.051, P < 0.001; Figure 5.7).
~ 14 c E 12 -o-UNSTlM Cl __ STlM ~ - 10
~ 8 c
0 ., " 6 ~
u " ..
4 " E >-
2 N 0 .. >-..J 0
pre-ex 70min 130 min post-exh
Figure 5.7. Effect of exercise on stimulated and un stimulated lysozyme secretion rate. Values are
means ± SEM(N = 12).
Cortisol
There was a significant change over time in salivary cortisol which increased post-exhaustion
(main effect oftime: F 2.19 = 12.734, P < 0.001; Figure 5.8)
78
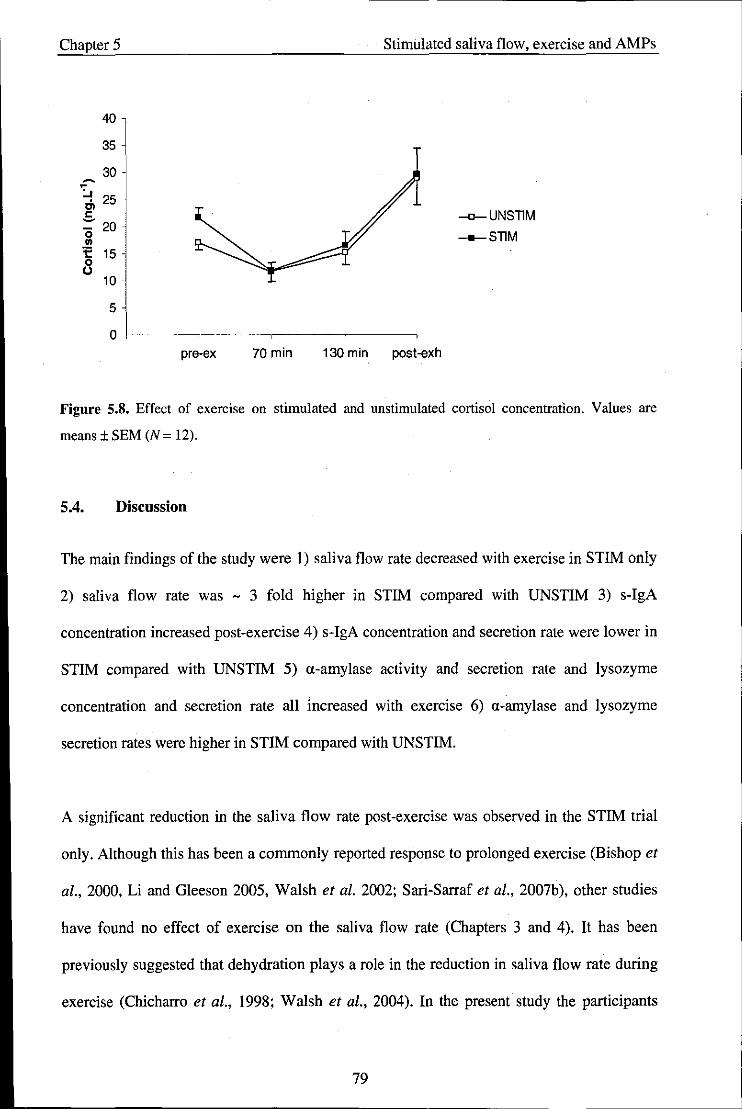
Chapter 5
40
35
30 ~
~
~ 25 Cl ..s "0 20 .. 1: 0
15 ()
10
5
0 pre-ex 70min
Stimulated saliva flow, exercise and AMPs
130 min post-exh
-o-UNsnM __ SnM
Figure 5_8_ Effect of exercise on stimulated and unstimulated cortisol concentration. Values are
means ± SEM (N = 12).
5_4_ Discussion
The main findings of the study were I) saliva flow rate decreased with exercise in STIM only
2) saliva flow rate was - 3 fold higher in STIM compared with UNSTIM 3) s-IgA
concentration increased post-exercise 4) s-IgA concentration and secretion rate were lower in
STIM compared with UNSTIM 5) a-amylase activity and secretion rate and lysozyme
concentration and secretion rate all increased with exercise 6) a-amylase and lysozyme
secretion rates were higher in STIM compared with UNSTIM.
A significant reduction in the saliva flow rate post-exercise was observed in the STIM trial
only. Although this has been a commonly reported response to prolonged exercise (Bishop et
al., 2000, Li and G1eeson 2005, Walsh et al. 2002; Sari-Sarraf et al., 2007b), other studies
have found no effect of exercise on the saliva flow rate (Chapters 3 and 4). It has been
previously suggested that dehydration plays a role in the reduction in saliva flow rate during
exercise (Chicharro et al., 1998; Walsh et aI., 2004). In the present study the participants
79
Chapter 5 Stimulated saliva flow, exercise and AMPs
were provided with 200 mL of fluid to consume every 20 min which resulted in a small net
mean body loss of 0.53 ± 0.11 kg. This suggests that the participants were only marginally
hypohydrated and is unlikely to have influenced the saliva flow rate (Walsh et al., 2004). It is
possible that the decreased parasympathetic nervous system activity during exercise, causing
a removal of vasodilatory influences (Procter and Carpenter, 2007), may limit the increase in
flow rate with chewing. A further explanation is that the exhaustive nature of the exercise
affected the force with which the participants chewed the gum. Although participants were
instructed to chew at a regular rate and force for each saliva collection, it cannot be
overlooked that the fatiguing nature of the exercise may have affected this. Since salivary
production is directly related to the applied chewing force (Hector and Linden, 1999), a
reduction in the amount of saliva produced could occur. This is an obvious limitation with a
stimulated saliva flow collection.
Salivary IgA concentration increased with exercise in both trials which is consistent with
previous studies (Chapters 4 and 5). Furthermore, significantly lower values in STIM
compared with UNSTIM were observed throughout the exercise protocol. This is in
accordance with Proctor and Carpenter (2001), who reported a lower s-IgA concentration in
whole-mouth saliva following chewing. These changes are likely to be a result of the
increased saliva flow rate with chewing which acts to dilute the saliva.
A significant increase in the s-IgA secretion rate was observed with exercise. This is in
agreement with Blannin et al. (1998) who also reported increases following both short
duration and long duration exercise to exhaustion. S-IgA secretion rate showed little change
during the steady state exercise at 60% \l02nuu. However, following the ride to exhaustion at
75% \l02nuu the s-IgA secretion rate increased by 50% in the UNSTIM trial and 26% in the
STIM trial. This suggests that the effect of exercise on s-IgA secretion rate may be intensity
80
------------------------------------ -
Chapter 5 Stimulated saliva flow, exercise and AMPs
dependent. Indeed, Blannin et al. (1998) found a greater increase in s-IgA secretion rate
following a higher intensity cycle to exhaustion (80% versus 55% Y02mox). However, other
researchers have found no effect of intensity on s-IgA measures (McDowell et al., 1991).
The transient increase in s-IgA secretion rate post-exercise is likely to be related to the
increased SNS activity with exercise resulting in an increased secretion of s-IgA into saliva
via trancytosis (Carpenter et al., 2000). An involvement of SNS activity with exercise can be
identified by the increase in a-amylase activity since this has been proposed as a potential
marker of SNS activity during stressful conditions (Chatterton et al., 1996). These findings
suggest that increases in s-IgA secretion during exercise occur only in response to high levels
of sympathetic nerve stimulation, a finding that has been previously confirmed in the rat
model (Carpenter et a!., 2000).
The present results show that s-IgA secretion rate was significantly lower in STIM compared
with UNSTIM. These findings do not support Proctor and Carpenter (2001) who found that
stimulating saliva flow by chewing increased the secretion rate of s-IgA from the parotid
gland into saliva at rest. The differences in methods may account for these discrepancies.
Proctor and colleagues stimulated saliva by chewing on a piece of polythene tube whereas the
present study administered a commercially available flavoured chewing gum. The resulting
differences between masticatory stimulation only, from chewing the polythene tube, and
gustatory and masticatory stimulation combined when chewing the flavoured gum, may
account for these inconsistencies. However, Gleeson et al. (2003b) also reported an elevated
s-IgA secretion rate during exercise when sucking on a mint (gustatory stimulation only) for
1 min prior to saliva collection.
In addition to the different types of stimulation, it is possible that the secretion rate of s-IgA
in STIM during exercise may have been affected by the reduction in saliva flow rate which
81
Chapter 5 Stimulated saliva flow, exercise and AMPs
occurred in this trial. Such potential vanances highlight a further limitation of using a
stimulated saliva collection in comparison to unstimulated saliva collection (Navazesh and
Christensen, 1982). Thus, further research is required to determine the effects of the different
methods of stimulating saliva on s-IgA secretion rate at rest and during exercise to clarify
these inconsistencies. Although stimulating saliva flow appeared to have a detrimental effect
on the rate of s-IgA secretion during exercise, the differences compared with the unstimulated
condition were small and the impact of this in terms of URTI risk may have little
consequence.
Lysozyme concentration and secretion rate were increased with exercise duration. These
findings are in accordance with those in Chapter 4 and suggest a temporary enhancement in
this aspect of mucosal immunity with exercise. Stimulating saliva flow did not affect
lysozyme concentration. This is in agreement with Rudney (1989) who reported that salivary
lysozyme is unaffected by the flow rate. However, when lysozyme was expressed as a
secretion rate, significantly higher values in STIM compared with UNSTIM were observed.
Alpha-amylase activity and secretion rate were higher during STIM compared with UNSTIM
and this confirms findings by Proctor and Carpenter (2001) who also found an increased
secretion of a-amylase following chewing. Exercise also resulted in increases in this enzyme.
This is a common finding amongst studies (Chatterton et a!., 1996, Walsh et al., 1999,
Bishop et a!., 2000), and can be attributed to the increase in SNS activity with exercise
(Chatterton et al., 1996). Both lysozyme and a-amylase have antimicrobial effects (Tenovuo,
1998); thus, the finding of an increase in their secretion rate with exercise which is further
enhanced by stimulating saliva flow suggests these factors have a beneficial effect on the oral
immune system
82
Chapter 5 Stimulated saliva flow, exercise and AMPs
It was speculated in Chapter 4 that the differences between the secretion of these proteins
with feeding compared with fasting may be related to the way these proteins are stored and
secreted into saliva. Lysozyme and a-amylase are stored in secretory granules which are
released spontaneously upon autonomic stimulation (Bosch et al., 2002). However, s-IgA is
secreted onto mucosal surfaces across epithelial cells via the polymeric immunoglobulin
receptor (pIgR), (Proctor and Carpenter 2001). These findings show that the combination of
masticatory and gustatory stimuli through chewing flavoured gum activate the secretion of
stored salivary proteins into saliva (lysozyme and a-amylase) but do not enhance the receptor
mediated secretion of s-IgA.
A further explanation for the findings may be related to the relative contributions of the
different salivary glands during unstimulated and stimulated saliva flow, since specific
salivary glands have been shown to be activated by some stimuli more than others (Noble,
2000). For example, mastication predominantly activates the parotid glands, which produce
large amounts of a-amlyase. In contrast, strong taste stimuli activate the submandibular and
sublingual glands (from which lysozyme is mainly produced) more than the parotid gland.
Thus, the increase in a-amylase and lysozyme by chewing flavoured gum may be explained
by the increase of salivary secretion from these specific glands. The relative contribution of
salivary glands for s-IgA secretion is not clear. Crawford et al. (1975) reported s-IgA
concentration to be four times higher in the minor salivary glands than parotid glands
although other data suggest a low parotid s-IgA secretion rate is associated with high
susceptibility to dental caries, suggesting a greater role of the parotid gland in s-IgA secretion
(Brandtzeag, 1976). These uncertainties make it difficult to relate the changes in s-IgA
secretion in stimulated and un stimulated saliva flow to the stimulation of specific glands.
83
Chapter 5 Stimulated saliva flow, exercise and AMPs
In conclusion, these results suggest that prolonged exhaustive exercise at 60% and 75%
V02max in trained men can result in increases in salivary antimicrobial proteins, which may
be beneficial to oral immune status. Moreover, stimulating saliva flow during exercise has a
further enhancing effect on a-amylase and lysozyme secretion but has little effect on s-IgA
secretion rate. Although these findings highlight a possible benefit of chewing gum while
performing strenuous exercise, the potential risk of choking while doing this should be
considered.
84
Chapter 6 Exercise intensity and AMPs
Chapter 6 - Study 4: Effect of exercise intensity on salivary antimicrobial
proteins and markers of stress in active men
Abstract
The present study investigated the effects of exercise intensity on salivary immunoglobulin A
(s-IgA) and salivary lysozyme and examined how these responses were associated with
salivary markers of adrenal activation. Using a randomised design, 10 healthy active men
participated in 3 experimental cycling trials: 50% Y02,""" 75% Y02_ and an incremental
test to exhaustion (EXH). The durations of the trials were the same as a preliminary
incremental test to exhaustion (22.3 ± 0.8 min; mean ± SEM). Timed, unstimulated saliva
samples were collected at pre-exercise, post-exercise and 1 h post-exercise. The EXH trial
significantly increased the secretion rates of both s-IgA and lysozyme. Increases in lysozyme
secretion rate also occurred at 75% Y02m" . No significant changes in saliva flow rate were
observed in any trial. Cycling at 75% Y02_ and EXH significantly increased the secretion
of a-amylase and Chromogranin A immediately post-exercise but higher values of cortisol at
75% Y02""" and EXH compared to 50% Y02_ were observed at 1 h post-exercise only.
These findings suggest that short duration, high intensity exercise increases the secretion rate
of s-IgA and lysozyme despite no change in the saliva flow rate. These effects appear to be
associated with changes in sympathetic activity and not the hypothalamic-pituitary-adrenal
axis.
6.1. Introduction
To date, several studies have investigated the effects of exercise on s-IgA with many
reporting reductions following intense exercise (Tomasi et aI., 1982; Steerenberg et aI., 1997;
Fahlman et al., 2001), and increases following more moderate or lower intensity exercise
85

Chapter 6 Exercise intensity and AMPs
(Dorrington et al., 2003; Reid et ai, 2001). However, results from the previous chapters in
this thesis do not support these findings. In chapters 4 and 5 significant increases in s-IgA
levels were observed post -exercise and these effects appeared to be greater following the
higher intensity exercise bout (75% YOzm,,) compared with the lower intensity exercise bout
(60% YOz=). Furthermore, preliminary findings suggest that lysozyme is also increased
with high intensity exercise (Chapters 5 and 6). Thus, it appears that the relationship between
exercise intensity and mucosal immunity remains controversial.
The responses of saliva flow rate and composition during exercise are influenced by
sympathetic nervous system activity and the hypothalamic-pituitary-adrenal (HP A) axis.
Generally it is considered that sympathetic stimulation (via noradrenaline) leads to higher
salivary protein concentrations (e.g. a-amylase), whereas increased rates of fluid output
occur in response to parasympathetic stimulation (Chicharro et al., 1998). In rodents, the
secretion of s-IgA can be increased by both parasympathetic and sympathetic stimulation
(Carpenter et aI., 2000) and adrenaline has been recently shown to increase the entry of
human IgA into saliva by rat salivary cells via increased mobilisation of the polymeric Ig
receptor (Carpenter et al., 2004). Since the levels of catecholamines appear to increase in
direct relation to exercise intensity (McMurray et al., 1987), it may be speculated that this
would have an impact on the salivary responses to exercise.
Alpha-amylase has been previously identified as a marker of SNS activity during exercise
(Chatterton et aI., 1996), and its secretion appears to be dependent on the exercise intensity
(Bishop et al., 2000; Ljunberg et aI., 1997; Walsh et aI., 1999). However, the response of (J.
amylase to exercise has been questioned since it can also be affected by parasympathetic
activity (Bosch et aI., 2002), and as demonstrated in Chapters 4 and 5, by prior food ingestion
and/or mastication during exercise. Another potential marker of SNS activity is salivary
86
Chapter 6 Exercise intensity and AMPs
Chromogranin A (CgA). It is co-stored and co-released with catecholamines from the adrenal
medulla and neuronal vesicles during exocytosis (Banks and Helle, 1965). Salivary CgA has
been shown to increase rapidly under psychological stress (Nakane et al., 1998); however, its
response to exercise has yet to be determined. Since catecholamines measured in saliva are
regarded as a poor index of sympathetic nervous activity (Kennedy et aI., 2001), a-amylase
and CgA may serve as potential non-invasive tools for evaluating the relationship between
the sympathetic nervous system and mucosal immunity following exercise at different
intensities.
Exercise also stimulates the release of cortisol from the adrenal cortex and salivary cortisol is
considered a reliable index of HPA activity (Chicharro et aI., 1998). Cortisol has been
suggested to play an important role in inhibiting s-IgA mobilisation andlor production
(Hucklebridge et aI., 1998). Moreover, it has been implicated in inhibiting lysozyme
production and secretion (Perera et al., 1997). Circulating cortisol is also dependent on the
exercise intensity, where elevations occur following intensities above approximately 60%
V02""" (Vim, 1996).
The effect of exercise on the mucosal immune system appears to be influenced by the release
of stress hormones such as catecholamines and cortisol, yet how these hormones relate to
changes in mucosal immunity following exercise at different intensities remains unclear.
Therefore, the primary aim of the present study was to investigate the s-IgA and lysozyme
responses to constant duration exercise at 3 different intensities: 50% V02mox, 75%
V02= and an incremental exercise test to exhaustion. A secondary aim was to assess the
response of non-invasive salivary markers of adrenal activation during exercise at different
intensities and to examine how these relate to the responses of salivary antimicrobial proteins.
87

Chapter 6 Exercise intensity and AMPs
6.2. Methods
6.2.1. Participants
Ten healthy males (mean ± SEM: age 23 ± 1 yr; height: 183 ± 2 cm; body mass 76.2 ± 2.2
kg; Y02m" 51.4 ± 1.9 mL.kg·l.min- l; HRmax 190 ± 2 beats.min- I
) volunteered to participate in
the study. Following preliminary measurements, the participants completed 3 main trials in a
randomised order separated by at least 3 days.
6.2.2. Experimental procedures
Participants reported to the laboratory at 11 :45 h. They were requested to abstain from
drinking alcohol and taking medication in the 24 h preceding each experimental session.
They were instructed to consume their normal breakfast including 500 mL of water at 9:00 h
prior to each of the trials, and then repeat this breakfast for each of the subsequent trials.
They were then asked to consume a further 500 mL of water 90 min before exercise in order
to standardise hydration status. Upon arrival at the laboratory, participants were instructed to
empty their bladder before body mass was measured. They then sat quietly for 5 min before
an initial pre-exercise saliva sample was collected. The collection time for each participant
was designed to ensure that a minimum volume of 1.5 mL was obtained. They were then
randomly assigned to one of 3 exercise trials: Trial 1 was performed at a work rate equivalent
to 50% YO,_, Trial 2 was performed at a work rate equivalent to 75% YO,"",x and Trial 3
was a repetition of the incremental test to exhaustion (EXH). Each trial was for the same
duration as the initial preliminary YO,_ test. The mean duration (± SEM) for the trials was
22.3 ± 0.8 min. The participants began cycling at 12:00 h. Heart rate and RPE were recorded
every 3 min during exercise and during the final minute before cessation of exercise. A saliva
sample was collected immediately post-exercise and a final sample was obtained at 1 h post-
88
Chapter 6 Exercise intensity and AMPs
exercise. A fingertip capillary blood sample was also obtained post-exercise to determine
blood lactate concentration using an Analox PGM7 analyser (Analox, Stokesley, North
Yorkshire, UK) and body mass was measured immediately after the post-exercise saliva
sample had been collected. Water consumption was not permitted during exercise; however,
participants were given 200 mL of water to consume immediately after the post-exercise
saliva sample. No other fluid or food was permitted until after the final 1 h post-exercise
saliva sample had been collected. The laboratory temperature and relative humidity were 23.4
± 0.5 °C and 41 ± 2 %, respectively.
6.2.3. Saliva collection
Methods of saliva collection and analysis are detailed in Chapter 2.
6.2.4. Statistical analysis
Salivary data, HR and RPE were analysed using a 3 (trials) x 3 (times of measurement)
repeated measures ANOV A. Body mass losses and blood lactate concentration were
examined using a one-factor repeated measure ANOV A. Significant differences were
assessed using Student's paired Hest with Holm-Bonferroni adjustments for mUltiple
comparisons. Statistical significance was accepted at P < 0.05.
6.3. Results
6.3.1. Physiological variables and RPE
Results for HR, RPE, body mass losses and blood lactate are presented in Table 6.1. Mean
HR was significantly higher in the 75% V02mru< and EXH trials compared with the 50%
V02max trial (main effect of trial; F 1. 12 = 77.4, P < 0.001). Only during the final stage of
89

Chapter 6 Exercise intensity and AMPs
exercise was HR significantly higher in the EXH trial compared with the 75% Y02m" trial (P
< 0.05). Similarly, mean RPE was significantly higher with the 75% Y02ma, and EXH trials
compared with the 50% Y02ma> trial (main effect of trial; F 2. 14 = 48.3, P < 0.001). Only
during the final stage of exercise was RPE significantly higher in the EXH trial compared
with the 75% Y02ma> trial (P < 0.05). Body mass losses were similar between trials. Post-
exercise blood lactate concentration increased significantly with exercise intensity (main
effect oftrial; F 1.13 = 64.0 P < 0.001).
Table 6.1. Effect of exercise intensity on heart rate, RPE, body mass loss and blood lactate
concentration.
Variable
Heart Rate (beats.min,l)
RPE
Body mass loss (kg)
Blood Lactate (mmol.L")
Mean
124 (1)
10 (1)
End
128 (4)
10 (1)
0.3 (0.1)
1.8 (0.3)
75% Y02ma, EXH
Mean End Mean End
162(1)* 170(3)* 144 (1) * 1 186 (2)* 1
14 (1)* 16 (1) * 13(1)*1 19(1)*1
0.4 (0.1) 182 ± 1
7.5 (0.6) * 0.3 (0.1)
Values are means (± SEM) (N = 10). * Significantly different from 50% Y02ma, (P < 0.05).
1 Significantly different from 75% Y02ma> (P < 0.05).
6.4. Salivary variables
Saliva flow rate
Saliva flow rate did not change significantly throughout the experimental protocol (Table
6.2).
90
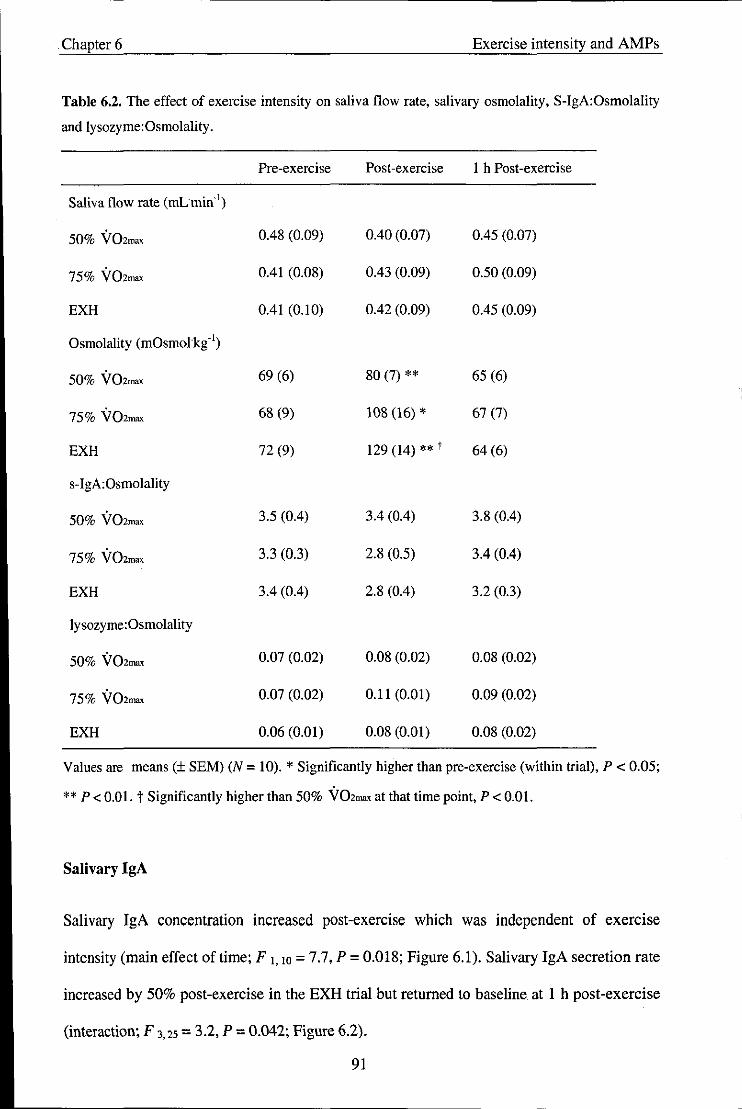
. Chapter 6 Exercise intensity and AMPs
Table 6.2. The effect of exercise intensity on saliva flow rate. salivary osmolality, S-IgA:Osmolality
and lysozyme:Osmolality.
Pre-exercise Post-exercise 1 h Post-exercise
Saliva flow rate (mLmin'!)
50% VOZmax 0.48 (0.09) 0.40 (0.07) 0.45 (0.07)
75% VOZma, 0.41 (0.08) 0.43 (0.09) 0.50 (0.09)
EXH 0.41 (0.10) 0.42 (0.09) 0.45 (0.09)
Osmolality (mOsmol'kg'!)
50% VOZma, 69 (6) 80 (7) ** 65 (6)
75% VOZmax 68 (9) 108 (16) * 67 (7)
EXH 72 (9) 129 (14) ** t 64 (6)
s-IgA:Osmolality
50% VOzma< 3.5 (0.4) 3.4 (0.4) 3.8 (004)
75% VOZma, 3.3 (0.3) 2.8 (0.5) 3.4 (004)
EXH 3.4 (004) 2.8 (004) 3.2 (0.3)
lysozyme:Osmolality
50% VOzma< 0.07 (0.02) 0.08 (0.02) 0.08 (0.02)
75% VOzma< 0.07 (0.02) 0.11 (0.01) 0.09 (0.02)
EXH 0.06 (0.01) 0.08 (0.01) 0.08 (0.02)
Values are means (± SEM) (N = 10). * Significantly higher than pre-exercise (within trial), P < 0.05;
** P < 0.01. t Significantly higher than 50% VOzma< at that time point, P < 0.01.
Salivary IgA
Salivary IgA concentration increased post-exercise which was independent of exercise
intensity (main effect oftime; F 1, 10 = 7.7, P = 0.018; Figure 6.1), Salivary IgA secretion rate
increased by 50% post-exercise in the EXH trial but returned to baseline at 1 h post-exercise
(interaction; F 3,25 = 3.2, P = 0.042; Figure 6.2).
91
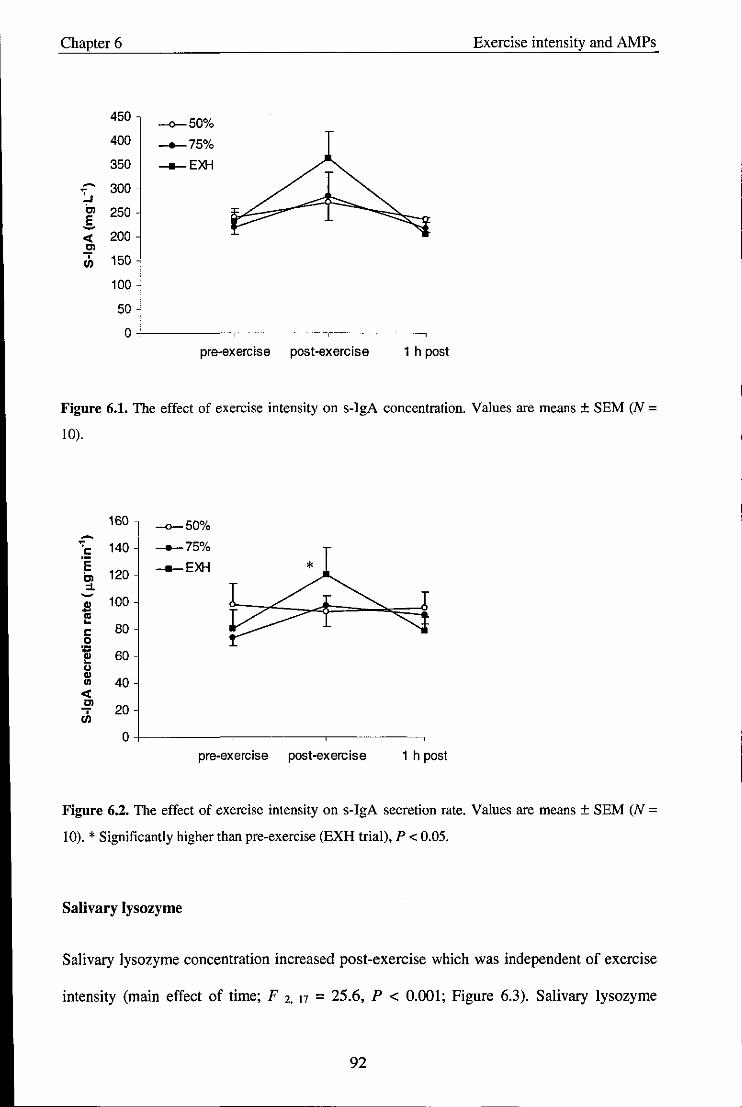
Chapter 6 Exercise intensity and AMPs
450 -0-50% 400 __ 75%
350 __ EXH
- 300 ~ Cl 250 E -et 200 ~ th 150
100
50
0 pre-exercise post-exercise 1 h post
Figure 6_1. The effect of exercise intensity on s-IgA concentration. Values are means ± SEM (N =
10).
160 -0-50% -:5 140 __ 75%
E Cl 120
__ EXH
::1. - 100 S '" -c: 80 0
~ 60 u ..
40 III
et 0> 20 -;
en 0
pre-exercise post-exercise 1 h post
Figure 6.2_ The effect of exercise intensity on s-IgA secretion rate. Values are means ± SEM (N =
10). * Significantly higher than pre-exercise (EXH trial), P < 0.05.
Salivary lysozyme
Salivary lysozyme concentration increased post-exercise which was independent of exercise
intensity (main effect of time; F 2. 17 = 25.6, P < 0.001; Figure 6.3). Salivary lysozyme
92

Chapter 6 Exercise intensity and AMPs
secretion rate increased by 160% post-exercise in the 75% V02=x and EXH trials returning to
baseline at I h post-exercise (interaction; F 3, 25 = 4,9, P = 0,01), but there was no change in
the 50% V02ma, trial (Figure 6.4),
14
12 -4-50%
~ -.-.-75% :... Cl
10 __ EXH
E ~ 8 ., E ,..
6 N 0 In
~ 4 rh
2
0 pre-exercise post-exercise 1 h post
Figure 6.3. The effect of exercise intensity on lysozyme concentration. Values are means ± SEM (N = 10).
~ 7 "' I: E -4-50%
6 Cl ___ 75% :1. ~
5 __ EXH * t ~ ~
I: 4 0 :; ~ 3 u ., In .,
2 E ,.. N 0 1 !i ... • 0 en
pre-exercise post-exercise 1 h post
Figure 6.4. The effect of exercise intensity on lysozyme secretion rate. Values are means ± SEM (N =
10). * Significantly higher than pre-exercise, P < 0.Dl, t Significantly higher than 50% V02m", trial
at that time point, P < 0.05.
93
Chapter 6 Exercise intensity and AMPs
Salivary osmolality
Salivary osmolality (Table 6.2) increased post-exercise in all trials (main effect of time; F 1.11
= 54.3, P < 0.001) and was significantly higher at post-exercise in the EXH trial compared
with the 50% V02max trial (interaction; F 2.22 = 7.5, P = 0.002). Salivary IgA to osmolality
ratio did not change significantly during the experimental protocol. Salivary lysozyme to
osmolality ratio increased post-exercise independent of exercise intensity (main effect of
time; F 2 15 = 8.0, P = 0.006).
Stress markers
Alpha-amylase activity (Table 6.3) increased post-exercise which was independent of
exercise intensity (main effect of time; F 1, 11 = 24.2, P < 0.001). Alpha-amylase secretion
rate increased by about 60% post-exercise in the 75% VOZmax and EXH trials returning to
baseline at 1 h post-exercise (interaction F 3, 27 = 3,9, P = 0.019), but there was no change in
the 50% V02max trial. Salivary cortisol was unchanged immediately post-exercise but was
significantly higher at 1 h post-exercise in the 75% VOZmax and EXH trials compared with
the 50% V02max trial (interaction; F 2,17 = 9,0, P = 0.003; Table 6.3).
94
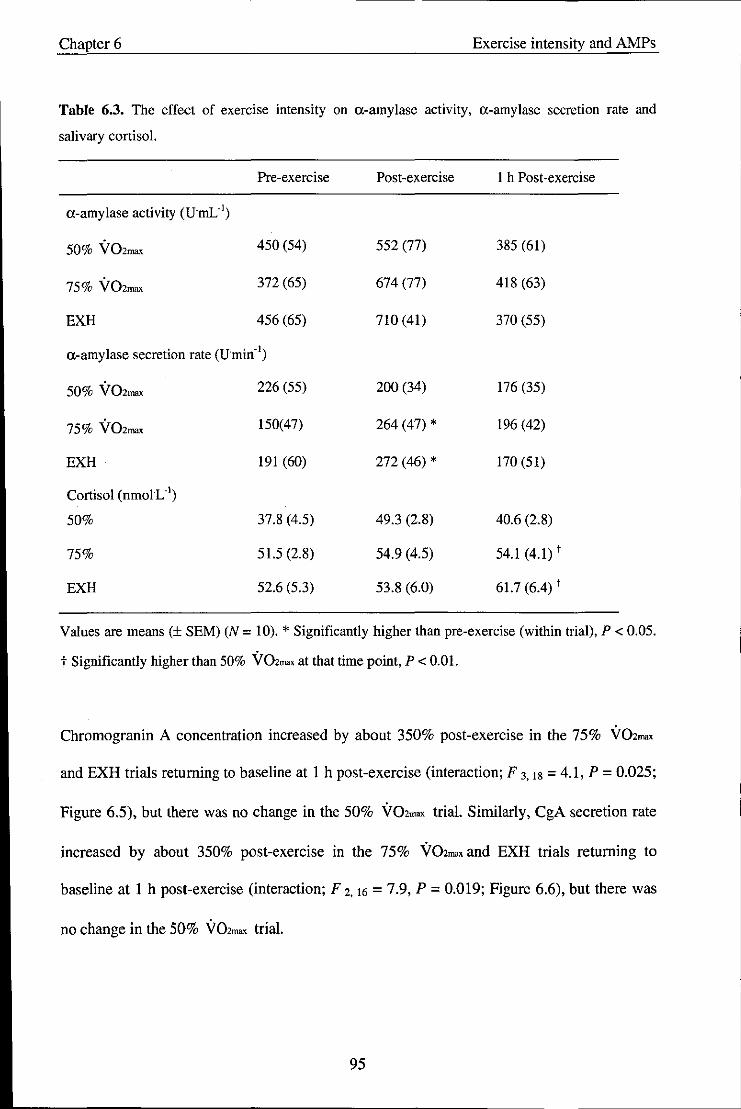
Chapter 6 Exercise intensity and AMPs
Table 6.3. The effect of exercise intensity on a-amylase activity, a-amylase secretion rate and
salivary cortisol.
Pre-exercise Post-exercise I h Post-exercise
a-amylase activity (FmL")
50% V02max 450 (54) 552 (77) 385 (61)
75% V02max 372 (65) 674 (77) 418 (63)
EXH 456 (65) 710(41) 370 (55)
a-amylase secretion rate (Fmin· l)
50% V02ma, 226 (55) 200 (34) 176 (35)
75% V02max 150(47) 264 (47) * 196 (42)
EXH 191 (60) 272 (46) * 170(51)
Cortisol (nmoIL·I)
50% 37.8 (4.5) 49.3 (2.8) 40.6 (2.8)
75% 51.5 (2.8) 54.9 (4.5) 54.1 (4.1) t
EXH 52.6 (5.3) 53.8 (6.0) 61.7 (6.4) t
Values are means (± SEM) (N = 10). * Significantly higher than pre-exercise (within trial), P < 0.05.
t Significantly higher than 50% V02",,, at that time point, P < om.
Chromogranin A concentration increased by about 350% post-exercise in the 75% V02max
and EXH trials returning to baseline at 1 h post-exercise (interaction; F 3.18 = 4.1, P = 0.025;
Figure 6.5), but there was no change in the 50% V02_ trial. Similarly, CgA secretion rate
increased by about 350% post-exercise in the 75% V02ma, and EXH trials returning to
baseline at 1 h post-exercise (interaction; F 2.16 = 7.9, P = 0.019; Figure 6.6), but there was
no change in the 50% V02m"" trial.
95
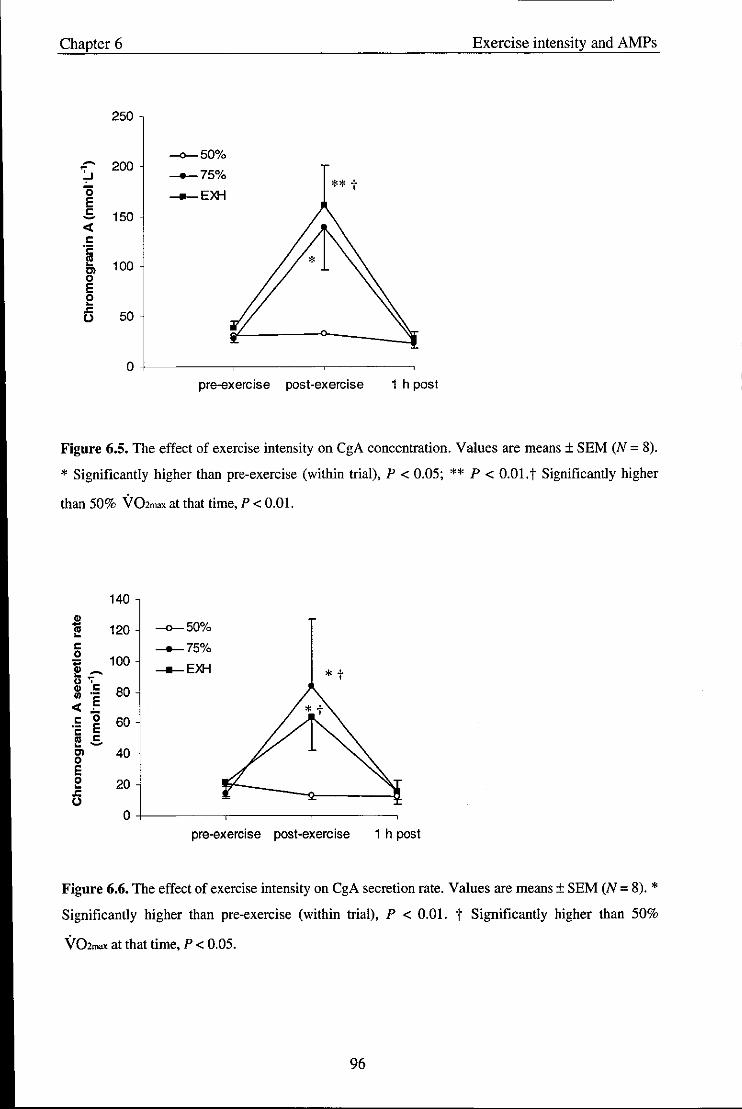
Chapter 6 Exercise intensity and AMPs
250
-0-50% ~ 200 :... ___ 750/0
'0 -ll-EXH ** t E c: 150 -et c: .~
100 Cl 0 E 0 ~
6 50
0 pre-exercise post-exercise 1 h post
Figure 6.S. The effect of exercise intensity on CgA concentration. Values are means ± SEM (N = 8).
* Significantly higher than pre-exercise (within trial), P < 0.05; ** P < 0.01. t Significantly higher
than 50% Y02max at that time, P < 0.01.
140
" - 120 -0-50% III ~
c: __ 75% 0 ,., 100 -ll-EXH ,,~ * t ts '7
" c: 80 III .-
et .E I: 0 60 '2 E III c: ~ -Cl 40 0 E 0 20 ~
.r: U
0 pre-exercise post-exercise 1 h post
Figure 6.6. The effect of exercise intensity on CgA secretion rate. Values are means ± SEM (N = 8). * Significantly higher than pre-exercise (within trial), P < om. t Significantly higher than 50%
Y02mox at that time, P < 0.05.
96
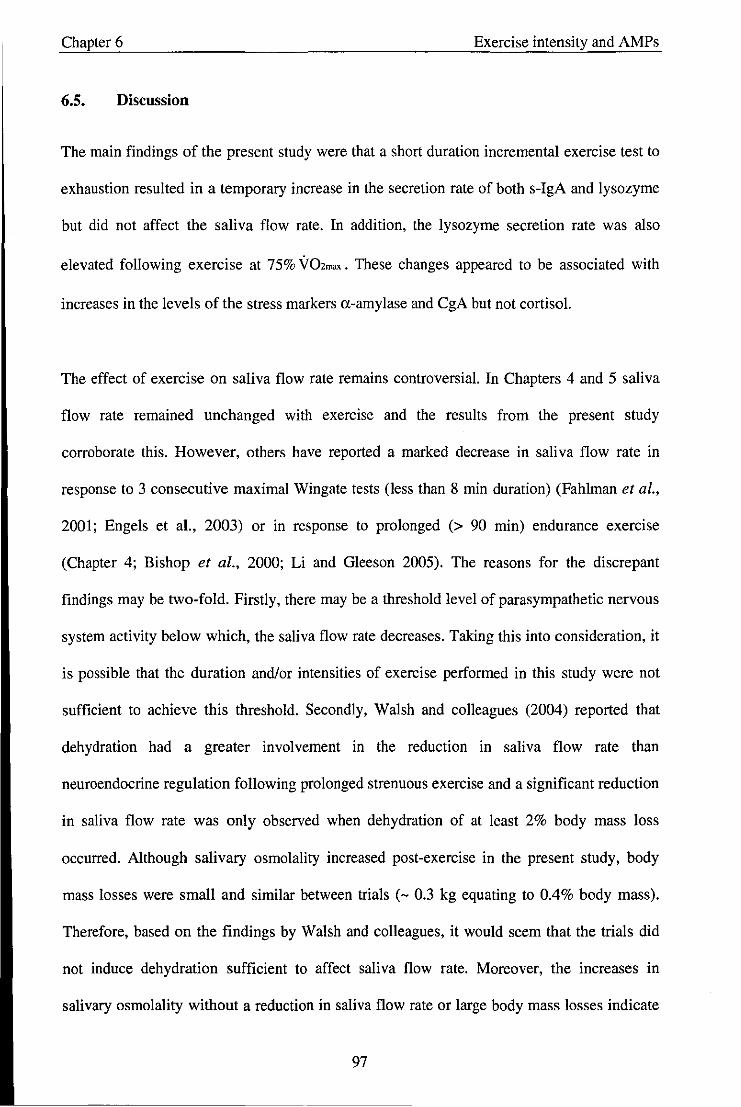
Chapter 6 Exercise intensity and AMPs
6.5. Discussion
The main findings of the present study were that a short duration incremental exercise test to
exhaustion resulted in a temporary increase in the secretion rate of both s-IgA and lysozyme
but did not affect the saliva flow rate. In addition, the lysozyme secretion rate was also
elevated following exercise at 75% V02max. These changes appeared to be associated with
increases in the levels of the stress markers a-amylase and CgA but not cortisol.
The effect of exercise on saliva flow rate remains controversial. In Chapters 4 and 5 saliva
flow rate remained unchanged with exercise and the results from the present study
corroborate this. However, others have reported a marked decrease in saliva flow rate in
response to 3 consecutive maximal Wingate tests (less than 8 min duration) (Fahlman et aI.,
2001; Engels et aI., 2003) or in response to prolonged (> 90 min) endurance exercise
(Chapter 4; Bishop et al., 2000; Li and Gleeson 2005). The reasons for the discrepant
findings may be two-fold. Firstly, there may be a threshold level of parasympathetic nervous
system activity below which, the saliva flow rate decreases. Taking this into consideration, it
is possible that the duration and/or intensities of exercise performed in this study were not
sufficient to achieve this threshold. Secondly, Walsh and colleagues (2004) reported that
dehydration had a greater involvement in the reduction in saliva flow rate than
neuroendocrine regulation following prolonged strenuous exercise and a significant reduction
in saliva flow rate was only observed when dehydration of at least 2% body mass loss
occurred. Although salivary osmolality increased post-exercise in the present study, body
mass losses were small and similar between trials (- 0.3 kg equating to 0.4% body mass).
Therefore, based on the findings by Walsh and colleagues, it would seem that the trials did
not induce dehydration sufficient to affect saliva flow rate. Moreover, the increases in
salivary osmolality without a reduction in saliva flow rate or large body mass losses indicate
97
Chapter 6 Exercise intensity and AMPs
a greater effect of neural innervation of saliva electrolyte secretion rather than dehydration
per se. This may question the reliability of salivary osmolality as an indicator of hydration
status post-exercise.
Previous research conducted in athletes suffering from recurrent infections has shown that
exercise of equal duration performed at 75% VOz""", and 100% VOZmru< were associated with
a trend for a lower s-IgA concentration post-exercise while levels increased slightly after
exercise at 50% VOz""" (Williams et aI., 2001). A similar pattern was observed in children (8
- 12 yr) when s-IgA was expressed as a ratio to albumin (Dorrington et al., 2003). From this
work these researchers concluded that there exists a positive association between the degree
. of immune suppression post-exercise and the exercise intensity level. The present study
sought to re-examine these findings in a cohort of healthy active males. Contrary to the above
findings, significant increases in s-IgA concentration and secretion rate were observed post
exercise following the EXH trial. Due to the incremental nature of this trial, peak HR was
only higher than the 75% VOZmax trial at the end of exercise. Furthermore, overall mean HR
was significantly lower in EXH compared with 75% VOZmax. This suggests that it could be
the peak intensity rather than the overall intensity which is important in influencing s-IgA
secretion.
An elevation in the s-IgA secretion rate following exercise indicates an increased availability
of s-IgA present on the mucosal surfaces and not just a concentrating effect of the saliva as a
result of a reduction in saliva flow rate. The regulation of s-IgA is via a short-term (minutes)
mobilisation (trancytosis) modulated by sympathetic nerves and/or a long-term (days)
modification of s-IgA synthesis (Goodrich and McGee, 1998). Proctor et al. (2003) reported
that acute stimulation of ,B-adrenoreceptors in anaesthetised rats increased s-IgA secretion via
98
Chapter 6 Exercise intensity and AMPs
elevated trancytosis from the glandular pool in a dose-independent manner above a certain
threshold. Therefore, it could be argued that in the short term, it is only very high intensity
exercise that will induce sympathetic stimulation sufficient to increase the transportation of s
JgA into saliva as was observed in the EXH trial. However, when this stimulus becomes more
prolonged (as would occur in longer duration - though less intense - exercise) the amount of
IgA available for transport might become depleted and result in a reduction in the secretion of
IgA (Proctor et aI., 2003). Indeed, the different durations, intensities and types of adrenergic
stimulation could help to explain the inconsistencies in the literature previously cited. Despite
demonstrating significant changes in s-IgA concentration and secretion rate post -exercise, no
significant changes at any intensity were observed when s-IgA was expressed relative to
osmolality. This highlights once more the uncertainty of which is the most appropriate
method for expressing s-IgA.
The present study measured a-amylase and CgA as surrogate markers of sympathetic
activity. Dawes (1981) reported that an elevated a-amylase activity could be induced by
increases in plasma catecholamines and sympathetic nervous activity with exercise.
Furthermore, a previous study found a significant correlation between salivary a-amylase and
plasma noradrenaline concentration following exercise (Chatterton et al., 1996), although
others have failed to confirm this (Nater et al., 2006). Significant increases in both a-amylase
activity and a-amylase secretion rate were observed post-exercise although only the secretion
rate was significantly affected by the exercise intensity. A significant increase in both the
concentration and secretion rate of CgA was found post -exercise and both were influenced by
the exercise intensity. These findings lend further support to an increased involvement of
sympathetic activity in the high intensity trials, which may function to increase the
mobilisation of IgA into saliva. What these results also suggest is that both the concentration
99
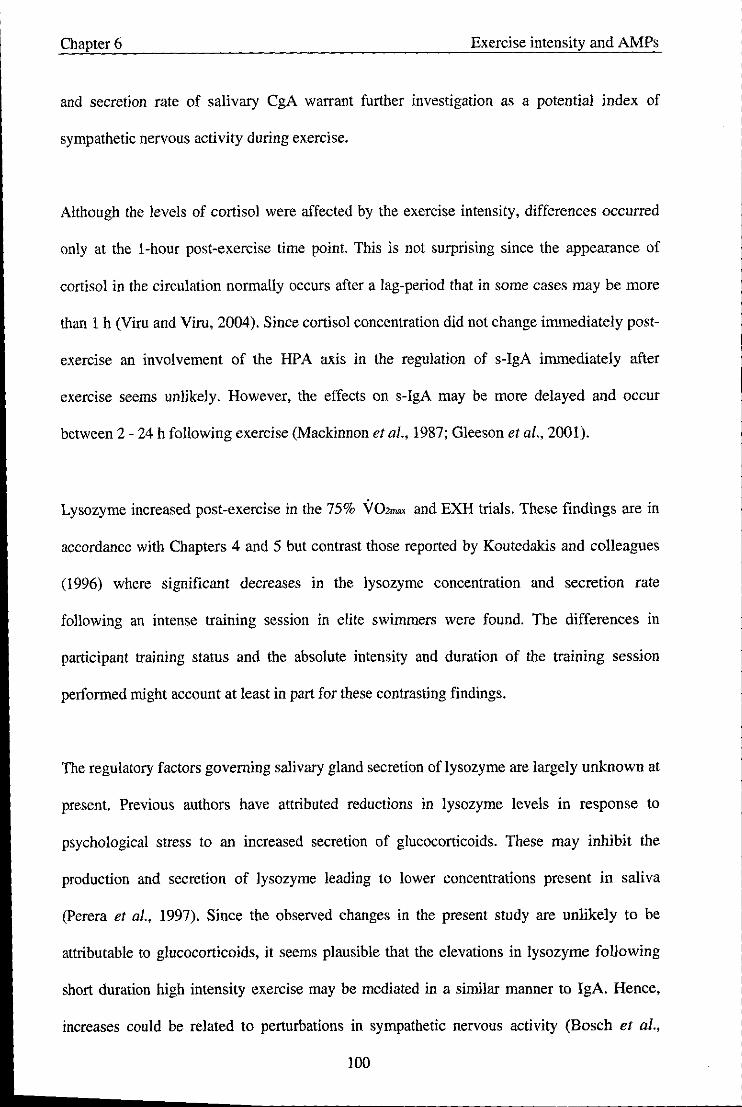
-------- -
Chapter 6 Exercise intensity and AMPs
and secretion rate of salivary CgA warrant further investigation as a potential index of
sympathetic nervous activity during exercise.
Although the levels of cortisol were affected by the exercise intensity, differences occurred
only at the I-hour post-exercise time point. This is not surprising since the appearance of
cortisol in the circulation normally occurs after a lag-period that in some cases may be more
than I h (Viru and Viru, 2004). Since cortisol concentration did not change immediately post
exercise an involvement of the HPA axis in the regulation of s-IgA immediately after
exercise seems unlikely. However, the effects on s-IgA may be more delayed and occur
between 2 - 24 h following exercise (Mackinnon et al., 1987; Gleeson et aI., 2001).
Lysozyme increased post-exercise in the 75% V02mx< and EXH trials. These findings are in
accordance with Chapters 4 and 5 but contrast those reported by Koutedakis and colleagues
(1996) where significant decreases in the lysozyme concentration and secretion rate
following an intense training session in elite swimmers were found. The differences in
participant training status and the absolute intensity and duration of the training seSSlOn
performed might account at least in part for these contrasting findings.
The regulatory factors governing salivary gland secretion of lysozyme are largely unknown at
present. Previous authors have attributed reductions in lysozyme levels in response to
psychological stress to an increased secretion of glucocorticoids. These may inhibit the
production and secretion of lysozyme leading to lower concentrations present in saliva
(Perera et al., 1997). Since the observed changes in the present study are unlikely to be
attributable to glucocorticoids, it seems plausible that the elevations in lysozyme following
short duration high intensity exercise may be mediated in a similar manner to IgA. Hence,
increases could be related to perturbations in sympathetic nervous activity (Bosch et aI.,
100
Chapter 6 Exercise intensity and AMPs
2002), resulting in a transient increase in mobilisation of lysozyme into saliva. Moreover,
since similar elevations in lysozyme were also observed in the 75% \rOZm" trial, it is
possible that the threshold of sympathetic nervous activity to increase mobilisation may be
lower for that of lysozyme than s-IgA. Although increases in salivary antimicrobial proteins
may suggest a temporary enhancement of immune function, the significance of this in terms
of infection risk is currently unclear and thus, the clinical relevance of these findings remains
unknown.
In conclusion, the data from the present study indicate that a short duration incremental
exercise test to exhaustion can result in temporary increases in the secretion rate of both s
IgA and lysozyme without affecting saliva flow rate. Furthermore, an increase in the
lysozyme secretion rate also occurred post-exercise at 75% \r02m"". These results appear to
be associated with increases in the secretion rate of CgA and a-amylase. Collectively, these
findings suggest that sympathetic stimulation during intensive exercise appears to be great
enough to increase s-IgA and lysozyme transport into saliva without the affecting the saliva
flow rate.
101

Chapter 7 S-IgA, URTI and training in athletes
Chapter 7 - Study 5: Salivary IgA and respiratory illness in elite male and
female swimmers during a 6-month period of training and competition
Abstract
The purpose of the present study was to examine the impact of a 6-month period of training
and competition on mucosal immunity and respiratory illness in a cohort of 12 elite male and
female swimmers. Unstimulated, timed saliva samples were collected at rest on 8 occasions
over a 6-month period leading up to and during an international swimming competition for
the analysis of salivary immunoglobulin A (s-IgA) and salivary osmolality. In addition,
symptoms of respiratory illness were recorded on a weekly basis. There were no significant
changes in saliva flow rate, s-IgA concentration or the ratio of s-IgA to osmolality (P> 0.05)
throughout the training study period. There was a significant main effect of time for s-IgA
secretion rate (P < 0.05), which was significantly lower at week 22 (pre-competition)
compared with week 26 (post-competition). Lower levels of s-IgA secretion rate were also
observed at week 7 (pre-trials) and week 17 (post-intensified training) compared with week
26, although these did not quite reach significance (P = 0.054). Significant differences in
gender were found in all the salivary measures with females demonstrating lower levels than
males. However, the responses of these measures to the training period did not differ between
genders. Symptoms of respiratory illness were highest during week 8 of the study (post-trials)
where 7 swimmers (3 male and 4 female) reported ill. However, this did not appear to be
directly related to lower s-IgA levels. These results suggest that a 6-month season of swim
training and competition may result in significant changes in the s-IgA secretion rate but not
the s-IgA concentration. Significant differences in gender exist in resting salivary
composition but these are not differently affected by swim training.
102
---------------------------------------------------------------------------------
Chapter 7 S-IgA, URTI and training in athletes
7.1. Introduction
Over the past decade there has been a proliferation of research investigating the effects of
exercise on immune function and infection risk in athletes. The perceptions remain that
athletes report a higher incidence of upper respiratory tract infections (URTI) during periods
of heavy training and competition and this is thought to be related to perturbations in certain
aspects of immune function (Nieman, 1994, Nieman et a!., 1990a, Peters, 1997). It is now
widely accepted that the immune system exhibits change following both acute exercise and
chronic training, but a direct link between these changes and infection risk has yet to be
convincingly established.
Secretory immunoglobulin A (IgA) represents the first line of defence against infectious
agents related to URTI. IgA has the capacity to inhibit the colonisation of pathogens, bind
antigens for transport across the epithelial barrier and neutralise viruses (Lamm, 1998). It is
well known that individuals with IgA deficiency experience a higher incidence of URTI and a
significant relationship between salivary IgA (s-IgA) concentration and the incidence of
URTI in the general popUlation has been reported (Jemmott and McClelland, 1989).
Numerous studies have investigated how the levels of s-IgA are affected by exercise although
the results have been inconsistent to date. Following acute exercise, some have reported that
s-IgA concentration was depressed (Tomasi et al .• Mackinnon et al., 1987. Tharp and Barnes.
1990). whereas others have reported either no change (McDowell et al .• 1991, Walsh et al.,
1999) or even elevations (Blannin et aI., 1998; Tharp. 1991).
Longitudinal studies have shown that the changes may be cumulative over time since resting
s-IgA concentration was shown to fall with each additional month of training in elite
swimmers (Gleeson et al.. 1999). Similar findings were reported in American college
103

Chapter 7 S-IgA, UR TI and training in athletes
footballers: during a 12-month football season reductions in both the concentration and the
secretion rate of s-IgA were observed during the most intense periods of training. In contrast,
Gleeson et al (2000) reported small but significant increases in s-IgA during a 12-week
training cycle leading up to competition in elite swimmers.
Some studies have successfully linked changes in s-IgA to the reported incidence of URTI in
athletes. A significant inverse association between pre-training s-IgA concentration and the
numbers of reported infections was found in elite swimmers (Gleeson et al., 1999).
Furthermore, Fahlman and Engels (2005) found an inverse correlation with the s-IgA
secretion rate and respiratory illness in American footballers. However, others have not been
able to repeat these findings. No correlation between URTI and s-IgA concentration was
found in a different cohort of swimmers over 12 weeks (Gleeson et al., 2000), in a group of
elite female rowers over 2 months (Nehlsen-Cannarella et al., 2000) or in elite tennis players
studied over 12 weeks (Novas et al., 2003). The differences in these findings could be related
to the limited duration of these studies or the method of expressing s-IgA. In the earlier
studies, s-IgA was expressed as a concentration. However, more recently researchers have
chosen to represent it as a secretion rate or as a ratio to osmolality. Expressing s-IgA relative
to osmolality may be a valid measure when significant variations in saliva flow rate occur
(Blannin et al., 1998). However, it is thought that the secretion rate of s-IgA may be more
appropriate since it represents the amount of s-IgA present on the mucosal surface as both the
saliva flow rate and IgA concentration are important for host defence (Mackinnon et aI.,
1993a). This was supported by Fahlman and Engels (2005) who concluded that the secretion
rate may be the most useful clinical biomarker to predict the incidence of URTI. However,
further research into this area is required before any general consensus can be arrived at.
104
Chapter 7 S-IgA, URTI and training in athletes
The majority of published research into the effect of exercise on the immune system has
mainly focused on male athletes overlooking potential differences in gender. Indeed,
significant gender differences in s-IgA concentration have been reported in elite swimmers
with females exhibiting lower values than males both at rest and post-exercise (Glee son et aI.,
1999). It is not known whether the same can be said for other methods of expressing s-IgA or
whether the s-IgA response to training is the same. Whether this factor might explain some of
the inconsistencies in the literature remains to be investigated. Therefore, this study sought to
extend previous findings to determine a) the effects of a 6-month season of training and
competition on measures of mucosal immunity in elite male and female swimmers and b)
whether the selected markers of mucosal immunity were related to reported episodes of
URTI.
7.2. Methods
7.2.1. Participants
Twelve elite swimmers (7 male and 5 female) were recruited to participate in the present
study. All were members of the British Swimming National team, ranked in the top 3 in their
event nationally and the top 100 internationally. Their physical characteristics are outlined in
Table 7.1.
105

Chapter 7
Table 7,1, Participant Characteristics (N = 12)
Variable
Age (yr
Mass (kg)
Height (m)
Mean (±SEM)
Males (N = 7)
22± 1
79.4 ± 2.4
1.90 ± 0.01
Females (N = 5)
21 ± 1
62.5 ± 3.0*
1.70 ± 0.01 *
* Significantly different to Males (P < 0.05).
7,2,2, Study design
S-IgA, URTI and training in athletes
The swimmers were monitored on 8 occasions during a 6-month period of training and
competition leading up to and during the Commonwealth Games in Melbourne, Australia in
March 2006. At the beginning and end of each training cycle a timed, un stimulated saliva
sample was collected from each swimmer. The collections were made at rest, between 7:30 h
and 8:00 h, at least l-h post-prandially and a minimum of 18 h after the previous training
session. At the beginning of each training week, a log recording symptoms of URTI
(Appendix E) was completed. This referred to any symptoms exhibited during the previous
week. A positive episode of URTI was recorded when two or more symptoms were exhibited
on two consecutive days, at least I-week apart from a previous episode.
7.2.3. Training loads
All types of training were incorporated into the study. A typical week consisted of 20 - 25 h
of pool training and 6 - 8 h of dry-land training involving core strength and flexibility work.
The subjective rating for the training sessions was defined and controlled by the British
Swimming Head Coach and Team Physiologist. Individual training intensities were based on
the swimmers' personal best times and maximum heart rate recorded during an incremental
106
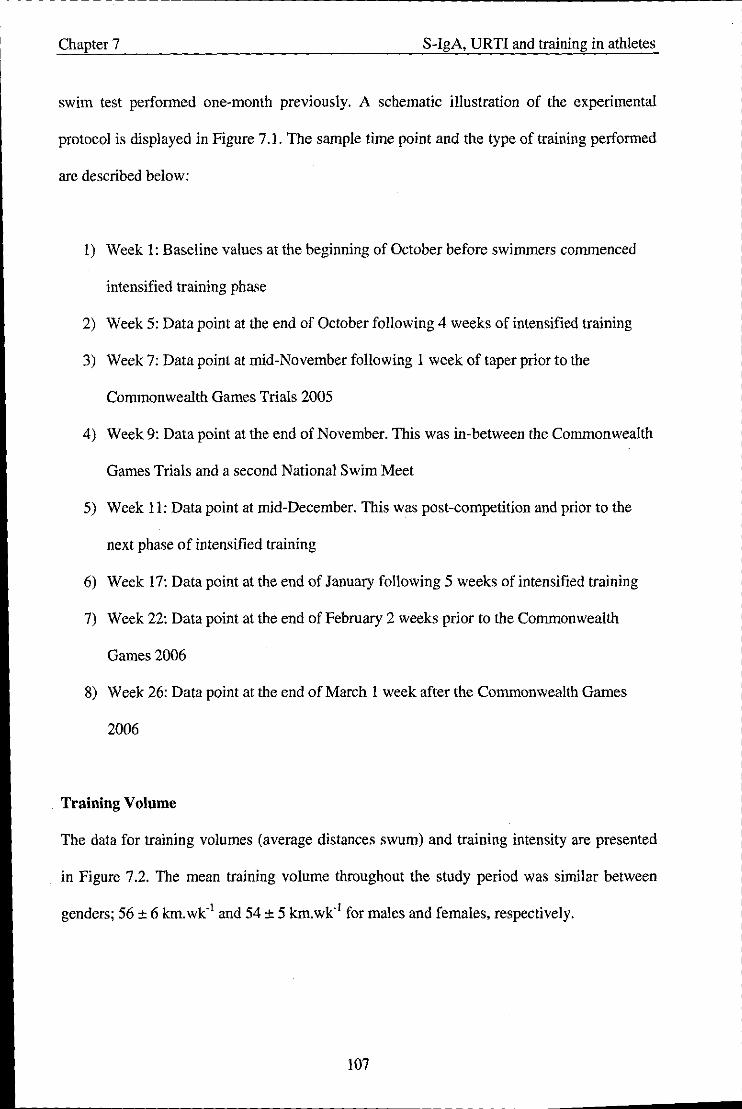
Chapter 7 S-IgA. URTI and training in athletes
swim test performed one-month previously. A schematic illustration of the experimental
protocol is displayed in Figure 7.1. The sample time point and the type of training performed
are described below:
1) Week 1: Baseline values at the beginning of October before swimmers commenced
intensified training phase
2) Week 5: Data point at the end of October following 4 weeks of intensified training
3) Week 7: Data point at mid-November following 1 week of taper prior to the
Commonwealth Games Trials 2005
4) Week 9: Data point at the end of November. This was in-between the Commonwealth
Games Trials and a second National Swim Meet
5) Week 11: Data point at mid-December. This was post-competition and prior to the
next phase of intensified training
6) Week 17: Data point at the end of January following 5 weeks of intensified training
7) Week 22: Data point at the end of February 2 weeks prior to the Commonwealth
Games 2006
8) Week 26: Data point at the end of March 1 week after the Commonwealth Games
2006
Training Volume
The data for training volumes (average distances swum) and training intensity are presented
in Figure 7.2. The mean training volume throughout the study period was similar between
genders; 56 ± 6 km.wk'! and 54 ± 5 km.wk'l for males and females. respectively.
107
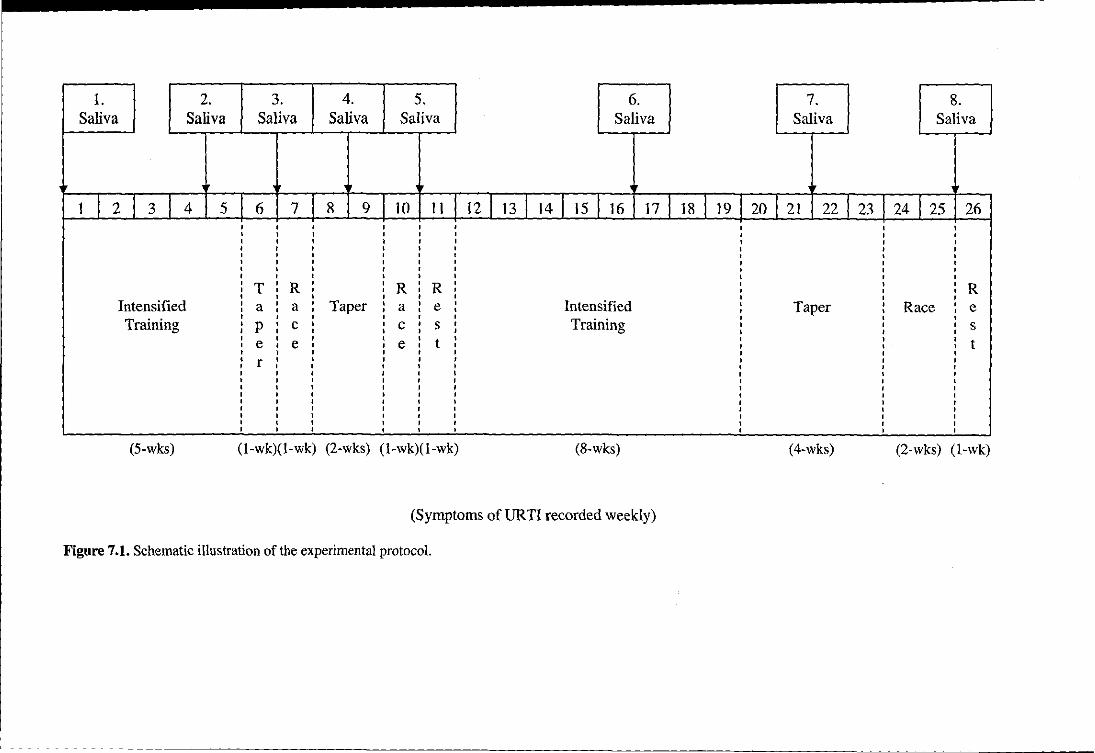
1. 2. 3. 4. 5. 6. 7. 8. Saliva Saliva Saliva Saliva Saliva Saliva Saliva Saliva
1 I 2 3 4 5 6 7 8 9 10 11 12 I 13114 I 15 16 17 18119120 21 22 23 J 24 25 26 , , , , , , , , , , , , , , , , , , , , , , , , , , , , , , , , , , , , , , , , , , , , , , , , , , , , , , , , , , , , , , , , , , , • , , , , ,
T ,
R , ,
R ,
R , , • ,
R , , , , , , , , , , , , , , , , , , Intensified , a , a , Taper , a • e , Intensified , Taper , Race , e , , , , , , , , , , , , , , ,
Training , , ,
Training , p • c , , c , s , , , , s • , , • , , • , , , e
, e
, , e
, t
, , , , t , , , , , , , , , , , , , , , , , , , r , , , , , , , , , , , , , , , , , , , , , , , , , , , , , , , , , , , , , , , , , , , , , , , , , , , , , , , , , , , , , , , , , , , , , , , , , , , , , , , , , , , , , , , , , , , , , , , , , ,
(5-wks) (l-wk)(1-wk) (2-wks) (l-wk)(l-wk) (8-wks) (4-wks) (2-wks) (l-wk)
(Symptoms ofURTI recorded weekly)
Figure 7.1. Schematic illustration of the experimental protocol.

~ I I
_ 80
' ... J 70
E 60 C ~ 50 :3 "5 40 > .~ 30 c ~ 20
c 10 III
~ o L
1 2 3 4 5 6 7 8 9 10 11 12 13 14 15 16 17 18 19 20 21 22 23 24 25 26
Figure 7.2. The weekly training programme undertaken during the study indicating the type of training and mean distances swum (km.week-!) each week_
• High intensity training, Ill!! Moderate intensity training. Il'J Low intensity training. 0 Competition. .. Saliva sampling.
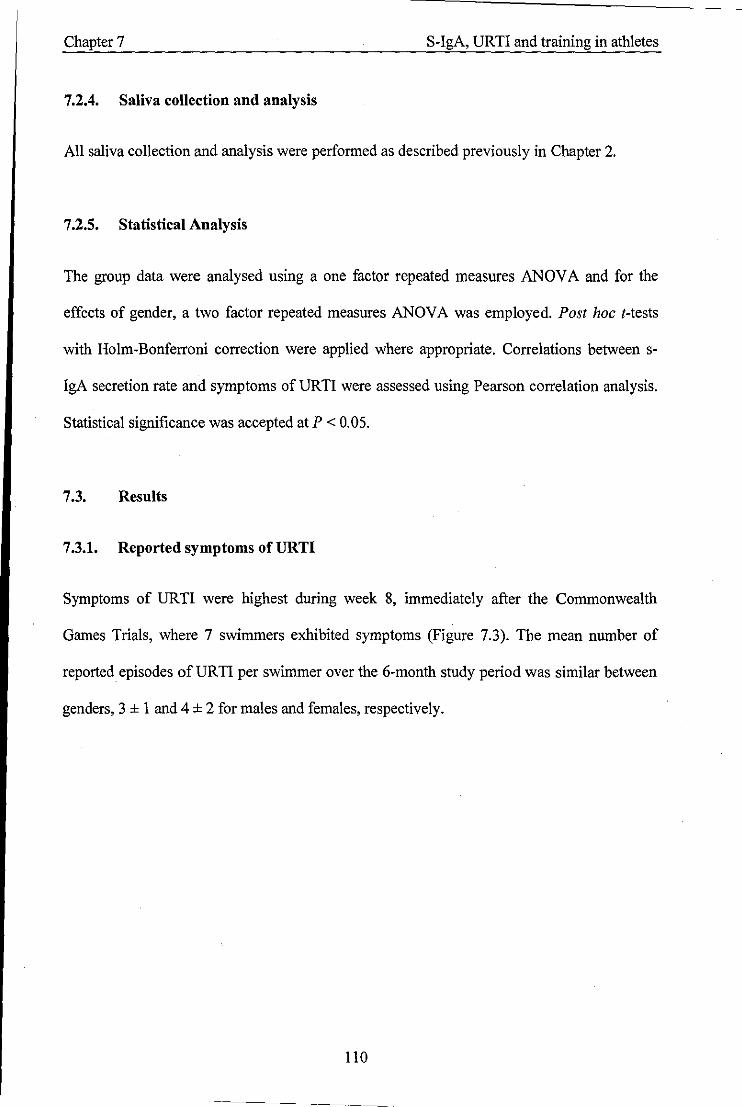
Chapter 7 S-IgA, URTl and training in athletes
7.2.4. Saliva collection and analysis
All saliva collection and analysis were performed as described previously in Chapter 2.
7.2.5. Statistical Analysis
The group data were analysed using a one factor repeated measures ANOVA and for the
effects of gender, a two factor repeated measures ANOV A was employed. Post hoc t-tests
with Holm-Bonferroni correction were applied where appropriate. Correlations between s
IgA secretion rate and symptoms of URTl were assessed using Pearson correlation analysis.
Statistical significance was accepted at P < 0.05.
7.3. Resnlts
7.3.1. Reported symptoms of URTI
Symptoms of URTl were highest during week 8, immediately after the Commonwealth
Games Trials, where 7 swimmers exhibited symptoms (Figure 7.3). The mean number of
reported episodes of UR Tl per swimmer over the 6-month study period was similar between
genders, 3 ± I and 4 ± 2 for males and females, respectively.
110

Chapter 7 S-IgA, UR TI and training in athletes
III E 8 .s Co
7 E in' ;; 6 .~
5 "'-,glt 4 a;;:) Ill ....
" 0 3 ~
Co III 2 .SI " S ca .... 0 0 ci 1 z 2 3 4 5 6 7 8 9 10 11 12 13 14 15 16 17 18 19 20 21 22 23 24 25
Figure 7.3. The incidence of reported symptoms ofURTI during the 6-month training stndy (N= 12).
7.3.2. Salivary variables
Saliva flow rate
There were no significant changes in saliva flow rate throughout the study period (Figure
7.4). There was a significant main effect of gender, saliva flow rate was lower in females
compared with males (h 80 = 11.268, P = 0.001).
111
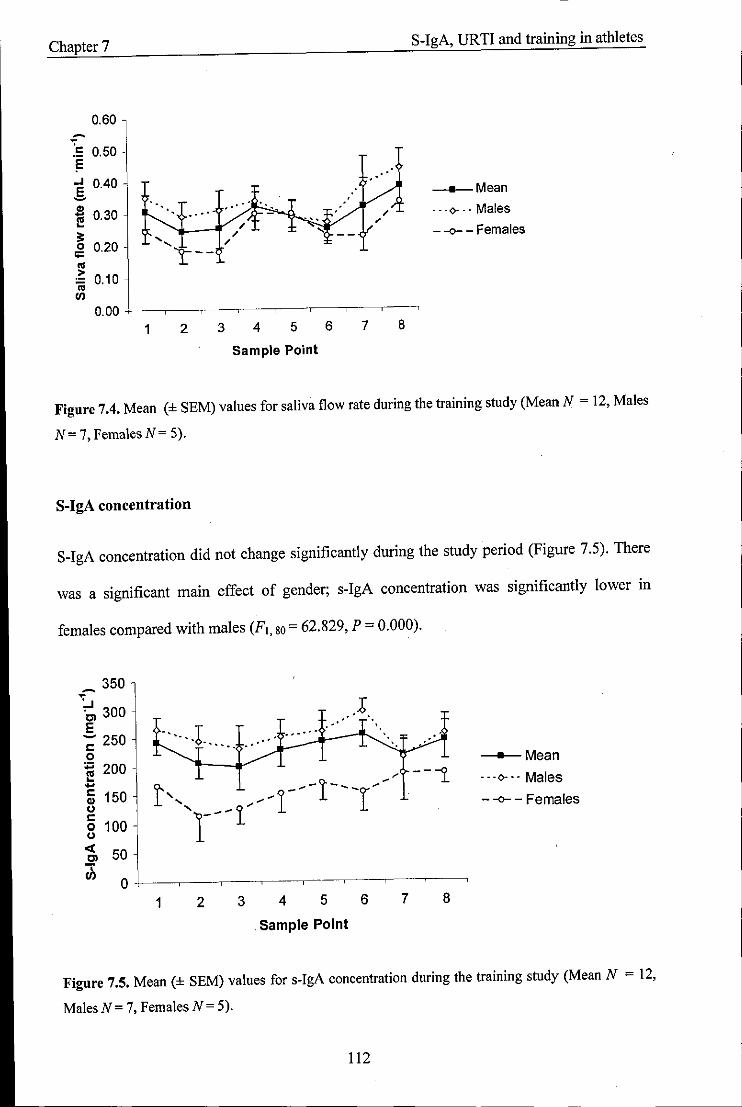
Chapter 7 S-IgA, URTI and training in athletes
0.60 ~
:= 0.50 != .' ...I 0.40 E
__ Mean -., 0.30
.. ' ... <)- .. Males
1;j .0'- - " ~ " ,
;= ' .... " - -<>- - Females
0 0.20 " 0:: 't--.. . ~ 0.10 iii VI
0.00 1 2 3 4 5 6 7 8
Sample Point
Figure 7.4. Mean (± SEM) values for saliva flow rate during the training study (Mean N = 12, Males
N= 7, FemalesN= 5).
S-IgA concentration
S-IgA concentration did not change significantly during the study period (Figure 7.5). There
was a significant main effect of gender; s-IgA concentration was significantly lower in
females compared with males (F1, 80 = 62,829, P = 0.000).
_ 350
~:.J 300 ~ - 250 c o
:;::; 200 E .... § 150 o c o 100 o
.. ' .. '
...... .1 __ ..,.... "
--"i
~ 50 jj o -f---.---.---'----'- -~---,--~-~
1 2 3 4 5 6 7 8
Sample Point
--Mean
"'0'" Males
- -0- - Females
Figure 7.5. Mean (± SEM) values for s-IgA concentration during the training study (Mean N = 12,
MalesN= 7, Females N= 5).
112
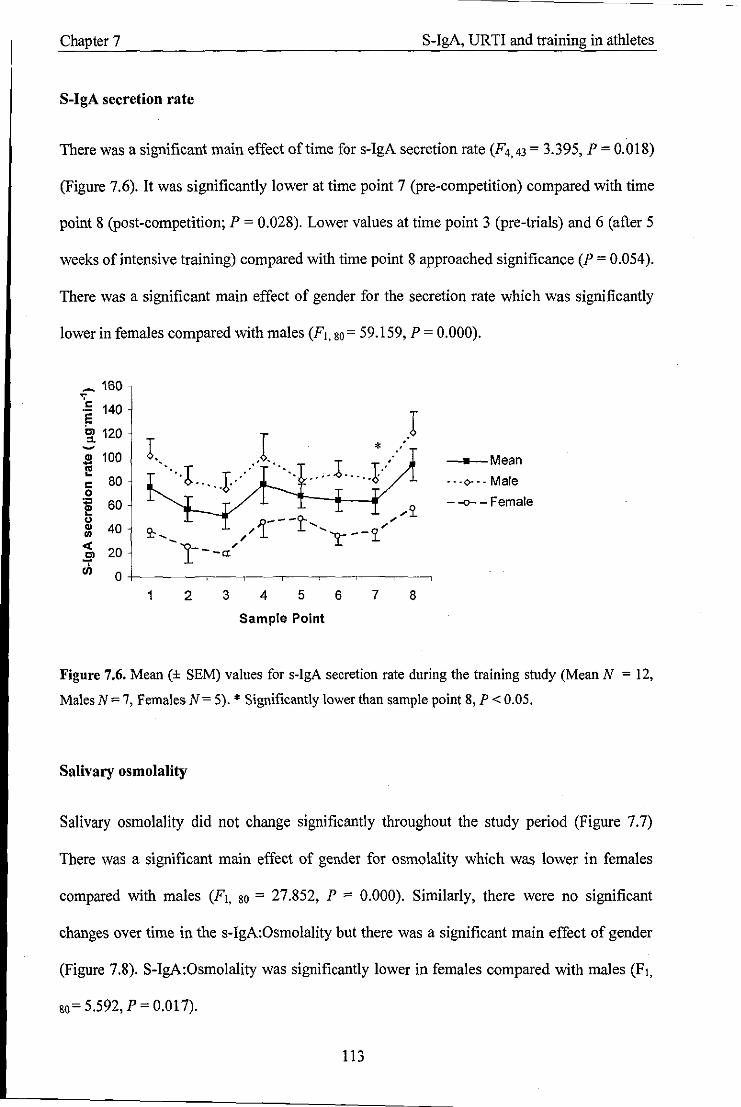
Chapter 7 S-IgA, URTI and training in athletes
S-IgA secretion rate
There was a significant main effect of time for s-lgA secretion rate (F4,43 = 3,395, P = 0.018)
(Figure 7.6). It was significantly lower at time point 7 (pre-competition) compared with time
point 8 (post-competition; P = 0.028). Lower values at time point 3 (pre-trials) and 6 (after 5
weeks of intensive training) compared with time point 8 approached significance (P = 0.054).
There was a significant main effect of gender for the secretion rate which was significantly
lower in females compared with males (Fl, 80= 59.159, P = 0.000).
_ 160 , .!: 140 E ~ 120 -S 100 I!
80 c 0 .,
60 1!! " Q) 40 "' « 20 Cl ...,. III 0
1 2 3 4 5 6
Sample Point
* .' )
7 8
__ Mean
"'0-" Male
- -0- - Female
Figure 7.6. Mean (± SEM) values for s-lgA secretion rate during the training study (Mean N = 12,
Males N = 7, Females N = 5). * Significantly lower than sample point 8, P < 0.05.
Salivary osmolality
Salivary osmolality did not change significantly throughout the study period (Figure 7.7)
There was a significant main effect of gender for osmolality which was lower in females
compared with males (Fl, 80 = 27.852, P = 0.000). Similarly, there were no significant
changes over time in the s-IgA:Osmolality but there was a significant main effect of gender
(Figure 7.8). S-lgA:Osmolality was significantly lower in females compared with males (Fl,
80= 5.592, P = 0.017).
113
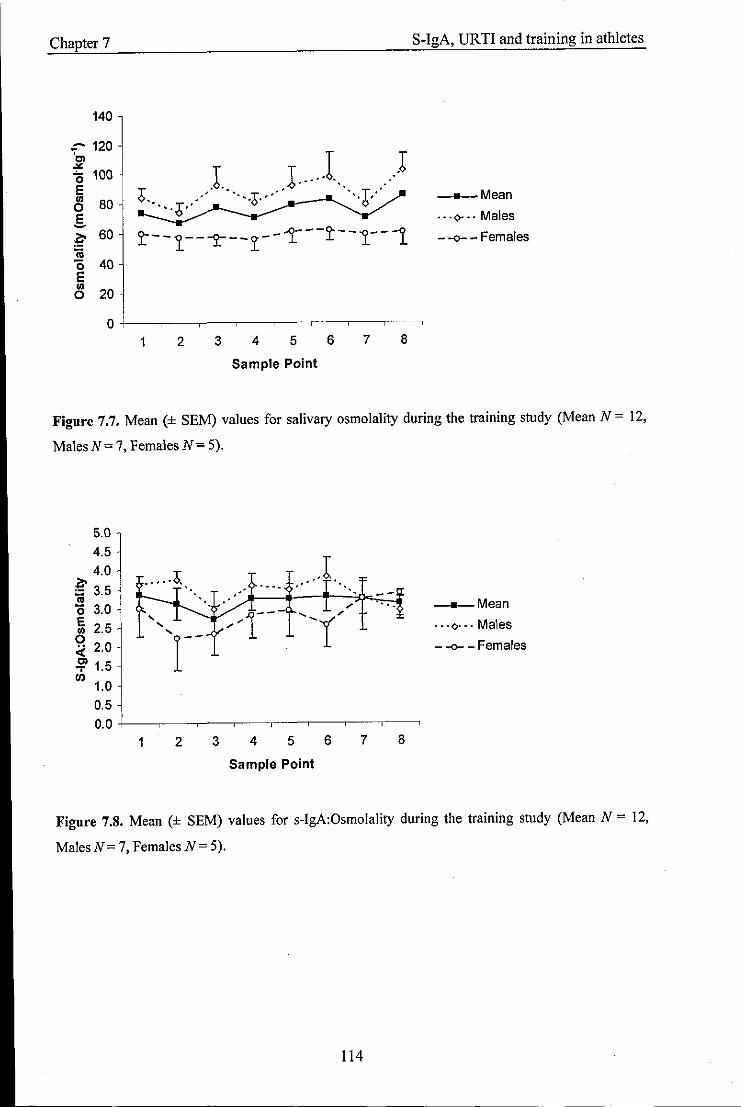
Chapter 7
140
::-- 120 ~ (; 100 E
CS 80 §. ~ 60 :a "0 40 E III o 20
1. J ... 1.. ..) 6 .' .. T." ',T' ..... ;>... "0' 't!
t- -1--J>."--~C --r---~--1--1.
1 2 3 4 5 6 7 8
Sample Point
S-IgA, URTI and training in athletes
__ Mean
"'0-" Males
- -<>- - Females
Figure 7.7. Mean (± SEM) values for salivary osmolality during the training study (Mean N = 12,
MalesN=7, Females N= 5).
5.0
4.5
4.0 ..... ;>. ~ 3.5 ca 0 3.0 E ....
2.5 .... III .... 0
2.0 r-4: !?! 1.5 VI
1.0 0.5
0.0 1 2
"--. "
.,; r-
3 4 5
Sample Point
6 7 8
__ Mean
"'0-" Males
- -<>- - Females
Figure 7.S. Mean (± SEM) values for s-IgA:Osmolality during the training study (Mean N = 12,
MalesN= 7, FemalesN= 5).
114
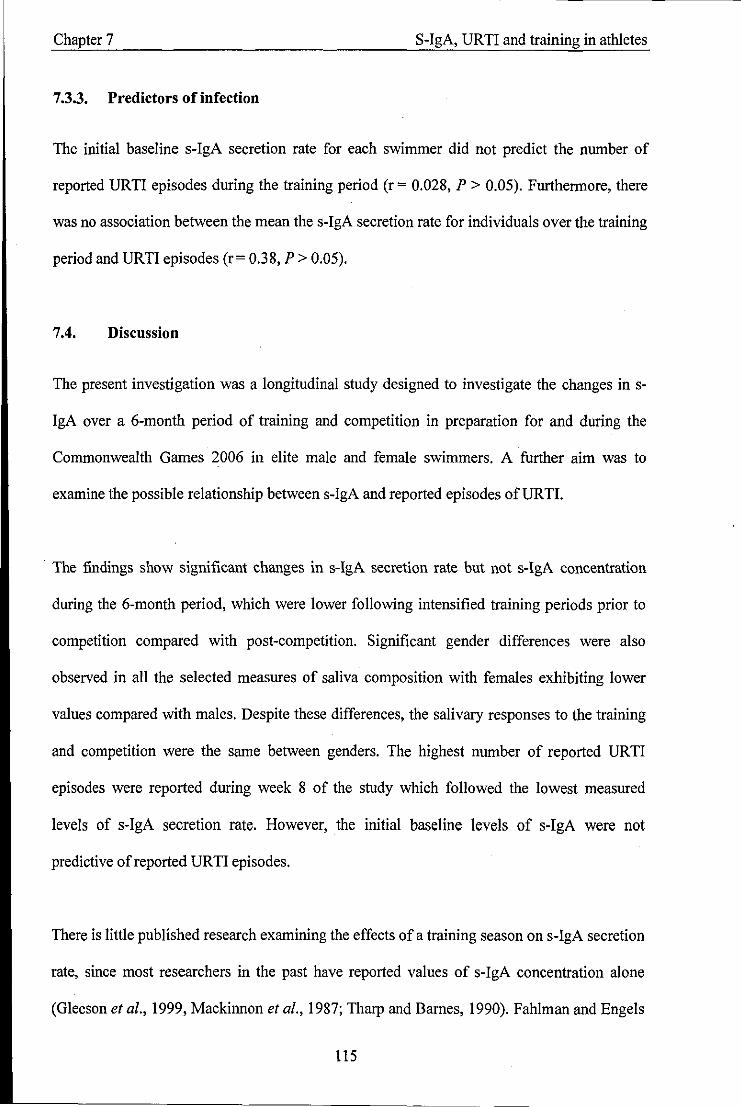
Chapter 7 S-IgA, UR TI and training in athletes
7.3.3. Predictors of infection
The initial baseline s-IgA secretion rate for each swimmer did not predict the number of
reported URTI episodes during the training period (r = 0.028, P > 0.05). Furthermore, there
was no association between the mean the s-IgA secretion rate for individuals over the training
period and URTI episodes (r= 0.38, P> 0.05).
7.4. Discussion
The present investigation was a longitudinal study designed to investigate the changes in s
IgA over a 6-month period of training and competition in preparation for and during the
Commonwealth Games 2006 in elite male and female swimmers. A further aim was to
examine the possible relationship between s-IgA and reported episodes ofURTI.
. The findings show significant changes in s-IgA secretion rate but not s-IgA concentration
during the 6-month period, which were lower following intensified training periods prior to
competition compared with post-competition. Significant gender differences were also
observed in all the selected measures of saliva composition with females exhibiting lower
values compared with males. Despite these differences, the salivary responses to the training
and competition were the same between genders. The highest number of reported URTI
episodes were reported during week 8 of the study which followed the lowest measured
levels of s-IgA secretion rate. However, the initial baseline levels of s-IgA were not
predictive of reported URTI episodes.
There is little published research examining the effects of a training season on s-IgA secretion
rate, since most researchers in the past have reported values of s-IgA concentration alone
(Gleeson et al., 1999, Mackinnon et al., 1987; Tharp and Bames, 1990). Fahlman and Engels
115
Chapter 7 S-IgA, UR TI and training in athletes
(2005) reported lower levels of s-IgA secretion rate in a cohort of 75 male American college
footballers following two 6-week periods of high intensity training and competition, but
which recovered during periods of recovery and rest. However, Whitham et al. (2006)
reported no significant change in s-IgA secretion rate during a 20 week training study in
Parachute Regiment trainees, despite decreased saliva flow rate at week 20 (June) compared
with baseline (January). The results of the present study followed a similar pattern to
Fahlman and Engels, (2005), where values tended to be lower following periods of
intensified training, prior to competition compared with post-competition, where they seemed
to recover. Indeed, previous research on acute exercise has suggested that the mucosal
immune response may be affected by the exercise intensity (Fahlman et al., 2001; Mackinnon
et al., 1987; Mackinnon and Jenkins, 1992; Tomasi et al., 1982), but the relationship between
s-IgA and chronic training is less clear. Significant increases in s-IgA concentration have
been reported following 12-weeks of moderate intensity training in previously sedentary
adults (Klentrou et al., 2002) and after a 12-week training period in elite swimmers (Gleeson
et al., 2000). In contrast, studies of a longer duration have reported decreases in s-IgA
concentration after a 4-month training period in elite swimmers and a downward trend during
a 7-month season in another group of elite male and female swimmers (Gleeson et al., 1999).
However, none of these groups measured s-IgA levels post-competition or reported s-IgA
secretion rate. Clearly further work is required in this area which examines all the available
methods of expressing s-IgA before a general conclusion can be drawn.
It is noteworthy that in the present study significant differences in s-IgA secretion rate were
only observed between the pre-Commonwealth Games (week 22) and post-Commonwealth
Games (week 26) time points and not with the initial baseline values. One possible factor to
account for this finding was that the levels may have been slightly suppressed at the
beginning of the training study by psychological stress and anxiety of the training and
116
Chapter 7 S-IgA, URTI and training in athletes
competition that lay ahead. Indeed, chronic psychological stress and anxiety have been
repeatedly associated with reductions in s-IgA (Deinzer and Schuller, 1998; Jemmott and
Magloire, 1988), and this may also have partly accounted for the lower levels in s-IgA
secretion rate observed prior to competition. In addition to this, the majority of the swimmers
had been involved in some basic endurance training before joining the squad at the beginning
of the study, which may also have affected their baseline s-IgA levels. Thus, this data point
may not represent a true baseline level, a finding that has also been reported previously in
swimmers (Gleeson et al., 2000).
The main limitation of the present study was that no control group was examined. Thus, one
cannot be sure that the measures were not influenced by seasonal fluctuations. For example,
saliva flow rate is known to be lower during the wann summer months (Whitham et al.,
2006), and this could in turn affect the s-IgA concentration and/or secretion rate.
Furthermore, there exists a seasonal variation in URTI incidence, which is generally higher
during the winter (Matthews et al., 2002). The present study was conducted in the winter
months when saliva flow rate was unlikely to be affected. However, it is not known whether
the increased reported symptoms of UR TI during week 8 of the study where a result of the
training intervention or representative of a seasonal variation.
The present study found no significant changes in the concentration of s-IgA throughout the
training period. This is in contrast to previous reports which found consistent changes in the
concentration following a period of training in elite swimmers (Gleeson et al., 1999; Gleeson
et al., 2000; Tharp and Bames, 1990). Since the s-IgA secretion rate was not measured by
these groups, a direct comparison cannot be made. However, our findings show that it was
only the secretion rate of s-IgA (and not the concentration) that was sensitive to the training
stimulus. A change in the s-IgA secretion rate may be a significant finding since it represents
117

Chapter 7 S-IgA, URTI and training in athletes
the amount of s-IgA available on the mucosal surfaces for protection against infectious agents
and takes into account the concentration of s-IgA and the saliva flow rate, both of which are
important for host defence (Mackinnon et al., 1993a). In addition to s-IgA concentration, no
differences were observed when s-IgA was expressed relative to osmolality. Taken together,
these findings highlight the disparities that occur when measuring these aspects of muscosal
immunity in response to training, and raise the question over their utility as markers ofURTI
risk in athletes.
A further significant finding in the present investigation was the striking differences found
between genders. In all of the salivary measures females consistently exhibited lower values
when compared with males. However, their responses to the training stimulus were the same.
GIeeson and colleagues (1999) reported a significantly lower s-IgA concentration in elite
female swimmers compared with their male counterparts with no apparent difference in
URTI incidence, and the present results extend these findings. A lower saliva flow rate and
indeed s-IgA secretion rate measured in females may not be surprising since it has been
shown that females possess smaller salivary glands than males (Inoue et al., 2006). The lower
values in osmolality and s-IgA concentration may initially suggest that the females produced
a more dilute saliva which could be related to their hydration status. However, the s-IgA
relative to osmolality values were also lower in females, which seems to suggest a lower level
of mucosal immunity in females compared with males within this cohort of swimmers.
The reasons for the observed gender differences are unknown at present. It is known that sex
hormones play a role in modulating certain aspects of immune function at rest (Timmons et
al., 2005). However, Burrows et al. (2002) found no differences in mucosal immune status in
female endurance athletes over three consecutive menstrual cycles. Moreover, no relationship
was found between s-IgA concentration and progesterone levels. It is possible that the
118
-------- --- --
Chapter 7 S-IgA, URTI and training in athletes
absolute training status of the swimmers (men being faster than women) may have influenced
the results, since Francis et al. (2005) reported increased values of s-IgA concentration in
higher trained athletes compared with moderately trained athletes. On the other hand, the
differences may be related to the relative training load performed. Although the training
intensity was different and relative to each individual based on personal best times and
maximum heart rates, the absolute volume performed was similar. Since immune function is
affected by high volumes of training (Nieman, 2000), it is possible that this volume of
training placed a higher demand on the female athlete, resulting in an increased physiological
and/or psychological stress which may in tum impact negatively on s-IgA. Future
investigations designed to measure the levels of stress (quantitatively or qualitatively) during
a training period may provide more of an insight into this idea since negative associations
between the levels of stress hormones and s-IgA have been previously found (Hucklebridge
et al., 1998). One important point arising from these findings is that such differences should
be considered if normative levels for the prediction of infection risk in elite athletes are to be
established. The importance of this finding in terms of infection risk cannot be determined
from such a small sample size and although the females did report a higher number of
reported URTI episodes on average, this difference was not significant.
A negative association between s-IgA levels and URTI symptoms has been previously
established in elite swimmers (Gleeson et al., 1999; Tharp and Barnes, 1990) and American
footballers (Fahlman and Engels, 2005). However, others have been unable to find an
association (Gleeson et al., 2000; Nehlsen-Carmarella et al., 2000; Novas, 2003), and the
results from the present study corroborate this. The failure to link perturbations in immune
function to infection incidence following heavy training and/or competition may largely be
due to the difficulty of measuring immunity in groups of athletes large enough to have
sufficient statistical power to detect an effect. This is something that is often outside of the
119
Chapter 7 S-IgA, URTI and training in athletes
control of the researcher. During the study period, the highest number of URTI symptoms
was reported in the middle of the training period following the first competition. This
occurred two weeks after the lowest values in s-IgA secretion were recorded. Since s-IgA
was not measured in the week in between these two time points, one cannot exclude the
possibility that the levels of s-IgA may have remained low or dropped even further during
this time leading to an increased susceptibility of URTI as was observed. Mackinnon et al.
(l993b) found that lower levels of s-IgA preceded infection by 48 h and this highlights the
necessity of regular sampling if a direct link between these two factors is to be established.
Although s-IgA secretion rate tended to be lower following periods of intense training,
without a control group, it is difficult to ascertain whether these levels were below a critical
'healthy' level, which would subsequently leave them more susceptible to URTI. Moreover,
every attempt was made to accurately classify symptoms of URTI by questionnaire, however,
viral load was not measured directly and hence, one cannot be certain that the reported
symptoms were entirely representative of an infectious challenge.
Although a significantly lower s-IgA secretion rate was found prior to the Commonwealth
Games compared with afterwards, only one swimmer reported an episode ofURTI during the
meet. This may indicate that the levels recorded as a group were not at a critical level, which
would leave them more susceptible to illness. This can be reassuring for the coaches since
URTI has been shown to have a negative impact on performance (Pyne et al., 2001).
In summary, the present data demonstrate that s-IgA secretion rate tends to be lower after a
period of high intensity training leading up to competition and recovers post-competition.
However, s-IgA concentration and s-IgA to osmolality ratio remain unaffected. Females
exhibit lower values of saliva flow rate, osmolality, s-IgA concentration and secretion rate at
rest compared with males but their response to the training stimulus appears to be the same.
120
Chapter 7 s-IgA, URTI and training in athletes
Reported symptoms of respiratory illness were highest during week 8 of the study - following
the period when s-IgA secretion rate was lowest; but the initial baseline values of s-IgA
secretion rate did not directly predict the number of infections for each individual swimmer.
121
Chapter 8 General Discussion
Chapter 8 - General Discussion
Despite the abundance of research conducted into the effect of exercise on mucosal immunity
the consensus remains unclear. Much of the inconsistencies arise from the design of the
protocols, the participants studied and their nutritional status, and methodological and
analytical differences. The purpose of this thesis was to address some of these factors and to
investigate potential methods of enhancing the immune response to exercise.
8.1. Nutritional status
Gleeson and colleagues reported that the nutritional status of an individual can affect resting
s-IgA levels with fasting saliva yielding higher and more variable s-IgA concentrations than
non-fasting saliva (Gleeson et al., 1990; Gleeson et al., 2oo4a). This was examined further in
this thesis where firstly the effects of a fed or fasted state prior to exercise were compared.
The results showed that the ingestion of a high CHO breakfast 2 h before exercise had no
effect on saliva flow rate, s-IgA concentration and secretion rate and it was concluded that
exercise performed in either a fed or fasted state (of approximately 10 h) would have little
influence on the absolute levels or the response pattern of s-IgA. It was speculated that the
differences in the findings could be related to the timing of the meal and/or hydration status
of the individual. Thus, in Chapter 4 the influence of feeding versus fasting during exercise
on s-IgA was investigated; with the additional measurement of the salivary antimicrobial
proteins lysozyme and a-amylase. No significant effects of nutritional status on the s-IgA
response to exercise were found. In contrast, feeding the high CHO cereal bars during
exercise resulted in a significant increase in lysozyme and a-amylase compared with fasting.
Carbohydrate is known to blunt the cortisol response during exercise and appears to limit the
degree of immunodepression (Nieman, 2007). However, since higher values of cortisol in the
122
- - - - -------------
Chapter 8 General Discussion
fasted state compared with the fed state were only observed at the post -exhaustion time point,
it was unlikely that cortisol played a role in these immune responses. The salivary glands are
innervated by parasympathetic and sympathetic nerves (Chicharro et al., 1998), and it is
possible that the ingestion of cereal bars during exercise activates mechanical and/or
gustatory receptors leading to a reflex stimulation of protein secretion via the autonomic
nerves. Moreover, since higher values in lysozyme and a-amylase remained evident post
exhaustion, it suggests that these effects are relatively long lasting.
The design of the study was such that it prevented the effects of feeding on the salivary
responses to be separated from masticatory stimuli alone or in combination with gustatory
(flavoured) stimuli. Although both trials would have elicited a certain amount of gustatory
stimuli, the fact that the flavours were not identically matched, may have confounded the
responses. Thus, future research should attempt isolate these effects as well as from the
effects of CHO, to examine which may have the most potentially beneficial effects during
exercise.
8.2. Exercise and saliva flow rate
The results in this thesis show that an acute bout of exercise can differently affect the saliva
flow rate. In Chapter 3 a significant drop in the flow rate was observed with exercise which
recovered to baseline levels at 1 h post-exercise and these findings are consistent with many
studies (Bishop et ai., 2000; Li and Gleeson 2005; Sari-Sarraf et ai., 2007b; Walsh et al.,
2002). In contrast, saliva flow rate was unaffected by exercise in Chapters 4, 5 and 6, which
is in accordance with other studies (Bishop et al., 2000; Walsh et al., 2004).
123
Chapter 8 General Discussion
It has been previously demonstrated that dehydration has the greatest impact on saliva flow
rate during exercise (Walsh et al., 2004), which seems to occur after losses of -3% body
mass. However, in the present studies, body mass losses were small « 1.5%), indicating that
the participants consumed sufficient fluids to offset most of their body mass losses. This
suggests that the reduction in saliva flow rate observed in Chapter 3 was a result of changes
in autonomic nervous system activity and removal of parasympathetic vasodilatory
influences, rather than dehydration per se. Indeed, the saliva flow rate was at its lowest point
during exercise when parasympathetic nervous system activity would have been inhibited,
and this started to recover upon cessation of exercise when parasympathetic activity would
have returned.
The fact that saliva flow rate decreased in Chapter 3 and did not change in Chapters 4, 5 and
6 may be related to the different exercise intensities and durations employed between studies,
as well as the timing of the samples. This is evident as the largest drop in saliva flow rate was
found during the final 5 min of the 2 h bout of exercise at 65% V02mru<, rather than
immediately post-exercise when it started to recover (Chapter 3). This suggests that there
may be a threshold level and/or duration of parasympathetic innervation below which, saliva
flow rate decreases.
A further interesting finding was that salivary osmolality increased post-exercise without a
significant change in body mass (Chapters 3 and 6) or a change in saliva flow rate (Chapter
6). This suggests that in addition to the saliva flow rate, the autonomic nervous system exerts
a control on electrolyte secretion during exercise in the absence of dehydration. These results
contrast those by Bishop et al. (2000) and Walsh et al. (2004) where fluid intake (to match
pre-determined sweat losses in the latter study) prevented the decrease in saliva flow rate and
increase in osmolality. Such a finding may question the reliability of salivary osmolality as a
124

Chapter 8 General Discussion
marker of hydration status (or in relation to s-IgA concentration) post-exercise. Clearly, the
regulatory factors governing saliva flow rate during exercise remain controversial and further
research is warranted to examine these factors before a consensus can be drawn.
The maintenance of saliva flow rate during exercise is important since it has been suggested
to be the single salivary defensive factor that significantly affects oral health (Rantonen and
Meurman, 2000). The finding that individuals suffering from dry mouth syndrome have an
increased incidence of URTI (Fox et aI., 1985) supports this notion.
8.3. Acnte exercise and salivary antimicrobial proteins
The s-IgA response to acute exercise was fairly consistent across studies. The results showed
an increase in s-IgA concentration following exercise. Since s-IgA concentration is affected
by the saliva flow rate, it is generally thought that these increases represent a drying of the
mouth with dehydration rather than genuine alterations in the mucosal immune response.
Hence, this factor was accounted for by expressing s-IgA as a secretion rate (saliva flow rate
x concentration) and thus reflected the total amount of s-IgA available at the mucosal surface.
With the exception of Chapter 3, significant increases were found in the s-IgA secretion rate
post -exercise which returned to baseline levels at 1 h post -exercise. The increases in s-IgA
secretion rate can be explained by the increase in SNS activity during high intensity exercise
as this has been shown to increase the mobilisation of IgA into saliva by transcytosis (Proctor
et aI., 2003). S-IgA secretion rate did not change significantly in Chapter 4, although a
decrease of 25% during exercise compared with pre-exercise was observed. Furthermore, a
significant decrease in the s-IgA:osmolality ratio was found post-exercise. In this study,
significant decreases in the saliva flow rate occurred with exercise. Taken together these
results suggest that decreases in s-IgA secretion rate occurring with exercise are a result of
125
Chapter 8 General Discussion
the reduction in saliva flow rate rather than s-IgA secretion per se. However, when the saliva
flow rate is maintained (Chapters 5, 6 and 7); the secretion rate tends to increase.
Salivary lysozyme and a-amylase appeared to follow the same pattern as s-IgA. Increases
were consistently observed with exercise in both their concentration and secretion rate
(Chapters 5, 6 and 7). Although the regulatory mechanism(s) governing secretion of these
proteins is less clear, it is assumed that these changes are mediated in the same manner as s
IgA, resulting from increases in SNS activity with exercise (Carpenter et al., 1998).
Collectively, these findings suggest that an acute bout of exercise, with regular fluid ingestion
can result in a temporary enhancement of mucosal immune status. These findings challenge
previous reports of a depressed mucosal immunity following intense exercise (Fahlman et aI.,
2001; Mackinnon & Jenkins, 1993; Steerenberg et al., 1997; Tomasi et al., 1982) and
highlight the complexity of this measure of immunity in response to exercise.
8.4. Exercise intensity
The responses of antimicrobial proteins to exercise appear to be influenced by the exercise
intensity. This was initially demonstrated in Chapter 6 where s-IgA secretion rate showed
little change during the moderate exercise intensity (60% V02max), but increased by - 35%
following exercise at the higher intensity (75% V02"",,). These effects were examined in
more detail in Chapter 7. The results showed significant increases in both s-IgA and
lysozyme post-exercise following an incremental test to exhaustion, which returned to
baseline at 1 h post-exercise. Moreover, lysozyme was also elevated following exercise at
75% V02max, whereas s-IgA remained unchanged. The increases in salivary proteins
following the higher intensity trials reflect the elevated SNS activity, and also suggest that the
126

· Chapter 8 General Discussion
threshold of SNS activity to increase lysosyme may be lower than that for s-IgA. Taken
together, these findings suggest that mucosal immunity may be temporarily enhanced
following exercise at high intensities but does not change following more moderate short
duration exercise.
s.s. Stress markers
The regulation of mucosal immunity during exercise is thought to be influenced by the
release of stress hormones such as catecholamines and cortisol. The measurement of stress
hormones in saliva aims to provide an easy non-invasive measure of SNS activity and the
HP A axis activation without inducing further stress associated with blood drawing. Salivary
cortisol has been shown to correlate highly with circulating levels (Chicharro et aI., 1998);
however, catecholamines measured in saliva are regarded as less reliable (Kennedy et al.,
2001). Thus, this thesis measured a-amylase and salivary chromogranin A as surrogate
markers of SNS activity. In Chapter 7 these markers of adrenal activation were specifically
compared in response to short duration exercise at 3 different intensities. Alpha-amylase
activity and secretion rate increased with exercise but only the secretion rate was affected by
the intensity. However, both the concentration and secretion rate of chromogranin A was
significantly affected by the exercise intensity.
The increases in these stress markers occurred in relation to increases in lysozyme and s-IgA
and hence support the idea that the changes in salivary antimicrobial proteins during exercise
are mediated by changes in SNS activity. These findings also suggest that both the
concentration and secretion rate of chromogranin A warrant further investigation as potential
indexes of SNS activity during exercise, which should compare them to circulating levels of
blood catecholamines.
127
- - ------------
Chapter 8 General Discussion
Increases in cortisol with exercise occurred between 90 - 120 min after the onset of exercise
and at intensities of 65% Y02""" and above (chapters 4, 5, 6 and 7). This is not surprising
since the appearance of cortisol in the circulation is reported to occur after a lag-period that in
some cases may be more than I h (Viru and Viru, 2004), and following intensities above 60%
Y02ma,. Since the changes in salivary antimicrobial proteins occurred more rapidly, within
25 min of exercise (Chapters 5, 6 and 7), an involvement of the HPA axis in the regulation of
their secretion seems unlikely. However, the effects on s-IgA may be more delayed and occur
between 2 - 24 h following exercise (Mackinnon et al., 1987; Gleeson et al., 2001).
8.6. Chronic exercise and s-IgA
The present findings show that chronic exercise training and competition in a squad of elite
male and female swimmers can affect the s-IgA secretion rate but have little impact on the s
IgA concentration. Clear trends were found in the s-IgA secretion rate which was lower
following periods of intense training and higher post -competition. These findings are in
accordance to those reported by Fahlman and Engels (2005) who suggested that the s-IgA
secretion rate is the most useful clinical biomarker of immune status in athletes. However,
these findings are in contrast to the results following acute exercise presented in this thesis
where significant increases were observed post-exercise. As discussed previously, the
immediate effects of exercise on s-IgA are likely to be mediated by increased SNS activity
with exercise. However, stimulation of the HPA axis by exercise (the end product being
cortisol) may exhibit a more delayed response. Indeed, the synthetic glucocorticoid
dexamethasone has been shown to cause a decline in the mobilisation of s-IgA 24 h after a
single injection (Wira et al., 1990), and in the longer term cortisol may inhibit IgA synthesis
by B cells in the submucosa (Saxon et al., 1978). Thus, the lower levels in s-IgA secretion
128
Chapter 8 General Discussion
rate found following intensive training could be explained by a chronic elevation of cortisol
levels.
Although there was no significant correlation between s-IgA and URTI symptoms, it was
observed that the highest number of reported symptoms was preceded by the lowest s-IgA
secretion rate. The failure to link perturbations in s-IgA to URTI may be due to the limited
number of elite athletes in the squad, and is a major limitation in conducting research in this
group of individuals. Moreover, the differences between genders in the measurements would
also add to the variability making an association difficult to detect. Finally, the lack of control
group in this study prevents us from ascertaining whether the changes were a result of the
exercise training or simply reflecting a seasonal variation. Nevertheless, the results lend some
support to a chronic effect of exercise training on mucosal immunity and highlight the need
for further well-controlled studies that should look to examine other salivary antimicrobial
proteins.
8.7. Gender differences
Significant gender differences in s-IgA, males being higher than females, in the general
population have been previously reported (Evans et aI., 2000). Furthermore, lower s-IgA
concentrations in females compared with males were observed in elite swimmers at rest
(Gleeson et al., 1999). Thus, in both Chapters 4 and 8 a female group was incorporated into
the study design. The results showed significantly lower levels of s-IgA concentration,
secretion rate and osmolality in females compared with males (Chapters 3 and 7). In addition,
in Chapter 7 the saliva flow rate was also found to be lower in females. Although these
differences were apparent at rest, they did not appear to influence the salivary responses to
exercise, or exercise training.
129

Chapter 8 General Discussion
The precise reason for these gender differences is unknown at present. Sex hormones appear
play an important role in some aspects of the immune function (Timmons et aI., 2005),
however, their significance in modulating mucosal immunity is less certain (Burrows et al.,
2002). Other possible explanations may include the absolute training status (Francis et al.,
2005), training volume (Nieman, 2000) and nutritional status (Chandra, 1997; Gleeson et al.,
2004b). Despite the uncertainty surrounding these mechanisms, such a finding is of practical
importance since it may have implications on the future design of studies, and should be
considered if clinically normal ranges are to be identified. Moreover, whether these findings
are important in infection risk needs to be evaluated since they contrast with reports that
women are generally more resistant to viral infections than men (Beery, 2003).
8.8. Stimulating saliva flow
Stimulating saliva flow either by eating food or chewing flavoured gum during exercise was
shown to enhance certain aspects of mucosal immunity (Chapters 5 and 6). In Chapter 5 it
was demonstrated that eating a commercially available cereal bar every 60 min during
exercise increased the secretion of lysozyme and a-amylase into saliva but did not affect s
IgA. These findings were extended in Chapter 6 where it was shown that chewing flavoured
gum during exercise enhanced lysozyme and a-amylase secretion rates but resulted in a small
reduction in the s-IgA secretion rate.
Eating food and/or chewing gum causes the activation of masticatory and gustatory receptors
which initiates a reflex stimulation of protein secretion via the autonomic nerves (Pedersen et
al., 2002). The fact that lysozyme and a-amylase were affected but s-IgA showed little or no
change may depend on their different secretory pathways. Lysozyme and a-amylase are
130
Chapter 8 General Discussion
stored in membrane secretory granules and are released spontaneously upon neuronal
stimulation (Bosch et aI., 2002). However, s-IgA is secreted onto mucosal surfaces via
transport across the epithelial cells by the polymeric Ig receptor, which is activated by
neuronal stimuli that may differ to those of other salivary proteins (Proctor and Carpenter
2001).
In addition, the increase in lysozyme and a-amylase by chewing may be explained by the
increase in salivary secretion from specific glands. For example, mastication particularly
activates the parotid glands which produce large amounts of a-amylase, whereas strong taste
stimuli activate the submandibular and sublingual glands from which lysozyme is mainly
produced.
As with Chapter 4, a limitation of these findings is that it is not possible to distinguish
whether the differences between stimulated and unstimulated saliva flow were due to
masticatory or gustatory stimuli alone or in combination. In order to separate these
mechanisms, it would be interesting to compare the effects of chewing flavoured gum
compared with chewing tasteless polythene tube on the salivary responses to exercise.
The finding of an increase in the secretion rates of lysozyme and a-amylase with exercise
which is further enhanced by stimulating saliva flow suggests these factors have a beneficial
effect on the oral immune system. At present, there have been no studies that have directly
related the levels of these proteins in saliva to a reduced risk of URTI and given the present
findings, this may be of interest.
131
Chapter 8 General Discussion
8.9. Conclusions
The main conclusions arising from this thesis are:
1) The prior nutritional status (fed versus fasted) of an individual does not affect resting
s-IgA levels or the s-IgA response to prolonged exercise.
2) Ingestion of cereal bars during exercise can increase the secretion of lysozyme and a
amylase into saliva but does not affect s-IgA.
3) Stimulating saliva production during exercise by chewing flavoured gum enhances
lysozyme and a-amylase secretion but results in a small decrease in s-IgA secretion.
4) The responses of salivary antimicrobial proteins to exercise are affected by the
relative exercise intensity. S-IgA secretion increases following short-duration
incremental exhaustive exercise but remains unchanged following exercise at 75%
and 50% VO,""". Lysozyme increases following exercise at both 75% V02""" and to
exhaustion. These responses appear to be associated with increases in SNS activation
but not cortisol.
5) S-IgA secretion rate is affected by chronic exercise training resulting in lower values
prior to competition compared with post-competition, whereas s-IgA concentration
and s-IgA to osmolality remain unchanged. S-IgA secretion rate does no appear to be
directly linked to reported symptoms of URTI.
6) Females exhibit lower values of saliva flow rate, osmolality, s-IgA concentration and
secretion rate at rest but this does not affect the response to an acute bout of exercise
or chronic exercise training.
132
References
Aps J. K., Martens L. C. (2005). Review: The physiology of saliva and transfer of drugs into
saliva. Forensic Science International, 150: 119-31.
Asking, B. and Proctor, G. B. (1989). Parasympathetic activation of amylase secretion in the
intact and sympathetically denervated rate parotid gland. Quarterly Journal of Experimental
Physiology, 74: 45-52.
Banks, P. and Helle, K. B. (1965). The release of protein from the stimulated adrenal
medulla. Biochemical Journal, 97: 40C-4IC.
Barrett, B. Locken, K., Maberry, R, Schwamman, J, Brown, R. Bobula, J. and Stauffacher,
E. A. (2002). The wisconsin Upper Respiratory Symptom Survey (WURSS): a new research
instrument for assessing the common cold. The Journal of Family Practice, 51: 265-273.
Beery, T. A. (2003). Sex differences in infection and sepsis. Critical care nursing clinics of
North America, 15: 55-62.
Bishop, N. C., Blannin, A. K., Armstrong, E., Rickman, M. and Gleeson, M. (2000).
Carbohydrate and fluid intake affect the saliva flow rate and JgA response to cycling.
Medicine and Science in Sports and Exercise, 32: 2046-2051.
Bishop, N. C., Walker, G. 1., Scanlon, G. A., Richards, S. and Rogers, E. (2006). Salivary
IgA responses to prolonged intensive exercise following caffeine ingestion. Medicine and
Science in Sports and Exercise, 38: 5l3-519.
l33
Biannin, A K., Robson, P. l., Walsh, N. P., Clark, AM., GIennon, L. and Gleeson, M.
(1998). The effect of exercising to exhaustion at difficult intensities on saliva
immunoglobulin A, protein and electrolyte secretion. International Journal of Sports
Medicine, 19: 547-552.
Bosch l. A, de Geus E. l., Veerrnan E. C., Hoogstraten l. and Nieuw Amerongen A. V.
(2003). Innate secretory immunity in response to laboratory stressors that evoke distinct
patterns of cardiac autonomic activity. Psychosomatic Medicine, 65: 245-58.
Bosch, l.A, Ring, c., Geus, E. 1. C., Veerrnan, E. C. I. and Nieuw Amerogen, A. V. (2002)
Stress and secretory immunity. International Review of Neurobiology, 52: 213-253.
Brandtzeag, P. (1976). Synthesis and secretion of secretory immunoglobulins: with special
reference to dental diseases. Journal of Dental Research, 55: C102-114.
Burrows M., Bird S. R and Bishop N. (2002). The menstrual cycle and its effect on the
immune status of female endurance runners. Journal of Sports Sciences, 20: 339-344.
Carpenter, G. H., Garrett, J. R, Hartley, R H. and Proctor, G. B. (1998). The influence of
nerves on the secretion of immunoglobulin A into submandibular saliva in rats. Journal of
Physiology, 512: 567-573.
Carpenter, G. H., Proctor, G.B., Andersen, L.C., Zhang, X. S. and Garrett, 1. R (2000).
Immunoglobulin A secretion into saliva during dual sympathetic and parasympathetic nerve
stimulation of rat submandibular glands. Experimental Physiology, 85: 281-286.
134
Carpenter, G. H., Proctor, G. B., Ebersole, L. E. and Garrett, 1. R (2004). Secretion of IgA by
rat parotid and submandibular cells in response to autonomimetic stimulation in vitro.
International Immunopharmacology, 4: 1005-1014.
Chandra R K. (1997). Nutrition and the immune system: an introduction. The American
Journal of Clinical Nutrition, 66: 460S-463S.
Chatterton, R. T., Vogelsong, K. M., Lu, Y. C., Ellmen, A. B. and Hudgens, G. A. (1996).
Salivary alpha-amylase as a measure of endogenous adrenergic activity. Clinical Physiology,
1: 433-448.
Chicharro, J. L., Lucia, A., Perez, M., Vaquero, A. and Urena, R (1998). Saliva composition
and Exercise. Sports Medicine, 26: 17-27.
Clancy, R, Pang, G., Dunkley, M., Taylor, D. and Cripps, A. (1995). Acute on chronic
bronchitis: A model of mucosal immunology. Immunology and Cell Biology, 73: 414 - 417.
Cole, A. S. and Eastoe, J. E. (1988). Biochemistry and Oral Biology. 2nd edition, pp. 476-477.
London: Wright.
Costa R J., Jones G. E., Lamb K. L., Coleman R. and Williams 1. H. (2005). The effects of a
high carbohydrate diet on cortisol and salivary immunoglobulin A (s-IgA) during a period of
increase exercise workload amongst Olympic and Ironman triathletes. International Journal
of Sports Medicine. 26: 880-5.
135

Crawford, J.M., Taubman, M.A. & Smith, DJ. (1975). Minor salivary glands as a major
source of secretory immunoglobulin A in the human oral cavity. Science, 190: 1206-1209.
Crooks, C V.m Wall, C. R., Cross, M. L. and Rutherfurd-Markwick K. J. (2006). The effect
of bovine colostrum supplementation on salivary IgA in distance runners. International
Journal of Sports Nutrition and Exercise Metabolism, 16: 47-64.
Davis, J. M., Kohut, M. L., Colbert, L. H., Jackson, D. A., Chaffar, A. and Mayer, E. P.
(1997). Exercise, alveolar macrophage function, and susceptibility to respiratory infection.
Journal of Applied Physiology, 83:1461-1466.
Dawes, C. (1974). Rhythms in salivary flow rate and composition. International Journal of
Chronobiology, 2: 253-79.
Dawes, C. (1981). The effects of exercise on protein and electrolyte secretion in parotid
saliva. Journal of Physiology, 320: 139-148.
Deinzer R. and Schiiller N. (1998). Dynamics of stress-related decrease of salivary
immunoglobulin A (sIgA): relationship to symptoms of the common cold and studying
behavior. Behavioral Medicine, 23: 161-169.
Dorrington, L., Gleeson, M. and Callister, R. (2003). Effect of exercise intensity on salivary
IgA in children. Journal of Science and Medicine in Sport, 6: 46 [Abstract].
Edgar, W.M. (1990). Saliva and dental health. Clinical implications of saliva: report of a
consensus meeting. British Dental Journal, 169:96-8.
136
Ekblom B, Ekblom 0, Maim C. (2006). Infectious episodes before and after a marathon race.
Scandinavian Journal of Medicine & Science in Sports, 16: 287-93.
Engels, HJ., Fahlman, M. M. and Wirth, 1. C. (2003). Effects of ginseng on secretory IgA,
performance, and recovery from interval exercise. Medicine and Science in Sports and
Exercise, 35: 690-696.
Evans, P., Derm G., Ford, G., Hucklebrideg, F., Hunt, K and Lambert, S. (2000). Social
Class, Sex, Age Differences in Mucosal Immunity in a Large Community Sample. Brain
Behaviour and Immunity, 14: 41-48.
Fahlman, M. M. and Engels, H. J. (2005). Mucosal IgA and URTI in American Collage
Football Players: A Year Longitudinal Study. Medicine and Science in Sports and Exercise,
37: 374-380.
Fahlman, M. M., Engels, H. J., Morgan, A. L. and Kolokouri, S. (2001). Mucosal IgA
response to repeated wingate tests in females. International Journal of Sports Medicine, 22:
127-131.
Fleshner, M. (2000). Exercise and neuroendocrine regulation of antibody production:
protective effect of physical activity on stress-induced suppression of the specific antibody
response. International Journal of Sports Medicine, 21: SI4-19.
137
Ford, J., N. Trevatt, C. A. Dix, and J. L. FaIlowfield. (1997). The effect of fluid replacement
and heat on salivary flow rate and optical density at 280 nm in response to exercise. Journal
of Sports Science, 15: 49-50.
Fox, P. c., Van der Ven, P. F., Sonies, B. C., Weiffenbach, J. M. and Baum, B. J. (1985).
Xerostomia evaluation of a symptom with increasing significance. Journal of American
Dietetic Association, 110: 519-525.
Francis, J. L., Gleeson, M., Pyne, D. B., Callister, R. and Clancy, Robert (2005). Medicine
and Science in Sport and Exercise, 37: 571-578.
Frayn, K. N. (1983). Calculations of substrate oxidation rates in vivo from gaseous exchange.
Journal of Applied Physiology, 55: 628-634.
Garrett J. R. (1987) The proper role pf nerves in salivary secretion: A review. Journal of
Dental Research, 66: 387-397.
Gleeson, M. (2006). Introduction to the immune system. In Gleeson, M. (2006). Immune
Function in Sport and Exercise, pp 15-43. Edinburgh: Churchill Livingstone.
Gleeson, M. (2007). Immune function in sport and exercise Journal of Applied Physiology,
103: 693-699.
Gleeson, M. G. and Bishop, N. C. (2000) Elite Athlete Immunology: Importance of Nutrition.
International Journal of Sports Medicine, 21: S44-S50.
138

Gleeson, M., Bishop, N. C., Sterne, V. L. and Hawkins, A. J. (2001). Diurnal variation in
saliva immunoglobulin A concentration and the effect of a previous day of heavy exercise.
Medicine and Science in Sports and Exercise, 33: Supplement, ISEI abstract 54.
Gleeson, M., Crampton, B., Strachan, S., Mundel, T. & Till, L. (2003b). Effect of high-
intensity exercise on stimulated and unstimulated human salivary immunoglobulin A
secretion, (abstract). Journal of Physiology, 547P PC6.
Gleeson, M., Cripps, A. W., Clancy, R. L. and Geraghty, S. B. (1990). The variability of
immunoglobulins and albumin in saliva of normal and IgA-deficient adults. In: Advances in
Mucosal Immunology. T. T. Mcdonald (Ed.) Lancaster UK: Kluwer Academic Publishers,
pp. 500-501.
Gleeson M., McDonald, W.A., Cripps, A.W., Pyne, D. B., Clancy, R. L. and Fricker, P. A.
(1995) The effect on immunity of long-term intensive training in elite swimmers. Clinical
Experimental Immunology, 102: 210-216.
Gleeson, M., W. A. McDonald, D. B. Pyne, Clancy, R. L., Cripps, A.W., Francis, J. L. and
Fricker, P. A. (2000) Immune Status and Respiratory Illness for Elite Swimmers During a 12-
Week Training Cycle. International Journal of Sports Medicine. 21: 302-307.
Gleeson, M., W. A. McDonald, D. B. Pyne, A. W. Cripps, J. L. Francis, P. A. Fricker, and R.
L. Clancy. (1999). Salivary IgA levels and infection risk in elite swimmers. Medicine and
Science in Sports and exercise, 31: 67-73.
139 i --
Gleeson, M., Nieman, D. C. and Pedersen, B. K. (2004b). Exercise, nutrition and immune
function. Journal of Sports Sciences, 22: 115-125.
Gleeson, M. and Pyne, D. B. (2000). Exercise effects on mucosal immunity. Immunology and
Cell Biology, 78: 536-544.
Gleeson, M. G., Pyne, D. B. and Callister, R. (2003a). Exercise effects on mucosal immunity
and risk of upper respiratory illness. International Sportmedicine Journal, 4: 1-14.
Gleeson, M. G., Pyne, D. B. and Callister, R (2004a). The missing links in exercise effects on
mucosal immunity. Exercise Immunology Review, 10: 107-128.
Gomez, F. E., Villegas, 1. and Bourges, H. (1991). An enzyme-linked immunosorbent assay
for human secretory immunoglobulin A in parotid saliva. La Revista de Investigacion
Clinica, 43: 351-358.
Goodrich, M. E. and McGee, D. W. (1998). Regulation of mucosal B cell immunoglobulin
secretion by intestinal epithelial cell-derived cytokines. Cytokine, 10: 948-955.
Graham, N. M. (1990). The epidemiology of acute respiratory infections in children and
adults: a global perspective. Epidemiologic Reviews, 12: 149-78.
Hall, H., Fahlman, M. M. and Engels, H. 1. (2007) Echinacea purpurea and mucosal
immunity. International Journal of Sports Medicine, 28: 792-797.
140
--------- - -------------------
Hanson, L. A., Bjorkander, 1. and Oxelius, V. A. (1983). Selective IgA deficiency. In
Primary and Secondary Immunodeficiency Disorders. (edited by R. K. Chandra), pp. 62-64.
Edinburgh: Churchill Livingstone.
Hector, M. P. and Linden, R. W. A. (1999). Reflexes of salivary secretion. In "Neural
Mechanisms of Salivary Gland Secretion" (1. R. Garrett, 1. Ekstrom and L. C. Anderson,
eds.). Frontiers in Oral Biology, Volume 11, Chapter 12 pp. 196-218. Karger, Basel.
Horswill C. A., Stofan 1. R., Horn M. K., Eddy D. E. and Murray R. (2006). Effect of
exercise and fluid consumption on salivary flow and pH. International Journal of Sports
Medicine, 27: 500-504.
Hucklebridge, F., Clow, A. and Evans, P. (1998). The relationship between salivary secretory
immunoglobulin A and cortisol: neuroendocrine response to awakening and the diurnal cycle.
International Journal of Psychophysiology, 31: 69-76.
Humphrey, S. P. and Williamson, R. P. (2001). A review of saliva: normal composition,
flow, and function. The Journal of Prosthetic Dentistry, 85: 162-169.
Inoue, H., Ono, K., Masuda, W., Morimoto, Y., Tanaka, T., Yokota, M and Inenaga, K.
(2006). Gender difference in unstimulated whole saliva flow rate and salivary gland sizes.
Archives of Oral Biology, 51: 1055-1060.
lolles, P and 10Jles 1. (1982). What is new in lysozyme research? Molecular and Cellular
Biochemistry, 63: 165-189.
141
Jemmott. J. B. and Magloire, K. (1988). Academic stress, social support, and secretory
immunoglobulin A. Journal of Personality and Social Psychology, 55: 803-10.
Jemmott. J. B. and McClelland, D. c., (1989). Secretory IgA as a measure of resistance to
infectious disease: comments on Stone, Cox, Valdimarsdottir, and Neale. Behavioral
Medicine, 15: 63-71.
Kavanagh, D. A., O'Mullane, D. M., Smeeton, N. (1998). Variation of salivary flow rate in
adolescents. Archives of Oral Biology, 43: 347-352.
Kennedy, B., Dillon, E., Mills, P. J. and Ziegler, M. G. (2001). Catecholamines in human
saliva. Life Sciences, 25: 87-99.
Klentrou K., Cieslak, T., MacNeil, M., Vintinner, A., and Plyley, M. (2002). Effect of
moderate exercise on salivary immunoglobulin A and infection risk in humans. European
Journal of Applied Physiology, 87: 153-158.
Koutedakis, Y., Sabin, E. and Perera, S. (1996). Modulation of salivary lysozyme by training
in elite male swimmers. Journal of Sports Sciences, 14: 90 [Abstract].
Krieger J. W., Crowe M. and Blank S. E. (2004). Chronic glutamine supplementation
increases nasal but not salivary IgA during 9 days of interval training. Journal of Applied
Physiology, 97: 585-591.
142
Laing, S. J., Gwynne, D., Blackwell, J., Williams, M., Waiters, R. and Walsh, N. P. (2005).
Salivary IgA response to prolonged exercise in a hot environment in trained cyclists.
European Journal of Applied Physiology, 93: 665-671.
Lamm, M. E. (1998). Current concepts in mucosal immunity IV. How epithelial transport of
IgA antibodies relates to host defense. American Journal of Physiology, 274: 614-617.
Li, T. L. and Gleeson, M. (2004). The effect of single and repeated bouts of prolonged
cycling and circadian variation on saliva flow rate, immunoglobulin A and a-amylase
responses. Journal of Sports Sciences, 22: 1015-lO24.
Li, T -L. and Gleeson, M. (2005). The effects of carbohydrate supplementation during
repeated bouts of prolonged exercise on saliva flow rate and immunoglobulin A. Journal of
Sports Sciences, 23: 713-722.
Ljungberg, G., Ericson, T., Ekbolm, B. and Birkhed, D. (1997). Saliva and marathon running.
Scandinavian Journal of Medicine and Science in Sports, 7: 214-219.
Lugardon K., Raffner R., Goumon Y., Corti A., Delmas A., Bulet P. et aI., (2000).
Antibacterial and antifungal activities of vasostatin-l, the N-terminal fragment of
chromogranin A. Journal of Biological Chemistry, 275: lO745-lO753.
Mackinnon, L. T. (1999). Exercise and Humoral Immunity. In Advances in Exercise
Immunology, pp. 159-200. Champaign, IL: Human Kinetics.
143
Mackinnon, L. T. (2000). Chronic exercise training effects on immune function. Medicine
and Science in Sports and Exercise, 32: S369-S376.
Mackinnon, L. T., Chick, T. W., Van, A. S. and Tomasi, T. B. (1987). The effect of exercise
on secretory and natural immunity. Advances in Experimental Medicine and Biology, 216A:
869-876.
Mackinnon, L. T., Chick, T. W., Van, A. S., and Tomasi, T. B. (1989). Decreased secretory
immunoglobulins following intense endurance exercise. Sports Training and Medical
Rehabilitation, 1: 209-218.
Mackinnon, L. T, Ginn, E., and Seymour, G. J. (1993a). Decreased salivary immunoglobulin
A secretion after intense interval exercise in elite kayakers. European Journal of Applied
Physiology, 67: 180-184.
Mackinnon, L. T, Ginn, E., and Seymour, G. J. (l993b). Temporal relationship between
exercise-induced decreases in salivary IgA and subsequent appearance of upper respiratory
tract infection in elite athletes. Australian Journal of Science and Medicine in Sport, 25:
SI79-S183.
Mackinnon, L. T., and Hooper, S. (1994). Mucosal (secretory) immune system responses to
exercise of varying intensity and during overtraining. International Journal of Sports
Medicine, 15: S179-S183.
Mackinnon, L. T. and Jenkins, D. G. (1993). Decreased salivary IgA after intense interval
exercise before and after training. Medicine and Science in Sports and Exercise, 25: 678-683.
144
Matthews C. E., Ockene 1. S., Freedson P. S., Rosal M. C., Merriam P. A and Hebert J. R.
(2002). Moderate to vigorous physical activity and risk of upper-respiratory tract infection.
Medicine and Science in Sports and Exercise, 34: 1242-1248.
McDowell S. L., Chaloa, K., Housh, T. J., Tharp, G. D. and Johnson, G. O. (1991) The effect
of exercise intensity and duration on salivary immunoglobulin A. European Journal of
Applied Physiology, 63: 108-111.
McDowell S. L., Hughes R. A., Hughes R. J., Housh D. J., Housh T. J. and Johnson G. O.
(1992). The effect of exhaustive exercise on salivary immunoglobulin A Journal of Sports
Medicine and Physical Fitness, 32: 412-415.
McMurray, R. G., Forsythe, W. A, Mar, M. H. and Hardy, C. J. (1987). Exercise intensity
related responses of beta-endorphin and catecholamines. Medicine and Science in Sports and
Exercise, 19: 570-574.
Michishige F., Kanno K., Yoshinaga S., Hinode D., Takehisa Y. and Yasuoka S. (2006).
Effect of saliva collection method on the concentration of protein components in saliva. The
Journal of Medical Investigation : JMI. 53: 140-146.
Nakane, H., Asami, 0., Yamada, Y., Harada, T., Matsui, N., Kanno, T. and Yanaihara, N.
(1998) Salivary chromogranin A as an index of psychosomatic stress response. Biomedical
Research, 19: 401-406.
145
Nater, U. M., La Marca, R, Florin, L., Moses, A., Langhans, W., Koller et al., (2006). Stress
induced changes in human salivary alpha-amylase activity - associations with adrenergic
activity. Psychomeuroendocrinology, 31: 49-58.
Navazesh, M. & Christensen, C.M. (1982). A comparison of whole mouth resting and
stimulated salivary measurement procedures. Journal of Dental Research, 61: 1158-1162.
Nehlsen-Cannaralla S. L., Nieman, D. c., Fagoaga, O. R, Kelln, W. J., Shannon, M., Davis,
J. M. (2000). Saliva immunoglobulins in elite women rowers. European Journal of Applied
Physiology, 81: 222-228.
Nieman, D. C. (1994). Exercise, upper respiratory tract infection, and the immune system.
Medicine and Science in Sports and Exercise, 26: 128-139.
Nieman, D. C. (2007). Marathon training and immune function. Sports Medicine, 37: 412-
415.
Nieman, D. c., Johanssen, L. M., Lee, J. W. and Arabatzis, K. (1990a) Infectious episodes in
runners before and after the Los Angeles Marathon. The Journal of Sports Medicine and
Physical Fitness, 30: 316-328.
Nieman, D. , Henson, D. A. , Fagoaga, O. R, Utter, A. c., Vinci, D. M., Davis, J. M.,
Nehlsen-Cannarella, S.L. (2002). Change in salivary IgA following a competitive marathon
race. International Journal of Sports Medicine, 23: 69-75.
146
Nieman D. C., Nehlsen-Cannarella S. L., Markoff P. A., Balk-Lamberton A. J., Yang H.,
Chritton D. B., Lee J. W. and Arabatzis K. (1990b). The effects of moderate exercise training
on natural killer cells and acute upper respiratory tract infections. International Journal of
Sports Medicine, 11: 467-473
Nieman, D. C. and Pedersen, B. K. (1999). Exercise and immune function Recent
developments. Sports Medicine, 27: 73-80.
Noble, RE. (2000). Salivary alpha-amylase and lysozyme levels: a non-invasive technique
for measuring parotid vs. submandibular/sublingual gland activity. (Abstract). Journal of
Oral Science, 42: 83-86.
Novas, A. M. P., Rowbottom, D. G., Jenkins, D. G. (2003). Tennis, Incidence of URTI
and Salivary IgA. International Journal of Sports Medicine. 24: 223-229.
Oliver S. J., Laing S. J., Wilson S., Bilzon J. L., WaIters R,and Walsh N. P. (2007). Salivary
immunoglobulin A response at rest and after exercise following a 48 h period of fluid and/or
energy restriction. British Journal of Nutrition, 97: 1109-1116.
Pedersen A. M., Bardow A., Jensen S. B. and Nauntofte B. (2002). Saliva and gastrointestinal
functions of taste, mastication, swallowing and digestion. Oral Diseases, 8: 117-29.
Palmer F. M., Nieman D. C., Henson D. A., McAnulty S. R, McAnulty L., Swick N. S.,
Utter A. c., Vinci D. M. and Morrow J. D. (2003). Influence of vitamin C supplementation
on oxidative and salivary IgA changes following an ultramarathon. European Journal of
Applied Physiology, 89: 100-107.
147
Perera, S., Uddin, M., and Hayes, 1. A. (1997). Salivary lysozyme: a non-invasive marker for
the study of the effects of stress on natural immunity. International Journal of Behavioral
Medicine, 4: 170-178.
Peters, E. M. (1997) Exercise, immunology and upper respiratory tract infections.
International Journal of Sports Medicine, 1: S69-77.
Peters, E. M. and Bateman, E. D. (1983). Ultramarathon running and upper respiratory tract
infections. South African Medical Journal, 64: 582-584.
Pilardeau, P. Richalet, 1. P. and Bouissou, P. (1990). Saliva flow and composition in humans
exposed to acute altitude hypoxia. European Journal of Applied Physiology, 59, 450-453.
Proctor, G. B. and Carpenter, G. H. (2001). Chewing stimulates secretion of human salivary
secretory immunoglobulin A. Journal of Dental Research, 80: 909-913.
Proctor, G. B. and Carpenter, G. H. (2007). Regulation of salivary gland function by
autonomic nerves. Autonomic Neuroscience,' basic & clinical, 30: 133: 3-18.
Proctor, G. B., Garrett, 1. R., Carpenter, G. H. and Ebersole, L. E. (2003). Salivary secretion
of immunoglobulin A by submandibular glands in response to autonomimetic infusions in
anaesthetised rats. Journal of Neuroimmunology, 136: 17-24.
148

Pyne, D. B., Gleeson, M., McDonald, W. A., Clancy, R. L., Perry, C. and Fricker, P. A.
(2000). Training strategies to maintain immunocompetence in athletes. International Journal
of Sports Medicine, 21: 551-560.
pyne, D. B., McDona1d, W. A., Gleeson, M., Flanagan, A., Clancy, R. L. and Fricker, P.A.
(2001). Mucosal immunity, respiratory illness, and competitive performance in elite
swimmers. Medicine and Science in Sports and Exercise, 33: 348-353.
Rantonen P. J. and Meurman J. H. (2000). Correlations between total protein, lysozyme,
immunoglobulins, amylase, and albumin in stimulated whole saliva during daytime. Acta
odontologica Scandinavica, 58: 160-165.
Reid, M. R., Drummond, P. D. and Mackinnon L. T. (2001). The effect of moderate aerobic
exercise and relaxation on secretory immunoglobulin A. International Journal of Sports
Medicine, 22: 132-137.
Rossen, R. D., Butler, W. T. and Wa1dman, R. H., (1970). The proteins in nasal secretions. 11.
A longitudinal study of IgA and neutralising antibody levels in nasal washings from men
infected with influenza virus. Journal of the American Medical Association, 211: 1157-1161.
Rudney, J.D. (1989). Relationships between human parotid saliva lysozyme, lactoferrin,
salivary peroxidase and sIgA in a large sample population. Archives of Oral Biology, 34:
499-506.
149

Sari-Sarraf V., Reilly T., Doran D. and Atkinson G. (2007a). The effects of single and
repeated bouts of soccer-specific exercise on salivary IgA. Archives of Oral Biology, 52: 526-
532.
Sari-Sarraf V., Reilly T., Doran D. and Atkinson G. (2007b). Effects of Repeated Bouts of
Soccer-Specific Intermittent Exercise on Salivary IgA. Archives of Oral Biology, 52: 526-
532.
Saxon, A., Stevens, RH., Ramer, S. J. and elements, P. J (1978). Glucocorticoids
Administered In Vivo Inhibit Suppressor T Lymphocyte Function and Diminish B
Lymphocyte Responsiveness in In Vitro Immunoglobulin Synthesis. The Journal of clinical
investigation, 61: 922-930.
Scannapieco, F. A., Solomon, L. and Wadenya. RO. (1994). Emergence in human dental
plaque and host distribution of amylase-binding streptococci. Journal of Dental Research, 73:
1627-1635.
Schwab K. 0., Heubel G., and Bartels, H. (1992) Free epinephrine, norepinephrine and
dopamine in saliva and plasma of healthy adults. European Journal of Clinical Chemistry
and Clinical Biochemistry: Journal of the Forum of European Clinical Chemistry Societies,
30: 541-544.
Shephard, R J. and Shek, P. N. (1997). Interactions between sleep, other body rhythms,
immune responses, and exercise. Canadian Journal of Applied Physiology, 22: 95-116.
150
Steerenberg, P. A, Van Asperen, I. A, Van Nieuw Amergongen, A, Biewenga, J., Mol, D.
And Medema, G. (1997). Salivary levels of immunoglobulin A in triathletes. European
Journal of Oral Science, 105: 305-309.
Strazdins L., Meyerkort S., BrentV., D'Souza R. M., Broom D. H. and Kyd J. M. (2005).
Impact of saliva collection methods on sIgA and cortisol assays and acceptability to
participants. Journal of Immunological Methods, 307: 167-171.
Strub, J. M., Gouman, Y., Lugardon, K., Capon, C., Lopez, M., Moniatte, M. et al., (1996).
Antibacterial activity of glycosylated and phosphorylated chromogranin A-derived peptide
from bovine adrenal medullary chromaffin granules. Journal of Biological Chemistry, 271:
173-194.
Taylor, D. C., Cripps A. Wand Clancy, R. L. A possible role for determining acute
exacerbation in chronic bronchitis (1995). Clinical and Experimental Immunology, 102: 406-
416.
Tenovuo J. (1998). Antimicrobial function of human saliva--how important is it for oral
health? Acta odontologica Scandinavica, 56: 250-256.
Tharp, G. D. (1991). Basketball exercise and secretory immunoglobulin A. European Journal
of Applied Physiology, 63: 312-314.
Tharp, G. D. and Bames, M. W. (1990). Reduction of saliva immunoglobulin levels by swim
training. European Journal of Applied Physiology, 60: 61-64.
151
Tiollier E., Gomez-Merino D., Burnat P., Jouanin J. C., Bourrilhon C., Filaire E., Guezennec
C. Y. and Chennaoui M. (2005). Intense training: mucosal immunity and incidence of
respiratory infections. European Journal of Applied Physiology, 93: 421-428.
Timmons, B. W., Hamadeh, M. J., Devries, M. C. and Tamopolsky, M. A. (2005) Influence
of gender, menstrual phase, and oral contraceptive use on immunological changes in response
to prolonged cycling. Journal of Applied Physiology, 99: 979-985.
Tomasi, T. B., Trudeau, F. B., Czerwinski, D. and Erredge, S. (1982). Immune parameters in
athletes before and after strenuous exercise. Journal of Clinical Immunology, 2: 173-178.
Viru, A. (1996). Postexercise recovery period: carbohydrate and protein metabolism.
Scandinavian Journal of Medicine and Science in Sports, 6: 2-14.
Viru, A. and Viru, M. (2004). Cortisol - an essential adaptation hormone in exercIse.
International Journal Sports Medicine, 25: 461-464.
Walsh, N. P., Bishop, N. c., Blackwell, J. B., Wierzbicki, S. G. and Montague, J. C. (2002).
Salivary IgA response to prolonged exercise in a cold environment in trained cyclists.
Medicine and Science in Sports and Exercise, 34: 1632-1637.
Walsh, N. P., Blannin, A. K., Clark, A. M., Cook, L., Robson, P. 1. and Gleeson, M. (1999).
The effects of high intensity intermittent exercise on saliva IgA, total protein and [alpha]
amylase. Journal of Sports Sciences, 17: 129-134.
152
Walsh, N. P., Laing, S. J., Oliver, S. 0., Montague, J. C., Waiters, R. and Bilzon, J. L. (2004).
Saliva parameters as potential indices of hydration status during acute dehydration. Medicine
and Science in Sports and Exercise, 36: 1535-1542.
West, N. P., Pyne, D. B., Renshaw, G. and Cripps, A. W. (2006). Antimicrobial peptides and
proteins, exercise and innate mucosal immunity. FEMS Immunology and Medical
Microbiology, 48: 293-304.
Whitham, M., Laing, S. J., Dorrimgton, M., Walters, R., Dunklin, S., Bland, D., Bilzon, J. L.
and Walsh, N. P. (2006) The influence of an arduous military training program on immune
function and upper respiratory tract infection incidence. Military Medicine, 171: 703-709.
Williams, N., Gleeson, M., Callister, R., Fitzgerald, P. E., Reid, V. L. and Clancy, R. L.
(2001). Effect of exercise intensity on mucosal immunity in competitive athletes suffering
fatigue and recurrent infections. Medicine and Science in Sports and Exercise, 33:
Supplement, ISEI abstract 50.
Williams, C. and Serratosa, L (2006). Nutrition on match day. Journal ojSports Sciences, 24:
687-697.
Wira, C. R. Sandoe, C. P. and Steele, M. G. (1990). Glucocorticoid regulation of the humoral
immune system. In vivo effects of dexamethasone on IgA and IgG in serum and at mucosal
surfaces. Journal oj Immunology, 144: 142-146.
153
Appendix A - Participant Consent Form
154
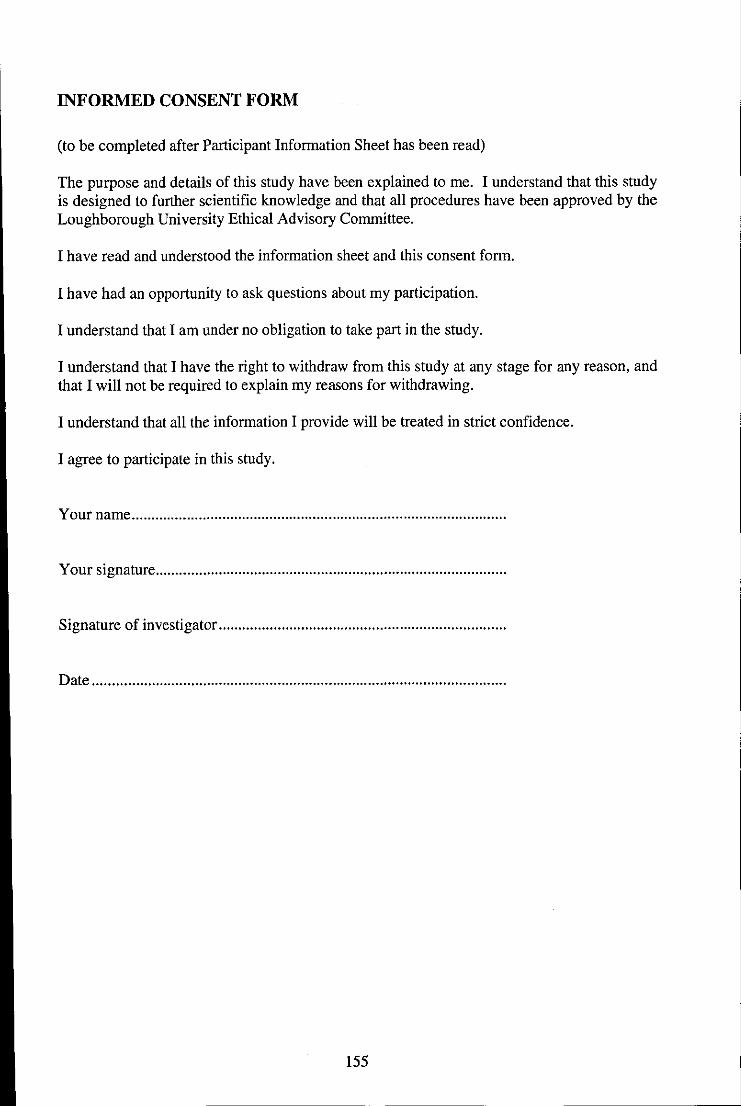
----------
INFORMED CONSENT FORM
(to be completed after Participant Information Sheet has been read)
The purpose and details of this study have been explained to me. I understand that this study is designed to further scientific knowledge and that all procedures have been approved by the Loughborough University Ethical Advisory Conunittee.
I have read and understood the information sheet and this consent form.
I have had an opportunity to ask questions about my participation.
I understand that I am under no obligation to take part in the study.
I understand that I have the right to withdraw from this study at any stage for any reason, and that I will not be required to explain my reasons for withdrawing.
I understand that all the information I provide will be treated in strict confidence.
I agree to participate in this study.
Your name .............................................................................................. .
Your signature ....................................................................................... ..
Signature of investigator ........................................................................ .
Date ........................................................................................................ .
155
Appendix B - Health Screening Questionnaire
156

HEALTH SCREEN FOR STUDY VOLUNTEERS
Name ................................................................................... .
It is important that volunteers participating in research studies are currently in good health and have had no significant medical problems in the past. This is to ensure (i) their own continuing well-being and (ii) to avoid the possibility of individual health issues confounding study outcomes.
Please complete this brief questionnaire to confirm fitness to participate:
l. At present, do you have any health problem for which you are:
(a) on medication, prescribed or otherwise YESD NOD
(b) attending your general practitioner YESD NOD
(c) on a hospital waiting list YESD NOD
2. In the past two years, have you had any illness which require you to:
(a) consult your GP YESD NOD
(b) attend a hospital outpatient department YESD NOD
(c) be admitted to hospital YESD NOD
3. Have you ever had any of the following:
(a) Convulsions/epilepsy YESD NOD
(b) Asthma YESD NOD
(c) Eczema YESD NOD
(d) Diabetes YESD NOD
(e) A blood disorder YESD NOD
(f) Head injury YESD NOD
(g) Digestive problems YESD NOD
(h) Heart problems YESD NOD
(i) Problems with bones or joints YESD NOD
157
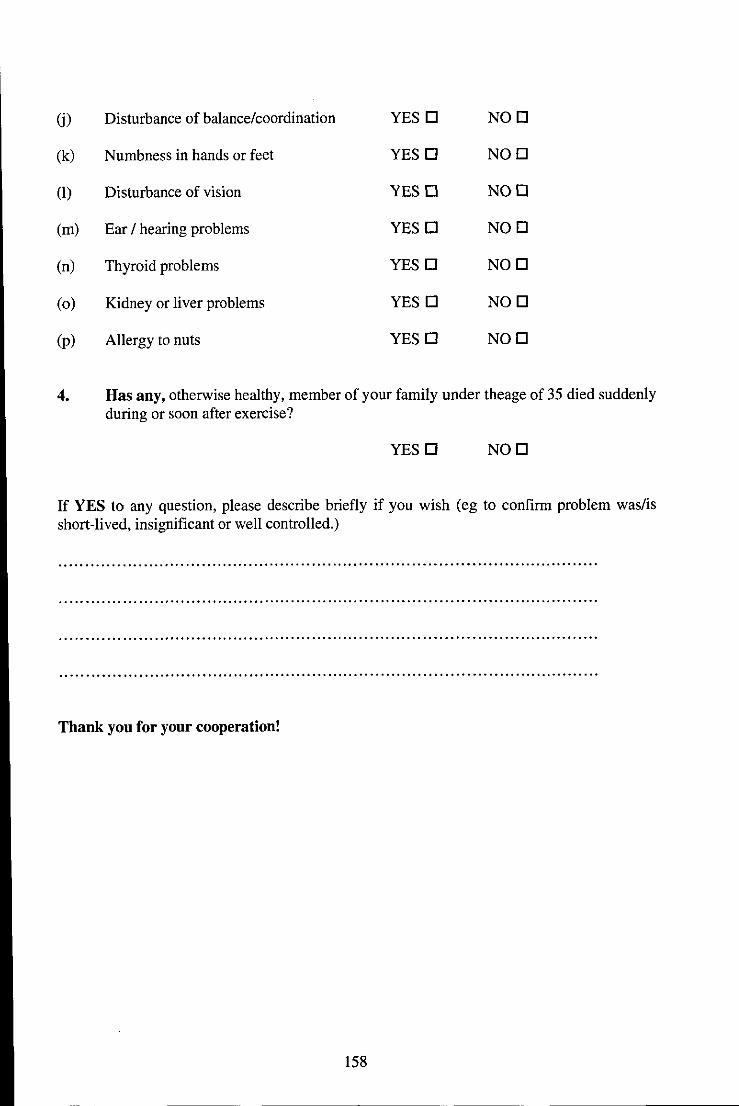
G) Disturbance of balance/coordination YESD NOD
(k) Numbness in hands or feet YESD NOD
(1) Disturbance of vision YESD NOD
(m) Ear / hearing problems YESD NOD
(n) Thyroid problems YESD NOD
(0) Kidney or liver problems YES D NOD
(p) Allergy to nuts YESD NOD
4. Has any, otherwise healthy, member of your family under theage of 35 died suddenly during or soon after exercise?
YESD NOD
If YES to any question, please describe briefly if you wish (eg to confirm problem was/is short-lived, insignificant or well controlled.)
......................................................................................................
......................................................................................................
......................................................................................................
Thank you for your cooperation!
158
Appendix C - Physical Activity Questionnaire
159
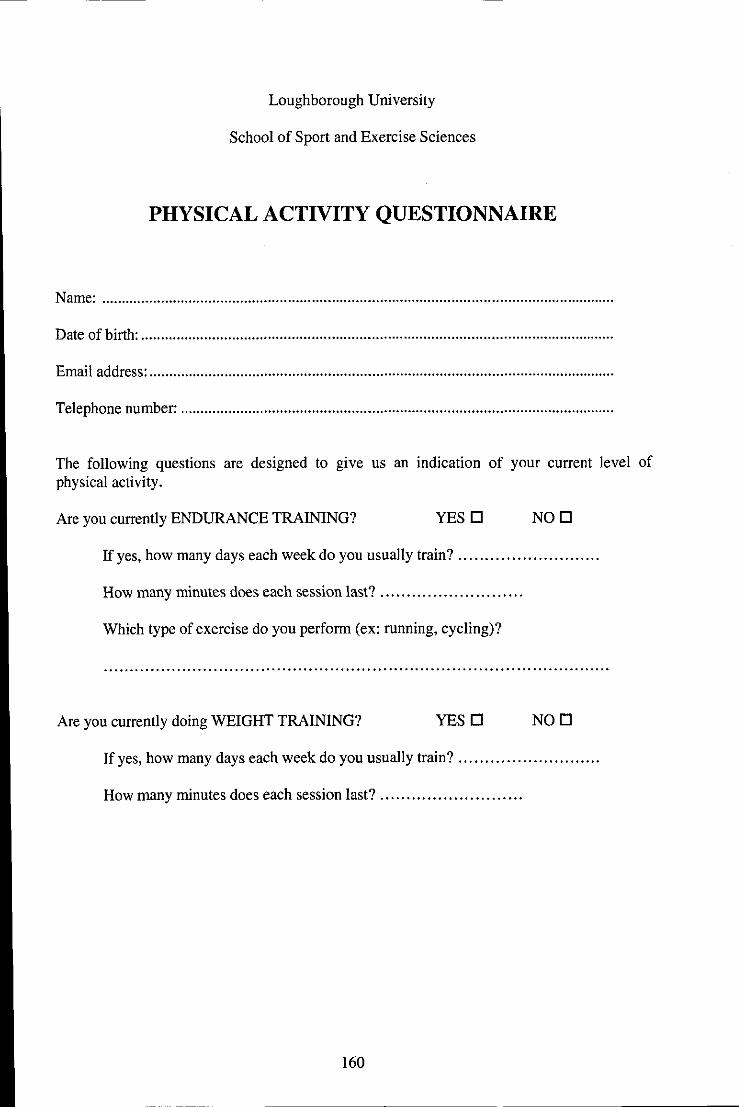
Loughborough University
School of Sport and Exercise Sciences
PHYSICAL ACTIVITY QUESTIONNAIRE
Name: ................................................................................................................................ .
Date of birth: ...................................................................................................................... .
Email address: .................................................................................................................... .
Telephone number: ............................................................................................................ .
The following questions are designed to give us an indication of your current level of physical activity.
Are you currently ENDURANCE TRAINING? YESD NOD
If yes, how many days each week do you usually train? .......................... .
How many minutes does each session last? .......................... .
Which type of exercise do you perform (ex: running, cycling)?
................................................................................................
Are you currently doing WEIGHT TRAINING? YESD NOD
If yes, how many days each week do you usually train? .......................... .
How many minutes does each session last? .......................... .
160
Appendix D - Health Qnestionnaire
161
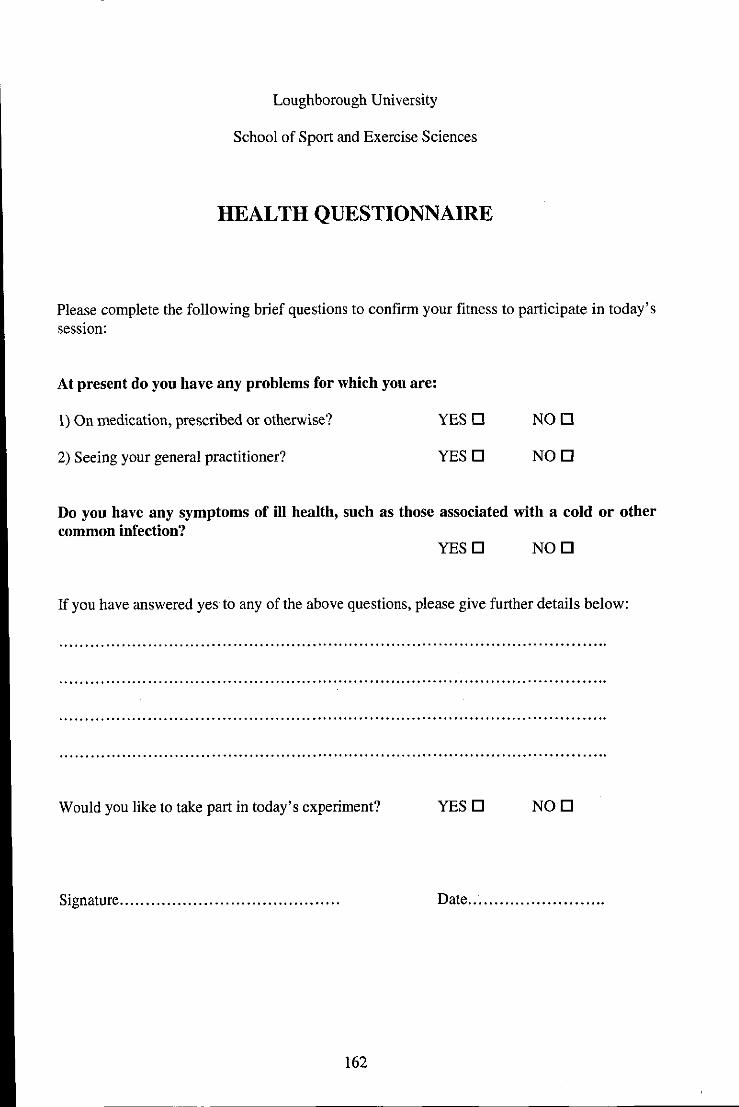
Loughborough University
School of Sport and Exercise Sciences
HEALTH QUESTIONNAIRE
Please complete the following brief questions to confirm your fitness to participate in today's session:
At present do you have any problems for which you are:
1) On medication, prescribed or otherwise? YESD NOD
2) Seeing your general practitioner? YESD NOD
Do you have any symptoms of ill health, such as those associated with a cold or other common infection?
YESD NOD
If you have answered yes to any of the above questions, please give further details below:
Would you like to take part in today's experiment? YESD NOD
Signature ......................................... . Date ......................... .
162
Appendix E - URTI Symptoms Questionnaire
163
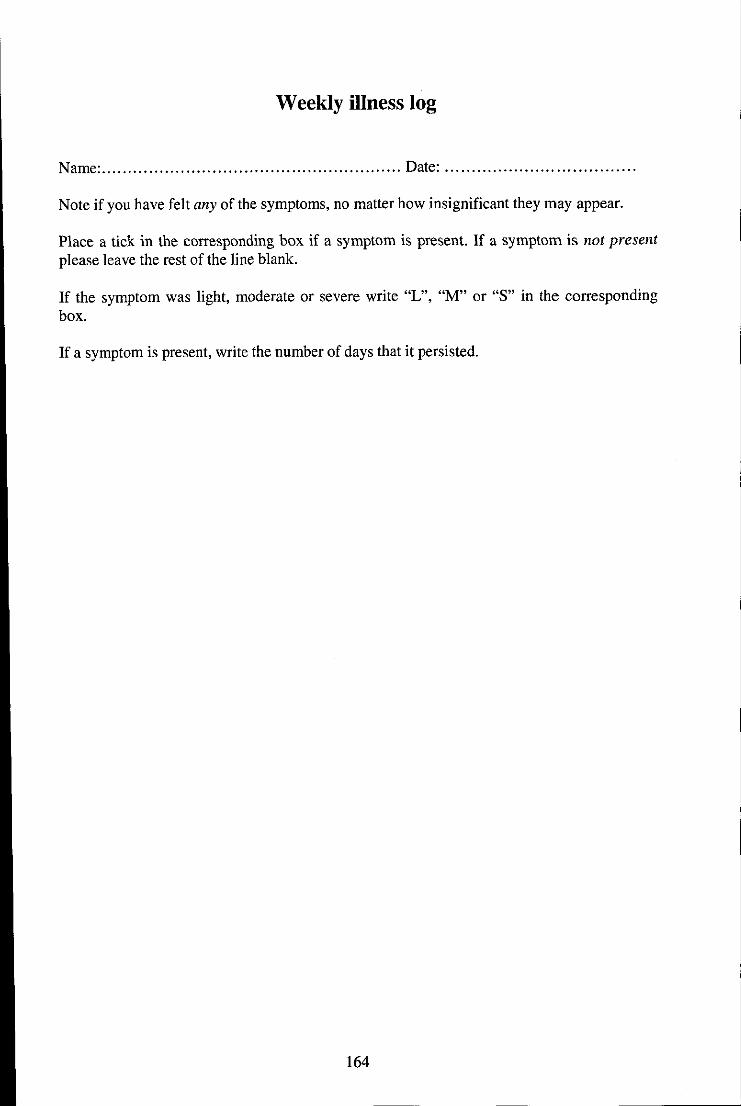
Weekly illness log
Name: ......................................................... Date: ................................... .
Note if you have felt any of the symptoms, no matter how insignificant they may appear.
Place a tick in the corresponding box if a symptom is present. If a symptom is not present please leave the rest of the line blank.
If the symptom was light, moderate or severe write "L", "M" or "S" in the corresponding box.
If a symptom is present, write the number of days that it persisted.
164
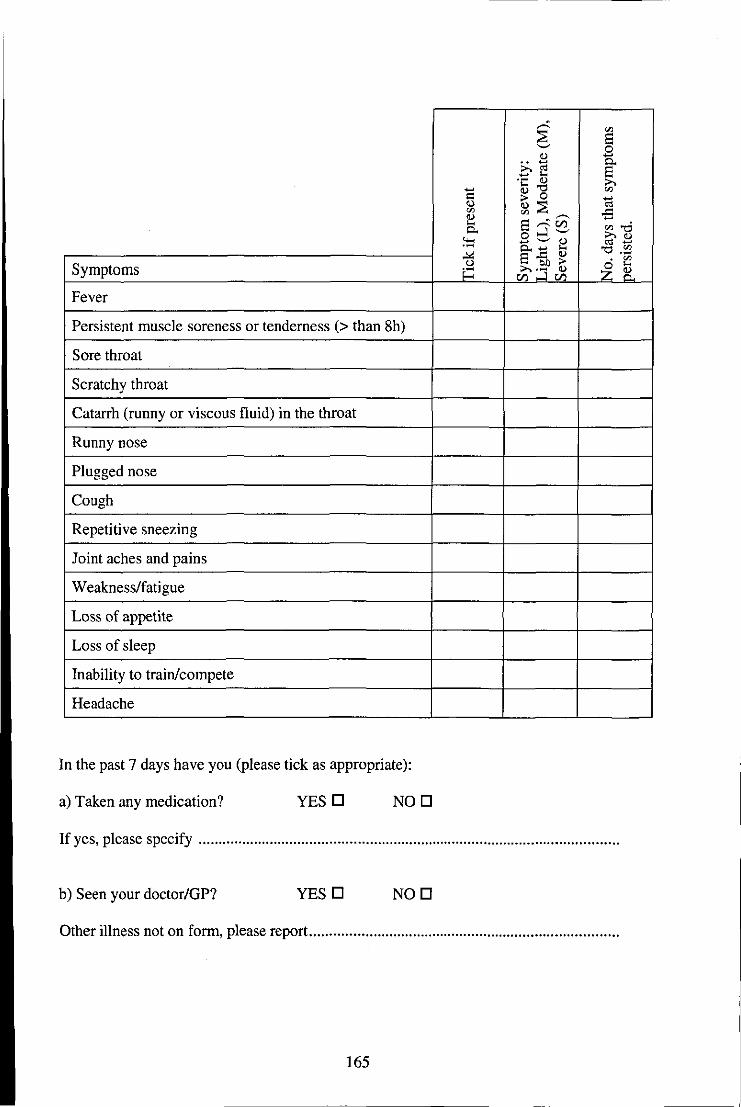
,.-:: '" 6 8 0
" -.. - a :>..'" - I-; .~ " :>.. - 1-;'0
'" <= " 0 .. " ~~ '" ..s ~ a~Ci.l 0., ",od o....l ~ ~E ""' -~" .~
0., - I-; "Cj .~
"" 8 .<:: " . '" Symptoms
() 0Ij > ~~ E::: :>"'J " Cl) Cl)
Fever
Persistent muscle soreness or tenderness (> than 8h)
Sore throat
Scratchy throat
Catarrh (runny or viscous fluid) in the throat
Runny nose
Plugged nose
Cough
Repetitive sneezing
Joint aches and pains
Weakness/fatigue
Loss of appetite
Loss of sleep
Inability to train/compete
Headache
In the past 7 days have you (please tick as appropriate):
a) Taken any medication? YES 0 NOD
If yes, please specify ......................................................................................................... .
b) Seen your doctor/GP? YES 0 NOD
Other illness not on form, please report ............................................................................. .
165

Related Documents