Research Journal of Finance and Accounting www.iiste.org ISSN 2222-1697 (Paper) ISSN 2222-2847 (Online) Vol.4, No.6, 2013 236 Factors Determining Capital Structure: A Case study of listed companies in Sri Lanka Ms.M.Sangeetha Senior Programme Assistant UNHCR, Kilinochchi, Sri Lanka Email: [email protected] N.Sivathaasan Assistant Librarian, Main Library University of Jaffna, Sri Lanka Email: [email protected] Abstract The most debatable topic in capital structure revolves around the optimal capital structure. This article investigates the factors determining capital structure in Sri Lankan context during 2002 to 2006 (five years). In an attempt, the present study examined the determinants of capital structure such as tangibility, size, growth rate, profitability, liquidity and dividend payout with samples of 50 companies including 13 sectors representing 21% of the mean number of companies listed in Colombo Stock Exchange Ltd as of 2006. Descriptive and inferential statistics were used in the analysis of data using Statistical Package for Social Science (SPSS). Results revealed that the use of debt capital is relatively low in Sri Lanka and size, growth rate and profitability are statistically significant determinants of capital structure. According to regression analysis, above six factors have an impact on capital structure at the rate of 77 % which is significant at 0.05 levels. Keywords: Capital Structure, Determinant(s), Colombo Stock Exchange. 1. Introduction Capital structure remains as a controversial issue in modern corporate finance. A firm can raise fund either through debt or equity or mixture of both. There are two schools of thought in capital structure. One school pleads for optimal capital structure and other does against. Former school argues that judicious mixture of debt and equity capital can minimize the overall cost of capital and maximize the value of the firm. Hence, this school considers capital structure decision as relevant. Latter school of thought led by Modiglinai and Miller contends that financing decision does not affect the value of the firm. The modern theory of capital structure began with the introduction of Modiglinai and Miller (1958), Rajan and Zingales (1995), Harris and Raviv (1991). Four theoretical approaches can be distinguished namely the irrelevance theory of Modiglinai and Miller (1958) , the trade off theory (Bradley et al., 1984), agency cost theory (Jensen and Meckling, 1976) and pecking order theory (Myers and Majluf, 1984). The three conflicting theories of capital structure such as trade-off theory, agency cost theory and pecking order theories have been developed after the establishment of Modiglinai and Miller’s theory. Even though his theory shows the irrelevance of capital structure to the value of the firm, this implies that, there does not exist an optimal capital structure. Because, a firm’s value cannot be affected by its choice of financing. The logic of the Modigliani and Miller (1958) analysis is still accepted, despite the contradiction of their theoretical conclusions with empirical evidence. Various factors have been suggested as major players in determining how much of a company can borrow and in what circumstances. Academics don’t seem to be in a complete agreement as to what determines the capital structure of a firm. Tangibility of assets, growth opportunities, size, uniqueness, business risk, and profitability are some of the major factors which determine the capital structure. However, the significance of these determinants may vary from country to country depending on their economy settings. In this study, determinants of capital structure in Sri Lankan context are examined based on a panel data set from 2002 to 2006 comprising 50 companies listed on Colombo Stock Exchange with reference to capital structure theories. CORE Metadata, citation and similar papers at core.ac.uk Provided by International Institute for Science, Technology and Education (IISTE): E-Journals

Welcome message from author
This document is posted to help you gain knowledge. Please leave a comment to let me know what you think about it! Share it to your friends and learn new things together.
Transcript
Research Journal of Finance and Accounting www.iiste.org
ISSN 2222-1697 (Paper) ISSN 2222-2847 (Online)
Vol.4, No.6, 2013
236
Factors Determining Capital Structure: A Case study of listed
companies in Sri Lanka
Ms.M.Sangeetha
Senior Programme Assistant
UNHCR, Kilinochchi, Sri Lanka
Email: [email protected]
N.Sivathaasan
Assistant Librarian, Main Library
University of Jaffna, Sri Lanka
Email: [email protected]
Abstract
The most debatable topic in capital structure revolves around the optimal capital structure. This article investigates
the factors determining capital structure in Sri Lankan context during 2002 to 2006 (five years). In an attempt, the
present study examined the determinants of capital structure such as tangibility, size, growth rate, profitability,
liquidity and dividend payout with samples of 50 companies including 13 sectors representing 21% of the mean
number of companies listed in Colombo Stock Exchange Ltd as of 2006. Descriptive and inferential statistics were
used in the analysis of data using Statistical Package for Social Science (SPSS). Results revealed that the use of debt
capital is relatively low in Sri Lanka and size, growth rate and profitability are statistically significant determinants
of capital structure. According to regression analysis, above six factors have an impact on capital structure at the rate
of 77 % which is significant at 0.05 levels.
Keywords: Capital Structure, Determinant(s), Colombo Stock Exchange.
1. Introduction
Capital structure remains as a controversial issue in modern corporate finance. A firm can raise fund either through
debt or equity or mixture of both. There are two schools of thought in capital structure. One school pleads for
optimal capital structure and other does against. Former school argues that judicious mixture of debt and equity
capital can minimize the overall cost of capital and maximize the value of the firm. Hence, this school considers
capital structure decision as relevant. Latter school of thought led by Modiglinai and Miller contends that financing
decision does not affect the value of the firm. The modern theory of capital structure began with the introduction of
Modiglinai and Miller (1958), Rajan and Zingales (1995), Harris and Raviv (1991).
Four theoretical approaches can be distinguished namely the irrelevance theory of Modiglinai and Miller (1958) , the
trade off theory (Bradley et al., 1984), agency cost theory (Jensen and Meckling, 1976) and pecking order theory
(Myers and Majluf, 1984). The three conflicting theories of capital structure such as trade-off theory, agency cost
theory and pecking order theories have been developed after the establishment of Modiglinai and Miller’s theory.
Even though his theory shows the irrelevance of capital structure to the value of the firm, this implies that, there does
not exist an optimal capital structure. Because, a firm’s value cannot be affected by its choice of financing. The logic
of the Modigliani and Miller (1958) analysis is still accepted, despite the contradiction of their theoretical
conclusions with empirical evidence.
Various factors have been suggested as major players in determining how much of a company can borrow and in
what circumstances. Academics don’t seem to be in a complete agreement as to what determines the capital structure
of a firm. Tangibility of assets, growth opportunities, size, uniqueness, business risk, and profitability are some of the
major factors which determine the capital structure. However, the significance of these determinants may vary from
country to country depending on their economy settings. In this study, determinants of capital structure in Sri Lankan
context are examined based on a panel data set from 2002 to 2006 comprising 50 companies listed on Colombo
Stock Exchange with reference to capital structure theories.
CORE Metadata, citation and similar papers at core.ac.uk
Provided by International Institute for Science, Technology and Education (IISTE): E-Journals
Research Journal of Finance and Accounting www.iiste.org
ISSN 2222-1697 (Paper) ISSN 2222-2847 (Online)
Vol.4, No.6, 2013
237
2. Research Problem
The assets of a company can be financed by issuing ordinary shares or by retained earnings and borrowings. Capital
structure refers to the different options used by a firm in financing its assets. It can combine bonds, lease financing
bank loans or many other options with equity in an overall attempt to boost the market value of the firm. To
maximize the overall value, firms differ with respect to capital structures which have given birth to different capital
structure theories that attempt to explain the variation in capital structure firms over time or across regions.
This study attempts to examine the factors which determine the capital structure of Sri Lankan listed companies.
RQ: What are the factors that determine the capital structure of Sri Lankan listed companies?
3. Objective of Study
The main objective of the study is to find out the factors which determine the capital structure of Sri Lankan listed
companies and sub objectives are:
To identify the relationship between the factors determining capital structure and capital structure
To identify the impact of those factors on capital structure of the companies.
4. Review of Literature
Theoretical and empirical capital structure studies have generated many results that attempt to explain the
determinants of capital structure. There exist a number of determinants of capital structure derived from various
theories. Haris and Raviv (1991) demonstrate in their review article that the motives and circumstances could
determine capital structure choices which have been seen nearly uncountable. According to Titman and Wessels
(1988), the required explanatory variable may frequently be imperfect proxies for the defined corporate attributes.
Most of the capital structure studies to date are based on data from developed countries. For example, Rajan and
Zingales (1995) used data from the G.7 countries while Bevan and Danbolt (2000 and 2002) utilized data from UK,
Antoious et al. (2002) analyzed data from UK, Germany and France and Hall et al. (2004) used data from Europe.
There are only a few studies that provide evidence from developing countries. For example, Booth et al. (2001)
analyzed data from developing countries (Brazil, Mexico, India, South Korea Jordan, Malaysia, Pakistan and
Thailand. Turkey and Zimbabwe, Pandey (2001) used data from Malaysia. Chen (2004) utilized data from China,
Omet and Nobanee (2001) used data from Jordan and Al-sakaran (2001) analyzed data from Saudi Arabia. Some
have used cross country comparisons based data from particular region. For example, Decsomsak et al. (2004)
analyzed data from the Asian pacific region.
There is no universal theory of capital structure and no reason to expect one (Myers, 2001). Different theories give
different predictions on how tangibility is related to leverage. On the relationship between tangibility and capital
structure, the trade-off and agency theories state that tangibility is positively related to leverage. If a company’s
tangible assets are high, then these assets can be used as collateral, diminishing the lender’s risk of suffering such
agency costs of debt. Moreover, in firms with more intangible assets, the costs of controlling capital expenditures are
higher, as monitoring is more difficult. Hence, a high fraction of tangible assets is expected to be associated with
high leverage. Several empirical studies confirm this suggestion, as Friend and Lang (1988), Rajan and Zingales
(1995), Wald (1999), Frank and Goyal (2004) found out. On the other hand, Bevan and Danbolt (2000), Booth et al.
(2001), and Huang and Song (2002) experienced a negative relationship between tangibility and leverage in some
cases.
In line with the tradeoff theory, size is expected to be positively related to leverage. However, as Rajan and Zingales
(1995) stated, if the costs of financial distress are low, the positive relationship should not be strong. Agency theory
also suggests a positive relationship between size and leverage. According to Pecking order theory, larger firms have
less asymmetric information problems which imply that they will have a higher preference for equity than smaller
ones. A negative relationship is thus predicted for size and leverage. Some authors find positive relationship between
size and leverage, for example Friend and Lang(1988), Rajan and Zingales (1995) for all G7 countries except for
Germany, Wald (1999), Wiwattanakantang (1999), Bevan and Danbolt (2000), Pandey (2001), Al-Sakaran (2001),
Research Journal of Finance and Accounting www.iiste.org
ISSN 2222-1697 (Paper) ISSN 2222-2847 (Online)
Vol.4, No.6, 2013
238
Huang and Song (2002), Frank and Goyal (2004). On the other hand, in some studies a negative relationship is
reported, for example Titman and Wessels (1988) and Chaplinsky and Niehaus(1993).
Whereas the trade-off, signaling and agency theories expect a positive relationship between profitability and
leverage, the pecking order theory predicts a negative one. Most empirical studies observe a negative relationship
between leverage and profitability. For example Kester (1986), Friend and Lang(1988), Titman and Wessels (1988),
Rajan and Zingales (1995) for G7 countries except for Germany, Wald(1999), Wiwattanakantang (1999), Bevan and
Danbolt (2000), Booth et al. (2001), Huang and Song (2002).On the other hand, Frank and Goyal (2004) experienced
a positive relationship between profitability and leverage in some models. Velnampy and Nimalathasan (2010)
examined about firm size on profitability between Bank of Ceylon and Commercial Bank of Ceylon in Sri Lanka
during ten years period from 1997 to 2006 and found that there is a positive relationship between Firm size and
Profitability in Commercial Bank of Ceylon Ltd, but there is no relationship between firm size and profitability in
Bank of Ceylon. Various studies identified the determinants of profitability (Islam and Mili, 2012, Velnampy, 2005
& 2005, 2013, Velnampy and Pratheepkanth, 2012, and Niresh and Velnampy, 2012)
The agency cost theory and pecking order theory explain the contradictory relation between the growth rate and
capital structure. Growth rate is negatively related with long-term debt level (Jensen and Meckling, 1976). Some
empirical studies also show the negative relationship, such as Kim and Sorensen (1986), and Titman and Wessels
(1988), Rajan and Zingales (1995), Wiwattanakantang (1999), Bevan and Danbolt (2000), Huang and Song (2002)
and Frank and Goyal (2004). On the other hand, Booth et al. (2001) demonstrate, in some models, a positive
relationship between growth opportunities and leverage. On the other hand, Pecking order theory, contrary to the
agency cost theory, shows the positive relation between the growth rate and debt level of enterprises based on that a
higher growth rate implies a higher demand for funds, and, ceteris paribus, a greater reliance on external financing
through the preferred source of debt. Pecking order theory contends that management prefers internal to external
financing and debt to equity if it issues securities. Velnampy and Nimalathasan (2008) pointed out the association
between organizational growth and profitability in Commercial Bank of Ceylon limited in Sri Lanka and concluded
that organizational growth has a greater impact on all profitability ratios such as net profit, operating profit, ROE,
ROI and RAA.
The bankruptcy costs theory pleads for adverse relation between the dividend payout ratio and debt level in capital
structure. The low bankruptcy cost implies the high level of debt in the capital structure. But, the pecking order
theory shows the positive relation between debt level and dividend payout ratio. Further, management prefers the
internal financing to external one. Instead of distributing the high dividend, and meeting the financial need from debt
capital, management retains the earnings.
A negative relationship between liquidity and leverage is expected in market oriented economies (Ghassan omet &
Fadi Mashharawe, 2003). Indeed, this result is supported by the empirical findings of Ozkan (2001) and Antonious
(2002).
5. Methodology
5.1. Sampling Techniques
For the purpose of this study, population has been defined in terms of the number of companies listed on Colombo
Stock Exchange (CSE) for the period from 2002 to 2006. As on this period, the total number of such companies
falling in twenty different sectors such as Banks finance and insurance, Beverage food and tobacco, Chemicals and
pharmaceuticals, Construction and engineering, Diversified holdings, Foot ware and textiles, Health care, Hotels and
travels, Information technology, Investment trusts, Land and property, Manufacturing, Motors, Oil palms,
Plantations, Power and energy, Services, Stores and supplies, Telecommunications and Trading were around 235.
The sample of firms is selected on the basis of following criteria.
The firm must be a non-financial firm. The companies in Banks finance and insurance, and Investment trust
sectors are excluded, since the use and determinants of leverage of these companies are likely to be different
to the ones in companies in non-financial sectors.
Research Journal of Finance and Accounting www.iiste.org
ISSN 2222-1697 (Paper) ISSN 2222-2847 (Online)
Vol.4, No.6, 2013
239
Availability of the required firm-specific data for a consecutive period of five years starting from the
financial year 2002 and ending with the financial year 2006.Firms with any missing observations for any
variable in the model during the above range also dropped.
Firms having negative book equity are excluded since that can lead to negative leverage, which will induce
a downward bias to the mean estimates of leverage.
Firms having extreme values for any of capital structure are also excluded.
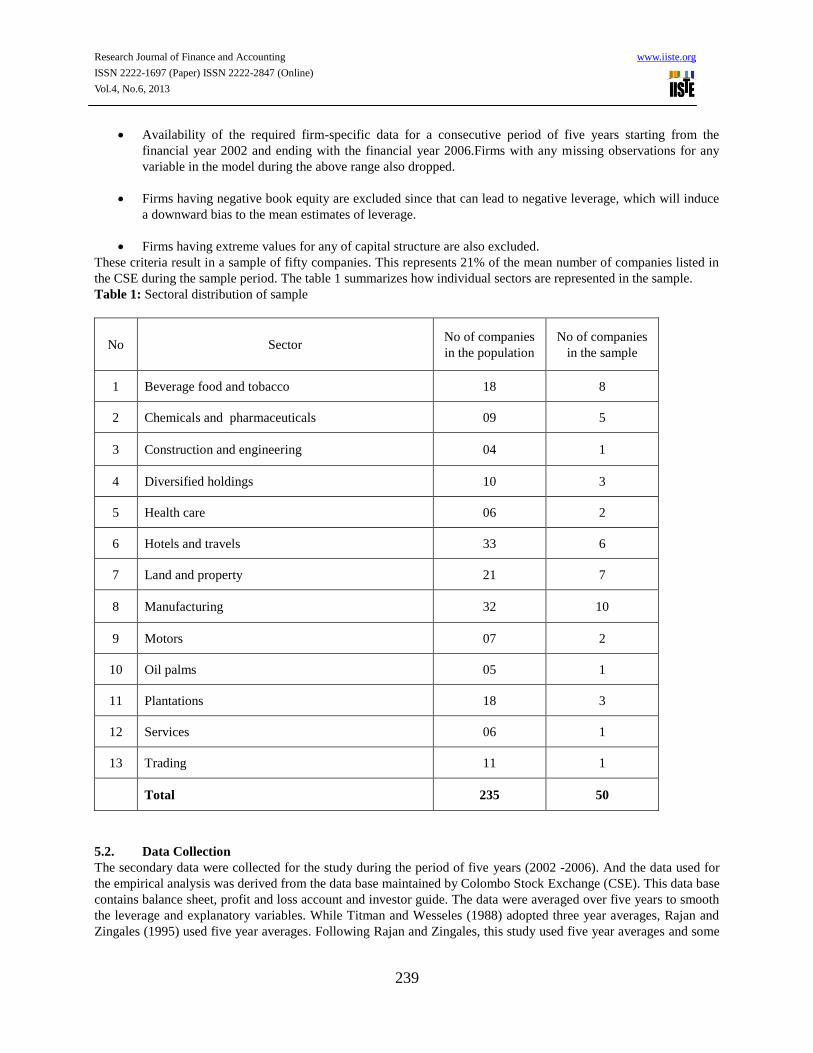
These criteria result in a sample of fifty companies. This represents 21% of the mean number of companies listed in
the CSE during the sample period. The table 1 summarizes how individual sectors are represented in the sample.
Table 1: Sectoral distribution of sample
No Sector No of companies
in the population
No of companies
in the sample
1 Beverage food and tobacco 18 8
2 Chemicals and pharmaceuticals 09 5
3 Construction and engineering 04 1
4 Diversified holdings 10 3
5 Health care 06 2
6 Hotels and travels 33 6
7 Land and property 21 7
8 Manufacturing 32 10
9 Motors 07 2
10 Oil palms 05 1
11 Plantations 18 3
12 Services 06 1
13 Trading 11 1
Total 235 50
5.2. Data Collection
The secondary data were collected for the study during the period of five years (2002 -2006). And the data used for
the empirical analysis was derived from the data base maintained by Colombo Stock Exchange (CSE). This data base
contains balance sheet, profit and loss account and investor guide. The data were averaged over five years to smooth
the leverage and explanatory variables. While Titman and Wesseles (1988) adopted three year averages, Rajan and
Zingales (1995) used five year averages. Following Rajan and Zingales, this study used five year averages and some
Research Journal of Finance and Accounting www.iiste.org
ISSN 2222-1697 (Paper) ISSN 2222-2847 (Online)
Vol.4, No.6, 2013
240
necessary data were hunted from online (official website of CSE).Further, annual reports of the companies, books,
journals, magazines and research reports were also used for data collection.
5.3. Mode of Analysis
In this study, various statistical methods have been employed to analyze data collected from 50 companies listed on
CSE. A well know statistical package called “SPSS” (Statistical Package for Social Science) version 13 has been
used to analyze the data researcher collected. The upper level of statistical significance for hypotheses testing was set
at 5%. All statistical test results were computed at the 2-tailed level of significance. Statistical analysis involves both
descriptive and inferential statistics.
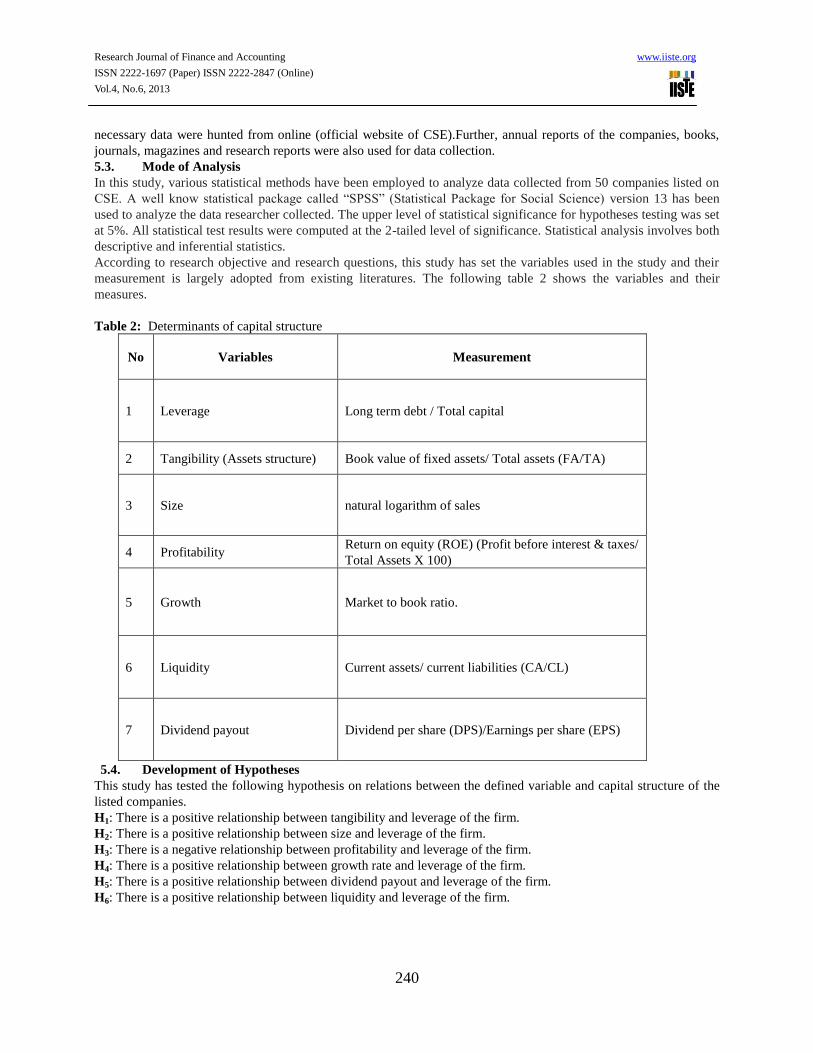
According to research objective and research questions, this study has set the variables used in the study and their
measurement is largely adopted from existing literatures. The following table 2 shows the variables and their
measures.
Table 2: Determinants of capital structure
No Variables Measurement
1 Leverage Long term debt / Total capital
2 Tangibility (Assets structure) Book value of fixed assets/ Total assets (FA/TA)
3 Size natural logarithm of sales
4 Profitability Return on equity (ROE) (Profit before interest & taxes/
Total Assets X 100)
5 Growth Market to book ratio.
6 Liquidity Current assets/ current liabilities (CA/CL)
7 Dividend payout Dividend per share (DPS)/Earnings per share (EPS)
5.4. Development of Hypotheses
This study has tested the following hypothesis on relations between the defined variable and capital structure of the
listed companies.
H1: There is a positive relationship between tangibility and leverage of the firm.
H2: There is a positive relationship between size and leverage of the firm.
H3: There is a negative relationship between profitability and leverage of the firm.
H4: There is a positive relationship between growth rate and leverage of the firm.
H5: There is a positive relationship between dividend payout and leverage of the firm.
H6: There is a positive relationship between liquidity and leverage of the firm.

Research Journal of Finance and Accounting www.iiste.org
ISSN 2222-1697 (Paper) ISSN 2222-2847 (Online)
Vol.4, No.6, 2013
241
5.5. Conceptual Model
Based on data availability and some other constraints, only six variables such as tangibility, size, profitability,
growth, dividend payout and liquidity are tested in this study. This can be conceptualized as follows;
Figure 1: Research Model
6. Results and Discussions
6.1. Descriptive Statistics
Descriptive statistics provide information on the key variables in the study and are presented below. Means, medians
and standard deviations for the each regression variables are presented in table 3.
Capital
Structure
Determinants of Capital
Structure
Tangibility (H1)
There is a positive
relationship
between
tangibility and
leverage of the
firm.
H2: There is a
positive
relationship
between size and
leverage of the
firm.
H3: There is a
negative
relationship
between
profitability and
leverage of the
firm.
H4: There is a
positive
relationship
between growth
Size (H2)
Profitability (H3)
Growth rate (H4)
Dividend payout (H5) Liquidity (H6)
Research Journal of Finance and Accounting www.iiste.org
ISSN 2222-1697 (Paper) ISSN 2222-2847 (Online)
Vol.4, No.6, 2013
242
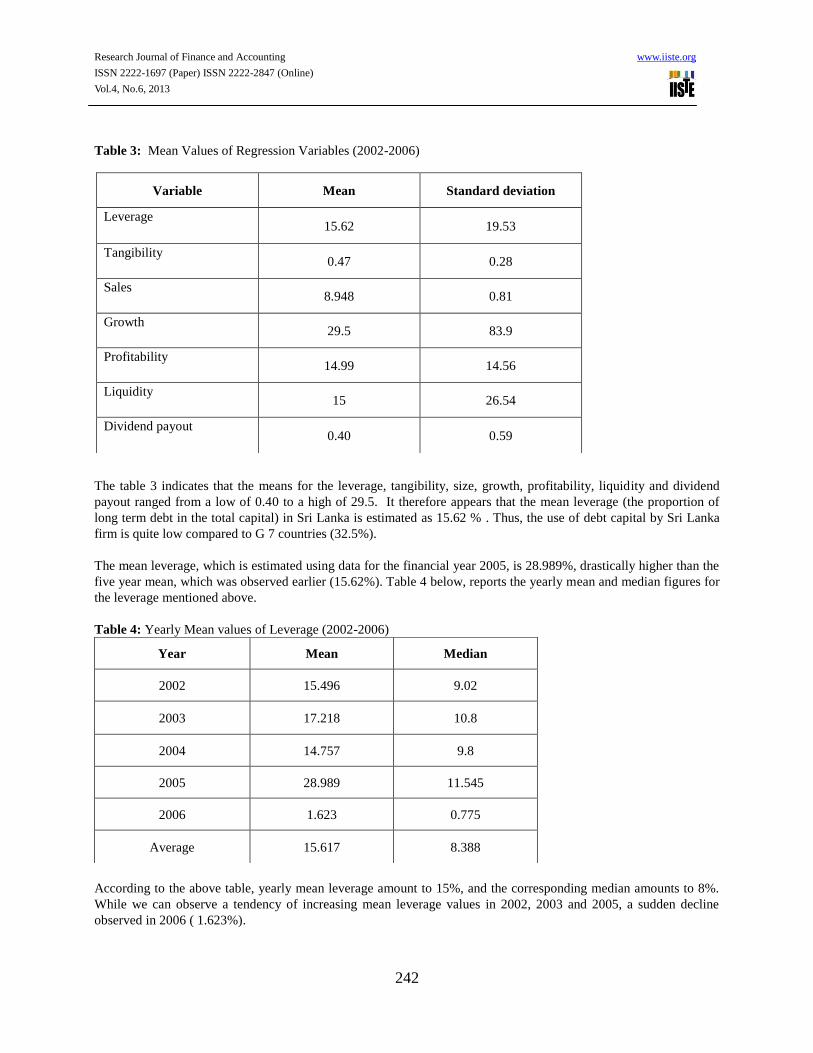
Table 3: Mean Values of Regression Variables (2002-2006)
The table 3 indicates that the means for the leverage, tangibility, size, growth, profitability, liquidity and dividend
payout ranged from a low of 0.40 to a high of 29.5. It therefore appears that the mean leverage (the proportion of
long term debt in the total capital) in Sri Lanka is estimated as 15.62 % . Thus, the use of debt capital by Sri Lanka
firm is quite low compared to G 7 countries (32.5%).
The mean leverage, which is estimated using data for the financial year 2005, is 28.989%, drastically higher than the
five year mean, which was observed earlier (15.62%). Table 4 below, reports the yearly mean and median figures for
the leverage mentioned above.
Table 4: Yearly Mean values of Leverage (2002-2006)
According to the above table, yearly mean leverage amount to 15%, and the corresponding median amounts to 8%.
While we can observe a tendency of increasing mean leverage values in 2002, 2003 and 2005, a sudden decline
observed in 2006 ( 1.623%).
Variable Mean Standard deviation
Leverage 15.62 19.53
Tangibility 0.47 0.28
Sales 8.948 0.81
Growth 29.5 83.9
Profitability 14.99 14.56
Liquidity 15 26.54
Dividend payout 0.40 0.59
Year Mean Median
2002 15.496 9.02
2003 17.218 10.8
2004 14.757 9.8
2005 28.989 11.545
2006 1.623 0.775
Average 15.617 8.388
Research Journal of Finance and Accounting www.iiste.org
ISSN 2222-1697 (Paper) ISSN 2222-2847 (Online)
Vol.4, No.6, 2013
243
The table 3 shows that, mean tangibility over the five year is 47% and the market value of assets is 29.5 times the
book value of assets on mean. Further, the means of sales of the companies in the sample is Rs 16219170118 (means
of natural logarithm of sales is 8.948). During the five year period, firms earned a mean ROE of 14.99%. Moreover,
it indicates that the companies in the sample have current assets, which is 15 times greater than their current liability.
The average dividend available to shareholders out of earnings is 0.4 times.
6.2. Correlation Analysis
The Pearson’s Moment Correlation Coefficient was computed for purposes of determining the following
relationship:
The relationship between leverage and tangibility
The relationship between leverage and size
The relationship between leverage and growth
The relationship between leverage and profitability
The relationship between leverage and liquidity
The relationship between leverage and dividend payout.
In order to delineate the relationship between the various determinants of capital structure, leverage was correlated
and is presented in table 5.
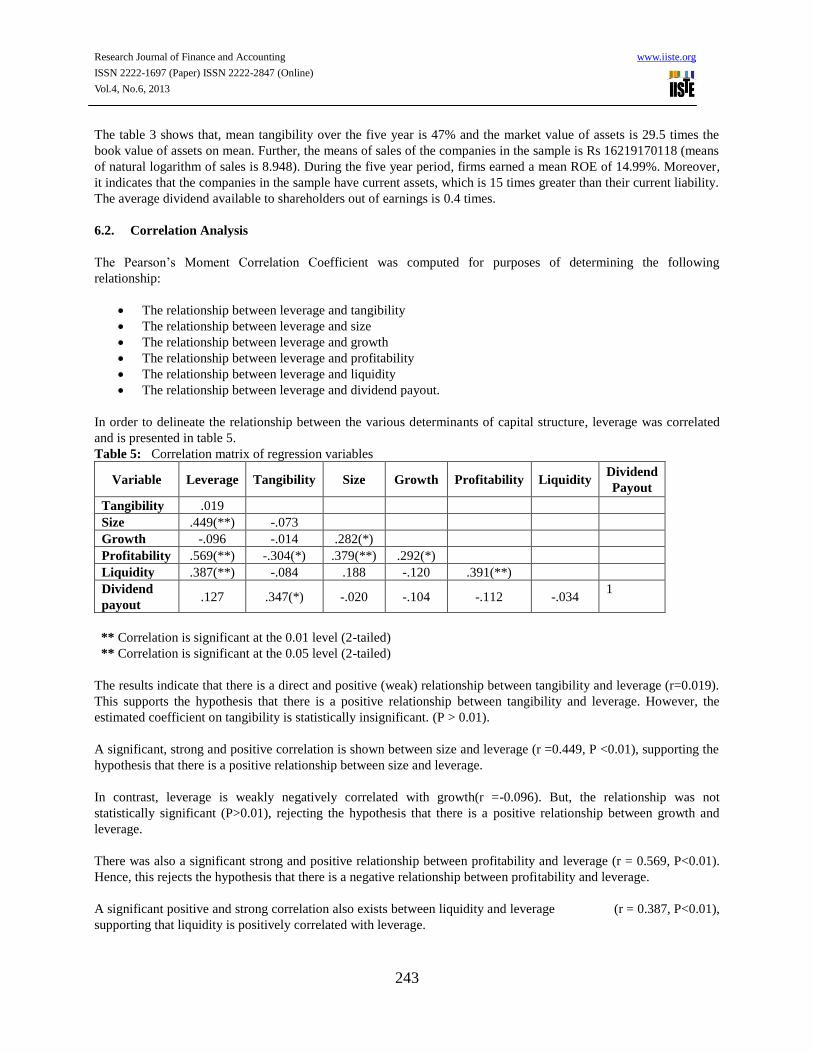
Table 5: Correlation matrix of regression variables
Variable Leverage Tangibility Size Growth Profitability Liquidity Dividend
Payout
Tangibility .019
Size .449(**) -.073
Growth -.096 -.014 .282(*)
Profitability .569(**) -.304(*) .379(**) .292(*)
Liquidity .387(**) -.084 .188 -.120 .391(**)
Dividend
payout .127 .347(*) -.020 -.104 -.112 -.034
1
** Correlation is significant at the 0.01 level (2-tailed)
** Correlation is significant at the 0.05 level (2-tailed)
The results indicate that there is a direct and positive (weak) relationship between tangibility and leverage (r=0.019).
This supports the hypothesis that there is a positive relationship between tangibility and leverage. However, the
estimated coefficient on tangibility is statistically insignificant. (P > 0.01).
A significant, strong and positive correlation is shown between size and leverage (r =0.449, P <0.01), supporting the
hypothesis that there is a positive relationship between size and leverage.
In contrast, leverage is weakly negatively correlated with growth(r =-0.096). But, the relationship was not
statistically significant (P>0.01), rejecting the hypothesis that there is a positive relationship between growth and
leverage.
There was also a significant strong and positive relationship between profitability and leverage (r = 0.569, P<0.01).
Hence, this rejects the hypothesis that there is a negative relationship between profitability and leverage.
A significant positive and strong correlation also exists between liquidity and leverage (r = 0.387, P<0.01),
supporting that liquidity is positively correlated with leverage.
Research Journal of Finance and Accounting www.iiste.org
ISSN 2222-1697 (Paper) ISSN 2222-2847 (Online)
Vol.4, No.6, 2013
244
Finally, the results indicate that there is a statistically insignificant, weak and positive relationship between dividend
payout and leverage (r=0.127, P>0.01). This supports the hypothesis that there is a positive relationship between
dividend payout and leverage.
Further, the results indicate that, growth has a significant correlation with size (r=0.282, P<0.05) and
profitability has significant correlations with tangibility, size and growth. While liquidity has significantly correlated
with profitability (r= 0.391), dividend payout correlates with tangibility (r=0.347).
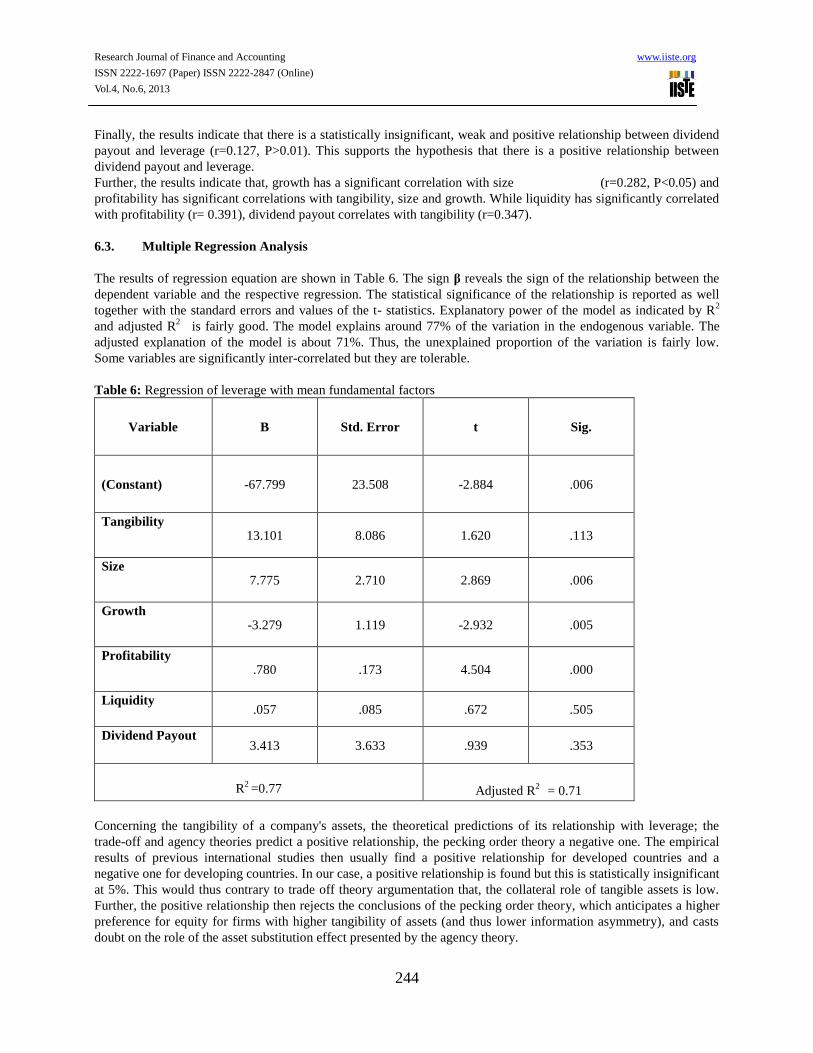
6.3. Multiple Regression Analysis
The results of regression equation are shown in Table 6. The sign β reveals the sign of the relationship between the
dependent variable and the respective regression. The statistical significance of the relationship is reported as well
together with the standard errors and values of the t- statistics. Explanatory power of the model as indicated by R2
and adjusted R2
is fairly good. The model explains around 77% of the variation in the endogenous variable. The
adjusted explanation of the model is about 71%. Thus, the unexplained proportion of the variation is fairly low.
Some variables are significantly inter-correlated but they are tolerable.
Table 6: Regression of leverage with mean fundamental factors
Variable B Std. Error t Sig.
(Constant) -67.799 23.508 -2.884 .006
Tangibility 13.101 8.086 1.620 .113
Size 7.775 2.710 2.869 .006
Growth -3.279 1.119 -2.932 .005
Profitability .780 .173 4.504 .000
Liquidity .057 .085 .672 .505
Dividend Payout 3.413 3.633 .939 .353
R2 =0.77
Adjusted R2
= 0.71
Concerning the tangibility of a company's assets, the theoretical predictions of its relationship with leverage; the
trade-off and agency theories predict a positive relationship, the pecking order theory a negative one. The empirical
results of previous international studies then usually find a positive relationship for developed countries and a
negative one for developing countries. In our case, a positive relationship is found but this is statistically insignificant
at 5%. This would thus contrary to trade off theory argumentation that, the collateral role of tangible assets is low.
Further, the positive relationship then rejects the conclusions of the pecking order theory, which anticipates a higher
preference for equity for firms with higher tangibility of assets (and thus lower information asymmetry), and casts
doubt on the role of the asset substitution effect presented by the agency theory.
Research Journal of Finance and Accounting www.iiste.org
ISSN 2222-1697 (Paper) ISSN 2222-2847 (Online)
Vol.4, No.6, 2013
245
A positive relationship between company size, as measured by the natural logarithm of the volume of its sales, and
leverage is found for the 2002-2006 averages. This result is consistent with the results of the majority of other
international empirical studies. With a statistical significance at the 5% level, the positive sign supports the
predictions of the tradeoff and agency theories and contradicts the predictions of the pecking order theory. Size can
thus be really regarded as an inverse proxy for the probability of bankruptcy. The fact that larger firms tend to be
more leveraged points, however, not only at their greater stability and lower probability of bankruptcy (as per the
trade-off theory), but also (in line with the agency theory) at their easier access to debt. This easier access to debt
markets then probably outweighs their preference for equity expected by the pecking order theory.
In the case of profitability a positive relationship with leverage is found for the 2002-2006 averages; Profit is most
statistically significant determinant among other variables. More profitable Sri Lankan companies have a tendency to
use relatively high debt in their capital structure. But majority of other international studies, find a negative
relationship. It is consistent with pecking order theory and its prediction that companies prefer to retain their
earnings, in order to avoid the necessity to raise debt or external equity. This finding is, however, on the other hand,
contradicted with the trade-off theory (predicting that more profitable firms will borrow more, as they will have a
greater motivation to shield their income from taxation), the signaling theory (expecting higher debt to be a good
signal about the profitability of a firm), as well as the agency theory (seeing higher leverage as an instrument for
reducing free cash flow available to managers).
Beta coefficient of growth shows that growth is negatively related with leverage supporting agency cost theory. It
suggests that equity controlled firms have a tendency to invest sub-optimally to expropriate wealth from the
enterprises’ bondholders. The agency cost is likely to be higher for enterprises in growing industries which have
more flexibility in their choice of future investment. On the other hand this result is contrary to pecking order theory
that suggests a positive relationship between the above two variables.
The result of the above regression analysis shows that, there is a positive relationship (insignificant at 5%) between
dividend payout and leverage. This result supports the pecking order theory and its prediction that a management
prefers the internal financing to external one. However, it is not consistent with the bankruptcy costs theory.
Because, it pleads for adverse relation between the dividend payout ratio and debt level in capital structure.
The above table 6 indicates that there is a positive relationship between liquidity and leverage. However, the
relationship between the above two variables is statistically insignificant.
The model explains around 77% of variation in financial leverage. The incorporated variables except tangibility,
liquidity and dividend payout, have significant effect on the leverage. But the constant term of the model is with
unusual sign. This indicates the severe problem of the model. Statistically, this model is fit to check the influence of
firm’s characteristics on the leverage, but the constant term of the model is contradictory to the reality. In real world,
leverage ratio does never pass the vertical axis below the origin.
7. Conclusion
This study investigated the use and the determinants of leverage in Sri Lanka using a sample of 50 firms listed in
Colombo Stock Exchange. The empirical results revealed that the use of debt financing by Sri Lankan firm is
significantly low and this is largely due to the use of less long term debt. The lack of a developed long term debt
market may explain the low use of long term debt in Sri Lanka.
It is evident from the study that out of six explanatory variables such as tangibility, size, growth, profitability,
liquidity and dividend payout, three- size, profitability and growth are statistically significant determinants of capital
structure in Sri Lanka. These facts conclude that corporate size, growth rate and profitability play a major role in
Research Journal of Finance and Accounting www.iiste.org
ISSN 2222-1697 (Paper) ISSN 2222-2847 (Online)
Vol.4, No.6, 2013
246
determination of the financial leverage in Sri Lankan firms; and tangibility, liquidity and dividend payout do dismal
role.
8. References
1. Al-Sakran, S. (2001). Leverage determinants in the absence of corporate tax system: the
case of non-financial publicly traded corporation in Saudi Arabia. Managerial Finance, 27: 58-86.
2. Antonious, A., Guney, Y. & Paudyal, K. (2002). Determinants of corporate capital
Structure: evidence from European Countries, University of Durham, working paper: 1-8.
3. Bevan, A. & Danbolt, J. (2000). Dynamics in the determinants of capital structure in the
UK,University of Glasgow, working paper: 1-10.
4. Bevan, A. & Danbolt, J. (2002). Capital structure and its determinants in the UK- A
Deco Positional Analysis. Applied Financial Economics, 12: 159-170.
5. Booth, L., Aivazian, V., Demirg, A., Kunt, U.C. & Maksimovic, V. (2001). Capital structures in
developing countries. Journal of Finance, 56(1): 87–130.
6. Bradley, M., Jarrell, G. A. & Kim, E. H. (1984). On the existence of an optimal capital
structure: theory and evidence. The Journal of Finance, 39(3): 857-878.
7. Chaplinsky, S. & Niehaus, G. (1990). The determinants of inside ownership and leverage.
University of Michigan, working paper.
8. Chen, J.(2004). Determinants of capital structure of Chinese-listed companies. Journal of
Business Research, 57: 1341-1351.
9. Deesomsak, R., Paudyal, K. & Pescetto, G. (2004). The determinants of capital Structure:
evidence from the Asia Pacific Region. Journal of Multinational Financial Management, 14: 387-
405.
10. Frank, M.Z. & V.K. Goyal. (2004). The effect of market conditions on capital structure
adjustment. Finance Research Letters, forthcoming.
11. Friend, I. & Lang, L.H.P. (1988). An empirical test of the impact of managerial self-
interest on corporate capital structure. Journal of Finance, 47: 271-281.
12. Ghassan , O. & Fadi, M. (2003). The capital structure choice in tax contrasting
environments: evidence from the Jordanian, Kuwaiti, Omani Saudi corporate sectors. 10th
Conference of the Economic Research Forum.
13. Hall, G. C., Hutchinson, P. J.& Michaelas, N. (2004). Determinants of the capital
structures of European SMEs. Journal of Business Finance & Accounting, 31(5):
711-728.
14. Harris, M. & Raviv, A.(1991). The theory of capital structure. Journal of Finance, 46(1):
297-355.
15. Huang, S. & Song, F. (2002). The determinants of capital structure: evidence from China,
The University of Hong Kong, working paper: 2-7.
16. Jensen, M. C. & Meckling, W. H. (1976). Theory of the firm: Managerial behavior,
agency costs and ownership structure. Journal of financial economics, 3(4): 305- 360.
17. Kester, C. W. (1986). Capital and ownership structure: a comparison of united states and
Japanese Manufacturing Corporations. Financial Management, 15: 5–16.
18. Kim, W. S. & E. H. Sorensen.(1986). Evidence on the impact of the agency costs of debt
on corporate debt policy. Journal of Financial and Quantitative Analysis, 21: 131-144.
19. Modigliani, F. & Miller, M.(1958). The cost of capital, corporation finance and the
theory of investment. The American Economic Review, 48: 261-297.
20. Myers, S.C. (1977). Determinants of corporate borrowing. Journal of Financial
Economics, 5(2): 147–75.
21. Myers, S. & Majluf. (1984). Corporate financing and investment decisions when firms
have information that investors do not have. Journal of Financial Economics,13(2): 187-221.
22. Myers, S.C. (2001). Capital structure. The Journal of Economic Perspectives, 15(2): 81-
102.
Research Journal of Finance and Accounting www.iiste.org
ISSN 2222-1697 (Paper) ISSN 2222-2847 (Online)
Vol.4, No.6, 2013
247
23. Norton, E. (1989). Determinants of capital structure: a survey. Advances in financial
planning and forecasting, 3: 323–350.
24. Omet, G. & Nobanee, H. (2001). The capital structure of listed industrial companies in
Jordan. Arabic Journal of Administrative Sciences, 8: 273-289.
25. Ozkan, A. (2001). Determinants of capital structure and adjustment to long run target:
evidence from UK company panel data. Journal of Business Finance and Accounting, 28: 175-198.
26. Pandey, M. (2001). Capital structure and the firm characteristics: evidence from An
emerging Market, Indian Institute of Management Ahmedabad, working paper: 3-5.
27. Pandey, I.M. (2006). Financial management,(9th
ed.). Vikas Publishing House Pvt. Ltd.
28. Pandey, I.M., Chotigeat, T. & Ranjit, M.K. (2000). Capital structure choices in an
emerging capital market: case of Thailand. Management and Change, 4(1): 1-14.
29. Rajan, R.G. & Zingales, L. (1995).What do we know about capital structure choice?:
some evidence from international data. Journal of Finance, 50(5): 1421–60.
30. Keshar, J. & Baral. (2004). Determinants of capital structure; a case study of listed
companies of Nepal. The Journal of Nepalese Business studies,1.
31. Titman, S. & Wessels, R. (1988). The determinants of capital structure choice. The
Journal of Finance, 43(1): 1-19.
32. Velnampy, T. & Nimalathasan, B.(2008). An association between organizational growth
and profitability: a study of Commercial Bank of Ceylon ltd Sri Lanka. Annals of University of
Bucharest, Economic and Administrative Series, 2: 46-57
33. Velnampy, T. & Nimalathasan, B. (2010). Firm size on profitability: a comparative study
of Bank of Ceylon and Commercial Bank of Ceylon Ltd in Sri Lanka. Global Journal of
Management and Business Researh,10(2): 96-102.
34. Velnampy, (2013) Corporate Governance and Firm Performance: A Study of Sri Lankan Manufacturing
Companies; Journal of Economics and Sustainable Development 4(3); 228-236
35. Velnampy.T and Pratheepkanth.P,(2012),Portfolio Structure and Performance: A Study on Selected
Financial Organisation in Sri Lanka, Opinion: International Journal of Business
Management,2(2).
36. Velnampy.T. (2005), A Study on Investment Apparaisal and Profitability.Journal of Business
Studies,(2);23-35.
37. Velnampy.T. (2005), Application of Investment Appraisal Techniques in Kanchipuram Modern Rice
Mill,International Conference on ‘Emerging Trend in Capital Market’,Madras University.
38. Wald John K. (1999). How firm characteristics affect capital structure: an international
Comparison. Journal of Financial Research, 22(2): 161-187.
39. Wiwattanakantang, Y. (1999). An empirical study on the determinants of the capital structure of Thai firms.
Pacific-Basin Finance Journal, Elsevier, 7(3-4): 371-403.
40. Hand book of listed companies. (2009).Colombo Stock Exchange.
Related Documents