Open Journal of Social Sciences, 2016, 4, 137-146 Published Online July 2016 in SciRes. http://www.scirp.org/journal/jss http://dx.doi.org/10.4236/jss.2016.47023 How to cite this paper: Obisesan, A. and Famous, O. (2016) Factors Affecting Water Supply in Owah-Abbi, Delta State. Open Journal of Social Sciences, 4, 137-146. http://dx.doi.org/10.4236/jss.2016.47023 Factors Affecting Water Supply in Owah-Abbi, Delta State Adekunle Obisesan, Ozabor Famous Geography and Environmental Management Department, Uniport, Choba, Nigeria Received 17 June 2016; accepted 18 July 2016; published 21 July 2016 Copyright © 2016 by authors and Scientific Research Publishing Inc. This work is licensed under the Creative Commons Attribution International License (CC BY). http://creativecommons.org/licenses/by/4.0/ Abstract This study aims at examining the factors that influence inadequate water supply in Owah-Abbi. The research was conducted by applying the survey research design and data relevant to the topic of study were generated via direct field measurement and administration of questionnaire. Find- ings include: major sources of water in Owah Abbi Community including Borehole (57.33%), hand dug well (21.33%) and River/Stream water (12%), and those who depend on rain water are 9.33%. It was also revealed that in Owah-Abbi Community water is provided by Government (42.66%); Community (20.67%); Individual efforts (10.67%) and other bodies (26%). Similarly, causes of the water shortage in Owah-Abbi Community included corruption (37.33%); unfavoura- ble Government policies (25.33%); while 17.33% blamed it on the theft and vandalization of Owah- Abbi water supply facilities. Others were the poor management culture of the facilities (8.67%), Erratic Power supply in the community (6.67%), Faulty Hydraulic equipment (2.67%) and care- lessness (2%). The study recommended that the government should provide water for the people of Owah-Abbi as a matter of urgency; protection of the existing water infrastructures was also re- quired; the people of Owah-Abbi should be advised on the need to purify water; enlightenment programs should be carried out in the area. Keywords Factors, Water, Owah-Abbi, Vandalization 1. Introduction In the past few decades, there have been frantic efforts to provide domestic water for both the rural and urban areas in the developed countries. Yet in Africa and other less developed continents, there is still no sufficient water for domestic use [1] [2]. Similarly, while some parts of these developing countries have access to clean

Welcome message from author
This document is posted to help you gain knowledge. Please leave a comment to let me know what you think about it! Share it to your friends and learn new things together.
Transcript
Open Journal of Social Sciences, 2016, 4, 137-146 Published Online July 2016 in SciRes. http://www.scirp.org/journal/jss http://dx.doi.org/10.4236/jss.2016.47023
How to cite this paper: Obisesan, A. and Famous, O. (2016) Factors Affecting Water Supply in Owah-Abbi, Delta State. Open Journal of Social Sciences, 4, 137-146. http://dx.doi.org/10.4236/jss.2016.47023
Factors Affecting Water Supply in Owah-Abbi, Delta State Adekunle Obisesan, Ozabor Famous Geography and Environmental Management Department, Uniport, Choba, Nigeria
Received 17 June 2016; accepted 18 July 2016; published 21 July 2016
Copyright © 2016 by authors and Scientific Research Publishing Inc. This work is licensed under the Creative Commons Attribution International License (CC BY). http://creativecommons.org/licenses/by/4.0/
Abstract This study aims at examining the factors that influence inadequate water supply in Owah-Abbi. The research was conducted by applying the survey research design and data relevant to the topic of study were generated via direct field measurement and administration of questionnaire. Find-ings include: major sources of water in Owah Abbi Community including Borehole (57.33%), hand dug well (21.33%) and River/Stream water (12%), and those who depend on rain water are 9.33%. It was also revealed that in Owah-Abbi Community water is provided by Government (42.66%); Community (20.67%); Individual efforts (10.67%) and other bodies (26%). Similarly, causes of the water shortage in Owah-Abbi Community included corruption (37.33%); unfavoura-ble Government policies (25.33%); while 17.33% blamed it on the theft and vandalization of Owah- Abbi water supply facilities. Others were the poor management culture of the facilities (8.67%), Erratic Power supply in the community (6.67%), Faulty Hydraulic equipment (2.67%) and care-lessness (2%). The study recommended that the government should provide water for the people of Owah-Abbi as a matter of urgency; protection of the existing water infrastructures was also re-quired; the people of Owah-Abbi should be advised on the need to purify water; enlightenment programs should be carried out in the area.
Keywords Factors, Water, Owah-Abbi, Vandalization
1. Introduction In the past few decades, there have been frantic efforts to provide domestic water for both the rural and urban areas in the developed countries. Yet in Africa and other less developed continents, there is still no sufficient water for domestic use [1] [2]. Similarly, while some parts of these developing countries have access to clean
A. Obisesan, O. Famous
138
and unpolluted water for domestic use, some other parts especially the rural poor may have to trek long dis-tances, pay so much to get even less than the needed daily amount of water to use [3].
However, clean and unpolluted water is a basic requirement for sustainable development [4]. This thus prompted the government of countries at the United Nation summit in the year 2000 to list provision of clean water as one of the major targets of the millennium development goals [5]. However, with this level of impor-tance, accorded water it is sad to remark that in the rural areas of Nigeria where about 50% of the total popula-tion resides, 60% to 65% of the population do not have access to clean and unpolluted water [4]. Therefore, in an attempt to capture the factors responsible for poor access to portable water in the rural areas of the developing countries [6], some factors which include and not restricted to design, performance and maintenance, societal problems, institutional failures, financial impediments etc. are identified. In the view of [7], factors that account for the low access to domestic water supply include poor water supply facilities, poor technical capacity of the host communities and a lack of adequate regulatory frame work that captures portable water supply. Further-more, [4] suggested that the factors of rural water supply included lack of maintenance, lack of community par-ticipation, lack of co-ordination and co-operation among stakeholders, politics, inefficient monitoring, and poor attitude towards government property. However, when the basic water requirement (BWR) per person per day as prescribed by World Health Organization (WHO) (which is 20 ltrs) is not provided, problems that include poor sanitation, spread of diseases, exhaustion, etc. will become prevalent in any geographic space [8]-[15].
In Owah-Abbi, there are shortages in water for domestic use. The people have to travel far distances to get portable water for home use. This has resulted in untold hardship for the people there. However there are few individual that can afford personal borehole in the area since the cost for erecting storage tanks ranges from 450 to 500 thousand Naira. Even the few privately owned borehole owners complain of not having power (for two years now) to pump water and rather resort to the use of generators. All these have either forced the people in the area to use the water from the river Ethiopie, which is polluted [16], or harvest rainwater which is acidic [17], or use less than the required amount of water per day in a household. All these problems stated have social and health implications on the people there. This study is however set out to find out the factors affecting water supply in Owah-Abbi.
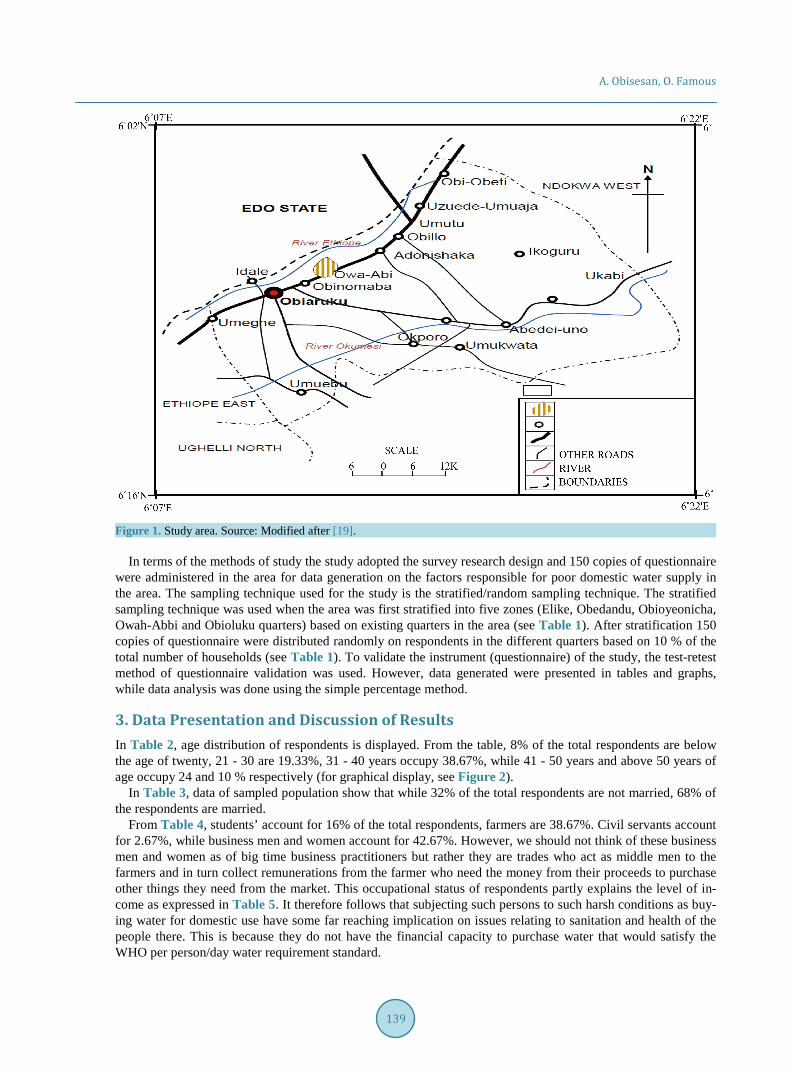
2. Materials and Methods Owah-Abbi is located in the South geopolitical zone of Nigeria. It is located between latitude 5˚50'N and 5˚52'N and longitude 6˚8' East and 6˚11' of the Greenwich meridian (see Figure 1). Owah-Abbi is bounded to the west by river Ethiope, the east by Ebedei and in the south by Obinomba and the total land area of the community is 2016 km sq. The entire Delta State is a region built up of sedimentation of the Niger Delta and consists of the Delta in various stages of development of which Owah-Abbi in Ukwuani Local Government falls within. The area is located on a relatively low land, but towards the Northern region of the area the land scape slopes gently, forming the valley drain of the river Ethiope and across the river the land rises gently forming a high land. This singular factor thus affects the depth of the water table which in turn increases the amount it costs to sink a bo-rehole in the area. Owah-Abbi enjoys tropical equatorial climate with long wet season of over 8 months, with a break in August. Apart from the wet season, Owah-Abbi also experiences dry season which is characterized by high temperature (27˚C - 31˚C) which normally last between 2 - 3 months (December to February). The rain fall type in the area is mainly of conventional rainfall. However the factors that account for the prevailing climate in the area include the prevalence of the Tropical (mT) air mass, and the tropical continental (cT) air mass. The mT air mass which is warm, moist and humid prevails almost throughout the year and usher in rainfall into the area during the period of its prevalence. While the cT on the other hand is dry and dusty and this air mass brings in the harmattan season and it lasts for two to three months [18]. Apart from these two factors that affect the cli-mate of the area, some urbanization activities and gas flaring from neighbouring town (Ebedei) has also lead to increase temperature, acid rainfall phenomenon and low relative humidity [18].
The people there are mainly farmers who specialize in agricultural product such as plantain, yam, Garri. Thus on market days popularly known as Olie which attract a large number of people from the surrounding towns and cities presents the farmers with the opportunity to sell their farm produce such as Garri, plantain, yam etc how-ever at a very cheap price. This further explains the reason why the people cannot afford a borehole of their own and would rather prefer to trek far distances to get water that is portable and fit for domestic use.
A. Obisesan, O. Famous
139
Figure 1. Study area. Source: Modified after [19].
In terms of the methods of study the study adopted the survey research design and 150 copies of questionnaire were administered in the area for data generation on the factors responsible for poor domestic water supply in the area. The sampling technique used for the study is the stratified/random sampling technique. The stratified sampling technique was used when the area was first stratified into five zones (Elike, Obedandu, Obioyeonicha, Owah-Abbi and Obioluku quarters) based on existing quarters in the area (see Table 1). After stratification 150 copies of questionnaire were distributed randomly on respondents in the different quarters based on 10 % of the total number of households (see Table 1). To validate the instrument (questionnaire) of the study, the test-retest method of questionnaire validation was used. However, data generated were presented in tables and graphs, while data analysis was done using the simple percentage method.
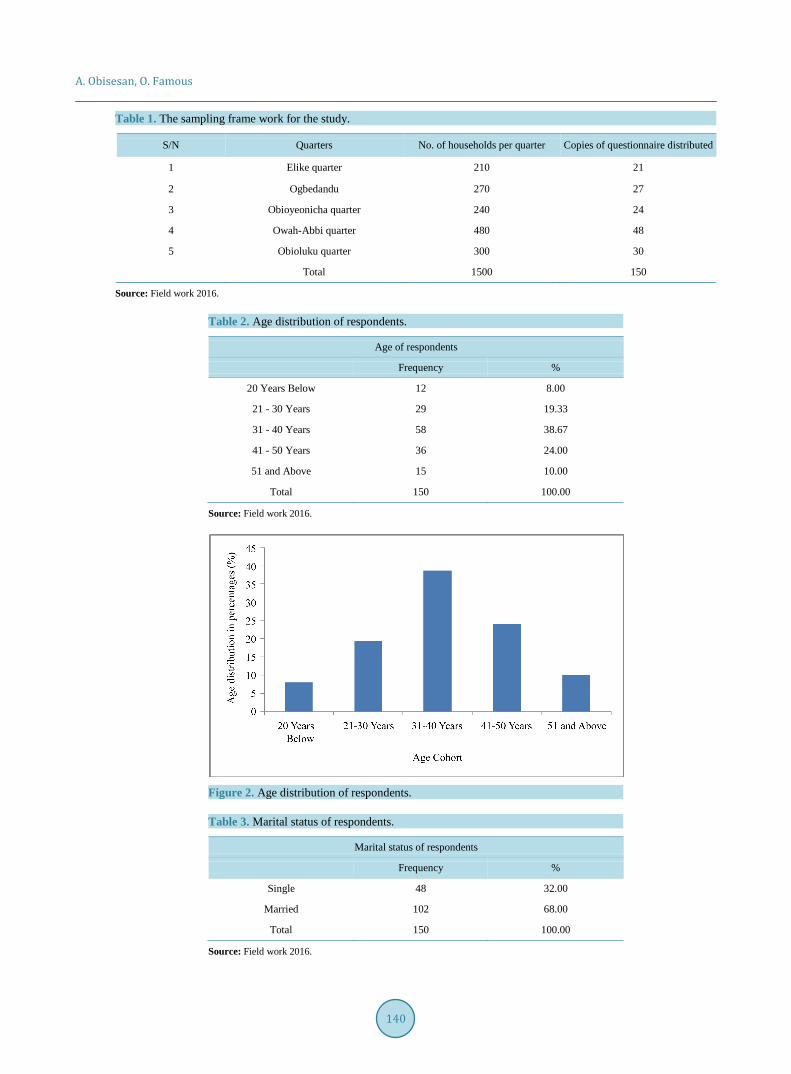
3. Data Presentation and Discussion of Results In Table 2, age distribution of respondents is displayed. From the table, 8% of the total respondents are below the age of twenty, 21 - 30 are 19.33%, 31 - 40 years occupy 38.67%, while 41 - 50 years and above 50 years of age occupy 24 and 10 % respectively (for graphical display, see Figure 2).
In Table 3, data of sampled population show that while 32% of the total respondents are not married, 68% of the respondents are married.
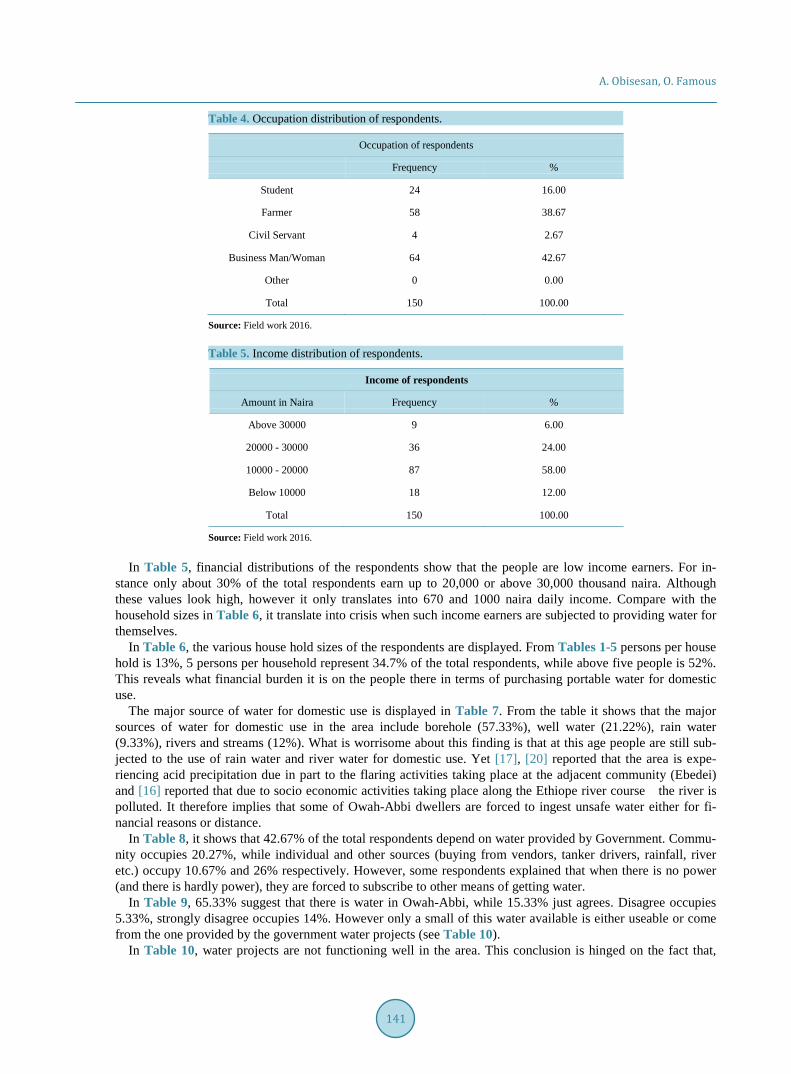
From Table 4, students’ account for 16% of the total respondents, farmers are 38.67%. Civil servants account for 2.67%, while business men and women account for 42.67%. However, we should not think of these business men and women as of big time business practitioners but rather they are trades who act as middle men to the farmers and in turn collect remunerations from the farmer who need the money from their proceeds to purchase other things they need from the market. This occupational status of respondents partly explains the level of in-come as expressed in Table 5. It therefore follows that subjecting such persons to such harsh conditions as buy-ing water for domestic use have some far reaching implication on issues relating to sanitation and health of the people there. This is because they do not have the financial capacity to purchase water that would satisfy the WHO per person/day water requirement standard.
A. Obisesan, O. Famous
140
Table 1. The sampling frame work for the study.
S/N Quarters No. of households per quarter Copies of questionnaire distributed
1 Elike quarter 210 21
2 Ogbedandu 270 27
3 Obioyeonicha quarter 240 24
4 Owah-Abbi quarter 480 48
5 Obioluku quarter 300 30
Total 1500 150
Source: Field work 2016.
Table 2. Age distribution of respondents.
Age of respondents
Frequency %
20 Years Below 12 8.00
21 - 30 Years 29 19.33
31 - 40 Years 58 38.67
41 - 50 Years 36 24.00
51 and Above 15 10.00
Total 150 100.00
Source: Field work 2016.
Figure 2. Age distribution of respondents.
Table 3. Marital status of respondents.
Marital status of respondents
Frequency %
Single 48 32.00
Married 102 68.00
Total 150 100.00
Source: Field work 2016.
A. Obisesan, O. Famous
141
Table 4. Occupation distribution of respondents.
Occupation of respondents
Frequency %
Student 24 16.00
Farmer 58 38.67
Civil Servant 4 2.67
Business Man/Woman 64 42.67
Other 0 0.00
Total 150 100.00
Source: Field work 2016.
Table 5. Income distribution of respondents.
Income of respondents
Amount in Naira Frequency %
Above 30000 9 6.00
20000 - 30000 36 24.00
10000 - 20000 87 58.00
Below 10000 18 12.00
Total 150 100.00
Source: Field work 2016.
In Table 5, financial distributions of the respondents show that the people are low income earners. For in-stance only about 30% of the total respondents earn up to 20,000 or above 30,000 thousand naira. Although these values look high, however it only translates into 670 and 1000 naira daily income. Compare with the household sizes in Table 6, it translate into crisis when such income earners are subjected to providing water for themselves.
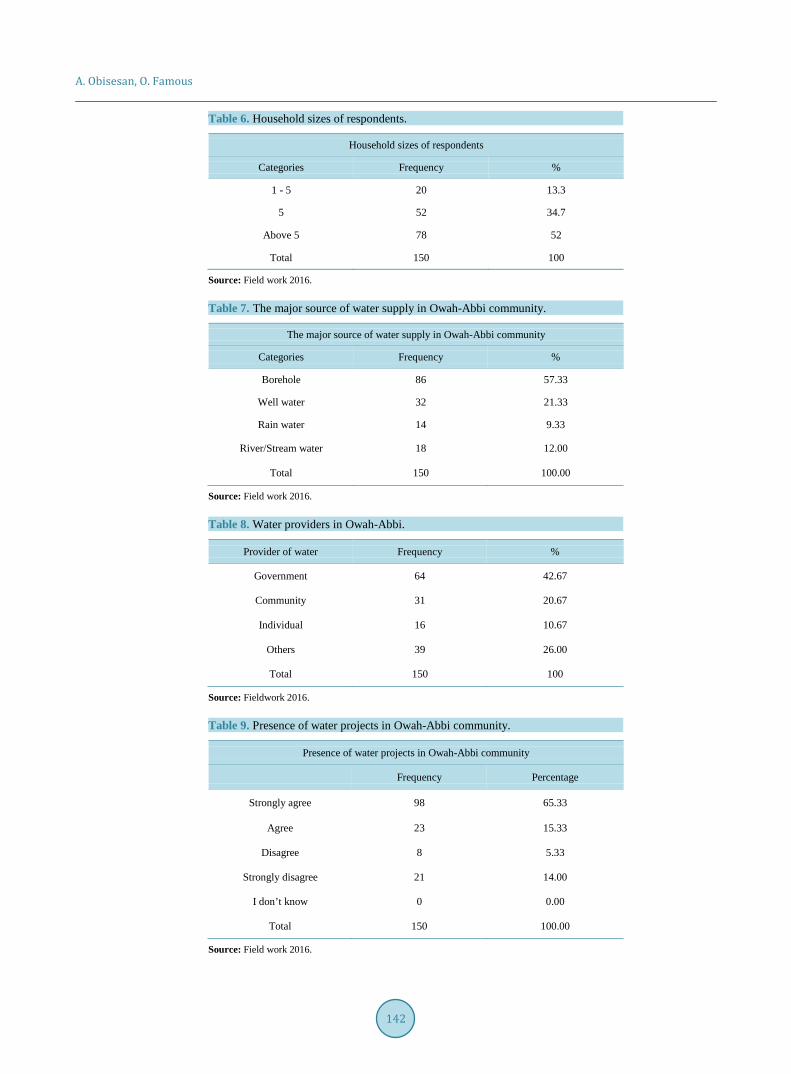
In Table 6, the various house hold sizes of the respondents are displayed. From Tables 1-5 persons per house hold is 13%, 5 persons per household represent 34.7% of the total respondents, while above five people is 52%. This reveals what financial burden it is on the people there in terms of purchasing portable water for domestic use.
The major source of water for domestic use is displayed in Table 7. From the table it shows that the major sources of water for domestic use in the area include borehole (57.33%), well water (21.22%), rain water (9.33%), rivers and streams (12%). What is worrisome about this finding is that at this age people are still sub-jected to the use of rain water and river water for domestic use. Yet [17], [20] reported that the area is expe-riencing acid precipitation due in part to the flaring activities taking place at the adjacent community (Ebedei) and [16] reported that due to socio economic activities taking place along the Ethiope river course the river is polluted. It therefore implies that some of Owah-Abbi dwellers are forced to ingest unsafe water either for fi-nancial reasons or distance.
In Table 8, it shows that 42.67% of the total respondents depend on water provided by Government. Commu-nity occupies 20.27%, while individual and other sources (buying from vendors, tanker drivers, rainfall, river etc.) occupy 10.67% and 26% respectively. However, some respondents explained that when there is no power (and there is hardly power), they are forced to subscribe to other means of getting water.
In Table 9, 65.33% suggest that there is water in Owah-Abbi, while 15.33% just agrees. Disagree occupies 5.33%, strongly disagree occupies 14%. However only a small of this water available is either useable or come from the one provided by the government water projects (see Table 10).
In Table 10, water projects are not functioning well in the area. This conclusion is hinged on the fact that,
A. Obisesan, O. Famous
142
Table 6. Household sizes of respondents.
Household sizes of respondents
Categories Frequency %
1 - 5 20 13.3
5 52 34.7
Above 5 78 52
Total 150 100
Source: Field work 2016.
Table 7. The major source of water supply in Owah-Abbi community.
The major source of water supply in Owah-Abbi community
Categories Frequency %
Borehole 86 57.33
Well water 32 21.33
Rain water 14 9.33
River/Stream water 18 12.00
Total 150 100.00
Source: Field work 2016.
Table 8. Water providers in Owah-Abbi.
Provider of water Frequency %
Government 64 42.67
Community 31 20.67
Individual 16 10.67
Others 39 26.00
Total 150 100
Source: Fieldwork 2016.
Table 9. Presence of water projects in Owah-Abbi community.
Presence of water projects in Owah-Abbi community
Frequency Percentage
Strongly agree 98 65.33
Agree 23 15.33
Disagree 8 5.33
Strongly disagree 21 14.00
I don’t know 0 0.00
Total 150 100.00
Source: Field work 2016.
A. Obisesan, O. Famous
143
Table 10. All water projects are functional.
All water projects are functional
Frequency Percentage
Strongly agree 8 5.33
Agree 1 0.67
Disagree 18 12.00
Strongly disagree 123 82.00
I don’t know 0 0.00
Total 150 100.00
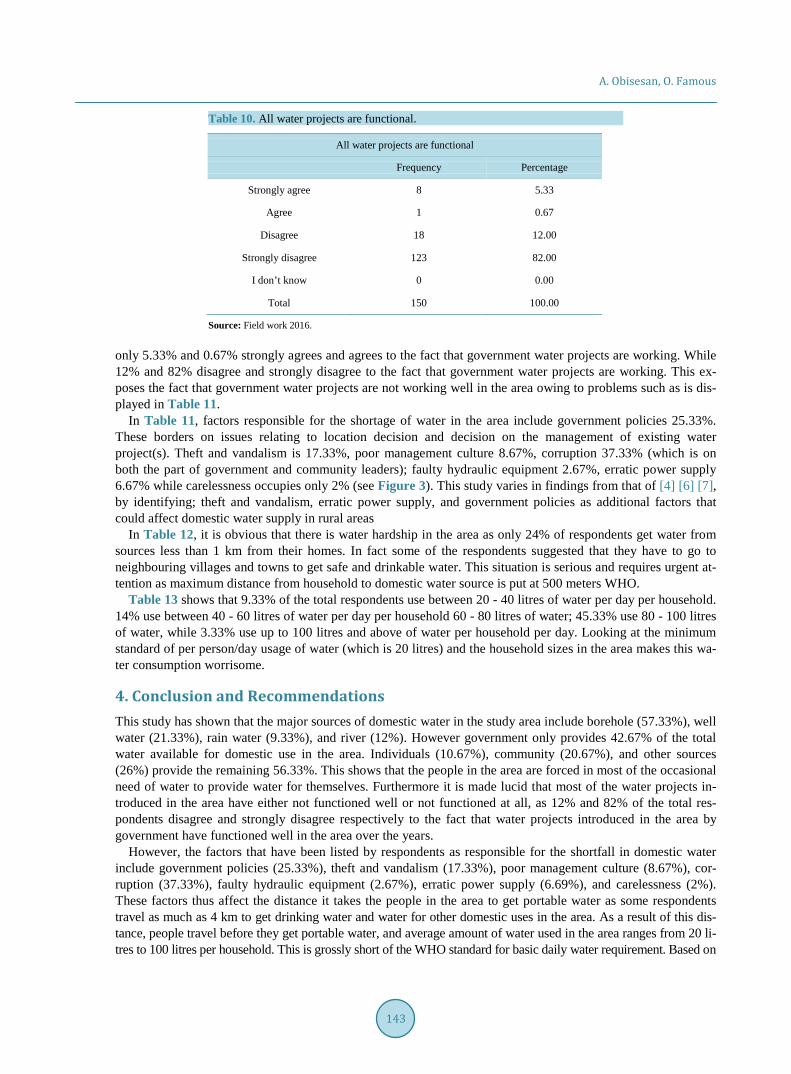
Source: Field work 2016. only 5.33% and 0.67% strongly agrees and agrees to the fact that government water projects are working. While 12% and 82% disagree and strongly disagree to the fact that government water projects are working. This ex-poses the fact that government water projects are not working well in the area owing to problems such as is dis-played in Table 11.
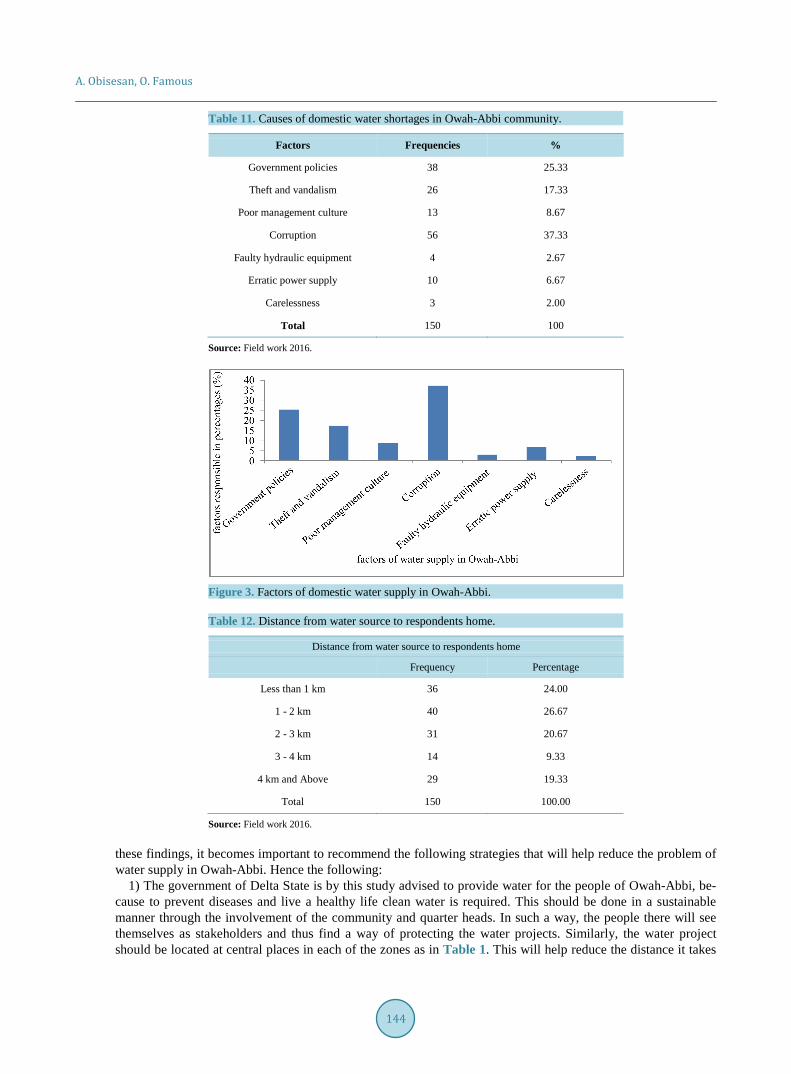
In Table 11, factors responsible for the shortage of water in the area include government policies 25.33%. These borders on issues relating to location decision and decision on the management of existing water project(s). Theft and vandalism is 17.33%, poor management culture 8.67%, corruption 37.33% (which is on both the part of government and community leaders); faulty hydraulic equipment 2.67%, erratic power supply 6.67% while carelessness occupies only 2% (see Figure 3). This study varies in findings from that of [4] [6] [7], by identifying; theft and vandalism, erratic power supply, and government policies as additional factors that could affect domestic water supply in rural areas
In Table 12, it is obvious that there is water hardship in the area as only 24% of respondents get water from sources less than 1 km from their homes. In fact some of the respondents suggested that they have to go to neighbouring villages and towns to get safe and drinkable water. This situation is serious and requires urgent at-tention as maximum distance from household to domestic water source is put at 500 meters WHO.
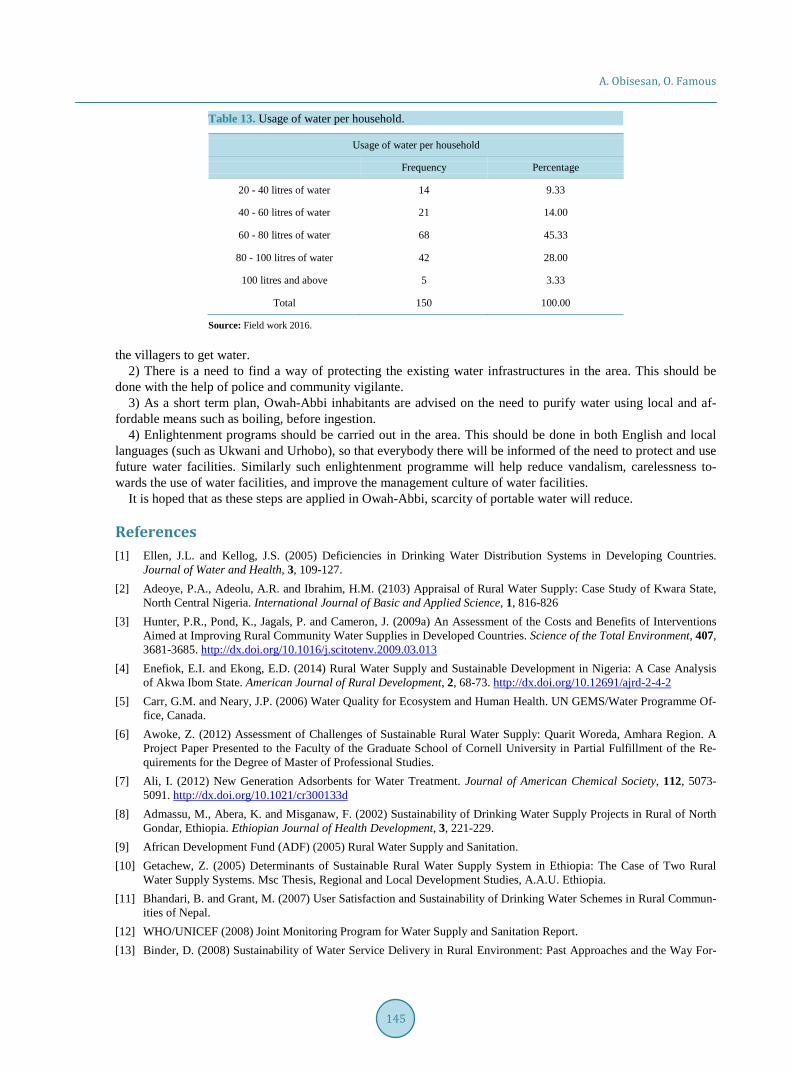
Table 13 shows that 9.33% of the total respondents use between 20 - 40 litres of water per day per household. 14% use between 40 - 60 litres of water per day per household 60 - 80 litres of water; 45.33% use 80 - 100 litres of water, while 3.33% use up to 100 litres and above of water per household per day. Looking at the minimum standard of per person/day usage of water (which is 20 litres) and the household sizes in the area makes this wa-ter consumption worrisome.
4. Conclusion and Recommendations This study has shown that the major sources of domestic water in the study area include borehole (57.33%), well water (21.33%), rain water (9.33%), and river (12%). However government only provides 42.67% of the total water available for domestic use in the area. Individuals (10.67%), community (20.67%), and other sources (26%) provide the remaining 56.33%. This shows that the people in the area are forced in most of the occasional need of water to provide water for themselves. Furthermore it is made lucid that most of the water projects in-troduced in the area have either not functioned well or not functioned at all, as 12% and 82% of the total res-pondents disagree and strongly disagree respectively to the fact that water projects introduced in the area by government have functioned well in the area over the years.
However, the factors that have been listed by respondents as responsible for the shortfall in domestic water include government policies (25.33%), theft and vandalism (17.33%), poor management culture (8.67%), cor-ruption (37.33%), faulty hydraulic equipment (2.67%), erratic power supply (6.69%), and carelessness (2%). These factors thus affect the distance it takes the people in the area to get portable water as some respondents travel as much as 4 km to get drinking water and water for other domestic uses in the area. As a result of this dis-tance, people travel before they get portable water, and average amount of water used in the area ranges from 20 li-tres to 100 litres per household. This is grossly short of the WHO standard for basic daily water requirement. Based on
A. Obisesan, O. Famous
144
Table 11. Causes of domestic water shortages in Owah-Abbi community.
Factors Frequencies %
Government policies 38 25.33
Theft and vandalism 26 17.33
Poor management culture 13 8.67
Corruption 56 37.33
Faulty hydraulic equipment 4 2.67
Erratic power supply 10 6.67
Carelessness 3 2.00
Total 150 100
Source: Field work 2016.
Figure 3. Factors of domestic water supply in Owah-Abbi.
Table 12. Distance from water source to respondents home.
Distance from water source to respondents home
Frequency Percentage
Less than 1 km 36 24.00
1 - 2 km 40 26.67
2 - 3 km 31 20.67
3 - 4 km 14 9.33
4 km and Above 29 19.33
Total 150 100.00
Source: Field work 2016. these findings, it becomes important to recommend the following strategies that will help reduce the problem of water supply in Owah-Abbi. Hence the following:
1) The government of Delta State is by this study advised to provide water for the people of Owah-Abbi, be-cause to prevent diseases and live a healthy life clean water is required. This should be done in a sustainable manner through the involvement of the community and quarter heads. In such a way, the people there will see themselves as stakeholders and thus find a way of protecting the water projects. Similarly, the water project should be located at central places in each of the zones as in Table 1. This will help reduce the distance it takes
A. Obisesan, O. Famous
145
Table 13. Usage of water per household.
Usage of water per household
Frequency Percentage
20 - 40 litres of water 14 9.33
40 - 60 litres of water 21 14.00
60 - 80 litres of water 68 45.33
80 - 100 litres of water 42 28.00
100 litres and above 5 3.33
Total 150 100.00
Source: Field work 2016. the villagers to get water.
2) There is a need to find a way of protecting the existing water infrastructures in the area. This should be done with the help of police and community vigilante.
3) As a short term plan, Owah-Abbi inhabitants are advised on the need to purify water using local and af-fordable means such as boiling, before ingestion.
4) Enlightenment programs should be carried out in the area. This should be done in both English and local languages (such as Ukwani and Urhobo), so that everybody there will be informed of the need to protect and use future water facilities. Similarly such enlightenment programme will help reduce vandalism, carelessness to-wards the use of water facilities, and improve the management culture of water facilities.
It is hoped that as these steps are applied in Owah-Abbi, scarcity of portable water will reduce.
References [1] Ellen, J.L. and Kellog, J.S. (2005) Deficiencies in Drinking Water Distribution Systems in Developing Countries.
Journal of Water and Health, 3, 109-127. [2] Adeoye, P.A., Adeolu, A.R. and Ibrahim, H.M. (2103) Appraisal of Rural Water Supply: Case Study of Kwara State,
North Central Nigeria. International Journal of Basic and Applied Science, 1, 816-826 [3] Hunter, P.R., Pond, K., Jagals, P. and Cameron, J. (2009a) An Assessment of the Costs and Benefits of Interventions
Aimed at Improving Rural Community Water Supplies in Developed Countries. Science of the Total Environment, 407, 3681-3685. http://dx.doi.org/10.1016/j.scitotenv.2009.03.013
[4] Enefiok, E.I. and Ekong, E.D. (2014) Rural Water Supply and Sustainable Development in Nigeria: A Case Analysis of Akwa Ibom State. American Journal of Rural Development, 2, 68-73. http://dx.doi.org/10.12691/ajrd-2-4-2
[5] Carr, G.M. and Neary, J.P. (2006) Water Quality for Ecosystem and Human Health. UN GEMS/Water Programme Of-fice, Canada.
[6] Awoke, Z. (2012) Assessment of Challenges of Sustainable Rural Water Supply: Quarit Woreda, Amhara Region. A Project Paper Presented to the Faculty of the Graduate School of Cornell University in Partial Fulfillment of the Re-quirements for the Degree of Master of Professional Studies.
[7] Ali, I. (2012) New Generation Adsorbents for Water Treatment. Journal of American Chemical Society, 112, 5073- 5091. http://dx.doi.org/10.1021/cr300133d
[8] Admassu, M., Abera, K. and Misganaw, F. (2002) Sustainability of Drinking Water Supply Projects in Rural of North Gondar, Ethiopia. Ethiopian Journal of Health Development, 3, 221-229.
[9] African Development Fund (ADF) (2005) Rural Water Supply and Sanitation. [10] Getachew, Z. (2005) Determinants of Sustainable Rural Water Supply System in Ethiopia: The Case of Two Rural
Water Supply Systems. Msc Thesis, Regional and Local Development Studies, A.A.U. Ethiopia. [11] Bhandari, B. and Grant, M. (2007) User Satisfaction and Sustainability of Drinking Water Schemes in Rural Commun-
ities of Nepal. [12] WHO/UNICEF (2008) Joint Monitoring Program for Water Supply and Sanitation Report. [13] Binder, D. (2008) Sustainability of Water Service Delivery in Rural Environment: Past Approaches and the Way For-
A. Obisesan, O. Famous
146
ward February 2008. [14] Demeke, A. (2009) Determinants of Household Participation in Water Resource Management: Achefer Amhara Ethi-
opia. MPS Thesis, Cornell University, Ithaca, NY, USA. [15] USAID (2009) Environmental Guidelines for Small-Scale Activities in Africa. Chapter 16: Water and Sanitation. [16] Okumagba, P.O. and Ozabor, F. (2014) The Effects of Socio-Economic Activities on River Ethiopia. Journal of Sus-
tainable Society, 3, 1-6. http://dx.doi.org/10.11634/216825851403528 [17] Ojeh, V.N. (2012) Sustainable Development and Gas Flaring Activities: A Case Study of Ebedei Area of Ukwuani
LGA, Delta State, Nigeria. Journal of Resources and Environment, 2, 169-174. http://dx.doi.org/10.5923/j.re.20120204.06
[18] Efe, S.I. (2002) Gas Flaring and the Niger Delta Environment. A Climatological Analysis. Afr J Environ Stud., 3, 11-17.
[19] Ojeh, V.N. and Ugboma, P. (2012) Flood Hazards in Urban Niger Delta: A Case Study of Abraka Town. International Journal of Environmental Engineering Research, 1, 23-29.
[20] Ozabor, F. and Obisesan, A. (2015) Gas Flaring: Impacts on Temperature, Agriculture and the People of Ebedei in Delta State Nigeria. Journal of Sustainable Society, 4, 5-12.
Submit or recommend next manuscript to SCIRP and we will provide best service for you: Accepting pre-submission inquiries through Email, Facebook, LinkedIn, Twitter, etc. A wide selection of journals (inclusive of 9 subjects, more than 200 journals) Providing 24-hour high-quality service User-friendly online submission system Fair and swift peer-review system Efficient typesetting and proofreading procedure Display of the result of downloads and visits, as well as the number of cited articles Maximum dissemination of your research work
Submit your manuscript at: http://papersubmission.scirp.org/
Related Documents