RESEARCH ARTICLE Factors affecting the seismic behavior of segmental precast bridge columns Haitham DAWOOD a , Mohamed ELGAWADY b,* , Joshua HEWES c a Virginia Polytechnic Institute and State University, Blacksburg, VA 24061-0002, USA b Department of Civil, Architectural, and Environmental Engineering, Missouri University of Science and Technology, Rolla MO 65409, USA c Department of Civil and Environmental Engineering, Northern Arizona University, Flagstaff AZ 86011, USA * Corresponding author. E-mail: [email protected] © Higher Education Press and Springer-Verlag Berlin Heidelberg 2014 ABSTRACT This manuscript discusses the design parameters that potentially affect the lateral seismic response of segmental precast post-tensioned bridge piers. The piers consist of precast circular cross section segments stacked one on top of the other with concentric tendons passing through ducts made in the segments during casting. The bottommost segments of the piers were encased in steel tubes to enhance ductility and minimize damage. An FE model was used to investigate different design parameters and how they influence the lateral force – displacement response of the piers. Design parameters investigated included the initial post-tensioning stress as a percentage of the tendon yield stress, the applied axial stresses on concrete due to post-tensioning, pier aspect ratios, construction details, steel tube thicknesses, and internal mild steel rebar added as energy dissipaters. Based on the data presented, an initial tendon stress in the range of 40%-60% of its yield stress and initial axial stress on concrete of approximately 20% of the concrete’ s characteristic strength is appropriate for most typical designs. These design values will prevent tendon yielding until lateral drift angle reaches approximately 4.5%. Changing the steel tube thickness, height, or a combination of both proved to be an effective parameter that may be used to reach a target performance level at a specific seismic zone. KEYWORDS finite element analysis, concrete, precast units, bridges 1 Introduction The Federal Highway Administration (FHWA) and the States Departments of Transportation are in urgent need to address the challenge of aging bridges, which need rehabilitation or replacement. In addition, in the last few decades, traffic demand has grown tremendously with a limited increase in highway capacity. This resulted in surging demand on improving existing highways and constructing new highways including bridges. However, large construction projects resulted in high level of congestion during lengthy construction periods. Hence, there is strong momentum to develop technology to expedite bridge construction and different transportation agencies adopted the mantra “get in, get out, stay out.” Growing number of States employ prefabricated bridge elements and systems to accelerate bridge construction. The use of precast for construction of bridge piers and abutments can have tremendous impacts on construction schedules through time saved in establishing a work zone, forming, placing reinforcement, pouring concrete, strip- ping formwork and curing, all of which can be accom- plished offsite and in parallel with other construction operations [1]. The use of precast concrete bridge piers and abutments is not a new concept. Precast post-tensioned (PPT) piers has been used in Long Key Bridge (Florida), Seven Mile Bridge (Florida), John T. Collinson Rail Bridge (Florida), Sunshine Skyway Bridge (Florida), Dauphin Island Bridge (Alabama), Neches River Bridge (Texas), Louetta Road Overpass (Texas), Linn Cove Viaduct (North Carolina), and Chesapeake and Delaware Canal Bridge (Delaware), Varina-Enon Bridge (Virginia), West Gate Free Way Article history: Received Nov. 2, 2013; Accepted May. 26, 2014 Front. Struct. Civ. Eng. DOI 10.1007/s11709-014-0264-8

Welcome message from author
This document is posted to help you gain knowledge. Please leave a comment to let me know what you think about it! Share it to your friends and learn new things together.
Transcript
RESEARCH ARTICLE
Factors affecting the seismic behavior of segmentalprecast bridge columns
Haitham DAWOODa, Mohamed ELGAWADYb,*, Joshua HEWESc
a Virginia Polytechnic Institute and State University, Blacksburg, VA 24061-0002, USAbDepartment of Civil, Architectural, and Environmental Engineering, Missouri University of Science and Technology, Rolla MO
65409, USAcDepartment of Civil and Environmental Engineering, Northern Arizona University, Flagstaff AZ 86011, USA*Corresponding author. E-mail: [email protected]
© Higher Education Press and Springer-Verlag Berlin Heidelberg 2014
ABSTRACT This manuscript discusses the design parameters that potentially affect the lateral seismic response ofsegmental precast post-tensioned bridge piers. The piers consist of precast circular cross section segments stacked one ontop of the other with concentric tendons passing through ducts made in the segments during casting. The bottommostsegments of the piers were encased in steel tubes to enhance ductility and minimize damage. An FE model was used toinvestigate different design parameters and how they influence the lateral force – displacement response of the piers.Design parameters investigated included the initial post-tensioning stress as a percentage of the tendon yield stress, theapplied axial stresses on concrete due to post-tensioning, pier aspect ratios, construction details, steel tube thicknesses,and internal mild steel rebar added as energy dissipaters. Based on the data presented, an initial tendon stress in the rangeof 40%-60% of its yield stress and initial axial stress on concrete of approximately 20% of the concrete’s characteristicstrength is appropriate for most typical designs. These design values will prevent tendon yielding until lateral drift anglereaches approximately 4.5%. Changing the steel tube thickness, height, or a combination of both proved to be an effectiveparameter that may be used to reach a target performance level at a specific seismic zone.
KEYWORDS finite element analysis, concrete, precast units, bridges
1 Introduction
The Federal Highway Administration (FHWA) and theStates Departments of Transportation are in urgent need toaddress the challenge of aging bridges, which needrehabilitation or replacement. In addition, in the last fewdecades, traffic demand has grown tremendously with alimited increase in highway capacity. This resulted insurging demand on improving existing highways andconstructing new highways including bridges. However,large construction projects resulted in high level ofcongestion during lengthy construction periods. Hence,there is strong momentum to develop technology toexpedite bridge construction and different transportationagencies adopted the mantra “get in, get out, stay out.”
Growing number of States employ prefabricated bridgeelements and systems to accelerate bridge construction.The use of precast for construction of bridge piers andabutments can have tremendous impacts on constructionschedules through time saved in establishing a work zone,forming, placing reinforcement, pouring concrete, strip-ping formwork and curing, all of which can be accom-plished offsite and in parallel with other constructionoperations [1].The use of precast concrete bridge piers and abutments is
not a new concept. Precast post-tensioned (PPT) piers hasbeen used in Long Key Bridge (Florida), Seven MileBridge (Florida), John T. Collinson Rail Bridge (Florida),Sunshine Skyway Bridge (Florida), Dauphin Island Bridge(Alabama), Neches River Bridge (Texas), Louetta RoadOverpass (Texas), Linn Cove Viaduct (North Carolina),and Chesapeake and Delaware Canal Bridge (Delaware),Varina-Enon Bridge (Virginia), West Gate Free WayArticle history: Received Nov. 2, 2013; Accepted May. 26, 2014
Front. Struct. Civ. Eng.DOI 10.1007/s11709-014-0264-8
Viaduct (Australia) [2,3]. In these projects, bonded post-tensioning tendons were used and the construction of theprecast piers emulated the conventional cast in placemonolithic reinforced concrete piers.Unbonded segmental precast post-tensioned (SPPT) pier
system has been evolved over the past two decades foraccelerating bridge construction. In addition, unbondedSPPT piers have inherent self-centering features, whichreduce residual displacement at the conclusion of anearthquake. Past research, also, showed that unbondedSPPT piers suffered less damage compared to counterpartmonolithic reinforced concrete piers. Both conventionalreinforced concrete (i.e., including vertical rebar and steelstirrups) and concrete encased in steel or fiber reinforcedpolymer tubes were used for construction of the segments[4–15].For piers having circular cross sections, past research
experimentally investigated the effects of pier aspect ratio,applied initial post-tensioning stress, and confinementthickness (i.e., thickness of the steel tube). This paper useda detailed 3D finite element model, which was developedand presented in [11] to study the effects of tendon initialpost-tensioning stress level (PT), initial concrete compres-sive stress due to post-tensioning (IS), pier aspect ratio(AR), different construction details of the system (CON),confinement thickness at the pier’s base (CTh), andinternal energy dissipating bars (IED) on the force-displacement response of SPPT piers.
2 Standard SPPT Pier
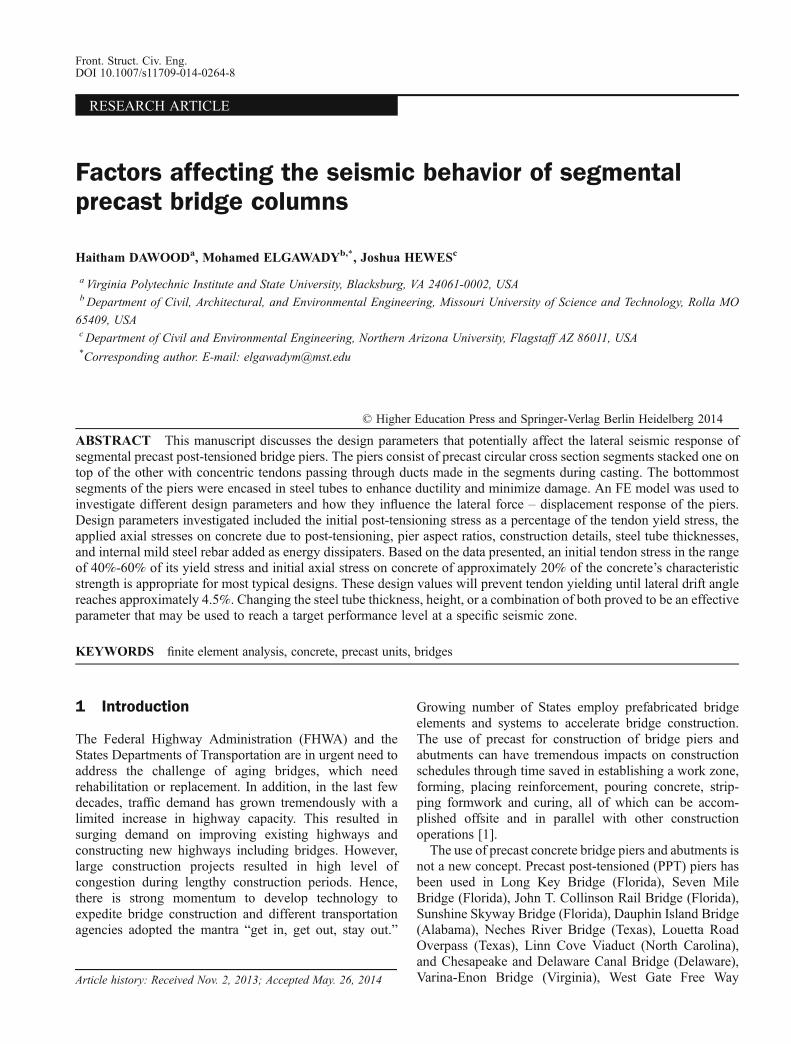
The standard pier investigated in this paper (see Fig. 1(a))was similar in dimensions to a 40% scale model namely
pier JH11 tested by Hewes [4]. The pier consisted of fourconcrete segments placed on top of each other andstructurally connected using a concentric unbonded tendoncomprised of 27 – 12.7 mm [0.5 in] diameter ASTM A779[16] Grade 270 (1860MPa [270 ksi]) low-relaxation steelstrands with a total cross-sectional area of 2665 mm2 [4.13in2]. The pier was circular in cross-section with diameter of610 mm [24 in]. The pier has an aspect ratio (AR) of 6,where aspect ratio is defined as the distance between pointof application of lateral loading and pier base divided bypier diameter. The unbonded tendon length was Lt = 4953mm [195 in]. During the experimental work, the pier wassubjected to an initial post tensioning stress correspondingto approximately 45% of the yield strength of the tendons.The bottommost segment of the pier utilized a 6.0 mm
[0.24 in] thick, ASTM A569 [17], A36 steel jacket toprovide the relatively high level of lateral confinementwhich is required due to the high compressive strainsassociated with a pier rocking about its base. The steeljacket started from the top of the bottommost segment andterminated approximately 25.4 mm [1.0 in] above itsbottom to prevent the jacket from bearing on the footingduring testing. This resulted in a jacket height ofapproximately 585 mm [23 in] or approximately 17% ofthe pier height. The steel used in jacketing the segment hadyield and ultimate strengths of 317 [46 ksi] and 460MPa[67 ksi], respectively. The jacketed segment did notcontain any longitudinal reinforcement other than thepost-tensioning tendons. Segments two through four (i.e.,the three non-jacketed segments) had 8 #4 (Gr. 60) aslongitudinal rebar spaced evenly around the perimeter ofthe section. This corresponds to a longitudinal non-prestressed reinforcement ratio of 0.35%. These barswere used to position the stirrups and hence were not
Fig. 1 Detailed dimensions for (a) standard pier and (b) pier B
2 Front. Struct. Civ. Eng.
continued between segments. The characteristic concretecompressive strength (f′c) used was 41.4 MPa [6000 psi].All other segments above the bottommost segment wereconstructed as conventional reinforced concrete segmentshaving transverse spiral of #3 of Grade 60 spaced at 75 mm[3.0 in] for lateral confinement. The upper non-jacketedsegments had a concrete cover of 25.4 mm [1.0 in]. Thepier cross section was selected to be circular since jacketconfinement is very effective for circular cross sectionscompared to rectangular ones.Throughout this manuscript the standard pier was used
for the analysis. However, to evaluate the effect of pieraspect ratio on pier response, a squat pier – namely “PierB” – was also used in the investigation. The piercharacteristics are identical to the standard pier in thismanuscript but with an aspect ratio of 3. It consisted ofonly two segments resulting in a clear height of 1524 mm[60 in] instead of 3354 mm [132 in] for the standard pier.
3 Summary of the 3D finite element model
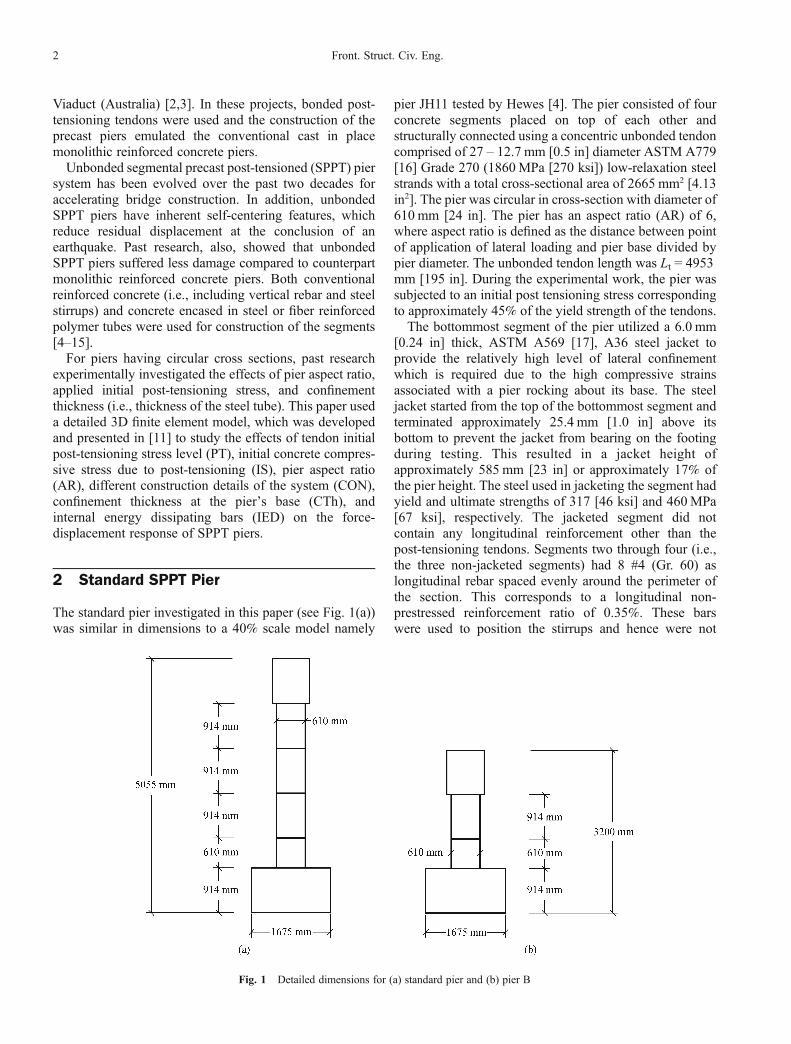
ABAQUS/Standard version 6.8-2 [18], a general-purposefinite element code, was selected as a basic platform fordeveloping a 3D detailed finite element (FE) model duringthis study. The model was built up using 3D continuumelements for concrete and fiber components and 3D beamelements for the post-tensioning tendons (Fig. 2). Thedetailed description and validation of the model are givenby [11].
The concrete damaged plasticity model [19,20] was usedto model the concrete material behavior while the classicmetal plasticity model was used for the tendon’s material.The fiber tube was modeled as an elastic orthotropicmaterial. The ends of the tendon were embedded in theloading stub (that represents the superstructure) and thefoundation to simulate the tendon’s anchorage. The tendonwas subjected to a stress type initial condition to simulateits post-tensioning. By neglecting the sliding of thefoundation and by assuming a rigid soil underneath thefoundation, the bottom surface of the foundation wasconstrained in the three motional directions. A typical pierloading stages were: a) tendon’s post-tensioning; b)application of a vertical external gravity load; and c)application of a monolithically increasing lateral displace-ment.Figure 2 shows a summary of the detailed finite element
pier model. This model was used to study the effects of sixparameters on the force-displacement response of SPPTpiers. The effects of tendon initial post-tensioning stresslevel (PT), initial concrete compressive stress due to post-tensioning (IS), pier aspect ratio (AR), different construc-tion details of the system (CON), confinement thickness atthe pier’s base (CTh), and internal energy dissipating bars(IED) on the overall behavior of the system wereinvestigated. Table 1 summarizes the different valuesassigned for each parameter. The range of these parameterswas selected to investigate a wide spectrum of values anddoes not necessarily reflect typical values to be used inpractice.
Fig. 2 A typical mesh and applied loads and displacements for the SPPT pier.
Haitham DAWOOD et al. Factors affecting the seismic behavior of segmental precast bridge columns 3
4 Results and discussions
4.1 Effects of initial post-tensioning level in the tendon
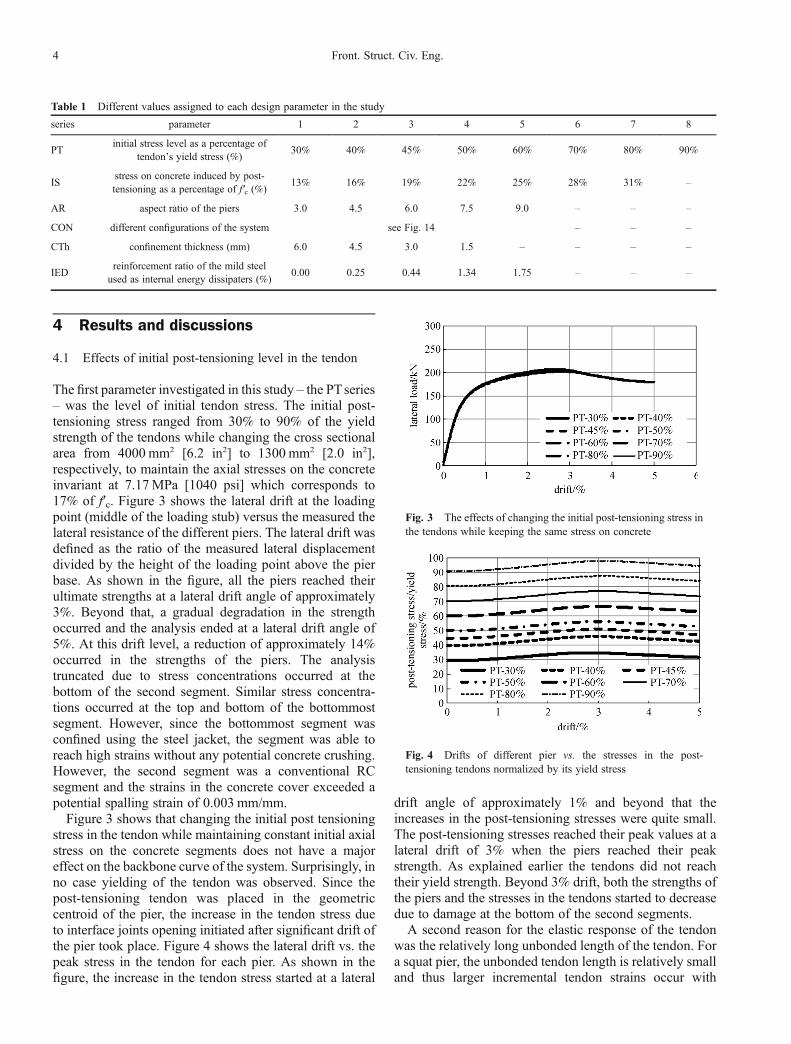
The first parameter investigated in this study – the PTseries– was the level of initial tendon stress. The initial post-tensioning stress ranged from 30% to 90% of the yieldstrength of the tendons while changing the cross sectionalarea from 4000 mm2 [6.2 in2] to 1300 mm2 [2.0 in2],respectively, to maintain the axial stresses on the concreteinvariant at 7.17MPa [1040 psi] which corresponds to17% of f′c. Figure 3 shows the lateral drift at the loadingpoint (middle of the loading stub) versus the measured thelateral resistance of the different piers. The lateral drift wasdefined as the ratio of the measured lateral displacementdivided by the height of the loading point above the pierbase. As shown in the figure, all the piers reached theirultimate strengths at a lateral drift angle of approximately3%. Beyond that, a gradual degradation in the strengthoccurred and the analysis ended at a lateral drift angle of5%. At this drift level, a reduction of approximately 14%occurred in the strengths of the piers. The analysistruncated due to stress concentrations occurred at thebottom of the second segment. Similar stress concentra-tions occurred at the top and bottom of the bottommostsegment. However, since the bottommost segment wasconfined using the steel jacket, the segment was able toreach high strains without any potential concrete crushing.However, the second segment was a conventional RCsegment and the strains in the concrete cover exceeded apotential spalling strain of 0.003 mm/mm.Figure 3 shows that changing the initial post tensioning
stress in the tendon while maintaining constant initial axialstress on the concrete segments does not have a majoreffect on the backbone curve of the system. Surprisingly, inno case yielding of the tendon was observed. Since thepost-tensioning tendon was placed in the geometriccentroid of the pier, the increase in the tendon stress dueto interface joints opening initiated after significant drift ofthe pier took place. Figure 4 shows the lateral drift vs. thepeak stress in the tendon for each pier. As shown in thefigure, the increase in the tendon stress started at a lateral
drift angle of approximately 1% and beyond that theincreases in the post-tensioning stresses were quite small.The post-tensioning stresses reached their peak values at alateral drift of 3% when the piers reached their peakstrength. As explained earlier the tendons did not reachtheir yield strength. Beyond 3% drift, both the strengths ofthe piers and the stresses in the tendons started to decreasedue to damage at the bottom of the second segments.A second reason for the elastic response of the tendon
was the relatively long unbonded length of the tendon. Fora squat pier, the unbonded tendon length is relatively smalland thus larger incremental tendon strains occur with
Table 1 Different values assigned to each design parameter in the study
series parameter 1 2 3 4 5 6 7 8
PTinitial stress level as a percentage of
tendon’s yield stress (%)30% 40% 45% 50% 60% 70% 80% 90%
ISstress on concrete induced by post-tensioning as a percentage of f′c (%)
13% 16% 19% 22% 25% 28% 31% –
AR aspect ratio of the piers 3.0 4.5 6.0 7.5 9.0 – – –
CON different configurations of the system see Fig. 14 – – –
CTh confinement thickness (mm) 6.0 4.5 3.0 1.5 – – – –
IEDreinforcement ratio of the mild steelused as internal energy dissipaters (%)
0.00 0.25 0.44 1.34 1.75 – – –
Fig. 3 The effects of changing the initial post-tensioning stress inthe tendons while keeping the same stress on concrete
Fig. 4 Drifts of different pier vs. the stresses in the post-tensioning tendons normalized by its yield stress
4 Front. Struct. Civ. Eng.
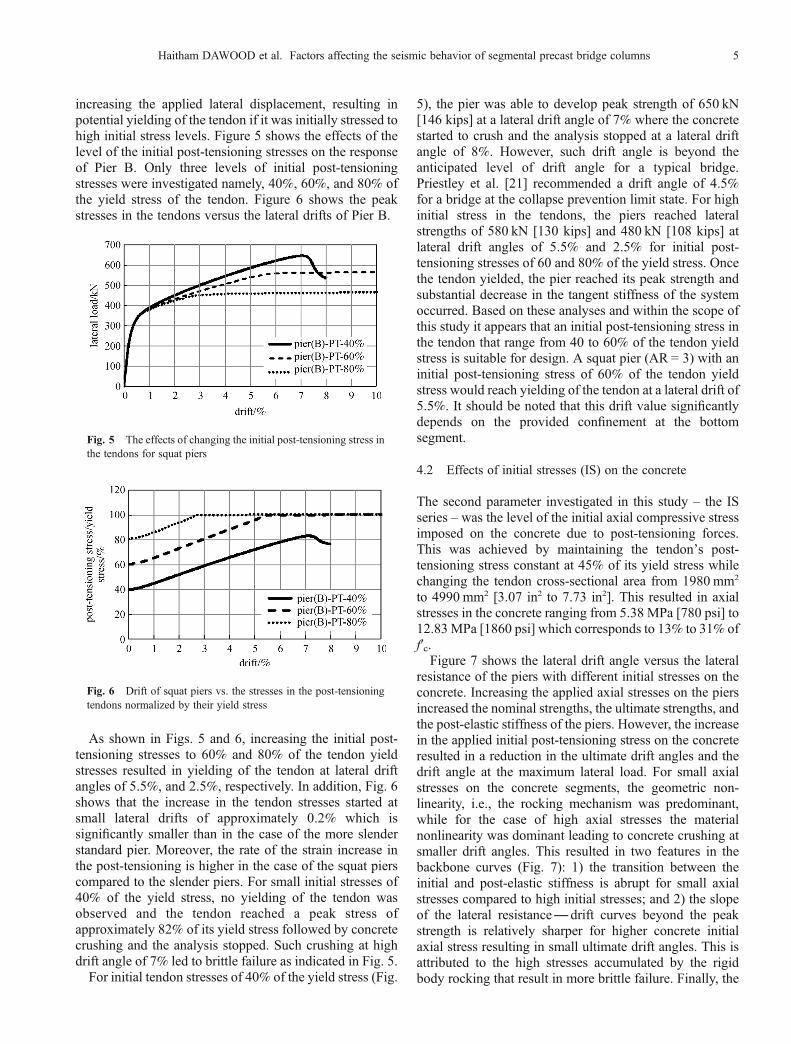
increasing the applied lateral displacement, resulting inpotential yielding of the tendon if it was initially stressed tohigh initial stress levels. Figure 5 shows the effects of thelevel of the initial post-tensioning stresses on the responseof Pier B. Only three levels of initial post-tensioningstresses were investigated namely, 40%, 60%, and 80% ofthe yield stress of the tendon. Figure 6 shows the peakstresses in the tendons versus the lateral drifts of Pier B.
As shown in Figs. 5 and 6, increasing the initial post-tensioning stresses to 60% and 80% of the tendon yieldstresses resulted in yielding of the tendon at lateral driftangles of 5.5%, and 2.5%, respectively. In addition, Fig. 6shows that the increase in the tendon stresses started atsmall lateral drifts of approximately 0.2% which issignificantly smaller than in the case of the more slenderstandard pier. Moreover, the rate of the strain increase inthe post-tensioning is higher in the case of the squat pierscompared to the slender piers. For small initial stresses of40% of the yield stress, no yielding of the tendon wasobserved and the tendon reached a peak stress ofapproximately 82% of its yield stress followed by concretecrushing and the analysis stopped. Such crushing at highdrift angle of 7% led to brittle failure as indicated in Fig. 5.For initial tendon stresses of 40% of the yield stress (Fig.
5), the pier was able to develop peak strength of 650 kN[146 kips] at a lateral drift angle of 7% where the concretestarted to crush and the analysis stopped at a lateral driftangle of 8%. However, such drift angle is beyond theanticipated level of drift angle for a typical bridge.Priestley et al. [21] recommended a drift angle of 4.5%for a bridge at the collapse prevention limit state. For highinitial stress in the tendons, the piers reached lateralstrengths of 580 kN [130 kips] and 480 kN [108 kips] atlateral drift angles of 5.5% and 2.5% for initial post-tensioning stresses of 60 and 80% of the yield stress. Oncethe tendon yielded, the pier reached its peak strength andsubstantial decrease in the tangent stiffness of the systemoccurred. Based on these analyses and within the scope ofthis study it appears that an initial post-tensioning stress inthe tendon that range from 40 to 60% of the tendon yieldstress is suitable for design. A squat pier (AR = 3) with aninitial post-tensioning stress of 60% of the tendon yieldstress would reach yielding of the tendon at a lateral drift of5.5%. It should be noted that this drift value significantlydepends on the provided confinement at the bottomsegment.
4.2 Effects of initial stresses (IS) on the concrete
The second parameter investigated in this study – the ISseries – was the level of the initial axial compressive stressimposed on the concrete due to post-tensioning forces.This was achieved by maintaining the tendon’s post-tensioning stress constant at 45% of its yield stress whilechanging the tendon cross-sectional area from 1980 mm2
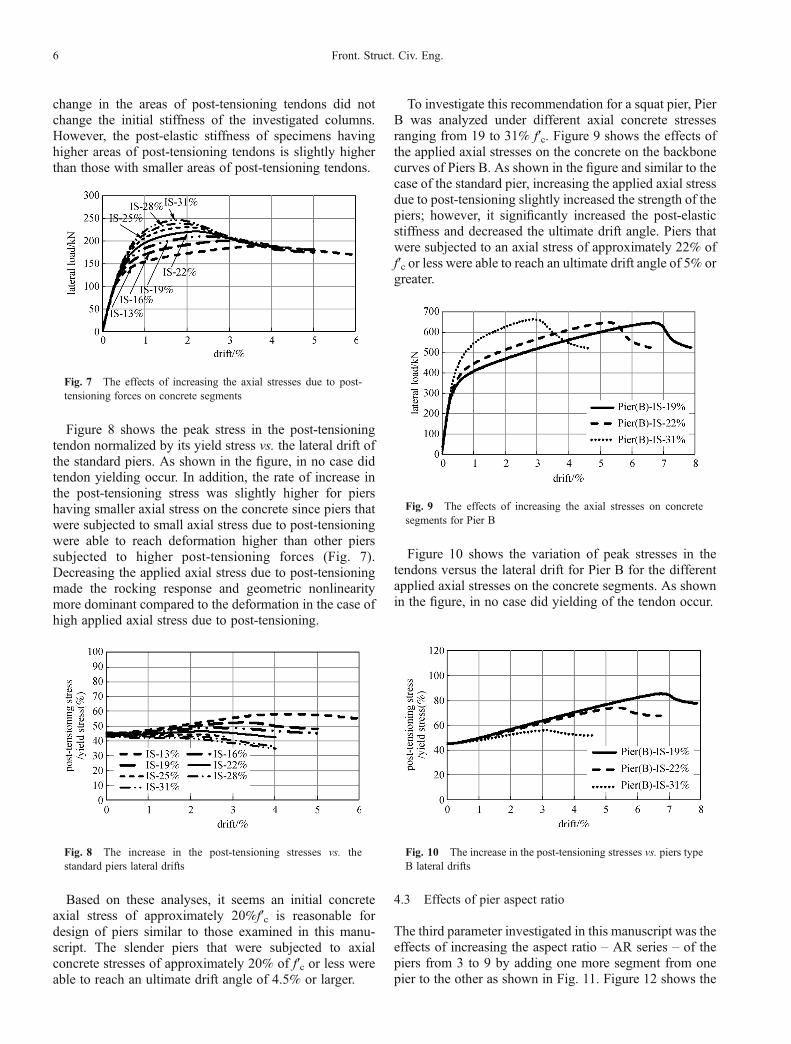
to 4990 mm2 [3.07 in2 to 7.73 in2]. This resulted in axialstresses in the concrete ranging from 5.38 MPa [780 psi] to12.83MPa [1860 psi] which corresponds to 13% to 31% off′c.Figure 7 shows the lateral drift angle versus the lateral
resistance of the piers with different initial stresses on theconcrete. Increasing the applied axial stresses on the piersincreased the nominal strengths, the ultimate strengths, andthe post-elastic stiffness of the piers. However, the increasein the applied initial post-tensioning stress on the concreteresulted in a reduction in the ultimate drift angles and thedrift angle at the maximum lateral load. For small axialstresses on the concrete segments, the geometric non-linearity, i.e., the rocking mechanism was predominant,while for the case of high axial stresses the materialnonlinearity was dominant leading to concrete crushing atsmaller drift angles. This resulted in two features in thebackbone curves (Fig. 7): 1) the transition between theinitial and post-elastic stiffness is abrupt for small axialstresses compared to high initial stresses; and 2) the slopeof the lateral resistance— drift curves beyond the peakstrength is relatively sharper for higher concrete initialaxial stress resulting in small ultimate drift angles. This isattributed to the high stresses accumulated by the rigidbody rocking that result in more brittle failure. Finally, the
Fig. 5 The effects of changing the initial post-tensioning stress inthe tendons for squat piers
Fig. 6 Drift of squat piers vs. the stresses in the post-tensioningtendons normalized by their yield stress
Haitham DAWOOD et al. Factors affecting the seismic behavior of segmental precast bridge columns 5
change in the areas of post-tensioning tendons did notchange the initial stiffness of the investigated columns.However, the post-elastic stiffness of specimens havinghigher areas of post-tensioning tendons is slightly higherthan those with smaller areas of post-tensioning tendons.
Figure 8 shows the peak stress in the post-tensioningtendon normalized by its yield stress vs. the lateral drift ofthe standard piers. As shown in the figure, in no case didtendon yielding occur. In addition, the rate of increase inthe post-tensioning stress was slightly higher for piershaving smaller axial stress on the concrete since piers thatwere subjected to small axial stress due to post-tensioningwere able to reach deformation higher than other pierssubjected to higher post-tensioning forces (Fig. 7).Decreasing the applied axial stress due to post-tensioningmade the rocking response and geometric nonlinearitymore dominant compared to the deformation in the case ofhigh applied axial stress due to post-tensioning.
Based on these analyses, it seems an initial concreteaxial stress of approximately 20%f′c is reasonable fordesign of piers similar to those examined in this manu-script. The slender piers that were subjected to axialconcrete stresses of approximately 20% of f′c or less wereable to reach an ultimate drift angle of 4.5% or larger.
To investigate this recommendation for a squat pier, PierB was analyzed under different axial concrete stressesranging from 19 to 31% f′c. Figure 9 shows the effects ofthe applied axial stresses on the concrete on the backbonecurves of Piers B. As shown in the figure and similar to thecase of the standard pier, increasing the applied axial stressdue to post-tensioning slightly increased the strength of thepiers; however, it significantly increased the post-elasticstiffness and decreased the ultimate drift angle. Piers thatwere subjected to an axial stress of approximately 22% off′c or less were able to reach an ultimate drift angle of 5% orgreater.
Figure 10 shows the variation of peak stresses in thetendons versus the lateral drift for Pier B for the differentapplied axial stresses on the concrete segments. As shownin the figure, in no case did yielding of the tendon occur.
4.3 Effects of pier aspect ratio
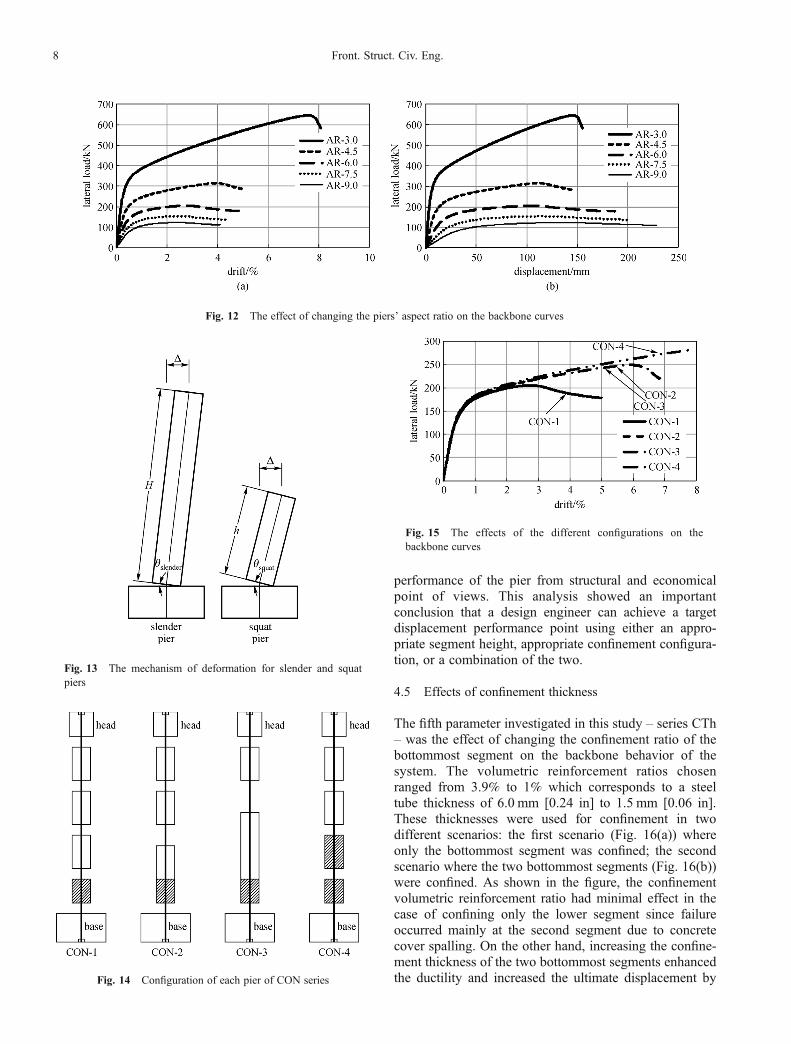
The third parameter investigated in this manuscript was theeffects of increasing the aspect ratio – AR series – of thepiers from 3 to 9 by adding one more segment from onepier to the other as shown in Fig. 11. Figure 12 shows the
Fig. 7 The effects of increasing the axial stresses due to post-tensioning forces on concrete segments
Fig. 8 The increase in the post-tensioning stresses vs. thestandard piers lateral drifts
Fig. 9 The effects of increasing the axial stresses on concretesegments for Pier B
Fig. 10 The increase in the post-tensioning stresses vs. piers typeB lateral drifts
6 Front. Struct. Civ. Eng.
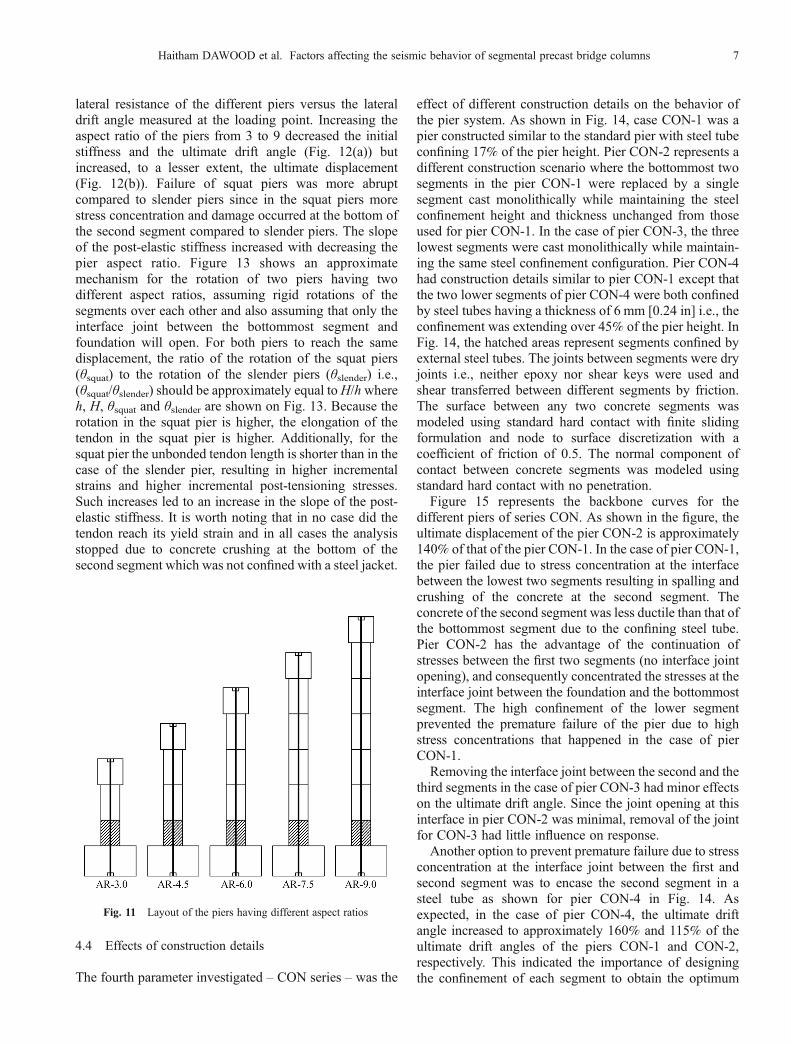
lateral resistance of the different piers versus the lateraldrift angle measured at the loading point. Increasing theaspect ratio of the piers from 3 to 9 decreased the initialstiffness and the ultimate drift angle (Fig. 12(a)) butincreased, to a lesser extent, the ultimate displacement(Fig. 12(b)). Failure of squat piers was more abruptcompared to slender piers since in the squat piers morestress concentration and damage occurred at the bottom ofthe second segment compared to slender piers. The slopeof the post-elastic stiffness increased with decreasing thepier aspect ratio. Figure 13 shows an approximatemechanism for the rotation of two piers having twodifferent aspect ratios, assuming rigid rotations of thesegments over each other and also assuming that only theinterface joint between the bottommost segment andfoundation will open. For both piers to reach the samedisplacement, the ratio of the rotation of the squat piers(θsquat) to the rotation of the slender piers (θslender) i.e.,(θsquat/θslender) should be approximately equal toH/hwhereh, H, θsquat and θslender are shown on Fig. 13. Because therotation in the squat pier is higher, the elongation of thetendon in the squat pier is higher. Additionally, for thesquat pier the unbonded tendon length is shorter than in thecase of the slender pier, resulting in higher incrementalstrains and higher incremental post-tensioning stresses.Such increases led to an increase in the slope of the post-elastic stiffness. It is worth noting that in no case did thetendon reach its yield strain and in all cases the analysisstopped due to concrete crushing at the bottom of thesecond segment which was not confined with a steel jacket.
4.4 Effects of construction details
The fourth parameter investigated – CON series – was the
effect of different construction details on the behavior ofthe pier system. As shown in Fig. 14, case CON-1 was apier constructed similar to the standard pier with steel tubeconfining 17% of the pier height. Pier CON-2 represents adifferent construction scenario where the bottommost twosegments in the pier CON-1 were replaced by a singlesegment cast monolithically while maintaining the steelconfinement height and thickness unchanged from thoseused for pier CON-1. In the case of pier CON-3, the threelowest segments were cast monolithically while maintain-ing the same steel confinement configuration. Pier CON-4had construction details similar to pier CON-1 except thatthe two lower segments of pier CON-4 were both confinedby steel tubes having a thickness of 6 mm [0.24 in] i.e., theconfinement was extending over 45% of the pier height. InFig. 14, the hatched areas represent segments confined byexternal steel tubes. The joints between segments were dryjoints i.e., neither epoxy nor shear keys were used andshear transferred between different segments by friction.The surface between any two concrete segments wasmodeled using standard hard contact with finite slidingformulation and node to surface discretization with acoefficient of friction of 0.5. The normal component ofcontact between concrete segments was modeled usingstandard hard contact with no penetration.Figure 15 represents the backbone curves for the
different piers of series CON. As shown in the figure, theultimate displacement of the pier CON-2 is approximately140% of that of the pier CON-1. In the case of pier CON-1,the pier failed due to stress concentration at the interfacebetween the lowest two segments resulting in spalling andcrushing of the concrete at the second segment. Theconcrete of the second segment was less ductile than that ofthe bottommost segment due to the confining steel tube.Pier CON-2 has the advantage of the continuation ofstresses between the first two segments (no interface jointopening), and consequently concentrated the stresses at theinterface joint between the foundation and the bottommostsegment. The high confinement of the lower segmentprevented the premature failure of the pier due to highstress concentrations that happened in the case of pierCON-1.Removing the interface joint between the second and the
third segments in the case of pier CON-3 had minor effectson the ultimate drift angle. Since the joint opening at thisinterface in pier CON-2 was minimal, removal of the jointfor CON-3 had little influence on response.Another option to prevent premature failure due to stress
concentration at the interface joint between the first andsecond segment was to encase the second segment in asteel tube as shown for pier CON-4 in Fig. 14. Asexpected, in the case of pier CON-4, the ultimate driftangle increased to approximately 160% and 115% of theultimate drift angles of the piers CON-1 and CON-2,respectively. This indicated the importance of designingthe confinement of each segment to obtain the optimum
Fig. 11 Layout of the piers having different aspect ratios
Haitham DAWOOD et al. Factors affecting the seismic behavior of segmental precast bridge columns 7
performance of the pier from structural and economicalpoint of views. This analysis showed an importantconclusion that a design engineer can achieve a targetdisplacement performance point using either an appro-priate segment height, appropriate confinement configura-tion, or a combination of the two.
4.5 Effects of confinement thickness
The fifth parameter investigated in this study – series CTh– was the effect of changing the confinement ratio of thebottommost segment on the backbone behavior of thesystem. The volumetric reinforcement ratios chosenranged from 3.9% to 1% which corresponds to a steeltube thickness of 6.0 mm [0.24 in] to 1.5 mm [0.06 in].These thicknesses were used for confinement in twodifferent scenarios: the first scenario (Fig. 16(a)) whereonly the bottommost segment was confined; the secondscenario where the two bottommost segments (Fig. 16(b))were confined. As shown in the figure, the confinementvolumetric reinforcement ratio had minimal effect in thecase of confining only the lower segment since failureoccurred mainly at the second segment due to concretecover spalling. On the other hand, increasing the confine-ment thickness of the two bottommost segments enhancedthe ductility and increased the ultimate displacement by
Fig. 12 The effect of changing the piers’ aspect ratio on the backbone curves
Fig. 13 The mechanism of deformation for slender and squatpiers
Fig. 14 Configuration of each pier of CON series
Fig. 15 The effects of the different configurations on thebackbone curves
8 Front. Struct. Civ. Eng.
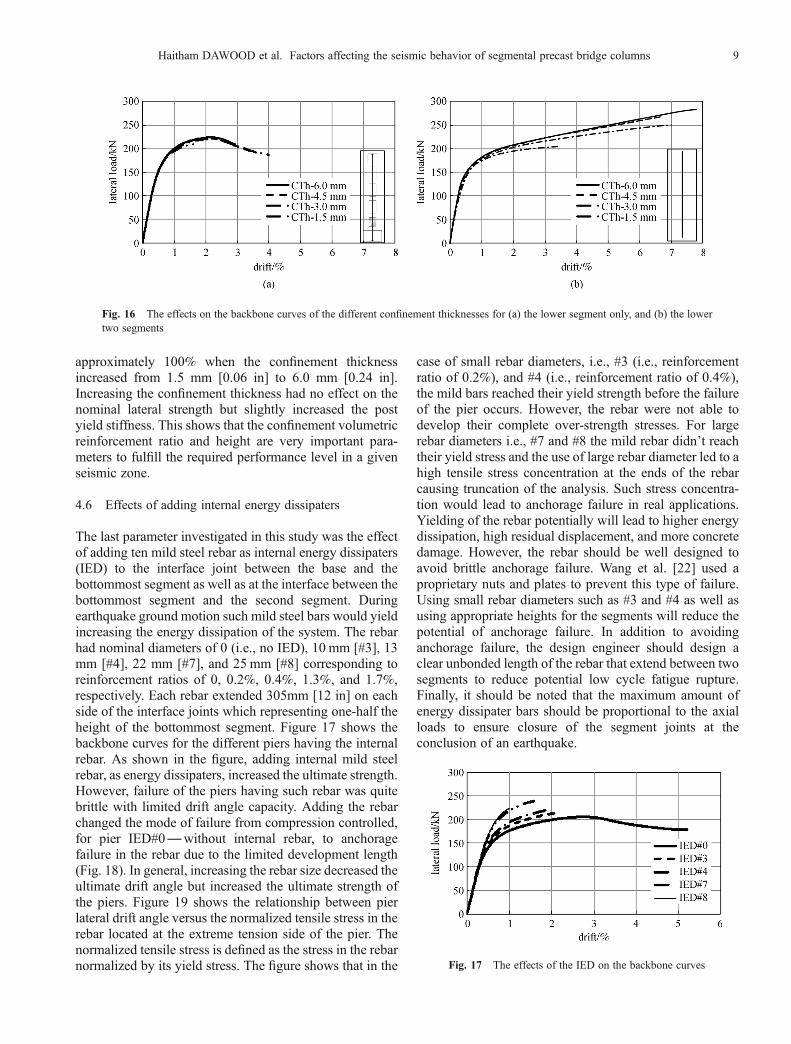
approximately 100% when the confinement thicknessincreased from 1.5 mm [0.06 in] to 6.0 mm [0.24 in].Increasing the confinement thickness had no effect on thenominal lateral strength but slightly increased the postyield stiffness. This shows that the confinement volumetricreinforcement ratio and height are very important para-meters to fulfill the required performance level in a givenseismic zone.
4.6 Effects of adding internal energy dissipaters
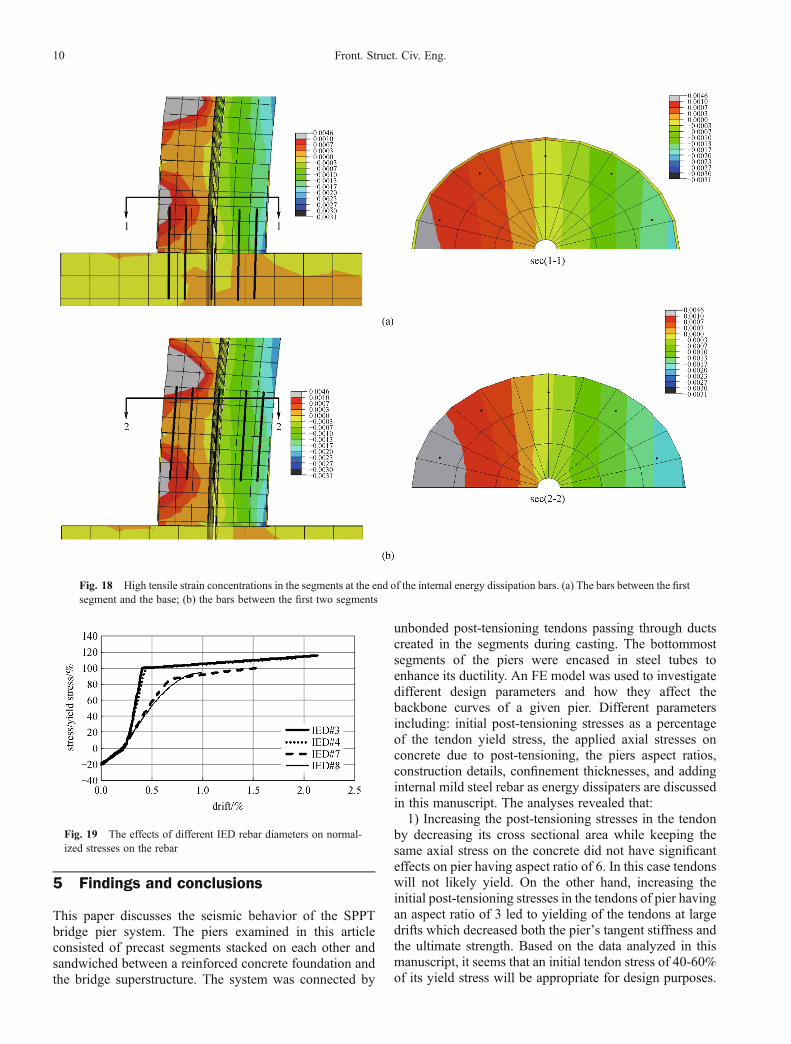
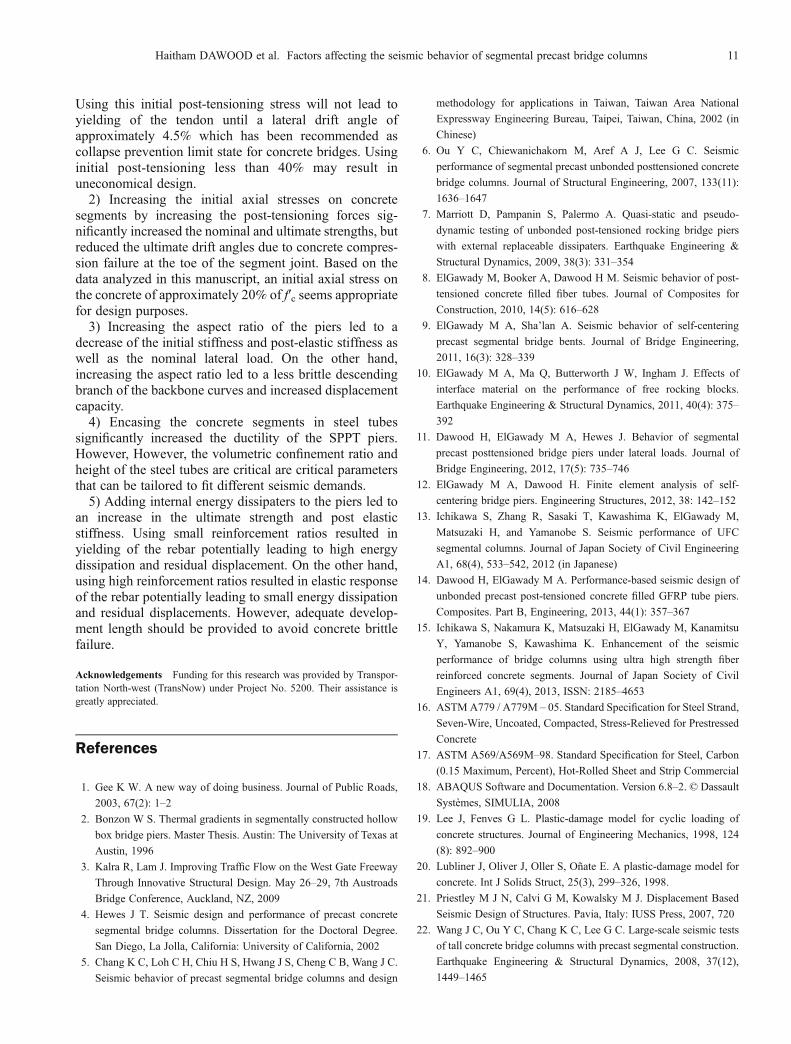
The last parameter investigated in this study was the effectof adding ten mild steel rebar as internal energy dissipaters(IED) to the interface joint between the base and thebottommost segment as well as at the interface between thebottommost segment and the second segment. Duringearthquake ground motion such mild steel bars would yieldincreasing the energy dissipation of the system. The rebarhad nominal diameters of 0 (i.e., no IED), 10 mm [#3], 13mm [#4], 22 mm [#7], and 25 mm [#8] corresponding toreinforcement ratios of 0, 0.2%, 0.4%, 1.3%, and 1.7%,respectively. Each rebar extended 305mm [12 in] on eachside of the interface joints which representing one-half theheight of the bottommost segment. Figure 17 shows thebackbone curves for the different piers having the internalrebar. As shown in the figure, adding internal mild steelrebar, as energy dissipaters, increased the ultimate strength.However, failure of the piers having such rebar was quitebrittle with limited drift angle capacity. Adding the rebarchanged the mode of failure from compression controlled,for pier IED#0—without internal rebar, to anchoragefailure in the rebar due to the limited development length(Fig. 18). In general, increasing the rebar size decreased theultimate drift angle but increased the ultimate strength ofthe piers. Figure 19 shows the relationship between pierlateral drift angle versus the normalized tensile stress in therebar located at the extreme tension side of the pier. Thenormalized tensile stress is defined as the stress in the rebarnormalized by its yield stress. The figure shows that in the
case of small rebar diameters, i.e., #3 (i.e., reinforcementratio of 0.2%), and #4 (i.e., reinforcement ratio of 0.4%),the mild bars reached their yield strength before the failureof the pier occurs. However, the rebar were not able todevelop their complete over-strength stresses. For largerebar diameters i.e., #7 and #8 the mild rebar didn’t reachtheir yield stress and the use of large rebar diameter led to ahigh tensile stress concentration at the ends of the rebarcausing truncation of the analysis. Such stress concentra-tion would lead to anchorage failure in real applications.Yielding of the rebar potentially will lead to higher energydissipation, high residual displacement, and more concretedamage. However, the rebar should be well designed toavoid brittle anchorage failure. Wang et al. [22] used aproprietary nuts and plates to prevent this type of failure.Using small rebar diameters such as #3 and #4 as well asusing appropriate heights for the segments will reduce thepotential of anchorage failure. In addition to avoidinganchorage failure, the design engineer should design aclear unbonded length of the rebar that extend between twosegments to reduce potential low cycle fatigue rupture.Finally, it should be noted that the maximum amount ofenergy dissipater bars should be proportional to the axialloads to ensure closure of the segment joints at theconclusion of an earthquake.
Fig. 16 The effects on the backbone curves of the different confinement thicknesses for (a) the lower segment only, and (b) the lowertwo segments
Fig. 17 The effects of the IED on the backbone curves
Haitham DAWOOD et al. Factors affecting the seismic behavior of segmental precast bridge columns 9
5 Findings and conclusions
This paper discusses the seismic behavior of the SPPTbridge pier system. The piers examined in this articleconsisted of precast segments stacked on each other andsandwiched between a reinforced concrete foundation andthe bridge superstructure. The system was connected by
unbonded post-tensioning tendons passing through ductscreated in the segments during casting. The bottommostsegments of the piers were encased in steel tubes toenhance its ductility. An FE model was used to investigatedifferent design parameters and how they affect thebackbone curves of a given pier. Different parametersincluding: initial post-tensioning stresses as a percentageof the tendon yield stress, the applied axial stresses onconcrete due to post-tensioning, the piers aspect ratios,construction details, confinement thicknesses, and addinginternal mild steel rebar as energy dissipaters are discussedin this manuscript. The analyses revealed that:1) Increasing the post-tensioning stresses in the tendon
by decreasing its cross sectional area while keeping thesame axial stress on the concrete did not have significanteffects on pier having aspect ratio of 6. In this case tendonswill not likely yield. On the other hand, increasing theinitial post-tensioning stresses in the tendons of pier havingan aspect ratio of 3 led to yielding of the tendons at largedrifts which decreased both the pier’s tangent stiffness andthe ultimate strength. Based on the data analyzed in thismanuscript, it seems that an initial tendon stress of 40-60%of its yield stress will be appropriate for design purposes.
Fig. 18 High tensile strain concentrations in the segments at the end of the internal energy dissipation bars. (a) The bars between the firstsegment and the base; (b) the bars between the first two segments
Fig. 19 The effects of different IED rebar diameters on normal-ized stresses on the rebar
10 Front. Struct. Civ. Eng.
Using this initial post-tensioning stress will not lead toyielding of the tendon until a lateral drift angle ofapproximately 4.5% which has been recommended ascollapse prevention limit state for concrete bridges. Usinginitial post-tensioning less than 40% may result inuneconomical design.2) Increasing the initial axial stresses on concrete
segments by increasing the post-tensioning forces sig-nificantly increased the nominal and ultimate strengths, butreduced the ultimate drift angles due to concrete compres-sion failure at the toe of the segment joint. Based on thedata analyzed in this manuscript, an initial axial stress onthe concrete of approximately 20% of f′c seems appropriatefor design purposes.3) Increasing the aspect ratio of the piers led to a
decrease of the initial stiffness and post-elastic stiffness aswell as the nominal lateral load. On the other hand,increasing the aspect ratio led to a less brittle descendingbranch of the backbone curves and increased displacementcapacity.4) Encasing the concrete segments in steel tubes
significantly increased the ductility of the SPPT piers.However, However, the volumetric confinement ratio andheight of the steel tubes are critical are critical parametersthat can be tailored to fit different seismic demands.5) Adding internal energy dissipaters to the piers led to
an increase in the ultimate strength and post elasticstiffness. Using small reinforcement ratios resulted inyielding of the rebar potentially leading to high energydissipation and residual displacement. On the other hand,using high reinforcement ratios resulted in elastic responseof the rebar potentially leading to small energy dissipationand residual displacements. However, adequate develop-ment length should be provided to avoid concrete brittlefailure.
Acknowledgements Funding for this research was provided by Transpor-tation North-west (TransNow) under Project No. 5200. Their assistance isgreatly appreciated.
References
1. Gee K W. A new way of doing business. Journal of Public Roads,
2003, 67(2): 1–2
2. Bonzon W S. Thermal gradients in segmentally constructed hollow
box bridge piers. Master Thesis. Austin: The University of Texas at
Austin, 1996
3. Kalra R, Lam J. Improving Traffic Flow on the West Gate Freeway
Through Innovative Structural Design. May 26–29, 7th Austroads
Bridge Conference, Auckland, NZ, 2009
4. Hewes J T. Seismic design and performance of precast concrete
segmental bridge columns. Dissertation for the Doctoral Degree.
San Diego, La Jolla, California: University of California, 2002
5. Chang K C, Loh C H, Chiu H S, Hwang J S, Cheng C B, Wang J C.
Seismic behavior of precast segmental bridge columns and design
methodology for applications in Taiwan, Taiwan Area National
Expressway Engineering Bureau, Taipei, Taiwan, China, 2002 (in
Chinese)
6. Ou Y C, Chiewanichakorn M, Aref A J, Lee G C. Seismic
performance of segmental precast unbonded posttensioned concrete
bridge columns. Journal of Structural Engineering, 2007, 133(11):
1636–1647
7. Marriott D, Pampanin S, Palermo A. Quasi-static and pseudo-
dynamic testing of unbonded post-tensioned rocking bridge piers
with external replaceable dissipaters. Earthquake Engineering &
Structural Dynamics, 2009, 38(3): 331–354
8. ElGawady M, Booker A, Dawood H M. Seismic behavior of post-
tensioned concrete filled fiber tubes. Journal of Composites for
Construction, 2010, 14(5): 616–628
9. ElGawady M A, Sha’lan A. Seismic behavior of self-centering
precast segmental bridge bents. Journal of Bridge Engineering,
2011, 16(3): 328–339
10. ElGawady M A, Ma Q, Butterworth J W, Ingham J. Effects of
interface material on the performance of free rocking blocks.
Earthquake Engineering & Structural Dynamics, 2011, 40(4): 375–
392
11. Dawood H, ElGawady M A, Hewes J. Behavior of segmental
precast posttensioned bridge piers under lateral loads. Journal of
Bridge Engineering, 2012, 17(5): 735–746
12. ElGawady M A, Dawood H. Finite element analysis of self-
centering bridge piers. Engineering Structures, 2012, 38: 142–152
13. Ichikawa S, Zhang R, Sasaki T, Kawashima K, ElGawady M,
Matsuzaki H, and Yamanobe S. Seismic performance of UFC
segmental columns. Journal of Japan Society of Civil Engineering
A1, 68(4), 533–542, 2012 (in Japanese)
14. Dawood H, ElGawady M A. Performance-based seismic design of
unbonded precast post-tensioned concrete filled GFRP tube piers.
Composites. Part B, Engineering, 2013, 44(1): 357–367
15. Ichikawa S, Nakamura K, Matsuzaki H, ElGawady M, Kanamitsu
Y, Yamanobe S, Kawashima K. Enhancement of the seismic
performance of bridge columns using ultra high strength fiber
reinforced concrete segments. Journal of Japan Society of Civil
Engineers A1, 69(4), 2013, ISSN: 2185–4653
16. ASTM A779 / A779M – 05. Standard Specification for Steel Strand,
Seven-Wire, Uncoated, Compacted, Stress-Relieved for Prestressed
Concrete
17. ASTM A569/A569M–98. Standard Specification for Steel, Carbon
(0.15 Maximum, Percent), Hot-Rolled Sheet and Strip Commercial
18. ABAQUS Software and Documentation. Version 6.8–2. © Dassault
Systèmes, SIMULIA, 2008
19. Lee J, Fenves G L. Plastic-damage model for cyclic loading of
concrete structures. Journal of Engineering Mechanics, 1998, 124
(8): 892–900
20. Lubliner J, Oliver J, Oller S, Oñate E. A plastic-damage model for
concrete. Int J Solids Struct, 25(3), 299–326, 1998.
21. Priestley M J N, Calvi G M, Kowalsky M J. Displacement Based
Seismic Design of Structures. Pavia, Italy: IUSS Press, 2007, 720
22. Wang J C, Ou Y C, Chang K C, Lee G C. Large-scale seismic tests
of tall concrete bridge columns with precast segmental construction.
Earthquake Engineering & Structural Dynamics, 2008, 37(12),
1449–1465
Haitham DAWOOD et al. Factors affecting the seismic behavior of segmental precast bridge columns 11
Related Documents