v.11, n.1 Vitória-ES, Jan.-Mar. 2014 p. 1 - 24 ISSN 1808-2386 Received on January 25, 2012; reviewed on June 23, 2012; accepted on July 03, 2012; disclosed on March 12, 2014. * Author for correspondence: † PhD in Control and Accounting from the University of São Paulo. Institution: Professor at University of São Paulo. Address: Av. Bandeirantes, 3900. Monte Alegre, Ribeirão Preto/SP. E-mail: [email protected] Telephone: (16) 3602-3886 Ω MSc. from the University of São Paulo. Institution: Doctoral student in Administration at FEARP-USP. Address: Rua: Abrahão Isa Halack, 2145, Ribeirania, Ribeirão Preto/SP. E-mail: [email protected] Telephone: (16) 9.9797-3316 ¥ PhD in Control and Accounting from the University of São Paulo. Institution: Professor at the University of São Paulo. Address: Av. Bandeirantes, 3900. Monte Alegre, Ribeirão Preto/SP. E-mail: [email protected] Telephone: (16) 3602- 3943 ‡Habilitation in Economics from the University of São Paulo. Institution: Professor at the University of São Paulo. Address: Rua: Tutoia, 839/21, São Paulo/SP. E-mail: [email protected] Telephone: (16) 3602-4477, (11) 9.8562-8818 Note from the Editor: This article was accepted by Bruno Funchal. This article has a Creative Commons License - Attribution 3.0 Not Adapted. 1 Factors Affecting Stock Liquidity: Corporate Governance, ADRs and Economic Crisis Ricardo Luiz Menezes da Silva † University of São Paulo - USP Paula Carolina Ciampaglia Nardi Ω University of São Paulo - USP Vinicius Aversari Martins ¥ University of São Paulo - USP Milton Barossi-Filho ‡ University of São Paulo - USP ABSTRACT Listing for trading in one of the segments of the BM&FBovespa requiring enhanced corporate governance can be seen as a way to align the interests of agents and principals. One of the supposed benefits of adhesion to these segments is increased stock liquidity. This study analyzes a sample of firms listed on the BM&FBovespa through panel data with Huber-White correction. The hypotheses are a positive relation between listing in one of these segments and liquidity, and that the higher the governance level, the greater the effect on liquidity. The results indicate that in the period before the 2008 crisis, the companies as a whole listed in the special governance segments had more liquid shares. But this result extends only to firms listed in the Level 1 and Novo Mercado segments when the three segments are analyzed individually. The hypotheses could not be confirmed in the entire period analyzed, from 2000 to 2009, possibly because of the effects of the crisis. For companies traded in the Level 2 segment, higher liquidity was not observed in the periods studied. Additionally, companies with ADRs showed higher liquidity in relation to those listed in the enhanced governance segments, independent of the effects of the crisis. Keywords: Stock liquidity. Corporate governance. Financial crisis of 2008.

Welcome message from author
This document is posted to help you gain knowledge. Please leave a comment to let me know what you think about it! Share it to your friends and learn new things together.
Transcript
v.11, n.1
Vitória-ES, Jan.-Mar. 2014
p. 1 - 24 ISSN 1808-2386
Received on January 25, 2012; reviewed on June 23, 2012; accepted on July 03, 2012; disclosed on March 12, 2014. * Author for correspondence: † PhD in Control and Accounting from the University of São Paulo. Institution: Professor at University of São Paulo. Address: Av. Bandeirantes, 3900. Monte Alegre, Ribeirão Preto/SP. E-mail: [email protected] Telephone: (16) 3602-3886
Ω MSc. from the University of São Paulo. Institution: Doctoral student in Administration at FEARP-USP. Address: Rua: Abrahão Isa Halack, 2145, Ribeirania, Ribeirão Preto/SP. E-mail: [email protected] Telephone: (16) 9.9797-3316
¥ PhD in Control and Accounting from the University of São Paulo. Institution: Professor at the University of São Paulo. Address: Av. Bandeirantes, 3900. Monte Alegre, Ribeirão Preto/SP. E-mail: [email protected] Telephone: (16) 3602-3943
‡Habilitation in Economics from the University of São Paulo. Institution: Professor at the University of São Paulo. Address: Rua: Tutoia, 839/21, São Paulo/SP. E-mail: [email protected] Telephone: (16) 3602-4477, (11) 9.8562-8818
Note from the Editor: This article was accepted by Bruno Funchal.
This article has a Creative Commons License - Attribution 3.0 Not Adapted.
1
Factors Affecting Stock Liquidity: Corporate Governance, ADRs and Economic Crisis
Ricardo Luiz Menezes da Silva†
University of São Paulo - USP
Paula Carolina Ciampaglia NardiΩ University of São Paulo - USP
Vinicius Aversari Martins ¥
University of São Paulo - USP
Milton Barossi-Filho‡ University of São Paulo - USP
ABSTRACT
Listing for trading in one of the segments of the BM&FBovespa requiring enhanced corporate governance can be seen as a way to align the interests of agents and principals. One of the supposed benefits of adhesion to these segments is increased stock liquidity. This study analyzes a sample of firms listed on the BM&FBovespa through panel data with Huber-White correction. The hypotheses are a positive relation between listing in one of these segments and liquidity, and that the higher the governance level, the greater the effect on liquidity. The results indicate that in the period before the 2008 crisis, the companies as a whole listed in the special governance segments had more liquid shares. But this result extends only to firms listed in the Level 1 and Novo Mercado segments when the three segments are analyzed individually. The hypotheses could not be confirmed in the entire period analyzed, from 2000 to 2009, possibly because of the effects of the crisis. For companies traded in the Level 2 segment, higher liquidity was not observed in the periods studied. Additionally, companies with ADRs showed higher liquidity in relation to those listed in the enhanced governance segments, independent of the effects of the crisis.
Keywords: Stock liquidity. Corporate governance. Financial crisis of 2008.
2 Silva, Nardi, Martins, Barossi-Filho
BBR, Vitória, v. 11, n. 1, Art. 1, p. 1 - 24, jan.-mar. 2014 www.bbronline.com.br
1 INTRODUCTION
ood corporate governance practices are important for emerging and
developed countries alike. In Brazil, the importance of adopting good
governance standards has increased with the need to obtain funding from
abroad at competitive costs. For this purpose, the São Paulo Stock,
Mercantile and Futures Exchange (BM&FBOVESPA) created three trading
segments for firms with enhanced governance: Level 1, Level 2 and Novo
Mercado (“New Market”). These levels are reserved for companies that
voluntarily adopt governance safeguards in addition to those required by
law. In this respect, these governance practices should give shareholders rights and guarantees
that reduce the information asymmetry and agency conflict between minority and controlling
shareholders, which can have a strong influence on managers (LA PORTA et al., 2000).
Theoretically, investors with more information about firms will be more willing to invest,
meaning greater confidence in and demand for the securities of firms listed in these trading
segments, causing an increase in the liquidity of their shares. This relationship between
governance and stock liquidity is corroborated by Schadewitz & Blevins (1998, p. 41), who
state that “rational investors, realizing the possible risks, avoid ownership in firms whose
quantity and quality of disclosures are consistently below expectations.” Therefore, increased
stock liquidity can generate benefits for firms, such as lower cost of capital, as pointed out by
Amihud & Mendelson (1986; 2000), who found empirical evidence of this effect.
On the other hand, poor governance practices can result in the use of inside information
for the self-benefit of managers, manipulation of earnings and conflicts of interest, as amply
demonstrated by the cases of Enron, Tyco, Worldcom and ImClone. In this scenario or
scandals, the quality of disclosure by firms has gained importance, and efforts have been
made to assure stricter governance standards in many countries, such as the United States with
the enactment of the Sarbanes-Oxley Act (SOX). Therefore, the adoption of better corporate
governance practices is strongly related to the level of disclosure. This should be a critical
factor for the success of listed corporations, based on the assumption that investors are more
watchful of this aspect, particularly after cases of fraud or economic crisis.
The demand for information in the market can be affected by the institutional
arrangements of countries, such as the legal system (LA PORTA; LOPES-DE-SILANES;
SHLEIFER, 1998). In this respect, Brazil has a code law system. According to various
studies, code law countries tend to provide less protection to investors and thus have less
G
Factors Affecting Stock Liquidity: Corporate Governance, ADRs and Economic Crisis
3
BBR, Vitória, v. 11, n. 1, Art. 1, p. 1 - 24, jan.-mar. 2014 www.bbronline.com.br
developed capital markets than do countries with a common law legal tradition (LA PORTA
et al., 1997; BUSHMAN; SMITH, 2001). Despite this expectation for code law countries in
general, the availability of stock market trading segments with stricter rules on corporate
governance, seeking to increase protection to investors, should provide a reward in the form
of increased liquidity. In this respect, both the BM&FBovespa and the Brazilian Securities
Commission (CVM) statei that listing in one of the enhanced governance segments brings
benefits, such as better institutional image; greater demand for shares, meaning higher prices;
lower cost of capital; and greater protection of minority shareholders. For the equity market as
a whole, these institutions affirm that such special listing increases liquidity and makes it
easier to issue shares. These claims are empirically verifiable and justify applied studies to
confirm or refute the existence of these benefits.
In this respect, various studies have sought to identify the relationships between
governance practices and the benefits of these practices. An example is the technical report of
KPMG (2009), which applied a checklist to investigate the differences of some governance
practices between companies listed in one of the special levels of the BM&FBovespa and
firms with ADRs. The results showed that firms with ADRs satisfied more of the items on the
checklist. Based on this context, we propose to contribute to research in this area by
examining the following question: What is the relationship between listing in the special
governance segments of the BM&FBovespa and the liquidity of shares?
Therefore, our general aim is to analyze the relationship between adherence to one of
the enhanced governance segment of the BM&FBovespa and the liquidityii of shares. Our
specific objectives are: i) to verify whether there is an association between stock liquidity and
adherence to the Level 1 segment; ii) to verify whether there is an association between stock
liquidity and adherence to the Level 2 segment; iii) to verify whether there is an association
between stock liquidity and adherence to the Novo Mercado segment; and iv) if such a
relationship is confirmed, to investigate whether this relationship is different between the
three levels, i.e., if the benefit in terms of stock liquidity increases as the listing level rises.
Although our focus is on the relationship between liquidity and governance, we provide
some additional considerations regarding firms that issue American Depositary Receipts
(ADRs) because of their need to adopt stricter disclosure levels due to the requirements of the
Securities and Exchange Commission (SEC). The relationship between governance and stock
liquidity was analyzed by regression of panel data in two models: with and without
differentiation as to the corporate governance levels (Level 1, Level 2, Novo Mercado). For
4 Silva, Nardi, Martins, Barossi-Filho
BBR, Vitória, v. 11, n. 1, Art. 1, p. 1 - 24, jan.-mar. 2014 www.bbronline.com.br
the period from 2000 to 2007, the results indicate an increase in liquidity for the companies
with enhanced governance as a group, but only for those in the Level 1 and Novo Mercado
segments with when examining each segment individually. With the period extended to 2009
to include two years impacted by the financial crisis of 2008, no benefits of governance on
stock liquidity were observed. Finally, companies with ADRs showed higher liquidity in
relation to those listed in the three governance segments both before and during the crisis.
These results contribute to the literature by allowing a comparison of the effect of corporate
governance on stock liquidity in a period before and during the crisis, based on interactions
between the governance levels and the crisis.
Authors such as Carvalho (2003), Martins, Silva & Nardi (2006), Camargos & Barbosa
(2006) and Chaves & Silva (2006) have found a positive relationship between levels of
corporate governance and stock liquidity. They have mainly used the event study technique
with a restricted number of firms at the levels, considering the study period. In this respect,
the main contribution of this article is the individual and joint analysis of governance and
liquidity by means of regression with panel data in the period from 2000 to 2009. This
technique enabled us to investigate in more detail the effect of the 2008 financial crisis on the
relationship of the variables of interest. Although the results for the period before the crisis
only partially bore out the expectation indicated in the literature, the results for 2008 and 2009
indicate the opposite, with no differences in stock liquidity due to enhanced corporate
governance levels, a finding examined in section 4.
The article is organized into five sections including this introduction. Section 2 presents
the theoretical foundation and briefly discusses some empirical results of studies on
governance and stock liquidity; Section 3 explains the methodology; Section 4 presents and
analyzes the results; and Section 5 contains our final considerations.
2 LITERATURE REVIEW
2.1 THE AGENCY PROBLEM AND THE RELATIONSHIP WITH CORPORATE GOVERNANCE
According to Jensen & Meckling (1976, p. 5), the agency relationship is defined as “a
contract under which one or more persons (the principal(s)) engage another person (the agent)
to perform some service on their behalf which involves delegating some decision making
authority to the agent.” If both sides try to maximize their utilities, it is logical to believe that
the agent will not always act in the best interests of the principal, and instead will make
decisions that can expropriate the principal’s wealth. The causes of agency conflict were
Factors Affecting Stock Liquidity: Corporate Governance, ADRs and Economic Crisis
5
BBR, Vitória, v. 11, n. 1, Art. 1, p. 1 - 24, jan.-mar. 2014 www.bbronline.com.br
further investigated by Jensen & Meckling (1994), under the hypothesis that human nature is
utilitarian and rational, leading people to maximize a utility function of preferences. This
hypothesis is based on the fact that an individual tends to be more effective in meeting his
own objectives than those of others. However, it must be considered that the agency problem
in Brazil is mainly between the controlling and minority shareholders rather than between
managers and shareholders as a group, due to the great concentration of voting shares
(OKIMURA et al., 2004) and other corporate governance aspectsiii , because the controlling
shareholders exert strong influence on the managers.
According to Shleifer & Vishny (1997, p. 737), “corporate governance deals with the
ways in which suppliers of finance to corporations assure themselves of getting a return on
their investment.” The term supplier here refers both to the shareholders (suppliers if equity
capital) and lenders (suppliers of debt capital), and both groups can increase their funding
depending on the level of protection against expropriation. La Porta et al. (2000, p. 3)
complement the idea by stating that “corporate governance is, to a large extent, a set of
mechanisms through which outside investors protect themselves against expropriation by the
insiders.” In this sense, Silveira (2002, p. 14) points out that corporate governance
corresponds to the “set of incentive and control mechanisms that aim to harmonize the
relationship between shareholders and managers, by reducing agency problems, in a situation
of separation between ownership and control.”
Therefore, stricter corporate governance practices tend to align the interests between the
shareholders and managers, or between the controlling and minority shareholders. The
adhesion of firms to a special governance listing segment can also be seen as a solution to the
adverse selection and moral hazard problems, since by doing so companies are signaling to
the market they want to reduce the information asymmetry between market participants and
managers and convey a sense of greater security to investors.
2.2 THE LEVELS OF CORPORATE GOVERNANCE OF THE BM&FBOVESPA
In December 2000, the BM&FBovespaiv created three trading segments reserved for
firms with enhanced governance levels. The basic idea was to increase the value of the
companies and the liquidity of their shares, because adhesion to higher governance standards
tends to provide greater security to shareholders and higher quality and transparency of the
information disclosed. With regard to the benefits of good governance practices, Iudícibus &
Lopes (2004, p.182) add that a good corporate governance system aims to conciliate the
interests of agents and principals. Besides this, the adhesion to stricter governance levels can
6 Silva, Nardi, Martins, Barossi-Filho
BBR, Vitória, v. 11, n. 1, Art. 1, p. 1 - 24, jan.-mar. 2014 www.bbronline.com.br
signal to the market that the company wants to reduce information asymmetry and transmit
greater security to investors.
The characteristics of these three trading segments can be summarized as follows: i)
Level 1 requires companies to adopt practices that favor transparency and access to
information, by disclosing more information than the minimum required by law, and to
maintain more dispersed ownership, through a minimum free float of 25%; ii) Level 2
requires satisfying the rules of Level 1 and others, such as extending to all holders of common
shares the same conditions obtained by the controllers upon the sale of control of the
company, and at least 80% of this value to holders of preferred shares (tag along), as well as
voting rights to preferred shares; and iii) Novo Mercado has the same rules and Level 2 but
only allows the issuance of voting shares. Therefore, the Novo Mercado segment is the most
rigorous in terms of governance, and Level I is the least rigorous.
Because the creation of these three trading segments by the BM&FBovespa aims to
improve the quality of disclosure, reduce information asymmetry and broaden the
shareholding base, theoretically adherence to these rules should have an effect on the liquidity
of those firms’ shares. This justifies the interest in analyzing whether migration to one of the
enhanced governance levels affects the liquidity of these companies’ shares. It is also
interesting to verify if there is rising liquidity according to the corporate governance level,
given the different rules, mainly related to the rights of shareholders, as discussed before.
2.3 EMPIRICAL EVIDENCE OF THE EFFECT OF CORPORATE GOVERNANCE ON STOCK LIQUIDITY
Various authors have found a positive relationship between the level of corporate
governance and stock liquidity, such as Attig et al. (2006), Kanagaretnam, Lobo & Whalen
(2007), Chen et al. (2007), Goh, Ng & Young (2008), Chung, Elder & Kim (2010) and
Dumitrescu (2010). In Brazil, Carvalho (2003) found that adhesion to one of the three special
segments of the Bovespa had a positive impact on the stock liquidity. Similar results were
reported by Martins, Silva & Nardi (2006), Camargos & Barbosa (2006) and Chaves & Silva
(2006). On the other hand, Aguiar, Corrar & Batistella (2004) did not observe a change in
liquidity for companies listed in the Level 1 segment. Silveira & Barros (2008) investigated
the determinants of governance of listed Brazilian companies and concluded that adhesion to
enhanced governance levels of the BM&FBovespa did not appear to influence their level of
governance.
Factors Affecting Stock Liquidity: Corporate Governance, ADRs and Economic Crisis
7
BBR, Vitória, v. 11, n. 1, Art. 1, p. 1 - 24, jan.-mar. 2014 www.bbronline.com.br
In light of the above, it can be noted that the relationship between corporate governance
and stock liquidity is not clear and needs further study. Therefore, since the adoption of higher
levels of governance implies practices that reduce information asymmetry and increase
shareholders’ rights, our hypotheses are:
H1: adherence to the Level 1 trading segment of the BM&FBovespa causes an increase
in stock liquidity;
H2: adherence to the Level 1I trading segment of the BM&FBovespa causes an increase
in stock liquidity;
H3: adherence to the Novo Mercado trading segment of the BM&FBovespa causes an
increase in stock liquidity; and
H4: the stricter the requirements (information disclosure, shareholder rights, etc.) a firm
must satisfy in a determined segment are, the greater will be the liquidity of its shares.
These hypotheses are justified by the fact that adhesion to one of the special trading
segments is associated with giving more rights to shareholders and greater transparency to the
market, meaning a possible reduction of information asymmetry. Because there are rising
governance standards for the three trading segments, we assume that adherence to each one
implies distinct changes in stock liquidity.
3 METHODOLOGY
The sample is composed of all firms listed on the BM&FBovespa. In the case of those
with both common and preferred shares, we excluded the type with lower liquidity. We also
excluded stocks that were never traded, leaving 521 firms. The distribution of the companies
according to trading segment was as follows: 4% for Level 2; 9% for Level 1; 19% for Novo
Mercado; and 69% for the traditional segment.
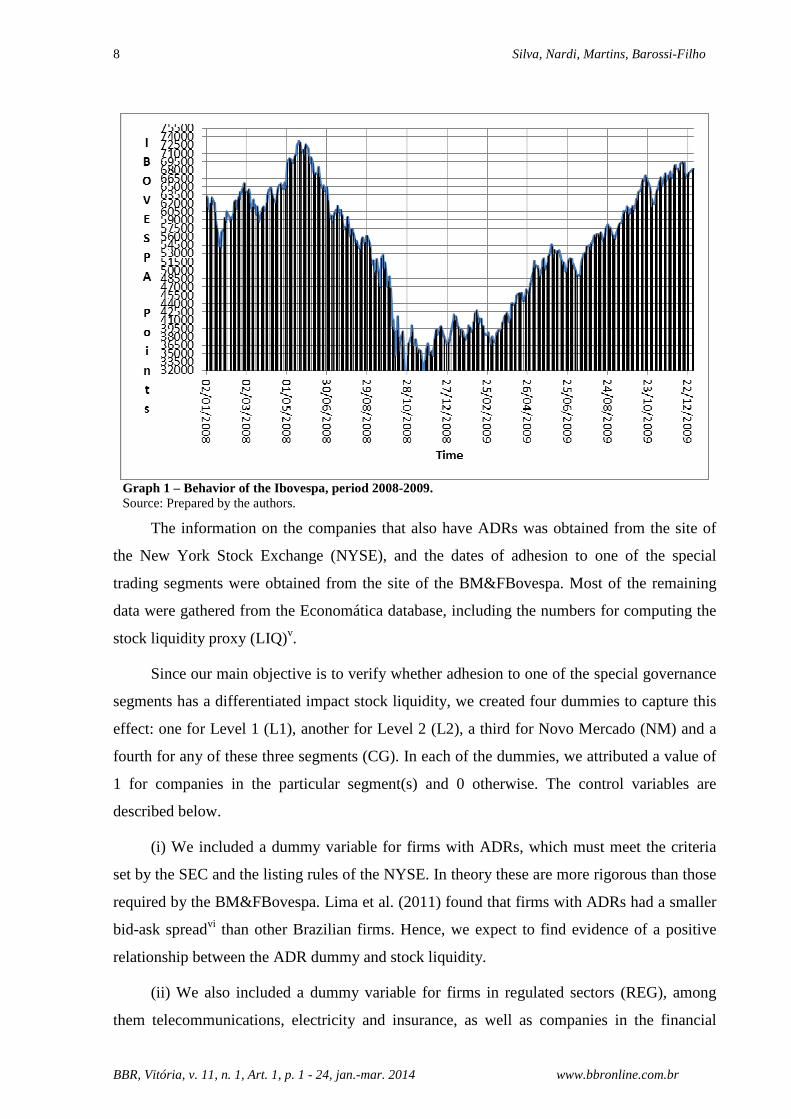
The study period covers the financial crisis of 2008. Assuming that the crisis caused
structural breaks in the stock market, we first analyzed the 2000-2007 period and then the
entire 2000-2009 period. This treatment is justified by the possibility that the crisis affected
the liquidity of the market as a whole in 2008 and 2009, which would influence the
relationship between governance and liquidity. The period considered for the financial crisis
is July 2008 to May 2009. The reason for this delineation is that the main market-tracking
index, the Ibovespa, started to fall sharply just before July 2008 and the began recovering in
May 2009, as can be seen in the graph.
8 Silva, Nardi, Martins, Barossi-Filho
BBR, Vitória, v. 11, n. 1, Art. 1, p. 1 - 24, jan.-mar. 2014 www.bbronline.com.br
Graph 1 – Behavior of the Ibovespa, period 2008-2009. Source: Prepared by the authors.
The information on the companies that also have ADRs was obtained from the site of
the New York Stock Exchange (NYSE), and the dates of adhesion to one of the special
trading segments were obtained from the site of the BM&FBovespa. Most of the remaining
data were gathered from the Economática database, including the numbers for computing the
stock liquidity proxy (LIQ)v.
Since our main objective is to verify whether adhesion to one of the special governance
segments has a differentiated impact stock liquidity, we created four dummies to capture this
effect: one for Level 1 (L1), another for Level 2 (L2), a third for Novo Mercado (NM) and a
fourth for any of these three segments (CG). In each of the dummies, we attributed a value of
1 for companies in the particular segment(s) and 0 otherwise. The control variables are
described below.
(i) We included a dummy variable for firms with ADRs, which must meet the criteria
set by the SEC and the listing rules of the NYSE. In theory these are more rigorous than those
required by the BM&FBovespa. Lima et al. (2011) found that firms with ADRs had a smaller
bid-ask spreadvi than other Brazilian firms. Hence, we expect to find evidence of a positive
relationship between the ADR dummy and stock liquidity.
(ii) We also included a dummy variable for firms in regulated sectors (REG), among
them telecommunications, electricity and insurance, as well as companies in the financial
Factors Affecting Stock Liquidity: Corporate Governance, ADRs and Economic Crisis
9
BBR, Vitória, v. 11, n. 1, Art. 1, p. 1 - 24, jan.-mar. 2014 www.bbronline.com.br
sector. It is reasonable to believe that “regulation can distort the informational capacity of
accounting” by interfering in the process of preparing and disclosing accounting information
(SARLO NETO; LOPES; LOSS, 2002, p. 3).
(iii) To control for the size effect, we used the logarithm of total assets (SIZE) (Chung,
Elder & Kim; 2010).
(iv) We included financing (FIN), defined by the logarithm of the ratio between total
liabilities and stockholders’ equity. According to Chen et al. (2007), this variable has a
negative relationship with quality of disclosure. Assuming that lesser information asymmetry
reduces the risk of adverse selection, investors should have stronger demand for shares of
companies when there is less asymmetry, positively affecting those shares’ liquidity.
Therefore, we expect a negative relationship between FIN and stock liquidity.
(v) We included return on assets (ROA), calculated as the net profit over total assets, to
represent the economic performance of the firms. According to Chen et al. (2007), there is a
positive relationship between return and disclosure.
(vi) We also included a measure of volatility, calculated as the standard deviation of
ROA (VROA). Volatility is known as a measure of risk. Assuming that ROA is a proxy for
firms’ economic performance, the more volatile the performance indicators are, the greater
the risk will be. Therefore, we expect a negative relationship between this variable and stock
liquidity.
(vii) To capture the evolution of assets over time and the cyclical behavior of assets and
the reflections on liquidity, we included a temporal variable (TIME), calculated as the mean
of the logarithm of total assets in each year for the companies.
(viii) Finally, we included a dummy to identify periods in which a firm had negative
equity (NEGEQ), assigning a value of 1 for negative equity and 0 otherwise equity.
We used the following empirical model to verify the behavior of stock liquidity during
the sample period:
itititit
itititititititiit
NEGEQTIMEVROA
ROAFINSIZEREGADRRLIQ
εβββββββββα
++++++++++=
987
654321 (1)
Where: Rit representes the dummy variables for governance described above: L1, L2,
NM or CG. For example, in section 4.2, the first model contains only CG, while the second
model contains the variables L1, L2 and NM.
10 Silva, Nardi, Martins, Barossi-Filho
BBR, Vitória, v. 11, n. 1, Art. 1, p. 1 - 24, jan.-mar. 2014 www.bbronline.com.br
The use of the panel data method is justified by our interest in observing the effect of
the governance variables on liquidity from January 2000 to December 2009 rather than in a
determined year, which could be done in a cross-sectional regression model. According to
Wooldridge (2006, p. 416), the basic reason to employ the panel data method is that it takes
into account that the unobserved effects are correlated with the explanatory variables. We ran
the statistical tests with the STATA version 9.2 software.
4 ANALYSIS OF THE RESULTS
4.1 DESCRIPTIVE STATISTICS
To understand the behavior of LIQ, SIZE, FIN and ROA during the period under
analysis, we calculated the mean, standard deviation and median.
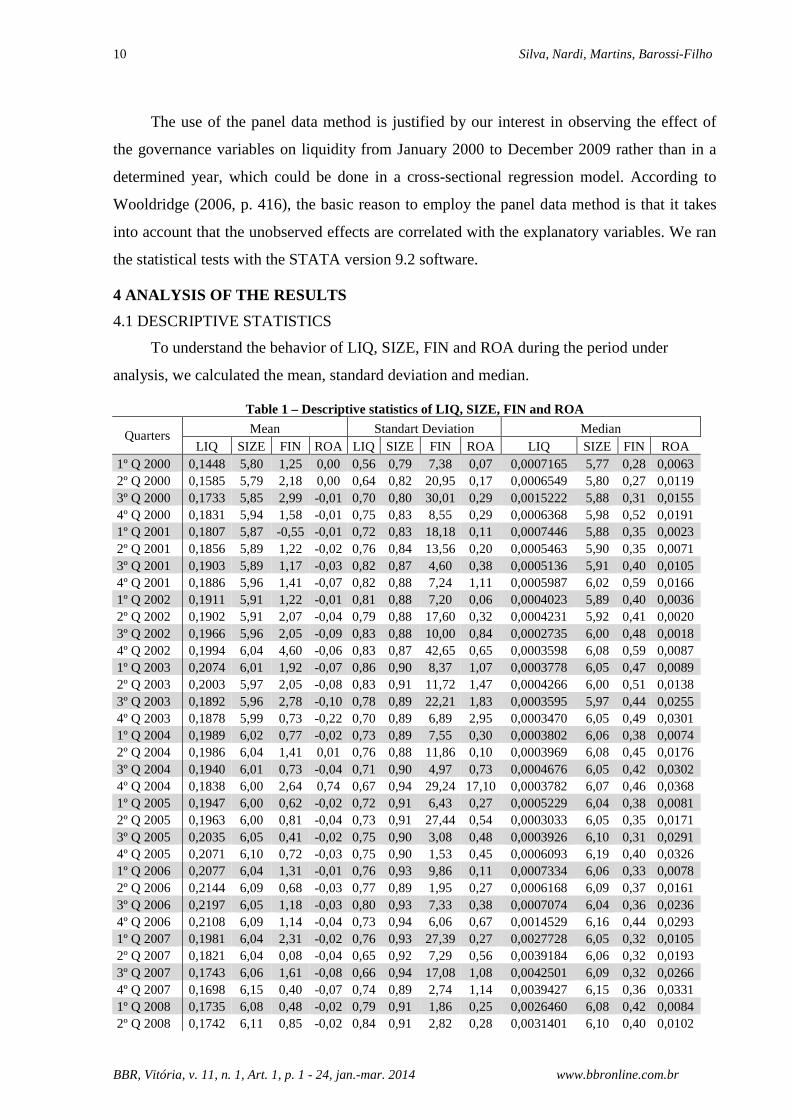
Table 1 – Descriptive statistics of LIQ, SIZE, FIN and ROA
Quarters Mean Standart Deviation Median LIQ SIZE FIN ROA LIQ SIZE FIN ROA LIQ SIZE FIN ROA
1º Q 2000 0,1448 5,80 1,25 0,00 0,56 0,79 7,38 0,07 0,0007165 5,77 0,28 0,0063 2º Q 2000 0,1585 5,79 2,18 0,00 0,64 0,82 20,95 0,17 0,0006549 5,80 0,27 0,0119 3º Q 2000 0,1733 5,85 2,99 -0,01 0,70 0,80 30,01 0,29 0,0015222 5,88 0,31 0,0155 4º Q 2000 0,1831 5,94 1,58 -0,01 0,75 0,83 8,55 0,29 0,0006368 5,98 0,52 0,0191 1º Q 2001 0,1807 5,87 -0,55 -0,01 0,72 0,83 18,18 0,11 0,0007446 5,88 0,35 0,0023 2º Q 2001 0,1856 5,89 1,22 -0,02 0,76 0,84 13,56 0,20 0,0005463 5,90 0,35 0,0071 3º Q 2001 0,1903 5,89 1,17 -0,03 0,82 0,87 4,60 0,38 0,0005136 5,91 0,40 0,0105 4º Q 2001 0,1886 5,96 1,41 -0,07 0,82 0,88 7,24 1,11 0,0005987 6,02 0,59 0,0166 1º Q 2002 0,1911 5,91 1,22 -0,01 0,81 0,88 7,20 0,06 0,0004023 5,89 0,40 0,0036 2º Q 2002 0,1902 5,91 2,07 -0,04 0,79 0,88 17,60 0,32 0,0004231 5,92 0,41 0,0020 3º Q 2002 0,1966 5,96 2,05 -0,09 0,83 0,88 10,00 0,84 0,0002735 6,00 0,48 0,0018 4º Q 2002 0,1994 6,04 4,60 -0,06 0,83 0,87 42,65 0,65 0,0003598 6,08 0,59 0,0087 1º Q 2003 0,2074 6,01 1,92 -0,07 0,86 0,90 8,37 1,07 0,0003778 6,05 0,47 0,0089 2º Q 2003 0,2003 5,97 2,05 -0,08 0,83 0,91 11,72 1,47 0,0004266 6,00 0,51 0,0138 3º Q 2003 0,1892 5,96 2,78 -0,10 0,78 0,89 22,21 1,83 0,0003595 5,97 0,44 0,0255 4º Q 2003 0,1878 5,99 0,73 -0,22 0,70 0,89 6,89 2,95 0,0003470 6,05 0,49 0,0301 1º Q 2004 0,1989 6,02 0,77 -0,02 0,73 0,89 7,55 0,30 0,0003802 6,06 0,38 0,0074 2º Q 2004 0,1986 6,04 1,41 0,01 0,76 0,88 11,86 0,10 0,0003969 6,08 0,45 0,0176 3º Q 2004 0,1940 6,01 0,73 -0,04 0,71 0,90 4,97 0,73 0,0004676 6,05 0,42 0,0302 4º Q 2004 0,1838 6,00 2,64 0,74 0,67 0,94 29,24 17,10 0,0003782 6,07 0,46 0,0368 1º Q 2005 0,1947 6,00 0,62 -0,02 0,72 0,91 6,43 0,27 0,0005229 6,04 0,38 0,0081 2º Q 2005 0,1963 6,00 0,81 -0,04 0,73 0,91 27,44 0,54 0,0003033 6,05 0,35 0,0171 3º Q 2005 0,2035 6,05 0,41 -0,02 0,75 0,90 3,08 0,48 0,0003926 6,10 0,31 0,0291 4º Q 2005 0,2071 6,10 0,72 -0,03 0,75 0,90 1,53 0,45 0,0006093 6,19 0,40 0,0326 1º Q 2006 0,2077 6,04 1,31 -0,01 0,76 0,93 9,86 0,11 0,0007334 6,06 0,33 0,0078 2º Q 2006 0,2144 6,09 0,68 -0,03 0,77 0,89 1,95 0,27 0,0006168 6,09 0,37 0,0161 3º Q 2006 0,2197 6,05 1,18 -0,03 0,80 0,93 7,33 0,38 0,0007074 6,04 0,36 0,0236 4º Q 2006 0,2108 6,09 1,14 -0,04 0,73 0,94 6,06 0,67 0,0014529 6,16 0,44 0,0293 1º Q 2007 0,1981 6,04 2,31 -0,02 0,76 0,93 27,39 0,27 0,0027728 6,05 0,32 0,0105 2º Q 2007 0,1821 6,04 0,08 -0,04 0,65 0,92 7,29 0,56 0,0039184 6,06 0,32 0,0193 3º Q 2007 0,1743 6,06 1,61 -0,08 0,66 0,94 17,08 1,08 0,0042501 6,09 0,32 0,0266 4º Q 2007 0,1698 6,15 0,40 -0,07 0,74 0,89 2,74 1,14 0,0039427 6,15 0,36 0,0331 1º Q 2008 0,1735 6,08 0,48 -0,02 0,79 0,91 1,86 0,25 0,0026460 6,08 0,42 0,0084 2º Q 2008 0,1742 6,11 0,85 -0,02 0,84 0,91 2,82 0,28 0,0031401 6,10 0,40 0,0102
Factors Affecting Stock Liquidity: Corporate Governance, ADRs and Economic Crisis
11
BBR, Vitória, v. 11, n. 1, Art. 1, p. 1 - 24, jan.-mar. 2014 www.bbronline.com.br
3º Q 2008 0,1727 6,14 0,86 -0,02 0,82 0,93 2,73 0,27 0,0019776 6,15 0,44 0,0063 4º Q 2008 0,1737 6,18 1,31 -0,07 0,90 0,94 4,33 0,86 0,0012682 6,22 0,54 0,0017 1º Q 2009 0,1891 6,20 1,38 -0,02 0,94 0,92 4,72 0,39 0,0015452 6,21 0,48 0,0038 2º Q 2009 0,1731 6,16 1,21 -0,04 0,74 0,94 5,09 0,58 0,0023832 6,21 0,43 0,0085 3º Q 2009 0,1678 6,17 0,98 -0,04 0,65 0,94 4,40 0,61 0,0025594 6,20 0,42 0,0080 4º Q 2009 0,1591 6,19 2,00 -0,03 0,59 0,95 16,00 1,08 0,0021398 6,24 0,49 0,0101 Source: Prepared by the authors.
Observation of the average of LIQ during the quarters of the study period shows there
was growth from the first quarter of 2000 to the start of 2007 and liquidity declined in 2008-
2009, which includes the worst part of the crisis. The median of LIQ increased in the quarters
of 2007, which is coherent with the reduction of average liquidity that year. In turn, the
behavior of the standard deviation at the start of 2009 indicates there was an increase in
volatility around the mean.
The average of the SIZE variable generally increased during the entire period, including
that of the crisis, while its standard deviation also increased during the series due to the
increased number of observations far from the mean.
There was wide fluctuation for FIN. The increase in its average in 2002 can be
explained by the depreciation of the exchange rate, causing a sharp rise in the debt of
companies with foreign loans. The ROA variable showed a negative average for nearly the
entire period.
4.2 ANALYSIS OF THE RESULTS FOR THE PERIOD FROM 2000 TO 2007
We estimated two panel regression models, one for the general governance dummy
variable and the other for each of the governance variables separately, with the other variables
the same. The results are in Table 2.
To increase the robustness of the models, we carried out the following steps:
i) In analyzing the residuals generated by the regression, we checked for the
presence of heteroscedasticityvii and autocorrelationviii , besides whether or not
the data were normally distributed; and
ii) To adjust the results for problems of heteroscedasticity and autocorrelation, we
used the Huber-White or Sandwich adjustment (Huber, 1967; White, 1980) to
estimate the covariance matrix of the estimated parameters. According to
Cameron & Trivedi (2010, p. 334), this adjustment is adequate for panel data.
The first model refers to the dummy CG which represents listing in any of the three
governance segments indiscriminately. The results are shown below.
12 Silva, Nardi, Martins, Barossi-Filho
BBR, Vitória, v. 11, n. 1, Art. 1, p. 1 - 24, jan.-mar. 2014 www.bbronline.com.br
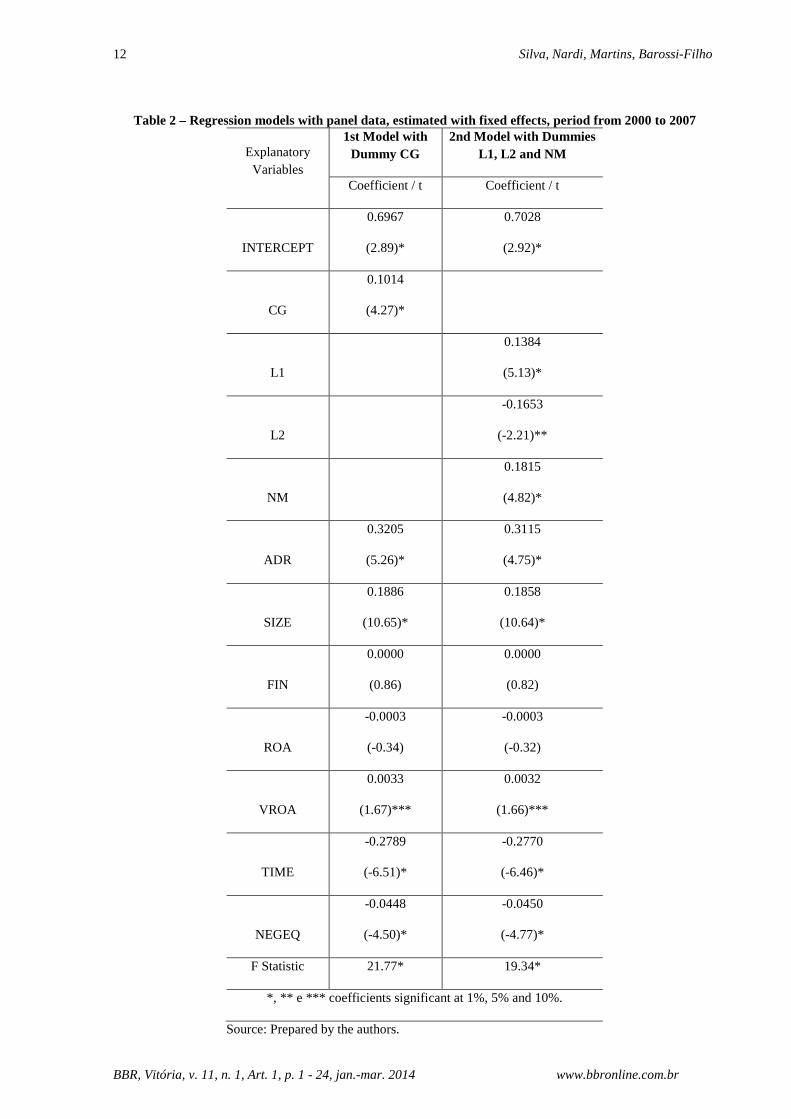
Table 2 – Regression models with panel data, estimated with fixed effects, period from 2000 to 2007
Explanatory Variables
1st Model with Dummy CG
2nd Model with Dummies L1, L2 and NM
Coefficient / t Coefficient / t
INTERCEPT
0.6967
(2.89)*
0.7028
(2.92)*
CG
0.1014
(4.27)*
L1
0.1384
(5.13)*
L2
-0.1653
(-2.21)**
NM
0.1815
(4.82)*
ADR
0.3205
(5.26)*
0.3115
(4.75)*
SIZE
0.1886
(10.65)*
0.1858
(10.64)*
FIN
0.0000
(0.86)
0.0000
(0.82)
ROA
-0.0003
(-0.34)
-0.0003
(-0.32)
VROA
0.0033
(1.67)***
0.0032
(1.66)***
TIME
-0.2789
(-6.51)*
-0.2770
(-6.46)*
NEGEQ
-0.0448
(-4.50)*
-0.0450
(-4.77)*
F Statistic 21.77* 19.34*
*, ** e *** coefficients significant at 1%, 5% and 10%.
Source: Prepared by the authors.
Factors Affecting Stock Liquidity: Corporate Governance, ADRs and Economic Crisis
13
BBR, Vitória, v. 11, n. 1, Art. 1, p. 1 - 24, jan.-mar. 2014 www.bbronline.com.br
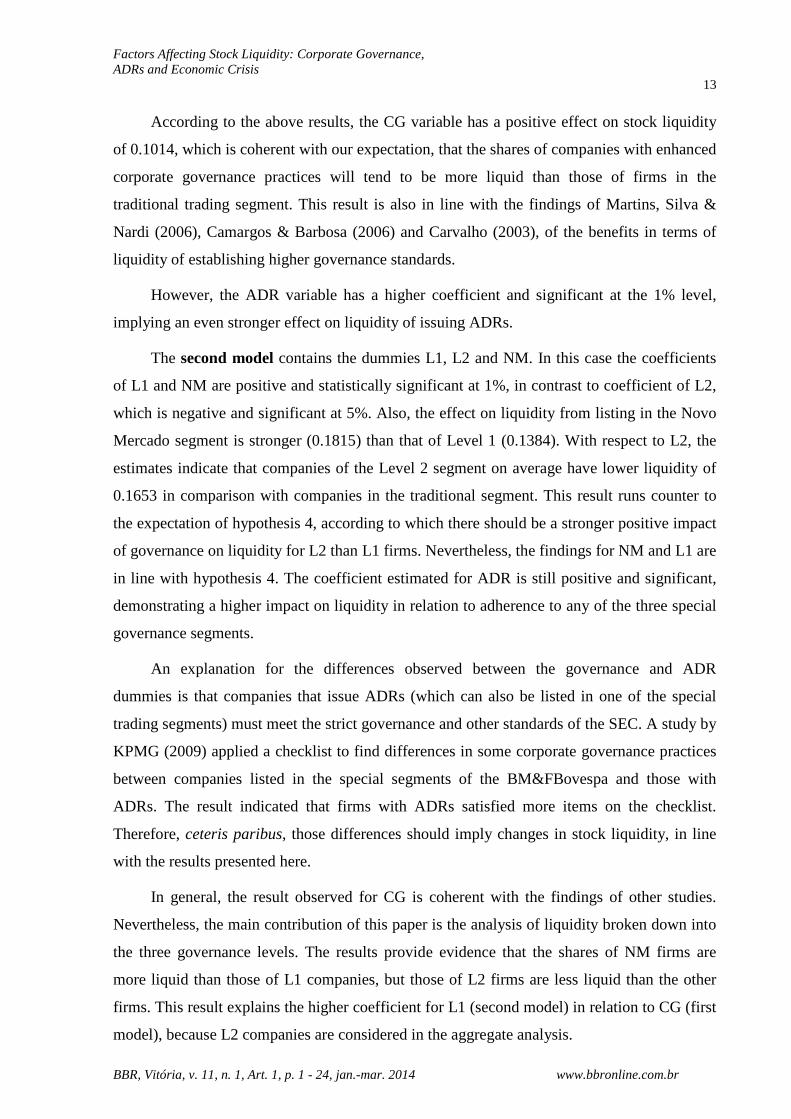
According to the above results, the CG variable has a positive effect on stock liquidity
of 0.1014, which is coherent with our expectation, that the shares of companies with enhanced
corporate governance practices will tend to be more liquid than those of firms in the
traditional trading segment. This result is also in line with the findings of Martins, Silva &
Nardi (2006), Camargos & Barbosa (2006) and Carvalho (2003), of the benefits in terms of
liquidity of establishing higher governance standards.
However, the ADR variable has a higher coefficient and significant at the 1% level,
implying an even stronger effect on liquidity of issuing ADRs.
The second model contains the dummies L1, L2 and NM. In this case the coefficients
of L1 and NM are positive and statistically significant at 1%, in contrast to coefficient of L2,
which is negative and significant at 5%. Also, the effect on liquidity from listing in the Novo
Mercado segment is stronger (0.1815) than that of Level 1 (0.1384). With respect to L2, the
estimates indicate that companies of the Level 2 segment on average have lower liquidity of
0.1653 in comparison with companies in the traditional segment. This result runs counter to
the expectation of hypothesis 4, according to which there should be a stronger positive impact
of governance on liquidity for L2 than L1 firms. Nevertheless, the findings for NM and L1 are
in line with hypothesis 4. The coefficient estimated for ADR is still positive and significant,
demonstrating a higher impact on liquidity in relation to adherence to any of the three special
governance segments.
An explanation for the differences observed between the governance and ADR
dummies is that companies that issue ADRs (which can also be listed in one of the special
trading segments) must meet the strict governance and other standards of the SEC. A study by
KPMG (2009) applied a checklist to find differences in some corporate governance practices
between companies listed in the special segments of the BM&FBovespa and those with
ADRs. The result indicated that firms with ADRs satisfied more items on the checklist.
Therefore, ceteris paribus, those differences should imply changes in stock liquidity, in line
with the results presented here.
In general, the result observed for CG is coherent with the findings of other studies.
Nevertheless, the main contribution of this paper is the analysis of liquidity broken down into
the three governance levels. The results provide evidence that the shares of NM firms are
more liquid than those of L1 companies, but those of L2 firms are less liquid than the other
firms. This result explains the higher coefficient for L1 (second model) in relation to CG (first
model), because L2 companies are considered in the aggregate analysis.
14 Silva, Nardi, Martins, Barossi-Filho
BBR, Vitória, v. 11, n. 1, Art. 1, p. 1 - 24, jan.-mar. 2014 www.bbronline.com.br
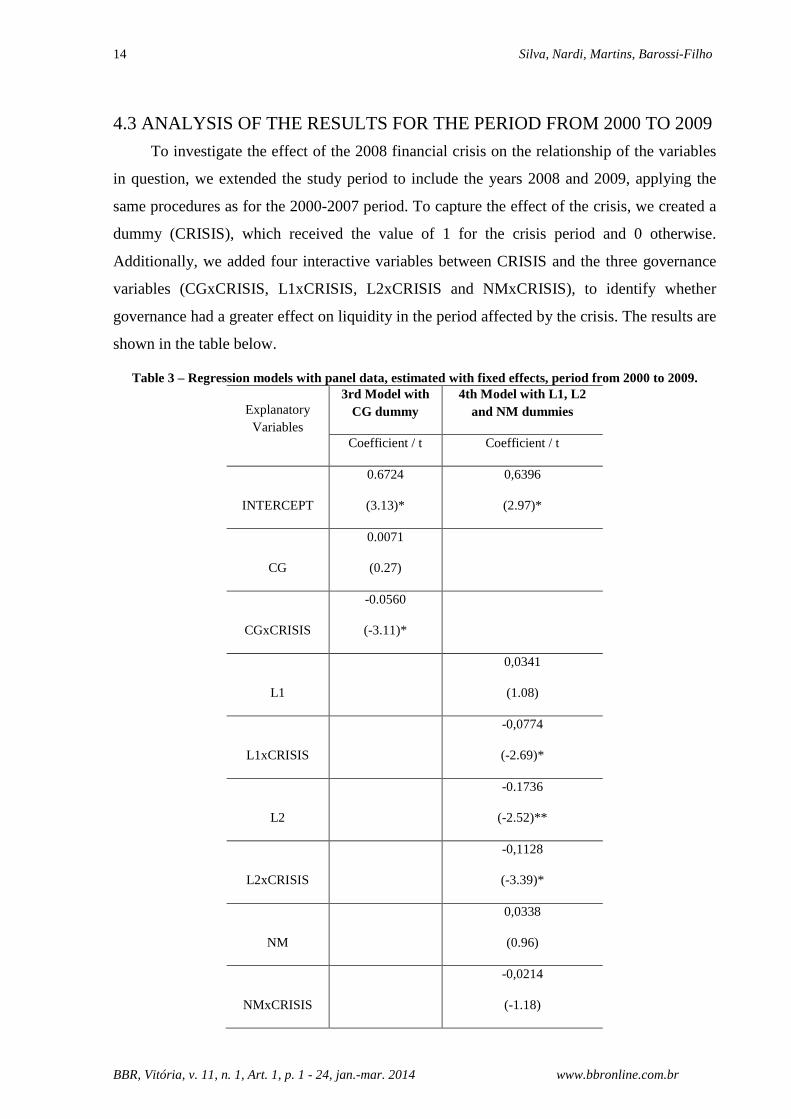
4.3 ANALYSIS OF THE RESULTS FOR THE PERIOD FROM 2000 TO 2009
To investigate the effect of the 2008 financial crisis on the relationship of the variables
in question, we extended the study period to include the years 2008 and 2009, applying the
same procedures as for the 2000-2007 period. To capture the effect of the crisis, we created a
dummy (CRISIS), which received the value of 1 for the crisis period and 0 otherwise.
Additionally, we added four interactive variables between CRISIS and the three governance
variables (CGxCRISIS, L1xCRISIS, L2xCRISIS and NMxCRISIS), to identify whether
governance had a greater effect on liquidity in the period affected by the crisis. The results are
shown in the table below.
Table 3 – Regression models with panel data, estimated with fixed effects, period from 2000 to 2009.
Explanatory Variables
3rd Model with CG dummy
4th Model with L1, L2 and NM dummies
Coefficient / t Coefficient / t
INTERCEPT
0.6724
(3.13)*
0,6396
(2.97)*
CG
0.0071
(0.27)
CGxCRISIS
-0.0560
(-3.11)*
L1
0,0341
(1.08)
L1xCRISIS
-0,0774
(-2.69)*
L2
-0.1736
(-2.52)**
L2xCRISIS
-0,1128
(-3.39)*
NM
0,0338
(0.96)
NMxCRISIS
-0,0214
(-1.18)
Factors Affecting Stock Liquidity: Corporate Governance, ADRs and Economic Crisis
15
BBR, Vitória, v. 11, n. 1, Art. 1, p. 1 - 24, jan.-mar. 2014 www.bbronline.com.br
ADR
0.9669
(4.24)*
0.9753
(4.22)*
REG
-0.3263
(-2.53)**
-0.3259
(-2.53)**
SIZE
0.2156
(11.52)*
0.2148
(11.42)*
FIN
0.0001
(1.21)
0.0001
(1.22)
ROA
-0.0001
(-0.67)
-0.0001
(-0.64)
VROA
0.0043
(2.20)**
0.0042
(2.19)**
TIME
-0.2882
(-8.08)*
-0.2819
(-7.90)*
NEGEQ
-0.0682
(-8.26)*
-0.0679
(-8.47)*
CRISIS
0.0186
(1.20)
0.0173
(1.11)
F Statistic 22.53* 18.57*
*, ** and *** coefficients significant at 1%, 5% and 10%.
Source: Prepared by the authors.
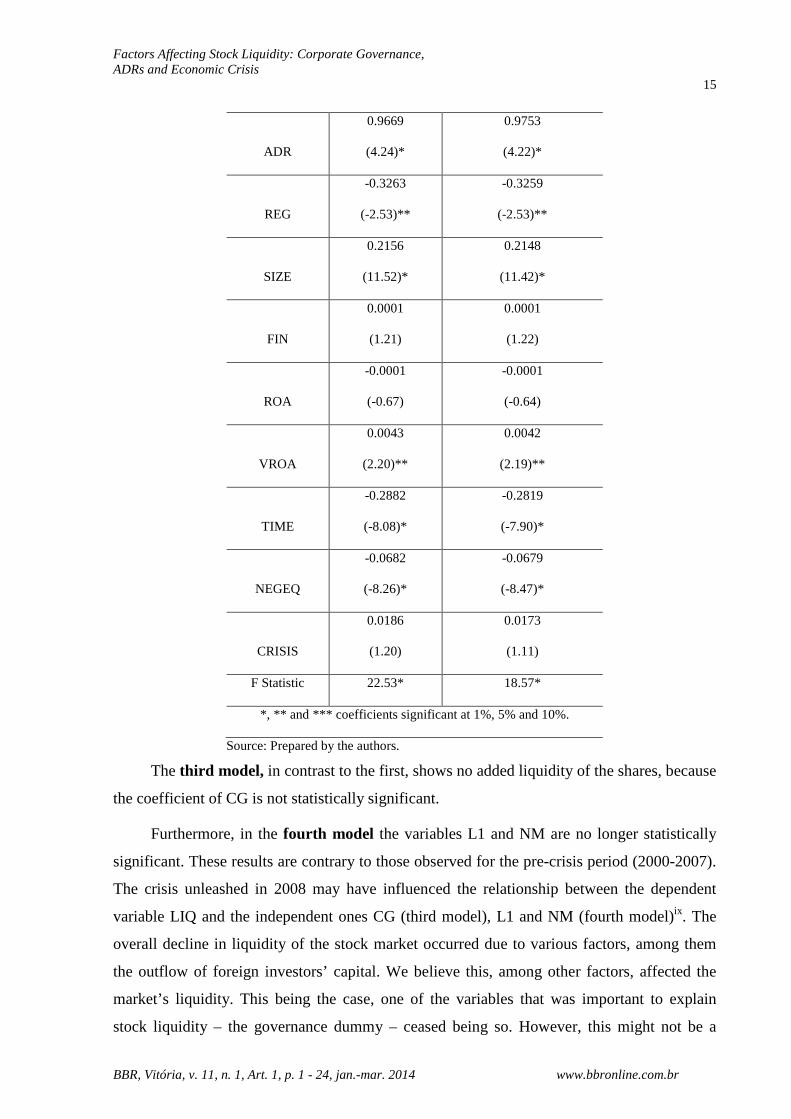
The third model, in contrast to the first, shows no added liquidity of the shares, because
the coefficient of CG is not statistically significant.
Furthermore, in the fourth model the variables L1 and NM are no longer statistically
significant. These results are contrary to those observed for the pre-crisis period (2000-2007).
The crisis unleashed in 2008 may have influenced the relationship between the dependent
variable LIQ and the independent ones CG (third model), L1 and NM (fourth model)ix. The
overall decline in liquidity of the stock market occurred due to various factors, among them
the outflow of foreign investors’ capital. We believe this, among other factors, affected the
market’s liquidity. This being the case, one of the variables that was important to explain
stock liquidity – the governance dummy – ceased being so. However, this might not be a
16 Silva, Nardi, Martins, Barossi-Filho
BBR, Vitória, v. 11, n. 1, Art. 1, p. 1 - 24, jan.-mar. 2014 www.bbronline.com.br
persistent effect. Only future studies, after the effects of the crisis dissipate, will be able to
resolve this point.
On the other hand, the L2 variable continues having the same result as in the 2000-2007
period, albeit contrary to the expectation. In other words, the shares of companies in the Level
2 segment, in the pre-crisis period and during the crisis, are less liquid than the shares of the
other firms.
The interactive variables show the effects of the governance levels during the crisis. In
the case of CGxCRISIS, the estimated coefficient is negative and statistically significant at
1%. Besides this, the variables L1xCRISIS, L2xCRISIS and NMxCRISIS have negative
signs, although only the last one is significant. These results indicate that enhanced corporate
governance practices during the crisis period provided no liquidity premium.
However, the ADR dummy is statistically significant in all the models, with a higher
coefficient in comparison with the 2000-2007 period. This indicates that the issuance of
ADRs came to have a stronger impact on liquidity. A possible explanation is that against the
backdrop of the higher systemic risk in the crisis period, demand increased for the shares of
firms perceived as safer investments due to the higher disclosure required by the SEC’s rules.
Therefore, the results for the variables L1 and NM do not allow any conclusions
regarding hypotheses H1 and H3, since those variables were statistically significant in the
2000-2007 period and not in the 2000-2009 period. The likely explanation for this change in
the relationship of the variables is the crisis. However, to draw more solid conclusions on the
effects on liquidity of listing in the Level 1 and Novo Mercado Segments, later studies with a
longer time frame will be necessary.
On the other hand, according to the results of this study, hypothesis H2 can be rejected,
since the result runs counter to the expectation in periods with our without crisis.
Nevertheless, we must stress the low number of firms listed in the Level 2 segment in the
period studied in relation to the total of 521 firms, as can be seen in the appendix. Since Level
2 firms follow the same rules as Level 1 companies plus others, we expected to find liquidity
at least the same as that of Level 1 firms, assuming all else constant. However, other factors
associated with the companies, such as sector, size, past performance, age, analyst coverage
and specific events, might explain the contrary result.
Another observation that deserves note is the consistently positive effect on liquidity of
issuing ADRs before and during the crisis, something that did not occur for L1 and MN firms.
Factors Affecting Stock Liquidity: Corporate Governance, ADRs and Economic Crisis
17
BBR, Vitória, v. 11, n. 1, Art. 1, p. 1 - 24, jan.-mar. 2014 www.bbronline.com.br
In other words, these variables ceased being relevant to explain stock liquidity, unlike the
ADR variable. With this, assuming that ADR, L1 and NM all represent enhanced governance
factors, it can be said that Brazilian companies that adapted to the rules of the SEC were
perceived more favorably by investors during the crisis period than those following the
governance rules of the L1 and NM segments. It is important to stress that nearly all the
companies issuing ADRs in the sample belong to Level II or III of the NYSE, the most
demanding in terms of SEC regulations, and also are subject to SOX. Consequently, the
governance standards of these firms are naturally stricter, requiring greater rights for investors
and better transparency. These aspects explain the greater liquidity premium for firms with
ADRs in relation to L1 and NM firms.
An explanation for that result can be the different governance rules the companies must
satisfy. For example, firms with securities traded in the American market must abide by the
SOX Act, which according to Andrade & Rossetti (2006, p. 183), “established comprehensive
regulations applicable to corporate life, based on good governance practices.” Besides this, we
can mention the role of institutional investors with influence on governance.
Another aspect to consider is the legal setting of the two countries. Brazil has a code
law system while the United States follows the common law tradition. Among the various
characteristics that differentiate the two systems is the generally weaker enforcement in code
law counties due to institutional factors. According to La Porta, Lopez-de-Silanes & Shleifer
(1998), a legal system with strong enforcement can offset the existence of weak rules, as long
as the courts and administrative authorities are active in protecting investors. This aspect can
explain the greater trust by investors in monitoring the application of governance rules and the
degree of investor protection, helping explain the difference in the estimated coefficients for
the governance and ADR dummies.
In summary, the differences in terms of governance rules and the legal environment are
reflected in the liquidity premium, which favors issuers of ADRs over other firms.
Hypothesis H4 also can be rejected, since although the coefficient of NM is higher than
that of L1 for the pre-crisis period, that effect evaporates for the full period. Furthermore, the
coefficient of L2 is negative in the two periods.
18 Silva, Nardi, Martins, Barossi-Filho
BBR, Vitória, v. 11, n. 1, Art. 1, p. 1 - 24, jan.-mar. 2014 www.bbronline.com.br
5 FINAL CONSIDERATIONS
According to agency theory, principals and agents often do not share the same interests.
In the corporate world, governance mechanisms aim to reduce the risk that agents will
expropriate principals’ wealth.
Many studies have shown that adhesion to enhanced corporate governance practices is
associated with various benefits to companies, among them higher stock liquidity. The
objective of this article was to analyze the relationship between governance and stock
liquidity by means of panel regressions.
Based on the results, H2 is rejected because we observed a negative coefficient for L2 in
both the pre-crisis period (2000-2007) and the full period including the crisis years (2000-
2009). On the other hand, the results for L1 and NM do not allow reaching any conclusions
on H1 and H3, since the variables were statistically significant in the 2000-2007 period and
presented a contrary result in the 2000-2009 period. An explanation for this change in the
relationship of these variables with liquidity can be the effect of the crisis starting in 2008. To
reach conclusions on the variables L1 and NM, further research is necessary over a longer
period. H4 was also rejected in function of the results of the previous hypotheses.
The results are not coherent with the expected benefits for firms in the special
governance segments in comparison with those in the traditional trading segment, especially
for L2.
The greatest benefit in terms of stock liquidity appears to be provided by having ADRs.
The likely explanation is that the criteria for listing on the NYSE and the consequent need to
comply with the rules of the Sarbanes-Oxley Act and the SEC are more stringent than those
for admission to any of the three special trading segments of the BM&FBovespa.
Besides this, there are institutional aspects of the Brazilian capital market that should be
considered, mainly the relatively low protection of investors and high ownership and control
concentration (Okimura et al., 2004), both of which act as disincentives to investment.
However, this study shows that the signals sent by adhering to a special trading segment
and/or issuing ADRs can bring benefits to companies, especially those issuing ADRs. An
explanation for these differences in stock liquidity can be the legal and regulatory
environment, where Brazil has some weaknesses in relation to the United States.
One limitation of this study is the fact we did not consider other variables that can
influence stock liquidity, and consequently the regression results. Another limitation is the use
Factors Affecting Stock Liquidity: Corporate Governance, ADRs and Economic Crisis
19
BBR, Vitória, v. 11, n. 1, Art. 1, p. 1 - 24, jan.-mar. 2014 www.bbronline.com.br
of a single proxy for liquidity. Studies such as that of Amihud (2002) indicate that liquidity is
a multi-dimensional variable that cannot be captured by a single metric. For this reason, future
studies could use other proxies for liquidity. The same goes for the measurement of corporate
governance. A governance index that involves aspects of information disclosure and
shareholder rights other than those inherent in the dummy variables used here could help
explain the differences in the liquidity of firms’ shares. Finally, future studies covering longer
intervals, to include years after recovery from the 2008 crisis, can help shed more light on the
endurance of the effects of this event.
REFERENCES
AGUIAR, A. B.; CORRAR, L. J.; BATISTELLA, F. D. Adoção de práticas de governança corporativa e o comportamento das ações na Bovespa: evidências empíricas. Revista de Administração – RAUSP, São Paulo, v. 39, n. 4, p. 338-347, out./nov./dez. 2004.
AMIHUD, Y.; MENDELSON, H. Asset pricing and the bid-ask spread. Journal of Financial Economics, Amsterdam, v. 17, n. 2, p. 223-250, dez. 1986.
AMIHUD, Y.; MENDELSON, H. The liquidity route to a lower cost of capital. Journal of Applied Corporate Finance, New York, v. 12, n. 4, p. 8-25, winter 2000.
AMIHUD, Y. Illiquidity and stock returns: cross-section and time series effects. Journal of Financial Markets, v. 5, n. 1, p. 31-56, 2002.
ANDRADE, A.; ROSSETTI, J. P. Governança corporativa: fundamentos, desenvolvimento e tendências. 2. ed. São Paulo: Atlas, 2006.
ASSAF NETO, A.; AMBROZINI, M. A.; LIMA, F. G. Dividendos: teoria e prática. Ribeirão Preto: Inside Books. 2007.
ATTIG, N. et al. Effects of large shareholding on information asymmetry and stock liquidity. Journal of Banking and Finance, v. 30, n. 10, p. 2875-2892, 2006.
BAUM, C. F. Residual diagnostics for cross-section time series regression models. The Stata Journal, v. 1, n. 1, p. 101-104, 2001.
BOVESPA - Bolsa de Valores de São Paulo. Disponível em: <www.bovespa.com.br>. Acesso em: 27 fev. 2006.
BUSHMAN, R. M.; SMITH, A. J. Financial accounting information and corporate governance. Journal of Accounting and Economics, v. 32, n. 1-3, p. 237-333, 2001.
CAMARGOS, M. A.; BARBOSA, F. V. Evidência empírica do impacto da adesão aos níveis diferenciados de governança corporativa sobre o comportamento das ações na Bovespa. In: ENCONTRO DA ASSOCIAÇÃO NACIONAL DE PÓS-GRADUAÇÃO E PESQUISA EM ADMINISTRAÇÃO, 30., 2006, Salvador. Anais... Salvador: ANPAD, 2006.
20 Silva, Nardi, Martins, Barossi-Filho
BBR, Vitória, v. 11, n. 1, Art. 1, p. 1 - 24, jan.-mar. 2014 www.bbronline.com.br
CAMERON, A. C.; TRIVEDI, P. K. Microeconometrics using stata. Texas: Stata Press, 2010.
CARVALHO, A. G. Efeitos da migração para os níveis de governança da Bovespa. Bolsa de Valores de São Paulo, 2003. Disponível em: <http://www.bovespa.com.br/pdf/uspniveis.pdf>. Acesso em: 23 abr. 2006.
CHAVEZ, G. A.; SILVA, A. C. Improved corporate governance: market reaction and liquidity implications. Working Paper. Disponível em <http://latienda.ie.edu/working_papers_economia/WP06-08.pdf>. Acesso em: 01 set. 2010.
CHEN, W. et al. Corporate governance and equity liquidity: analysis of S&P transparency and disclosure rankings. Corporate Governance: An International Review, v. 15, n. 4, p. 644-660, jul. 2007.
CHUNG, K. H.; ELDER, J.; KIM, J. Corporate governance and liquidity. Journal of Financial and Quantitative Analysis, v. 45, n. 2, p. 265-291, abr. 2010.
COMISSÃO DE VALORES MOBILIÁRIOS (CVM ). Disponível em: <http://www.cvm.gov.br>. Acesso em: 5 mar. 2006.
DUMITRESCU, A. Corporate governance and market liquidity. Social Science Research Network, working papers series. Abril 2010. Disponível em: <http://ssrn.com/abstract=1343783>. Acesso em: 01 set. 2010.
DRUKKER, D. M. Testing for serial correlation in linear panel-data models. Stata Journal, v. 3, n. 2, p. 168-177, 2003.
GOH, B. W.; NG, J.; YOUNG, K. O. Corporate governance and liquidity: an exploration of voluntary disclosure, analyst coverage and adverse selection as mediating mechanisms. In: ANNUAL MEETING AND CONFERENCE ON TEACHING AND LEARNING IN ACCOUNTING, 2009. Anais Eletrônicos… New York, 2009. Disponível em: <http://aaahq.org/AM2009/abstract.cfm?submissionID=1489>. Acesso em: 01 set. 2010.
HUBER, P. J. The behavior of maximum likelihood estimates under nonstandard conditions. In: BERKELEY SYMPOSIUM ON MATHEMATICAL STATISTICS AND PROBABILITY, 15., 1967, Berkeley, CA. Anais… Berkeley: University of California, v. 1, p. 221–233.
JENSEN, M. C.; MECKLING, W. H. Theory of the firm: managerial behavior, agency costs and ownership structure. Journal of Financial Economics, v. 3, n. 4, p. 305-360, out. 1976.
JENSEN, M.; MECKLING, W. H. The nature of man. Journal of Applied Corporate Finance, v. 7, n. 2, p. 4-19, Summer 1994.
KPMG. A governança corporativa e o mercado de capitais: um panorama das corporações brasileiras na BMF&FBOVESPA e nas bolsas norte-americanas. Versão 2009-2010. Disponível em: <http://www.kpmg.com.br/aci/publicacoes/2009/Estudo_GC2009.pdf>. Acesso: 01 set. 2009.
Factors Affecting Stock Liquidity: Corporate Governance, ADRs and Economic Crisis
21
BBR, Vitória, v. 11, n. 1, Art. 1, p. 1 - 24, jan.-mar. 2014 www.bbronline.com.br
KANAGARETNAM, K.; LOBO, G. J.; WHALEN, D. J. Does good corporate governance reduce information asymmetry around quarterly earnings announcements? Journal of Accounting and Public Policy, v. 26, n. 4, p. 497-522, 2007.
LA PORTA, R. et al. Investor protection and corporate governance. Journal of Financial Economics, v. 58, n. 1, p. 3-27, out. 2000.
LA PORTA, R. et al. Legal determinants of external finance. The Journal of Finance, v. 52, n. 3, p. 1131-1150, 1997.
LA PORTA, R.; LOPEZ-DE-SILANES, F.; SHLEIFER, A. Law and finance. Journal of Political Economy, v. 106, n. 6, p. 1113-1155, 1998.
LIMA, R. A. et al. O bid-ask spread e a governança certificada: uma investigação no mercado de capitais brasileiro em 2006. Advances in Scientific and Applied Accounting. São Paulo, v. 4, n. 1, p. 101-125, 2011.
MARTINS, V. A.; SILVA, R. L. M.; NARDI, P. C. C. Governança corporativa e liquidez das ações. In: ENCONTRO DA ASSOCIAÇÃO NACIONAL DE PÓS-GRADUAÇÃO E PESQUISA EM ADMINISTRAÇÃO, 30., 2006, Salvador. Anais... Salvador: ANPAD, 2006.
OKIMURA, R. T., SILVEIRA, A. M., ROCHA, K. C. Estrutura de propriedade e desempenho corporativo no Brasil. In: ENCONTRO DA ASSOCIAÇÃO NACIONAL DE PÓS-GRADUAÇÃO E PESQUISA EM ADMINISTRAÇÃO, 28., Curitiba, 2004. Anais... Curitiba: ANPAD, 2004. CD-ROM.
PINDYNCK, R. S.; RUBINFELD, D. L. Econometria: modelos e previsões. 4 ed. Rio de Janeiro: Elsevier, 2004.
SARLO NETO, A.; LOPES A. B.; LOSS, L. O impacto da regulamentação sobre a relação entre lucro e retorno das ações das empresas dos setores elétrico e financeiro no Brasil. In: ENCONTRO DA ASSOCIAÇÃO NACIONAL DE PÓS-GRADUAÇÃO E PESQUISA EM ADMINISTRAÇÃO, 26., Salvador, 2002. Anais... Salvador: ANPAD, 2002.
SCHADEWITZ, H. J.; BLEVINS, D. R. Major determinants of interim disclosures in an emerging market. American Business Review, v. 16, n. 1, p. 41-55, 1998.
SHLEIFER, A. VISHNY, R. A survey of corporate governance. Journal of Finance, v. 52, n. 2, p. 737-783, 1997.
SILVEIRA, A. M. Governança corporativa, desempenho e valor da empresa no Brasil. São Paulo. 2002. 152 f. Dissertação (Mestrado em Administração) – Faculdade de Economia, Administração e Contabilidade da Universidade de São Paulo, 2002. Disponível em: <www.teses.usp.br>.
SILVEIRA, A. M. Governança corporativa e estrutura de propriedade: determinantes e relação com o desempenho das empresas no Brasil. 2004. 250 f. Tese (Doutorado em Administração) – Faculdade de Economia, Administração e Contabilidade da Universidade de São Paulo, 2004.
22 Silva, Nardi, Martins, Barossi-Filho
BBR, Vitória, v. 11, n. 1, Art. 1, p. 1 - 24, jan.-mar. 2014 www.bbronline.com.br
SILVEIRA, A. D. M.; BARROS, L. A. B. C. Determinantes da qualidade da governança corporativa das companhias abertas brasileiras. Revista Eletrônica de Administração – REAd. ed. 61, v. 14, n. 3, set./dez. 2008.
VIEIRA, K. M.; CERETTA, P. S.; FONSECA, J. L. Influência da variação da liquidez na precificação de ativos: análise em painel do mercado brasileiro no período de janeiro de 2000 a junho de 2008. Brazilian Business Review, v. 8, n. 3, p. 41-65, jul./set. 2011.
VIEIRA, K. M.; MILACH, F. T. Liquidez/iliquidez no mercado brasileiro: comportamento no período 1995-2005 e suas relações com o retorno. Revista Base, v. 5, n. 1, p. 5-16, jan./abr. 2008.
WHITE, H. A heteroskedasticity-consistent covariance matrix estimator and a direct test for heteroskedasticity. Econometrica, v. 48, n. 4, p. 817–830, 1980.
WOOLDRIDGE, J. M. Introdução à econometria: uma abordagem moderna. Tradução: Rogério César de Souza e José Antonio Ferreira, São Paulo: Pioneira Thomson Learning, 2006.
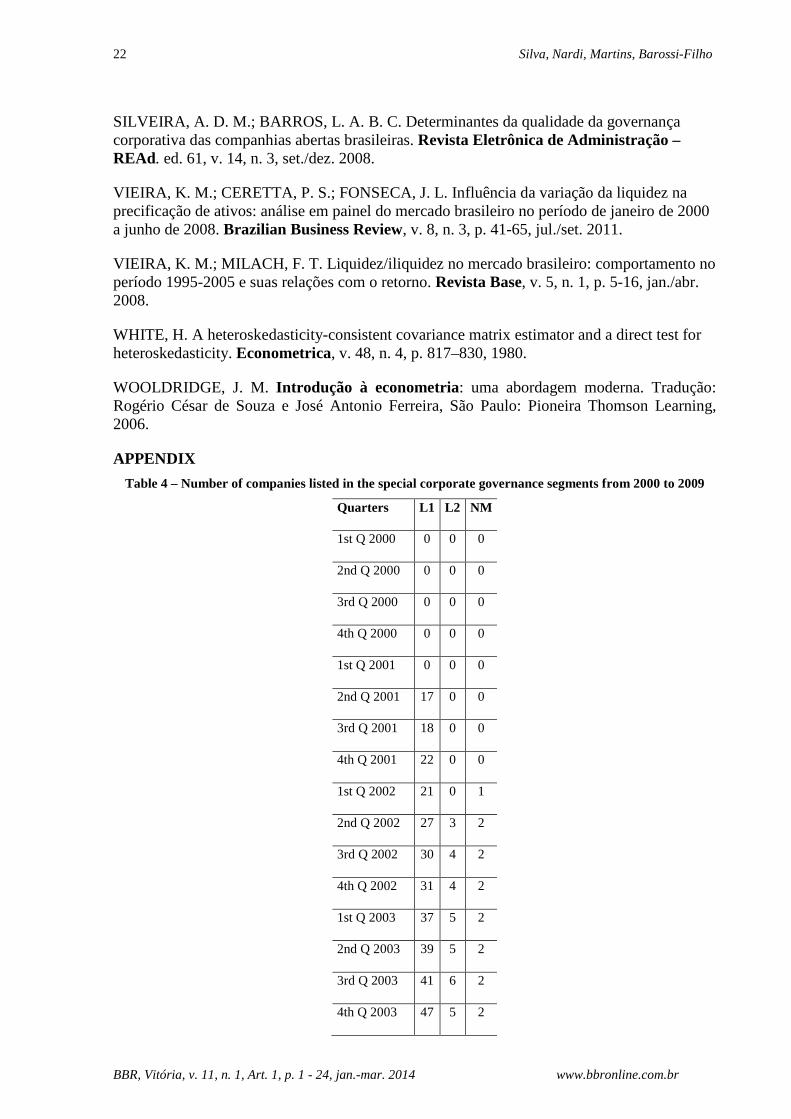
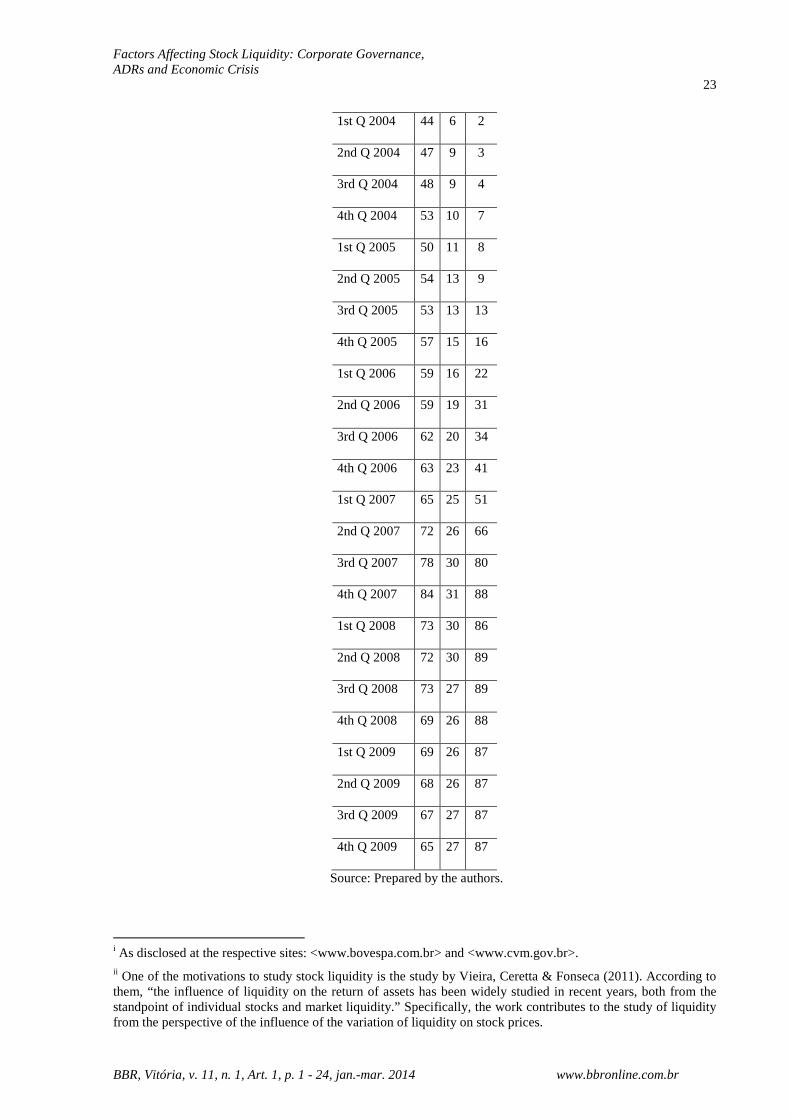
APPENDIX
Table 4 – Number of companies listed in the special corporate governance segments from 2000 to 2009
Quarters L1 L2 NM
1st Q 2000 0 0 0
2nd Q 2000 0 0 0
3rd Q 2000 0 0 0
4th Q 2000 0 0 0
1st Q 2001 0 0 0
2nd Q 2001 17 0 0
3rd Q 2001 18 0 0
4th Q 2001 22 0 0
1st Q 2002 21 0 1
2nd Q 2002 27 3 2
3rd Q 2002 30 4 2
4th Q 2002 31 4 2
1st Q 2003 37 5 2
2nd Q 2003 39 5 2
3rd Q 2003 41 6 2
4th Q 2003 47 5 2
Factors Affecting Stock Liquidity: Corporate Governance, ADRs and Economic Crisis
23
BBR, Vitória, v. 11, n. 1, Art. 1, p. 1 - 24, jan.-mar. 2014 www.bbronline.com.br
1st Q 2004 44 6 2
2nd Q 2004 47 9 3
3rd Q 2004 48 9 4
4th Q 2004 53 10 7
1st Q 2005 50 11 8
2nd Q 2005 54 13 9
3rd Q 2005 53 13 13
4th Q 2005 57 15 16
1st Q 2006 59 16 22
2nd Q 2006 59 19 31
3rd Q 2006 62 20 34
4th Q 2006 63 23 41
1st Q 2007 65 25 51
2nd Q 2007 72 26 66
3rd Q 2007 78 30 80
4th Q 2007 84 31 88
1st Q 2008 73 30 86
2nd Q 2008 72 30 89
3rd Q 2008 73 27 89
4th Q 2008 69 26 88
1st Q 2009 69 26 87
2nd Q 2009 68 26 87
3rd Q 2009 67 27 87
4th Q 2009 65 27 87
Source: Prepared by the authors.
i As disclosed at the respective sites: <www.bovespa.com.br> and <www.cvm.gov.br>. ii One of the motivations to study stock liquidity is the study by Vieira, Ceretta & Fonseca (2011). According to them, “the influence of liquidity on the return of assets has been widely studied in recent years, both from the standpoint of individual stocks and market liquidity.” Specifically, the work contributes to the study of liquidity from the perspective of the influence of the variation of liquidity on stock prices.
24 Silva, Nardi, Martins, Barossi-Filho
BBR, Vitória, v. 11, n. 1, Art. 1, p. 1 - 24, jan.-mar. 2014 www.bbronline.com.br
iii For more details, see Silveira (2004, p. 54). iv At the time it was just the Bovespa (before the merger with BM&F in 2006).
vCalculated by the following equation: V
v
N
n
P
pidityMarketliqu ××
×= 100, where: p = number of days when there
was at least one trade of the stock within the period chosen; P = number of days in the period chosen; n = number of trades of the stock within the period chosen; N = number of trades of all stocks within the period chosen; v = volume of trading of the stock in monetary terms in the period chosen; and V = volume of trading of all stocks in monetary terms in the period chosen. vi The bid-ask spread is the difference between the buy and sell prices quoted in the market at the same moment. The idea is that the greater this difference is, the lower the liquidity will be, because it will be harder for an investor to carry out a quick round of trading. Therefore, the bid-ask spread is a natural measure of liquidity. vii We calculated the modified Wald statistic for heteroscedasticity in the form of groups in the residuals of the regression model with fixed effects (Baum, 2001); H0: homoscedastic residuals, H1: heteroscedastic residuals. viii We carried out the test of the presence of autocorrelation developed by Drukker (2003). H0: residuals not autocorrelated, H1: residuals autocorrelated with order ρ. ix In additional tests, not reported, the variable “Crisis”, when considered alone or together with the corporate governance variables, presented a negative sign and statistical significance at the 1% level, revealing the influence of the crisis on the behavior of the stock liquidity variable.
Related Documents