102 Human Dimensions of Wildlife, 14:102–118, 2009 Copyright © Taylor & Francis Group, LLC ISSN: 1087-1209 print / 1533-158X online DOI: 10.1080/10871200802695594 UHDW 1087-1209 1533-158X Human Dimensions of Wildlife, Vol. 14, No. 2, January 2009: pp. 1–26 Human Dimensions of Wildlife Factors Affecting Perceptions of Human–Wildlife Interactions in Residential Areas of Northern New York and Implications for Conservation Factors Affecting Human–Wildlife Interactions H. E. Kretser et al. HEIDI E. KRETSER, 1 PAUL D. CURTIS, 2 JOSEPH D. FRANCIS, 3 ROLF J. PENDALL, 4 AND BARBARA A. KNUTH 2 1 Wildlife Conservation Society, Saranac Lake, New York, USA 2 Department of Natural Resources, Cornell University, Ithaca, New York, USA 3 Department of Development Sociology, Cornell University, Ithaca, New York, USA 4 Department of City and Regional Planning, Cornell University, Ithaca, New York, USA We explored factors influencing people’s perceptions of human–wildlife interactions in residential areas, reporting interactions to authorities, and potential conservation implications. Data were obtained from a mail survey of 1,439 landowners. We used logistic regression to predict probabilities of having non-positive perceptions and reporting interactions to authorities. Our models predicted perceptions relatively well; factors influencing perceptions included attitudes toward wildlife, experiences with wildlife, age, urban or rural upbringing, and location of current residence. Our models did not predict reports of human–wildlife interactions with satisfactory accuracy. Overall perceptions of wildlife interactions were more positive compared to percep- tions of experiences with specific species around respondents’ homes. Those not having positive interactions demonstrated less support for land and wildlife conservation. Future research should explore species-specific and incident-specific details to anticipate potentially negative perceptions of human–wildlife interactions, develop mechanisms for engaging those indifferent to wildlife interactions, and determine interventions that maintain support for conservation endeavors. Keywords human–wildlife conflict, Adirondack Park, exurban, logistic regression, protected area, urban–rural interface Introduction Interactions between humans and wildlife occur across a variety of social and landscape contexts (Woodroffe, Thirgood, & Rabinowitz, 2005; Messmer, 2000). People may view interactions with wildlife as fun, exciting, and providing an opportunity to learn more about wildlife. When interactions result in property loss or threats to domestic animals or human safety, however, the effects can be devastating. Such conflicts can result in a desire for species control and considerable setbacks for local wildlife and habitat conservation Address correspondence to Heidi E. Kretser, Wildlife Conservation Society, 7 Bandy Brook Avenue, Suite 204, Saranac Lake, NY 12983, USA. E-mail: [email protected]

Welcome message from author
This document is posted to help you gain knowledge. Please leave a comment to let me know what you think about it! Share it to your friends and learn new things together.
Transcript

102
Human Dimensions of Wildlife, 14:102–118, 2009Copyright © Taylor & Francis Group, LLCISSN: 1087-1209 print / 1533-158X onlineDOI: 10.1080/10871200802695594
UHDW1087-12091533-158XHuman Dimensions of Wildlife, Vol. 14, No. 2, January 2009: pp. 1–26Human Dimensions of Wildlife
Factors Affecting Perceptions of Human–Wildlife Interactions in Residential Areas of Northern New York and Implications for Conservation
Factors Affecting Human–Wildlife InteractionsH. E. Kretser et al. HEIDI E. KRETSER,1 PAUL D. CURTIS,2 JOSEPH D. FRANCIS,3 ROLF J. PENDALL,4 AND BARBARA A. KNUTH2
1Wildlife Conservation Society, Saranac Lake, New York, USA2Department of Natural Resources, Cornell University, Ithaca, New York, USA3Department of Development Sociology, Cornell University, Ithaca, New York,USA4Department of City and Regional Planning, Cornell University, Ithaca, New York,USA
We explored factors influencing people’s perceptions of human–wildlife interactions inresidential areas, reporting interactions to authorities, and potential conservationimplications. Data were obtained from a mail survey of 1,439 landowners. We usedlogistic regression to predict probabilities of having non-positive perceptions andreporting interactions to authorities. Our models predicted perceptions relatively well;factors influencing perceptions included attitudes toward wildlife, experiences withwildlife, age, urban or rural upbringing, and location of current residence. Our modelsdid not predict reports of human–wildlife interactions with satisfactory accuracy.Overall perceptions of wildlife interactions were more positive compared to percep-tions of experiences with specific species around respondents’ homes. Those not havingpositive interactions demonstrated less support for land and wildlife conservation.Future research should explore species-specific and incident-specific details to anticipatepotentially negative perceptions of human–wildlife interactions, develop mechanismsfor engaging those indifferent to wildlife interactions, and determine interventions thatmaintain support for conservation endeavors.
Keywords human–wildlife conflict, Adirondack Park, exurban, logistic regression,protected area, urban–rural interface
Introduction
Interactions between humans and wildlife occur across a variety of social and landscapecontexts (Woodroffe, Thirgood, & Rabinowitz, 2005; Messmer, 2000). People may viewinteractions with wildlife as fun, exciting, and providing an opportunity to learn moreabout wildlife. When interactions result in property loss or threats to domestic animals orhuman safety, however, the effects can be devastating. Such conflicts can result in a desirefor species control and considerable setbacks for local wildlife and habitat conservation
Address correspondence to Heidi E. Kretser, Wildlife Conservation Society, 7 Bandy BrookAvenue, Suite 204, Saranac Lake, NY 12983, USA. E-mail: [email protected]

Factors Affecting Human–Wildlife Interactions 103
efforts (e.g., Treves, Wallace, Naughton-Treves, & Morales, 2006; Jonker, Muth, Organ,Zwiek, & Siemer, 2006; Omondi, 1995; Decker & Brown, 1982).
In the United States, exurban development (low-density residential development on5- to 40-acre parcels per single family dwelling) is more dense than traditional agrariancommunities but less dense than suburban uses and consumes 10 times more land thansuburban and urban development combined (United States Department of Agriculture,2003). Exurbanization is associated with habitat fragmentation, wildlife adaptations to livingin close proximity with humans, declines in consumptive wildlife recreation, changes insupport for wildlife management techniques, and increases in reported human–wildlifeinteractions (Kretser, Sullivan, & Knuth, 2008; Glennon & Kretser, 2005; Conover, 2002;Organ & Ellingwood, 2000; Stout, Stedman, Decker, & Knuth, 1993).
In recent years, reported human–wildlife interactions and requests for assistance with suchinteractions have increased (Lindsey & Adams, 2006). Those experiencing human–wildlifeinteractions at the urban–rural fringe may contact numerous agencies for assistance or informa-tion. State wildlife agencies receive, record, and respond to many of these inquiries, and aremandated to manage wildlife in the interests of the public (Geist, Mahoney, & Organ, 2001).Effectively managing these human–wildlife impacts and minimizing conflicts (Riley et al.,2002) involves knowing where interactions take place and how they are perceived.
While landscape characteristics influence locations of human–wildlife interactions(Treves et al., 2004; McIntyre, 1999; Kretser et al., 2008), social characteristics driveemotional responses to wildlife (Kellert, 1980a, 1980b). The cognitive hierarchy suggeststhat people develop wildlife values from a young age and these values tend to be resistantto change. These orientations form the basis of beliefs, attitudes, and behaviors (Schwartz &Bilsky, 1987; Fulton, Manfredo, & Liscomb, 1996). Attitudes (i.e., evaluative judgmentsabout an event) are related to more recent experiences and are influenced by beliefs (Homer &Kahle, 1988). Beliefs and past experiences relate to factors such as age, gender, socioeco-nomic status, and upbringing (i.e., rural vs. urban) (Fazio & Zanna, 1981; Kaczensky,Blazic, & Gossow, 2004). Attitudes are important because they influence how people willbehave (Fazio & Zanna, 1981; Fulton et al., 1996). In this article, we explore how peopleperceive experiences with a range of wildlife impacts typically found in residential areas,factors underlying these attitudes, whether a landowner reports a human–wildlife interac-tion to authorities, and the association between landowners’ overall perception of wildlifeexperiences around their home and their support for conservation (a behavioral intention).
Studies have demonstrated the importance of understanding stakeholders to developeffective strategies for addressing human–wildlife interactions, especially those resultingin conflicts (e.g., co-management) (Treves et al., 2006, Decker & Chase, 1997). Under-standing what drives perceptions of wildlife, tolerance to human–wildlife conflict, andattitudes toward management practices provides insight into what variables might influ-ence landowners’ perceptions of wildlife interactions in residential exurban and urban areas.Research evaluating attitudes toward specific species (e.g., white-tailed deer, Odocoileusvirgininus, Canada geese, Branta Canadensis) in suburban or agricultural areas demonstratedthat perceptions relate to prior experiences with that species (e.g., damage, exposure tothe species through outdoor activities) as well as more general attitudes about that spe-cies or how people value it (e.g., for hunting or economic benefit, for education, forexistence value; West & Parkhurst, 2002; Coluccy, Drobney, Graber, Sheriff, & Witter,2001; Stout, Stedman, Decker, & Knuth, 1993). Naughton-Treves and Treves (2005)summarized research on factors shaping landowners’ tolerance of wildlife conflicts; fac-tors associated with lower tolerance included small landholdings, the inability toemploy a variety of strategies to address or prevent damage, lack of alternative income

104 H. E. Kretser et al.
aside from land activities, damage caused by an animal with little economic value, alarge and potentially dangerous animal, and frequent conflicts.
In Sweden, a rural connection or ability to spend time outdoors or in the countrysidefavorably affected urbanites’ perceptions toward wolves (Canis lupus) (Heberlien & Ericsson,2005). Perceptions of carnivores tend to be more negative for people who are older, female,work in professions dependent on natural resources, or live in rural areas (Kellert, Black,Rush, & Bath, 1996). Positive perceptions of a species appear to be related to education levelor knowledge about a species (Bath & Buchanan, 1989; Kaczensky et al., 2004).
In light of previous work, we expected experience with wildlife, knowledge aboutwildlife, and more general attitudes about and previous behaviors toward wildlife wouldinfluence how individuals perceive a human–wildlife interaction. We expected that thosesame variables, with the addition of perceptions of experiences with wildlife, would pre-dict whether or not someone reported a human–wildlife interaction to authorities. We alsoexpected that positive perceptions of experiences would be associated with support forland and wildlife protection programs.
Study Site
We conducted our research in Northern New York State. Four study areas were included,two inside the 24,000 km2 of publicly and privately owned lands of the Adirondack Parkand two outside the Park (Figure 1). Study areas were selected based on hot spot locationsof reported nuisance wildlife “complaints” (as termed by the agencies involved and a
Figure 1. Map of study areas in Northern New York State.
0 10 20 30 405Miles
¯
Legend
Adirondack ParkNorthern New York
High Amenity ExurbanTraditional Exurban
Urban IIUrban I
To Montreal, CANADA
To Albany, NEW YORK
I-87
New York State
Adirondack State Park
Northern New York Study Area

Factors Affecting Human–Wildlife Interactions 105
cluster analysis in CrimeStatII) from 2001–2003 along the Interstate 87 corridor, Albany,New York to Montreal, Canada. Complaints were recorded by the New York StateDepartment of Environmental Conservation (DEC) and private nuisance wildlife controloperators (NWCO) (Levine, 2007). We called the study areas Urban I (population ∼62,000),Urban II (pop. ∼55,000), Traditional Exurban (pop. ∼22,000), and High-Amenity Exurban(pop. ∼24,000) (U.S. Census Bureau, 2006). Urban I had a vibrant downtown, a smallliberal arts college, national historic sites, and a race track. Urban II had conventionalindustries, some of which have declined during the past few decades. The TraditionalExurban area had abundant natural resources and is located on a major Interstate within anhour commute of the urban areas. The High Amenity Exurban area was more than 30 minutesfrom I87, over one hour from any urban area, yet had vibrant downtown communities andaccess to abundant natural resources. We generated a random sample of landowners fromcounty tax assessment data that listed owners of the property.
Methods
Survey Implementation
The self-administered mail questionnaire was based on (a) results of 45 semi-structuredinterviews to assess perceptions of residential development and impacts to wildlifeconducted in 2004 with Northern New York residents, local-decision makers, realtors,and government leaders (Kretser, 2008) and (b) prior research and theory (Fulton et al.,1996; Treves, 2009). The survey was pre-tested on 30 residents from towns adjacentto the study sites. We sent questionnaires to a random sample of 1,100 landowners ineach site. We used a multi-phased contact approach: an initial survey mailing, a fol-low-up post card, a second survey mailing to non-respondents, and a final reminderpostcard. Short telephone interviews with 25 non-respondents were conducted at eachsite to assess non-response bias (Connelly, Knuth, & Kay, 2002). We also includedseveral questions from our survey in The Empire State Poll to compare results ofNorthern New York survey respondents with Upstate New York residents (i.e., notliving in New York City and Long Island) (Nisbet, 2007).
Survey Content and Analysis
We requested information about the types of wildlife respondents interact with, theirperceptions of specific interactions, as well as their overall perceptions of wildlife interac-tions (Kretser, 2008). We also requested information on what types of actions they tookafter they had an interaction with wildlife, their attitudes and knowledge about wildlife,their attitudes about land conservation and development; and demographic data. In thisanalysis, we focused on age and income, and a suite of variables thought to influenceperceptions of wildlife (Table 1).
Dependent Variables
Perceived experiences with wildlife. We asked people to think about wildlife experiencesaround their home. For example, “What is your overall experience with wildlife during thepast five years?” Participants selected responses on a 5-point scale of very negative, nega-tive, neither negative nor positive, positive, or very positive.

106
Tab
le 1
Var
iabl
es e
xpec
ted
to in
flue
nce
resp
onde
nts’
exp
erie
nces
with
wild
life
over
the
past
5 y
ears
1
Var
iabl
e
Exp
erie
nce
wit
h w
ildlif
e
Posi
tive
(n
= 9
81)
Not
pos
itiv
e (n
= 3
93)
Dem
ogra
phic
sM
ean
age
57.9
64.4
**M
ean
inco
me2
4.60
4.04
**T
ype
of r
esid
ent
Seas
onal
22.6
%21
.9%
Per
man
ent
77.4
%78
.1%
Len
gth
of o
ccup
ancy
3N
ewco
mer
19.3
%14
.7%
Lon
gtim
er80
.7%
85.3
%P
rim
ary
orig
in4
Urb
an b
ackg
roun
d37
.8%
33.0
%R
ural
bac
kgro
und
62.2
%67
.0%
Kno
wle
dge
of w
ildlif
e53.
172.
36**
Beh
avio
rs t
owar
d w
ildlif
e6
Prom
otin
g w
ildl
ife
inte
ract
ions
(sc
ale:
−3.
72 to
2.3
4)0.
272
-0.7
04**
Prot
ectin
g pr
oper
ty f
rom
wil
dlif
e (s
cale
: −2.
61 to
2.8
9)-0
.137
0.15
8**
Att
itud
es t
owar
d w
ildlif
e6
Wil
dlif
e to
lera
nce
and
enjo
ymen
t (sc
ale:
−6.
71 to
2.4
6)0.
262
-0.5
92**
Wil
dlif
e co
ncer
ns (
scal
e: −
4.47
to 2
.54)
-0.2
060.
464*
*E
xper
ienc
e w
ith
wild
life
Dam
age7
Pre
viou
s da
mag
e fr
om w
ildl
ife
69.3
%63
.0%
No
prev
ious
dam
age
from
wil
dlif
e30
.7%
37.0
%*
Fre
quen
cy o
f in
tera
ctio
ns w
ith
wil
dlif
e8M
ore
than
onc
e pe
r w
eek
78.7
%43
.2%
Onc
e pe
r w
eek
or le
ss21
.3%
56.8
%**

107
Par
tici
pate
s in
out
door
act
iviti
es9
Con
sum
ptiv
e w
ildl
ife
acti
viti
es42
.7%
33.2
%**
Non
-con
sum
ptiv
e w
ildl
ife
acti
viti
es87
.9%
52.7
%**
Mot
oriz
ed a
ctiv
itie
s42
.6%
37.4
%N
on-m
otor
ized
act
ivit
ies
85.0
%69
.2%
**E
xtre
me
recr
eati
onal
act
ivit
ies
29.1
%15
.7%
**
1 *p <
.05,
**p
< .0
1, s
igni
fica
nt d
ata
in b
old.
2 Scal
e: T
otal
Fam
ily I
ncom
e Sc
ale
from
1–1
0, w
here
1 =
“$1
9,99
9 or
less
,” 2
= “
$20,
000–
$39,
999,
” 3
= “
40,0
00–$
59,9
99,”
. . .
10
= “
$180
,000
or
mor
e.”
3 Lon
gtim
ers
wer
e co
nsid
ered
thos
e w
ho li
ved
in th
e ar
ea f
or 1
0 or
mor
e ye
ars
(Sm
ith &
Kra
nnic
h, 2
000)
.4 R
espo
nden
ts in
dica
ted
the
area
that
des
crib
ed w
here
they
live
d th
e m
ost p
rior
to th
eir
18th
bir
thda
y; U
rban
= u
rban
or
subu
rban
, Rur
al =
rur
al, m
ostly
far
mla
nd,
rura
l—m
ostly
res
iden
tial,
smal
l tow
n.5 A
sum
of
corr
ect r
espo
nses
to s
even
kno
wle
dge
ques
tions
rel
atin
g to
wild
life
in N
orth
ern
New
Yor
k (N
NY
): H
uman
–wild
life
conf
licts
are
incr
easi
ng in
NN
Y;
Bla
ck b
ears
are
rar
e in
NN
Y; R
ed f
ox h
ave
mor
e sp
ecif
ic h
abita
t req
uire
men
ts th
an A
mer
ican
mar
ten;
Coy
otes
are
nat
ive
to N
NY
; Abo
ut 2
00 m
oose
live
in N
NY
;W
arbl
ers
have
mor
e sp
ecif
ic h
abita
t req
uire
men
ts th
an b
lue
jays
; Som
e sp
ecie
s ad
apt t
o th
e pr
esen
ce o
f hu
man
s.6 E
ach
vari
able
fro
m a
fac
tor
anal
ysis
on
stat
emen
ts a
bout
beh
avio
rs a
roun
d re
spon
dent
s’ p
rope
rty
and
attit
udes
abo
ut w
ildlif
e, C
ronb
ach’
s al
pha
rang
ed f
rom
0.62
4 to
0.7
96 (
Kre
tser
, 200
8).
7 Res
pond
ents
ans
wer
ed y
es o
r no
to h
avin
g da
mag
e to
thei
r pr
oper
ty o
r be
long
ings
fro
m w
ildlif
e at
any
tim
e.8 R
espo
nden
ts i
ndic
ated
on
aver
age
how
oft
en t
hey
inte
ract
with
wild
life:
nev
er, a
few
tim
es p
er y
ear,
onc
e a
mon
th, s
ever
al t
imes
per
mon
th, s
ever
al t
imes
per
wee
k, o
r da
ily. W
e re
code
d th
e va
riab
le in
to a
dic
hoto
mou
s re
spon
se a
s on
ce p
er w
eek
or le
ss a
nd m
ore
than
onc
e pe
r w
eek.
9 Res
pond
ents
che
cked
the
activ
ities
in w
hich
they
had
eng
aged
ove
r th
e la
st 1
2 m
onth
s. W
e di
vide
d th
em in
to c
ateg
orie
s: c
onsu
mpt
ive
wil
dlif
e ac
tiviti
es =
bea
r,de
er, o
r sm
all g
ame
hunt
ing,
fis
hing
, and
trap
ping
, non
-con
sum
ptiv
e w
ildlif
e ac
tiviti
es =
wat
chin
g w
ildlif
e an
d ph
otog
raph
ing
wild
life,
mot
oriz
ed a
ctiv
itie
s =
AT
Vri
ding
, mot
or-b
oatin
g, je
t-sk
iing,
sno
wm
obili
ng, n
on-m
otor
ized
act
iviti
es =
hik
ing,
can
oein
g or
kay
akin
g, s
wim
min
g, c
ampi
ng, b
ackp
acki
ng, c
ross
-cou
ntry
ski
ing,
snow
shoe
ing,
ext
rem
e re
crea
tion
al a
ctiv
ities
= r
ock
clim
bing
or
ice
clim
bing
, mou
ntai
n bi
king
, or
dow
nhill
ski
ing.

108 H. E. Kretser et al.
Perceptions of species-specific interactions. We asked respondents to reflect on interactionswith individual species during the past five years, what types of experiences or impactsthey had with the species, and whether the experience was very negative, negative, neithernegative nor positive, positive, or very positive. We asked about species most frequentlyreported to the NWCOs and DEC: bats (Vespertilionidae family), black bear (Ursusamericanus), geese, coyote (Canis latrans), fox (Vulpes sp), white-tailed deer, moose(Alces alces), skunk (Mephitis mephitis), raccoon (Procyon lotor), squirrels (Sciuruscarolinensis and Tamiascriurus hudsonicus), and woodchuck (Marmota monax).
Reporting wildlife interactions. Respondents indicated all authorities (DEC, NWCOs, police,health department, Cornell Cooperative Extension, or other) to which they reported ahuman–wildlife interaction during the past five years. We recoded this variable as reportor did not report.
Support for land and wildlife protection. Respondents indicated how well they agreed(strongly disagree, disagree, neither agree nor disagree, agree, or strongly agree) with statementsabout programs promoting land or wildlife protection in Northern New York or elsewhere.
Analyses. Each community was analyzed separately to compare differences in perceptionsacross all of the dependent variables using t-tests and chi-square. We used binary logisticregression models to determine relative importance of underlying factors leading toperceptions of human–wildlife interactions. We assessed the relationship between respon-dents’ overall perceptions of experiences with wildlife and respondents’ perceptions ofinteractions with individual species around their properties with Spearman’s Rank correla-tions. Finally, we assessed the potential conservation implications of experiences withwildlife by comparing perceptions of interactions to statements about support for programsprotecting land and wildlife.
Results
Response
A total of 1,439 (37%) people responded to the survey, including 362 (36%) respondentsfrom Urban I, 347 (34%) from Urban II, 380 (39%) from Traditional Exurban, and 350(39%) from High Amenity Exurban. The respondents were 59% male and 36% female.
Nonresponse
The non-respondent landowners reported having daily interactions with wildlife morefrequently than respondents (Χ2 = 12.11, p < .05) and had more positive perceptions ofexperiences with wildlife (Χ2 = 12.90, p < .01). Non-respondents had fewer negativeexperiences with wildlife (Χ2 = 6.85, p < .01) and had fewer experiences where wildlifecaused damage to their homes (Χ2 = 25.72, p < .001). Non-respondents were more likelyto have contacted a professional regarding their experiences with wildlife compared torespondents (Χ2 = 7.36, p < .01), even though they had more positive experiences. Wealso compared responses from our survey and non-respondents to responses to three ofour wildlife questions included in the 2007 Empire State Poll (Nisbet, 2007). Our surveyrespondents had experienced more damage than the poll respondents, but did not differsignificantly from the NY residents living outside of New York City and Long Island on

Factors Affecting Human–Wildlife Interactions 109
the number of negative experiences with wildlife or general attitudes towards wildlife(Table 2).
Dependent Variables
We were interested in respondents’ overall experiences with wildlife (n = 1,374) andwhether respondents reported human–wildlife interactions to authorities (n = 1,285).Overall experience with wildlife tended strongly toward being positive, with Very Nega-tive = 2%, Negative = 3%, Neither Negative or Positive = 24%, Positive = 29%, and VeryPositive = 42%. As less than 5% of respondents perceived interactions as negative or verynegative groups, we compared results of the Very Negative/Negative (negative), theneither Negative nor Positive (neutral), and the Very Positive/Positive (positive) groupsacross 17 independent variables, the same variables listed in Table 1. We used one-wayANOVAs with Bonferroni post-hoc (p < .01) for seven comparisons and chi-square(p < .01) analysis for 10 variables (Kretser, 2008). We found significant differencesbetween the positive and negative group on nine variables. The neutral group differedfrom the positive group on 13 variables. Neutral and negative groups differed on only twovariables: previous damage and protecting property from wildlife. No differences werefound for four variables, type of resident (seasonal or permanent), length of occupancy(newcomer or longtimer), primary origin (urban or rural), and participation in motorizedactivities. We recognize that some researchers have treated the nonsubstantive responsesseparately (Browne-Nunez & Vaske, 2006), however, these results justified combining theneutral and negative group for this particular analysis given the low frequencies in thenegative group overall. We recoded experience with wildlife as Not Positive (n = 1,374,29%) and Positive (71%). For Reporting to Authorities, 14% (n = 1,285) reported ahuman–wildlife interaction to authorities, whereas 86% had not.
Bivariate Analyses
For positive and non-positive experiences with wildlife, the bivariate analysis revealed thatacross the communities, the same nine variables were significantly different so we opted togroup the four sites (Table 1) and include community as a variable in the modeling effort.The bivariate analyses (t-tests, chi-square) indicated that age, income, knowledge, behaviors,attitudes, and experiences were different between those who perceived positive experiencesand those who did not (Table 1). Those perceiving non-positive interactions with wildlifetended to be older with lower incomes. They had less knowledge of wildlife and were morelikely to interact with wildlife once per week or less. They were also more likely to exhibitbehaviors of protecting their property from wildlife and to demonstrate wildlife concerns.
Of those respondents who had reported one or more interactions to authorities, 67%had positive overall experiences with wildlife whereas 25% reported neutral experiencesand 8% had negative overall experiences. We found only three significant differencesbetween reporters and non-reporters (Table 1). Those who reported to authorities weremore likely to have exhibited behaviors of protecting property from wildlife ( R = 0.273,
NR = –0.111; p < .01), to have had previous damage from wildlife (n = 180, 84%) com-pared to those who did not report (n = 1,105, 66%, p < .01), and to have perceived overallnon-positive interactions with wildlife during the past five years (33%) compared to thosenot reporting (25%, p < .05). Respondents were significantly more likely to indicate negativeperceptions of experiences with an individual species if they had reported an interactionwith that species for all of the focal species except moose and coyote.
XX

110
Tab
le 2
Com
pari
son
of N
orth
ern
New
Yor
k la
ndow
ners
’ ex
peri
ence
s w
ith
wild
life
in 2
006
(in
bold
) to
non
-res
pond
ents
fro
m th
e su
rvey
and
ups
tate
, do
wns
tate
, and
all
New
Yor
kers
exp
erie
nces
wit
h w
ildl
ife
from
the
2007
New
Yor
k E
mpi
re S
tate
Pol
l
NN
Y la
ndow
ners
20
06 s
urve
yN
on-r
espo
nden
ts
2006
Sur
vey
Ups
tate
hom
eow
ners
20
07 P
oll
Dow
nsta
te h
omeo
wne
rs
2007
pol
lA
ll N
Y S
tate
ho
meo
wne
rs 2
007
poll
n =
137
7n
= 1
01n
= 3
93n
= 4
07n
= 8
00
Has
wil
dlif
e ev
er c
ause
d da
mag
e to
you
r pr
oper
ty?
Uni
ts a
re p
erce
nts
Yes
67.4
42.6
**53
.7**
23.3
**34
.3**
No
32.6
57.4
46.3
76.7
65.7
Hav
e yo
u ev
er h
ad a
neg
ativ
e ex
peri
ence
with
wil
dlif
e?Y
es35
.622
.8*
36.9
26.9
**27
.3**
No
64.4
77.2
63.1
78.1
72.7
Ove
rall
, wha
t is
your
gen
eral
att
itud
e ab
out w
ildl
ife?
Ver
y ne
gati
ve0.
41.
00.
81.
7**
1.3*
*N
egat
ive
0.9
00.
87.
65.
1N
ot n
eg. o
r po
s.12
.93.
811
.321
.717
.9P
ositi
ve29
.626
.035
.838
.437
.5V
ery
posi
tive
56.2
66.0
51.4
30.5
38.2
*p <
.01,
**p
< .0
01.

Factors Affecting Human–Wildlife Interactions 111
Modeling
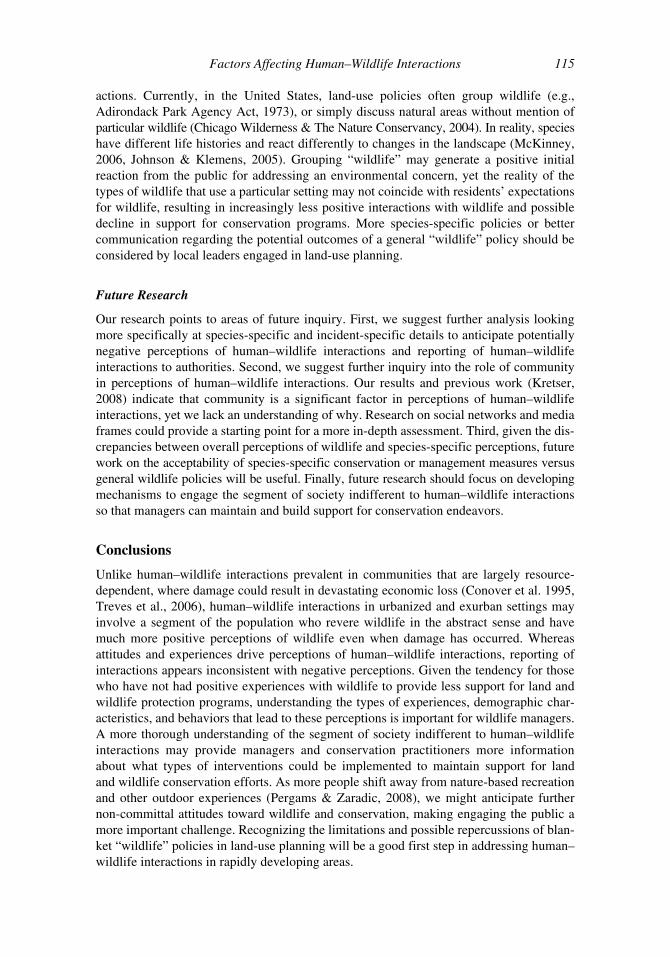
We predicted the probability of having a non-positive interaction using binary logisticregression. Age, community, behaviors, attitudes, and experiences were associated withthe probability of respondents having a non-positive interaction. An increase in ageslightly increased the probability of perceiving a non-positive interaction. People residingin Urban I, Urban II, and Traditional Exurban communities were two times more likely tohave non-positive interactions with wildlife compared to those living in the High-AmenityExurban community (Figure 2). People from urban backgrounds were more likely to havepositive experiences with wildlife compared to those from rural backgrounds (Figure 2).
General attitudes and behaviors toward wildlife were associated with perceived expe-riences with wildlife. People who engaged in behaviors to protect their property fromwildlife were 1.3 times more likely to report a non-positive interaction. People who hadconcerns about wildlife were over 1.5 times more likely to report non-positive interactionswith wildlife (Figure 2). Previous damage from wildlife was associated with less positiveperceptions of human–wildlife interactions. Those who interacted with wildlife lessfrequently (once per week or less) were more than twice as likely to report a non-positiveinteraction with wildlife. Those who did not participate in nonconsumptive wildlife activ-ities such as wildlife photography or bird watching were 2.5 times more likely to report anon-positive experience with wildlife.
Binary logistic regression was used for predicting reported human–wildlife interactions.The model predicting probability of reporting interactions was unacceptable (Nagelkerke
Figure 2. Logistic regression model predicting non-positive experiences with wildlife (n = 1,143).Black bars indicate variables leading to non-positive experiences, gray bars indicate variables lead-ing to positive experiences.
–1 –0.5 0 0.5 1 1.5 2
Age
Urban origin
Urban I resident
Urban II resident
Traditional exurban resident
Promote wildlife interactions
Protect property from wildlife
Tolerate and enjoy wildlife
Wildlife concerns
No previous damage from wildlife
Interact with wildlife once per week or less
No non-consumptive wildlife activity
Dem
ogra
phic
Beh
avio
rsA
ttitu
des
Exp
erie
nce
Odds ratio - 1
***
**
*
**
*
***
**
***
***
*
***
***
*p < 0.05,**p < 0.01, ***p < 0.001ROC curve = .750, Nagelkerke R2 = .462
What leads to non-positive perceptions of interactions with wildlife?

112 H. E. Kretser et al.
R2 = 0.070). However, significant variables in the model associated with higher probabilitiesof reporting human–wildlife interactions included previous non-positive interactions withwildlife (Wald = 5.973, p < .05), previous damage from wildlife (Wald = 13.630, p < .001),engaging in behaviors to promote wildlife interactions (Wald = 4.503, p < .05), and engagingin behaviors to protect property from wildlife (Wald = 12.944, p < .001).
Species-Specific Interactions
We compared the overall experience with wildlife with overall experience for individualspecies (Figure 3) and found that perceptions of individual species were significantly, butnot strongly, correlated with overall wildlife perceptions (r2 between 0.204–0.444, p < .001).The highest correlations were with moose, deer, bear, and fox (r2 > .4) whereas the lowestcorrelations were with skunk, raccoon, coyotes, and woodchucks (r2 < .3).
Support for Land and Wildlife Protection Programs
We found that support for programs protecting land and wildlife in Northern New Yorkand elsewhere was lower for respondents who had non-positive experiences with wildlifecompared to those who had positive experiences (Figure 4). Given that 83% of the non-positive group is composed of people who were neutral toward wildlife interactions, thissuggests that this segment of landowners may also be a group that could potentiallyimpact policies regarding land and wildlife protection.
Figure 3. Comparison of perceptions of overall experiences with wildlife and experiences withspecific species. We report only for species with n > 100.
Reported Experiences with Wildlife
0% 25% 50% 75% 100%
Skunks (n = 751)
Raccoons (n = 679)
Woodchucks (n = 531)
Squirrels (n = 1196)
Coyotes (n = 414)
Bats (n = 1008)
Bears (n = 384)
Fox (n = 715)
Geese (n = 704)
Deer (n = 1012)
Moose (n = 148)
Overall Experience (n = 1374)
Wild
life
Spec
ies
Percent Respondents
Very Negative Negative Neither Negative nor Positive Positive Very Positive

Factors Affecting Human–Wildlife Interactions 113
Discussion
As expected, experiences with wildlife, attitudes about wildlife, and behaviors towardwildlife were related to whether or not respondents perceived a human–wildlife interac-tion as positive or not positive. Counter to expectations, those same characteristics wereunable to predict whether a respondent reported a human–wildlife interaction to authorities.Those reporting interactions, however, were more likely to have experienced previousdamage and had engaged in behaviors to protect their property from wildlife, consistentwith previous findings (Naughton-Treves & Treves, 2005). Reporting human–wildlifeinteractions may be confounded because people do not know who to contact about aninteraction (Reiter, Brunson, & Schmidt, 1999; Lindsey & Adams, 2006). Aside from ageand urban versus rural backgrounds, demographic characteristics were unimportant indetermining the likelihood of a respondent having a non-positive experience with wildlife.Although differences across our communities were not evident, community was related toperceptions of experiences with wildlife. Consistent with previous work (Kretser, 2008;Naughton-Treves et al., 2003), individual characteristics may be less likely to influenceattitudes compared to the actual community in which one lives, social group to which onebelongs, and the experiences and attitudes one has regarding wildlife. This conforms toprevious work where sociodemographics played only a minor role in attitudes towardbears (Kaczensky et al., 2004; Jonker et al., 2006) and contact or experiences with wild-life, previous damage, and severity of damage (livestock losses or animal entering a homevs. a damaged birdfeeder) were more influential (Naughton-Treves et al., 2003; Heberlein &Ericsson, 2005; Jonker et al., 2006; Kretser, 2008).
Understanding what influences people’s perceptions of human–wildlife interactionswill be important in maintaining support for land and wildlife conservation efforts. Our
Figure 4. Support for land and wildlife protection programs in Northern New York and elsewherein the United States according to respondents having overall positive or non-positive experienceswith wildlife.
0%
25%
50%
75%
100%
In NNY Elsewhere In NNY Elsewhere
noitcetorp efildliWnoitcetorp dnaL
Perc
ent a
gree
ing
Non-positive (n = 362)
Positive (n = 934)
Experience with wildlife:
I am in favor of programs that support....
* * * * * * * * ** * *
***significantly different at p < 0.001

114 H. E. Kretser et al.
model provides information about whom wildlife managers (either state agencies or localconservation organizations) might focus management actions toward, and what types ofactions they might consider, that is, landowners living in urban or traditional exurban areas(within commuting distance of a metropolitan area) where people may not have frequentinteractions with wildlife. Similar to Heberlein and Ericsson (2005), we suggest that manag-ers could focus on allaying wildlife concerns by developing opportunities for people to havepositive interactions with wildlife through activities such as bird watching or nature photog-raphy or simply have opportunities for spending time outside. Managers might also focus onlandowners who have previously experienced damage. In this instance, managers mightwork with landowners, or even local zoning agencies, to develop ways to minimize human–wildlife interactions and have landowners engage in behaviors that simultaneously minimizeimpacts to wildlife and protect property from wildlife damage.
Overall Wildlife Experiences versus Species-Specific Interactions
Overall experiences with wildlife were more positive than species-specific experiences.Respondents had more neutral and negative perceptions of species-specific interactions.Respondents who ranked their interactions with wildlife overall and interactions with specificspecies were more correlated with and positive for bears, moose, deer, and fox (larger morecharismatic species) compared to the smaller animals. Exceptions to this trend were coyotesand squirrels. When people think about wildlife in general, they tend to focus on larger, morecharismatic species and not the smaller, less charismatic species that are often considered “nui-sance” (Organ & Ellingwood, 2000; Curtis, Richmond, Wellner, & Tullar, 1995). Alterna-tively, the types of conflicts associated with the larger charismatic wildlife are more tolerablecompared to the smaller species. This idea follows from Kellert’s (1980b) findings that animalssuch as skunks, coyotes, bats, or species that frequently cause property damage tend to be morenegatively viewed compared to more familiar and aesthetic species. Perceptions of species-specific interactions had more variation overall. Although positive perceptions may dominatefor a specific species, severe impacts such as wildlife entering a home, causing an imminentthreat to humans, or depredating on livestock can strongly and negatively affect perceptions(Naughton-Treves et al., 2003; Kretser, 2008). Examining individual species and specificimpacts (such as in the compost, under the house, or threatening pets) may be a more effectivemethod to understand people’s perceptions of wildlife interactions (Riley et al., 2002).
The non-response data indicated that those with negative experiences are more likelyto respond to a survey yet less likely to contact professionals about wildlife. This findingsuggests that alternative approaches to communicate or work with landowners on wildlifeissues in this region may be necessary. Given that our sample represented landowners whomore frequently experience damage and landowners who differ from New York state voterson key questions in our survey, we advise caution in generalizing our results beyond oursample of landowners and northern New York. Still, our findings provide insights on howprivate landowners living near a protected area think about human–wildlife interactionsaround their homes, and an opportunity to examine how perceptions of human–wildlifeinteractions might influence land-use policy.
In places with escalating development, particularly in exurban landscapes, planning is acritical tool for mitigating negative impacts to the natural resources (Kretser et al., 2009).In light of our findings that overall perceptions of experiences with wildlife tend to bemore positive than species-specific perceptions, land use plans at the town, county, orregional level that address “wildlife needs” may be too ambiguous for residents to receiveadequate information regarding the possible wildlife impacts of different management
Factors Affecting Human–Wildlife Interactions 115
actions. Currently, in the United States, land-use policies often group wildlife (e.g.,Adirondack Park Agency Act, 1973), or simply discuss natural areas without mention ofparticular wildlife (Chicago Wilderness & The Nature Conservancy, 2004). In reality, specieshave different life histories and react differently to changes in the landscape (McKinney,2006, Johnson & Klemens, 2005). Grouping “wildlife” may generate a positive initialreaction from the public for addressing an environmental concern, yet the reality of thetypes of wildlife that use a particular setting may not coincide with residents’ expectationsfor wildlife, resulting in increasingly less positive interactions with wildlife and possibledecline in support for conservation programs. More species-specific policies or bettercommunication regarding the potential outcomes of a general “wildlife” policy should beconsidered by local leaders engaged in land-use planning.
Future Research
Our research points to areas of future inquiry. First, we suggest further analysis lookingmore specifically at species-specific and incident-specific details to anticipate potentiallynegative perceptions of human–wildlife interactions and reporting of human–wildlifeinteractions to authorities. Second, we suggest further inquiry into the role of communityin perceptions of human–wildlife interactions. Our results and previous work (Kretser,2008) indicate that community is a significant factor in perceptions of human–wildlifeinteractions, yet we lack an understanding of why. Research on social networks and mediaframes could provide a starting point for a more in-depth assessment. Third, given the dis-crepancies between overall perceptions of wildlife and species-specific perceptions, futurework on the acceptability of species-specific conservation or management measures versusgeneral wildlife policies will be useful. Finally, future research should focus on developingmechanisms to engage the segment of society indifferent to human–wildlife interactionsso that managers can maintain and build support for conservation endeavors.
Conclusions
Unlike human–wildlife interactions prevalent in communities that are largely resource-dependent, where damage could result in devastating economic loss (Conover et al. 1995,Treves et al., 2006), human–wildlife interactions in urbanized and exurban settings mayinvolve a segment of the population who revere wildlife in the abstract sense and havemuch more positive perceptions of wildlife even when damage has occurred. Whereasattitudes and experiences drive perceptions of human–wildlife interactions, reporting ofinteractions appears inconsistent with negative perceptions. Given the tendency for thosewho have not had positive experiences with wildlife to provide less support for land andwildlife protection programs, understanding the types of experiences, demographic char-acteristics, and behaviors that lead to these perceptions is important for wildlife managers.A more thorough understanding of the segment of society indifferent to human–wildlifeinteractions may provide managers and conservation practitioners more informationabout what types of interventions could be implemented to maintain support for landand wildlife conservation efforts. As more people shift away from nature-based recreationand other outdoor experiences (Pergams & Zaradic, 2008), we might anticipate furthernon-committal attitudes toward wildlife and conservation, making engaging the public amore important challenge. Recognizing the limitations and possible repercussions of blan-ket “wildlife” policies in land-use planning will be a good first step in addressing human–wildlife interactions in rapidly developing areas.

116 H. E. Kretser et al.
Finally, from an individual perspective in urban and exurban contexts, most of thehuman–wildlife interactions were considered positive even though there may have beendamage involved. However, from a societal standpoint, collectively, the human–wildlifeinteractions that are not perceived as positive interactions may be one indicator of declin-ing support for programs designed to promote protection of land and wildlife. Certainlyfor those involved in conservation, this presents an opportunity for engaging a segment ofthe population for whom wildlife issues may not be salient but who could potentially bepersuaded to support management and conservation efforts.
Acknowledgments
We thank the anonymous reviewers for their helpful comments on previous drafts of thismanuscript, Cornell University Human Dimensions Research Unit staff and graduate stu-dents for their contributions and review comments to earlier versions of this manuscript.We are thankful to our funders: the National Science Foundation Doctoral DissertationImprovement Award # BCS-0525391, the National Science Foundation Award #0647878,the American Fellowship from the American Association of University Women EducationalFoundation, and the Cornell University Agricultural Experiment Station federal formulafunds, Project No. NYC 1477433, received from Cooperative State Research, Education, andExtension Service, U.S. Department of Agriculture. Any opinions, findings, conclusions,or recommendations expressed in this publication are the authors and do not necessarilyreflect the views of the National Science Foundation, U.S. Department of Agriculture orany of the other funding organizations.
References
Adirondack Park Agency Act. (1973). New York State Executive Law, Article 27.Bath, A. J., & Buchanan, T. (1989). Attitudes of interest groups in Wyoming toward wolf restoration
in Yellowstone National Park. Wildlife Society Bulletin, 17(4), 519–525.Browne-Nunez, C., & Vaske, J. J. (2006). Predicting unsure responses to a proposed moose hunt in
Anchorage, Alaska. Human Dimensions of Wildlife, 11, 371–382.Coluccy, J. M., Drobney, R. D., Graber, D. A., Sheriff, S. L., & Witter, D. J. (2001). Attitudes of
central Missouri residents toward local giant Canada geese and management alternatives. Wild-life Society Bulletin, 29(1), 116–123.
Connelly N. A., Knuth, B. A., & Kay, D. L. (2002). Public support for ecosystem restoration in theHudson River Valley, USA. Environmental Management, 29, 467–476.
Conover, M. (2002). Resolving human-wildlife conflicts: The science of wildlife damage management.Boca Raton: Lewis Publishers.
Conover, M. R., Pitt, W. C., Kessler, K. K., DuBow, T. J., & Sanborn, W. A. (1995). Review ofhuman injuries, illnesses, and economic losses caused by wildlife in the United States. WildlifeSociety Bulletin, 23, 407–414.
Curtis, P. D., Richmond, M. E., Wellner, P. A., & Tullar, B. (1995). Characteristics of the privatenuisance wildlife control industry in New York. Proceedings of the Eastern Wildlife DamageControl Conference, 6, 49–57.
Decker, D. J., & Brown, T. L. (1982). Fruit growers’ vs. other farmers’ attitudes toward deer inNew York. Wildlife Society Bulletin, 15, 150–155.
Decker, D. J., & Chase, L. C. (1997). Human dimensions of living with wildlife—A managementchallenge for the 21st century. Wildlife Society Bulletin, 25(4), 788–795.
Fazio, R. H., & Zanna, M. P. (1981). Direct experience and attitude-behavior consistency. Advancesin Experimental Social Psychology, 14, 161–201.

Factors Affecting Human–Wildlife Interactions 117
Fulton, D. C., Manfredo, M. J., & Liscomb, J. (1996). Wildlife value orientations: a conceptual andmeasurement approach. Human Dimensions of Wildlife, 1(2), 24–47.
Geist, V., Mahoney, S. P., & Organ, J. F. (2001). Why hunting has defined the North Americanmodel of wildlife conservation. Transactions of the North American Wildlife and NaturalResources Conference, 66, 175–185.
Glennon, M. J., & Kretser, H. E. (2005). Impacts to wildlife from low density, exurban develop-ment: Information and considerations for the Adirondack Park. Wildlife Conservation Society:Technical Paper Series #3.
Heberlein, T. A., & Ericsson, G. (2005). Ties to the countryside: Accounting of urbanites attitudestoward hunting, wolves, and wildlife. Human Dimensions of Wildlife, 10, 213–227.
Homer, P. M. and Kahle, L. R. (1988). A structural equation test of the value-attitude-behavior hier-archy. Journal of Personality and Social Psychology, 54(4), 638–646.
Johnson, E. A., & Klemens, M. W. (2005). Nature in fragments: The legacy of sprawl. New York:Columbia University Press.
Jonker, S. A., Muth, R. A., Organ J. F., Zweik, R. R., & Siemer, W. F. (2006). Experience withbeaver damage and attitudes of Massachusetts residents toward beaver. Wildlife Society Bulletin,34(34), 1009–1021.
Kaczensky, P., Blazic, M., & Gossow, H. (2004). Public attitudes towards brown bears (Ursus acrtos)in Solvenia. Biological Conservation, 118, 661–674.
Kellert, S. R. (1980a). Contemporary values of wildlife in American society. In W. W. Shaw &E. H. Zube (Eds). Wildlife Values. U.S. Forest Service, Rocky Mountain Forest and RangeExperiment Station, Instructional Service Report 1, 31–59.
Kellert, S. R. (1980b). Americans’ attitudes and knowledge of animals. Proceedings of the Forty-Fifth North American Wildlife Conference, 45, 111–124.
Kellert, S. R., Black, M., Rush, C. R., & Bath, A. J. (1996). Human culture and large carnivore con-servation in North America. Conservation Biology, 10(4), 977–990.
Kretser, H. E. (2008). The exurban frontier: Anticipating human-wildlife interactions where we live,work, and play. Ph.D. Dissertation, Cornell University, Ithaca, New York, USA.
Kretser, H. E., Hilty, J. A., Glennon, M. J., Burrell, J. F., Smith, Z. P., & Knuth, B. A. (2009). Chal-lenges of governance and land management on the exurban/wilderness frontier in the USA. In K.Andersson, E. Eklund, M. Lehtola, & P. Salmi (Eds.), Beyond the rural-urban divide.Comparative perspectives on the differentiated countryside and its regulation (pp. 277–304).Bingley, UK: Emerald Group Publishing Limited.
Kretser, H. E., Sullivan, P. J. & Knuth, B. A. (2008). Housing density as an indicator of spatialpatterns of reported human–wildlife interactions in Northern New York. Landscape and UrbanPlanning, 84, 282–292.
Levine, N. (2007). CrimeStat: A spatial statistics program for the analysis of crime incident loca-tions (v 3.1). Ned Levine & Associates, Houston, TX, and the National Institute of Justice,Washington, DC.
Lindsey, K. J., & Adams, C. E. (2006). Public demand for information and assistance at the human–wildlife interface. Human Dimensions of Wildlife, 11, 267–283.
McIntyre, N. E. (1999). Influences of urban land use on the frequency of scorpion stings in the Phoenix,Arizona, metropolitan area. Landscape and Urban Planning, 45, 47–55.
McKinney, M. L. (2006). Urbanization as a major cause of biotic homogenization. BiologicalConservation, 127, 247–260
Messmer, T. A. (2000). The emergence of human-wildlife conflict management: Turning challengesinto opportunities. International Biodeterioration & Biodegradation, 45, 97–102.
Naughton-Treves, L., Grossberg, B., & Treves, A. (2003). Paying for tolerance: Rural citizens’ atti-tudes toward wolf depredation and compensation. Conservation Biology, 17(6), 1500–1511.
Naughton-Treves, L. C., & Treves, A. (2005). Factors shaping local support for wildlife. InR. Woodreffe, S. Thirgood, & A. Rabinowitz (Eds.), Socio-ecological factors shaping local sup-port for wildlife: Crop-raiding by Elephants and other wildlife in Africa (pp. 252–277). New York:Cambridge University Press.

118 H. E. Kretser et al.
Nisbet, E. (2007). New York Opinion Index, Empire State Poll, Report 1: Introduction & Methodology.Cornell University Survey Research Institute. Retrieved November 12, 2008, from http://www.sri.cornell.edu/sri/files/esp/Report_1_2007_Intro_Method.pdf.
Omondi, P. (1995). Wildlife-human conflict in Kenya; integrating wildlife conservation with humanneeds in the Masai Mara region. Dissertation. McGill University. 338 p. (UMI dissertationServices Bell & Howell Company).
Organ, J. F., & Ellingwood, M. R. (2000). Wildlife stakeholder acceptance capacity for black bears,beavers, and other beasts in the east. Human Dimensions of Wildlife, 5, 63–75.
Pergams, O. R. W., & Zaradic, P. A. (2008). Evidence for a fundamental and pervasive shift awayfrom nature-based recreation. Proceedings of the National Academy of Sciences, February 19,2008, 105(7), 2295–2300.
Reiter, D. K., Brunson, M. W., & Schmidt, R. H. (1999). Public attitudes toward wildlife damagemanagement and policy. Wildlife Society Bulletin, 27(3), 746–758.
Riley S. J., & Decker, D. J. (2000). Risk perception as a factor in wildlife stakeholder acceptancecapacity for cougars in Montana. Human Dimensions of Wildlife, 5, 50–62.
Riley, S. J., Decker D. J., Carpenter, L. H., Organ, J. F., Siemer, W. F., Mattfeld, G. F., & Parsons, G.(2002). The essence of wildlife management. Wildlife Society Bulletin, 30(2), 585–593.
Schwartz, S. H. & Bilsky, W. (1987). Toward a universal psychological structure of human values.Journal of Personality and Social Psychology, 53(3), 550–562.
Smith, M. D., & Krannich, R. S. (2000). “Culture clash” revisited: Newcomer and longer-term resi-dents’ attitudes toward land use, development, and environmental issues in rural communities inthe Rocky Mountains West. Rural Sociology, 65, 396–421.
Stout, R. J., Knuth, B. A., & Curtis, P. D. (1997). Preferences of suburban landowners for deer manage-ment techniques: A step towards better communication. Wildlife Society Bulletin, 25(2), 348–359.
Stout, R. J., Stedman, R. C., Decker, D. J., & Knuth, B. A. (1993). Perceptions of risk from deer-related vehicle accidents: Implications for public preferences for deer herd size. Wildlife SocietyBulletin, 21, 237–249.
The Nature Conservancy & Chicago Wilderness (2004). Conservation Development in Practice.Northeastern Illinois Planning Commission, Environment and Natural Resources Group.Retrieved January 2008 from www.nipc.org/environment/sustainable/conservationdesign.
Treves, A. (2009). The human dimensions of conflicts with wildlife around protected areas. InM. J. Manfredo, J. J. Vaske, P. J. Brown, D. J. Decker, & E. A. Duke (Eds.), Wildlife and society:The science of human dimensions (pp. 214–228). Washington, DC: Island Press.
Treves, A., Wallace, R. B., Naughton-Treves, L., & Morales, A. (2006). Co-management human–wildlife conflicts: A review. Human Dimensions of Wildlife, 11, 383–396.
Treves, A., Naughton-Treves, L., Harper, E. K., Mladenoff, D. J., Rose, R. A., Sickley, T. A., &Wydeven, A. P. (2004). Predicting human-carnivore conflict: A spatial model derived from25 years of data on wolf predation on livestock. Conservation Biology, 18(1), 114–125.
United States Census Bureau (2006). Retrieved November 12, 2008, from http://www.census.gov/.United States Department of Agriculture (2003). National Resources Inventory 2001 Annual NRI.
Urbanization and development of rural land. U.S. Department of Agriculture, Natural ResourcesConservation Service. Retrieved January 2004, from http://www.nrcs.gov/technical/land/nri01/urban.pdf.
West, B. C., & Parkhurst, J. A. (2002). Interactions between deer damage, deer density, and stake-holder attitudes in Virginia. Wildlife Society Bulletin, 30(1), 139–147.
Woodroffe, R., Thirgood, S., & Rabinowitz, A. (Eds.) (2005). People and wildlife: Conflict or coex-istence? Cambridge, UK: Cambridge University Press.
Related Documents