Remote Sens. 2014, 6, 5452-5479; doi:10.3390/rs6065452 remote sensing ISSN 2072-4292 www.mdpi.com/journal/remotesensing Article Carbon Stock Assessment Using Remote Sensing and Forest Inventory Data in Savannakhet, Lao PDR Phutchard Vicharnakorn 1, *, Rajendra P. Shrestha 1 , Masahiko Nagai 2 , Abdul P. Salam 3 and Somboon Kiratiprayoon 4 1 Natural Resources Management, School of Environment, Resources, and Development, Asian Institute of Technology, P.O. Box 4, Klong Luang 12120, Thailand; E-Mail: [email protected] 2 Remote Sensing and GIS, School of Engineering and Technology, Asian Institute of Technology, P.O. Box 4, Klong Luang 12120, Thailand; E-Mail: [email protected] 3 Energy, School of Environment, Resources, and Development, Asian Institute of Technology, P.O. Box 4, Klong Luang 12120, Thailand; E-Mail: [email protected] 4 School of Science and Technology, Thammasat University, 99 Paholyothin Rd., Klong Luang 12120, Thailand; E-Mail: [email protected] * Author to whom correspondence should be addressed; E-Mail: [email protected]; Tel.: +66-8-1361-5834; Fax: +66-2215-8914. Received: 29 January 2014; in revised form: 29 May 2014 / Accepted: 29 May 2014 / Published: 12 June 2014 Abstract: Savannakhet Province, Lao People’s Democratic Republic (PDR), is a small area that is connected to Thailand, other areas of Lao PDR, and Vietnam via road No. 9. This province has been increasingly affected by carbon dioxide (CO 2 ) emitted from the transport corridors that have been developed across the region. To determine the effect of the CO 2 increases caused by deforestation and emissions, the total above-ground biomass (AGB) and carbon stocks for different land-cover types were assessed. This study estimated the AGB and carbon stocks (t/ha) of vegetation and soil using standard sampling techniques and allometric equations. Overall, 81 plots, each measuring 1600 m 2 , were established to represent samples from dry evergreen forest (DEF), mixed deciduous forest (MDF), dry dipterocarp forest (DDF), disturbed forest (DF), and paddy fields (PFi). In each plot, the diameter at breast height (DBH) and height (H) of the overstory trees were measured. Soil samples (composite n = 2) were collected at depths of 0–30 cm. Soil carbon was assessed using the soil depth, soil bulk density, and carbon content. Remote sensing (RS; Landsat Thematic Mapper (TM) image) was used for land-cover classification and OPEN ACCESS

Welcome message from author
This document is posted to help you gain knowledge. Please leave a comment to let me know what you think about it! Share it to your friends and learn new things together.
Transcript
Remote Sens. 2014, 6, 5452-5479; doi:10.3390/rs6065452
remote sensing ISSN 2072-4292
www.mdpi.com/journal/remotesensing
Article
Carbon Stock Assessment Using Remote Sensing and Forest
Inventory Data in Savannakhet, Lao PDR
Phutchard Vicharnakorn 1,
*, Rajendra P. Shrestha 1, Masahiko Nagai
2, Abdul P. Salam
3
and Somboon Kiratiprayoon 4
1 Natural Resources Management, School of Environment, Resources, and Development,
Asian Institute of Technology, P.O. Box 4, Klong Luang 12120, Thailand;
E-Mail: [email protected] 2 Remote Sensing and GIS, School of Engineering and Technology, Asian Institute of Technology,
P.O. Box 4, Klong Luang 12120, Thailand; E-Mail: [email protected] 3 Energy, School of Environment, Resources, and Development, Asian Institute of Technology,
P.O. Box 4, Klong Luang 12120, Thailand; E-Mail: [email protected] 4 School of Science and Technology, Thammasat University, 99 Paholyothin Rd.,
Klong Luang 12120, Thailand; E-Mail: [email protected]
* Author to whom correspondence should be addressed; E-Mail: [email protected];
Tel.: +66-8-1361-5834; Fax: +66-2215-8914.
Received: 29 January 2014; in revised form: 29 May 2014 / Accepted: 29 May 2014 /
Published: 12 June 2014
Abstract: Savannakhet Province, Lao People’s Democratic Republic (PDR), is a small
area that is connected to Thailand, other areas of Lao PDR, and Vietnam via road No. 9.
This province has been increasingly affected by carbon dioxide (CO2) emitted from the
transport corridors that have been developed across the region. To determine the effect of
the CO2 increases caused by deforestation and emissions, the total above-ground biomass
(AGB) and carbon stocks for different land-cover types were assessed. This study
estimated the AGB and carbon stocks (t/ha) of vegetation and soil using standard sampling
techniques and allometric equations. Overall, 81 plots, each measuring 1600 m2, were
established to represent samples from dry evergreen forest (DEF), mixed deciduous forest
(MDF), dry dipterocarp forest (DDF), disturbed forest (DF), and paddy fields (PFi).
In each plot, the diameter at breast height (DBH) and height (H) of the overstory trees were
measured. Soil samples (composite n = 2) were collected at depths of 0–30 cm. Soil carbon
was assessed using the soil depth, soil bulk density, and carbon content. Remote sensing
(RS; Landsat Thematic Mapper (TM) image) was used for land-cover classification and
OPEN ACCESS
Remote Sens. 2014, 6 5453
development of the AGB estimation model. The relationships between the AGB and RS
data (e.g., single TM band, various vegetation indices (VIs), and elevation) were
investigated using a multiple linear regression analysis. The results of the total carbon
stock assessments from the ground data showed that the MDF site had the highest value,
followed by the DEF, DDF, DF, and PFi sites. The RS data showed that the MDF site had
the highest area coverage, followed by the DDF, PFi, DF, and DEF sites. The results
indicated significant relationships between the AGB and RS data. The strongest correlation
was found for the PFi site, followed by the MDF, DDF, DEF, and DF sites.
Keywords: above-ground biomass; carbon stock; Landsat; vegetation indices;
image classification
1. Introduction
Tropical forest lands are a natural forest type that is an important source of biodiversity, food,
and carbon storage. Tropical forests comprise the largest proportion of the world’s forests at 44% [1];
they also contain one of the largest carbon pools and have a significant function in the global carbon
cycle. Forests store carbon and contain approximately 80% of the total above-ground organic carbon
and 40% of the total below-ground organic carbon worldwide. Deforestation and forest degradation
contribute 15%–20% of global carbon emissions, and most of this contribution comes from tropical
regions. Approximately 60% of the carbon sequestered by forests is released back into the atmosphere
via deforestation. Scientists have also determined that tropical deforestation releases 1.5 Gt of carbon
into the atmosphere each year [2]. Deforestation and forest degradation are the major sources of
greenhouse gas (GHG) emissions in most tropical countries. The Intergovernmental Panel on Climate
Change (IPCC) [3] estimated that the global carbon dioxide (CO2) emissions from land-use change,
averaged over the 1990s, ranged between 0.5 and 2.7 Gt C∙a−1
, with an average of 1.6 Gt C∙a−1
.
Forest biomass is an indicator of carbon sequestration. The amount of carbon sequestered by a forest
can be inferred from its biomass accumulation because approximately 50% of forest dry biomass is
carbon [4]. The majority of biomass assessments are performed for the above-ground biomass (AGB)
of trees because this biomass generally represents the greatest fraction of the total living biomass in a
forest and does not pose significant logistical problems during field measurements [3]. Estimating
above-ground forest biomass is the most important step in measuring the carbon stocks and fluxes
from tropical forests and helps to determine the contribution of forests to the global carbon cycle.
Moreover, estimates of AGB can also be used to predict root biomass, which is generally estimated to
be 20% of the above-ground forest biomass [5]; this figure was based on a predictive relationship
determined from an extensive literature review [6]. In addition, dead wood or litter carbon stocks
(e.g., downed trees, standing dead or broken branches, leaves) are normally presumed to correspond to
10%–20% of the above-ground forest carbon stock in mature forests [7].
Deforestation and forest degradation continue to be an important environmental problem in Lao
People’s Democratic Republic (PDR). In the 1950s, forests covered approximately 70% of the land
area in this country; however, by 1992, the forest coverage had declined to approximately 47% of the
Remote Sens. 2014, 6 5454
total land area as a result of population expansion, agricultural cultivation, and timber exports [8].
In 2005, land-use change and forestry in Lao PDR, including deforestation and land clearing, were
responsible for 26% of the GHG emissions, and transport was responsible for 9% of the emissions.
These emissions are expected to increase annually. The data from the Lao PDR forest department
assessments of the forest land cover in 1982 and 2010 showed that forest with more than 20% crown
cover decreased from 6.04 billion to 5.15 billion tons over this 28-year period; moreover, the total
volume lost between 1982 and 2010 was approximately 148 million m3. As forests can contribute to
offsetting emissions, the current forest areas must be measured to ensure their protection.
Traditional biomass assessment methods based on field measurements are the most accurate methods;
however, they are difficult to conduct over large areas and are costly, time consuming, and labor
intensive [9]. Recently, remote-sensing (RS) procedures have been applied to and established for
natural resources management. Currently, RS is widely used to collect information regarding forest
AGB and vegetation structure as well as to monitor and map vegetation biomass and productivity on
large scales [10–12] by measuring the spectral reflectance of the vegetation [13]. However, optical RS
does not directly assess above-ground forest biomass, and radiometry is sensitive to vegetation
structure (i.e., crown size and tree density), texture, and shadow, which are correlated with AGB,
particularly in the infrared bands [14,15]. RS data are now considered to be the most reliable method
of estimating spatial biomass in tropical regions over large areas. RS technology has been applied to
biomass assessment in many studies [10,16,17] because it can obtain forest information over large
areas at a reasonable cost and with acceptable accuracy based on repetitive data collection with
minimal effort [13].
In general, estimating the AGB in tropical forests is a challenging task because of their complex
forest structure. Many studies have shown that the method of determining relationships between field
measurements and RS data and then extrapolating these relationships over large areas is very useful [18].
To determine the relationship between above-ground field biomass and RS data, researchers have
used linear regression models with or without log transformations of field biomass data [19,20] and
multiple regressions with or without stepwise selection [13,20–22]. Artificial neutral networks [20,23],
semi-empirical models [24], nonlinear regression [25], and nonparametric estimation techniques
(e.g., k-nearest neighbor and k-means clustering) have also been used [13,26]. Although no model can
determine this complex relationship absolutely, researchers continue to use multiple regression models
as one of the best options. Vegetation index models are generally used to estimate biomass in many
studies [20,27,28]. Vegetation indices (VIs) are calculated from mathematical transformations of the
original spectral reflectance data and can be used to interpret land vegetation cover [29]. VIs are
applied to remove the variations caused by spectral reflectance measurements while also measuring the
biophysical properties that result from the soil background, sun view angles, and atmospheric
conditions [13]. Many previous studies have shown significant positive relationships between biomass
and VIs [6,30,31]; however, other studies have shown poor relationships [30,31].
Many methods can be used to map and estimate above-ground forest biomass for different
land-cover types; one such method is the use of Landsat imagery (medium-resolution satellite images)
to estimate the attributes of forests through direct correlations or stepwise regression analyses with
spectral bands, band ratios, or VIs [11,27,32]. In general, land-cover change mapping cannot be
accurately performed based on low- and medium-resolution satellite images. However, the use of
Remote Sens. 2014, 6 5455
high-resolution images to map large areas is expensive and requires a high degree of technical skill for
data interpretation; these issues are problematic in developing countries. Landsat is commonly used for
many applications because it can be obtained for free or at a low cost. A combination of many data
sources (e.g., forest inventory, land use, elevation, and RS data) can be used to predict vegetation
variables over large areas [33]. A hybrid supervised/unsupervised classification approach coupled with
a geographical information systems (GIS) analysis has been employed to improve land use/cover
mapping for Landsat data [33–35]. In tropical regions, forest plot-based field measurements have been
correlated with RS data, and these measurements have been used to estimate that carbon stocks are
limited, particularly in Southeast Asian countries, such as Lao PDR. The present study seeks to
characterize the carbon stock of tropical forest types using forest-plot-based field measurements and
RS data to develop a simple RS-based methodology. The field-based measurement and RS approach
might also help to improve forest carbon estimation in order to reduce emissions resulting from
deforestation and forest degradation (REDD+) and to design incentive programs; furthermore,
this approach might improve forest management with regard to climate-change mitigation.
2. Methods
2.1. Study Area
Savannakhet Province is located in the southern region of Lao PDR, lying between 16° and 17°
north latitude and between 105° and 106° east longitude (Figure 1). This province covers 21,774 km2,
and its topography is lowland with a slight slope from east to west to the Mekong River. Savannakhet
Province contains the largest rice field area in the country [36], and the dominant occupation is
farming. Savannakhet is connected to Thailand, other areas of Lao PDR, and Vietnam via road No. 9,
and it is linked to China and Cambodia via road No. 13.
Savannakhet has a tropical monsoon climate, and the average annual temperature is 26.3 °C.
The landscape varies from low-lying floodplains to foothills and mountains. The average annual
rainfall is approximately 1440 mm and is significantly higher in the eastern upland region of the
province than in the lower areas. Rice is a major crop in this region. Lao PDR relies on forest products
because it has a low population density and a large forested area. Forest products meet a wide range of
subsistence needs, provide opportunities for income generation, and are an important source of export
income [37]. Savannakhet has large forested areas, including natural protected areas (Phou Xang Hae,
Dong Nadet, and Don Phou Vieng) and a natural production forest (Dong Sithouane). In 2000, forest
land covered approximately 70% of the province. Forestry is the second most important economic
sector, after agriculture, and a key source of export income for Savannakhet [37,38]. However, Lao
PDR is aware of the recent decline of its natural resources due to an increasing population,
encroachments on its forests for settlement, agricultural cultivation, illegal logging, and forest fires.
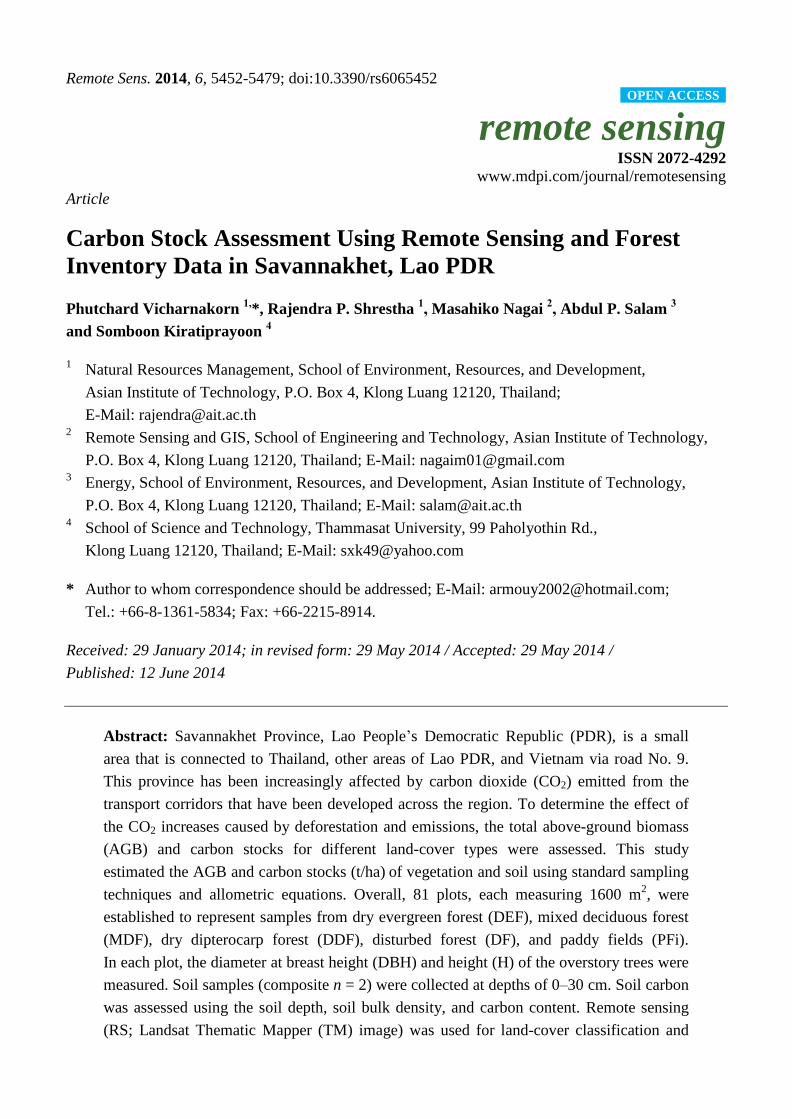
Remote Sens. 2014, 6 5456
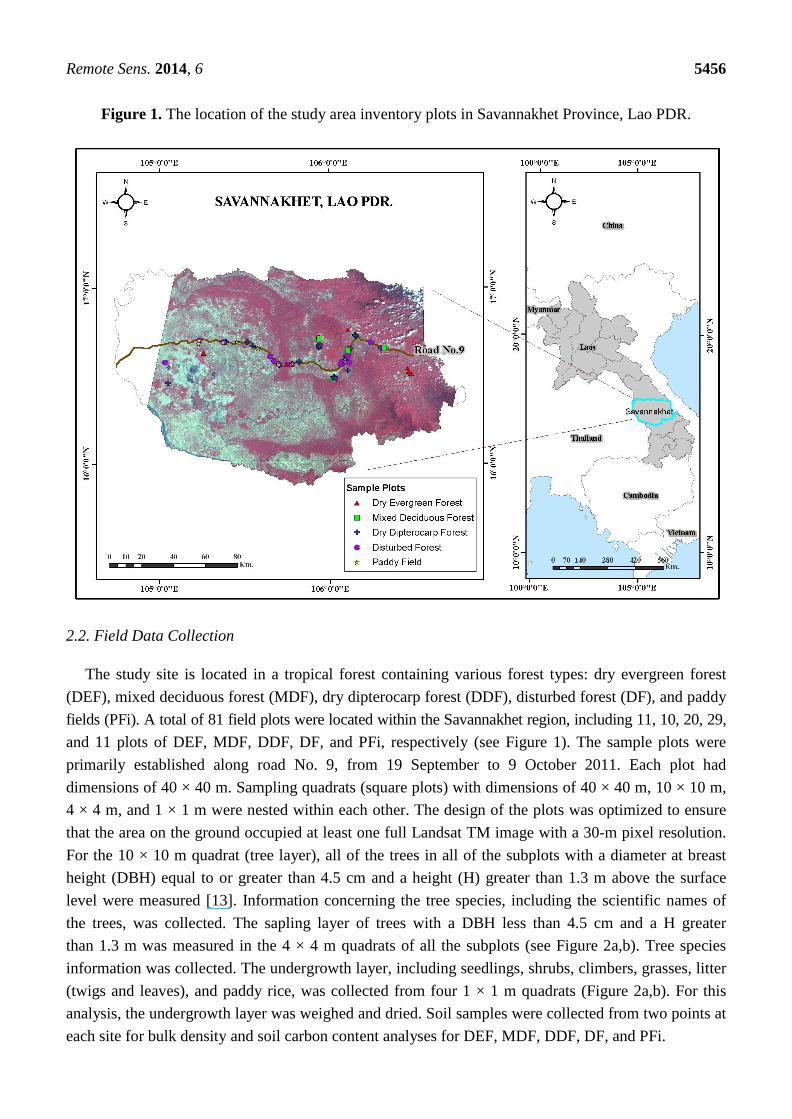
Figure 1. The location of the study area inventory plots in Savannakhet Province, Lao PDR.
2.2. Field Data Collection
The study site is located in a tropical forest containing various forest types: dry evergreen forest
(DEF), mixed deciduous forest (MDF), dry dipterocarp forest (DDF), disturbed forest (DF), and paddy
fields (PFi). A total of 81 field plots were located within the Savannakhet region, including 11, 10, 20, 29,
and 11 plots of DEF, MDF, DDF, DF, and PFi, respectively (see Figure 1). The sample plots were
primarily established along road No. 9, from 19 September to 9 October 2011. Each plot had
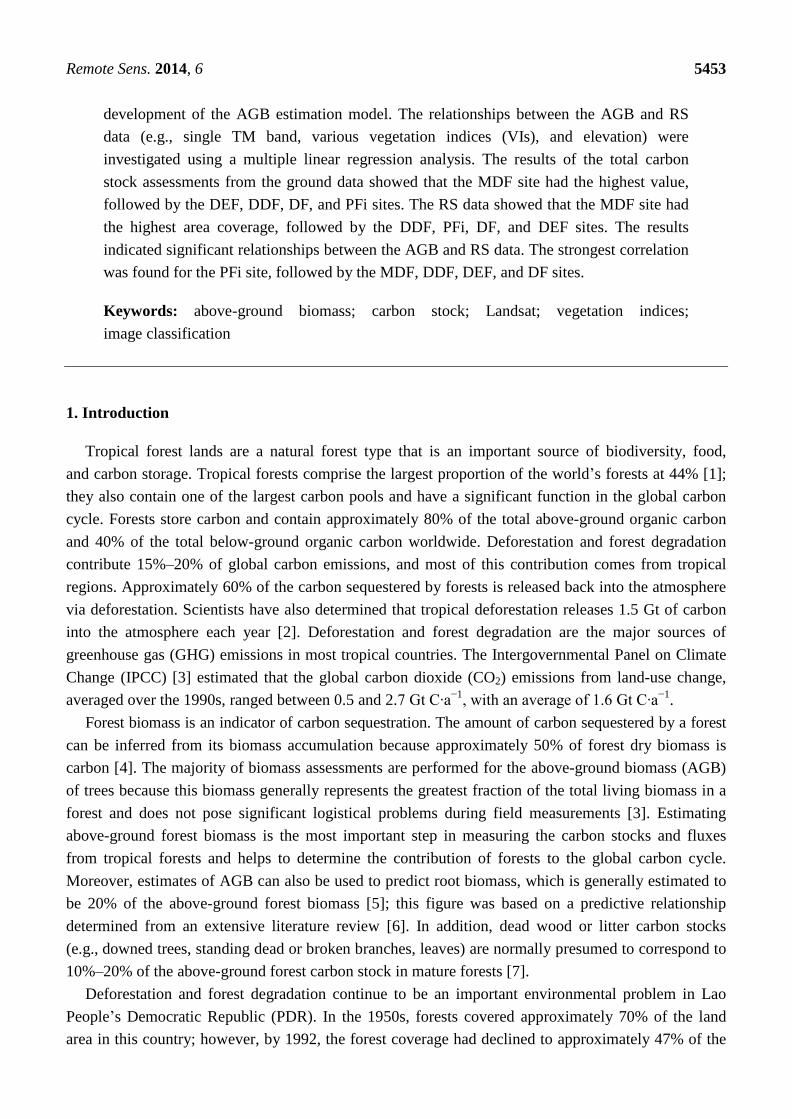
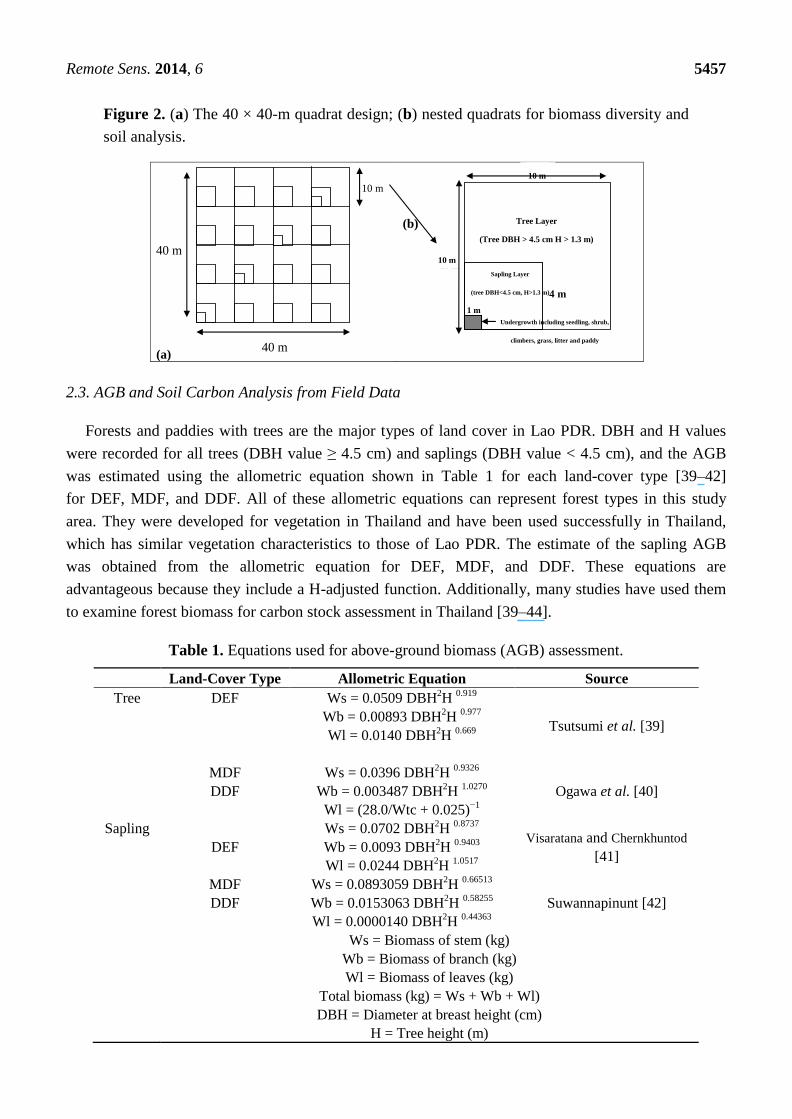
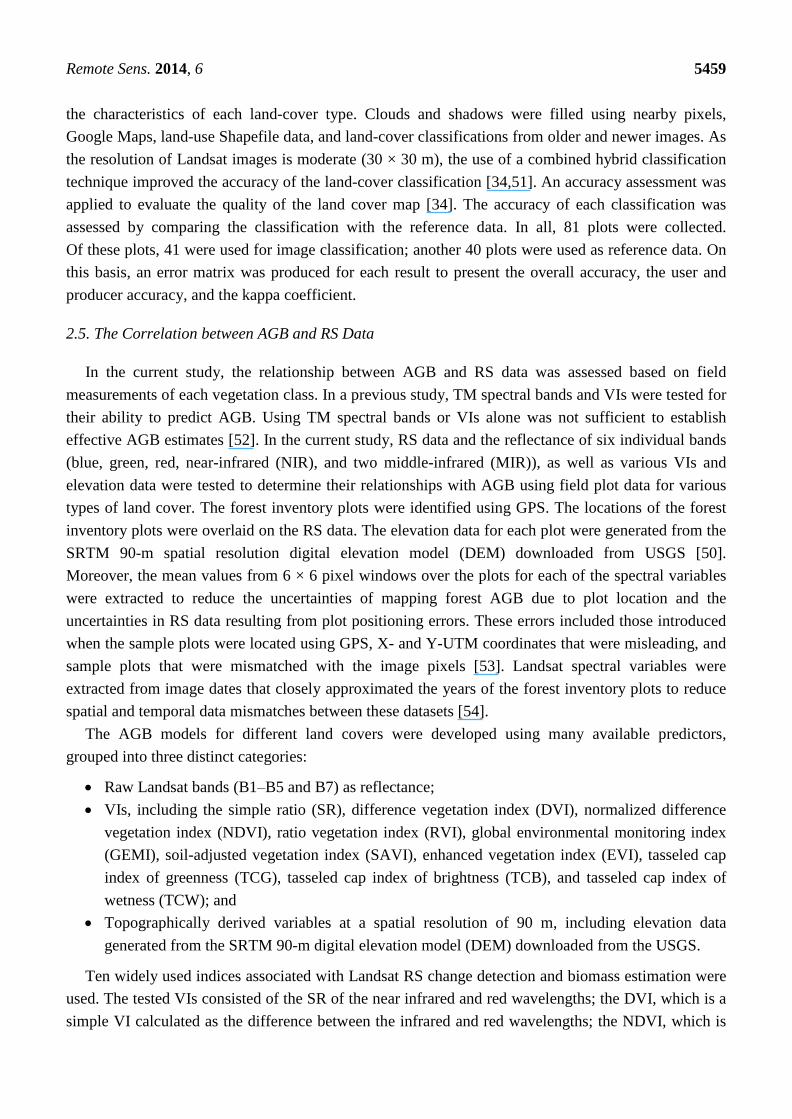
dimensions of 40 × 40 m. Sampling quadrats (square plots) with dimensions of 40 × 40 m, 10 × 10 m,
4 × 4 m, and 1 × 1 m were nested within each other. The design of the plots was optimized to ensure
that the area on the ground occupied at least one full Landsat TM image with a 30-m pixel resolution.
For the 10 × 10 m quadrat (tree layer), all of the trees in all of the subplots with a diameter at breast
height (DBH) equal to or greater than 4.5 cm and a height (H) greater than 1.3 m above the surface
level were measured [13]. Information concerning the tree species, including the scientific names of
the trees, was collected. The sapling layer of trees with a DBH less than 4.5 cm and a H greater
than 1.3 m was measured in the 4 × 4 m quadrats of all the subplots (see Figure 2a,b). Tree species
information was collected. The undergrowth layer, including seedlings, shrubs, climbers, grasses, litter
(twigs and leaves), and paddy rice, was collected from four 1 × 1 m quadrats (Figure 2a,b). For this
analysis, the undergrowth layer was weighed and dried. Soil samples were collected from two points at
each site for bulk density and soil carbon content analyses for DEF, MDF, DDF, DF, and PFi.
Remote Sens. 2014, 6 5457
Figure 2. (a) The 40 × 40-m quadrat design; (b) nested quadrats for biomass diversity and
soil analysis.
2.3. AGB and Soil Carbon Analysis from Field Data
Forests and paddies with trees are the major types of land cover in Lao PDR. DBH and H values
were recorded for all trees (DBH value ≥ 4.5 cm) and saplings (DBH value < 4.5 cm), and the AGB
was estimated using the allometric equation shown in Table 1 for each land-cover type [39–42]
for DEF, MDF, and DDF. All of these allometric equations can represent forest types in this study
area. They were developed for vegetation in Thailand and have been used successfully in Thailand,
which has similar vegetation characteristics to those of Lao PDR. The estimate of the sapling AGB
was obtained from the allometric equation for DEF, MDF, and DDF. These equations are
advantageous because they include a H-adjusted function. Additionally, many studies have used them
to examine forest biomass for carbon stock assessment in Thailand [39–44].
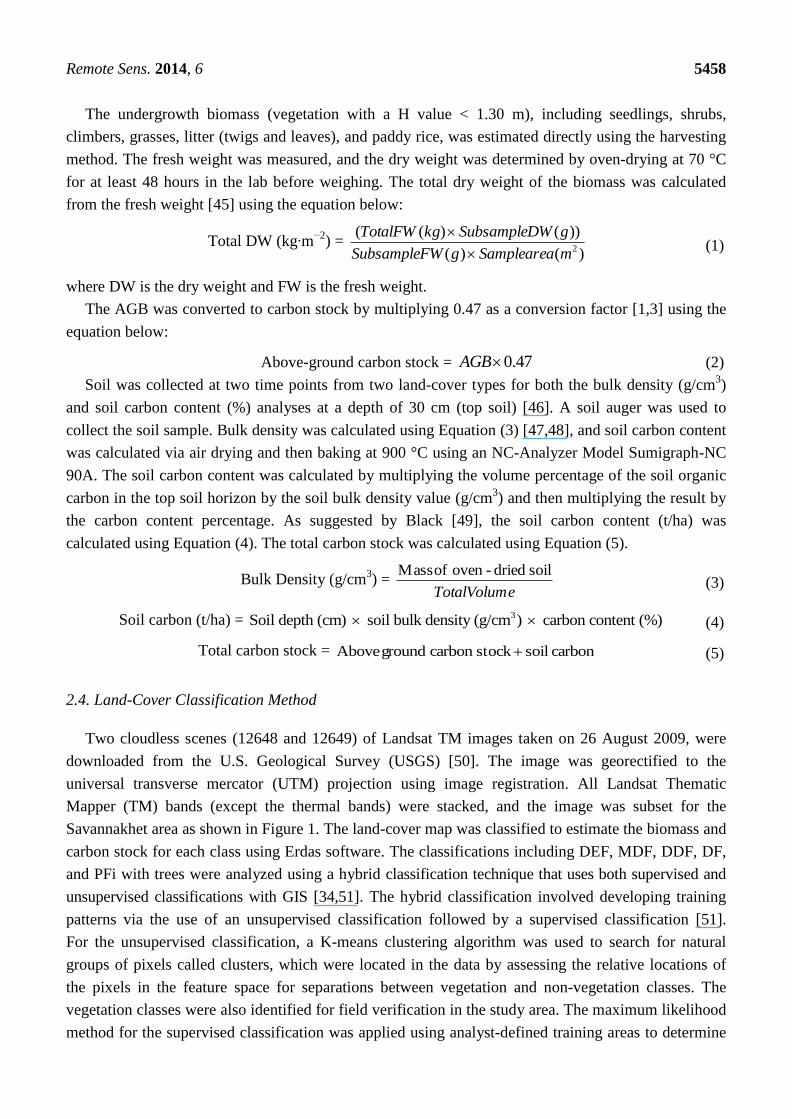
Table 1. Equations used for above-ground biomass (AGB) assessment.
Land-Cover Type Allometric Equation Source
Tree DEF Ws = 0.0509 DBH2H
0.919
Tsutsumi et al. [39] Wb = 0.00893 DBH
2H
0.977
Wl = 0.0140 DBH2H
0.669
MDF Ws = 0.0396 DBH2H
0.9326
Ogawa et al. [40] DDF Wb = 0.003487 DBH2H
1.0270
Wl = (28.0/Wtc + 0.025)−1
Sapling
DEF
Ws = 0.0702 DBH2H
0.8737
Visaratana and Chernkhuntod
[41] Wb = 0.0093 DBH
2H
0.9403
Wl = 0.0244 DBH2H
1.0517
MDF Ws = 0.0893059 DBH2H
0.66513
Suwannapinunt [42] DDF Wb = 0.0153063 DBH2H
0.58255
Wl = 0.0000140 DBH2H
0.44363
Ws = Biomass of stem (kg)
Wb = Biomass of branch (kg)
Wl = Biomass of leaves (kg)
Total biomass (kg) = Ws + Wb + Wl)
DBH = Diameter at breast height (cm)
H = Tree height (m)
Figure 2. (a) The 40x40-m quadrat design; (b) nested quadrats
for biomass diversity and soil analysis.
(a)
(b)
2.3. AGB and Soil Carbon Analysis from Field Data
10 m
40 m
40 m
4 m
10 m
1 m
10 m
10 m
Undergrowth including seedling, shrub,
climbers, grass, litter and paddy
( Layer
Tree Layer
(Tree DBH > 4.5 cm H > 1.3 m)
Sapling Layer
(tree DBH<4.5 cm, H>1.3 m)
Remote Sens. 2014, 6 5458
The undergrowth biomass (vegetation with a H value < 1.30 m), including seedlings, shrubs,
climbers, grasses, litter (twigs and leaves), and paddy rice, was estimated directly using the harvesting
method. The fresh weight was measured, and the dry weight was determined by oven-drying at 70 °C
for at least 48 hours in the lab before weighing. The total dry weight of the biomass was calculated
from the fresh weight [45] using the equation below:
Total DW (kg∙m−2
) = )()(
))()((2mSampleareagWSubsampleF
gWSubsampleDkgTotalFW
(1)
where DW is the dry weight and FW is the fresh weight.
The AGB was converted to carbon stock by multiplying 0.47 as a conversion factor [1,3] using the
equation below:
Above-ground carbon stock = 0.47AGB (2)
Soil was collected at two time points from two land-cover types for both the bulk density (g/cm3)
and soil carbon content (%) analyses at a depth of 30 cm (top soil) [46]. A soil auger was used to
collect the soil sample. Bulk density was calculated using Equation (3) [47,48], and soil carbon content
was calculated via air drying and then baking at 900 °C using an NC-Analyzer Model Sumigraph-NC
90A. The soil carbon content was calculated by multiplying the volume percentage of the soil organic
carbon in the top soil horizon by the soil bulk density value (g/cm3) and then multiplying the result by
the carbon content percentage. As suggested by Black [49], the soil carbon content (t/ha) was
calculated using Equation (4). The total carbon stock was calculated using Equation (5).
Bulk Density (g/cm3) =
eTotalVolum
soil dried-oven of Mass (3)
Soil carbon (t/ha) = 3Soil depth (cm) soil bulk density (g/cm ) carbon content (%) (4)
Total carbon stock = carbon soil stock carbon ground Above (5)
2.4. Land-Cover Classification Method
Two cloudless scenes (12648 and 12649) of Landsat TM images taken on 26 August 2009, were
downloaded from the U.S. Geological Survey (USGS) [50]. The image was georectified to the
universal transverse mercator (UTM) projection using image registration. All Landsat Thematic
Mapper (TM) bands (except the thermal bands) were stacked, and the image was subset for the
Savannakhet area as shown in Figure 1. The land-cover map was classified to estimate the biomass and
carbon stock for each class using Erdas software. The classifications including DEF, MDF, DDF, DF,
and PFi with trees were analyzed using a hybrid classification technique that uses both supervised and
unsupervised classifications with GIS [34,51]. The hybrid classification involved developing training
patterns via the use of an unsupervised classification followed by a supervised classification [51].
For the unsupervised classification, a K-means clustering algorithm was used to search for natural
groups of pixels called clusters, which were located in the data by assessing the relative locations of
the pixels in the feature space for separations between vegetation and non-vegetation classes. The
vegetation classes were also identified for field verification in the study area. The maximum likelihood
method for the supervised classification was applied using analyst-defined training areas to determine
Remote Sens. 2014, 6 5459
the characteristics of each land-cover type. Clouds and shadows were filled using nearby pixels,
Google Maps, land-use Shapefile data, and land-cover classifications from older and newer images. As
the resolution of Landsat images is moderate (30 × 30 m), the use of a combined hybrid classification
technique improved the accuracy of the land-cover classification [34,51]. An accuracy assessment was
applied to evaluate the quality of the land cover map [34]. The accuracy of each classification was
assessed by comparing the classification with the reference data. In all, 81 plots were collected.
Of these plots, 41 were used for image classification; another 40 plots were used as reference data. On
this basis, an error matrix was produced for each result to present the overall accuracy, the user and
producer accuracy, and the kappa coefficient.
2.5. The Correlation between AGB and RS Data
In the current study, the relationship between AGB and RS data was assessed based on field
measurements of each vegetation class. In a previous study, TM spectral bands and VIs were tested for
their ability to predict AGB. Using TM spectral bands or VIs alone was not sufficient to establish
effective AGB estimates [52]. In the current study, RS data and the reflectance of six individual bands
(blue, green, red, near-infrared (NIR), and two middle-infrared (MIR)), as well as various VIs and
elevation data were tested to determine their relationships with AGB using field plot data for various
types of land cover. The forest inventory plots were identified using GPS. The locations of the forest
inventory plots were overlaid on the RS data. The elevation data for each plot were generated from the
SRTM 90-m spatial resolution digital elevation model (DEM) downloaded from USGS [50].
Moreover, the mean values from 6 × 6 pixel windows over the plots for each of the spectral variables
were extracted to reduce the uncertainties of mapping forest AGB due to plot location and the
uncertainties in RS data resulting from plot positioning errors. These errors included those introduced
when the sample plots were located using GPS, X- and Y-UTM coordinates that were misleading, and
sample plots that were mismatched with the image pixels [53]. Landsat spectral variables were
extracted from image dates that closely approximated the years of the forest inventory plots to reduce
spatial and temporal data mismatches between these datasets [54].
The AGB models for different land covers were developed using many available predictors,
grouped into three distinct categories:
Raw Landsat bands (B1–B5 and B7) as reflectance;
VIs, including the simple ratio (SR), difference vegetation index (DVI), normalized difference
vegetation index (NDVI), ratio vegetation index (RVI), global environmental monitoring index
(GEMI), soil-adjusted vegetation index (SAVI), enhanced vegetation index (EVI), tasseled cap
index of greenness (TCG), tasseled cap index of brightness (TCB), and tasseled cap index of
wetness (TCW); and
Topographically derived variables at a spatial resolution of 90 m, including elevation data
generated from the SRTM 90-m digital elevation model (DEM) downloaded from the USGS.
Ten widely used indices associated with Landsat RS change detection and biomass estimation were
used. The tested VIs consisted of the SR of the near infrared and red wavelengths; the DVI, which is a
simple VI calculated as the difference between the infrared and red wavelengths; the NDVI, which is
Remote Sens. 2014, 6 5460
the ratio of contrasting reflectance between the maximum absorption of the red wavelength due to
chlorophyll pigments and the maximum reflectance of the infrared wavelength due to leaf cellular
structure [55]; the RVI, which is a simple VI calculated by dividing the reflectance value of the near
infrared wavelength by that of the red wavelength [56]; the GEMI, which is a non-linear VI similar to
the NDVI but less sensitive to atmospheric affects; the SAVI, which is similar to the NDVI but adds a
soil brightness correction factor [57,58]; the EVI, which was developed to address specific limitations
of the NDVI by being more sensitive to changes in areas with high biomass and reducing the influence
of atmospheric conditions on VIs; and the TCG, TCB, and TCW, which were derived directly from the
raw Landsat bands using the reflectance-based transformation [59]. The TC components have been
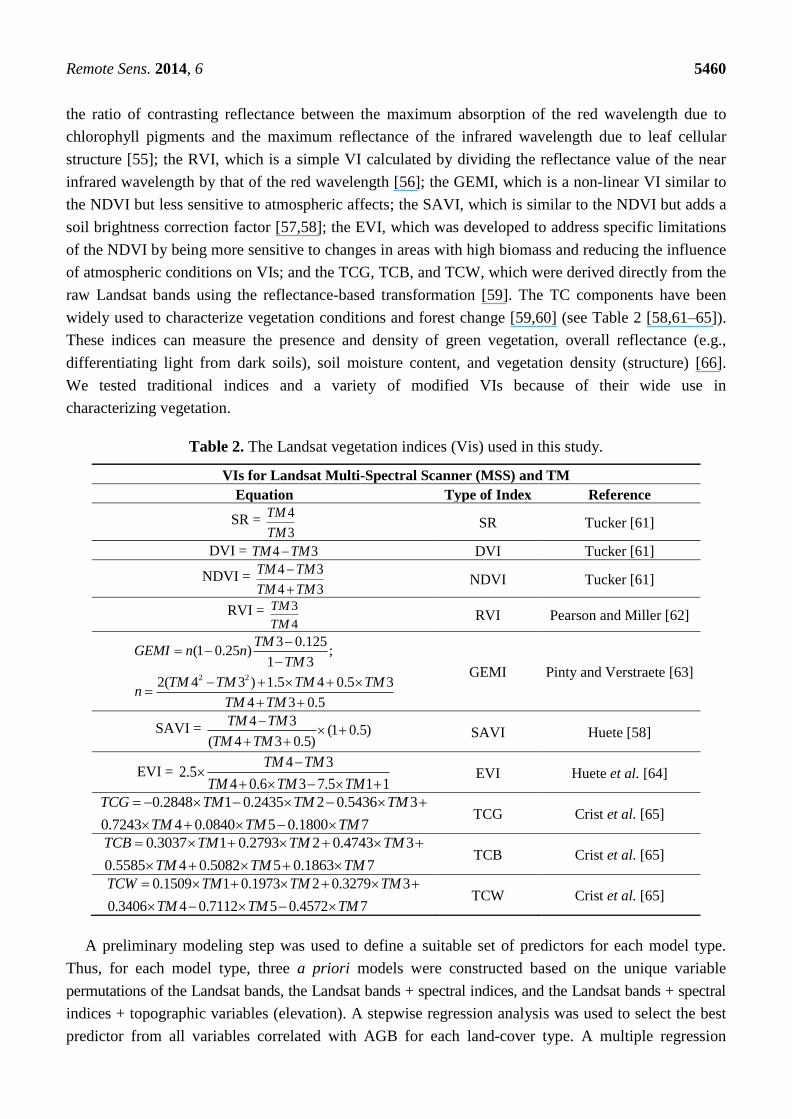
widely used to characterize vegetation conditions and forest change [59,60] (see Table 2 [58,61–65]).
These indices can measure the presence and density of green vegetation, overall reflectance (e.g.,
differentiating light from dark soils), soil moisture content, and vegetation density (structure) [66].
We tested traditional indices and a variety of modified VIs because of their wide use in
characterizing vegetation.
Table 2. The Landsat vegetation indices (Vis) used in this study.
VIs for Landsat Multi-Spectral Scanner (MSS) and TM
Equation Type of Index Reference
SR = 3
4
TM
TM SR Tucker [61]
DVI = 34 TMTM DVI Tucker [61]
NDVI = 34
34
TMTM
TMTM
NDVI Tucker [61]
RVI = 4
3
TM
TM RVI Pearson and Miller [62]
2 2
3 0.125(1 0.25 ) ;
1 3
2( 4 3 ) 1.5 4 0.5 3
4 3 0.5
TMGEMI n n
TM
TM TM TM TMn
TM TM
GEMI Pinty and Verstraete [63]
SAVI = 4 3
(1 0.5)( 4 3 0.5)
TM TM
TM TM
SAVI Huete [58]
EVI = 4 3
2.54 0.6 3 7.5 1 1
TM TM
TM TM TM
EVI Huete et al. [64]
0.2848 1 0.2435 2 0.5436 3
0.7243 4 0.0840 5 0.1800 7
TCG TM TM TM
TM TM TM
TCG Crist et al. [65]
0.3037 1 0.2793 2 0.4743 3
0.5585 4 0.5082 5 0.1863 7
TCB TM TM TM
TM TM TM
TCB Crist et al. [65]
0.1509 1 0.1973 2 0.3279 3
0.3406 4 0.7112 5 0.4572 7
TCW TM TM TM
TM TM TM
TCW Crist et al. [65]
A preliminary modeling step was used to define a suitable set of predictors for each model type.
Thus, for each model type, three a priori models were constructed based on the unique variable
permutations of the Landsat bands, the Landsat bands + spectral indices, and the Landsat bands + spectral
indices + topographic variables (elevation). A stepwise regression analysis was used to select the best
predictor from all variables correlated with AGB for each land-cover type. A multiple regression
Remote Sens. 2014, 6 5461
model was used to identify the relationship between the AGB and RS data. Finally, the biomass
estimation map for various land-cover types was generated from the models and land cover
classification resulting from Section 2.4.
2.6. Model Validation
The models were evaluated using cross-validation by plot. For this analysis, the data were divided
into two groups: the observed (y) and predicted (ŷ) values for each land-cover type. The AGB was the
observed variable in these analyses. The RS data (e.g., TM bands, VIs, and elevation) were the
predictors. The AGB predictions for each model were validated using a withheld validation dataset by
calculating the RMSE between the observed and predicted values, as well as the relative RMSE,
the bias, and the relative bias [54]. The results were validated by comparing the RMSE, the relative
RMSE, the bias, and the relative bias of each model. Pearson correlation (r) was used to measure the
strength of the linear relationship between variables. The probability value (p-value) was used to verify
the performance of the model.
The RMSE and the relative RMSE were calculated using Equations (6) and (7), where (Ŷi) is the
predicted AGB of the ith plot and (Yi) is the observed AGB of the ith plot:
n
YY
RMSEii
2^
(6)
% 100RMSE
RMSE
Y
(7)
The bias and the relative bias were calculated from the difference between the mean predicted AGB
(^
Y ) and the mean observed AGB (Ῡ), as shown in Equations (8) and (9):
YYBias^
(8)
Bias% 100Bias
Y (9)
3. Results and Discussion
3.1. Vegetation Structure and Forest Composition
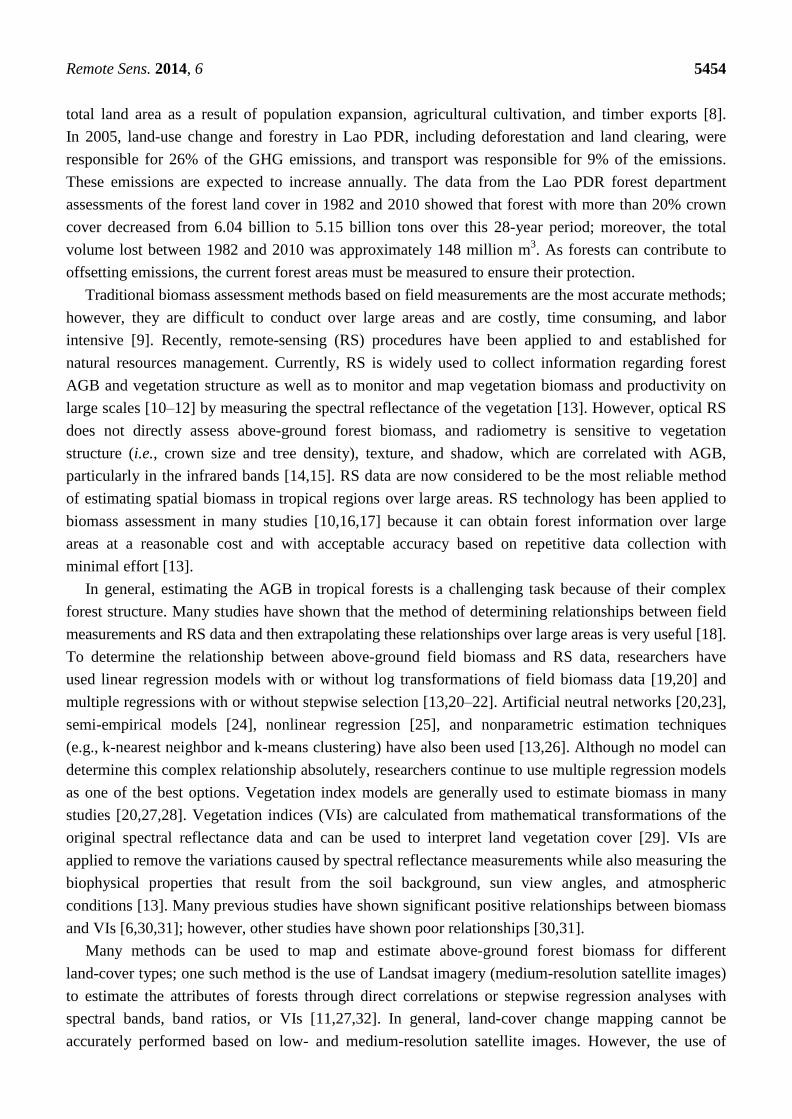
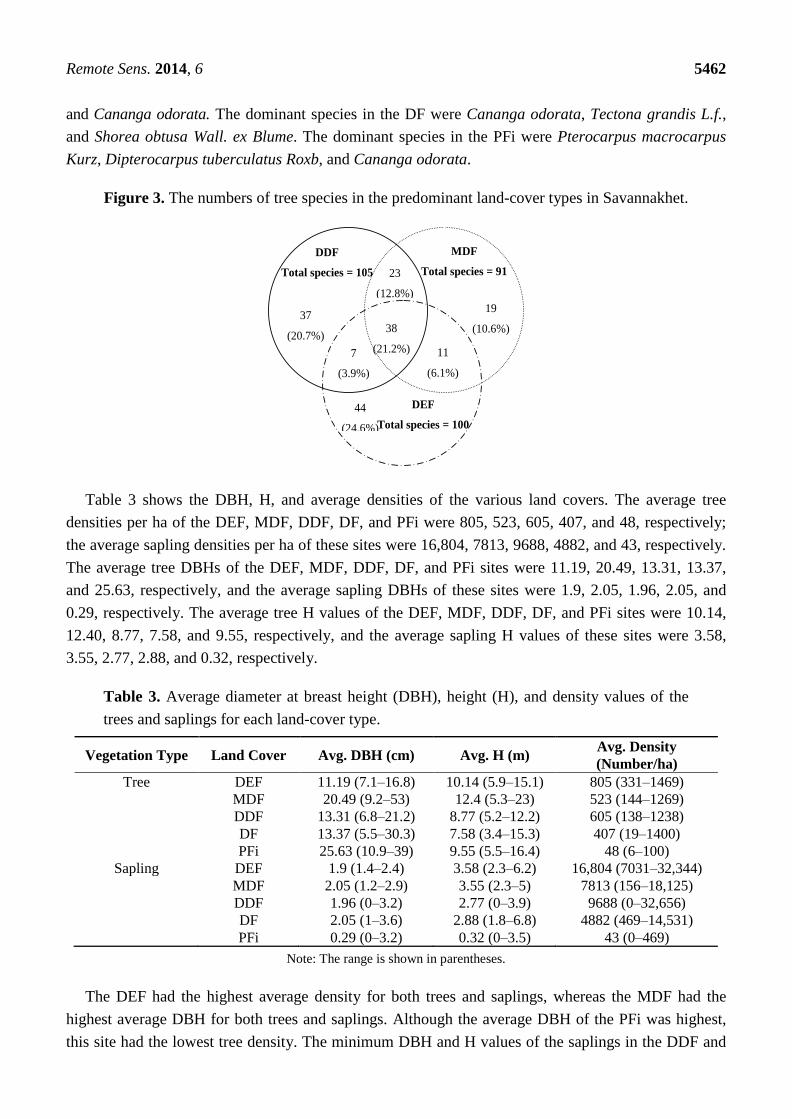
A total of 197 species were found in the DEF, MDF, and DDF sample sites (100, 91, and 105 species,
respectively), and 38 species (21.2%) were found in all three forest types (including Mitragyna
rotundifolia [Roxb.] Kuntze, Irvingia malayana Oliv. ex A. w. Benn., and Millettia brandisiana Kurz).
A total of 23 species were found in the MDF and DDF sites, 7 species were found in the DEF and
DDF sites, and 11 species were found in the DEF and MDF sites (see Figure 3). The dominant species
in the DEF included Lithocarpus polystachyus (Wall.) Rehd., Irvingia malayana Oliv. ex A. w. Benn.,
and Syzygium cumini (L.) Skeels. The dominant species of the MDF were Cananga odorata, Mitragyna
rotundifolia (Roxb.) Kuntze, and Xylia sylocarpa var. kerrii (Craib and Hutch.) I. Nielsen.
The dominant species in the DDF were Shorea obtusa. Wall. ex Blume, Shorea siamensis Miq.,
Remote Sens. 2014, 6 5462
and Cananga odorata. The dominant species in the DF were Cananga odorata, Tectona grandis L.f.,
and Shorea obtusa Wall. ex Blume. The dominant species in the PFi were Pterocarpus macrocarpus
Kurz, Dipterocarpus tuberculatus Roxb, and Cananga odorata.
Figure 3. The numbers of tree species in the predominant land-cover types in Savannakhet.
Table 3 shows the DBH, H, and average densities of the various land covers. The average tree
densities per ha of the DEF, MDF, DDF, DF, and PFi were 805, 523, 605, 407, and 48, respectively;
the average sapling densities per ha of these sites were 16,804, 7813, 9688, 4882, and 43, respectively.
The average tree DBHs of the DEF, MDF, DDF, DF, and PFi sites were 11.19, 20.49, 13.31, 13.37,
and 25.63, respectively, and the average sapling DBHs of these sites were 1.9, 2.05, 1.96, 2.05, and
0.29, respectively. The average tree H values of the DEF, MDF, DDF, DF, and PFi sites were 10.14,
12.40, 8.77, 7.58, and 9.55, respectively, and the average sapling H values of these sites were 3.58,
3.55, 2.77, 2.88, and 0.32, respectively.
Table 3. Average diameter at breast height (DBH), height (H), and density values of the
trees and saplings for each land-cover type.
Vegetation Type Land Cover Avg. DBH (cm) Avg. H (m) Avg. Density
(Number/ha)
Tree DEF 11.19 (7.1–16.8) 10.14 (5.9–15.1) 805 (331–1469)
MDF 20.49 (9.2–53) 12.4 (5.3–23) 523 (144–1269)
DDF 13.31 (6.8–21.2) 8.77 (5.2–12.2) 605 (138–1238)
DF 13.37 (5.5–30.3) 7.58 (3.4–15.3) 407 (19–1400)
PFi 25.63 (10.9–39) 9.55 (5.5–16.4) 48 (6–100)
Sapling DEF 1.9 (1.4–2.4) 3.58 (2.3–6.2) 16,804 (7031–32,344)
MDF 2.05 (1.2–2.9) 3.55 (2.3–5) 7813 (156–18,125)
DDF 1.96 (0–3.2) 2.77 (0–3.9) 9688 (0–32,656)
DF 2.05 (1–3.6) 2.88 (1.8–6.8) 4882 (469–14,531)
PFi 0.29 (0–3.2) 0.32 (0–3.5) 43 (0–469)
Note: The range is shown in parentheses.
The DEF had the highest average density for both trees and saplings, whereas the MDF had the
highest average DBH for both trees and saplings. Although the average DBH of the PFi was highest,
this site had the lowest tree density. The minimum DBH and H values of the saplings in the DDF and
Figure 3. The numbers of tree species in the predominant land-cover types in Savannakhet.
Table 3 shows the DBH, H, and average densities of the various land covers. The average tree
37
(20.7%)
23
(12.8%)
38
(21.2%) 7
(3.9%)
19
(10.6%)
11
(6.1%)
44
(24.6%)
DDF
Total species = 105
MDF
Total species = 91
DEF
Total species = 100
Remote Sens. 2014, 6 5463
PFi were 0 because several plots had no saplings. The MDF had the highest average H for trees,
whereas the DEF had the highest average H for saplings. In this study, the DBH and H values of each
individual tree and sapling in the plots were used to estimate the AGB following the allometric
equation provided in Table 1.
3.2. AGB and Soil Carbon Analysis from Field Data
The data collected from the field were applied with the methodology described in Sections 2.2 and
2.3. The above-ground biomass and carbon stocks were largely influenced by the DBH, H, and
density. A summary of the AGB and carbon stocks for various land covers is shown in Tables 4 and 5,
and a summary of the soil carbon stock is shown in Table 6.
3.2.1. The AGB Analysis of Each Component from Field Data
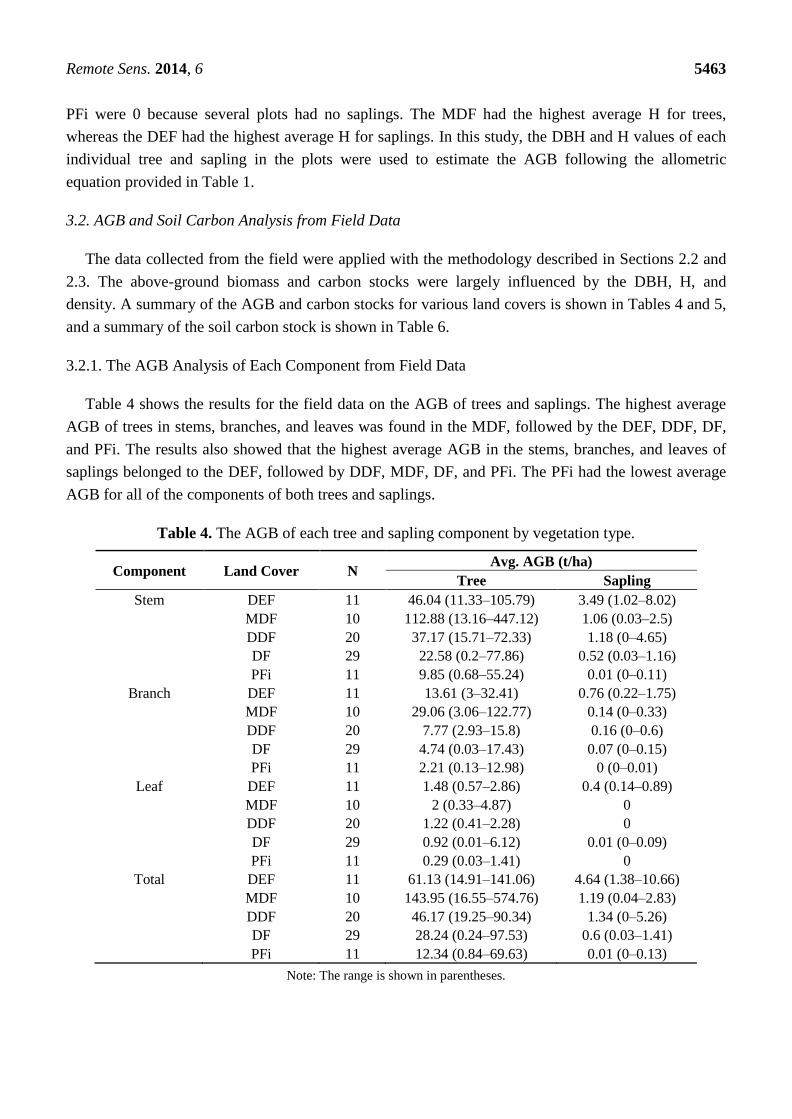
Table 4 shows the results for the field data on the AGB of trees and saplings. The highest average
AGB of trees in stems, branches, and leaves was found in the MDF, followed by the DEF, DDF, DF,
and PFi. The results also showed that the highest average AGB in the stems, branches, and leaves of
saplings belonged to the DEF, followed by DDF, MDF, DF, and PFi. The PFi had the lowest average
AGB for all of the components of both trees and saplings.
Table 4. The AGB of each tree and sapling component by vegetation type.
Component Land Cover N Avg. AGB (t/ha)
Tree Sapling
Stem DEF 11 46.04 (11.33–105.79) 3.49 (1.02–8.02)
MDF 10 112.88 (13.16–447.12) 1.06 (0.03–2.5)
DDF 20 37.17 (15.71–72.33) 1.18 (0–4.65)
DF 29 22.58 (0.2–77.86) 0.52 (0.03–1.16)
PFi 11 9.85 (0.68–55.24) 0.01 (0–0.11)
Branch DEF 11 13.61 (3–32.41) 0.76 (0.22–1.75)
MDF 10 29.06 (3.06–122.77) 0.14 (0–0.33)
DDF 20 7.77 (2.93–15.8) 0.16 (0–0.6)
DF 29 4.74 (0.03–17.43) 0.07 (0–0.15)
PFi 11 2.21 (0.13–12.98) 0 (0–0.01)
Leaf DEF 11 1.48 (0.57–2.86) 0.4 (0.14–0.89)
MDF 10 2 (0.33–4.87) 0
DDF 20 1.22 (0.41–2.28) 0
DF 29 0.92 (0.01–6.12) 0.01 (0–0.09)
PFi 11 0.29 (0.03–1.41) 0
Total DEF 11 61.13 (14.91–141.06) 4.64 (1.38–10.66)
MDF 10 143.95 (16.55–574.76) 1.19 (0.04–2.83)
DDF 20 46.17 (19.25–90.34) 1.34 (0–5.26)
DF 29 28.24 (0.24–97.53) 0.6 (0.03–1.41)
PFi 11 12.34 (0.84–69.63) 0.01 (0–0.13)
Note: The range is shown in parentheses.
Remote Sens. 2014, 6 5464
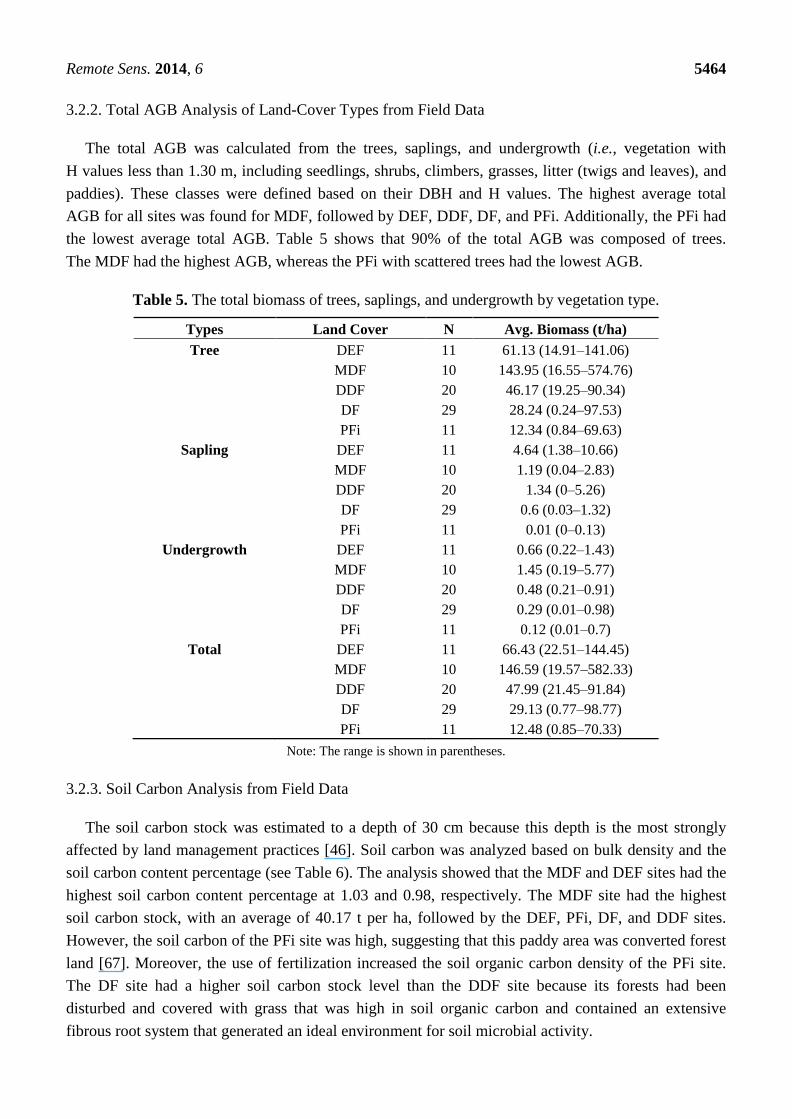
3.2.2. Total AGB Analysis of Land-Cover Types from Field Data
The total AGB was calculated from the trees, saplings, and undergrowth (i.e., vegetation with
H values less than 1.30 m, including seedlings, shrubs, climbers, grasses, litter (twigs and leaves), and
paddies). These classes were defined based on their DBH and H values. The highest average total
AGB for all sites was found for MDF, followed by DEF, DDF, DF, and PFi. Additionally, the PFi had
the lowest average total AGB. Table 5 shows that 90% of the total AGB was composed of trees.
The MDF had the highest AGB, whereas the PFi with scattered trees had the lowest AGB.
Table 5. The total biomass of trees, saplings, and undergrowth by vegetation type.
Types Land Cover N Avg. Biomass (t/ha)
Tree DEF 11 61.13 (14.91–141.06)
MDF 10 143.95 (16.55–574.76)
DDF 20 46.17 (19.25–90.34)
DF 29 28.24 (0.24–97.53)
PFi 11 12.34 (0.84–69.63)
Sapling DEF 11 4.64 (1.38–10.66)
MDF 10 1.19 (0.04–2.83)
DDF 20 1.34 (0–5.26)
DF 29 0.6 (0.03–1.32)
PFi 11 0.01 (0–0.13)
Undergrowth DEF 11 0.66 (0.22–1.43)
MDF 10 1.45 (0.19–5.77)
DDF 20 0.48 (0.21–0.91)
DF 29 0.29 (0.01–0.98)
PFi 11 0.12 (0.01–0.7)
Total DEF 11 66.43 (22.51–144.45)
MDF 10 146.59 (19.57–582.33)
DDF 20 47.99 (21.45–91.84)
DF 29 29.13 (0.77–98.77)
PFi 11 12.48 (0.85–70.33)
Note: The range is shown in parentheses.
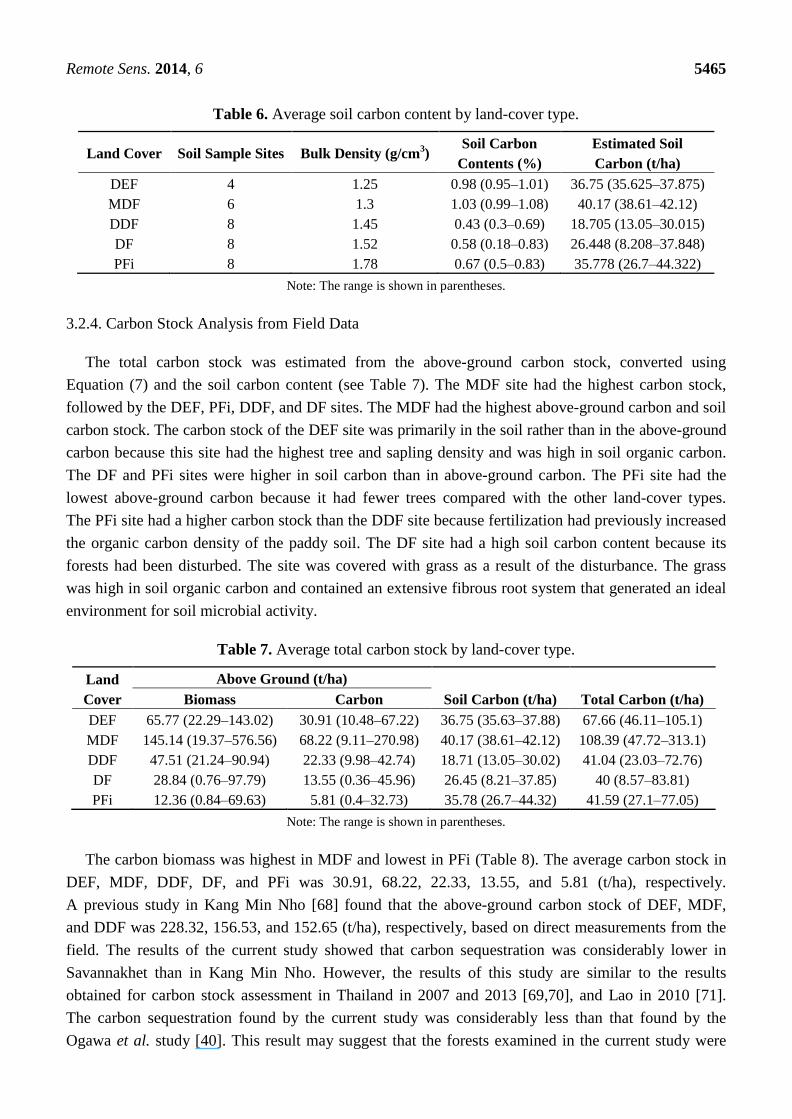
3.2.3. Soil Carbon Analysis from Field Data
The soil carbon stock was estimated to a depth of 30 cm because this depth is the most strongly
affected by land management practices [46]. Soil carbon was analyzed based on bulk density and the
soil carbon content percentage (see Table 6). The analysis showed that the MDF and DEF sites had the
highest soil carbon content percentage at 1.03 and 0.98, respectively. The MDF site had the highest
soil carbon stock, with an average of 40.17 t per ha, followed by the DEF, PFi, DF, and DDF sites.
However, the soil carbon of the PFi site was high, suggesting that this paddy area was converted forest
land [67]. Moreover, the use of fertilization increased the soil organic carbon density of the PFi site.
The DF site had a higher soil carbon stock level than the DDF site because its forests had been
disturbed and covered with grass that was high in soil organic carbon and contained an extensive
fibrous root system that generated an ideal environment for soil microbial activity.
Remote Sens. 2014, 6 5465
Table 6. Average soil carbon content by land-cover type.
Land Cover Soil Sample Sites Bulk Density (g/cm3)
Soil Carbon
Contents (%)
Estimated Soil
Carbon (t/ha)
DEF 4 1.25 0.98 (0.95–1.01) 36.75 (35.625–37.875)
MDF 6 1.3 1.03 (0.99–1.08) 40.17 (38.61–42.12)
DDF 8 1.45 0.43 (0.3–0.69) 18.705 (13.05–30.015)
DF 8 1.52 0.58 (0.18–0.83) 26.448 (8.208–37.848)
PFi 8 1.78 0.67 (0.5–0.83) 35.778 (26.7–44.322)
Note: The range is shown in parentheses.
3.2.4. Carbon Stock Analysis from Field Data
The total carbon stock was estimated from the above-ground carbon stock, converted using
Equation (7) and the soil carbon content (see Table 7). The MDF site had the highest carbon stock,
followed by the DEF, PFi, DDF, and DF sites. The MDF had the highest above-ground carbon and soil
carbon stock. The carbon stock of the DEF site was primarily in the soil rather than in the above-ground
carbon because this site had the highest tree and sapling density and was high in soil organic carbon.
The DF and PFi sites were higher in soil carbon than in above-ground carbon. The PFi site had the
lowest above-ground carbon because it had fewer trees compared with the other land-cover types.
The PFi site had a higher carbon stock than the DDF site because fertilization had previously increased
the organic carbon density of the paddy soil. The DF site had a high soil carbon content because its
forests had been disturbed. The site was covered with grass as a result of the disturbance. The grass
was high in soil organic carbon and contained an extensive fibrous root system that generated an ideal
environment for soil microbial activity.
Table 7. Average total carbon stock by land-cover type.
Land
Cover
Above Ground (t/ha)
Soil Carbon (t/ha) Total Carbon (t/ha) Biomass Carbon
DEF 65.77 (22.29–143.02) 30.91 (10.48–67.22) 36.75 (35.63–37.88) 67.66 (46.11–105.1)
MDF 145.14 (19.37–576.56) 68.22 (9.11–270.98) 40.17 (38.61–42.12) 108.39 (47.72–313.1)
DDF 47.51 (21.24–90.94) 22.33 (9.98–42.74) 18.71 (13.05–30.02) 41.04 (23.03–72.76)
DF 28.84 (0.76–97.79) 13.55 (0.36–45.96) 26.45 (8.21–37.85) 40 (8.57–83.81)
PFi 12.36 (0.84–69.63) 5.81 (0.4–32.73) 35.78 (26.7–44.32) 41.59 (27.1–77.05)
Note: The range is shown in parentheses.
The carbon biomass was highest in MDF and lowest in PFi (Table 8). The average carbon stock in
DEF, MDF, DDF, DF, and PFi was 30.91, 68.22, 22.33, 13.55, and 5.81 (t/ha), respectively.
A previous study in Kang Min Nho [68] found that the above-ground carbon stock of DEF, MDF,
and DDF was 228.32, 156.53, and 152.65 (t/ha), respectively, based on direct measurements from the
field. The results of the current study showed that carbon sequestration was considerably lower in
Savannakhet than in Kang Min Nho. However, the results of this study are similar to the results
obtained for carbon stock assessment in Thailand in 2007 and 2013 [69,70], and Lao in 2010 [71].
The carbon sequestration found by the current study was considerably less than that found by the
Ogawa et al. study [40]. This result may suggest that the forests examined in the current study were
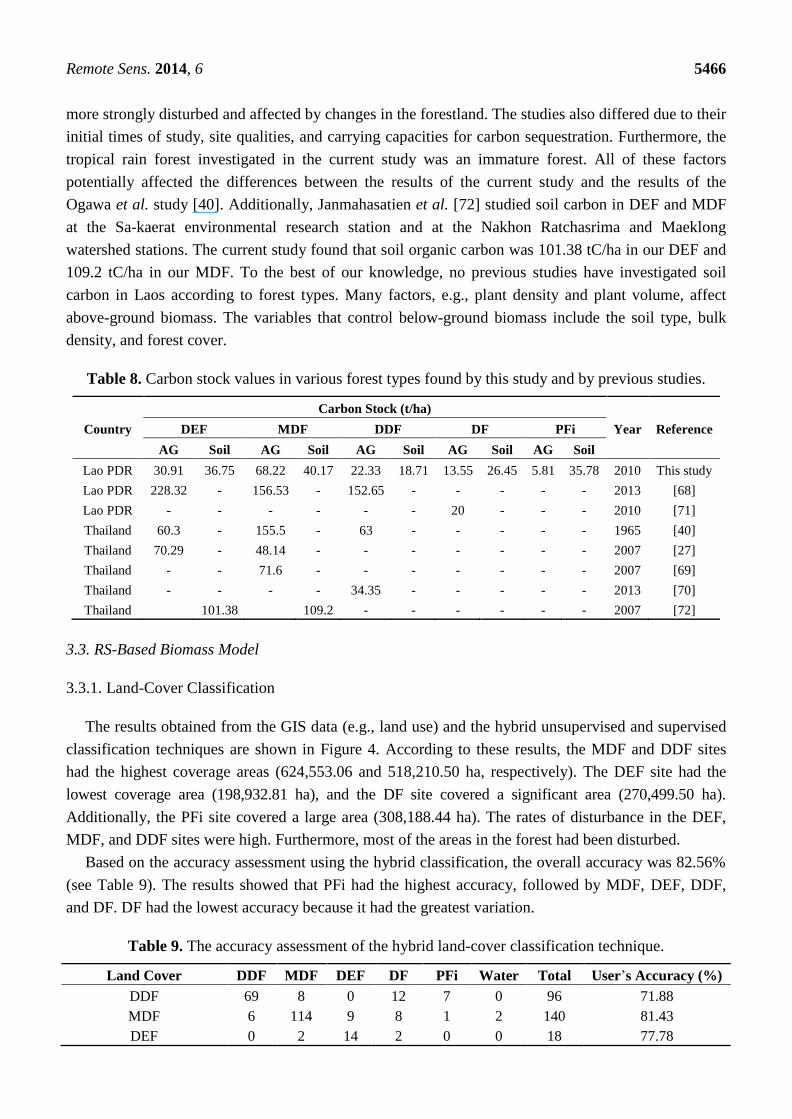
Remote Sens. 2014, 6 5466
more strongly disturbed and affected by changes in the forestland. The studies also differed due to their
initial times of study, site qualities, and carrying capacities for carbon sequestration. Furthermore, the
tropical rain forest investigated in the current study was an immature forest. All of these factors
potentially affected the differences between the results of the current study and the results of the
Ogawa et al. study [40]. Additionally, Janmahasatien et al. [72] studied soil carbon in DEF and MDF
at the Sa-kaerat environmental research station and at the Nakhon Ratchasrima and Maeklong
watershed stations. The current study found that soil organic carbon was 101.38 tC/ha in our DEF and
109.2 tC/ha in our MDF. To the best of our knowledge, no previous studies have investigated soil
carbon in Laos according to forest types. Many factors, e.g., plant density and plant volume, affect
above-ground biomass. The variables that control below-ground biomass include the soil type, bulk
density, and forest cover.
Table 8. Carbon stock values in various forest types found by this study and by previous studies.
Country
Carbon Stock (t/ha)
Year Reference DEF MDF DDF DF PFi
AG Soil AG Soil AG Soil AG Soil AG Soil
Lao PDR 30.91 36.75 68.22 40.17 22.33 18.71 13.55 26.45 5.81 35.78 2010 This study
Lao PDR 228.32 - 156.53 - 152.65 - - - - - 2013 [68]
Lao PDR - - - - - - 20 - - - 2010 [71]
Thailand 60.3 - 155.5 - 63 - - - - - 1965 [40]
Thailand 70.29 - 48.14 - - - - - - - 2007 [27]
Thailand - - 71.6 - - - - - - - 2007 [69]
Thailand - - - - 34.35 - - - - - 2013 [70]
Thailand 101.38 109.2 - - - - - - 2007 [72]
3.3. RS-Based Biomass Model
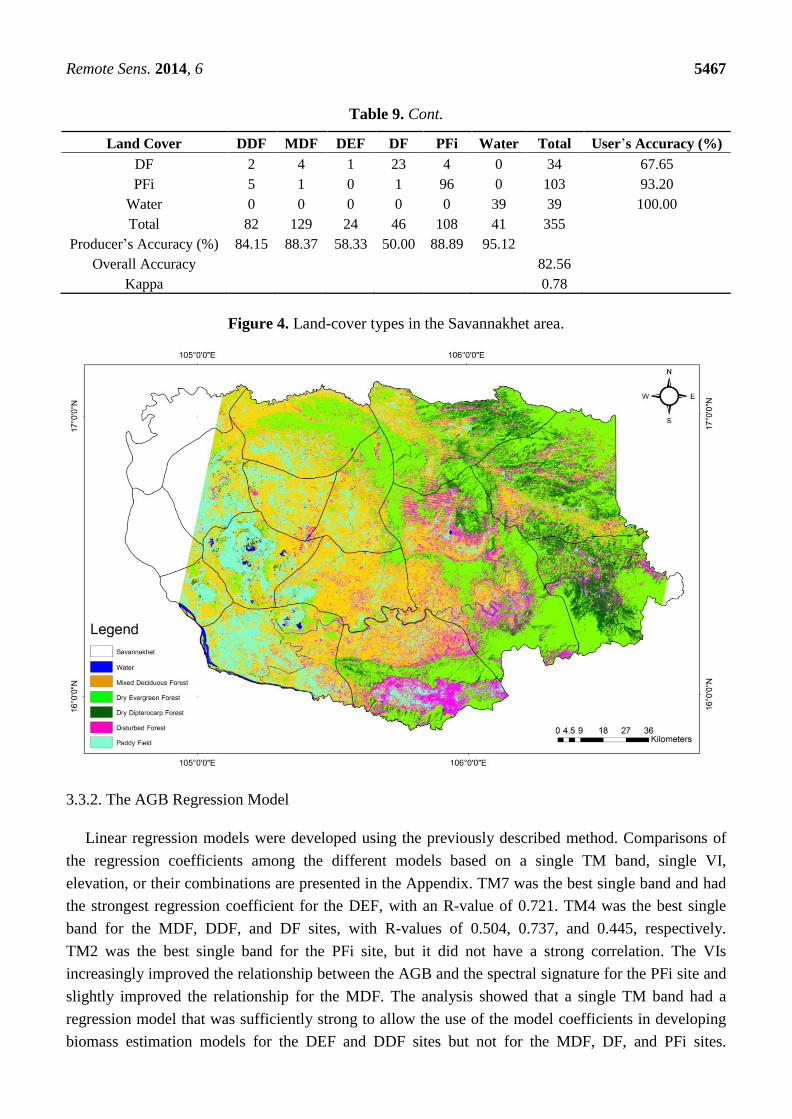
3.3.1. Land-Cover Classification
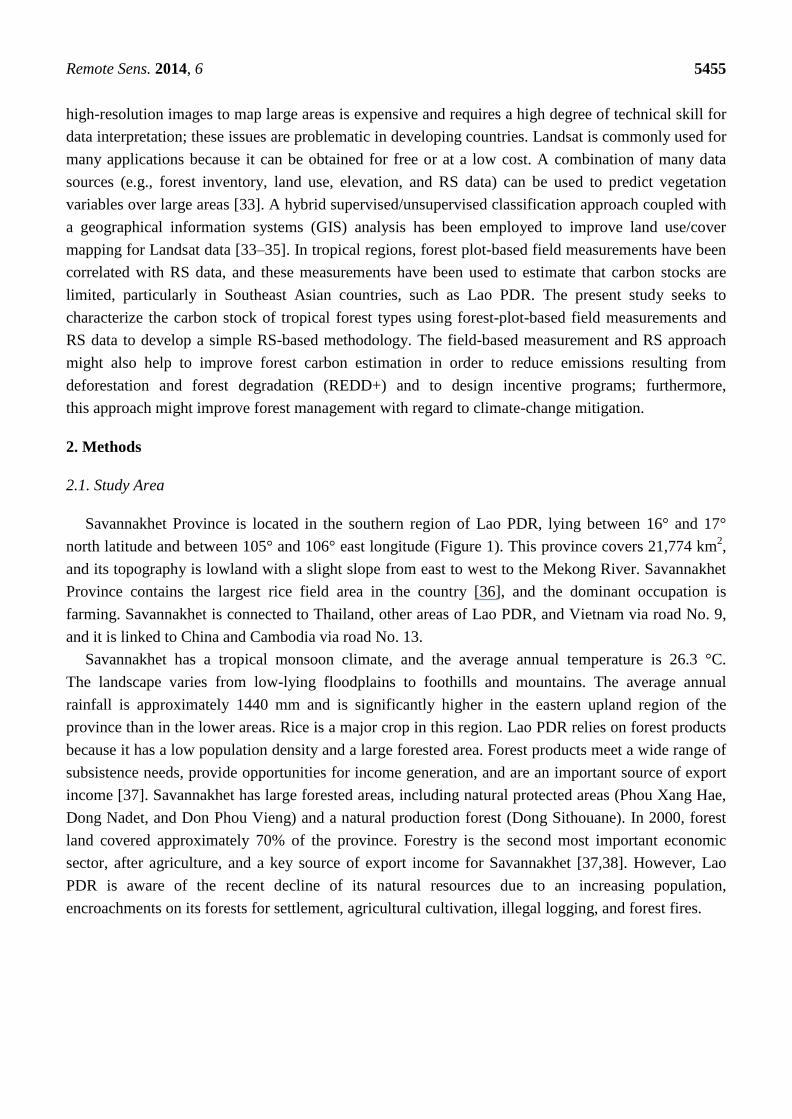
The results obtained from the GIS data (e.g., land use) and the hybrid unsupervised and supervised
classification techniques are shown in Figure 4. According to these results, the MDF and DDF sites
had the highest coverage areas (624,553.06 and 518,210.50 ha, respectively). The DEF site had the
lowest coverage area (198,932.81 ha), and the DF site covered a significant area (270,499.50 ha).
Additionally, the PFi site covered a large area (308,188.44 ha). The rates of disturbance in the DEF,
MDF, and DDF sites were high. Furthermore, most of the areas in the forest had been disturbed.
Based on the accuracy assessment using the hybrid classification, the overall accuracy was 82.56%
(see Table 9). The results showed that PFi had the highest accuracy, followed by MDF, DEF, DDF,
and DF. DF had the lowest accuracy because it had the greatest variation.
Table 9. The accuracy assessment of the hybrid land-cover classification technique.
Land Cover DDF MDF DEF DF PFi Water Total User’s Accuracy (%)
DDF 69 8 0 12 7 0 96 71.88
MDF 6 114 9 8 1 2 140 81.43
DEF 0 2 14 2 0 0 18 77.78
Remote Sens. 2014, 6 5467
Table 9. Cont.
Land Cover DDF MDF DEF DF PFi Water Total User’s Accuracy (%)
DF 2 4 1 23 4 0 34 67.65
PFi 5 1 0 1 96 0 103 93.20
Water 0 0 0 0 0 39 39 100.00
Total 82 129 24 46 108 41 355
Producer’s Accuracy (%) 84.15 88.37 58.33 50.00 88.89 95.12
Overall Accuracy 82.56
Kappa 0.78
Figure 4. Land-cover types in the Savannakhet area.
3.3.2. The AGB Regression Model
Linear regression models were developed using the previously described method. Comparisons of
the regression coefficients among the different models based on a single TM band, single VI,
elevation, or their combinations are presented in the Appendix. TM7 was the best single band and had
the strongest regression coefficient for the DEF, with an R-value of 0.721. TM4 was the best single
band for the MDF, DDF, and DF sites, with R-values of 0.504, 0.737, and 0.445, respectively.
TM2 was the best single band for the PFi site, but it did not have a strong correlation. The VIs
increasingly improved the relationship between the AGB and the spectral signature for the PFi site and
slightly improved the relationship for the MDF. The analysis showed that a single TM band had a
regression model that was sufficiently strong to allow the use of the model coefficients in developing
biomass estimation models for the DEF and DDF sites but not for the MDF, DF, and PFi sites.
Remote Sens. 2014, 6 5468
Therefore, two or more independent variables were required to improve the relationship between the
AGB and the RS data. A stepwise regression analysis indicated that if the independent variables in the
multiple regression models consisted of two or more TM bands, VIs, or other variables (e.g., elevation
or a combination of the original independent variables), the regression coefficients significantly
improved the R-values because high correlations were found among the spectral signatures, VIs, and
the other variables. The results indicated that the RS data, including TM7, TM4, SR, DVI, RVI, SAVI,
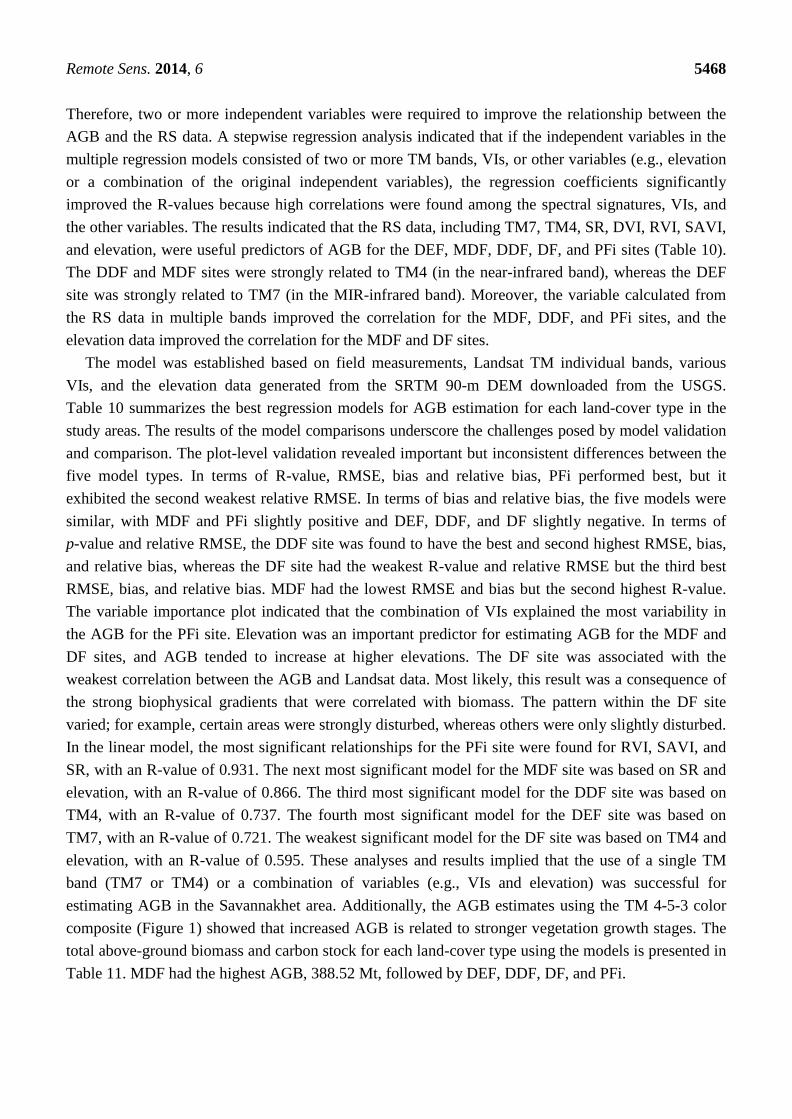
and elevation, were useful predictors of AGB for the DEF, MDF, DDF, DF, and PFi sites (Table 10).
The DDF and MDF sites were strongly related to TM4 (in the near-infrared band), whereas the DEF
site was strongly related to TM7 (in the MIR-infrared band). Moreover, the variable calculated from
the RS data in multiple bands improved the correlation for the MDF, DDF, and PFi sites, and the
elevation data improved the correlation for the MDF and DF sites.
The model was established based on field measurements, Landsat TM individual bands, various
VIs, and the elevation data generated from the SRTM 90-m DEM downloaded from the USGS.
Table 10 summarizes the best regression models for AGB estimation for each land-cover type in the
study areas. The results of the model comparisons underscore the challenges posed by model validation
and comparison. The plot-level validation revealed important but inconsistent differences between the
five model types. In terms of R-value, RMSE, bias and relative bias, PFi performed best, but it
exhibited the second weakest relative RMSE. In terms of bias and relative bias, the five models were
similar, with MDF and PFi slightly positive and DEF, DDF, and DF slightly negative. In terms of
p-value and relative RMSE, the DDF site was found to have the best and second highest RMSE, bias,
and relative bias, whereas the DF site had the weakest R-value and relative RMSE but the third best
RMSE, bias, and relative bias. MDF had the lowest RMSE and bias but the second highest R-value.
The variable importance plot indicated that the combination of VIs explained the most variability in
the AGB for the PFi site. Elevation was an important predictor for estimating AGB for the MDF and
DF sites, and AGB tended to increase at higher elevations. The DF site was associated with the
weakest correlation between the AGB and Landsat data. Most likely, this result was a consequence of
the strong biophysical gradients that were correlated with biomass. The pattern within the DF site
varied; for example, certain areas were strongly disturbed, whereas others were only slightly disturbed.
In the linear model, the most significant relationships for the PFi site were found for RVI, SAVI, and
SR, with an R-value of 0.931. The next most significant model for the MDF site was based on SR and
elevation, with an R-value of 0.866. The third most significant model for the DDF site was based on
TM4, with an R-value of 0.737. The fourth most significant model for the DEF site was based on
TM7, with an R-value of 0.721. The weakest significant model for the DF site was based on TM4 and
elevation, with an R-value of 0.595. These analyses and results implied that the use of a single TM
band (TM7 or TM4) or a combination of variables (e.g., VIs and elevation) was successful for
estimating AGB in the Savannakhet area. Additionally, the AGB estimates using the TM 4-5-3 color
composite (Figure 1) showed that increased AGB is related to stronger vegetation growth stages. The
total above-ground biomass and carbon stock for each land-cover type using the models is presented in
Table 11. MDF had the highest AGB, 388.52 Mt, followed by DEF, DDF, DF, and PFi.
Remote Sens. 2014, 6 5469
Table 10. Models used for AGB estimation (t/ha) for each land-cover type.
Models Used for AGB Estimation for Each Land-Cover Type
Land
Cover Regression Models R
p-Value RMSE
Relative
RMSE Bias
Relative
Bias
DEF AGB = 325.911 + (−10.816 × TM7) 0.721 0.012 24.95 37.93 −0.01 −0.02
MDF AGB = 202.406 + (196.558 × SR) + (−1.884 ×
Elevation) 0.866 0.027 81.87 54.58 0.07 0.05
DDF AGB = 101.633 + (−0.796 × TM4) 0.737 0.0003 14.07 29.64 −0.02 −0.05
DF AGB = −17.134 + (−0.816 × TM4) + (0.550 ×
Elevation) 0.595 0.015 19.72 68.39 −0.02 −0.08
PFi AGB = −1716.153 + (2071.324 × RVI)+(1676.510
× SAVI) + (−72.293 × SR) 0.931 0.002 6.9 55.89 0.001 0.008
Table 11. Total AGB and carbon stock estimation for each land-cover type.
Land Cover Average AGB (t/ha) Total AGB (Mt) Total AG Carbon (Mt)
DEF 148.91(23.06–239.38) 32.91 15.47
MDF 388.52(113.8–587.73) 269.61 126.72
DDF 53.74(41.14–67.41) 30.94 14.54
DF 52.93(25.37–194.18) 15.91 7.48
PFi 37.42(2.77–134.51) 12.81 6.02
Total 362.18 170.22
3.3.3. Total Carbon Stock in the Study Area
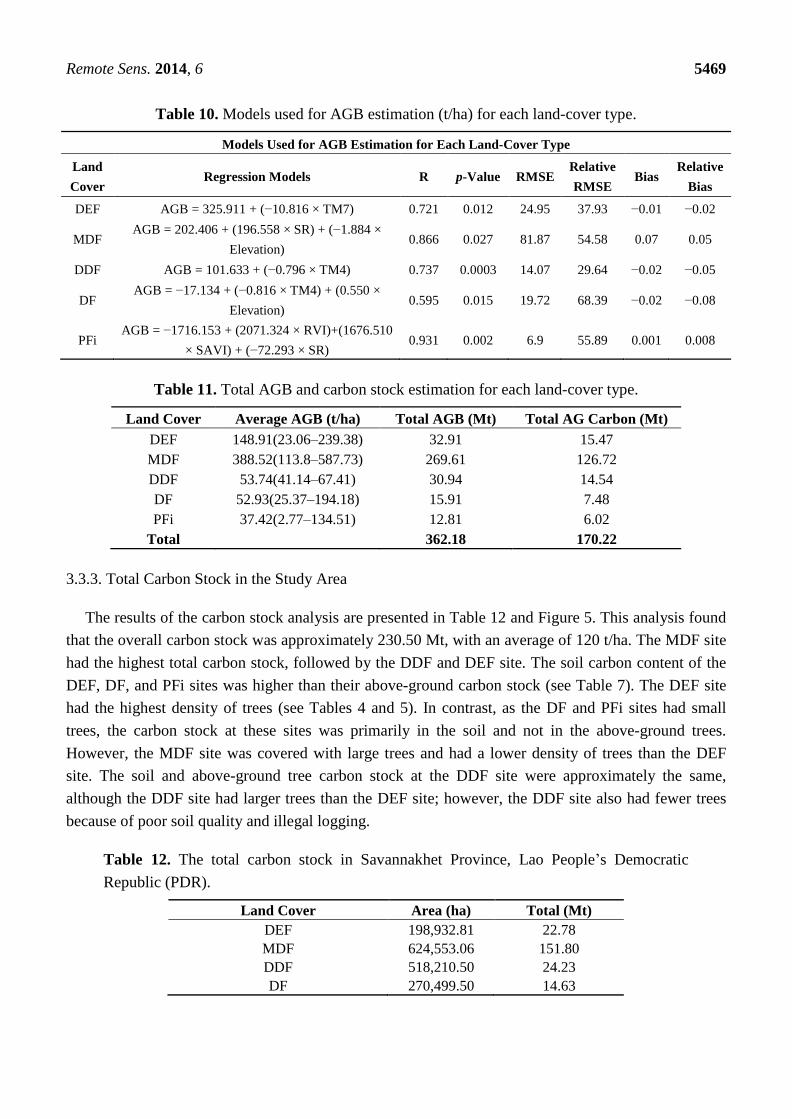
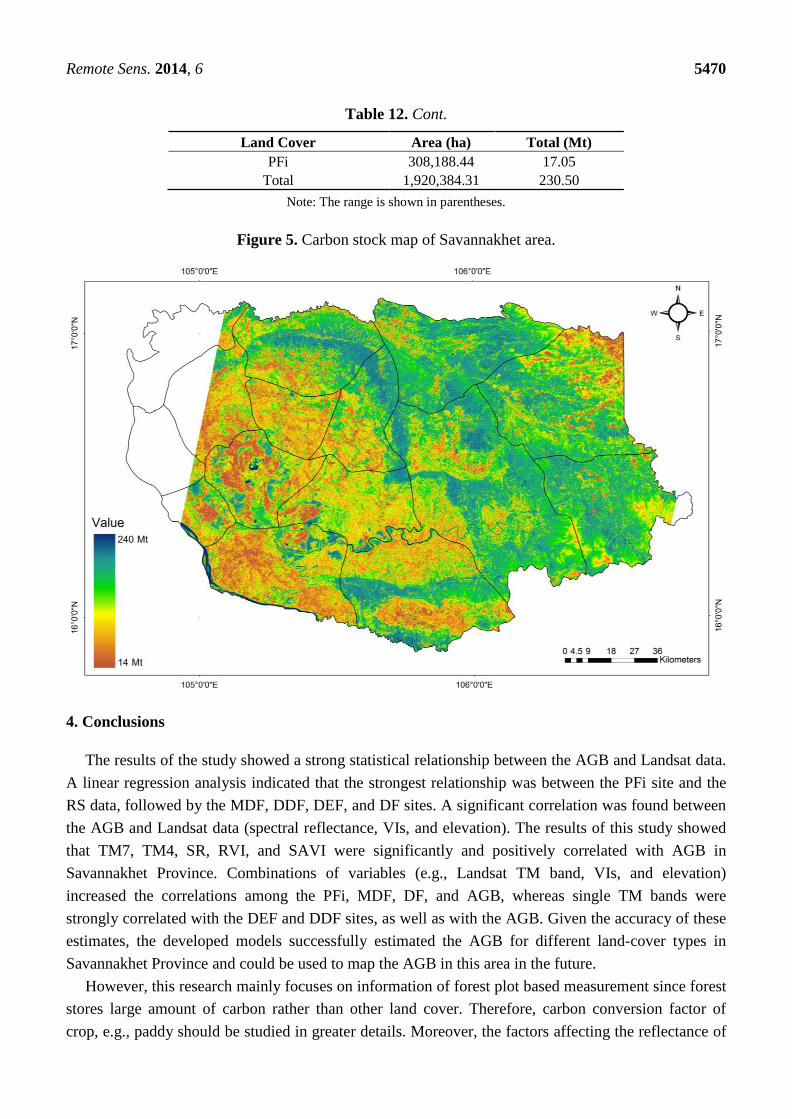
The results of the carbon stock analysis are presented in Table 12 and Figure 5. This analysis found
that the overall carbon stock was approximately 230.50 Mt, with an average of 120 t/ha. The MDF site
had the highest total carbon stock, followed by the DDF and DEF site. The soil carbon content of the
DEF, DF, and PFi sites was higher than their above-ground carbon stock (see Table 7). The DEF site
had the highest density of trees (see Tables 4 and 5). In contrast, as the DF and PFi sites had small
trees, the carbon stock at these sites was primarily in the soil and not in the above-ground trees.
However, the MDF site was covered with large trees and had a lower density of trees than the DEF
site. The soil and above-ground tree carbon stock at the DDF site were approximately the same,
although the DDF site had larger trees than the DEF site; however, the DDF site also had fewer trees
because of poor soil quality and illegal logging.
Table 12. The total carbon stock in Savannakhet Province, Lao People’s Democratic
Republic (PDR).
Land Cover Area (ha) Total (Mt)
DEF 198,932.81 22.78
MDF 624,553.06 151.80
DDF 518,210.50 24.23
DF 270,499.50 14.63
Remote Sens. 2014, 6 5470
Table 12. Cont.
Land Cover Area (ha) Total (Mt)
PFi 308,188.44 17.05
Total 1,920,384.31 230.50
Note: The range is shown in parentheses.
Figure 5. Carbon stock map of Savannakhet area.
4. Conclusions
The results of the study showed a strong statistical relationship between the AGB and Landsat data.
A linear regression analysis indicated that the strongest relationship was between the PFi site and the
RS data, followed by the MDF, DDF, DEF, and DF sites. A significant correlation was found between
the AGB and Landsat data (spectral reflectance, VIs, and elevation). The results of this study showed
that TM7, TM4, SR, RVI, and SAVI were significantly and positively correlated with AGB in
Savannakhet Province. Combinations of variables (e.g., Landsat TM band, VIs, and elevation)
increased the correlations among the PFi, MDF, DF, and AGB, whereas single TM bands were
strongly correlated with the DEF and DDF sites, as well as with the AGB. Given the accuracy of these
estimates, the developed models successfully estimated the AGB for different land-cover types in
Savannakhet Province and could be used to map the AGB in this area in the future.
However, this research mainly focuses on information of forest plot based measurement since forest
stores large amount of carbon rather than other land cover. Therefore, carbon conversion factor of
crop, e.g., paddy should be studied in greater details. Moreover, the factors affecting the reflectance of
Remote Sens. 2014, 6 5471
this area should be studied more in the future including the effect of the undergrowth vegetation on the
canopy reflectance in a continuum of canopy closure. Landsat data have been widely used in the study
of forest due to the long run satellite data with free or low cost. A cost-effective approach would be
very advantage for countries with limited above ground biomass data for developing allometric
equations. However, the aboveground biomass estimation across the landscape can be improved by
incorporating tree height as an additional driving variable using light detection and ranging (LiDAR)
remote sensing technique [16,17].
Acknowledgments
The Greater Mekong Subregion Environment Operations Center (GMS-EOC), Asian Development
Bank (ADB), Thailand funded this research. The authors acknowledge Prasong Thammapala
for his advice and support. We thank the anonymous reviewers, whose comments improved this
paper considerably.
Author Contributions
Phutchard Vicharnakorn, Rajendra P. Shrestha, Masahiko Nagai, Abdul P. Salam,
and
Somboon Kiratiprayoon developed the research concept and methods. Phutchard Vicharnakorn and the
GMS-EOC teams collected and prepared the data. Phutchard Vicharnakorn conducted the research.
Phutchard Vicharnakorn and Prasong Thammapala performed and interpreted the data analyses, which
were then discussed with all of the authors. Phutchard Vicharnakorn wrote the manuscript with
contributions from all of the authors.
Conflicts of Interest
The authors declare no conflict of interest.
References
1. Food and Agriculture Organization of the United Nations (FAO). State of World’s Forest;
Food FAO: Rome, Italy, 2011.
2. Gullison, R.E.; Frumhoff, P.C.; Canadell, J.G.; Field, C.B.; Nepstad, D.C.; Hayhoe, K.; Avissar, R.;
Curran, L.M.; Friedlingstein, P.; Jones, C.D.; et al. Tropical forests and climate policy.
Science 2007, 316, 985–986.
3. Intergovernmental Panel on Climate Change (IPCC). Climate Change 2007: The Physical Science
Basis: Working Group I Contribution to the Fourth Assessment Report of the IPCC;
Cambridge University Press: Cambridge, UK, 2007.
4. Brown, S. Estimating Biomass and Biomass Change of Tropical Forests; FAO Forest Resources
Assessment Publication: Roma, Italy, 1997; p. 55.
5. Achard, F.; Eva, H.D.; Stibig, H.; Mayaux, P.; Gallego, J.; Richards, T.; Malingreau, J.
Determination of deforestation rates of the World’s humid tropical forests. Science 2002, 297,
999–1002.
Remote Sens. 2014, 6 5472
6. Mokany, K.; Raison, J.R.; Prokushkin, A.S. Critical analysis of root-shoot rations in terrestrial
biomes. Glob. Chang. Biol. 2006, 12, 84–96.
7. Houghton, R.A.; Hall, F.; Goetz, S. Importance of biomass in the global carbon cycle. J. Geophys. Res.
2009, 114, 1–13.
8. International Conference on Emergency Medicine (ICEM). Lao PDR National Report on
Protected Areas and Development. In Review of Protected Areas and Development in the Lower
Mekong River Region; ICEM: Indooroopilly, QLD, Australia, 2003; p. 101.
9. Attarchi, S.; Gloaguen, R. Improving of above groud biomass using dual polarimetric PALSAR
and ETM+ data in the Hyrcanian fore tainnuomts (Iran). Remote Sens. 2014, 6, 3693–3715.
10. Maynard, C.L.; Lawrence, R.L.; Nielsen, G.A.; Decker, G. Modeling vegetation amount using
bandwise regression and ecological site descriptions as an alternative to vegetation indices.
GISci. Remote Sens. 2007, 44, 68–81.
11. Main-Knorn, M.; Moisen, G.G.; Healey, S.P.; Keeton, W.S.; Freeman, E.A.; Hostert, P.
Evaluating the remote sensing and inventory-based estimation of biomass in the Western
Carpathians. Remote Sens. 2011, 3, 1427–1446.
12. Neigh, C.S.R.; Bolton, D.K.; Diabate, M.; Williams, J.J.; Carvalhais, N. An automated approach
to map the history of forest disturbance from insect mortality and harvest with Landsat Time-Series
data. Remote Sens. 2014, 6, 2782–2808.
13. Lu, D. The potential and challenge of remote sensing-based biomass estimation. Int. J. Remote Sens.
2006, 27, 1297–1328.
14. Ramankutty, N.; Gibbs, H.K; Achard, F.; DeFries, R.; Foley, J.A.; Houghton, R.A. Challenges to
estimating carbon emissions from tropical deforestation. Glob. Chang. Biol. 2007, 13, 51–66.
15. Somphone, C. Participatory Forest Management: A Research Study in Savannakhet Province, Laos.
In Laos Country Report 2003; Institute for Global Environmental Strategies: Kanagawa, Japan,
2004; pp. 44–45.
16. Kankare, V.; Vastaranta, M.; Holopainen, M.; Raty, M.; Yu, X.; Hyyppa, J.; Hyyppa, H.; Alho, P.;
Viitala, R. Retrieval of forest aboveground biomass and stem volume with airborne scanning
LiDAR. Remote Sens. 2013, 5, 2257–2274.
17. Wannasiri, W.; Masahiko, N.; Kiyoshi, H.; Santitamnont, P.; Miphokasap, P. Extraction of mangrove
biophysical parameters using Airborne LiDAR. Remote Sens. 2013, 5, 1787–1808.
18. Foody, G.M.; Boyd, D.S.; Cutler, M.E.J. Predictive relations of tropical forest biomass from
Landsat TM data and their transferability between regions. Remote Sens. Environ. 2003, 85,
463–474.
19. Kobayashi, S.; Omura, Y.; Sanga-Ngoie, K.; Widyorini, R.; Kawai, S.; Supriadi, B.; Yamaguchi, Y.
Characteristics of decomposition powers of L-band multi-polarimetric SAR in assessing tree
growth of industrial plantation forest in the tropics. Remote Sens. 2012, 4, 3058–3077.
20. Clewley, D.; Lucas, R.; Accad, A.; Armston, J.; Bowen, M.; Dwyer, J.; Pollock, S.; Bunting, P.;
McAlpine, C.; Eyre, T.; et al. An approach to mapping forest growth stages in Queensland,
Australia through Integration of ALOS PALSAR and Landsat sensor data. Remote Sens. 2012, 4,
2236–2255.
Remote Sens. 2014, 6 5473
21. Robinson, C.; Saatchi, S.; Neumann, M.; Gillespipe, T. Impacts of spatial variability on
aboveground biomass estimation from L-band Radar in a temperate forest. Remote Sens. 2013, 5,
1001–1023.
22. Zheng, D.; Rademacher, J.; Chen, J.; Crow, T.; Bresee, M.; Le Moine, J.; Ryu, S.
Estimating aboveground biomass using Landsat 7 ETM+ data across a managed landscape in
Northern Wisconsin, USA. Remote Sens. Environ. 2004, 93, 402–411.
23. Coulibaly, L.; Migolet, P.; Adegbidi, G.H.; Fournier, R.; Hervet, E. Mapping Aboveground Forest
Biomass from IKONOS Satellite Image and Multi-Source Geospatial Data Using Neural
Networks and a Kriging Interpolation. In Proceedings of IEEE International Geoscience and
Remote Sensing Symposium, 2008 (IGARSS 2008), Boston, MA, USA, 7–11 June 2008;
pp. 298–301.
24. Castel, T.; Guerra, F.; Caraglio, Y.; Houllier, F. Retrieval biomass of a large Venezuelan pine
plantation using JERS-1 SAR data. Analysis of forest structure impact on radar signature.
Remote Sens. Environ. 2002, 79, 30–41.
25. Wijaya, A.; Gloaguen, R. Fusion of ALOS Palsar and Landsat ETM Data for Land Cover
Classification and Biomass Modeling Using Non-Linear Methods. In Proceedings of IEEE
International Geoscience and Remote Sensing Symposium, 2009 (IGARSS 2009), Cape Town,
South Africa 12–17 June 2009; pp. 581–584.
26. Anindya, M.K.; Yadavand, N. Applying enhanced k-Nearest neighbor approach on satellite images
for forest biomass estimation of Vellore district. Eng. Sci. Technol. Int. J. 2012, 2, 2250–3498.
27. Terakunpisut, J.; Gajaseni, N.; Ruankawe, N. Carbon sequestration potential in aboveground
biomass of Thong Pha Phum National Forest, Thailand. Appl. Ecol. Environ. Res. 2007, 5,
93–102.
28. Schlerf, M.; Alzberger, C.; Hill, J. Remote sensing of forest biophysical variables using HyMap
imaging spectrometer data. Remote Sens. Environ. 2005, 95, 177–194.
29. Das, S.; Singh, T.P. Correlation analysis between biomass and spectral vegetation indices of
forest ecosystem. Int. J. Eng. Res. Technol. 2012, 1, 1–13.
30. Patel, N.K.; Saxena, R.K.; Shiwalkar, A. Study of fractional vegetation cover using high spectral
resolution data. J. Indian Soc. Remote Sens. 2007, 35, 73–79.
31. Zhang, C.; Franklin, S.E.; Wulder, M.A. Geostatistical and texture analysis of Airborne acquired
images used in forest classification. Int. J. Remote Sens. 2004, 25, 859–865.
32. Samaniego, L.; Schulz, K. Supervised classification of agricultural land cover using a modified
k-NN technique (MNN) and Landsat remote sensing imagery. Remote Sens. 2009, 1, 875–895.
33. Labrecque, S.; Fournier, R.; Luther, J.; Piercy, D. A comparison of four methods to maps biomass
from Landsat-TM and inventory data in western Newfoundland. For. Ecol. Manag. 2006, 226,
129–144.
34. Ohmann, J.L.; Gregory, M.J. Predictive mapping of forest composition and structure with direct
gradient analysis and nearest-neighbor imputation in coastal Oregon, USA. Canadian. J. For. Res.
2002, 32, 725–741.
35. Kamusoko, C.; Aniya, M. Hybrid classification of Landsat data and GIS for land use/cover
change analysis of the Bindura district, Zimbabwe. Int. J. Remote Sens. 2009, 30, 97–115.
Remote Sens. 2014, 6 5474
36. Yuan, F.; Bauer, M.E.; Heinert, N.J.; Holden, G. Multi-level Land Cover Mapping of the Twin
Cities (Minnesota) Metropolitan area with multi-seasonal Landsat TM/ETM+ Data. Geocarto Int.
2005, 20, 5–14.
37. Food and Agriculture Organization of the United Nations (FAO). National Forest Products Statistics,
Lao PDR. In An Overview of Forest Products Statistics in South and Southeast Asia:
Forestry Statistics and Data Collection; FAO: Bangkok, Thailand, 2002; pp. 117–184.
38. Committee for Planning and Cooperation. The National Committee for Poverty Eradication.
In The National Poverty Eradication Programme; Committee for Planning and Cooperation:
Vientiane, Laos, 2003.
39. Tsutsumi, T.; Yoda, K.; Sahunalu, P.; Dhanmanonda, P.; Prachaiyo, B. Chapter 3. Shifting
Cultivation: An Experiment at Nam Phrom, Northeast Thailand and Its Implications for Upland
Farming in the Monsoon Tropics. In Forest: Felling, Burning and Regeneration; Kyoto University:
Kyoto, Japan, 1983; pp. 13–62.
40. Ogawa, H.; Yoda, K.; Ogino, K.; Kira, T. Comparative ecological studies on three main type of
forest vegetation in Thailand II. Plant Biomass Nat. Life Southeast Asia 1965, 4, 49–80.
41. Visaratana, T.; Chernkhuntod, C. Species and above Ground Biomass of Dry Evergreen Forest;
Department of National Park, Wildlife, and Plant Conservation, Kasetsart University: Bangkok,
Thailand, 2004.
42. Suwannapinunt, W. A study on the biomass of Thyrsostachys siamensis GAMBLE forest at
Hin-Lap, Kanchanaburi. J. Bamboo Res. 1983, 2, 82–101.
43. Glumphabutr, P.; Kaitpraneet, S.; Wachrinrat, C. Nutrient dynamics of natural evergreen forests
in the eastern region of Thailand. Kasetsart J. Nat. Sci. 2007, 41, 811–822.
44. Chaiyo, U.; Garivait, S.; Wanthongchai, K. Structure and carbon storage in aboveground biomass
of mixed deciduous forest in western region, Thailand. GMSARN Int. J. 2012, 6, 143–150.
45. Senpaseuth, P.; Navanugraha, C.; Pattanakiat, S. The estimation of carbon storage in dry
evergreen and dry dipterocarp forest in Sang Khom District, Nong Khai province, Thailand.
Environ. Nat. Resour. J. 2009, 7, 1–11.
46. Powers, J.S.; Corre, M.D.; Twine, T.E.; Veldkamp, E. Geographic bias of field observations of
soil carbon stocks with tropical land-use changes precludes spatial extrapolation. Biol. Sci. 2011,
108, 6318–6322.
47. Vagen, T.G.; Winowiecki, L.A. Mapping of soil organic carbon stocks for spatially explicit
assessments of climate change mitigation potential. Environ. Res. Lett. 2013, 8, 1748–1793.
48. Grossman, R.B.; Reinsch, T.G. The Solid Phase: 2.1. In Bulk Density and Linear Extensibility:
Methods of Soil Analysis, Part 4; Soil Science Society of America Madison: Madison, WI, USA,
2002; pp. 201–225.
49. Black, C.A. Hydrogen-ion Activity. In Methods of Soil Analysis Part II: Chemical and
Microbiological Properties; America Society of Agronomy: Madison, WI, USA, 1965; pp. 771–1572.
50. U.S. Geological Survey. Earth Resources Observation and Science Center (EROS). Available
online: http://glovis.usgs.gov/ (accessed on 29 January 2014).
51. Pradhan, R.; Ghose, M.K.; Jeyaram, A. Land cover classification of remotely sensed satellite data
using Bayesian and Hybrid classifier. Int. J. Comput. Appl. 2010, 7, 1–4.
Remote Sens. 2014, 6 5475
52. Bahadur, K. Improving Landsat and IRS image classification: Evaluation of unsupervised and
supervised classification through band ratios and DEM in a mountainous landscape in Nepal.
Remote Sens. 2009, 1, 1257–1272.
53. Lu, D.; Mausel, P.; Brondizio, E.; Moran, E. Assessment of atmospheric correction methods for
Landsat TM data applicable to Amazon basin LBA research. Int. J. Remote Sens. 2002, 23,
2651–2671.
54. Wang, G.; Zhang, M.; Gertner, G.Z.; Oyana, T.; McRoberts, R.E.; Ge, H. Uncertainties of
mapping aboveground forest carbon due to plot locations using national forest inventory plot and
remotely sensed data. Scand. J. For. Res. 2011, 26, 360–373.
55. Powell, S.L.; Cohen, W.B.; Healey, S.P.; Kennedy, R.E.; Gretchen, G.M.; Pierce, K.B.;
Ohmann, J.L. Quantification of live aboveground forest biomass dynamics with Landsat time-series
and field inventory data: A comparison of empirical modeling approaches. Remote Sens. Environ.
2010, 114, 053–1068.
56. Piao, S.L.; Fang, J.Y.; Zhou, L.M.; Tan, K.; Tao, S. Changes in biomass carbon stocks in China’s
grasslands between 1982 and 1999. Glob. Biogeochem. Cycles 2007, 21, 1–10.
57. Richardson, A.J.; Wiegand, C.L. Distinguishing vegetation from soil background information.
Photogramm. Eng. Remote Sens. 1977, 43, 1541–1552.
58. Huete, A.R. A soil-adjusted vegetation index (SAVI). Remote Sens. Environ. 1988, 25, 295–309.
59. Crist, E.P. A TM tasseled cap equivalent transformation for reflectance factor data.
Remote Sens. Environ. 1985, 17, 301−306.
60. Healey, S.P.; Cohen, W.B.; Yang, Z.; and Krankina, O.N. Comparison of Tasseled Cap-based
Landsat data structures for forest disturbance detection. Remote Sens. Environ 2005, 97, 301−310.
61. Tucker, C.J. Red and photographic infrared linear combinations for monitoring vegetation.
Remote Sens. Environ. 1979, 8, 127–150.
62. Pearson, R.L.; Miller, D.L. Remote Mapping of Standing Crop Biomass for Estimation of the
Productivity of the Short-Grass Prairie, Pawnee National Grassland, Colorado. In Proceedings of
the Eighth International Symposium on Remote Sensing of Environment, Michigan, MI, USA,
2–6 October 1972; pp. 1357–1381.
63. Pinty, B.; Verstraete, M.M. GEMI: A non-linear index to monitor global vegetation from satellites.
Vegetation 1992, 101, 15–20.
64. Huete, A.; Keita, F.; Thome, K.; Privette, J.; Van Leeuwen, W.J.D.; Justice, C.; Morisette, J.A.
Light aircraft radiometric package for MODLAND Quick Airborne Looks (MQUALS).
Earth Obs. 1999, 11, 22–25.
65. Crist, E.P.; Laurin, R.; Cicone, R.C. Vegetation and Soils Information Contained in Transformed
Thematic Mapper Data. In Proceedings of 1986 International Geoscience and Remote Sensing
Symposium (IGARSS’ 86) on Remote Sensing, Zurich, Switzerland, 8–11 September 1986;
pp. 1465–1470.
66. Cohen, W.B.; Goward, S.N. Landsat’s role in ecological applications of remote sensing.
Bioscience 2004, 54, 535−545.
67. Forestry Department Food and Agriculture Organization of the United Nations (FRA). Global
Forest Resources Assessment 2010 Country Report Lao People’s Democratic Republic;
Forestry FRA: Rome, Italy, 2010.
Remote Sens. 2014, 6 5476
68. Kang, M.N. Forest Cover and Carbon Mapping in the Greater Mekong Subregion and Malaysia;
The Third Progress Workshop: Beijing, China, 2013.
69. Petsri, S.; Pumijumnong, N. Aboveground carbon content in mixed deciduous forest and teak
plantation. Environ. Natl. Resour. J. 2007, 5, 1–10.
70. Homchan, C.; Khamyong, S.; Anongrak, N. Plant Diversity and Biomass Carbon Storage in a Dry
Dipterocarp Forest with Planted Bamboos at Huai Hong Krai Royal Development Study Center,
Chiang Mai Province. In Proceedings of the International Graduate Research Conference,
Chiang Mai University, Chiang Mai, Thailand, 20 December 2013.
71. Reduced Emissions from Deforestation and Forest Degradation. REDD Concept Note,
Biodiversity Corridor VietNam ADBR-PPTA 7459: GMS Biodiversity Conservation Corridors;
National University of Laos: Laos, Vientiane, Thailand, 2010.
72. Janmahasatien, S.; Phopinit, S.; Wichiennopparat, W. Soil Carbon in the Sakaerat Dry Evergreen
Forest and the Maeklong Mixed Deciduous Forest; Department of National Parks, Wildlife, and
Plant Conservation: Bangkok, Thailand, 2007.
Appendix
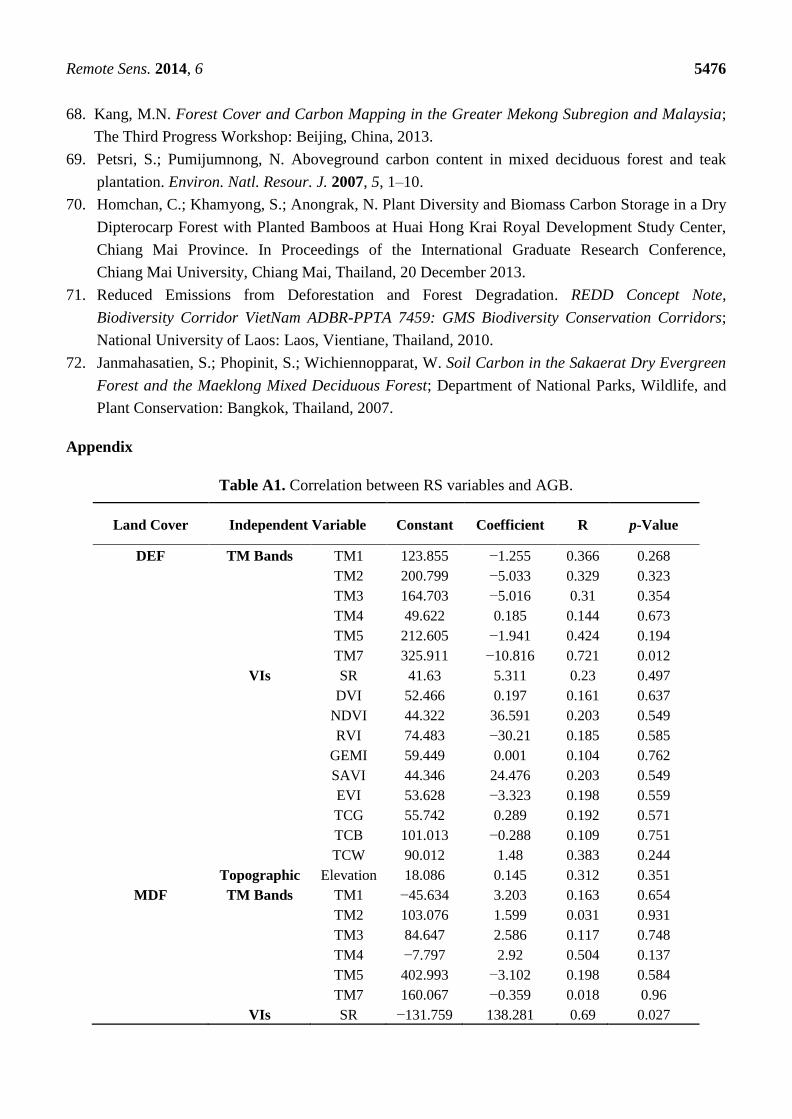
Table A1. Correlation between RS variables and AGB.
Land Cover Independent Variable Constant Coefficient R p-Value
DEF TM Bands TM1 123.855 −1.255 0.366 0.268
TM2 200.799 −5.033 0.329 0.323
TM3 164.703 −5.016 0.31 0.354
TM4 49.622 0.185 0.144 0.673
TM5 212.605 −1.941 0.424 0.194
TM7 325.911 −10.816 0.721 0.012
VIs SR 41.63 5.311 0.23 0.497
DVI 52.466 0.197 0.161 0.637
NDVI 44.322 36.591 0.203 0.549
RVI 74.483 −30.21 0.185 0.585
GEMI 59.449 0.001 0.104 0.762
SAVI 44.346 24.476 0.203 0.549
EVI 53.628 −3.323 0.198 0.559
TCG 55.742 0.289 0.192 0.571
TCB 101.013 −0.288 0.109 0.751
TCW 90.012 1.48 0.383 0.244
Topographic Elevation 18.086 0.145 0.312 0.351
MDF TM Bands TM1 −45.634 3.203 0.163 0.654
TM2 103.076 1.599 0.031 0.931
TM3 84.647 2.586 0.117 0.748
TM4 −7.797 2.92 0.504 0.137
TM5 402.993 −3.102 0.198 0.584
TM7 160.067 −0.359 0.018 0.96
VIs SR −131.759 138.281 0.69 0.027
Remote Sens. 2014, 6 5477
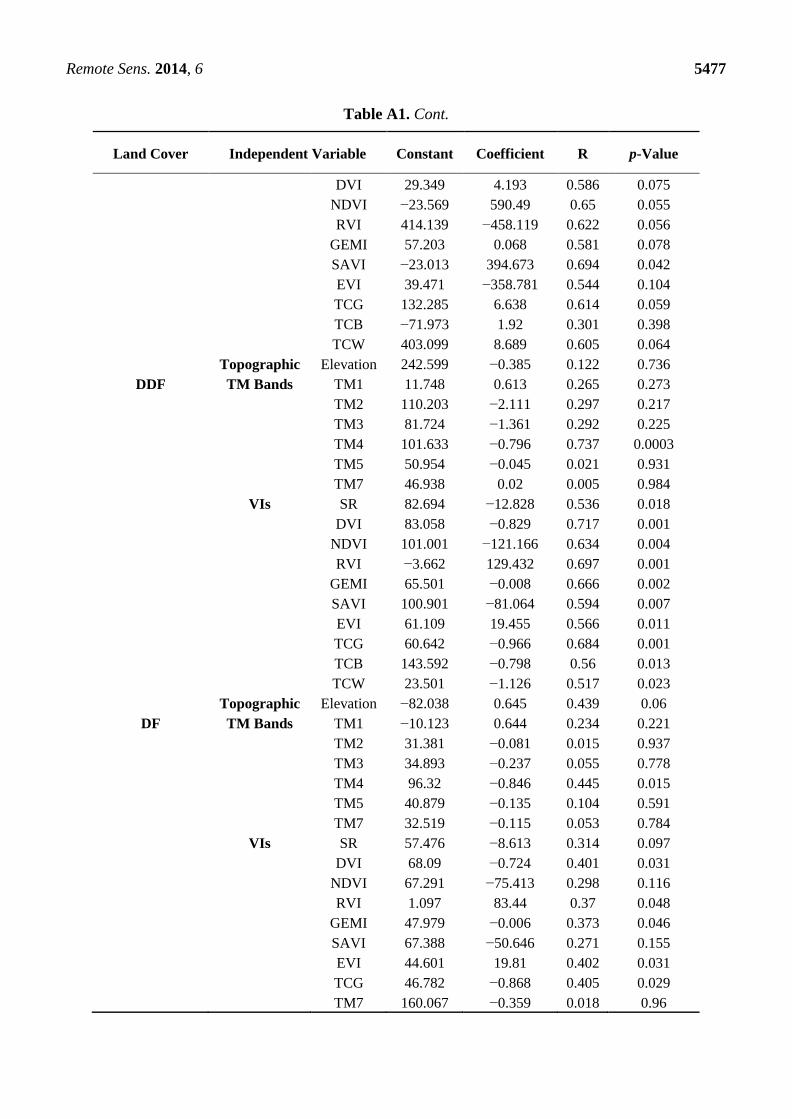
Table A1. Cont.
Land Cover Independent Variable Constant Coefficient R p-Value
DVI 29.349 4.193 0.586 0.075
NDVI −23.569 590.49 0.65 0.055
RVI 414.139 −458.119 0.622 0.056
GEMI 57.203 0.068 0.581 0.078
SAVI −23.013 394.673 0.694 0.042
EVI 39.471 −358.781 0.544 0.104
TCG 132.285 6.638 0.614 0.059
TCB −71.973 1.92 0.301 0.398
TCW 403.099 8.689 0.605 0.064
Topographic Elevation 242.599 −0.385 0.122 0.736
DDF TM Bands TM1 11.748 0.613 0.265 0.273
TM2 110.203 −2.111 0.297 0.217
TM3 81.724 −1.361 0.292 0.225
TM4 101.633 −0.796 0.737 0.0003
TM5 50.954 −0.045 0.021 0.931
TM7 46.938 0.02 0.005 0.984
VIs SR 82.694 −12.828 0.536 0.018
DVI 83.058 −0.829 0.717 0.001
NDVI 101.001 −121.166 0.634 0.004
RVI −3.662 129.432 0.697 0.001
GEMI 65.501 −0.008 0.666 0.002
SAVI 100.901 −81.064 0.594 0.007
EVI 61.109 19.455 0.566 0.011
TCG 60.642 −0.966 0.684 0.001
TCB 143.592 −0.798 0.56 0.013
TCW 23.501 −1.126 0.517 0.023
Topographic Elevation −82.038 0.645 0.439 0.06
DF TM Bands TM1 −10.123 0.644 0.234 0.221
TM2 31.381 −0.081 0.015 0.937
TM3 34.893 −0.237 0.055 0.778
TM4 96.32 −0.846 0.445 0.015
TM5 40.879 −0.135 0.104 0.591
TM7 32.519 −0.115 0.053 0.784
VIs SR 57.476 −8.613 0.314 0.097
DVI 68.09 −0.724 0.401 0.031
NDVI 67.291 −75.413 0.298 0.116
RVI 1.097 83.44 0.37 0.048
GEMI 47.979 −0.006 0.373 0.046
SAVI 67.388 −50.646 0.271 0.155
EVI 44.601 19.81 0.402 0.031
TCG 46.782 −0.868 0.405 0.029
TM7 160.067 −0.359 0.018 0.96
Remote Sens. 2014, 6 5478
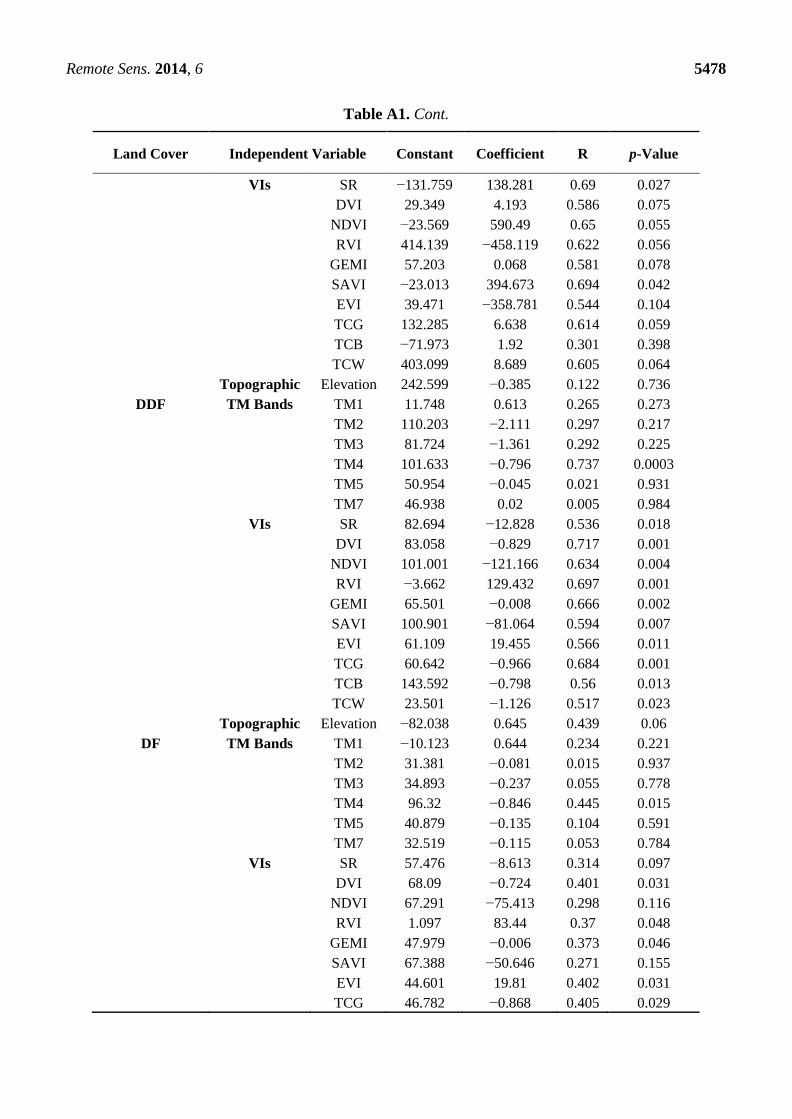
Table A1. Cont.
Land Cover Independent Variable Constant Coefficient R p-Value
VIs SR −131.759 138.281 0.69 0.027
DVI 29.349 4.193 0.586 0.075
NDVI −23.569 590.49 0.65 0.055
RVI 414.139 −458.119 0.622 0.056
GEMI 57.203 0.068 0.581 0.078
SAVI −23.013 394.673 0.694 0.042
EVI 39.471 −358.781 0.544 0.104
TCG 132.285 6.638 0.614 0.059
TCB −71.973 1.92 0.301 0.398
TCW 403.099 8.689 0.605 0.064
Topographic Elevation 242.599 −0.385 0.122 0.736
DDF TM Bands TM1 11.748 0.613 0.265 0.273
TM2 110.203 −2.111 0.297 0.217
TM3 81.724 −1.361 0.292 0.225
TM4 101.633 −0.796 0.737 0.0003
TM5 50.954 −0.045 0.021 0.931
TM7 46.938 0.02 0.005 0.984
VIs SR 82.694 −12.828 0.536 0.018
DVI 83.058 −0.829 0.717 0.001
NDVI 101.001 −121.166 0.634 0.004
RVI −3.662 129.432 0.697 0.001
GEMI 65.501 −0.008 0.666 0.002
SAVI 100.901 −81.064 0.594 0.007
EVI 61.109 19.455 0.566 0.011
TCG 60.642 −0.966 0.684 0.001
TCB 143.592 −0.798 0.56 0.013
TCW 23.501 −1.126 0.517 0.023
Topographic Elevation −82.038 0.645 0.439 0.06
DF TM Bands TM1 −10.123 0.644 0.234 0.221
TM2 31.381 −0.081 0.015 0.937
TM3 34.893 −0.237 0.055 0.778
TM4 96.32 −0.846 0.445 0.015
TM5 40.879 −0.135 0.104 0.591
TM7 32.519 −0.115 0.053 0.784
VIs SR 57.476 −8.613 0.314 0.097
DVI 68.09 −0.724 0.401 0.031
NDVI 67.291 −75.413 0.298 0.116
RVI 1.097 83.44 0.37 0.048
GEMI 47.979 −0.006 0.373 0.046
SAVI 67.388 −50.646 0.271 0.155
EVI 44.601 19.81 0.402 0.031
TCG 46.782 −0.868 0.405 0.029
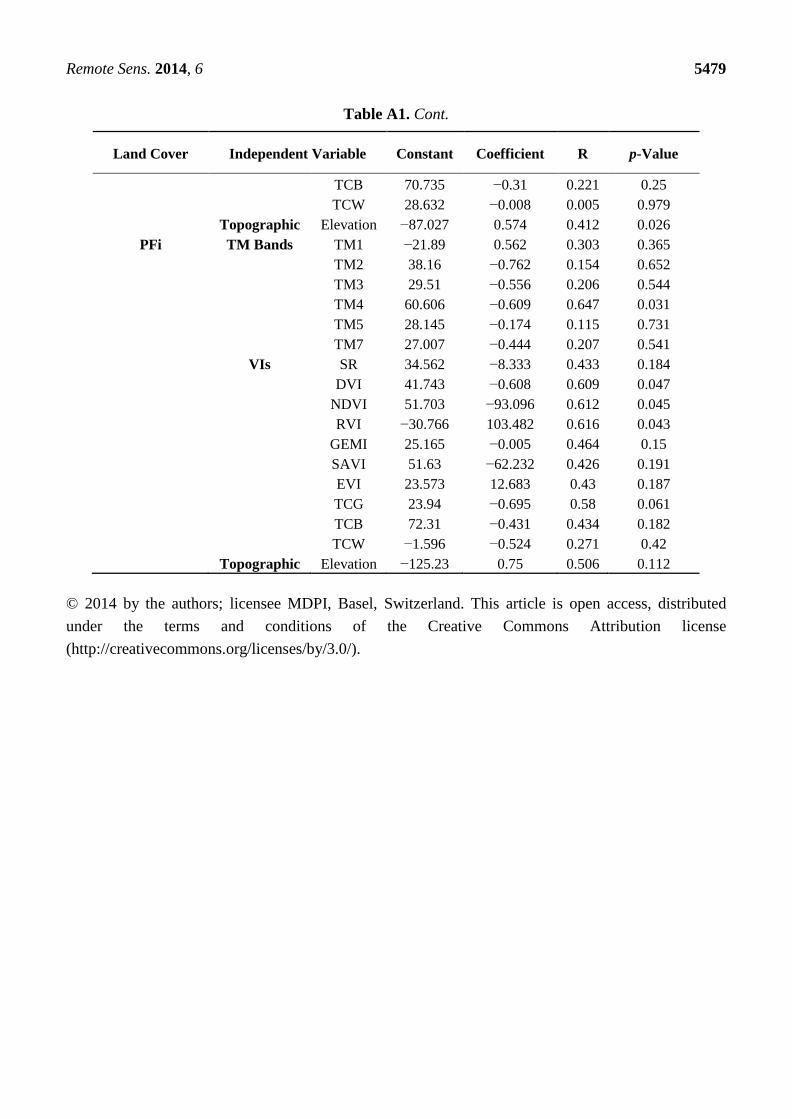
Remote Sens. 2014, 6 5479
Table A1. Cont.
Land Cover Independent Variable Constant Coefficient R p-Value
TCB 70.735 −0.31 0.221 0.25
TCW 28.632 −0.008 0.005 0.979
Topographic Elevation −87.027 0.574 0.412 0.026
PFi TM Bands TM1 −21.89 0.562 0.303 0.365
TM2 38.16 −0.762 0.154 0.652
TM3 29.51 −0.556 0.206 0.544
TM4 60.606 −0.609 0.647 0.031
TM5 28.145 −0.174 0.115 0.731
TM7 27.007 −0.444 0.207 0.541
VIs SR 34.562 −8.333 0.433 0.184
DVI 41.743 −0.608 0.609 0.047
NDVI 51.703 −93.096 0.612 0.045
RVI −30.766 103.482 0.616 0.043
GEMI 25.165 −0.005 0.464 0.15
SAVI 51.63 −62.232 0.426 0.191
EVI 23.573 12.683 0.43 0.187
TCG 23.94 −0.695 0.58 0.061
TCB 72.31 −0.431 0.434 0.182
TCW −1.596 −0.524 0.271 0.42
Topographic Elevation −125.23 0.75 0.506 0.112
© 2014 by the authors; licensee MDPI, Basel, Switzerland. This article is open access, distributed
under the terms and conditions of the Creative Commons Attribution license
(http://creativecommons.org/licenses/by/3.0/).
Related Documents


