1

Welcome message from author
This document is posted to help you gain knowledge. Please leave a comment to let me know what you think about it! Share it to your friends and learn new things together.
Transcript

1
2
Presented by
RangeGowda .R
I Ph.D (Agril. Economics)
UAS ,GKVK
Bengaluru
Factor analysis is an interdependence technique in that an entire set of interdependent relationships is examined.
Factor Analysis: a statistical technique used to,
1. Estimate factors variables
2. Reduce the dimensionality of a large number of variables to a fewer number of factors.
o Helps in Data Summarization and Reduction
Introduction
3

Applications of factor analysis in marketing research
Market segmentation
Product research
Advertising studies
Pricing studies
4
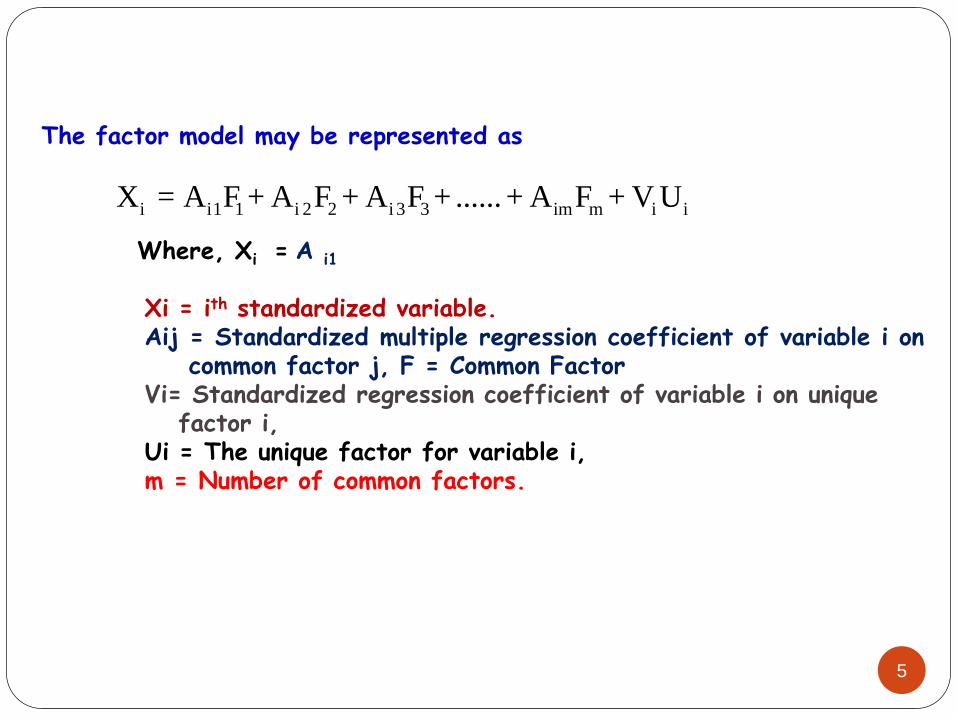
The factor model may be represented as
Where, Xi = A i1
Xi = ith standardized variable.Aij = Standardized multiple regression coefficient of variable i on
common factor j, F = Common FactorVi= Standardized regression coefficient of variable i on unique
factor i,Ui = The unique factor for variable i,m = Number of common factors.
i i1 1 i 2 2 i 3 3 im m i iX = A F + A F + A F + ...... + A F + V U
5
Assumptions in Factor analysis
Observed variables should be linear combinations.
Some underlying structure does exist in the set of selectedvariables
Sample is homogenous
variables should be normality, homoscedasticity and linearityapply only to the extent that they diminish the observedcorrelations
6

Steps in factor analysis
Formulate the problem
Construct the correlation matrix
Determine the method of factor analysis.
Determine the number of factors
Estimate the factor matrix
Rotate the factors
Estimating practical significance 7

Steps in factor analysis
Formulate the problem
The variables to be included in the factor analysis should be specified
Variables should be appropriately measured on an interval or ratio scale
8

Construct the correlation matrix
The variables must be correlated
Formal statistics are available for testing appropriateness of the factor model, they are
Bartlett’s test
1. Chi-square transformation of the determinant of thecorrelation matrix
Kaiser- Meyer-Olkin (KMO) measure of sampling adequacy
9

10
Kaiser- Meyer-Olkin (KMO) measure of sampling adequacy
o Ranges between 0 and 1o Value greater than 0.5 is desirable
oThe measure can be interpreted with the following guidelines:
0.8 or above- admirable0.7 or above –medium 0.6 or above-moderate0.5 or above- miserable or negligibleBelow 0.5-unacceptable
o Values above 0.5 for either the entire matrix or an individual variable indicate appropriateness
There are two approaches to factor analysis
1. Principal component analysis and
2. Common factor analysis
11

The total variance of any variable can be divided into three types of variance
• Common varianceIs defined as that variance in a variable that is shared
with all other variables in the analysis
• Specific variance- Unique variancevariance associated with only a specific variable
• Error varianceUnreliable variation in a variable
12

The selection of one of the method over the other is based on two criteria
• The objectives of the factor analysis
• The amount of prior knowledge about the variance in the variables
13

Determine the number of factors
a. Apriori determination : Based on prior knowledge
b. Determination based on eigen values
o Only factors with eigen value greater than 1.0are retained
o All factors which less than 1 are considered
insignificant
14

Based on significance tests
• Statistical significance of the separateeigen values
• Retain only those factors that arestatistically significant
• When sample size is large many will havesignificant values
15
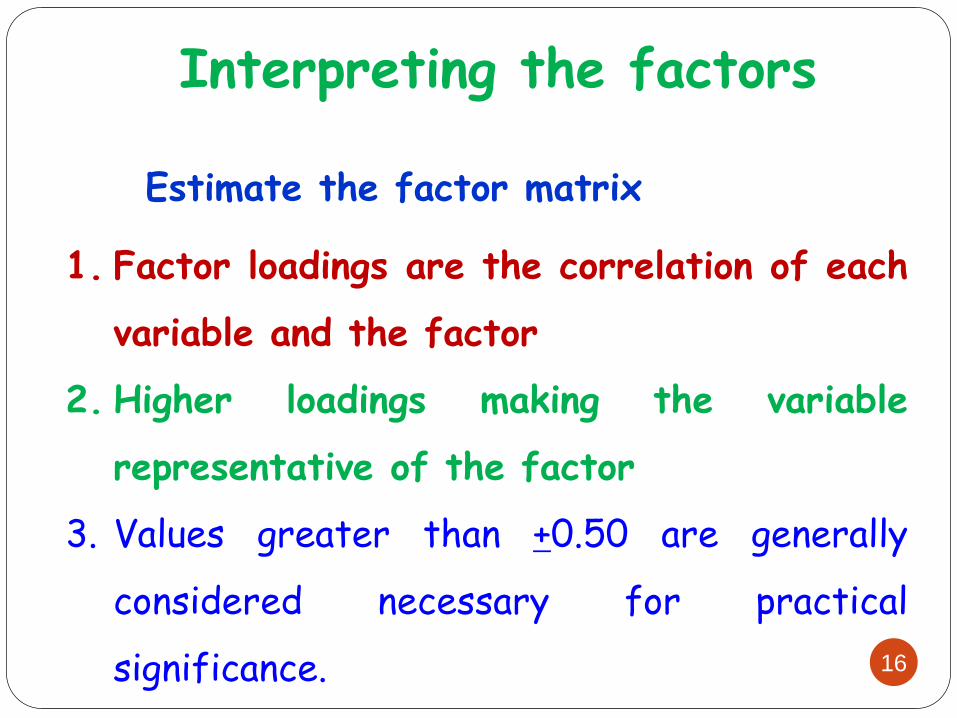
Interpreting the factors
Estimate the factor matrix
1. Factor loadings are the correlation of each
variable and the factor
2. Higher loadings making the variable
representative of the factor
3. Values greater than +0.50 are generally
considered necessary for practical
significance. 16

Case Study-I
Supply Chain Management of Organic Products in Karnataka
Gayatri, Y.P., (2007)
17

o Studied the Factors influencing the consumer
preference for organic products
o Author has selected randomly 50 respondents from
four outlets
o Factors influencing the purchase of organic products
are examined with the help of factor analysis
18

A total of twenty variables are considered encompassing different aspects of organic products VariablesOrganic food is more tastierIt is free of pesticide residuesIt is safe food for children and sickIt is nutritiousOrganic fruits and vegetables are larger than the conventional onesIt is less attractive than the conventional produceIt is eco-friendlyIt stays more fresh It can be stored for long periodHealth benefitsConsumers fall sick less oftenOrganic fruits are more sweeterProduced without using chemicalsIts high price confers better qualityIt is certifiedCertification is a quality assuranceNo genuinity between labeled & non-labeledFree from blemishesMeant for only high end users Organic consumption is status symbol
19

Variables
Factor Loadings
Factor 1 Factor 2 Factor 3
Organic food is more tastier 0.839 0.022 -0.147
It is free of pesticide residues 0.780 -0.095 0.200
It is safe food for children and sick 0.688 -0.335 0.264
It is nutritious 0.705 -0.186 -0.248
Organic fruits and vegetables are larger than the
conventional ones
-0.672 0.150 -0.247
It is less attractive than the conventional produce 0.079 0.114 -0.047
It is eco-friendly 0.007 -0.158 0.713
It stays more fresh 0.969 -0.094 -0.214
It can be stored for long period 0.874 -0.195 -0.037
Health benefits 0.382 -0.167 -0.130
Consumers fall sick less often 0.551 -0.385 0.245
Organic fruits are more sweeter 0.144 0.137 0.202
Produced without using chemicals -0.020 0.459 -0.078
Its high price confers better quality 0.224 0.036 -0.009
It is certified -0.557 0.346 -0.005
Certification is a quality assurance -0.291 -0.066 -0.123
No genuinity between labeled & non-labeled -0.221 -0.222 0.121
Free from blemishes -0.005 0.020 -0.251
Meant for only high end users -0.297 0.766 0.116
Organic consumption is status symbol 0.100 0.607 -0.061
Rotated factor Matrix
Source: Gayatri, 2007 20
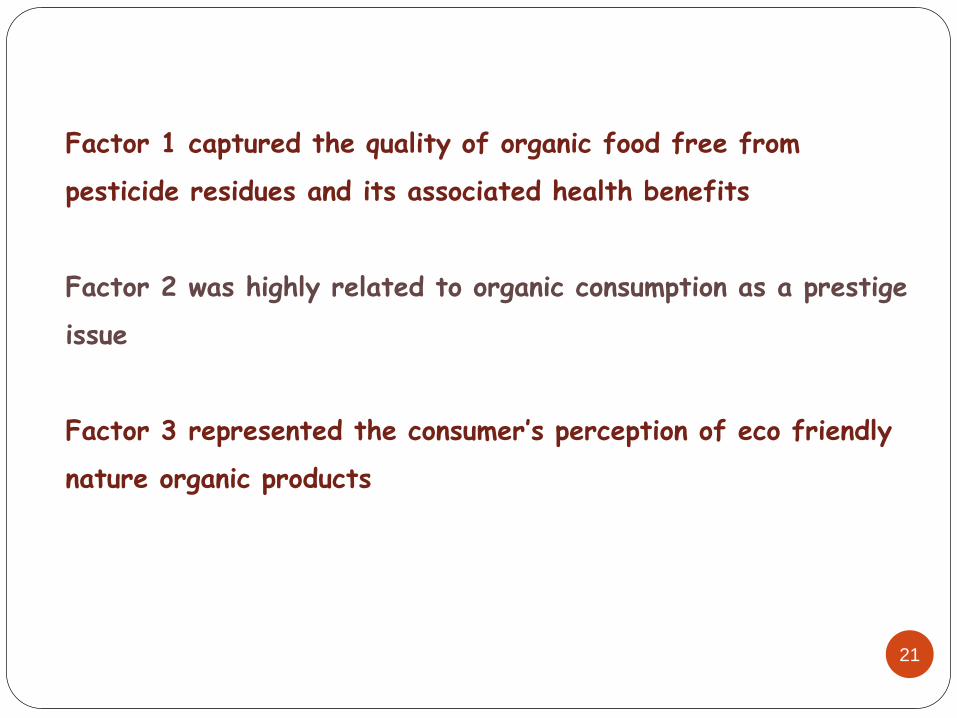
Factor 1 captured the quality of organic food free from
pesticide residues and its associated health benefits
Factor 2 was highly related to organic consumption as a prestige
issue
Factor 3 represented the consumer’s perception of eco friendly
nature organic products
21

Sl.no
FactorsEigenvalues
% ofvariance
Cumulativevariance
1 Health benefits andpesticide free food
7.078 35.38 35.38
2 Prestige symbol 1.747 8.73 44.12
3 Eco-friendly natureof organic products
1.547 7.73 51.85
4Production withoutfertilizers
0.902 4.51 56.36
5 Price 0.770 3.84 60.21
Table 14: Total Variance Explained by Factor Analysis
Source: Gayatri, 2007 22
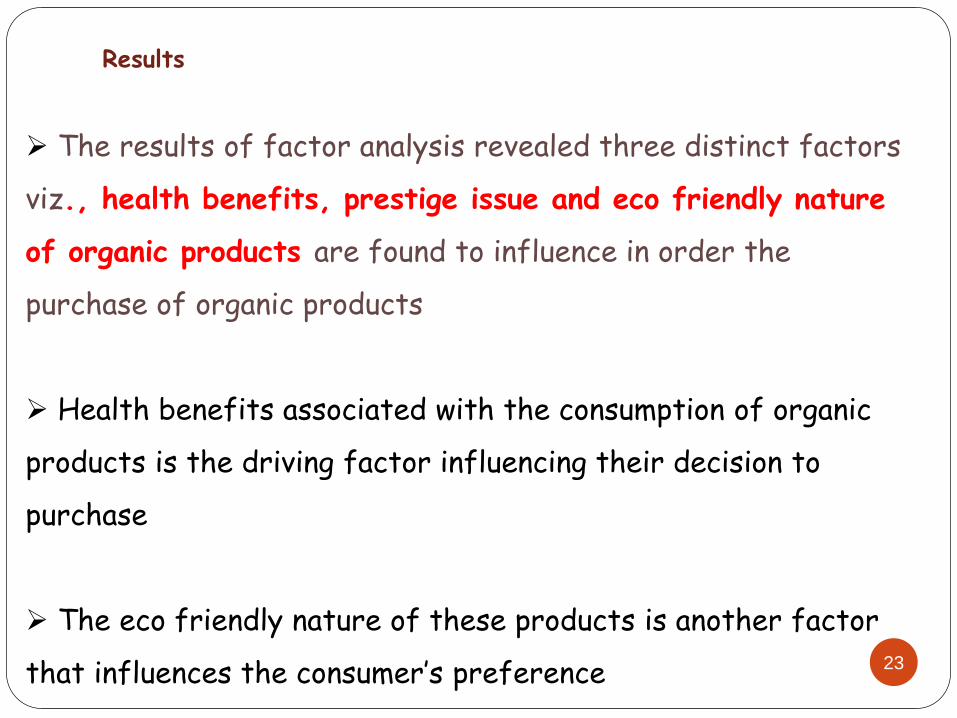
The results of factor analysis revealed three distinct factors
viz., health benefits, prestige issue and eco friendly nature
of organic products are found to influence in order the
purchase of organic products
Health benefits associated with the consumption of organic
products is the driving factor influencing their decision to
purchase
The eco friendly nature of these products is another factor
that influences the consumer’s preference
Results
23

24
Conclusions
1. It provides the researcher to Data Summarization and
Reduction
2. The general purpose of factor analysis techniques is to
summarize the information
3. This requires large sample size and if the measurement
variables are in ratio scale we can get very good results
4. Factors scores calculated from this analysis can be used in
subsequent multivariate analysis
5. This can be used in market research (consumer preference)

Related Documents


