FACT SHEET October 2021

Welcome message from author
This document is posted to help you gain knowledge. Please leave a comment to let me know what you think about it! Share it to your friends and learn new things together.
Transcript

FACT SHEETOctober 2021
Index
Page No.
From the CEO’s desk 3
Market Review 4
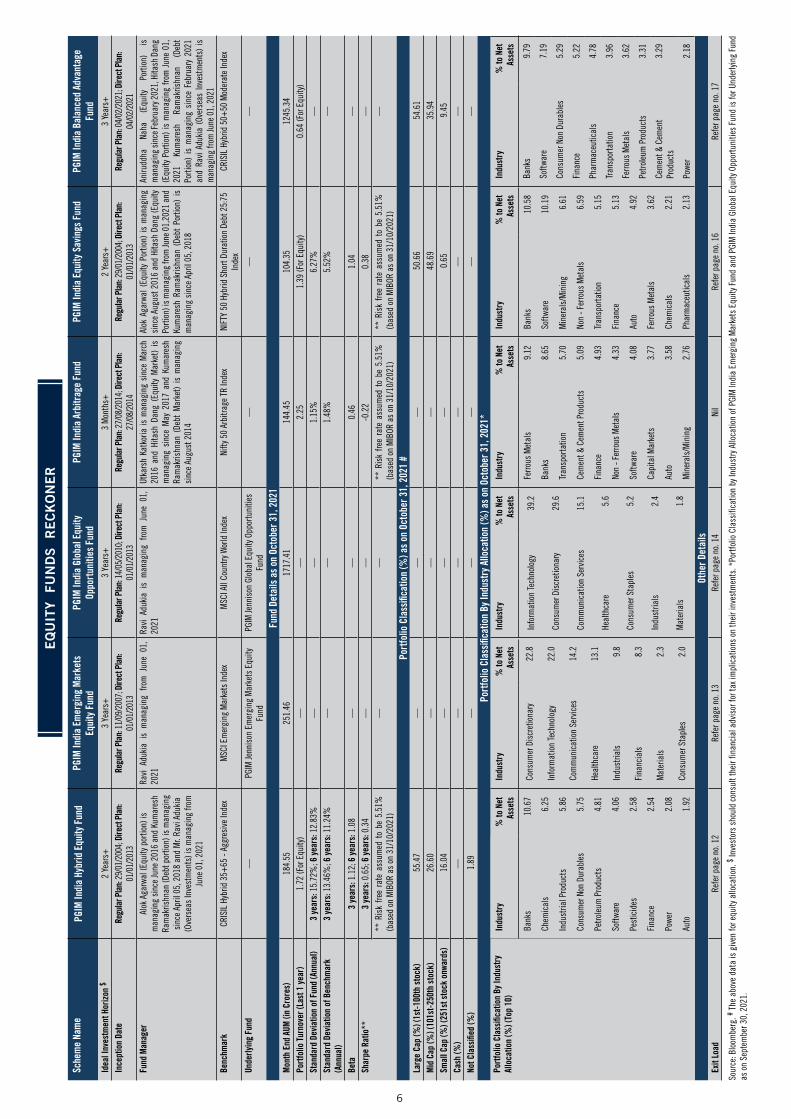
Snapshot of Equity Funds Reckoner 5
PGIM India Large Cap Fund (Large Cap Fund - An open ended equity scheme predominantly investing in large cap stocks)
7
PGIM India Flexi Cap Fund (Earlier known as PGIM India Diversified Equity Fund) (Flexi Cap Fund - An open ended dynamic equity scheme investing across large cap, mid cap, small cap stocks)
8
PGIM India Midcap Opportunities Fund (Mid Cap Fund- An open ended equity scheme predominantly investing in mid cap stocks)
9
PGIM India Small Cap Fund(An open-ended equity scheme predominantly investing in small cap stocks)
10
PGIM India Long Term Equity Fund (An Open Ended Equity Linked Savings Scheme with a statutory lock-in of 3 years and tax benefit)
11
PGIM India Hybrid Equity Fund (An open ended hybrid scheme investing predominantly in equity and equity related instruments)
12
PGIM India Emerging Markets Equity Fund (Earlier known as PGIM India Euro Equity Fund) (An open ended equity fund of fund scheme investing in PGIM Jennison Emerging Markets Equity Fund)
13
PGIM India Global Equity Opportunities Fund(An open ended equity fund of fund scheme investing in PGIM Jennison Global Equity Opportunities Fund)
14
PGIM India Arbitrage Fund (An open ended scheme investing in arbitrage opportunities)
15
PGIM India Equity Savings Fund(An Open Ended Scheme investing in equity, arbitrage and debt)
16
PGIM India Balanced Advantage Fund(An open ended dynamic asset allocation fund)
17
Snapshot of Debt Funds Reckoner 18
PGIM India Overnight Fund (An open ended debt scheme investing in overnight securities)
20
PGIM India Insta Cash Fund(An Open Ended Liquid Scheme)
21
PGIM India Ultra Short Term Fund (An open ended ultra-short term debt scheme investing in instruments such that the Macaulay duration of the portfolio is between 3 months to 6 months)
22
PGIM India Money Market Fund (An open ended debt scheme investing in money market instruments)
23
PGIM India Low Duration Fund (An open ended low duration debt scheme investing in instruments such that the Macaulay duration of the portfolio is between 6 months to 12 months)
24
PGIM India Short Maturity Fund (An open ended short term debt scheme investing in instruments such that the Macaulay duration of the portfolio is between 1 year to 3 years)
25
PGIM India Banking and PSU Debt Fund (An open ended debt scheme predominantly investing in Debt instruments of banks, Public Sector Undertakings, Public Financial Institutions and Municipal Bonds)
26
PGIM India Credit Risk Fund (Number of Segregated Portfolio 1)(An open ended debt scheme predominantly investing in AA and below rated corporate bonds (excluding AA+ rated corporate bonds))
27
PGIM India Dynamic Bond Fund (An open ended dynamic debt scheme investing across duration)
28
PGIM India Premier Bond Fund (An open ended debt scheme predominantly investing in AA+ and above rated corporate bonds)
29
PGIM India Gilt Fund (An open ended debt scheme investing in government securities across maturities)
30
Performance of Other Funds 31
SIP Performance 32
How to read the Factsheet 33
3
Dear Investors and Partners,
Happy Diwali and a Prosperous New Year.
As we start the new year, the trends that are keeping us excited here at PGIM India is the Real Estate story and the fact that we have been able to successfully bring a product proposition for Indian investors which is unique and can provide you access to a different asset class altogether within the mutual fund space. The PGIM India Global Select Real Estate Securities Fund of Fund (FoF) opens for subscription on 15th November 2021 and closes on 29th November 2021. When we think of the Real Estate investment opportunity, most of us are inclined to think in traditional terms of physical Residential or Commercial property. The option to participate in this asset class which retains the characteristics of physical property but also brings forth the benefit of a mutual fund structure is a very exciting one.
The effects of a global pandemic is now receding and economies around the world are recovering fast. Some sub-sector within the real estate has seen a disruption due to Covid 19 and some of the shift in behaviour may prove to be useful for demand in the long term. Any disruption historically for e.g. new technology, has been mostly about consumer choice for saving time. Any new technology which provide convenience and can shape human behaviour and has a greater chance of being a success. As an investor it is imperative to recognize these disruptions and shift in consumer behaviour to lead us to investment choices which have the potential to generate above average returns.
Real Estate is also in a disruption of sorts, wherein on one hand we have the after-effects of the pandemic and on the other hand there are new opportunities, but at the heart of this disruption is the same underlying theme of change in behaviour, which leads me to believe that we are on the cusp of a new cycle in real estate. A case in point is the shift in how companies are thinking of procuring materials and the supply chain may shift from just-in-time to just-in-case. This has long term ramifications in terms of demand for space and storage, which may include specialized facilities as well. However in the past, we have seen that to capitalize on any such disruptive opportunities, one needs to have that information edge, as initial innovation can be replicated fast and challengers may arrive on the scene. Fortunately within the PGIM group, we have deep expertise and specialized knowledge of global real estate through PGIM Real Estate team located all over the globe.
I started off by saying that traditional way of investing in physical real estate is changing and new innovations are emerging. Another traditional area which I think is seeing a rethink is the 60/40 portfolio mix of stocks and bonds for the long term. A global Real Estate FoF can help in diversifying further and adds another element for asset allocation strategies. Apart from growth and income considerations, the modern day portfolios needs to be build taking into account higher inflationary expectations going forward and probably higher interest rates as well. Real Estate historically have been a beneficiary in such environment.
To summarize a Global Real Estate FoF provides an unique opportunity for Indian investor, which is a combination of providing access in a hitherto asset class which was unaffordable for most and also provides diversification opportunities both in terms of asset class as well as geographical and currency diversification. Just what a smart portfolio needs in today’s world.
Stay safe & happy investing.
A crisis brings opportunities too
Ajit MenonCEO
From the CEO’s desk
4
Source: RBI & BloombergThe views of the Fund Manager should not be construed as an advice and investors must make their own investment decisions regarding investment/disinvestment in securities market and/or suitability of the funds based on their specific investment objectives and financial positions and using such independent advisors as they believe necessary. None of the information contained in this document shall be constituted as a recommendation to buy or sell any particular security. Mutual Fund investments are subject to market risks, read all scheme related documents carefully.
Equity Market
Market Review Details as on October 31, 2021
The market that was
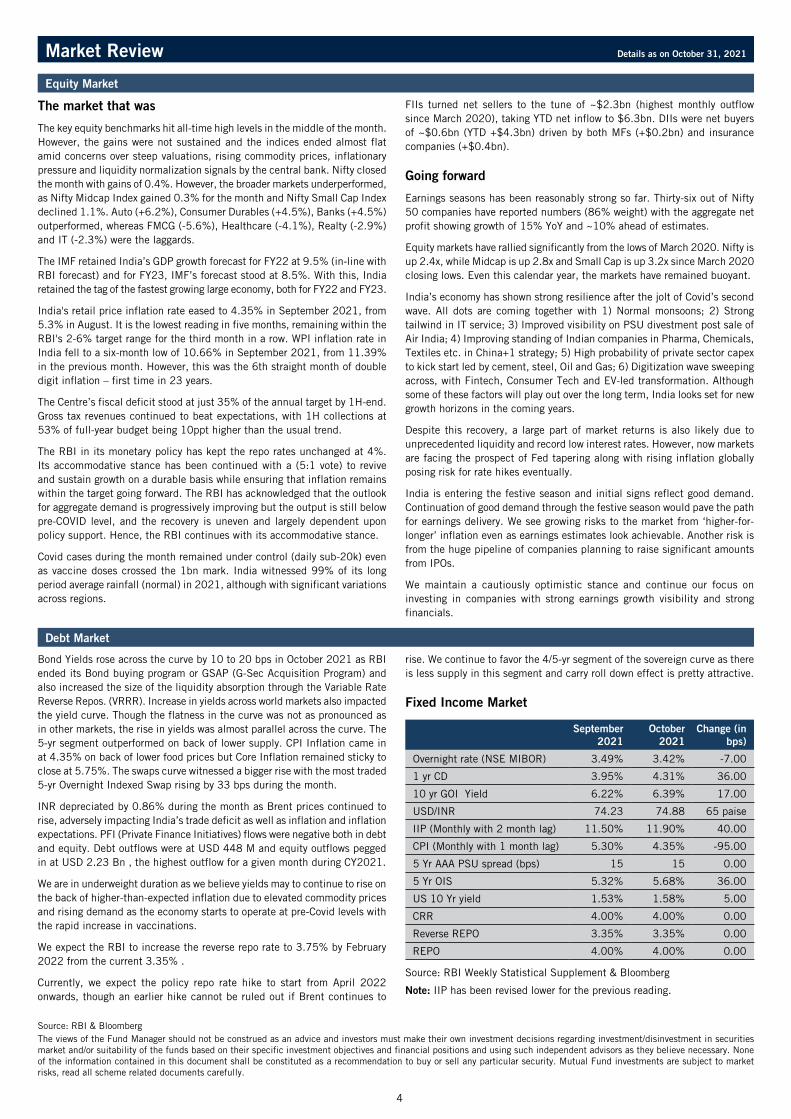
The key equity benchmarks hit all-time high levels in the middle of the month. However, the gains were not sustained and the indices ended almost flat amid concerns over steep valuations, rising commodity prices, inflationary pressure and liquidity normalization signals by the central bank. Nifty closed the month with gains of 0.4%. However, the broader markets underperformed, as Nifty Midcap Index gained 0.3% for the month and Nifty Small Cap Index declined 1.1%. Auto (+6.2%), Consumer Durables (+4.5%), Banks (+4.5%) outperformed, whereas FMCG (-5.6%), Healthcare (-4.1%), Realty (-2.9%) and IT (-2.3%) were the laggards.
The IMF retained India’s GDP growth forecast for FY22 at 9.5% (in-line with RBI forecast) and for FY23, IMF’s forecast stood at 8.5%. With this, India retained the tag of the fastest growing large economy, both for FY22 and FY23.
India's retail price inflation rate eased to 4.35% in September 2021, from 5.3% in August. It is the lowest reading in five months, remaining within the RBI's 2-6% target range for the third month in a row. WPI inflation rate in India fell to a six-month low of 10.66% in September 2021, from 11.39% in the previous month. However, this was the 6th straight month of double digit inflation – first time in 23 years.
The Centre’s fiscal deficit stood at just 35% of the annual target by 1H-end. Gross tax revenues continued to beat expectations, with 1H collections at 53% of full-year budget being 10ppt higher than the usual trend.
The RBI in its monetary policy has kept the repo rates unchanged at 4%. Its accommodative stance has been continued with a (5:1 vote) to revive and sustain growth on a durable basis while ensuring that inflation remains within the target going forward. The RBI has acknowledged that the outlook for aggregate demand is progressively improving but the output is still below pre-COVID level, and the recovery is uneven and largely dependent upon policy support. Hence, the RBI continues with its accommodative stance.
Covid cases during the month remained under control (daily sub-20k) even as vaccine doses crossed the 1bn mark. India witnessed 99% of its long period average rainfall (normal) in 2021, although with significant variations across regions.
FIIs turned net sellers to the tune of ~$2.3bn (highest monthly outflow since March 2020), taking YTD net inflow to $6.3bn. DIIs were net buyers of ~$0.6bn (YTD +$4.3bn) driven by both MFs (+$0.2bn) and insurance companies (+$0.4bn).
Going forward
Earnings seasons has been reasonably strong so far. Thirty-six out of Nifty 50 companies have reported numbers (86% weight) with the aggregate net profit showing growth of 15% YoY and ~10% ahead of estimates.
Equity markets have rallied significantly from the lows of March 2020. Nifty is up 2.4x, while Midcap is up 2.8x and Small Cap is up 3.2x since March 2020 closing lows. Even this calendar year, the markets have remained buoyant.
India’s economy has shown strong resilience after the jolt of Covid’s second wave. All dots are coming together with 1) Normal monsoons; 2) Strong tailwind in IT service; 3) Improved visibility on PSU divestment post sale of Air India; 4) Improving standing of Indian companies in Pharma, Chemicals, Textiles etc. in China+1 strategy; 5) High probability of private sector capex to kick start led by cement, steel, Oil and Gas; 6) Digitization wave sweeping across, with Fintech, Consumer Tech and EV-led transformation. Although some of these factors will play out over the long term, India looks set for new growth horizons in the coming years.
Despite this recovery, a large part of market returns is also likely due to unprecedented liquidity and record low interest rates. However, now markets are facing the prospect of Fed tapering along with rising inflation globally posing risk for rate hikes eventually.
India is entering the festive season and initial signs reflect good demand. Continuation of good demand through the festive season would pave the path for earnings delivery. We see growing risks to the market from ‘higher-for-longer’ inflation even as earnings estimates look achievable. Another risk is from the huge pipeline of companies planning to raise significant amounts from IPOs.
We maintain a cautiously optimistic stance and continue our focus on investing in companies with strong earnings growth visibility and strong financials.
Debt Market
rise. We continue to favor the 4/5-yr segment of the sovereign curve as there is less supply in this segment and carry roll down effect is pretty attractive.
Fixed Income Market
September 2021
October 2021
Change (in bps)
Overnight rate (NSE MIBOR) 3.49% 3.42% -7.00
1 yr CD 3.95% 4.31% 36.00
10 yr GOI Yield 6.22% 6.39% 17.00
USD/INR 74.23 74.88 65 paise
IIP (Monthly with 2 month lag) 11.50% 11.90% 40.00
CPI (Monthly with 1 month lag) 5.30% 4.35% -95.00
5 Yr AAA PSU spread (bps) 15 15 0.00
5 Yr OIS 5.32% 5.68% 36.00
US 10 Yr yield 1.53% 1.58% 5.00
CRR 4.00% 4.00% 0.00
Reverse REPO 3.35% 3.35% 0.00
REPO 4.00% 4.00% 0.00
Source: RBI Weekly Statistical Supplement & Bloomberg
Note: IIP has been revised lower for the previous reading.
Bond Yields rose across the curve by 10 to 20 bps in October 2021 as RBI ended its Bond buying program or GSAP (G-Sec Acquisition Program) and also increased the size of the liquidity absorption through the Variable Rate Reverse Repos. (VRRR). Increase in yields across world markets also impacted the yield curve. Though the flatness in the curve was not as pronounced as in other markets, the rise in yields was almost parallel across the curve. The 5-yr segment outperformed on back of lower supply. CPI Inflation came in at 4.35% on back of lower food prices but Core Inflation remained sticky to close at 5.75%. The swaps curve witnessed a bigger rise with the most traded 5-yr Overnight Indexed Swap rising by 33 bps during the month.
INR depreciated by 0.86% during the month as Brent prices continued to rise, adversely impacting India’s trade deficit as well as inflation and inflation expectations. PFI (Private Finance Initiatives) flows were negative both in debt and equity. Debt outflows were at USD 448 M and equity outflows pegged in at USD 2.23 Bn , the highest outflow for a given month during CY2021.
We are in underweight duration as we believe yields may to continue to rise on the back of higher-than-expected inflation due to elevated commodity prices and rising demand as the economy starts to operate at pre-Covid levels with the rapid increase in vaccinations.
We expect the RBI to increase the reverse repo rate to 3.75% by February 2022 from the current 3.35% .
Currently, we expect the policy repo rate hike to start from April 2022 onwards, though an earlier hike cannot be ruled out if Brent continues to
5
EQ
UIT
Y F
UN
DS
R
EC
KO
NE
R
Sche
me
Nam
ePG
IM In
dia
Larg
e Ca
p Fu
ndPG
IM In
dia
Flex
i Cap
Fun
dPG
IM In
dia
Mid
cap
Oppo
rtun
ities
Fun
dPG
IM In
dia
Smal
l Cap
Fun
dPG
IM In
dia
Long
Ter
m E
quity
Fun
d
Idea
l Inv
estm
ent H
oriz
on $
3 Ye
ars+
3 Ye
ars+
4 Ye
ars+
3 Ye
ars+
3 Ye
ars+
Ince
ptio
n Da
teRe
gula
r Pla
n: 2
1/01
/200
3; D
irect
Pla
n:
01/0
1/20
13Re
gula
r Pla
n: 0
4/03
/201
5; D
irect
Pla
n:
04/0
3/20
15Re
gula
r Pla
n: 0
2/12
/201
3; D
irect
Pla
n:
02/1
2/20
13Re
gula
r Pla
n: 2
9/07
/202
1;
Dire
ct P
lan:
29/
07/2
021
Regu
lar P
lan:
11/
12/2
015;
Dire
ct P
lan:
11
/12/
2015
Fund
Man
ager
Alok
Aga
rwal
is m
anag
ing
sinc
e Ju
ly 27
, 201
7An
irudd
ha N
aha
(Equ
ity P
ortio
n) is
man
agin
gsi
nce
April
05,
201
8 ,M
r. An
andh
aPa
dman
abha
n An
jene
yan
(Equ
ity P
ortio
n) is
m
anag
ing
from
June
1, 2
021
and
Mr.
Ravi
Adu
kia
(ove
rsea
s in
vest
men
ts) i
s m
anag
ing
fro
m Ju
ne 1
, 202
1.
Aniru
ddha
Nah
a is
man
agin
g si
nce
April
05,
20
18 a
nd M
r. Vi
vek
Shar
ma
is m
anag
ing
from
Ju
ne 0
1, 2
021
Mr.
Aniru
ddha
Nah
a (O
ver
18 y
ears
of
expe
rienc
e in
the
equ
ity a
nd d
ebt
mar
ket),
Mr.
Kum
ares
h Ra
mak
rishn
an (
Debt
por
tion)
(Ov
er 2
0 ye
ars
of
expe
rienc
e in
Fixe
d In
com
e M
arke
t as
a F
und
Man
ager
and
Ana
lyst)
and
Mr. R
avi A
duki
a (O
vers
eas
Inve
stm
ents
) (Ov
er 1
5 ye
ars
of e
xper
ienc
e in
Indi
an
finan
cial
mar
kets
, prim
arily
in e
quity
rese
arch
).
Srin
ivas
Rao
Rav
uri i
s m
anag
ing
sinc
e Se
ptem
ber 1
4, 2
019
and
Mr.
Utka
rsh
Katk
oria
is
man
agin
g fro
m Ju
ne 0
1, 2
021
Benc
hmar
kNi
fty 5
0 TR
Inde
xNi
fty 5
00 T
R In
dex
Nifty
Mid
cap
100
TR In
dex
Nifty
Sm
all C
ap 1
00 T
RIS&
P BS
E 20
0 TR
Inde
x
Fund
Det
ails
as
on O
ctob
er 3
1, 2
021
Mon
th E
nd A
UM (i
n Cr
ores
)35
9.64
2705
.57
3388
.27
1220
.80
333.
83
Port
folio
Turn
over
(Las
t 1 y
ear)
1.48
1.36
1.24
0.43
0.19
Stan
dard
Dev
iatio
n of
Fun
d (A
nnua
l)17
.23%
17.1
6%17
.98%
—16
.77%
Stan
dard
Dev
iatio
n of
Ben
chm
ark
(Ann
ual)
18.1
0%17
.36%
19.6
3%—
17.9
0%
Beta
0.93
0.95
0.87
—0.
91
Shar
pe R
atio
**0.
380.
690.
72—
0.59
** R
isk
free
rate
ass
umed
to b
e 5.
51%
(bas
ed
on M
IBOR
as
on 3
1/10
/202
1)**
Ris
k fre
e ra
te a
ssum
ed to
be
5.51
% (b
ased
on
MIB
OR a
s on
31/
10/2
021)
** R
isk
free
rate
ass
umed
to b
e 5.
51%
(bas
ed
on M
IBOR
as
on 3
1/10
/202
1)
—**
Ris
k fre
e ra
te a
ssum
ed to
be
5.27
% (b
ased
on
MIB
OR a
s on
31/
10/2
021)
Port
folio
Cla
ssifi
catio
n (%
) as
on O
ctob
er 3
1, 2
021
Larg
e Ca
p (%
) (1s
t-10
0th
stoc
k) 8
3.66
4
8.55
3
.11
— 7
5.28
Mid
Cap
(%) (
101s
t-25
0th
stoc
k) 8
.62
25.
18
70.
02
16.
65
9.5
9
Smal
l Cap
(%) (
251s
t sto
ck o
nwar
ds)
3.3
1 2
2.23
2
1.66
7
3.23
1
3.39
Cash
(%)
4.4
1 4
.05
5.2
1 1
0.12
1
.74
Not C
lass
ified
(%)
——
——
—
Port
folio
Cla
ssifi
catio
n By
Indu
stry
Allo
catio
n (%
) as
on O
ctob
er 3
1, 2
021
Port
folio
Cla
ssifi
catio
n By
Indu
stry
Allo
catio
n (%
) (T
op 1
0)In
dust
ry%
to N
et
Asse
ts
Bank
s26
.59
Softw
are
14.0
7
Fina
nce
7.72
Petro
leum
Pro
duct
s7.
25
Cons
truct
ion
Proj
ect
4.91
Phar
mac
eutic
als
4.63
Cons
umer
Non
Dur
able
s3.
94
Insu
ranc
e3.
20
Chem
ical
s3.
14
Pest
icid
es2.
97
Indu
stry
% to
Net
As
sets
Softw
are
15.9
7
Bank
s11
.69
Cem
ent &
Cem
ent P
rodu
cts
8.05
Fina
nce
7.17
Indu
stria
l Pro
duct
s6.
89
Phar
mac
eutic
als
6.62
Cons
truct
ion
4.49
Cons
truct
ion
Proj
ect
4.18
Insu
ranc
e3.
83
Cons
umer
Dur
able
s3.
75
Indu
stry
% to
Net
As
sets
Softw
are
14.4
9
Indu
stria
l Pro
duct
s9.
92
Bank
s9.
89
Cons
umer
Dur
able
s8.
92
Chem
ical
s7.
18
Phar
mac
eutic
als
7.05
Cem
ent &
Cem
ent P
rodu
cts
6.95
Indu
stria
l Cap
ital G
oods
4.56
Auto
4.40
Cons
truct
ion
3.67
Indu
stry
% to
Net
As
sets
Indu
stria
l Pro
duct
s16
.27
Softw
are
13.4
7
Cons
umer
Dur
able
s7.
46
Capi
tal M
arke
ts5.
94
Phar
mac
eutic
als
5.82
Cons
truct
ion
4.74
Cem
ent &
Cem
ent P
rodu
cts
4.48
Chem
ical
s4.
43
Auto
4.32
Heal
thca
re S
ervi
ces
3.08
Indu
stry
% to
Net
As
sets
Bank
s25
.54
Softw
are
16.8
1
Phar
mac
eutic
als
10.1
4
Petro
leum
Pro
duct
s7.
30
Tele
com
- Se
rvic
es5.
77
Cons
umer
Non
Dur
able
s5.
76
Powe
r5.
07
Cons
truct
ion
Proj
ect
5.06
Indu
stria
l Cap
ital G
oods
3.13
Fina
nce
3.04
Othe
r Det
ails
Exit
Load
Refe
r pag
e no
. 7Re
fer p
age
no. 8
Refe
r pag
e no
. 9Re
fer p
age
no. 1
0Ni
l
Sour
ce: B
loom
berg
. $ In
vest
ors
shou
ld c
onsu
lt th
eir f
inan
cial
adv
isor
for t
ax im
plic
atio
ns o
n th
eir i
nves
tmen
ts.
6
Sche
me
Nam
ePG
IM In
dia
Hybr
id E
quity
Fun
dPG
IM In
dia
Emer
ging
Mar
kets
Eq
uity
Fun
dPG
IM In
dia
Glob
al E
quity
Op
port
uniti
es F
und
PGIM
Indi
a Ar
bitr
age
Fund
PGIM
Indi
a Eq
uity
Sav
ings
Fun
dPG
IM In
dia
Bala
nced
Adv
anta
ge
Fund
Idea
l Inv
estm
ent H
oriz
on $
2 Ye
ars+
3 Ye
ars+
3 Ye
ars+
3 M
onth
s+2
Year
s+3
Year
s+In
cept
ion
Date
Regu
lar P
lan:
29/
01/2
004;
Dire
ct P
lan:
01
/01/
2013
Regu
lar P
lan:
11/
09/2
007;
Dire
ct P
lan:
01
/01/
2013
Regu
lar P
lan:
14/
05/2
010;
Dire
ct P
lan:
01
/01/
2013
Regu
lar P
lan:
27/
08/2
014;
Dire
ct P
lan:
27
/08/
2014
Regu
lar P
lan:
29/
01/2
004;
Dire
ct P
lan:
01
/01/
2013
Regu
lar P
lan:
04/
02/2
021;
Dire
ct P
lan:
04
/02/
2021
Fund
Man
ager
Alok
Aga
rwal
(Equ
ity p
ortio
n) is
m
anag
ing
sinc
e Ju
ne 2
016
and
Kum
ares
h Ra
mak
rishn
an (D
ebt p
ortio
n) is
man
agin
g si
nce
April
05,
201
8 an
d M
r. Ra
vi A
duki
a (O
vers
eas
Inve
stm
ents
) is
man
agin
g fro
m
June
01,
202
1
Ravi
Adu
kia
is m
anag
ing
from
Jun
e 01
, 20
21Ra
vi A
duki
a is
man
agin
g fro
m J
une
01,
2021
Utka
rsh
Katk
oria
is m
anag
ing
sinc
e M
arch
20
16 a
nd H
itash
Dan
g (E
quity
Mar
ket)
is
man
agin
g si
nce
May
201
7 an
d Ku
mar
esh
Ram
akris
hnan
(De
bt M
arke
t) is
man
agin
g si
nce
Augu
st 2
014
Alok
Aga
rwal
(Eq
uity
Por
tion)
is m
anag
ing
sinc
e Au
gust
201
6 an
d Hi
tash
Dan
g (E
quity
Po
rtion
) is m
anag
ing
from
June
01,
2021
and
Ku
mar
esh
Ram
akris
hnan
(De
bt P
ortio
n) i
s m
anag
ing
sinc
e Ap
ril 0
5, 2
018
Aniru
ddha
Na
ha
(Equ
ity
Porti
on)
is
man
agin
g si
nce F
ebru
ary 2
021,
Hita
sh D
ang
(Equ
ity P
ortio
n) is
man
agin
g fro
m Ju
ne 0
1,
2021
Ku
mar
esh
Ram
akris
hnan
(D
ebt
Porti
on)
is m
anag
ing
sinc
e Fe
brua
ry 2
021
and
Ravi
Adu
kia
(Ove
rsea
s In
vest
men
ts)
is
man
agin
g fro
m Ju
ne 0
1, 2
021
Benc
hmar
kCR
ISIL
Hyb
rid 3
5+65
- Ag
gres
ive
Inde
xM
SCI E
mer
ging
Mar
kets
Inde
xM
SCI A
ll Co
untry
Wor
ld In
dex
Nifty
50
Arbi
trage
TR
Inde
xNI
FTY
50 H
ybrid
Sho
rt Du
ratio
n De
bt 2
5:75
In
dex
CRIS
IL H
ybrid
50+
50 M
oder
ate
Inde
x
Unde
rlyin
g Fu
nd—
PGIM
Jenn
ison
Em
ergi
ng M
arke
ts E
quity
Fu
ndPG
IM Je
nnis
on G
loba
l Equ
ity O
ppor
tuni
ties
Fund
——
—
Fund
Det
ails
as
on O
ctob
er 3
1, 2
021
Mon
th E
nd A
UM (i
n Cr
ores
)18
4.55
251.
4617
17.4
114
4.45
104.
3512
45.3
4Po
rtfo
lio T
urno
ver (
Last
1 y
ear)
1.72
(For
Equ
ity)
——
2.25
1.39
(For
Equ
ity)
0.64
(For
Equ
ity)
Stan
dard
Dev
iatio
n of
Fun
d (A
nnua
l)3
year
s: 1
5.72
%; 6
yea
rs: 1
2.83
%—
—1.
15%
6.27
%—
Stan
dard
Dev
iatio
n of
Ben
chm
ark
(Ann
ual)
3 ye
ars:
13.
46%
; 6 y
ears
: 11.
24%
——
1.48
%5.
52%
—
Beta
3 ye
ars:
1.1
2; 6
yea
rs: 1
.08
——
0.46
1.04
—Sh
arpe
Rat
io**
3 ye
ars:
0.6
5; 6
yea
rs: 0
.34
——
-0.2
20.
38—
** R
isk
free
rate
ass
umed
to
be 5
.51%
(b
ased
on
MIB
OR a
s on
31/
10/2
021)
——
** R
isk
free
rate
ass
umed
to
be 5
.51%
(b
ased
on
MIB
OR a
s on
31/
10/2
021)
** R
isk
free
rate
ass
umed
to
be 5
.51%
(b
ased
on
MIB
OR a
s on
31/
10/2
021)
—
Port
folio
Cla
ssifi
catio
n (%
) as
on O
ctob
er 3
1, 2
021
#La
rge
Cap
(%) (
1st-
100t
h st
ock)
55.
47
——
— 5
0.66
5
4.61
M
id C
ap (%
) (10
1st-
250t
h st
ock)
26.
60
——
— 4
8.69
3
5.94
Sm
all C
ap (%
) (25
1st s
tock
onw
ards
) 1
6.04
—
——
0.6
5 9
.45
Cash
(%)
——
——
——
Not C
lass
ified
(%)
1.8
9—
——
——
Port
folio
Cla
ssifi
catio
n By
Indu
stry
Allo
catio
n (%
) as
on O
ctob
er 3
1, 2
021*
Port
folio
Cla
ssifi
catio
n By
Indu
stry
Al
loca
tion
(%) (
Top
10)
Indu
stry
% to
Net
As
sets
Bank
s10
.67
Chem
ical
s6.
25
Indu
stria
l Pro
duct
s5.
86
Cons
umer
Non
Dur
able
s5.
75
Petro
leum
Pro
duct
s4.
81
Softw
are
4.06
Pest
icid
es2.
58
Fina
nce
2.54
Powe
r2.
08
Auto
1.92
Indu
stry
% to
Net
As
sets
Cons
umer
Dis
cret
iona
ry22
.8
Info
rmat
ion
Tech
nolo
gy22
.0
Com
mun
icat
ion
Serv
ices
14.2
Heal
thca
re13
.1
Indu
stria
ls9.
8
Fina
ncia
ls8.
3
Mat
eria
ls2.
3
Cons
umer
Sta
ples
2.0
Indu
stry
% to
Net
As
sets
Info
rmat
ion
Tech
nolo
gy39
.2
Cons
umer
Dis
cret
iona
ry29
.6
Com
mun
icat
ion
Serv
ices
15.1
Heal
thca
re5.
6
Cons
umer
Sta
ples
5.2
Indu
stria
ls2.
4
Mat
eria
ls1.
8
Indu
stry
% to
Net
As
sets
Ferro
us M
etal
s9.
12
Bank
s8.
65
Tran
spor
tatio
n5.
70
Cem
ent &
Cem
ent P
rodu
cts
5.09
Fina
nce
4.93
Non
- Fer
rous
Met
als
4.33
Softw
are
4.08
Capi
tal M
arke
ts3.
77
Auto
3.58
Min
eral
s/M
inin
g2.
76
Indu
stry
% to
Net
As
sets
Bank
s10
.58
Softw
are
10.1
9
Min
eral
s/M
inin
g6.
61
Non
- Fer
rous
Met
als
6.59
Tran
spor
tatio
n5.
15
Fina
nce
5.13
Auto
4.92
Ferro
us M
etal
s3.
62
Chem
ical
s2.
21
Phar
mac
eutic
als
2.13
Indu
stry
% to
Net
As
sets
Bank
s9.
79
Softw
are
7.19
Cons
umer
Non
Dur
able
s5.
29
Fina
nce
5.22
Phar
mac
eutic
als
4.78
Tran
spor
tatio
n3.
96
Ferro
us M
etal
s3.
62
Petro
leum
Pro
duct
s3.
31
Cem
ent &
Cem
ent
Prod
ucts
3.29
Powe
r2.
18
Othe
r Det
ails
Exit
Load
Refe
r pag
e no
. 12
Refe
r pag
e no
. 13
Refe
r pag
e no
. 14
Nil
Refe
r pag
e no
. 16
Refe
r pag
e no
. 17
Sour
ce: B
loom
berg
. # T
he a
bove
dat
a is
giv
en fo
r equ
ity a
lloca
tion.
$ In
vest
ors
shou
ld c
onsu
lt th
eir f
inan
cial
adv
isor
for t
ax im
plic
atio
ns o
n th
eir i
nves
tmen
ts. *
Portf
olio
Cla
ssifi
catio
n by
Indu
stry
Allo
catio
n of
PGI
M In
dia
Emer
ging
Mar
kets
Equ
ity F
und
and
PGIM
Indi
a Gl
obal
Equ
ity O
ppor
tuni
ties
Fund
is fo
r Und
erlyi
ng F
und
as o
n Se
ptem
ber 3
0, 2
021.
EQ
UIT
Y F
UN
DS
R
EC
KO
NE
R
7
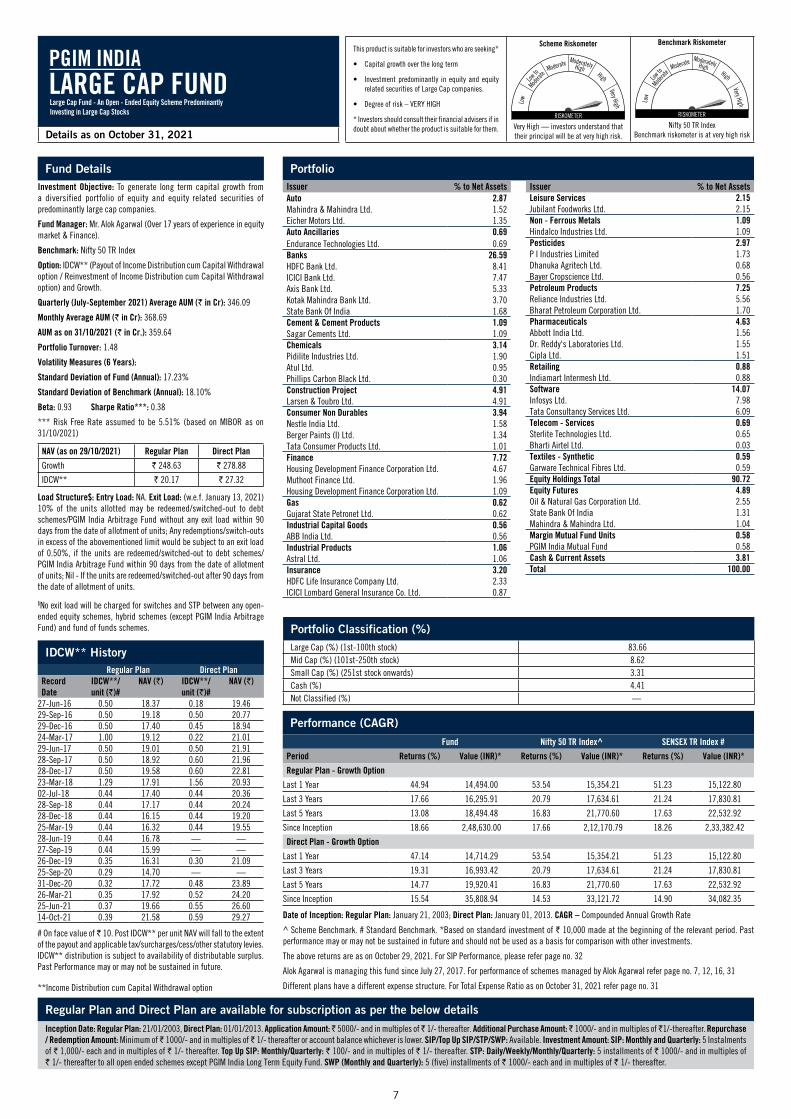
Performance (CAGR)Fund Nifty 50 TR Index^ SENSEX TR Index #
Period Returns (%) Value (INR)* Returns (%) Value (INR)* Returns (%) Value (INR)*
Regular Plan - Growth Option
Last 1 Year 44.94 14,494.00 53.54 15,354.21 51.23 15,122.80
Last 3 Years 17.66 16,295.91 20.79 17,634.61 21.24 17,830.81
Last 5 Years 13.08 18,494.48 16.83 21,770.60 17.63 22,532.92
Since Inception 18.66 2,48,630.00 17.66 2,12,170.79 18.26 2,33,382.42
Direct Plan - Growth Option
Last 1 Year 47.14 14,714.29 53.54 15,354.21 51.23 15,122.80
Last 3 Years 19.31 16,993.42 20.79 17,634.61 21.24 17,830.81
Last 5 Years 14.77 19,920.41 16.83 21,770.60 17.63 22,532.92
Since Inception 15.54 35,808.94 14.53 33,121.72 14.90 34,082.35
Date of Inception: Regular Plan: January 21, 2003; Direct Plan: January 01, 2013. CAGR – Compounded Annual Growth Rate
^ Scheme Benchmark. # Standard Benchmark. *Based on standard investment of ` 10,000 made at the beginning of the relevant period. Past performance may or may not be sustained in future and should not be used as a basis for comparison with other investments.
The above returns are as on October 29, 2021. For SIP Performance, please refer page no. 32
Alok Agarwal is managing this fund since July 27, 2017. For performance of schemes managed by Alok Agarwal refer page no. 7, 12, 16, 31
Different plans have a different expense structure. For Total Expense Ratio as on October 31, 2021 refer page no. 31
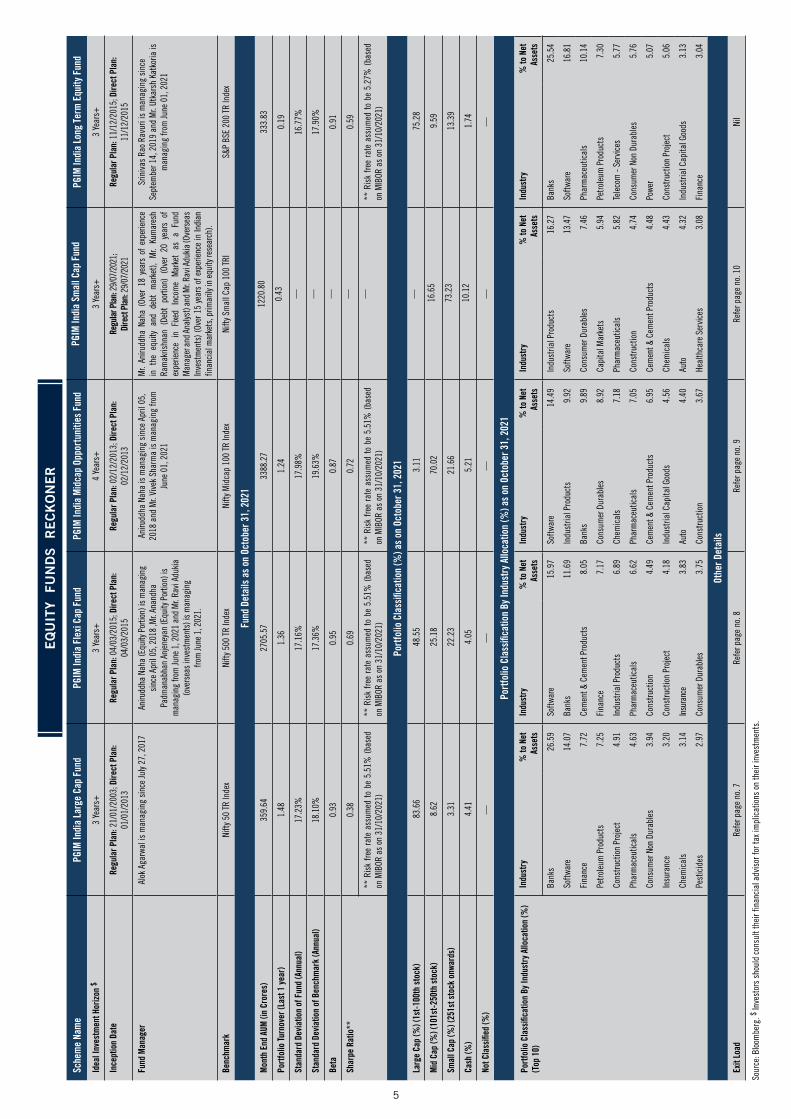
Portfolio Classification (%)Large Cap (%) (1st-100th stock) 83.66 Mid Cap (%) (101st-250th stock) 8.62 Small Cap (%) (251st stock onwards) 3.31 Cash (%) 4.41 Not Classified (%) —
Regular Plan and Direct Plan are available for subscription as per the below detailsInception Date: Regular Plan: 21/01/2003, Direct Plan: 01/01/2013. Application Amount: ̀ 5000/- and in multiples of ̀ 1/- thereafter. Additional Purchase Amount: ̀ 1000/- and in multiples of ̀ 1/-thereafter. Repurchase / Redemption Amount: Minimum of ̀ 1000/- and in multiples of ̀ 1/- thereafter or account balance whichever is lower. SIP/Top Up SIP/STP/SWP: Available. Investment Amount: SIP: Monthly and Quarterly: 5 Instalments of ` 1,000/- each and in multiples of ` 1/- thereafter. Top Up SIP: Monthly/Quarterly: ` 100/- and in multiples of ` 1/- thereafter. STP: Daily/Weekly/Monthly/Quarterly: 5 installments of ` 1000/- and in multiples of ` 1/- thereafter to all open ended schemes except PGIM India Long Term Equity Fund. SWP (Monthly and Quarterly): 5 (five) installments of ` 1000/- each and in multiples of ` 1/- thereafter.
Fund DetailsInvestment Objective: To generate long term capital growth from a diversified portfolio of equity and equity related securities of predominantly large cap companies.
Fund Manager: Mr. Alok Agarwal (Over 17 years of experience in equity market & Finance).
Benchmark: Nifty 50 TR Index
Option: IDCW** (Payout of Income Distribution cum Capital Withdrawal option / Reinvestment of Income Distribution cum Capital Withdrawal option) and Growth.
Quarterly (July-September 2021) Average AUM (` in Cr): 346.09
Monthly Average AUM (` in Cr): 368.69
AUM as on 31/10/2021 (` in Cr.): 359.64
Portfolio Turnover: 1.48
Volatility Measures (6 Years):
Standard Deviation of Fund (Annual): 17.23%
Standard Deviation of Benchmark (Annual): 18.10%
Beta: 0.93 Sharpe Ratio***: 0.38
*** Risk Free Rate assumed to be 5.51% (based on MIBOR as on 31/10/2021)
NAV (as on 29/10/2021) Regular Plan Direct Plan
Growth ` 248.63 ` 278.88
IDCW** ` 20.17 ` 27.32
Load Structure$: Entry Load: NA. Exit Load: (w.e.f. January 13, 2021) 10% of the units allotted may be redeemed/switched-out to debt schemes/PGIM India Arbitrage Fund without any exit load within 90 days from the date of allotment of units; Any redemptions/switch-outs in excess of the abovementioned limit would be subject to an exit load of 0.50%, if the units are redeemed/switched-out to debt schemes/PGIM India Arbitrage Fund within 90 days from the date of allotment of units; Nil - If the units are redeemed/switched-out after 90 days from the date of allotment of units.
$No exit load will be charged for switches and STP between any open-ended equity schemes, hybrid schemes (except PGIM India Arbitrage Fund) and fund of funds schemes.
PortfolioIssuer % to Net AssetsAuto 2.87Mahindra & Mahindra Ltd. 1.52Eicher Motors Ltd. 1.35Auto Ancillaries 0.69Endurance Technologies Ltd. 0.69Banks 26.59HDFC Bank Ltd. 8.41ICICI Bank Ltd. 7.47Axis Bank Ltd. 5.33Kotak Mahindra Bank Ltd. 3.70State Bank Of India 1.68Cement & Cement Products 1.09Sagar Cements Ltd. 1.09Chemicals 3.14Pidilite Industries Ltd. 1.90Atul Ltd. 0.95Phillips Carbon Black Ltd. 0.30Construction Project 4.91Larsen & Toubro Ltd. 4.91Consumer Non Durables 3.94Nestle India Ltd. 1.58Berger Paints (I) Ltd. 1.34Tata Consumer Products Ltd. 1.01Finance 7.72Housing Development Finance Corporation Ltd. 4.67Muthoot Finance Ltd. 1.96Housing Development Finance Corporation Ltd. 1.09Gas 0.62Gujarat State Petronet Ltd. 0.62Industrial Capital Goods 0.56ABB India Ltd. 0.56Industrial Products 1.06Astral Ltd. 1.06Insurance 3.20HDFC Life Insurance Company Ltd. 2.33ICICI Lombard General Insurance Co. Ltd. 0.87
Issuer % to Net AssetsLeisure Services 2.15Jubilant Foodworks Ltd. 2.15Non - Ferrous Metals 1.09Hindalco Industries Ltd. 1.09Pesticides 2.97P I Industries Limited 1.73Dhanuka Agritech Ltd. 0.68Bayer Cropscience Ltd. 0.56Petroleum Products 7.25Reliance Industries Ltd. 5.56Bharat Petroleum Corporation Ltd. 1.70Pharmaceuticals 4.63Abbott India Ltd. 1.56Dr. Reddy's Laboratories Ltd. 1.55Cipla Ltd. 1.51Retailing 0.88Indiamart Intermesh Ltd. 0.88Software 14.07Infosys Ltd. 7.98Tata Consultancy Services Ltd. 6.09Telecom - Services 0.69Sterlite Technologies Ltd. 0.65Bharti Airtel Ltd. 0.03Textiles - Synthetic 0.59Garware Technical Fibres Ltd. 0.59Equity Holdings Total 90.72Equity Futures 4.89Oil & Natural Gas Corporation Ltd. 2.55State Bank Of India 1.31Mahindra & Mahindra Ltd. 1.04Margin Mutual Fund Units 0.58PGIM India Mutual Fund 0.58Cash & Current Assets 3.81Total 100.00
This product is suitable for investors who are seeking*
• Capital growth over the long term
• Investment predominantly in equity and equity related securities of Large Cap companies.
• Degree of risk – VERY HIGH
* Investors should consult their financial advisers if in doubt about whether the product is suitable for them.
Scheme Riskometer
Moderate
Low to
Moderat
e
Low
ModeratelyHigh
Very High
High
RISKOMETER
Very High — investors understand that their principal will be at very high risk.
Benchmark Riskometer
Moderate
Low to
Moderat
e
Low
ModeratelyHigh
Very High
High
RISKOMETER
Nifty 50 TR IndexBenchmark riskometer is at very high risk
IDCW** HistoryRegular Plan Direct Plan
Record Date
IDCW**/unit (`)#
NAV (`) IDCW**/unit (`)#
NAV (`)
27-Jun-16 0.50 18.37 0.18 19.4629-Sep-16 0.50 19.18 0.50 20.7729-Dec-16 0.50 17.40 0.45 18.9424-Mar-17 1.00 19.12 0.22 21.0129-Jun-17 0.50 19.01 0.50 21.9128-Sep-17 0.50 18.92 0.60 21.9628-Dec-17 0.50 19.58 0.60 22.8123-Mar-18 1.29 17.91 1.56 20.9302-Jul-18 0.44 17.40 0.44 20.3628-Sep-18 0.44 17.17 0.44 20.2428-Dec-18 0.44 16.15 0.44 19.2025-Mar-19 0.44 16.32 0.44 19.5528-Jun-19 0.44 16.78 — —27-Sep-19 0.44 15.99 — —26-Dec-19 0.35 16.31 0.30 21.0925-Sep-20 0.29 14.70 — —31-Dec-20 0.32 17.72 0.48 23.8926-Mar-21 0.35 17.92 0.52 24.2025-Jun-21 0.37 19.66 0.55 26.6014-Oct-21 0.39 21.58 0.59 29.27
# On face value of ̀ 10. Post IDCW** per unit NAV will fall to the extent of the payout and applicable tax/surcharges/cess/other statutory levies. IDCW** distribution is subject to availability of distributable surplus. Past Performance may or may not be sustained in future.
Details as on October 31, 2021
**Income Distribution cum Capital Withdrawal option
Large Cap Fund - An Open - Ended Equity Scheme Predominantly Investing in Large Cap Stocks
LARGE CAP FUNDPGIM INDIA

8
Portfolio Classification (%)Large Cap (%) (1st-100th stock) 48.55 Mid Cap (%) (101st-250th stock) 25.18 Small Cap (%) (251st stock onwards) 22.23 Cash (%) 4.05 Not Classified (%) —
Regular Plan and Direct Plan are available for subscription as per the below detailsInception Date: Regular Plan: 04/03/2015, Direct Plan: 04/03/2015. Application Amount: ̀ 5000/- and in multiples of ̀ 1/- thereafter. Additional Purchase Amount: ̀ 1000/- and in multiples of ̀ 1/- thereafter. Repurchase / Redemption Amount: Minimum of ̀ 1000/- and in multiples of ̀ 1/- thereafter or account balance whichever is lower. SIP/Top Up SIP/STP/SWP: Available. Investment Amount: SIP: Monthly and Quarterly: 5 installments of ` 1000/- each and in multiples of ` 1/- thereafter. Top Up SIP: Monthly/Quarterly: ` 100/- and in multiples of ` 1/- thereafter. STP: Daily/Weekly/Monthly/Quarterly: 5 installments of ` 1000/- and in multiples of ` 1/- thereafter to all open ended schemes except PGIM India Long Term Equity Fund. SWP (Monthly and Quarterly): 5 (five) installments of ` 1000/- each and in multiples of ` 1/- thereafter.
Fund Details
Investment Objective: To generate income & capital appreciation by predominantly investing in an actively managed diversified portfolio of equity & equity related instruments including derivatives.
Fund Manager: Mr. Aniruddha Naha (Equity Portion) (Over 18 years of experience in the equity and debt market) and Mr. Anandha Padmanabhan Anjeneyan (Equity Portion) (Over 10 years of experience in Equity Market) and Mr. Ravi Adukia (Overseas Investments) (Over 15 years of experience in Indian financial markets, primarily in equity research).
Benchmark: Nifty 500 TR Index
Option: IDCW** (Payout of Income Distribution cum Capital Withdrawal option / Reinvestment of Income Distribution cum Capital Withdrawal option) and Growth.
Quarterly (July-September 2021) Average AUM (` in Cr): 1864.50
Monthly Average AUM (` in Cr): 2591.55
AUM as on 31/10/2021 (` in Cr.): 2705.57
Portfolio Turnover: 1.36
Volatility Measures (6 Years):
Standard Deviation of Fund (Annual): 17.16%
Standard Deviation of Benchmark (Annual): 17.36%
Beta: 0.95 Sharpe Ratio***: 0.69
*** Risk Free Rate assumed to be 5.51% (based on MIBOR as on 31/10/2021)
NAV (as on 29/10/2021) Regular Plan Direct Plan
Growth ` 26.58 ` 29.41
IDCW** ` 20.02 ` 21.41
Load Structure$: Entry Load: NA. Exit Load: (w.e.f. January 13, 2021) 10% of the units allotted may be redeemed/switched-out to debt schemes/PGIM India Arbitrage Fund without any exit load within 90 days from the date of allotment of units; Any redemptions/switch-outs in excess of the abovementioned limit would be subject to an exit load of 0.50%, if the units are redeemed/switched-out to debt schemes/PGIM India Arbitrage Fund within 90 days from the date of allotment of units; Nil - If the units are redeemed/switched-out after 90 days from the date of allotment of units.
$No exit load will be charged for switches and STP between any open-ended equity schemes, hybrid schemes (except PGIM India Arbitrage Fund) and fund of funds schemes.
This product is suitable for investors who are seeking*
• Capital appreciation over long term.
• To generate income and capital appreciation by predominantly investing in an actively managed diversified portfolio of equity and equity related instruments including derivatives.
• Degree of risk – VERY HIGH
* Investors should consult their financial advisers if in doubt about whether the product is suitable for them.
Scheme Riskometer
Moderate
Low to
Moderat
e
Low
ModeratelyHigh
Very High
High
RISKOMETER
Very High — investors understand that their principal will be at very high risk.
Benchmark Riskometer
Moderate
Low to
Moderat
e
Low
ModeratelyHigh
Very High
High
RISKOMETER
Nifty 500 TR IndexBenchmark riskometer is at very high risk
Performance (CAGR)Fund Nifty 500 TR Index^ NIFTY 50 TR Index #
Period Returns (%) Value (INR)* Returns (%) Value (INR)* Returns (%) Value (INR)*Regular Plan - Growth Option
Last 1 Year 69.30 16,929.94 59.08 15,908.05 53.54 15,354.21 Last 3 Years 29.96 21,964.57 21.22 17,820.98 20.79 17,634.61 Last 5 Years 19.36 24,241.47 16.34 21,323.32 16.83 21,770.60 Since Inception 15.81 26,580.00 12.88 22,411.57 12.22 21,549.09 Direct Plan - Growth Option
Last 1 Year 72.80 17,279.67 59.08 15,908.05 53.54 15,354.21 Last 3 Years 32.48 23,266.93 21.22 17,820.98 20.79 17,634.61 Last 5 Years 21.58 26,581.53 16.34 21,323.32 16.83 21,770.60 Since Inception 17.58 29,410.00 12.88 22,411.57 12.22 21,549.09
Date of Inception: Regular Plan: March 04, 2015; Direct Plan: March 04, 2015. CAGR – Compounded Annual Growth Rate^ Scheme Benchmark. # Standard Benchmark. *Based on standard investment of ` 10,000 made at the beginning of the relevant period. Past performance may or may not be sustained in future and should not be used as a basis for comparison with other investments.The above returns are as on October 29, 2021. For SIP Performance, please refer page no. 32w.e.f. November 01, 2019 benchmark of the scheme has been changed from S&PBSE 200 TR Index to Nifty 500 TR Index.W.e.f. January 31, 2021, the name and type of the scheme has changed to PGIM India Flexi Cap Fund and Flexi Cap Fund - An open ended dynamic equity scheme investing across large cap, mid cap, small cap stocks, respectively.Aniruddha Naha (Equity Portion) is managing this fund since April 05, 2018. For performance of schemes managed by Aniruddha Naha refer page no. 8, 9, 17. Anandha Padmanabhan Anjeneyan (Equity Portion) is managing this fund from June 01, 2021. No other Schemes are managed by Anandha Padmanabhan Anjeneyan. Ravi Adukia (Overseas Investments) is managing this fund since June 01, 2021. For performance of schemes managed by Ravi Adukia refer page no. 8, 12, 13, 14, 17.Different plans have a different expense structure. For Total Expense Ratio as on October 31, 2021 refer page no. 31
PortfolioIssuer % to Net AssetsAuto 1.58Ashok Leyland Ltd. 1.58Auto Ancillaries 0.79Subros Ltd. 0.79Banks 11.69ICICI Bank Ltd. 5.26State Bank Of India 3.34Axis Bank Ltd. 3.09Capital Markets 2.71Multi Commodity Exchange Of India Ltd. 2.71Cement & Cement Products 8.05Ultratech Cement Ltd. 2.96Ambuja Cements Ltd. 2.54Birla Corporation Ltd. 2.54Chemicals 0.83Phillips Carbon Black Ltd. 0.83Commercial Services 1.12SIS Ltd. 1.12Construction 4.49Oberoi Realty Ltd. 3.06Ashiana Housing Ltd 1.44Construction Project 4.18Larsen & Toubro Ltd. 4.18Consumer Durables 3.75Bata India Ltd. 2.00Dixon Technologies (India) Ltd. 1.75Consumer Non Durables 0.77Sirca Paints India Ltd. 0.77Entertainment 0.56Zee Entertainment Enterprises Ltd. 0.56Finance 7.17Housing Development Finance Corporation Ltd. 3.68Can Fin Homes Ltd. 2.43Housing Development Finance Corporation Ltd. 1.07Gas 2.76Gujarat Gas Ltd. 2.76
Issuer % to Net AssetsHealthcare Services 2.69Krishna Inst Of Medical Sciences Ltd. 2.69Industrial Capital Goods 2.13Siemens Ltd. 2.13Industrial Products 6.89Esab India Ltd. 2.97SKF India Ltd. 2.27Cummins India Ltd. 1.66Insurance 3.83SBI Life Insurance Company Ltd. 2.12ICICI Prudential Life Insurance Co Ltd. 1.71Oil 1.93Oil & Natural Gas Corporation Ltd. 1.93Pesticides 0.76Bharat Rasayan Ltd. 0.76Pharmaceuticals 6.62Sun Pharmaceutical Industries Ltd. 2.06Alkem Laboratories Ltd. 2.00Dr. Reddy's Laboratories Ltd. 1.72Abbott India Ltd. 0.84Software 15.97Infosys Ltd. 6.47Oracle Financial Services Software Ltd. 3.02Persistent Systems Ltd. 2.54Larsen & Toubro Infotech Ltd. 1.98Coforge Ltd. 1.97Telecom - Services 2.91Bharti Airtel Ltd. 2.91Textile Products 0.67K.P.R. Mill Ltd. 0.67Transportation 1.21Container Corporation Of India Ltd. 1.21Cash & Other Receivables Total 3.93Grand Total 100.00
IDCW** HistoryRegular Plan Direct Plan
Record Date
IDCW**/unit (`)#
NAV (`) IDCW**/unit (`)#
NAV (`)
28-Sep-17 0.25 12.55 0.27 12.8128-Dec-17 0.25 13.36 0.27 13.6723-Mar-18 1.39 12.14 1.40 12.4402-Jul-18 0.22 11.04 0.22 11.3928-Sep-18 0.22 10.40 0.22 10.7828-Dec-18 — — 0.16 10.6425-Sep-20 0.24 12.29 0.28 12.9831-Dec-20 0.27 15.06 0.33 15.9526-Mar-21 0.31 15.63 0.37 16.5925-Jun-21 0.33 17.95 0.39 19.10
# On face value of ̀ 10. Post IDCW** per unit NAV will fall to the extent of the payout and applicable tax/surcharges/cess/other statutory levies. IDCW** distribution is subject to availability of distributable surplus. Past Performance may or may not be sustained in future.
Details as on October 31, 2021
**Income Distribution cum Capital Withdrawal option
FLEXI CAP FUNDPGIM INDIA
(Earlier known as PGIM India Diversified Equity Fund)Flexi Cap Fund - An open ended dynamic equity scheme investing across large cap, mid cap, small cap stocks

9
Details as on October 31, 2021
This product is suitable for investors who are seeking*• Capital appreciation over long run.• To achieve long term capital appreciation by
predominantly investing in equity and equity related instruments of mid cap companies.
• Degree of risk – VERY HIGH
* Investors should consult their financial advisers if in doubt about whether the product is suitable for them.
Scheme Riskometer
Moderate
Low to
Moderat
e
Low
ModeratelyHigh
Very High
High
RISKOMETER
Very High — investors understand that their principal will be at very high risk.
Benchmark Riskometer
Moderate
Low to
Moderat
e
Low
ModeratelyHigh
Very High
High
RISKOMETER
Nifty Midcap 100 TR IndexBenchmark riskometer is at very high risk
Fund Details
Investment Objective: The primary objective of the Scheme is to achieve long-term capital appreciation by predominantly investing in equity & equity related instruments of mid cap companies.
Fund Manager: Mr. Aniruddha Naha (Over 18 years of experience in the equity and debt market) and Mr. Vivek Sharma (Over 15 years of experience in Indian financial markets, primarily in equity research).
Benchmark: Nifty Midcap 100 TR Index
Option: IDCW** (Payout of Income Distribution cum Capital Withdrawal option / Reinvestment of Income Distribution cum Capital Withdrawal option) and Growth.
Quarterly (July-September 2021) Average AUM (` in Cr): 2539.23
Monthly Average AUM (` in Cr): 3276.05
AUM as on 31/10/2021 (` in Cr): 3388.27
Portfolio Turnover: 1.24
Volatility Measures (6 Years):
Standard Deviation of Fund (Annual): 17.98%
Standard Deviation of Benchmark (Annual): 19.63%
Beta: 0.87 Sharpe Ratio***: 0.72
*** Risk Free Rate assumed to be 5.51% (based on MIBOR as on 31/10/2021)
NAV (as on 29/10/2021) Regular Plan Direct Plan
Growth ` 43.01 ` 47.30
IDCW** ` 23.74 ` 39.20
Load Structure$: Entry Load: NA. Exit Load: (w.e.f. January 13, 2021) 10% of the units allotted may be redeemed/switched-out to debt schemes/PGIM India Arbitrage Fund without any exit load within 90 days from the date of allotment of units; Any redemptions/switch-outs in excess of the abovementioned limit would be subject to an exit load of 0.50%, if the units are redeemed/switched-out to debt schemes/PGIM India Arbitrage Fund within 90 days from the date of allotment of units; Nil - If the units are redeemed/switched-out after 90 days from the date of allotment of units.
$No exit load will be charged for switches and STP between any open-ended equity schemes, hybrid schemes (except PGIM India Arbitrage Fund) and fund of funds schemes.
Regular Plan and Direct Plan are available for subscription as per the below details
Inception Date: Regular Plan: 02/12/2013, Direct Plan: 02/12/2013. Application Amount: ̀ 5000/- and in multiples of ̀ 1/- thereafter. Additional Purchase Amount: ̀ 1000/- and in multiples of ̀ 1/- thereafter. Repurchase / Redemption Amount: Minimum of ̀ 1000/- and in multiples of ̀ 1/- thereafter or account balance whichever is lower. SIP/Top Up SIP/STP/SWP: Available. Investment Amount: SIP: Monthly and Quarterly: 5 installments of ̀ 1000/- each and in multiples of ` 1/- thereafter. Top Up SIP: Monthly/Quarterly: ` 100/- and in multiples of ` 1/- thereafter. STP: Daily/Weekly/Monthly/Quarterly: 5 installments of ` 1000/- and in multiples of ` 1/- thereafter to all open ended schemes except PGIM India Long Term Equity Fund. SWP (Monthly and Quarterly): 5 (five) installments of ` 1000/- each and in multiples of ` 1/- thereafter.
Performance (CAGR)Fund Nifty Midcap 100 TR Index^ NIFTY 50 TR Index #
Period Returns (%) Value (INR)* Returns (%) Value (INR)* Returns (%) Value (INR)*Regular Plan - Growth Option
Last 1 Year 90.73 19,073.17 80.18 18,017.85 53.54 15,354.21 Last 3 Years 35.39 24,838.85 22.16 18,240.49 20.79 17,634.61 Last 5 Years 20.26 25,164.76 15.04 20,158.61 16.83 21,770.60 Since Inception 20.25 43,010.00 20.20 42,872.57 15.52 31,325.16 Direct Plan - Growth Option
Last 1 Year 94.49 19,449.01 80.18 18,017.85 53.54 15,354.21 Last 3 Years 37.71 26,141.08 22.16 18,240.49 20.79 17,634.61 Last 5 Years 22.21 27,277.23 15.04 20,158.61 16.83 21,770.60 Since Inception 21.70 47,300.00 20.20 42,872.57 15.52 31,325.16
Date of Inception: Regular Plan: December 02, 2013; Direct Plan: December 02, 2013. CAGR – Compounded Annual Growth Rate^ Scheme Benchmark. # Standard Benchmark. *Based on standard investment of ` 10,000 made at the beginning of the relevant period. Past performance may or may not be sustained in future and should not be used as a basis for comparison with other investments.The above returns are as on October 29, 2021. For SIP Performance, please refer page no. 32W.e.f. April 02, 2018, the benchmark has been renamed from Nifty Free Float Midcap 100 Index to Nifty Midcap 100 TR IndexAniruddha Naha is managing this fund since April 05, 2018 and Mr. Vivek Sharma is managing this fund since June 01, 2021. For performance of schemes managed by Aniruddha Naha refer page no. 8, 9, 17. No other schemes are managed by Vivek Sharma.Different plans have a different expense structure. For Total Expense Ratio as on October 31, 2021 refer page no. 31
IDCW** HistoryRegular Plan Direct Plan
Record Date
IDCW**/unit (`)#
NAV (`) IDCW**/unit (`)#
NAV (`)
28-Mar-16 0.25 12.49 0.25 12.6329-Sep-16 0.30 14.44 — —29-Dec-16 0.30 12.84 — —24-Mar-17 0.30 14.55 — —29-Jun-17 0.30 14.99 — —28-Sep-17 0.30 14.50 — —28-Dec-17 0.30 16.18 — —23-Mar-18 1.33 14.31 — —02-Jul-18 0.27 13.18 — —28-Sep-18 0.27 11.77 — —28-Dec-18 0.27 11.51 — —25-Mar-19 0.27 11.38 — —28-Jun-19 0.27 11.22 — —30-Jun-20 0.18 11.08 — —31-Dec-20 0.30 15.86 — —26-Mar-21 0.36 17.61 — —25-Jun-21 0.36 20.47 — —
# On face value of ̀ 10. Post IDCW** per unit NAV will fall to the extent of the payout and applicable tax/surcharges/cess/other statutory levies. IDCW** distribution is subject to availability of distributable surplus. Past Performance may or may not be sustained in future.
Issuer % to Net AssetsAerospace & Defense 1.95Bharat Electronics Ltd. 1.95Auto 4.40Ashok Leyland Ltd. 3.32TVS Motor Company Ltd. 1.08Auto Ancillaries 0.97Minda Industries Ltd. 0.97Banks 9.89The Federal Bank Ltd. 3.40Canara Bank 2.53Indusind Bank Ltd. 1.88ICICI Bank Ltd. 1.21Indian Bank 0.86Cement & Cement Products 6.95Dalmia Bharat Ltd. 2.50ACC Ltd. 2.41Sagar Cements Ltd. 2.04Chemicals 7.18BASF India Ltd. 2.51Aarti Industries Ltd. 2.23Tata Chemicals Ltd. 1.33India Glycols Ltd. 1.12Construction 3.67Sobha Ltd. 2.60Kolte - Patil Developers Ltd. 1.08Consumer Durables 8.92Bata India Ltd. 2.74Voltas Ltd. 2.13Crompton Greaves Cons Electrical Ltd. 1.65Dixon Technologies (India) Ltd. 1.63Kajaria Ceramics Ltd. 0.77Consumer Non Durables 1.59Varun Beverages Limited 1.59Entertainment 1.78Zee Entertainment Enterprises Ltd. 1.78Ferrous Metals 0.77APL Apollo Tubes Ltd. 0.77
Portfolio
Portfolio Classification (%)Large Cap (%) (1st-100th stock) 3.11 Mid Cap (%) (101st-250th stock) 70.02 Small Cap (%) (251st stock onwards) 21.66 Cash (%) 5.21 Not Classified (%) —
Issuer % to Net AssetsGas 0.90Gujarat State Petronet Ltd. 0.90Healthcare Services 3.54Max Healthcare Institute Ltd. 2.35Syngene International Ltd. 1.20Industrial Capital Goods 4.56ABB India Ltd. 3.46Praj Industries Ltd. 1.10Industrial Products 9.92Timken India Ltd. 3.26Cummins India Ltd. 2.61Bharat Forge Ltd. 2.04SKF India Ltd. 2.01Insurance 2.98Max Financial Services Ltd. 2.98Leisure Services 1.71The Indian Hotels Company Ltd. 1.71Other Services 1.15Quess Corp Ltd. 1.15Pesticides 1.18Bharat Rasayan Ltd. 1.18Pharmaceuticals 7.05Sanofi India Ltd. 2.91JB Chemicals & Pharmaceuticals Ltd. 2.68Suven Pharmaceuticals Ltd. 1.46Software 14.49Mphasis Ltd. 4.50Mindtree Ltd. 3.54Coforge Ltd. 3.10L&T Technology Services Ltd. 1.74Affle (India) Ltd. 1.61Textile Products 0.81Gokaldas Exports Ltd. 0.81Cash & Current Assets 3.65Total 100.00
**Income Distribution cum Capital Withdrawal option
MIDCAP OPPORTUNITIES FUNDPGIM INDIA
Mid Cap Fund- An open ended equity scheme predominantly investing in mid cap stocks

10
Details as on October 31, 2021
This product is suitable for investors who are seeking*
• Capital appreciation over a long period of time.
• Investment in equity and equity related instruments of small cap companies.
• Degree of risk – VERY HIGH
* Investors should consult their financial advisers if in doubt about whether the product is suitable for them.
Scheme Riskometer
Moderate
Low to
Moderat
e
Low
ModeratelyHigh
Very High
High
RISKOMETER
Very High — investors understand that their principal will be at very high risk.
Benchmark Riskometer
Moderate
Low to
Moderat
e
Low
ModeratelyHigh
Very High
High
RISKOMETER
Nifty Small Cap 100 TRIBenchmark riskometer is at very high risk
Fund Details
Investment Objective: To achieve long term capital appreciation by predominantly investing in equity and equity related instruments of small cap companies.
Fund Manager: Mr. Aniruddha Naha (Over 18 years of experience in the equity and debt market), Mr. Kumaresh Ramakrishnan (Debt portion) (Over 20 years of experience in Fixed Income Market as a Fund Manager and Analyst) and Mr. Ravi Adukia (Overseas Investments) (Over 15 years of experience in Indian financial markets, primarily in equity research).
Benchmark: Nifty Small Cap 100 TRI
Option: IDCW** (Payout of Income Distribution cum Capital Withdrawal option / Reinvestment of Income Distribution cum Capital Withdrawal option) and Growth.
Quarterly (July-September 2021) Average AUM (` in Cr): 461.92
Monthly Average AUM (` in Cr): 1073.95
AUM as on 31/10/2021 (` in Cr): 1220.80
Portfolio Turnover: 0.43
NAV (as on 29/10/2021) Regular Plan Direct Plan
Growth ` 10.90 ` 10.96
IDCW** ` 10.90 ` 10.96
Load Structure$: Entry Load: NA. Exit Load: 10% of the units allotted may be redeemed/switched-out to debt schemes/PGIM India Arbitrage Fund without any exit load within 90 days from the date of allotment; Any redemptions/switch-outs in excess of the abovementioned limit would be subject to an exit load of 0.50%, if the units are redeemed/switched-out to debt schemes/PGIM India Arbitrage Fund within 90 days from the date of allotment of units; Nil - If the units are redeemed/ switched-out after 90 days from the date of allotment of units.
$No exit load will be charged for switches and STP between any open-ended equity schemes, hybrid schemes (except PGIM India Arbitrage Fund) and fund of funds schemes.
Regular Plan and Direct Plan are available for subscription as per the below details
Inception Date: Regular Plan: 29/07/2021, Direct Plan: 29/07/2021. Application Amount: ̀ 5000/- and in multiples of ̀ 1/- thereafter. Additional Purchase Amount: ̀ 1000/- and in multiples of ̀ 1/- thereafter. Repurchase / Redemption Amount: Minimum of ̀ 1000/- and in multiples of ̀ 1/- thereafter or account balance whichever is lower. SIP/Top Up SIP/STP/SWP: Available. Investment Amount: SIP: Monthly and Quarterly: 5 installments of ̀ 1000/- each and in multiples of ` 1/- thereafter. Top Up SIP: Monthly/Quarterly: ` 100/- and in multiples of ` 1/- thereafter. STP: Daily/Weekly/Monthly/Quarterly: 5 installments of ` 1000/- and in multiples of ` 1/- thereafter to all open ended schemes except PGIM India Long Term Equity Fund. SWP (Monthly and Quarterly): 5 (five) installments of ` 1000/- each and in multiples of ` 1/- thereafter.
Issuer % to Net Assets
Auto 4.32
Ashok Leyland Ltd. 2.81
V.S.T Tillers Tractors Ltd. 1.51
Auto Ancillaries 2.98
Subros Ltd. 1.48
Minda Corporation Ltd. 1.10
Jamna Auto Industries Ltd. 0.40
Banks 0.85
Indian Bank 0.85
Capital Markets 5.94
Multi Commodity Exchange Of India Ltd. 3.28
Central Depository Services (I) Ltd. 1.42
Computer Age Management Services Ltd. 1.23
Cement & Cement Products 4.48
Birla Corporation Ltd. 2.32
Sagar Cements Ltd. 2.16
Chemicals 4.43
BASF India Ltd. 2.68
India Glycols Ltd. 1.75
Commercial Services 1.46
SIS Ltd. 1.46
Construction 4.74
Sobha Ltd. 2.79
Kolte - Patil Developers Ltd. 1.95
Consumer Durables 7.46
Stove Kraft Ltd. 1.95
Pokarna Ltd. 1.84
Orient Electric Ltd. 1.46
Greenply Industries Ltd. 1.29
Somany Ceramics Ltd. 0.93
Entertainment 1.78
Inox Leisure Ltd. 1.78
Ferrous Metals 1.47
Vardhman Special Steels Ltd. 0.92
Shyam Metalics And Energy Ltd. 0.55
Portfolio
Portfolio Classification (%)
Large Cap (%) (1st-100th stock) —
Mid Cap (%) (101st-250th stock) 16.65
Small Cap (%) (251st stock onwards) 73.23
Cash (%) 10.12
Not Classified (%) —
Issuer % to Net AssetsFinance 2.55
Can Fin Homes Ltd. 2.55
Healthcare Services 3.08
Krishna Inst Of Medical Sciences Ltd. 3.08
Industrial Capital Goods 2.85
Praj Industries Ltd. 1.73
The Anup Engineering Ltd. 1.11
Industrial Products 16.27
Timken India Ltd. 4.05
KEI Industries Ltd. 3.83
SKF India Ltd. 2.72
Graphite India Ltd. 2.20
Esab India Ltd. 2.08
John Cockerill India Ltd. 0.70
Carborundum Universal Ltd. 0.69
Other Consumer Services 0.70
MPS Ltd. 0.70
Paper 1.85
JK Paper Ltd. 1.85
Pharmaceuticals 5.82
JB Chemicals & Pharmaceuticals Ltd. 4.03
Suven Pharmaceuticals Ltd. 1.25
Sequent Scientific Ltd. 0.54
Software 13.47
Mphasis Ltd. 3.65
Coforge Ltd. 2.57
Firstsource Solutions Ltd. 2.43
Persistent Systems Ltd. 2.25
Affle (India) Ltd. 1.75
Newgen Software Technologies Ltd. 0.81
Textile Products 2.84
TCNS Clothing Company Ltd. 1.50
Gokaldas Exports Ltd. 1.34
Textiles - Cotton 1.75
Vardhman Textiles Ltd. 1.75
Cash & Current Assets 8.94
Total 100.00
**Income Distribution cum Capital Withdrawal option
Returns are not provided as the scheme has not completed six months since inception.
Different plans have a different expense structure. For Total Expense Ratio as on October 31, 2021 refer page no. 31
SMALL CAP FUNDPGIM INDIA
An open-ended equity scheme predominantly investing in small cap stocks

11
Portfolio Classification (%)
Large Cap (%) (1st-100th stock) 75.28
Mid Cap (%) (101st-250th stock) 9.59
Small Cap (%) (251st stock onwards) 13.39
Cash (%) 1.74
Not Classified (%) —
Fund Details
Investment Objective: The primary objective of the Scheme is to generate long-term capital appreciation by predominantly investing in equity & equity related instruments and to enable eligible investors to avail deduction from total income, as permitted under the Income Tax Act, 1961 as amended from time to time.
Fund Manager: Mr. Srinivas Rao Ravuri (Over 24 years of experience in Indian financial markets, primarily in equity research & Fund Management) and Mr. Utkarsh Katkoria (Over 14 years of experience in Indian financial markets, primarily in equity research).
Benchmark: S&P BSE 200 TR Index
Option: IDCW** (Payout of Income Distribution cum Capital Withdrawal option) and Growth.
Quarterly (July-September 2021) Average AUM (` in Cr): 353.68
Monthly Average AUM (` in Cr): 348.99
AUM as on 31/10/2021 (` in Cr): 333.83
Portfolio Turnover: 0.19
Volatility Measures (5 Years):
Standard Deviation of Fund (Annual): 16.77%
Standard Deviation of Benchmark (Annual): 17.90%
Beta: 0.91 Sharpe Ratio***: 0.59
*** Risk Free Rate assumed to be 5.27% (based on MIBOR as on 31/10/2021)
NAV (29/10/2021) Regular Plan Direct Plan
Growth ` 23.13 ` 25.05
IDCW** ` 17.03 ` 17.13
Load Structure$: Entry Load: NA. Exit Load: Nil
$No exit load will be charged for switches and STP between any openended equity schemes, hybrid schemes (except PGIM India Arbitrage Fund) and fund of funds schemes.
Regular Plan and Direct Plan are available for subscription as per the below detailsInception Date: Regular Plan: 11/12/2015, Direct Plan: 11/12/2015. Application Amount: Minimum of ` 500/- and in multiples of ` 500/- thereafter. Additional Purchase Amount: Minimum of ` 500/- and in multiples of ` 500/- thereafter. Repurchase / Redemption Amount: Minimum of ` 1000/- and in multiples of ` 1/- thereafter or account balance whichever is lower. SIP/Top Up SIP/STP/SWP: Available. Investment Amount: SIP: Monthly: 12 installments of ` 500/- each and in multiples of ` 500/- thereafter or 6 installments of ` 1000/- each and in multiples of ` 500/- thereafter. Quarterly: 6 installments of ` 1000/- each and in multiples of ` 500/- thereafter. Top Up SIP: Monthly: ` 500/- each and in multiples of ` 500/- thereafter. Quarterly: ` 1000/- each and in multiples of ` 500/- thereafter. STP: Daily: 12 installments of ` 500/- and in multiples of ` 500/- thereafter. Weekly/Monthly/Quarterly: 6 installments of ` 1000/- each and in multiples of ` 500/- thereafter. PGIM India Long Term Equity Fund is only a Target Scheme under the STP Facility. SWP (Monthly and Quarterly): 5 (five) installments of ` 1000/- each and in multiples of ` 1/- thereafter.
This product is suitable for investors who are seeking*• Long-term capital appreciation• To generate long-term capital appreciation by
predominantly investing in equity & equity related instruments and to enable eligible investors to avail deduction from total income, as permitted under the Income Tax Act, 1961 as amended from time to time.
• Degree of risk – VERY HIGH
* Investors should consult their financial advisers if in doubt about whether the product is suitable for them.
Scheme Riskometer
Moderate
Low to
Moderat
e
Low
ModeratelyHigh
Very High
High
RISKOMETER
Very High — investors understand that their principal will be at very high risk.
Benchmark Riskometer
Moderate
Low to
Moderat
e
Low
ModeratelyHigh
Very High
High
RISKOMETER
S&P BSE 200 TR IndexBenchmark riskometer is at very high risk
Performance (CAGR)Fund S&P BSE 200 TR Index^ NIFTY 50 TR Index #
Period Returns (%) Value (INR)* Returns (%) Value (INR)* Returns (%) Value (INR)*
Regular Plan - Growth Option
Last 1 Year 62.77 16,277.27 57.34 15,734.41 53.54 15,354.21
Last 3 Years 20.90 17,679.17 21.31 17,862.26 20.79 17,634.61
Last 5 Years 15.18 20,279.54 16.68 21,638.57 16.83 21,770.60
Since Inception 15.31 23,130.00 17.24 25,503.77 16.85 25,019.16
Direct Plan - Growth Option
Last 1 Year 64.59 16,458.61 57.34 15,734.41 53.54 15,354.21
Last 3 Years 22.55 18,415.84 21.31 17,862.26 20.79 17,634.61
Last 5 Years 16.91 21,848.93 16.68 21,638.57 16.83 21,770.60
Since Inception 16.88 25,050.00 17.24 25,503.77 16.85 25,019.16
Date of Inception: Regular Plan: December 11, 2015; Direct Plan: December 11, 2015. CAGR – Compounded Annual Growth Rate^ Scheme Benchmark. # Standard Benchmark. *Based on standard investment of ` 10,000 made at the beginning of the relevant period. Past performance may or may not be sustained in future and should not be used as a basis for comparison with other investments.The above returns are as on October 29, 2021. For SIP Performance, please refer page no. 32Srinivas Rao Ravuri is managing this fund since September 14, 2019 and Mr. Utkarsh Katkoria is managing this fund since June 01, 2021. No other scheme is managed by Srinivas Rao Ravuri. For performance of schemes managed by Utkarsh Katkoria refer page no. 11, 15.Different plans have a different expense structure. For Total Expense Ratio as on October 31, 2021 refer page no. 31
Portfolio
Issuer % to Net Assets
Auto 1.56Mahindra & Mahindra Ltd. 1.56Auto Ancillaries 1.45Minda Industries Ltd. 1.45Banks 25.54ICICI Bank Ltd. 8.90HDFC Bank Ltd. 5.79State Bank Of India 5.48The Federal Bank Ltd. 1.99City Union Bank Ltd. 1.84Kotak Mahindra Bank Ltd. 1.54Construction Project 5.06Larsen & Toubro Ltd. 5.06Consumer Durables 1.70Crompton Greaves Cons Electrical Ltd. 1.70Consumer Non Durables 5.76ITC Ltd. 3.01Hindustan Unilever Ltd. 1.65Sirca Paints India Ltd. 1.10Ferrous Metals 0.99Tata Steel Ltd. 0.99Finance 3.04Housing Development Finance Corporation Ltd. 3.04Industrial Capital Goods 3.13Praj Industries Ltd. 3.13
Issuer % to Net AssetsOther Services 2.37Quess Corp Ltd. 2.37Petroleum Products 7.30Reliance Industries Ltd. 4.65Hindustan Petroleum Corporation Ltd. 2.65Pharmaceuticals 10.14Sun Pharmaceutical Industries Ltd. 3.38Cipla Ltd. 3.06Gland Pharma Ltd. 1.88Aurobindo Pharma Ltd. 1.82Power 5.07Power Grid Corporation Of India Ltd. 2.72NTPC Ltd. 2.35Software 16.81Infosys Ltd. 7.35HCL Technologies Ltd. 3.12Kpit Technologies Ltd. 2.33Newgen Software Technologies Ltd. 2.11Tata Consultancy Services Ltd. 1.89Telecom - Services 5.77Bharti Airtel Ltd. 5.60Bharti Airtel Ltd. 0.17Textiles - Cotton 2.40Vardhman Textiles Ltd. 2.40Cash & Current Assets 1.92Total 100.00
IDCW** History
Regular Plan Direct Plan
Record Date
IDCW**/unit (`)#
NAV (`) IDCW**/unit (`)#
NAV (`)
29-Jun-17 0.24 12.15 0.24 12.32
28-Sep-17 0.24 12.15 0.25 12.36
28-Dec-17 0.24 13.06 0.25 13.32
23-Mar-18 0.80 11.86 1.12 12.03
02-Jul-18 0.21 11.49 0.21 11.38
28-Sep-18 0.18 11.20 0.21 11.12
28-Jun-19 0.03 11.72 — —
27-Sep-19 0.10 11.43 0.03 11.02
26-Dec-19 0.16 11.45 — —
31-Dec-20 0.25 13.44 0.26 13.45
26-Mar-21 0.27 14.00 0.29 14.03
25-Jun-21 0.27 15.70 0.29 15.75
# On face value of ̀ 10. Post IDCW** per unit NAV will fall to the extent of the payout and applicable tax/surcharges/cess/other statutory levies. IDCW** distribution is subject to availability of distributable surplus. Past Performance may or may not be sustained in future.
Details as on October 31, 2021
**Income Distribution cum Capital Withdrawal option
LONG TERM EQUITY FUNDPGIM INDIA
An Open Ended Equity Linked Savings Scheme with a statutory lock-in of 3 years and tax benefit

12
Performance (CAGR)Fund CRISIL Hybrid 35+65 - Aggresive Index^ Nifty 50 TR Index #
Period Returns (%) Value (INR)* Returns (%) Value (INR)* Returns (%) Value (INR)*Regular Plan - Growth Option
Last 1 Year 41.51 14,151.00 36.56 13,656.26 53.54 15,354.21 Last 3 Years 15.71 15,498.02 17.96 16,420.40 20.79 17,634.61 Last 5 Years 10.48 16,460.84 13.99 19,253.90 16.83 21,770.60 Since Inception 13.75 98,590.00 12.96 87,169.77 15.05 1,20,615.48 Direct Plan - Growth Option
Last 1 Year 43.88 14,388.22 36.56 13,656.26 53.54 15,354.21 Last 3 Years 17.56 16,252.44 17.96 16,420.40 20.79 17,634.61 Last 5 Years 12.17 17,765.04 13.99 19,253.90 16.83 21,770.60 Since Inception 13.28 30,075.94 13.33 30,179.66 14.53 33,121.72 Date of Inception: Regular Plan: January 29, 2004; Direct Plan: January 01, 2013. CAGR – Compounded Annual Growth Rate^ Scheme Benchmark. # Standard Benchmark. *Based on standard investment of ` 10,000 made at the beginning of the relevant period. Past performance may or may not be sustained in future and should not be used as a basis for comparison with other investments.The above returns are as on October 29, 2021. For SIP Performance, please refer page no. 32## The benchmark of the scheme has been changed from BSE 200 Index to CRISIL Balanced Fund - Aggresive Index w.e.f. close of business hours March 04, 2016, pursuant to change in fundamental attributes of the scheme. Hence, 3 years data of qualitative/volatility measures has also been shown to reflect the correct risk attribute of the scheme. Further, the name of the benchmark has been changed from CRISIL Balanced Fund - Aggresive Index to CRISIL Hybrid 35+65 - Aggresive Index w.e.f. January 31, 2018.The debt component of the benchmark is TRI since inception. For equity component of the benchmark, i.e. S&P BSE 200 PRI value is used till 31st July 2006 and TRI is used since 1st Aug 2006.Scheme performance may not strictly be comparable with that of its Standard Benchmark in view of balanced nature of the scheme where a portion of scheme’s investments are made in debt instruments.Alok Agarwal (Equity Portion) is managing this scheme since June 2016 and Kumaresh Ramakrishnan (Debt Portion) is managing this scheme since April 05, 2018 and Ravi Adukia (Overseas Investments) is managing this scheme since June 01, 2021. For performance of schemes managed by Kumaresh Ramakrishnan refer page no. 12, 15-17, 20-24, 27, 31. For performance of schemes managed by Alok Agarwal refer page no. 7, 12, 16, 31. For performance of schemes managed by Ravi Adukia refer page no. 8, 12, 13, 14, 17.Different plans have a different expense structure. For Total Expense Ratio as on October 31, 2021 refer page no. 31.
IDCW** HistoryRegular Plan Direct Plan
Record Date
IDCW**/unit (`)#
NAV (`) IDCW**/unit (`)#
NAV (`)
IDCW**
25-Sep-20 0.22 11.74 0.39 19.38
31-Dec-20 0.23 13.59 0.43 22.48
26-Mar-21 0.25 13.67 0.45 22.64
MONTHLY IDCW**
17-Aug-21 0.13 24.17 0.15 25.45
17-Sep-21 0.13 24.93 0.16 26.27
14-Oct-21 0.13 25.90 0.16 27.29
# On face value of ̀ 10. Post IDCW** per unit NAV will fall to the extent of the payout and applicable tax/surcharges/cess/other statutory levies. IDCW** distrib ution is subject to availability of distributable surplus. Past Performance may or may not be sustained in future.
PortfolioIssuer % to Net
AssetsRating
Auto 1.92Mahindra & Mahindra Ltd. 1.92Auto Ancillaries 0.99Endurance Technologies Ltd. 0.99Banks 10.67HDFC Bank Ltd. 4.20Kotak Mahindra Bank Ltd. 2.53State Bank Of India 1.39Axis Bank Ltd. 1.31ICICI Bank Ltd. 1.24Capital Markets 0.92Multi Commodity Exchange Of India Ltd. 0.92Cement & Cement Products 1.54Sagar Cements Ltd. 1.54Chemicals 6.25Pidilite Industries Ltd. 1.25Chemplast Sanmar Ltd. 1.23Aarti Industries Ltd. 1.04Atul Ltd. 0.98Gujarat Alkalies And Chemicals Ltd. 0.77Nocil Ltd. 0.68Phillips Carbon Black Ltd. 0.29Construction 1.27Oberoi Realty Ltd. 1.27Consumer Non Durables 5.75United Spirits Ltd. 1.28United Breweries Ltd. 1.26Varun Beverages Limited 1.15Tata Consumer Products Ltd. 1.05Asian Paints Ltd. 1.01Ferrous Metals 0.76Steel Authority Of India Ltd. 0.76Fertilisers 0.81Coromandel International Ltd. 0.81Finance 2.54Muthoot Finance Ltd. 1.43Housing Development Finance Corp. Ltd. 1.11Gas 0.89Gujarat State Petronet Ltd. 0.89Healthcare Services 0.38Syngene International Ltd. 0.38Industrial Capital Goods 0.52ABB India Ltd. 0.52Industrial Products 5.86Esab India Ltd. 1.18KEI Industries Ltd. 1.14Astral Ltd. 1.14SKF India Ltd. 1.08Bharat Forge Ltd. 0.83
Details as on October 31, 2021
This product is suitable for investors who are seeking*
• Capital growth over the long term
• Investing predominantly in equity and equity related securities.
• Degree of risk – VERY HIGH
* Investors should consult their financial advisers if in doubt about whether the product is suitable for them.
Scheme Riskometer
Moderate
Low to
Moderat
e
Low
ModeratelyHigh
Very High
High
RISKOMETER
Very High — investors understand that their principal will be at very high risk.
Benchmark Riskometer
Moderate
Low to
Moderat
e
Low
ModeratelyHigh
Very High
High
RISKOMETER
CRISIL Hybrid 35+65 - Aggresive IndexBenchmark riskometer is at very high risk
Fund Details
Investment Objective: The investment objective of the scheme is to seek to generate long term capital appreciation and income from a portfolio of equity and equity related securities as well as fixed income securities.
Fund Manager: Mr. Alok Agarwal (Equity portion) (Over 17 years of experience in equity market & Finance) and Mr. Kumaresh Ramakrishnan (Debt portion) (Over 20 years of experience in Fixed Income markets as Fund Manager and Analyst) and Mr. Ravi Adukia (Overseas Investments) (Over 15 years of experience in Indian financial markets, primarily in equity research).
Benchmark: CRISIL Hybrid 35+65 - Aggresive Index##
Option: IDCW**, Monthly IDCW** - (Payout of Income Distribution cum Capital Withdrawal option / Reinvestment of Income Distribution cum Capital Withdrawal option) and Growth.
Quarterly (July-September 2021) Average AUM (` in Cr): 136.33
Monthly Average AUM (` in Cr): 178.25
AUM as on 31/10/2021 (` in Cr.): 184.55
Portfolio Turnover: 1.72 (For Equity)
For Debt part of the Portfolio:
Average Maturity: 0.33 yrs Modified Duration: 0.28 yrs
Portfolio Yield: 3.71%
Volatility Measures 3 Years## 6 Years
Standard Deviation of Fund (Annual) 15.72% 12.83%
Standard Deviation of Benchmark (Annual) 13.46% 11.24%
Beta 1.12 1.08
Sharpe Ratio*** 0.65 0.34
*** Risk Free Rate assumed to be 5.51% (based on MIBOR as on 31/10/2021)
NAV (as on 29/10/2021) Regular Plan Direct Plan
Growth ` 98.59 ` 110.89
IDCW** ` 16.26 ` 27.17
Monthly IDCW** ` 24.88 ` 26.22
Load Structure$: Entry Load: NA Exit Load: (w.e.f. January 13, 2021) 10% of the units allotted may be redeemed/switched-out to debt schemes/PGIM India Arbitrage Fund without any exit load within 90 days from the date of allotment of units; Any redemptions/switch-outs in excess of the abovementioned limit would be subject to an exit load of 0.50%, if the units are redeemed/switched-out to debt schemes/PGIM India Arbitrage Fund within 90 days from the date of allotment of units; Nil - If the units are redeemed/switched-out after 90 days from the date of allotment of units.$No exit load will be charged for switches and STP between any open-ended equity schemes, hybrid schemes (except PGIM India Arbitrage Fund) and fund of funds schemes.
Regular Plan and Direct Plan are available for subscription as per the below detailsInception Date: Regular Plan: 29/01/2004, Direct Plan: 01/01/2013. Application Amount: ` 5000/- and in multiples of ` 1/- thereafter. Additional Purchase Amount: ` 1000/- and in multiples of ` 1/- thereafter. Repurchase / Redemption Amount: Minimum of ̀ 1000/- and in multiples of ̀ 1/- thereafter or account balance whichever is lower. SIP/Top Up SIP/STP/SWP: Available. Investment Amount: SIP: Monthly and Quarterly: 5 installments of ` 1000/- each and in multiples of ` 1/- thereafter. Top Up SIP: Monthly/Quarterly: ` 100/- each and in multiples of ` 1/- thereafter. STP: Daily/Weekly/Monthly/Quarterly: 5 installments of ` 1000/- and in multiples of ` 1/- thereafter to all open ended schemes except PGIM India Long Term Equity Fund. SWP (Monthly and Quarterly): 5 (five) installments of ` 1000/- each and in multiples of ` 1/- thereafter.
Portfolio Classification (%)**Large Cap (%) (1st-100th stock) 55.47 Mid Cap (%) (101st-250th stock) 26.60 Small Cap (%) (251st stock onwards) 16.04 Not Classified 1.89
** The above data is given for equity allocation
Issuer % to Net Assets
Rating
Supreme Industries Ltd. 0.50Insurance 1.52HDFC Life Insurance Company Ltd. 0.83ICICI Lombard General Insurance Co. Ltd. 0.68Leisure Services 0.72Jubilant Foodworks Ltd. 0.72Pesticides 2.58P I Industries Limited 0.98Bayer Cropscience Ltd. 0.95Dhanuka Agritech Ltd. 0.66Petroleum Products 4.81Reliance Industries Ltd. 4.81Pharmaceuticals 0.80Abbott India Ltd. 0.54JB Chemicals & Pharmaceuticals Ltd. 0.25Power 2.08Tata Power Company Ltd. 1.51Torrent Power Ltd. 0.57Retailing 1.08Indiamart Intermesh Ltd. 1.08Software 4.06Tech Mahindra Ltd. 1.60Infosys Ltd. 0.98Tata Consultancy Services Ltd. 0.87HCL Technologies Ltd. 0.62Telecom - Services 0.65Sterlite Technologies Ltd. 0.65Textiles - Synthetic 0.75Garware Technical Fibres Ltd. 0.75Equity Holdings Total 60.11Mutual Funds/Exchange Traded 10.73PGIM Jennsn GLEQ OP-USD AC I 10.73Equity Futures 4.68Oil & Natural Gas Corporation Ltd. 1.87HDFC Bank Ltd. 1.42State Bank Of India 1.39Corporate Debt 3.27Non-Convertible Debentures 3.27Small Industries Development Bank Of India 1.66 CARE AAAJamnagar Utilities & Power Pvt. Ltd. 1.62 CRISIL AAAGovernment Bond And Treasury Bill 5.48Government Bond 2.79Government Of India 2.79 SOVEREIGNTreasury Bill 2.69182 Days Tbill Red 2021 2.69 SOVEREIGNState Government Bond 0.00State Government Of Andhra Pradesh 0.00 SOVEREIGNCash & Current Assets 15.73Total 100.00
**Income Distribution cum Capital Withdrawal option
HYBRID EQUITY FUNDPGIM INDIA
An open ended hybrid scheme investing predominantly in equity and equity related instruments
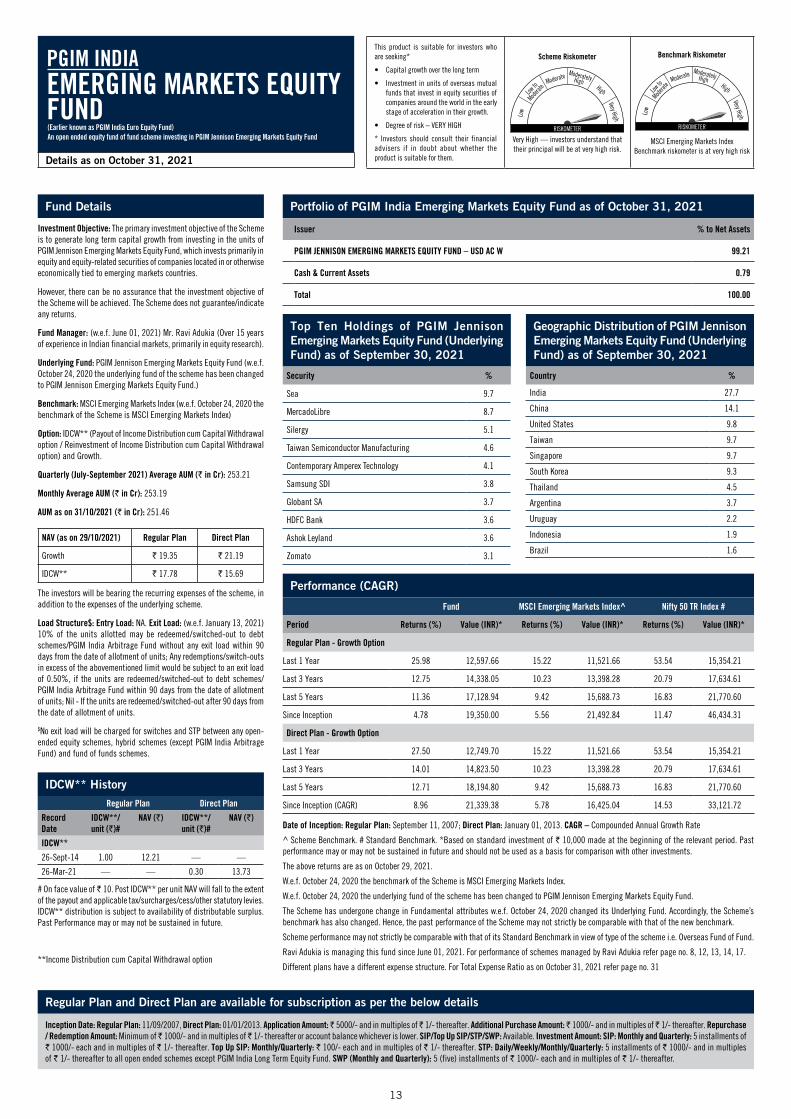
13
Fund Details
Investment Objective: The primary investment objective of the Scheme is to generate long term capital growth from investing in the units of PGIM Jennison Emerging Markets Equity Fund, which invests primarily in equity and equity-related securities of companies located in or otherwise economically tied to emerging markets countries.
However, there can be no assurance that the investment objective of the Scheme will be achieved. The Scheme does not guarantee/indicate any returns.
Fund Manager: (w.e.f. June 01, 2021) Mr. Ravi Adukia (Over 15 years of experience in Indian financial markets, primarily in equity research).
Underlying Fund: PGIM Jennison Emerging Markets Equity Fund (w.e.f. October 24, 2020 the underlying fund of the scheme has been changed to PGIM Jennison Emerging Markets Equity Fund.)
Benchmark: MSCI Emerging Markets Index (w.e.f. October 24, 2020 the benchmark of the Scheme is MSCI Emerging Markets Index)
Option: IDCW** (Payout of Income Distribution cum Capital Withdrawal option / Reinvestment of Income Distribution cum Capital Withdrawal option) and Growth.
Quarterly (July-September 2021) Average AUM (` in Cr): 253.21
Monthly Average AUM (` in Cr): 253.19
AUM as on 31/10/2021 (` in Cr): 251.46
NAV (as on 29/10/2021) Regular Plan Direct Plan
Growth ` 19.35 ` 21.19
IDCW** ` 17.78 ` 15.69
The investors will be bearing the recurring expenses of the scheme, in addition to the expenses of the underlying scheme.
Load Structure$: Entry Load: NA. Exit Load: (w.e.f. January 13, 2021) 10% of the units allotted may be redeemed/switched-out to debt schemes/PGIM India Arbitrage Fund without any exit load within 90 days from the date of allotment of units; Any redemptions/switch-outs in excess of the abovementioned limit would be subject to an exit load of 0.50%, if the units are redeemed/switched-out to debt schemes/PGIM India Arbitrage Fund within 90 days from the date of allotment of units; Nil - If the units are redeemed/switched-out after 90 days from the date of allotment of units.
$No exit load will be charged for switches and STP between any open-ended equity schemes, hybrid schemes (except PGIM India Arbitrage Fund) and fund of funds schemes.
Portfolio of PGIM India Emerging Markets Equity Fund as of October 31, 2021
Issuer % to Net Assets
PGIM JENNISON EMERGING MARKETS EQUITY FUND – USD AC W 99.21
Cash & Current Assets 0.79
Total 100.00
This product is suitable for investors who are seeking*
• Capital growth over the long term
• Investment in units of overseas mutual funds that invest in equity securities of companies around the world in the early stage of acceleration in their growth.
• Degree of risk – VERY HIGH
* Investors should consult their financial advisers if in doubt about whether the product is suitable for them.
Scheme Riskometer
Moderate
Low to
Moderat
e
Low
ModeratelyHigh
Very High
High
RISKOMETER
Very High — investors understand that their principal will be at very high risk.
Benchmark Riskometer
Moderate
Low to
Moderat
e
Low
ModeratelyHigh
Very High
High
RISKOMETER
MSCI Emerging Markets IndexBenchmark riskometer is at very high risk
Regular Plan and Direct Plan are available for subscription as per the below details
Inception Date: Regular Plan: 11/09/2007, Direct Plan: 01/01/2013. Application Amount: ̀ 5000/- and in multiples of ̀ 1/- thereafter. Additional Purchase Amount: ̀ 1000/- and in multiples of ̀ 1/- thereafter. Repurchase / Redemption Amount: Minimum of ̀ 1000/- and in multiples of ̀ 1/- thereafter or account balance whichever is lower. SIP/Top Up SIP/STP/SWP: Available. Investment Amount: SIP: Monthly and Quarterly: 5 installments of ` 1000/- each and in multiples of ` 1/- thereafter. Top Up SIP: Monthly/Quarterly: ` 100/- each and in multiples of ` 1/- thereafter. STP: Daily/Weekly/Monthly/Quarterly: 5 installments of ` 1000/- and in multiples of ` 1/- thereafter to all open ended schemes except PGIM India Long Term Equity Fund. SWP (Monthly and Quarterly): 5 (five) installments of ` 1000/- each and in multiples of ` 1/- thereafter.
Performance (CAGR)
Fund MSCI Emerging Markets Index^ Nifty 50 TR Index #
Period Returns (%) Value (INR)* Returns (%) Value (INR)* Returns (%) Value (INR)*
Regular Plan - Growth Option
Last 1 Year 25.98 12,597.66 15.22 11,521.66 53.54 15,354.21
Last 3 Years 12.75 14,338.05 10.23 13,398.28 20.79 17,634.61
Last 5 Years 11.36 17,128.94 9.42 15,688.73 16.83 21,770.60
Since Inception 4.78 19,350.00 5.56 21,492.84 11.47 46,434.31
Direct Plan - Growth Option
Last 1 Year 27.50 12,749.70 15.22 11,521.66 53.54 15,354.21
Last 3 Years 14.01 14,823.50 10.23 13,398.28 20.79 17,634.61
Last 5 Years 12.71 18,194.80 9.42 15,688.73 16.83 21,770.60
Since Inception (CAGR) 8.96 21,339.38 5.78 16,425.04 14.53 33,121.72
Date of Inception: Regular Plan: September 11, 2007; Direct Plan: January 01, 2013. CAGR – Compounded Annual Growth Rate
^ Scheme Benchmark. # Standard Benchmark. *Based on standard investment of ` 10,000 made at the beginning of the relevant period. Past performance may or may not be sustained in future and should not be used as a basis for comparison with other investments.
The above returns are as on October 29, 2021.
W.e.f. October 24, 2020 the benchmark of the Scheme is MSCI Emerging Markets Index.
W.e.f. October 24, 2020 the underlying fund of the scheme has been changed to PGIM Jennison Emerging Markets Equity Fund.
The Scheme has undergone change in Fundamental attributes w.e.f. October 24, 2020 changed its Underlying Fund. Accordingly, the Scheme’s benchmark has also changed. Hence, the past performance of the Scheme may not strictly be comparable with that of the new benchmark.
Scheme performance may not strictly be comparable with that of its Standard Benchmark in view of type of the scheme i.e. Overseas Fund of Fund.
Ravi Adukia is managing this fund since June 01, 2021. For performance of schemes managed by Ravi Adukia refer page no. 8, 12, 13, 14, 17.
Different plans have a different expense structure. For Total Expense Ratio as on October 31, 2021 refer page no. 31
Geographic Distribution of PGIM Jennison Emerging Markets Equity Fund (Underlying Fund) as of September 30, 2021
Country %
India 27.7
China 14.1
United States 9.8
Taiwan 9.7
Singapore 9.7
South Korea 9.3
Thailand 4.5
Argentina 3.7
Uruguay 2.2
Indonesia 1.9
Brazil 1.6
Top Ten Holdings of PGIM Jennison Emerging Markets Equity Fund (Underlying Fund) as of September 30, 2021
Security %
Sea 9.7
MercadoLibre 8.7
Silergy 5.1
Taiwan Semiconductor Manufacturing 4.6
Contemporary Amperex Technology 4.1
Samsung SDI 3.8
Globant SA 3.7
HDFC Bank 3.6
Ashok Leyland 3.6
Zomato 3.1
Details as on October 31, 2021
**Income Distribution cum Capital Withdrawal option
IDCW** HistoryRegular Plan Direct Plan
Record Date
IDCW**/unit (`)#
NAV (`) IDCW**/unit (`)#
NAV (`)
IDCW**
26-Sept-14 1.00 12.21 — —
26-Mar-21 — — 0.30 13.73
# On face value of ̀ 10. Post IDCW** per unit NAV will fall to the extent of the payout and applicable tax/surcharges/cess/other statutory levies. IDCW** distrib ution is subject to availability of distributable surplus. Past Performance may or may not be sustained in future.
EMERGING MARKETS EQUITYFUND
PGIM INDIA
(Earlier known as PGIM India Euro Equity Fund)An open ended equity fund of fund scheme investing in PGIM Jennison Emerging Markets Equity Fund

14
Fund Details
Investment Objective: The primary investment objective of the Scheme is to generate long term capital growth from a diversified portfolio of units of overseas mutual funds. However, there can be no assurance that the investment objective of the Scheme will be achieved. The Scheme does not guarantee/ indicate any returns.
Fund Manager: (w.e.f. June 01, 2021) Mr. Ravi Adukia (Over 15 years of experience in Indian financial markets, primarily in equity research).
Underlying Fund: PGIM Jennison Global Equity Opportunities Fund
Benchmark: MSCI All Country World Index
Option: IDCW** (Payout of Income Distribution cum Capital Withdrawal option / Reinvestment of Income Distribution cum Capital Withdrawal option) and Growth.
Quarterly (July-September 2021) Average AUM (` in Cr): 1427.91
Monthly Average AUM (` in Cr): 1617.78
AUM as on 31/10/2021 (` in Cr): 1717.41
NAV (as on 29/10/2021) Regular Plan Direct Plan
Growth ` 40.14 ` 43.80
IDCW** ` 36.08 ` 43.80
The investors will be bearing the recurring expenses of the scheme, in addition to the expenses of the underlying scheme.
Load Structure$: Entry Load: NA. Exit Load: (w.e.f. January 13, 2021) 10% of the units allotted may be redeemed/switched-out to debt schemes/PGIM India Arbitrage Fund without any exit load within 90 days from the date of allotment of units; Any redemptions/switch-outs in excess of the abovementioned limit would be subject to an exit load of 0.50%, if the units are redeemed/switched-out to debt schemes/PGIM India Arbitrage Fund within 90 days from the date of allotment of units; Nil - If the units are redeemed/switched-out after 90 days from the date of allotment of units.
$No exit load will be charged for switches and STP between any open-ended equity schemes, hybrid schemes (except PGIM India Arbitrage Fund) and fund of funds schemes.
Portfolio of PGIM India Global Equity Opportunities Fund as of October 31, 2021
Issuer % to Net Assets
PGIM JENNSN GLEQ OP-USD AC I 99.33
Cash & Current Assets 0.67
Total 100.00
Top Ten Holdings of PGIM Jennison Global Equity Opportunities Fund (Underlying Fund) as of September 30, 2021
Security Ending Weight (% of equity)
Tesla 6.0
Sea 5.4
Apple 4.9
Adyen 4.5
MercadoLibre 4.3
NVIDIA 4.2
Shopify - Class A 4.2
LVMH Moet Hennessy Louis Vuitton 4.0
Alphabet - Class A 3.6
Atlassian - Class A 3.6
Geographic Distribution of PGIM Jennison Global Equity Opportunities Fund (Underlying Fund) as of September 30, 2021
Country %
United States 56.6
France 13.0
Netherlands 7.8
Singapore 5.4
Switzerland 4.8
Canada 4.2
Hong Kong 2.4
Italy 2.1
Germany 1.8
Uruguay 0.8
This product is suitable for investors who are seeking*
• Capital growth over the long term
• Investment in units of overseas mutual funds that invest in equity securities of companies around the world in the early stage of acceleration in their growth.
• Degree of risk – VERY HIGH
* Investors should consult their financial advisers if in doubt about whether the product is suitable for them.
Scheme Riskometer
Moderate
Low to
Moderat
e
Low
ModeratelyHigh
Very High
High
RISKOMETER
Very High — investors understand that their principal will be at very high risk.
Benchmark Riskometer
Moderate
Low to
Moderat
e
Low
ModeratelyHigh
Very High
High
RISKOMETER
MSCI All Country World IndexBenchmark riskometer is at very high risk
Regular Plan and Direct Plan are available for subscription as per the below details
Inception Date: Regular Plan: 14/05/2010, Direct Plan: 01/01/2013. Application Amount: ̀ 5000/- and in multiples of ̀ 1/- thereafter. Additional Purchase Amount: ̀ 1000/- and in multiples of ̀ 1/- thereafter. Repurchase / Redemption Amount: Minimum of ̀ 1000/- and in multiples of ̀ 1/- thereafter or account balance whichever is lower. SIP/Top Up SIP/STP/SWP: Available. Investment Amount: SIP: Monthly and Quarterly: 5 installments of ̀ 1000/- each and in multiples of ` 1/- thereafter. Top Up SIP: Monthly/Quarterly: ` 100/- each and in multiples of ` 1/- thereafter. STP: Daily/Weekly/Monthly/Quarterly: 5 installments of ` 1000/- and in multiples of ` 1/- thereafter to all open ended schemes except PGIM India Long Term Equity Fund. SWP (Monthly and Quarterly): 5 (five) installments of ` 1000/- each and in multiples of ` 1/- thereafter.
IDCW** History
Regular Plan Direct Plan
Record Date
IDCW**/unit (`)#
NAV (`) IDCW**/unit (`)#
NAV (`)
18-Mar-14 1.00 15.94 — —
31-Dec-20 0.64 33.02 — —
26-Mar-21 0.64 28.73 — —
# On face value of ̀ 10. Post IDCW** per unit NAV will fall to the extent of the payout and applicable tax/surcharges/cess/other statutory levies. IDCW** distribution is subject to availability of distributable surplus. Past Performance may or may not be sustained in future.
Performance (CAGR)
Fund MSCI All Country World Index^ Nifty 50 TR Index #
Period Returns (%) Value (INR)* Returns (%) Value (INR)* Returns (%) Value (INR)*
Regular Plan - Growth Option
Last 1 Year 31.01 13,100.52 35.96 13,595.85 53.54 15,354.21
Last 3 Years 33.34 23,728.09 15.90 15,576.07 20.79 17,634.61
Last 5 Years 24.80 30,289.87 15.28 20,363.23 16.83 21,770.60
Since Inception 12.88 40,140.00 13.53 42,858.12 12.85 40,001.88
Direct Plan - Growth Option
Last 1 Year 32.53 13,252.65 35.96 13,595.85 53.54 15,354.21
Last 3 Years 34.73 24,475.59 15.90 15,576.07 20.79 17,634.61
Last 5 Years 26.28 32,131.97 15.28 20,363.23 16.83 21,770.60
Since Inception 13.65 30,954.06 13.28 30,071.66 14.53 33,121.72
Date of Inception: Regular Plan: May 14, 2010; Direct Plan: January 01, 2013. CAGR – Compounded Annual Growth Rate
^ Scheme Benchmark. # Standard Benchmark. *Based on standard investment of ` 10,000 made at the beginning of the relevant period. Past performance may or may not be sustained in future and should not be used as a basis for comparison with other investments.
The above returns are as on October 29, 2021.
w.e.f. October 17, 2018 benchmark for the scheme has been changed to MSCI All Country World Index. Further w.e.f October 17, 2018 the underlying fund of the scheme has been changed.
The Scheme has undergone change in Fundamental attributes w.e.f. October 17, 2018 changed its Underlying Fund. Accordingly, the Scheme’s benchmark has also changed. Hence, the past performance of the Scheme may not strictly be comparable with that of the new benchmark.
Scheme performance may not strictly be comparable with that of its Standard Benchmark in view of type of the scheme i.e. Overseas Fund of Fund.
Ravi Adukia is managing this fund since June 01, 2021.
For performance of schemes managed by Ravi Adukia refer page no. 8, 12, 13, 14, 17
Different plans have a different expense structure. For Total Expense Ratio as on October 31, 2021 refer page no. 31
Details as on October 31, 2021
**Income Distribution cum Capital Withdrawal option
GLOBAL EQUITYOPPORTUNITIES FUND
PGIM INDIA
An open ended equity fund of fund scheme investing in PGIM Jennison Global Equity Opportunities Fund
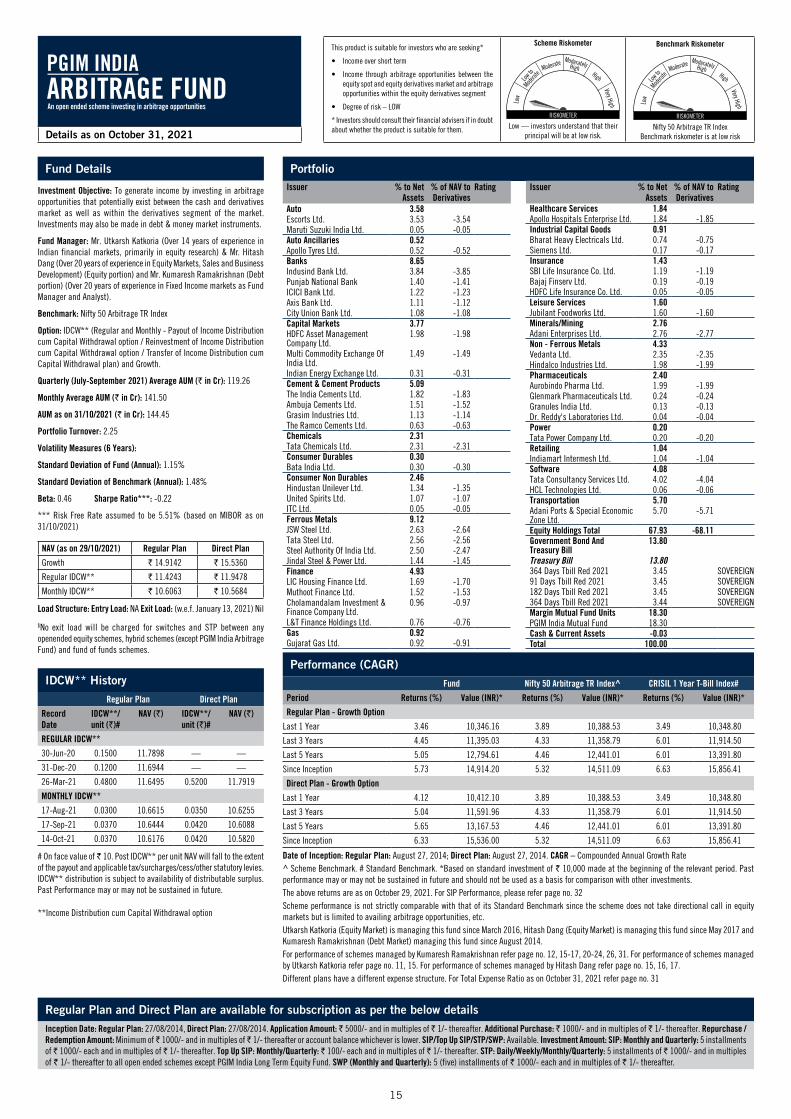
15
Fund Details
Investment Objective: To generate income by investing in arbitrage opportunities that potentially exist between the cash and derivatives market as well as within the derivatives segment of the market. Investments may also be made in debt & money market instruments.
Fund Manager: Mr. Utkarsh Katkoria (Over 14 years of experience in Indian financial markets, primarily in equity research) & Mr. Hitash Dang (Over 20 years of experience in Equity Markets, Sales and Business Development) (Equity portion) and Mr. Kumaresh Ramakrishnan (Debt portion) (Over 20 years of experience in Fixed Income markets as Fund Manager and Analyst).
Benchmark: Nifty 50 Arbitrage TR Index
Option: IDCW** (Regular and Monthly - Payout of Income Distribution cum Capital Withdrawal option / Reinvestment of Income Distribution cum Capital Withdrawal option / Transfer of Income Distribution cum Capital Withdrawal plan) and Growth.
Quarterly (July-September 2021) Average AUM (` in Cr): 119.26
Monthly Average AUM (` in Cr): 141.50
AUM as on 31/10/2021 (` in Cr): 144.45
Portfolio Turnover: 2.25
Volatility Measures (6 Years):
Standard Deviation of Fund (Annual): 1.15%
Standard Deviation of Benchmark (Annual): 1.48%
Beta: 0.46 Sharpe Ratio***: -0.22
*** Risk Free Rate assumed to be 5.51% (based on MIBOR as on 31/10/2021)
NAV (as on 29/10/2021) Regular Plan Direct Plan
Growth ` 14.9142 ` 15.5360
Regular IDCW** ` 11.4243 ` 11.9478
Monthly IDCW** ` 10.6063 ` 10.5684
Load Structure: Entry Load: NA Exit Load: (w.e.f. January 13, 2021) Nil
$No exit load will be charged for switches and STP between any openended equity schemes, hybrid schemes (except PGIM India Arbitrage Fund) and fund of funds schemes.
Details as on October 31, 2021
This product is suitable for investors who are seeking*
• Income over short term
• Income through arbitrage opportunities between the equity spot and equity derivatives market and arbitrage opportunities within the equity derivatives segment
• Degree of risk – LOW
* Investors should consult their financial advisers if in doubt about whether the product is suitable for them.
Scheme Riskometer
Moderate
Low to
Moderat
e
Low
ModeratelyHigh
Very High
High
RISKOMETER
Low — investors understand that their principal will be at low risk.
Benchmark Riskometer
Moderate
Low to
Moderat
e
Low
ModeratelyHigh
Very High
High
RISKOMETER
Nifty 50 Arbitrage TR IndexBenchmark riskometer is at low risk
Regular Plan and Direct Plan are available for subscription as per the below detailsInception Date: Regular Plan: 27/08/2014, Direct Plan: 27/08/2014. Application Amount: ̀ 5000/- and in multiples of ̀ 1/- thereafter. Additional Purchase: ̀ 1000/- and in multiples of ̀ 1/- thereafter. Repurchase / Redemption Amount: Minimum of ̀ 1000/- and in multiples of ̀ 1/- thereafter or account balance whichever is lower. SIP/Top Up SIP/STP/SWP: Available. Investment Amount: SIP: Monthly and Quarterly: 5 installments of ̀ 1000/- each and in multiples of ̀ 1/- thereafter. Top Up SIP: Monthly/Quarterly: ̀ 100/- each and in multiples of ̀ 1/- thereafter. STP: Daily/Weekly/Monthly/Quarterly: 5 installments of ̀ 1000/- and in multiples of ` 1/- thereafter to all open ended schemes except PGIM India Long Term Equity Fund. SWP (Monthly and Quarterly): 5 (five) installments of ` 1000/- each and in multiples of ` 1/- thereafter.
Performance (CAGR)
Fund Nifty 50 Arbitrage TR Index^ CRISIL 1 Year T-Bill Index#
Period Returns (%) Value (INR)* Returns (%) Value (INR)* Returns (%) Value (INR)*
Regular Plan - Growth Option
Last 1 Year 3.46 10,346.16 3.89 10,388.53 3.49 10,348.80
Last 3 Years 4.45 11,395.03 4.33 11,358.79 6.01 11,914.50
Last 5 Years 5.05 12,794.61 4.46 12,441.01 6.01 13,391.80
Since Inception 5.73 14,914.20 5.32 14,511.09 6.63 15,856.41
Direct Plan - Growth Option
Last 1 Year 4.12 10,412.10 3.89 10,388.53 3.49 10,348.80
Last 3 Years 5.04 11,591.96 4.33 11,358.79 6.01 11,914.50
Last 5 Years 5.65 13,167.53 4.46 12,441.01 6.01 13,391.80
Since Inception 6.33 15,536.00 5.32 14,511.09 6.63 15,856.41
Date of Inception: Regular Plan: August 27, 2014; Direct Plan: August 27, 2014. CAGR – Compounded Annual Growth Rate^ Scheme Benchmark. # Standard Benchmark. *Based on standard investment of ` 10,000 made at the beginning of the relevant period. Past performance may or may not be sustained in future and should not be used as a basis for comparison with other investments.The above returns are as on October 29, 2021. For SIP Performance, please refer page no. 32Scheme performance is not strictly comparable with that of its Standard Benchmark since the scheme does not take directional call in equity markets but is limited to availing arbitrage opportunities, etc.Utkarsh Katkoria (Equity Market) is managing this fund since March 2016, Hitash Dang (Equity Market) is managing this fund since May 2017 and Kumaresh Ramakrishnan (Debt Market) managing this fund since August 2014.For performance of schemes managed by Kumaresh Ramakrishnan refer page no. 12, 15-17, 20-24, 26, 31. For performance of schemes managed by Utkarsh Katkoria refer page no. 11, 15. For performance of schemes managed by Hitash Dang refer page no. 15, 16, 17.Different plans have a different expense structure. For Total Expense Ratio as on October 31, 2021 refer page no. 31
IDCW** HistoryRegular Plan Direct Plan
Record Date
IDCW**/unit (`)#
NAV (`) IDCW**/unit (`)#
NAV (`)
REGULAR IDCW**
30-Jun-20 0.1500 11.7898 — —
31-Dec-20 0.1200 11.6944 — —
26-Mar-21 0.4800 11.6495 0.5200 11.7919
MONTHLY IDCW**
17-Aug-21 0.0300 10.6615 0.0350 10.6255
17-Sep-21 0.0370 10.6444 0.0420 10.6088
14-Oct-21 0.0370 10.6176 0.0420 10.5820
# On face value of ̀ 10. Post IDCW** per unit NAV will fall to the extent of the payout and applicable tax/surcharges/cess/other statutory levies. IDCW** distribution is subject to availability of distributable surplus. Past Performance may or may not be sustained in future.
PortfolioIssuer % to Net
Assets% of NAV to Derivatives
Rating
Auto 3.58Escorts Ltd. 3.53 -3.54Maruti Suzuki India Ltd. 0.05 -0.05Auto Ancillaries 0.52Apollo Tyres Ltd. 0.52 -0.52Banks 8.65Indusind Bank Ltd. 3.84 -3.85Punjab National Bank 1.40 -1.41ICICI Bank Ltd. 1.22 -1.23Axis Bank Ltd. 1.11 -1.12City Union Bank Ltd. 1.08 -1.08Capital Markets 3.77HDFC Asset Management Company Ltd.
1.98 -1.98
Multi Commodity Exchange Of India Ltd.
1.49 -1.49
Indian Energy Exchange Ltd. 0.31 -0.31Cement & Cement Products 5.09The India Cements Ltd. 1.82 -1.83Ambuja Cements Ltd. 1.51 -1.52Grasim Industries Ltd. 1.13 -1.14The Ramco Cements Ltd. 0.63 -0.63Chemicals 2.31Tata Chemicals Ltd. 2.31 -2.31Consumer Durables 0.30Bata India Ltd. 0.30 -0.30Consumer Non Durables 2.46Hindustan Unilever Ltd. 1.34 -1.35United Spirits Ltd. 1.07 -1.07ITC Ltd. 0.05 -0.05Ferrous Metals 9.12JSW Steel Ltd. 2.63 -2.64Tata Steel Ltd. 2.56 -2.56Steel Authority Of India Ltd. 2.50 -2.47Jindal Steel & Power Ltd. 1.44 -1.45Finance 4.93LIC Housing Finance Ltd. 1.69 -1.70Muthoot Finance Ltd. 1.52 -1.53Cholamandalam Investment & Finance Company Ltd.
0.96 -0.97
L&T Finance Holdings Ltd. 0.76 -0.76Gas 0.92Gujarat Gas Ltd. 0.92 -0.91
Issuer % to Net Assets
% of NAV to Derivatives
Rating
Healthcare Services 1.84Apollo Hospitals Enterprise Ltd. 1.84 -1.85Industrial Capital Goods 0.91Bharat Heavy Electricals Ltd. 0.74 -0.75Siemens Ltd. 0.17 -0.17Insurance 1.43SBI Life Insurance Co. Ltd. 1.19 -1.19Bajaj Finserv Ltd. 0.19 -0.19HDFC Life Insurance Co. Ltd. 0.05 -0.05Leisure Services 1.60Jubilant Foodworks Ltd. 1.60 -1.60Minerals/Mining 2.76Adani Enterprises Ltd. 2.76 -2.77Non - Ferrous Metals 4.33Vedanta Ltd. 2.35 -2.35Hindalco Industries Ltd. 1.98 -1.99Pharmaceuticals 2.40Aurobindo Pharma Ltd. 1.99 -1.99Glenmark Pharmaceuticals Ltd. 0.24 -0.24Granules India Ltd. 0.13 -0.13Dr. Reddy's Laboratories Ltd. 0.04 -0.04Power 0.20Tata Power Company Ltd. 0.20 -0.20Retailing 1.04Indiamart Intermesh Ltd. 1.04 -1.04Software 4.08Tata Consultancy Services Ltd. 4.02 -4.04HCL Technologies Ltd. 0.06 -0.06Transportation 5.70Adani Ports & Special Economic Zone Ltd.
5.70 -5.71
Equity Holdings Total 67.93 -68.11Government Bond And Treasury Bill
13.80
Treasury Bill 13.80364 Days Tbill Red 2021 3.45 SOVEREIGN91 Days Tbill Red 2021 3.45 SOVEREIGN182 Days Tbill Red 2021 3.45 SOVEREIGN364 Days Tbill Red 2021 3.44 SOVEREIGNMargin Mutual Fund Units 18.30PGIM India Mutual Fund 18.30Cash & Current Assets -0.03Total 100.00
**Income Distribution cum Capital Withdrawal option
ARBITRAGE FUNDPGIM INDIA
An open ended scheme investing in arbitrage opportunities

16
Portfolio Classification (%)**Large Cap (%) (1st-100th stock) 50.66
Mid Cap (%) (101st-250th stock) 48.69
Small Cap (%) (251st stock onwards) 0.65
Not Classified —
Fund Details
Investment Objective: The investment objective of the scheme is to provide capital appreciation and income distribution to the investors by using equity and equity related instruments, arbitrage opportunities and investments in debt and money market instruments.
Fund Manager: Mr. Alok Agarwal (Equity portion) (Over 17 years of experience in equity market & Finance) and Mr. Hitash Dang (Equity Portion) (Over 22 years of experience in equity markets, sales and Business Development) and Mr. Kumaresh Ramakrishnan (Debt portion) (Over 20 years of experience in Fixed Income Market as a Fund Manager and Analyst)
Benchmark: NIFTY 50 Hybrid Short Duration Debt 25:75 Index (w.e.f September 01, 2021)##
Option: IDCW** (Monthly and Annual - Payout of Income Distribution cum Capital Withdrawal option / Reinvestment of Income Distribution cum Capital Withdrawal option) and Growth.
Quarterly (July-September 2021) Average AUM (` in Cr): 45.28
Monthly Average AUM (` in Cr): 82.06
AUM as on 31/10/2021 (` in Cr): 104.35
Portfolio Turnover: 1.39 (For Equity)
For Debt part of the Portfolio:
Average Maturity: 0.39 yrs Modified Duration: 0.38 yrs
Portfolio Yield: 3.62%
Volatility Measures (6 Years):Standard Deviation of Fund (Annual): 6.27%Standard Deviation of Benchmark (Annual): 5.52%Beta: 1.04 Sharpe Ratio***: 0.38*** Risk Free Rate assumed to be 5.51% (based on MIBOR as on 31/10/2021)
NAV (as on 29/10/2021) Regular Plan Direct Plan
Growth ` 39.5611 ` 43.4753
Monthly IDCW** ` 12.9512 ` 16.1592
Annual IDCW** ` 15.7714 ` 13.8083
Load Structure$: Entry Load: NA Exit Load: (w.e.f. January 13, 2021) 10% of the units allotted may be redeemed/switched-out to debt schemes/PGIM India Arbitrage Fund without any exit load within 90 days from the date of allotment of units; Any redemptions/switch-outs in excess of the abovementioned limit would be subject to an exit load of 0.50%, if the units are redeemed/switched-out to debt schemes/PGIM India Arbitrage Fund within 90 days from the date of allotment of units; Nil - If the units are redeemed/switched-out after 90 days from the date of allotment of units.
$No exit load will be charged for switches and STP between any open-ended equity schemes, hybrid schemes (except PGIM India Arbitrage Fund) and fund of funds schemes.
This product is suitable for investors who are seeking*
• Capital appreciation and Income distribution over the medium term
• Investment primarily in equity and equity related securities and a small allocation to debt securities
• Degree of risk – LOW TO MODERATE
* Investors should consult their financial advisers if in doubt about whether the product is suitable for them.
Scheme Riskometer
Moderate
Low to
Moderat
e
Low
ModeratelyHigh
Very High
High
RISKOMETER
Low to Moderate — investors understand that their principal will be at low to moderate risk.
Benchmark Riskometer
Moderate
Low to
Moderat
e
Low
ModeratelyHigh
Very High
High
RISKOMETER
NIFTY 50 Hybrid Short Duration Debt 25:75 Index
Benchmark riskometer is at moderate risk
Regular Plan and Direct Plan are available for subscription as per the below detailsInception Date: Regular Plan: 29/01/2004, Direct Plan: 01/01/2013. Application Amount: Minimum of ̀ 5000/- and in multiples of ̀ 1/- thereafter. Additional Purchase: Minimum of ̀ 1000/- and in multiples of ̀ 1/- thereafter. Repurchase / Redemption Amount: Minimum of ̀ 1000/- and in multiples of ̀ 1/- thereafter or account balance whichever is lower. SIP/Top Up SIP/STP/SWP: Available. Investment Amount: SIP: Monthly and Quarterly: 5 installments of ̀ 1000/- each and in multiples of ̀ 1/- thereafter. Top Up SIP: Monthly/Qaurterly: ̀ 100/- each and in multiples of ̀ 1/- thereafter. STP: Daily/Weekly/Monthly/Quarterly: 5 installments of ̀ 1000/- and in multiples of ` 1/- thereafter to all open ended schemes except PGIM India Long Term Equity Fund. SWP (Monthly and Quarterly): 5 (five) installments of ` 1000/- each and in multiples of ` 1/- thereafter.
IDCW** HistoryRegular Plan Direct Plan
Record Date
IDCW**/unit (`)#
NAV (`) IDCW**/unit (`)#
NAV (`)
MONTHLY IDCW**
17-Aug-21 0.0650 12.8608 — —
17-Sep-21 0.0670 12.9802 0.0790 13.8392
14-Oct-21 0.0670 13.0850 0.0770 13.9516
ANNUAL IDCW**
25-Mar-19 0.8854 15.2067 0.8854 15.4266
27-Mar-20 0.7260 13.4670 0.8677 13.7968
26-Mar-21 0.9700 15.3022 1.1000 15.6544
# On face value of ̀ 10. Post IDCW** per unit NAV will fall to the extent of the payout and applicable tax/surcharges/cess/other statutory levies. IDCW** distribution is subject to availability of distributable surplus. Past Performance may or may not be sustained in future.
Performance (CAGR)Fund NIFTY 50 Hybrid Short Duration
Debt 25:75 Index ^CRISIL 10 Year Gilt Index #
Period Returns (%) Value (INR)* Returns (%) Value (INR)* Returns (%) Value (INR)*Regular Plan - Growth Option
Last 1 Year 19.69 11,968.63 15.66 11,565.63 1.64 10,163.85 Last 3 Years 9.59 13,165.77 11.95 14,033.46 8.29 12,700.94 Last 5 Years 7.79 14,555.38 10.17 16,232.11 5.85 13,287.73 Since Inception 8.05 39,561.10 10.07 16,161.69 5.73 26,915.16 Direct Plan - Growth Option
Last 1 Year 21.27 12,127.24 15.66 11,565.63 1.64 10,163.85 Last 3 Years 10.84 13,619.57 11.95 14,033.46 8.29 12,700.94 Last 5 Years 9.09 15,456.35 10.17 16,232.11 5.85 13,287.73 Since Inception 9.89 22,999.40 10.04 23,282.71 6.86 17,969.89 Date of Inception: Regular Plan: January 29, 2004; Direct Plan: January 01, 2013. CAGR – Compounded Annual Growth Rate^ Scheme Benchmark. # Standard Benchmark. *Based on standard investment of ` 10,000 made at the beginning of the relevant period. Past performance may or may not be sustained in future and should not be used as a basis for comparison with other investments.##with effect from September 01, 2021 the benchmark of the scheme has been changed from 70% NIFTY 50 Arbitrage Index and 30% of the NIFTY 50 TR Index to NIFTY 50 Hybrid Short Duration Debt 25:75 Index.The above returns are as on October 29, 2021. For SIP Performance, please refer page no. 32Scheme performance may not strictly be comparable with that of its Standard Benchmark in view of hybrid nature of the scheme where a portionof scheme’s investments are made in debt & derivatives.Alok Agarwal (Equity Portion) is managing this fund since August 2016 and Mr. Hitash Dang (Equity Portion) since June 01, 2021 and Kumaresh Ramakrishnan (Debt Portion) is managing this fund since April 05, 2018.For performance of schemes managed by Alok Agarwal refer page no. 7, 12, 16, 31. For performance of schemes managed by Hitash Dang refer page no. 15, 16, 17. For performance of schemes managed by Kumaresh Ramakrishnan refer page no. 12, 15-17, 20-24, 26, 31Different plans have a different expense structure. For Total Expense Ratio as on October 31, 2021 refer page no. 31
PortfolioIssuer % to Net
Assets% of NAV to Derivatives
Rating
Auto 4.92Escorts Ltd. 3.56 -3.58Ashok Leyland Ltd. 1.36Banks 10.58Indusind Bank Ltd. 5.11 -5.13HDFC Bank Ltd. 1.52Axis Bank Ltd. 1.42State Bank Of India 1.08 -1.09Canara Bank 0.55 -0.56ICICI Bank Ltd. 0.50Kotak Mahindra Bank Ltd. 0.39Chemicals 2.21Tata Chemicals Ltd. 1.55 -1.56Aarti Industries Ltd. 0.55Phillips Carbon Black Ltd. 0.10Construction 0.53Oberoi Realty Ltd. 0.53Consumer Durables 1.21Havells India Ltd. 1.21 -1.22Consumer Non Durables 0.54Tata Consumer Products Ltd. 0.54Ferrous Metals 3.62Jindal Steel & Power Ltd. 2.00 -2.00JSW Steel Ltd. 0.87 -0.87Tata Steel Ltd. 0.75 -0.75Finance 5.13Housing Development Finance Corporation Ltd.
4.50 -4.51
Muthoot Finance Ltd. 0.63Industrial Capital Goods 1.42ABB India Ltd. 1.42Industrial Products 0.84Astral Ltd. 0.84Insurance 1.84SBI Life Insurance Company Ltd. 1.32 -1.32HDFC Life Insurance Co. Ltd. 0.52Minerals/Mining 6.61Adani Enterprises Ltd. 4.77 -4.79NMDC Ltd. 1.84 -1.85
Issuer % to Net Assets
% of NAV to Derivatives
Rating
Non - Ferrous Metals 6.59Vedanta Ltd. 6.59 -6.61Petroleum Products 1.13Reliance Industries Ltd. 1.13Pharmaceuticals 2.13Glenmark Pharmaceuticals Ltd. 0.89 -0.89Abbott India Ltd. 0.58Cadila Healthcare Ltd. 0.42 -0.43Pfizer Ltd. 0.24Power 1.04Tata Power Company Ltd. 0.66Torrent Power Ltd. 0.38Retailing 1.03Indiamart Intermesh Ltd. 1.03Software 10.19Tata Consultancy Services Ltd. 5.37 -5.40Tech Mahindra Ltd. 4.42 -3.55Infosys Ltd. 0.40Telecom - Services 0.70Vodafone Idea Ltd. 0.70 -0.71Transportation 5.15Adani Ports & Special Economic Zone Ltd.
5.15 -5.15
Equity Holdings Total 67.42 -51.94Corporate Debt 1.90Non-Convertible Debentures 1.90Jamnagar Utilities & Power Pvt. Ltd.
1.90 CRISIL AAA
Government Bond And Treasury Bill
19.06
Treasury Bill 19.06364 Days Tbill Red 2022 9.52 SOVEREIGN91 Days Tbill Red 2021 4.78 SOVEREIGN364 Days Tbill Red 2022 4.76 SOVEREIGNMargin Mutual Fund Units 3.95PGIM India Mutual Fund 3.95Cash & Current Assets 7.67Total 100.00
Details as on October 31, 2021
** The above data is given for equity allocation
**Income Distribution cum Capital Withdrawal option
EQUITY SAVINGS FUNDPGIM INDIA
An Open Ended Scheme investing in equity, arbitrage and debt
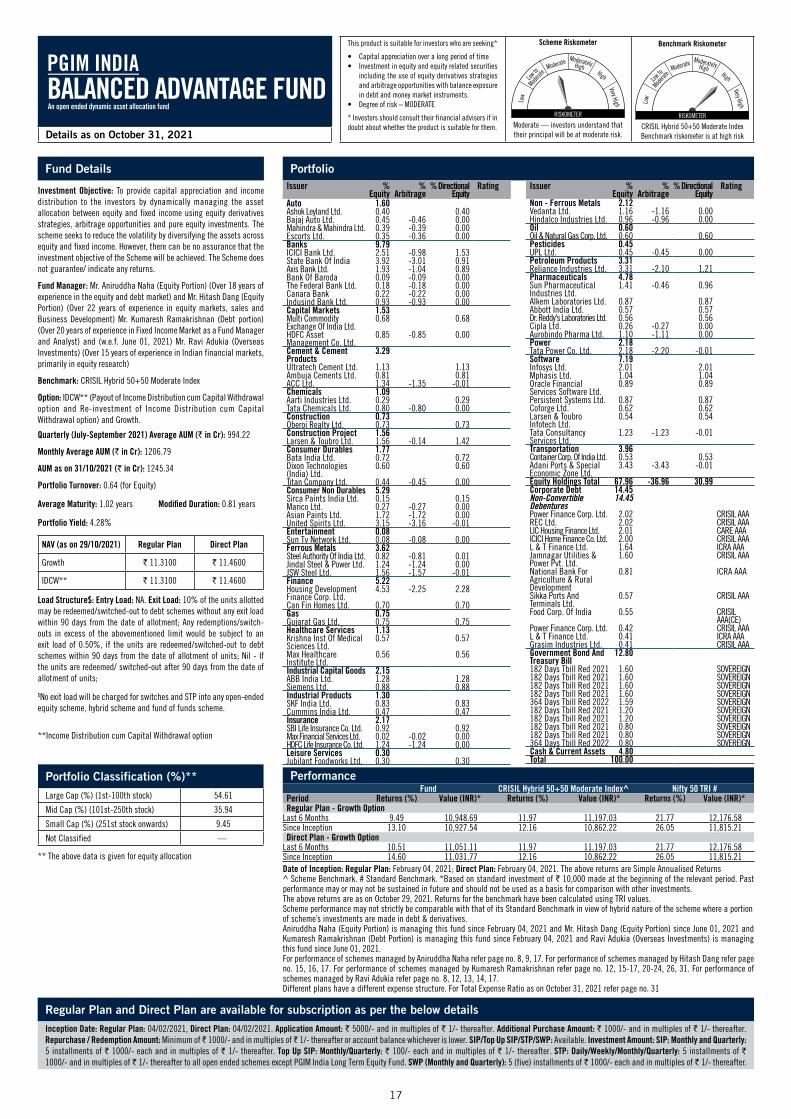
17
Portfolio Classification (%)**Large Cap (%) (1st-100th stock) 54.61
Mid Cap (%) (101st-250th stock) 35.94
Small Cap (%) (251st stock onwards) 9.45
Not Classified —
Fund Details
Investment Objective: To provide capital appreciation and income distribution to the investors by dynamically managing the asset allocation between equity and fixed income using equity derivatives strategies, arbitrage opportunities and pure equity investments. The scheme seeks to reduce the volatility by diversifying the assets across equity and fixed income. However, there can be no assurance that the investment objective of the Scheme will be achieved. The Scheme does not guarantee/ indicate any returns.
Fund Manager: Mr. Aniruddha Naha (Equity Portion) (Over 18 years of experience in the equity and debt market) and Mr. Hitash Dang (Equity Portion) (Over 22 years of experience in equity markets, sales and Business Development) Mr. Kumaresh Ramakrishnan (Debt portion) (Over 20 years of experience in Fixed Income Market as a Fund Manager and Analyst) and (w.e.f. June 01, 2021) Mr. Ravi Adukia (Overseas Investments) (Over 15 years of experience in Indian financial markets, primarily in equity research)
Benchmark: CRISIL Hybrid 50+50 Moderate Index
Option: IDCW** (Payout of Income Distribution cum Capital Withdrawal option and Re-investment of Income Distribution cum Capital Withdrawal option) and Growth.
Quarterly (July-September 2021) Average AUM (` in Cr): 994.22
Monthly Average AUM (` in Cr): 1206.79
AUM as on 31/10/2021 (` in Cr): 1245.34
Portfolio Turnover: 0.64 (for Equity)
Average Maturity: 1.02 years Modified Duration: 0.81 years
Portfolio Yield: 4.28%
NAV (as on 29/10/2021) Regular Plan Direct Plan
Growth ` 11.3100 ` 11.4600
IDCW** ` 11.3100 ` 11.4600
Load Structure$: Entry Load: NA. Exit Load: 10% of the units allotted may be redeemed/switched-out to debt schemes without any exit load within 90 days from the date of allotment; Any redemptions/switch-outs in excess of the abovementioned limit would be subject to an exit load of 0.50%, if the units are redeemed/switched-out to debt schemes within 90 days from the date of allotment of units; Nil - If the units are redeemed/ switched-out after 90 days from the date of allotment of units;
$No exit load will be charged for switches and STP into any open-ended equity scheme, hybrid scheme and fund of funds scheme.
This product is suitable for investors who are seeking*
• Capital appreciation over a long period of time• Investment in equity and equity related securities
including the use of equity derivatives strategies and arbitrage opportunities with balance exposure in debt and money market instruments.
• Degree of risk – MODERATE
* Investors should consult their financial advisers if in doubt about whether the product is suitable for them.
Scheme Riskometer
Moderate
Low to
Moderat
e
Low
ModeratelyHigh
Very High
High
RISKOMETER
Moderate — investors understand that their principal will be at moderate risk.
Benchmark Riskometer
Moderate
Low to
Moderat
e
Low
ModeratelyHigh
Very High
High
RISKOMETER
CRISIL Hybrid 50+50 Moderate IndexBenchmark riskometer is at high riskDetails as on October 31, 2021
Regular Plan and Direct Plan are available for subscription as per the below detailsInception Date: Regular Plan: 04/02/2021, Direct Plan: 04/02/2021. Application Amount: ` 5000/- and in multiples of ` 1/- thereafter. Additional Purchase Amount: ` 1000/- and in multiples of ` 1/- thereafter. Repurchase / Redemption Amount: Minimum of ̀ 1000/- and in multiples of ̀ 1/- thereafter or account balance whichever is lower. SIP/Top Up SIP/STP/SWP: Available. Investment Amount: SIP: Monthly and Quarterly: 5 installments of ` 1000/- each and in multiples of ` 1/- thereafter. Top Up SIP: Monthly/Quarterly: ` 100/- each and in multiples of ` 1/- thereafter. STP: Daily/Weekly/Monthly/Quarterly: 5 installments of ` 1000/- and in multiples of ` 1/- thereafter to all open ended schemes except PGIM India Long Term Equity Fund. SWP (Monthly and Quarterly): 5 (five) installments of ` 1000/- each and in multiples of ` 1/- thereafter.
** The above data is given for equity allocation
**Income Distribution cum Capital Withdrawal option
PerformanceFund CRISIL Hybrid 50+50 Moderate Index^ Nifty 50 TRI #
Period Returns (%) Value (INR)* Returns (%) Value (INR)* Returns (%) Value (INR)*Regular Plan - Growth Option
Last 6 Months 9.49 10,948.69 11.97 11,197.03 21.77 12,176.58 Since Inception 13.10 10,927.54 12.16 10,862.22 26.05 11,815.21 Direct Plan - Growth Option
Last 6 Months 10.51 11,051.11 11.97 11,197.03 21.77 12,176.58 Since Inception 14.60 11,031.77 12.16 10,862.22 26.05 11,815.21 Date of Inception: Regular Plan: February 04, 2021; Direct Plan: February 04, 2021. The above returns are Simple Annualised Returns^ Scheme Benchmark. # Standard Benchmark. *Based on standard investment of ` 10,000 made at the beginning of the relevant period. Past performance may or may not be sustained in future and should not be used as a basis for comparison with other investments.The above returns are as on October 29, 2021. Returns for the benchmark have been calculated using TRI values.Scheme performance may not strictly be comparable with that of its Standard Benchmark in view of hybrid nature of the scheme where a portionof scheme’s investments are made in debt & derivatives. Aniruddha Naha (Equity Portion) is managing this fund since February 04, 2021 and Mr. Hitash Dang (Equity Portion) since June 01, 2021 and Kumaresh Ramakrishnan (Debt Portion) is managing this fund since February 04, 2021 and Ravi Adukia (Overseas Investments) is managing this fund since June 01, 2021.For performance of schemes managed by Aniruddha Naha refer page no. 8, 9, 17. For performance of schemes managed by Hitash Dang refer page no. 15, 16, 17. For performance of schemes managed by Kumaresh Ramakrishnan refer page no. 12, 15-17, 20-24, 26, 31. For performance of schemes managed by Ravi Adukia refer page no. 8, 12, 13, 14, 17.Different plans have a different expense structure. For Total Expense Ratio as on October 31, 2021 refer page no. 31
BALANCED ADVANTAGE FUNDPGIM INDIA
An open ended dynamic asset allocation fund
PortfolioIssuer %
Equity%
Arbitrage% Directional
EquityRating
Auto 1.60Ashok Leyland Ltd. 0.40 0.40Bajaj Auto Ltd. 0.45 -0.46 0.00Mahindra & Mahindra Ltd. 0.39 -0.39 0.00Escorts Ltd. 0.35 -0.36 0.00Banks 9.79ICICI Bank Ltd. 2.51 -0.98 1.53State Bank Of India 3.92 -3.01 0.91Axis Bank Ltd. 1.93 -1.04 0.89Bank Of Baroda 0.09 -0.09 0.00The Federal Bank Ltd. 0.18 -0.18 0.00Canara Bank 0.22 -0.22 0.00Indusind Bank Ltd. 0.93 -0.93 0.00Capital Markets 1.53Multi Commodity Exchange Of India Ltd.
0.68 0.68
HDFC Asset Management Co. Ltd.
0.85 -0.85 0.00
Cement & Cement Products
3.29
Ultratech Cement Ltd. 1.13 1.13Ambuja Cements Ltd. 0.81 0.81ACC Ltd. 1.34 -1.35 -0.01Chemicals 1.09Aarti Industries Ltd. 0.29 0.29Tata Chemicals Ltd. 0.80 -0.80 0.00Construction 0.73Oberoi Realty Ltd. 0.73 0.73Construction Project 1.56Larsen & Toubro Ltd. 1.56 -0.14 1.42Consumer Durables 1.77Bata India Ltd. 0.72 0.72Dixon Technologies (India) Ltd.
0.60 0.60
Titan Company Ltd. 0.44 -0.45 0.00Consumer Non Durables 5.29Sirca Paints India Ltd. 0.15 0.15Marico Ltd. 0.27 -0.27 0.00Asian Paints Ltd. 1.72 -1.72 0.00United Spirits Ltd. 3.15 -3.16 -0.01Entertainment 0.08Sun Tv Network Ltd. 0.08 -0.08 0.00Ferrous Metals 3.62Steel Authority Of India Ltd. 0.82 -0.81 0.01Jindal Steel & Power Ltd. 1.24 -1.24 0.00JSW Steel Ltd. 1.56 -1.57 -0.01Finance 5.22Housing Development Finance Corp. Ltd.
4.53 -2.25 2.28
Can Fin Homes Ltd. 0.70 0.70Gas 0.75Gujarat Gas Ltd. 0.75 0.75Healthcare Services 1.13Krishna Inst Of Medical Sciences Ltd.
0.57 0.57
Max Healthcare Institute Ltd.
0.56 0.56
Industrial Capital Goods 2.15ABB India Ltd. 1.28 1.28Siemens Ltd. 0.88 0.88Industrial Products 1.30SKF India Ltd. 0.83 0.83Cummins India Ltd. 0.47 0.47Insurance 2.17SBI Life Insurance Co. Ltd. 0.92 0.92Max Financial Services Ltd. 0.02 -0.02 0.00HDFC Life Insurance Co. Ltd. 1.24 -1.24 0.00Leisure Services 0.30Jubilant Foodworks Ltd. 0.30 0.30
Issuer % Equity
% Arbitrage
% Directional Equity
Rating
Non - Ferrous Metals 2.12Vedanta Ltd. 1.16 -1.16 0.00Hindalco Industries Ltd. 0.96 -0.96 0.00Oil 0.60Oil & Natural Gas Corp. Ltd. 0.60 0.60Pesticides 0.45UPL Ltd. 0.45 -0.45 0.00Petroleum Products 3.31Reliance Industries Ltd. 3.31 -2.10 1.21Pharmaceuticals 4.78Sun Pharmaceutical Industries Ltd.
1.41 -0.46 0.96
Alkem Laboratories Ltd. 0.87 0.87Abbott India Ltd. 0.57 0.57Dr. Reddy's Laboratories Ltd. 0.56 0.56Cipla Ltd. 0.26 -0.27 0.00Aurobindo Pharma Ltd. 1.10 -1.11 0.00Power 2.18Tata Power Co. Ltd. 2.18 -2.20 -0.01Software 7.19Infosys Ltd. 2.01 2.01Mphasis Ltd. 1.04 1.04Oracle Financial Services Software Ltd.
0.89 0.89
Persistent Systems Ltd. 0.87 0.87Coforge Ltd. 0.62 0.62Larsen & Toubro Infotech Ltd.
0.54 0.54
Tata Consultancy Services Ltd.
1.23 -1.23 -0.01
Transportation 3.96Container Corp. Of India Ltd. 0.53 0.53Adani Ports & Special Economic Zone Ltd.
3.43 -3.43 -0.01
Equity Holdings Total 67.96 -36.96 30.99Corporate Debt 14.45Non-Convertible Debentures
14.45
Power Finance Corp. Ltd. 2.02 CRISIL AAAREC Ltd. 2.02 CRISIL AAALIC Housing Finance Ltd. 2.01 CARE AAAICICI Home Finance Co. Ltd. 2.00 CRISIL AAAL & T Finance Ltd. 1.64 ICRA AAAJamnagar Utilities & Power Pvt. Ltd.
1.60 CRISIL AAA
National Bank For Agriculture & Rural Development
0.81 ICRA AAA
Sikka Ports And Terminals Ltd.
0.57 CRISIL AAA
Food Corp. Of India 0.55 CRISIL AAA(CE)
Power Finance Corp. Ltd. 0.42 CRISIL AAAL & T Finance Ltd. 0.41 ICRA AAAGrasim Industries Ltd. 0.41 CRISIL AAAGovernment Bond And Treasury Bill
12.80
182 Days Tbill Red 2021 1.60 SOVEREIGN182 Days Tbill Red 2021 1.60 SOVEREIGN182 Days Tbill Red 2021 1.60 SOVEREIGN182 Days Tbill Red 2021 1.60 SOVEREIGN364 Days Tbill Red 2022 1.59 SOVEREIGN182 Days Tbill Red 2021 1.20 SOVEREIGN182 Days Tbill Red 2021 1.20 SOVEREIGN182 Days Tbill Red 2021 0.80 SOVEREIGN182 Days Tbill Red 2021 0.80 SOVEREIGN364 Days Tbill Red 2022 0.80 SOVEREIGNCash & Current Assets 4.80Total 100.00

18
DE
BT
FU
ND
S
RE
CK
ON
ER
PGIM
Indi
a Ov
erni
ght F
und
PGIM
Indi
a In
sta
Cash
Fun
dPG
IM In
dia
Ultr
a Sh
ort T
erm
Fun
dPG
IM In
dia
Mon
ey M
arke
t Fun
dPG
IM In
dia
Low
Dura
tion
Fund
PGIM
Indi
a Sh
ort M
atur
ity F
und
Why
Inve
st?
Park
sur
plus
fun
ds a
nd m
anag
e sh
ort
term
liq
uidi
ty fo
r as
low
as 1
Day
Cash
Man
agem
ent.
Any m
oney
ove
r 7 D
ays
Inve
stor
s lo
okin
g to
par
k th
eir
fund
s fo
r a
perio
d ov
er 3
Mon
ths
Inve
stor
s lo
okin
g to
par
k th
eir
fund
s fo
r a
perio
d ov
er 3
Mon
ths
For m
oney
ove
r 6 m
onth
s. P
ositi
oned
bet
ween
Ul
tra
Shor
t an
d Sh
ort
Mat
urity
. Ac
crua
l St
rate
gy
Activ
ely m
anag
ed S
hort
Mat
urity
Fun
d wi
th a
m
ix of
PSU
and
Cor
pora
te b
onds
Port
folio
Fea
ture
s#In
vest
men
ts
in
over
nigh
t se
curit
ies
with
m
atur
ity o
f 1 D
ayIn
vest
men
ts
in
debt
an
d m
oney
m
arke
t se
curit
ies
with
mat
urity
of u
p to
91
Days
Cons
erva
tive
Ultra
Sho
rt Te
rm F
und
with
a
dura
tion
rang
e of
3 M
onth
s to
6 M
onth
sIn
vest
men
ts in
mon
ey m
arke
t sec
uriti
es w
ith
mat
urity
of u
p to
1 Y
ear
Inve
stm
ents
in
de
bt
and
mon
ey
mar
ket
secu
ritie
s wi
th a
dur
atio
n ra
nge
of 6
Mon
ths
to 1
Yea
r
Inve
stin
g Pr
edom
inan
tly in
AA+
and
hig
her
rate
d co
rpor
ate
bond
s an
d Go
vern
men
t Se
curit
ies
with
spe
cifie
d M
acau
lay
dura
tion
rang
e of
1 to
3 Y
ears
Idea
l Inv
estm
ent H
oriz
on$
1 Da
y +7
Days
+3
Mon
ths
+3
Mon
ths
+6
Mon
ths
+1
Year
+
Ince
ptio
n Da
teRe
gula
r Pla
n: 2
7/08
/201
9;
Dire
ct P
lan:
27/
08/2
019
Regu
lar P
lan:
05/
09/2
007;
Di
rect
Pla
n: 0
1/01
/201
3Re
gula
r Pla
n: 1
8/11
/200
8;
Dire
ct P
lan:
01/
01/2
013
Regu
lar P
lan:
06/
03/2
020;
Di
rect
Pla
n: 0
6/03
/202
0Re
gula
r Pla
n: 2
2/06
/200
7;
Dire
ct P
lan:
01/
01/2
013
Regu
lar P
lan:
21/
01/2
003;
Di
rect
Pla
n: 0
1/01
/201
3
Fund
Man
ager
Kum
ares
h Ra
mak
rishn
an a
nd K
unal
Jain
Kum
ares
h Ra
mak
rishn
an a
nd K
unal
Jain
Kum
ares
h Ra
mak
rishn
an a
nd K
unal
Jain
Kum
ares
h Ra
mak
rishn
an a
nd K
unal
Jain
Kum
ares
h Ra
mak
rishn
anPu
neet
Pal
and
(w.e
.f. Ju
ly 01
, 202
1) A
nkur
M
urar
ka
Benc
hmar
kNi
fty 1
D Ra
te In
dex
CRIS
IL L
iqui
d Fu
nd In
dex
CRIS
IL U
ltra
Shor
t Ter
m D
ebt I
ndex
CRIS
IL M
oney
Mar
ket F
und
Inde
xCR
ISIL
Low
Dur
atio
n De
bt In
dex
CRIS
IL S
hort
Term
Bon
d Fu
nd In
dex
Fund
Det
ails
as
on O
ctob
er 3
1, 2
021
Mon
th E
nd A
UM (i
n cr
ores
)28
6.32
581.
3771
2.18
96.1
386
.62
36.2
0
Aver
age
Mat
urity
1 da
y0.
72 m
onth
s3.
36 m
onth
s4.
68 m
onth
s0.
51 ye
ar2.
43 ye
ars
Mac
aula
y Du
ratio
n1
day
0.78
mon
ths
3.58
mon
ths
4.63
mon
ths
0.53
year
1.50
year
s
Mod
ified
Dur
atio
n1
day
0.74
mon
ths
3.17
mon
ths
4.40
mon
ths
0.48
year
1.43
year
s
Port
folio
Yie
ld3.
40%
3.63
%3.
91%
4.10
%4.
17%
4.72
%
Asse
t Mix
Com
mer
cial
Pap
er—
49.5
6%15
.80%
38.8
7%7.
87%
—
Cert
ifica
te o
f Dep
osit
——
10.5
4%9.
28%
——
PSU
Bond
s/ P
FI B
onds
——
23.2
1%—
40.6
3%13
.30%
PSU
Bank
s—
—7.
16%
——
9.88
%
Bank
Fix
ed D
epos
it—
——
——
—
Bill
Redi
scou
ntin
g—
——
——
—
Trea
sury
Bill
s—
18.6
7%9.
10%
——
13.8
0%
Corp
orat
e De
bt—
0.81
%14
.46%
—13
.52%
30.2
5%
Cash
& C
urre
nt A
sset
s0.
39%
0.23
%2.
50%
1.84
%1.
89%
-0.2
7%
Perp
etua
l Bon
ds—
——
——
2.77
%**
GOI S
ecur
ities
—8.
14%
5.12
%42
.60%
5.94
%20
.16%
Reve
rse
Repo
99.6
1%22
.59%
12.1
1%7.
41%
30.1
5%10
.11%
Ratin
g M
ix
AAA/
A1+/
Sove
reig
n &
equi
vale
nts
100.
00%
100.
00%
100.
00%
100.
00%
95.3
1%93
.05%
AA+
——
——
2.36
%6.
95%
AA*
——
——
2.33
%—
A+—
——
——
—
Othe
rs—
——
——
—
Load
Str
uctu
re
Exit
Load
Nil
Refe
r pag
e no
. 21
Nil
Nil
Nil
0.5%
if re
deem
ed o
n or
bef
ore
6 m
onth
s an
d Ni
l if r
edee
med
afte
r 6 m
onth
s fro
m th
e da
te
of a
llotm
ent
*AA
incl
ude
secu
ritie
s ra
ted
as A
A an
d AA
-. $
IInve
stor
s sh
ould
con
sult
thei
r fin
anci
al a
dvis
or fo
r tax
impl
icat
ions
on
thei
r inv
estm
ents
. **A
ll th
e pe
rpet
ual b
onds
are
und
er B
asel
III B
onds
. # T
hese
are
bas
ed o
n fu
nd m
anag
er’s
curre
nt o
utlo
ok &
Sub
ject
to c
hang
e.

19
DE
BT
FU
ND
S
RE
CK
ON
ER
Deta
ilsPG
IM In
dia
Bank
ing
& PS
U De
bt F
und
PGIM
Indi
a Cr
edit
Risk
Fun
d (N
umbe
r of
Segr
egat
ed P
ortfo
lio 1
)##
PGIM
Indi
a Dy
nam
ic B
ond
Fund
PGIM
Indi
a Pr
emie
r Bon
d Fu
ndPG
IM In
dia
Gilt
Fund
Why
Inve
st?
Activ
ely m
anag
ed fu
nd w
ith m
inim
um 7
2% a
lloca
tion
to B
anki
ng a
nd P
SU b
onds
Accr
ual f
und
with
med
ium
mat
urity
Dyna
mic
ally
man
aged
dur
atio
n fu
nd in
vest
ing
acro
ss
the
curv
e by
iden
tifyin
g be
st o
ppor
tuni
ties
on th
e yie
ld
curv
e
High
Qua
lity p
ortfo
lio in
vest
ing
pred
omin
antly
inCo
rpor
ate
Bond
s. M
inim
um 7
2% p
ortfo
lio a
lloca
tion
will
be in
Cor
pora
te B
onds
Activ
ely m
anag
ed m
ediu
m /
long
dur
atio
n fu
nd
Port
folio
Fea
ture
s#In
vest
ing
pred
omin
antly
in P
SU &
Ban
king
sec
uriti
es
and
Gove
rnm
ent S
ecur
ities
Inve
stm
ents
pre
dom
inan
tly i
n Co
rpor
ate
Bond
s of
va
rious
mat
uriti
es a
nd a
cros
s ra
tings
Inve
stin
g pr
edom
inan
tly in
AAA
Bon
ds a
nd G
over
nmen
t Se
curit
ies
Inve
stin
g Pr
edom
inan
tly i
n AA
+ a
nd h
ighe
r ra
ted
corp
orat
e bo
nds
and
Gove
rnm
ent S
ecur
ities
Inve
stm
ents
in
Ce
ntra
l an
d St
ate
Gove
rnm
ent
Secu
ritie
s
Idea
l Inv
estm
ent H
oriz
on$
3 Ye
ars
+3
Year
s +
3 Ye
ars
+3
Year
s +
3 Ye
ars
+
Ince
ptio
n Da
teRe
gula
r Pla
n: 1
1/03
/201
3; D
irect
Pla
n: 1
1/03
/201
3Re
gula
r Pla
n: 2
9/09
/201
4; D
irect
Pla
n: 2
9/09
/201
4Re
gula
r Pla
n: 1
2/01
/201
2; D
irect
Pla
n: 0
1/01
/201
3Re
gula
r Pla
n: 3
0/01
/200
3; D
irect
Pla
n: 0
1/01
/201
3Re
gula
r Pla
n: 2
7/10
/200
8; D
irect
Pla
n: 0
1/01
/201
3
Fund
Man
ager
Pune
et P
alKu
mar
esh
Ram
akris
hnan
Pune
et P
alPu
neet
Pal
Pune
et P
al
Benc
hmar
kCR
ISIL
Ban
king
& P
SU D
ebt I
ndex
Nifty
Cre
dit R
isk
Bond
Inde
xCR
ISIL
Com
posi
te B
ond
Fund
Inde
xCR
ISIL
Com
posi
te B
ond
Fund
Inde
xCR
ISIL
Dyn
amic
Gilt
Inde
x
Fund
Det
ails
as
on O
ctob
er 3
1, 2
021
Mon
th E
nd A
UM (i
n cr
ores
)79
.63
43.7
411
8.33
69.0
813
9.54
Aver
age
Mat
urity
2.31
year
s1.
02 ye
ars
4.78
year
s2.
84 ye
ars
5.16
year
s
Mac
aula
y Du
ratio
n1.
28 ye
ars
0.94
year
s3.
12 ye
ars
1.73
year
s3.
48 ye
ars
Mod
ified
Dur
atio
n1.
21 ye
ars
0.89
year
s3.
02 ye
ars
1.64
year
s3.
38 ye
ars
Port
folio
Yie
ld4.
25%
5.01
%5.
17%
4.88
%5.
25%
Asse
t Mix
Com
mer
cial
Pap
er—
——
——
Cert
ifica
te o
f Dep
osit
——
——
—
PSU
Bond
s/ P
FI B
onds
50.8
7%26
.93%
—27
.68%
—
PSU
Bank
s12
.06%
—2.
14%
6.83
%—
Bank
Fix
ed D
epos
it—
——
——
Bill
Redi
scou
ntin
g—
——
——
Trea
sury
Bill
s—
——
—10
.74%
Corp
orat
e De
bt1.
25%
39.4
8%12
.75%
33.8
4%—
Cash
& C
urre
nt A
sset
s2.
74%
2.20
%1.
28%
-2.0
7%-0
.54%
Perp
etua
l Bon
ds8.
24%
**0.
47%
**—
3.69
%**
—
GOI S
ecur
ities
14.0
7%—
60.9
0%17
.86%
76.8
0%
Reve
rse
Repo
10.7
7%30
.92%
22.9
3%12
.17%
13.0
0%
Ratin
g M
ix
AAA/
A1+/
Sove
reig
n &
equi
vale
nts
91.7
6%71
.66%
100.
00%
91.2
0%10
0.00
%
AA+
8.24
%9.
42%
—8.
80%
—
AA*
—18
.92%
——
—
A-—
——
——
Othe
rs—
——
——
Load
Str
uctu
re
Exit
Load
Nil
Refe
r pag
e no
. 27
Nil
Nil
Nil
*AA
incl
ude
secu
ritie
s ra
ted
as A
A an
d AA
-. $
IInve
stor
s sh
ould
con
sult
thei
r fin
anci
al a
dvis
or fo
r tax
impl
icat
ions
on
thei
r inv
estm
ents
. **A
ll th
e pe
rpet
ual b
onds
are
und
er B
asel
III B
onds
.#
Thes
e ar
e ba
sed
on fu
nd m
anag
er’s
curre
nt o
utlo
ok &
Sub
ject
to c
hang
e. #
#Det
ails
giv
en a
re o
nly f
or M
ain
Portf
olio
, for
seg
rega
ted
portf
olio
det
ails
ple
ase
refe
r pag
e no
. 27.
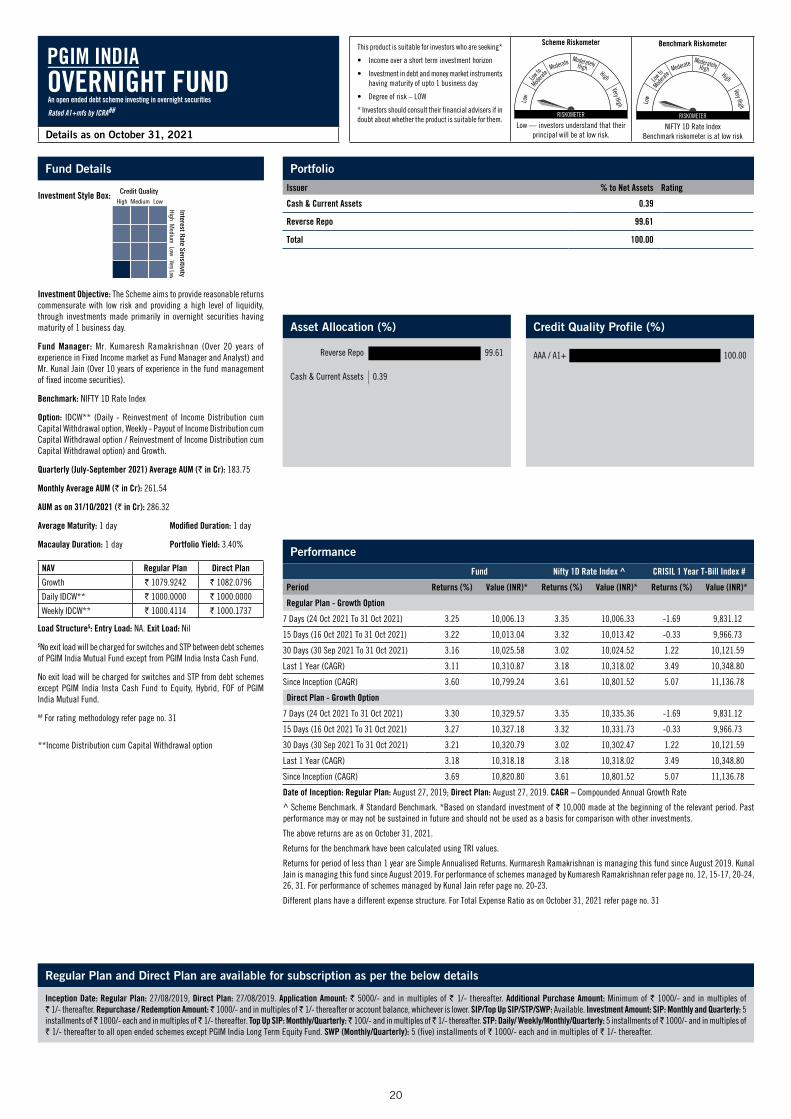
20
Fund Details
Investment Style Box:
Investment Objective: The Scheme aims to provide reasonable returns commensurate with low risk and providing a high level of liquidity, through investments made primarily in overnight securities having maturity of 1 business day.
Fund Manager: Mr. Kumaresh Ramakrishnan (Over 20 years of experience in Fixed Income market as Fund Manager and Analyst) and Mr. Kunal Jain (Over 10 years of experience in the fund management of fixed income securities).
Benchmark: NIFTY 1D Rate Index
Option: IDCW** (Daily - Reinvestment of Income Distribution cum Capital Withdrawal option, Weekly - Payout of Income Distribution cum Capital Withdrawal option / Reinvestment of Income Distribution cum Capital Withdrawal option) and Growth.
Quarterly (July-September 2021) Average AUM (` in Cr): 183.75
Monthly Average AUM (` in Cr): 261.54
AUM as on 31/10/2021 (` in Cr): 286.32
Average Maturity: 1 day Modified Duration: 1 day
Macaulay Duration: 1 day Portfolio Yield: 3.40%
NAV Regular Plan Direct Plan
Growth ` 1079.9242 ` 1082.0796
Daily IDCW** ` 1000.0000 ` 1000.0000
Weekly IDCW** ` 1000.4114 ` 1000.1737
Load Structure$: Entry Load: NA. Exit Load: Nil
$No exit load will be charged for switches and STP between debt schemes of PGIM India Mutual Fund except from PGIM India Insta Cash Fund.
No exit load will be charged for switches and STP from debt schemes except PGIM India Insta Cash Fund to Equity, Hybrid, FOF of PGIM India Mutual Fund.
## For rating methodology refer page no. 31
Details as on October 31, 2021
This product is suitable for investors who are seeking*
• Income over a short term investment horizon
• Investment in debt and money market instruments having maturity of upto 1 business day
• Degree of risk – LOW
* Investors should consult their financial advisers if in doubt about whether the product is suitable for them.
Scheme Riskometer
Moderate
Low to
Moderat
e
Low
ModeratelyHigh
Very High
High
RISKOMETER
Low — investors understand that their principal will be at low risk.
Benchmark Riskometer
Moderate
Low to
Moderat
e
Low
ModeratelyHigh
Very High
High
RISKOMETER
NIFTY 1D Rate IndexBenchmark riskometer is at low risk
Asset Allocation (%) Credit Quality Profile (%)
Regular Plan and Direct Plan are available for subscription as per the below details
Inception Date: Regular Plan: 27/08/2019, Direct Plan: 27/08/2019. Application Amount: ` 5000/- and in multiples of ` 1/- thereafter. Additional Purchase Amount: Minimum of ` 1000/- and in multiples of ` 1/- thereafter. Repurchase / Redemption Amount: ̀ 1000/- and in multiples of ̀ 1/- thereafter or account balance, whichever is lower. SIP/Top Up SIP/STP/SWP: Available. Investment Amount: SIP: Monthly and Quarterly: 5 installments of ̀ 1000/- each and in multiples of ̀ 1/- thereafter. Top Up SIP: Monthly/Quarterly: ̀ 100/- and in multiples of ̀ 1/- thereafter. STP: Daily/ Weekly/Monthly/Quarterly: 5 installments of ̀ 1000/- and in multiples of ` 1/- thereafter to all open ended schemes except PGIM India Long Term Equity Fund. SWP (Monthly/Quarterly): 5 (five) installments of ` 1000/- each and in multiples of ` 1/- thereafter.
Portfolio
Issuer % to Net Assets Rating
Cash & Current Assets 0.39
Reverse Repo 99.61
Total 100.00
Performance
Fund Nifty 1D Rate Index ^ CRISIL 1 Year T-Bill Index #
Period Returns (%) Value (INR)* Returns (%) Value (INR)* Returns (%) Value (INR)*
Regular Plan - Growth Option
7 Days (24 Oct 2021 To 31 Oct 2021) 3.25 10,006.13 3.35 10,006.33 -1.69 9,831.12
15 Days (16 Oct 2021 To 31 Oct 2021) 3.22 10,013.04 3.32 10,013.42 -0.33 9,966.73
30 Days (30 Sep 2021 To 31 Oct 2021) 3.16 10,025.58 3.02 10,024.52 1.22 10,121.59
Last 1 Year (CAGR) 3.11 10,310.87 3.18 10,318.02 3.49 10,348.80
Since Inception (CAGR) 3.60 10,799.24 3.61 10,801.52 5.07 11,136.78
Direct Plan - Growth Option
7 Days (24 Oct 2021 To 31 Oct 2021) 3.30 10,329.57 3.35 10,335.36 -1.69 9,831.12
15 Days (16 Oct 2021 To 31 Oct 2021) 3.27 10,327.18 3.32 10,331.73 -0.33 9,966.73
30 Days (30 Sep 2021 To 31 Oct 2021) 3.21 10,320.79 3.02 10,302.47 1.22 10,121.59
Last 1 Year (CAGR) 3.18 10,318.18 3.18 10,318.02 3.49 10,348.80
Since Inception (CAGR) 3.69 10,820.80 3.61 10,801.52 5.07 11,136.78
Date of Inception: Regular Plan: August 27, 2019; Direct Plan: August 27, 2019. CAGR – Compounded Annual Growth Rate
^ Scheme Benchmark. # Standard Benchmark. *Based on standard investment of ` 10,000 made at the beginning of the relevant period. Past performance may or may not be sustained in future and should not be used as a basis for comparison with other investments.
The above returns are as on October 31, 2021.
Returns for the benchmark have been calculated using TRI values.
Returns for period of less than 1 year are Simple Annualised Returns. Kurmaresh Ramakrishnan is managing this fund since August 2019. Kunal Jain is managing this fund since August 2019. For performance of schemes managed by Kumaresh Ramakrishnan refer page no. 12, 15-17, 20-24, 26, 31. For performance of schemes managed by Kunal Jain refer page no. 20-23.
Different plans have a different expense structure. For Total Expense Ratio as on October 31, 2021 refer page no. 31
**Income Distribution cum Capital Withdrawal option
OVERNIGHT FUNDPGIM INDIA
An open ended debt scheme investing in overnight securities
Rated A1+mfs by ICRA##
0.39
99.61
Cash & Current Assets
Reverse Repo 100.00AAA / A1+

21
Fund Details
Investment Style Box:
Investment Objective: To generate steady returns along with high liquidity by investing in a portfolio of short-term, high quality money market and debt instruments.Fund Manager: Mr. Kumaresh Ramakrishnan (Over 20 years of experience in Fixed Income market as Fund Manager and Analyst) and Mr. Kunal Jain (Over 10 years of experience in the fund management of fixed income securities).Benchmark: CRISIL Liquid Fund IndexOption: IDCW** (Daily Reinvestment of Income Distribution cum Capital Withdrawal option only, Weekly, Monthly - Payout of Income Distribution cum Capital Withdrawal option / Reinvestment of Income Distribution cum Capital Withdrawal option / Transfer of Income Distribution cum Capital Withdrawal option) and Growth.Quarterly (July-September 2021) Average AUM (` in Cr): 736.59Monthly Average AUM (` in Cr): 694.43AUM as on 31/10/2021 (` in Cr): 581.37Average Maturity: 0.72 months Modified Duration: 0.74 monthsMacaulay Duration: 0.78 months Portfolio Yield: 3.63%
NAV Regular Plan Direct Plan
Growth ` 271.2812 ` 273.2852
Daily IDCW** ` 100.3040 ` 106.1241
Weekly IDCW** ` 100.5230 ` 100.5236
Monthly IDCW** ` 108.4527 ` 107.6860
Bonus ` 185.4593 —
Load Structure$: Entry Load: NA.Exit Load (w.e.f. October 20, 2019):
Investor exit upon subscription
Exit load as a % of redemption/ switch proceeds
Day 1 0.0070%Day 2 0.0065%Day 3 0.0060%Day 4 0.0055%Day 5 0.0050%Day 6 0.0045%
Day 7 onwards 0.0000%
## For rating methodology refer page no. 31
Asset Allocation (%) Credit Quality Profile (%)
Details as on October 31, 2021
This product is suitable for investors who are seeking*
• Liquidity and generate income in the short term
• Investment in debt and money market securities with maturity upto 91 days only
• Degree of risk – LOW TO MODERATE
* Investors should consult their financial advisers if in doubt about whether the product is suitable for them.
Scheme Riskometer
Moderate
Low to
Moderat
e
Low
ModeratelyHigh
Very High
High
RISKOMETER
Low to Moderate — investors understand that their principal will be at low to moderate risk.
Benchmark Riskometer
Moderate
Low to
Moderat
e
Low
ModeratelyHighVery High
High
RISKOMETER
CRISIL Liquid Fund IndexBenchmark riskometer is at moderate risk
Regular Plan and Direct Plan are available for subscription as per the below detailsInception Date: Regular Plan: 05/09/2007, Direct Plan: 01/01/2013. Application Amount: ` 5000/- and in multiples of ` 1/- thereafter. Additional Purchase Amount: Minimum of ` 1000/- and in multiples of ` 1/- thereafter. Repurchase / Redemption Amount: ̀ 1000/- and in multiples of ̀ 1/- thereafter or account balance, whichever is lower. SIP/Top Up SIP/STP/SWP: Available. Investment Amount: SIP: Monthly and Quarterly: 5 installments of ̀ 1000/- each and in multiples of ̀ 1/- thereafter. Top Up SIP: Monthly/Quarterly: ̀ 100/- each and in multiples of ̀ 1/- thereafter. STP: Daily/ Weekly/Monthly/Quarterly: 5 installments of ̀ 1000/- and in multiples of ` 1/- thereafter to all open ended schemes except PGIM India Long Term Equity Fund. SWP (Monthly/Quarterly): 5 (five) installments of ` 1000/- each and in multiples of ` 1/- thereafter.
IDCW** HistoryRegular Plan Direct Plan
Record Date
IDCW** / unit (`)#
NAV (`) IDCW** / unit (`)#
NAV (`)
MONTHLY IDCW**27-Aug-21 0.2850 108.7246 0.2920 107.964124-Sep-21 0.2850 108.6919 0.2920 107.930729-Oct-21 0.2850 108.7176 0.2920 107.9575QUARTERLY IDCW**28-Dec-18 1.4674 144.5086 1.5342 146.443825-Mar-19 1.4674 144.7950 1.5342 146.678228-Jun-19 1.4674 145.3521 1.5342 147.1883ANNUAL IDCW**28-Mar-14 8.4000 114.3787 — —23-Mar-18 6.6916 141.2863 — —
# On face value of ̀ 100. Post IDCW** per unit NAV will fall to the extent of the payout and applicable tax/surcharges/cess/other statutory levies. IDCW** distribution is subject to availability of distributable surplus. Past Performance may or may not be sustained in future.
PortfolioIssuer % to Net
AssetsRating
GOI Securities 8.14
Government Of India - Gilts - 8.79% 2021 8.14 SOV
Commercial Paper 49.56
Reliance Jio Infocomm Limited 8.12 CRISIL A1+
TV18 Broadcast Limited 8.12 ICRA A1+
Larsen & Toubro Ltd. 8.08 CRISIL A1+
Berger Paints Limited 8.08 CRISIL A1+
Aditya Birla Money Ltd 6.65 CRISIL A1+
Reliance Industries Ltd. 5.67 CRISIL A1+
National Bank For Agriculture & Rural Development
4.03 ICRA A1+
National Bank For Agriculture & Rural Development
0.81 CARE A1+
Issuer % to Net Assets
Rating
Corporate Debt 0.81
Ultratech Cement Ltd. 0.81 CRISIL AAA
Treasury Bills 18.67
182 Days Tbill Mat 2021 12.99 SOV
182 Days Tbill Mat 2021 4.06 SOV
91 Days Tbill Mat 2021 0.81 SOV
182 Days Tbill Mat 2021 0.81 SOV
Cash & Current Assets 0.23
Reverse Repo 22.59
Total 100.00
**Income Distribution cum Capital Withdrawal option
INSTA CASH FUNDPGIM INDIA
An Open Ended Liquid Scheme
Rated AAAmfs by ICRA##
0.23
0.81
8.14
18.67
22.59
49.56
Cash & Current Assets
Corporate Debt
GOI Securities
Treasury Bills
Reverse Repo
Commercial Paper
26.81
73.19
SOVEREIGN
AAA / A1+
Performance
Fund CRISIL Liquid Fund Index ^ CRISIL 1 Year T-Bill Index #
Period Returns (%) Value (INR)* Returns (%) Value (INR)* Returns (%) Value (INR)*
Regular Plan - Growth Option
7 Days (24 Oct 2021 To 31 Oct 2021) 2.38 10,004.51 2.85 10,005.39 -1.69 9,831.12
15 Days (16 Oct 2021 To 31 Oct 2021) 2.56 10,010.41 2.86 10,011.58 -0.33 9,966.73
30 Days (30 Sep 2021 To 31 Oct 2021) 3.04 10,024.67 3.31 10,026.78 1.22 10,121.59
Last 1 Year (CAGR) 3.18 10,317.82 3.55 10,354.73 3.49 10,348.80
Last 3 Years (CAGR) 4.95 11,561.64 5.25 11,659.67 6.01 11,914.50
Last 5 Years (CAGR) 5.76 13,231.37 5.95 13,355.58 6.01 13,391.80
Since Inception (CAGR) 7.30 27,128.12 7.05 26,227.28 6.32 23,799.81
Direct Plan - Growth Option
7 Days (24 Oct 2021 To 31 Oct 2021) 2.48 10,247.78 2.85 10,285.03 -1.69 9,831.12
15 Days (16 Oct 2021 To 31 Oct 2021) 2.66 10,266.34 2.86 10,285.50 -0.33 9,966.73
30 Days (30 Sep 2021 To 31 Oct 2021) 3.14 10,314.23 3.31 10,330.79 1.22 10,121.59
Last 1 Year (CAGR) 3.30 10,330.30 3.55 10,354.73 3.49 10,348.80
Last 3 Years (CAGR) 5.07 11,602.53 5.25 11,659.67 6.01 11,914.50
Last 5 Years (CAGR) 5.85 13,292.28 5.95 13,355.58 6.01 13,391.80
Since Inception (CAGR) 7.09 18,304.41 7.08 18,291.71 6.67 17,681.81
Date of Inception: Regular Plan: September 05, 2007; Direct Plan: January 01, 2013. CAGR – Compounded Annual Growth Rate^ Scheme Benchmark. # Standard Benchmark. *Based on standard investment of ` 10,000 made at the beginning of the relevant period. Past performance may or may not be sustained in future and should not be used as a basis for comparison with other investments.The above returns are as on October 31, 2021.Returns for the benchmark have been calculated using TRI values.Returns for period of less than 1 year are Simple Annualised Returns. Kurmaresh Ramakrishnan is managing this fund since January 2011. Kunal Jain is managing this fund since January 2018. For performance of schemes managed by Kumaresh Ramakrishnan refer page no. 12, 15-17, 20-24, 26, 31. For performance of schemes managed by Kunal Jain refer page no. 20-23.Different plans have a different expense structure. For Total Expense Ratio as on October 31, 2021 refer page no. 31

22
Regular Plan and Direct Plan are available for subscription as per the below detailsInception Date: Regular Plan: 18/11/2008, Direct Plan: 01/01/2013. Application Amount: ` 5000/- and in multiples of ` 1/- thereafter. Additional Purchase Amount: Minimum of ` 1000/- and in multiples of ` 1/- thereafter. Repurchase / Redemption Amount: Minimum of ̀ 1000/- and in multiples of ̀ 1/- thereafter or account balance, whichever is lower. SIP/Top Up SIP/STP/SWP: Available. Investment Amount: SIP: Monthly and Quarterly: 5 installments of ̀ 1000/- each and in multiples of ̀ 1/- thereafter. Top Up SIP: Monthly/Quarterly: ̀ 100/- each and in multiples of ̀ 1/- thereafter. STP: Daily/ Weekly/Monthly/Quarterly: 5 installments of ̀ 1000/- and in multiples of ` 1/- thereafter to all open ended schemes except PGIM India Long Term Equity Fund. SWP (Monthly/Quarterly): 5 (five) installments of ` 1000/- each and in multiples of ` 1/- thereafter.
Fund Details
Investment Style Box:
Investment Objective: To provide liquidity and seek to generate returns by investing in a mix of short term debt and money market instruments.
Fund Manager: Mr. Kumaresh Ramakrishnan (Over 20 years of experience in Fixed Income market as Fund Manager and Analyst) and Mr. Kunal Jain (Over 10 years of experience in the fund management of fixed income securities)
Benchmark: CRISIL Ultra Short Term Debt Index
Option: IDCW** (Daily Reinvestment of Income Distribution cum Capital Withdrawal option only, Weekly & Monthly - Reinvestment of Income Distribution cum Capital Withdrawal option / Payout of Income Distribution cum Capital Withdrawal option / Transfer of Income Distribution cum Capital Withdrawal option) and Growth.
Quarterly (July-September 2021) Average AUM (` in Cr): 629.93
Monthly Average AUM (` in Cr): 708.59
AUM as on 31/10/2021 (` in Cr): 712.18
Average Maturity: 3.36 months Modified Duration: 3.17 months
Macaulay Duration: 3.58 months Portfolio Yield: 3.91%
NAV (as on 29/10/2021) Regular Plan Direct Plan
Growth ` 27.5655 ` 28.1699
Daily IDCW** ` 10.0203 ` 10.0179
Weekly IDCW** ` 10.0778 ` 10.2662
Monthly IDCW** ` 12.5537 ` 11.9048
Load Structure$: Entry Load: NA. Exit Load: Nil.
$No exit load will be charged for switches and STP between debt schemes of PGIM India Mutual Fund except from PGIM India Insta Cash Fund.
No exit load will be charged for switches and STP from debt schemes except PGIM India Insta Cash Fund to Equity, Hybrid, FOF of PGIM India Mutual Fund.## For rating methodology refer page no. 31
Asset Allocation (%) Credit Quality Profile (%)
Portfolio
Issuer % to Net Assets
Rating
GOI Securities 5.12Government Of India - Gilts - 8.20% - 2022
2.84 SOV
8.96 Punjab SDL Mat 2022 1.57 SOV9.02 Uttarpradesh SDL Mat 2021 0.71 SOVCertificate Of Deposit 10.54Axis Bank Ltd. 3.62 CRISIL A1+Small Industries Development Bank Of India
3.46 CARE A1+
HDFC Bank Ltd. 3.46 CARE A1+Commercial Paper 15.80Aditya Birla Money Ltd 5.59 CRISIL A1+ICICI Securities Ltd 5.27 CRISIL A1+LIC Housing Finance Ltd. 2.73 CRISIL A1+Network 18 Media & Investments Ltd 2.21 CARE A1+Corporate Debt 14.46L And T Finance Ltd (Old Name Family Credit Ltd)
4.54 ICRA AAA
Housing Development Finance Corp. Ltd. 4.23 CRISIL AAALarsen & Toubro Ltd. 3.57 CRISIL AAA
Issuer % to Net Assets
Rating
Ultratech Cement Ltd. 1.41 CRISIL AAAL&T Housing Finance Limited 0.71 ICRA AAATreasury Bills 9.10182 Days Tbill Mat 2021 3.50 SOV182 Days Tbill Mat 2021 2.10 SOV182 Days Tbill Mat 2021 2.10 SOV182 Days Tbill Mat 2021 1.40 SOVPSU Bonds 23.21NTPC Ltd. 6.15 CRISIL AAAPower Finance Corporation Ltd. 5.02 CRISIL AAANational Highways Authority Of India 4.94 CRISIL AAAHousing & Urban Development Corporation Ltd
3.58 CARE AAA
Rural Electrification Corporation Ltd. 3.52 CARE AAAPSU Bank 7.16National Bank For Agriculture & Rural Development
7.16 CRISIL AAA
Reverse Repo 12.11Cash & Current Assets 2.50Total 100.00
Details as on October 31, 2021
This product is suitable for investors who are seeking*• Income over the short term• Investment in short term debt and money
market instruments• Degree of risk – LOW TO MODERATE
* Investors should consult their financial advisers if in doubt about whether the product is suitable for them.
Scheme Riskometer
Moderate
Low to
Moderat
e
Low
ModeratelyHigh
Very High
High
RISKOMETER
Low to Moderate — investors understand that their principal will be at low to moderate risk.
Benchmark Riskometer
Moderate
Low to
Moderat
e
Low
ModeratelyHighVery High
High
RISKOMETER
CRISIL Ultra Short Term Debt IndexBenchmark riskometer is at moderately high risk
Performance (CAGR)
Fund CRISIL Ultra Short Term Debt Index^
CRISIL 1 Year T-Bill Index#
Period Returns (%) Value (INR)* Returns (%) Value (INR)* Returns (%) Value (INR)*
Regular Plan - Growth Option
Last 1 Year 3.27 10,326.71 4.15 10,415.13 3.49 10,348.80
Last 3 Years 7.95 12,583.02 6.32 12,020.08 6.01 11,914.50
Last 5 Years 7.59 14,418.48 6.68 13,816.78 6.01 13,391.80
Since Inception 8.14 27,565.50 7.72 26,188.47 6.31 22,082.05
Direct Plan - Growth Option
Last 1 Year 3.74 10,374.43 4.15 10,415.13 3.49 10,348.80
Last 3 Years 8.26 12,689.90 6.32 12,020.08 6.01 11,914.50
Last 5 Years 7.87 14,609.89 6.68 13,816.78 6.01 13,391.80
Since Inception 8.57 20,674.55 7.60 19,101.03 6.67 17,681.81
Date of Inception: Regular Plan: November 18, 2008; Direct Plan: January 01, 2013. CAGR – Compounded Annual Growth Rate^ Scheme Benchmark. # Standard Benchmark. *Based on standard investment of ` 10,000 made at the beginning of the relevant period. Past performance may or may not be sustained in future and should not be used as a basis for comparison with other investments.The above returns are as on October 29, 2021.Returns for the benchmark have been calculated using TRI values.w.e.f. November 01, 2019 benchmark of the scheme has been changed from CRISIL Liquid Fund Index to CRISIL Ultra Short Term Debt IndexKumaresh Ramakrishnan is managing this fund since January 2011. Kunal Jain is managing this fund since January 2018.For performance of schemes managed by Kumaresh Ramakrishnan refer page no. 12, 15-17, 20-24, 27, 31. For performance of schemes managed by Kunal Jain refer page no. 20-23.Different plans have a different expense structure. For Total Expense Ratio as on October 31, 2021 refer page no. 31
IDCW** HistoryRegular Plan Direct Plan
Record Date
IDCW**/unit (`)#
NAV (`) IDCW**/unit (`)#
NAV (`)
MONTHLY IDCW**27-Aug-21 0.0440 12.5873 0.0460 11.936624-Sep-21 0.0440 12.5682 0.0460 11.918029-Oct-21 0.0440 12.5537 0.0460 11.9048QUARTERLY IDCW**28-Dec-18 0.1267 11.3205 0.1267 11.049025-Mar-19 0.1267 11.3608 0.1267 11.089328-Jun-19 0.1267 11.5195 0.1267 11.2451ANNUAL IDCW**26-Sept-14 — — 1.0000 12.0182
# On face value of ̀ 10. Post IDCW** per unit NAV will fall to the extent of the payout and applicable tax/surcharges/cess/other statutory levies. IDCW** distribution is subject to availability of distributable surplus. Past Performance may or may not be sustained in future.
**Income Distribution cum Capital Withdrawal option
ULTRA SHORT TERM FUNDPGIM INDIA
An open ended ultra-short term debt scheme investing in instruments such that the Macaulay duration of the portfolio is between 3 months to 6 months
Rated AAAmfs by ICRA##
2.505.12
7.169.10
10.5412.11
14.4615.80
23.21
Cash & Current AssetsGOI Securities
PSU BankTreasury Bills
Certificate of DepositReverse Repo
Corporate DebtCommercial Paper
PSU Bonds
14.22
85.78
SOVEREIGN
AAA / A1+
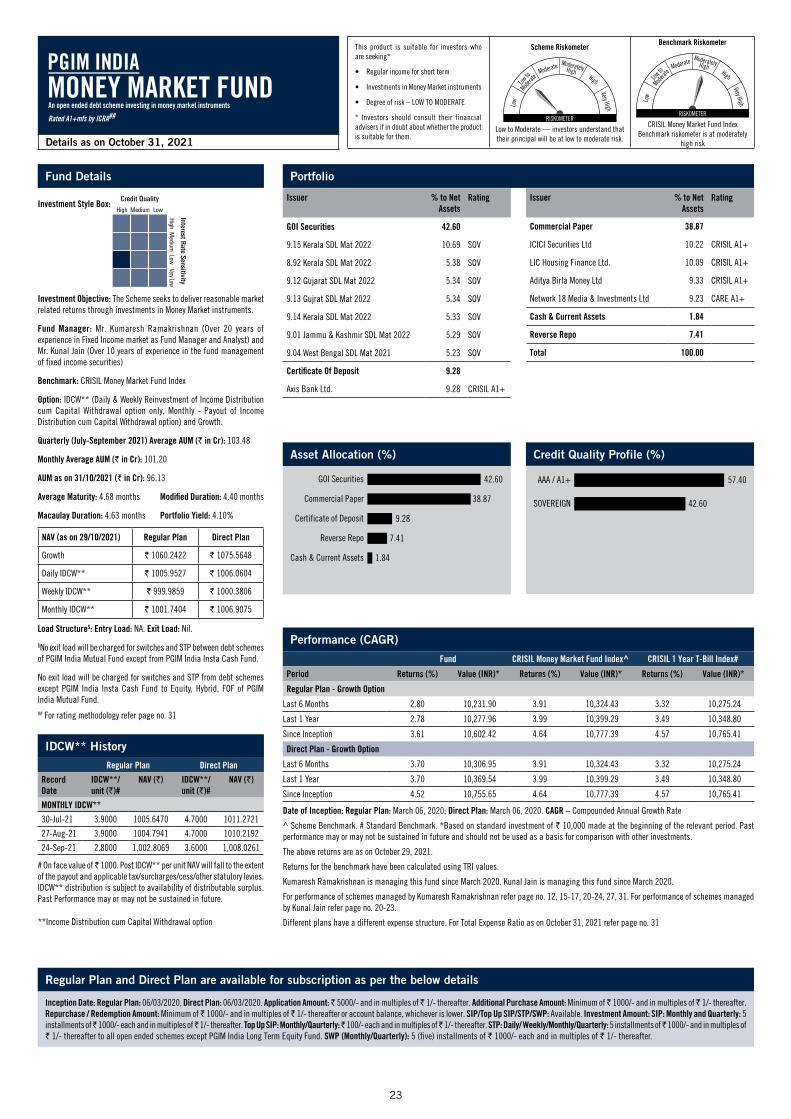
23
Regular Plan and Direct Plan are available for subscription as per the below details
Inception Date: Regular Plan: 06/03/2020, Direct Plan: 06/03/2020. Application Amount: ̀ 5000/- and in multiples of ̀ 1/- thereafter. Additional Purchase Amount: Minimum of ̀ 1000/- and in multiples of ̀ 1/- thereafter. Repurchase / Redemption Amount: Minimum of ̀ 1000/- and in multiples of ̀ 1/- thereafter or account balance, whichever is lower. SIP/Top Up SIP/STP/SWP: Available. Investment Amount: SIP: Monthly and Quarterly: 5 installments of ̀ 1000/- each and in multiples of ̀ 1/- thereafter. Top Up SIP: Monthly/Qaurterly: ̀ 100/- each and in multiples of ̀ 1/- thereafter. STP: Daily/ Weekly/Monthly/Quarterly: 5 installments of ̀ 1000/- and in multiples of ` 1/- thereafter to all open ended schemes except PGIM India Long Term Equity Fund. SWP (Monthly/Quarterly): 5 (five) installments of ` 1000/- each and in multiples of ` 1/- thereafter.
Fund Details
Investment Style Box:
Investment Objective: The Scheme seeks to deliver reasonable market related returns through investments in Money Market instruments.
Fund Manager: Mr. Kumaresh Ramakrishnan (Over 20 years of experience in Fixed Income market as Fund Manager and Analyst) and Mr. Kunal Jain (Over 10 years of experience in the fund management of fixed income securities)
Benchmark: CRISIL Money Market Fund Index
Option: IDCW** (Daily & Weekly Reinvestment of Income Distribution cum Capital Withdrawal option only, Monthly - Payout of Income Distribution cum Capital Withdrawal option) and Growth.
Quarterly (July-September 2021) Average AUM (` in Cr): 103.48
Monthly Average AUM (` in Cr): 101.20
AUM as on 31/10/2021 (` in Cr): 96.13
Average Maturity: 4.68 months Modified Duration: 4.40 months
Macaulay Duration: 4.63 months Portfolio Yield: 4.10%
NAV (as on 29/10/2021) Regular Plan Direct Plan
Growth ` 1060.2422 ` 1075.5648
Daily IDCW** ` 1005.9527 ` 1006.0604
Weekly IDCW** ` 999.9859 ` 1000.3806
Monthly IDCW** ` 1001.7404 ` 1006.9075
Load Structure$: Entry Load: NA. Exit Load: Nil.
$No exit load will be charged for switches and STP between debt schemes of PGIM India Mutual Fund except from PGIM India Insta Cash Fund.
No exit load will be charged for switches and STP from debt schemes except PGIM India Insta Cash Fund to Equity, Hybrid, FOF of PGIM India Mutual Fund.## For rating methodology refer page no. 31
Asset Allocation (%) Credit Quality Profile (%)
Portfolio
Issuer % to Net Assets
Rating
GOI Securities 42.60
9.15 Kerala SDL Mat 2022 10.69 SOV
8.92 Kerala SDL Mat 2022 5.38 SOV
9.12 Gujarat SDL Mat 2022 5.34 SOV
9.13 Gujrat SDL Mat 2022 5.34 SOV
9.14 Kerala SDL Mat 2022 5.33 SOV
9.01 Jammu & Kashmir SDL Mat 2022 5.29 SOV
9.04 West Bengal SDL Mat 2021 5.23 SOV
Certificate Of Deposit 9.28
Axis Bank Ltd. 9.28 CRISIL A1+
Issuer % to Net Assets
Rating
Commercial Paper 38.87
ICICI Securities Ltd 10.22 CRISIL A1+
LIC Housing Finance Ltd. 10.09 CRISIL A1+
Aditya Birla Money Ltd 9.33 CRISIL A1+
Network 18 Media & Investments Ltd 9.23 CARE A1+
Cash & Current Assets 1.84
Reverse Repo 7.41
Total 100.00
Details as on October 31, 2021
This product is suitable for investors who are seeking*
• Regular income for short term
• Investments in Money Market instruments
• Degree of risk – LOW TO MODERATE
* Investors should consult their financial advisers if in doubt about whether the product is suitable for them.
Scheme Riskometer
Moderate
Low to
Moderat
e
Low
ModeratelyHigh
Very High
High
RISKOMETER
Low to Moderate — investors understand that their principal will be at low to moderate risk.
Benchmark Riskometer
Moderate
Low to
Moderat
e
Low
ModeratelyHigh
Very High
High
RISKOMETER
CRISIL Money Market Fund IndexBenchmark riskometer is at moderately
high risk
IDCW** HistoryRegular Plan Direct Plan
Record Date
IDCW**/unit (`)#
NAV (`) IDCW**/unit (`)#
NAV (`)
MONTHLY IDCW**
30-Jul-21 3.9000 1005.6470 4.7000 1011.2721
27-Aug-21 3.9000 1004.7941 4.7000 1010.2192
24-Sep-21 2.8000 1,002.8069 3.6000 1,008.0261
# On face value of ̀ 1000. Post IDCW** per unit NAV will fall to the extent of the payout and applicable tax/surcharges/cess/other statutory levies. IDCW** distribution is subject to availability of distributable surplus. Past Performance may or may not be sustained in future.
Performance (CAGR)
Fund CRISIL Money Market Fund Index^ CRISIL 1 Year T-Bill Index#
Period Returns (%) Value (INR)* Returns (%) Value (INR)* Returns (%) Value (INR)*
Regular Plan - Growth Option
Last 6 Months 2.80 10,231.90 3.91 10,324.43 3.32 10,275.24
Last 1 Year 2.78 10,277.96 3.99 10,399.29 3.49 10,348.80
Since Inception 3.61 10,602.42 4.64 10,777.39 4.57 10,765.41
Direct Plan - Growth Option
Last 6 Months 3.70 10,306.95 3.91 10,324.43 3.32 10,275.24
Last 1 Year 3.70 10,369.54 3.99 10,399.29 3.49 10,348.80
Since Inception 4.52 10,755.65 4.64 10,777.39 4.57 10,765.41
Date of Inception: Regular Plan: March 06, 2020; Direct Plan: March 06, 2020. CAGR – Compounded Annual Growth Rate
^ Scheme Benchmark. # Standard Benchmark. *Based on standard investment of ` 10,000 made at the beginning of the relevant period. Past performance may or may not be sustained in future and should not be used as a basis for comparison with other investments.
The above returns are as on October 29, 2021.
Returns for the benchmark have been calculated using TRI values.
Kumaresh Ramakrishnan is managing this fund since March 2020. Kunal Jain is managing this fund since March 2020.
For performance of schemes managed by Kumaresh Ramakrishnan refer page no. 12, 15-17, 20-24, 27, 31. For performance of schemes managed by Kunal Jain refer page no. 20-23.
Different plans have a different expense structure. For Total Expense Ratio as on October 31, 2021 refer page no. 31**Income Distribution cum Capital Withdrawal option
MONEY MARKET FUNDPGIM INDIA
An open ended debt scheme investing in money market instruments
Rated A1+mfs by ICRA##
1.84
7.41
9.28
38.87
42.60
Cash & Current Assets
Reverse Repo
Certificate of Deposit
Commercial Paper
GOI Securities
42.60
57.40
SOVEREIGN
AAA / A1+

24
Details as on October 31, 2021
This product is suitable for investors who are seeking*
• Income over the short term
• Investment in low duration debt and money market instruments
• Degree of risk – LOW TO MODERATE
* Investors should consult their financial advisers if in doubt about whether the product is suitable for them.
Scheme Riskometer
Moderate
Low to
Moderat
e
Low
ModeratelyHigh
Very High
High
RISKOMETER
Low to Moderate — investors understand that their principal will be at low to moderate risk.
Benchmark Riskometer
Moderate
Low to
Moderat
e
Low
ModeratelyHighVery High
High
RISKOMETER
CRISIL Low Duration Debt IndexBenchmark riskometer is at moderately
high risk
Fund Details
Investment Style Box:
Investment Objective: The objective of the Scheme is to seek to generate income through investment primarily in low duration debt & money market securities.There is no assurance or guarantee that the investment objective of the scheme will be achieved.
Fund Manager: Mr. Kumaresh Ramakrishnan (Over 20 years of experience in Fixed Income markets as Fund Manager and Analyst)
Benchmark: CRISIL Low Duration Debt Index
Option: IDCW** (Daily Reinvestment of Income Distribution cum Capital Withdrawal option only, Regular - Payout of Income Distribution cum Capital Withdrawal option / Reinvestment of Income Distribution cum Capital Withdrawal option, Weekly, Monthly - Reinvestment of Income Distribution cum Capital Withdrawal option / Payout of Income Distribution cum Capital Withdrawal option / Transfer of Income Distribution cum Capital Withdrawal option) and Growth.
Quarterly (July-September 2021) Average AUM (` in Cr): 73.08
Monthly Average AUM (` in Cr): 84.98
AUM as on 31/10/2021 (` in Cr): 86.62
Average Maturity: 0.51 yr Modified Duration: 0.48 yr
Macaulay Duration: 0.53 yr Portfolio Yield: 4.17%
NAV (as on 29/10/2021) Regular Plan Direct Plan
Growth ` 23.7662 ` 25.0971
Daily IDCW** ` 9.2562 ` 9.4104
Weekly IDCW** ` 9.3345 ` 9.6768
Monthly IDCW** ` 10.0325 ` 10.0277
Load Structure$: Entry Load: NA. Exit Load: Nil.
$No exit load will be charged for switches and STP between debt schemes of PGIM India Mutual Fund except from PGIM India Insta Cash Fund.
No exit load will be charged for switches and STP from debt schemes except PGIM India Insta Cash Fund to Equity, Hybrid, FOF of PGIM India Mutual Fund.
Asset Allocation (%) Credit Quality Profile (%)
Portfolio
Issuer % to Net Assets
Rating
GOI Securities 5.94
Government Of India - Gilts - 6.84% 2022
5.94 SOV
Commercial Paper 7.87
LIC Housing Finance Ltd. 5.60 CRISIL A1+
ICICI Securities Ltd 2.27 CRISIL A1+
Corporate Debt 13.52
L And T Finance Ltd (Old Name Family Credit Ltd)
5.29 ICRA AAA
Housing Development Finance Corporation Ltd.
3.54 CRISIL AAA
Hindalco Industries Ltd. 2.36 CRISIL AA+
JM Financial Credit Solutions Limited 1.17 ICRA AA
Indostar Capital Finance Pvt. Ltd. 1.16 CARE AA-
Issuer % to Net Assets
Rating
PSU Bonds 40.63
Power Finance Corporation Ltd. 8.26 CRISIL AAA
NTPC Ltd. 8.23 CRISIL AAA
Small Industries Development Bank Of India
7.06 CARE AAA
Rural Electrification Corporation Ltd. 6.46 CRISIL AAA
Indian Oil Corporation Ltd. 5.80 CRISIL AAA
Food Corporation Of India 4.24 CRISIL AAA (SO)
Bharat Petroleum Corporation Ltd. 0.58 CRISIL AAA
Reverse Repo 30.15
Cash & Current Assets 1.89
Total 100.00
Regular Plan and Direct Plan are available for subscription as per the below detailsInception Date: Regular Plan: 22/06/2007, Direct Plan: 01/01/2013. Application Amount: ` 5000/- and in multiples of ` 1/- thereafter. Additional Purchase Amount: Minimum of ` 1000/- and in multiples of ` 1/- thereafter. Repurchase / Redemption Amount: Minimum of ̀ 1000/- and in multiples of ̀ 1/- thereafter or account balance, whichever is lower. SIP/Top Up SIP/STP/SWP: Available. Investment Amount: SIP: Monthly and Quarterly: 5 installments of ̀ 1000/- each and in multiples of ̀ 1/- thereafter. Top Up SIP: Monthly/Quarterly: ̀ 100/- each and in multiples of ̀ 1/- thereafter. STP: Daily/Weekly/Monthly/Quarterly: 5 installments of ̀ 1000/- and in multiples of ` 1/- thereafter to all open ended schemes except PGIM India Long Term Equity Fund. SWP (Monthly/Quarterly): 5 (five) installments of ` 1000/- each and in multiples of ` 1/- thereafter.
IDCW** HistoryRegular Plan Direct Plan
Record Date
IDCW**/unit (`)#
NAV (`) IDCW**/unit (`)#
NAV (`)
REGULAR IDCW**28-Dec-17 0.1405 11.3151 0.1472 11.659423-Mar-18 0.1405 11.2798 0.1472 11.6394MONTHLY IDCW**27-Aug-21 — — 0.0420 10.064724-Sep-21 0.0340 10.0500 0.0390 10.043929-Oct-21 0.0300 10.0325 0.0240 10.0277QUARTERLY IDCW**28-Sep-18 0.1267 10.2662 0.1334 10.316528-Dec-18 0.1267 10.2976 0.1334 10.354925-Mar-19 0.1267 10.3157 0.1334 10.3850ANNUAL IDCW**24-Mar-17 — — 0.0535 12.289423-Mar-18 0.6692 12.1180 0.6692 13.119525-Mar-19 0.6670 11.9713 0.6670 13.1369
# On face value of ̀ 10. Post IDCW** per unit NAV will fall to the extent of the payout and applicable tax/surcharges/cess/other statutory levies. IDCW** distribution is subject to availability of distributable surplus. Past Performance may or may not be sustained in future.
Performance (CAGR)
Fund CRISIL Low Duration Debt Index^ CRISIL 1 Year T-Bill Index#
Period Returns (%) Value (INR)* Returns (%) Value (INR)* Returns (%) Value (INR)*
Regular Plan - Growth Option
Last 1 Year 3.50 10,349.51 4.37 10,436.93 3.49 10,348.80
Last 3 Years -1.13 9,664.25 7.08 12,281.28 6.01 11,914.50
Last 5 Years 2.03 11,059.70 7.07 14,073.93 6.01 13,391.80
Since Inception 6.21 23,766.20 7.54 28,413.75 6.30 24,064.11
Direct Plan - Growth Option
Last 1 Year 4.21 10,420.70 4.37 10,436.93 3.49 10,348.80
Last 3 Years -0.40 9,879.28 7.08 12,281.28 6.01 11,914.50
Last 5 Years 2.72 11,435.12 7.07 14,073.93 6.01 13,391.80
Since Inception 5.75 16,388.98 8.01 19,752.39 6.67 17,681.81
Date of Inception: Regular Plan: June 22, 2007; Direct Plan: January 01, 2013. CAGR – Compounded Annual Growth Rate
^ Scheme Benchmark. # Standard Benchmark. *Based on standard investment of ` 10,000 made at the beginning of the relevant period. Past performance may or may not be sustained in future and should not be used as a basis for comparison with other investments.
The above returns are as on October 29, 2021.W.e.f. May 01, 2018, the benchmark of the scheme has been changed from CRISIL Liquid Fund Index to CRISIL Low Duration Debt Index.
Returns for the benchmark have been calculated using TRI values.
Kumaresh Ramakrishnan is managing this fund since August 2008.
For performance of schemes managed by Kumaresh Ramakrishnan refer page no. 12, 15-17, 20-24, 27, 31
Different plans have a different expense structure. For Total Expense Ratio as on October 31, 2021 refer page no. 31**Income Distribution cum Capital Withdrawal option
* AA include securities rated as AA and AA-
LOW DURATION FUNDPGIM INDIA
An open ended low duration debt scheme investing in instruments such that the Macaulay duration of the portfolio is between 6 months to 12 months
5.94
2.33
2.36
89.37
SOVEREIGN
AA*
AA+
AAA / A1+
1.89
5.94
7.87
13.52
30.15
40.63
Cash & Current Assets
GOI Securities
Commercial Paper
Corporate Debt
Reverse Repo
PSU Bonds

25
Details as on October 31, 2021
This product is suitable for investors who are seeking*
• Income over the short term
• Investment in short term debt and money market instruments
• Degree of risk – MODERATE
* Investors should consult their financial advisers if in doubt about whether the product is suitable for them.
Scheme Riskometer
Moderate
Low to
Moderat
e
Low
ModeratelyHigh
Very High
High
RISKOMETER
Moderate — investors understand that their principal will be at moderate risk.
Benchmark Riskometer
Moderate
Low to
Moderat
e
Low
ModeratelyHighVery High
High
RISKOMETER
CRISIL Short Term Bond Fund IndexBenchmark riskometer is at moderate risk
Fund Details
Investment Style Box:
Investment Objective: The investment objective of the Scheme is to seek to generate returns with low to medium market risk for investors by investing in a portfolio of short-medium term debt and money market securities.Fund Manager: Mr. Puneet Pal (Over 16 years of experience in Debt Market) and (w.e.f. July 01, 2021) Mr. Ankur Murarka (Over 10 years of experience in the fund management of fixed income securities)Benchmark: CRISIL Short Term Bond Fund IndexOption: IDCW** (Monthly, Quarterly & Annual - Payout of Income Distribution cum Capital Withdrawal option / Reinvestment of Income Distribution cum Capital Withdrawal option / Transfer of Income Distribution cum Capital Withdrawal option) and Growth.Quarterly (July-September 2021) Average AUM (` in Cr): 40.02Monthly Average AUM (` in Cr): 36.66AUM as on 31/10/2021 (` in Cr): 36.20Average Maturity: 2.43 yrs Modified Duration: 1.43 yrsMacaulay Duration: 1.50 years Portfolio Yield: 4.72%
NAV (as on 29/10/2021) Regular Plan Direct Plan
Growth ` 36.2821 ` 39.0352
Monthly IDCW** ` 11.8599 ` 12.4473
Quarterly IDCW** ` 10.1338 ` 10.7795
Half Yearly Bonus ` 14.6597 —
Annual Bonus ` 24.1880 —
Load Structure$: Entry Load: NA. Exit Load: 0.50% If redeemed on or before 6 months from the date of allotment and Nil If redeemed after 6 months from the date of allotment.
$No exit load will be charged for switches and STP between debt schemes of PGIM India Mutual Fund except from PGIM India Insta Cash Fund.
No exit load will be charged for switches and STP from debt schemes except PGIM India Insta Cash Fund to Equity, Hybrid, FOF of PGIM India Mutual Fund.
Asset Allocation (%) Credit Quality Profile (%)
Regular Plan and Direct Plan are available for subscription as per the below details
Inception Date: Regular Plan: 21/01/2003, Direct Plan: 01/01/2013. Application Amount: ` 5000/- and in multiples of ` 1/- thereafter. Additional Purchase Amount: Minimum of ` 1000/- and in multiples of ` 1/- thereafter. Repurchase / Redemption Amount: Minimum of ̀ 1000/- and in multiples of ̀ 1/- thereafter or account balance, whichever is lower. SIP/Top Up SIP/STP/SWP: Available. Investment Amount: SIP: Monthly and Quarterly: 5 installments of ̀ 1000/- each and in multiples of ̀ 1/- thereafter. Top Up SIP: Monthly/Quarterly: ̀ 100/- each and in multiples of ̀ 1/- thereafter. STP: Daily/Weekly/Monthly/Quarterly: 5 installments of ̀ 1000/- and in multiples of ` 1/- thereafter to all open ended schemes except PGIM India Long Term Equity Fund. SWP (Monthly/Quarterly): 5 (five) installments of ` 1000/- each and in multiples of ` 1/- thereafter.
IDCW** HistoryRegular Plan Direct Plan
Record Date
IDCW**/unit (`)#
NAV (`) IDCW**/unit (`)#
NAV (`)
MONTHLY IDCW**27-Aug-21 0.0550 11.9395 0.0610 12.525324-Sep-21 0.0550 11.9201 0.0610 12.507129-Oct-21 0.0550 11.8599 0.0610 12.4473QUARTERLY IDCW**26-Mar-21 0.1400 10.2829 0.1600 10.936525-Jun-21 0.1400 10.2981 0.1600 10.955924-Sep-21 0.1400 10.2783 0.1600 10.9384ANNUAL IDCW**24-Mar-17 0.5353 11.1047 — —23-Mar-18 0.6022 10.9914 — —25-Mar-19 0.4136 10.6908 — —
# On face value of ̀ 10. Post IDCW** per unit NAV will fall to the extent of the payout and applicable tax/surcharges/cess/other statutory levies. IDCW** distribution is subject to availability of distributable surplus. Past Performance may or may not be sustained in future.
Peformance (CAGR)
Fund CRISIL Short TermBond Fund Index^
CRISIL 1 Year T-Bill Index#
Period Returns (%) Value (INR)* Returns (%) Value (INR)* Returns (%) Value (INR)*
Regular Plan - Growth Option
Last 1 Year 3.43 10,342.53 4.81 10,481.12 3.49 10,348.80
Last 3 Years 3.81 11,186.72 8.59 12,806.07 6.01 11,914.50
Last 5 Years 4.68 12,572.03 7.54 14,384.90 6.01 13,391.80
Since Inception 7.10 36,282.10 7.29 37,468.25 5.95 29,636.97
Direct Plan - Growth Option
Last 1 Year 4.18 10,417.83 4.81 10,481.12 3.49 10,348.80
Last 3 Years 4.61 11,448.05 8.59 12,806.07 6.01 11,914.50
Last 5 Years 5.54 13,097.83 7.54 14,384.90 6.01 13,391.80
Since Inception 7.53 18,979.53 8.30 20,226.15 6.67 17,681.81
Date of Inception: Regular Plan: January 21, 2003; Direct Plan: January 01, 2013. CAGR – Compounded Annual Growth Rate
^ Scheme Benchmark. # Standard Benchmark. *Based on standard investment of ` 10,000 made at the beginning of the relevant period. Past performance may or may not be sustained in future and should not be used as a basis for comparison with other investments.
The above returns are as on October 29, 2021.
Returns for the benchmark have been calculated using TRI values.
Puneet Pal is managing this fund since December 2017 and Ankur Murarka is managing this fund w.e.f. July 01, 2021.
For performance of schemes managed by Puneet Pal refer page no. 25-26, 28-30
No other schemes are managed by Ankur Murarka.
Different plans have a different expense structure. For Total Expense Ratio as on October 31, 2021 refer page no. 31
Issuer % to Net Assets
Rating
GOI Securities 20.16
4.04 FRB GOI Mat 2028 10.32 SOV
5.63 GOI Mat 2026 9.16 SOV
6.64 GOI Mat 2035 0.68 SOV
Corporate Debt 30.25
Bajaj Housing Finance Ltd 9.62 CRISIL AAA
Tata Capital Financial Services Ltd 8.33 ICRA AAA
Muthoot Finance Limited 4.18 CRISIL AA+
Fullerton India Credit Company Limited 2.83 CRISIL AAA
Jamnagar Utilities & Power Pvt Ltd 2.74 CARE AAA
Britannia Industries Limited 2.55 CRISIL AAA
Treasury Bills 13.80
91 Days Tbill Mat 2021 13.80 SOV
Portfolio
Issuer % to Net Assets
Rating
PSU Bonds 13.30
Housing & Urban Development Corporation Ltd
5.66 ICRA AAA
Nuclear Power Corporation Of India Ltd 2.91 CRISIL AAA
Rural Electrification Corporation Ltd. 2.78 CRISIL AAA
Power Grid Corporation Of India Ltd. 1.95 CRISIL AAA
PSU Bank 9.88
National Bank For Agriculture & Rural Development
6.98 CRISIL AAA
National Housing Bank 2.90 CRISIL AAA
Perpetual Bond* 2.77
Axis Bank Ltd. 2.77 CRISIL AA+
Reverse Repo 10.11
Cash & Current Assets -0.27
Total 100.00
*All the perpetual bonds in PGIM India Short Maturity Fund are Basel III bonds.
**Income Distribution cum Capital Withdrawal option
SHORT MATURITY FUNDPGIM INDIA
An open ended short term debt scheme investing in instruments such that the Macaulay duration of the portfolio is between 1 year to 3 years
-0.272.77
9.8810.11
13.3013.80
20.1630.25
Cash & Current AssetsPerpetual Bond*
PSU BankReverse Repo
PSU BondsTreasury BillsGOI Securities
Corporate Debt
33.96
6.95
59.09
SOVEREIGN
AA+
AAA / A1+
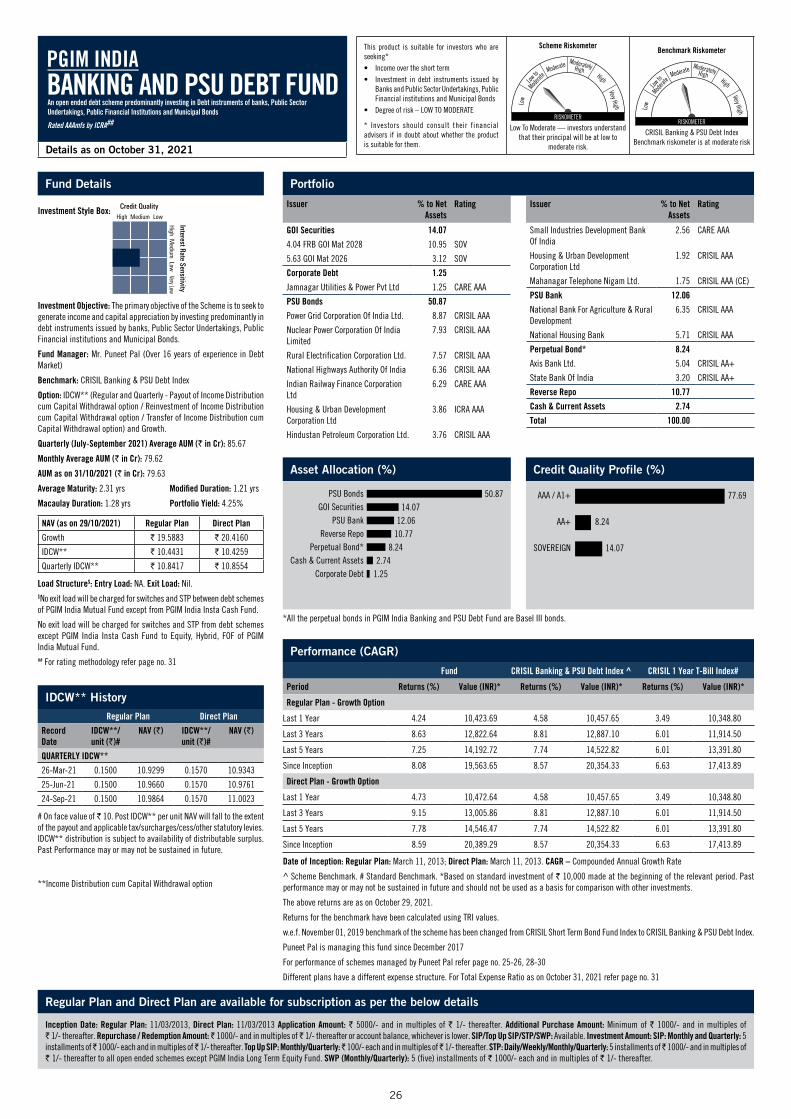
26
Fund Details
Investment Style Box:
Investment Objective: The primary objective of the Scheme is to seek to generate income and capital appreciation by investing predominantly in debt instruments issued by banks, Public Sector Undertakings, Public Financial institutions and Municipal Bonds.
Fund Manager: Mr. Puneet Pal (Over 16 years of experience in Debt Market)
Benchmark: CRISIL Banking & PSU Debt Index
Option: IDCW** (Regular and Quarterly - Payout of Income Distribution cum Capital Withdrawal option / Reinvestment of Income Distribution cum Capital Withdrawal option / Transfer of Income Distribution cum Capital Withdrawal option) and Growth.
Quarterly (July-September 2021) Average AUM (` in Cr): 85.67
Monthly Average AUM (` in Cr): 79.62
AUM as on 31/10/2021 (` in Cr): 79.63
Average Maturity: 2.31 yrs Modified Duration: 1.21 yrs
Macaulay Duration: 1.28 yrs Portfolio Yield: 4.25%
NAV (as on 29/10/2021) Regular Plan Direct Plan
Growth ` 19.5883 ` 20.4160
IDCW** ` 10.4431 ` 10.4259
Quarterly IDCW** ` 10.8417 ` 10.8554
Load Structure$: Entry Load: NA. Exit Load: Nil.$No exit load will be charged for switches and STP between debt schemes of PGIM India Mutual Fund except from PGIM India Insta Cash Fund.
No exit load will be charged for switches and STP from debt schemes except PGIM India Insta Cash Fund to Equity, Hybrid, FOF of PGIM India Mutual Fund.## For rating methodology refer page no. 31
Regular Plan and Direct Plan are available for subscription as per the below details
Inception Date: Regular Plan: 11/03/2013, Direct Plan: 11/03/2013 Application Amount: ` 5000/- and in multiples of ` 1/- thereafter. Additional Purchase Amount: Minimum of ` 1000/- and in multiples of ` 1/- thereafter. Repurchase / Redemption Amount: ̀ 1000/- and in multiples of ̀ 1/- thereafter or account balance, whichever is lower. SIP/Top Up SIP/STP/SWP: Available. Investment Amount: SIP: Monthly and Quarterly: 5 installments of ̀ 1000/- each and in multiples of ̀ 1/- thereafter. Top Up SIP: Monthly/Quarterly: ̀ 100/- each and in multiples of ̀ 1/- thereafter. STP: Daily/Weekly/Monthly/Quarterly: 5 installments of ̀ 1000/- and in multiples of ` 1/- thereafter to all open ended schemes except PGIM India Long Term Equity Fund. SWP (Monthly/Quarterly): 5 (five) installments of ` 1000/- each and in multiples of ` 1/- thereafter.
Details as on October 31, 2021
This product is suitable for investors who are seeking*• Income over the short term• Investment in debt instruments issued by
Banks and Public Sector Undertakings, Public Financial institutions and Municipal Bonds
• Degree of risk – LOW TO MODERATE
* Investors should consult their financial advisers if in doubt about whether the product is suitable for them.
Scheme Riskometer
Moderate
Low to
Moderat
e
Low
ModeratelyHigh
Very High
High
RISKOMETER
Low To Moderate — investors understand that their principal will be at low to
moderate risk.
Benchmark Riskometer
Moderate
Low to
Moderat
e
Low
ModeratelyHigh
Very High
High
RISKOMETER
CRISIL Banking & PSU Debt IndexBenchmark riskometer is at moderate risk
Asset Allocation (%) Credit Quality Profile (%)
Performance (CAGR)
Fund CRISIL Banking & PSU Debt Index ^ CRISIL 1 Year T-Bill Index#
Period Returns (%) Value (INR)* Returns (%) Value (INR)* Returns (%) Value (INR)*
Regular Plan - Growth Option
Last 1 Year 4.24 10,423.69 4.58 10,457.65 3.49 10,348.80
Last 3 Years 8.63 12,822.64 8.81 12,887.10 6.01 11,914.50
Last 5 Years 7.25 14,192.72 7.74 14,522.82 6.01 13,391.80
Since Inception 8.08 19,563.65 8.57 20,354.33 6.63 17,413.89
Direct Plan - Growth Option
Last 1 Year 4.73 10,472.64 4.58 10,457.65 3.49 10,348.80
Last 3 Years 9.15 13,005.86 8.81 12,887.10 6.01 11,914.50
Last 5 Years 7.78 14,546.47 7.74 14,522.82 6.01 13,391.80
Since Inception 8.59 20,389.29 8.57 20,354.33 6.63 17,413.89
Date of Inception: Regular Plan: March 11, 2013; Direct Plan: March 11, 2013. CAGR – Compounded Annual Growth Rate
^ Scheme Benchmark. # Standard Benchmark. *Based on standard investment of ` 10,000 made at the beginning of the relevant period. Past performance may or may not be sustained in future and should not be used as a basis for comparison with other investments.
The above returns are as on October 29, 2021.
Returns for the benchmark have been calculated using TRI values.
w.e.f. November 01, 2019 benchmark of the scheme has been changed from CRISIL Short Term Bond Fund Index to CRISIL Banking & PSU Debt Index.
Puneet Pal is managing this fund since December 2017
For performance of schemes managed by Puneet Pal refer page no. 25-26, 28-30
Different plans have a different expense structure. For Total Expense Ratio as on October 31, 2021 refer page no. 31
IDCW** HistoryRegular Plan Direct Plan
Record Date
IDCW**/unit (`)#
NAV (`) IDCW**/unit (`)#
NAV (`)
QUARTERLY IDCW**
26-Mar-21 0.1500 10.9299 0.1570 10.9343
25-Jun-21 0.1500 10.9660 0.1570 10.9761
24-Sep-21 0.1500 10.9864 0.1570 11.0023
# On face value of ̀ 10. Post IDCW** per unit NAV will fall to the extent of the payout and applicable tax/surcharges/cess/other statutory levies. IDCW** distribution is subject to availability of distributable surplus. Past Performance may or may not be sustained in future.
Issuer % to Net Assets
Rating
GOI Securities 14.07
4.04 FRB GOI Mat 2028 10.95 SOV
5.63 GOI Mat 2026 3.12 SOV
Corporate Debt 1.25
Jamnagar Utilities & Power Pvt Ltd 1.25 CARE AAA
PSU Bonds 50.87
Power Grid Corporation Of India Ltd. 8.87 CRISIL AAA
Nuclear Power Corporation Of India Limited
7.93 CRISIL AAA
Rural Electrification Corporation Ltd. 7.57 CRISIL AAA
National Highways Authority Of India 6.36 CRISIL AAA
Indian Railway Finance Corporation Ltd
6.29 CARE AAA
Housing & Urban Development Corporation Ltd
3.86 ICRA AAA
Hindustan Petroleum Corporation Ltd. 3.76 CRISIL AAA
Portfolio
Issuer % to Net Assets
Rating
Small Industries Development Bank Of India
2.56 CARE AAA
Housing & Urban Development Corporation Ltd
1.92 CRISIL AAA
Mahanagar Telephone Nigam Ltd. 1.75 CRISIL AAA (CE)
PSU Bank 12.06
National Bank For Agriculture & Rural Development
6.35 CRISIL AAA
National Housing Bank 5.71 CRISIL AAA
Perpetual Bond* 8.24
Axis Bank Ltd. 5.04 CRISIL AA+
State Bank Of India 3.20 CRISIL AA+
Reverse Repo 10.77
Cash & Current Assets 2.74
Total 100.00
*All the perpetual bonds in PGIM India Banking and PSU Debt Fund are Basel III bonds.
**Income Distribution cum Capital Withdrawal option
BANKING AND PSU DEBT FUNDPGIM INDIA
An open ended debt scheme predominantly investing in Debt instruments of banks, Public Sector Undertakings, Public Financial Institutions and Municipal Bonds
Rated AAAmfs by ICRA##
1.252.74
8.2410.7712.06
14.0750.87
Corporate DebtCash & Current Assets
Perpetual Bond*Reverse Repo
PSU BankGOI Securities
PSU Bonds
14.07
8.24
77.69
SOVEREIGN
AA+
AAA / A1+

27
Fund Details
Investment Style Box:
Investment Objective: The investment objective of the Scheme is to seek to generate income and capital appreciation by investing predominantly in AA and below rated corporate debt (excluding AA+ rated corporate bonds).
Fund Manager: Mr. Kumaresh Ramakrishnan (Over 20 years of experience in Fixed Income market as Fund Manager and Analyst).
Benchmark: NIFTY Credit Risk Bond Index
Option: IDCW** (Quarterly - Payout of Income Distribution cum Capital Withdrawal option / Reinvestment of Income Distribution cum Capital Withdrawal option / Transfer of Income Distribution cum Capital Withdrawal option) and Growth.
Main Portfolio (` in Cr)
Segregated Portfolio 1 (` in Cr)
Quarterly Average AUM(July-September 2021)
44.42 0.00
Monthly Average AUM 44.49 0.00
AUM as on 31/10/2021 43.74 0.00
Average Maturity: 1.02 yrs Modified Duration: 0.89 yrs
Macaulay Duration: 0.94 yrs Portfolio Yield: 5.01%
NAV (as on 29/10/2021) Main Portfolio Segregated Portfolio 1
Growth ` 15.4963 ` 0.0000
Quarterly IDCW** ` 10.5584 ` 0.0000
Direct-Growth ` 16.6868 ` 0.0000
Direct- Quarterly IDCW** ` 10.9209 ` 0.0000
Load Structure$: Entry Load: NA. Exit Load: 10% – of the units allotted may be redeemed without any exit load within 1 year from the date of allotment; Any redemptions in excess of the abovementioned limit would be subject to an exit load of 1%, if the units are redeemed within 1 year from the date of allotment of units; Nil – If the units are redeemed after 1 year from the date of allotment of units.$No exit load will be charged for switches and STP between debt schemes of PGIM India Mutual Fund except from PGIM India Insta Cash Fund.
No exit load will be charged for switches and STP from debt schemes except PGIM India Insta Cash Fund to Equity, Hybrid, FOF of PGIM India Mutual Fund.
Not Applicable for Segregated Portfolio.
Details as on October 31, 2021
This product is suitable for investors who are seeking*• Income and capital appreciation over medium to
long term• Investments predominantly in AA and below rated
corporate debt securities (excluding AA+ rated corporate bonds) of various maturities
• Degree of risk – LOW TO MODERATE
* Investors should consult their financial advisers if in doubt about whether the product is suitable for them.
Scheme Riskometer
Moderate
Low to
Moderat
e
Low
ModeratelyHigh
Very High
High
RISKOMETER
Low To Moderate — investors understand that their principal will be at low to
moderate risk.
Benchmark Riskometer
Moderate
Low to
Moderat
e
Low
ModeratelyHigh
Very High
High
RISKOMETER
NIFTY Credit Risk Bond IndexBenchmark riskometer is at high risk
Asset Allocation (Main Portfolio) (%)
Asset Allocation-Segregated Portfolio 1 (%)
Credit Quality Profile (Main Portfolio) (%)
Credit Quality Profile-Segregated Portfolio 1 (%)
* AA include securities rated as AA and AA-
Regular Plan and Direct Plan are available for subscription as per the below detailsInception Date: Regular Plan: 29/09/2014, Direct Plan: 29/09/2014. Application Amount: ` 5000/- and in multiples of ` 1/- thereafter. Additional Purchase Amount: Minimum of ` 1000/- and in multiples of ` 1/- thereafter. Repurchase / Redemption Amount: ̀ 1000/- and in multiples of ̀ 1/- thereafter or account balance, whichever is lower. SIP/Top Up SIP/STP/SWP: Available. Investment Amount for: SIP: Monthly and Quarterly: 5 installments of ̀ 1000/- each and in multiples of ̀ 1/- thereafter. Top Up SIP: Monthly/Quarterly: ̀ 100/- each and in multiples of ̀ 1/- thereafter. STP: Daily/Weekly/Monthly/Quarterly: 5 installments of ̀ 1000/- and in multiples of ` 1/- thereafter to all open ended schemes except PGIM India Long Term Equity Fund. SWP (Monthly/Quarterly): 5 (five) installments of ` 1000/- each and in multiples of ` 1/- thereafter.
IDCW** History (Main Portfolio)Regular Plan Direct Plan
Record Date IDCW**/unit (`)#
NAV (`) IDCW**/unit (`)#
NAV (`)
REGULAR IDCW**
28-Dec-18 0.1801 12.5515 — —
25-Mar-19 0.1801 12.5118 — —
28-Jun-19 0.1801 11.8167 — —
QUARTERLY IDCW**
26-Dec-19 0.0934 10.4044 0.1001 10.5919
25-Jun-21 0.1700 10.4432 0.1900 10.8001
24-Sep-21 0.1400 10.3723 0.1600 10.7353
# On face value of ̀ 10. Post IDCW** per unit NAV will fall to the extent of the payout and applicable tax/surcharges/cess/other statutory levies. IDCW** distribution is subject to availability of distributable surplus. Past Performance may or may not be sustained in future.
Performance (CAGR)Fund NIFTY Credit Risk Bond Index^ CRISIL 1 Year T-Bill Index#
Period Returns (%) Value (INR)* Returns (%) Value (INR)* Returns (%) Value (INR)*Regular Plan - Growth Option
Last 1 Year 10.65 11,064.83 8.59 10,859.46 3.49 10,348.80 Last 3 Years 3.48 11,083.12 9.92 13,282.74 6.01 11,914.50 Last 5 Years 4.44 12,429.74 8.61 15,113.09 6.01 13,391.80 Since Inception 6.37 15,496.30 9.17 18,623.25 6.61 15,745.57 Direct Plan - Growth Option
Last 1 Year 11.87 11,187.26 8.59 10,859.46 3.49 10,348.80 Last 3 Years 4.60 11,444.60 9.92 13,282.74 6.01 11,914.50 Last 5 Years 5.57 13,116.89 8.61 15,113.09 6.01 13,391.80 Since Inception 7.49 16,686.80 9.17 18,623.25 6.61 15,745.57
Date of Inception: Regular Plan: September 29, 2014; Direct Plan: September 29, 2014. CAGR – Compounded Annual Growth Rate^ Scheme Benchmark. # Standard Benchmark. *Based on standard investment of ` 10,000 made at the beginning of the relevant period. Past performance may or may not be sustained in future and should not be used as a basis for comparison with other investments.The above returns are as on October 29, 2021.w.e.f. November 01, 2019 benchmark of the scheme has been changed from CRISIL Composite AA Short Term Bond Index to NIFTY Credit Risk Bond Index.Returns for the benchmark have been calculated using TRI values.This performance includes the impact of segregation. On the day of segregation i.e March 6, 2020 the impact on NAV was -4.5%.Kumaresh Ramakrishnan is managing this fund since March 2016For performance of schemes managed by Kumaresh Ramakrishnan refer page no. 12, 15-17, 20-24, 27, 31Different plans have a different expense structure. For Total Expense Ratio as on October 31, 2021 refer page no. 31
Main Portfolio
Issuer % to Net Assets
Rating
Corporate Debt 39.48
Hindalco Industries Ltd. 9.42 CRISIL AA+
JM Financial Credit Solutions Limited 9.30 ICRA AA
Indostar Capital Finance Pvt. Ltd. 9.15 CARE AA-
Sikka Port Terminal Limited (Erstwhile East West Pipeline Limited)
6.94 CRISIL AAA
Housing Development Finance Corporation Ltd.
4.67 CRISIL AAA
PSU Bonds 26.93
Rural Electrification Corporation Ltd. 10.60 CRISIL AAA
Issuer % to Net Assets
Rating
Small Industries Development Bank Of India
9.32 CARE AAA
Power Finance Corporation Ltd. 7.01 CRISIL AAA
Perpetual Bond* 0.47
Canara Bank 0.47 CARE AA
Reverse Repo 30.92
Cash & Current Assets 2.20
Total 100.00
Segregated Portfolio 1
Issuer % to Net Assets RatingPerpetual Bond* 100.00Yes Bank Ltd. 100.00 ICRA DTotal 100.00
100.00Perpetual Bond 100.00D
Yes Bank Limited has been segregated from the scheme’s portfolio due to rating downgrade by ICRA to “D” on March 6, 2020. Kindly refer to SID/KIM for complete details on segregation of portfolio.
*All the perpetual bonds in PGIM India Credit Risk Fund are under Basel III.
**Income Distribution cum Capital Withdrawal option
CREDIT RISK FUND (Number of Segregated Portfolio 1)
PGIM INDIA
An open ended debt scheme predominantly investing in AA and below rated corporate bonds (excluding AA+ rated corporate bonds)
0.47
2.20
26.93
30.92
39.48
Perpetual Bond*
Cash & Current Assets
PSU Bonds
Reverse Repo
Corporate Debt
18.92
9.42
71.66
AA*
AA+
AAA / A1+

28
Fund Details
Investment Style Box:
Investment Objective: The objective of the Scheme is to seek to generate returns through active management of a portfolio of debt and money market instruments.
Fund Manager: Mr. Puneet Pal (Over 16 years of experience in Debt Market)
Benchmark: CRISIL Composite Bond Fund Index
Option: IDCW** (Quarterly - Payout of Income Distribution cum Capital Withdrawal option /Reinvestment of Income Distribution cum Capital Withdrawal option) and Growth.
Quarterly (July-September 2021) Average AUM (` in Cr): 107.90
Monthly Average AUM (` in Cr): 116.13
AUM as on 31/10/2021 (` in Cr): 118.33
Average Maturity: 4.78 yrs Modified Duration: 3.02 yrs
Macaulay Duration: 3.12 yrs Portfolio Yield: 5.17%
NAV (as on 29/10/2021) Regular Plan Direct Plan
Growth ` 2134.8429 ` 2315.4323
Quarterly IDCW** ` 1125.7664 ` 1206.9422
Load Structure$: Entry Load: NA. Exit Load: Nil
$No exit load will be charged for switches and STP between debt schemes of PGIM India Mutual Fund except from PGIM India Insta Cash Fund.
No exit load will be charged for switches and STP from debt schemes except PGIM India Insta Cash Fund to Equity, Hybrid, FOF of PGIM India Mutual Fund.
## For rating methodology refer page no. 31
Details as on October 31, 2021
This product is suitable for investors who are seeking*
• Regular income for short term.
• To generate returns through active management of a portfolio of debt and money market instruments.
• Degree of risk – MODERATE
* Investors should consult their financial advisers if in doubt about whether the product is suitable for them.
Scheme Riskometer
Moderate
Low to
Moderat
e
Low
ModeratelyHigh
Very High
High
RISKOMETER
Moderate — investors understand that their principal will be at moderate risk.
Benchmark Riskometer
Moderate
Low to
Moderat
e
Low
ModeratelyHigh
Very High
High
RISKOMETER
CRISIL Composite Bond Fund IndexBenchmark riskometer is at moderate risk
Asset Allocation (%) Credit Quality Profile (%)
Performance (CAGR)
Fund CRISIL Composite Bond Fund Index^
CRISIL 10 YearGilt Index#
Period Returns (%) Value (INR)* Returns (%) Value (INR)* Returns (%) Value (INR)*
Regular Plan - Growth Option
Last 1 Year 2.90 10,290.42 3.85 10,384.84 1.64 10,163.85
Last 3 Years 8.40 12,739.45 9.73 13,215.43 8.29 12,700.94
Last 5 Years 7.35 14,261.29 7.58 14,410.64 5.85 13,287.73
Since Inception 8.04 21,348.43 8.58 22,400.21 7.06 19,514.93
Direct Plan - Growth Option
Last 1 Year 4.10 10,409.91 3.85 10,384.84 1.64 10,163.85
Last 3 Years 9.39 13,092.10 9.73 13,215.43 8.29 12,700.94
Last 5 Years 8.44 14,995.33 7.58 14,410.64 5.85 13,287.73
Since Inception 8.86 21,157.34 8.51 20,568.99 6.86 17,969.89
Date of Inception: Regular Plan: January 12, 2012; Direct Plan: January 01, 2013. CAGR – Compounded Annual Growth Rate
^ Scheme Benchmark. # Standard Benchmark. *Based on standard investment of ` 10,000 made at the beginning of the relevant period. Past performance may or may not be sustained in future and should not be used as a basis for comparison with other investments.
The above returns are as on October 29, 2021.
Returns for the benchmark have been calculated using TRI values.
Puneet Pal is managing this fund since December 2017
For performance of schemes managed by Puneet Pal refer page no. 25-26, 28-30
Different plans have a different expense structure. For Total Expense Ratio as on October 31, 2021 refer page no. 31
IDCW** HistoryRegular Plan Direct Plan
Record Date
IDCW**/unit (`)#
NAV (`) IDCW**/unit (`)#
NAV (`)
QUARTERLY IDCW**
26-Mar-21 17.2500 1145.9179 20.0000 1224.7776
25-Jun-21 17.2500 1143.8159 20.0000 1224.6370
24-Sep-21 17.2500 1143.9722 20.0000 1226.5791
# On face value of ̀ 1000. Post IDCW** per unit NAV will fall to the extent of the payout and applicable tax/surcharges/cess/other statutory levies. IDCW** distribution is subject to availability of distributable surplus. Past Performance may or may not be sustained in future.
Issuer % to Net Assets
Rating
GOI Securities 60.90
5.63 GOI Mat 2026 30.11 SOV
4.04 FRB GOI Mat 2028 11.58 SOV
6.67 GOI Mat 2035 10.17 SOV
7.27 Govt Stock Mat 2026 4.47 SOV
4.62 GOI Floating Rate Mat 2033(Old Rate 4.70)
2.14 SOV
6.64 GOI Mat 2035 1.45 SOV
5.77% GOI Mat 2030 0.84 SOV
7.17 Govt. Stock 2028 0.14 SOV
Portfolio
Issuer % to Net Assets
Rating
Corporate Debt 12.75
Jamnagar Utilities & Power Pvt Ltd 6.72 CARE AAA
SBI Cards And Payment Services 4.33 CRISIL AAA
Tata Capital Financial Services Ltd 1.70 ICRA AAA
PSU Bank 2.14
National Bank For Agriculture & Rural Development
2.14 CRISIL AAA
Reverse Repo 22.93
Cash & Current Assets 1.28
Total 100.00
Regular Plan and Direct Plan are available for subscription as per the below details
Inception Date: Regular Plan: 12/01/2012, Direct Plan: 01/01/2013. Application Amount: ` 5000/- and in multiples of ` 1/- thereafter. Additional Purchase Amount: Minimum of ` 1000/- and in multiples of ` 1/- thereafter. Repurchase / Redemption Amount: ̀ 1000/- and in multiples of ̀ 1/- thereafter or account balance, whichever is lower. SIP/Top Up SIP/STP/SWP: Available. Investment Amount for: SIP: Monthly and Quarterly: 5 installments of ̀ 1000/- each and in multiples of ̀ 1/- thereafter. Top Up SIP: Monthly/Quarterly: ̀ 100/- each and in multiples of ̀ 1/- thereafter. STP: Daily/Weekly/Monthly/Quarterly: 5 installments of ̀ 1000/- and in multiples of ` 1/- thereafter to all open ended schemes except PGIM India Long Term Equity Fund. SWP (Monthly/Quarterly): 5 (five) installments of ` 1000/- each and in multiples of ` 1/- thereafter.
**Income Distribution cum Capital Withdrawal option
DYNAMIC BOND FUNDPGIM INDIA
An open ended dynamic debt scheme investing across duration
Rated AAAmfs by ICRA##
1.28
2.14
12.75
22.93
60.90
Cash & Current Assets
PSU Bank
Corporate Debt
Reverse Repo
GOI Securities
60.90
39.10
SOVEREIGN
AAA / A1+

29
Fund Details
Investment Style Box:
Investment Objective: The investment objective of the Scheme is to seek to generate income and capital appreciation by predominantly investing in AA+ and above rated corporate bonds.
Fund Manager: Mr. Puneet Pal (Over 16 years of experience in Debt Market)
Benchmark: CRISIL Composite Bond Fund Index
Option: IDCW** (Monthly, Quarterly and Annual - Payout of Income Distribution cum Capital Withdrawal option / Reinvestment of Income Distribution cum Capital Withdrawal option / Transfer of Income Distribution cum Capital Withdrawal option) and Growth.
Quarterly (July-September 2021) Average AUM (` in Cr): 74.80
Monthly Average AUM (` in Cr): 69.77
AUM as on 31/10/2021 (` in Cr): 69.08
Average Maturity: 2.84 yrs Modified Duration: 1.64 yrs
Macaulay Duration: 1.73 yrs Portfolio Yield: 4.88%
NAV (as on 29/10/2021) Regular Plan Direct Plan
Growth ` 34.7977 ` 37.7461
Monthly IDCW** ` 13.3940 ` 15.3216
Quarterly IDCW** ` 11.8278 ` 13.2379
Annual IDCW** ` 10.9787 ` 16.4989
Load Structure$: Entry Load: NA. Exit Load: Nil
$No exit load will be charged for switches and STP between debt schemes of PGIM India Mutual Fund except from PGIM India Insta Cash Fund.
No exit load will be charged for switches and STP from debt schemes except PGIM India Insta Cash Fund to Equity, Hybrid, FOF of PGIM India Mutual Fund.## For rating methodology refer page no. 31
Regular Plan and Direct Plan are available for subscription as per the below details
Inception Date: Regular Plan: 30/01/2003, Direct Plan: 01/01/2013. Application Amount: ` 5000/- and in multiples of ` 1/- thereafter. Additional Purchase Amount: ` 1000/- and in multiples of ` 1/- thereafter. Repurchase / Redemption Amount: ̀ 1000/- and in multiples of ̀ 1/- thereafter or account balance, whichever is lower. SIP/Top Up SIP/STP/SWP: Available. Investment Amount: SIP: Monthly and Quarterly: 5 installments of ̀ 1000/- each and in multiples of ̀ 1/- thereafter. Top Up SIP: Monthly/Quarterly: ̀ 100/- each and in multiples of ̀ 1/- thereafter. STP: Daily/Weekly/Monthly/Quarterly: 5 installments of ̀ 1000/- and in multiples of ` 1/- thereafter to all open ended schemes except PGIM India Long Term Equity Fund. SWP (Monthly/Quarterly): 5 (five) installments of ` 1000/- each and in multiples of ` 1/- thereafter.
Details as on October 31, 2021
This product is suitable for investors who are seeking*
• Income over the medium term
• Investments predominantly in AA+ and above rated corporate bonds including bonds
• Degree of risk – MODERATE
* Investors should consult their financial advisers if in doubt about whether the product is suitable for them.
Scheme Riskometer
Moderate
Low to
Moderat
e
Low
ModeratelyHigh
Very High
High
RISKOMETER
Moderate — investors understand that their principal will be at moderate risk.
Benchmark Riskometer
Moderate
Low to
Moderat
e
Low
ModeratelyHigh
Very High
High
RISKOMETER
CRISIL Composite Bond Fund IndexBenchmark riskometer is at moderate risk
Asset Allocation (%) Credit Quality Profile (%)
Performance (CAGR)
Fund CRISIL Composite Bond Fund Index^
CRISIL 10 YearGilt Index#
Period Returns (%) Value (INR)* Returns (%) Value (INR)* Returns (%) Value (INR)*
Regular Plan - Growth Option
Last 1 Year 4.51 10,451.14 3.85 10,384.84 1.64 10,163.85
Last 3 Years 7.71 12,498.44 9.73 13,215.43 8.29 12,700.94
Last 5 Years 6.43 13,655.23 7.58 14,410.64 5.85 13,287.73
Since Inception 6.87 34,797.70 7.04 35,834.04 6.16 30,710.27
Direct Plan - Growth Option
Last 1 Year 5.18 10,517.57 3.85 10,384.84 1.64 10,163.85
Last 3 Years 8.56 12,798.00 9.73 13,215.43 8.29 12,700.94
Last 5 Years 7.41 14,301.05 7.58 14,410.64 5.85 13,287.73
Since Inception 8.01 19,740.24 8.51 20,568.99 6.86 17,969.89
Date of Inception: Regular Plan: January 30, 2003; Direct Plan: January 01, 2013. CAGR – Compounded Annual Growth Rate
^ Scheme Benchmark. # Standard Benchmark. *Based on standard investment of ` 10,000 made at the beginning of the relevant period. Past performance may or may not be sustained in future and should not be used as a basis for comparison with other investments.
The above returns are as on October 29, 2021.
Returns for the benchmark have been calculated using TRI values.
Puneet Pal is managing this fund since December 2017
For performance of schemes managed by Puneet Pal refer page no. 25-26, 28-30
Different plans have a different expense structure. For Total Expense Ratio as on October 31, 2021 refer page no. 31
IDCW** HistoryRegular Plan Direct Plan
Record Date
IDCW**/unit (`)#
NAV (`) IDCW**/unit (`)#
NAV (`)
MONTHLY IDCW**30-Jul-21 0.0620 13.4508 0.0730 15.376424-Sep-21 0.0620 13.4599 0.0750 15.391229-Oct-21 0.0620 13.3940 0.0750 15.3216QUARTERLY IDCW**26-Mar-21 0.1625 11.9286 0.1950 13.345625-Jun-21 0.1625 11.9785 0.1875 13.398124-Sep-21 0.1650 11.9963 0.1950 13.4282ANNUAL IDCW**25-Mar-19 0.6003 11.0842 0.6670 12.377927-Mar-20 0.4536 11.0913 0.7271 16.653726-Mar-21 0.6100 11.2350 0.9900 16.8991
# On face value of ̀ 10. Post IDCW** per unit NAV will fall to the extent of the payout and applicable tax/surcharges/cess/other statutory levies. IDCW** distribution is subject to availability of distributable surplus. Past Performance may or may not be sustained in future.
Portfolio
Issuer % to Net Assets
Rating
GOI Securities 17.86
4.04 FRB GOI Mat 2028 12.62 SOV
6.10 GOI Mat 2031 2.84 SOV
5.63 GOI Mat 2026 2.40 SOV
Corporate Debt 33.84
Bajaj Housing Finance Ltd 9.36 CRISIL AAA
Jamnagar Utilities & Power Private Limited 7.19 CARE AAA
Britannia Industries Limited 6.24 CRISIL AAA
Fullerton India Credit Company Limited 5.94 CRISIL AAA
Muthoot Finance Limited 5.11 CRISIL AA+
PSU Bonds 27.68
National Highways Authority Of India 7.33 CRISIL AAA
Housing & Urban Development Corp. Ltd 5.16 CRISIL AAA
Issuer % to Net Assets
Rating
Nuclear Power Corporation Of India Limited 4.57 CRISIL AAA
Rural Electrification Corporation Ltd. 4.37 CRISIL AAA
Power Grid Corporation Of India Ltd. 3.36 CRISIL AAA
Hindustan Petroleum Corporation Ltd. 2.89 CRISIL AAA
PSU Bank 6.83
National Housing Bank 6.83 CRISIL AAA
Perpetual Bond* 3.69
State Bank Of India 3.69 CRISIL AA+
Reverse Repo 12.17
Cash & Current Assets -2.07
Total 100.00
*All the perpetual bonds in PGIM India Premier Bond Fund are Basel III bonds.
**Income Distribution cum Capital Withdrawal option
PREMIER BOND FUNDPGIM INDIA
An open ended debt scheme predominantly investing in AA+ and above rated corporate bonds
Rated AAAmfs by ICRA##
17.86
8.80
73.34
SOVEREIGN
AA+
AAA / A1+
-2.073.69
6.8312.17
17.8627.68
33.84
Cash & Current AssetsPerpetual Bond*
PSU BankReverse RepoGOI Securities
PSU BondsCorporate Debt

30
Fund Details
Investment Style Box:
Investment Objective: To seek to generate reasonable returns by investing in Central/State Government securities of various maturities.
Fund Manager: Mr. Puneet Pal (Over 16 years of experience in Debt Market)
Benchmark: CRISIL Dynamic Gilt Index (w.e.f. March 01, 2020 benchmark of the scheme has been changed from I-Sec Mi-Bex to CRISIL Dynamic Gilt Index)
Option: IDCW** (Quarterly - Payout of Income Distribution cum Capital Withdrawal option / Reinvestment of Income Distribution cum Capital Withdrawal option) and Growth.
Quarterly (July-September 2021) Average AUM (` in Cr): 134.13
Monthly Average AUM (` in Cr): 137.89
AUM as on 31/10/2021 (` in Cr): 139.54
Average Maturity: 5.16 yrs Modified Duration: 3.38 yrs
Macaulay Duration: 3.48 yrs Portfolio Yield: 5.25%
NAV (as on 29/10/2021) Regular Plan Direct Plan
Growth ` 24.5585 ` 25.5962
Quarterly IDCW** ` 14.4246 ` 14.8097
Load Structure$: Entry Load: NA. Exit Load: Nil.$No exit load will be charged for switches and STP between debt schemes of PGIM India Mutual Fund except from PGIM India Insta Cash Fund.
No exit load will be charged for switches and STP from debt schemes except PGIM India Insta Cash Fund to Equity, Hybrid, FOF of PGIM India Mutual Fund.
Details as on October 31, 2021
This product is suitable for investors who are seeking*
• Income over the medium term
• Investments only in Central/State securities of various maturities
• Degree of risk – MODERATE
* Investors should consult their financial advisers if in doubt about whether the product is suitable for them.
Scheme Riskometer
Moderate
Low to
Moderat
e
Low
ModeratelyHigh
Very High
High
RISKOMETER
Moderate — investors understand that their principal will be at moderate risk.
Benchmark Riskometer
Moderate
Low to
Moderat
e
Low
ModeratelyHigh
Very High
High
RISKOMETER
CRISIL Dynamic Gilt IndexBenchmark riskometer is at moderate risk
Asset Allocation (%) Credit Quality Profile (%)
Regular Plan and Direct Plan are available for subscription as per the below details
Inception Date: Regular Plan: 27/10/2008, Direct Plan: 01/01/2013. Application Amount: ` 5000/- and in multiples of ` 1/- thereafter. Additional Purchase Amount: ` 1000/- and in multiples of ` 1/- thereafter. Repurchase / Redemption Amount: ̀ 1000/- and in multiples of ̀ 1/- thereafter or account balance, whichever is lower. SIP/Top up SIP/STP/SWP: Available. Investment Amount: SIP: Monthly and Quarterly: 5 installments of ̀ 1000/- each and in multiples of ̀ 1/- thereafter. Top Up SIP: Monthly/Quarterly: ̀ 100/- each and in multiples of ̀ 1/- thereafter. STP: Daily/Weekly/Monthly/Quarterly: 5 installments of ̀ 1000/- and in multiples of ` 1/- thereafter to all open ended schemes except PGIM India Long Term Equity Fund. SWP (Monthly/Quarterly): 5 (five) installments of ` 1000/- each and in multiples of ` 1/- thereafter.
IDCW** HistoryRegular Plan Direct Plan
Record Date
IDCW**/unit (`)#
NAV (`) IDCW**/unit (`)#
NAV (`)
QUARTERLY IDCW**26-Sept-14 0.5971 13.0387 0.5971 13.049127-Mar-15 0.5385 13.2882 0.5385 13.318328-Mar-16 0.6692 13.3825 0.6692 13.445828-Dec-17 0.1472 14.1658 0.1539 14.294223-Mar-18 0.1472 14.0648 0.1539 14.199528-Jun-18 0.1467 13.8354 0.1534 13.984628-Sep-18 0.1467 13.7418 0.1534 13.905728-Dec-18 0.1467 14.0894 0.1534 14.270925-Mar-19 0.1467 14.1145 0.1534 14.308128-Jun-19 0.1467 14.6098 0.1534 14.824327-Sep-19 0.1668 14.5706 0.1668 14.792626-Dec-19 0.1668 14.5677 0.1668 14.813227-Mar-20 0.1601 14.7939 0.1601 15.066430-Jun-20 0.2500 14.9987 0.2600 15.295525-Sep-20 0.2250 14.8485 0.2800 15.185931-Dec-20 0.2200 14.9241 0.2500 15.264626-Mar-21 0.2150 14.6143 0.2400 14.962925-Jun-21 0.2150 14.6223 0.2400 14.994024-Sep-21 0.2200 14.6516 0.2450 15.0457
# On face value of ̀ 10. Post IDCW** per unit NAV will fall to the extent of the payout and applicable tax/surcharges/cess/other statutory levies. IDCW** distribution is subject to availability of distributable surplus. Past Performance may or may not be sustained in future.
Performance (CAGR)
Fund CRISIL Dynamic Gilt Index ^ CRISIL 10 Year Gilt Index #
Period Returns (%) Value (INR)* Returns (%) Value (INR)* Returns (%) Value (INR)*
Regular Plan - Growth Option
Last 1 Year 3.24 10,324.34 3.40 10,339.87 1.64 10,163.85
Last 3 Years 8.52 12,782.77 9.39 13,094.18 8.29 12,700.94
Last 5 Years 6.63 13,785.40 7.12 14,107.97 5.85 13,287.73
Since Inception 7.15 24,558.50 7.92 26,971.17 6.48 22,633.44
Direct Plan - Growth Option
Last 1 Year 4.45 10,445.13 3.40 10,339.87 1.64 10,163.85
Last 3 Years 9.40 13,097.11 9.39 13,094.18 8.29 12,700.94
Last 5 Years 7.32 14,239.71 7.12 14,107.97 5.85 13,287.73
Since Inception 8.28 20,184.37 8.13 19,938.97 6.86 17,969.89
Date of Inception: Regular Plan: October 27, 2008; Direct Plan: January 01, 2013. CAGR – Compounded Annual Growth Rate
^ Scheme Benchmark. # Standard Benchmark. *Based on standard investment of ` 10,000 made at the beginning of the relevant period. Past performance may or may not be sustained in future and should not be used as a basis for comparison with other investments.
The above returns are as on October 29, 2021.
w.e.f. March 01, 2020 benchmark of the scheme has been changed from I-Sec Mi-Bex to CRISIL Dynamic Gilt Index
Returns for the benchmark have been calculated using TRI values.
Puneet Pal is managing this fund since December 2017.
For performance of schemes managed by Puneet Pal refer page no. 25-26, 28-30
Different plans have a different expense structure. For Total Expense Ratio as on October 31, 2021 refer page no. 31
Issuer % to Net Assets
Rating
GOI Securities 76.80
5.63 GOI Mat 2026 40.42 SOV
4.04 FRB GOI Mat 2028 10.71 SOV
6.67 GOI Mat 2035 9.02 SOV
7.27 Govt Stock Mat 2026 3.79 SOV
5.15 GOI Mat 2025 3.54 SOV
5.77% GOI Mat 2030 2.58 SOV
6.64 GOI Mat 2035 2.11 SOV
6.10 GOI Mat 2031 2.11 SOV
4.62 GOI Floating Rate Mat 2033(Old Rate 4.70)
1.82 SOV
Portfolio Holdings
Issuer % to Net Assets
Rating
8.27% Rajasthan SDL Special Mat 2023 0.57 SOV
7.57 GOI Mat 2033 0.13 SOV
Treasury Bills 10.74
91 Days Tbill Mat 2021 7.16 SOV
182 Days Tbill Mat 2021 3.58 SOV
Reverse Repo 13.00
Cash & Current Assets -0.54
Total 100.00
**Income Distribution cum Capital Withdrawal option
GILT FUNDPGIM INDIA
An open ended debt scheme investing in government securities across maturities
-0.54
10.74
13.00
76.80
Cash & Current Assets
Treasury Bills
Reverse Repo
GOI Securities
87.54
12.46
SOVEREIGN
AAA / A1+

31
Total Expense Ratio (TER): @@
Different plans have a different expense structure. Month End Total Expense Ratio for the month of October 31, 2021 for PGIM India Large Cap Fund - Regular Plan: 2.46%, PGIM India Large Cap Fund - Direct Plan: 0.95%, PGIM India Flexi Cap Fund - Regular Plan: 2.23%, PGIM India Flexi Cap Fund - Direct Plan: 0.19%, PGIM India Midcap Opportunities Fund - Regular Plan: 2.20%, PGIM India Midcap Opportunities Fund - Direct Plan: 0.32%, PGIM India Small Cap Fund - Regular Plan: 2.19%, PGIM India Small Cap Fund - Direct Plan: 0.25%, PGIM India Long Term Equity Fund - Regular Plan: 2.48%, PGIM India Long Term Equity Fund - Direct Plan: 1.37%, PGIM India Hybrid Equity Fund - Regular Plan: 2.42%, PGIM India Hybrid Equity Fund - Direct Plan: 0.69%, PGIM India Emerging Markets Equity Fund** - Regular Plan: 2.44%, PGIM India Emerging Markets Equity Fund** - Direct Plan: 1.25%, PGIM India Global Equity Opportunities Fund** - Regular Plan: 2.44%, PGIM India Global Equity Opportunities Fund** - Direct Plan: 1.40%, PGIM India Arbitrage Fund - Regular Plan: 0.98%, PGIM India Arbitrage Fund - Direct Plan: 0.33%, PGIM India Equity Savings Fund - Regular Plan: 1.21%, PGIM India Equity Savings Fund - Direct Plan: 0.17%, PGIM India Balanced Advantage Fund - Regular Plan: 2.16%, PGIM India Balanced Advantage Fund - Direct Plan: 0.25%, PGIM India Overnight Fund - Regular Plan: 0.12%, PGIM India Overnight Fund - Direct Plan: 0.07%, PGIM India Insta Cash Fund - Regular Plan: 0.25%, PGIM India Insta Cash Fund - Direct Plan: 0.15%, PGIM India Ultra Short Term Fund - Regular Plan: 0.80%, PGIM India Ultra Short Term Fund - Direct Plan: 0.34%, PGIM India Money Market Fund-Regular Plan: 1.03%, PGIM India Money Market Fund - Direct Plan: 0.15%, PGIM India Low Duration Fund - Regular Plan: 1.19%, PGIM India Low Duration Fund - Direct Plan: 0.46%, PGIM India Short Maturity Fund - Regular Plan: 1.43%, PGIM India Short Maturity Fund - Direct Plan: 0.69%, PGIM India Banking and PSU Debt Fund - Regular Plan: 0.80%, PGIM India Banking and PSU Debt Fund - Direct Plan: 0.33%, PGIM India Credit Risk Fund (Main Portfolio) - Regular Plan: 1.79%, PGIM India Credit Risk Fund (Main Portfolio) - Direct Plan: 0.81%, PGIM India Credit Risk Fund (Number of Segregated Portfolio 1) - Regular Plan: 0.00%, PGIM India Credit Risk Fund (Number of Segregated Portfolio 1) - Direct Plan: 0.00%, PGIM India Dynamic Bond Fund - Regular Plan: 1.80%, PGIM India Dynamic Bond Fund - Direct Plan: 0.59%, PGIM India Premier Bond Fund - Regular Plan: 0.90%, PGIM India Premier Bond Fund - Direct Plan: 0.13%, PGIM India Gilt Fund - Regular Plan: 1.45%, PGIM India Gilt Fund - Direct Plan: 0.30%.
@@ Total Expense Ratio includes Goods and Services Tax on management fees & additional commission.
**Total Expense Ratio for PGIM India Emerging Markets Equity Fund and PGIM India Global Equity Opportunities Fund is inclusive of expense of the underlying fund.
ICRA has assigned the “[ICRA]A1+mfs” (pronounced as ICRA A one plus m f s) rating to the PGIM India Overnight Fund and PGIM India Money Market Fund. Schemes with “[ICRA]A1mfs” rating are considered to have very strong degree of safety regarding timely receipt of payments from the investments that they have made. Modifier {“+” (plus)} can be used with the rating symbol to reflect the comparative standing within the category.
ICRA has assigned the "[ICRA] AAAmfs" (pronounced as ICRA triple A m f s) rating to the PGIM India Insta Cash Fund, PGIM India Ultra Short Term Fund, PGIM India Banking and PSU Debt Fund, PGIM India Dynamic Bond Fund and PGIM India Premier Bond Fund. Schemes with this rating are considered to have the highest degree of safety regarding timely receipt of payments from the investments that they have made.
The ratings should, however, not be construed as an indication of the performance of the Mutual Fund scheme or of volatility in its returns For complete rating scale and definitions please refer to ICRA's Website www.icra.in or other ICRA Rating Publications ICRA Credit Quality Rating Methodology for debt mutual fund schemes
ICRA's mutual fund rating methodology is based on evaluating the inherent credit quality of the fund's portfolio. As a measure of the credit quality of a debt fund's assets, ICRA uses the concept of "credit scores".
These scores are based on ICRA's estimates of credit risk associated with each exposure of the portfolio taking into account its maturity. To quantify the credit risk scores, ICRA uses its database of historical default rates for various rating categories for various maturity buckets. The credit risk ratings incorporate ICRA's assessment of a debt fund's published investment objectives and policies, its management characteristics, and the creditworthiness of its investment portfolio. ICRA reviews relevant fund information on an ongoing basis to support its published rating opinions. If the portfolio credit score meets the benchmark of the assigned rating during the review, the rating is retained. In an event that the benchmark credit score is breached, ICRA gives a month's time to the debt fund manager to bring the portfolio credit score within the benchmark credit score. If the debt fund manager is able to reduce the portfolio credit score within the benchmark credit score, the rating is retained. If the portfolio still continues to breach the benchmark credit score, the rating is revised to reflect the change in credit quality.
Performance of Other Funds (CAGR) Details as on October 31, 2021
Period Last 1 Year Last 3 Years Last 5 Years Benchmark Date of Inception Fund Manager Details
Name of the Scheme
Scheme Returns (%)
Benchmark Returns (%)
Scheme Returns (%)
Benchmark Returns (%)
Scheme Returns (%)
Benchmark Returns (%)
Fund Manager
Managing Since
PGIM India Fixed Duration Fund - Series AY
4.55 3.85 8.86 9.73 — —CRISIL Composite Bond Fund Index
May 31, 2018Kumresh
RamakrishnanMay 31, 2018
PGIM India Fixed Duration Fund - Series BA
4.10 3.85 8.39 9.73 — —CRISIL Composite Bond Fund Index
June 19, 2018Kumresh
RamakrishnanJune 19, 2018
CAGR – Compounded Annual Growth Rate. The above returns are for Regular Plan - Growth Option. Different plans have a different expense structure.Past performance may or may not be sustained in future and should not be used as a basis for comparison with other investments.

32
SIP Performance (CAGR) Details as on October 31, 2021
PGIM India Large Cap FundPeriod Amount (Rs.) Returns (Annualised) (%)
Investment PGIM India Large Cap Fund PGIM India Large Cap Fund Nifty 50 TR Index^Last 1 Year 1,20,000 1,38,925.12 30.75 40.97Last 3 Years 3,60,000 5,08,132.13 23.77 28.25Last 5 Years 6,00,000 9,02,710.07 16.37 22.17Since Inception 22,50,000 1,03,51,611.41 14.46 14.96Date of Inception: Regular Plan: January 21, 2003. Alok Agarwal managing this fund since July 27, 2017.
The fund offers flexible and convenient Systematic Investment Plan (SIP) facility. To illustrate the advantages of SIP investments, this is how your investments would have grown if you had invested ` 10,000 on the 1st Business day of every month over a period of time
PGIM India Flexi Cap FundPeriod Amount (Rs.) Returns (Annualised) (%)
Investment PGIM India Flexi Cap Fund PGIM India Flexi Cap Fund Nifty 500 TR Index^Last 1 Year 1,20,000 1,63,286.23 73.70 44.71Last 3 Years 3,60,000 6,37,000.77 40.91 30.46Last 5 Years 6,00,000 11,51,013.58 26.42 20.50Since Inception 7,90,000 16,52,578.60 22.17 8.86Date of Inception: Regular Plan: March 04, 2015. Anniruddha Naha (Equity Portion) managing this fund since April 05, 2018. A. Anandha Padmanabhan (Equity Portion) managing this fund since January 31, 2021. Ravi Adukia (Overseas Investments) managing this fund since June 01, 2021.
PGIM India Midcap Opportunities FundPeriod Amount (Rs.) Returns (Annualised) (%)
Investment PGIM India Midcap Opportunities Fund PGIM India Midcap Opportunities Fund Nifty Midcap 100 TR Index^
Last 1 Year 1,20,000 1,62,867.64 72.93 59.57Last 3 Years 3,60,000 9,02,545.17 70.03 51.77Last 5 Years 6,00,000 12,95,144.84 31.40 22.13Since Inception 9,50,000 23,93,472.03 22.69 18.57Date of Inception: Regular Plan: December 02, 2013. Aniruddha Naha managing this fund since April 05, 2018. Vivek Sharma managing this fund since June 01, 2021.
^Benchmark. The above performance is for Regular Plan - Growth Option. Different plans have a different expense structure. Past performance may or may not be sustained in future and should not be used as a basis for comparison with other investments.
PGIM India Long Term Equity FundPeriod Amount (Rs.) Returns (Annualised) (%)
Investment PGIM India Long Term Equity Fund PGIM India Long Term Equity Fund S&P BSE 200 TR Index^Last 1 Year 1,20,000 1,47,484.04 45.44 43.25Last 3 Years 3,60,000 10,87,375.78 30.22 29.93Last 5 Years 6,00,000 10,87,375.78 18.27 19.34Since Inception 7,00,000 12,04,216.09 18.52 19.56Date of Inception: Regular Plan: December 11, 2015. Srinivas Rao Ravuri is managing since September 14, 2019. Utkarsh Katkoria managing this fund from June 01, 2021.
PGIM India Hybrid Equity FundPeriod Amount (Rs.) Returns (Annualised) (%)
Investment PGIM India Hybrid Equity Fund PGIM India Hybrid Equity Fund CRISIL Hybrid 35+65 - Aggresive Index^Last 1 Year 1,20,000 1,39,896.17 32.39 28.65Last 3 Years 3,60,000 4,97,869.88 22.28 22.58Last 5 Years 6,00,000 8,65,404.55 14.65 16.80Since Inception 21,30,000 66,52,963.23 11.77 12.79Date of Inception: Regular Plan: January 29, 2004. The debt component of the benchmark is TRI since inception. For equity component of the benchmark, i.e. S&P BSE 200 PRI value is used till 31st July 2006 and TRI is used since 1st Aug 2006. Alok Agarwal (Equity Portion) is managing this scheme since June 2016 and Kumaresh Ramakrishnan (Debt Portion) is managing this scheme since April 05, 2018 and Ravi Adukia (Overseas Investments) is managing this scheme from June 01, 2021.
PGIM India Arbitrage FundPeriod Amount (Rs.) Returns (Annualised) (%)
Investment PGIM India Arbitrage Fund PGIM India Arbitrage Fund Nifty 50 Arbitrage TR Index^Last 1 Year 1,20,000 1,22,335.68 3.66 3.97Last 3 Years 3,60,000 3,82,595.12 4.00 3.77Last 5 Years 6,00,000 6,73,282.49 4.56 4.23Since Inception 8,60,000 10,31,570.66 5.00 4.61Date of Inception: Regular Plan: August 27, 2014. Utkarsh Katkoria (Equity Market) is managing this fund since March 2016, Hitash Dang (Equity Market) is managing this fund since May 2017 and Kumaresh Ramakrishnan (Debt Market) managing this fund since August 2014.
PGIM India Equity Savings FundPeriod Amount (Rs.) Returns (Annualised) (%)
Investment PGIM India Equity Savings Fund PGIM India Equity Savings Fund 70% NIFTY 50 Arbitrage TR Index and 30% NIFTY 50 TR Index^
Last 1 Year 1,20,000 1,29,947.90 15.85 12.94Last 3 Years 3,60,000 4,29,167.92 11.78 12.77Last 5 Years 6,00,000 7,56,747.91 9.23 11.12Since Inception 21,30,000 47,06,232.97 8.30 10.04Date of Inception: Regular Plan: January 29, 2004. Alok Agarwal (Equity Portion) is managing this fund since August 2016, Hitash Dang (Equity Portion) is managing this fund from June 01, 2021 and Kumaresh Ramakrishnan (Debt Portion) is managing this fund since April 05, 2018.
PGIM India Emerging Markets Equity FundPeriod Amount (Rs.) Returns (Annualised) (%)
Investment PGIM India Emerging Markets Equity Fund PGIM India Emerging Markets Equity Fund MSCI Emerging Markets Index^Last 1 Year 1,20,000 1,27,402.07 11.73 -1.36Last 3 Years 3,60,000 4,70,471.41 18.22 11.97Last 5 Years 6,00,000 8,26,754.19 12.80 9.42Since Inception 16,90,000 63,62,668.12 17.22 7.16Date of Inception: Regular Plan: September 11, 2007. Ravi Adukia is managing this fund from June 01, 2021.
PGIM India Global Equity Opportunities FundPeriod Amount (Rs.) Returns (Annualised) (%)
Investment PGIM India Global Equity Opportunities Fund
PGIM India Global Equity Opportunities Fund
MSCI All Country World Index^
Last 1 Year 1,20,000 1,38,330.66 29.75 24.18Last 3 Years 3,60,000 6,17,422.88 38.46 22.23Last 5 Years 6,00,000 12,63,684.48 30.36 17.16Since Inception 13,70,000 35,40,894.96 15.67 13.50Date of Inception: Regular Plan: May 14, 2010. Ravi Adukia is managing this fund from June 01, 2021.

33
Fund Manager:An employee of the asset management company such as a mutual fund or life insurer, who manages investments of the scheme. He is usually part of a larger team of fund managers and research analysts.
Application Amount for Fresh Subscription:This is the minimum investment amount for a new investor in a mutual fund scheme.
Minimum Additional Amount:This is the minimum investment amount for an existing investor in a mutual fund scheme.
Yield to Maturity:The Yield to Maturity or the YTM is the rate of return anticipated on a bond if held until maturity. YTM is expressed as an annual rate. The YTM factors in the bond’s current market price, par value, coupon interest rate and time to maturity.
SIP:SIP or systematic investment plan works on the principle of making periodic investment of a fixed sum. It works similar to a recurring bank deposit. For instance, an investor may opt for an SIP that invests Rs. 500 every 15th of the month in an equity fund for a period of three years.
NAV:The NAV or the net asset value is the total asset value per unit of the mutual fund after deducting all related and permissible expenses. The NAV is calculated at the end of every business day. It is the value at which the investor enters or exits the mutual fund.
Benchmark:A group of securities, usually a market index, whose performance is used as a standard or benchmark to measure investment performance of mutual funds, among other investments. Some typical benchmarks include the Nifty, Sensex, BSE200, BSE500, 10- year Gsec.
Entry Load:A mutual fund may have a sales charge or load at the time of entry and/or exit to compensate the distributor/agent.
Entry load is charged at the time an investor purchases the units of a mutual fund. The entry load is added to the prevailing NAV at the time of investment. For instance, if the NAV is Rs. 100 and the entry load is 1%, the investor will enter the fund at Rs. 101.
Note: SEBI, vide circular dated June 30, 2009 has abolished entry load and mandated that the upfront commission to distributors will be paid by the investor directly to the distributor, based on his assessment of various factors including the service rendered by the distributor.
Exit load:Exit load is charged at the time an investor redeems the units of a mutual fund. The exit load is deducted from the prevailing NAV at the time of redemption. For instance, if the NAV is Rs. 100 and the exit load is 1%, the redemption price would be Rs. 99 per unit.
Modified Duration:Modified duration is the price sensitivity and the percentage change in price for a unit change in yield.
Macaulay Duration:The Macaulay duration is the weighted average term to maturity of the cash flows from a bond. The weight of each cash flow is determined by dividing the present value of the cash flow by the price.
Standard Deviation:Standard Deviation is a statistical measure of the range of an investment’s performance. When a mutual fund has a high standard deviation, its means its range of performance is wide, implying greater volatility.
Sharpe Ratio:The Sharpe Ratio, named after its founder, the Nobel Laureate William Sharpe, is a measure of risk-adjusted returns. It is calculated using standard deviation and excess return to determine reward per unit of risk.
Beta:Beta is a measure of an investment’s volatility vis-à-vis the market. Beta of less than 1 means that the security will be less volatile than the market. A beta of greater than 1 implies that the security’s price will be more volatile than the market.
AUM:AUM or assets under management refers to the recent/ updated cumulative market value of investments managed by a mutual fund or any investment firm.
Holdings:The holdings or the portfolio is a mutual fund’s latest or updated reported statement of investments/ securities. These are usually displayed in terms of percentage to net assets or the rupee value or both. The objective is to give investors an idea of where their money is being invested by the fund manager.
Nature of Scheme:The investment objective and underlying investments determine the nature of the mutual fund scheme. For instance, a mutual fund that aims at generating capital appreciation by investing in stock markets is an equity fund or growth fund. Likewise, a mutual fund that aims at capital preservation by investing in debt markets is a debt fund or income fund. Each of these categories may have sub-categories.
Rating Profile:Mutual funds invest in securities after evaluating their creditworthiness as disclosed by the ratings. A depiction of the mutual fund in various investments based on their ratings becomes the rating profile of the fund. Typically, this is a feature of debt funds.
Portfolio Turnover:Portfolio Turnover is a measure of how frequently assets within a fund are bought and sold by the managers.
R-Squared:R-Squared is a statistical measure that represents the percentage of a fund or security’s movements that can be explained by movements in a benchmark index.
Average Maturity:In a mutual fund containing debt securities, Average Maturity is the average amount of time until the debt securities mature.
Portfolio Yield:Portfolio Yield is computed by determining the cash flows for the portfolio and determining the interest rate that will make the present value of the cash flows equal to the market value of the portfolio.
Total Expense Ratio:Weighted Average i.e. Total Expense of the month / average Asset / number of days in month* days in a year.
How to read the Factsheet
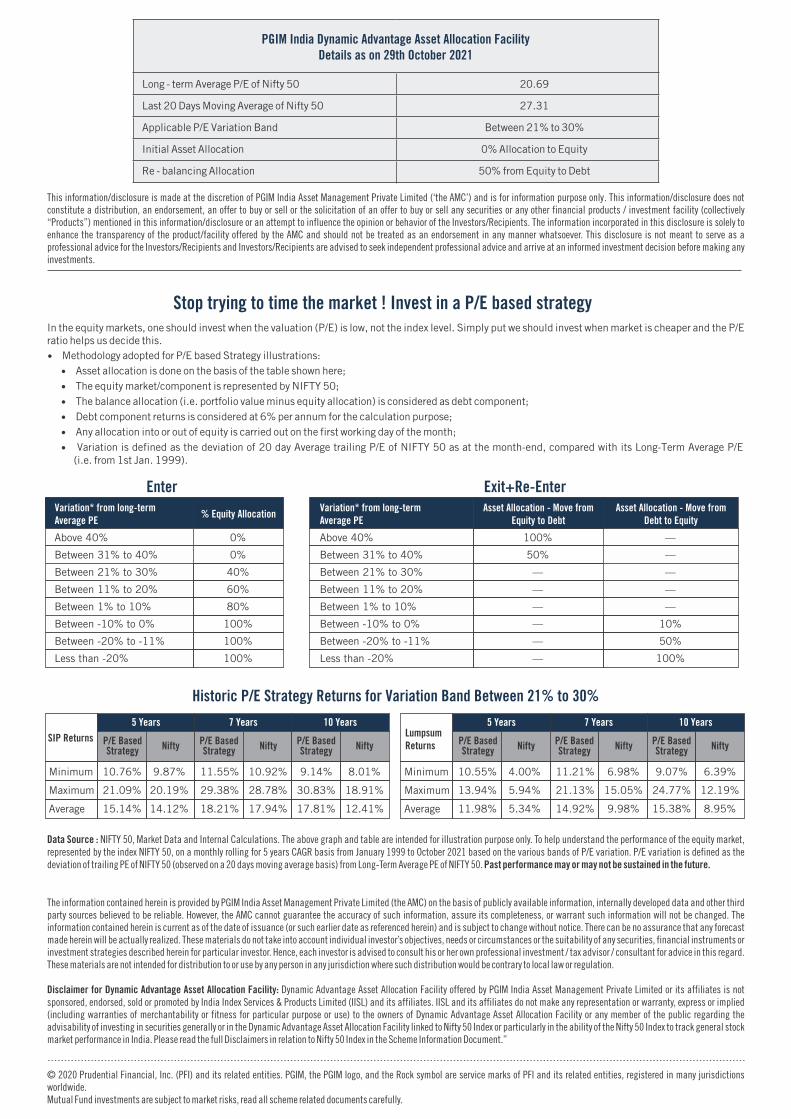
Enter Exit+Re-Enter
This information/disclosure is made at the discretion of PGIM India Asset Management Private Limited (‘the AMC’) and is for information purpose only. This information/disclosure does not constitute a distribution, an endorsement, an offer to buy or sell or the solicitation of an offer to buy or sell any securities or any other financial products / investment facility (collectively “Products”) mentioned in this information/disclosure or an attempt to influence the opinion or behavior of the Investors/Recipients. The information incorporated in this disclosure is solely to enhance the transparency of the product/facility offered by the AMC and should not be treated as an endorsement in any manner whatsoever. This disclosure is not meant to serve as a professional advice for the Investors/Recipients and Investors/Recipients are advised to seek independent professional advice and arrive at an informed investment decision before making any investments.
Stop trying to time the market ! Invest in a P/E based strategyIn the equity markets, one should invest when the valuation (P/E) is low, not the index level. Simply put we should invest when market is cheaper and the P/E ratio helps us decide this.
Methodology adopted for P/E based Strategy illustrations:Ÿ Asset allocation is done on the basis of the table shown here;Ÿ The equity market/component is represented by NIFTY 50;Ÿ The balance allocation (i.e. portfolio value minus equity allocation) is considered as debt component;Ÿ Debt component returns is considered at 6% per annum for the calculation purpose;Ÿ Any allocation into or out of equity is carried out on the first working day of the month;Ÿ Variation is defined as the deviation of 20 day Average trailing P/E of NIFTY 50 as at the month-end, compared with its Long-Term Average P/E Ÿ(i.e. from 1st Jan. 1999).
Historic P/E Strategy Returns for Variation Band Between 21% to 30%
Data Source : NIFTY 50, Market Data and Internal Calculations. The above graph and table are intended for illustration purpose only. To help understand the performance of the equity market, represented by the index NIFTY 50, on a monthly rolling for 5 years CAGR basis from January 1999 to October 2021 based on the various bands of P/E variation. P/E variation is defined as the deviation of trailing PE of NIFTY 50 (observed on a 20 days moving average basis) from Long-Term Average PE of NIFTY 50. Past performance may or may not be sustained in the future.
The information contained herein is provided by PGIM India Asset Management Private Limited (the AMC) on the basis of publicly available information, internally developed data and other third party sources believed to be reliable. However, the AMC cannot guarantee the accuracy of such information, assure its completeness, or warrant such information will not be changed. The information contained herein is current as of the date of issuance (or such earlier date as referenced herein) and is subject to change without notice. There can be no assurance that any forecast made herein will be actually realized. These materials do not take into account individual investor’s objectives, needs or circumstances or the suitability of any securities, financial instruments or investment strategies described herein for particular investor. Hence, each investor is advised to consult his or her own professional investment / tax advisor / consultant for advice in this regard. These materials are not intended for distribution to or use by any person in any jurisdiction where such distribution would be contrary to local law or regulation.
Disclaimer for Dynamic Advantage Asset Allocation Facility: Dynamic Advantage Asset Allocation Facility offered by PGIM India Asset Management Private Limited or its affiliates is not sponsored, endorsed, sold or promoted by India Index Services & Products Limited (IISL) and its affiliates. IISL and its affiliates do not make any representation or warranty, express or implied (including warranties of merchantability or fitness for particular purpose or use) to the owners of Dynamic Advantage Asset Allocation Facility or any member of the public regarding the advisability of investing in securities generally or in the Dynamic Advantage Asset Allocation Facility linked to Nifty 50 Index or particularly in the ability of the Nifty 50 Index to track general stock market performance in India. Please read the full Disclaimers in relation to Nifty 50 Index in the Scheme Information Document.”
PGIM India Dynamic Advantage Asset Allocation FacilityDetails as on 29th October 2021
Long - term Average P/E of Nifty 50 20.69
Last 20 Days Moving Average of Nifty 50 27.31
Applicable P/E Variation Band Between 21% to 30%
Initial Asset Allocation 0% Allocation to Equity
Re - balancing Allocation 50% from Equity to Debt
Variation* from long-termAverage PE
% Equity Allocation
Above 40%
Between 31% to 40%
Between 21% to 30%
Between 11% to 20%
Between 1% to 10%
Between -10% to 0%
Between -20% to -11%
Less than -20%
0%
0%
40%
60%
80%
100%
100%
100%
Variation* from long-termAverage PE
Above 40%
Between 31% to 40%
Between 21% to 30%
Between 11% to 20%
Between 1% to 10%
Between -10% to 0%
Between -20% to -11%
Less than -20%
Asset Allocation - Move fromEquity to Debt
100%
50%
—
—
—
—
—
—
Asset Allocation - Move fromDebt to Equity
—
—
—
—
—
10%
50%
100%
© 2020 Prudential Financial, Inc. (PFI) and its related entities. PGIM, the PGIM logo, and the Rock symbol are service marks of PFI and its related entities, registered in many jurisdictions worldwide. Mutual Fund investments are subject to market risks, read all scheme related documents carefully.
5 Years
Minimum 10.76% 9.87% 11.55% 10.92% 9.14% 8.01%
Maximum 21.09% 20.19% 29.38% 28.78% 30.83% 18.91%
Average 15.14% 14.12% 18.21% 17.94% 17.81% 12.41%
SIP Returns P/E BasedStrategy Nifty
7 Years
P/E BasedStrategy Nifty
10 Years
P/E BasedStrategy Nifty
5 Years
Minimum 10.55% 4.00% 11.21% 6.98% 9.07% 6.39%
Maximum 13.94% 5.94% 21.13% 15.05% 24.77% 12.19%
Average 11.98% 5.34% 14.92% 9.98% 15.38% 8.95%
LumpsumReturns P/E Based
Strategy Nifty
7 Years
P/E BasedStrategy Nifty
10 Years
P/E BasedStrategy Nifty

*Dynamic Advantage Asset Allocation Facility
© 2020 Prudential Financial, Inc. (PFI) and its related entities. PGIM, the PGIM logo, and the Rock symbol are service marks of PFI and its related entities, registered in many jurisdictions worldwide.
Mutual Fund investments are subject to market risks, read all scheme related documents carefully.
This product is suitable for investors who are seeking*:
• Capital appreciation over a long period of time.
• Investment in equity and equity related securities including the use of equity derivatives strategies and arbitrage opportunities with balance exposure in debt and money market instruments.
• Degree of risk – Moderate
* Investors should consult their financial advisers if in doubt about whether the product is suitable for them.
Investors understand that their principalwill be at moderate risk
Moderate
Low to
Moderat
e
Low
ModeratelyHigh
Very High
High
RISKOMETER
C-23
0/20
21-2
2
Related Documents