Market Data Market Data (Price/Exchange Rate/Stock Markets) 01 Market Data (World) 03 Market Data (Japan) 05 Index Data (Consolidated) Profitability Indices 08 Efficiency Indices 09 Productivity Indices 10 Stability Indices 11 Performance Indices 12 Reserves/Production Indices 13 Operating Data Global E&P 14 Main Projects in Production 15 Oil and Gas Reserves 16 Oil and Gas Net Production 20 Sales Volume 21 Business Investment/Others 22 Financial Data (Consolidated) 23 Corporate Information 26 C O N T E N T S Fact Book 2011 Year ended March 31, 2011 A Firm Commitment to Sustainable Energy

Welcome message from author
This document is posted to help you gain knowledge. Please leave a comment to let me know what you think about it! Share it to your friends and learn new things together.
Transcript

Market Data
Market Data (Price/Exchange Rate/Stock Markets) 01
Market Data (World) 03
Market Data (Japan) 05
Index Data (Consolidated)
Profitability Indices 08
Efficiency Indices 09
Productivity Indices 10
Stability Indices 11
Performance Indices 12
Reserves/Production Indices 13
Operating Data
Global E&P 14
Main Projects in Production 15
Oil and Gas Reserves 16
Oil and Gas Net Production 20
Sales Volume 21
Business Investment/Others 22
Financial Data (Consolidated) 23
Corporate Information 26
C O N T E N T S
Fact Book 2011Year ended March 31, 2011
A Firm Commitment to Sustainable Energy
Akasaka Biz Tower 5-3-1 Akasaka, Minato-ku Tokyo 107-6332, JapanPhone: +81-3-5572-0200http://www.inpex.co.jp/
Printed in Japan
A Firm Commitment to Sustainable Energy

Market Data
(U.S.$/bbl)0
30
60
90
120
150(U.S.$/bbl)
ICE BrentNYMEX WTICIF price in Japan
(¥/ton)
(¥/ton)0
50,000
100,000
150,000Average of the high and low price
(U.S.$/ton)
(U.S.$/ton)
0
200
400
600
800
Market Data
Market Data (Price/Exchange Rate/Stock Markets)
Crude oil price trend (ICE Brent/NYMEX WTI/CIF price in Japan)
Annual average 2002 2003 2004 2005 2006 2007 2008 2009 2010 2011ICE Brent 25.02 28.45 37.97 55.08 66.09 72.68 98.37 62.49 80.25 111.19NYMEX WTI 25.83 31.04 41.40 56.56 66.22 72.31 99.65 61.80 79.53 98.33CIF price in Japan 24.63 29.15 36.39 50.99 64.08 69.02 102.42 60.60 79.20 106.00
Source: Petroleum Association of Japan (PAJ), etc. * 2011: From January to June
LNG (CIF) price trend in Japan
Annual average 2002 2003 2004 2005 2006 2007 2008 2009 2010 2011LNG (CIF) price 220.40 246.02 267.28 311.96 367.54 398.68 647.29 467.19 563.88 665.81
* 2011: From January to JuneSource: Petroleum Association of Japan (PAJ)
Steel products (steel plate) price trend in Japan
Annual average 2002 2003 2004 2005 2006 2007 2008 2009 2010 2011Steel products price (steel plate) 40,500 45,667 75,125 83,333 80,500 81,000 117,542 102,167 87,708 87,833
Source: Japan Metal Daily * 2011: From January to June
INPEX CORPORATION Fact Book 201101

Exchange rate trend (Japanese yen against U.S. dollar)
World stock markets (2002/1=100)
Reference: INPEX’s share price performance vs. TOPIX (2006/4=100)
2002 2003 2004 2005 2006 2007 2008 2009 2010 2011Average exchange rate 125.34 115.99 108.23 110.21 116.38 117.84 103.46 93.58 87.81 82.05
Source: Mizuho Corporate Bank * 2011: From January to June
(¥/U.S.$)
(¥/U.S.$)
0
80
90
100
110
120
130
140
0
100
50
150
20081
20091 2 3 4 5 6
20101 7 8 9 101112 2 3 4 5 6
20111
200720064 2 3 4 5 6 7 8 9 1011122 3 4 5 6 7 8 9 1011121 2 3 4 5 6 7 8 9 1011125 6 7 8 9 101112 7
INPEXTOPIX
0
50
100
150
200
300
250
2010/1 2011/12009/12008/12007/12006/12005/12004/12003/12002/1
ASX (Australia)Hang Seng (Hong Kong)TOPIX (Japan)S&P500 (U.S.)FTSE100 (U.K.)
Mar
ket
Dat
a
INPEX CORPORATION Fact Book 2011 02

Market Data
World primary energy consumption 2010
Proved reserves by region and reserves to production ratio (RP ratio) (At the end of 2010)
World oil and gas production
(Million tons oil equivalent) (%)
■ Crude oil 4,028.1 33.6%
■ Natural gas 2,858.1 23.8%
■ Coal 3,555.8 29.6%
■ Nuclear power 626.2 5.2%
■ Hydroelectricity 775.6 6.5%
■ Renewables 158.6 1.3%
Total 12,002.4 100.0%
Total
12,002.4Million tons
oil equivalent
Total
1,383.2Billion bbl
Total
6,608.9Trillion cf
(Thousand bbl/day)
0
25,000
50,000
75,000
100,000
0
1,000
2,000
3,000
4,000
80,278
2,975.9
2001 2002 2003 2004 2005 2006 2007 2008 2009 2010
82,095
74,906 74,700 77,075 80,568 81,485 81,729 81,544 82,0153,193.3
2,478.0 2,519.4 2,616.5 2,694.0 2,778.0 2,880.7 2,950.5 3,062.1
■ Crude oil (Left scale) ■ Natural gas (Right scale)
(Billion m3)
Crude oil Natural gas
Market Data (World)
(Billion bbl) (%)
■ North America 74.3 5.4%
■ Central, South America 239.4 17.3%
■ Europe, Eurasia 139.7 10.1%
■ Middle East 752.5 54.4%
■ Africa 132.1 9.5%
■ Asia Pacific 45.2 3.3%
Total 1,383.2 100.0%
(Trillion cf) (%)
■ North America 350.8 5.3%
■ Central, South America 261.6 4.0%
■ Europe, Eurasia 2,227.6 33.7%
■ Middle East 2,677.0 40.5%
■ Africa 520.1 7.9%
■ Asia Pacific 571.8 8.7%
Total 6,608.9 100.0%
Source: BP “BP Statistical Review of World Energy 2011“
Source: BP “BP Statistical Review of World Energy 2011“ Source: BP “BP Statistical Review of World Energy 2011“
Source: BP “BP Statistical Review of World Energy 2011“
RP ratio (years)
46.2RP ratio (years)
58.6
INPEX CORPORATION Fact Book 201103

Volume of global trade (Crude oil)
Volume of global trade 2010 (LNG)
(Thousand bbl/day)
2002 2003 2004 2005 2006 2007 2008 2009 2010 Change2010 over 2009
2010 share of total
ImportsU.S. 11,357 12,254 12,898 13,525 13,612 13,632 12,872 11,453 11,689 2.1% 21.8%
Europe 11,895 11,993 12,538 13,261 13,461 13,953 13,751 12,486 12,094 (3.1%) 22.6%
Japan 5,070 5,314 5,203 5,225 5,201 5,032 4,925 4,263 4,567 7.1% 8.5%
Rest of World *2 16,291 17,191 18,651 19,172 20,287 22,937 23,078 24,132 25,160 4.3% 47.0%
TOTAL WORLD 44,613 46,752 49,290 51,182 52,561 55,554 54,626 52,333 53,510 2.2% 100.0%
ExportsU.S. 904 921 991 1,129 1,317 1,439 1,967 1,947 2,154 10.7% 4.0%
Canada 1,959 2,096 2,148 2,201 2,330 2,457 2,498 2,518 2,599 3.2% 4.9%
Mexico 1,966 2,115 2,070 2,065 2,102 1,975 1,609 1,449 1,539 6.2% 2.9%
Central, South America 2,965 2,942 3,233 3,528 3,681 3,570 3,616 3,748 3,568 (4.8%) 6.7%
Europe 2,234 2,066 1,993 2,149 2,173 2,273 2,023 2,034 1,888 (7.2%) 3.5%
Former Soviet Union 5,370 6,003 6,440 7,076 7,155 8,334 8,184 7,972 8,544 7.2% 16.0%
Middle East 18,062 18,943 19,630 19,821 20,204 19,680 20,128 18,409 18,883 2.6% 35.3%
North Africa 2,620 2,715 2,917 3,070 3,225 3,336 3,260 2,938 2,871 (2.3%) 5.4%
West Africa 3,134 3,612 4,048 4,358 4,704 4,830 4,587 4,364 4,601 5.5% 8.6%
Asia Pacific *3 3,848 3,978 4,189 4,243 4,312 6,004 5,392 5,631 6,226 10.6% 11.6%
Rest of World *2 1,551 1,361 1,631 1,542 1,359 1,656 1,363 1,323 637 (51.9%) 1.2%
TOTAL WORLD 44,613 46,752 49,290 51,182 52,561 55,554 54,626 52,333 53,510 2.2% 100.0%Source: BP “BP Statistical Review of World Energy 2011”
(Billion m3)
From Export Countries
To Import Countries
U.S.Trinidad
& Tobago
Peru Belgium Norway RussianFederation Algeria Egypt Equatorial
Guinea Libya Nigeria Oman Qatar UAE Yemen Australia Brunei Indonesia Malaysia TOTAL IMPORTS
North AmericaU. S. – 5.38 0.45 – 0.76 – – 2.07 – – 1.18 – 1.29 – 1.10 – – – – 12.23 Canada – 1.59 0.08 – 0.08 – – – – – – – 0.25 – – – – – – 2.00 Mexico – – 0.26 – – – – 0.16 – – 2.23 – 1.02 – 0.18 – – 1.87 – 5.72
Central, South AmericaArgentina – 1.63 – – – – – – – – – – 0.15 – – – – – – 1.78 Brazil 0.09 0.85 0.16 0.08 – – – – 0.08 – 0.89 – 0.59 0.04 – – – – – 2.78 Chile – 0.52 – – – – 0.17 0.55 1.50 – – – 0.25 – 0.08 – – – – 3.07 Dominican Republic – 0.82 – – – – – – – – – – – – – – – – – 0.82 Puerto Rico – 0.77 – – – – – – – – – – – – – – – – – 0.77
EuropeBelgium 0.05 0.08 0.08 – 6.91 – – 0.17 – – 0.16 – 5.80 – – – – – – 6.43 France – 0.35 – – 14.15 – 6.27 0.73 – – 3.57 – 2.43 – 0.08 – – – – 13.94 Greece – 0.08 – – – – 0.98 0.08 0.03 – – – – – – – – – – 1.17 Italy – 0.32 – – 5.75 – 27.56 0.72 0.09 – – – 6.18 – – – – – – 9.08 Portugal – 0.18 – – 0.05 – – – – – 2.70 – 0.08 – – – – – – 3.01 Spain 0.12 3.32 0.63 0.08 3.30 – 12.05 2.62 – 0.34 7.82 0.17 5.54 – 0.18 – – – – 27.54 Turkey – 0.26 – 0.08 0.26 – 3.87 0.27 – – 1.26 – 1.92 – – – – – – 7.92 United Kingdom 0.18 1.63 – – 26.57 – 1.25 0.12 – – 0.40 – 13.89 – 0.26 – – – – 18.67
Middle EastKuwait – 0.33 – 0.09 – 0.09 – 0.33 0.29 – 0.08 0.91 – 0.25 0.09 0.09 – – 0.24 2.78 UAE – – – – – – – – – – – – 17.41 – – – – – – 0.16
Asia PacificChina – 0.07 0.08 0.08 – 0.51 – 0.08 0.08 – 0.17 – 1.61 0.08 0.70 5.21 – 2.45 1.68 12.80 India – 0.66 – – – – – 0.09 0.17 – 0.33 – 10.53 – 0.37 – – – – 12.15 Japan 0.85 0.15 – 0.08 – 8.23 0.08 0.57 0.72 – 0.84 3.80 10.15 6.86 0.16 17.66 7.78 17.00 18.55 93.48 South Korea 0.35 0.88 0.08 0.08 0.16 3.90 – 0.98 1.85 – 1.18 6.11 10.16 0.25 2.27 1.33 1.05 7.42 6.39 44.44 Taiwan – 0.51 – – 0.07 0.67 – 0.17 0.35 – 1.09 0.50 3.75 0.42 – 1.06 2.62 3.68 14.90 TOTAL EXPORTS 1.64 20.38 1.82 0.57 4.71 13.40 19.31 9.71 5.16 0.34 23.90 11.49 75.75 7.90 5.48 25.36 8.83 31.36 30.54 297.63
Source: BP “BP Statistical Review of World Energy 2011”
*1. Annual changes and shares of total are calculated using thousand barrels daily figures. *2. Includes unidentified trade. *3. Excludes Japan. Excludes Trade between other Asia Pacific countries and India prior to 2007.
Note: Numbers in red refer to both pipeline and LNG trade
Mar
ket
Dat
a
INPEX CORPORATION Fact Book 2011 04

Market Data
(1010 kcal)
0
100,000
200,000
300,000
400,000
500,000
600,000
514,818558,651 540,281 548,320 550,333 565,750 565,087 563,197 550,290562,392
(Million tons)
0
50
100
150
200
250
175.7
221.9 216.8 218.8 216.3 215.0 211.8195.4
180.0204.0
(Thousand kl)
917
761 734 756830 860 911
979 973905 3,555
2,499 2,4662,752 2,814 2,957 3,140
3,729 3,7063,408
0
200
400
600
800
1,000(Million m3)
0
1,000
2,000
3,000
4,000
2000 2001 2002 2003 2004 2005 2006 2007 2008 2009
■ Crude oil(Thousand kl) 761 734 756 830 860 911 905 979 973 917(Thousand bbl/day) 13.1 12.6 13.0 14.3 14.8 15.7 15.6 16.9 16.8 15.8
■ Natural gas(Million m3) 2,499 2,466 2,752 2,814 2,957 3,140 3,408 3,729 3,706 3,555(Thousand BOE/day)* 42.6 42.0 46.9 48.0 50.4 53.5 58.1 63.5 63.2 60.6
2000 2001 2002 2003 2004 2005 2006 2007 2008 2009■ Renewables, etc. 7,333 7,015 7,260 7,483 7,322 7,305 7,318 7,465 7,032 6,683
■ Nuclear power 69,241 68,770 63,445 51,603 60,725 64,139 63,859 55,526 54,326 58,876
■ Hydroelectricity 19,253 18,674 18,367 21,248 20,964 17,031 19,426 16,522 16,797 16,961
■ Gas 73,398 72,002 74,321 78,964 78,427 78,806 86,119 92,968 92,721 90,242
■ Crude oil 289,204 271,216 275,742 278,203 275,154 281,136 268,312 268,127 258,663 235,697
■ Coal 100,222 102,604 109,185 112,832 123,158 116,670 117,358 122,589 120,751 106,359Total 558,651 540,281 548,320 550,333 565,750 565,087 562,392 563,197 550,290 514,818
2000 2001 2002 2003 2004 2005 2006 2007 2008 2009■ Electric power 25.2 22.4 25.5 26.4 24.6 25.6 21.5 25.7 23.0 16.6
■ Non-energy* 7.2 6.9 6.7 6.0 5.8 5.4 5.4 5.2 4.5 4.5
■ Transportation 88.9 89.2 89.1 88.8 89.9 88.8 87.8 85.5 82.4 80.6
■ Private 37.1 35.0 36.4 35.1 35.1 35.8 32.6 30.7 27.5 26.3
■ Industrial (Manufacturing) 74.0 71.5 72.7 73.3 71.9 70.1 68.0 64.5 57.2 56.3
■ Industrial (Nonmanufacturing) 14.8 14.2 14.0 13.1 12.4 11.7 10.2 9.5 8.4 7.9Demand total 221.9 216.8 218.8 216.3 215.0 211.8 204.0 195.4 180.0 175.7
Sources: "Handbook of Energy and Economics Statistics in Japan '11"
Sources: "Handbook of Energy and Economics Statistics in Japan '11"
Sources: "Handbook of Energy and Economics Statistics in Japan '11"
*Data calculated from Handbook of Energy and Economics Statistics in Japan '11.
* Grease, Paraffin, Asphalt and Lubricant
Crude oil and natural gas production (Japan)
Primary energy supply (Japan)
Petroleum product demand by sector (Japan)
Market Data (Japan)
(1010Kcal)
(Million tons)
INPEX CORPORATION Fact Book 201105
(Thousand kl)
0
50,000
100,000
150,000
200,000
250,000
300,000
254,604 239,784 241,898 244,854 241,805 249,010 238,649 234,406211,657
242,029
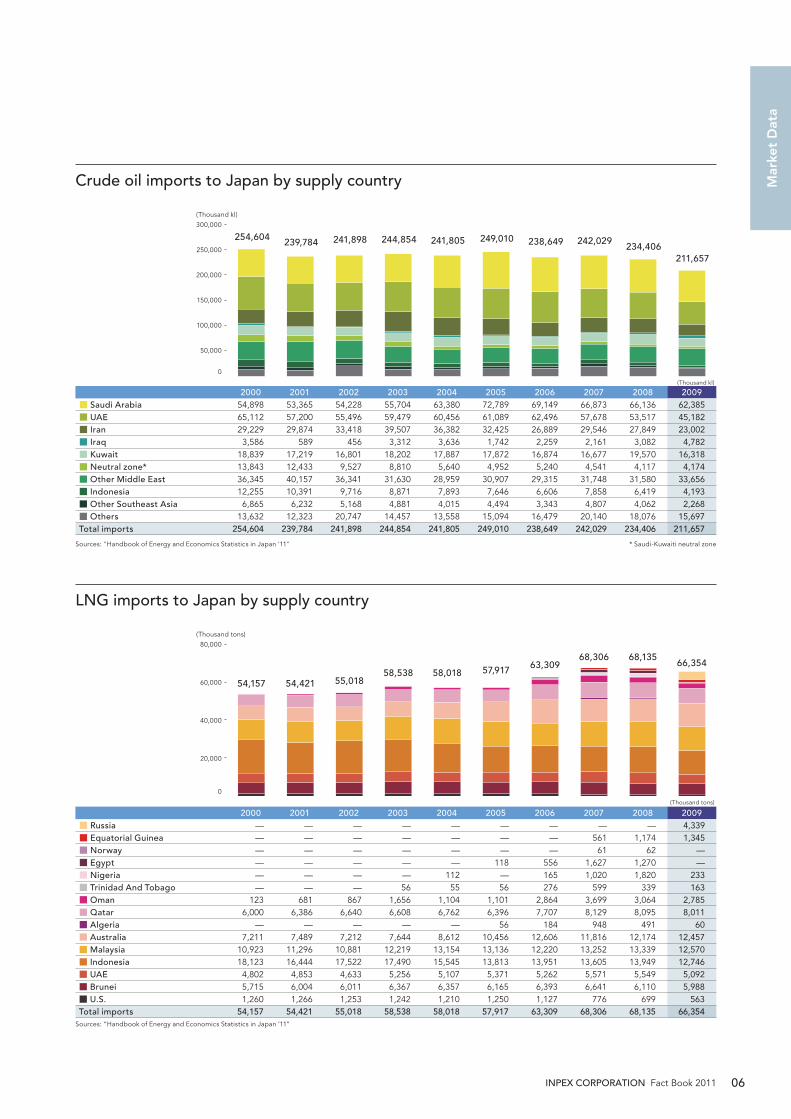
2000 2001 2002 2003 2004 2005 2006 2007 2008 2009■ Saudi Arabia 54,898 53,365 54,228 55,704 63,380 72,789 69,149 66,873 66,136 62,385
■ UAE 65,112 57,200 55,496 59,479 60,456 61,089 62,496 57,678 53,517 45,182
■ Iran 29,229 29,874 33,418 39,507 36,382 32,425 26,889 29,546 27,849 23,002
■ Iraq 3,586 589 456 3,312 3,636 1,742 2,259 2,161 3,082 4,782
■ Kuwait 18,839 17,219 16,801 18,202 17,887 17,872 16,874 16,677 19,570 16,318
■ Neutral zone* 13,843 12,433 9,527 8,810 5,640 4,952 5,240 4,541 4,117 4,174
■ Other Middle East 36,345 40,157 36,341 31,630 28,959 30,907 29,315 31,748 31,580 33,656
■ Indonesia 12,255 10,391 9,716 8,871 7,893 7,646 6,606 7,858 6,419 4,193
■ Other Southeast Asia 6,865 6,232 5,168 4,881 4,015 4,494 3,343 4,807 4,062 2,268
■ Others 13,632 12,323 20,747 14,457 13,558 15,094 16,479 20,140 18,076 15,697Total imports 254,604 239,784 241,898 244,854 241,805 249,010 238,649 242,029 234,406 211,657
Sources: "Handbook of Energy and Economics Statistics in Japan '11" * Saudi-Kuwaiti neutral zone
Crude oil imports to Japan by supply country
Sources: “Handbook of Energy and Economics Statistics in Japan ’11”
LNG imports to Japan by supply country
(Thousand tons)
0
20,000
40,000
60,000
80,000
66,354
54,157 54,421 55,01858,538
68,135
58,01863,309
68,30657,917
2000 2001 2002 2003 2004 2005 2006 2007 2008 2009■ Russia — — — — — — — — — 4,339
■ Equatorial Guinea — — — — — — — 561 1,174 1,345
■ Norway — — — — — — — 61 62 —
■ Egypt — — — — — 118 556 1,627 1,270 —
■ Nigeria — — — — 112 — 165 1,020 1,820 233
■ Trinidad And Tobago — — — 56 55 56 276 599 339 163
■ Oman 123 681 867 1,656 1,104 1,101 2,864 3,699 3,064 2,785
■ Qatar 6,000 6,386 6,640 6,608 6,762 6,396 7,707 8,129 8,095 8,011
■ Algeria — — — — — 56 184 948 491 60
■ Australia 7,211 7,489 7,212 7,644 8,612 10,456 12,606 11,816 12,174 12,457
■ Malaysia 10,923 11,296 10,881 12,219 13,154 13,136 12,220 13,252 13,339 12,570
■ Indonesia 18,123 16,444 17,522 17,490 15,545 13,813 13,951 13,605 13,949 12,746
■ UAE 4,802 4,853 4,633 5,256 5,107 5,371 5,262 5,571 5,549 5,092
■ Brunei 5,715 6,004 6,011 6,367 6,357 6,165 6,393 6,641 6,110 5,988
■ U.S. 1,260 1,266 1,253 1,242 1,210 1,250 1,127 776 699 563Total imports 54,157 54,421 55,018 58,538 58,018 57,917 63,309 68,306 68,135 66,354
(Thousand kl)
(Thousand tons)
Mar
ket
Dat
a
INPEX CORPORATION Fact Book 2011 06

Market Data
Market Data (Japan)
Sources: “Handbook of Energy and Economics Statistics in Japan ’11”
LNG consumption by sector (Japan)
(Thousand tons)
0
20,000
40,000
60,000
80,000
N.A.54,500 N.A. N.A. N.A.
N.A.N.A.
N.A.N.A.
N.A.
2000 2001 2002 2003 2004 2005 2006 2007 2008 2009■ Industrial fuels 667 N.A. N.A. N.A. N.A. N.A. N.A. N.A. N.A. N.A.
■ City gas 15,989 15,084 16,647 17,625 18,878 20,539 23,288 24,697 24,148 23,847
■ Electric power 37,844 38,175 37,914 39,063 37,170 34,640 38,177 42,105 41,034 40,671Total 54,500 N.A. N.A. N.A. N.A. N.A. N.A. N.A. N.A. N.A.Imports 54,157 54,421 55,018 58,538 58,018 57,917 63,309 68,306 68,135 66,354
Breakdown of city gas production, purchases in Japan by raw material source
(109 kcal)
0
100,000
200,000
300,000
400,000
500,000
351,611
253,472 257,426 279,205 289,791
370,566 357,058333,014 348,752307,869
2000 2001 2002 2003 2004 2005 2006 2007 2008 2009■ Others 7 8 8 8 8 11 12 9 9 9
■ Natural gas 14,581 14,808 16,191 17,416 18,303 20,455 23,299 29,513 28,932 27,518
■ LNG 206,467 213,203 234,632 248,616 268,043 293,738 312,684 328,723 316,815 312,619
■ Coal-based gas 2,287 1,855 1,882 1,363 653 476 344 136 6 —
■ Crude oil-based gas 30,130 27,552 26,493 22,388 20,862 18,333 12,413 12,185 11,296 11,465Total 253,472 257,426 279,205 289,791 307,869 333,014 348,752 370,566 357,058 351,611
Gas sales volume by sector (Japan)
(109 kcal)
0
100,000
200,000
300,000
400,000338,374
250,173 254,056 274,338 286,146
345,051301,382
337,619358,956
324,592
2000 2001 2002 2003 2004 2005 2006 2007 2008 2009■ Others 21,206 21,834 23,924 24,494 26,784 28,589 27,602 29,266 28,520 28,857
■ Industrial 93,443 97,626 110,229 120,303 132,852 147,808 164,515 181,522 172,469 167,069
■ Commercial 40,612 41,042 43,458 44,285 47,115 48,919 47,853 49,443 47,604 46,161
■ Residential 94,912 93,554 96,727 97,064 94,631 99,275 97,650 98,724 96,458 96,287Total 250,173 254,056 274,338 286,146 301,382 324,592 337,619 358,956 345,051 338,374
Sources: “Handbook of Energy and Economics Statistics in Japan ’11”
Sources: “Handbook of Energy and Economics Statistics in Japan ’11”
(Thousand tons)
(109kcal)
(109kcal)
INPEX CORPORATION Fact Book 201107

Index DataIndex Data
(¥ million)Years ended March 31 2007 2008 2009 2010 2011Net sales 969,712 1,202,965 1,076,164 840,427 943,080 Crude oil 607,400 783,465 650,352 486,920 557,910 Natural gas 332,937 391,090 398,266 326,412 356,247 Other 29,375 28,409 27,545 27,094 28,921Cost of sales 343,794 390,554 319,038 298,167 334,833Gross profit 625,918 812,410 757,126 542,259 608,247Operating income 559,077 714,211 663,266 461,667 529,742Net income 165,091 173,245 145,062 107,210 128,699EBIDAX (Earnings before interest, depreciation and amortization, and exploration) 321,787 382,649 275,865 242,539 274,929Gross margin 64.5% 67.5% 70.4% 64.5% 64.5%Operating margin 57.7% 59.4% 61.6% 54.9% 56.2%Net margin 17.0% 14.4% 13.5% 12.8% 13.6%
Net sales
Operating income, Operating margin
Cost of sales
Net income, Net margin
Gross profit, Gross margin
EBIDAX
Profitability Indices (Consolidated)
2007/3 2008/3 2009/3 2010/30
900,000
300,000
600,000
1,200,000
1,500,000
2011/3
(¥ million)
969,712
1,076,164
840,427943,080
607,400783,465
391,090
332,937
29,375
1,202,96528,409
650,352
398,266
27,545
486,920
326,412
27,094
557,910
356,247
28,921
■ Net income Net margin
0
20
40
60
80
100
0
600,000
200,000
400,000
800,000
1,000,000
812,410757,126
542,259
625,918
(%)(¥ million)
2007/3 2008/3 2009/3 2010/3 2011/3
608,247
67.5%64.5%
70.4%
64.5% 64.5%
0
20
40
60
80
0
200,000
400,000
600,000
800,000
559,077
714,211
663,266
461,667
(%)(¥ million)
2007/3 2008/3 2009/3 2010/3 2011/3
529,742
57.7% 59.4% 61.6%54.9% 56.2%
0
10
20
30
40
0
50,000
100,000
150,000
200,000
165,091173,245
145,062
107,210
128,699
(%)(¥ million)
2007/3 2008/3 2009/3 2010/3 2011/3
14.4%17.0%
13.5% 12.8% 13.6%
0
300,000
100,000
200,000
400,000
500,000
390,554
343,794319,038
298,167
334,833
(¥ million)
2007/3 2008/3 2009/3 2010/3 2011/3
0
100,000
200,000
300,000
400,000
321,787
382,649
275,865
242,539
274,929
(¥ million)
2007/3 2008/3 2009/3 2010/3 2011/3
• EBIDAX = Net income + Minority interests + Deferred tax + (1 – Tax rate) x (Interest expense – Interest income) + Exchange profit and loss + Depreciation and amortization + Amortization of goodwill + Recovery of recoverable accounts under production sharing (capital expenditures) + Exploration expenses + Provision for exploration projects + Provision for allowance for recoverable accounts under production sharing
• Gross margin = Gross profit / Net sales• Operating margin = Operating income / Net sales• Net margin = Net income / Net sales
■ Operating income Operating margin
■ Other■ Natural gas■ Crude oil
■ Gross profit Gross margin
Mar
ket
Dat
a
INPEX CORPORATION Fact Book 2011 08

Index Data
Efficiency Indices (Consolidated)
Years ended March 31 2007 2008 2009 2010 2011Total assets turnover (Times) 0.64 0.70 0.60 0.44 0.40Net assets turnover (Times) 0.99 1.04 0.83 0.59 0.53Return on equity (ROE) 17.7% 15.8% 11.9% 8.1% 7.6%Net return on average capital employed (Net ROACE) 20.4% 21.4% 14.6% 10.5% 10.8%Return on assets (ROA) 10.9% 10.1% 8.1% 5.7% 5.5%
• Total assets turnover = Net sales / Average of total assets at the beginning and end of the fiscal year
• Net assets turnover = Net sales / Average of net assets at the beginning and end of the fiscal year
• ROE = Net income / Average of net assets excluding minority interests* at the beginning and end of the fiscal year
• Net ROACE = (Net income + Minority interests + (Interest expense – Interest income) × (1 – Tax rate)) / (Average of sum of net assets and net debt* at the beginning and end of the fiscal year)
• ROA = Net income / Average of total assets at the beginning and end of the fiscal year
* See page 11
Total assets turnover
Net ROACE
Net assets turnover
Return on assets (ROA)
Return on equity (ROE)
0
0.2
0.6
0.8
1.0
0.4
0.70
0.640.60
0.440.40
(Times)
2007/3 2008/3 2009/3 2010/3 2011/30
1.0
1.5
0.5
0.991.04
0.83
0.590.53
(Times)
2007/3 2008/3 2009/3 2010/3 2011/30
20
25
15
10
5
(%)
2007/3 2008/3 2009/3 2010/3 2011/3
15.8%
17.7%
11.9%
8.1% 7.6%
0
24
30
18
12
6
(%)
2007/3 2008/3 2009/3 2010/3 2011/3
20.4%
14.6%
10.5% 10.8%
21.4%
0
15
20
10
5
(%)
2007/3 2008/3 2009/3 2010/3 2011/3
10.9%
8.1%
5.7% 5.5%
10.1%
INPEX CORPORATION Fact Book 201109

Productivity Indices (Consolidated)
(¥ million)Years ended March 31 2007 2008 2009 2010 2011Number of employees (End of the fiscal year) 1,672 1,724 1,814 1,870 1,854Net sales per employee 583 708 608 456 506Operating income per employee 336 421 375 251 284Ordinary income per employee 352 404 348 240 273Net income per employee 99 102 82 58 69
• Net sales per employee = Net sales / Average number of employees at the beginning and end of the fiscal year
• Operating income per employee = Operating income / Average number of employees at the beginning and end of the fiscal year
• Ordinary income per employee = Ordinary income / Average number of employees at the beginning and end of the fiscal year
• Net income per employee = Net income / Average number of employees at the beginning and end of the fiscal year
Number of employees (End of the fiscal year)
Ordinary income per employee
Net sales per employee
Net income per employee
Operating income per employee
0
300
200
400
500
100
352
404
348
240
273
(¥ million)
2007/3 2008/3 2009/3 2010/3 2011/30
60
90
120
30
99 102
82
58
69
(¥ million)
2007/3 2008/3 2009/3 2010/3 2011/3
0
1,000
500
1,500
2,000
1,672 1,7241,814 1,870 1,854
(Employees)
2007/3 2008/3 2009/3 2010/3 2011/30
400
200
600
800
583
708
608
456506
(¥ million)
2007/3 2008/3 2009/3 2010/3 2011/30
300
200
400
500
100
336
421
375
251
284
(¥ million)
2007/3 2008/3 2009/3 2010/3 2011/3
Ind
ex D
ata
INPEX CORPORATION Fact Book 2011 10

Index Data
Net assets excluding minority interests,Equity ratio
Fixed ratio
Interest-bearing debt, D/E ratio
Net debt,Net debt / Net total capital employed
Total assets
Current ratio
Stability Indices (Consolidated)
(¥ million)Years ended March 31 2007 2008 2009 2010 2011Total assets 1,608,106 1,807,900 1,768,044 2,013,778 2,680,379Net assets excluding minority interests 1,028,894 1,157,370 1,271,122 1,387,499 1,996,888Interest-bearing debt 248,969 194,087 164,246 240,382 273,147Net debt (169,664) (328,351) (324,108) (349,211) (688,806)Equity ratio 64.0% 64.0% 71.9% 68.9% 74.5%Current ratio 178% 174% 200% 216% 194%Fixed ratio 110% 107% 107% 110% 110%D/E ratio 24.2% 16.8% 12.9% 17.3% 13.7%Interest-bearing debt / Total capital employed 18.7% 13.5% 10.8% 13.9% 11.5%Net debt / Net total capital employed (18.6%) (36.1%) (31.2%) (30.6%) (48.9%)
• Net assets excluding minority interests = Net assets – Minority interests• Interest-bearing debt = Short-term borrowings + Long-term debt• Net debt = Interest-bearing debt – Cash and cash equivalents – Time deposits – Public and corporate bonds and other debt securities with determinable value• Equity ratio = Net assets excluding minority interests / Total assets• Current ratio = Current assets / Current liabilities• Fixed ratio = Fixed assets / Net assets excluding minority interests• D/E ratio = Interest-bearing debt / Net assets excluding minority interests• Interest-bearing debt / Total capital employed = Interest-bearing debt / (Net assets + Interest-bearing debt)• Net debt / Net total capital employed = Net debt / (Net assets + Net debt)
0
2,000,000
3,000,000
1,000,000
1,807,900
1,608,1061,768,044
2,013,778
2,680,379
(¥ million)
2007/3 2008/3 2009/3 2010/3 2011/30
30
60
90
120
0
400,000
1,200,000
1,600,000
2,000,000
800,000
1,157,3701,028,894
1,271,1221,387,499
1,996,888 (%)(¥ million)
2007/3 2008/3 2009/3 2010/3 2011/3
64.0% 64.0%
71.9%68.9%
74.5%
0
10
20
30
40
0
200,000
300,000
100,000
248,969
194,087
164,246
240,382
273,147
(%)(¥ million)
2007/3 2008/3 2009/3 2010/3 2011/3
24.2%
16.8%
12.9%
17.3%
13.7%
0
200
300
100
(%)
2007/3 2008/3 2009/3 2010/3 2011/3
178%
200%216%
194%
174%
0
150
200
100
50
(%)
2007/3 2008/3 2009/3 2010/3 2011/3
107%110% 107% 110% 110%
0
–60
–80
–40
–20
20
0
200,000
–400,000
–600,000
–800,000
–200,000
−169,664 −328,351 −324,108 −349,211 −688,806
(%)(¥ million)
2007/3 2008/3 2009/3 2010/3 2011/3
−18.6%
−36.1%−31.2%
−30.6%
−48.9%
■ Net assets excluding minority interests Equity ratio
■ Interest-bearing debt D/E ratio
■ Net debt Net debt / Net total capital employed
INPEX CORPORATION Fact Book 201111

(Yen)Years ended March 31 2007 2008 2009 2010 2011Earnings per share (EPS) 70,423.45 73,510.14 61,601.60 45,553.56 40,832.40Net assets excluding minority interests per share 436,467.92 491,168.09 540,100.10 589,548.88 546,958.90Cash flow per share 98,957 154,447 97,820 102,559 86,961Cash dividends per share 7,000 7,500 8,000 5,500 6,000Price earnings ratio (PER) (Times) 14.5 15.1 11.1 15.1 15.5Price book-value ratio (PBR) (Times) 2.3 2.3 1.3 1.2 1.2Price cash flow ratio (PCFR) (Times) 10.3 7.2 7.0 6.7 7.3Payout ratio 9.9% 10.2% 13.0% 12.1% 14.7%
Performance Indices (Consolidated)
• EPS = Net income / Average number of shares during the fiscal year
• Net assets excluding minority interests per share = Net assets excluding minority interests / Average number of shares during the fiscal year
• Cash flow per share = Cash flow from operating activities /Number of shares issued at the end of the fiscal year
• PER = Stock price (end of the fiscal year) / EPS
• PBR = Stock price (end of the fiscal year) / Net assets excluding minority interests per share
• PCFR = Stock price (end of the fiscal year) / Cash flow per share
• Payout ratio = Cash dividends per share / EPS
Earnings per share (EPS)
Price book-value ratio (PBR)
Cash dividends per share
Price cash flow ratio (PCFR)
Price earnings ratio (PER)
Payout ratio
0
60,000
80,000
100,000
40,000
20,000
70,423.4573,510.14
61,601.60
45,553.5640,832.40
(Yen)
2007/3 2008/3 2009/3 2010/3 2011/30
6,000
8,000
10,000
4,000
2,000
7,0007,500
8,000
5,500
6,000
(Yen)
2007/3 2008/3 2009/3 2010/3 2011/30
20
30
10
14.5
11.1
15.1 15.5
(Times)
15.1
2007/3 2008/3 2009/3 2010/3 2011/3
0
3
4
2
1
2.3
1.31.2 1.2
(Times)
2.3
2007/3 2008/3 2009/3 2010/3 2011/30
20
10
10.3
7.0 6.77.3
(Times)
7.2
2007/3 2008/3 2009/3 2010/3 2011/30
20
10
(%)
2007/3 2008/3 2009/3 2010/3 2011/3
9.9%
13.0%12.1%
14.7%
10.2%In
dex
Dat
a
INPEX CORPORATION Fact Book 2011 12

Index Data
Reserves/Production Indices (Consolidated)
Years ended March 31 2007 2008 2009 2010 2011Net proved reserves (MM boe) 1,770 1,645 1,598 1,475 1,308Net probable reserves (MM boe) 1,959 2,721 3,176 2,929 2,818Net production (Thousand boe/day) 418 423 405 405 423Reserves to production ratio (Years)
Proved reserves 11.6 10.7 10.8 10.0 8.5Proved reserves + Probable reserves 24.5 28.2 32.3 29.8 26.7
Reserve replacement ratio (3-year average, %) 293% 122% 61% 35% 25%Average expenses per boe produced (U.S.$)
Production cost 8.5 10.2 12.4 11.2 11.4Production cost (Excluding royalty) 4.2 5.0 6.3 6.8 6.2Selling, general and administrative expenses 1.7 1.6 2.5 2.7 2.6
Finding and development cost per boe (3-year average, U.S.$) 6.9 17.5 28.3 55.4 78.6Exploration success ratio (3-year average, %) 32.8% 57.9% 56.3% 64.5% 46.8%
• Reserves to production ratio (Years) = Reserves as of the end of the fiscal year / Production in the fiscal year• Reserve replacement ratio = Proved reserves increase including acquisition / Production• Finding and development cost per boe = The sum of total costs incurred for exploration and development of oil and gas fields and total costs incurred for acquisitions
divided by the sum of proved reserve extensions, acquisitions and revisions.• Exploration success ratio = The number of net productive exploratory wells drilled / The number of net exploratory wells drilled Exploratory well: An exploratory well is a well drilled to find a new field, to find a new reservoir in a field previously found to be productive of oil or gas in another reservoir or
to extend the limits of a known reservoir.
2007/3 2008/3 2009/3 2010/30
3,000
1,000
2,000
4,000
5,000
2011/3
(MM boe)
3,728
1,959
4,774
3,176 4,404
2,929 4,126
2,818
4,366
2,721
1,770 1,5981,475
1,308
1,645
0
20
30
40
10
24.5
11.6
32.3
10.8
29.8
10.08.5
26.7
(Years)
28.2
10.7
2007/3 2008/3 2009/3 2010/3 2011/30
200
300
100
(%)
2007/3 2008/3 2009/3 2010/3 2011/3
293%
122%61%
35% 25%
0
5
10
15
8.5
1.7
12.4
2.5
11.2
2.7 2.6
11.4
10.2
1.6
2007/3 2008/3 2009/3 2010/3 2011/3
(U.S.$)
0
40
60
80
20
6.9
28.3
55.4
78.6
(U.S.$)
17.5
2007/3 2008/3 2009/3 2010/3 2011/30
40
60
80
20
(%)
2007/3 2008/3 2009/3 2010/3 2011/3
32.8%
57.9%
56.3%
64.5%
46.8%
Finding and development cost per boe (3-year average)
Exploration success ratio (3-year average)
Average expenses per boe produced (Production cost, Selling, general and administrative expenses)
Production cost Selling, general and administrative expenses
Proved+probable reserves Proved reserves
Note: 1. Proved reserves and production volumes are calculated in accordance with U.S. Security Exchange Commission (SEC) regulations. 2. Probable reserves as of March 31, 2008, 2009, 2010 and 2011 are calculated in accordance with SPE/WPC/AAPG/SPEE guideline (SPE–PRMS) approved in March 2007. The volumes are sum of proved reserves and probable reserves by SPE–PRMS after deduction
of proved reserves by SEC regulations. Probable reserves as of March 31, 2007 are calculated in accordance with the guideline established by SPE and WPC (1997 SPE/WPC). The volumes are sum of proved reserves and probable reserves by 1997 SPE/WPC after deduction of proved reserves by SEC regulations.
3. Proved reserves and probable reserves as of March 31, 2007, 2008, 2009 and 2010 are based on the reserves report by DeGolyer & MacNaughton. In regard to proved reserves and probable reserves as of March 31, 2011, the reserves of the projects which are expected to be invested a large amount and affect the company' future result materially are evaluated by DeGolyer & MacNaughton, and the others are done internally. Reserve volumes of Joslyn oil sand project (mining) as of March 31, 2008 are based on the evaluation by RYDER SCOTT.
4. Figures are translated into U.S. dollars based on the average exchange rate of the relevant fiscal year. In the fiscal years ended March 31, 2007, 2008, 2009, 2010 and 2011 the average exchange rates were ¥116.62, ¥113.61, ¥100.85, ¥92.49 and ¥85.83 respectively. 5. Lower reserve replacement ratio and higher costs in 2009, 2010 and 2011 resulted from no substantial addition to the proved reserves and increased exploration and development expenditures during the term.
■ Net probable reserves■ Net proved reserves
Net proved reserves Net probable reserves
Reserves to production ratio(Proved reserves, Proved+probable reserves)
Reserve replacement ratio(3-year average)
INPEX CORPORATION Fact Book 201113

Global E&P
Reserve replacement ratio (2008–2010 Average)
168
201
136
218
160
105
176
103 103108
45
718099
25
149
(%)
0
50
100
150
250
200
BG (UK)
Occidental (U
S)
Woodside (AU)
Santos (AU)
RD Shell (UK-NL)
BP (UK)
ExxonMobil (U
S)
Apache (US) ENI (IT
)
Chevron (US)
Total (FR)
ConocoPhillips (U
S)
Talisman (CA)
Statoil (NO)
Anadarko (US)
INPEX
Source: Most recent publicly available information
Source: Most recent publicly available information
Source: Most recent publicly available information
Note: Proved reserves increase including acquisition divided by Production. Reserves and production volumes attributable to the
equity method affiliates are included. Reserves data as of December 31, 2010, except for INPEX (as of March 31, 2011). Production
data for the year ended December 31, 2010, except for INPEX (for the year ended March 31, 2011)
Note: Reserve data as of December 31, 2010, except for INPEX (as of March 31, 2011) in accordance with SEC regulations.
Amounts attributable to the equity method affiliates are included. Government-owned companies are not included. Oil includes
unconventional resources such as bitumen, synthetic crude. Santos does not disclose proved reserves by products.
Note: Production data for the year ended December 31, 2010, except for INPEX (for the year ended March 31, 2011). Production
figures are in accordance with SEC regulations. Amounts attributable to the equity method are included. Government-owned
companies are not included. Oil includes unconventional resources such as bitumen, synthetic crude.
Proved reserves
Production volume
0
2,000
6,000
8,000
25,000(MM boe)
10,000
12,000
11,000
9,000
7,000
5,000
3,000
1,000
4,000
Occidental (U
S)
BG (UK)
Statoil (NO)
ConocoPhillips (U
S)
ExxonMobil (US)
BP (UK)
Chevron (U
S)
Apache (US)
Talisman (C
A)
Santos (AU)
Anadarko (US)
INPEX
RD Shell (UK·NL)
Total (FR)
ENI (IT)
Woodside (A
U)
646
14,00217,826
10,85410,285
8,310
6,603
5,118
3,3632,8932,954
1,3081,309 1,150
24,809
2,422
■■ Natural gas ■■ Oil
0
200
800
1,000
5,000(Thousand boe/day)
1,200
1,400
2,500
400
600
Occidental (U
S)
BG (UK)
ENI (IT)
Total (FR)
BP (UK)
ExxonMobil (US)
Chevron (U
S)
Anadarko (US)
Woodside (A
U)
Santos (AU)
Apache (US)
INPEX
RD Shell (UK·NL)
ConocoPhillips (U
S)
Statoil (NO)
Talisman (C
A)
3,836
137
4,5843,347
2,7632,126
1,6561,754
747642658
423353
199
■■ Natural gas ■■ Oil
2,284
646
Operating Data
Op
erat
ing
Dat
a
INPEX CORPORATION Fact Book 2011 14

Operating Data
Main Projects in Production
Field / Project name Contract type Contract durationCrude oil
production*1
(Thousand bbl/day)
LPG production*1
(Thousand bbl/day)
Gas production*1
(MMcf/day)
Japan Minami-Nagaoka, etc.Concession agreement
Unlimited 4 – 129
Indonesia
Mahakam/AttakaProduction sharing contract
December 31, 2017 91 – 2,026
South Natuna Sea Block B
Production sharing contract
October 15, 2028 56 12 376
Berau BlockProduction sharing contract
December 31, 2035 5 – 799
Australia
WA-35-L (Van Gogh)Concession agreement
— 30 – –
WA-43-L (Ravensworth)
Concessionagreement
— 16 – –
The Timor Sea Joint Petroleum Development Area (JPDA)*2
JPDA03-12 (Bayu-Undan)
Production sharing contract
February 6, 2022 54 32 502
Azerbaijan ACGProduction sharing contract
December 11, 2024 821 – –
UAE
ADMAConcession agreement
March 8, 2018 (Upper Zakum field March 8, 2026)
Nondisclosure Nondisclosure Nondisclosure
ABKConcession agreement
March 8, 2018 Nondisclosure Nondisclosure Nondisclosure
D.R. Congo Offshore D.R. CongoConcession agreement
November 21, 2023 14 – –
Angola
3/05Production sharing contract
June 30, 2025 45 – –
3/85Production sharing contract
Cobo December 31, 2010 Pambi June 30, 2011
8 – –
3/91Production sharing contract
December 31, 2012 10 – –
Algeria Ohanet Risk service contract October 27, 2011 15 17 –
U.S.
Ship Shoal 72, Main Pass 118, West Cameron 401/402 Louisiana SL 19372
Concession agreement
Unlimited 1 – 19
VenezuelaCopa Macoya/Guarico Oriental
Joint venture agreement
March 31, 2026 1 – 78
Brazil Frade BlockConcession agreement
August 6, 2025 62 – 12
*1 All field base and average of the year ended March 31, 2011*2 East Timor and Australia
INPEX CORPORATION Fact Book 201115

Oil and Gas Reserves
Crude oil (MMbbl) Gas (Bcf)
Japan Asia & Oceania
Eurasia(Europe & NIS)
Middle East &Africa Americas Subtotal
Interest in reservesheld by equity-
method affiliatesTotal
Crudeoil Gas Crude
oil Gas Crudeoil Gas Crude
oil Gas Crudeoil Gas Crude
oil Gas Crudeoil Gas Crude
oil Gas
As of March 31, 2007 21 845 106 2,398 203 — 523 — — 93 853 3,336 286 446 1,139 3,782
Extensions and discoveries — — 20 — 29 — — — 1 — 50 — — — 50 —
Acquisitions and sales — — 0 1 — — — — — 40 0 41 0 3 0 44
Revisions of previous estimates 0 (0) (0) (77) (5) — (5) — — 1 (10) (75) (4) (8) (14) (83)
Interim production (1) (59) (13) (309) (20) — (30) — (0) (29) (64) (397) (23) — (88) (397)
As of March 31, 2008 20 786 112 2,014 207 — 489 — 1 106 829 2,905 259 440 1,088 3,346
Extensions and discoveries — — 0 — — — — — — — 0 — (2) — (1) —
Acquisitions and sales — — — — (12) — — — 6 5 (6) 5 — — (6) 5
Revisions of previous estimates (0) (14) 28 217 25 — (3) — (1) 78 49 281 (1) 65 48 346
Interim production (1) (60) (16) (307) (9) — (30) — (1) (30) (57) (397) (23) — (81) (397)
As of March 31, 2009 18 713 124 1,923 211 — 457 — 5 159 815 2,795 233 505 1,048 3,300
INPEX CORPORATION and consolidated subsidiaries
As of March 31, 2009 18 713 124 1,923 211 — 457 — 5 159 815 2,795
Extensions and discoveries — — 5 — — — — — — — 5 —
Acquisitions and sales — — — — — — — — — — — —
Revisions of previous estimates 0 0 (1) 45 6 — 3 — 1 62 9 107
Interim production (1) (57) (17) (319) (10) — (27) — (2) (32) (57) (408)
As of March 31, 2010 16 656 111 1,649 207 — 433 — 4 190 771 2,495
Interest in reserves held by equity–method affiliates
As of March 31, 2009 — — 2 505 — — 226 — 6 1 233 505
Extensions and discoveries — — — — — — — — — — — —
Acquisitions and sales — — — — — — — — — — — —
Revisions of previous estimates — — (0) (30) — — (2) — (1) (0) (2) (30)
Interim production — — (0) — — — (21) — (1) (0) (22) (0)
As of March 31, 2010 — — 1 475 — — 203 — 4 0 209 475
As of March 31, 2010 16 656 112 2,124 207 — 636 — 8 190 980 2,970
INPEX CORPORATION and consolidated subsidiaries
As of March 31, 2010 16 656 111 1,649 207 — 433 — 4 190 771 2,495
Extensions and discoveries — — — — — — — — — — — —
Acquisitions and sales — — (6) (37) 7 — — — (3) — (2) (37)
Revisions of previous estimates 0 — 4 (100) 6 — (3) — 0 2 8 (98)
Interim production (1) (46) (24) (305) (10) — (27) — (1) (30) (63) (380)
As of March 31, 2011 15 611 85 1,208 210 — 404 — 0 162 715 1,980
Interest in reserves held by equity–method affiliates
As of March 31, 2010 — — 1 475 — — 203 — 4 0 209 475
Extensions and discoveries — — — — — — — — — — — —
Acquisitions and sales — — — — — — 0 — — — 0 —
Revisions of previous estimates — — 0 16 — — (1) — 0 0 (1) 16
Interim production — — (0) (20) — — (23) — (2) (0) (24) (21)
As of March 31, 2011 — — 2 470 — — 179 — 3 0 184 471
As of March 31, 2011 15 611 87 1,678 210 — 583 — 3 162 899 2,451
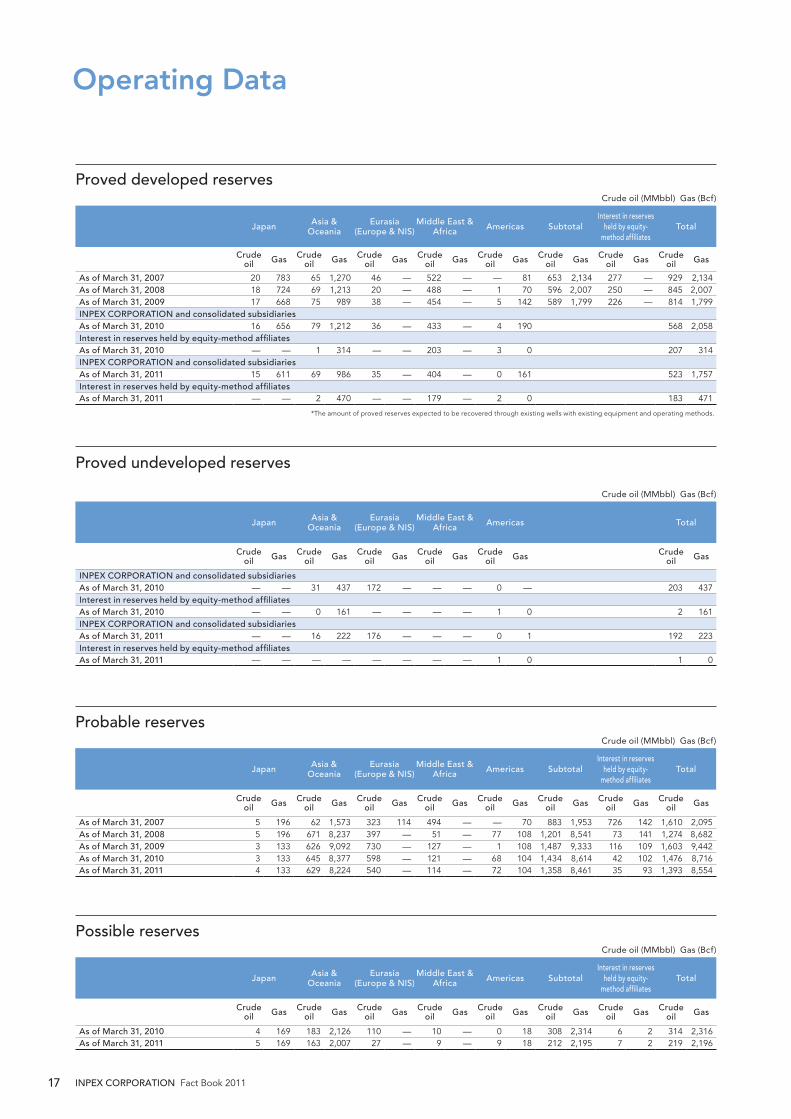
Proved reserves
Op
erat
ing
Dat
a
INPEX CORPORATION Fact Book 2011 16
Operating Data
Crude oil (MMbbl) Gas (Bcf)
Japan Asia & Oceania
Eurasia(Europe & NIS)
Middle East &Africa Americas Total
Crudeoil Gas Crude
oil Gas Crudeoil Gas Crude
oil Gas Crudeoil Gas Crude
oil Gas
INPEX CORPORATION and consolidated subsidiariesAs of March 31, 2010 — — 31 437 172 — — — 0 — 203 437Interest in reserves held by equity-method affiliatesAs of March 31, 2010 — — 0 161 — — — — 1 0 2 161INPEX CORPORATION and consolidated subsidiariesAs of March 31, 2011 — — 16 222 176 — — — 0 1 192 223Interest in reserves held by equity-method affiliatesAs of March 31, 2011 — — — — — — — — 1 0 1 0
Crude oil (MMbbl) Gas (Bcf)
Japan Asia & Oceania
Eurasia(Europe & NIS)
Middle East &Africa Americas Subtotal
Interest in reservesheld by equity-
method affiliatesTotal
Crudeoil Gas Crude
oil Gas Crudeoil Gas Crude
oil Gas Crudeoil Gas Crude
oil Gas Crudeoil Gas Crude
oil Gas
As of March 31, 2007 5 196 62 1,573 323 114 494 — — 70 883 1,953 726 142 1,610 2,095As of March 31, 2008 5 196 671 8,237 397 — 51 — 77 108 1,201 8,541 73 141 1,274 8,682As of March 31, 2009 3 133 626 9,092 730 — 127 — 1 108 1,487 9,333 116 109 1,603 9,442As of March 31, 2010 3 133 645 8,377 598 — 121 — 68 104 1,434 8,614 42 102 1,476 8,716As of March 31, 2011 4 133 629 8,224 540 — 114 — 72 104 1,358 8,461 35 93 1,393 8,554
Crude oil (MMbbl) Gas (Bcf)
Japan Asia & Oceania
Eurasia(Europe & NIS)
Middle East &Africa Americas Subtotal
Interest in reservesheld by equity-
method affiliatesTotal
Crudeoil Gas Crude
oil Gas Crudeoil Gas Crude
oil Gas Crudeoil Gas Crude
oil Gas Crudeoil Gas Crude
oil Gas
As of March 31, 2010 4 169 183 2,126 110 — 10 — 0 18 308 2,314 6 2 314 2,316As of March 31, 2011 5 169 163 2,007 27 — 9 — 9 18 212 2,195 7 2 219 2,196
Proved undeveloped reserves
Probable reserves
Possible reserves
Crude oil (MMbbl) Gas (Bcf)
Japan Asia & Oceania
Eurasia(Europe & NIS)
Middle East &Africa Americas Subtotal
Interest in reservesheld by equity-
method affiliatesTotal
Crudeoil Gas Crude
oil Gas Crudeoil Gas Crude
oil Gas Crudeoil Gas Crude
oil Gas Crudeoil Gas Crude
oil Gas
As of March 31, 2007 20 783 65 1,270 46 — 522 — — 81 653 2,134 277 — 929 2,134As of March 31, 2008 18 724 69 1,213 20 — 488 — 1 70 596 2,007 250 — 845 2,007As of March 31, 2009 17 668 75 989 38 — 454 — 5 142 589 1,799 226 — 814 1,799INPEX CORPORATION and consolidated subsidiariesAs of March 31, 2010 16 656 79 1,212 36 — 433 — 4 190 568 2,058Interest in reserves held by equity-method affiliatesAs of March 31, 2010 — — 1 314 — — 203 — 3 0 207 314INPEX CORPORATION and consolidated subsidiariesAs of March 31, 2011 15 611 69 986 35 — 404 — 0 161 523 1,757Interest in reserves held by equity-method affiliatesAs of March 31, 2011 — — 2 470 — — 179 — 2 0 183 471
*The amount of proved reserves expected to be recovered through existing wells with existing equipment and operating methods.
Proved developed reserves
INPEX CORPORATION Fact Book 201117

(¥ million)
Total Japan Asia & Oceania
Eurasia(Europe & NIS)
Middle East & Africa Americas
As of March 31, 2007INPEX CORPORATION and consolidated subsidiaries
Future cash inflows 8,540,286 814,449 2,645,392 1,444,902 3,612,733 22,810Future production and development costs (2,586,449) (143,763) (863,273) (425,072) (1,141,377) (12,964)Future income tax expenses (3,430,774) 121,435 (765,801) (232,138) (2,308,577) (2,823)Future net cash flows 2,523,063 549,251 1,016,318 787,692 162,779 7,02310% annual discount for estimated timing of cash flows (1,239,469) (305,507) (386,207) (450,200) (95,905) (1,650)Standardized measure of discounted future net cash flows 1,283,594 243,744 630,111 337,492 66,874 5,373
Share of equity method investees' standardized measure of discounted future net cash flows 63,534 — 37,916 — 22,981 2,637
As of March 31, 2008INPEX CORPORATION and consolidated subsidiaries
Future cash inflows 10,784,073 879,942 3,055,125 2,030,128 4,792,848 26,030Future production and development costs (2,693,818) (153,954) (751,518) (487,550) (1,279,902) (20,894)Future income tax expenses (4,882,340) (145,218) (1,011,368) (384,543) (3,339,299) (1,912)Future net cash flows 3,207,915 580,770 1,292,239 1,158,035 173,647 3,22410% annual discount for estimated timing of cash flows (1,583,464) (310,255) (423,485) (765,939) (82,604) (1,181)Standardized measure of discounted future net cash flows 1,624,451 270,515 868,754 392,096 91,043 2,043
Share of equity method investees' standardized measure of discounted future net cash flows 77,355 — 43,219 — 18,680 15,456
As of March 31, 2009INPEX CORPORATION and consolidated subsidiaries
Future cash inflows 5,089,166 666,124 1,547,449 788,338 2,034,401 52,854Future production and development costs (2,179,952) (141,203) (706,891) (425,575) (876,844) (29,439)Future income tax expenses (1,704,618) (169,144) (341,036) (89,052) (1,098,893) (6,493)Future net cash flows 1,204,596 355,777 499,522 273,711 58,664 16,92210% annual discount for estimated timing of cash flows (617,598) (178,323) (172,777) (214,198) (48,704) (3,596)Standardized measure of discounted future net cash flows 586,998 177,454 326,745 59,513 9,960 13,326
Share of equity method investees' standardized measure of discounted future net cash flows 26,275 — 12,888 — 13,476 (89)
As of March 31, 2010INPEX CORPORATION and consolidated subsidiaries
Future cash inflows 6,194,451 495,648 1,707,919 1,150,581 2,781,641 58,663Future production and development costs (2,159,840) (128,497) (648,877) (485,115) (870,046) (27,306)Future income tax expenses (2,548,220) (117,201) (449,341) (149,413) (1,820,429) (11,837)Future net cash flows 1,486,391 249,950 609,701 516,053 91,166 19,52010% annual discount for estimated timing of cash flows (709,314) (121,312) (189,090) (337,759) (56,669) (4,483)Standardized measure of discounted future net cash flows 777,077 128,638 420,611 178,294 34,497 15,037
Share of equity method investees' standardized measure of discounted future net cash flows
Future cash inflows 1,439,084 — 83,504 — 1,329,955 25,625Future production and development costs (509,279) — (29,380) — (464,240) (15,659)Future income tax expenses (856,117) — (19,192) — (835,636) (1,289)Future net cash flows 73,688 — 34,932 — 30,079 8,67710% annual discount for estimated timing of cash flows (37,025) — (18,384) — (16,900) (1,740)Standardized measure of discounted future net cash flows 36,663 — 16,548 — 13,179 6,937
Total of standardized measure of discounted future net cash flows 813,740 128,638 437,159 178,294 47,676 21,974As of March 31, 2011INPEX CORPORATION and consolidated subsidiaries
Future cash inflows 6,350,230 539,869 1,590,216 1,383,629 2,806,307 30,209Future production and development costs (1,913,933) (117,393) (449,736) (494,241) (833,128) (19,434)Future income tax expenses (2,686,247) (139,424) (478,851) (179,337) (1,886,511) (2,125)Future net cash flows 1,750,050 283,052 661,630 710,051 86,667 8,65010% annual discount for estimated timing of cash flows (749,379) (128,557) (174,490) (394,948) (49,389) (1,994)Standardized measure of discounted future net cash flows 1,000,671 154,495 487,140 315,103 37,278 6,656
Share of equity method investees' standardized measure of discounted future net cash flows
Future cash inflows 1,397,434 — 101,144 — 1,276,469 19,821Future production and development costs (448,355) — (49,888) — (390,130) (8,338)Future income tax expenses (866,698) — (15,943) — (847,664) (3,091)Future net cash flows 82,381 — 35,314 — 38,676 8,39210% annual discount for estimated timing of cash flows (33,395) — (15,436) — (17,282) (677)Standardized measure of discounted future net cash flows 48,986 — 19,878 — 21,393 7,715
Total of standardized measure of discounted future net cash flows 1,049,657 154,495 507,017 315,103 58,671 14,370
* The exchange rates as of March 31, 2007, 2008, 2009, 2010 and 2011 are the TTM rate of ¥118.09, ¥100.20, ¥98.26, ¥93.04 and ¥83.15 per U.S.$, respectively.
Standardized measure of discounted future net cash flows relating to proved reserves
Note: 1. Disclosure items of proved reserves are based on the U.S. Statement of Financial Accounting Standards No.69 through fiscal 2008. Since fiscal 2009, Accounting Standards Codification Topic 932 "Extractive activities—Oil & Gas".
2. Proved reserves and production volumes are calculated in accordance with U.S. Security Exchange Commission (SEC) regulations. 3. Probable reserves as of March 31, 2008, 2009, 2010 and 2011 are calculated in accordance with SPE/WPC/AAPG/SPEE guideline (SPE-PRMS) approved in March 2007.
The volumes are sum of proved reserves and probable reserves by SPE-PRMS after deduction of proved reserves by SEC regulations. Probable reserves as of March 31, 2007 are calculated in accordance with the guideline established by SPE and WPC (1997 SPE/WPC). The volumes are sum of proved reserves and probable reserves by 1997 SPE/WPC after deduction of proved reserves by SEC regulations.
4. The probable reserves also include reserves of bitumen. 5. Proved reserves as of March 31, 2007, 2008, 2009 and 2010 are based on the reserves report by DeGolyer & MacNaughton. In regard to proved reserves as of March
31, 2011, the reserves of the projects which are expected to be invested a large amount and affect the company' future result materially are evaluated by DeGolyer & MacNaughton, and the others are done internally. Reserve volumes of Joslyn oil sand project (mining) as of March 31, 2008 are based on the evaluation by RYDER SCOTT.
6. The figures in these tables include Minority interests.
Op
erat
ing
Dat
a
INPEX CORPORATION Fact Book 2011 18

Operating Data
(¥ million)
INPEX CORPORATION and consolidated subsidiaries Total Japan Asia & Oceania
Eurasia(Europe &
NIS)
Middle East & Africa Americas Equity–method
affiliates
Standardized measure, beginning of period (As of April 1, 2006) 1,270,915 247,706 639,933 306,240 69,804 7,232
Changes resulting from:Sales and transfers of oil and gas produced,
net of production costs 49,262 (6,439) 39,664 11,075 4,250 712
Net change in prices, and gas production costs 276,809 28,601 112,953 37,547 96,717 991Development cost incurred 142,896 6,394 94,382 29,699 10,664 1,757Changes in estimated development costs (78,604) (15,702) (25,211) (16,033) (18,852) (2,806)Revisions of previous quantity estimates (571,647) (34,545) (281,095) (98,701) (154,175) (3,131)Accretion of discount 5,355 38,855 (58,980) 10,897 14,094 489Net change in income taxes 101,795 2,868 53,660 5,630 40,344 (707)Extensions, discoveries and improved recoveries 53,809 — — 53,809 — —Other 33,004 (23,994) 54,805 (2,671) 4,028 836
Standardized measure,end of period and beginning of period (As of March 31 and April 1, 2007)
1,283,594 243,744 630,111 337,492 66,874 5,373
Changes resulting from:Sales and transfers of oil and gas produced,
net of production costs (628,569) (40,219) (297,020) (127,112) (160,676) (3,542)
Net change in prices, and gas production costs 1,935,375 111,166 640,567 314,185 872,036 (2,579)Development cost incurred 181,584 10,077 101,134 53,539 15,325 1,509Changes in estimated development costs (90,504) (15,295) (15,745) (77,487) 20,149 (2,126)Revisions of previous quantity estimates (43,723) (4,232) (49,365) 34,272 (26,786) 2,388Accretion of discount 264,348 29,488 109,146 39,421 85,615 678Net change in income taxes (1,005,154) (23,532) (179,165) (12,479) (790,606) 628Extensions, discoveries and improved recoveries 38,369 — 38,417 — — (48)Other (310,869) (40,682) (109,326) (169,735) 9,112 (238)
Standardized measure,end of period and beginning of period(As of March 31 and April 1, 2008)
1,624,451 270,515 868,754 392,096 91,043 2,043
Changes resulting from:Sales and transfers of oil and gas produced,
net of production costs (812,293) (50,382) (428,573) (113,727) (217,340) (2,271)
Net change in prices, and production costs (2,324,615) (77,468) (815,640) (407,345) (1,024,751) 589Development cost incurred 146,809 7,611 82,634 45,102 9,333 2,129Changes in estimated development costs (143,921) 6,760 (63,952) (26,211) (61,675) 1,157Revisions of previous quantity estimates 136,571 (6,536) 100,001 46,208 (8,001) 4,899Accretion of discount 358,052 32,784 146,413 45,171 133,321 363Net change in income taxes 1,510,591 (15,202) 459,898 57,027 1,011,337 (2,469)Extensions, discoveries and improved recoveries 6,488 — — — — 6,488Other 84,865 9,372 (22,790) 21,192 76,693 398
Standardized measure,end of period and beginning of period(As of March 31 and April 1, 2009)
613,273 177,454 326,745 59,513 9,960 13,326 26,275
Changes resulting from:Sales and transfers of oil and gas produced,
net of production costs (477,438) (37,617) (201,573) (27,132) (98,361) (6,986) (105,769)
Net change in prices, and production costs 1,257,233 (70,134) 331,816 185,126 460,172 8,309 341,944Development cost incurred 127,421 3,114 86,032 13,568 13,132 465 11,109Changes in estimated development costs (61,607) (3,552) (11,651) (47,379) 1,322 (537) 189Revisions of previous quantity estimates 71,242 (1,055) 36,272 18,028 26,364 3,395 (11,761)Accretion of discount 187,995 24,938 52,928 10,177 56,680 1,506 41,765Net change in income taxes (753,861) 20,376 (95,799) (27,639) (431,991) (4,313) (214,494)Extensions, discoveries and improved recoveries 465 — 465 — — — —Other (150,983) 15,114 (104,624) (5,968) (2,781) (128) (52,595)
Standardized measure,end of period and beginning of period(As of March 31 and April 1, 2010)
813,740 128,638 420,611 178,294 34,497 15,037 36,663
Changes resulting from:Sales and transfers of oil and gas produced,
net of production costs (508,519) (19,129) (208,617) (48,858) (124,814) (3,314) (103,787)
Net change in prices, and production costs 797,080 59,277 299,991 107,142 179,087 (2,782) 154,364Development cost incurred 134,197 1,721 63,518 51,787 8,690 63 8,418Changes in estimated development costs (27,919) (150) 780 (27,861) 6,911 142 (7,741)Revisions of previous quantity estimates 62,352 6,043 (16,484) 56,464 4,590 1,615 10,124Accretion of discount 63,903 10,478 29,153 17,841 2,729 511 3,191Net change in income taxes (200,877) (18,722) (50,824) (14,988) (70,871) 2,676 (48,148)Extensions, discoveries and improved recoveries 2,146 — (6,198) 14,190 — (5,846) —Other (86,445) (13,661) (44,791) (18,908) (3,541) (1,446) (4,098)
Standardized measure, end of period(As of March 31, 2011) 1,049,657 154,495 487,140 315,103 37,278 6,656 48,986
* The exchange rates as of March 31, 2007, 2008, 2009, 2010 and 2011 are the TTM rate of ¥118.09, ¥100.20, ¥98.26, ¥93.04 and ¥83.15 per U.S.$ , respectively.
Changes in the standardized measure of discounted future net cash flows relating to proved reserves
Note: 1. Disclosure items of proved reserves are based on the U.S. Statement of Financial Accounting Standards No.69 through the year ended March 31, 2009. Since the year ended March 31, 2010, Accounting Standard Codification Topic 932 "Extractive activities—Oil & Gas".
2. The figures in these tables include Minority interests.
INPEX CORPORATION Fact Book 201119

* The production volume under the production sharing contracts entered into by INPEX Group corresponds to the net economic take of the Group.
Oil and Gas Net Production*
(Thousand bbl/day)
2007/3 2008/3 2009/3 2010/3 2011/3■ Japan 3.9 4.9 4.9 4.5 3.9
■ Asia & Oceania 40.4 36.5 44.7 47.7 65.1
■ Eurasia (Europe & NIS) 47.9 54.5 24.8 26.9 27.9
■ Middle East & Africa 82.3 80.7 81.0 73.3 73.0
■ Americas 0.1 0.4 2.7 5.5 2.3 Subtotal 174.7 177.0 158.1 158.0 172.2■ Proportional interest in production by
equity-method affiliates 67.8 64.6 65.1 60.4 67.4
Total 242.5 241.5 223.2 218.3 239.6Annual production (MM bbl) 88.5 88.4 81.5 79.7 87.5
Oil / Condensate / LPG
0
150
50
100
200
250(Thousand bbl/day)
2007/3 2008/3 2009/3 2010/3 2011/3
242.5 241.5
223.2218.3
239.6
(MMcf/day)
2007/3 2008/3 2009/3 2010/3 2011/3■ Japan 127.8 161.5 164.9 155.1 128.7
■ Asia & Oceania 865.8 845.7 842.8 880.5 836.0
■ Eurasia (Europe & NIS) — — — — —
■ Middle East & Africa — — — — —
■ Americas 57.5 81.6 82.3 86.9 81.1 Subtotal 1,051.1 1,088.8 1,090.0 1,122.6 1,045.9■ Proportional interest in production by
equity-method affiliates — — — — 56.6
Total 1,051.1 1,088.8 1,090.0 1,122.6 1,102.5Annual production (Bcf) 383.6 398.5 397.8 409.7 402.4
Natural gas
0
800
400
200
600
1,000
1,200(MMcf/day)
2007/3 2008/3 2009/3 2010/3 2011/3
1,051.11,088.8 1,090.0
1,122.6 1,102.5
(Thousand boe/day)
2007/3 2008/3 2009/3 2010/3 2011/3■ Japan 25.2 31.9 32.4 30.4 25.3
■ Asia & Oceania 184.7 177.4 185.1 194.5 204.4
■ Eurasia (Europe & NIS) 47.9 54.5 24.8 26.9 27.9
■ Middle East & Africa 82.3 80.7 81.0 73.3 73.0
■ Americas 9.7 14.0 16.4 20.0 15.8 Subtotal 349.8 358.4 339.7 345.1 346.5■ Proportional interest in production by
equity-method affiliates 67.8 64.6 65.1 60.4 76.8
Total 417.7 423.0 404.9 405.4 423.3Annual production (MM boe) 152.5 154.8 147.8 148.0 154.5
Crude oil and natural gas
0
350
250
200
150
50
100
300
400
450(Thousand boe/day)
2007/3 2008/3 2009/3 2010/3 2011/3
417.7 423.0404.9 405.4
423.3
Op
erat
ing
Dat
a
INPEX CORPORATION Fact Book 2011 20

Operating Data
* Countries and areas are shown by segment.
Sales Volume*
(Thousand bbl)
2007/3 2008/3 2009/3 2010/3 2011/3■ Japan 170 408 241 208 156
(Thousand kl) 27 65 38 33 25
■ Asia & Oceania 13,234 13,445 12,958 15,295 18,004
■ Eurasia (Europe & NIS) 16,390 19,609 8,664 11,556 9,056
■ Middle East & Africa 53,470 52,177 52,641 47,293 48,396
■ Americas 11 77 923 1,743 1,040 Total 83,276 85,716 75,427 76,095 76,651Average unit price of domestic production (¥/kl) 45,694 62,225 65,829 41,470 49,957
Average unit price of overseas production (U.S.$/bbl) 62.16 80.07 82.70 68.40 84.34
Crude oil
0
60,000
20,000
40,000
80,000
100,000(Thousand bbl)
2007/3 2008/3 2009/3 2010/3 2011/3
83,27685,716
75,427 76,095 76,651
(MMcf)
2007/3 2008/3 2009/3 2010/3 2011/3■ Japan 47,495 61,846 60,629 61,459 64,253
(Million m3) 1,273 1,657 1,625 1,647 1,722
■ Asia & Oceania 318,413 310,458 310,744 324,364 306,641
■ Eurasia (Europe & NIS) — — — — —
■ Middle East & Africa — — — — —
■ Americas 172 29,777 29,703 30,861 30,334 Total 366,080 402,081 401,076 416,684 401,228Average unit price of domestic production (¥/m3) 34.96 35.70 37.39 38.41 41.73
Average unit price of overseas production (U.S.$/thousand cf)
7.51 8.26 9.22 7.43 9.10
Natural gas (excluding LPG)
0
300,000
100,000
200,000
400,000
500,000(MMcf)
2007/3 2008/3 2009/3 2010/3 2011/3
366,080
402,081 401,076416,684
401,228
(Thousand bbl)
2007/3 2008/3 2009/3 2010/3 2011/3■ Japan 184 183 191 212 229
(Thousand tons) 17.5 17.4 18.2 20.2 21.8■ Asia & Oceania 1,166 1,366 1,876 3,164 3,258■ Eurasia (Europe & NIS) — — — — —■ Middle East & Africa — — — — —■ Americas — — — — — Total 1,351 1,549 2,067 3,377 3,487Average unit price of domestic production (¥/kg) 127 130 143 111 115
Average unit price of overseas production (U.S.$/bbl) 48.76 62.00 68.03 55.74 66.45
LPG
0
2,000
1,000
3,000
4,000(Thousand bbl)
2007/3 2008/3 2009/3 2010/3 2011/3
1,3511,549
2,067
3,3773,487
INPEX CORPORATION Fact Book 201121

Business Investment / Others
(¥ million)
2007/3 2008/3 2009/3 2010/3 2011/3Oil and natural gas development expenditures* 185,956 232,958 235,305 202,035 187,028Capital expenditures for natural gas sales facilities and others 19,460 23,651 23,891 46,696 21,233 Total 205,417 256,610 259,197 248,731 208,262
(¥ million)
2007/3 2008/3 2009/3 2010/3 2011/3Exploration expenditures 30,544 64,746 48,653 32,995 32,530
Exploration cost equivalent amount in exploration expenditures* 26,838 57,785 46,011 30,332 26,563Acquisition costs 1,144 17,979 10,404 691 28,445 Total 31,688 82,726 59,057 33,686 60,976
(¥ million)
2007/3 2008/3 2009/3 2010/3 2011/3■ Japan 11,318 12,836 8,139 7,569 4,468
■ Asia & Oceania 112,943 170,952 171,309 127,953 115,927
■ Eurasia (Europe & NIS) 70,679 77,442 60,189 68,074 93,070
■ Middle East & Africa 19,843 25,403 32,915 25,326 23,795
■ Americas 2,862 29,049 21,810 6,799 10,743 Total 217,645 315,684 294,364 235,721 248,004
Capital expenditures
Oil and gas exploration expenditures
Oil and gas exploration and development expenditures (by segment)*
0
250,000
100,000
50,000
150,000
200,000
300,000
350,000(¥ million)
2007/3 2008/3 2009/3 2010/3 2011/3
217,645
315,684294,364
235,721248,004
* Oil and natural gas development expenditures include amounts equivalent to development costs under production sharing contracts and others booked as investment account (recoverable accounts under production sharing), as well as capital expenditures booked as tangible fixed assets.
* Including acquisition costs
* Exploration expenses + Provision for allowance for recoverable accounts under production sharing + Provision for exploration projects The difference between “Exploration expenditures” and “Exploration cost equivalent amount in exploration expenditures” is exploration
expenditure expended in the development and production project under production sharing contract.
(¥ million)
2007/3 2008/3 2009/3 2010/3 2011/3Depreciation and amortization 30,599 36,181 42,966 40,354 54,245Recovery of recoverable accounts under production sharing (capital expenditures) 105,949 92,147 45,724 45,653 50,816Amortization of goodwill 6,977 6,616 6,760 6,759 6,760 Total 143,525 134,944 95,450 92,766 111,821
(¥ million)
2007/3 2008/3 2009/3 2010/3 2011/3Balance at beginning of the year 295,075 319,149 383,162 453,922 514,645Add: Exploration costs 9,791 27,459 23,643 10,084 23,990
Development costs 160,113 183,002 160,589 146,028 120,996Operating expenses 46,683 52,697 55,929 54,938 43,819Other 16 — — 2,670 2,819
Less: Cost recovery (capital expenditures) 105,949 92,147 45,724 45,653 50,816Cost recovery (operating expenditures) 86,319 106,047 104,847 107,074 95,665Other 262 951 18,830 270 25,459
Balance at end of the year 319,149 383,162 453,922 514,645 534,330Allowance for recoverable accounts under production sharing at end of the year 51,190 71,445 87,828 94,891 96,879
Depreciation equivalent amount
Analysis of recoverable accounts under production sharing
Op
erat
ing
Dat
a
INPEX CORPORATION Fact Book 2011 22

Financial Data
Consolidated Balance Sheets
(¥ million)2007/3 2008/3 2009/3 2010/3 2011/3
Assets I Current assets 1. Cash and deposits 194,278 204,596 117,393 119,809 112,395 2. Accounts receivable—trade 81,954 120,948 73,540 88,364 95,391 3. Marketable securities 55,586 115,730 149,507 213,040 207,165 4. Inventories 13,254 19,716 18,205 12,322 12,137 5. Deferred tax assets 17,242 11,236 6,144 5,355 9,450 6. Accounts receivable—other 81,688 83,436 37,871 43,160 57,032 7. Other 30,129 9,504 8,474 10,824 12,500 Less allowance for doubtful accounts (11) (58) (28) (22) (13,141) Total current assets 474,123 565,110 411,110 492,854 492,932 II Fixed assets 1. Tangible fixed assets (1) Buildings and structures 103,091 112,291 101,732 127,599 118,054 (2) Wells 17,597 19,893 22,008 18,193 28,604 (3) Machinery, equipment and vehicles 44,356 49,001 47,352 45,728 58,227 (4) Land 28,310 28,386 20,752 20,789 20,707 (5) Construction in progress 22,505 28,720 76,818 91,447 75,077 (6) Other 3,366 16,187 28,971 54,335 79,189 Total tangible fixed assets 219,227 254,481 297,635 358,094 379,861 2. Intangible assets (1) Goodwill 132,105 121,644 114,883 108,122 101,362 (2) Exploration and development rights 127,110 120,176 115,566 107,856 125,228 (3) Mining rights 4,364 18,843 18,592 18,154 17,554 (4) Other 2,240 4,815 4,638 5,070 4,966 Total intangible assets 265,821 265,480 253,680 239,205 249,110 3. Investments and other assets (1) Investment securities 354,851 360,726 344,698 403,978 975,541 (2) Long-term loans receivable 3,388 9,361 141,195 18,641 13,979 (3) Recoverable accounts under production sharing 319,149 383,162 453,922 514,645 534,330 (4) Deferred tax assets — 20,618 26,140 24,563 27,213 (5) Other 34,879 31,279 65,926 72,576 118,340 Less allowance for doubtful accounts (1,869) (911) (528) (640) (270) Less allowance for recoverable accounts under production sharing (51,190) (71,445) (87,828) (94,891) (96,879) Less allowance for investments in exploration (10,273) (9,963) (10,907) (15,248) (13,780) Total investments and other assets 648,934 722,827 805,618 923,624 1,558,474 Total fixed assets 1,133,982 1,242,789 1,356,934 1,520,923 2,187,447 Total assets 1,608,106 1,807,900 1,768,044 2,013,778 2,680,379Liabilities I Current liabilities 1. Accounts payable—trade 21,793 22,582 11,873 16,601 23,441 2. Short-term loans 50,649 19,274 27,816 4,872 4,441 3. Income taxes payable 85,143 131,523 70,419 86,534 113,101 4. Accounts payable—other 88,768 111,505 65,440 81,211 83,309 5. Provision for exploration projects 6,899 10,786 7,948 15,324 9,537 6. Accrued bonuses to officers 193 208 134 132 127 7. Asset retirement obligations — — — — 3,686 8. Other 12,799 29,404 22,427 23,228 17,083 Total current liabilities 266,247 325,285 206,059 227,905 254,728 II Long-term liabilities 1. Long-term debt 198,320 174,813 136,430 235,510 268,706 2. Deferred tax liabilities 38,994 44,296 28,171 27,139 36,517 3. Accrued retirement benefits to employees 8,371 8,645 8,545 7,585 6,979 4. Accrued retirement benefits to officers 1,712 475 — — — 5. Liabilities for site restoration and decommissioning costs 11,930 12,728 14,192 14,257 — 6. Liabilities for losses on development activities 1,964 1,964 1,964 1,964 — 7. Accrued special repair and maintenance 179 229 404 442 443 8. Asset retirement obligations — — — — 8,965 9. Other 370 649 10,216 8,369 6,655 Total long-term liabilities 261,843 243,802 199,924 295,269 328,268 Total liabilities 528,090 569,088 405,984 523,175 582,997Net assets I Shareholders' equity 1. Common stock 30,000 30,000 30,000 30,000 290,809 2. Capital surplus 418,491 418,493 418,477 418,477 679,287 3. Retained earnings 570,120 718,616 844,832 936,744 1,047,431 4. Treasury stock (1,108) (2,215) (5,248) (5,248) (5,248) Total shareholders‘ equity 1,017,503 1,164,894 1,288,062 1,379,974 2,012,280 II Accumulated other comprehensive income 1. Unrealized holding gain (loss) on securities 9,348 (7,468) (6,817) 12,351 1,455 2. Unrealized gain (loss) from hedging instruments 17 3 (0) — — 3. Translation adjustments 2,025 (60) (10,121) (4,826) (16,847) Total accumulated other comprehensive income 11,391 (7,524) (16,939) 7,525 (15,391) III Minority interests 51,121 81,442 90,938 103,103 100,493 Total net assets 1,080,016 1,238,812 1,362,060 1,490,603 2,097,382 Total liabilities and net assets 1,608,106 1,807,900 1,768,044 2,013,778 2,680,379
INPEX CORPORATION Fact Book 201123

Consolidated Statements of Income and Consolidated Statement of Comprehensive Income
Consolidated Statements of Income(¥ million)
2007/3 2008/3 2009/3 2010/3 2011/3
I Net sales 969,712 1,202,965 1,076,164 840,427 943,080
II Cost of sales 343,794 390,554 319,038 298,167 334,833
Gross profit 625,918 812,410 757,126 542,259 608,247
III Exploration expenses 17,688 34,095 25,982 15,710 12,000
IV Selling, general and administrative expenses 49,152 64,104 67,877 64,880 66,504
Operating income 559,077 714,211 663,266 461,667 529,742
V Other income
1. Interest income 12,843 10,984 9,535 4,353 4,110
2. Dividend income 2,291 5,439 12,338 9,476 5,721
3. Equity in earnings of affiliates 1,349 1,764 946 — 4,933
4. Gain on change in equity — — — — 3,644
5. Gain on transfer of mining rights 33,533 — — — 7,333
6. Net gain on redetermination of unitized field — 4,005 — — —
7. Net gain on taking effect of exploration and production agreement — 3,481 — — —
8. Foreign exchange gain 5,738 2,747 — — —
9. Other 4,322 4,666 9,214 7,643 5,432
Total other income 60,079 33,089 32,034 21,473 31,176
VI Other expenses
1. Interest expense 12,389 10,887 3,934 1,274 1,073
2. Equity in losses of affiliates — — — 1,919 —
3. Provision for allowance for doubtful accounts — — — — 9,132
4. Provision for allowance for recoverable accounts under production sharing 6,176 20,586 16,642 6,028 11,481
5. Provision for exploration projects 2,973 3,104 3,386 8,594 3,082
6. Provision for investments in exploration — — — 5,408 —
7. Loss on valuation of investment securities — 21,349 31,798 — —
8. Loss on adjustment for changes of accounting standard for asset retirement obligations — — — — 1,555
9. Foreign exchange loss — — 14,570 13,263 11,539
10. Other 11,355 5,572 8,801 4,624 14,466
Total other expenses 32,893 61,501 79,134 41,113 52,331
Ordinary income 586,262 685,799 616,166 442,027 508,587
Income before income taxes and minority interests 586,262 685,799 616,166 442,027 508,587
Income taxes—current 432,894 496,852 488,262 322,993 367,082
Income taxes—deferred (19,655) (5,502) (17,883) 2,132 1,614
Income before minority interests — — — — 139,890
Minority interests 7,932 21,204 725 9,691 11,190
Net income 165,091 173,245 145,062 107,210 128,699
(¥ million)
2011/3
Income before minority interests 139,890
Other comprehensive income
Unrealized holding loss on securities (10,950)
Translation adjustments (11,516)
Share of other comprehensive income of associates accounted for by the equity method (2,716)
Total other comprehensive income (25,183)
Comprehensive income 114,706
Total comprehensive income attributable to:
Shareholders of INPEX CORPORATION 105,782
Minority interests 8,923
Consolidated Statement of Comprehensive Income
Fina
ncia
l Dat
a
INPEX CORPORATION Fact Book 2011 24
Financial Data
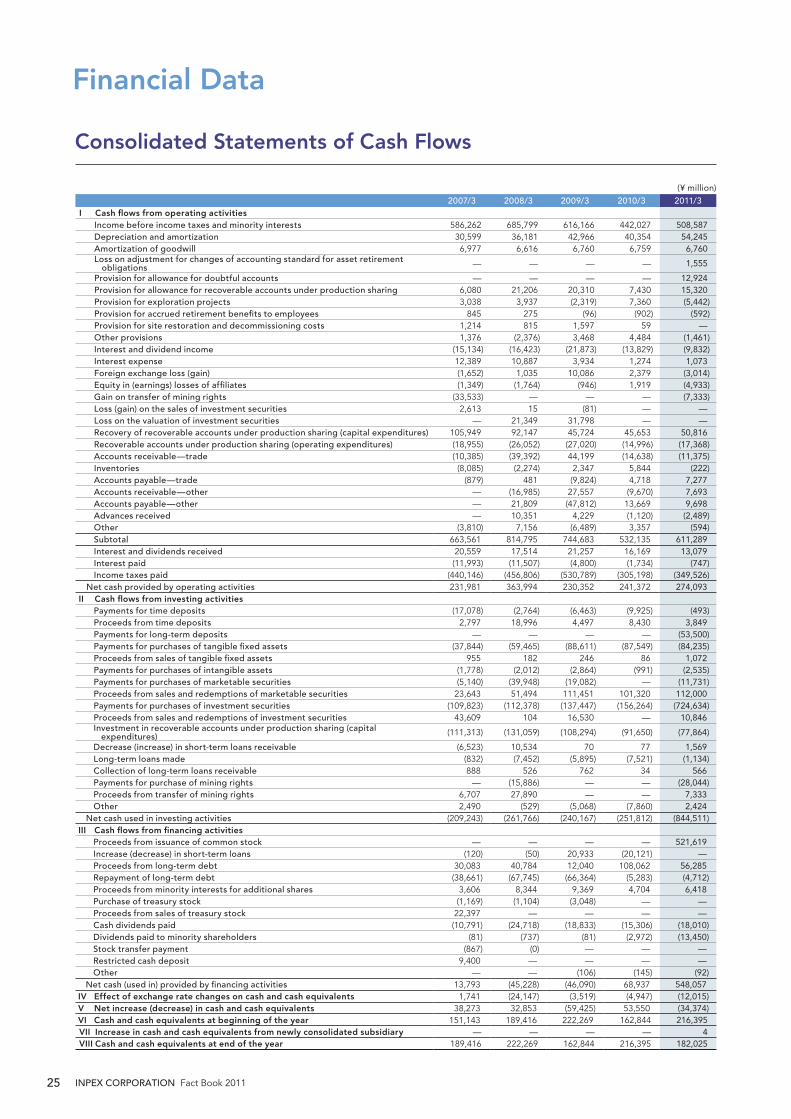
Consolidated Statements of Cash Flows
(¥ million)
2007/3 2008/3 2009/3 2010/3 2011/3I Cash flows from operating activities
Income before income taxes and minority interests 586,262 685,799 616,166 442,027 508,587Depreciation and amortization 30,599 36,181 42,966 40,354 54,245Amortization of goodwill 6,977 6,616 6,760 6,759 6,760Loss on adjustment for changes of accounting standard for asset retirement
obligations — — — — 1,555
Provision for allowance for doubtful accounts — — — — 12,924Provision for allowance for recoverable accounts under production sharing 6,080 21,206 20,310 7,430 15,320Provision for exploration projects 3,038 3,937 (2,319) 7,360 (5,442)Provision for accrued retirement benefits to employees 845 275 (96) (902) (592)Provision for site restoration and decommissioning costs 1,214 815 1,597 59 —Other provisions 1,376 (2,376) 3,468 4,484 (1,461)Interest and dividend income (15,134) (16,423) (21,873) (13,829) (9,832)Interest expense 12,389 10,887 3,934 1,274 1,073Foreign exchange loss (gain) (1,652) 1,035 10,086 2,379 (3,014)Equity in (earnings) losses of affiliates (1,349) (1,764) (946) 1,919 (4,933)Gain on transfer of mining rights (33,533) — — — (7,333)Loss (gain) on the sales of investment securities 2,613 15 (81) — —Loss on the valuation of investment securities — 21,349 31,798 — —Recovery of recoverable accounts under production sharing (capital expenditures) 105,949 92,147 45,724 45,653 50,816Recoverable accounts under production sharing (operating expenditures) (18,955) (26,052) (27,020) (14,996) (17,368)Accounts receivable—trade (10,385) (39,392) 44,199 (14,638) (11,375)Inventories (8,085) (2,274) 2,347 5,844 (222)Accounts payable—trade (879) 481 (9,824) 4,718 7,277Accounts receivable—other — (16,985) 27,557 (9,670) 7,693Accounts payable—other — 21,809 (47,812) 13,669 9,698Advances received — 10,351 4,229 (1,120) (2,489)Other (3,810) 7,156 (6,489) 3,357 (594)Subtotal 663,561 814,795 744,683 532,135 611,289Interest and dividends received 20,559 17,514 21,257 16,169 13,079Interest paid (11,993) (11,507) (4,800) (1,734) (747)Income taxes paid (440,146) (456,806) (530,789) (305,198) (349,526)
Net cash provided by operating activities 231,981 363,994 230,352 241,372 274,093II Cash flows from investing activities
Payments for time deposits (17,078) (2,764) (6,463) (9,925) (493)Proceeds from time deposits 2,797 18,996 4,497 8,430 3,849Payments for long-term deposits — — — — (53,500)Payments for purchases of tangible fixed assets (37,844) (59,465) (88,611) (87,549) (84,235)Proceeds from sales of tangible fixed assets 955 182 246 86 1,072Payments for purchases of intangible assets (1,778) (2,012) (2,864) (991) (2,535)Payments for purchases of marketable securities (5,140) (39,948) (19,082) — (11,731)Proceeds from sales and redemptions of marketable securities 23,643 51,494 111,451 101,320 112,000Payments for purchases of investment securities (109,823) (112,378) (137,447) (156,264) (724,634)Proceeds from sales and redemptions of investment securities 43,609 104 16,530 — 10,846Investment in recoverable accounts under production sharing (capital
expenditures) (111,313) (131,059) (108,294) (91,650) (77,864)
Decrease (increase) in short-term loans receivable (6,523) 10,534 70 77 1,569Long-term loans made (832) (7,452) (5,895) (7,521) (1,134)Collection of long-term loans receivable 888 526 762 34 566Payments for purchase of mining rights — (15,886) — — (28,044)Proceeds from transfer of mining rights 6,707 27,890 — — 7,333Other 2,490 (529) (5,068) (7,860) 2,424
Net cash used in investing activities (209,243) (261,766) (240,167) (251,812) (844,511)III Cash flows from financing activities
Proceeds from issuance of common stock — — — — 521,619Increase (decrease) in short-term loans (120) (50) 20,933 (20,121) —Proceeds from long-term debt 30,083 40,784 12,040 108,062 56,285Repayment of long-term debt (38,661) (67,745) (66,364) (5,283) (4,712)Proceeds from minority interests for additional shares 3,606 8,344 9,369 4,704 6,418Purchase of treasury stock (1,169) (1,104) (3,048) — —Proceeds from sales of treasury stock 22,397 — — — —Cash dividends paid (10,791) (24,718) (18,833) (15,306) (18,010)Dividends paid to minority shareholders (81) (737) (81) (2,972) (13,450)Stock transfer payment (867) (0) — — —Restricted cash deposit 9,400 — — — —Other — — (106) (145) (92)
Net cash (used in) provided by financing activities 13,793 (45,228) (46,090) 68,937 548,057IV Effect of exchange rate changes on cash and cash equivalents 1,741 (24,147) (3,519) (4,947) (12,015)V Net increase (decrease) in cash and cash equivalents 38,273 32,853 (59,425) 53,550 (34,374)VI Cash and cash equivalents at beginning of the year 151,143 189,416 222,269 162,844 216,395VII Increase in cash and cash equivalents from newly consolidated subsidiary — — — — 4VIII Cash and cash equivalents at end of the year 189,416 222,269 162,844 216,395 182,025
INPEX CORPORATION Fact Book 201125

Corporate Information
■ Price range (Right scale) ■ Monthly trading volume (Left scale)
20072006 2008 20094 5 6 7 8 9 10 11 12 4 5 6 7 8 9 10 11 121 2 34 5 6 7 8 9 10 11 12 1 2 3 4 5 6 7 8 9 10 11 121 2 3
20104 5 6 756 7 8 9 10 11 121 2 3
201141 2 3
(Thousands of shares) (Yen)
0 0
250,000
500,000
1,500,000
750,000
1,000,000
1,250,000
800
400
1,600
1,200
Shareholding by
Shareholder type
(%)*1
■ Financial institutions (Including trust accounts) 14.5
■ Securities companies 0.7
■ Other domestic corporations 22.6
■ Minister of Economy, Trade and Industry*2 18.9
■ Foreign corporations and other 40.2
■ Individuals and other 3.0
■ Treasury stock 0.1
Major Shareholders (Common Shares) Shareholding by Shareholder Type
Share Price Range, Trading Volume
Stock Data
Authorized Shares: 9,000,000 common shares 1 special class shareTotal Number of Shareholders and Issued Shares
Common shares: 38,753 shareholders / 3,655,809 shares Special class share*: 1 shareholder (Minister of Economy, Trade and Industry) / 1 share
Name Number of Shares
Percentage of Total Shares
(%)*
Minister of Economy, Trade and Industry 692,307 18.9
Japan Petroleum Exploration Co., Ltd. 267,233 7.3Mitsui Oil Exploration Co., Ltd. 176,760 4.8Mitsubishi Corporation 134,500 3.7JX Holdings, Inc. 134,432 3.7The Master Trust Bank of Japan, Ltd. (Trust Account) 130,362 3.6Japan Trustee Services Bank, Ltd. (Trust Account) 124,404 3.4State Street Bank and Trust Company 99,989 2.7JP Morgan Chase Bank 380055 95,239 2.6State Street Bank and Trust Company 505223 59,362 1.6
Company Name: INPEX CORPORATION
Established: April 3, 2006
Capital: ¥290,809,835,000
Company Headquarters: Akasaka Biz Tower 5-3-1 Akasaka, Minato-ku,
Tokyo 107-6332, Japan
Number of Employees (Consolidated):
1,854
DisclaimerInformation contained in Fact Book 2011 is provided solely for informational purposes and is not an offer or a solicitation of an offer to buy or sell securities. You are requested to make investment decisions using your own judgment. Although the Company has made sufficient effort to ensure the accuracy of information provided herein, the Company assumes no responsibility for any damages or liabilities including, but not limited to, those due to incorrect information or any other reason.
Notes: Financial figures in this fact book have been rounded down to the nearest unit. Figures in parentheses denote negative amounts.
* Percentage of total shares are for all issued and outstanding shares.*1 Percentage of total shares are for all issued and
outstanding shares.*2 Excludes one special class share.
* The Company’s Articles of Incorporation stipulate that certain major corporate decisions require a resolution by the holder of the special class share in addition to the approval of the shareholders’ meetings or Board of Directors.
Unit ConversionCrude oil Natural gas Sales gas LPG LNG
1 kl ≒ 6.29 bbl 1 cf ≒ 1,000 Btu*
1 m3 ≒ 37.32 cf1 ton ≒ 10.5 bbl
(Crude oil)
1 ton ≒ 8.8 bbl (Crude oil) ≒ 1,400m3 (Natural gas) ≒ 53 MMBtu*
1 ton ≒ 7.4 bbl 1 Bm3 ≒ 700 thousand ton (LNG)
1 bbl ≒ 6,000 cf (Natural gas) 100 MMcf/day ≒ 700 thousand ton/y (LNG)
100 thousand bbl/day ≒ 4 MMton/y (LNG) 1 Tcf ≒ 1 MMton × 20 years (LNG) (20 MMton)
*British Thermal UnitNote: Unit-equivalent figures are estimates. We cannot guarantee those figures’ accuracy as applied to dealing or verification.
(As of March 31, 2011)
Co
rpo
rate
Info
rmat
ion
INPEX CORPORATION Fact Book 2011 26

Market Data
Market Data (Price/Exchange Rate/Stock Markets) 01
Market Data (World) 03
Market Data (Japan) 05
Index Data (Consolidated)
Profitability Indices 08
Efficiency Indices 09
Productivity Indices 10
Stability Indices 11
Performance Indices 12
Reserves/Production Indices 13
Operating Data
Global E&P 14
Main Projects in Production 15
Oil and Gas Reserves 16
Oil and Gas Net Production 20
Sales Volume 21
Business Investment/Others 22
Financial Data (Consolidated) 23
Corporate Information 26
C O N T E N T S
Fact Book 2011Year ended March 31, 2011
A Firm Commitment to Sustainable Energy
Akasaka Biz Tower 5-3-1 Akasaka, Minato-ku Tokyo 107-6332, JapanPhone: +81-3-5572-0200http://www.inpex.co.jp/
Printed in Japan
A Firm Commitment to Sustainable Energy
Related Documents