Facilities Services- Campus Planning 2010 CAMPUS MASTER PLAN MONITORING REPORT March 1, 2011 -1- OVERVIEW Oregon State University through the development review process and approval of the Campus Master Plan (CMP) is responsible for the completion of a Campus Master Plan (CMP) Monitoring Report. The details included in the 2010 CMP Monitoring Report are identified in the OSU District land development code in Section 3.36.70. We have received feedback from the City of Corvallis regarding our previous reports. OSU wants to provide a report that will show the development of the OSU campus in a way that is easy to read and provides at-a-glance information. The report will generally follow the same order outlined in Section 3.36.70, but will include graphics and tables for how OSU has developed consistent with the Campus Master Plan for the past calendar year. SECTOR ALLOCATION SUMMARY The Sector Allocation Summary is an accounting of the gross square feet (GSF) of development by CMP sector. The table below shows the total GSF by sector for projects that have had a building permit and CMP checklist submitted to the City within the last 12-month calendar period. The table also includes the remaining development for each sector. Since 2004, OSU has developed approximately 13% or 425,547 gross square feet. The following chart shows the percentage of development by Sector since December 2004.

Welcome message from author
This document is posted to help you gain knowledge. Please leave a comment to let me know what you think about it! Share it to your friends and learn new things together.
Transcript

Facilities Services- Campus Planning 2010 CAMPUS MASTER PLAN MONITORING REPORT March 1, 2011
-1-
OVERVIEW Oregon State University through the development review process and approval of the Campus Master Plan (CMP) is responsible for the completion of a Campus Master Plan (CMP) Monitoring Report. The details included in the 2010 CMP Monitoring Report are identified in the OSU District land development code in Section 3.36.70. We have received feedback from the City of Corvallis regarding our previous reports. OSU wants to provide a report that will show the development of the OSU campus in a way that is easy to read and provides at-a-glance information. The report will generally follow the same order outlined in Section 3.36.70, but will include graphics and tables for how OSU has developed consistent with the Campus Master Plan for the past calendar year. SECTOR ALLOCATION SUMMARY The Sector Allocation Summary is an accounting of the gross square feet (GSF) of development by CMP sector. The table below shows the total GSF by sector for projects that have had a building permit and CMP checklist submitted to the City within the last 12-month calendar period. The table also includes the remaining development for each sector.
Since 2004, OSU has developed approximately 13% or 425,547 gross square feet. The following chart shows the percentage of development by Sector since December 2004.

-2-
OPEN SPACE ALLOCATION SUMMARY The Open Space Allocation Summary provides an overview of OSU’s development as it relates to the minimum open space allocation identified in the campus master plan. To calculate the open space impacts the table below shows the overall MINIMUM open space allocation, which includes future development allocation for each sector. The data comes from the building footprint and any additional impervious surfaces, such as parking lots.
Since 2004, OSU has developed approximately 1% or (328,238) square feet of its buildable lands. The total existing opens space determined in 2004 was 16,668,463 square feet. PARKING UTILIZATION STUDY The 2010 Parking Utilization Study shows a 74% utilization rate, an increase of 3 % from 2009. The following figure shows the capacity of parking compared with the OSU campus population.
Parking capacity was reduced by 92 spaces, and parking capacity has decreased since 2008, mostly in Sector C due to construction in parking lots. Parking displacement in Sector C must be constructed elsewhere on the

-3-
main campus at a 1-1 ratio.1 Therefore, new parking lots will be constructed at the southwest intersection of Campus Way and 35th Street in 2011 to replace the parking spaces removed to construct the Hallie Ford Center and the Outdoor Recreation Field Project. To mitigate the loss of parking for the Linus Pauling Center, two parking lots were constructed at the intersection of 11th and Washington Way and were completed just after this study was completed. With the construction of these lots, it is anticipated the utilization will slightly decrease. PARKING UTILIZATION SUMMARY Parking utilization is calculated as the ratio of occupied spaces to the total parking spaces. OSU’s 2010 parking utilization rate is 74% during peak hours. This is a 3% increase in OSU’s parking utilization between 2009 and 2010. The increase could be correlated to the development of new buildings on existing parking lots in Sector C. Policies in the campus master plan states if parking is displaced in Sector C, then parking must be replaced on a one-to-one ratio to the maximum extent practicable. As stated above, to mitigate the loss of a large amount of parking in Sector C to make way for the Linus Pauling Science Center, the Hallie Ford Center and the Outdoor Recreation field project, OSU was able to replace some of the displaced parking to the maximum extent practicable. However, there are plans to construct parking west of Campus Way and 35th Street in 2011-12. The figure below shows the parking capacity by parking type.
For more detailed information, please refer to Appendices: OSU Parking Utilization Study – Fall 2010
TRANSPORTATION DEMAND MANAGEMENT (TDM) SUMMARY OSU TDM programs are managed by the Alternative Transportation Advisory Committee and Transit and Parking Services. A component of a TDM measure is OSU’s shuttle system. There are two routes identified on campus” North route and South Routes. The following chart shows the shuttle ridership for the past four (4) years. 1 CMP Chapter 5(d. Parking) page 5-6.
-4-
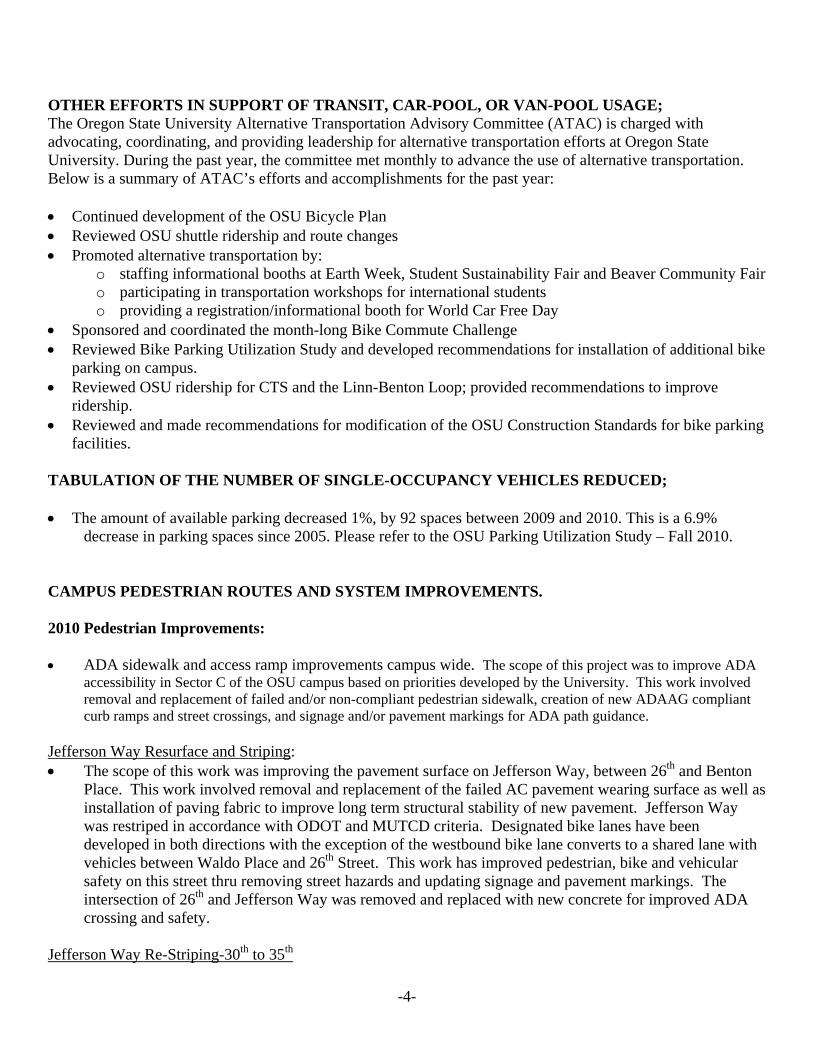
OTHER EFFORTS IN SUPPORT OF TRANSIT, CAR-POOL, OR VAN-POOL USAGE; The Oregon State University Alternative Transportation Advisory Committee (ATAC) is charged with advocating, coordinating, and providing leadership for alternative transportation efforts at Oregon State University. During the past year, the committee met monthly to advance the use of alternative transportation. Below is a summary of ATAC’s efforts and accomplishments for the past year: Continued development of the OSU Bicycle Plan Reviewed OSU shuttle ridership and route changes Promoted alternative transportation by:
o staffing informational booths at Earth Week, Student Sustainability Fair and Beaver Community Fair o participating in transportation workshops for international students o providing a registration/informational booth for World Car Free Day
Sponsored and coordinated the month-long Bike Commute Challenge Reviewed Bike Parking Utilization Study and developed recommendations for installation of additional bike
parking on campus. Reviewed OSU ridership for CTS and the Linn-Benton Loop; provided recommendations to improve
ridership. Reviewed and made recommendations for modification of the OSU Construction Standards for bike parking
facilities. TABULATION OF THE NUMBER OF SINGLE-OCCUPANCY VEHICLES REDUCED; The amount of available parking decreased 1%, by 92 spaces between 2009 and 2010. This is a 6.9%
decrease in parking spaces since 2005. Please refer to the OSU Parking Utilization Study – Fall 2010. CAMPUS PEDESTRIAN ROUTES AND SYSTEM IMPROVEMENTS. 2010 Pedestrian Improvements: ADA sidewalk and access ramp improvements campus wide. The scope of this project was to improve ADA
accessibility in Sector C of the OSU campus based on priorities developed by the University. This work involved removal and replacement of failed and/or non-compliant pedestrian sidewalk, creation of new ADAAG compliant curb ramps and street crossings, and signage and/or pavement markings for ADA path guidance.
Jefferson Way Resurface and Striping: The scope of this work was improving the pavement surface on Jefferson Way, between 26th and Benton
Place. This work involved removal and replacement of the failed AC pavement wearing surface as well as installation of paving fabric to improve long term structural stability of new pavement. Jefferson Way was restriped in accordance with ODOT and MUTCD criteria. Designated bike lanes have been developed in both directions with the exception of the westbound bike lane converts to a shared lane with vehicles between Waldo Place and 26th Street. This work has improved pedestrian, bike and vehicular safety on this street thru removing street hazards and updating signage and pavement markings. The intersection of 26th and Jefferson Way was removed and replaced with new concrete for improved ADA crossing and safety.
Jefferson Way Re-Striping-30th to 35th
-5-
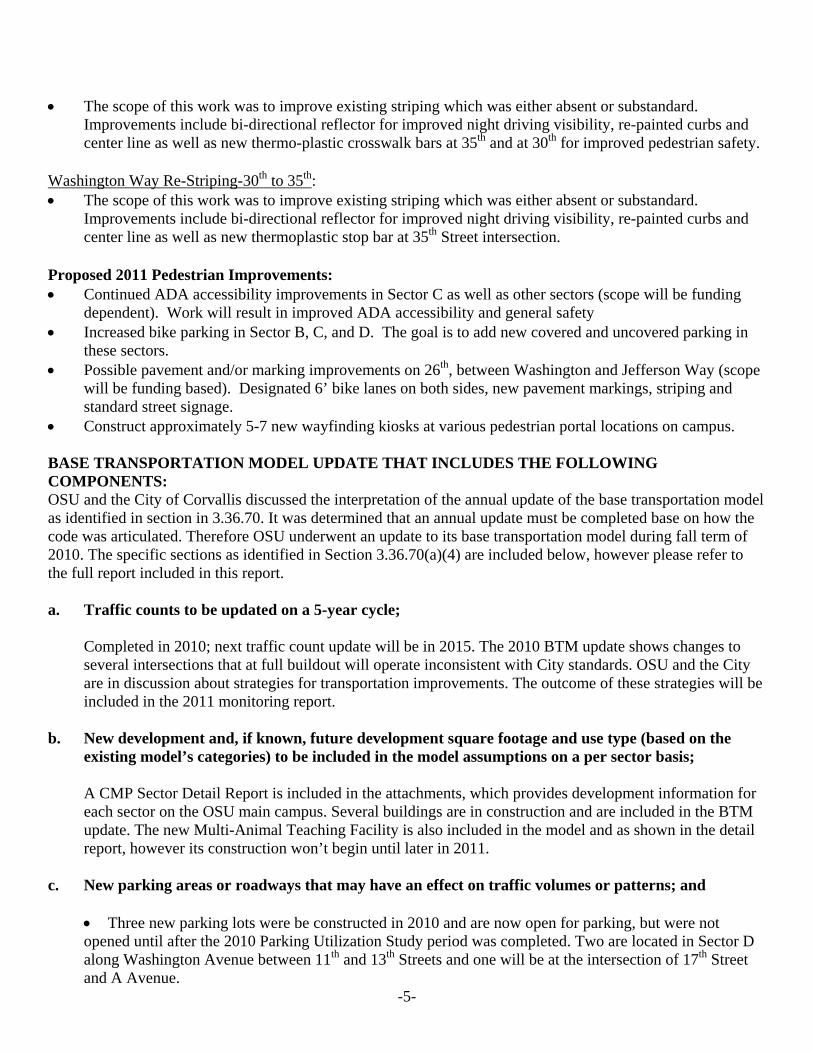
The scope of this work was to improve existing striping which was either absent or substandard. Improvements include bi-directional reflector for improved night driving visibility, re-painted curbs and center line as well as new thermo-plastic crosswalk bars at 35th and at 30th for improved pedestrian safety.
Washington Way Re-Striping-30th to 35th: The scope of this work was to improve existing striping which was either absent or substandard.
Improvements include bi-directional reflector for improved night driving visibility, re-painted curbs and center line as well as new thermoplastic stop bar at 35th Street intersection.
Proposed 2011 Pedestrian Improvements: Continued ADA accessibility improvements in Sector C as well as other sectors (scope will be funding
dependent). Work will result in improved ADA accessibility and general safety Increased bike parking in Sector B, C, and D. The goal is to add new covered and uncovered parking in
these sectors. Possible pavement and/or marking improvements on 26th, between Washington and Jefferson Way (scope
will be funding based). Designated 6’ bike lanes on both sides, new pavement markings, striping and standard street signage.
Construct approximately 5-7 new wayfinding kiosks at various pedestrian portal locations on campus. BASE TRANSPORTATION MODEL UPDATE THAT INCLUDES THE FOLLOWING COMPONENTS: OSU and the City of Corvallis discussed the interpretation of the annual update of the base transportation model as identified in section in 3.36.70. It was determined that an annual update must be completed base on how the code was articulated. Therefore OSU underwent an update to its base transportation model during fall term of 2010. The specific sections as identified in Section 3.36.70(a)(4) are included below, however please refer to the full report included in this report. a. Traffic counts to be updated on a 5-year cycle;
Completed in 2010; next traffic count update will be in 2015. The 2010 BTM update shows changes to several intersections that at full buildout will operate inconsistent with City standards. OSU and the City are in discussion about strategies for transportation improvements. The outcome of these strategies will be included in the 2011 monitoring report.
b. New development and, if known, future development square footage and use type (based on the
existing model’s categories) to be included in the model assumptions on a per sector basis;
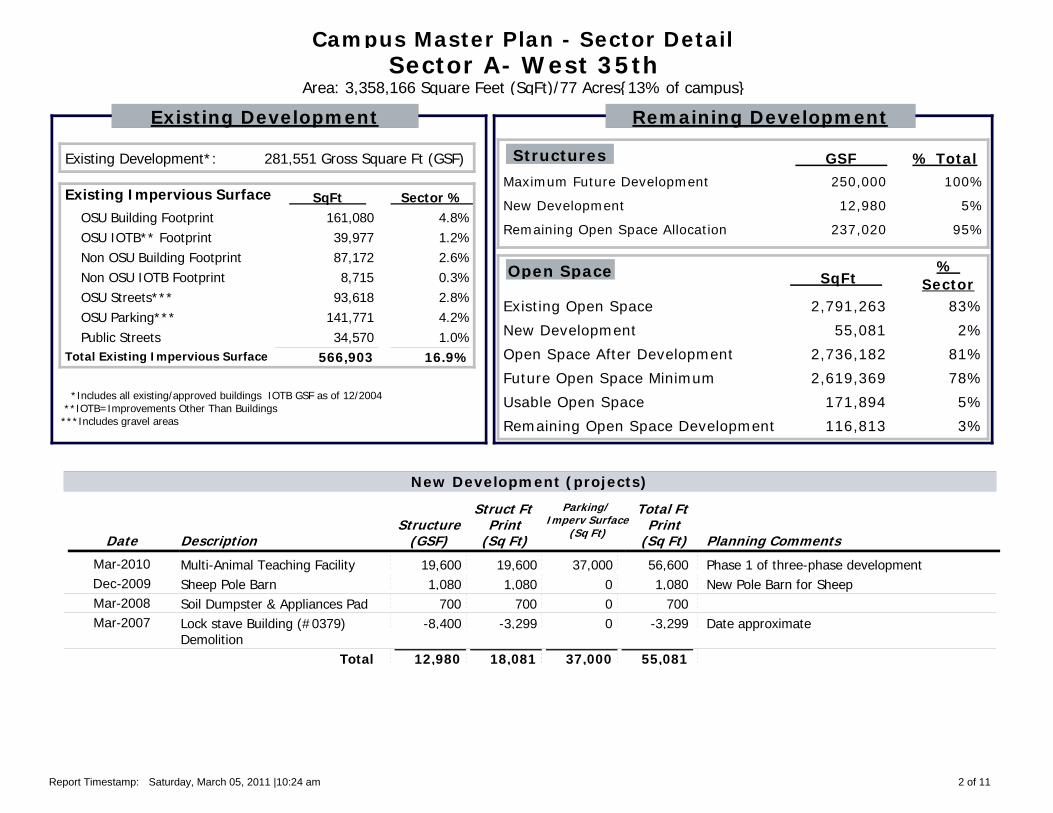
A CMP Sector Detail Report is included in the attachments, which provides development information for each sector on the OSU main campus. Several buildings are in construction and are included in the BTM update. The new Multi-Animal Teaching Facility is also included in the model and as shown in the detail report, however its construction won’t begin until later in 2011.
c. New parking areas or roadways that may have an effect on traffic volumes or patterns; and
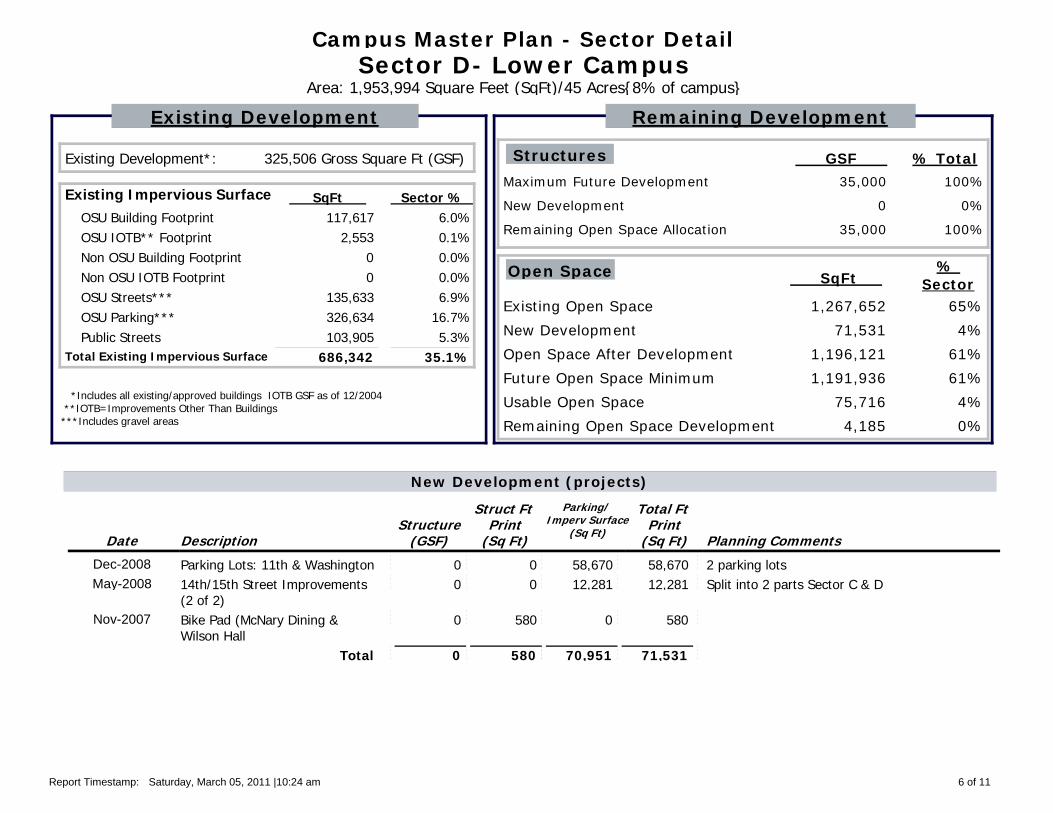
Three new parking lots were be constructed in 2010 and are now open for parking, but were not opened until after the 2010 Parking Utilization Study period was completed. Two are located in Sector D along Washington Avenue between 11th and 13th Streets and one will be at the intersection of 17th Street and A Avenue.

-6-
A new lot is under construction at the intersection of 17th Street and A Avenue lot and will be designated open parking in September/October 2011. There are two additional lots planned for construction in 2011 in Sector A. The new Multi-Animal Teaching Facility will add additional spaces, and across Campus Way to the south an additional lot is planned for construction to replace parking removed in Sector C for the Outdoor Recreation Center and a new Native American Long House. The parking lots will be included in next year’s BTM update.
d. Within one year of the adoption of the CMP, and on a recurrent 2-year schedule, OSU shall complete
in coordination with City staff a baseline traffic count for Jackson Avenue between Arnold Way and 35th Street. City staff shall provide OSU and the neighborhood association with the most recent baseline traffic volume measurements made within the last 5 years.
Refer to 2008 CMP monitoring report. OSU will complete a study of these intersections with the next base transportation model update in 2011.
ADDITIONAL MONITORING EFFORTS INCLUDE: OSU’s sustainability activities span the university. OSU Facilities Services has taken an active and a coordinated lead in promoting and practicing sustainability within campus operations. With the establishment of a Sustainability Coordinator for campus operations, OSU has been able to propel its sustainability efforts and has received several high-profile recognitions and awards, including:
Earning a place in the Kaplan College Guide 2009’s list of America’s top 25 “green” colleges.
Being recognized by the U.S. EPA for our commitment to green power with a 2008 Green Power Leadership Award to be presented as part of the National Renewable Energy Marketing Conference.
Being rank by the U.S. EPA as one of the nation’s top five higher education users of “green power” and the best
in the Pac 10
Being listed among the nation’s top 25 campuses on the Sustainable Endowment Institute’s 2008 College Sustainability Report Card.
Storm Water Management
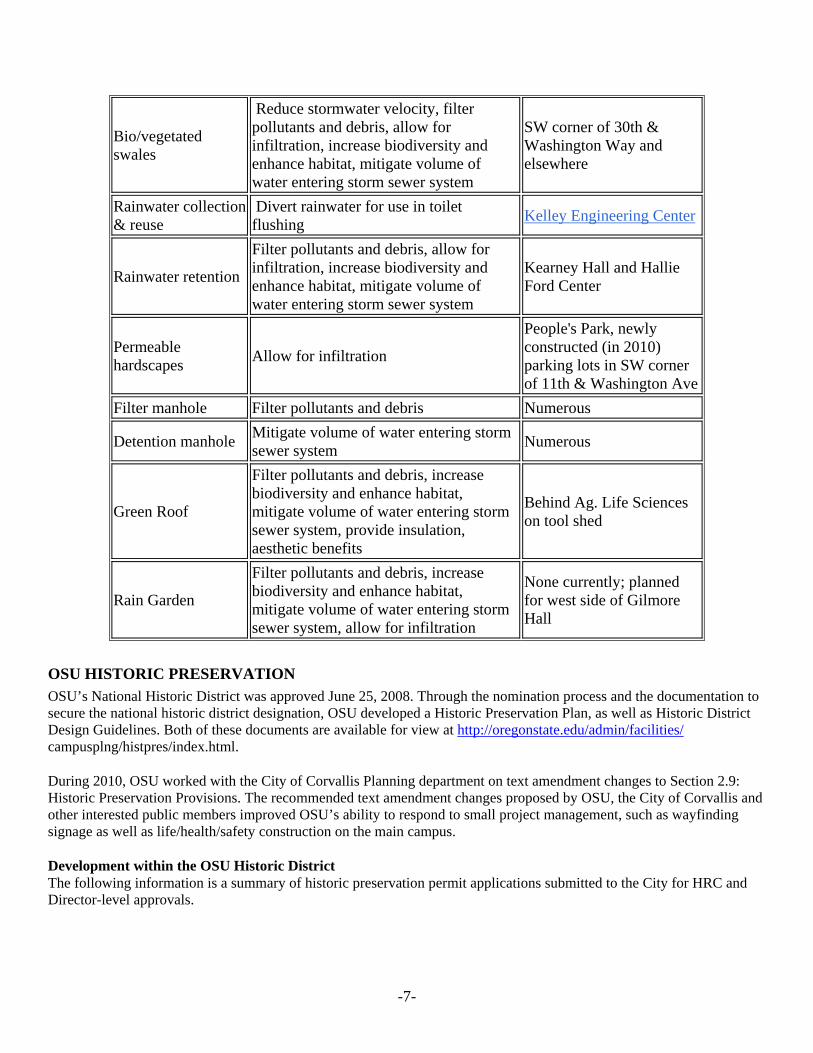
Stormwater is water that does not permeate the ground but instead runs over impermeable surfaces like roofs, parking lots, and streets, picking up pollutants and debris before finally entering the storm sewer system. Much of this untreated water eventually enters creeks, streams and rivers. The table below shows stormwater management technologies, their purpose and where they are in use on the OSU campus.
Stormwater Management
Technology or Device
Purpose Where in use
Stone Swales
Reduce stormwater velocity, filter pollutants and debris, allow for infiltration, increase biodiversity and enhance habitat, mitigate volume of water entering storm sewer system
Reser Stadium parking lot (SW corner) and elsewhere
-7-
Bio/vegetated swales
Reduce stormwater velocity, filter pollutants and debris, allow for infiltration, increase biodiversity and enhance habitat, mitigate volume of water entering storm sewer system
SW corner of 30th & Washington Way and elsewhere
Rainwater collection & reuse
Divert rainwater for use in toilet flushing
Kelley Engineering Center
Rainwater retention
Filter pollutants and debris, allow for infiltration, increase biodiversity and enhance habitat, mitigate volume of water entering storm sewer system
Kearney Hall and Hallie Ford Center
Permeable hardscapes
Allow for infiltration
People's Park, newly constructed (in 2010) parking lots in SW corner of 11th & Washington Ave
Filter manhole Filter pollutants and debris Numerous
Detention manhole Mitigate volume of water entering storm sewer system
Numerous
Green Roof
Filter pollutants and debris, increase biodiversity and enhance habitat, mitigate volume of water entering storm sewer system, provide insulation, aesthetic benefits
Behind Ag. Life Sciences on tool shed
Rain Garden
Filter pollutants and debris, increase biodiversity and enhance habitat, mitigate volume of water entering storm sewer system, allow for infiltration
None currently; planned for west side of Gilmore Hall
OSU HISTORIC PRESERVATION OSU’s National Historic District was approved June 25, 2008. Through the nomination process and the documentation to secure the national historic district designation, OSU developed a Historic Preservation Plan, as well as Historic District Design Guidelines. Both of these documents are available for view at http://oregonstate.edu/admin/facilities/ campusplng/histpres/index.html. During 2010, OSU worked with the City of Corvallis Planning department on text amendment changes to Section 2.9: Historic Preservation Provisions. The recommended text amendment changes proposed by OSU, the City of Corvallis and other interested public members improved OSU’s ability to respond to small project management, such as wayfinding signage as well as life/health/safety construction on the main campus. Development within the OSU Historic District The following information is a summary of historic preservation permit applications submitted to the City for HRC and Director-level approvals.

-8-
2010 Historic Permit Applications
10 Director Level Applications
Project Name Submittal Date Decision
Date Processing
Days Gleeson Hall 4-22-10 5-10-10 18 Kidder Hall 6-16-10 7-16-10 30
Overall Average Length of Processing Time 24
12 HRC Level Applications*
Project Name Submittal Date Decision
Date Processing
Days McAlexander Field House 1-15-10 1-10-10 54 Outdoor Sports Complex 3-19-10 5-13-10 55 Native American Cultural Center 7-13-10 9-15-10 64 Merryfield Hall 6-24-10 8-11-10 55 McAlexander Field House Mod 8-4-10 9-29-10 56 People’s Park 8-4-10 9-29-10 56 Lower Campus Bench 8-18-10 9-29-10 42 Outdoor Sports Complex Mod 9-23-10 12-1-10 69 Bollards at ALS 11-5-10 Interpreted
Exempt -
Poling & Cauthorn ADA Spaces 11-16-10 Pending - Waldo & Dryden Fire Escapes 11-17-10 12-15-10 28
Overall Average Length of Processing Time 63

-9-
Appendices
1. Campus Master Plan – Sector Detail Report
2. Base Transportation Model Report
3. OSU Parking Utilization and Neighborhood Street Parking Study – Fall 2010
4. OSU 2010 Bicycle Utilization Study

Appendix 1
Campus Master Plan – Sector Detail Report

Campus Master Plan - Sector Detail
Area: 24,904,904 Square Feet (SqFt)/572 Acres{100% of campus}
8,141,683 Gross Square Ft (GSF)
3,247,71690,930
213,28618,058
1,124,8083,142,321
399,3228,236,441
3,155,000
425,547
2,729,453
16,668,463
12,939,706
3,728,757
328,471
3,400,286
16,339,992
Existing Development*:
OSU Building FootprintOSU IOTB** FootprintNon OSU Building FootprintNon OSU IOTB FootprintOSU Streets***OSU Parking***Public Streets
Total Existing Impervious Surface
Maximum Future Development
New Development
Remaining Open Space Allocation
Existing Open Space
Future Open Space Minimum
Usable Open Space
New Development
Remaining Open Space Development
Open Space After Development
Existing Impervious Surface SqFt 13.0%0.4%0.9%0.1%4.5%
12.6%1.6%
33.1%
Sector % 100%
GSF % Total
Existing Development
13%
87%
67%
SqFt %
Sector
52%
15%
1%
14%
66%
Structures
Open Space
Remaining Development
Whole Campus- All Sectors
*Includes all existing/approved buildings IOTB GSF as of 12/2004 **IOTB=Improvements Other Than Buildings***Includes gravel areas
-------------------------------------- No New Development Activity ---------------------------------------New Development (projects)
DescriptionStructure
(GSF)
Struct Ft Print
(Sq Ft)
Parking/ Imperv Surface
(Sq Ft) Planning Comments
Total Ft Print
(Sq Ft)Date
Sector C 144,501 39,355 -16,807 Sector Aggregate22,548Mar-2011
Sector G 150,838 30,448 45,000 Sector Aggregate75,448Jun-2010
Sector A 12,980 18,081 37,000 Sector Aggregate55,081Mar-2010
Sector E 28,857 22,347 13,800 Sector Aggregate36,147Mar-2010
Sector B 23,075 29,607 19,075 Sector Aggregate48,682Sep-2009
Sector F 67,276 20,599 0 Sector Aggregate20,599Jul-2009
Sector D 0 580 70,951 Sector Aggregate71,531Dec-2008
Sector J -1,980 -1,565 0 Sector Aggregate-1,565Sep-2007
425,547Total 159,452 169,019 328,471
Report Timestamp: Saturday, March 05, 2011 |10:24 am 1 of 11
Campus Master Plan - Sector Detail
Area: 3,358,166 Square Feet (SqFt)/77 Acres{13% of campus}
281,551 Gross Square Ft (GSF)
161,08039,97787,1728,715
93,618141,77134,570
566,903
250,000
12,980
237,020
2,791,263
2,619,369
171,894
55,081
116,813
2,736,182
Existing Development*:
OSU Building FootprintOSU IOTB** FootprintNon OSU Building FootprintNon OSU IOTB FootprintOSU Streets***OSU Parking***Public Streets
Total Existing Impervious Surface
Maximum Future Development
New Development
Remaining Open Space Allocation
Existing Open Space
Future Open Space Minimum
Usable Open Space
New Development
Remaining Open Space Development
Open Space After Development
Existing Impervious Surface SqFt 4.8%1.2%2.6%0.3%2.8%4.2%1.0%
16.9%
Sector % 100%
GSF % Total
Existing Development
5%
95%
83%
SqFt %
Sector
78%
5%
2%
3%
81%
Structures
Open Space
Remaining Development
Sector A- West 35th
*Includes all existing/approved buildings IOTB GSF as of 12/2004 **IOTB=Improvements Other Than Buildings***Includes gravel areas
-------------------------------------- No New Development Activity ---------------------------------------New Development (projects)
DescriptionStructure
(GSF)
Struct Ft Print
(Sq Ft)
Parking/ Imperv Surface
(Sq Ft) Planning Comments
Total Ft Print
(Sq Ft)Date
Multi-Animal Teaching Facility 19,600 19,600 37,000 Phase 1 of three-phase development56,600Mar-2010
Sheep Pole Barn 1,080 1,080 0 New Pole Barn for Sheep1,080Dec-2009
Soil Dumpster & Appliances Pad 700 700 0 700Mar-2008
Lock stave Building (#0379) Demolition
-8,400 -3,299 0 Date approximate-3,299Mar-2007
12,980Total 18,081 37,000 55,081
Report Timestamp: Saturday, March 05, 2011 |10:24 am 2 of 11

Campus Master Plan - Sector Detail
Area: 3,129,255 Square Feet (SqFt)/72 Acres{13% of campus}
831,426 Gross Square Ft (GSF)
437,20513,512
100,2368,117
129,191590,62366,596
1,345,480
500,000
23,075
476,925
1,783,775
1,032,654
751,121
48,682
702,439
1,735,093
Existing Development*:
OSU Building FootprintOSU IOTB** FootprintNon OSU Building FootprintNon OSU IOTB FootprintOSU Streets***OSU Parking***Public Streets
Total Existing Impervious Surface
Maximum Future Development
New Development
Remaining Open Space Allocation
Existing Open Space
Future Open Space Minimum
Usable Open Space
New Development
Remaining Open Space Development
Open Space After Development
Existing Impervious Surface SqFt 14.0%0.4%3.2%0.3%4.1%
18.9%2.1%
43.0%
Sector % 100%
GSF % Total
Existing Development
5%
95%
57%
SqFt %
Sector
33%
24%
2%
22%
55%
Structures
Open Space
Remaining Development
Sector B- West Campus
*Includes all existing/approved buildings IOTB GSF as of 12/2004 **IOTB=Improvements Other Than Buildings***Includes gravel areas
-------------------------------------- No New Development Activity ---------------------------------------New Development (projects)
DescriptionStructure
(GSF)
Struct Ft Print
(Sq Ft)
Parking/ Imperv Surface
(Sq Ft) Planning Comments
Total Ft Print
(Sq Ft)Date
Dryden Generator 232 232 0 New generator on concrete slab232Sep-2009
Radiation Center High Bay Addition
1,600 1,600 308 1,908Jun-2009
Vet Dairy Barn Tuff Shed 420 420 0 420Nov-2007
EH&S Annex Addition 1,120 1,120 0 1,120Aug-2007
New Energy Center 32,419 32,419 18,767 51,186Feb-2007
Poultry House G (#0149) Demolition
-7,040 0 0 Slab remains (footprint no change) Demolish for Energy Center
0Feb-2007
Poultry House H (#0157) Demolition
-5,676 -6,184 0 Demolish for Energy Center-6,184Feb-2007
23,075Total 29,607 19,075 48,682
Report Timestamp: Saturday, March 05, 2011 |10:24 am 3 of 11

Campus Master Plan - Sector Detail
Area: 6,863,033 Square Feet (SqFt)/158 Acres{28% of campus}
4,685,510 Gross Square Ft (GSF)
1,460,8415,865
00
529,326829,01057,060
2,882,102
750,000
144,501
605,499
3,980,931
2,470,692
1,510,239
22,548
1,487,691
3,958,383
Existing Development*:
OSU Building FootprintOSU IOTB** FootprintNon OSU Building FootprintNon OSU IOTB FootprintOSU Streets***OSU Parking***Public Streets
Total Existing Impervious Surface
Maximum Future Development
New Development
Remaining Open Space Allocation
Existing Open Space
Future Open Space Minimum
Usable Open Space
New Development
Remaining Open Space Development
Open Space After Development
Existing Impervious Surface SqFt 21.3%0.1%0.0%0.0%7.7%
12.1%0.8%
42.0%
Sector % 100%
GSF % Total
Existing Development
19%
81%
58%
SqFt %
Sector
36%
22%
0%
22%
58%
Structures
Open Space
Remaining Development
Sector C- Campus Core
*Includes all existing/approved buildings IOTB GSF as of 12/2004 **IOTB=Improvements Other Than Buildings***Includes gravel areas
-------------------------------------- No New Development Activity ---------------------------------------New Development (projects)
DescriptionStructure
(GSF)
Struct Ft Print
(Sq Ft)
Parking/ Imperv Surface
(Sq Ft) Planning Comments
Total Ft Print
(Sq Ft)Date
Merryfield Hall screening wall, concrete pad
0 0 235 New air condensors at Merryfield Hall require concrete pad, screening wall
235Mar-2011
ADA Ramp on North side of Milam Hall
0 0 784 New ADA ramp includes removal and re-installation of replacement bike racks. Existing bike parking removed=270 sf. Replacement bike parking = 354 sf. New ADA ramp paving = 678 sf. Net increase in impervious= 784 sf open space development.
784Feb-2011
New ADA parking at Poling and Cauthorn
0 0 1,000 New parking spaces created from landscaped area between building and Intramural Way
1,000Jan-2011
Report Timestamp: Saturday, March 05, 2011 |10:24 am 4 of 11

Campus Master Plan - Sector DetailNew access ramp on south side of building
0 0 505 140 Sf of existing walk and stairs to be demolished, 645 Sf of new ramp and stairs to be installed. Therefore 505 SF of net increase in impervios paving
505Jan-2011
Native American Cultural Center 1,180 1,180 -3,749 Removing existing Quonset hut and parking lot and constructing new building. Net increase in existing open space.
-2,569Aug-2010
Remove Quonset hut and replace with Native American Cultural Center
1,180 1,180 -3,749 Net increase is building square footage and net decrease in impervious cover due to removal of existing parking lot.
-2,569Aug-2010
ALS Nitrogen Storage Tank and concrete pad
162 0 162 ALS storage tank, concrete pad, and screening162May-2010
Plageman Generator 270 270 0 New Generator and Bike Racks270Dec-2009
McAlexander Field House 0 0 239 Interior / Parking Alterations239Dec-2009
Hallie Ford Building 18,173 7,352 -600 New building on parking lot, some parking converted to landscaping
6,752Dec-2009
Green Shed 128 128 0 Green Roof tool shed for compost area128Oct-2009
Kerr Admin Bldg Replacement ADA Ramp
0 0 0 Replacement non-compliant ADA ramp on south of Kerr Admin Bldg
0Aug-2009
Nash Hall General Improvements 0 375 0 Generator Footprint375Aug-2009
Reed Lodge Remodel 0 0 922 922Jul-2009
Heckart Lodge Renovation 0 0 1,141 Renovation- no new GSF1,141Jun-2009
Education Hall- Seismic Upgrade 0 0 0 Voluntary Seismic Upgrade0May-2009
Linus Pauling Science Center 102,000 22,444 -16,030 Structure to be built on existing Parking Lot/Some current parking Lot converted to open space
6,414Mar-2009
14th/15th Street Improvements (1 of 2)
0 0 2,333 Split into 2 parts Sector C & D2,333May-2008
Goss Stadium Expansion 21,408 6,426 0 6,426Aug-2007
144,501Total 39,355 -16,807 22,548
Report Timestamp: Saturday, March 05, 2011 |10:24 am 5 of 11
Campus Master Plan - Sector Detail
Area: 1,953,994 Square Feet (SqFt)/45 Acres{8% of campus}
325,506 Gross Square Ft (GSF)
117,6172,553
00
135,633326,634103,905
686,342
35,000
0
35,000
1,267,652
1,191,936
75,716
71,531
4,185
1,196,121
Existing Development*:
OSU Building FootprintOSU IOTB** FootprintNon OSU Building FootprintNon OSU IOTB FootprintOSU Streets***OSU Parking***Public Streets
Total Existing Impervious Surface
Maximum Future Development
New Development
Remaining Open Space Allocation
Existing Open Space
Future Open Space Minimum
Usable Open Space
New Development
Remaining Open Space Development
Open Space After Development
Existing Impervious Surface SqFt 6.0%0.1%0.0%0.0%6.9%
16.7%5.3%
35.1%
Sector % 100%
GSF % Total
Existing Development
0%
100%
65%
SqFt %
Sector
61%
4%
4%
0%
61%
Structures
Open Space
Remaining Development
Sector D- Lower Campus
*Includes all existing/approved buildings IOTB GSF as of 12/2004 **IOTB=Improvements Other Than Buildings***Includes gravel areas
-------------------------------------- No New Development Activity ---------------------------------------New Development (projects)
DescriptionStructure
(GSF)
Struct Ft Print
(Sq Ft)
Parking/ Imperv Surface
(Sq Ft) Planning Comments
Total Ft Print
(Sq Ft)Date
Parking Lots: 11th & Washington 0 0 58,670 2 parking lots58,670Dec-2008
14th/15th Street Improvements (2 of 2)
0 0 12,281 Split into 2 parts Sector C & D12,281May-2008
Bike Pad (McNary Dining & Wilson Hall
0 580 0 580Nov-2007
0Total 580 70,951 71,531
Report Timestamp: Saturday, March 05, 2011 |10:24 am 6 of 11

Campus Master Plan - Sector Detail
Area: 2,870,819 Square Feet (SqFt)/66 Acres{12% of campus}
253,046 Gross Square Ft (GSF)
209,49910,860
00
39,718244,33930,977
535,393
120,000
28,857
91,143
2,335,426
2,210,531
124,895
36,147
88,748
2,299,279
Existing Development*:
OSU Building FootprintOSU IOTB** FootprintNon OSU Building FootprintNon OSU IOTB FootprintOSU Streets***OSU Parking***Public Streets
Total Existing Impervious Surface
Maximum Future Development
New Development
Remaining Open Space Allocation
Existing Open Space
Future Open Space Minimum
Usable Open Space
New Development
Remaining Open Space Development
Open Space After Development
Existing Impervious Surface SqFt 7.3%0.4%0.0%0.0%1.4%8.5%1.1%
18.6%
Sector % 100%
GSF % Total
Existing Development
24%
76%
81%
SqFt %
Sector
77%
4%
1%
3%
80%
Structures
Open Space
Remaining Development
Sector E- Southwest Campus
*Includes all existing/approved buildings IOTB GSF as of 12/2004 **IOTB=Improvements Other Than Buildings***Includes gravel areas
-------------------------------------- No New Development Activity ---------------------------------------New Development (projects)
DescriptionStructure
(GSF)
Struct Ft Print
(Sq Ft)
Parking/ Imperv Surface
(Sq Ft) Planning Comments
Total Ft Print
(Sq Ft)Date
Oak Creek Electrical Repair 36 36 0 Increase size of existing 64 sf concrete pad by 36 square feet. New pad total size = 100 sf
36Mar-2010
College of Vetinerary Medicine Pole Barn
960 960 0 960Mar-2009
UHDS Svc Bldg Storage Facility 48 48 0 48Nov-2007
Large Animal Vet Med Hospital 27,813 21,303 13,800 updated 8/13/08 (Larrie Easterly)35,103Mar-2007
28,857Total 22,347 13,800 36,147
Report Timestamp: Saturday, March 05, 2011 |10:24 am 7 of 11

Campus Master Plan - Sector Detail
Area: 2,062,341 Square Feet (SqFt)/47 Acres{8% of campus}
847,166 Gross Square Ft (GSF)
555,2201,709
00
134,334610,702
4081,302,373
750,000
67,276
682,724
759,968
412,468
347,500
20,599
326,901
739,369
Existing Development*:
OSU Building FootprintOSU IOTB** FootprintNon OSU Building FootprintNon OSU IOTB FootprintOSU Streets***OSU Parking***Public Streets
Total Existing Impervious Surface
Maximum Future Development
New Development
Remaining Open Space Allocation
Existing Open Space
Future Open Space Minimum
Usable Open Space
New Development
Remaining Open Space Development
Open Space After Development
Existing Impervious Surface SqFt 26.9%0.1%0.0%0.0%6.5%
29.6%0.0%
63.2%
Sector % 100%
GSF % Total
Existing Development
9%
91%
37%
SqFt %
Sector
20%
17%
1%
16%
36%
Structures
Open Space
Remaining Development
Sector F- Reser Stadium and Gill Coliseum
*Includes all existing/approved buildings IOTB GSF as of 12/2004 **IOTB=Improvements Other Than Buildings***Includes gravel areas
-------------------------------------- No New Development Activity ---------------------------------------New Development (projects)
DescriptionStructure
(GSF)
Struct Ft Print
(Sq Ft)
Parking/ Imperv Surface
(Sq Ft) Planning Comments
Total Ft Print
(Sq Ft)Date
26th St Gateway (2 of 2) 16 16 0 Sculpture16Jul-2009
Gill Annex 31,593 20,583 0 20,583Apr-2007
Reser Phase II (South Stands) 35,667 0 0 Expansion above existing parking lot.0Feb-2007
67,276Total 20,599 0 20,599
Report Timestamp: Saturday, March 05, 2011 |10:24 am 8 of 11

Campus Master Plan - Sector Detail
Area: 1,360,414 Square Feet (SqFt)/31 Acres{5% of campus}
742,092 Gross Square Ft (GSF)
268,5313,931
00
62,988169,35459,146
563,950
350,000
150,838
199,162
796,464
544,166
252,298
75,448
176,850
721,016
Existing Development*:
OSU Building FootprintOSU IOTB** FootprintNon OSU Building FootprintNon OSU IOTB FootprintOSU Streets***OSU Parking***Public Streets
Total Existing Impervious Surface
Maximum Future Development
New Development
Remaining Open Space Allocation
Existing Open Space
Future Open Space Minimum
Usable Open Space
New Development
Remaining Open Space Development
Open Space After Development
Existing Impervious Surface SqFt 19.7%0.3%0.0%0.0%4.6%
12.4%4.3%
41.5%
Sector % 100%
GSF % Total
Existing Development
43%
57%
59%
SqFt %
Sector
40%
19%
6%
13%
53%
Structures
Open Space
Remaining Development
Sector G- LaSells and Alumni Center
*Includes all existing/approved buildings IOTB GSF as of 12/2004 **IOTB=Improvements Other Than Buildings***Includes gravel areas
-------------------------------------- No New Development Activity ---------------------------------------New Development (projects)
DescriptionStructure
(GSF)
Struct Ft Print
(Sq Ft)
Parking/ Imperv Surface
(Sq Ft) Planning Comments
Total Ft Print
(Sq Ft)Date
OSU INTO 150,720 30,330 45,000 **Needs to be verified**75,330Jun-2010
26th St Gateway (1 of 2) 118 118 0 Sign & Landscape118Jul-2009
150,838Total 30,448 45,000 75,448
Report Timestamp: Saturday, March 05, 2011 |10:24 am 9 of 11
Campus Master Plan - Sector Detail
Area: 1,030,317 Square Feet (SqFt)/24 Acres{4% of campus}
133,535 Gross Square Ft (GSF)
97611,37225,8781,226
0229,88846,660
316,000
50,000
0
50,000
714,317
659,403
54,914
0
54,914
714,317
Existing Development*:
OSU Building FootprintOSU IOTB** FootprintNon OSU Building FootprintNon OSU IOTB FootprintOSU Streets***OSU Parking***Public Streets
Total Existing Impervious Surface
Maximum Future Development
New Development
Remaining Open Space Allocation
Existing Open Space
Future Open Space Minimum
Usable Open Space
New Development
Remaining Open Space Development
Open Space After Development
Existing Impervious Surface SqFt 0.1%1.1%2.5%0.1%0.0%
22.3%4.5%
30.7%
Sector % 100%
GSF % Total
Existing Development
0%
100%
69%
SqFt %
Sector
64%
5%
0%
5%
69%
Structures
Open Space
Remaining Development
Sector H- Far South Campus
*Includes all existing/approved buildings IOTB GSF as of 12/2004 **IOTB=Improvements Other Than Buildings***Includes gravel areas
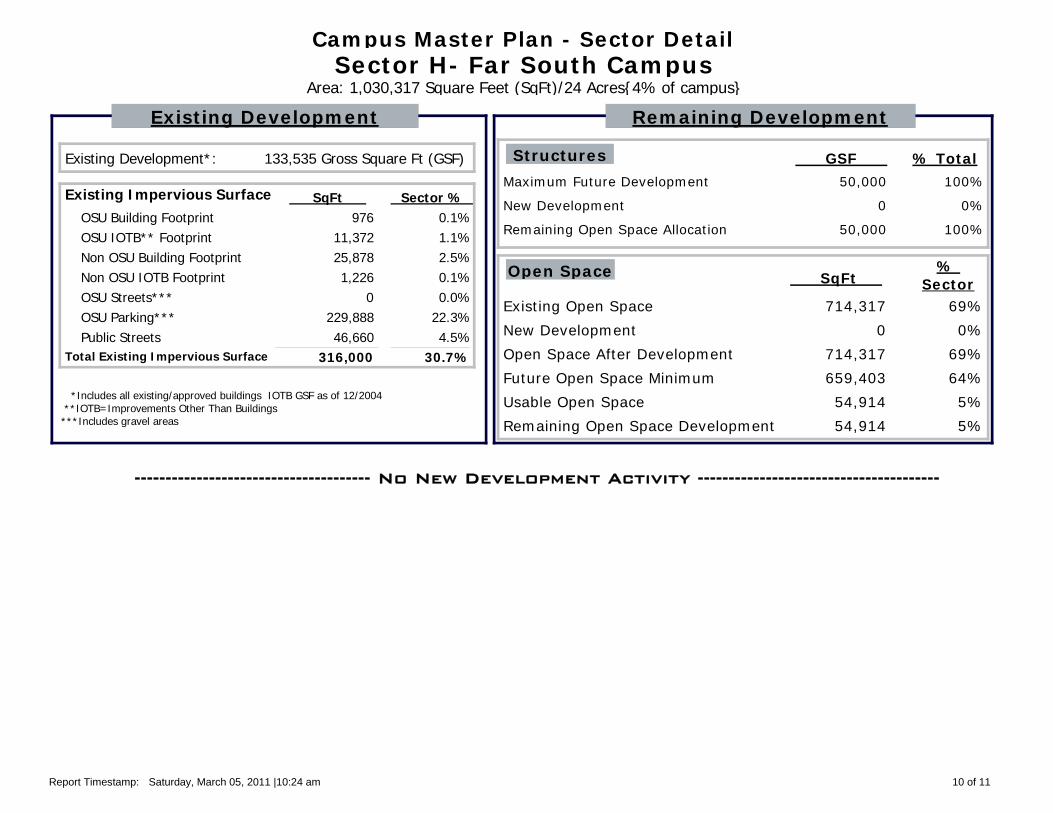
-------------------------------------- No New Development Activity ---------------------------------------
Report Timestamp: Saturday, March 05, 2011 |10:24 am 10 of 11

Campus Master Plan - Sector Detail
Area: 2,276,565 Square Feet (SqFt)/52 Acres{9% of campus}
41,851 Gross Square Ft (GSF)
36,7471,151
00000
37,898
350,000
-1,980
351,980
2,238,667
1,798,486
440,181
-1,565
441,746
2,240,232
Existing Development*:
OSU Building FootprintOSU IOTB** FootprintNon OSU Building FootprintNon OSU IOTB FootprintOSU Streets***OSU Parking***Public Streets
Total Existing Impervious Surface
Maximum Future Development
New Development
Remaining Open Space Allocation
Existing Open Space
Future Open Space Minimum
Usable Open Space
New Development
Remaining Open Space Development
Open Space After Development
Existing Impervious Surface SqFt 1.6%0.1%0.0%0.0%0.0%0.0%0.0%
1.7%
Sector % 100%
GSF % Total
Existing Development
-1%
101%
98%
SqFt %
Sector
79%
19%
0%
19%
98%
Structures
Open Space
Remaining Development
Sector J- South Farm
*Includes all existing/approved buildings IOTB GSF as of 12/2004 **IOTB=Improvements Other Than Buildings***Includes gravel areas
-------------------------------------- No New Development Activity ---------------------------------------New Development (projects)
DescriptionStructure
(GSF)
Struct Ft Print
(Sq Ft)
Parking/ Imperv Surface
(Sq Ft) Planning Comments
Total Ft Print
(Sq Ft)Date
Residence (#0401) Demolition -1,980 -1,565 0 -1,565Sep-2007
-1,980Total -1,565 0 -1,565
Report run by: pattym Database: S:\Planning\Databases\CMPSectorDevelopmentTracking\MSAccess2007CMP_Tracking_FINAL.accdb
Report Timestamp: Saturday, March 05, 2011 |10:24 am 11 of 11

Appendix 2
Base Transportation Model Report

2010 BASE TRANSPORTATION MODEL UPDATE OREGON STATE UNIVERSITY CAMPUS Corval l is, Oregon Prepared For Oregon State University Completed On March 14, 2011 Project Number 2100087.01

H:\Projects\210008701\WP\110314 BTM Update Report.doc 1
TABLE OF CONTENTS Page #
I . Introduction .... . . . . . . . . . . . . . . . . . . . . . . . . . . . . . . . . . . . . . . . . . . . . . . . . . . . . . . . . . . . . . . . . . . . . . . . . . . . . . . . . . . . 2
I I . Vehicle Operations Analysis ... . . . . . . . . . . . . . . . . . . . . . . . . . . . . . . . . . . . . . . . . . . . . . . . . . . . . . . . . . . . . 3
I I I . Mitigation .... . . . . . . . . . . . . . . . . . . . . . . . . . . . . . . . . . . . . . . . . . . . . . . . . . . . . . . . . . . . . . . . . . . . . . . . . . . . . . . . . . . . . . . . 7
LIST OF TABLES
Table 1 – Intersection Operations .... . . . . . . . . . . . . . . . . . . . . . . . . . . . . . . . . . . . . . . . . . . . . . . . . . . . . . . . . . . . . 4
Table 2 – Intersection Operation Deficiencies .... . . . . . . . . . . . . . . . . . . . . . . . . . . . . . . . . . . . . . . . . . 5
Table 3 – IntersectionsFor Future Analysis ... . . . . . . . . . . . . . . . . . . . . . . . . . . . . . . . . . . . . . . . . . . . . . . . . . 6
Table 4 – Mitigated Intersection Operations .... . . . . . . . . . . . . . . . . . . . . . . . . . . . . . . . . . . . . . . . . . . 10

H:\Projects\210008701\WP\110314 BTM Update Report.doc 2
I. INTRODUCTION
Materials contained in this document update the Oregon State University (OSU) Base Transportation Model (BTM) developed for the OSU Campus Master Plan. This document provides a 2010 update to the previously prepared December 8, 2006 OSU BTM Update and identifies changes in existing and future year system operations.
For this update the following background data was collected and analysis performed: Base traffic volumes at all study intersections Current intersection traffic control information and approach geometries Travel survey to determine specific trip making characteristics Specific building data for current uses/occupancies
SCOPE OF REPORT
This analysis addresses intersection operations within the OSU campus influence area. Analysis intersections have been previously defined through BTM update processes in agreement with OSU and City of Corvallis staffs and are contained in the base transportation model. Operation analyses were performed for the weekday AM and PM peak hours at the study intersections for the following scenarios: Current year (2010) existing conditions Plan year (2014) conditions assuming full build-out of the Campus Master Plan.
Current and plan year system operating conditions are documented and necessary mitigation measures are identified to address system deficiencies.
2010 OSU BTM Update materials are presented in the following manner: Vehicle Operations Analysis Mitigation
H:\Projects\210008701\WP\110314 BTM Update Report.doc 3
I I . VEHICLE OPERATIONS ANALYSIS
OPERATION ANALYSIS DESCRIPTION
Intersection operation characteristics are generally defined by two measurements: level-of-service (LOS) and volume-to-capacity (v/c) ratio. The City uses LOS and delay and ODOT uses v/c ratio to determine intersection performance. Since both agencies have roadways within the project impact area, both measurements are included in the analysis.
LOS is a measure of the average control delay (in seconds) experienced by drivers at an intersection and is described by a letter on the scale from ‘A’ to ‘F.’ LOS ‘A’ represents optimum operating conditions and minimum delay. LOS ‘F’ indicates over capacity conditions causing unacceptable delay. LOS ‘D’ is considered the acceptable minimum by the City of Corvallis.
V/c ratio is a measurement of capacity used by a given traffic movement for an entire intersection. It is defined by the rate of traffic flow or traffic demand divided by the theoretical capacity. Based on the 1999 Oregon Highway Plan (OHP), US 20/OR 34 (Corvallis-Newport Highway) is classified as a Statewide Highway, a National Highway System (NHS) route, a Freight Route, a Truck Route and an Expressway. The OHP requires a maximum v/c ratio of 0.80 be maintained on US 20/OR 34 at the study area intersections.
PEAK HOUR FACTOR
The peak hour factor (PHF) is used to determine the design hour flow rate and is defined as the ratio of total hourly flow to the peak 15-minute flow rate within the hour. For analyses contained in this update, PHFs are calculated for individual study area intersections.

H:\Projects\210008701\WP\110314 BTM Update Report.doc 4
OPERATION ANALYSIS
The TRAFFIX analysis module within VISUM was used to calculate LOS and v/c ratios for the study area intersections. This analysis is based on Highway Capacity Manual procedures.
Analyses results are summarized in the following table. For signalized and all-way stop controlled intersections, overall intersection operations are presented. For unsignalized intersections, operations are presented for the worst performing lane group.
Transportation analyses are presented for the following scenarios:
Base year (2006) conditions – provided as historical reference Current year (2010) existing conditions Plan year (2014) future conditions assuming full build-out of the Campus Master Plan
TABLE 1 – INTERSECTION OPERATIONS
AM Peak Hour PM Peak Hour Study In tersect ion (Nor th -South /East -West )
Contro l Type
Mob i l i ty S tandard
2006 2010 2014 2006 2010 2014 2-Way S top B C 9 t h S t ree t / Je f fe rson Avenue S igna l i zed
LOS B B B B
9 t h S t ree t /Monroe Avenue S igna l i zed LOS A A B B B B 11 t h S t ree t / Je f fe rson Avenue 2 -Way S top LOS C B D C C F 14 t h S t ree t /Monroe Avenue S igna l i zed LOS A A B B B B 15 t h S t ree t /Wes te rn Bou levard S igna l i zed LOS C C D C C C 15 t h S t ree t /Wash ing ton Way 2 -Way S top LOS C C F D F F 15 t h S t ree t /Wash ing ton Avenue 2 -Way S top LOS B C E E C D 15 t h S t ree t / Je f fe rson Avenue S igna l i zed LOS A A A B A A 17 t h S t ree t /Wash ing ton Way 2 -Way S top LOS A A B A B B K ings B l vd /Monroe Avenue 3 -Way S top LOS A B C C F F 25 t h /Park Ter race /Monroe Avenue 2 -Way S top LOS D C D E C D 26 t h S t ree t /US 20 /OR 34 S igna l i zed V /C 0 .71 0 .55 0 .89 0 .68 1 .12 1 .39
2 -Way S top C C 26 t h S t ree t /Wes te rn Bou levard S igna l i zed
LOS C C C C
26 t h S t ree t /Wash ing ton Way 4 -Way S top LOS A A B A A A 2 -Way S top B B 26 t h S t ree t /Monroe Avenue 4 -Way S top
LOS A B B C
29 t h S t ree t /Har r i son Bou levard S igna l i zed LOS C B C C B B 30 t h S t ree t /Wes te rn Bou levard 2 -Way S top LOS B E F C B B 30 t h S t ree t /Wash ing ton Way 4 -Way S top LOS B B B B A B 30 t h S t ree t /Orchard Avenue 2 -Way S top LOS C D E C B C 30 t h S t ree t /Har r i son Bou levard 2 -Way S top LOS F F F F F F 35 t h S t ree t /US 20 /OR 34 S igna l i zed V /C 0 .79 0 .66 1 .03 0 .69 0 .86 0 .99 35 t h S t ree t /Wes te rn Bou levard S igna l i zed LOS B B D B B B 35 t h S t ree t / Je f fe rson Avenue 2 -Way S top LOS C F 1 F 1 C C D 35 t h S t ree t /Campus Way 2 -Way S top LOS C C C C F F 35 t h S t ree t /Har r i son Bou levard S igna l i zed LOS C B B C B B 36 t h S t ree t /Har r i son Bou levard Signa l i zed LOS B B B B A A 1 R e v i e w i n d i c a t e s 2 0 1 0 A M c o u n t d a t a m a y b e i n c o r r e c t

H:\Projects\210008701\WP\110314 BTM Update Report.doc 5
OPERATION ANALYSIS SUMMARY
As depicted in the previous table, most intersections show small performance decreases from 2006 to 2010; however, some changes are significant and generally result from increases in background traffic volumes. There are additional performance decreases between the 2010 and 2014 analysis scenarios resulting from the assumed build-out of campus facili t ies and background traffic growth. The 9 t h Street/Jefferson Avenue intersection has been signalized and operating deficiencies are not anticipated. A traffic signal is planned for construction at the 26t h Street/Western Boulevard intersection. As such, analysis assumes the intersection is signalized and operating deficiencies are not anticipated.
Again, LOS ‘D’ is considered the acceptable minimum for roadways under City of Corvallis jurisdiction. A v/c ratio of 0.80 is the maximum acceptable for roadways under ODOT jurisdiction. The following table summarizes intersection operation deficiencies
TABLE 2 – INTERSECTION OPERATION DEF ICIENCIES
In tersect ion Year Peak Hour Def ic iency
11 t h S t ree t / Je f fe rson Avenue 2014 PM Nor thbound approach exceeds mob i l i t y s tandard due to i nc reases in
t ra f f i c vo lumes and capac i t y cons t ra i n ts 2010 PM 15 t h S t ree t /
Wash ing ton Way 2014 AM/PM Eas tbound approach exceeds mob i l i t y s tandard due to i nc reases in t ra f f i c vo lumes and capac i t y cons t ra i n ts
15 t h S t ree t / Wash ing ton Avenue 2014 AM Wes tbound approach exceeds mob i l i t y s tandard due to capac i t y
cons t ra i n ts 2010 K ings Bou levard /
Monroe Avenue 2014 PM Wes tbound approach exceeds mob i l i t y s tandard due to i nc reases in
t ra f f i c vo lumes and capac i t y cons t ra i n ts 2010 PM 26 t h S t ree t /
US 20 /OR 34 2014 AM/PM In te rsec t ion exceeds mob i l i t y s tandard
2010 30 t h S t ree t / Wes te rn Bou levard 2014
AM Sou thbound approach exceeds mob i l i t y s tandard due to a subs tan t ia l i nc rease i n background t ra f f i c vo lumes l i ke l y due to new deve lopment
30 t h S t ree t / Orchard Avenue 2014 AM Sou thbound approach exceeds mob i l i t y s tandard due to a subs tan t ia l
i nc rease i n background t ra f f i c vo lumes l i ke l y due to new deve lopment 2010 30 t h S t ree t /
Har r i son Bou levard 2014 AM/PM Sou thbound approach exceeds mob i l i t y s tandard due to capac i t y
cons t ra i n ts 2010 PM 35 t h S t ree t /
US 20 /OR 34 2014 AM/PM Sou thbound approach exceeds mob i l i t y s tandard due to capac i t y cons t ra i n ts
2010 35 t h S t ree t / Je f fe rson Avenue 2014
AM Eas tbound approach exceeds mob i l i t y s tandard due to h igh approach vo lumes . Rev iew i nd i ca tes 2010 coun t da ta may be i nco r rec t
2010 35 t h S t ree t / Campus Way 2014 PM Wes tbound approach exceeds mob i l i t y s tandard due to capac i t y
cons t ra i n ts

H:\Projects\210008701\WP\110314 BTM Update Report.doc 6
POTENTIAL INTERSECTIONS FOR FUTURE ANALYSIS
Based on a review of intersection operations and the current model data, a number of intersections should be considered for study/analysis to improve model calibration and to better identify changes in traffic flows resulting from campus development. These intersections include:
TABLE 3 – INTERSECTIONSFOR FUTURE ANALYSIS Study In tersect ion (Nor th -South / |East -West ) Bas is fo r Add ing
Arno ld Way /Jackson Avenue Added fo r Jackson , 35 t h to A rno ld S tudy Area 11 t h S t ree t /Wes te rn Bou levard Modera te to h i gh use i n te rsec t i on , improved mode l ca l i b ra t i on 11 t h S t ree t /Wash ing ton Avenue Modera te to h i gh use i n te rsec t i on , improved mode l ca l i b ra t i on 11 t h S t ree t /Monroe Avenue Modera te to h i gh use i n te rsec t i on , improved mode l ca l i b ra t i on 15 t h S t ree t /A Avenue Add i f de ta i l ed Sec to r G ana l ys i s i s requ i red 16 t h S t ree t /Wes te rn Bou levard Add i f de ta i l ed Sec to r G ana l ys i s i s requ i red S tad ium Avenue Wes t /Wes te rn Bou levard Add i f de ta i l ed Sec to r G ana l ys i s i s requ i red 26 t h S t ree t /S tad ium Avenue Add i f de ta i l ed Sec to r G ana l ys i s i s requ i red 30 t h S t ree t / Je f fe rson Avenue Modera te to h i gh use i n te rsec t i on , improved mode l ca l i b ra t i on 30 t h S t ree t /Campus Way Modera te to h i gh use i n te rsec t i on , improved mode l ca l i b ra t i on 30 t h S t ree t / Jackson Avenue Added fo r Jackson , 35 t h to A rno ld S tudy Area 35 t h S t ree t / Jackson Avenue Added fo r Jackson , 35 t h to A rno ld S tudy Area

H:\Projects\210008701\WP\110314 BTM Update Report.doc 7
III. MITIGATION
Based on the operation analysis, the following intersections require mitigation to operate at acceptable agency mobility standards:
11th Street/Jefferson Avenue 15th Street/Washington Way 15th Street/Washington Avenue Kings Boulevard/Monroe Avenue 26th Street/US 20/OR 34 30th Street/Western Boulevard 30th Street/Orchard Avenue 30th Street/Harrison Boulevard 35th Street/US 20/OR 34 35th Street/Jefferson Avenue 35th Street/Campus Way
MITIGATION DESCRIPTION
Individual intersection mitigation is described as follows:
The 11t h Street/Jefferson Avenue is anticipated to exceed the City mobility standard during the AM peak hour. The following infrastructure improvements are recommended to allow the intersection to operate acceptably:
Convert to All-Way Stop-Control.
The 15t h Street intersections with Washington Way and Washington Avenue are anticipated to exceed the City mobility standard during the AM and PM peak hours. Specifically, the 15t h Street/Washington Way eastbound approach and the 15t h Street/Washington Avenue westbound approach exceed the mobili ty standard. The following infrastructure improvements are recommended to allow the intersection to operate acceptably:
Realign Washington Way and Washington Avenue to create a 4-leg intersection. Previous operation analyses, including the 2006 BTM Update, recommend realigning Washington Way and Washington Avenue. The intersection has some operational deficiencies due to its proximity to the railroad, limited right-of-way (a portion of the Washington Way road is within the railroad right-of-way), limited sight distance for southbound movements, and lack of a designated pedestrian/bike crossing on 15t h Street. To address these deficiencies, realignment of Washington Way continues to be the recommended mitigation.

H:\Projects\210008701\WP\110314 BTM Update Report.doc 8
The Kings Boulevard/Monroe Avenue intersection southbound approach exceeds the City mobility standard primarily due to high left-turn volumes. The intersection did not meet a signal warrant analysis performed for the 2003 OSU study and right-of-way constraints prevent additional intersection improvements. The southbound movements are further hindered by limited visibility caused by on-street parking on the north side of Monroe. The intersection is also in a very high use pedestrian zone. The following mitigation is recommended:
Construct mitigation per the approved Monroe Avenue Improvement Plan.
Improvements identified in the Monroe Avenue Improvement Plan identify construction of enhanced intersection improvements and include delineated pedestrian crossing areas, intersection bulb-outs and clearly delineated travel lanes for bicycles and motor vehicles. The general plan intent is to introduce traffic calming measures and improve safety recognizing there are a significant number of persons using the transportation system via different modes. The 26t h Street/US 20/OR 34 intersection is anticipated to exceed the ODOT mobility standard during the AM and PM peak hours. The City of Corvallis Transportation System Plan recommends the following infrastructure improvements along the US 20/OR 34 corridor:
Widen the roadway to a 4–lane cross section The 30t h Street/Western Boulevard intersection southbound approach exceeds the City mobili ty standard due to a substantial increase in background traffic volumes l ikely due to new development. The following infrastructure improvements are recommended to allow the intersection to operate acceptably:
Construct a new signal The 30t h Street/Orchard Avenue intersection eastbound approach exceeds the City mobili ty standard due to a substantial increase in background traffic volumes l ikely due to new development. The following infrastructure improvements are recommended to allow the intersection to operate acceptably:
Construct new roundabout
Orchard Avenue forms part of the northern campus boundary with Corvallis residential neighborhoods. Orchard Avenue is also located at the northern end of the 30t h Street Couplet which splits immediately south of the intersection. While some higher form of intersection traffic control is necessary to allow the intersection to operate at an acceptable mobility standard, a roundabout is recommended because its design features can be used to establish a campus entrance point and allow for a smooth transition from one-way roadways to a two-way roadway.

H:\Projects\210008701\WP\110314 BTM Update Report.doc 9
The 30t h Street/Harrison Boulevard intersection southbound approach exceeds the City mobility standard. Due to right-of-way constraints, additional turn bays cannot be added at this intersection. Additionally, intersection signalization is restricted by the proximity to the signalized 29t h Street/Harrison Boulevard intersection and would require nonstandard traffic operations. As such, mitigation is not recommended. Because of roadway connectivity, it is anticipated a certain amount of 30t h Street traffic faced with excessive delays will divert to alternate routes and the resulting LOS will improve.
No mitigation recommended The 35t h Street/US 20/OR 34 intersection is anticipated to exceed the ODOT mobility standard during the AM and PM peak hours. The City of Corvallis Transportation System Plan recommends the following infrastructure improvements along the US 20/OR 34 corridor: Widen the roadway to a 4–lane cross section Provide protected left-turns for the north and southbound approaches
The 35t h Street/Jefferson Avenue intersection is anticipated to exceed the City mobility standard during the AM peak hour. Review of the intersection traffic volumes used in the analysis indicates the counts have a significantly different distribution than previous traffic counts. Therefore, intersection reevaluation is recommended prior to mitigation being recommended. If mitigation is necessary, it is recommended a traffic signal be considered.
No mitigation recommended until further evaluation is performed
The 35t h Street/Campus Way intersection is anticipated to exceed the City mobility standard during the PM peak hour. The following infrastructure improvements are recommended to allow the intersection to operate acceptably: Construct a new signal
H:\Projects\210008701\WP\110314 BTM Update Report.doc 10
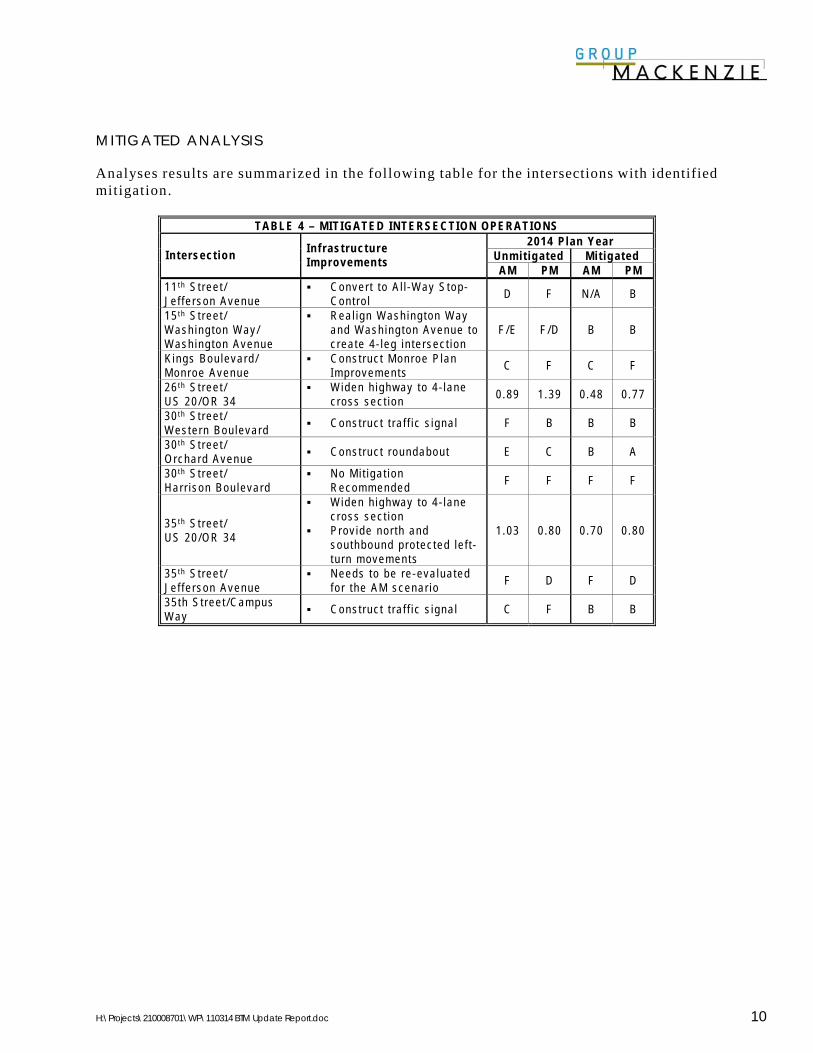
MITIGATED ANALYSIS
Analyses results are summarized in the following table for the intersections with identified mitigation.
TABLE 4 – MIT IGATED INTERSECTION OPERATIONS 2014 P lan Year
Unmi t igated Mi t igated In tersect ion In f rast ructu re Improvements AM PM AM PM
11 t h S t ree t / Je f fe rson Avenue
Conver t to A l l -Way S top-Con t ro l D F N /A B
15 t h S t ree t / Wash ing ton Way / Wash ing ton Avenue
Rea l i gn Wash ing ton Way and Wash ing ton Avenue to c rea te 4 - l eg i n te rsec t i on
F /E F /D B B
K ings Bou levard / Monroe Avenue
Cons t ruc t Monroe P lan Improvements C F C F
26 t h S t ree t / US 20 /OR 34
Widen h ighway to 4 - l ane c ross sec t i on 0 .89 1 .39 0 .48 0 .77
30 t h S t ree t / Wes te rn Bou levard Cons t ruc t t ra f f i c s i gna l F B B B
30 t h S t ree t / Orchard Avenue Cons t ruc t roundabou t E C B A
30 t h S t ree t / Har r i son Bou levard
No Mi t i ga t i on Recommended F F F F
35 t h S t ree t / US 20 /OR 34
Widen h ighway to 4 - l ane c ross sec t i on
Prov ide nor th and sou thbound p ro tec ted l e f t -t u rn movements
1 .03 0 .80 0 .70 0 .80
35 t h S t ree t / Je f fe rson Avenue
Needs to be re -eva lua ted fo r the AM scenar i o F D F D
35 th S t ree t /Campus Way Cons t ruc t t ra f f i c s i gna l C F B B
Appendix 3
OSU Parking Utilization and Neighborhood
Street Parking Study – Fall 2010
OSU PARKING UTILIZATION STUDY AND
NEIGHBORHOOD STREET PARKING
STUDY FALL TERM 2010
FACILITIES SERVICES CAMPUS PLANNING
Facilities Services- Campus Planning February, 2011
2010 OSU PARKING UTILIZATION STUDY
-2-
Table of Contents Overview ............................................................................................................................. 3
Parking Permits ................................................................................................................... 3
Methodologies ..................................................................................................................... 4
Campus Population and Parking Capacity .......................................................................... 4
Parking Facilities ................................................................................................................. 4
Parking System .................................................................................................................... 5
Parking Utilization .............................................................................................................. 6
Parking Occupancy ............................................................................................................. 6
Parking Demand .................................................................................................................. 7
Parking Utilization by Sector .............................................................................................. 7
Future Parking Facilities ..................................................................................................... 8
OSU Campus Parking Utilization Findings ........................................................................ 8
Overview ............................................................................................................................. 9
District Findings ................................................................................................................ 10
Parking Capacity methodology ......................................................................................... 10
Summary: District A Findings ........................................................................................... 10
Summary: District B Findings ........................................................................................... 10
Overall Summary of Districts A and B .............................................................................. 10
District Parking Utilization Strategies ............................................................................... 11
Additional Information/Contacts ....................................................................................... 11
TABLE OF FIGURES Figure 1: Parking Permits by Employee .......................................................................................... 3
Figure 2: 2010 OSU Campus Population ........................................................................................ 4
Figure 3: OSU Parking Capacity and Enrollment Trend.................................................................. 5
Figure 4: Parking Capacity by Lot Type .......................................................................................... 6
Figure 5: Trends for the Neighborhood Parking Utilization ............................................................ 9
TABLE LIST Table 1: Summary of OSU Parking Usage ...................................................................................... 6
Table 2: Peak Time Parking Demand Ratios .................................................................................... 7
Table 3: Summary of Parking Utilization by Sector ........................................................................ 7
Table 4: 2010 Neighborhood District Parking Utilization ............................................................. 10

Facilities Services- Campus Planning February, 2011
2010 OSU PARKING UTILIZATION STUDY
-3-
1. OSU Parking Utilization Study
Oregon State University’s Campus Master Plan (CMP) includes policies for how OSU will address existing and future parking demand. CMP Chapter 7 – Parking Plan requires the planning and construction of new parking facilities if the campus parking utilization rate reaches 85% to 90%. The OSU Parking Utilization Study is intended to provide an analysis of the parking conditions for on-campus parking facilities. (See Attachment A - Parking Survey Overview Map). An annual parking survey is completed for on-campus parking as well as an every 5-year neighborhood parking districts study for two areas adjacent to the OSU boundary.
OVERVIEW OSU’s 2010 campus parking utilization is 74%. This is an increase of 3% between 2009 and 2010. The OSU campus population also increased between 2009 and 2010 by 6.9% (26,609 to 28,591), which may have impacted the utilization rate. There was a decrease of parking capacity of 92 spaces between 2009 and 2010. The decrease in available parking most likely increased the parking utilization.
PARKING PERMITS The number of parking permits issued in 2010 included 3,487 student permits and 2,812 faculty/staff permits for a total of 6,299 permits. There was an increase of 125 parking permits: 26 student (1%) and 99 faculty/staff (4%) for an average increase of 2%.
Figure 1: Parking Permits by Employee
Student permit purchases were 15% of the total student population of 23,761, and faculty/staff permits were 58% of the total faculty and staff population. Over the past 5 years, the number of student parking permits issued has decreased on an average of 3% per year.

Facilities Services- Campus Planning February, 2011
2010 OSU PARKING UTILIZATION STUDY
-4-
METHODOLOGIES The study was conducted during the 4th week of the fall academic term, typically when a university is at its peak capacity. The study period was completed on two (2) separate days: a typical laboratory day (Tuesday, October 19) and a typical lecture day (Wednesday, October 20). A count of parking space vacancies was completed by Transit and Parking Services staff on each day of the survey.
CAMPUS POPULATION AND PARKING CAPACITY To effectively evaluate how OSU is planning for its future parking needs, Figure 2 (2010 OSU Population Breakdown) shows the campus population trend over the past 5 years. The total campus population has increased approximately 16.9% since 2006, with the largest percent increase between 2009 and 2010 of 6.9%.
Figure 2: 2010 OSU Campus Population
PARKING FACILITIES There are two primary parking facilities on campus: a parking structure and parking lots. All lots on campus include permitted, metered, and open (free) parking spaces. OSU has open on-street parking along Jefferson Way, west of 35th Street, and within Sector G on 16th and ‘A’ Streets. During the course of the study period, a large open lot was also used for open parking and is located behind the Valley Softball Stadium and east of the Hilton Garden Inn. (See Attachment A – Study Overview)

Facilities Services- Campus Planning February, 2011
2010 OSU PARKING UTILIZATION STUDY
-5-
PARKING SYSTEM OSU’s parking is supported by purchasing a parking permit. There are pay-lots for short-term parking located in specific areas on campus. Permits are sold by employee and/or vehicular type: faculty/staff, student, emeritus, motorcycle, and visitor. Parking spaces within lots are denoted at the entrances of each lot and are labeled according to their permitted use. Faculty/staff permits can be used in student lots. Special permits are available for OSU service vehicles, as well as vendors and visitors to campus. There are also partial term and daily permits. Figure 3 below shows the comparison of OSU’s parking capacity related to the campus population over the past 5 years.
Figure 3: OSU Parking Capacity and Enrollment Trend
Parking capacity was reduced by 92 spaces, and parking capacity has decreased since 2008, mostly in Sector C due to construction in parking lots. Parking displacement in Sector C must be constructed elsewhere on the main campus at a 1-1 ratio.1 Therefore, new parking lots will be constructed at the southwest intersection of Campus Way and 35th Street in 2011 to replace the parking spaces removed to construct the Hallie Ford Center and the Outdoor Recreation Field Project. To mitigate the loss of parking for the Linus Pauling Center, two parking lots were constructed at the intersection of 11th and Washington Way and were completed just after this study was completed. With the construction of these lots, it is anticipated the utilization will slightly decrease.
1 CMP Chapter 5(d. Parking) page 5-6.

Facilities Services- Campus Planning February, 2011
2010 OSU PARKING UTILIZATION STUDY
-6-
PARKING UTILIZATION OSU’s parking utilization is at 74% during peak hours. Parking utilization is calculated as the ratio of occupied spaces to the total parking spaces. A 90% utilization rate requires OSU to construct new parking facilities. (See Attachment C - Campus Survey Results Map
Figure 4: Parking Capacity by Lot Type
PARKING OCCUPANCY Parking occupancy slightly decreased between 2009 and 2010. Figure 3 (OSU Parking Capacity and Enrollment Trends) and Table 1 (Summary of Parking Usage on Campus) show the comparison of parking utilization for the last five years. The decrease may have been affected by an increase in parking permits in 2009. OSU completed a bicycle utilization study during the parking study and there were significant increases in bicycle utilization. This may have influence the decreased parking utilization as more people may be riding their bicycles to campus.
Table 1: Summary of OSU Parking Usage

Facilities Services- Campus Planning February, 2011
2010 OSU PARKING UTILIZATION STUDY
-7-
PARKING DEMAND Parking demand is defined by parking lot utilization or by the sale of campus parking permits (from September 1st through October 8th). OSU uses parking demand ratios to project future demand in conjunction with parking lot utilization. The parking demand ratio is calculated by either the ratio of permitted vehicles to campus population or the ratio of vehicles parked to campus population. Table 2 (OSU Peak Time Parking Demand Ratios) below shows the total number of parking permits by two categories: 1) faculty/staff; and 2) student. Sixteen (16%) percent of the total campus population park on campus, and 74% of the population purchase parking permits. Compared with 2009, the number of permits purchased increased by 125 permits (26 Students and 99 Faculty/Staff) or 3.9%.
Table 2: Peak Time Parking Demand Ratios
PARKING UTILIZATION BY SECTOR The OSU Campus Master Plan divides the campus into nine (9) sectors, each with its own development allocation and parking lots. Table 3 (Summary of Parking Usage by Sector) shows parking demand and utilization by each sector. Attachment B - Parking Capacity by Campus Sector Map reflects the parking capacity by sector.
Table 3: Summary of Parking Utilization by Sector
On a sector by sector basis Sectors F and H maintain the lowest utilization. Sector F (parking around Reser Stadium) has three (3) large lots and is utilized less than 40%. This is due to the change in 2006 from open parking to a permitted lot. Sector H low utilization is quite low, but also does not have a significant amount of parking capacity (46 spaces), and is mainly used for athletic events. At various times, there is a gravel lot that has been used previously for open parking, however, it is not patrolled by TAPS and so isn’t included

Facilities Services- Campus Planning February, 2011
2010 OSU PARKING UTILIZATION STUDY
-8-
in the parking study. Sector G has shown low utilization which is where the parking garage is located. Its utilization increased 1% between 2009 and 2010.
FUTURE PARKING FACILITIES Future parking facilities are planned according to the policies set forth in the Campus Master Plan. As stated earlier, parking capacity decreased by 92 spaces. To mitigate the displacement of the parking, new facilities will be constructed at the intersection of SW Campus Way and 35th Street. A new parking lot is being constructed north of the OSU INTO building and will be designated open/public parking to replace the parking removed along 17th and ‘A’ streets. Additional parking will be added to parking lot south of Bloss Hall.
OSU CAMPUS PARKING UTILIZATION FINDINGS The parking utilization rate increased 3% between 2009 and 2010, from 71% to 74%. Over
the past five years, the utilization is on average 73%. Parking capacity decreased by 92 spaces. The 5-year trend shows that parking capacity has
decreased by 6.9% over the past five (5) years. Parking demand is lowest in the student population where only 15% of the students
purchase parking permits. Conversely, 58% of the faculty and staff population purchase parking permits.
Sector F has three (3) large lots totaling 1142 parking spaces that are being utilized at an average of 40%. This is up slightly from the past three years, where utilization was an average of 33%.
Sector H has a large open parking lot that is not patrolled by TAPS therefore its utilization is not included in the study. Other lot utilization is less than 25%. This is an interesting data point because there is a shuttle stop in this location.

Facilities Services- Campus Planning February, 2011
2010 OSU PARKING UTILIZATION STUDY
-9-
2. Neighborhood Parking Utilization Study
OVERVIEW OSU completes a neighborhood utilization study every five years. From 2003 until 2007, OSU completed an annual neighborhood study; however in 2007, the City of Corvallis and OSU agreed to complete a neighborhood study every five years. To have the study fall within an established 5-year timeframe that will work well with the Campus Master Plan update, a 2010 study was completed. The 2010 Neighborhood Street Parking Study was completed during the same days as the OSU Main Campus Parking Study (October 19 and October 20). The hours for the survey began on the hour from 9:00 AM to 1:00 PM for both the College Hill (District A) and North College Hill (District B), north and west of the OSU main campus. The survey was completed by Facilities Services. A graphical representation of the results for 2007 and 2010 is indicated below in Figure 5 – Trends for Neighborhood Parking Utilization.
Figure 5: Trends for the Neighborhood Parking Utilization

Facilities Services- Campus Planning February, 2011
2010 OSU PARKING UTILIZATION STUDY
-10-
DISTRICT FINDINGS The College Hill (District A) parking district is bounded between 27th and 32nd Streets east/west and between Van Buren and Orchard Avenue north/south. The North College Hill (District B) district is bounded between 14th and 24th Street east/west and between Harrison Blvd. and Monroe Avenue north/south. The overall street parking utilization by time period for this survey is indicated below in Table 4 below.
Table 4: 2010 Neighborhood District Parking Utilization
PARKING CAPACITY METHODOLOGY Street capacity was determined using City of Corvallis parking space standards of 22' x 18' for contiguous parking and 18' x 8' for single parking. Because streets are unmarked more compact vehicles can fit into a series of unmarked spaces than is indicative of capacity. This could affect the overall utilization.
SUMMARY: DISTRICT A FINDINGS District A has an overall average utilization rate of 70%. This is a 2% DECREASE from the survey completed in 2007. Streets nearer to the campus boundary (See Attachment A - Parking Survey Overview Map) reflect higher utilization than parking further away. Utilization is lowest from 9AM to 10AM, and stays relative constant the rest of the survey period. In 2007, the number cars with OSU permits were minimal; however, the 2010 study shows an increase. Eight (8) cars with current OSU permits were parked in District A. (See Attachments D and F.)
SUMMARY: DISTRICT B FINDINGS District B has an overall average utilization rate of 86%. This is a 12% DECREASE from the 2007 survey. Utilization is highest between 9AM and 11AM, and decreases from 11AM to Noon. Utilization increases 5% over the noon hour. Nine (9) cars with current OSU permits were parked in District B. (See Attachments E and G.)
OVERALL SUMMARY OF DISTRICTS A AND B Together the neighborhood districts north of the campus show a 78% overall parking utilization rate. The 2007 average utilization rate was 96%. This is an 8% decrease from 2007.

Facilities Services- Campus Planning February, 2011
2010 OSU PARKING UTILIZATION STUDY
-11-
DISTRICT PARKING UTILIZATION STRATEGIES Strategies that may be considered to improve parking both at OSU and in the residential districts include but are not limited to the following:
Analysis of the parking study shows that more cars are parked on streets than what is available (based on 22’ x 8’ standard contiguous parking spaces and 18' x 8' single parking spaces). Parking on streets where parking is over 100% of capacity (“hot spots”) may be reduced if parking enforcement were available in each neighborhood district during peak times to help change parking behaviors.
The City of Corvallis does not stripe parking spaces in the neighborhoods; therefore this
may result in haphazard parking which the study refers to as a “hotspot.”
OSU will complete a Neighborhood Parking District Study fall term of 2015 in conjunction with the OSU parking study to identify potential strategies to establish and maintain acceptable parking utilization rates within neighborhood parking districts around the campus boundary.
ADDITIONAL INFORMATION/CONTACTS For additional information and or questions concerning this report contact the following. Patty Katz, Campus Planning Manager, 541-737-0917, [email protected] Attachments Attachment A - Parking Survey Overview Map Attachment B - Parking Capacity by Campus Sector Map Attachment C - Campus Survey Results Map Printed: 4. February 2011 at 04:20 PM

OSU Campus Parking Utilization SurveySurvey Dates:Tuesday, October 19 2010 to Wednesday, October 20 2010
Veh/Cap % Cap Veh/Cap % Cap Veh/Cap % Cap Veh/Cap % Cap Veh/Cap % CapStudent Faculty ADA Other Total
Results Aggregated CampuswideCampus Wide 2,897/4,273 68% 1,757/1,864 94% 96/258 37% 912/1,230 74% 5,661/7,625 74%
Results Aggregated by SectorSector A 0/0 0/0 0/2 0% 116/128 91% 116/130 89%
Sector B 353/427 83% 340/372 91% 8/21 38% 101/130 77% 801/950 84%
Sector C 513/516 99% 1,032/1,054 98% 65/109 59% 481/614 78% 2,090/2,293 91%
Sector D 810/898 90% 194/204 95% 1/11 9% 70/104 67% 1,075/1,217 88%
Sector E 87/124 70% 0/0 1/4 25% 71/98 72% 159/226 70%
Sector F 354/1,142 31% 103/137 75% 8/61 12% 36/57 63% 500/1,397 36%
Sector G 781/1,166 67% 89/97 92% 10/44 23% 32/59 53% 912/1,366 67%
Sector H 0/0 0/0 4/6 67% 6/40 15% 10/46 22%
Results Aggregated by Sector & Survey DateSector A (Tue, Oct 19 2010) 0/0 0/0 0/2 0% 115/128 90% 115/130 88%
Sector A (Wed, Oct 20 2010) 0/0 0/0 0/2 0% 117/128 91% 117/130 90%
Sector B (Tue, Oct 19 2010) 352/427 82% 328/372 88% 9/21 43% 85/130 65% 774/950 81%
Sector B (Wed, Oct 20 2010) 354/427 83% 351/372 94% 7/21 33% 116/130 89% 828/950 87%
Sector C (Tue, Oct 19 2010) 515/516 100% 1,037/1,054 98% 67/109 61% 491/614 80% 2,110/2,293 92%
Sector C (Wed, Oct 20 2010) 510/516 99% 1,027/1,054 97% 62/109 57% 470/614 77% 2,069/2,293 90%
Sector D (Tue, Oct 19 2010) 787/898 88% 197/204 97% 1/11 9% 69/104 66% 1,054/1,217 87%
Sector D (Wed, Oct 20 2010) 833/898 93% 190/204 93% 1/11 9% 71/104 68% 1,095/1,217 90%
Sector E (Tue, Oct 19 2010) 89/124 72% 0/0 1/4 25% 63/98 64% 153/226 68%
Sector E (Wed, Oct 20 2010) 85/124 69% 0/0 1/4 25% 79/98 81% 165/226 73%
Sector F (Tue, Oct 19 2010) 354/1,142 31% 100/137 73% 9/61 15% 37/57 65% 500/1,397 36%
Sector F (Wed, Oct 20 2010) 353/1,142 31% 105/137 77% 6/61 10% 35/57 61% 499/1,397 36%
Sector G (Tue, Oct 19 2010) 841/1,166 72% 87/97 90% 13/44 30% 35/59 59% 976/1,366 71%
Sector G (Wed, Oct 20 2010) 721/1,166 62% 91/97 94% 7/44 16% 28/59 47% 847/1,366 62%
Sector H (Tue, Oct 19 2010) 0/0 0/0 4/6 67% 6/40 15% 10/46 22%
Sector H (Wed, Oct 20 2010) 0/0 0/0 4/6 67% 6/40 15% 10/46 22%
Survey Details
Printed: 04-Feb-2011 at 04:09 pm Page 1 of 6

Veh/Cap % Cap Veh/Cap % Cap Veh/Cap % Cap Veh/Cap % Cap Veh/Cap % CapStudent Faculty ADA Other Total
A- HWRL Lot (#3371)- W Of 35th & Jefferson (N Of Hwrl - Bldg #0137) {19Oct10 0/0 0/0 0/2 0% 10/18 56% 10/20 50%
A- HWRL Lot (#3371)- W Of 35th & Jefferson (N Of Hwrl - Bldg #0137) {20Oct10 0/0 0/0 0/2 0% 11/18 61% 11/20 55%
A- Jeff Way W of 35 (#3372)- N & S Side Of Jefferson (Way - W Of 35th & Jeff) { 0/0 0/0 0/0 105/110 95% 105/110 95%
A- Jeff Way W of 35 (#3372)- N & S Side Of Jefferson (Way - W Of 35th & Jeff) { 0/0 0/0 0/0 106/110 96% 106/110 96%
B- CW W Greenhouse (#3320)- W Of West GreenhouSE (3200 Block Of Campus 5/6 83% 0/0 1/1 100% 3/7 43% 9/14 64%
B- CW W Greenhouse (#3320)- W Of West GreenhouSE (3200 Block Of Campus 4/6 67% 0/0 1/1 100% 2/7 29% 7/14 50%
B- CW W Greenhouse (#3332)- W & SW & S Of Crop (Science Bldg #0080) {19Oc 170/170 100% 110/111 99% 2/3 67% 3/5 60% 285/289 99%
B- CW W Greenhouse (#3332)- W & SW & S Of Crop (Science Bldg #0080) {20Oc 170/170 100% 111/111 100% 0/3 0% 5/5 100% 286/289 99%
B- CW W Mopl Lot (#3333)- West Of Motor Pool Lot (N & NE & E Of EHSA) {19 92/160 58% 63/84 75% 2/3 67% 3/5 60% 160/252 63%
B- CW W Mopl Lot (#3333)- West Of Motor Pool Lot (N & NE & E Of EHSA) {20 99/160 62% 75/84 89% 2/3 67% 4/5 80% 180/252 71%
B- CW Wgnd (#3330)- W & N Of Weigand Hall {19Oct10} 0/0 26/26 100% 0/2 0% 0/0 26/28 93%
B- CW Wgnd (#3330)- W & N Of Weigand Hall {20Oct10} 0/0 26/26 100% 0/2 0% 0/0 26/28 93%
B- Jeff Rad Lot (#3331)- E Of Radiation Center {19Oct10} 24/30 80% 19/23 83% 1/3 33% 1/3 33% 45/59 76%
B- Jeff Rad Lot (#3331)- E Of Radiation Center {20Oct10} 20/30 67% 12/23 52% 1/3 33% 1/3 33% 34/59 58%
B- Orchard Ct Lot (#3322)- Orchard Family Village (Apartment Complex Lot) {19 0/0 0/0 0/2 0% 71/95 75% 71/97 73%
B- Orchard Ct Lot (#3322)- Orchard Family Village (Apartment Complex Lot) {20 0/0 0/0 0/2 0% 95/95 100% 95/97 98%
B- Richardson Lot (#3341)- W & S Of Dryden Hall (S Of Peavy Hall) {19Oct10} 61/61 100% 102/115 89% 3/7 43% 3/11 27% 169/194 87%
B- Richardson Lot (#3341)- W & S Of Dryden Hall (S Of Peavy Hall) {20Oct10} 61/61 100% 115/115 100% 3/7 43% 7/11 64% 186/194 96%
B- Vet Research Lot (#3342)- S Of Vet Research Lab (S Of Building #0154) {19Oct 0/0 8/13 62% 0/0 1/4 25% 9/17 53%
B- Vet Research Lot (#3342)- S Of Vet Research Lab (S Of Building #0154) {20Oct 0/0 12/13 92% 0/0 2/4 50% 14/17 82%
C- 16th N Lot (#3223)- College Inn Parking (SW Of 16th & Jackson) {19Oct10} 0/0 0/0 5/5 100% 169/184 92% 174/189 92%
C- 16th N Lot (#3223)- College Inn Parking (SW Of 16th & Jackson) {20Oct10} 0/0 0/0 4/5 80% 161/184 88% 165/189 87%
C- 26th N (#3260)- 26th that is North of Jefferson Way and South of Monroe Ave { 0/0 3/4 75% 1/3 33% 15/17 88% 19/24 79%
C- 26th N (#3260)- 26th that is North of Jefferson Way and South of Monroe Ave { 0/0 0/4 0% 0/3 0% 17/17 100% 17/24 71%
C- 26th S (#3300)- 26th St & Dixon Rec Cent. {19Oct10} 18/18 100% 0/0 1/2 50% 14/37 38% 33/57 58%
C- 26th S (#3300)- 26th St & Dixon Rec Cent. {20Oct10} 18/18 100% 0/0 1/2 50% 18/37 49% 37/57 65%
C- 27th Lot (#3311)- N Of Burt Hall (SW Of Jackson & 27th St.) {19Oct10} 0/0 102/103 99% 0/4 0% 0/0 102/107 95%
C- 27th Lot (#3311)- N Of Burt Hall (SW Of Jackson & 27th St.) {20Oct10} 0/0 100/103 97% 0/4 0% 0/0 100/107 93%
C- 30th Meter (#3295)- W Of West Hall (Metered Spaces On 30th) {19Oct10} 0/0 0/0 2/2 100% 5/7 71% 7/9 78%
C- 30th Meter (#3295)- W Of West Hall (Metered Spaces On 30th) {20Oct10} 0/0 0/0 1/2 50% 5/7 71% 6/9 67%
C- Bates S Lot (#3314)- S Of Bates Hall (NW Of 26th & Campus Way) {19Oct10} 0/0 41/41 100% 1/1 100% 0/0 42/42 100%
C- Bates S Lot (#3314)- S Of Bates Hall (NW Of 26th & Campus Way) {20Oct10} 0/0 41/41 100% 1/1 100% 0/0 42/42 100%
C- BE (#3241)- Pioneer Place (NW Of Benton Hall) {19Oct10} 0/0 31/32 97% 2/2 100% 3/5 60% 36/39 92%
C- BE (#3241)- Pioneer Place (NW Of Benton Hall) {20Oct10} 0/0 32/32 100% 2/2 100% 3/5 60% 37/39 95%
C- Benton (#3268)- Along Benton Place (Between Jefferson & Wash.) {19Oct10} 0/0 85/85 100% 0/0 13/13 100% 98/98 100%
Printed: 04-Feb-2011 at 04:09 pm Page 2 of 6

Veh/Cap % Cap Veh/Cap % Cap Veh/Cap % Cap Veh/Cap % Cap Veh/Cap % CapStudent Faculty ADA Other Total
C- Benton (#3268)- Along Benton Place (Between Jefferson & Wash.) {20Oct10} 0/0 83/85 98% 0/0 10/13 77% 93/98 95%
C- Benton Lot (#3261)- W Of Colemand Field (NW Benton Pl & Washington) {19O 60/61 98% 55/57 96% 0/0 2/2 100% 117/120 98%
C- Benton Lot (#3261)- W Of Colemand Field (NW Benton Pl & Washington) {20O 59/61 97% 56/57 98% 0/0 1/2 50% 116/120 97%
C- CC Campus Way (#3231)- Spaces along Campus Way between 14th & 26th {19 0/0 0/0 0/0 8/11 73% 8/11 73%
C- CC Campus Way (#3231)- Spaces along Campus Way between 14th & 26th {20 0/0 0/0 0/0 8/11 73% 8/11 73%
C- CC Jefferson Way (#3253)- Spaces along Jefferson Way between 26th & 15th {1 0/0 0/0 0/0 12/15 80% 12/15 80%
C- CC Jefferson Way (#3253)- Spaces along Jefferson Way between 26th & 15th {2 0/0 0/0 0/0 13/15 87% 13/15 87%
C- CC Mem Lot (#3252)- NW Of Strand Ag Hall (Dead End Of Memorial Pl.) {19O 0/0 0/0 4/7 57% 9/10 90% 13/17 76%
C- CC Mem Lot (#3252)- NW Of Strand Ag Hall (Dead End Of Memorial Pl.) {20O 0/0 0/0 2/7 29% 9/10 90% 11/17 65%
C- CC Meter Lot (#3251)- E Of MU Bookstore (S Of Strand Ag Hall) {19Oct10} 0/0 0/0 3/5 60% 68/79 86% 71/84 85%
C- CC Meter Lot (#3251)- E Of MU Bookstore (S Of Strand Ag Hall) {20Oct10} 0/0 0/0 1/5 20% 60/79 76% 61/84 73%
C- Cordley W Lot (#3315)- W Ofcordley Hall {19Oct10} 0/0 15/15 100% 5/6 83% 2/5 40% 22/26 85%
C- Cordley W Lot (#3315)- W Ofcordley Hall {20Oct10} 0/0 14/15 93% 4/6 67% 4/5 80% 22/26 85%
C- Ed Hall (#3250)- West & SW Of Ed Hall {19Oct10} 0/0 0/0 4/4 100% 10/10 100% 14/14 100%
C- Ed Hall (#3250)- West & SW Of Ed Hall {20Oct10} 0/0 0/0 4/4 100% 10/10 100% 14/14 100%
C- Fairbanks Lot (#3301)- Jefferson Way W of Fairbanks {19Oct10} 0/0 23/23 100% 2/2 100% 1/2 50% 26/27 96%
C- Fairbanks Lot (#3301)- Jefferson Way W of Fairbanks {20Oct10} 0/0 23/23 100% 1/2 50% 0/2 0% 24/27 89%
C- Intramural Lot (#3294)- S Of West Hall (NW 30th & Intermural Way) {19Oct10 0/0 13/13 100% 0/0 0/0 13/13 100%
C- Intramural Lot (#3294)- S Of West Hall (NW 30th & Intermural Way) {20Oct10 0/0 13/13 100% 0/0 0/0 13/13 100%
C- Jeff Way W (#3302)- N Side Of Jefferson Way (Between 26th & 30th) {19Oct10 52/52 100% 36/36 100% 2/4 50% 12/14 86% 102/106 96%
C- Jeff Way W (#3302)- N Side Of Jefferson Way (Between 26th & 30th) {20Oct10 51/52 98% 36/36 100% 2/4 50% 8/14 57% 97/106 92%
C- Kerr 15th Lot (#3262)- S Of Kerr Admin Bldg (W Of 15th & Adams) {19Oct10} 0/0 35/36 97% 1/4 25% 25/29 86% 61/69 88%
C- Kerr 15th Lot (#3262)- S Of Kerr Admin Bldg (W Of 15th & Adams) {20Oct10} 0/0 36/36 100% 2/4 50% 19/29 66% 57/69 83%
C- Kerr Jeff Lot (#3263)- W Of Kerr Admin Bldg (SE Of Jefferson & Benton) {19O 0/0 17/17 100% 5/7 71% 11/13 85% 33/37 89%
C- Kerr Jeff Lot (#3263)- W Of Kerr Admin Bldg (SE Of Jefferson & Benton) {20O 0/0 17/17 100% 4/7 57% 8/13 62% 29/37 78%
C- Langton Pl (#3254)- Spaces along Langton Pl west of Waldo & North of Goss {1 0/0 0/0 0/0 3/5 60% 3/5 60%
C- Langton Pl (#3254)- Spaces along Langton Pl west of Waldo & North of Goss {2 0/0 0/0 0/0 2/5 40% 2/5 40%
C- Memorial (#3230)- Memorial Place - Between (Campus Way & Monroe) {19Oct 0/0 3/3 100% 0/0 7/15 47% 10/18 56%
C- Memorial (#3230)- Memorial Place - Between (Campus Way & Monroe) {20Oct 0/0 3/3 100% 0/0 5/15 33% 8/18 44%
C- Monroe 16th Lot (#3221)- Behind Graf Hall & (Batcheller & Covell) {19Oct10} 0/0 44/45 98% 0/2 0% 5/13 38% 49/60 82%
C- Monroe 16th Lot (#3221)- Behind Graf Hall & (Batcheller & Covell) {20Oct10} 0/0 45/45 100% 0/2 0% 10/13 77% 55/60 92%
C- Monroe Wngr Lot (#3222)- Between Weniger & Gilbert {19Oct10} 0/0 28/29 97% 4/5 80% 5/8 63% 37/42 88%
C- Monroe Wngr Lot (#3222)- Between Weniger & Gilbert {20Oct10} 0/0 28/29 97% 4/5 80% 6/8 75% 38/42 90%
C- Moreland Lot (#3264)- SW Of Moreland Hall & (S Of Native Amer LnghouSE) 0/0 8/8 100% 2/2 100% 2/4 50% 12/14 86%
C- Moreland Lot (#3264)- SW Of Moreland Hall & (S Of Native Amer LnghouSE) 0/0 7/8 88% 2/2 100% 3/4 75% 12/14 86%
Printed: 04-Feb-2011 at 04:09 pm Page 3 of 6

Veh/Cap % Cap Veh/Cap % Cap Veh/Cap % Cap Veh/Cap % Cap Veh/Cap % CapStudent Faculty ADA Other Total
C- Orchard Ave (#3309)- Spaces along Orchard Ave between 27th & 30th {19Oct10 0/0 13/14 93% 0/0 31/31 100% 44/45 98%
C- Orchard Ave (#3309)- Spaces along Orchard Ave between 27th & 30th {20Oct10 0/0 12/14 86% 0/0 30/31 97% 42/45 93%
C- Orchard N Lot (#3317)- North Off Orchard St (2800 Block Of Orchard Ave) {19 169/169 100% 0/0 0/0 0/0 169/169 100%
C- Orchard N Lot (#3317)- North Off Orchard St (2800 Block Of Orchard Ave) {20 167/169 99% 0/0 0/0 0/0 167/169 99%
C- Orchard S Lot (#3316)- S Off Orchard Ave (2800 Block Of Orchard Ave) {19Oc 79/79 100% 64/68 94% 0/0 1/2 50% 144/149 97%
C- Orchard S Lot (#3316)- S Off Orchard Ave (2800 Block Of Orchard Ave) {20Oc 78/79 99% 61/68 90% 0/0 1/2 50% 140/149 94%
C- Park Terr (#3240)- Street Parking On (Park Terrace) {19Oct10} 0/0 0/0 0/0 2/2 100% 2/2 100%
C- Park Terr (#3240)- Street Parking On (Park Terrace) {20Oct10} 0/0 0/0 0/0 1/2 50% 1/2 50%
C- Park Terr E Lot (#3233)- SE Of Monroe & (Park Terrace) {19Oct10} 0/0 119/119 100% 2/3 67% 8/11 73% 129/133 97%
C- Park Terr E Lot (#3233)- SE Of Monroe & (Park Terrace) {20Oct10} 0/0 117/119 98% 2/3 67% 5/11 45% 124/133 93%
C- Park Terr W Lot (#3234)- SW Of Monroe & Park Terra (South Of Coas Bldg) {1 0/0 165/167 99% 5/8 63% 2/6 33% 172/181 95%
C- Park Terr W Lot (#3234)- SW Of Monroe & Park Terra (South Of Coas Bldg) {2 0/0 166/167 99% 5/8 63% 3/6 50% 174/181 96%
C- Pioneer S (#3242)- SW Of Benton Hall (SE Of MilNE Computer Cent) {19Oct10 0/0 8/8 100% 2/8 25% 6/9 67% 16/25 64%
C- Pioneer S (#3242)- SW Of Benton Hall (SE Of MilNE Computer Cent) {20Oct10 0/0 7/8 88% 3/8 38% 7/9 78% 17/25 68%
C- Pioneer W (#3243)- W Of Milne Computer Ctr (Street Parking) {19Oct10} 0/0 1/2 50% 0/0 1/3 33% 2/5 40%
C- Pioneer W (#3243)- W Of Milne Computer Ctr (Street Parking) {20Oct10} 0/0 2/2 100% 0/0 0/3 0% 2/5 40%
C- ROTC Lot (#3265)- W Of Navy ROTC Bldg {19Oct10} 0/0 12/12 100% 0/0 0/2 0% 12/14 86%
C- ROTC Lot (#3265)- W Of Navy ROTC Bldg {20Oct10} 0/0 11/12 92% 0/0 2/2 100% 13/14 93%
C- ROTC N (#3269)- E Of Dixon Rec Center (N Of Navy ROTC) {19Oct10} 0/0 0/0 4/4 100% 4/4 100% 8/8 100%
C- ROTC N (#3269)- E Of Dixon Rec Center (N Of Navy ROTC) {20Oct10} 0/0 0/0 3/4 75% 1/4 25% 4/8 50%
C- Sackett Lot (#3303)- N Of Sackett Hall (SE Of 30th & Campus Way) {19Oct10} 0/0 0/0 1/4 25% 16/19 84% 17/23 74%
C- Sackett Lot (#3303)- N Of Sackett Hall (SE Of 30th & Campus Way) {20Oct10} 0/0 0/0 0/4 0% 15/19 79% 15/23 65%
C- Sackett Meter (#3292)- NE Of West Dining Hall (W Of Hawley Hall) {19Oct10} 0/0 0/0 1/1 100% 6/7 86% 7/8 88%
C- Sackett Meter (#3292)- NE Of West Dining Hall (W Of Hawley Hall) {20Oct10} 0/0 0/0 1/1 100% 6/7 86% 7/8 88%
C- Waldo Lot (#3266)- E & S Of Waldo Hall (And W Of Snell Hall) {19Oct10} 0/0 2/2 100% 4/5 80% 2/5 40% 8/12 67%
C- Waldo Lot (#3266)- E & S Of Waldo Hall (And W Of Snell Hall) {20Oct10} 0/0 2/2 100% 4/5 80% 4/5 80% 10/12 83%
C- Washington Way Lot (#3293)- Spaces S Of Tennis Courts (Lot W Of Tennis Pav 137/137 100% 10/10 100% 1/1 100% 0/0 148/148 100%
C- Washington Way Lot (#3293)- Spaces S Of Tennis Courts (Lot W Of Tennis Pav 137/137 100% 10/10 100% 1/1 100% 0/0 148/148 100%
C- Weatherford (#3291)- SW Of Weatherford (E Of Poling Hall) {19Oct10} 0/0 0/0 1/2 50% 3/3 100% 4/5 80%
C- Weatherford (#3291)- SW Of Weatherford (E Of Poling Hall) {20Oct10} 0/0 0/0 2/2 100% 3/3 100% 5/5 100%
C- Womens Bldg Lot (#3310)- W & NW Of Womens Bldg (S Of Hovland & Gilmor 0/0 104/105 99% 2/6 33% 8/12 67% 114/123 93%
C- Womens Bldg Lot (#3310)- W & NW Of Womens Bldg (S Of Hovland & Gilmor 0/0 105/105 100% 6/6 100% 12/12 100% 123/123 100%
D- 11th N (#3215)- Between {19Oct10} 0/0 0/0 1/1 100% 19/19 100% 20/20 100%
D- 11th N (#3215)- Between {20Oct10} 0/0 0/0 1/1 100% 18/19 95% 19/20 95%
D- 13th (#3218)- 13th Street Between (Adams & Washington) {19Oct10} 18/30 60% 0/0 0/0 0/0 18/30 60%
Printed: 04-Feb-2011 at 04:09 pm Page 4 of 6

Veh/Cap % Cap Veh/Cap % Cap Veh/Cap % Cap Veh/Cap % Cap Veh/Cap % CapStudent Faculty ADA Other Total
D- 13th (#3218)- 13th Street Between (Adams & Washington) {20Oct10} 27/30 90% 0/0 0/0 0/0 27/30 90%
D- 14th (#3220)- 14th Street Between (Adams & Washington) {19Oct10} 29/29 100% 0/0 0/0 0/0 29/29 100%
D- 14th (#3220)- 14th Street Between (Adams & Washington) {20Oct10} 28/29 97% 0/0 0/0 0/0 28/29 97%
D- Adams (#3217)- Adams Ave. Between (11th St & 15th St.) {19Oct10} 27/27 100% 0/0 0/2 0% 2/3 67% 29/32 91%
D- Adams (#3217)- Adams Ave. Between (11th St & 15th St.) {20Oct10} 27/27 100% 0/0 0/2 0% 2/3 67% 29/32 91%
D- Adams Ave N Lot (#3204)- East Of Wilson Hall (1200 Block Of Adams Ave.) {1 0/0 21/22 95% 0/0 1/1 100% 22/23 96%
D- Adams Ave N Lot (#3204)- East Of Wilson Hall (1200 Block Of Adams Ave.) {2 0/0 22/22 100% 0/0 1/1 100% 23/23 100%
D- Adams Ave NE Lot (#3205)- Jefferson & 11th St {19Oct10} 76/77 99% 0/0 0/5 0% 0/0 76/82 93%
D- Adams Ave NE Lot (#3205)- Jefferson & 11th St {20Oct10} 76/77 99% 0/0 0/5 0% 0/0 76/82 93%
D- Adams Ave S Lot (#3207)- North Of Child Care Ctr. (11th St & Adams Ave.) {1 0/0 21/25 84% 0/1 0% 1/9 11% 22/35 63%
D- Adams Ave S Lot (#3207)- North Of Child Care Ctr. (11th St & Adams Ave.) {2 0/0 22/25 88% 0/1 0% 1/9 11% 23/35 66%
D- CW E (#3211)- Both Sides Of Campus Way (Between 11th And 14th) {19Oct10 88/88 100% 22/22 100% 0/0 4/4 100% 114/114 100%
D- CW E (#3211)- Both Sides Of Campus Way (Between 11th And 14th) {20Oct10 88/88 100% 21/22 95% 0/0 4/4 100% 113/114 99%
D- Jeff McNary Meter Lot (#3206)- North Of Callahan (1400 Block Of Jefferson) { 0/0 0/0 0/2 0% 2/12 17% 2/14 14%
D- Jeff McNary Meter Lot (#3206)- North Of Callahan (1400 Block Of Jefferson) { 0/0 0/0 0/2 0% 1/12 8% 1/14 7%
D- Jeff Way E 34/35 97% 41/41 100% 0/0 9/20 45% 84/96 88%
D- Jeff Way E 34/35 97% 39/41 95% 0/0 13/20 65% 86/96 90%
D- Madison Ave (#3214)- Madison Ave Between (9th St. And 11th St.) {19Oct10} 0/0 0/0 0/0 31/33 94% 31/33 94%
D- Madison Ave (#3214)- Madison Ave Between (9th St. And 11th St.) {20Oct10} 0/0 0/0 0/0 30/33 91% 30/33 91%
D- Washington (#3219)- Washington Ave. (Between 13th & 15th) {19Oct10} 7/7 100% 0/0 0/0 0/3 0% 7/10 70%
D- Washington (#3219)- Washington Ave. (Between 13th & 15th) {20Oct10} 7/7 100% 0/0 0/0 1/3 33% 8/10 80%
D- Washington NE Lot (#3203)- Adams Ave & 14th St {19Oct10} 190/196 97% 0/0 0/0 0/0 190/196 97%
D- Washington NE Lot (#3203)- Adams Ave & 14th St {20Oct10} 193/196 98% 0/0 0/0 0/0 193/196 98%
D- Washington NW Lot (#3202)- 15th & Adams Ave {19Oct10} 92/93 99% 92/94 98% 0/0 0/0 184/187 98%
D- Washington NW Lot (#3202)- 15th & Adams Ave {20Oct10} 90/93 97% 86/94 91% 0/0 0/0 176/187 94%
D- Washington SE Lot (#3209)- 11th And Washington {19Oct10} 18/102 18% 0/0 0/0 0/0 18/102 18%
D- Washington SE Lot (#3209)- 11th And Washington {20Oct10} 69/102 68% 0/0 0/0 0/0 69/102 68%
D- Washington SW Lot (#3201)- Washington & 15th Street {19Oct10} 208/214 97% 0/0 0/0 0/0 208/214 97%
D- Washington SW Lot (#3201)- Washington & 15th Street {20Oct10} 194/214 91% 0/0 0/0 0/0 194/214 91%
E- House Svc Lot (#3351)- Housing Warehouse (Surrounds Bldg # 0097) {19Oct10 3/3 100% 0/0 1/1 100% 27/47 57% 31/51 61%
E- House Svc Lot (#3351)- Housing Warehouse (Surrounds Bldg # 0097) {20Oct10 3/3 100% 0/0 0/1 0% 44/47 94% 47/51 92%
E- Magruder N Lot (#3360)- NE Of Magruder Hall (W Of Merritt Indoor Field) {19 0/0 0/0 0/2 0% 14/21 67% 14/23 61%
E- Magruder N Lot (#3360)- NE Of Magruder Hall (W Of Merritt Indoor Field) {20 0/0 0/0 1/2 50% 11/21 52% 12/23 52%
E- Magruder S Lot (#3363)- S & SE Of Magruder Hall {19Oct10} 68/77 88% 0/0 0/0 3/5 60% 71/82 87%
E- Magruder S Lot (#3363)- S & SE Of Magruder Hall {20Oct10} 64/77 83% 0/0 0/0 3/5 60% 67/82 82%
Printed: 04-Feb-2011 at 04:09 pm Page 5 of 6

Veh/Cap % Cap Veh/Cap % Cap Veh/Cap % Cap Veh/Cap % Cap Veh/Cap % CapStudent Faculty ADA Other Total
E- OCB Lot (#3364)- NW & SE Of Oak Creek Bldg {19Oct10} 18/44 41% 0/0 0/1 0% 19/25 76% 37/70 53%
E- OCB Lot (#3364)- NW & SE Of Oak Creek Bldg {20Oct10} 18/44 41% 0/0 0/1 0% 21/25 84% 39/70 56%
F- 26th S S of RR (#3304)- 26th South, South Of Rr (W Of Cesar Chavez Center) { 0/0 0/0 0/0 4/15 27% 4/15 27%
F- 26th S S of RR (#3304)- 26th South, South Of Rr (W Of Cesar Chavez Center) { 0/0 0/0 0/0 3/15 20% 3/15 20%
F- Gill Lot (#3282)- West Of Gill Coliseum {19Oct10} 0/0 39/44 89% 2/4 50% 3/4 75% 44/52 85%
F- Gill Lot (#3282)- West Of Gill Coliseum {20Oct10} 0/0 39/44 89% 0/4 0% 4/4 100% 43/52 83%
F- Lasells Lot (#3277)- SE Of Reser Stadium (Across 26th From LaSElls) {19Oct10 82/136 60% 0/0 1/8 13% 25/27 93% 108/171 63%
F- Lasells Lot (#3277)- SE Of Reser Stadium (Across 26th From LaSElls) {20Oct10 78/136 57% 0/0 0/8 0% 24/27 89% 102/171 60%
F- R.MILLER (#3283)- S Of Gill Coliseum (N Side Of Ralph Miller Ln) {19Oct10} 0/0 0/0 1/5 20% 0/4 0% 1/9 11%
F- R.MILLER (#3283)- S Of Gill Coliseum (N Side Of Ralph Miller Ln) {20Oct10} 0/0 0/0 2/5 40% 0/4 0% 2/9 22%
F- Reser Stadium Lot (#3281)- SW Of Reser Stadium {19Oct10} 91/765 12% 0/0 5/34 15% 1/1 100% 97/800 12%
F- Reser Stadium Lot (#3281)- SW Of Reser Stadium {20Oct10} 88/765 12% 0/0 4/34 12% 1/1 100% 93/800 12%
F- VALLEY FB (#3284)- W Of Valley Football Cent (S Of Merritt Truax Indoor) {1 181/241 75% 61/93 66% 0/10 0% 4/6 67% 246/350 70%
F- VALLEY FB (#3284)- W Of Valley Football Cent (S Of Merritt Truax Indoor) {2 187/241 78% 66/93 71% 0/10 0% 3/6 50% 256/350 73%
G- Alumni Lot (#3380)- N Of Ch2M Hill Bldg (700 Block Of SW 26th St) {19Oct1 48/48 100% 0/0 6/6 100% 3/4 75% 57/58 98%
G- Alumni Lot (#3380)- N Of Ch2M Hill Bldg (700 Block Of SW 26th St) {20Oct1 48/48 100% 0/0 1/6 17% 3/4 75% 52/58 90%
G- Bloss S Lot (#3270)- W Of 17th And Western (S Of Bloss Hall) {19Oct10} 40/41 98% 0/0 0/2 0% 2/2 100% 42/45 93%
G- Bloss S Lot (#3270)- W Of 17th And Western (S Of Bloss Hall) {20Oct10} 40/41 98% 0/0 0/2 0% 2/2 100% 42/45 93%
G- Bloss W Lot (#3273)- W & SW Of Bloss Hall (E Of Ch2M Hill Alumni Cen) {1 0/0 40/50 80% 0/0 2/11 18% 42/61 69%
G- Bloss W Lot (#3273)- W & SW Of Bloss Hall (E Of Ch2M Hill Alumni Cen) {2 0/0 44/50 88% 0/0 11/11 100% 55/61 90%
G- Cascade Way (#3271)- N & W & S Of Adams Hall (SW Of 15th & Washington) 0/0 47/47 100% 1/5 20% 26/28 93% 74/80 93%
G- Cascade Way (#3271)- N & W & S Of Adams Hall (SW Of 15th & Washington) 0/0 47/47 100% 2/5 40% 10/28 36% 59/80 74%
G- May Way Lot (#3280)- N Of Halsell Hall (SW Of 17th And May Way) {19Oct10 117/117 100% 0/0 3/10 30% 1/4 25% 121/131 92%
G- May Way Lot (#3280)- N Of Halsell Hall (SW Of 17th And May Way) {20Oct10 117/117 100% 0/0 3/10 30% 1/4 25% 121/131 92%
G- Parking Structure (#0205)- 661 SW 26th Street {19Oct10} 636/960 66% 0/0 3/21 14% 1/10 10% 640/991 65%
G- Parking Structure (#0205)- 661 SW 26th Street {20Oct10} 516/960 54% 0/0 1/21 5% 1/10 10% 518/991 52%
H- 15 N West (#3278)- East of Soccer Field (SW of 15th & Western) {19Oct10} 0/0 0/0 4/6 67% 6/40 15% 10/46 22%
H- 15 N West (#3278)- East of Soccer Field (SW of 15th & Western) {20Oct10} 0/0 0/0 4/6 67% 6/40 15% 10/46 22%
Printed: 04-Feb-2011 at 04:09 pm Page 6 of 6

OSU Neighborhood Street Parking SurveySurvey Dates:Wed 20-Oct-10 to Wed 20-Oct-10
WithResidental
Permit
No Residental
PermitTotal
Vehicles Parking Capacity
VacantSpots
Permits % of
Capacity
No Permit % of
Capacity
Total % of
Capacity
Vehicles atMetersMetered
Capacity%
Capacity
On-Street Parking (vehicles) % of Capacity Metered ParkingOSU
Parking Permits
Results Aggregated by DistrictCollege Hill West(CHW) Average 66 77 143200 57 33% 38% 71%9
North College Hill(NCH) Average 132 106 238271 33 49% 39% 88% 2424 100%10
Results Aggregated by DistrictCollege Hill West(CHW) Average {20-Oct-2010} 66 77 143200 57 33% 38% 71%9
North College Hill(NCH) Average {20-Oct-2010} 132 106 238271 33 49% 39% 88% 2424 100%10
Results Aggregated by District and SessionCHW: 09:00 AM to 10:00 AM 63 50 113184 71 34% 27% 61%3
CHW: 10:00 AM to 11:00 AM 63 91 154200 46 32% 46% 77%9
CHW: 11:00 AM to 12:00 PM 66 84 150200 50 33% 42% 75%16
CHW: 12:00 PM to 01:00 PM 65 74 139200 61 33% 37% 70%5
NCH: 09:00 AM to 10:00 AM 131 103 234271 37 48% 38% 86% 2424 100%14
NCH: 10:00 AM to 11:00 AM 139 106 245271 26 51% 39% 90% 2424 100%7
NCH: 11:00 AM to 12:00 PM 106 103 209229 20 46% 45% 91% 2323 100%4
NCH: 12:00 PM to 01:00 PM 126 96 222265 43 48% 36% 84% 2424 100%12
Results Aggregated by District and St SectionCHW- Total: 28th from Jackson to Johnson[W] 4 7 1111 1 32% 64% 95%2
CHW- Total: 28th from VanBuren to Jackson[W] 5 5 1011 1 42% 45% 88%1
CHW- Total: 29th from Harrison to VanBuren[E] 2 1 39 7 22% 6% 28%0
CHW- Total: 29th from Jackson to Johnson[E] 2 5 79 2 22% 53% 75%0
CHW- Total: 29th from VanBuren to Jackson[E] 8 1 811 3 70% 5% 75%0
CHW- Total: 30th from Johnson to Jackson[W] 5 4 99 0 53% 47% 100%1
CHW- Total: 31st from Jackson to Johnson[E] 3 1 37 4 36% 7% 43%0
Printed: 04-Feb-2011 at 04:10 pm Page 1 of 16
Legend: CHW-College Hill West (District A), NCH-North College Hill (District B)
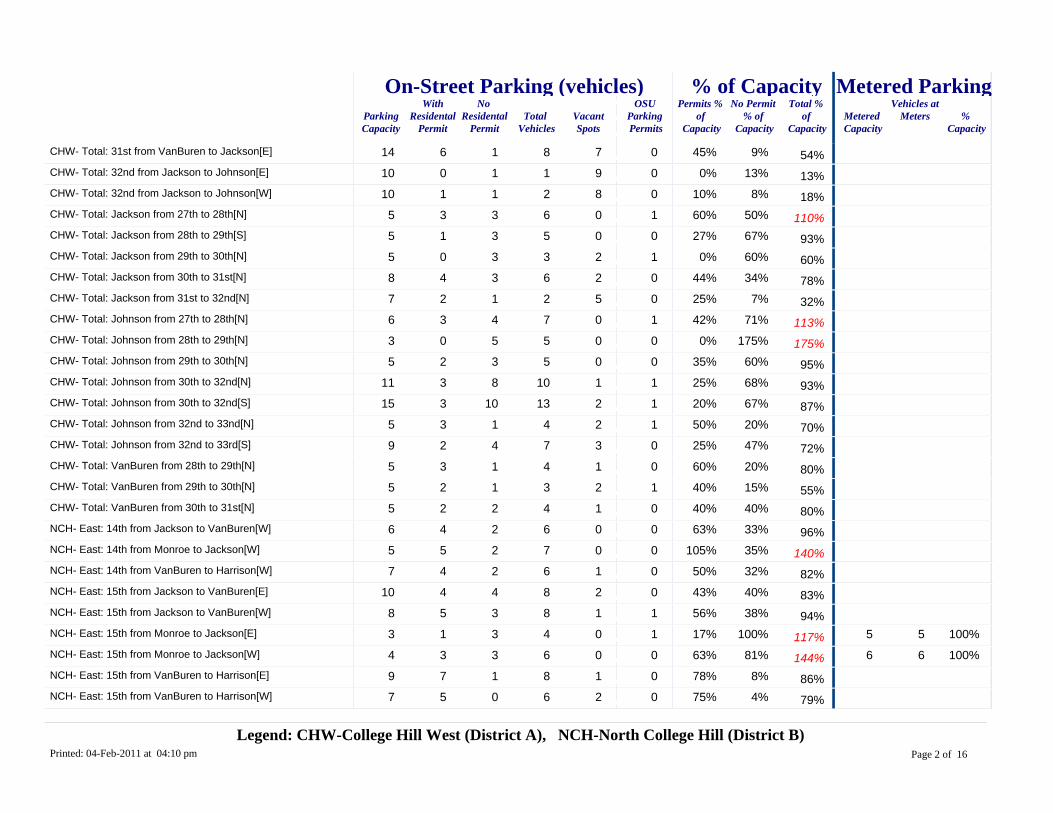
WithResidental
Permit
No Residental
PermitTotal
Vehicles Parking Capacity
VacantSpots
Permits % of
Capacity
No Permit % of
Capacity
Total % of
Capacity
Vehicles atMetersMetered
Capacity%
Capacity
On-Street Parking (vehicles) % of Capacity Metered ParkingOSU
Parking Permits
CHW- Total: 31st from VanBuren to Jackson[E] 6 1 814 7 45% 9% 54%0
CHW- Total: 32nd from Jackson to Johnson[E] 0 1 110 9 0% 13% 13%0
CHW- Total: 32nd from Jackson to Johnson[W] 1 1 210 8 10% 8% 18%0
CHW- Total: Jackson from 27th to 28th[N] 3 3 65 0 60% 50% 110%1
CHW- Total: Jackson from 28th to 29th[S] 1 3 55 0 27% 67% 93%0
CHW- Total: Jackson from 29th to 30th[N] 0 3 35 2 0% 60% 60%1
CHW- Total: Jackson from 30th to 31st[N] 4 3 68 2 44% 34% 78%0
CHW- Total: Jackson from 31st to 32nd[N] 2 1 27 5 25% 7% 32%0
CHW- Total: Johnson from 27th to 28th[N] 3 4 76 0 42% 71% 113%1
CHW- Total: Johnson from 28th to 29th[N] 0 5 53 0 0% 175% 175%0
CHW- Total: Johnson from 29th to 30th[N] 2 3 55 0 35% 60% 95%0
CHW- Total: Johnson from 30th to 32nd[N] 3 8 1011 1 25% 68% 93%1
CHW- Total: Johnson from 30th to 32nd[S] 3 10 1315 2 20% 67% 87%1
CHW- Total: Johnson from 32nd to 33nd[N] 3 1 45 2 50% 20% 70%1
CHW- Total: Johnson from 32nd to 33rd[S] 2 4 79 3 25% 47% 72%0
CHW- Total: VanBuren from 28th to 29th[N] 3 1 45 1 60% 20% 80%0
CHW- Total: VanBuren from 29th to 30th[N] 2 1 35 2 40% 15% 55%1
CHW- Total: VanBuren from 30th to 31st[N] 2 2 45 1 40% 40% 80%0
NCH- East: 14th from Jackson to VanBuren[W] 4 2 66 0 63% 33% 96%0
NCH- East: 14th from Monroe to Jackson[W] 5 2 75 0 105% 35% 140%0
NCH- East: 14th from VanBuren to Harrison[W] 4 2 67 1 50% 32% 82%0
NCH- East: 15th from Jackson to VanBuren[E] 4 4 810 2 43% 40% 83%0
NCH- East: 15th from Jackson to VanBuren[W] 5 3 88 1 56% 38% 94%1
NCH- East: 15th from Monroe to Jackson[E] 1 3 43 0 17% 100% 117% 55 100%1
NCH- East: 15th from Monroe to Jackson[W] 3 3 64 0 63% 81% 144% 66 100%0
NCH- East: 15th from VanBuren to Harrison[E] 7 1 89 1 78% 8% 86%0
NCH- East: 15th from VanBuren to Harrison[W] 5 0 67 2 75% 4% 79%0
Printed: 04-Feb-2011 at 04:10 pm Page 2 of 16
Legend: CHW-College Hill West (District A), NCH-North College Hill (District B)

WithResidental
Permit
No Residental
PermitTotal
Vehicles Parking Capacity
VacantSpots
Permits % of
Capacity
No Permit % of
Capacity
Total % of
Capacity
Vehicles atMetersMetered
Capacity%
Capacity
On-Street Parking (vehicles) % of Capacity Metered ParkingOSU
Parking Permits
NCH- East: 16th from Jackson to VanBuren[E] 2 6 88 0 28% 75% 103%0
NCH- East: 16th from Jackson to VanBuren[W] 4 6 98 0 44% 69% 113%0
NCH- East: 16th from Monroe to Jackson[E] 3 2 54 0 63% 56% 119% 33 100%0
NCH- East: 16th from Monroe to Jackson[W] 1 3 42 0 50% 163% 213% 44 100%1
NCH- East: 16th from VanBuren to Harrison[E] 4 2 57 2 50% 25% 75%0
NCH- East: 16th from VanBuren to Harrison[W] 4 3 79 2 44% 36% 81%0
NCH- East: Harrison from 14th to 15th[S] 2 0 26 4 33% 0% 33%0
NCH- East: Harrison from 15th to 16th[S] 0 0 06 6 0% 4% 4%0
NCH- East: Harrison from 16 to 17[S] 0 0 06 6 0% 4% 4%0
NCH- East: Jackson from 14th to 15th[N] 4 2 64 0 100% 38% 138%0
NCH- East: Jackson from 15th to 16th[N] 1 3 44 0 31% 63% 94%0
NCH- East: Jackson from 16th to 17th[N] 4 1 54 0 100% 31% 131%0
NCH- East: Monroe from 15th to 16th[N] 0 0 01 1 0% 0% 0% 44 100%0
NCH- East: Monroe from 16th to Kings[N] 0 1 14 4 0% 13% 13%0
NCH- West: 17th from Jackson to VanBuren[E] 6 2 86 0 100% 28% 128%0
NCH- West: 17th from Jackson to VanBuren[W] 3 6 97 0 36% 86% 121%0
NCH- West: 17th from VanBuren to Harrison[E] 2 2 47 3 29% 25% 54%0
NCH- West: 17th from VanBuren to Harrison[W] 2 3 57 2 32% 36% 68%0
NCH- West: 18th from VanBuren to Harrison[E] 4 1 54 0 94% 25% 119%0
NCH- West: 18th from VanBuren to Harrison[W] 4 0 44 0 94% 6% 100%0
NCH- West: 21st from Jackson to VanBuren[E] 5 3 88 1 59% 34% 94%1
NCH- West: 21st from Monroe to Jackson[E] 4 3 77 0 54% 43% 96% 11 100%1
NCH- West: 21st from VanBuren to Harrison[E] 6 5 1011 1 52% 41% 93%0
NCH- West: 23rd from Jackson to VanBuren[E] 5 2 67 1 64% 25% 89%0
NCH- West: 23rd from Monroe to Jackson[E] 1 4 53 0 33% 117% 150%1
NCH- West: 23rd from VanBuren to Harrison[E] 4 3 79 2 44% 36% 81%2
NCH- West: Harrison from 17th to Kings[S] 2 2 35 2 30% 30% 60%0
Printed: 04-Feb-2011 at 04:10 pm Page 3 of 16
Legend: CHW-College Hill West (District A), NCH-North College Hill (District B)
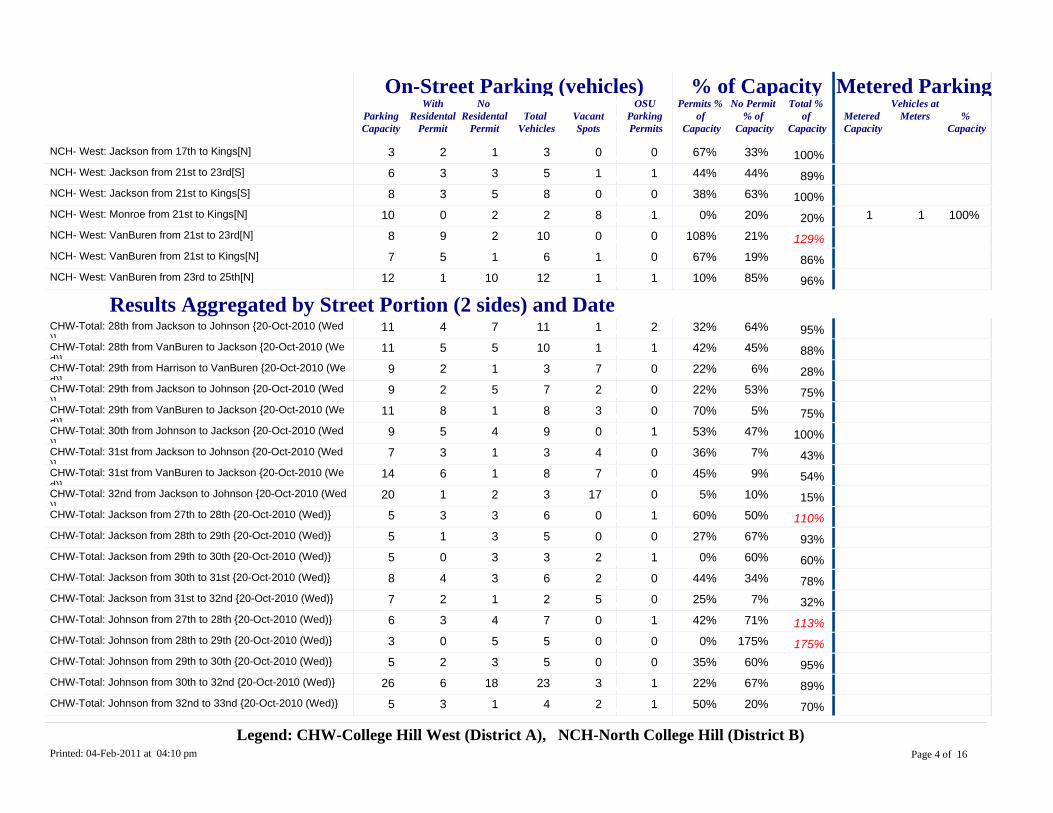
WithResidental
Permit
No Residental
PermitTotal
Vehicles Parking Capacity
VacantSpots
Permits % of
Capacity
No Permit % of
Capacity
Total % of
Capacity
Vehicles atMetersMetered
Capacity%
Capacity
On-Street Parking (vehicles) % of Capacity Metered ParkingOSU
Parking Permits
NCH- West: Jackson from 17th to Kings[N] 2 1 33 0 67% 33% 100%0
NCH- West: Jackson from 21st to 23rd[S] 3 3 56 1 44% 44% 89%1
NCH- West: Jackson from 21st to Kings[S] 3 5 88 0 38% 63% 100%0
NCH- West: Monroe from 21st to Kings[N] 0 2 210 8 0% 20% 20% 11 100%1
NCH- West: VanBuren from 21st to 23rd[N] 9 2 108 0 108% 21% 129%0
NCH- West: VanBuren from 21st to Kings[N] 5 1 67 1 67% 19% 86%0
NCH- West: VanBuren from 23rd to 25th[N] 1 10 1212 1 10% 85% 96%1
Results Aggregated by Street Portion (2 sides) and DateCHW-Total: 28th from Jackson to Johnson {20-Oct-2010 (Wed)}
4 7 1111 1 32% 64% 95%2
CHW-Total: 28th from VanBuren to Jackson {20-Oct-2010 (Wed)}
5 5 1011 1 42% 45% 88%1
CHW-Total: 29th from Harrison to VanBuren {20-Oct-2010 (Wed)}
2 1 39 7 22% 6% 28%0
CHW-Total: 29th from Jackson to Johnson {20-Oct-2010 (Wed)}
2 5 79 2 22% 53% 75%0
CHW-Total: 29th from VanBuren to Jackson {20-Oct-2010 (Wed)}
8 1 811 3 70% 5% 75%0
CHW-Total: 30th from Johnson to Jackson {20-Oct-2010 (Wed)}
5 4 99 0 53% 47% 100%1
CHW-Total: 31st from Jackson to Johnson {20-Oct-2010 (Wed)}
3 1 37 4 36% 7% 43%0
CHW-Total: 31st from VanBuren to Jackson {20-Oct-2010 (Wed)}
6 1 814 7 45% 9% 54%0
CHW-Total: 32nd from Jackson to Johnson {20-Oct-2010 (Wed)}
1 2 320 17 5% 10% 15%0
CHW-Total: Jackson from 27th to 28th {20-Oct-2010 (Wed)} 3 3 65 0 60% 50% 110%1
CHW-Total: Jackson from 28th to 29th {20-Oct-2010 (Wed)} 1 3 55 0 27% 67% 93%0
CHW-Total: Jackson from 29th to 30th {20-Oct-2010 (Wed)} 0 3 35 2 0% 60% 60%1
CHW-Total: Jackson from 30th to 31st {20-Oct-2010 (Wed)} 4 3 68 2 44% 34% 78%0
CHW-Total: Jackson from 31st to 32nd {20-Oct-2010 (Wed)} 2 1 27 5 25% 7% 32%0
CHW-Total: Johnson from 27th to 28th {20-Oct-2010 (Wed)} 3 4 76 0 42% 71% 113%1
CHW-Total: Johnson from 28th to 29th {20-Oct-2010 (Wed)} 0 5 53 0 0% 175% 175%0
CHW-Total: Johnson from 29th to 30th {20-Oct-2010 (Wed)} 2 3 55 0 35% 60% 95%0
CHW-Total: Johnson from 30th to 32nd {20-Oct-2010 (Wed)} 6 18 2326 3 22% 67% 89%1
CHW-Total: Johnson from 32nd to 33nd {20-Oct-2010 (Wed)} 3 1 45 2 50% 20% 70%1
Printed: 04-Feb-2011 at 04:10 pm Page 4 of 16
Legend: CHW-College Hill West (District A), NCH-North College Hill (District B)

WithResidental
Permit
No Residental
PermitTotal
Vehicles Parking Capacity
VacantSpots
Permits % of
Capacity
No Permit % of
Capacity
Total % of
Capacity
Vehicles atMetersMetered
Capacity%
Capacity
On-Street Parking (vehicles) % of Capacity Metered ParkingOSU
Parking Permits
CHW-Total: Johnson from 32nd to 33rd {20-Oct-2010 (Wed)} 2 4 79 3 25% 47% 72%0
CHW-Total: VanBuren from 28th to 29th {20-Oct-2010 (Wed)} 3 1 45 1 60% 20% 80%0
CHW-Total: VanBuren from 29th to 30th {20-Oct-2010 (Wed)} 2 1 35 2 40% 15% 55%1
CHW-Total: VanBuren from 30th to 31st {20-Oct-2010 (Wed)} 2 2 45 1 40% 40% 80%0
NCH-East: 14th from Jackson to VanBuren {20-Oct-2010 (Wed)}
4 2 66 0 63% 33% 96%0
NCH-East: 14th from Monroe to Jackson {20-Oct-2010 (Wed)} 5 2 75 0 105% 35% 140%0
NCH-East: 14th from VanBuren to Harrison {20-Oct-2010 (Wed)}
4 2 67 1 50% 32% 82%0
NCH-East: 15th from Jackson to VanBuren {20-Oct-2010 (Wed)}
9 7 1618 2 49% 39% 88%1
NCH-East: 15th from Monroe to Jackson {20-Oct-2010 (Wed)} 3 6 97 0 43% 89% 132% 1111 100%1
NCH-East: 15th from VanBuren to Harrison {20-Oct-2010 (Wed)}
12 1 1316 3 77% 6% 83%0
NCH-East: 16th from Jackson to VanBuren {20-Oct-2010 (Wed)}
6 12 1716 0 36% 72% 108%0
NCH-East: 16th from Monroe to Jackson {20-Oct-2010 (Wed)} 4 6 96 0 58% 92% 150% 77 100%1
NCH-East: 16th from VanBuren to Harrison {20-Oct-2010 (Wed)}
8 5 1316 4 47% 31% 78%0
NCH-East: Harrison from 14th to 15th {20-Oct-2010 (Wed)} 2 0 26 4 33% 0% 33%0
NCH-East: Harrison from 15th to 16th {20-Oct-2010 (Wed)} 0 0 06 6 0% 4% 4%0
NCH-East: Harrison from 16 to 17 {20-Oct-2010 (Wed)} 0 0 06 6 0% 4% 4%0
NCH-East: Jackson from 14th to 15th {20-Oct-2010 (Wed)} 4 2 64 0 100% 38% 138%0
NCH-East: Jackson from 15th to 16th {20-Oct-2010 (Wed)} 1 3 44 0 31% 63% 94%0
NCH-East: Jackson from 16th to 17th {20-Oct-2010 (Wed)} 4 1 54 0 100% 31% 131%0
NCH-East: Monroe from 15th to 16th {20-Oct-2010 (Wed)} 0 0 01 1 0% 0% 0% 44 100%0
NCH-East: Monroe from 16th to Kings {20-Oct-2010 (Wed)} 0 1 14 4 0% 13% 13%0
NCH-West: 17th from Jackson to VanBuren {20-Oct-2010 (Wed)}
9 8 1613 0 65% 59% 124%0
NCH-West: 17th from VanBuren to Harrison {20-Oct-2010 (Wed)}
4 4 914 6 30% 30% 61%0
NCH-West: 18th from VanBuren to Harrison {20-Oct-2010 (Wed)}
8 1 98 0 94% 16% 109%0
NCH-West: 21st from Jackson to VanBuren {20-Oct-2010 (Wed)}
5 3 88 1 59% 34% 94%1
NCH-West: 21st from Monroe to Jackson {20-Oct-2010 (Wed)} 4 3 77 0 54% 43% 96% 11 100%1
NCH-West: 21st from VanBuren to Harrison {20-Oct-2010 (Wed)}
6 5 1011 1 52% 41% 93%0
Printed: 04-Feb-2011 at 04:10 pm Page 5 of 16
Legend: CHW-College Hill West (District A), NCH-North College Hill (District B)

WithResidental
Permit
No Residental
PermitTotal
Vehicles Parking Capacity
VacantSpots
Permits % of
Capacity
No Permit % of
Capacity
Total % of
Capacity
Vehicles atMetersMetered
Capacity%
Capacity
On-Street Parking (vehicles) % of Capacity Metered ParkingOSU
Parking Permits
NCH-West: 23rd from Jackson to VanBuren {20-Oct-2010 (Wed)}
5 2 67 1 64% 25% 89%0
NCH-West: 23rd from Monroe to Jackson {20-Oct-2010 (Wed)} 1 4 53 0 33% 117% 150%1
NCH-West: 23rd from VanBuren to Harrison {20-Oct-2010 (Wed)}
4 3 79 2 44% 36% 81%2
NCH-West: Harrison from 17th to Kings {20-Oct-2010 (Wed)} 2 2 35 2 30% 30% 60%0
NCH-West: Jackson from 17th to Kings {20-Oct-2010 (Wed)} 2 1 33 0 67% 33% 100%0
NCH-West: Jackson from 21st to 23rd {20-Oct-2010 (Wed)} 3 3 56 1 44% 44% 89%1
NCH-West: Jackson from 21st to Kings {20-Oct-2010 (Wed)} 3 5 88 0 38% 63% 100%0
NCH-West: Monroe from 21st to Kings {20-Oct-2010 (Wed)} 0 2 210 8 0% 20% 20% 11 100%1
NCH-West: VanBuren from 21st to 23rd {20-Oct-2010 (Wed)} 9 2 108 0 108% 21% 129%0
NCH-West: VanBuren from 21st to Kings {20-Oct-2010 (Wed)} 5 1 67 1 67% 19% 86%0
NCH-West: VanBuren from 23rd to 25th {20-Oct-2010 (Wed)} 1 10 1212 1 10% 85% 96%1
DetailsCHW:28th from Jackson to Johnson[W]{20Oct10, 09AM-10AM}
4 6 1011 1 36% 55% 91%2
CHW:28th from Jackson to Johnson[W]{20Oct10, 10AM-11AM}
4 6 1011 1 36% 55% 91%2
CHW:28th from Jackson to Johnson[W]{20Oct10, 11AM-12PM}
3 7 1011 1 27% 64% 91%1
CHW:28th from Jackson to Johnson[W]{20Oct10, 12PM-01PM}
3 9 1211 0 27% 82% 109%1
CHW:28th from VanBuren to Jackson[W]{20Oct10, 10AM-11AM}
5 6 1111 0 45% 55% 100%1
CHW:28th from VanBuren to Jackson[W]{20Oct10, 11AM-12PM}
5 5 1011 1 45% 45% 91%1
CHW:28th from VanBuren to Jackson[W]{20Oct10, 12PM-01PM}
4 4 811 3 36% 36% 73%0
CHW:29th from Harrison to VanBuren[E]{20Oct10, 09AM-10AM}
2 1 39 6 22% 11% 33%0
CHW:29th from Harrison to VanBuren[E]{20Oct10, 10AM-11AM}
2 0 29 7 22% 0% 22%0
CHW:29th from Harrison to VanBuren[E]{20Oct10, 11AM-12PM}
2 0 29 7 22% 0% 22%0
CHW:29th from Harrison to VanBuren[E]{20Oct10, 12PM-01PM}
2 1 39 6 22% 11% 33%0
CHW:29th from Jackson to Johnson[E]{20Oct10, 09AM-10AM} 2 5 79 2 22% 56% 78%0
CHW:29th from Jackson to Johnson[E]{20Oct10, 10AM-11AM} 2 7 99 0 22% 78% 100%1
CHW:29th from Jackson to Johnson[E]{20Oct10, 11AM-12PM} 2 4 69 3 22% 44% 67%0
CHW:29th from Jackson to Johnson[E]{20Oct10, 12PM-01PM} 2 3 59 4 22% 33% 56%0
Printed: 04-Feb-2011 at 04:10 pm Page 6 of 16
Legend: CHW-College Hill West (District A), NCH-North College Hill (District B)

WithResidental
Permit
No Residental
PermitTotal
Vehicles Parking Capacity
VacantSpots
Permits % of
Capacity
No Permit % of
Capacity
Total % of
Capacity
Vehicles atMetersMetered
Capacity%
Capacity
On-Street Parking (vehicles) % of Capacity Metered ParkingOSU
Parking Permits
CHW:29th from VanBuren to Jackson[E]{20Oct10, 09AM-10AM}
7 0 711 4 64% 0% 64%0
CHW:29th from VanBuren to Jackson[E]{20Oct10, 10AM-11AM}
8 0 811 3 73% 0% 73%0
CHW:29th from VanBuren to Jackson[E]{20Oct10, 11AM-12PM}
8 1 911 2 73% 9% 82%1
CHW:29th from VanBuren to Jackson[E]{20Oct10, 12PM-01PM}
8 1 911 2 73% 9% 82%0
CHW:30th from Johnson to Jackson[W]{20Oct10, 09AM-10AM}
5 4 99 0 56% 44% 100%0
CHW:30th from Johnson to Jackson[W]{20Oct10, 10AM-11AM}
5 5 109 0 56% 56% 111%1
CHW:30th from Johnson to Jackson[W]{20Oct10, 11AM-12PM}
5 4 99 0 56% 44% 100%2
CHW:30th from Johnson to Jackson[W]{20Oct10, 12PM-01PM}
4 4 89 1 44% 44% 89%0
CHW:31st from Jackson to Johnson[E]{20Oct10, 09AM-10AM} 4 0 47 3 57% 0% 57%0
CHW:31st from Jackson to Johnson[E]{20Oct10, 10AM-11AM} 2 1 37 4 29% 14% 43%0
CHW:31st from Jackson to Johnson[E]{20Oct10, 11AM-12PM} 2 1 37 4 29% 14% 43%0
CHW:31st from Jackson to Johnson[E]{20Oct10, 12PM-01PM} 2 0 27 5 29% 0% 29%0
CHW:31st from VanBuren to Jackson[E]{20Oct10, 09AM-10AM}
5 0 514 9 36% 0% 36%0
CHW:31st from VanBuren to Jackson[E]{20Oct10, 10AM-11AM}
6 2 814 6 43% 14% 57%0
CHW:31st from VanBuren to Jackson[E]{20Oct10, 11AM-12PM}
7 2 914 5 50% 14% 64%0
CHW:31st from VanBuren to Jackson[E]{20Oct10, 12PM-01PM}
7 1 814 6 50% 7% 57%0
CHW:32nd from Jackson to Johnson[E]{20Oct10, 09AM-10AM}
0 0 010 10 0% 0% 0%0
CHW:32nd from Jackson to Johnson[E]{20Oct10, 10AM-11AM}
0 2 210 8 0% 20% 20%0
CHW:32nd from Jackson to Johnson[E]{20Oct10, 11AM-12PM}
0 3 310 7 0% 30% 30%0
CHW:32nd from Jackson to Johnson[E]{20Oct10, 12PM-01PM}
0 0 010 10 0% 0% 0%0
CHW:32nd from Jackson to Johnson[W]{20Oct10, 09AM-10AM}
1 0 110 9 10% 0% 10%0
CHW:32nd from Jackson to Johnson[W]{20Oct10, 10AM-11AM}
1 1 210 8 10% 10% 20%0
CHW:32nd from Jackson to Johnson[W]{20Oct10, 11AM-12PM}
1 2 310 7 10% 20% 30%0
CHW:32nd from Jackson to Johnson[W]{20Oct10, 12PM-01PM}
1 0 110 9 10% 0% 10%0
CHW:Jackson from 27th to 28th[N]{20Oct10, 09AM-10AM} 3 2 55 0 60% 40% 100%0
CHW:Jackson from 27th to 28th[N]{20Oct10, 10AM-11AM} 3 3 65 0 60% 60% 120%0
CHW:Jackson from 27th to 28th[N]{20Oct10, 11AM-12PM} 3 2 55 0 60% 40% 100%2
Printed: 04-Feb-2011 at 04:10 pm Page 7 of 16
Legend: CHW-College Hill West (District A), NCH-North College Hill (District B)

WithResidental
Permit
No Residental
PermitTotal
Vehicles Parking Capacity
VacantSpots
Permits % of
Capacity
No Permit % of
Capacity
Total % of
Capacity
Vehicles atMetersMetered
Capacity%
Capacity
On-Street Parking (vehicles) % of Capacity Metered ParkingOSU
Parking Permits
CHW:Jackson from 27th to 28th[N]{20Oct10, 12PM-01PM} 3 3 65 0 60% 60% 120%0
CHW:Jackson from 28th to 29th[S]{20Oct10, 10AM-11AM} 1 7 85 0 20% 140% 160%0
CHW:Jackson from 28th to 29th[S]{20Oct10, 11AM-12PM} 1 1 25 3 20% 20% 40%1
CHW:Jackson from 28th to 29th[S]{20Oct10, 12PM-01PM} 2 2 45 1 40% 40% 80%0
CHW:Jackson from 29th to 30th[N]{20Oct10, 09AM-10AM} 0 1 15 4 0% 20% 20%0
CHW:Jackson from 29th to 30th[N]{20Oct10, 10AM-11AM} 0 4 45 1 0% 80% 80%1
CHW:Jackson from 29th to 30th[N]{20Oct10, 11AM-12PM} 0 4 45 1 0% 80% 80%1
CHW:Jackson from 29th to 30th[N]{20Oct10, 12PM-01PM} 0 3 35 2 0% 60% 60%1
CHW:Jackson from 30th to 31st[N]{20Oct10, 09AM-10AM} 4 2 68 2 50% 25% 75%0
CHW:Jackson from 30th to 31st[N]{20Oct10, 10AM-11AM} 3 4 78 1 38% 50% 88%0
CHW:Jackson from 30th to 31st[N]{20Oct10, 11AM-12PM} 3 4 78 1 38% 50% 88%0
CHW:Jackson from 30th to 31st[N]{20Oct10, 12PM-01PM} 4 1 58 3 50% 13% 63%0
CHW:Jackson from 31st to 32nd[N]{20Oct10, 09AM-10AM} 1 0 17 6 14% 0% 14%0
CHW:Jackson from 31st to 32nd[N]{20Oct10, 10AM-11AM} 2 0 27 5 29% 0% 29%0
CHW:Jackson from 31st to 32nd[N]{20Oct10, 11AM-12PM} 2 1 37 4 29% 14% 43%0
CHW:Jackson from 31st to 32nd[N]{20Oct10, 12PM-01PM} 2 1 37 4 29% 14% 43%0
CHW:Johnson from 27th to 28th[N]{20Oct10, 09AM-10AM} 3 3 66 0 50% 50% 100%1
CHW:Johnson from 27th to 28th[N]{20Oct10, 10AM-11AM} 1 6 76 0 17% 100% 117%2
CHW:Johnson from 27th to 28th[N]{20Oct10, 11AM-12PM} 3 5 86 0 50% 83% 133%1
CHW:Johnson from 27th to 28th[N]{20Oct10, 12PM-01PM} 3 3 66 0 50% 50% 100%0
CHW:Johnson from 28th to 29th[N]{20Oct10, 09AM-10AM} 0 5 53 0 0% 167% 167%0
CHW:Johnson from 28th to 29th[N]{20Oct10, 10AM-11AM} 0 6 63 0 0% 200% 200%0
CHW:Johnson from 28th to 29th[N]{20Oct10, 11AM-12PM} 0 5 53 0 0% 167% 167%1
CHW:Johnson from 28th to 29th[N]{20Oct10, 12PM-01PM} 0 5 53 0 0% 167% 167%0
CHW:Johnson from 29th to 30th[N]{20Oct10, 09AM-10AM} 2 1 35 2 40% 20% 60%0
CHW:Johnson from 29th to 30th[N]{20Oct10, 10AM-11AM} 1 4 55 0 20% 80% 100%0
CHW:Johnson from 29th to 30th[N]{20Oct10, 11AM-12PM} 2 4 65 0 40% 80% 120%0
Printed: 04-Feb-2011 at 04:10 pm Page 8 of 16
Legend: CHW-College Hill West (District A), NCH-North College Hill (District B)

WithResidental
Permit
No Residental
PermitTotal
Vehicles Parking Capacity
VacantSpots
Permits % of
Capacity
No Permit % of
Capacity
Total % of
Capacity
Vehicles atMetersMetered
Capacity%
Capacity
On-Street Parking (vehicles) % of Capacity Metered ParkingOSU
Parking Permits
CHW:Johnson from 29th to 30th[N]{20Oct10, 12PM-01PM} 2 3 55 0 40% 60% 100%0
CHW:Johnson from 30th to 32nd[N]{20Oct10, 09AM-10AM} 3 6 911 2 27% 55% 82%0
CHW:Johnson from 30th to 32nd[N]{20Oct10, 10AM-11AM} 3 9 1211 0 27% 82% 109%0
CHW:Johnson from 30th to 32nd[N]{20Oct10, 11AM-12PM} 3 7 1011 1 27% 64% 91%1
CHW:Johnson from 30th to 32nd[N]{20Oct10, 12PM-01PM} 2 8 1011 1 18% 73% 91%1
CHW:Johnson from 30th to 32nd[S]{20Oct10, 09AM-10AM} 3 12 1515 0 20% 80% 100%0
CHW:Johnson from 30th to 32nd[S]{20Oct10, 10AM-11AM} 3 10 1315 2 20% 67% 87%0
CHW:Johnson from 30th to 32nd[S]{20Oct10, 11AM-12PM} 3 10 1315 2 20% 67% 87%1
CHW:Johnson from 30th to 32nd[S]{20Oct10, 12PM-01PM} 3 8 1115 4 20% 53% 73%1
CHW:Johnson from 32nd to 33nd[N]{20Oct10, 09AM-10AM} 4 0 45 1 80% 0% 80%0
CHW:Johnson from 32nd to 33nd[N]{20Oct10, 10AM-11AM} 2 1 35 2 40% 20% 60%0
CHW:Johnson from 32nd to 33nd[N]{20Oct10, 11AM-12PM} 2 1 35 2 40% 20% 60%1
CHW:Johnson from 32nd to 33nd[N]{20Oct10, 12PM-01PM} 2 2 45 1 40% 40% 80%1
CHW:Johnson from 32nd to 33rd[S]{20Oct10, 09AM-10AM} 2 2 49 5 22% 22% 44%0
CHW:Johnson from 32nd to 33rd[S]{20Oct10, 10AM-11AM} 2 5 79 2 22% 56% 78%0
CHW:Johnson from 32nd to 33rd[S]{20Oct10, 11AM-12PM} 3 5 89 1 33% 56% 89%1
CHW:Johnson from 32nd to 33rd[S]{20Oct10, 12PM-01PM} 2 5 79 2 22% 56% 78%0
CHW:VanBuren from 28th to 29th[N]{20Oct10, 09AM-10AM} 4 0 45 1 80% 0% 80%0
CHW:VanBuren from 28th to 29th[N]{20Oct10, 10AM-11AM} 3 0 35 2 60% 0% 60%0
CHW:VanBuren from 28th to 29th[N]{20Oct10, 11AM-12PM} 2 2 45 1 40% 40% 80%0
CHW:VanBuren from 28th to 29th[N]{20Oct10, 12PM-01PM} 3 2 55 0 60% 40% 100%0
CHW:VanBuren from 29th to 30th[N]{20Oct10, 09AM-10AM} 2 0 25 3 40% 0% 40%0
CHW:VanBuren from 29th to 30th[N]{20Oct10, 10AM-11AM} 2 0 25 3 40% 0% 40%1
CHW:VanBuren from 29th to 30th[N]{20Oct10, 11AM-12PM} 2 1 35 2 40% 20% 60%1
CHW:VanBuren from 29th to 30th[N]{20Oct10, 12PM-01PM} 2 2 45 1 40% 40% 80%0
CHW:VanBuren from 30th to 31st[N]{20Oct10, 09AM-10AM} 2 0 25 3 40% 0% 40%0
CHW:VanBuren from 30th to 31st[N]{20Oct10, 10AM-11AM} 2 2 45 1 40% 40% 80%0
Printed: 04-Feb-2011 at 04:10 pm Page 9 of 16
Legend: CHW-College Hill West (District A), NCH-North College Hill (District B)

WithResidental
Permit
No Residental
PermitTotal
Vehicles Parking Capacity
VacantSpots
Permits % of
Capacity
No Permit % of
Capacity
Total % of
Capacity
Vehicles atMetersMetered
Capacity%
Capacity
On-Street Parking (vehicles) % of Capacity Metered ParkingOSU
Parking Permits
CHW:VanBuren from 30th to 31st[N]{20Oct10, 11AM-12PM} 2 3 55 0 40% 60% 100%0
CHW:VanBuren from 30th to 31st[N]{20Oct10, 12PM-01PM} 2 3 55 0 40% 60% 100%0
NCH:14th from Jackson to VanBuren[W]{20Oct10, 09AM-10AM}
4 2 66 0 67% 33% 100%0
NCH:14th from Jackson to VanBuren[W]{20Oct10, 10AM-11AM}
4 3 76 0 67% 50% 117%0
NCH:14th from Jackson to VanBuren[W]{20Oct10, 11AM-12PM}
3 0 36 3 50% 0% 50%0
NCH:14th from Jackson to VanBuren[W]{20Oct10, 12PM-01PM}
4 3 76 0 67% 50% 117%0
NCH:14th from Monroe to Jackson[W]{20Oct10, 09AM-10AM} 6 1 75 0 120% 20% 140%0
NCH:14th from Monroe to Jackson[W]{20Oct10, 10AM-11AM} 6 1 75 0 120% 20% 140%0
NCH:14th from Monroe to Jackson[W]{20Oct10, 11AM-12PM} 6 1 75 0 120% 20% 140%0
NCH:14th from Monroe to Jackson[W]{20Oct10, 12PM-01PM} 3 4 75 0 60% 80% 140%0
NCH:14th from VanBuren to Harrison[W]{20Oct10, 09AM-10AM}
4 2 67 1 57% 29% 86%1
NCH:14th from VanBuren to Harrison[W]{20Oct10, 10AM-11AM}
5 0 57 2 71% 0% 71%0
NCH:14th from VanBuren to Harrison[W]{20Oct10, 11AM-12PM}
1 4 57 2 14% 57% 71%0
NCH:14th from VanBuren to Harrison[W]{20Oct10, 12PM-01PM}
4 3 77 0 57% 43% 100%0
NCH:15th from Jackson to VanBuren[E]{20Oct10, 09AM-10AM}
5 2 710 3 50% 20% 70%0
NCH:15th from Jackson to VanBuren[E]{20Oct10, 10AM-11AM}
5 5 1010 0 50% 50% 100%0
NCH:15th from Jackson to VanBuren[E]{20Oct10, 11AM-12PM}
4 6 1010 0 40% 60% 100%0
NCH:15th from Jackson to VanBuren[E]{20Oct10, 12PM-01PM}
3 3 610 4 30% 30% 60%0
NCH:15th from Jackson to VanBuren[W]{20Oct10, 09AM-10AM}
4 3 78 1 50% 38% 88%2
NCH:15th from Jackson to VanBuren[W]{20Oct10, 10AM-11AM}
5 3 88 0 63% 38% 100%0
NCH:15th from Jackson to VanBuren[W]{20Oct10, 11AM-12PM}
5 3 88 0 63% 38% 100%0
NCH:15th from Jackson to VanBuren[W]{20Oct10, 12PM-01PM}
4 3 78 1 50% 38% 88%0
NCH:15th from Monroe to Jackson[E]{20Oct10, 09AM-10AM} 0 3 33 0 0% 100% 100% 55 100%0
NCH:15th from Monroe to Jackson[E]{20Oct10, 10AM-11AM} 2 2 43 0 67% 67% 133% 55 100%2
NCH:15th from Monroe to Jackson[E]{20Oct10, 11AM-12PM} 0 4 43 0 0% 133% 133% 55 100%0
NCH:15th from Monroe to Jackson[E]{20Oct10, 12PM-01PM} 0 3 33 0 0% 100% 100% 55 100%0
NCH:15th from Monroe to Jackson[W]{20Oct10, 09AM-10AM} 2 4 64 0 50% 100% 150% 66 100%0
Printed: 04-Feb-2011 at 04:10 pm Page 10 of 16
Legend: CHW-College Hill West (District A), NCH-North College Hill (District B)
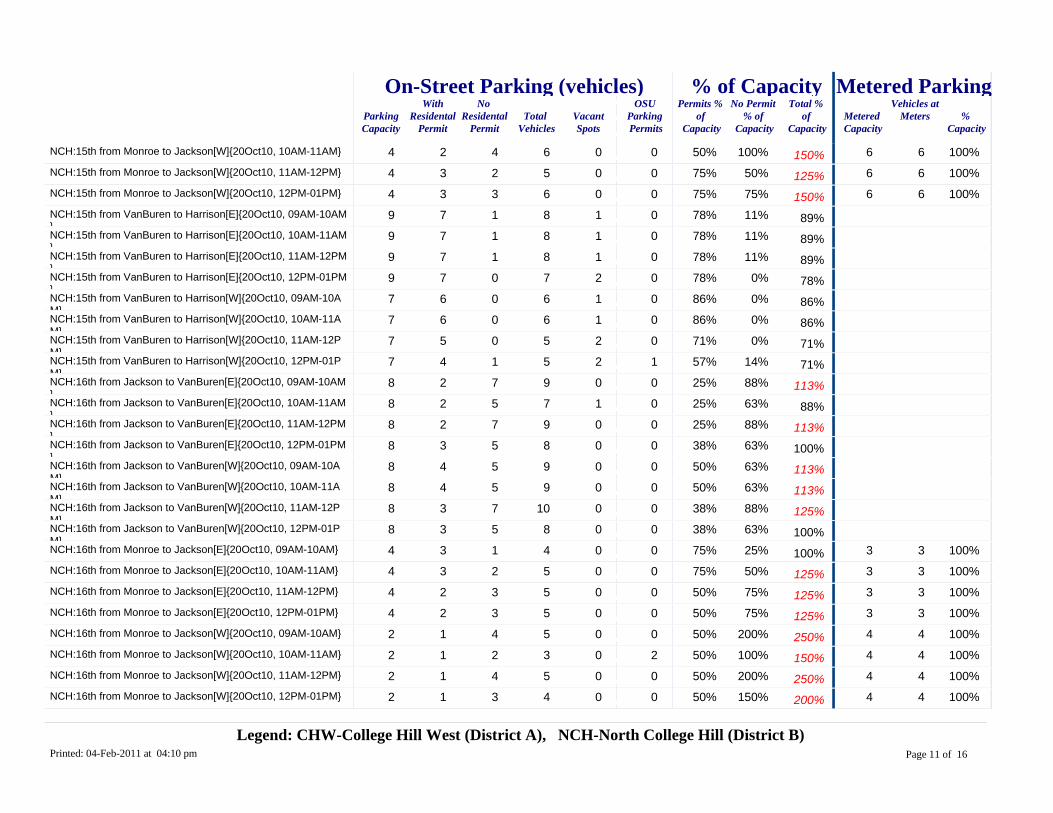
WithResidental
Permit
No Residental
PermitTotal
Vehicles Parking Capacity
VacantSpots
Permits % of
Capacity
No Permit % of
Capacity
Total % of
Capacity
Vehicles atMetersMetered
Capacity%
Capacity
On-Street Parking (vehicles) % of Capacity Metered ParkingOSU
Parking Permits
NCH:15th from Monroe to Jackson[W]{20Oct10, 10AM-11AM} 2 4 64 0 50% 100% 150% 66 100%0
NCH:15th from Monroe to Jackson[W]{20Oct10, 11AM-12PM} 3 2 54 0 75% 50% 125% 66 100%0
NCH:15th from Monroe to Jackson[W]{20Oct10, 12PM-01PM} 3 3 64 0 75% 75% 150% 66 100%0
NCH:15th from VanBuren to Harrison[E]{20Oct10, 09AM-10AM}
7 1 89 1 78% 11% 89%0
NCH:15th from VanBuren to Harrison[E]{20Oct10, 10AM-11AM}
7 1 89 1 78% 11% 89%0
NCH:15th from VanBuren to Harrison[E]{20Oct10, 11AM-12PM}
7 1 89 1 78% 11% 89%0
NCH:15th from VanBuren to Harrison[E]{20Oct10, 12PM-01PM}
7 0 79 2 78% 0% 78%0
NCH:15th from VanBuren to Harrison[W]{20Oct10, 09AM-10AM}
6 0 67 1 86% 0% 86%0
NCH:15th from VanBuren to Harrison[W]{20Oct10, 10AM-11AM}
6 0 67 1 86% 0% 86%0
NCH:15th from VanBuren to Harrison[W]{20Oct10, 11AM-12PM}
5 0 57 2 71% 0% 71%0
NCH:15th from VanBuren to Harrison[W]{20Oct10, 12PM-01PM}
4 1 57 2 57% 14% 71%1
NCH:16th from Jackson to VanBuren[E]{20Oct10, 09AM-10AM}
2 7 98 0 25% 88% 113%0
NCH:16th from Jackson to VanBuren[E]{20Oct10, 10AM-11AM}
2 5 78 1 25% 63% 88%0
NCH:16th from Jackson to VanBuren[E]{20Oct10, 11AM-12PM}
2 7 98 0 25% 88% 113%0
NCH:16th from Jackson to VanBuren[E]{20Oct10, 12PM-01PM}
3 5 88 0 38% 63% 100%0
NCH:16th from Jackson to VanBuren[W]{20Oct10, 09AM-10AM}
4 5 98 0 50% 63% 113%0
NCH:16th from Jackson to VanBuren[W]{20Oct10, 10AM-11AM}
4 5 98 0 50% 63% 113%0
NCH:16th from Jackson to VanBuren[W]{20Oct10, 11AM-12PM}
3 7 108 0 38% 88% 125%0
NCH:16th from Jackson to VanBuren[W]{20Oct10, 12PM-01PM}
3 5 88 0 38% 63% 100%0
NCH:16th from Monroe to Jackson[E]{20Oct10, 09AM-10AM} 3 1 44 0 75% 25% 100% 33 100%0
NCH:16th from Monroe to Jackson[E]{20Oct10, 10AM-11AM} 3 2 54 0 75% 50% 125% 33 100%0
NCH:16th from Monroe to Jackson[E]{20Oct10, 11AM-12PM} 2 3 54 0 50% 75% 125% 33 100%0
NCH:16th from Monroe to Jackson[E]{20Oct10, 12PM-01PM} 2 3 54 0 50% 75% 125% 33 100%0
NCH:16th from Monroe to Jackson[W]{20Oct10, 09AM-10AM} 1 4 52 0 50% 200% 250% 44 100%0
NCH:16th from Monroe to Jackson[W]{20Oct10, 10AM-11AM} 1 2 32 0 50% 100% 150% 44 100%2
NCH:16th from Monroe to Jackson[W]{20Oct10, 11AM-12PM} 1 4 52 0 50% 200% 250% 44 100%0
NCH:16th from Monroe to Jackson[W]{20Oct10, 12PM-01PM} 1 3 42 0 50% 150% 200% 44 100%0
Printed: 04-Feb-2011 at 04:10 pm Page 11 of 16
Legend: CHW-College Hill West (District A), NCH-North College Hill (District B)

WithResidental
Permit
No Residental
PermitTotal
Vehicles Parking Capacity
VacantSpots
Permits % of
Capacity
No Permit % of
Capacity
Total % of
Capacity
Vehicles atMetersMetered
Capacity%
Capacity
On-Street Parking (vehicles) % of Capacity Metered ParkingOSU
Parking Permits
NCH:16th from VanBuren to Harrison[E]{20Oct10, 09AM-10AM}
4 1 57 2 57% 14% 71%0
NCH:16th from VanBuren to Harrison[E]{20Oct10, 10AM-11AM}
4 2 67 1 57% 29% 86%0
NCH:16th from VanBuren to Harrison[E]{20Oct10, 11AM-12PM}
3 2 57 2 43% 29% 71%0
NCH:16th from VanBuren to Harrison[E]{20Oct10, 12PM-01PM}
3 2 57 2 43% 29% 71%0
NCH:16th from VanBuren to Harrison[W]{20Oct10, 09AM-10AM}
4 3 79 2 44% 33% 78%0
NCH:16th from VanBuren to Harrison[W]{20Oct10, 10AM-11AM}
4 3 79 2 44% 33% 78%1
NCH:16th from VanBuren to Harrison[W]{20Oct10, 11AM-12PM}
4 4 89 1 44% 44% 89%0
NCH:16th from VanBuren to Harrison[W]{20Oct10, 12PM-01PM}
4 3 79 2 44% 33% 78%0
NCH:17th from Jackson to VanBuren[E]{20Oct10, 09AM-10AM}
6 1 76 0 100% 17% 117%1
NCH:17th from Jackson to VanBuren[E]{20Oct10, 10AM-11AM}
6 2 86 0 100% 33% 133%0
NCH:17th from Jackson to VanBuren[E]{20Oct10, 11AM-12PM}
6 2 86 0 100% 33% 133%0
NCH:17th from Jackson to VanBuren[W]{20Oct10, 09AM-10AM}
3 7 107 0 43% 100% 143%0
NCH:17th from Jackson to VanBuren[W]{20Oct10, 10AM-11AM}
1 8 97 0 14% 114% 129%0
NCH:17th from Jackson to VanBuren[W]{20Oct10, 11AM-12PM}
3 5 87 0 43% 71% 114%0
NCH:17th from Jackson to VanBuren[W]{20Oct10, 12PM-01PM}
3 4 77 0 43% 57% 100%0
NCH:17th from VanBuren to Harrison[E]{20Oct10, 09AM-10AM}
2 1 37 4 29% 14% 43%0
NCH:17th from VanBuren to Harrison[E]{20Oct10, 10AM-11AM}
2 2 47 3 29% 29% 57%0
NCH:17th from VanBuren to Harrison[E]{20Oct10, 11AM-12PM}
2 3 57 2 29% 43% 71%0
NCH:17th from VanBuren to Harrison[E]{20Oct10, 12PM-01PM}
2 1 37 4 29% 14% 43%0
NCH:17th from VanBuren to Harrison[W]{20Oct10, 09AM-10AM}
2 0 27 5 29% 0% 29%0
NCH:17th from VanBuren to Harrison[W]{20Oct10, 10AM-11AM}
1 5 67 1 14% 71% 86%0
NCH:17th from VanBuren to Harrison[W]{20Oct10, 11AM-12PM}
3 2 57 2 43% 29% 71%0
NCH:17th from VanBuren to Harrison[W]{20Oct10, 12PM-01PM}
3 3 67 1 43% 43% 86%0
NCH:18th from VanBuren to Harrison[E]{20Oct10, 09AM-10AM}
4 1 54 0 100% 25% 125%0
NCH:18th from VanBuren to Harrison[E]{20Oct10, 10AM-11AM}
3 2 54 0 75% 50% 125%0
NCH:18th from VanBuren to Harrison[E]{20Oct10, 11AM-12PM}
4 0 44 0 100% 0% 100%0
NCH:18th from VanBuren to Harrison[E]{20Oct10, 12PM-01PM}
4 1 54 0 100% 25% 125%1
Printed: 04-Feb-2011 at 04:10 pm Page 12 of 16
Legend: CHW-College Hill West (District A), NCH-North College Hill (District B)

WithResidental
Permit
No Residental
PermitTotal
Vehicles Parking Capacity
VacantSpots
Permits % of
Capacity
No Permit % of
Capacity
Total % of
Capacity
Vehicles atMetersMetered
Capacity%
Capacity
On-Street Parking (vehicles) % of Capacity Metered ParkingOSU
Parking Permits
NCH:18th from VanBuren to Harrison[W]{20Oct10, 09AM-10AM}
4 0 44 0 100% 0% 100%0
NCH:18th from VanBuren to Harrison[W]{20Oct10, 10AM-11AM}
3 1 44 0 75% 25% 100%0
NCH:18th from VanBuren to Harrison[W]{20Oct10, 11AM-12PM}
4 0 44 0 100% 0% 100%0
NCH:18th from VanBuren to Harrison[W]{20Oct10, 12PM-01PM}
4 0 44 0 100% 0% 100%0
NCH:21st from Jackson to VanBuren[E]{20Oct10, 09AM-10AM}
4 5 98 0 50% 63% 113%0
NCH:21st from Jackson to VanBuren[E]{20Oct10, 10AM-11AM}
5 2 78 1 63% 25% 88%0
NCH:21st from Jackson to VanBuren[E]{20Oct10, 11AM-12PM}
5 3 88 0 63% 38% 100%1
NCH:21st from Jackson to VanBuren[E]{20Oct10, 12PM-01PM}
5 1 68 2 63% 13% 75%1
NCH:21st from Monroe to Jackson[E]{20Oct10, 09AM-10AM} 4 3 77 0 57% 43% 100% 11 100%1
NCH:21st from Monroe to Jackson[E]{20Oct10, 10AM-11AM} 3 2 57 2 43% 29% 71% 11 100%2
NCH:21st from Monroe to Jackson[E]{20Oct10, 11AM-12PM} 4 3 77 0 57% 43% 100% 11 100%1
NCH:21st from Monroe to Jackson[E]{20Oct10, 12PM-01PM} 4 4 87 0 57% 57% 114% 11 100%0
NCH:21st from VanBuren to Harrison[E]{20Oct10, 09AM-10AM}
7 3 1011 1 64% 27% 91%0
NCH:21st from VanBuren to Harrison[E]{20Oct10, 10AM-11AM}
6 6 1211 0 55% 55% 109%0
NCH:21st from VanBuren to Harrison[E]{20Oct10, 11AM-12PM}
5 5 1011 1 45% 45% 91%0
NCH:21st from VanBuren to Harrison[E]{20Oct10, 12PM-01PM}
5 4 911 2 45% 36% 82%1
NCH:23rd from Jackson to VanBuren[E]{20Oct10, 09AM-10AM}
0 1 17 6 0% 14% 14%1
NCH:23rd from Jackson to VanBuren[E]{20Oct10, 10AM-11AM}
7 1 87 0 100% 14% 114%0
NCH:23rd from Jackson to VanBuren[E]{20Oct10, 11AM-12PM}
5 3 87 0 71% 43% 114%0
NCH:23rd from Jackson to VanBuren[E]{20Oct10, 12PM-01PM}
6 2 87 0 86% 29% 114%0
NCH:23rd from Monroe to Jackson[E]{20Oct10, 09AM-10AM} 0 4 43 0 0% 133% 133%1
NCH:23rd from Monroe to Jackson[E]{20Oct10, 10AM-11AM} 0 5 53 0 0% 167% 167%0
NCH:23rd from Monroe to Jackson[E]{20Oct10, 11AM-12PM} 0 5 53 0 0% 167% 167%0
NCH:23rd from Monroe to Jackson[E]{20Oct10, 12PM-01PM} 4 0 43 0 133% 0% 133%1
NCH:23rd from VanBuren to Harrison[E]{20Oct10, 09AM-10AM}
4 3 79 2 44% 33% 78%2
NCH:23rd from VanBuren to Harrison[E]{20Oct10, 10AM-11AM}
4 4 89 1 44% 44% 89%0
NCH:23rd from VanBuren to Harrison[E]{20Oct10, 11AM-12PM}
4 4 89 1 44% 44% 89%2
Printed: 04-Feb-2011 at 04:10 pm Page 13 of 16
Legend: CHW-College Hill West (District A), NCH-North College Hill (District B)
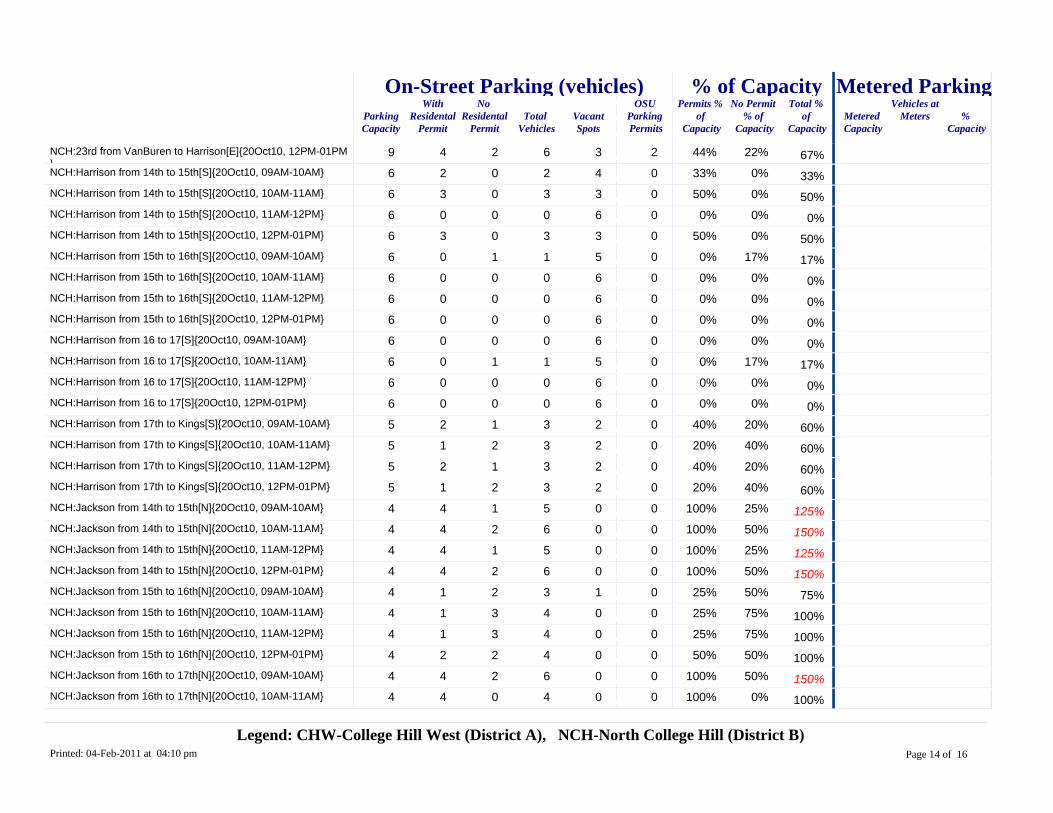
WithResidental
Permit
No Residental
PermitTotal
Vehicles Parking Capacity
VacantSpots
Permits % of
Capacity
No Permit % of
Capacity
Total % of
Capacity
Vehicles atMetersMetered
Capacity%
Capacity
On-Street Parking (vehicles) % of Capacity Metered ParkingOSU
Parking Permits
NCH:23rd from VanBuren to Harrison[E]{20Oct10, 12PM-01PM}
4 2 69 3 44% 22% 67%2
NCH:Harrison from 14th to 15th[S]{20Oct10, 09AM-10AM} 2 0 26 4 33% 0% 33%0
NCH:Harrison from 14th to 15th[S]{20Oct10, 10AM-11AM} 3 0 36 3 50% 0% 50%0
NCH:Harrison from 14th to 15th[S]{20Oct10, 11AM-12PM} 0 0 06 6 0% 0% 0%0
NCH:Harrison from 14th to 15th[S]{20Oct10, 12PM-01PM} 3 0 36 3 50% 0% 50%0
NCH:Harrison from 15th to 16th[S]{20Oct10, 09AM-10AM} 0 1 16 5 0% 17% 17%0
NCH:Harrison from 15th to 16th[S]{20Oct10, 10AM-11AM} 0 0 06 6 0% 0% 0%0
NCH:Harrison from 15th to 16th[S]{20Oct10, 11AM-12PM} 0 0 06 6 0% 0% 0%0
NCH:Harrison from 15th to 16th[S]{20Oct10, 12PM-01PM} 0 0 06 6 0% 0% 0%0
NCH:Harrison from 16 to 17[S]{20Oct10, 09AM-10AM} 0 0 06 6 0% 0% 0%0
NCH:Harrison from 16 to 17[S]{20Oct10, 10AM-11AM} 0 1 16 5 0% 17% 17%0
NCH:Harrison from 16 to 17[S]{20Oct10, 11AM-12PM} 0 0 06 6 0% 0% 0%0
NCH:Harrison from 16 to 17[S]{20Oct10, 12PM-01PM} 0 0 06 6 0% 0% 0%0
NCH:Harrison from 17th to Kings[S]{20Oct10, 09AM-10AM} 2 1 35 2 40% 20% 60%0
NCH:Harrison from 17th to Kings[S]{20Oct10, 10AM-11AM} 1 2 35 2 20% 40% 60%0
NCH:Harrison from 17th to Kings[S]{20Oct10, 11AM-12PM} 2 1 35 2 40% 20% 60%0
NCH:Harrison from 17th to Kings[S]{20Oct10, 12PM-01PM} 1 2 35 2 20% 40% 60%0
NCH:Jackson from 14th to 15th[N]{20Oct10, 09AM-10AM} 4 1 54 0 100% 25% 125%0
NCH:Jackson from 14th to 15th[N]{20Oct10, 10AM-11AM} 4 2 64 0 100% 50% 150%0
NCH:Jackson from 14th to 15th[N]{20Oct10, 11AM-12PM} 4 1 54 0 100% 25% 125%0
NCH:Jackson from 14th to 15th[N]{20Oct10, 12PM-01PM} 4 2 64 0 100% 50% 150%0
NCH:Jackson from 15th to 16th[N]{20Oct10, 09AM-10AM} 1 2 34 1 25% 50% 75%0
NCH:Jackson from 15th to 16th[N]{20Oct10, 10AM-11AM} 1 3 44 0 25% 75% 100%0
NCH:Jackson from 15th to 16th[N]{20Oct10, 11AM-12PM} 1 3 44 0 25% 75% 100%0
NCH:Jackson from 15th to 16th[N]{20Oct10, 12PM-01PM} 2 2 44 0 50% 50% 100%0
NCH:Jackson from 16th to 17th[N]{20Oct10, 09AM-10AM} 4 2 64 0 100% 50% 150%0
NCH:Jackson from 16th to 17th[N]{20Oct10, 10AM-11AM} 4 0 44 0 100% 0% 100%0
Printed: 04-Feb-2011 at 04:10 pm Page 14 of 16
Legend: CHW-College Hill West (District A), NCH-North College Hill (District B)

WithResidental
Permit
No Residental
PermitTotal
Vehicles Parking Capacity
VacantSpots
Permits % of
Capacity
No Permit % of
Capacity
Total % of
Capacity
Vehicles atMetersMetered
Capacity%
Capacity
On-Street Parking (vehicles) % of Capacity Metered ParkingOSU
Parking Permits
NCH:Jackson from 16th to 17th[N]{20Oct10, 11AM-12PM} 4 2 64 0 100% 50% 150%0
NCH:Jackson from 16th to 17th[N]{20Oct10, 12PM-01PM} 4 1 54 0 100% 25% 125%0
NCH:Jackson from 17th to Kings[N]{20Oct10, 09AM-10AM} 2 1 33 0 67% 33% 100%0
NCH:Jackson from 17th to Kings[N]{20Oct10, 10AM-11AM} 2 1 33 0 67% 33% 100%0
NCH:Jackson from 17th to Kings[N]{20Oct10, 12PM-01PM} 2 1 33 0 67% 33% 100%0
NCH:Jackson from 21st to 23rd[S]{20Oct10, 09AM-10AM} 2 3 56 1 33% 50% 83%1
NCH:Jackson from 21st to 23rd[S]{20Oct10, 10AM-11AM} 4 2 66 0 67% 33% 100%0
NCH:Jackson from 21st to 23rd[S]{20Oct10, 12PM-01PM} 2 3 56 1 33% 50% 83%3
NCH:Jackson from 21st to Kings[S]{20Oct10, 09AM-10AM} 3 5 88 0 38% 63% 100%0
NCH:Jackson from 21st to Kings[S]{20Oct10, 10AM-11AM} 3 5 88 0 38% 63% 100%0
NCH:Jackson from 21st to Kings[S]{20Oct10, 12PM-01PM} 3 5 88 0 38% 63% 100%1
NCH:Monroe from 15th to 16th[N]{20Oct10, 09AM-10AM} 0 0 01 1 0% 0% 0% 44 100%0
NCH:Monroe from 15th to 16th[N]{20Oct10, 10AM-11AM} 0 0 01 1 0% 0% 0% 44 100%0
NCH:Monroe from 15th to 16th[N]{20Oct10, 11AM-12PM} 0 0 01 1 0% 0% 0% 44 100%0
NCH:Monroe from 15th to 16th[N]{20Oct10, 12PM-01PM} 0 0 01 1 0% 0% 0% 44 100%0
NCH:Monroe from 16th to Kings[N]{20Oct10, 09AM-10AM} 0 0 04 4 0% 0% 0%0
NCH:Monroe from 16th to Kings[N]{20Oct10, 10AM-11AM} 0 0 04 4 0% 0% 0%0
NCH:Monroe from 16th to Kings[N]{20Oct10, 11AM-12PM} 0 2 24 2 0% 50% 50%0
NCH:Monroe from 16th to Kings[N]{20Oct10, 12PM-01PM} 0 0 04 4 0% 0% 0%0
NCH:Monroe from 21st to Kings[N]{20Oct10, 09AM-10AM} 0 6 610 4 0% 60% 60% 11 100%3
NCH:Monroe from 21st to Kings[N]{20Oct10, 10AM-11AM} 0 0 010 10 0% 0% 0% 11 100%0
NCH:Monroe from 21st to Kings[N]{20Oct10, 12PM-01PM} 0 0 010 10 0% 0% 0% 11 100%0
NCH:VanBuren from 21st to 23rd[N]{20Oct10, 09AM-10AM} 9 2 118 0 113% 25% 138%0
NCH:VanBuren from 21st to 23rd[N]{20Oct10, 10AM-11AM} 9 1 108 0 113% 13% 125%0
NCH:VanBuren from 21st to 23rd[N]{20Oct10, 12PM-01PM} 8 2 108 0 100% 25% 125%0
NCH:VanBuren from 21st to Kings[N]{20Oct10, 09AM-10AM} 5 1 67 1 71% 14% 86%0
NCH:VanBuren from 21st to Kings[N]{20Oct10, 10AM-11AM} 5 1 67 1 71% 14% 86%0
Printed: 04-Feb-2011 at 04:10 pm Page 15 of 16
Legend: CHW-College Hill West (District A), NCH-North College Hill (District B)
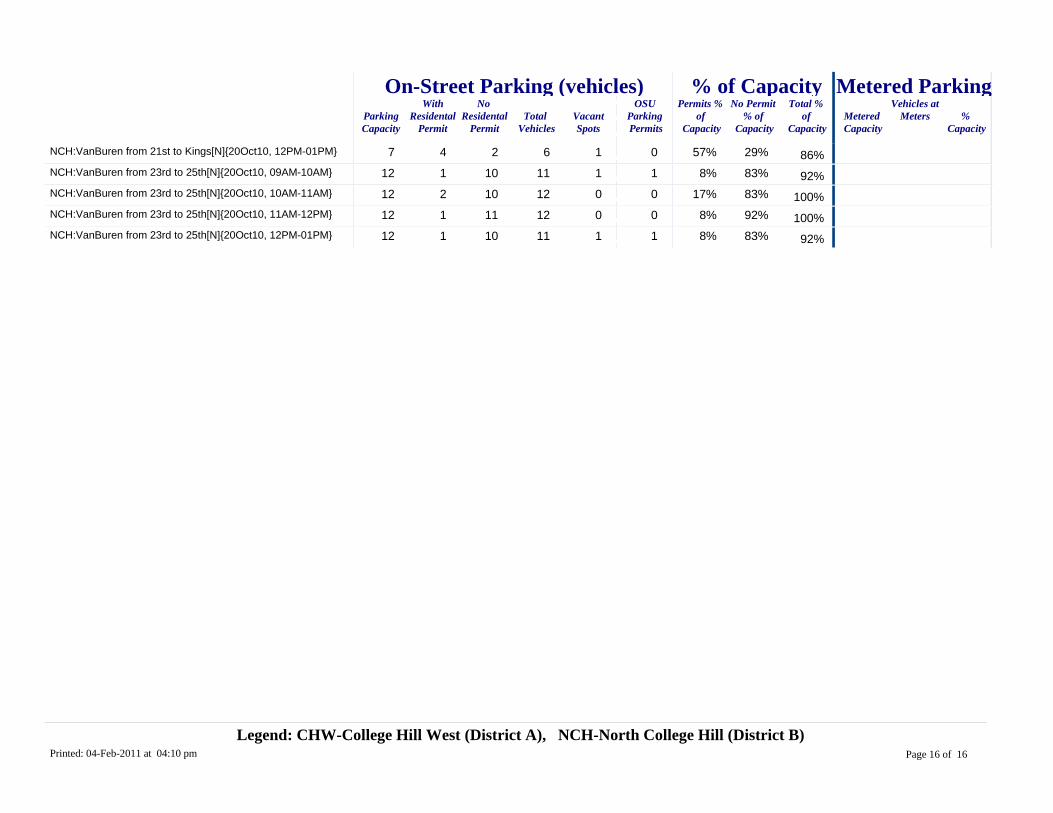
WithResidental
Permit
No Residental
PermitTotal
Vehicles Parking Capacity
VacantSpots
Permits % of
Capacity
No Permit % of
Capacity
Total % of
Capacity
Vehicles atMetersMetered
Capacity%
Capacity
On-Street Parking (vehicles) % of Capacity Metered ParkingOSU
Parking Permits
NCH:VanBuren from 21st to Kings[N]{20Oct10, 12PM-01PM} 4 2 67 1 57% 29% 86%0
NCH:VanBuren from 23rd to 25th[N]{20Oct10, 09AM-10AM} 1 10 1112 1 8% 83% 92%1
NCH:VanBuren from 23rd to 25th[N]{20Oct10, 10AM-11AM} 2 10 1212 0 17% 83% 100%0
NCH:VanBuren from 23rd to 25th[N]{20Oct10, 11AM-12PM} 1 11 1212 0 8% 92% 100%0
NCH:VanBuren from 23rd to 25th[N]{20Oct10, 12PM-01PM} 1 10 1112 1 8% 83% 92%1
Printed: 04-Feb-2011 at 04:10 pm Page 16 of 16
Legend: CHW-College Hill West (District A), NCH-North College Hill (District B)

3281
3286
3284
3332
3333
3334
3341
3303
3277
3104
3370
3201
3293
3234
0205
3902
3203
32083351
3363
3202
3317
3102
3233
3103
3280
3311
3262
3316
3251
3209
3380
3315
3314
3313
3204
3310
3362
3322
3261
3273
3210
3205
3364
3331
3221
3271
3360
3270
3282
3371
3222
3223
3330
3241
3263
3278
3250
3213
3901
3207
3302
3242
3211
33013372
3287
3217
3266
3320
3206
3265
3300
3264
3230
32183220
3260
32683342
3214
3283
3294
3252
3219
3215
3295
3269
3304
3243
3225
3240
3292
3291
LegendCMP Boundary
CMP Sectors
OSU Buildings
Parking Lots W ID#
Lot TypeDecommissioned
Non-OSU
Non-Public
OS
U C
amp
us P
lan
nin
g
\\ts
s-sh
are
.tss.
ore
go
nsta
te.e
du\
facs
vc\P
lann
ing\
_C
am
pus
Pla
nn
ing
\142
00
_La
nd
Use
Pla
nni
ng
\14
20
5-P
ark
ing
and
Tra
nsp
ort
atio
n\P
ark
ing
\Pa
rkin
gU
tiliz
atio
nStu
die
s\2
009
\Ma
pp
ing
\PU
S2
00
8OS
U_
Att
ach
A.m
xd
Thu
rsd
ay,
De
cem
ber
24
, 20
09
09
:20
AM
B
y: m
on
ask
yr
¯0 700 1,400 2,100 2,800350
Feet
Attachment A
2010 ParkingUtilization Study Survey Overview

OS
U C
amp
us P
lan
nin
g
\\ts
s-sh
are
.tss.
ore
go
nsta
te.e
du\
facs
vc\P
lann
ing\
_C
am
pus
Pla
nn
ing
\142
00
_La
nd
Use
Pla
nni
ng
\14
20
5-P
ark
ing
and
Tra
nsp
ort
atio
n\P
ark
ing
\Pa
rkin
gU
tiliz
atio
nStu
die
s\2
009
\Ma
pp
ing
\PU
S2
00
8OS
U_
Att
ach
A.m
xd
Thu
rsd
ay,
De
cem
ber
24
, 20
09
09
:20
AM
B
y: m
on
ask
yr
¯0 700 1,400 2,100 2,800350
Feet
Attachment BLegend
CMP Boundary
CMP Sectors
Permitted Lots25% and Below
25 - 70%
70 - 85%
85% and Above
Non-Permitted LotsDecommissioned
Non-OSU
Non-Public
2010 ParkingUtilization Study Parking Utilization

CAB
E F
D
G
H
OS
U C
amp
us P
lan
nin
g
\\ts
s-sh
are
.tss.
ore
go
nsta
te.e
du\
facs
vc\P
lann
ing\
_C
am
pus
Pla
nn
ing
\142
00
_La
nd
Use
Pla
nni
ng
\14
20
5-P
ark
ing
and
Tra
nsp
ort
atio
n\P
ark
ing
\Pa
rkin
gU
tiliz
atio
nStu
die
s\2
009
\Ma
pp
ing
\PU
S2
00
8OS
U_
Att
ach
A.m
xd
Thu
rsd
ay,
De
cem
ber
24
, 20
09
09
:20
AM
B
y: m
on
ask
yr
¯0 700 1,400 2,100 2,800350
Feet
Attachment CLegend
CMP Boundary
CMP SectorsPercent Use by Sector
25% and Below
25 - 50%
51 - 75%
76% - 100%
2010 ParkingUtilization Study Parking Utilization
by Sector
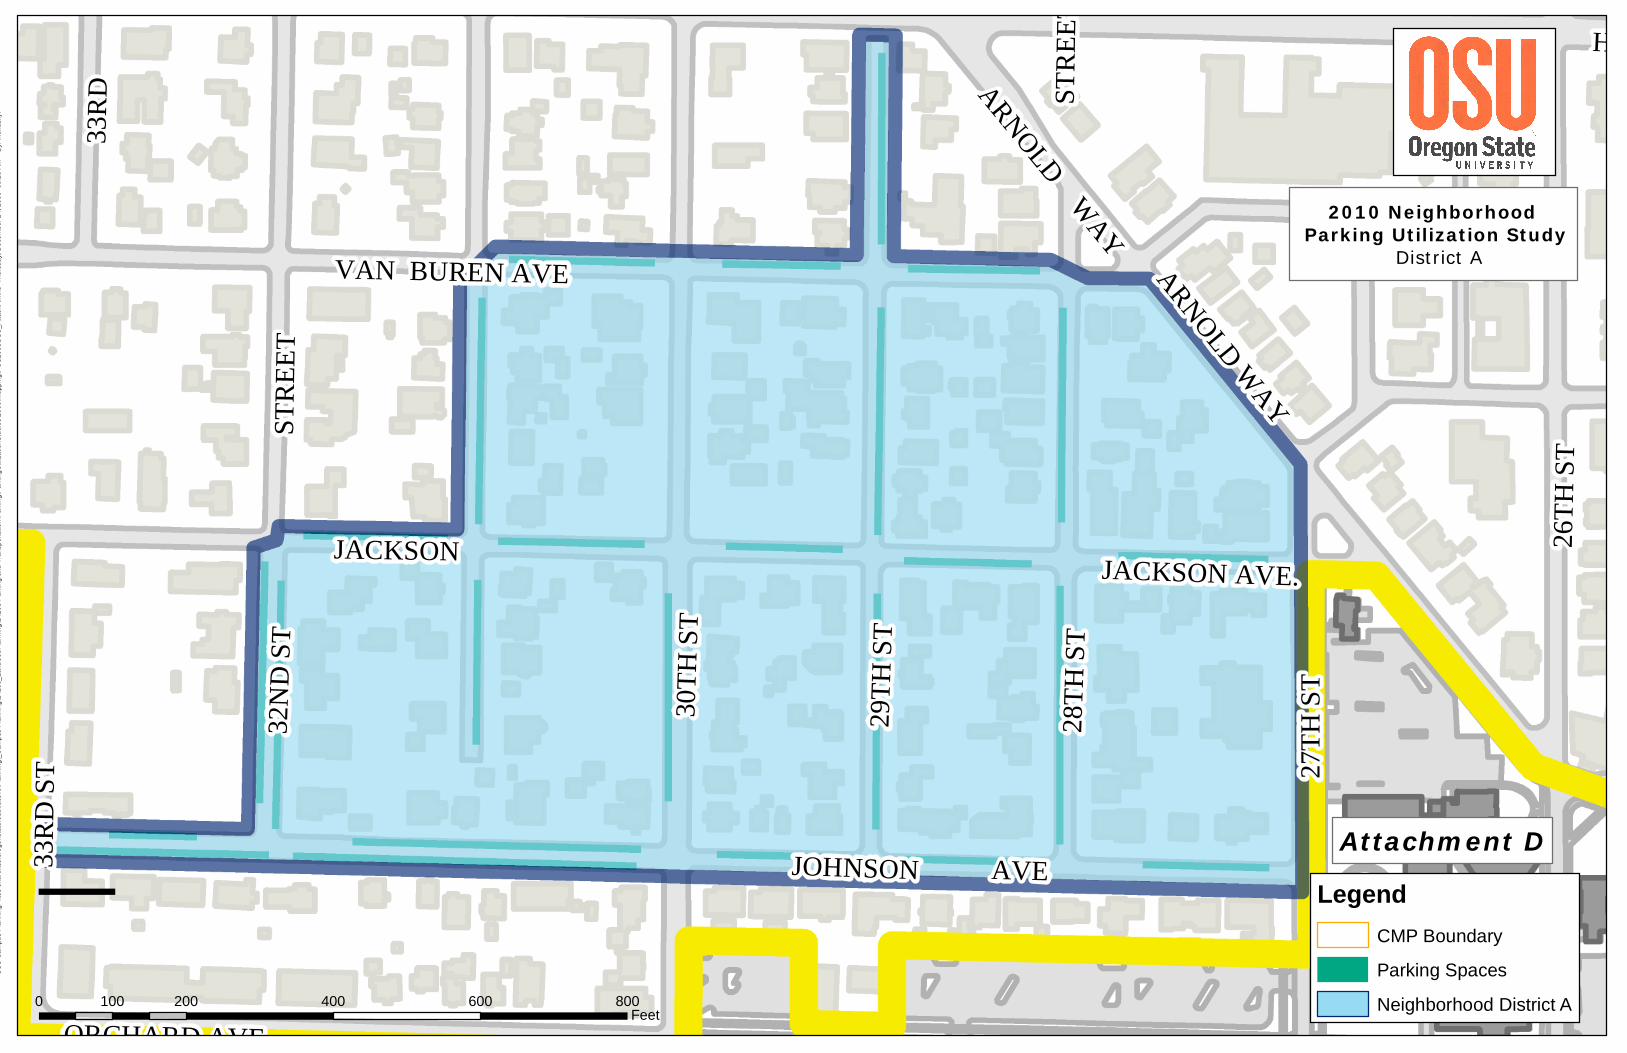
AVE
STRE
ET
30TH
ST
33RD
ST
32ND
ST
JOHNSON
JACKSON
28TH
ST
27TH
ST29TH
ST
26TH
ST
ARNOLD WAY
JACKSON AVE.
ARNOLD WAY
VAN BUREN AVE
STRE
ET HARRISON
ORCHARD AVE
33RD
S
TREE
T
OS
U C
am
pus
Pla
nn
ing
\\t
ss-s
hare
.tss
.ore
go
nsta
te.e
du\f
acs
vc\P
lan
nin
g\_
Cam
pus
Pla
nn
ing
\142
00_
La
ndU
seP
lan
nin
g\1
42
05-
Pa
rkin
g a
nd T
rans
por
tatio
n\P
ark
ing\
Pa
rkin
gU
tiliz
atio
nS
tud
ies\
20
09\
Ma
ppin
g\P
US
20
08O
SU
_A
ttac
hA
.mxd
Th
urs
da
y, D
ece
mb
er 2
4, 2
00
9 0
9:2
0 A
M
B
y: m
ona
skyr
0̄ 200 400 600 800100Feet
Attachment DLegend
CMP Boundary
Parking Spaces
Neighborhood District A
2010 Neighborhood Parking Utilization Study
District A

KING
S
BLVD.
AVENUE
AVENUEJACKSON
14TH S
T
13TH S
T
15TH S
T
16TH S
T
25TH
ST
17TH S
T
23RD
ST
21ST
ST
26TH
STHARRISON
VAN BURENMONROE AVE
KING
S BLV
D
MEMO
RIAL
PL
JACKSON AVE
PARK
TERR
ACE
VAN BUREN AVE
OS
U C
am
pus
Pla
nn
ing
\\t
ss-s
hare
.tss
.ore
go
nsta
te.e
du\f
acs
vc\P
lan
nin
g\_
Cam
pus
Pla
nn
ing
\142
00_
La
ndU
seP
lan
nin
g\1
42
05-
Pa
rkin
g a
nd T
rans
por
tatio
n\P
ark
ing\
Pa
rkin
gU
tiliz
atio
nS
tud
ies\
20
09\
Ma
ppin
g\P
US
20
08O
SU
_A
ttac
hA
.mxd
Th
urs
da
y, D
ece
mb
er 2
4, 2
00
9 0
9:2
0 A
M
B
y: m
ona
skyr
0̄ 280 560 840 1,120140Feet
Attachment ELegend
CMP Boundary
Parking Spaces
Neighborhood District B
2010 Neighborhood Parking Utilization Study
District B

AVE
STRE
ET
STRE
ET
30TH
ST
33RD
ST
32ND
ST
JOHNSON
JACKSON
28TH
ST
27TH
ST29
TH S
T
ARNOLD WAY
ORCHARD AVE
JACKSON AVE.
ARNOLD WAY
VAN BUREN AVE
33RD
S
TREE
T
HARRISON BLVD
o OSU Campus PlanningFebruary 1, 2011
GIS File: PUS2010_OffCmps_PCap.mxd
*Parking capacity based on Corvallis Land DevelopmentCode regulations (Vehicle Capacity indicated in callout)
0 200 400 600 800100Feet
2010 NeighborhoodStreet Parking Study
Attachment F-------------------------------
West College Hill (District A)Parking Survey Results
LegendDistrict A Boundary
Percent Utilization (A)25% and Under
26 - 50%
51 - 75%
75 - 95%
95% and Over

BlkC
Graf
GbAd
Owen
Rogers
BexellCovell
The GEM
WenigerGilbert
ShepardGleeson
DearbornMerryfield
AVENUE
AVENUE
JACKSON
14TH
ST
13TH
ST
15TH
ST
16TH
ST
17TH
ST
23RD
ST
21ST
ST
VAN BURENKI
NGS B
LVD
MEMO
RIAL
PL
JACKSON AVE
VAN BUREN AVE
Plageman
KING
S
o OSU Campus PlanningFebruary 1, 2011
GIS File: PUS2010_OffCmps_PCap.mxd
*Parking capacity based on Corvallis Land DevelopmentCode regulations (Vehicle Capacity indicated in callout)
0 240 480 720 960120Feet
LegendDistrict B Boundary
Percent Utilization (B)0 - 25%
25 - 50%51 - 75%76 - 95%95 - 100%
2010 NeighborhoodStreet Parking Study
Attachment G-------------------------------
North College Hill (District B)Parking Survey Results

Appendix 4
OSU 2010 Bicycle Utilization Study

2010 OSU Bicycle Parking Utilization Survey
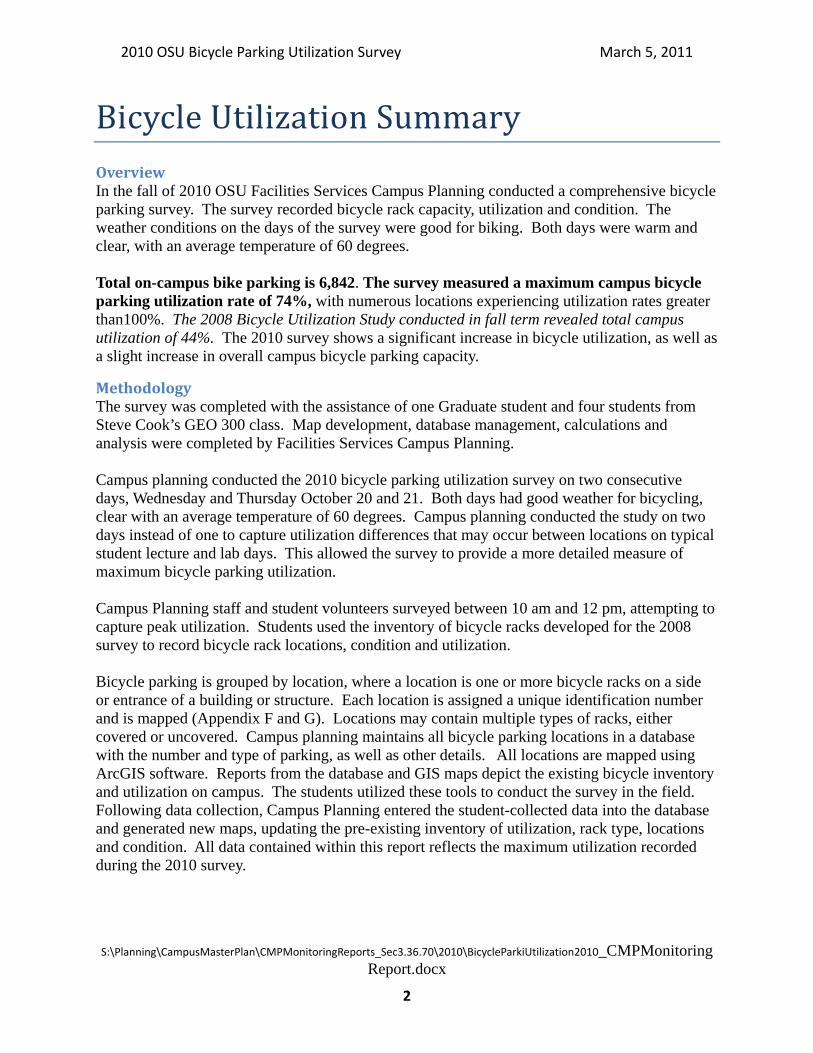
2010 OSU Bicycle Parking Utilization Survey March 5, 2011
S:\Planning\CampusMasterPlan\CMPMonitoringReports_Sec3.36.70\2010\BicycleParkiUtilization2010_CMPMonitoringReport.docx
2
Bicycle Utilization Summary Overview In the fall of 2010 OSU Facilities Services Campus Planning conducted a comprehensive bicycle parking survey. The survey recorded bicycle rack capacity, utilization and condition. The weather conditions on the days of the survey were good for biking. Both days were warm and clear, with an average temperature of 60 degrees. Total on-campus bike parking is 6,842. The survey measured a maximum campus bicycle parking utilization rate of 74%, with numerous locations experiencing utilization rates greater than100%. The 2008 Bicycle Utilization Study conducted in fall term revealed total campus utilization of 44%. The 2010 survey shows a significant increase in bicycle utilization, as well as a slight increase in overall campus bicycle parking capacity.
Methodology The survey was completed with the assistance of one Graduate student and four students from Steve Cook’s GEO 300 class. Map development, database management, calculations and analysis were completed by Facilities Services Campus Planning. Campus planning conducted the 2010 bicycle parking utilization survey on two consecutive days, Wednesday and Thursday October 20 and 21. Both days had good weather for bicycling, clear with an average temperature of 60 degrees. Campus planning conducted the study on two days instead of one to capture utilization differences that may occur between locations on typical student lecture and lab days. This allowed the survey to provide a more detailed measure of maximum bicycle parking utilization. Campus Planning staff and student volunteers surveyed between 10 am and 12 pm, attempting to capture peak utilization. Students used the inventory of bicycle racks developed for the 2008 survey to record bicycle rack locations, condition and utilization. Bicycle parking is grouped by location, where a location is one or more bicycle racks on a side or entrance of a building or structure. Each location is assigned a unique identification number and is mapped (Appendix F and G). Locations may contain multiple types of racks, either covered or uncovered. Campus planning maintains all bicycle parking locations in a database with the number and type of parking, as well as other details. All locations are mapped using ArcGIS software. Reports from the database and GIS maps depict the existing bicycle inventory and utilization on campus. The students utilized these tools to conduct the survey in the field. Following data collection, Campus Planning entered the student-collected data into the database and generated new maps, updating the pre-existing inventory of utilization, rack type, locations and condition. All data contained within this report reflects the maximum utilization recorded during the 2010 survey.

2010 OSU Bicycle Parking Utilization Survey March 5, 2011
S:\Planning\CampusMasterPlan\CMPMonitoringReports_Sec3.36.70\2010\BicycleParkiUtilization2010_CMPMonitoringReport.docx
3
Inventory Total bicycle capacity on the OSU campus is 6,842 parking spaces of which 2,108 (31%) are covered and 4,734 (69%) are uncovered. Hoop racks are the preferred style of bike rack for installation and utilization. They provide greater user-convenience for placing, securing and maneuvering of bicycles. These racks represent 3,026 (44%) of total capacity. Older, wheel racks provide the majority of the remaining bicycle parking, or 52% of total capacity (See Appendix A). The remaining capacity is comprised of bike lockers, and other styles of racks. Bicycle parking must be constructed with most new development on campus based on the total square footage of the structure. Corvallis Land Development code (Section 3.36.50.13 – Bicycle Parking) requires that at least 50% of this new bicycle parking capacity be covered. Currently about 31% of campus bicycle parking is covered. The percentage of covered parking is anticipated to increase with new development. Hoop racks are installed when existing racks require replacement.
Utilization Survey results show that the OSU campus had an average bicycle parking utilization rate of 74% during peak times. This is a 30% increase over the 2008 survey. With increased utilization, many bicycles were found outside of racks, locked to railings and light posts. The survey recorded 409 individual bicycles locked outside of designated bicycle parking locations. In the weeks surrounding the survey dates, Campus Facilities Services received numerous emails and phone calls regarding this issue. The increase in the number of bicycles on campus exceeded the capacity of bicycle parking in numerous locations, impacting motor vehicle parking and ADA ramp accessibility. A failure to meet the need for secure bicycle parking on the OSU campus could negatively impact bicycle use as a alternative mode of transportation. The survey revealed that Campus sector C received the highest utilization of bicycle parking, at 81%. Sector C comprises the central campus area and contains most of the more commonly used classroom buildings and also much of the student housing. Overall sector C contains 65% of OSU campus bike parking capacity. 81% utilization of sector C represents 3,633 parked bicycles, or 72% of the total bicycles parked on campus. Sectors D and G received the second and third highest utilization at 65% and 63% respectively. During the survey, a total of 23 buildings experienced a utilization of 100% or greater. The highest concentration of bicycle parking utilization was in the northern portion of campus sector C, near buildings such as Merryfield, Milam, Gleeson, and Kearny. Two of the buildings with the highest utilization are housing and dining buildings Hawley Hall and West Dining Hall. Damaged and or missing bicycle racks were noted during the survey. 10 racks were found to be missing, while 24 were either damaged or unanchored. The locations of racks requiring attention are shown in the Bicycle Parking Survey Damage Report (Appendix G) and locations are mapped in Bike Location Physical Status Map (See Appendix E).

2010 OSU Bicycle Parking Utilization Survey March 5, 2011
S:\Planning\CampusMasterPlan\CMPMonitoringReports_Sec3.36.70\2010\BicycleParkiUtilization2010_CMPMonitoringReport.docx
4
Additional Information/Contacts.
For additional information please use the following contacts. Susan Padgett, Planner 541-737-6911, [email protected] David Dodson, Senior Planner,
541-737-8503, [email protected] Patty McIntosh, Campus Planning Manager 541-737-0917, [email protected]

2010 OSU Bicycle Parking Utilization Survey March 5, 2011
S:\Planning\CampusMasterPlan\CMPMonitoringReports_Sec3.36.70\2010\BicycleParkiUtilization2010_CMPMonitoringReport.docx
5
Appendices
A- Bicycle Parking Survey Detail Report B- Map: Percent Utilization by Building C- Map: Percent Utilization by Location D- Map: Capacity Distribution by Building E- Map: Bike Location Physical Status F- Map: Bike Parking Location ID G- Bicycle Parking Survey Damage Report

Bicycle Parking Survey: 20-Oct-2010 (Wednesday)Weather:Clear, warm (65 degrees)
Appendix A
Total Group Covered All Uncovered All
All Hoop All Wheel All Other Covered Hoop
Covered Wheel
Cover Other Uncovered Hoop
Uncovered Wheel
Uncovered Other
Bike Locker Not in Rack
TotalCampus Total 5029/684274% 1270/210860% 3350/473471% 2012/302666% 2436/353369% 172/28361% 608/97962% 532/88560% 130/24453% 1404/204769% 1904/264872% 42/39108% 409
SectorA 1/813% 1/425% 0/40% 0/40% 1/425% 0/40% 1/0 0/40%
B 411/68660% 192/34955% 204/33761% 161/25264% 235/43454% 70/10269% 122/24749% 91/15061% 113/18760% 15
C 3633/450681% 798/119667% 2530/331076% 1642/228472% 1521/199376% 165/22972% 408/63165% 260/36871% 130/19766% 1234/165375% 1261/162578% 35/32109% 305
D 497/76265% 81/20140% 395/56170% 10/1663% 466/69967% 0/470% 81/15453% 0/470% 10/1663% 385/54571% 21
E 74/12161% 70/11461% 3/743% 70/11461% 3/743% 70/11461% 3/743% 1
F 70/21033% 30/6943% 29/14121% 37/12629% 22/8426% 10/3033% 20/3951% 27/9628% 2/454% 11
G 341/54463% 98/17556% 187/36951% 92/23040% 186/30761% 7/7100% 50/9851% 48/7762% 42/13232% 138/23060% 7/7100% 56
X 2/540% 2/540% 2/540% 2/540%
BuildingAdams Hall (0060) 8/2040% 8/2040% 8/2040% 8/2040%
Agricultural Research Center (NInv-154) 10/4423% 10/3826% 0/60% 8/2631% 2/1811% 8/2040% 2/1811% 0/60%
Agricultural Research Service (NInv-162) 8/1457% 1/0 7/1450% 8/1457% 1/0 7/1450%
Arnold Cafeteria (0197) 12/1486% 6/786% 5/771% 11/1479% 6/786% 5/771% 1
Avery Lodge (0194) 40/6363% 40/6363% 40/6363% 40/6363%
Azalea House (0026) 29/5850% 24/5147% 0/70% 24/5841% 24/5147% 0/70% 5
Ballard Extension Hall (0067) 119/14085% 71/8089% 42/6070% 102/12085% 11/2055% 71/8089% 31/4078% 11/2055% 6
Batcheller Hall (0009) 9/1275% 9/1275% 9/1275% 9/1275%
Bates Hall (Family Study Center) (0069) 17/2861% 17/2861% 17/2861% 17/2861%
Benton Annex (Women's Center) (0029) 2/2100% 1/250% 1/250% 1/250% 1
Benton Hall (0027) 26/24108% 22/2492% 22/2492% 22/2492% 4
Bexell Hall (0018) 112/11498% 103/11490% 46/46100% 57/6884% 46/46100% 57/6884% 9
Black Cultural Center (0834) 0/60% 0/60% 0/60% 0/60%
Bloss Hall (0198) 108/102106% 78/10276% 71/9575% 7/7100% 71/9575% 7/7100% 30
Burt Hall (0068) 70/14648% 5/2421% 65/12253% 21/8026% 37/6656% 12/0 5/2421% 16/5629% 37/6656% 12/0
Buxton Hall (0111) 37/4093% 0/40% 35/3697% 12/12100% 0/40% 23/2496% 0/40% 12/12100% 23/2496% 2
Callahan Hall (0192) 149/30848% 0/470% 140/26154% 10/10100% 130/25152% 0/470% 0/470% 10/10100% 130/25152% 9
Carrie Halsell Hall (0204) 83/12467% 48/5096% 20/7427% 68/12455% 48/5096% 20/7427% 15
Cascade Hall (0058) 11/6617% 2/484% 9/1850% 11/5620% 0/100% 2/484% 9/8113% 0/100%
Cauthorn Hall (0114) 64/64100% 58/6491% 0/500% 58/14414% 0/500% 58/14414% 6
Centro Cultural Cesar Chavez (0814) 1/714% 1/714% 1/714% 1/714%
CH2M HIll Alumni Center (0201) 8/4617% 3/1619% 5/3017% 5/3017% 3/1619% 3/1619% 5/3017%
Child Care Center (0188) 2/1118% 2/540% 0/60% 0/60% 2/540% 2/540% 0/60%
Clark Laboratory (0088) 2/367% 2/367% 2/367% 2/367%
Clock Tower (0146) 72/8684% 70/8681% 70/8681% 70/8681% 2
Cordley Hall (0073) 281/39571% 18/4540% 247/35071% 174/26665% 91/12971% 0/100% 18/3551% 174/25668% 73/9478% 16
Covell Hall (0007) 48/47102% 47/47100% 20/20100% 27/27100% 20/20100% 27/27100% 1
Crop Science Bldg (0080) 26/4558% 26/4558% 26/4558% 26/4558%
Dearborn Hall (0011) 72/69104% 27/2993% 40/40100% 40/5474% 14/1593% 13/0 0/140% 14/1593% 13/0 40/40100% 5
Dixon Recreation Center (0145) 112/18660% 57/6884% 49/11842% 104/17260% 2/1414% 57/6884% 47/10445% 2/1414% 6
Dryden Hall (0151) 5/1242% 5/1242% 5/1242% 5/1242%
East Greenhouse (0074) 14/12117% 14/12117% 14/0 0/120% 14/0 0/120%
Monday, February 28, 2011 Page 1 of 7

Total Group Covered All Uncovered All
All Hoop All Wheel All Other Covered Hoop
Covered Wheel
Cover Other Uncovered Hoop
Uncovered Wheel
Uncovered Other
Bike Locker Not in Rack
Education Hall (0028)Energy Center (0078) 1/617% 1/617% 1/617% 1/617%
Environmental Health & Safety Annex (0141) 0/20% 0/20% 0/20% 0/20%
Fairbanks Hall (0087) 17/1989% 17/1989% 17/1989% 17/1989%
Finley Hall (0196) 108/13779% 36/4090% 62/9764% 98/13772% 36/4090% 62/9764% 10
Gilbert Hall (0015) 67/65103% 64/6598% 20/20100% 44/4598% 20/20100% 44/4598% 3
Gilbert Hall Addition (0012) 87/9493% 87/9493% 87/9493% 87/9493%
Gilkey Hall (0037) 22/2879% 21/2875% 21/2875% 21/2875% 1
Gill Coliseum (0121) 35/5959% 20/3951% 7/2035% 7/2035% 20/3951% 20/3951% 7/2035% 8
Gilmore Hall (0084) 20/2580% 20/2580% 20/2580% 20/2580%
Gladys Valley Gymnastics Center (0033) 24/2789% 22/2781% 22/2781% 22/2781% 2
Gleeson Hall (Chem Engr) (0016) 13/10130% 9/1090% 9/1090% 9/1090% 4
Hawley Hall (0119) 118/56211% 58/10580% 50/46109% 72/42171% 36/14257% 36/10360% 22/0 36/32113% 14/14100% 10
Heckert Lodge (0116) 84/9886% 41/5082% 43/4890% 43/8849% 41/10410% 0/400% 41/10410% 43/4890%
Hinsdale Wave Research Lab (0137) 1/813% 1/425% 0/40% 0/40% 1/425% 0/40% 1/0 0/40%
Hovland Hall (0092) 74/57130% 72/57126% 43/20215% 29/3778% 43/20215% 29/3778% 2
Industrial Bldg Annex (0059)Kearney Hall (0001) 92/68135% 41/0 51/6875% 40/5080% 52/18289% 41/0 40/5080% 11/1861%
Kelley Engineering Center (0003) 27/24113% 24/24100% 24/24100% 24/24100% 3
Kerr Administration Bldg (0061) 46/22321% 46/22321% 0/700% 40/7355% 6/808% 0/700% 40/7355% 6/808%
Key Shop (0048) 0/30% 0/30% 0/30% 0/30%
Kidder Hall (0034) 108/11693% 101/11687% 89/10287% 12/1486% 89/10287% 12/1486% 7
Langton Hall (0105) 39/7155% 36/7151% 24/5643% 12/1580% 24/5643% 12/1580% 3
LaSells Stewart Center (0200) 0/210% 0/210% 0/210% 0/210%
Magruder Hall (0153) 53/8066% 53/8066% 53/8066% 53/8066%
McNary Hall (0190) 113/107106% 109/107102% 109/107102% 109/107102% 4
Memorial Union Bldg (0083) 121/17968% 59/8074% 54/9955% 110/16666% 3/1323% 59/8074% 51/8659% 3/1323% 8
Merrit Truax Indoor Practice Center (0142) 2/2010% 2/2010% 2/2010% 2/2010%
Merryfield Hall (0002) 11/7157% 7/7100% 7/7100% 7/7100% 4
Milam Hall (0081) 166/130128% 120/13092% 8/8100% 112/12292% 8/8100% 112/12292% 46
Milne Computer Center (0020) 12/1867% 12/1867% 12/1867% 12/1867%
Moreland Hall (0106) 28/3288% 28/3288% 20/20100% 8/1267% 20/20100% 8/1267%
Nash Hall (0021) 36/6060% 36/6060% 36/6060% 36/6060%
National Forage Seed Center (NInv-156) 4/3611% 4/3611% 4/3611% 4/3611%
Native American Longhouse (0107) 2/1118% 2/1118% 2/1118% 2/1118%
Navy ROTC Armory (0117) 11/1385% 8/1362% 8/1362% 8/1362% 3
Oak Creek Building (0545) 21/4151% 17/3450% 3/743% 17/3450% 3/743% 17/3450% 3/743% 1
Orchard Court Unit-B (0202-B) 23/2785% 23/2785% 23/2785% 23/2785%
Orchard Court Unit-EL (0202-EL) 17/2665% 17/2665% 17/2665% 17/2665%
Owen Hall (0022) 91/73125% 24/23104% 50/50100% 50/50100% 24/23104% 24/23104% 50/50100% 17
Oxford House (0220) 15/3543% 15/3543% 15/3543% 15/3543%
Parking Services Building (0045) 0/60% 0/60% 0/60% 0/60%
Peavy Hall (0124) 160/19881% 35/35100% 116/16371% 77/11070% 74/8884% 35/35100% 77/11070% 39/5374% 9
Pharmacy (0030) 1/147% 1/147% 1/147% 1/147%
Physical Plant Heating Plant (0056) 1/138% 1/138% 1/617% 0/70% 1/617% 0/70%
Plageman Student Health CR (0062) 7/2133% 7/2133% 7/2133% 7/2133%
Poling Hall (0112) 85/12170% 15/5428% 70/67104% 8/5016% 77/71108% 0/400% 15/14107% 8/1080% 62/57109%
Pride Center (0853) 2/729% 2/729% 2/729% 2/729%
Prop Svcs (0862) 2/540% 2/540% 2/540% 2/540%
Radiation Center (0098) 20/2871% 19/2868% 19/2868% 19/2868% 1
Reed Lodge (0118) 24/4652% 11/2055% 13/2650% 24/4652% 11/2055% 13/2650%
Reser Stadium (0120) 4/745% 4/745% 4/469% 0/280% 4/469% 0/280%
Richardson Hall (0148) 37/5074% 30/4075% 7/1070% 37/5074% 30/4075% 7/1070%
Rogers Hall (0019) 41/4689% 2/825% 33/3887% 10/10100% 25/3669% 2/825% 10/10100% 23/2882% 6
Sackett Hall (0096) 127/115110% 102/11589% 102/11589% 102/11589% 25
Monday, February 28, 2011 Page 2 of 7

Total Group Covered All Uncovered All
All Hoop All Wheel All Other Covered Hoop
Covered Wheel
Cover Other Uncovered Hoop
Uncovered Wheel
Uncovered Other
Bike Locker Not in Rack
Seed Lab (0101) 1/714% 1/714% 1/714% 1/714%
Shepard Hall (0014) 18/14129% 14/14100% 14/14100% 14/14100% 4
Snell Hall (0100) 5/683% 5/683% 5/0 0/60% 5/0 0/60%
Snell Hall/ MU East (0100) 45/13533% 12/7616% 33/5956% 6/6100% 39/12930% 12/7616% 6/6100% 27/5351%
Sports Performance Center (0156) 16/2080% 8/1080% 5/1050% 13/2065% 8/1080% 5/1050% 3
Strand Agricultural Hall (0038) 77/16048% 74/16046% 20/20100% 54/14039% 20/20100% 54/14039% 3
The GEM (0199) 72/10569% 0/480% 64/57112% 48/44109% 16/6027% 0/10% 0/480% 48/44109% 16/12133% 0/10% 8
The Valley Library (0036) 132/128103% 96/96100% 32/32100% 128/128100% 96/96100% 32/32100% 4
Transportation Services (0135) 1/138% 1/138% 1/138% 1/138%
USDA Forestry Sciences Lab (2006) 31/10729% 30/6248% 1/452% 30/4468% 1/632% 30/3488% 0/280% 0/100% 1/353%
Valley Football Center (0143) 13/3735% 13/3735% 11/2055% 2/1712% 11/2055% 2/1712%
Vet Research Lab (0154) 0/60% 0/60% 0/60% 0/60%
Waldo Hall (0102) 10/6167% 6/6100% 6/6100% 6/6100% 4
Weatherford Hall (0109) 109/12786% 90/12771% 90/12075% 0/70% 90/12075% 0/70% 19
Weniger Hall (0017) 158/16099% 146/16091% 48/48100% 98/11288% 48/48100% 98/11288% 12
West Dining Hall (0113) 23/3077% 23/3077% 14/1688% 9/1464% 14/1688% 9/1464%
West Grnhse (0138)West Hall (0115) 63/32197% 32/32100% 32/32100% 32/32100% 31
Wiegand Hall (0128) 65/62105% 18/18100% 42/4495% 60/6297% 18/18100% 42/4495% 5
Wilkinson Hall/Gilfillan Aud (0070) 153/19877% 54/7671% 81/12266% 14/2070% 121/17868% 14/2070% 40/5671% 81/12266% 18
Wilson Hall (0191) 149/18083% 146/18081% 146/18081% 146/18081% 3
Withycombe Hall (0075) 36/6159% 36/6159% 36/6159% 36/6159%
Womens Bldg (0086) 75/8489% 75/8489% 75/8489% 75/8489%
LocationAdams Hall(0060) -N {ID 631} 5/1050% 5/1050% 5/1050% 5/1050%
Adams Hall(0060) -NW {ID 630} 3/1030% 3/1030% 3/1030% 3/1030%
Agricultural Research Center(NInv-154) -S {ID 118} 8/2631% 8/2040% 0/60% 8/2631% 8/2040% 0/60%
Agricultural Research Center(NInv-154) -W {ID 129} 2/1811% 2/1811% 2/1811% 2/1811%
Agricultural Research Service(NInv-162) -W {ID 122} 8/1457% 1/0 7/1450% 8/1457% 1/0 7/1450%
Arnold Cafeteria(0197) -E {ID 618} 7/7100% 6/786% 6/786% 6/786% 1
Arnold Cafeteria(0197) -N {ID 619} 5/771% 5/771% 5/771% 5/771%
Avery Lodge(0194) -E {ID 527} 34/4281% 34/4281% 34/4281% 34/4281%
Avery Lodge(0194) -N {ID 528} 6/2129% 6/2129% 6/2129% 6/2129%
Azalea House(0026) -E {ID 526} 22/22100% 17/2277% 17/2277% 17/2277% 5
Azalea House(0026) -S {ID 524} 0/290% 0/220% 0/70% 0/290% 0/220% 0/70%
Azalea House(0026) -SW {ID 525} 7/7100% 7/7100% 7/7100% 7/7100%
Ballard Extension Hall(0067) -E {ID 316} 108/12090% 71/8089% 31/4078% 102/12085% 71/8089% 31/4078% 6
Ballard Extension Hall(0067) -NE {ID 332} 11/2055% 11/2055% 11/2055% 11/2055%
Batcheller Hall(0009) -S {ID 427} 9/1275% 9/1275% 9/1275% 9/1275%
Bates Hall (Family Study Center)(0069) -E {ID 235} 4/850% 4/850% 4/850% 4/850%
Bates Hall (Family Study Center)(0069) -N {ID 248} 2/1020% 2/1020% 2/1020% 2/1020%
Bates Hall (Family Study Center)(0069) -N {ID 248} 11/10110% 11/10110% 11/10110% 11/10110%
Benton Annex (Women's Center)(0029) -W {ID 408} 2/2100% 1/250% 1/250% 1/250% 1
Benton Hall(0027) -N {ID 410} 11/1292% 10/1283% 10/1283% 10/1283% 1
Benton Hall(0027) -S {ID 409} 15/12125% 12/12100% 12/12100% 12/12100% 3
Bexell Hall(0018) -N {ID 320} 41/4591% 41/4591% 20/20100% 21/2584% 20/20100% 21/2584%
Bexell Hall(0018) -S {ID 319} 45/39115% 37/3995% 14/14100% 23/2592% 14/14100% 23/2592% 8
Bexell Hall(0018) -W {ID 321} 26/3087% 25/3083% 12/12100% 13/1872% 12/12100% 13/1872% 1
Black Cultural Center(0834) -W {ID 330} 0/60% 0/60% 0/60% 0/60%
Bloss Hall(0198) -N {ID 616} 108/102106% 78/10276% 71/9575% 7/7100% 71/9575% 7/7100% 30
Burt Hall(0068) -N {ID 244} 12/2646% 0/120% 12/1486% 0/260% 12/0 0/120% 0/140% 12/0
Burt Hall(0068) -N {ID 244} 5/2619% 5/1242% 0/140% 5/2619% 5/1242% 0/140%
Burt Hall(0068) -S {ID 241} 3/339% 3/339% 3/339% 3/339%
Burt Hall(0068) -S {ID 241} 31/3394% 31/3394% 31/3394% 31/3394%
Monday, February 28, 2011 Page 3 of 7

Total Group Covered All Uncovered All
All Hoop All Wheel All Other Covered Hoop
Covered Wheel
Cover Other Uncovered Hoop
Uncovered Wheel
Uncovered Other
Bike Locker Not in Rack
Burt Hall(0068) -W {ID 246} 6/1443% 6/1443% 6/1443% 6/1443%
Burt Hall(0068) -W {ID 246} 13/1493% 13/1493% 10/1471% 3/0 10/1471% 3/0
Buxton Hall(0111) -E {ID 213} 23/2882% 0/40% 23/2496% 0/40% 23/2496% 0/40% 23/2496%
Buxton Hall(0111) -W {ID 214} 14/12117% 12/12100% 12/12100% 12/12100% 2
Callahan Hall(0192) -N {ID 516} 111/27940% 0/470% 111/23248% 111/23248% 0/470% 0/470% 111/23248%
Callahan Hall(0192) -SE {ID 517} 38/29131% 29/29100% 10/10100% 19/19100% 10/10100% 19/19100% 9
Carrie Halsell Hall(0204) -E {ID 626} 28/20140% 20/20100% 20/20100% 20/20100% 8
Carrie Halsell Hall(0204) -N {ID 622} 27/20135% 20/20100% 20/20100% 20/20100% 7
Carrie Halsell Hall(0204) -S {ID 623} 0/140% 0/140% 0/140% 0/140%
Carrie Halsell Hall(0204) -SW {ID 625} 8/1080% 8/1080% 8/1080% 8/1080%
Carrie Halsell Hall(0204) -W {ID 624} 20/6033% 20/6033% 20/6033% 20/6033%
Cascade Hall(0058) -N {ID 627} 9/3625% 0/280% 9/8113% 9/3625% 0/280% 9/8113%
Cascade Hall(0058) -NNW {ID 628} 2/2010% 2/2010% 2/2010% 2/2010%
Cascade Hall(0058) -W {ID 634} 0/100% 0/100% 0/100% 0/100%
Cauthorn Hall(0114) -E {ID 207} 15/14107% 13/1493% 13/1493% 13/1493% 2
Cauthorn Hall(0114) -W {ID 209} 49/5098% 45/5090% 0/500% 45/0 0/500% 45/0 4
Centro Cultural Cesar Chavez(0814) -S {ID 638} 1/714% 1/714% 1/714% 1/714%
CH2M HIll Alumni Center(0201) -N {ID 612} 8/2631% 3/1619% 5/1050% 5/1050% 3/1619% 3/1619% 5/1050%
CH2M HIll Alumni Center(0201) -S {ID 614} 0/200% 0/200% 0/200% 0/200%
Child Care Center(0188) -N {ID 531} 2/1118% 2/540% 0/60% 0/60% 2/540% 2/540% 0/60%
Clark Laboratory(0088) -N {ID 123} 2/367% 2/367% 2/367% 2/367%
Clock Tower(0146) -N {ID 407} 18/3060% 18/3060% 18/3060% 18/3060%
Clock Tower(0146) -S {ID 406} 54/5696% 52/5693% 52/5693% 52/5693% 2
Cordley Hall(0073) -E {ID 233} 38/7749% 10/3826% 28/3972% 15/3050% 23/4749% 0/100% 10/2836% 15/2075% 13/1968%
Cordley Hall(0073) -ENE {ID 254} 8/2236% 8/2236% 8/2236% 8/2236%
Cordley Hall(0073) -ENE {ID 254} 34/22155% 22/22100% 22/22100% 22/22100% 12
Cordley Hall(0073) -N {ID 236} 17/14121% 17/14121% 17/14121% 17/14121%
Cordley Hall(0073) -S {ID 230} 65/6698% 8/7114% 55/5993% 42/42100% 21/2488% 8/7114% 42/42100% 13/1776% 2
Cordley Hall(0073) -SE {ID 255} 0/420% 0/420% 0/420% 0/420%
Cordley Hall(0073) -SE {ID 255} 30/4271% 30/4271% 30/4271% 30/4271%
Cordley Hall(0073) -SW {ID 231} 39/5078% 39/5078% 39/5078% 39/5078%
Cordley Hall(0073) -W {ID 232} 50/6083% 48/6080% 48/6080% 48/6080% 2
Covell Hall(0007) -E {ID 429} 10/9111% 9/9100% 9/9100% 9/9100% 1
Covell Hall(0007) -S {ID 428} 38/38100% 38/38100% 20/20100% 18/18100% 20/20100% 18/18100%
Crop Science Bldg(0080) -E {ID 102} 9/1850% 9/1850% 9/1850% 9/1850%
Crop Science Bldg(0080) -N {ID 101} 17/2763% 17/2763% 17/2763% 17/2763%
Dearborn Hall(0011) -NW {ID 424} 28/2997% 27/2993% 0/140% 14/1593% 13/0 0/140% 14/1593% 13/0 1
Dearborn Hall(0011) -S {ID 425} 44/40110% 40/40100% 40/40100% 40/40100% 4
Dixon Recreation Center(0145) -E {ID 506} 38/10237% 25/3669% 13/6620% 38/10237% 25/3669% 13/6620%
Dixon Recreation Center(0145) -N {ID 504} 2/1414% 2/1414% 2/1414% 2/1414%
Dixon Recreation Center(0145) -W {ID 505} 72/70103% 32/32100% 34/3889% 66/7094% 32/32100% 34/3889% 6
Dryden Hall(0151) -E {ID 110} 5/1242% 5/1242% 5/1242% 5/1242%
East Greenhouse(0074) -N {ID 257} 14/12117% 14/12117% 14/0 0/120% 14/0 0/120%
Education Hall(0028) -W {ID 405}Energy Center(0078) -E {ID 131} 1/617% 1/617% 1/617% 1/617%
Environmental Health & Safety Annex(0141) -NE {ID 0/20% 0/20% 0/20% 0/20%
Fairbanks Hall(0087) -E {ID 221} 17/1989% 17/1989% 17/1989% 17/1989%
Finley Hall(0196) -N {ID 621} 57/6193% 36/4090% 14/2167% 50/6182% 36/4090% 14/2167% 7
Finley Hall(0196) -W {ID 620} 51/7667% 48/7663% 48/7663% 48/7663% 3
Gilbert Hall Addition(0012) -N {ID 417} 31/31100% 31/31100% 31/31100% 31/31100%
Gilbert Hall Addition(0012) -W {ID 416} 56/6389% 56/6389% 56/6389% 56/6389%
Gilbert Hall(0015) -N {ID 419} 6/786% 6/786% 6/786% 6/786%
Gilbert Hall(0015) -S {ID 418} 22/20110% 20/20100% 20/20100% 20/20100% 2
Gilbert Hall(0015) -W {ID 420} 39/38103% 38/38100% 38/38100% 38/38100% 1
Gilkey Hall(0037) -NE {ID 333} 15/14107% 14/14100% 14/14100% 14/14100% 1
Monday, February 28, 2011 Page 4 of 7

Total Group Covered All Uncovered All
All Hoop All Wheel All Other Covered Hoop
Covered Wheel
Cover Other Uncovered Hoop
Uncovered Wheel
Uncovered Other
Bike Locker Not in Rack
Gilkey Hall(0037) -NW {ID 311} 7/1450% 7/1450% 7/1450% 7/1450%
Gilkey Hall(0037) -S {ID 310}Gill Coliseum(0121) -N {ID 609} 9/2143% 8/2138% 8/2138% 8/2138% 1
Gill Coliseum(0121) -S {ID 610} 18/11164% 11/11100% 11/11100% 11/11100% 7
Gill Coliseum(0121) -SE {ID 611} 8/2730% 1/714% 7/2035% 7/2035% 1/714% 1/714% 7/2035%
Gilmore Hall(0084) -E {ID 229} 10/1377% 10/1377% 10/1377% 10/1377%
Gilmore Hall(0084) -N {ID 228} 10/1283% 10/1283% 10/1283% 10/1283%
Gladys Valley Gymnastics Center(0033) -E {ID 403} 24/2789% 22/2781% 22/2781% 22/2781% 2
Gleeson Hall (Chem Engr)(0016) -W {ID 415} 13/10130% 9/1090% 9/1090% 9/1090% 4
Hawley Hall(0119) -N {ID 218} 15/14107% 14/14100% 14/14100% 14/14100% 1
Hawley Hall(0119) -S {ID 206} 16/10160% 10/10100% 0/100% 10/0 0/100% 10/0 6
Hawley Hall(0119) -S {ID 259} 72/16450% 36/0 36/16225% 72/16450% 36/0 36/16225%
Hawley Hall(0119) -W {ID 217} 15/1694% 12/0 0/160% 0/160% 12/0 12/0 0/160% 3
Heckert Lodge(0116) -E {ID 205} 11/1292% 11/1292% 11/1292% 11/1292%
Heckert Lodge(0116) -W {ID 204} 73/8685% 41/5082% 32/3689% 32/7642% 41/10410% 0/400% 41/10410% 32/3689%
Hinsdale Wave Research Lab(0137) -N {ID 121} 1/813% 1/425% 0/40% 0/40% 1/425% 0/40% 1/0 0/40%
Hovland Hall(0092) -N {ID 227} 22/3073% 22/3073% 22/3073% 22/3073%
Hovland Hall(0092) -S {ID 226} 52/27193% 50/27185% 43/20215% 7/7100% 43/20215% 7/7100% 2
Industrial Bldg Annex(0059) -E {ID 629}Kearney Hall(0001) -E {ID 434} 40/5080% 40/5080% 40/5080% 40/5080%
Kearney Hall(0001) -N {ID 433} 52/18289% 41/0 11/1861% 52/18289% 41/0 11/1861%
Kelley Engineering Center(0003) -E {ID 318} 27/24113% 24/24100% 24/24100% 24/24100% 3
Kelley Engineering Center(0003) -NE {ID 317}Kerr Administration Bldg(0061) -E {ID 513} 6/808% 6/808% 6/808% 6/808%
Kerr Administration Bldg(0061) -N {ID 514} 35/11630% 35/11630% 0/700% 35/4676% 0/700% 35/4676%
Kerr Administration Bldg(0061) -W {ID 512} 5/2719% 5/2719% 5/2719% 5/2719%
Key Shop(0048) -S {ID 515} 0/30% 0/30% 0/30% 0/30%
Kidder Hall(0034) -E {ID 437} 9/1090% 9/1090% 9/1090% 9/1090%
Kidder Hall(0034) -N {ID 413} 56/6685% 54/6682% 54/6682% 54/6682% 2
Kidder Hall(0034) -S {ID 412} 31/26119% 26/26100% 26/26100% 26/26100% 5
Kidder Hall(0034) -W {ID 414} 12/1486% 12/1486% 12/1486% 12/1486%
Langton Hall(0105) -N {ID 503} 39/7155% 36/7151% 24/5643% 12/1580% 24/5643% 12/1580% 3
LaSells Stewart Center(0200) -N {ID 615} 0/210% 0/210% 0/210% 0/210%
Magruder Hall(0153) -E {ID 602} 43/5086% 43/5086% 43/5086% 43/5086%
Magruder Hall(0153) -S {ID 601} 10/3033% 10/3033% 10/3033% 10/3033%
McNary Hall(0190) -E {ID 521}McNary Hall(0190) -N {ID 519} 113/107106% 109/107102% 109/107102% 109/107102% 4
Memorial Union Bldg(0083) -E {ID 304} 64/8674% 59/8074% 0/60% 59/8669% 59/8074% 0/60% 5
Memorial Union Bldg(0083) -NNW {ID 303} 17/2085% 17/2085% 17/2085% 17/2085%
Memorial Union Bldg(0083) -NW {ID 302} 21/20105% 19/2095% 19/2095% 19/2095% 2
Memorial Union Bldg(0083) -S {ID 331} 3/1323% 3/1323% 3/1323% 3/1323%
Memorial Union Bldg(0083) -W {ID 301} 16/4040% 15/4038% 15/4038% 15/4038% 1
Merrit Truax Indoor Practice Center(0142) -SE {ID 2/2010% 2/2010% 2/2010% 2/2010%
Merryfield Hall(0002) -W {ID 430} 11/7157% 7/7100% 7/7100% 7/7100% 4
Milam Hall(0081) -E {ID 315} 19/14136% 14/14100% 14/14100% 14/14100% 5
Milam Hall(0081) -N {ID 312} 17/2085% 14/2070% 14/2070% 14/2070% 3
Milam Hall(0081) -S {ID 313} 34/27126% 27/27100% 27/27100% 27/27100% 7
Milam Hall(0081) -SW {ID 334} 23/2688% 22/2685% 22/2685% 22/2685% 1
Milam Hall(0081) -W {ID 314} 73/43170% 43/43100% 8/8100% 35/35100% 8/8100% 35/35100% 30
Milne Computer Center(0020) -E {ID 411} 12/1867% 12/1867% 12/1867% 12/1867%
Moreland Hall(0106) -N {ID 502} 28/3288% 28/3288% 20/20100% 8/1267% 20/20100% 8/1267%
Nash Hall(0021) -N {ID 225} 36/6060% 36/6060% 36/6060% 36/6060%
National Forage Seed Center(NInv-156) -S {ID 119} 4/3611% 4/3611% 4/3611% 4/3611%
Native American Longhouse(0107) -W {ID 501} 2/1118% 2/1118% 2/1118% 2/1118%
Navy ROTC Armory(0117) -E {ID 507} 11/1385% 8/1362% 8/1362% 8/1362% 3
Monday, February 28, 2011 Page 5 of 7

Total Group Covered All Uncovered All
All Hoop All Wheel All Other Covered Hoop
Covered Wheel
Cover Other Uncovered Hoop
Uncovered Wheel
Uncovered Other
Bike Locker Not in Rack
Oak Creek Building(0545) -N {ID 632} 4/757% 3/743% 3/743% 3/743% 1
Oak Creek Building(0545) -S {ID 633} 3/1225% 3/1225% 3/1225% 3/1225%
Oak Creek Building(0545) -SE {ID 635} 14/2264% 14/2264% 14/2264% 14/2264%
Orchard Court Unit-B(0202-B) -N {ID 124} 23/2785% 23/2785% 23/2785% 23/2785%
Orchard Court Unit-EL(0202-EL) -S {ID 117} 17/2665% 17/2665% 17/2665% 17/2665%
Owen Hall(0022) -S {ID 431} 54/50108% 50/50100% 50/50100% 50/50100% 4
Owen Hall(0022) -W {ID 432} 37/23161% 24/23104% 24/23104% 24/23104% 13
Oxford House(0220) -N {ID 523} 15/3543% 15/3543% 15/3543% 15/3543%
Parking Services Building(0045) -W {ID 529} 0/60% 0/60% 0/60% 0/60%
Peavy Hall(0124) -E {ID 105} 45/5287% 45/5287% 20/20100% 25/3278% 20/20100% 25/3278%
Peavy Hall(0124) -N {ID 106} 90/89101% 28/28100% 54/6189% 40/40100% 42/4986% 28/28100% 40/40100% 14/2167% 8
Peavy Hall(0124) -NW {ID 127} 16/4040% 16/4040% 16/4040% 16/4040%
Peavy Hall(0124) -S {ID 107} 8/7114% 7/7100% 7/7100% 7/7100% 1
Peavy Hall(0124) -W {ID 104} 1/1010% 1/1010% 1/1010% 1/1010%
Pharmacy(0030) -E {ID 404} 1/147% 1/147% 1/147% 1/147%
Physical Plant Heating Plant(0056) -E {ID 530} 1/138% 1/138% 1/617% 0/70% 1/617% 0/70%
Plageman Student Health CR(0062) -E {ID 329} 4/757% 4/757% 4/757% 4/757%
Plageman Student Health CR(0062) -N {ID 327} 2/729% 2/729% 2/729% 2/729%
Plageman Student Health CR(0062) -S {ID 326} 1/714% 1/714% 1/714% 1/714%
Plageman Student Health CR(0062) -W {ID 328}Poling Hall(0112) -N {ID 215} 39/4391% 39/4391% 39/4391% 39/4391%
Poling Hall(0112) -NW {ID 208} 24/24100% 24/24100% 8/1080% 16/14114% 8/1080% 16/14114%
Poling Hall(0112) -W {ID 216} 15/14107% 15/14107% 15/14107% 15/14107%
Poling Hall(0112) -W {ID 258} 7/4018% 0/400% 7/0 0/400% 7/0 0/400% 7/0
Pride Center(0853) -NE {ID 637} 2/729% 2/729% 2/729% 2/729%
Prop Svcs(0862) -S {ID 522} 2/540% 2/540% 2/540% 2/540%
Radiation Center(0098) -S {ID 103} 20/2871% 19/2868% 19/2868% 19/2868% 1
Reed Lodge(0118) -E {ID 260} 9/3030% 0/200% 9/1090% 9/3030% 0/200% 9/1090%
Reed Lodge(0118) -S {ID 261} 15/1694% 11/0 4/1625% 15/1694% 11/0 4/1625%
Reser Stadium(0120) -N {ID 605} 4/2020% 4/2020% 4/2020% 4/2020%
Reser Stadium(0120) -S {ID 604} 0/140% 0/140% 0/140% 0/140%
Reser Stadium(0120) -SW {ID 608} 0/260% 0/260% 0/260% 0/260%
Reser Stadium(0120) -W {ID 607} 0/140% 0/140% 0/140% 0/140%
Richardson Hall(0148) -S {ID 109} 7/1070% 7/1070% 7/1070% 7/1070%
Richardson Hall(0148) -W {ID 108} 30/4075% 30/4075% 30/4075% 30/4075%
Rogers Hall(0019) -E {ID 423} 14/10140% 10/10100% 10/10100% 10/10100% 4
Rogers Hall(0019) -N {ID 421} 23/21110% 21/21100% 21/21100% 21/21100% 2
Rogers Hall(0019) -S {ID 422} 4/1527% 2/825% 2/729% 4/1527% 2/825% 2/729%
Sackett Hall(0096) -N {ID 223} 10/7143% 7/7100% 7/7100% 7/7100% 3
Sackett Hall(0096) -NE {ID 253} 9/7129% 7/7100% 7/7100% 7/7100% 2
Sackett Hall(0096) -NE {ID 253} 16/7229% 7/7100% 7/7100% 7/7100% 9
Sackett Hall(0096) -NNW {ID 252} 6/786% 6/786% 6/786% 6/786%
Sackett Hall(0096) -NNW {ID 252} 8/7114% 7/7100% 7/7100% 7/7100% 1
Sackett Hall(0096) -NW {ID 251} 6/1443% 6/1443% 6/1443% 6/1443%
Sackett Hall(0096) -NW {ID 251} 10/1471% 10/1471% 10/1471% 10/1471%
Sackett Hall(0096) -S {ID 222} 62/52119% 52/52100% 52/52100% 52/52100% 10
Seed Lab(0101) -N {ID 128} 1/714% 1/714% 1/714% 1/714%
Shepard Hall(0014) -S {ID 426} 18/14129% 14/14100% 14/14100% 14/14100% 4
Snell Hall(0100) -W {ID 532} 5/683% 5/683% 5/0 0/60% 5/0 0/60%
Snell Hall/ MU East(0100) -E {ID 510} 12/7616% 12/7616% 12/7616% 12/7616%
Snell Hall/ MU East(0100) -N {ID 511} 13/1681% 13/1681% 6/6100% 7/1070% 6/6100% 7/1070%
Snell Hall/ MU East(0100) -W {ID 509} 20/4347% 20/4347% 20/4347% 20/4347%
Sports Performance Center(0156) -SW {ID 636} 16/2080% 8/1080% 5/1050% 13/2065% 8/1080% 5/1050% 3
Strand Agricultural Hall(0038) -E {ID 309} 18/5334% 18/5334% 10/10100% 8/4319% 10/10100% 8/4319%
Strand Agricultural Hall(0038) -N {ID 307} 33/3594% 30/3586% 10/10100% 20/2580% 10/10100% 20/2580% 3
Monday, February 28, 2011 Page 6 of 7
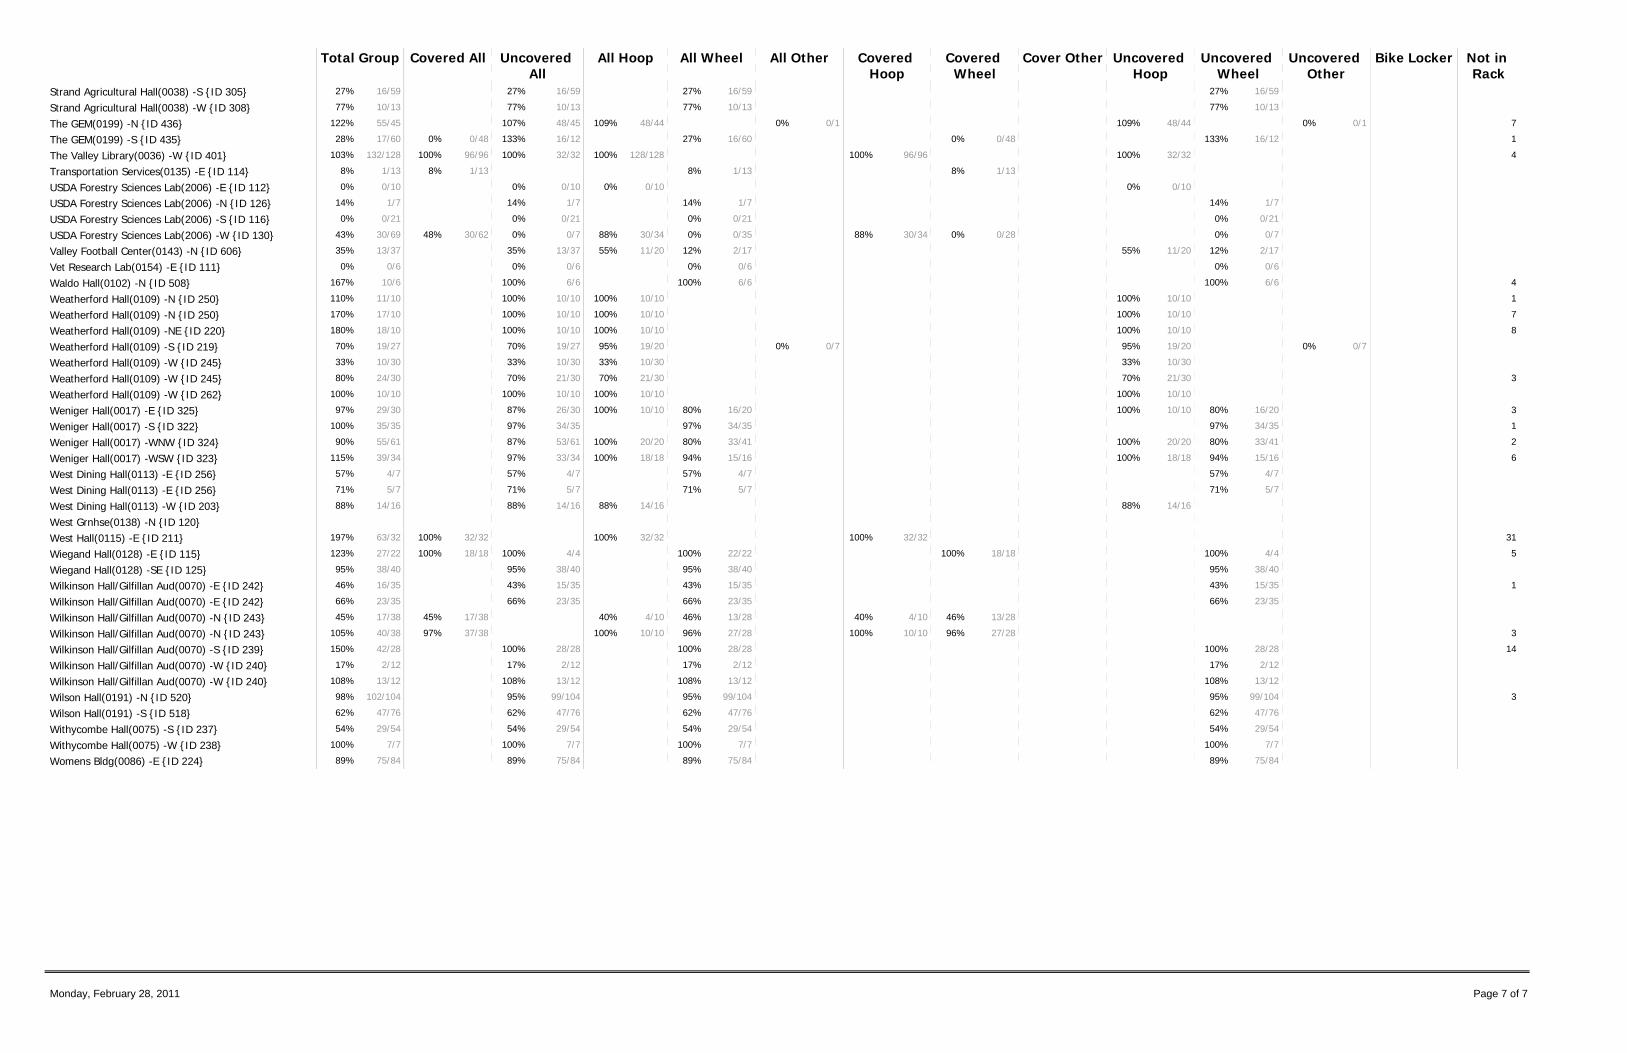
Total Group Covered All Uncovered All
All Hoop All Wheel All Other Covered Hoop
Covered Wheel
Cover Other Uncovered Hoop
Uncovered Wheel
Uncovered Other
Bike Locker Not in Rack
Strand Agricultural Hall(0038) -S {ID 305} 16/5927% 16/5927% 16/5927% 16/5927%
Strand Agricultural Hall(0038) -W {ID 308} 10/1377% 10/1377% 10/1377% 10/1377%
The GEM(0199) -N {ID 436} 55/45122% 48/45107% 48/44109% 0/10% 48/44109% 0/10% 7
The GEM(0199) -S {ID 435} 17/6028% 0/480% 16/12133% 16/6027% 0/480% 16/12133% 1
The Valley Library(0036) -W {ID 401} 132/128103% 96/96100% 32/32100% 128/128100% 96/96100% 32/32100% 4
Transportation Services(0135) -E {ID 114} 1/138% 1/138% 1/138% 1/138%
USDA Forestry Sciences Lab(2006) -E {ID 112} 0/100% 0/100% 0/100% 0/100%
USDA Forestry Sciences Lab(2006) -N {ID 126} 1/714% 1/714% 1/714% 1/714%
USDA Forestry Sciences Lab(2006) -S {ID 116} 0/210% 0/210% 0/210% 0/210%
USDA Forestry Sciences Lab(2006) -W {ID 130} 30/6943% 30/6248% 0/70% 30/3488% 0/350% 30/3488% 0/280% 0/70%
Valley Football Center(0143) -N {ID 606} 13/3735% 13/3735% 11/2055% 2/1712% 11/2055% 2/1712%
Vet Research Lab(0154) -E {ID 111} 0/60% 0/60% 0/60% 0/60%
Waldo Hall(0102) -N {ID 508} 10/6167% 6/6100% 6/6100% 6/6100% 4
Weatherford Hall(0109) -N {ID 250} 11/10110% 10/10100% 10/10100% 10/10100% 1
Weatherford Hall(0109) -N {ID 250} 17/10170% 10/10100% 10/10100% 10/10100% 7
Weatherford Hall(0109) -NE {ID 220} 18/10180% 10/10100% 10/10100% 10/10100% 8
Weatherford Hall(0109) -S {ID 219} 19/2770% 19/2770% 19/2095% 0/70% 19/2095% 0/70%
Weatherford Hall(0109) -W {ID 245} 10/3033% 10/3033% 10/3033% 10/3033%
Weatherford Hall(0109) -W {ID 245} 24/3080% 21/3070% 21/3070% 21/3070% 3
Weatherford Hall(0109) -W {ID 262} 10/10100% 10/10100% 10/10100% 10/10100%
Weniger Hall(0017) -E {ID 325} 29/3097% 26/3087% 10/10100% 16/2080% 10/10100% 16/2080% 3
Weniger Hall(0017) -S {ID 322} 35/35100% 34/3597% 34/3597% 34/3597% 1
Weniger Hall(0017) -WNW {ID 324} 55/6190% 53/6187% 20/20100% 33/4180% 20/20100% 33/4180% 2
Weniger Hall(0017) -WSW {ID 323} 39/34115% 33/3497% 18/18100% 15/1694% 18/18100% 15/1694% 6
West Dining Hall(0113) -E {ID 256} 4/757% 4/757% 4/757% 4/757%
West Dining Hall(0113) -E {ID 256} 5/771% 5/771% 5/771% 5/771%
West Dining Hall(0113) -W {ID 203} 14/1688% 14/1688% 14/1688% 14/1688%
West Grnhse(0138) -N {ID 120}West Hall(0115) -E {ID 211} 63/32197% 32/32100% 32/32100% 32/32100% 31
Wiegand Hall(0128) -E {ID 115} 27/22123% 18/18100% 4/4100% 22/22100% 18/18100% 4/4100% 5
Wiegand Hall(0128) -SE {ID 125} 38/4095% 38/4095% 38/4095% 38/4095%
Wilkinson Hall/Gilfillan Aud(0070) -E {ID 242} 16/3546% 15/3543% 15/3543% 15/3543% 1
Wilkinson Hall/Gilfillan Aud(0070) -E {ID 242} 23/3566% 23/3566% 23/3566% 23/3566%
Wilkinson Hall/Gilfillan Aud(0070) -N {ID 243} 17/3845% 17/3845% 4/1040% 13/2846% 4/1040% 13/2846%
Wilkinson Hall/Gilfillan Aud(0070) -N {ID 243} 40/38105% 37/3897% 10/10100% 27/2896% 10/10100% 27/2896% 3
Wilkinson Hall/Gilfillan Aud(0070) -S {ID 239} 42/28150% 28/28100% 28/28100% 28/28100% 14
Wilkinson Hall/Gilfillan Aud(0070) -W {ID 240} 2/1217% 2/1217% 2/1217% 2/1217%
Wilkinson Hall/Gilfillan Aud(0070) -W {ID 240} 13/12108% 13/12108% 13/12108% 13/12108%
Wilson Hall(0191) -N {ID 520} 102/10498% 99/10495% 99/10495% 99/10495% 3
Wilson Hall(0191) -S {ID 518} 47/7662% 47/7662% 47/7662% 47/7662%
Withycombe Hall(0075) -S {ID 237} 29/5454% 29/5454% 29/5454% 29/5454%
Withycombe Hall(0075) -W {ID 238} 7/7100% 7/7100% 7/7100% 7/7100%
Womens Bldg(0086) -E {ID 224} 75/8489% 75/8489% 75/8489% 75/8489%
Monday, February 28, 2011 Page 7 of 7

Van Buren Ave
Arnold Way28
th S t
29t h
St
32nd
St
Unkn
own
25t h
S t
Alle
yway
16th St
Alle
yway
12th
St
Park
Terr
ace St
Stadium Ave
34t h
St
31st
St
8th S
t
Alle
yway
Alle
yway
Harrison Blvd
14th St
Alle
yway
14th
S t
Unknown
13th
St
Lan g
t on
P l
Orchard Ave
Alle
yway
10th
St
Tyler Ave
E Ave
37th
St D Ave
Maple Tree
Dr
Stam
m Pl
Maple Tree Ct
B Ave
Popl
a r Pl
Alle
yway
14th
St
17th
St
D AveC Ave
30th
St
Maple Tree Ct
Western Blvd
Washington Ave
Wald
o Pl
35t h
St
Hanson St
Hans
on S t
30t h
S t30
t h St
17th S t
Sack
ett P
l
Alle
yway
27th
St
21st
S t
G ro v
e St
33r d
St 23rd
S t
13th St
11th St
11th
St
26 th S t
26t h
St
Ivy Pl
Alle
yway
K ing
s Bl v
d
Washington Way
Monroe Ave
Jackson Ave
Jefferson WayJefferson Ave
30th
St
Johnson Ave
Campus Way
Jackson Ave
Campus Way
Philomath Blvd
Ralph Miller Ln
6th S
t8t
h St
Intramural Way
15t h
S t
15th
St
Alle
yway
16th
St
Jackson Ave
Bent
on Pl
Madison Ave
Jackson Ave
7th S
t
Adams Ave
May Way
9th S
t
10th
St
5th S
t
Washington Way
West Hills Rd
A Ave
10th St
C Ave
13th
St
Pione
er Pl
Alleyway
MCCNashHov
KiddGilkMlm
GilmGmAn
CrpSMoPl
FmSv SPav
ALS
FeedRRLABat
KearOwenShepBexl
CovlGlsn
KECWILb Dear MfdGbAdBalEWithWgnd EGrn
BfBn Bate
Rog GrafCord
ShBn PSHCWGrnGilb
WngrBlkCOABWlkn
DGeo GEM
Burt
ACC
Fund
PrSB
SSCGSSC
HGI
Autz
OBL
EC
SPC
LPSCHFC
INTO
McAF
Resr
OSOCB
SBRRAEL
LSCOcSB
CHAC BlssVFbC
CeCh ArndAdamAFinl
CustHal
Magr
AdamPole CascGill PS1
IndP
HSvcFSStNavy
KeyTPavVtBn
VRLLARITR
HeatCCCFSSh
GSMBDryd GossPBHGWil
DxRC
West
SL
CalPol McDn
CauWsDn
Rich KAd
McNy OxHsLangNALh
SnelWald
MoreWfd
Pvy HkLgBuxtRdLg
Haw
HWRL
Entr DxLg AvLgGVGC AzHsMU EducVLib
FairFbAn SunH
PharSackRC
BnAn
StAg
WBEHSA ClkL Bent
D
E FG
H
AB C
!(527!(524
!(204 !(218!(403
!(612!(601
!(633
!(515
!(621
!(618
!(602
!(616
!(627
!(215!(206
!(510 !(512!(513
!(211
!(523!(213!(214!(205 !(514
!(432
!(101!(119
!(401
!(526!(103
!(102
!(122
!(430!(424!(417
!(416
!(232
!(243!(117
!(622
!(626
!(625!(610
!(609
!(603
!(222 !(221
!(301
!(302!(305
!(304 !(405!(404
!(525 !(528
!(614
!(615
!(604!(608
!(605
!(111
!(628
!(620!(629
!(634
!(507
!(108
!(250
!(257
!(130
!(129
!(128
!(637
!(636
!(334
!(333
!(332
!(255
!(254
!(252!(251 !(253
!(127!(126
!(125
!(531
!(123
!(124
!(635
!(529
!(530
!(331
!(248
!(246
!(208
!(116
!(245
!(219
!(220
!(109
!(107
!(120
!(118
!(113
!(630
!(606
!(517
!(328
!(317!(318
!(324
!(631
!(522
!(114
!(632
!(316
!(303
!(611
!(607
!(623
!(624
!(436
!(330!(242
!(244
!(327!(239
!(422!(418!(322
!(233!(235
!(115
!(421!(420!(325!(329
!(323!(236
!(423!(326
!(435
!(419!(240!(241
!(434
!(619
!(425!(426
!(313
!(228
!(226
!(431!(428!(427
!(413!(319
!(311 !(414
!(315!(312!(314!(229!(227
!(225
!(408!(224
!(407
!(406!(309!(308!(223
!(409
!(410!(411!(412!(307!(310
!(433!(429
!(415!(320
!(321!(230!(231!(237
!(238
!(521!(501
!(106
!(519!(509!(217!(105!(104!(121 !(511!(508!(503!(502!(112
!(520!(518
!(110!(506!(505
!(516
!(504!(216!(207!(209!(203
OSU C
ampu
s Plan
ning
S:\Pla
nning
\Parki
ngan
dTran
sporta
tion\A
ltTran
s\Bicy
cle\20
10\A
ppen
d_F.m
xd W
edne
sday,
Janu
ary 12
, 201
1 04
:41 PM
By
: pad
getts
2010 Bicycle Parking Locations Appendix F
¹0 620 1,240310
Feet
Rack Location & ID Number23

14th
St
Western Blvd
Washington Ave
35t h
St
Tyler Ave
30th
St Maple Tree Ct
30th
St
C Ave
D Ave
17th
St
Alle
yway
Pop l
a r Pl
B Ave
Maple Tree Ct
Stam
m Pl
Maple Tree
Dr
D Ave
37th
St
E Ave
10th
St
Alle
yway
Orchard Ave
Lang
t on
P l
13th
St
Unknown
14th
S t
Alle
yway
14th St
Harrison Blvd
Weat
h erf
ord
Pl
Sack
ett P
l
Alle
yway
Alle
yway
8th S
t
31st
St
34t h
St
Stadium Ave
Park
Terr
ace S
t
12th
St
Alle
yway
16th St
Alle
yway
25t h
S tUn
know
n
32nd
St
29t h
St
28th
S t
Arnold Way Van Buren Ave
Alleyway
Pione
er Pl
13th
St
C Ave
10th St
A Ave
West Hills Rd
Washington Way
5th S
t
10th
St
9th S
t
May Way
Wald
o Pl
Adams Ave
7th S
t
Jackson Ave
Madison Ave
Bent
on Pl
16th
St
Alle
yway
15th
St
15t h
S t
Intramural Way
8th S
t6t
h St
Ralph Miller Ln
Philomath Blvd
Campus Way
Jackson Ave
Campus Way
Johnson Ave
Jefferson Ave
Jefferson Way
Jackson Ave
Monroe Ave
Washington Way
King
s B l
vd
Alle
yway
Ivy Pl
26t h
St
26 th S t
11th
St
11th St
13th St
23r d
S t
33r d
St
G ro v
e St
21st
S t
27th
St Alle
yway
Sack
ett P
l
17th S t
30t h
St30
t h S t
H ans
on S t
Hanson St
Autz
OBL
Educ
SPC
LPSCHFC
INTO
ITR
Resr
OSOCB
SBRRAEL
LSCOcSB
CHAC BlssVFbC
CeCh ArndAdamA
Finl CustHalMagr
AdamPole CascGill PS1IndP
HSvcFSSt
EC
NavyKeyTPav
VtBn VRLLAR HeatCCC
FSSh
GSMBDryd GossPBHGWil
DxRC
WestMcAF
CalPol McDnCau
WsDnRichKAd
McNy OxHsLangNALh
SnelWald
MoreWfdPvy
HkLg BuxtRdLg HawHWRL
Entr DxLgAvLgGVGC AzHsMU VLib
FairFbAn SunHPharSackRCBnAn
StAg
WBEHSA ClkL Bent
MCCNash Hov KiddGilkMlmGilmGmAnCrpSMoPl
FmSv SPavALS
FeedRRLABat KearOwen
ShepBexlWILb
CovlGlsnSL KEC Dear
MfdGbAd
BalEWithWgnd EGrnBfBn Bate
Rog Graf
Cord
ShBnPSHC
WGrnGilbWngr
BlkCOABWlkn
DGeoGEMBurt
ACC
Fund
PrSB
SSCGSSC
HGI H
AB C
D
E FG
OSU C
ampu
s Plan
ning
S:\Pla
nning
\Parki
ngan
dTran
sporta
tion\A
ltTran
s\Bicy
cle\20
10\A
ppen
d_E.m
xd W
edne
sday,
Janu
ary 12
, 201
1 04
:35 PM
By
: pad
getts
Bike Rack Condition#0 Missing#0 Unanchored#0 Damaged
2010 Bicycle Parking Physical Status Appendix E
¹0 600 1,200300
Feet

14th
St
Western Blvd
Washington Ave
35t h
St
Tyler Ave
30th
St Maple Tree Ct
30th
St
C Ave
D Ave
17th
St
Alle
yway
Pop l
a r Pl
B Ave
Maple Tree Ct
Stam
m Pl
Maple Tree
Dr
D Ave
37th
St
E Ave
10th
St
Alle
yway
Orchard Ave
Lang
t on
P l
13th
St
Unknown
14th
S t
Alle
yway
14th St
Harrison Blvd
Weat
h erf
ord
Pl
Sack
ett P
l
Alle
yway
Alle
yway
8th S
t
31st
St
34t h
St
Stadium Ave
Park
Terr
ace S
t
12th
St
Alle
yway
16th St
Alle
yway
25t h
S tUn
know
n
32nd
St
29t h
St
28th
S t
Arnold Way Van Buren Ave
Alleyway
Pione
er Pl
13th
St
C Ave
10th St
A Ave
West Hills Rd
Washington Way
5th S
t
10th
St
9th S
t
May Way
Wald
o Pl
Adams Ave
Memo
ri al P
l
7th S
t
Jackson Ave
Madison Ave
Bent
on Pl
16th
St
Alle
yway
15th
St
15t h
S t
Intramural Way
8th S
t6t
h St
Ralph Miller Ln
Philomath Blvd
Campus Way
Jackson Ave
Campus Way
Johnson Ave
Jefferson Ave
Jefferson Way
Jackson Ave
Monroe Ave
Washington Way
King
s B l
vd
Alle
yway
Ivy Pl
26t h
St
26 th S t
11th
St
11th St
13th St
23r d
S t
33r d
St
G ro v
e St
21st
S t
27th
St Alle
yway
Sack
ett P
l
17th S t
30t h
St30
t h S t
H ans
on S t
Hanson St
Autz
OBL
PBHG
SPC
LPSCHFC
INTO
McNy
Resr
OCB
LSC
CHAC BlssVFbC
CeCh ArndAdamA
Finl HalMagr
AdamCascGill
IndP
Navy Key
VRL HeatCCC
DrydWil
DxRCWest
EC
CalPolCauWsDnRich
KAd
OxHsLangNALh
SnelWald
MoreWfdPvy
HkLg BuxtRdLg HawHWRL
AvLgGVGC AzHsMUEducVLib
Fair PharSack
OS
SBRRAEL
OcSB
CustPole PS1
HSvcFSSt
TPavVtBn LAR
ITRFSSh
GSMBGoss McAFMcDn
Entr DxLg
FbAn SunHRCBnAn
StAgWBEHSA ClkL Bent
MCCNashHov KiddGilkMlmGilmCrpSMoPl
Bat KearOwenShepBexl CovlGlsnSL KEC DearMfd
Bate GbAdBalE
WithWgnd EGrnRog
Cord
PSHCGilbWngr
BlkCWlkn GEMBurt
PrSB
GmAnFmSv SPav
ALSFeedRRLA
WILbBfBn GrafShBn WGrn
OABDGeo
ACC
Fund
SSCGSSC
HGI H
AB C
D
E FG
OSU C
ampu
s Plan
ning
s:\pla
nning
\parki
ngan
dtran
sport
ation
\alttr
ans\b
icycle
\2010
\appe
nd_b
.mxd
Thu
rsday,
Janu
ary 6,
2011
11:3
6 AM
By:
padg
etts
2010 Bicycle Parking Capacity by Building Appendix D
¹0 600 1,200300
Feet
Uncovered
Covered
Relative CapacityCapacity by Building

Van Buren Ave
Arnold Way28
th S t
29t h
St
32nd
St
Unkn
own
25t h
S t
Alle
yway
16th St
Alle
yway
12th
St
Park
Terr
ace S
t
Stadium Ave
34t h
St
31st
St
8th S
t
Alle
yway
Alle
yway
Harrison Blvd
14th St
Alle
yway
14th
S t
Unknown
13th
St
Lan g
t on
P l
Orchard Ave
Alle
yway
10th
St
Tyler Ave
E Ave
37th
St D Ave
Maple Tree
Dr
Stam
m Pl
Maple Tree Ct
B Ave
Popl
a r Pl
Alle
yway
14th
St
17th
St
D AveC Ave
30th
St
Maple Tree Ct
Western Blvd
Washington Ave
Wald
o Pl
35t h
St
Hanson St
Hans
on S t
30t h
S t30
t h St
17th S t
Sack
ett P
l
Alle
yway
27th
St
21st
S t
G ro v
e St
33r d
St 23rd
S t
13th St
11th St
11th
St
26 th S t
26t h
St
Ivy Pl
Alle
yway
K ing
s Bl v
d
Washington Way
Monroe Ave
Jackson Ave
Jefferson WayJefferson Ave
30th
St
Johnson Ave
Campus Way
Jackson Ave
Campus Way
Philomath Blvd
Ralph Miller Ln
6th S
t8t
h St
Intramural Way
15t h
S t
15th
St
Alle
yway
16th
St
Jackson Ave
Bent
on Pl
Madison Ave
Jackson Ave
7th S
t
Adams Ave
May Way
9th S
t
10th
St
5th S
t
Washington Way
West Hills Rd
A Ave
10th St
C Ave
13th
St
Pione
er Pl
Alleyway
MCCNashHov KiddGilk
MlmGilmGmAn
CrpSMoPl
FmSv SPav
ALS
FeedRRLABat
KearOwenShepBexl
CovlGlsn
KECWILb Dear MfdGbAdBalE
WithWgndEGrn
BfBn BateRog Graf
Cord
ShBnPSHC
WGrnGilb
WngrBlkCOABWlkn
DGeo GEMBurt
ACC
Fund
PrSB
SSCGSSC
HGI
Autz
OBL
EC
SPC
LPSCHFC
INTO
McAF
Resr
OSOCB
SBRRAEL
LSCOcSB
CHAC BlssVFbC
CeCh ArndAdamA
Finl Cust
HalMagr
AdamPole CascGill PS1
IndP
HSvcFSStNavy
KeyTPavVtBn
VRLLARITR
HeatCCCFSSh
GSMBDryd GossPBHGWil
DxRC
West
SL
CalPol
McDnCau
WsDnRichKAd
McNy OxHsLangNALh
SnelWald
MoreWfd
Pvy HkLgBuxtRdLg
HawHWRL
Entr DxLg AvLgGVGC AzHsMU EducVLib
FairFbAn SunH
PharSackRC
BnAn
StAg
WBEHSA ClkL Bent
D
E FG
H
AB C
527524
204218
403
612601
633
515
621
618602
616
627
215
206510
512 513
211
523213
214205 514
432
101119
401
526103
102
122
430424
417
416232
243117
622626
625610
609
603
222221
301
302305304
405404
525 528
614
615
604608
605
111
628
620629
634
507
108
250
257
130
129
128
637636
334
333
332
255
254
252
251 253
127126
125
531
123
124
635
529
530
331
248
246
208
116
245
219
220
109
107
120
118
113
630
606
517
328
317318
324
631
522
114
632
316
303
611
607
623
624
436
330242
244
327239
422418322233
235115
421420325329
323
236
423326
435419
240241
434
619
425426
313
228
226
431428427
413
319311 414
315312
314229227225
408224407
406309308223
409
410411412307
310
433429
415320
321230231237
238
521501
106
519509217105104121511508503502112
520518
110506
505
516
504216207
209203
OSU C
ampu
s Plan
ning
S:\Pla
nning
\Parki
ngan
dTran
sporta
tion\A
ltTran
s\Bicy
cle\20
10\A
ppen
d_C.m
xd W
edne
sday,
Janu
ary 12
, 201
1 04
:13 PM
By
: pad
getts
Bike Rack% Utilization
0% - 24%25% - 49%50% - 74%75% - 99%100% - 289%
2010 Bicycle Parking Utilization by Location Appendix C
¹0 600 1,200300
Feet

14th
St
Western Blvd
Washington Ave
35t h
St
Tyler Ave
30th
St Maple Tree Ct
30th
St
C Ave
D Ave
17th
St
Alle
yway
Pop l
a r Pl
B Ave
Maple Tree Ct
Stam
m Pl
Maple Tree
Dr
D Ave
37th
St
E Ave
10th
St
Alle
yway
Orchard Ave
Lang
t on
P l
13th
St
Unknown
14th
S t
Alle
yway
14th St
Harrison Blvd
Weat
h erf
ord
Pl
Sack
ett P
l
Alle
yway
Alle
yway
8th S
t
31st
St
34t h
St
Stadium Ave
Park
Terr
ace S
t
12th
St
Alle
yway
16th St
Alle
yway
25t h
S tUn
know
n
32nd
St
29t h
St
28th
S t
Arnold Way Van Buren Ave
Alleyway
Pione
er Pl
13th
St
C Ave
10th St
A Ave
West Hills Rd
Washington Way
5th S
t
10th
St
9th S
t
May Way
Wald
o Pl
Adams Ave
Memo
ri al P
l
7th S
t
Jackson Ave
Madison Ave
Bent
on Pl
16th
St
Alle
yway
15th
St
15t h
S t
Intramural Way
8th S
t6t
h St
Ralph Miller Ln
Philomath Blvd
Campus Way
Jackson Ave
Campus Way
Johnson Ave
Jefferson Ave
Jefferson Way
Jackson Ave
Monroe Ave
Washington Way
King
s B l
vd
Alle
yway
Ivy Pl
26t h
St
26 th S t
11th
St
11th St
13th St
23r d
S t
33r d
St
G ro v
e St
21st
S t
27th
St Alle
yway
Sack
ett P
l
17th S t
30t h
St30
t h S t
H ans
on S t
Hanson St
Autz
OBL
PBHG
SPC
LPSCHFC
INTO
McNy
Resr
OCB
LSC
CHAC BlssVFbC
CeCh ArndAdamA
Finl HalMagr
AdamCascGill
IndP
Navy KeyVRL Heat
CCCDryd
Wil
DxRC
West
EC
CalPolCauWsDnRich
KAd
OxHsLangNALh
SnelWald
MoreWfdPvy
HkLg BuxtRdLg HawHWRL
AvLgGVGC AzHsMUEducVLib
Fair PharSack
OS
SBRRAEL
OcSB
CustPole PS1
HSvcFSSt
TPavVtBn LAR
ITRFSSh
GSMBGoss McAFMcDn
Entr DxLg
FbAn SunHRCBnAn
StAgWBEHSA ClkL Bent
MCCNash Hov KiddGilkMlmGilmCrpSMoPlBat KearOwenShepBexl CovlGlsnSL KEC Dear
MfdBate GbAd
BalEWithWgnd EGrn
Rog
Cord
PSHCGilbWngr
BlkCWlkn GEMBurt
PrSB
GmAnFmSv SPav
ALSFeedRRLA
WILbBfBn GrafShBn WGrn
OABDGeo
ACC
Fund
SSCGSSC
HGI
H
AB C
D
E FG
OSU C
ampu
s Plan
ning
s:\pla
nning
\parki
ngan
dtran
sport
ation
\alttr
ans\b
icycle
\2010
\appe
nd_b
.mxd
Thu
rsday,
Janu
ary 6,
2011
11:3
6 AM
By:
padg
etts
Bike ParkingUtilization
0% - 24%25% - 49%50% - 74%75% - 99%100% - 211%
2010 Bicycle Parking Utilization by Building Appendix B
¹0 610 1,220305
Feet

Bicycle Parking Survey Damage Report 2010
Appendix G
Building Side Bldg #Loc ID
Missing
Unanchored
Comments Responsibility
Damaged
Campus Sector B
West Grnhse N 0133 120 rack removed FacServ
Campus Sector C
Ballard Extension Hall NE 0067 332 FacServ
Bexell Hall S 0018 319 FacServ
Bexell Hall W 0018 321 FacServ
Education Hall W 0028 405 FacServ
Gilbert Hall W 0015 420 FacServ
Gilkey Hall NW 0037 311 FacServ
Gilkey Hall S 0037 310 FacServ
Gilmore Hall N 0084 228 FacServ
Kelley Engineering Center NE 0003 317 FacServ
Memorial Union Bldg NW 0083 302 FacServ
Memorial Union Bldg S 0083 331 FacServ
Milam Hall N 0081 312 FacServ
Milam Hall W 0081 314 FacServ
Owen Hall W 0022 432 FacServ
Pharmacy E 0030 404 FacServ
Printed: 05-Jan-2011 12:18 pm Page 1 of 2

Building Side Bldg #Loc ID
Missing
Unanchored
Comments Responsibility
Damaged
Plageman Student Health E 0062 329 FacServ
Plageman Student Health W 0062 328 FacServ
Strand Agricultural Hall E 0038 309 FacServ
Strand Agricultural Hall N 0038 307 FacServ
Strand Agricultural Hall S 0038 305 FacServ
Strand Agricultural Hall W 0038 308 FacServ
Weniger Hall E 0017 325 FacServ
Weniger Hall S 0017 322 FacServ
Campus Sector D
Azalea House S 0026 524 Housing|Dining
Callahan Hall N 0192 516 12 wheel racks unusable due to location Housing|Dining
McNary Hall E 0190 521 Housing|Dining
Campus Sector F
Reser Stadium S 0120 604 FacServ
Reser Stadium W 0120 607 FacServ
Campus Sector G
Bloss Hall N 0198 616 Housing|Dining
Cascade Hall W 0058 634 FacServ
Industrial Bldg Annex E 0059 629 FacServ
LaSells Stewart Center N 0200 615 FacServ
Printed: 05-Jan-2011 12:18 pm Page 2 of 2
Related Documents