Facilitating the use of recorded lectures : analysing students' interactions to understand their navigational needs Citation for published version (APA): Gorissen, P. J. B. (2013). Facilitating the use of recorded lectures : analysing students' interactions to understand their navigational needs. Technische Universiteit Eindhoven. https://doi.org/10.6100/IR753927 DOI: 10.6100/IR753927 Document status and date: Published: 01/01/2013 Document Version: Publisher’s PDF, also known as Version of Record (includes final page, issue and volume numbers) Please check the document version of this publication: • A submitted manuscript is the version of the article upon submission and before peer-review. There can be important differences between the submitted version and the official published version of record. People interested in the research are advised to contact the author for the final version of the publication, or visit the DOI to the publisher's website. • The final author version and the galley proof are versions of the publication after peer review. • The final published version features the final layout of the paper including the volume, issue and page numbers. Link to publication General rights Copyright and moral rights for the publications made accessible in the public portal are retained by the authors and/or other copyright owners and it is a condition of accessing publications that users recognise and abide by the legal requirements associated with these rights. • Users may download and print one copy of any publication from the public portal for the purpose of private study or research. • You may not further distribute the material or use it for any profit-making activity or commercial gain • You may freely distribute the URL identifying the publication in the public portal. If the publication is distributed under the terms of Article 25fa of the Dutch Copyright Act, indicated by the “Taverne” license above, please follow below link for the End User Agreement: www.tue.nl/taverne Take down policy If you believe that this document breaches copyright please contact us at: [email protected] providing details and we will investigate your claim. Download date: 30. May. 2022

Welcome message from author
This document is posted to help you gain knowledge. Please leave a comment to let me know what you think about it! Share it to your friends and learn new things together.
Transcript
Facilitating the use of recorded lectures : analysing students'interactions to understand their navigational needsCitation for published version (APA):Gorissen, P. J. B. (2013). Facilitating the use of recorded lectures : analysing students' interactions tounderstand their navigational needs. Technische Universiteit Eindhoven. https://doi.org/10.6100/IR753927
DOI:10.6100/IR753927
Document status and date:Published: 01/01/2013
Document Version:Publisher’s PDF, also known as Version of Record (includes final page, issue and volume numbers)
Please check the document version of this publication:
• A submitted manuscript is the version of the article upon submission and before peer-review. There can beimportant differences between the submitted version and the official published version of record. Peopleinterested in the research are advised to contact the author for the final version of the publication, or visit theDOI to the publisher's website.• The final author version and the galley proof are versions of the publication after peer review.• The final published version features the final layout of the paper including the volume, issue and pagenumbers.Link to publication
General rightsCopyright and moral rights for the publications made accessible in the public portal are retained by the authors and/or other copyright ownersand it is a condition of accessing publications that users recognise and abide by the legal requirements associated with these rights.
• Users may download and print one copy of any publication from the public portal for the purpose of private study or research. • You may not further distribute the material or use it for any profit-making activity or commercial gain • You may freely distribute the URL identifying the publication in the public portal.
If the publication is distributed under the terms of Article 25fa of the Dutch Copyright Act, indicated by the “Taverne” license above, pleasefollow below link for the End User Agreement:www.tue.nl/taverne
Take down policyIf you believe that this document breaches copyright please contact us at:[email protected] details and we will investigate your claim.
Download date: 30. May. 2022

FAC
ILITATIN
G TH
E USE O
F REC
OR
DED
LECTU
RES: A
NA
LySIN
G STUD
ENTS’ IN
TERA
CTIO
NS TO U
ND
ERSTA
ND TH
EIR NA
vIG
ATIO
NA
L NEED
S P
ierr
e Go
rissen
Pierre Gorissen
FACILITATING THE USE OF RECORDED LECTURES: ANALySING STUDENTS’ INTERACTIONS TO UNDERSTAND THEIR NAvIGATIONAL NEEDS
UitnodigingVoor het bijwonen van de openbare verdediging van mijn proefschrift
Facilitating the use of recorded lectures: Analysing students’ interactions to understand their navigational needs
De verdediging vindt plaats op woensdag 12 juni 2013 16:00 uur, zaal 4 van de Technische Universiteit EindhovenDen Dolech 2 te Eindhoven
Aansluitend is er een receptie in café de Zwarte Doos op het TU/e terrein
ParanimfenConnie [email protected]
Erik [email protected]
Pierre GorissenFitissingel 2105754 CE [email protected]
Facilitating the use of recorded lectures: Analysing students’ interactions to understand
their navigational needs
Pierre Gorissen
This doctoral dissertation was financially supported by the STIP fund of Fontys Hogescholen and facilitated by the Eindhoven School of Education (Eindhoven University of Technology)
© 2013 Pierre Gorissen
A catalogue record is available from the Eindhoven University of Technology Library ISBN: 978-90-386-3376-3 NUR: 841 Printed by: Printservice TU/e
Cover design: Vladimir Simonjan (http://vydesign.nl/)
An online version is available at http://recordedlectures.com/
Facilitating the use of recorded lectures: Analysing students’ interactions to understand their
navigational needs.
PROEFSCHRIFT
ter verkrijging van de graad van doctor aan de Technische Universiteit Eindhoven, op gezag van de
rector magnificus, prof.dr.ir. C.J. van Duijn, voor een commissie aangewezen door het College voor
Promoties in het openbaar te verdedigen op woensdag 12 juni 2013 om 16.00 uur
door
Petrus Johannes Barbara Gorissen
geboren te Beek
Dit proefschrift is goedgekeurd door de promotor:
prof.dr. W.M.G. Jochems
Copromotor: dr. J M. van Bruggen

Everything that can be counted does not necessarily count; everything that counts cannot necessarily be counted.
— William Bruce Cameron (1963)

This page has been intentionally left blank
i
Contents
Contents i
List of figures v
List of tables vii
Dankwoord ix
Chapter 1 Introduction 1
1.1 Overview 1
1.2 The context of the research 2
1.3 Outline of the research 3
1.4 Outline of this dissertation 4
Chapter 2 Theoretical framework 7
2.1 Introduction 7
2.2 Lectures 7
2.3 Recording and broadcasting a lecture 12
2.4 Tagging recorded lectures 22
2.5 Context of the research 24
Chapter 3 Students and recorded lectures: Survey on current use and demands for higher education 27
3.1 Summary 27
3.2 Introduction 28
3.3 Lecture capturing 29
3.4 The Study 31
3.5 Results 35
3.6 Discussion 44
3.7 Conclusions 45
Chapter 4 Usage Reporting on Recorded Lectures using Educational Data Mining 47
4.1 Abstract 47
4.2 Introduction 48
Contents
ii
4.3 Lecture capturing 50
4.4 Method 52
4.5 Results for the total dataset 58
4.6 Results for the detailed analysis of course C01 60
4.7 Conclusions 67
Chapter 5 Methodological triangulation of the students’ use of recorded lectures 69
5.1 Abstract 69
5.2 Introduction 70
5.3 Method 74
5.4 Results 83
5.5 Conclusions 91
Chapter 6 Does tagging improve the navigation of recorded lectures by students? 95
6.1 Summary 95
6.2 Introduction 95
6.3 Method 96
6.4 Results 104
6.5 Conclusions and discussion 109
Chapter 7 Comparing student and expert based tagging of recorded lectures 113
7.1 Abstract 113
7.2 Introduction 113
7.3 Method 116
7.4 Results 120
7.5 Conclusions and discussion 130
Appendix 1 Tagging protocol 132
Appendix 2 Vector space modelling 134
Contents
iii
Chapter 8 Conclusions and discussion 137
8.1 Introduction 137
8.2 Methods used 138
8.3 Main findings and conclusions 143
8.4 Discussion and recommendations 147
8.5 Limitations of the study 149
8.6 Suggestions for further research 151
References 153
Summary 165
Samenvatting 169
List of Publications 175
Curriculum Vitae 179
Eindhoven School of Education dissertation series 181
Contents
iv
This page has been intentionally left blank
v
List of figures
Figure 2.1 Example LCS system architecture .................................................. 18
Figure 3.1 Mediasite LCS user interface of recorded lecture ........................ 31
Figure 4.1 A common LCS architecture ........................................................... 51
Figure 4.2 Recorded Lecture User Interface example .................................... 52
Figure 4.3 Data pre-processing steps ............................................................... 54
Figure 4.4 Microsoft Windows Media Service log file ................................... 54
Figure 4.5 Creation of dataset for detailed analysis ....................................... 58
Figure 4.6 Number of learner sessions per week ........................................... 61
Figure 4.7 Repeated use per recorded lecture................................................. 65
Figure 5.1 Example of a recorded lecture ........................................................ 71
Figure 5.2 Data pre-processing steps ............................................................... 78
Figure 5.3 Combining the data sources ........................................................... 79
Figure 5.4 Data cleaning ..................................................................................... 80
Figure 5.5 Selecting dataset for analysis .......................................................... 82
Figure 5.6 Heatmap of video viewed per student .......................................... 85
Figure 5.7 Number of learner sessions per week ........................................... 90
Figure 6.1 Example of the Regular Interface (RI) ........................................... 99
Figure 6.2 Example of the Tagging Interface (TI) ......................................... 100
Figure 6.3 Adding and editing tags ................................................................ 103
Figure 6.4 Number of recording sessions for TI and RI .............................. 105
Figure 6.5 Number of recording sessions for TI and RI during the last 7 days before the exam ........................................ 106
Figure 6.6 Proportion TI of total number of recording sessions per week ............................................................................ 106
Figure 6.7 Average amount of video (in minutes) per recorded lecture per recording session ................................. 107
Figure 7.1 Mediasite LCS user interface of a recorded lecture ................... 114
Figure 7.2 Example of the tagging interface (in Dutch) .............................. 117
Figure 7.3 Steps in the data preparation process .......................................... 120
Figure 7.4 Expert and student similarity compared .................................... 129
Figure 8.1 Data pre-processing steps ............................................................. 139
Figure 8.2 Tagging interface, admin view ..................................................... 140
Figure 8.3 Tagging interface, student view ................................................... 141
Figure 8.4 Student interface to add tags ........................................................ 142
Figure 8.5 Steps in the data preparation process .......................................... 143
Figures
vi
This page has been intentionally left blank
vii
List of tables
Table 1.1 Overview of the dissertation .............................................................. 5
Table 2.1 Lecture structures ................................................................................. 8
Table 2.2 Courses selected for the research ..................................................... 11
Table 3.1 Courses selected for the survey and response rates...................... 32
Table 3.2 Number of times respondents used recorded lectures for the course ...................................................................................... 35
Table 3.3 Ever used recorded lectures before ................................................. 36
Table 3.4 Reported technical difficulties. ......................................................... 37
Table 3.5 Indicated importance of lecture recording for different purposes. ....................................................................... 38
Table 3.6 Average percentage of a recording viewed. ................................... 40
Table 3.7 Reasons to not watch one or more of the recordings. ................... 41
Table 3.8 Indicated effectiveness in helping to succeed in the course. ....... 42
Table 3.9 Reasons to not attend one or more live lectures. ........................... 43
Table 4.1 Examples of recorded courses and number of recordings. .......... 53
Table 4.2 Part of the data available in each Microsoft Windows Media Service Log file row ........................... 55
Table 4.3 Usage overview per learner session in minutes ............................ 59
Table 4.4 Unique learner sessions per recorded lecture per month for the first part of the course ....................................... 62
Table 4.5 Unique learner sessions per recorded lecture per month for the second part of the course .................................. 63
Table 4.6 Test results versus use of recorded lectures for the exam ............ 66
Table 5.1 Courses selected for the survey and response rates...................... 76
Table 5.2 Importance of the course for the students ...................................... 83
Table 5.3 Indicated effectiveness in helping to success in the course ......... 84
Table 5.4 Features indicated as somewhat or very important while viewing recorded lectures ...................................................... 86
Table 5.5 Somewhat or very important purposes of using recorded lectures .................................................................... 87
Table 5.6 Possible indicators in LCS logs for purpose of use ....................... 88
Table 5.7 Number of times respondents used recorded lectures for the C01 course .............................................. 90
Table 5.8 Average percentage of a recording viewed .................................... 91
Table 6.1 Lecture structures ............................................................................. 101
Tables
viii
Table 6.2 Tags for C01 Lecture 11b ................................................................. 104
Table 6.3 Video received for RI ....................................................................... 108
Table 6.4 Video received and tag click count for TI ..................................... 108
Table 6.5 Descriptive statistics for regression analysis ................................ 109
Table 7.1 Students per video ........................................................................... 122
Table 7.2 Similarity matrix, video 1 – single-word stemmed tags ............. 125
Table 7.3 Similarity matrix video 2 – single word stemmed tags .............. 125
Table 7.4 Crosstable similarity using single word stemmed tags .............. 127
Table 7.5 Cross-table similarity using single-word stemmed tags for students and students versus expert ............. 128
Table 7.6 Lecture structures ............................................................................. 132
Table 7.7 Raw frequencies for the tags used by the students ..................... 134
Table 7.8 normalised vectors ........................................................................... 136
Table 7.9 similarity scores for the students ................................................... 136
Table 7.10 similarity scores for the students (optimised) ............................ 136
ix
Dankwoord
In Artikel 21 van het promotiereglement van de TU/e staat dat het proefschrift dankbetuigingen mag bevatten, “mits in bescheiden vorm, een en ander in overleg met de eerste promotor”. Die laatste toevoeging lijkt in het artikel te zijn opgenomen om te voorkomen dat een promovendus té zeer uit de bocht schiet bij dit onderdeel van het proefschrift. Het schrijven van dit allerlaatste onderdeel gebeurt namelijk op een moment in het promotietraject waarop menig promovendus opeens een vreemd gevoel bekruipt. De realisatie dat het traject bijna afgerond is, dat het werk er op zit, maar ook dat hiermee een einde komt aan een reis, kan zelfs een nuchtere promovendus een beetje melancholisch doen worden.
Maar veel reden voor melancholie is er niet. Want het waren vier ontzettend mooie en leerzame jaren. Waar ik met veel plezier en voldoening op terug zal kijken. En dat heb ik te danken aan een heleboel mensen zonder wie dit niet mogelijk was geweest.
Ik wil daarbij beginnen met het bedanken van het College van Bestuur van Fontys Hogescholen. Fontys biedt me een omgeving waarin ik mezelf kan blijven ontwikkelen en waarbij ik, zowel binnen als buiten Fontys, samen mag werken met inspirerende mensen. Zonder de geboden (financiële) ruimte, was dit onderzoek niet mogelijk geweest. In het verlengde daarvan wil ik Eduard van Hövell bedanken die als mijn directeur de oorspronkelijke aanvraag steunde en Hanneke Reuling voor haar onmisbare steun en enthousiasme tijdens het tweede deel van het traject. Datzelfde geldt voor Marieke van den Hurk die me als teamleider voor een deel van de week moest missen en die me zo veel mogelijk ruimte gegeven heeft voor het uitvoeren van dit onderzoek.
Voordat ik aan het promotietraject begon was me één ding op het hart gedrukt: de klik met promotor en begeleider moet goed zijn, anders wordt het een moeilijk traject. En ik had me geen beter duo kunnen wensen dan Wim Jochems en Jan van Bruggen. Dank voor de vier jaar van prettige samenwerking. Jullie stuurden, prikkelden, daagden uit, maar gaven ook rust daar waar het nodig was. Het zorgde er voor dat ik stap voor stap kon wennen aan de rol van beginnend onderzoeker.
Dankwoord
x
Geen onderzoek zonder een plek waar dat onderzoek uitgevoerd kan worden. Bij Fontys Hogeschool Verpleegkunde zag Josy van Dael het nut van het onderzoek direct in en zegde haar medewerking toe, Patrick de Vos was sparringpartner en Matthieu Berenbroek liet de opnames van zijn colleges als onderwerp van onderzoek gebruiken. Dank hiervoor. Bij de Technische Universiteit Eindhoven (TU/e) maakte Karin Ali, directeur van het Onderwijs en Studenten Service Centrum (STU) het mogelijk dat ik ook daar het onderzoek kon uitvoeren. Maurice Megens verleende me toegang tot de database van de Mediasite server en de bijbehorende logbestanden. Dank je voor het vertrouwen dat je in mijn vaardigheden met jouw toetsenbord had! Bij de TU/e was Chris Snijders in veel van de deelonderzoeken prominent in beeld. Dank je voor je bijdrage en je behulpzame, kritische opmerkingen. Ze hebben enorm geholpen.
Bij Mediamission zijn Robert-Jan Brouwer en Tom van Buren van Mediamission samen een enorme bron van kennis rond Mediasite. Dank voor jullie hulp. I also want to thank Rob Lips, Dharmesh Sampat and Ray Hassell from Sonic Foundry for their help. It is good to see that some of the recommendations coming out of the research are already finding their way into the Mediasite product.
And this dissertation would not have been what it is today without the help of Darcy Carsner Torres from Pen & Pestle. She corrected my English in all the chapters of this dissertation (except for this section!). I know you say it is your job, but I am grateful for your great work.
Natuurlijk horen ook mijn twee paranimfen in dit dankwoord thuis: Connie en Erik, jullie hebben me al eerder bijgestaan en ik ben blij dat jullie ook bij de verdediging van mijn proefschrift weer achter me staan. Erik, dank je voor je wijze adviezen, tips en vragen, zowel tijdens het onderzoek als tijdens de afronding.
Er zijn ook een aantal mensen die meer indirect aan dit onderzoek hebben bijgedragen. Zoals de andere promovendi bij de Eindhoven School of Education en de leden van de kenniskring van het lectoraat Educatieve Functies van ICT. Niek van den Bogert, Nele Sofie Coninx, Ton Marée, Fons Dehing, Ron Dankers, Karel Kreijns, Alexandra Smeets en iedereen die online en offline met me meegeleefd heeft en me van tijd tot tijd vroeg
Dankwoord
xi
“hoe gaat het met je onderzoek?”. Dank voor de gezelligheid en jullie steun en belangstelling.
Dat brengt me bij een aantal mensen die mij bijzonder dierbaar zijn. Lei en Helma, heel veel dank voor alle steun en belangstelling tijdens dit promotietraject. Helma, ik weet dat je er heel graag bij had willen zijn. Tot het allerlaatste moment, bleef je oprecht geïnteresseerd vragen naar mijn onderzoek. We missen je warmte nog elke dag. Mam, jij en pap hebben mij gemaakt tot wat ik nu ben. Jullie hebben laten zien dat je kunt blijven leren en je kunt blijven ontwikkelen. En nu ook zonder pap ben je een voorbeeld van immense levenskracht. Josine, zonder jou was dit niet mogelijk geweest. Er zijn niet genoeg woorden voor mijn liefde en dank. Marit en Niek, papa zat vaak boven op zolder te werken aan iets dat heel lang duurde en wat hij dan voor een stel professoren zou moeten verdedigen. Dat werk is nu eindelijk klaar. Ook jullie zijn vier jaar ouder geworden en vele malen wijzer. Ik ben trots op jullie.
Genoeg gekletst, aan het werk!
Pierre
Dankwoord
xii
This page has been intentionally left blank
1
Chapter 1 Introduction
1.1 Overview The higher education sector strives constantly to improve the quality of its education. The need for this continued improvement can be found in the need for an increasingly highly skilled, flexible workforce (Geerligs, Mittendorff, & Nieuwenhuis, 2004). There has been a move toward educational structures where the personal development and competencies of students play a more important role. And although lectures are still a dominant instructional method used (Hurtado, Eagan, Pryor, Whang, & Tran, 2012), there is a need to replace or extend them so that students gain control over their learning process. One way to do this is by creating recordings of live lectures and providing them online as recorded lectures (Abowd, Atkeson, et al., 1998). Recorded lectures allow students to review lectures at their own pace and at a time and place of their choosing. Thus, recordings offer a more learner-centred approach for lectures (Baecker, Moore, & Zijdemans, 2003; Tomoko Traphagan, Kucsera, & Kishi, 2010) .
The increased availability of broadband internet for students and educational institutions, and the introduction of commercially available turnkey systems, have led to an increase in the number of online available recordings of lectures (Leoni & Lichti, 2009). Reports based on students’ experiences with recorded lectures show they are appreciated by students as an added learning resource (Allers, 2007; Dekker & Allers, 2007; Filius & Lam, 2009; Gosper et al., 2008; Russell, Fass, & Bloothooft, 2008; T. Traphagan, 2005b; Veeramani & Bradly, 2008). This is not only the case for traditional distance students, but for on-campus students as well (Woo et al., 2008). Chang (2007) examined teacher and staff perceptions of lecture recordings, and results showed they favour the use of recorded lectures as well
There are also critics of the use of recorded lectures (Bell, Cockburn, McKenzie, & Vargo, 2001; Lane, 2008; Sheely, 2006; Westera, 2008). Recently, remarks regarding the usefulness of online lectures when
Introduction
2
compared to traditional lectures sparked an intense discussion in the Netherlands (ANP, 2012; Bregman, 2013; Hoven, 2013; van Gemert, 2013; van Hoof, 2013). Proponents of online lectures suggested replacing the live lectures with recorded lectures, while opponents pointed out that the live lectures offer more options for interaction between the students and the lecturer and argued that the lecturer should make the live lectures interesting enough for students to actually attend them.
The problem with much of the existing research, as well as the public discussion mentioned above, is that often the context of the research cited by proponents or opponents is very different. In many cases, the student population and their background are different, or the technology used to create the recorded lectures is not identical, or there has been no triangulation of student self-reports with other available data sources. This makes comparing results, weighing opinions, or adaptation to one’s own local situation difficult. The research reported in this dissertation tries to remedy that problem in part. Our intent is not to cover all angles possible, but to clearly state the context of the research, explicitly select participants, and to thoroughly document the data pre-processing steps taken during the analysis.
1.2 The context of the research The recording and broadcasting of lectures has been a solution for distance education for some time (F. Brown & Brown, 1994). In addition, more and more universities with on-campus students enhance parts of their courses with online video components and lecture recordings. The research will focus on two of those institutions.
Fontys University of Applied Sciences (Fontys Hogescholen) offers four-year programmes leading to a bachelor’s degree upon completion of the undergraduate phase and a master degree upon completion of the post-graduate phase. Fontys has about 40,000 students and about 4,000 staff members. Its 31 schools teach approximately 100 bachelor’s courses offered on a full-time, part-time, sandwich and in-service basis (Fontys, 2013).
The Eindhoven University of Technology (TU/e, Technische Universiteit Eindhoven) specialises in Engineering Science & Technology. The
Chapter 1
3
university offers both bachelor’s programmes and master’s programmes and has about 7,000 students and a total staff of about 3,000, of which about 1,900 are research staff. The Eindhoven University of Technology, the Delft University of Technology and the University of Twente form the 3TU Federation (TU/e, 2010).
A more detailed description of the context of the research is given in Chapter 2 where we introduce the framework that defines our research and describe the context of our research based on that framework.
1.3 Outline of the research Our research focusses on the use of asynchronous recorded lectures in higher education. The main research question for our study is this:
How do students use recorded lectures and how can we facilitate effective use?
We do not assume that the student’s study activity only consists of continuous viewing of recorded lectures but that students also review notes, do assignments, read in their textbooks, and take a short break. For this reason we analyse the use of recorded lectures within the context of a ‘learner session’: an uninterrupted period of time during which a learner accesses one or more recorded lectures (Advanced Distributed Learning, 2004) as part of a number of study activities.
Our main research question raises a number of subsidiary questions:
• How do students use the available recorded lectures? • How do students use recorded lectures according to their self-
report? • What actual usage of the recorded lectures can we derive from the
data on the system, and does that match with what students report?
We will then look at ways to facilitate student use of recorded lectures by improving their navigational support. We want to better support them while they are navigating to the parts of the recorded lecture they want to view. For this research, we will focus on the use of tags as a navigational aid. Tags are textual keywords and phrases, in this case, linking to locations within the recorded lectures (O'Reilly, 2005). We will investigate both the use of expert tagging and of tags created by students themselves.
Introduction
4
1.4 Outline of this dissertation This dissertation consists of eight chapters (see Table 1.1). The theoretical framework in Chapter 2 provides a more detailed description of the context of our research. In Chapter 3, we address the following questions based on the students’ self-reports:
• Where and when do students watch the recorded lectures? • With what purpose do they watch? • If they did not watch the recorded lectures, for what reason did
they not watch? • Is there a relationship between the use of recorded lectures and the
level of ambition of students, the ease of use of the recorded lectures, or the use of other resources available to the student?
In Chapter 4, we look at whether the log data collected by the LCS can provide an answer to these three questions:
• Do students use the recorded lectures as a structural substitute for lecture attendance?
• Do students repeatedly use the recorded lectures or do they use them just once?
• Do students use the recorded lectures to study for the tests/exams for this course?
The results of the students’ self-report and the log data are then triangulated in Chapter 5 to answer the following question:
• What actual usage of the recorded lectures can we derive from the data on the system, and does that match with what students report?
The research then focusses on the use of tags as a way to support the navigation of recorded lectures by the students. In Chapter 6, we will examine the following questions based on expert tagging:
• When do students use tags in recorded lectures? • Does the availability of tags increase the navigation speed of
students? Do the tags help them to more quickly locate the parts of the recorded lectures they want to view?
• Do students who use the tags score better for the exam?
Chapter 1
5
In Chapter 7, we look at tagging by the students. We will address the following questions:
• What strategy do students use when they tag recorded lectures? • Is student tagging a useful addition to expert tagging?
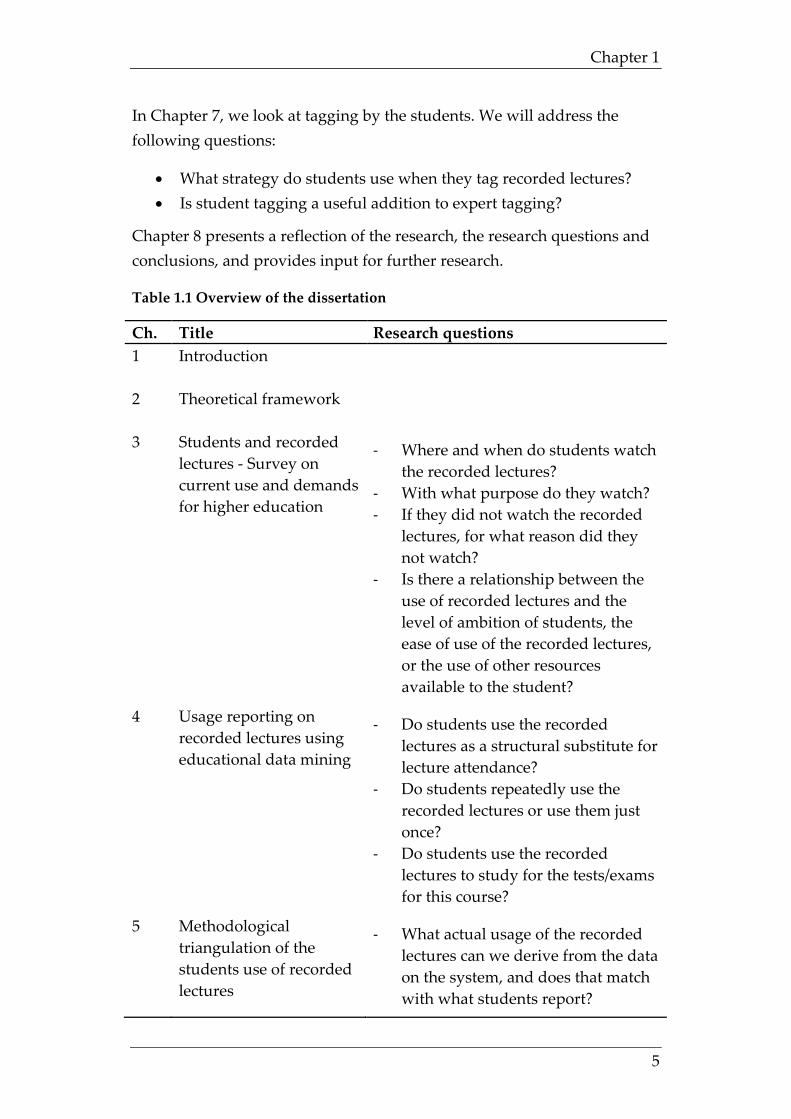
Chapter 8 presents a reflection of the research, the research questions and conclusions, and provides input for further research.
Table 1.1 Overview of the dissertation
Ch. Title Research questions 1 Introduction
2 Theoretical framework
3 Students and recorded lectures - Survey on current use and demands for higher education
- Where and when do students watch the recorded lectures?
- With what purpose do they watch? - If they did not watch the recorded
lectures, for what reason did they not watch?
- Is there a relationship between the use of recorded lectures and the level of ambition of students, the ease of use of the recorded lectures, or the use of other resources available to the student?
4 Usage reporting on recorded lectures using educational data mining
- Do students use the recorded lectures as a structural substitute for lecture attendance?
- Do students repeatedly use the recorded lectures or use them just once?
- Do students use the recorded lectures to study for the tests/exams for this course?
5 Methodological triangulation of the students use of recorded lectures
- What actual usage of the recorded lectures can we derive from the data on the system, and does that match with what students report?
Introduction
6
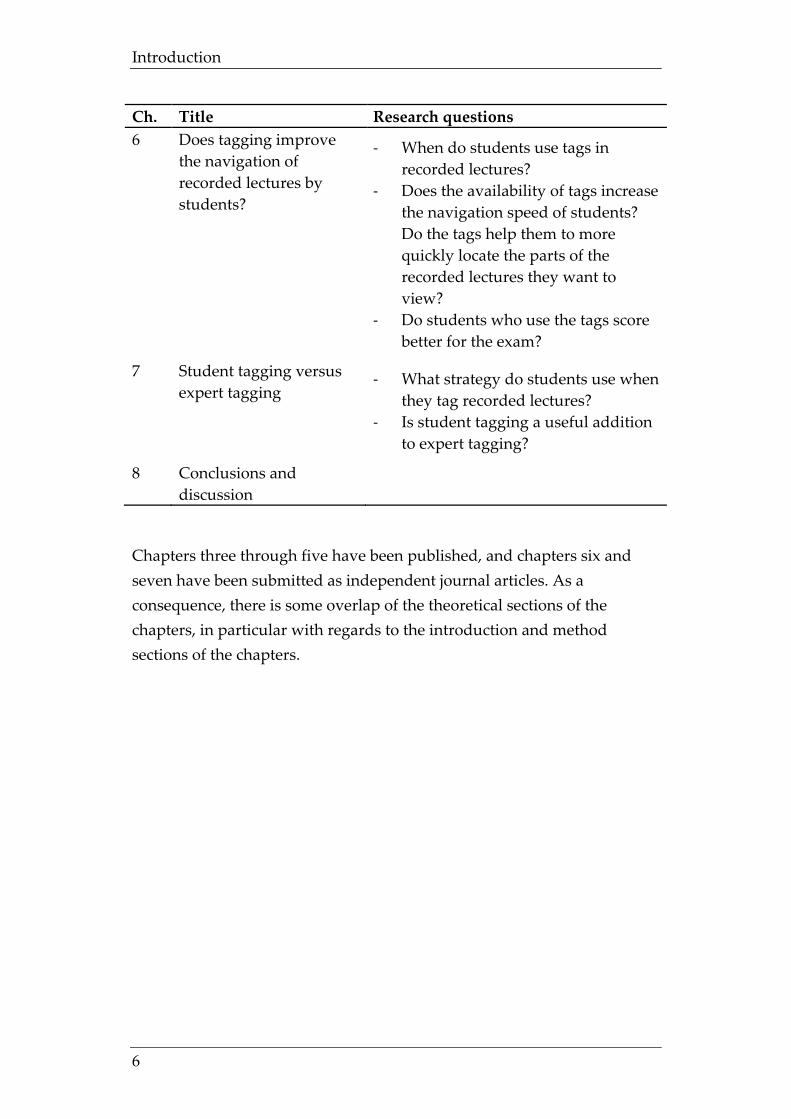
Ch. Title Research questions 6 Does tagging improve
the navigation of recorded lectures by students?
- When do students use tags in recorded lectures?
- Does the availability of tags increase the navigation speed of students? Do the tags help them to more quickly locate the parts of the recorded lectures they want to view?
- Do students who use the tags score better for the exam?
7 Student tagging versus expert tagging
- What strategy do students use when they tag recorded lectures?
- Is student tagging a useful addition to expert tagging?
8 Conclusions and discussion
Chapters three through five have been published, and chapters six and seven have been submitted as independent journal articles. As a consequence, there is some overlap of the theoretical sections of the chapters, in particular with regards to the introduction and method sections of the chapters.
7
Chapter 2 Theoretical framework
2.1 Introduction This chapter provides the background on this research into the use of recorded lectures by students and the possible facilitation of use. We will focus on the two parts of recorded lectures: the lecture (section 2.2) and the recording/broadcasting of those lectures (section 2.3). We also provide background on what tagging is and its role as a navigational aid (section 2.4). We will describe the factors that determine the context of the research setting and their impact on our research and will then summarise them in section 2.5.
2.2 Lectures The lecture has been around for hundreds of years. The lecture method is the most common form of teaching in institutions of higher education throughout the world (Behr, 1988). The word is derived from the Latin word lectare which mean ‘to read aloud’ and dates from the time before the printed book, when a monk in a monastery would read a book out loud, at a lectern, and the scholars would copy it down word for word (Exley & Dennick, 2004, p. 3). The effectiveness of a lecture as an instructional method has been questioned (Jones, 2007; Phillips, 2005; Sheely, 2006), but a recent survey amongst more than 23,000 lecturers at the University of California (Hurtado et al., 2012) showed that although the lectures had increased their use of other instructional methods, the use of extensive lecturing had remained fairly stable during the last decade. In some areas, 69.7% of all lecturers reportedly used extensive lecturing in all or most of the courses they teach. There are reasons to use lectures as an instructional method (Bligh, 1998; Exley & Dennick, 2004; Frederick, 1986; Isaacs, 1994):
• to make students think critically about a subject; • to demonstrate the way professionals reason in a subject manner or
solve problems; • to make students more enthusiastic about a subject;
Theoretical framework
8
• to give students the most important factual information about a subject;
• to explain the most difficult points; • to explain, clarify and organise difficult concepts; • to analyse and show relationships amongst seemingly dissimilar
ideas; • to challenge beliefs and habits of thinking; • to provide a structure and framework for the material; • to tailor material in textbooks to the students’ needs; • to provide current information; • to breed enthusiasm and motivation for further study; and • when using other formats is not viable.
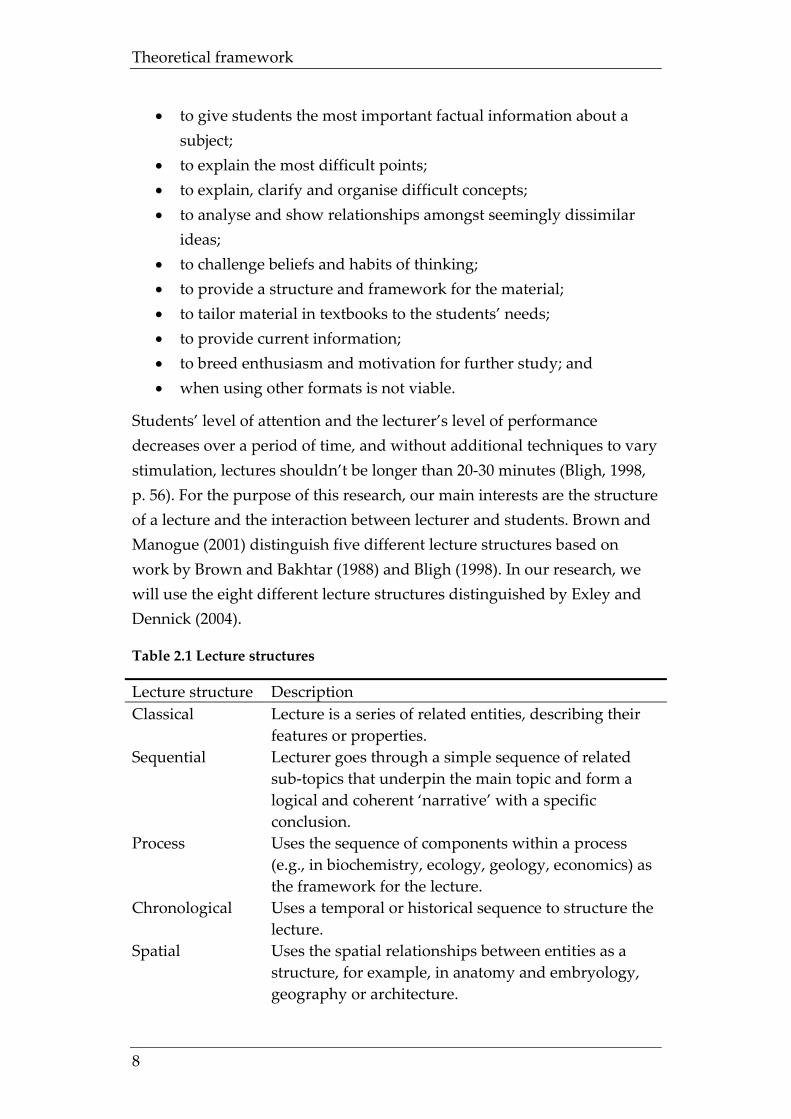
Students’ level of attention and the lecturer’s level of performance decreases over a period of time, and without additional techniques to vary stimulation, lectures shouldn’t be longer than 20-30 minutes (Bligh, 1998, p. 56). For the purpose of this research, our main interests are the structure of a lecture and the interaction between lecturer and students. Brown and Manogue (2001) distinguish five different lecture structures based on work by Brown and Bakhtar (1988) and Bligh (1998). In our research, we will use the eight different lecture structures distinguished by Exley and Dennick (2004).
Table 2.1 Lecture structures
Lecture structure Description Classical Lecture is a series of related entities, describing their
features or properties. Sequential Lecturer goes through a simple sequence of related
sub-topics that underpin the main topic and form a logical and coherent ‘narrative’ with a specific conclusion.
Process
Uses the sequence of components within a process (e.g., in biochemistry, ecology, geology, economics) as the framework for the lecture.
Chronological Uses a temporal or historical sequence to structure the lecture.
Spatial
Uses the spatial relationships between entities as a structure, for example, in anatomy and embryology, geography or architecture.
Chapter 2
9
Lecture structure Description Comparative
The lecturer sets up a debate between competing ideologies, concepts, methods, procedures or techniques.
Induction and deduction
Induction is the process by which observations, facts and evidence are synthesised to form theories, rules and laws. The opposite process by which theories and rules are used to predict and calculate facts about the world is known as deduction. Both processes can be used to structure a lecture.
Problems and case studies
Case studies can be used to structure lectures by bringing together conceptual understanding and reasoning with real-life, relevant situations.
* Adapted from (Exley & Dennick, 2004, pp. 52-55)
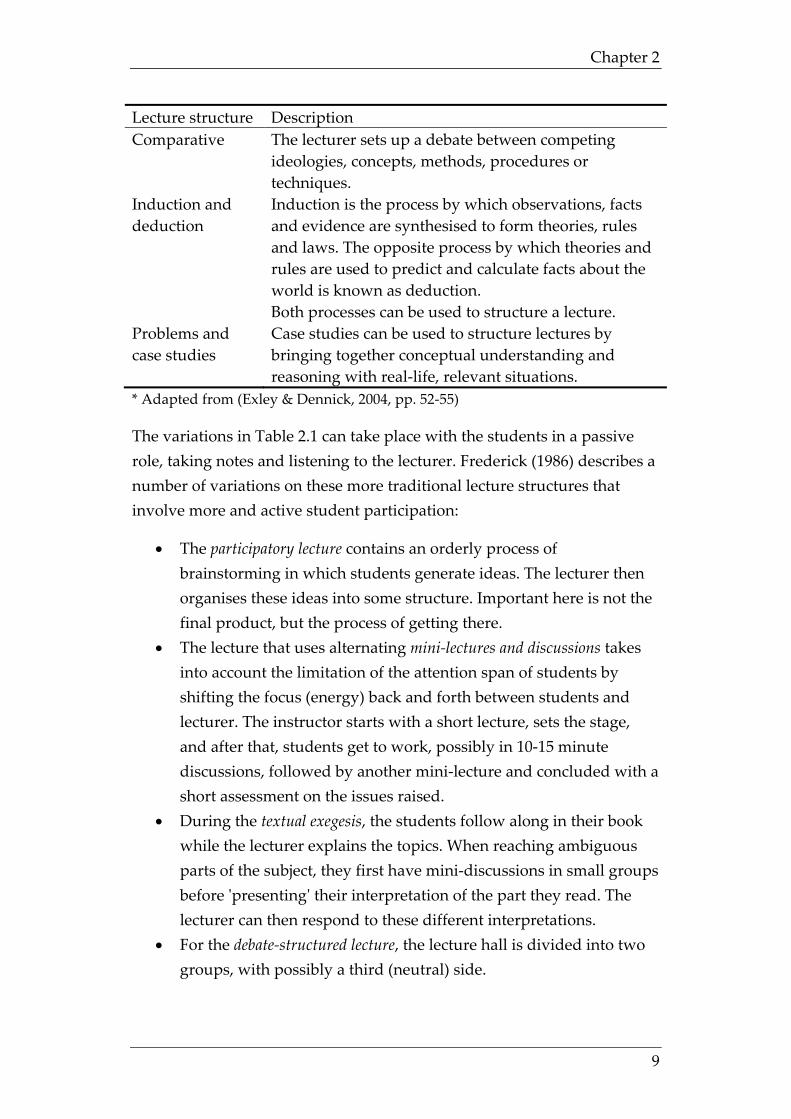
The variations in Table 2.1 can take place with the students in a passive role, taking notes and listening to the lecturer. Frederick (1986) describes a number of variations on these more traditional lecture structures that involve more and active student participation:
• The participatory lecture contains an orderly process of brainstorming in which students generate ideas. The lecturer then organises these ideas into some structure. Important here is not the final product, but the process of getting there.
• The lecture that uses alternating mini-lectures and discussions takes into account the limitation of the attention span of students by shifting the focus (energy) back and forth between students and lecturer. The instructor starts with a short lecture, sets the stage, and after that, students get to work, possibly in 10-15 minute discussions, followed by another mini-lecture and concluded with a short assessment on the issues raised.
• During the textual exegesis, the students follow along in their book while the lecturer explains the topics. When reaching ambiguous parts of the subject, they first have mini-discussions in small groups before 'presenting' their interpretation of the part they read. The lecturer can then respond to these different interpretations.
• For the debate-structured lecture, the lecture hall is divided into two groups, with possibly a third (neutral) side.
Theoretical framework
10
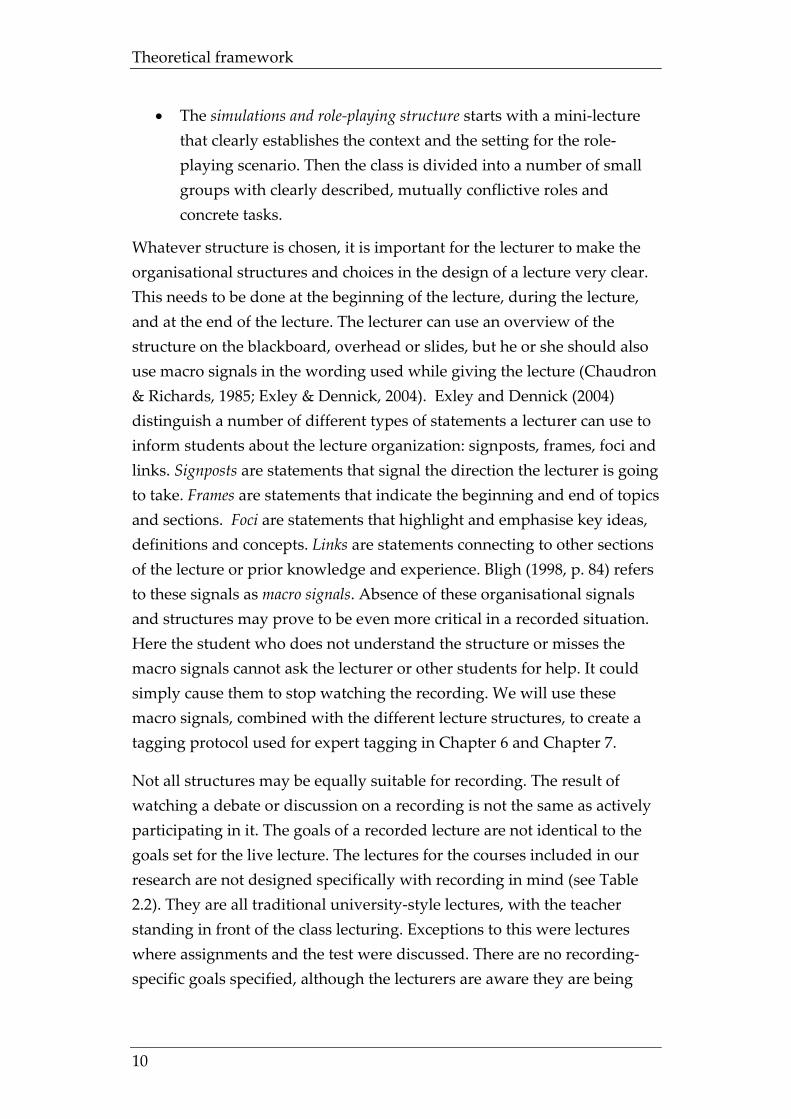
• The simulations and role-playing structure starts with a mini-lecture that clearly establishes the context and the setting for the role-playing scenario. Then the class is divided into a number of small groups with clearly described, mutually conflictive roles and concrete tasks.
Whatever structure is chosen, it is important for the lecturer to make the organisational structures and choices in the design of a lecture very clear. This needs to be done at the beginning of the lecture, during the lecture, and at the end of the lecture. The lecturer can use an overview of the structure on the blackboard, overhead or slides, but he or she should also use macro signals in the wording used while giving the lecture (Chaudron & Richards, 1985; Exley & Dennick, 2004). Exley and Dennick (2004) distinguish a number of different types of statements a lecturer can use to inform students about the lecture organization: signposts, frames, foci and links. Signposts are statements that signal the direction the lecturer is going to take. Frames are statements that indicate the beginning and end of topics and sections. Foci are statements that highlight and emphasise key ideas, definitions and concepts. Links are statements connecting to other sections of the lecture or prior knowledge and experience. Bligh (1998, p. 84) refers to these signals as macro signals. Absence of these organisational signals and structures may prove to be even more critical in a recorded situation. Here the student who does not understand the structure or misses the macro signals cannot ask the lecturer or other students for help. It could simply cause them to stop watching the recording. We will use these macro signals, combined with the different lecture structures, to create a tagging protocol used for expert tagging in Chapter 6 and Chapter 7.
Not all structures may be equally suitable for recording. The result of watching a debate or discussion on a recording is not the same as actively participating in it. The goals of a recorded lecture are not identical to the goals set for the live lecture. The lectures for the courses included in our research are not designed specifically with recording in mind (see Table 2.2). They are all traditional university-style lectures, with the teacher standing in front of the class lecturing. Exceptions to this were lectures where assignments and the test were discussed. There are no recording-specific goals specified, although the lecturers are aware they are being
Chapter 2
11
recorded and often try to facilitate viewers by repeating the questions asked by students in the lecture hall.
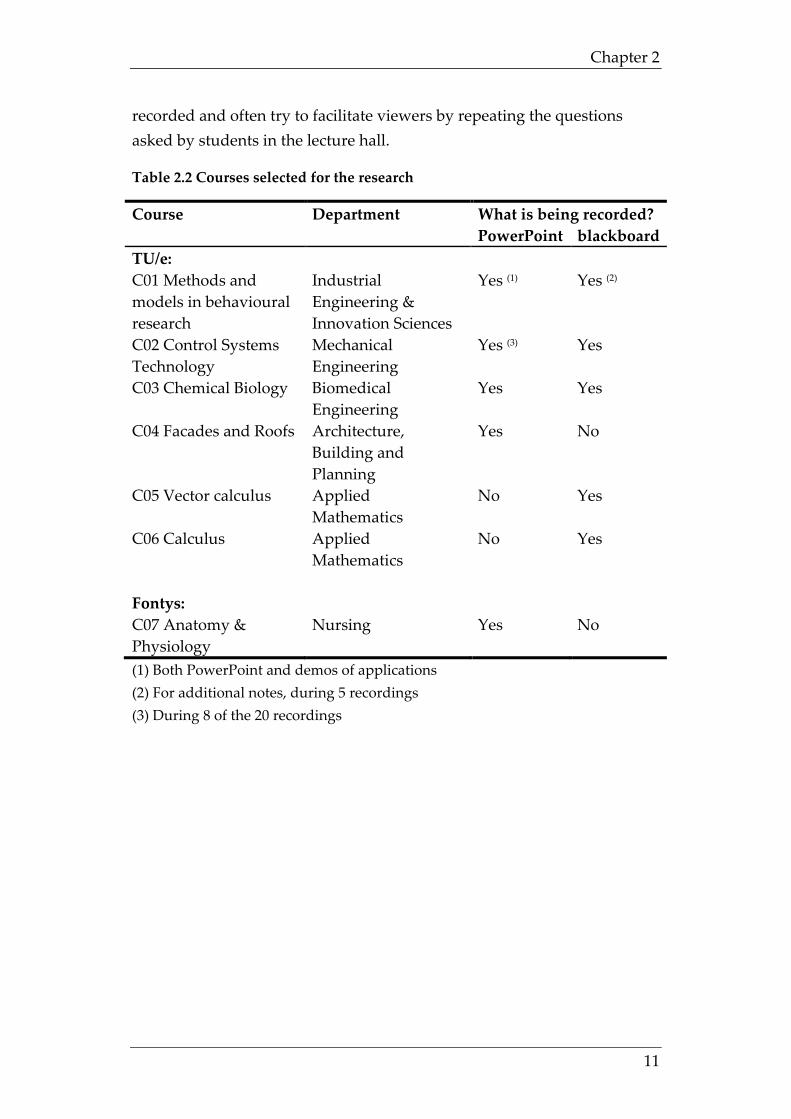
Table 2.2 Courses selected for the research
Course Department What is being recorded? PowerPoint blackboard TU/e: C01 Methods and models in behavioural research
Industrial Engineering & Innovation Sciences
Yes (1) Yes (2)
C02 Control Systems Technology
Mechanical Engineering
Yes (3) Yes
C03 Chemical Biology Biomedical Engineering
Yes Yes
C04 Facades and Roofs Architecture, Building and Planning
Yes No
C05 Vector calculus Applied Mathematics
No Yes
C06 Calculus Applied Mathematics
No Yes
Fontys: C07 Anatomy & Physiology
Nursing Yes No
(1) Both PowerPoint and demos of applications (2) For additional notes, during 5 recordings (3) During 8 of the 20 recordings
Theoretical framework
12
2.3 Recording and broadcasting a lecture In this section, we will introduce a framework to describe the context of our research with regards to recording and broadcasting in an educational context, and in particular, in relation to lectures. Based on the existing research into the recording and broadcasting of lectures, we have identified nine categories of factors that either directly or indirectly influence use and navigation:
1. Medium used (section 2.3.1) 2. Differences in time between event and view (section 2.3.2) 3. The distribution method (section 2.3.3) 4. Differences in target audience (section 2.3.4) 5. Interaction offered (section 2.3.5) 6. The system architecture (section 2.3.6) 7. The recording workflow (section 2.3.7) 8. Search and Find functionality (section 2.3.8) 9. Navigational functionality (section 2.3.9)
We will first describe the categories, and then we will use them to describe the context of our research.
2.3.1 Medium used
A recording and broadcast can consist of a number of media used in different combinations: text, still images and animations, audio, video or a combination of these media (called multimedia). The survey by Leoni and Lichti (2009) on the use of lecture capture in higher education shows that just over half of the 150 institutions that responded to that survey actually record video as part of the captured content. The other half focus on audio only or audio and content (text, still images, animations).
The combination of media captured and broadcasted depends not only on choice but also in part on the distribution method and the system architecture. For example, distribution via television requires a single video stream while a browser-based distribution allows for separate, synchronised streams. The architecture of the recording part of the system architecture influences the available media. Whether the setup has multiple cameras or just a microphone for audio recordings, whether it captures full motion video from the interaction on the lecturer’s desktop
Chapter 2
13
or just still images all determine what the output options are for a broadcast.
Impact of medium used on usage and navigation
The media that can be used have different usage and navigational advantages and disadvantages. Text can be scanned and read more easily and faster than audio or video (Arons, 1997). Video can bring visual cues across but requires full attention of the viewer while audio can be listened to while doing other activities (Day, 2008).
Within Fontys and the TU/e, two groups of media usage in recorded lectures can be identified. One is where video recording of the lecturer is combined with a series of images capturing the screen and slides of the lecturer. The second group of recorded lectures uses only a single video stream and no separate capture of the screen of the lecturer is created. In the latter group, the lecturer uses a blackboard.
2.3.2 Differences in time between event and view
A broadcast can be synchronous (live) or asynchronous (on demand). During a synchronous or live broadcast, students view the video live while the lecture takes place. Lecturers and students are online at the same time but can be in different geographical locations. Distances can be as small as between different lecture halls in the same building or big in case of broadcasts to viewers on different continents.
An asynchronous broadcast is the broadcast of a recording of a live event. This can be an edited or unedited version of the recorded lecture. The start of the broadcast can be scheduled and initiated by the provider of the recording, as with regular television, or it can be initiated on demand by the student, as is the case with most online video available through the internet or recordings on DVD. A synchronous broadcast can be recorded and archived as an asynchronous broadcast for later use.
Impact of differences in time between event and view on usage and navigation
When the geographical distance between lecturer and students is large, differences in time zones make synchronous broadcasts less feasible. But even when lecturer and students are in the same time zone, synchronous
Theoretical framework
14
broadcasts usually aren’t truly synchronous because there often is a small delay of about 10-20 seconds between the actual live event and the moment the viewer sees the recording on the screen. This is caused by the transcoding and buffering of the video on the server before being streamed to the viewer. This delay needs to be taken into account when lecturer and students want to interact during a live broadcast.
With asynchronous broadcasts, the time between live event and availability of the recording online in part determines its usage possibilities. It determines whether the student can view the recording before the next live event (the next lecture), often important when they need to make up for a missed lecture. This timeframe often depends on the level of automation of the recording workflow; some systems offer almost instant availability as soon as the live event has ended.
With a few exceptions, all broadcasts from both the TU/e and Fontys are asynchronous. The recordings are made available online within hours or days of the live events. Students can initiate playback of the recordings at any time they like over the internet.
2.3.3 The distribution method
There are a number of ways in which a broadcast or recording of a lecture can be distributed to the students:
• Television: Television broadcasts are expensive and limited to broadcasting organizations. Broadband internet, set-top boxes and home theatre PC’s have made large numbers of online broadcasts available for viewing on large screen television sets. This offers support for both synchronous and asynchronous broadcasts.
• CD or DVD: In the early days of the internet, limited bandwidth didn’t allow for the download or streaming of full-size video. For asynchronous broadcasts, the CD and DVD offer a cheap, albeit slow, alternative distribution method. CDs have a more limited storage capacity and are usually used for audio only.
• Streaming video/audio: Streaming video and audio enable the student to start watching or listening to a broadcast right away without first downloading a complete video or audio file. Streaming video and audio can be used for synchronous and
Chapter 2
15
asynchronous broadcasts. An asynchronous broadcast allows for navigation in the broadcast. The student can jump forward or backwards within the asynchronous broadcast even to parts of the broadcast that haven’t been downloaded yet.
• Browser-based: The browser-based model offers a number of advantages to users, with the most important being ease of use. The broadcasts are embedded in pages accessible through a web browser.
• Offline/downloadable: Downloadable versions of recorded lectures don’t require a network connection during playback. This medium is only available for asynchronous broadcasts.
Impact of the distribution method on usage and navigation
Television sets have a very easy to use navigation structure but usually limit the user’s ability to pause and play. CD and DVD recordings can contain a more advanced navigational structure. Streaming video and audio offer the advantage of instant on and are supported by a growing number of devices. Browser-based broadcasts have the advantage of allowing for the combination of multiple media streams into one synchronised broadcast. A page can combine multiple streams: a video stream with the video of a presenter combined with a synchronised image stream of the slides shown by the presenter. At the same time, the page can offer note-taking functionality to the students. The notes can automatically be time coded with the specific point in the broadcast that they belong to. Downloadable audio versions of the broadcasts have the advantage of freedom of location of use.
Fontys and the TU/e provide students with browser-based access to the recordings. The recording contains either just streaming video of the lecturer or a combination of streaming video of the lecturer combined with a view of the recorded screen. Neither university currently offers offline/downloadable versions of the recordings.
2.3.4 Differences in target audience
Although the term ‘recorded lectures’ seems specific enough, the same technology and infrastructure can be used for the recording and broadcasting of a number of different events. Some lecturers record short additional material in a studio setting where you use the same recording
Theoretical framework
16
and broadcasting infrastructure that also is used for the recording of live lectures in halls with students present, to record 10-15 minute clips. Other universities use the infrastructure to also record PhD thesis presentations as an extra service to their PhD students, family and friends. Some universities provide access to (parts of) their recordings via the OpenCourseWare Initiative (Abelson, 2008), making them available to audiences worldwide.
Impact of differences in target audience on usage and navigation
Recordings and broadcasts can be aimed at different audiences: students who attend the live lecture, remote or part-time students, potential students, or friends and family, in case of PhD thesis presentations. Short clips aimed at students who know in which context they’re viewing the clips require a different navigational support than 40-45 minute long recordings of live lectures. The PhD recordings are aimed at a completely different audience than the regular students attending the university; one probably needs no navigation but may require the option to create offline copies, while the other requires functionality aimed at supporting the learning process. Recordings aimed at remote students need to have all the relevant contextual information included, while recordings accessible to potential students will probably have to adhere to university PR regulations.
Fontys and the TU/e create the recorded lectures primarily for students who in principle have the opportunity to attend the live lecture. At both universities, these are both full-time and part-time students. Both universities use their recording infrastructure to record other events and presentations.
2.3.5 Interaction offered
There are a number of ways that students can interact with the lecturer during a synchronous or asynchronous broadcast. They can be grouped according to the media they use: video, audio and text (in a number of different forms):
• Interaction using video: During a videoconferencing session, not only the video of the lecturer is broadcast but also the video of the (other) students present during the synchronous broadcast. If the
Chapter 2
17
number of students is large, there may be a need to switch between the views, use zoom and pan to aim the camera at the person currently speaking or to only grant broadcast options to students at specific moments, for example, when a question is being asked or answered. Video is also used for interaction in combination with asynchronous broadcasts. Viewers record a video response to an existing video, which is then attached to the list of comments on the video.
• Interaction using audio: During live broadcasts over the internet, audio is often used as an alternative to video as a way to decrease the bandwidth needed for the broadcast, both on the side of the lecturer and that needed by the students.
• Interaction using text: Text requires even less bandwidth than audio and is the most often used method of allowing interaction during a broadcast. Interaction using text can take different forms, such as chat, e-mail, an online forum, text messages, and online polls.
Impact of interaction offered on usage and navigation
The differences in bandwidth needed for each of the interaction options can impact the possibilities students have to participate in the interaction. Some students might not have the required bandwidth available to participate via video or may feel reluctant to interact in that way. When there is a lively forum with a lot of questions and responses, this too needs to be made accessible and searchable for students in a way that makes it possible to link both the recording they’re viewing and the interaction that takes place or took place.
As an integrated part of the recordings, Fontys and the TU/e offer students the option to ask questions related to the recording via e-mail. With this form, the student can send an e-mail to the lecturer while viewing the recorded lecture. This platform, if so chosen by the student, automatically includes a link to the location within the recording that the student was watching. The courses at Fontys and the TU/e offer other interaction options as part of the online virtual learning environment.
Theoretical framework
18
2.3.6 The system architecture
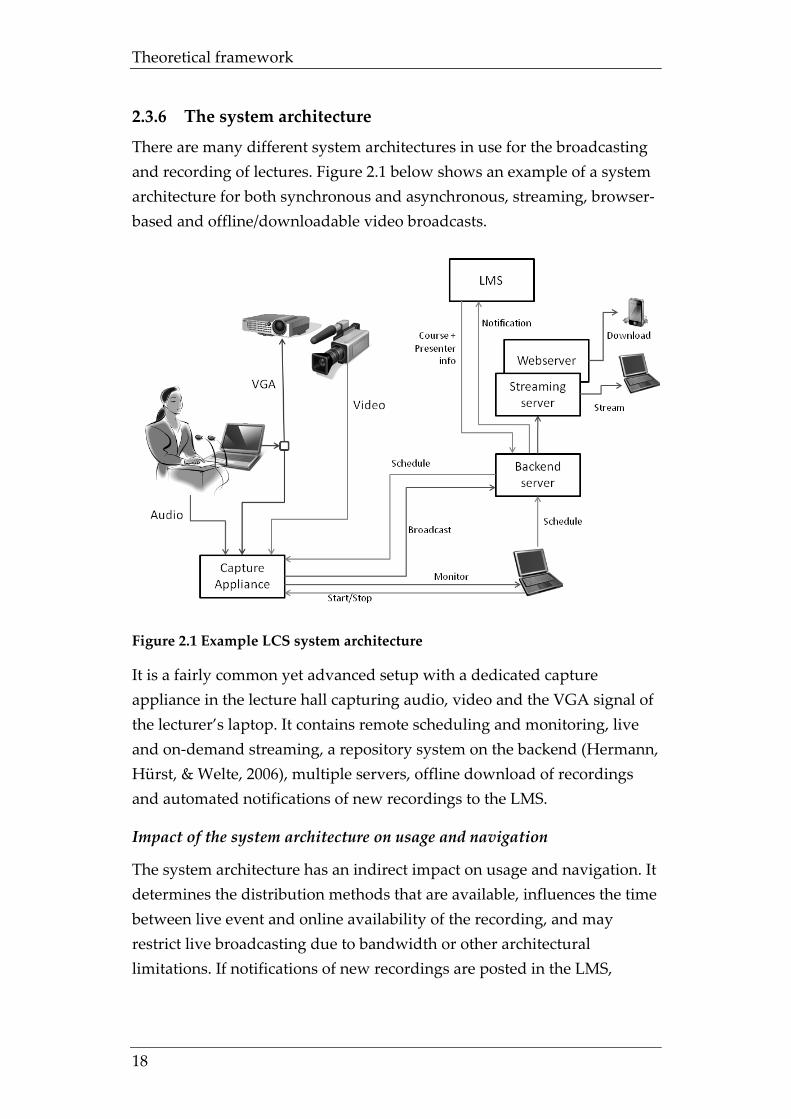
There are many different system architectures in use for the broadcasting and recording of lectures. Figure 2.1 below shows an example of a system architecture for both synchronous and asynchronous, streaming, browser-based and offline/downloadable video broadcasts.
Figure 2.1 Example LCS system architecture
It is a fairly common yet advanced setup with a dedicated capture appliance in the lecture hall capturing audio, video and the VGA signal of the lecturer’s laptop. It contains remote scheduling and monitoring, live and on-demand streaming, a repository system on the backend (Hermann, Hürst, & Welte, 2006), multiple servers, offline download of recordings and automated notifications of new recordings to the LMS.
Impact of the system architecture on usage and navigation
The system architecture has an indirect impact on usage and navigation. It determines the distribution methods that are available, influences the time between live event and online availability of the recording, and may restrict live broadcasting due to bandwidth or other architectural limitations. If notifications of new recordings are posted in the LMS,
Chapter 2
19
together with all the other resources for the course, then finding the correct recording is easier for students.
Fontys and the TU/e both use a commercially available system to create recorded lectures. The TU/e hosts the backend server, streaming server and webserver internally, and has three fixed and two mobile capture appliances in operation. Fontys hosts the servers externally at another university and has one fixed capture appliance. All the capture appliances are capable of capturing a VGA signal, audio and video of the lecturer.
2.3.7 The recording workflow
Broadcasts and recordings can differ in the number of people and activities that are involved. The workflow for a broadcast consists of a pre-production phase (preparation/planning), the actual recording/capture phase, and the post-production phase (Abowd, Atkeson, et al., 1998):
The number of people involved in the process can be extensive and diverse (Opencast project, 2010). Except for the work of the lecturer, all parts of the workflow can have different levels of automation, usually depending on the level of sophistication of the system and infrastructure. Zhang et al. (2008) describe a fully automated system using multiple cameras, scheduling, on-demand and live broadcasting.
Impact of the recording workflow on usage and navigation
Deal (2007) argues there is a trade-off to be made between the level of automation and the quality of the output. Yet Liu et al. (2001) show that most remote audience members could not tell if the video was produced by an automated system or a person.
The complexity of the workflow and the level of automation can have a significant influence on the scalability of the recording service and the time needed to get a recording online. This can range from minutes to a week or more.
Both the TU/e and Fontys schedule the recording of lectures at the beginning of the semester so the lectures can be scheduled in the lecture halls that have the capture appliances installed. The portable recording sets at the TU/e offer some additional flexibility for scheduling. The TU/e uses paid assistants (students) to start and stop the actual recording and to
Theoretical framework
20
control the cameras. At Fontys, the lecturer controls the recording from a control panel build into the desk. Here the single camera is set to a fixed position.
2.3.8 Search and find functionality
When the number of recordings increases, it becomes more difficult for viewers to find the recordings they want to view. Searching and finding recordings depends on the availability of metadata of those recording. The metadata describes properties like title of the recording, course, lecturer, date and time of recording, as well as content-related properties like the topics covered in the lecture. There are a number of ways this metadata can be added:
• Manual entry: Labour-intensive for large numbers, requires additional workflow because the lecturer often is the person who has the information but isn’t the one adding the information into the system.
• Provide by other systems: If the course already has a detailed lecture-by-lecture overview in the LMS, this information can be (automatically) linked to the recordings.
• Image-to-text conversion: Extracting text from slides captured works best for captures of broadcasts using PowerPoint slides or similar types of tools that use symbolic representation formats. Formulas and sketches in slides aren’t easily detected, but this is not a severe drawback, as almost only keywords are specified as a search pattern (Ziewer, 2004).
• Audio/video-to-text conversion: Another source for metadata is the audio of the broadcast. In particular in cases where there are no slides available or when the slides don’t contain (much) text, the audio of the presenter offers a much richer base for text extraction.
Impact of search and find functionality on usage and navigation
The time and effort it takes to find the recording or part of a recording a student is searching for depends on the availability of correct and detailed metadata. Unlike tagging systems, where the creator of the metadata is also one of the users of the metadata, manual entry of a formal, predefined metadata set is often labour-intensive work that usually only can be done by trained personnel. One problem with both the image-to-text and the
Chapter 2
21
audio/video-to-text approaches is the out-of-vocabulary (OOV) problem where the system can’t recognise words that are not in its fixed internal vocabulary (Hürst, 2003).
Neither Fontys nor the TU/e use automated metadata creation. Basic information about the recording, like course ID, course name, lecturer name and lecture episode number are entered into the system by hand based on information provided by faculty. The system offers text search based on that metadata.
Recordings are grouped in folders within a catalogue, based on the course ID, and depending on the course, they are linked from within the online virtual learning environment.
2.3.9 Navigational functionality
Even if a student finds the relevant recording of a lecture, often it will not be viewed straight through from the beginning to the end of the recording. In research by Brotherton and Abowd (2004), about half of the sessions on asynchronous broadcasts they analysed contained one or more jumps. During a synchronous broadcast, the student has little navigational functionality, often not even pause and rewind. The level of control during an asynchronous broadcast depends on the distribution method, but it is usually much more extensive, allowing the student to pause, rewind, replay, fast forward or skip parts of the recording.
When video is displayed in a browser or through an offline player, the viewer usually has the option to drag a marker onto a timeline. Doing that causes the playback to resume from that specific point in time. A number of researchers have dealt with the challenge of allowing viewers to skim through audio and video (Arons, 1997; Hürst, Lauer, Bürfent, & Götz, 2005; Hürst, Lauer, & Götz, 2005; Mertens, Schneider, Müller, & Vornberger, 2004). Recordings that use the browser-based distribution method often also offer a visual way to navigate the recording based on the screen content. Usually these screenshots are automatically created by the system based on a timer (e.g., a new screenshot every x minutes), the level of change on the screen (e.g., a new screenshot when x% of the screen has changed) or a combination of both techniques.
Theoretical framework
22
Impact of navigational functionality on usage and navigation
The advantage of automated creation of navigational possibilities is the speed with which they can be created and the cost advantage of not having to do it by hand. This means the recorded lectures can be made available quicker than when this is done by hand (see also section 2.3.2). Disadvantages of automated creation of navigational possibilities depend on the level of sophistication of the system that creates the navigation. Some systems generate a great number of screenshots (i.e., whenever the lecturer’s screen changes), for example, during a demonstration of an application or when the presentation contains a video or an animation. This makes them useless for navigational purposes. Additional metadata about the different parts of a recorded lecture, linking keywords and phrases to parts of the recording can help prevent this problem.
The system used by TU/e and Fontys offers a number of navigational options during playback of the asynchronous recordings in the browser. Video of the lecturer is displayed alongside the recording of the screen of the lecturer (if available). Underneath the video, a play/pause and skip back button allow playback control. There is also a slider above these buttons, which also can be used to control the playback location within the recording. Students can also navigate based on the slide view.
2.4 Tagging recorded lectures As demonstrated in previous sections, we have seen there is an advantage in getting recorded lectures online as soon as possible after the recording has been created, that both the search and find functionality and the navigational options of recorded lectures can be improved by metadata, but that formal metadata can be labour intensive to add.
Tags are textual keywords and phrases, usually freely chosen by users, that are assigned to online resources like webpages, pictures or videos (O'Reilly, 2005). They became popular as part of the Web 2.0 concept, allowing anyone to mark content with descriptive terms, in essence, adding their own explicit user-generated metadata (Mathes, 2004). Popular sites like del.icio.us (Delicious) allowed, and still allow, users to add bookmarks to websites combined with tags. Those tags are not only visible to the users that added the bookmarks but also to other users of the
Chapter 2
23
site. Combined, they form a folksonomy of tags (Vander Wal, 2007), a flexible bottom-up, user-created categorical structure. Although tagging is quite common now and supported by many websites, these social tagging systems were a significant step up from the original idea of metadata and ontologies (Gruber, 1993) being created and maintained by professionals. We can identify a number of functions that tags perform (Golder & Huberman, 2005):
• Identifying what (or who) the recording is about. This is the most common function of tags;
• Identifying what it is. For example, a question or an example; • Self-reference. The tag identifies the tagger or begins with ‘my’, like
‘myquestion’; • Refining categories. These tags do not stand alone without
contextual knowledge, for example, ‘Question 2’; • Identifying qualities or characteristics of the resource. For example,
funny, stupid, difficult; and • Task organising. These tags relate to performing a task, for
example, ’toread’.
User incentives and motivations for users play a significant role within social tagging systems. Marlow, Naaman, Boyd, and Davis (2006) identify a number of motivations that influence tagging behaviour, as adapted by (Velsen & Melenhorst, 2008)):
• Future retrieval: to make finding resource easier in the future. • Contribution and sharing: to contribute to a resource. • Attract attention: to bring the resource under the attention of
others. • Play and competition: as a form of gaming. • Self-presentation: to express the individual identity. • Opinion expression: to present a personal opinion.
An alternative to tagging by users is automated tagging using Optical Character Recognition (OCR) or Speech Recognition (Kamabathula & Iyer, 2011). Although results are promising, we are not exclusively interested in the use of tags as a means to retrieve parts of the recorded lectures. Tagging is a reflective practice that can give students an opportunity to summarise new ideas (Bateman, Brooks, McCalla, & Brusilovsky, 2007) in
Theoretical framework
24
a way similar to the way note taking aids their learning process (Bligh, 1998, pp. 129-147).
The version of the LCS used by TU/e and Fontys currently offers no user tagging of recorded lectures. It does offer some level of tagging in the form of ’chapters’, but those can only be added by an administrator or advanced users. They are more appropriately thought of as formal metadata, and they are not easy to find in the user interface provided by the LCS. Tags could offer a more flexible way of adding user-generated metadata to recorded lectures.
2.5 Context of the research To summarise the context of our research, we will use the parts of the recorded lectures described in sections 2.2 (lectures), 2.3 (the framework) and 2.4 (tagging) to describe the context of the research. Although there are other combinations possible, we chose this context because we expect it to contain a group of students who use the recorded lectures in comparable ways.
Lectures (see: section 2.2)
Our research focusses on traditional university-style lectures, with the teacher standing in front of the class lecturing at a University of Technology and a University of Applied Sciences in the Netherlands.
Medium used (see: section 2.3.1)
The research focusses on two groups of media usage in recorded lectures. One is where video recording of the lecturer is combined with a series of images capturing the screen and slides of the lecturer. The second group of recorded lectures uses only a single video stream, and no separate capture of the lecturer’s screen is created. In the latter group of lectures, the lecturer uses a blackboard.
Differences in time between event and view (see: section 2.3.2)
We research asynchronous broadcasts that are made available online within hours or days of the live events. Students can initiate playback of the recordings at any time they like over the internet.
Chapter 2
25
The distribution method (see: section 2.3.3)
Recordings are made available online through an internet browser. The recording contains either just streaming video of the lecturer or a combination of streaming video of the lecturer combined with a view of the recorded screen. Offline/downloadable versions of the recordings are not taken into account.
Target audience (see: section 2.3.4)
The recorded lectures researched here are created primarily for students who have the opportunity to attend the live lecture. These are both full-time and part-time students. Although both universities also use their recording infrastructure to record other events and presentations, the research questions and the research itself focus on this particular use of the recordings by students.
Interaction offered (see: section 2.3.5)
Both universities offer students the option of asking questions related to the recording via an e-mail format. The student can send an e-mail to the lecturer while viewing the recorded lecture. This format, if so chosen by the student, automatically includes a link to the location within the recording the student was watching. The courses at Fontys and the TU/e offer other interaction options, for example, as part of the online virtual learning environment, but these are not linked to the recorded lectures and so are outside the scope of this research.
The system architecture (see: section 2.3.6)
Both universities use a commercially available system (Sonicfoundry) to create recorded lectures. The TU/e hosts the backend server, streaming server and webserver internally and has three fixed and two mobile capture appliances in operation. Fontys hosts the servers externally at another university and has one fixed capture appliance. All the capture appliances are capable of capturing a VGA signal, audio and video of the lecturer. For our research, possible improvements within the two architectures are outside the scope of study. Where needed for our research, extensions to the architecture will be created.
Theoretical framework
26
The recording workflow (see: section 2.3.7)
Both universities that participated in this research plan the recording of lectures at the beginning of the semester so that the lectures can be scheduled in the lecture halls that have the capture appliances installed. The TU/e uses paid assistants (students) to start and stop the actual recording and to control the cameras. At Fontys, the lecturer controls the recording from a control panel build into the desk. Here, the single camera is set to a fixed position. For our research, possible improvements to the recording workflow are outside the scope of study.
Search and Find functionality (see: section 2.3.8)
Neither university that participated in the research uses automated metadata creation. Basic info about the recording like course ID, course name, lecturer name and lecture episode number are entered into the system by hand based on information that is provided by the faculty. The system offers a text search on that metadata. For our research we will not be able to modify the existing search and find functionality present in the system, but we will study possible extensions to the functionality using tagging within recorded lectures.
Navigational functionality (see: section 2.3.9)
The LCS used by the two universities offers a number of navigational options during playback of the asynchronous recordings in the browser. However, extending the player with additional navigational functionality was out of scope for this research because it would involve too extensive modifications to the system used. Instead, the research uses an additional layer over the existing player for the studies involving tagging within the recorded lectures.
Tagging recorded lectures (see: section 2.4)
The version of the LCS used by TU/e and Fontys currently offers no user tagging options. Experiments with regards to the use of tagging by students either involve the use of an additional layer over the existing player or an external application.
27
Chapter 3 Students and recorded lectures:
Survey on current use and demands for higher education*
3.1 Summary Online recordings of lectures provide students with anytime-anyplace access to lectures. Research shows that students prefer courses accompanied by online recordings and an increasing number of universities provide recorded lectures. This paper presents the results of a study into the use of recorded lectures at two universities in the Netherlands. The goal of the study is to gain a better understanding of the way that this group of students use recorded lectures. This understanding will enable the creation of usage scenarios that need to be supported. Our results show that students use recorded lectures as a replacement for missed lectures and for study tasks, like preparing for an exam. A large proportion of the students report that they watch 75% – 100% of a recorded lecture when the view one. Students did not mention the quality of the lectures itself appears not to influence the use of the recorded lectures. Recorded lectures for courses that only use the blackboard are viewed less often. There are also interesting differences in the use of recorded lectures of the different groups of students at the two universities. To increase the credibility and validity of the results, we need a more direct way to measure the use of recorded lectures by students. Methodological triangulation using the log data for the recorded lectures can provide this.
* This chapter has been published as: Gorissen, P., Van Bruggen, J. M. & Jochems, W. (2012) 'Students and recorded lectures: Survey on current use and demands for higher education', Research in Learning Technology. pp. 297-311 DOI: 10.3402/rlt.v20i0.17299
Students and recorded lectures: Survey on current use and demands for higher education
28
3.2 Introduction The lecture is the most common form of teaching method in institutions of higher education throughout the world (Behr, 1988). Its prevalence has been criticised by many (Phillips, 2005; Sheely, 2006), yet this criticism has not lead to significant changes in the form or frequency of use of lectures. An increasing number of universities choose to support student learning by providing online recordings of lectures (Leoni & Lichti, 2009).
These recorded lectures provide students with more control over their schedules and learning, allowing them to review lectures at their own pace and at a time and place of their choosing. Thus, recordings offer a more learner-centred approach for lectures (Baecker et al., 2003; Tomoko Traphagan et al., 2010) .
Research by T. Traphagan (2005b, 2006b), Veeramani and Bradly (2008) and Gosper et al. (2008) shows that most students express a preference for courses accompanied by online recordings of the lectures. This not only is the case for traditional distance students, but also for on-campus students as well (Woo et al., 2008). Chang (2007) examined teacher and staff perception towards lecture recordings and results show they favour the use of recorded lectures as well. Little is known, however, about the way in which students navigate within the recordings or how they find (the parts of) the recordings they want to watch. Most studies are limited to the overall opinions and perceptions of students and lecturers about usefulness of the recorded lectures.
This article reports on a study into the use of recorded lectures by students at two universities in the Netherlands. The study looks only at full length recorded lectures of live lectures, the most frequently type of recordings created at both universities, consisting of recordings of 40-45 minutes lectures. This study is part of a larger research project into the use of recorded lectures by students that aims to improve the support for recorded lectures by students within different usage scenarios.
In this stage of the larger body of our research, we asked students directly about their usage of recorded lectures. In the next stage, we will explore means to measure their use of the recorded lectures and the way in which they navigate through the recorded lectures. The goal of this first stage of
Chapter 3
29
the research is to get a better understanding of the way this group of students use recorded lectures. This will enable us to create student usage scenarios that need to be supported. In this article, we want to address the following questions: Where and when do students watch the recorded lectures? With what purpose do they watch? If they did not watch the recorded lectures, for what reason did they not watch? Is there a relationship between the use of recorded lectures and the level of ambition of students, the ease of use of the recorded lectures, or the use of other resources available to the student?
This study goes beyond the existing body of research by applying a sampling method that is different from other studies. We specifically selected students with recent exposure to recorded lectures and surveyed them about their use within a single specific course. Both users of the recorded lectures and non-users were included in the study. The subjects were all on-campus students who were able to attend the face-to-face lectures. And although the results are reported anonymously, the survey data allows us to compare the results of this first stage with the results of the second stage of the research. This means we will be able to compare the reported use of the recorded lectures with the actual use of the recorded lectures.
3.3 Lecture capturing There are a number of ways in which video can enhance lectures. Weblectures are video recordings that have been specifically made for use as educational resources (Day, 2008). They consist of a studio recording containing a combination of video and audio with a synchronised view of the lecturer’s computer screen while displaying a presentation. Weblectures usually do not exceed twenty minutes. A variation on the weblecture is the screencast (Udell, 2004). There the focus is on what happens on the screen, for example, to explain the usage of a computer application. Screencasts can contain video of the presenter, but usually only contain the audio and a recording of the screen. Because weblectures and screencasts are recorded in advance and in a controllable setting, their quality level can be reasonably high. The story they tell can be scripted in advance, re-takes of the recording are possible and they can be made available to students in advance of the actual lecture.
Students and recorded lectures: Survey on current use and demands for higher education
30
Lecture capturing involves the capturing of a live lecture situation. The lecture dictates the length, contents and structure. Early lecture-capturing systems often did not include video of the lecturer. One reason for this was that previously the speed of internet connections available to students required high video compression, low frame rates and small frame size (Fardon, 2003). One way used to solve bandwidth problems was to create downloadable podcasts that contained audio only or audio and video (Belanger, 2005; G. Campbell, 2005; Chan, Lee, & McLoughlin, 2006).
In the conversational framework, Laurillard (2002) uses the concept of ‘affordances’ (Gibson, 1979) of multimedia to match them with learning activities. Modern lecture capture system have a number of additional affordances when compared to more traditional media like a DVD, videocassette or even television broadcasts. Students have direct, on demand or live, access to the recorded lectures. They can play, pause and replay parts of the recorded lecture as often as they like. They can also annotate the recorded lectures, either directly in the interface provided by the lecture capture system, or by saving links (favourites) to parts of the recorded lecture.
Most universities in the Netherlands use commercially available systems to capture lectures; some have home-grown solutions. Both universities that participated in this research study use a lecture capturing system (LCS) called Mediasite by SonicFoundry (Sonicfoundry). All recordings are available online only; currently, no downloadable versions of the recordings are provided by either of the two universities.
The LCS used in this study consists of a combination of hardware and software. It captures a number of different media at once. An external video camera captures the video of the lecturer. The audio, captured through the lecturer’s wireless microphone, is recorded and relayed to the system. Finally, the VGA signal, normally sent directly to the projector, is rerouted through the lecture-capturing system, where it is recorded along with the audio and video of the presenter. The LCS automatically adjusts the recording and synchronisation of the recorded audio, the video and the VGA signal. When the recording is complete, it is automatically uploaded to a server and made available for students. Students’ notes are
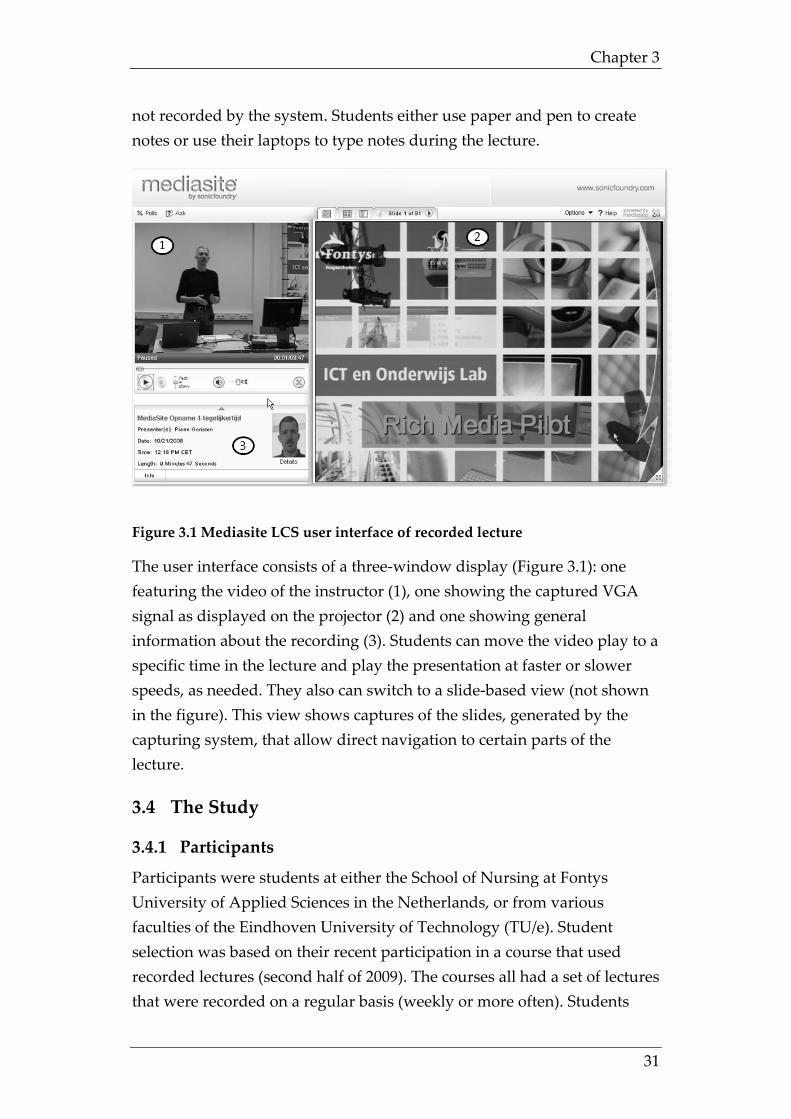
Chapter 3
31
not recorded by the system. Students either use paper and pen to create notes or use their laptops to type notes during the lecture.
Figure 3.1 Mediasite LCS user interface of recorded lecture
The user interface consists of a three-window display (Figure 3.1): one featuring the video of the instructor (1), one showing the captured VGA signal as displayed on the projector (2) and one showing general information about the recording (3). Students can move the video play to a specific time in the lecture and play the presentation at faster or slower speeds, as needed. They also can switch to a slide-based view (not shown in the figure). This view shows captures of the slides, generated by the capturing system, that allow direct navigation to certain parts of the lecture.
3.4 The Study
3.4.1 Participants
Participants were students at either the School of Nursing at Fontys University of Applied Sciences in the Netherlands, or from various faculties of the Eindhoven University of Technology (TU/e). Student selection was based on their recent participation in a course that used recorded lectures (second half of 2009). The courses all had a set of lectures that were recorded on a regular basis (weekly or more often). Students
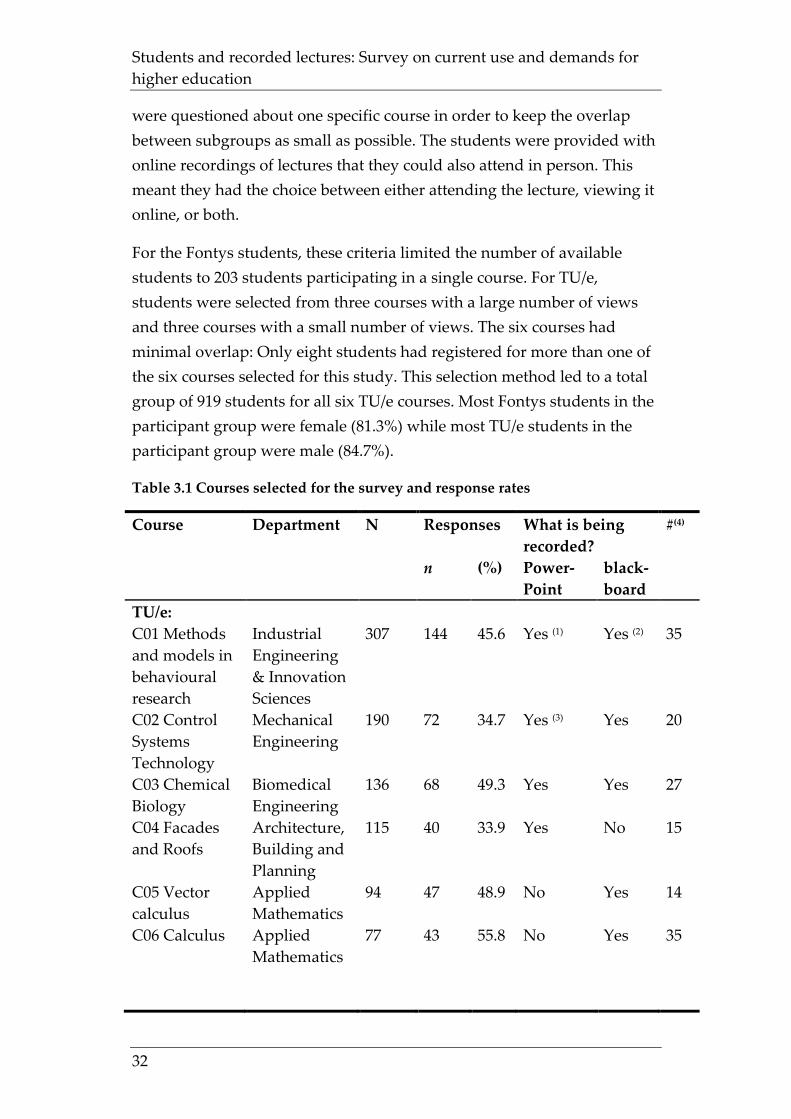
Students and recorded lectures: Survey on current use and demands for higher education
32
were questioned about one specific course in order to keep the overlap between subgroups as small as possible. The students were provided with online recordings of lectures that they could also attend in person. This meant they had the choice between either attending the lecture, viewing it online, or both.
For the Fontys students, these criteria limited the number of available students to 203 students participating in a single course. For TU/e, students were selected from three courses with a large number of views and three courses with a small number of views. The six courses had minimal overlap: Only eight students had registered for more than one of the six courses selected for this study. This selection method led to a total group of 919 students for all six TU/e courses. Most Fontys students in the participant group were female (81.3%) while most TU/e students in the participant group were male (84.7%).
Table 3.1 Courses selected for the survey and response rates
Course Department N Responses What is being recorded?
#(4)
n (%) Power- Point
black- board
TU/e: C01 Methods and models in behavioural research
Industrial Engineering & Innovation Sciences
307 144 45.6 Yes (1) Yes (2) 35
C02 Control Systems Technology
Mechanical Engineering
190 72 34.7 Yes (3)
Yes 20
C03 Chemical Biology
Biomedical Engineering
136 68 49.3 Yes Yes 27
C04 Facades and Roofs
Architecture, Building and Planning
115 40 33.9 Yes No 15
C05 Vector calculus
Applied Mathematics
94 47 48.9 No Yes 14
C06 Calculus Applied Mathematics
77 43 55.8 No Yes 35
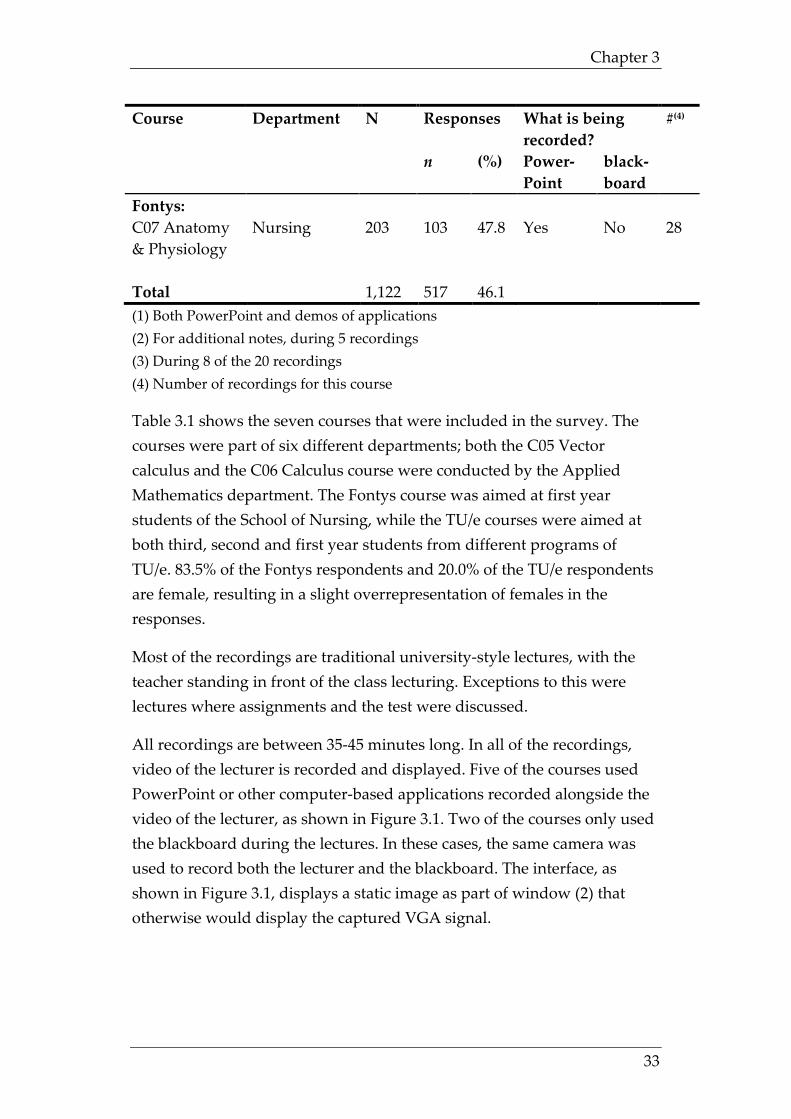
Chapter 3
33
Course Department N Responses What is being recorded?
#(4)
n (%) Power- Point
black- board
Fontys: C07 Anatomy & Physiology
Nursing 203 103 47.8 Yes No 28
Total 1,122 517 46.1 (1) Both PowerPoint and demos of applications (2) For additional notes, during 5 recordings (3) During 8 of the 20 recordings (4) Number of recordings for this course
Table 3.1 shows the seven courses that were included in the survey. The courses were part of six different departments; both the C05 Vector calculus and the C06 Calculus course were conducted by the Applied Mathematics department. The Fontys course was aimed at first year students of the School of Nursing, while the TU/e courses were aimed at both third, second and first year students from different programs of TU/e. 83.5% of the Fontys respondents and 20.0% of the TU/e respondents are female, resulting in a slight overrepresentation of females in the responses.
Most of the recordings are traditional university-style lectures, with the teacher standing in front of the class lecturing. Exceptions to this were lectures where assignments and the test were discussed.
All recordings are between 35-45 minutes long. In all of the recordings, video of the lecturer is recorded and displayed. Five of the courses used PowerPoint or other computer-based applications recorded alongside the video of the lecturer, as shown in Figure 3.1. Two of the courses only used the blackboard during the lectures. In these cases, the same camera was used to record both the lecturer and the blackboard. The interface, as shown in Figure 3.1, displays a static image as part of window (2) that otherwise would display the captured VGA signal.
Students and recorded lectures: Survey on current use and demands for higher education
34
3.4.2 Materials and procedures
During this stage of the research, the study consisted of two parts: an online survey and a number of semi-structured interviews. The online survey contained seventeen questions using both multiple choice and Likert scale questions. Some of the questions are based on questions used in other surveys on the use of recorded lectures (Hall, 2009; Kishi & Traphagan, 2007; T. Traphagan, 2006a; Veeramani & Bradly, 2008; Wieling, 2008; Williams & Fardon, 2007b; Zupancic, 2006). Students were able to complete the survey in about 10-15 minutes.
The first part of the survey asked students for their interest in the topic of the course, the perceived importance of the course for their course of study and the grade they wished to achieve for the course. In the second part of the survey, students rated the effectiveness of a number of available activities (e.g., attending face-to-face lectures) and supporting resources (e.g., slides, lecture notes, etc.) in helping them to succeed in the course. It also asked about any previous experience with lecture recordings, and whether they had used the recorded lectures for the course in question. In part three of the survey, those students who had used the lecture recordings were surveyed in more detail about their experiences during that use. Those questions were not displayed to students that indicated they had not used the recorded lectures. The final part of the survey contained questions for all students, seeking out reasons they did not watch one or more of the recorded lectures (if applicable). We reviewed the survey and tested it online with a number of peers and experts.
We approached the students using a personalised e-mail that contained the link to the web-based survey. In the e-mail and the survey itself, the students were reminded to complete the survey based on their experiences and use for the one specific course mentioned. The survey was open online for two weeks. An e-mail reminder was sent after one week and again on the final day of the survey to those students who had not completed the survey.
All questions in the survey and informational e-mails were provided in both Dutch and English because some of the international students at TU/e prefer English over Dutch. Students could switch between the Dutch
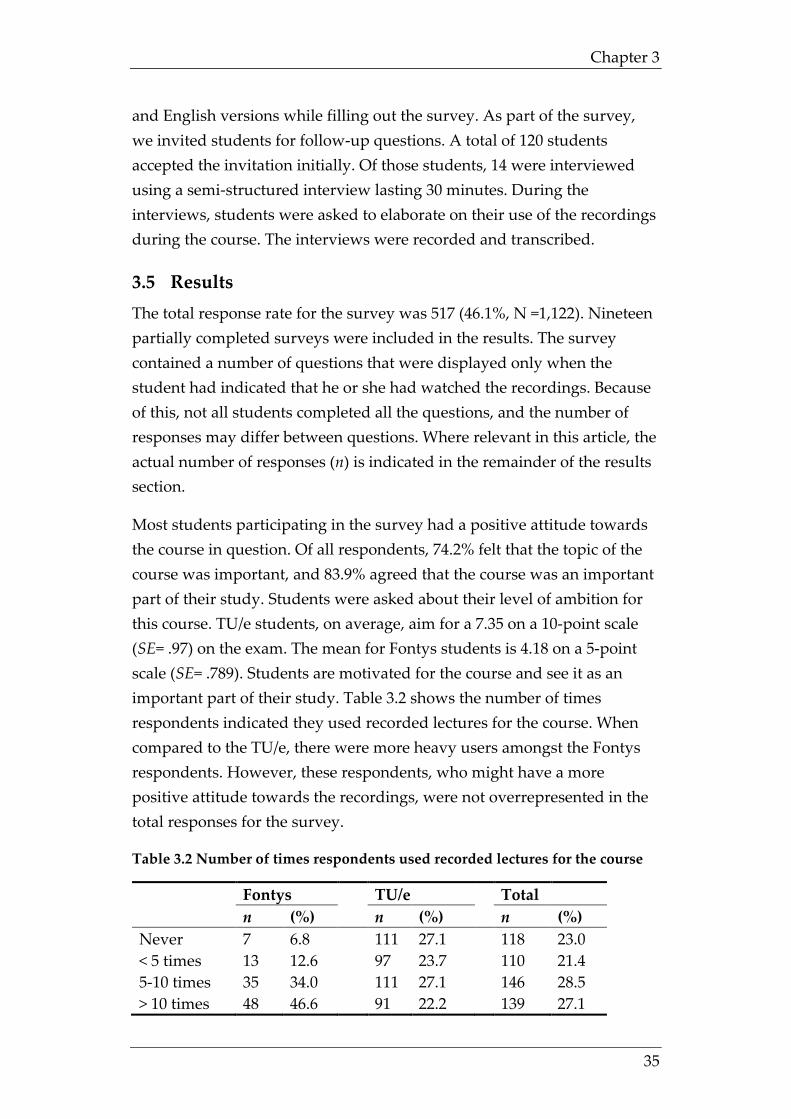
Chapter 3
35
and English versions while filling out the survey. As part of the survey, we invited students for follow-up questions. A total of 120 students accepted the invitation initially. Of those students, 14 were interviewed using a semi-structured interview lasting 30 minutes. During the interviews, students were asked to elaborate on their use of the recordings during the course. The interviews were recorded and transcribed.
3.5 Results The total response rate for the survey was 517 (46.1%, N =1,122). Nineteen partially completed surveys were included in the results. The survey contained a number of questions that were displayed only when the student had indicated that he or she had watched the recordings. Because of this, not all students completed all the questions, and the number of responses may differ between questions. Where relevant in this article, the actual number of responses (n) is indicated in the remainder of the results section.
Most students participating in the survey had a positive attitude towards the course in question. Of all respondents, 74.2% felt that the topic of the course was important, and 83.9% agreed that the course was an important part of their study. Students were asked about their level of ambition for this course. TU/e students, on average, aim for a 7.35 on a 10-point scale (SE= .97) on the exam. The mean for Fontys students is 4.18 on a 5-point scale (SE= .789). Students are motivated for the course and see it as an important part of their study. Table 3.2 shows the number of times respondents indicated they used recorded lectures for the course. When compared to the TU/e, there were more heavy users amongst the Fontys respondents. However, these respondents, who might have a more positive attitude towards the recordings, were not overrepresented in the total responses for the survey.
Table 3.2 Number of times respondents used recorded lectures for the course
Fontys TU/e Total n (%) n (%) n (%) Never 7 6.8 111 27.1 118 23.0 < 5 times 13 12.6 97 23.7 110 21.4 5-10 times 35 34.0 111 27.1 146 28.5 > 10 times 48 46.6 91 22.2 139 27.1
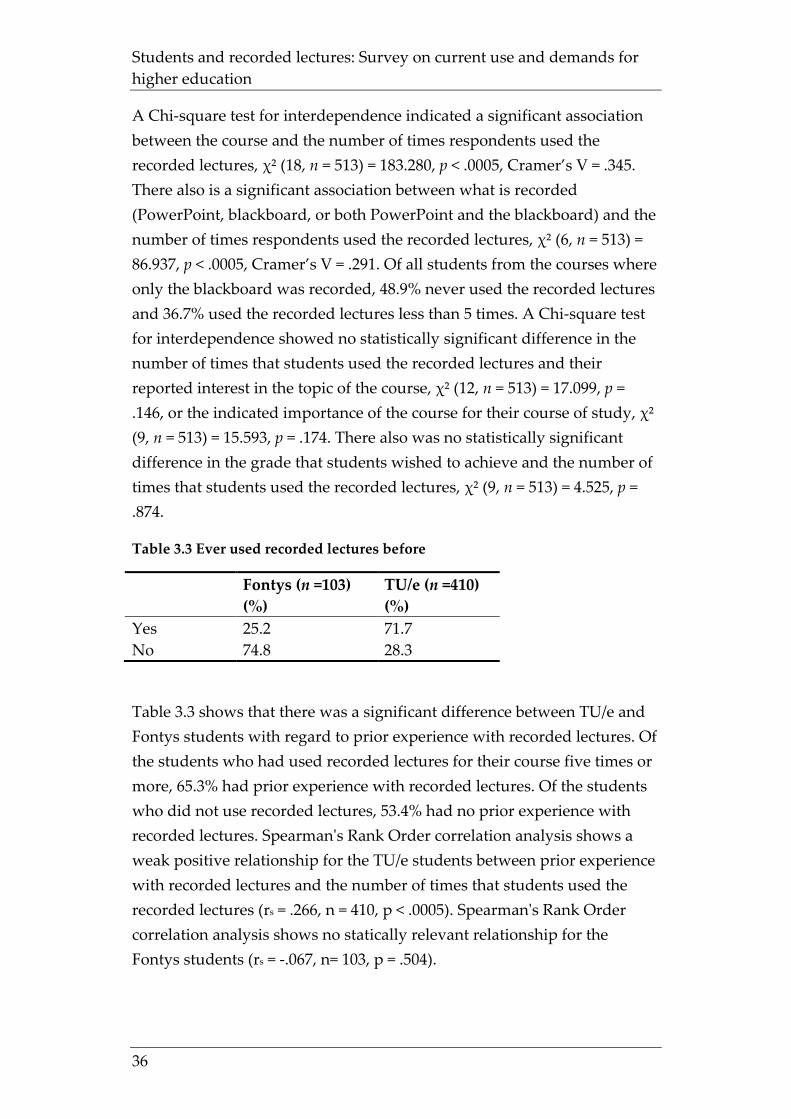
Students and recorded lectures: Survey on current use and demands for higher education
36
A Chi-square test for interdependence indicated a significant association between the course and the number of times respondents used the recorded lectures, χ² (18, n = 513) = 183.280, p < .0005, Cramer’s V = .345. There also is a significant association between what is recorded (PowerPoint, blackboard, or both PowerPoint and the blackboard) and the number of times respondents used the recorded lectures, χ² (6, n = 513) = 86.937, p < .0005, Cramer’s V = .291. Of all students from the courses where only the blackboard was recorded, 48.9% never used the recorded lectures and 36.7% used the recorded lectures less than 5 times. A Chi-square test for interdependence showed no statistically significant difference in the number of times that students used the recorded lectures and their reported interest in the topic of the course, χ² (12, n = 513) = 17.099, p = .146, or the indicated importance of the course for their course of study, χ² (9, n = 513) = 15.593, p = .174. There also was no statistically significant difference in the grade that students wished to achieve and the number of times that students used the recorded lectures, χ² (9, n = 513) = 4.525, p = .874.
Table 3.3 Ever used recorded lectures before
Fontys (n =103) (%)
TU/e (n =410) (%)
Yes 25.2 71.7 No 74.8 28.3
Table 3.3 shows that there was a significant difference between TU/e and Fontys students with regard to prior experience with recorded lectures. Of the students who had used recorded lectures for their course five times or more, 65.3% had prior experience with recorded lectures. Of the students who did not use recorded lectures, 53.4% had no prior experience with recorded lectures. Spearman's Rank Order correlation analysis shows a weak positive relationship for the TU/e students between prior experience with recorded lectures and the number of times that students used the recorded lectures (rs = .266, n = 410, p < .0005). Spearman's Rank Order correlation analysis shows no statically relevant relationship for the Fontys students (rs = -.067, n= 103, p = .504).
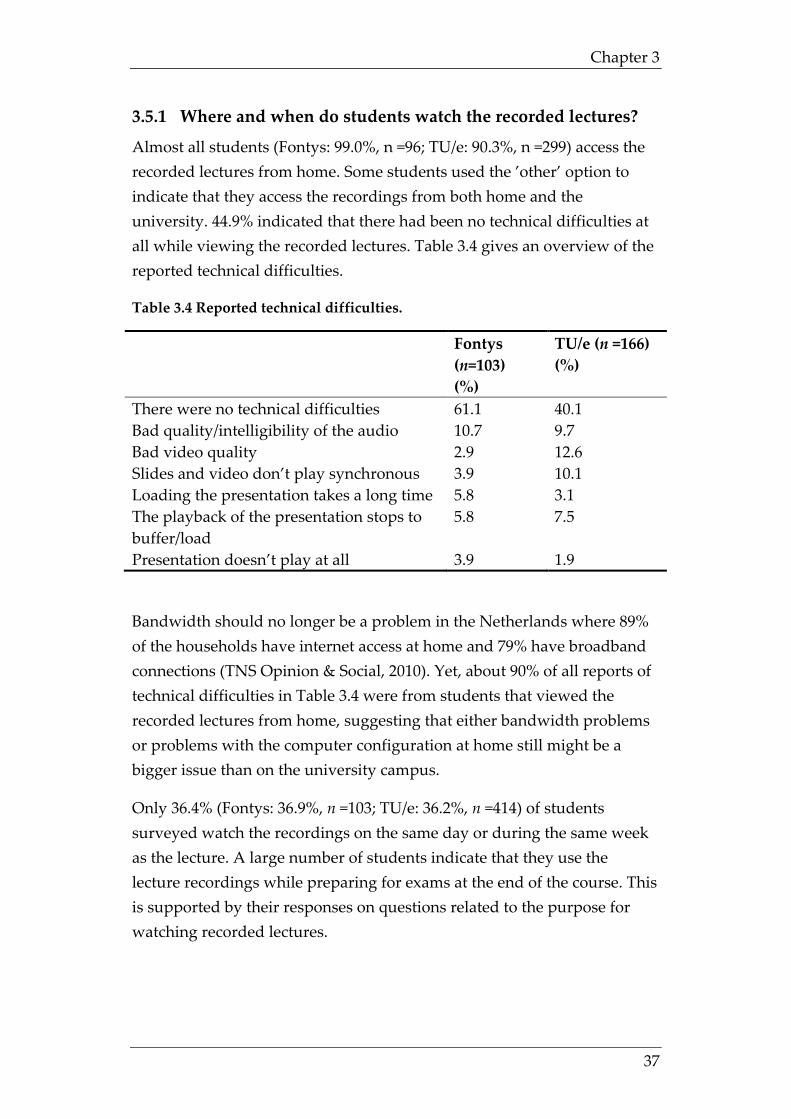
Chapter 3
37
3.5.1 Where and when do students watch the recorded lectures?
Almost all students (Fontys: 99.0%, n =96; TU/e: 90.3%, n =299) access the recorded lectures from home. Some students used the ’other’ option to indicate that they access the recordings from both home and the university. 44.9% indicated that there had been no technical difficulties at all while viewing the recorded lectures. Table 3.4 gives an overview of the reported technical difficulties.
Table 3.4 Reported technical difficulties.
Fontys (n=103) (%)
TU/e (n =166) (%)
There were no technical difficulties 61.1 40.1 Bad quality/intelligibility of the audio 10.7 9.7 Bad video quality 2.9 12.6 Slides and video don’t play synchronous 3.9 10.1 Loading the presentation takes a long time 5.8 3.1 The playback of the presentation stops to buffer/load
5.8 7.5
Presentation doesn’t play at all 3.9 1.9
Bandwidth should no longer be a problem in the Netherlands where 89% of the households have internet access at home and 79% have broadband connections (TNS Opinion & Social, 2010). Yet, about 90% of all reports of technical difficulties in Table 3.4 were from students that viewed the recorded lectures from home, suggesting that either bandwidth problems or problems with the computer configuration at home still might be a bigger issue than on the university campus.
Only 36.4% (Fontys: 36.9%, n =103; TU/e: 36.2%, n =414) of students surveyed watch the recordings on the same day or during the same week as the lecture. A large number of students indicate that they use the lecture recordings while preparing for exams at the end of the course. This is supported by their responses on questions related to the purpose for watching recorded lectures.
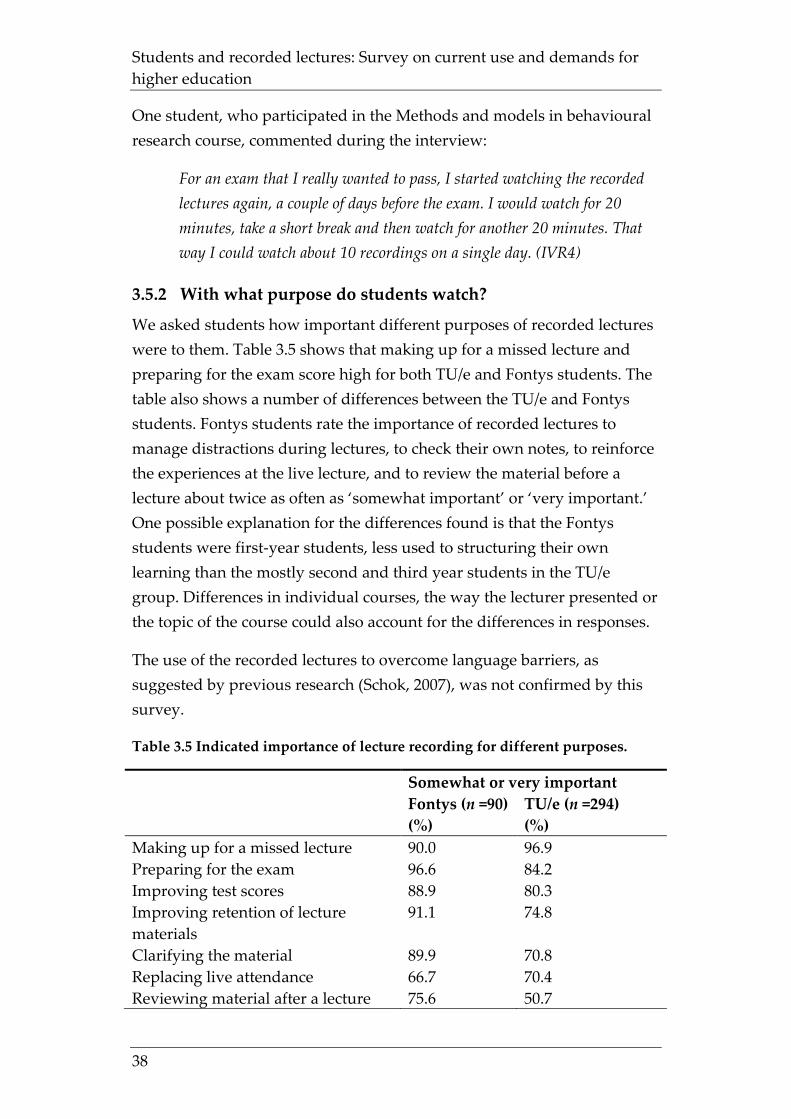
Students and recorded lectures: Survey on current use and demands for higher education
38
One student, who participated in the Methods and models in behavioural research course, commented during the interview:
For an exam that I really wanted to pass, I started watching the recorded lectures again, a couple of days before the exam. I would watch for 20 minutes, take a short break and then watch for another 20 minutes. That way I could watch about 10 recordings on a single day. (IVR4)
3.5.2 With what purpose do students watch?
We asked students how important different purposes of recorded lectures were to them. Table 3.5 shows that making up for a missed lecture and preparing for the exam score high for both TU/e and Fontys students. The table also shows a number of differences between the TU/e and Fontys students. Fontys students rate the importance of recorded lectures to manage distractions during lectures, to check their own notes, to reinforce the experiences at the live lecture, and to review the material before a lecture about twice as often as ‘somewhat important’ or ‘very important.’ One possible explanation for the differences found is that the Fontys students were first-year students, less used to structuring their own learning than the mostly second and third year students in the TU/e group. Differences in individual courses, the way the lecturer presented or the topic of the course could also account for the differences in responses.
The use of the recorded lectures to overcome language barriers, as suggested by previous research (Schok, 2007), was not confirmed by this survey.
Table 3.5 Indicated importance of lecture recording for different purposes.
Somewhat or very important Fontys (n =90)
(%) TU/e (n =294) (%)
Making up for a missed lecture 90.0 96.9 Preparing for the exam 96.6 84.2 Improving test scores 88.9 80.3 Improving retention of lecture materials
91.1 74.8
Clarifying the material 89.9 70.8 Replacing live attendance 66.7 70.4 Reviewing material after a lecture 75.6 50.7
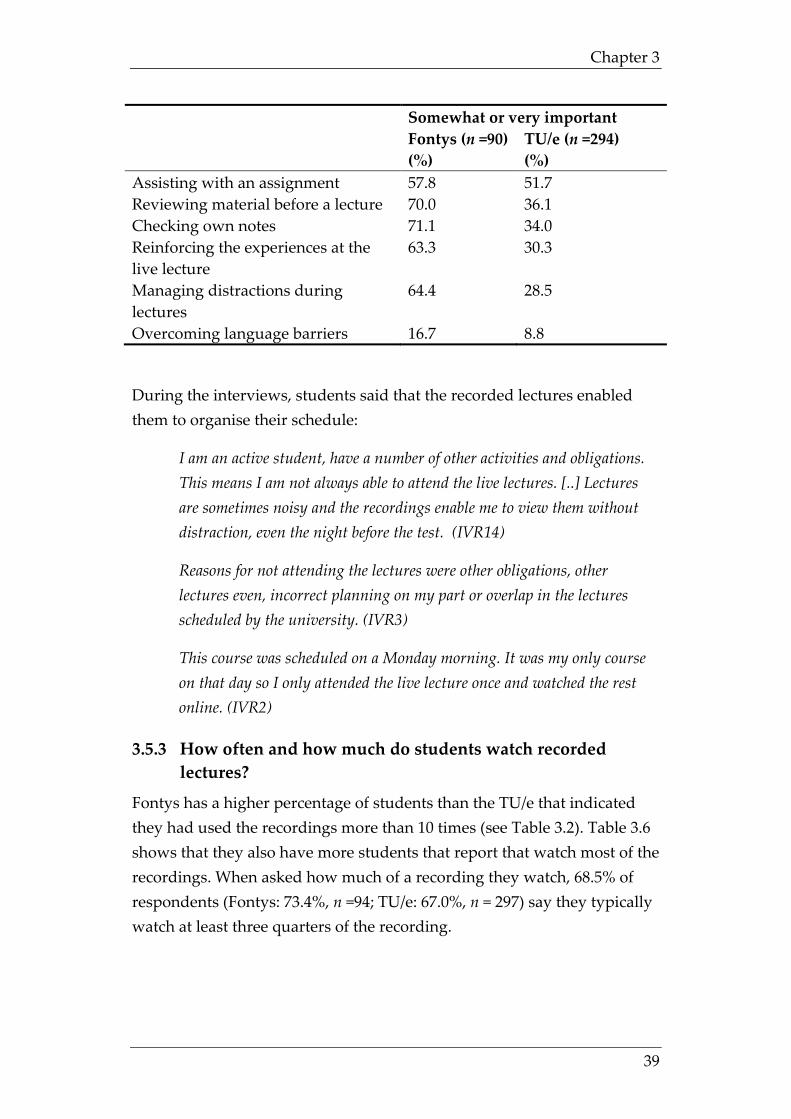
Chapter 3
39
Somewhat or very important Fontys (n =90)
(%) TU/e (n =294) (%)
Assisting with an assignment 57.8 51.7 Reviewing material before a lecture 70.0 36.1 Checking own notes 71.1 34.0 Reinforcing the experiences at the live lecture
63.3 30.3
Managing distractions during lectures
64.4 28.5
Overcoming language barriers 16.7 8.8
During the interviews, students said that the recorded lectures enabled them to organise their schedule:
I am an active student, have a number of other activities and obligations. This means I am not always able to attend the live lectures. [..] Lectures are sometimes noisy and the recordings enable me to view them without distraction, even the night before the test. (IVR14)
Reasons for not attending the lectures were other obligations, other lectures even, incorrect planning on my part or overlap in the lectures scheduled by the university. (IVR3)
This course was scheduled on a Monday morning. It was my only course on that day so I only attended the live lecture once and watched the rest online. (IVR2)
3.5.3 How often and how much do students watch recorded lectures?
Fontys has a higher percentage of students than the TU/e that indicated they had used the recordings more than 10 times (see Table 3.2). Table 3.6 shows that they also have more students that report that watch most of the recordings. When asked how much of a recording they watch, 68.5% of respondents (Fontys: 73.4%, n =94; TU/e: 67.0%, n = 297) say they typically watch at least three quarters of the recording.
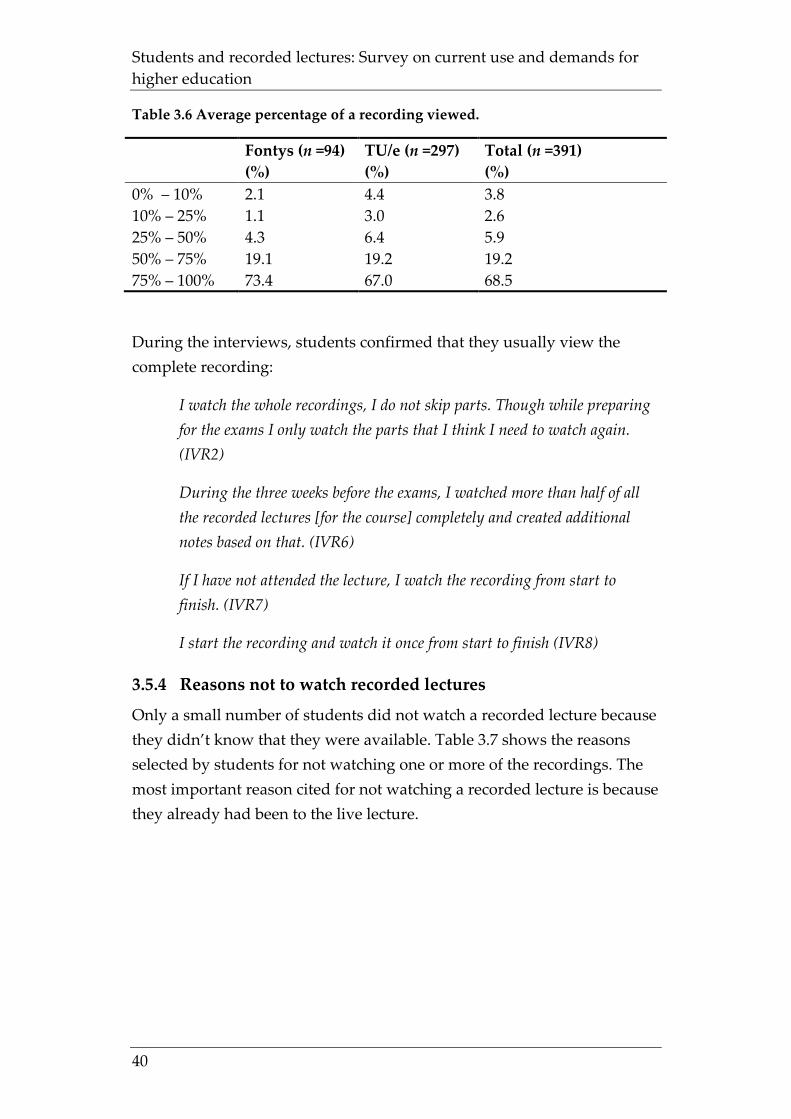
Students and recorded lectures: Survey on current use and demands for higher education
40
Table 3.6 Average percentage of a recording viewed.
Fontys (n =94) (%)
TU/e (n =297) (%)
Total (n =391) (%)
0% – 10% 2.1 4.4 3.8 10% – 25% 1.1 3.0 2.6 25% – 50% 4.3 6.4 5.9 50% – 75% 19.1 19.2 19.2 75% – 100% 73.4 67.0 68.5
During the interviews, students confirmed that they usually view the complete recording:
I watch the whole recordings, I do not skip parts. Though while preparing for the exams I only watch the parts that I think I need to watch again. (IVR2)
During the three weeks before the exams, I watched more than half of all the recorded lectures [for the course] completely and created additional notes based on that. (IVR6)
If I have not attended the lecture, I watch the recording from start to finish. (IVR7)
I start the recording and watch it once from start to finish (IVR8)
3.5.4 Reasons not to watch recorded lectures
Only a small number of students did not watch a recorded lecture because they didn’t know that they were available. Table 3.7 shows the reasons selected by students for not watching one or more of the recordings. The most important reason cited for not watching a recorded lecture is because they already had been to the live lecture.
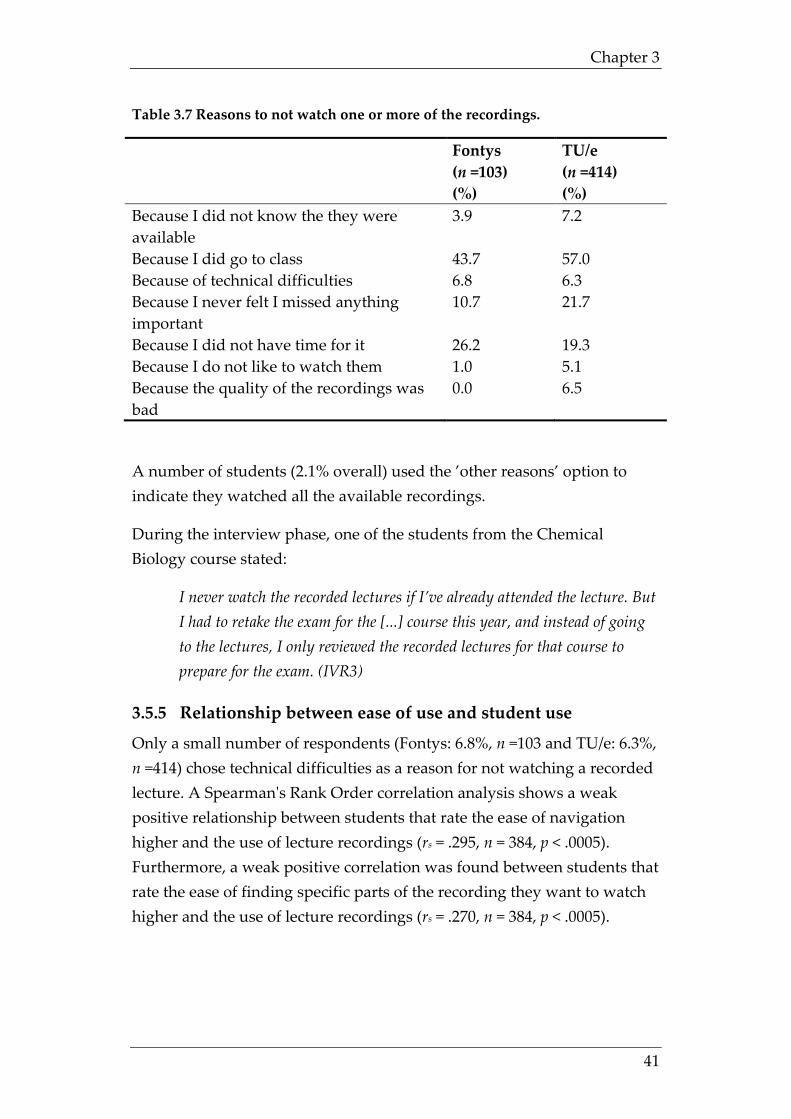
Chapter 3
41
Table 3.7 Reasons to not watch one or more of the recordings.
Fontys (n =103) (%)
TU/e (n =414) (%)
Because I did not know the they were available
3.9 7.2
Because I did go to class 43.7 57.0 Because of technical difficulties 6.8 6.3 Because I never felt I missed anything important
10.7 21.7
Because I did not have time for it 26.2 19.3 Because I do not like to watch them 1.0 5.1 Because the quality of the recordings was bad
0.0 6.5
A number of students (2.1% overall) used the ’other reasons’ option to indicate they watched all the available recordings.
During the interview phase, one of the students from the Chemical Biology course stated:
I never watch the recorded lectures if I’ve already attended the lecture. But I had to retake the exam for the [...] course this year, and instead of going to the lectures, I only reviewed the recorded lectures for that course to prepare for the exam. (IVR3)
3.5.5 Relationship between ease of use and student use
Only a small number of respondents (Fontys: 6.8%, n =103 and TU/e: 6.3%, n =414) chose technical difficulties as a reason for not watching a recorded lecture. A Spearman's Rank Order correlation analysis shows a weak positive relationship between students that rate the ease of navigation higher and the use of lecture recordings (rs = .295, n = 384, p < .0005). Furthermore, a weak positive correlation was found between students that rate the ease of finding specific parts of the recording they want to watch higher and the use of lecture recordings (rs = .270, n = 384, p < .0005).
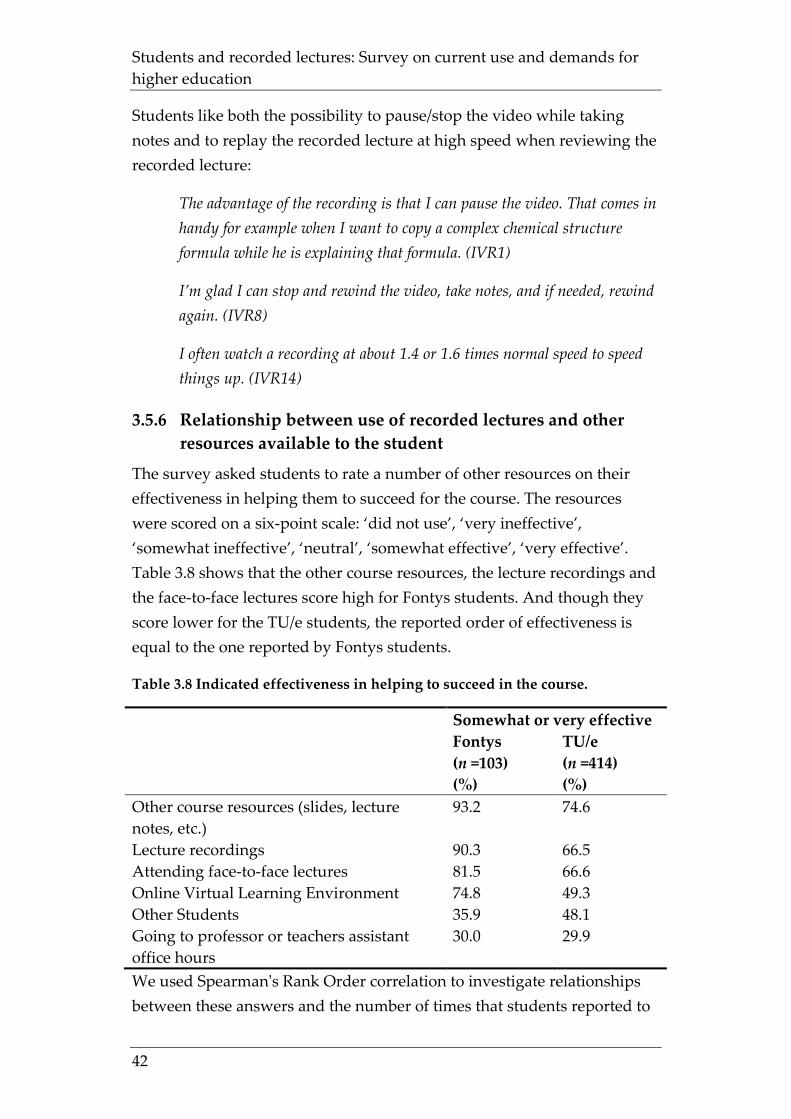
Students and recorded lectures: Survey on current use and demands for higher education
42
Students like both the possibility to pause/stop the video while taking notes and to replay the recorded lecture at high speed when reviewing the recorded lecture:
The advantage of the recording is that I can pause the video. That comes in handy for example when I want to copy a complex chemical structure formula while he is explaining that formula. (IVR1)
I’m glad I can stop and rewind the video, take notes, and if needed, rewind again. (IVR8)
I often watch a recording at about 1.4 or 1.6 times normal speed to speed things up. (IVR14)
3.5.6 Relationship between use of recorded lectures and other resources available to the student
The survey asked students to rate a number of other resources on their effectiveness in helping them to succeed for the course. The resources were scored on a six-point scale: ‘did not use’, ‘very ineffective’, ‘somewhat ineffective’, ‘neutral’, ‘somewhat effective’, ‘very effective’. Table 3.8 shows that the other course resources, the lecture recordings and the face-to-face lectures score high for Fontys students. And though they score lower for the TU/e students, the reported order of effectiveness is equal to the one reported by Fontys students.
Table 3.8 Indicated effectiveness in helping to succeed in the course.
Somewhat or very effective Fontys
(n =103) (%)
TU/e (n =414) (%)
Other course resources (slides, lecture notes, etc.)
93.2 74.6
Lecture recordings 90.3 66.5 Attending face-to-face lectures 81.5 66.6 Online Virtual Learning Environment 74.8 49.3 Other Students 35.9 48.1 Going to professor or teachers assistant office hours
30.0 29.9
We used Spearman's Rank Order correlation to investigate relationships between these answers and the number of times that students reported to
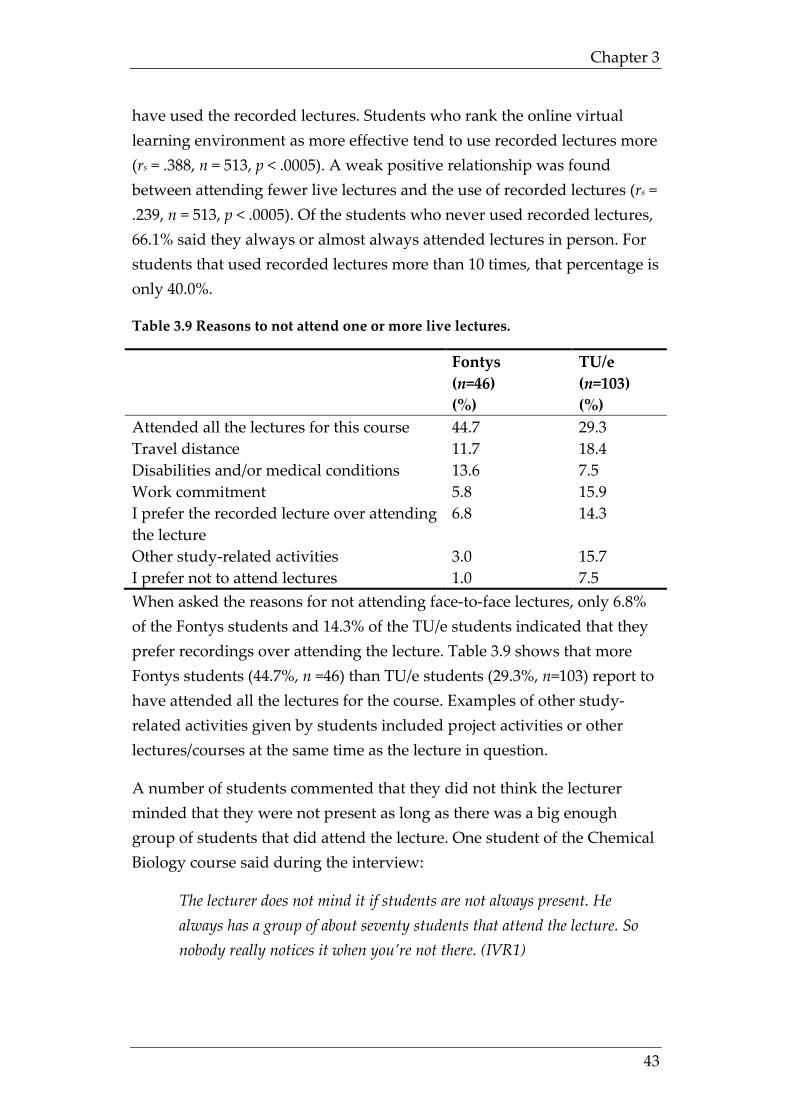
Chapter 3
43
have used the recorded lectures. Students who rank the online virtual learning environment as more effective tend to use recorded lectures more (rs = .388, n = 513, p < .0005). A weak positive relationship was found between attending fewer live lectures and the use of recorded lectures (rs = .239, n = 513, p < .0005). Of the students who never used recorded lectures, 66.1% said they always or almost always attended lectures in person. For students that used recorded lectures more than 10 times, that percentage is only 40.0%.
Table 3.9 Reasons to not attend one or more live lectures.
Fontys (n=46) (%)
TU/e (n=103) (%)
Attended all the lectures for this course 44.7 29.3 Travel distance 11.7 18.4 Disabilities and/or medical conditions 13.6 7.5 Work commitment 5.8 15.9 I prefer the recorded lecture over attending the lecture
6.8 14.3
Other study-related activities 3.0 15.7 I prefer not to attend lectures 1.0 7.5 When asked the reasons for not attending face-to-face lectures, only 6.8% of the Fontys students and 14.3% of the TU/e students indicated that they prefer recordings over attending the lecture. Table 3.9 shows that more Fontys students (44.7%, n =46) than TU/e students (29.3%, n=103) report to have attended all the lectures for the course. Examples of other study-related activities given by students included project activities or other lectures/courses at the same time as the lecture in question.
A number of students commented that they did not think the lecturer minded that they were not present as long as there was a big enough group of students that did attend the lecture. One student of the Chemical Biology course said during the interview:
The lecturer does not mind it if students are not always present. He always has a group of about seventy students that attend the lecture. So nobody really notices it when you’re not there. (IVR1)
Students and recorded lectures: Survey on current use and demands for higher education
44
Another student, from the Methods and models in behavioural research course, thought that some lecturers preferred smaller groups:
Some lecturers have problems with keeping order in large groups or get nervous if a lot of students talk during the lecture. Now, only the students that are motivated are there and the rest watches the recordings. (IVR5)
3.6 Discussion Students use recorded lectures as a replacement for missed lectures, either incidentally or as a structural replacement for lectures. They also use them for specific purposes, such as exam preparation, reviewing of material before a lecture or to improve the retention of lecture materials. This conforms with the findings of T. Traphagan (2006a), Veeramani and Bradly (2008) and Gosper et al. (2008).
A large number of students report that they view most of the recorded lectures. This is consistent with Gosper et al. (2008) who, based on a sample of 815 students, reported that 71% of the respondents stated that they listened to the entire recording. It is however higher than T. Traphagan (2006a) where only 46% or respondents out of a group of 488 said they watched the complete recordings.
The results show interesting differences in use between students from Fontys and TU/e. The Fontys students use the recorded lectures more than the TU/e students for activities such as managing distractions during lectures, checking their notes, reinforcing the experiences obtained at the live lecture and reviewing material before and after a lecture. These differences can be caused by differences in previous experience (or lack thereof) with recorded lectures, differences in gender, contents of the actual recorded lectures, course or department. Additional research is needed to determine the extent of the effect of each of these possible influencers.
Their reported interest in the topic of the course, the indicated importance of that topic for their study and the grade that students aim for does not appear to influence the number of times that students use the recorded lectures.
Chapter 3
45
In the interviews, even when prompted, students never mentioned quality of the lecture or lack thereof as decisive for watching or not watching a recorded lecture. Practical considerations like already having attended the lecture live or lack of time were much more important. There is a tendency that the recorded lectures for courses that only use the blackboard are viewed less often. This confirms the findings by T. Traphagan (2006a) that while some students are tempted to skip class because of recorded lectures, other factors affect attendance as much or more than the availability of recorded lectures does.
This research does not question the length, structure or contents of the lectures that are being recorded, even though those might merit reconsideration. Our goal was to research the use of recorded lectures in their current setting.
The collected data is based on verbal reports, in this case by students, of their use of recorded lectures. Surveys are prone to a number of errors (Deming, 1944). Methodological triangulation (N Denzin, 2006) increases the credibility and validity of the results provided by the surveys. Research by Judy Sheard, Jason Ceddia, John Hurst, and Juhani Tuovinen (2003) shows it is possible to infer student learning behaviour from their interaction with the system. The LCS used at Fontys and TU/e keeps a log of the students’ interactions with the recorded lectures. This data can also be used to get a more detailed view of the students’ navigation within the recorded lectures.
3.7 Conclusions The goal of this study was to get a better understanding of how students use the recorded lectures available at this moment. This is a first step towards the aim to improve the support for recorded lectures within different usage scenarios. Indeed, our study shows that different usage scenarios may apply. Students use recorded lectures to serve different purposes, such as replacement for lectures, exam preparation and reviewing material. Students of Higher Vocational Education seem to use recorded lectures more often than University students to check their understanding of a lecture they visited. We could not identify a relation between usage of recorded lectures and their quality or the importance of the topics covered.
Students and recorded lectures: Survey on current use and demands for higher education
46
Students know where to find the recordings and technical difficulties are seldom a reason not the watch the recorded lectures. Most technical problems occur when students view the recorded lectures from home.
In the next stage of the research, we will use the LCS logs to further study the above mentioned student usage scenarios for recorded lectures in a more quantitative way. This will enable us to better guide them to those parts of the lectures that they want to view given their intended purpose of use of the recorded lecture.
47
Chapter 4 Usage Reporting on Recorded Lectures using
Educational Data Mining*
4.1 Abstract Most research on the use of recorded lectures by students is based on surveys. In contrast, this study analyses the interactions of students with the recorded lectures. Our aim is to offer more support for navigating the parts of the recorded lecture that students want to view. To that end, survey data does not suffice; we need more detailed information about the use of the recorded lectures. In this article, we report an analysis of students’ use of recorded lectures at two Universities in the Netherlands. The data logged by the Lecture Capture System (LCS) is used and combined with collected survey data. We describe the process of data pre-processing, where multiple data sources are combined; after which, the data is cleaned, removing outliers and data not relevant to the research. The analysis first describes the resulting full dataset of 4,192 lecture recordings and 263 courses and then focusses on the usage for the course with the most learner sessions. We report discrepancies as well as similarities between students’ verbal reports on their use of recorded lectures and actual usage as logged by the recorded lecture servers. The analysis shows that recorded lectures are viewed to prepare for exams and assignments. The data suggests that students who that do this have a significantly higher chance of passing the exams. Given the discrepancies between verbal reports and actual usage, implementations should no longer rely on verbal reports alone.
* This chapter has been published as: Gorissen, P., Van Bruggen, J. M. & Jochems, W. (2012) Usage Reporting on Recorded Lectures using educational data mining, International Journal of Learning Technology, Vol. 7, No. 1, pp. 23-40. DOI: 10.1504/IJLT.2012.046864
Usage Reporting on Recorded Lectures using Educational Data Mining
48
4.2 Introduction The lecture has been around for hundreds of years. The lecture method is the most common form of teaching in institutions of higher education throughout the world (Behr, 1988). From a technological point of view, a lecture can be seen as a multimedia activity where the lecturer uses a combination of speech, writing and projected video and images to convey a message to the students (Abowd et al., 1996). Lectures can be enhanced by using video to support them. Weblectures are video recordings that have been specifically made for use as educational resources (Day, 2008). They consist of a studio recording containing a combination of video and audio with a synchronised view of the lecturer’s computer screen while displaying a presentation. A weblecture usually does not exceed twenty minutes. Screencasts (Udell, 2004) are a variation on the weblecture. They focus on what happens on the screen, for example, to explain the usage of a website. Screencasts may contain video of the presenter, but they usually only contain the audio and a recording of the screen. Because weblectures and screencasts are recorded in advance and in a controllable setting, their quality level can be reasonably high. The story they tell can be scripted in advance, re-takes of the recording are possible, and they can be made available to students in advance of the actual lecture. Recorded lectures use computing technology to facilitate the automatic capture and integration of and access to the media (blackboard, electronic whiteboard, presentation software, et cetera) used during a lecture (Abowd, Atkeson, et al., 1998; Abowd, Brotherton, & Bhalodia, 1998; Brotherton & Abowd, 2004). The lecture dictates the length, contents and structure. These integral recordings of lectures provide students with the opportunity to review lectures online at their own pace and at their preferred time and place. An increasing number of universities support their students by making recordings of lectures available online (Leoni & Lichti, 2009). The recordings are aimed at remote or part-time students as well as at on-campus full-time students that could attend the live lectures. Much of the research into recorded lectures focusses on the improvement of the technology used to capture the lectures (Abowd, Atkeson, et al., 1998; Abowd, Brotherton, et al., 1998; Baecker et al., 2003; Brotherton & Abowd, 2004; Zhang, Crawford, Rui, & He, 2005).
Chapter 4
49
Most of the research into the use of recorded lectures by students is based on surveys and verbal reports by students of their use of recorded lectures. Traphagan (2005a, 2006a), Veeramani and Bradly (2008) and Gosper et al. (2008) report that most students prefer courses accompanied by online recordings of the lectures. Some surveys report that a vast majority (91%) of the students ’strongly agree‘ or ’agree‘ that lecture capture makes it easier for them to learn (Craig, Brittan-Powell, El-Haggan, Gregory, & Braha, 2009) or that it improved their overall grade in the course (Sanchez, 2008). Recorded lectures are considered to be pedagogically neutral, but the availability can have a positive impact on the quality of the student experience (Deal, 2007). In our survey into the use of recorded lectures by students at two universities in the Netherlands, students reported that they see recorded lectures as an effective and versatile study tool (Gorissen, van Bruggen, & Jochems, 2012b). They use recorded lectures as an incidental or structural replacement for missed lectures as well as an aid for specific purposes, such as exam preparation. Our research suggests that students use the recordings differently at specific moments and for specific purposes. Sometimes they watch the entire recording; at other times, they only watch parts of it. The aim of our study is to analyse student interaction with the recorded lectures so institutions can better support them while they are navigating to the parts of the recorded lecture they want to view. For that, data from surveys is not sufficient. More detailed information about their use of the recorded lectures is needed.
In this article, we report on a study into usage reporting as a method to improve our understanding of the use of recorded lectures by students at a university in the Netherlands. We use three questions as the basis for the analysis:
• Do students use the recorded lectures as a structural substitute for lecture attendance?
• Do students repeatedly use the recorded lectures or just once? • Do students use the recorded lectures to study for the tests/exams
for this course?
The systems that provide access to recorded lectures record a significant amount and variety of data on what students are doing within the system.
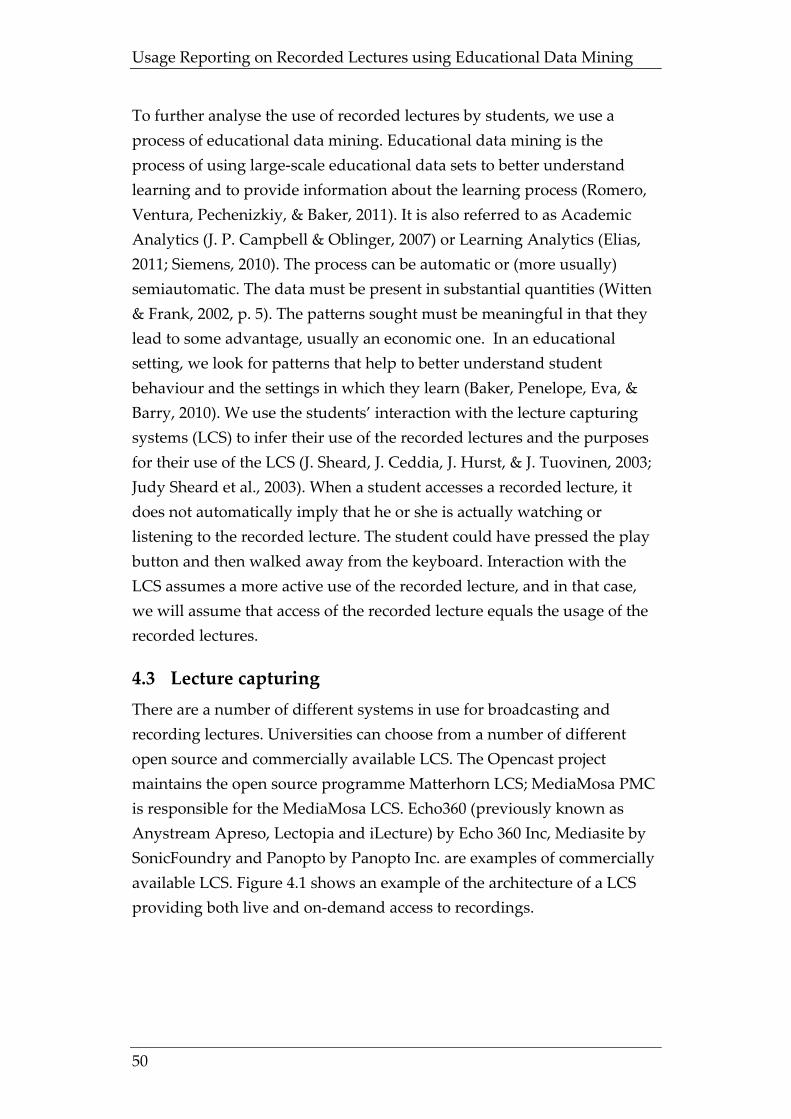
Usage Reporting on Recorded Lectures using Educational Data Mining
50
To further analyse the use of recorded lectures by students, we use a process of educational data mining. Educational data mining is the process of using large-scale educational data sets to better understand learning and to provide information about the learning process (Romero, Ventura, Pechenizkiy, & Baker, 2011). It is also referred to as Academic Analytics (J. P. Campbell & Oblinger, 2007) or Learning Analytics (Elias, 2011; Siemens, 2010). The process can be automatic or (more usually) semiautomatic. The data must be present in substantial quantities (Witten & Frank, 2002, p. 5). The patterns sought must be meaningful in that they lead to some advantage, usually an economic one. In an educational setting, we look for patterns that help to better understand student behaviour and the settings in which they learn (Baker, Penelope, Eva, & Barry, 2010). We use the students’ interaction with the lecture capturing systems (LCS) to infer their use of the recorded lectures and the purposes for their use of the LCS (J. Sheard, J. Ceddia, J. Hurst, & J. Tuovinen, 2003; Judy Sheard et al., 2003). When a student accesses a recorded lecture, it does not automatically imply that he or she is actually watching or listening to the recorded lecture. The student could have pressed the play button and then walked away from the keyboard. Interaction with the LCS assumes a more active use of the recorded lecture, and in that case, we will assume that access of the recorded lecture equals the usage of the recorded lectures.
4.3 Lecture capturing There are a number of different systems in use for broadcasting and recording lectures. Universities can choose from a number of different open source and commercially available LCS. The Opencast project maintains the open source programme Matterhorn LCS; MediaMosa PMC is responsible for the MediaMosa LCS. Echo360 (previously known as Anystream Apreso, Lectopia and iLecture) by Echo 360 Inc, Mediasite by SonicFoundry and Panopto by Panopto Inc. are examples of commercially available LCS. Figure 4.1 shows an example of the architecture of a LCS providing both live and on-demand access to recordings.
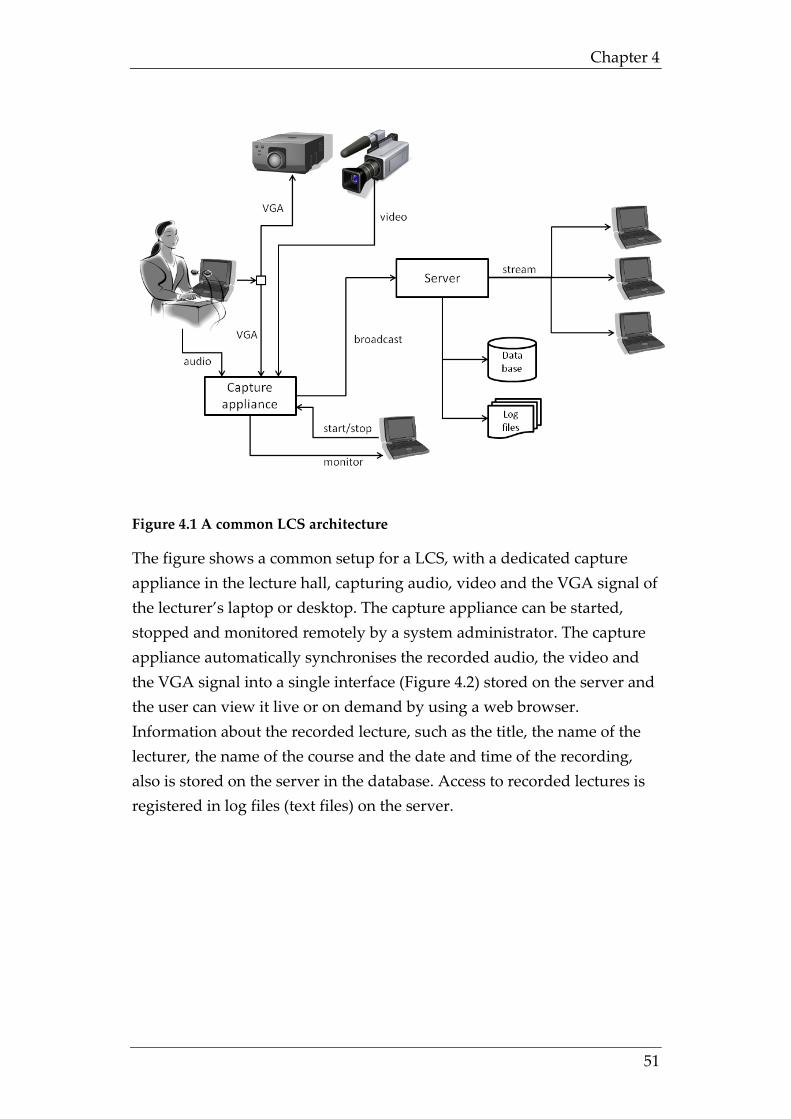
Chapter 4
51
Figure 4.1 A common LCS architecture
The figure shows a common setup for a LCS, with a dedicated capture appliance in the lecture hall, capturing audio, video and the VGA signal of the lecturer’s laptop or desktop. The capture appliance can be started, stopped and monitored remotely by a system administrator. The capture appliance automatically synchronises the recorded audio, the video and the VGA signal into a single interface (Figure 4.2) stored on the server and the user can view it live or on demand by using a web browser. Information about the recorded lecture, such as the title, the name of the lecturer, the name of the course and the date and time of the recording, also is stored on the server in the database. Access to recorded lectures is registered in log files (text files) on the server.
Usage Reporting on Recorded Lectures using Educational Data Mining
52
Figure 4.2 Recorded Lecture User Interface example
4.4 Method We analysed recordings created by the Eindhoven University of Technology (TU/e) in the Netherlands. The university uses the Mediasite LCS by SonicFoundry (Sonicfoundry). Six capture appliances are available to create recorded lectures. Currently the TU/e Mediasite repository holds about 8,000 recordings with a total length of over 5,000 hours of video. During the 2009-2010 academic year, a total of 128 different courses were recorded. The recorded lectures are typically about 40-45 minutes long, each containing one full lecture. The number of recordings per course depends on the number of lectures for that course; the average number of recordings for a single course recorded was 17 recordings, and the maximum was 48. Table 4.1 shows the top 10 of courses with the most number of recordings and the department within the university responsible for the course.
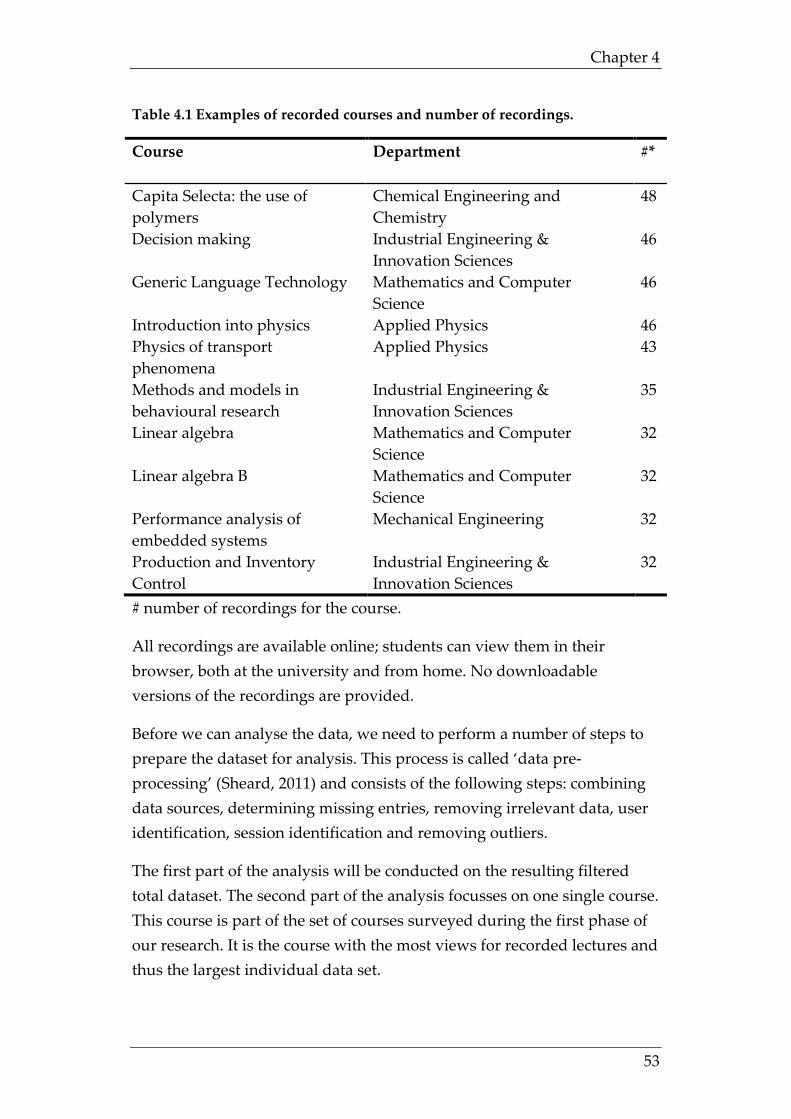
Chapter 4
53
Table 4.1 Examples of recorded courses and number of recordings.
Course Department #* Capita Selecta: the use of polymers
Chemical Engineering and Chemistry
48
Decision making Industrial Engineering & Innovation Sciences
46
Generic Language Technology Mathematics and Computer Science
46
Introduction into physics Applied Physics 46 Physics of transport phenomena
Applied Physics 43
Methods and models in behavioural research
Industrial Engineering & Innovation Sciences
35
Linear algebra Mathematics and Computer Science
32
Linear algebra B Mathematics and Computer Science
32
Performance analysis of embedded systems
Mechanical Engineering 32
Production and Inventory Control
Industrial Engineering & Innovation Sciences
32
# number of recordings for the course.
All recordings are available online; students can view them in their browser, both at the university and from home. No downloadable versions of the recordings are provided.
Before we can analyse the data, we need to perform a number of steps to prepare the dataset for analysis. This process is called ‘data pre-processing’ (Sheard, 2011) and consists of the following steps: combining data sources, determining missing entries, removing irrelevant data, user identification, session identification and removing outliers.
The first part of the analysis will be conducted on the resulting filtered total dataset. The second part of the analysis focusses on one single course. This course is part of the set of courses surveyed during the first phase of our research. It is the course with the most views for recorded lectures and thus the largest individual data set.
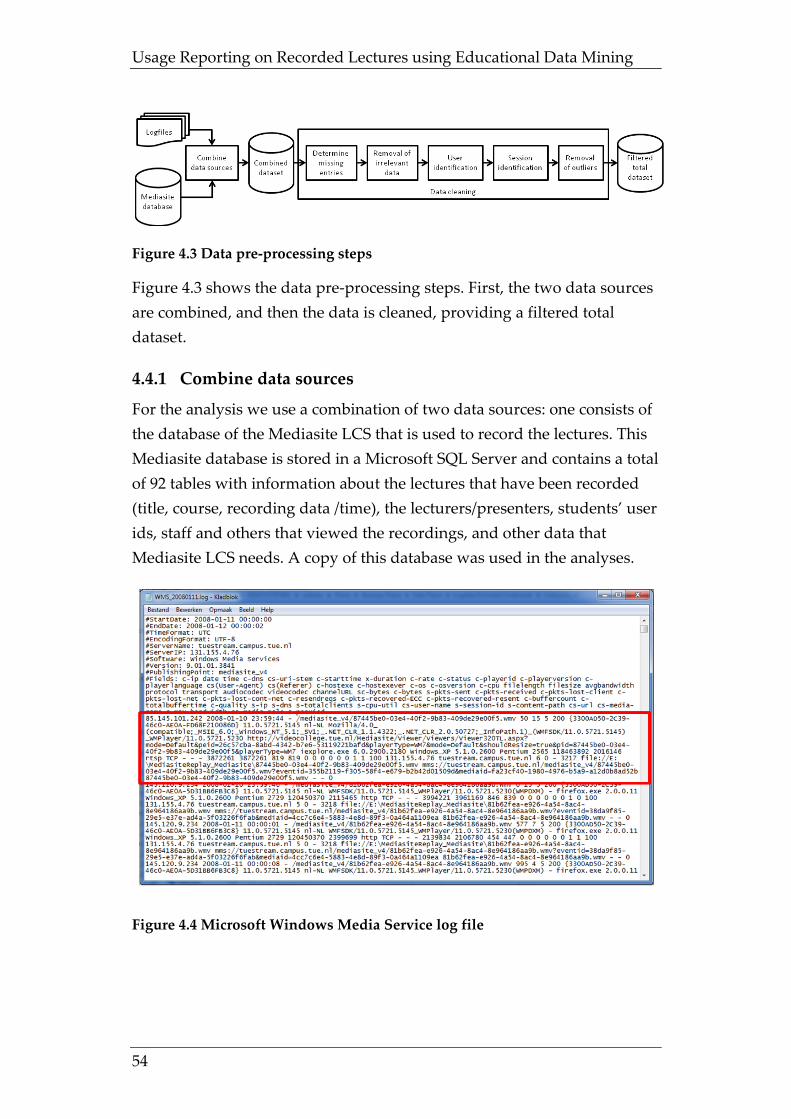
Usage Reporting on Recorded Lectures using Educational Data Mining
54
Figure 4.3 Data pre-processing steps
Figure 4.3 shows the data pre-processing steps. First, the two data sources are combined, and then the data is cleaned, providing a filtered total dataset.
4.4.1 Combine data sources
For the analysis we use a combination of two data sources: one consists of the database of the Mediasite LCS that is used to record the lectures. This Mediasite database is stored in a Microsoft SQL Server and contains a total of 92 tables with information about the lectures that have been recorded (title, course, recording data /time), the lecturers/presenters, students’ user ids, staff and others that viewed the recordings, and other data that Mediasite LCS needs. A copy of this database was used in the analyses.
Figure 4.4 Microsoft Windows Media Service log file
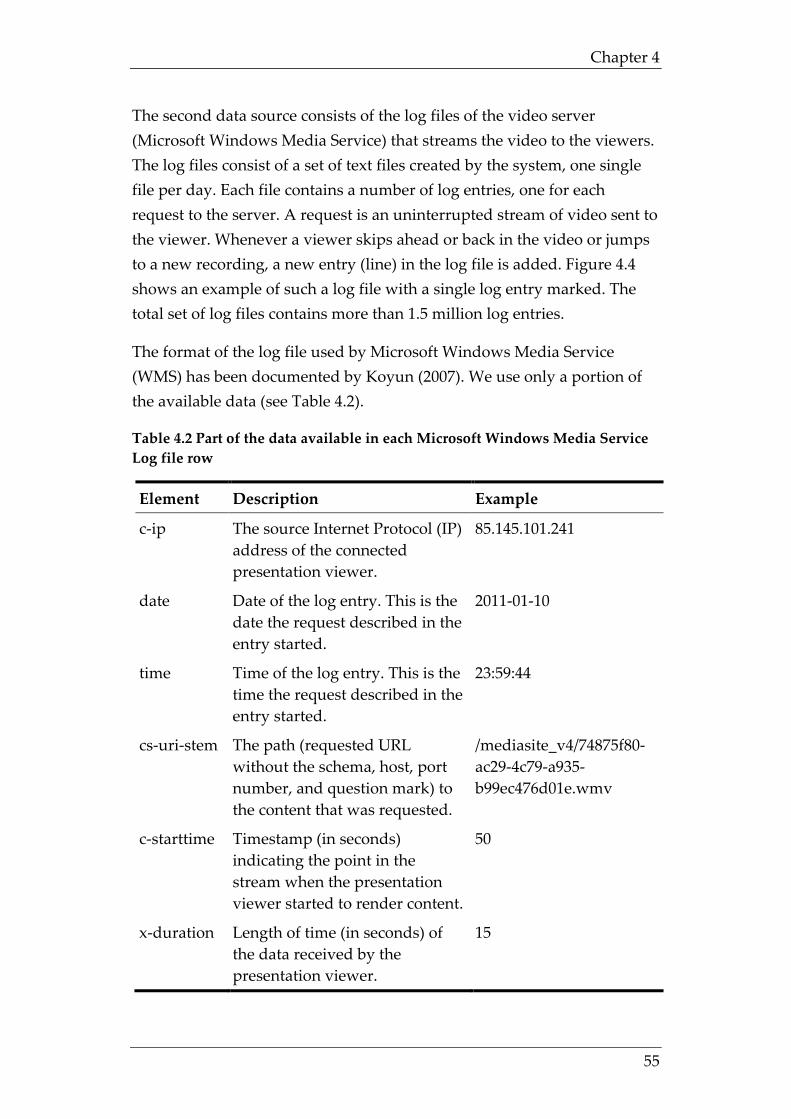
Chapter 4
55
The second data source consists of the log files of the video server (Microsoft Windows Media Service) that streams the video to the viewers. The log files consist of a set of text files created by the system, one single file per day. Each file contains a number of log entries, one for each request to the server. A request is an uninterrupted stream of video sent to the viewer. Whenever a viewer skips ahead or back in the video or jumps to a new recording, a new entry (line) in the log file is added. Figure 4.4 shows an example of such a log file with a single log entry marked. The total set of log files contains more than 1.5 million log entries.
The format of the log file used by Microsoft Windows Media Service (WMS) has been documented by Koyun (2007). We use only a portion of the available data (see Table 4.2).
Table 4.2 Part of the data available in each Microsoft Windows Media Service Log file row
Element Description Example
c-ip The source Internet Protocol (IP) address of the connected presentation viewer.
85.145.101.241
date Date of the log entry. This is the date the request described in the entry started.
2011-01-10
time Time of the log entry. This is the time the request described in the entry started.
23:59:44
cs-uri-stem The path (requested URL without the schema, host, port number, and question mark) to the content that was requested.
/mediasite_v4/74875f80-ac29-4c79-a935-b99ec476d01e.wmv
c-starttime Timestamp (in seconds) indicating the point in the stream when the presentation viewer started to render content.
50
x-duration Length of time (in seconds) of the data received by the presentation viewer.
15
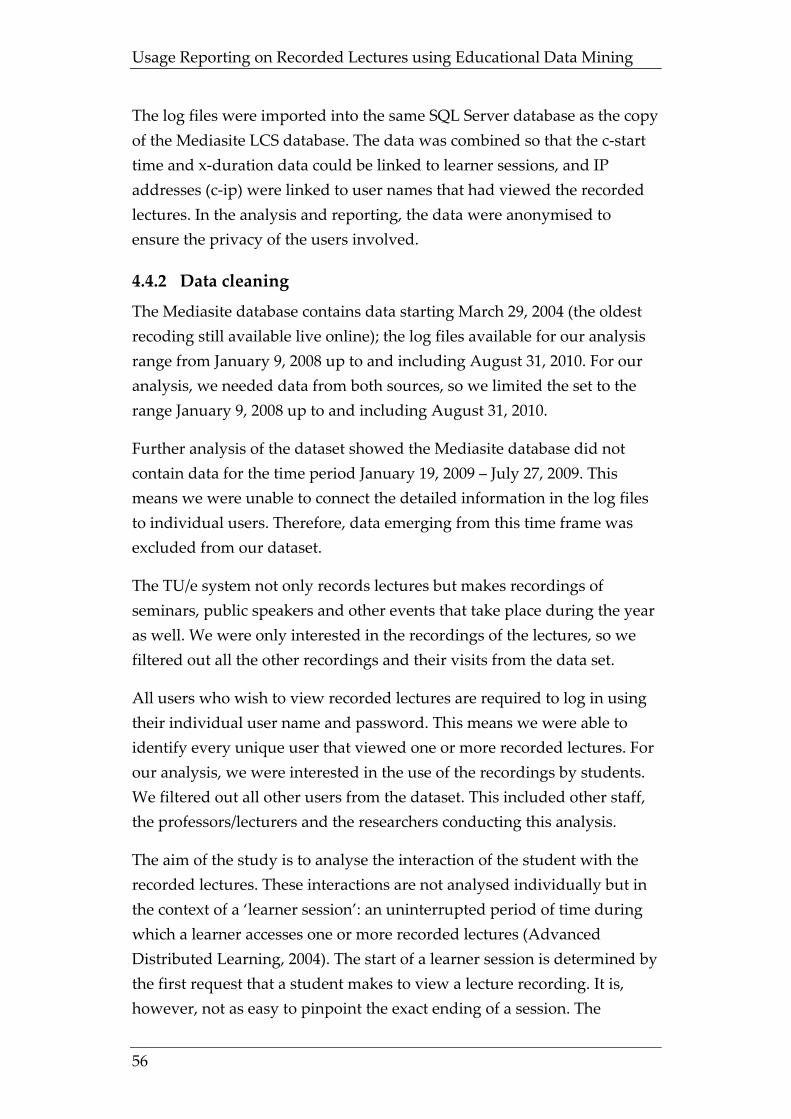
Usage Reporting on Recorded Lectures using Educational Data Mining
56
The log files were imported into the same SQL Server database as the copy of the Mediasite LCS database. The data was combined so that the c-start time and x-duration data could be linked to learner sessions, and IP addresses (c-ip) were linked to user names that had viewed the recorded lectures. In the analysis and reporting, the data were anonymised to ensure the privacy of the users involved.
4.4.2 Data cleaning
The Mediasite database contains data starting March 29, 2004 (the oldest recoding still available live online); the log files available for our analysis range from January 9, 2008 up to and including August 31, 2010. For our analysis, we needed data from both sources, so we limited the set to the range January 9, 2008 up to and including August 31, 2010.
Further analysis of the dataset showed the Mediasite database did not contain data for the time period January 19, 2009 – July 27, 2009. This means we were unable to connect the detailed information in the log files to individual users. Therefore, data emerging from this time frame was excluded from our dataset.
The TU/e system not only records lectures but makes recordings of seminars, public speakers and other events that take place during the year as well. We were only interested in the recordings of the lectures, so we filtered out all the other recordings and their visits from the data set.
All users who wish to view recorded lectures are required to log in using their individual user name and password. This means we were able to identify every unique user that viewed one or more recorded lectures. For our analysis, we were interested in the use of the recordings by students. We filtered out all other users from the dataset. This included other staff, the professors/lecturers and the researchers conducting this analysis.
The aim of the study is to analyse the interaction of the student with the recorded lectures. These interactions are not analysed individually but in the context of a ‘learner session’: an uninterrupted period of time during which a learner accesses one or more recorded lectures (Advanced Distributed Learning, 2004). The start of a learner session is determined by the first request that a student makes to view a lecture recording. It is, however, not as easy to pinpoint the exact ending of a session. The
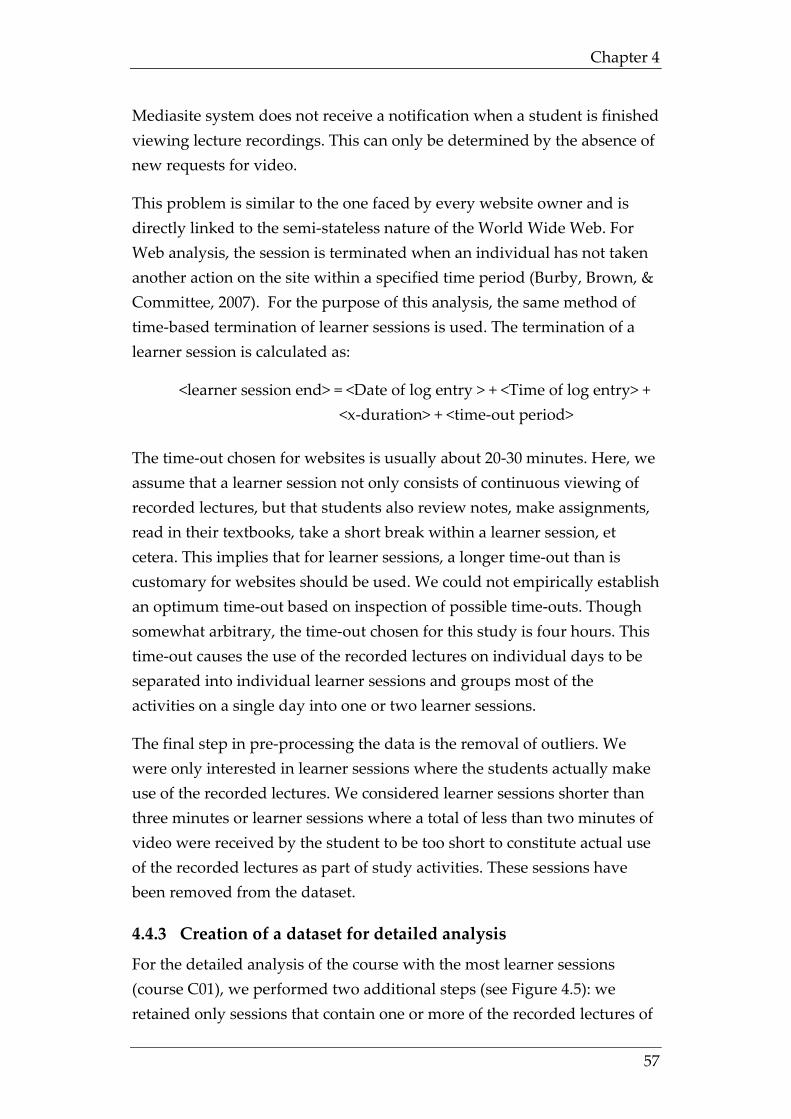
Chapter 4
57
Mediasite system does not receive a notification when a student is finished viewing lecture recordings. This can only be determined by the absence of new requests for video.
This problem is similar to the one faced by every website owner and is directly linked to the semi-stateless nature of the World Wide Web. For Web analysis, the session is terminated when an individual has not taken another action on the site within a specified time period (Burby, Brown, & Committee, 2007). For the purpose of this analysis, the same method of time-based termination of learner sessions is used. The termination of a learner session is calculated as:
<learner session end> = <Date of log entry > + <Time of log entry> + <x-duration> + <time-out period>
The time-out chosen for websites is usually about 20-30 minutes. Here, we assume that a learner session not only consists of continuous viewing of recorded lectures, but that students also review notes, make assignments, read in their textbooks, take a short break within a learner session, et cetera. This implies that for learner sessions, a longer time-out than is customary for websites should be used. We could not empirically establish an optimum time-out based on inspection of possible time-outs. Though somewhat arbitrary, the time-out chosen for this study is four hours. This time-out causes the use of the recorded lectures on individual days to be separated into individual learner sessions and groups most of the activities on a single day into one or two learner sessions.
The final step in pre-processing the data is the removal of outliers. We were only interested in learner sessions where the students actually make use of the recorded lectures. We considered learner sessions shorter than three minutes or learner sessions where a total of less than two minutes of video were received by the student to be too short to constitute actual use of the recorded lectures as part of study activities. These sessions have been removed from the dataset.
4.4.3 Creation of a dataset for detailed analysis
For the detailed analysis of the course with the most learner sessions (course C01), we performed two additional steps (see Figure 4.5): we retained only sessions that contain one or more of the recorded lectures of
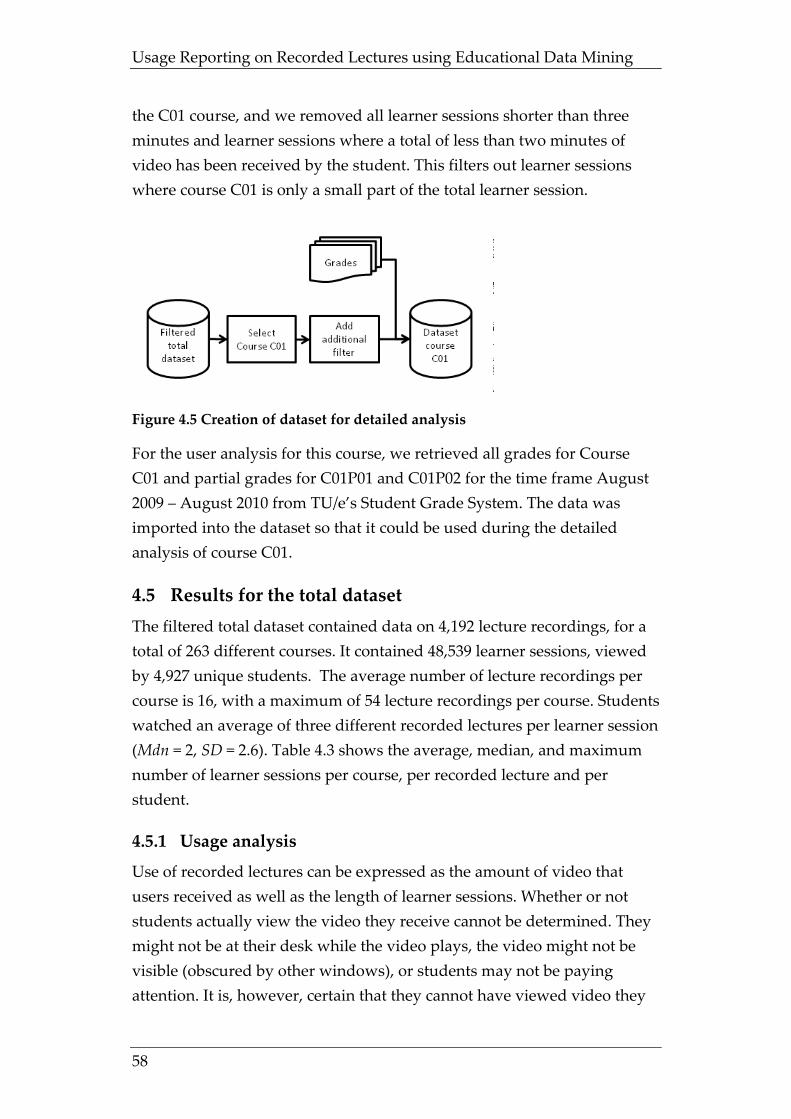
Usage Reporting on Recorded Lectures using Educational Data Mining
58
the C01 course, and we removed all learner sessions shorter than three minutes and learner sessions where a total of less than two minutes of video has been received by the student. This filters out learner sessions where course C01 is only a small part of the total learner session.
Figure 4.5 Creation of dataset for detailed analysis
For the user analysis for this course, we retrieved all grades for Course C01 and partial grades for C01P01 and C01P02 for the time frame August 2009 – August 2010 from TU/e’s Student Grade System. The data was imported into the dataset so that it could be used during the detailed analysis of course C01.
4.5 Results for the total dataset The filtered total dataset contained data on 4,192 lecture recordings, for a total of 263 different courses. It contained 48,539 learner sessions, viewed by 4,927 unique students. The average number of lecture recordings per course is 16, with a maximum of 54 lecture recordings per course. Students watched an average of three different recorded lectures per learner session (Mdn = 2, SD = 2.6). Table 4.3 shows the average, median, and maximum number of learner sessions per course, per recorded lecture and per student.
4.5.1 Usage analysis
Use of recorded lectures can be expressed as the amount of video that users received as well as the length of learner sessions. Whether or not students actually view the video they receive cannot be determined. They might not be at their desk while the video plays, the video might not be visible (obscured by other windows), or students may not be paying attention. It is, however, certain that they cannot have viewed video they
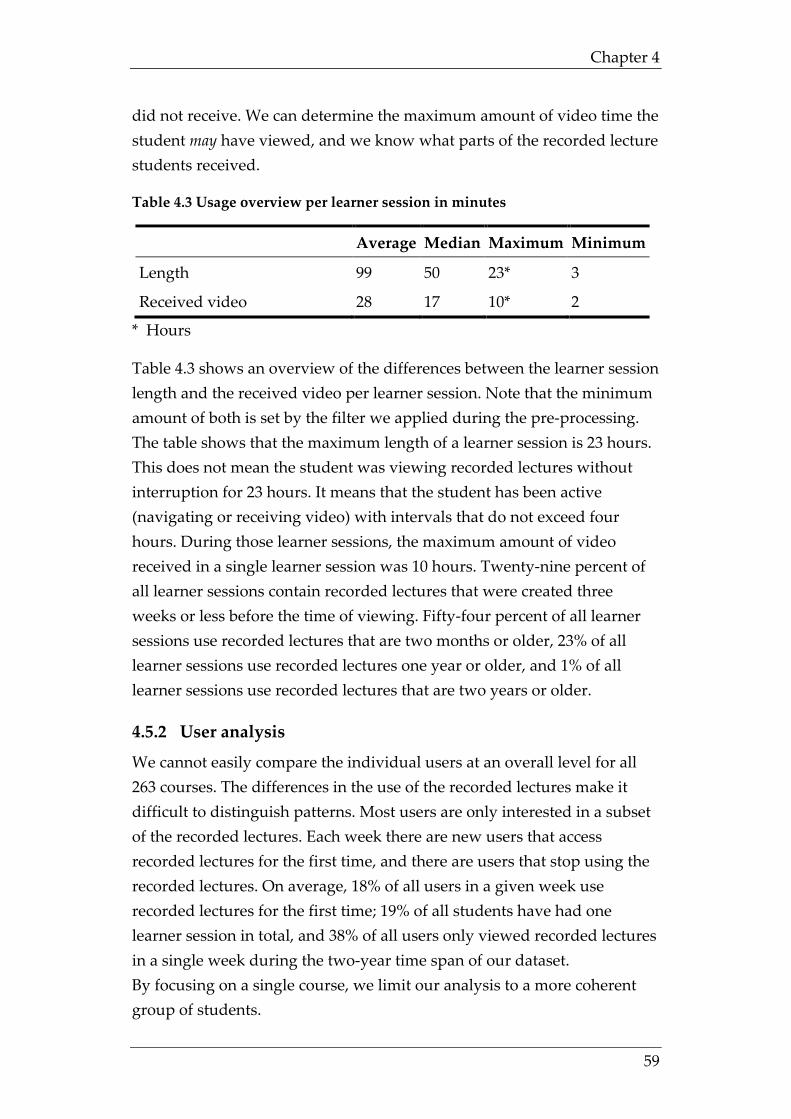
Chapter 4
59
did not receive. We can determine the maximum amount of video time the student may have viewed, and we know what parts of the recorded lecture students received.
Table 4.3 Usage overview per learner session in minutes
Average Median Maximum Minimum
Length 99 50 23* 3
Received video 28 17 10* 2
* Hours
Table 4.3 shows an overview of the differences between the learner session length and the received video per learner session. Note that the minimum amount of both is set by the filter we applied during the pre-processing. The table shows that the maximum length of a learner session is 23 hours. This does not mean the student was viewing recorded lectures without interruption for 23 hours. It means that the student has been active (navigating or receiving video) with intervals that do not exceed four hours. During those learner sessions, the maximum amount of video received in a single learner session was 10 hours. Twenty-nine percent of all learner sessions contain recorded lectures that were created three weeks or less before the time of viewing. Fifty-four percent of all learner sessions use recorded lectures that are two months or older, 23% of all learner sessions use recorded lectures one year or older, and 1% of all learner sessions use recorded lectures that are two years or older.
4.5.2 User analysis
We cannot easily compare the individual users at an overall level for all 263 courses. The differences in the use of the recorded lectures make it difficult to distinguish patterns. Most users are only interested in a subset of the recorded lectures. Each week there are new users that access recorded lectures for the first time, and there are users that stop using the recorded lectures. On average, 18% of all users in a given week use recorded lectures for the first time; 19% of all students have had one learner session in total, and 38% of all users only viewed recorded lectures in a single week during the two-year time span of our dataset. By focusing on a single course, we limit our analysis to a more coherent group of students.
Usage Reporting on Recorded Lectures using Educational Data Mining
60
4.6 Results for the detailed analysis of course C01 Course C01 is a course at the faculty of Industrial Engineering & Innovation Sciences of the TU/e. Students that participate in the course come from a number of different departments within the university. Most of the students (66%) are from the Industrial Engineering department; another substantial group of students (23%) is from the Innovation Sciences department. The course consists of an introduction in empirical research. Students learn how to translate real-life questions into research questions, and they learn how to create and evaluate research design. In the second part of the course, they receive hands-on training using SPSS. The course is taught by two lecturers: one for the first part of the course and one for the second part. The first part of the course is taught in Dutch; the second part is taught in English.
Grading for the course is done in two parts, and grades are registered for both individual parts and for the complete course. The first partial grade (C01P01) consists of the combined result for a 90-minute written test and an assignment. The second partial grade (C01P02) consists of a three-hour laptop test. Each partial grade (C01P01 and C01P02) needs to be 5.0 or higher on a 10-point scale. If that is the case, the grade for C01 = .5 x C01P01 + .5 x C01P02. This combined grade needs to be 6.0 or higher on a 10-point scale. Each partial grade can be retried once every year. Partial grades can extend into the next year.
The lecture recordings we examined span the period August 2009 through January 2010. During that period, there were a total of 35 recorded lectures captured as eighteen 2 x 45-minute recordings (the last lecture only consisted of 1 x 45 minutes).
During this detailed analysis of course C01, we will use the created ’dataset for the detailed analysis’.
4.6.1 Usage analysis
Figure 4.6 shows the number of learner sessions per week for the time frame August 2009 (week 36 of 2009, indicated as 200936) through August 2010 (week 35 of 2010, indicated as 201035).
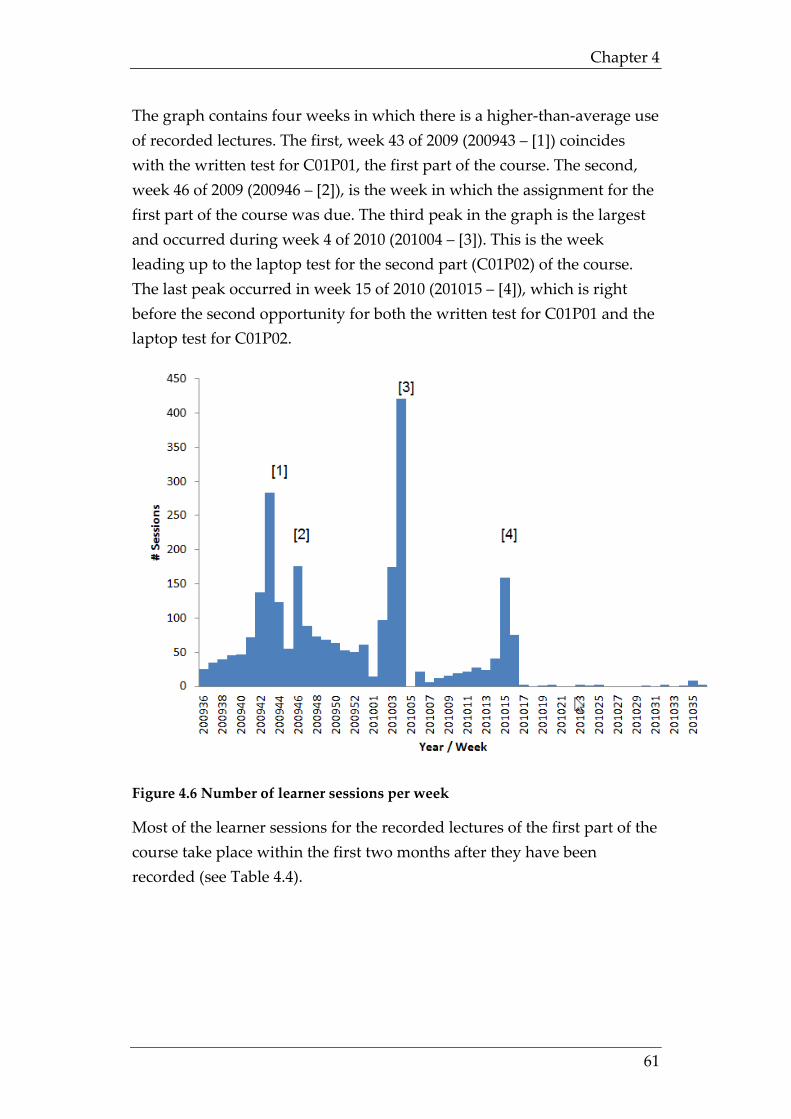
Chapter 4
61
The graph contains four weeks in which there is a higher-than-average use of recorded lectures. The first, week 43 of 2009 (200943 – [1]) coincides with the written test for C01P01, the first part of the course. The second, week 46 of 2009 (200946 – [2]), is the week in which the assignment for the first part of the course was due. The third peak in the graph is the largest and occurred during week 4 of 2010 (201004 – [3]). This is the week leading up to the laptop test for the second part (C01P02) of the course. The last peak occurred in week 15 of 2010 (201015 – [4]), which is right before the second opportunity for both the written test for C01P01 and the laptop test for C01P02.
Figure 4.6 Number of learner sessions per week
Most of the learner sessions for the recorded lectures of the first part of the course take place within the first two months after they have been recorded (see Table 4.4).
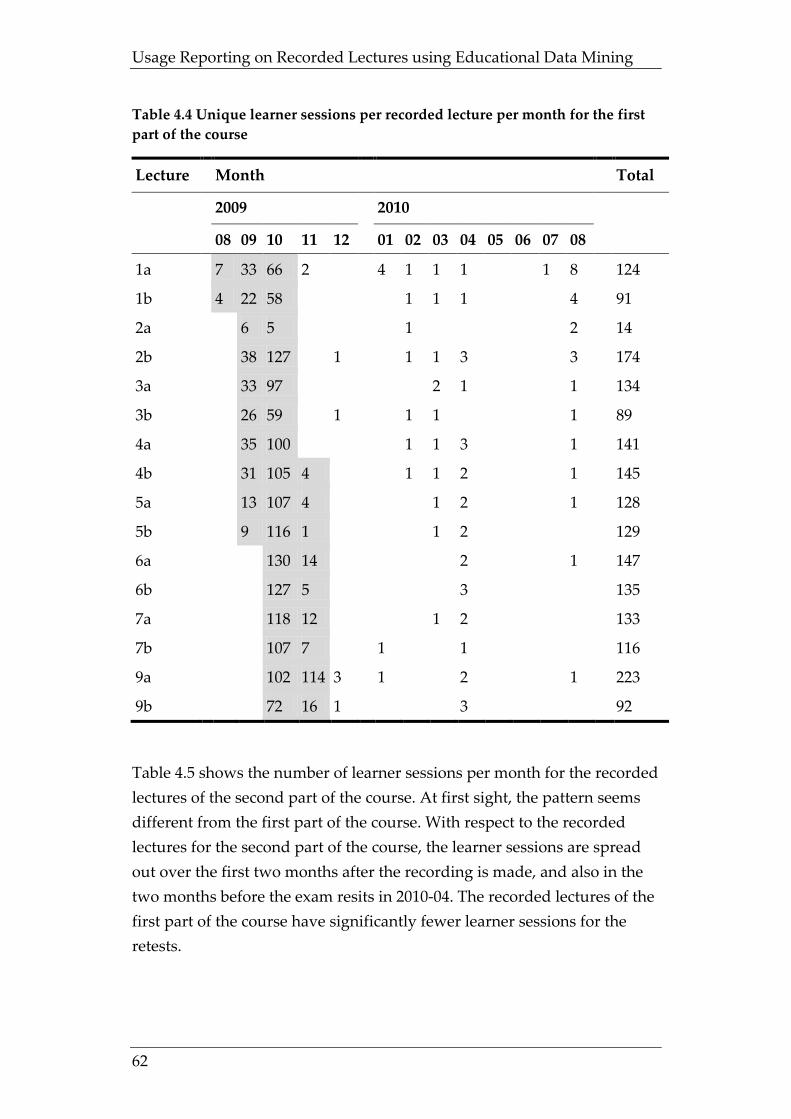
Usage Reporting on Recorded Lectures using Educational Data Mining
62
Table 4.4 Unique learner sessions per recorded lecture per month for the first part of the course
Lecture Month Total
2009 2010
08 09 10 11 12 01 02 03 04 05 06 07 08
1a 7 33 66 2 4 1 1 1 1 8 124
1b 4 22 58 1 1 1 4 91
2a 6 5 1 2 14
2b 38 127 1 1 1 3 3 174
3a 33 97 2 1 1 134
3b 26 59 1 1 1 1 89
4a 35 100 1 1 3 1 141
4b 31 105 4 1 1 2 1 145
5a 13 107 4 1 2 1 128
5b 9 116 1 1 2 129
6a 130 14 2 1 147
6b 127 5 3 135
7a 118 12 1 2 133
7b 107 7 1 1 116
9a 102 114 3 1 2 1 223
9b 72 16 1 3 92
Table 4.5 shows the number of learner sessions per month for the recorded lectures of the second part of the course. At first sight, the pattern seems different from the first part of the course. With respect to the recorded lectures for the second part of the course, the learner sessions are spread out over the first two months after the recording is made, and also in the two months before the exam resits in 2010-04. The recorded lectures of the first part of the course have significantly fewer learner sessions for the retests.
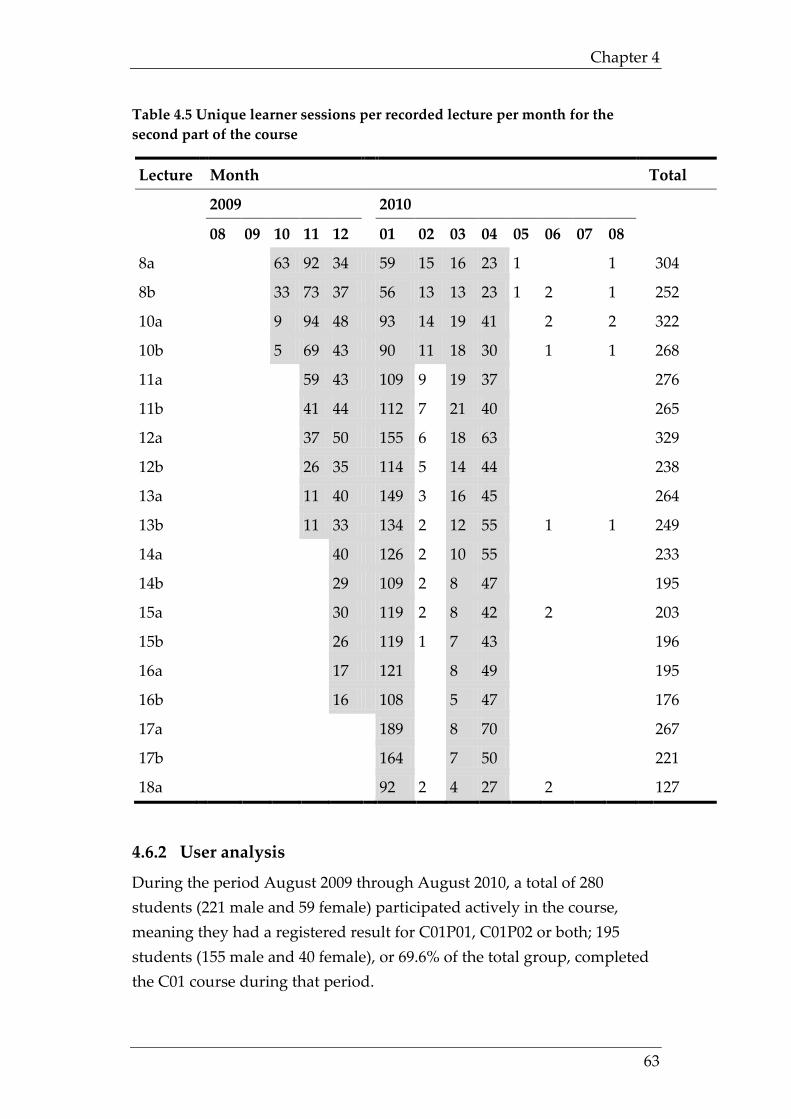
Chapter 4
63
Table 4.5 Unique learner sessions per recorded lecture per month for the second part of the course
Lecture Month Total
2009 2010
08 09 10 11 12 01 02 03 04 05 06 07 08
8a 63 92 34 59 15 16 23 1 1 304
8b 33 73 37 56 13 13 23 1 2 1 252
10a 9 94 48 93 14 19 41 2 2 322
10b 5 69 43 90 11 18 30 1 1 268
11a 59 43 109 9 19 37 276
11b 41 44 112 7 21 40 265
12a 37 50 155 6 18 63 329
12b 26 35 114 5 14 44 238
13a 11 40 149 3 16 45 264
13b 11 33 134 2 12 55 1 1 249
14a 40 126 2 10 55 233
14b 29 109 2 8 47 195
15a 30 119 2 8 42 2 203
15b 26 119 1 7 43 196
16a 17 121 8 49 195
16b 16 108 5 47 176
17a 189 8 70 267
17b 164 7 50 221
18a 92 2 4 27 2 127
4.6.2 User analysis
During the period August 2009 through August 2010, a total of 280 students (221 male and 59 female) participated actively in the course, meaning they had a registered result for C01P01, C01P02 or both; 195 students (155 male and 40 female), or 69.6% of the total group, completed the C01 course during that period.
Usage Reporting on Recorded Lectures using Educational Data Mining
64
During our study period, the recorded lectures for this course were viewed in a total of 2,650 learner sessions by a total of 291 unique students, of which 11 students had viewed the recorded lectures but had no registered results for C01P01, C01P02, or both. Thirty-nine students (13.5%) viewed the recorded lectures but did not have a registered result for either C01P01 or C01P02. Of those 39 students, 29 had two or fewer learner sessions. Four students had a total of seven learner sessions, and one student had nine learner sessions without a registered result for either part of the course.
A total of 28 students (10%) participated in the course but never watched a single recorded lecture. Of those, 11 students (39.3%) completed the C01 course successfully during our study period.
4.6.3 Learner sessions analysis
In the learner sessions analysis, the 2,650 learner sessions by 291 unique students were analysed in more detail. We used three questions as the basis for this analysis:
• Do students use the recorded lectures as a structural substitute for lecture attendance?
• Do students repeatedly use the recorded lectures or just once? • Do students use the recorded lectures to study for the tests/exams
for this course?
Recorded lectures as a substitute for lecture attendance
There was no direct method available in the data recordings to analyse whether students used the recorded lectures as a substitute for lecture attendance for the C01 course. Lecture attendance was not mandatory, and no attendance register was created during the C01 course for 2009-2010. Instead, we used the dataset to analyse the students’ viewing behaviour. If students use recorded lectures as a substitute for lecture attendance, they will be more likely to watch the full length of a recorded lecture. We assume they have watched the full length of a recorded lecture if they received at least 80% of the video for the recorded lecture.
On average, students watched each recorded lecture for the C01 course completely 11 times during the one-year period covered by the dataset. Most of the students never watched the full length of a recorded lecture
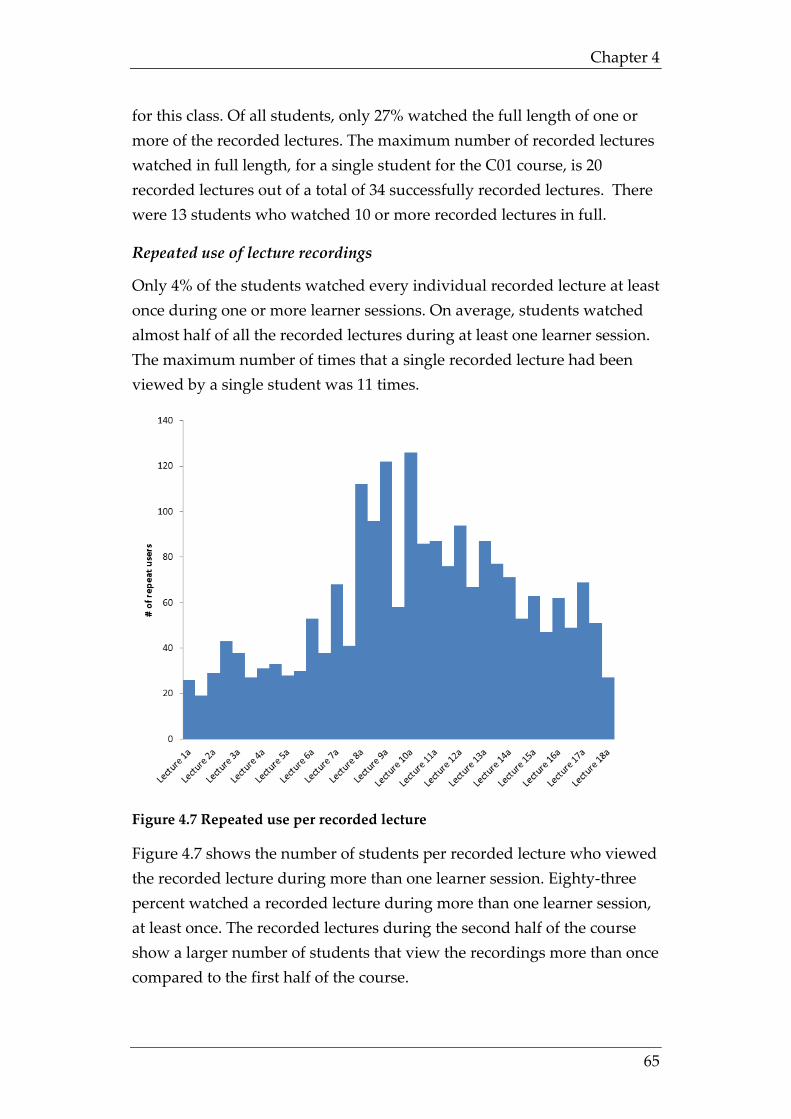
Chapter 4
65
for this class. Of all students, only 27% watched the full length of one or more of the recorded lectures. The maximum number of recorded lectures watched in full length, for a single student for the C01 course, is 20 recorded lectures out of a total of 34 successfully recorded lectures. There were 13 students who watched 10 or more recorded lectures in full.
Repeated use of lecture recordings
Only 4% of the students watched every individual recorded lecture at least once during one or more learner sessions. On average, students watched almost half of all the recorded lectures during at least one learner session. The maximum number of times that a single recorded lecture had been viewed by a single student was 11 times.
Figure 4.7 Repeated use per recorded lecture
Figure 4.7 shows the number of students per recorded lecture who viewed the recorded lecture during more than one learner session. Eighty-three percent watched a recorded lecture during more than one learner session, at least once. The recorded lectures during the second half of the course show a larger number of students that view the recordings more than once compared to the first half of the course.
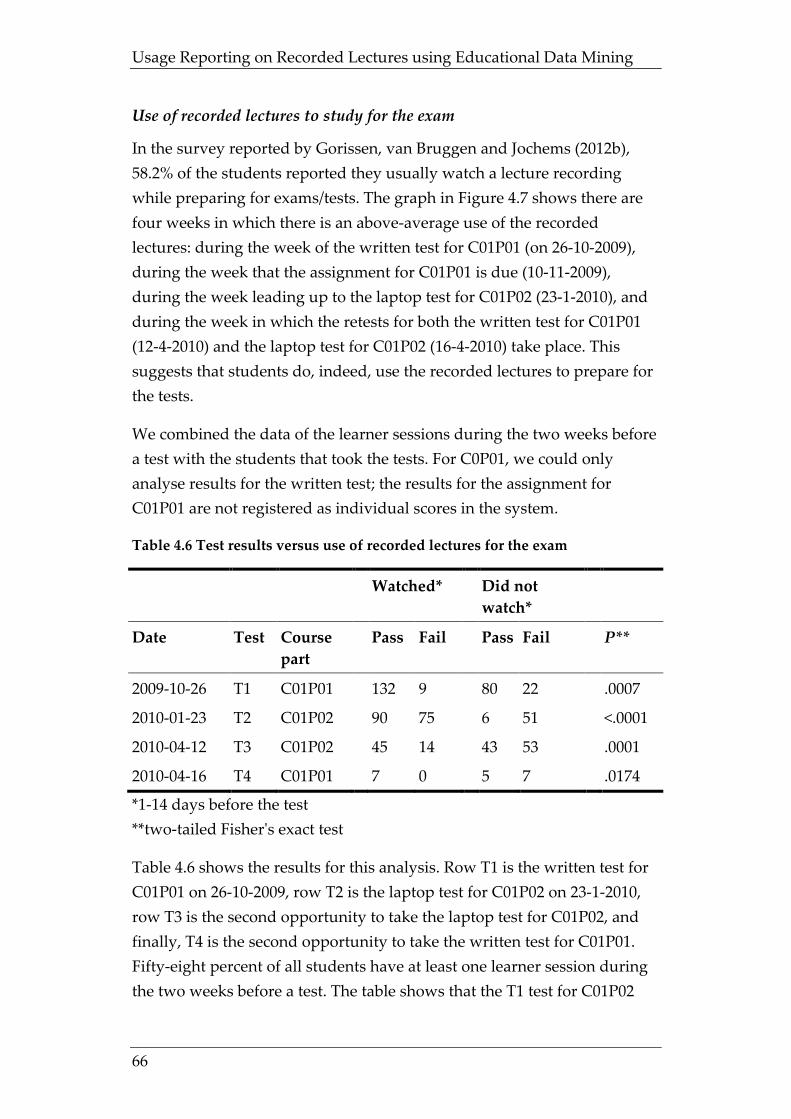
Usage Reporting on Recorded Lectures using Educational Data Mining
66
Use of recorded lectures to study for the exam
In the survey reported by Gorissen, van Bruggen and Jochems (2012b), 58.2% of the students reported they usually watch a lecture recording while preparing for exams/tests. The graph in Figure 4.7 shows there are four weeks in which there is an above-average use of the recorded lectures: during the week of the written test for C01P01 (on 26-10-2009), during the week that the assignment for C01P01 is due (10-11-2009), during the week leading up to the laptop test for C01P02 (23-1-2010), and during the week in which the retests for both the written test for C01P01 (12-4-2010) and the laptop test for C01P02 (16-4-2010) take place. This suggests that students do, indeed, use the recorded lectures to prepare for the tests.
We combined the data of the learner sessions during the two weeks before a test with the students that took the tests. For C0P01, we could only analyse results for the written test; the results for the assignment for C01P01 are not registered as individual scores in the system.
Table 4.6 Test results versus use of recorded lectures for the exam
Watched* Did not watch*
Date Test Course part
Pass Fail Pass Fail P**
2009-10-26 T1 C01P01 132 9 80 22 .0007
2010-01-23 T2 C01P02 90 75 6 51 <.0001
2010-04-12 T3 C01P02 45 14 43 53 .0001
2010-04-16 T4 C01P01 7 0 5 7 .0174
*1-14 days before the test **two-tailed Fisher's exact test
Table 4.6 shows the results for this analysis. Row T1 is the written test for C01P01 on 26-10-2009, row T2 is the laptop test for C01P02 on 23-1-2010, row T3 is the second opportunity to take the laptop test for C01P02, and finally, T4 is the second opportunity to take the written test for C01P01. Fifty-eight percent of all students have at least one learner session during the two weeks before a test. The table shows that the T1 test for C01P02
Chapter 4
67
had a high fail rate (45%), even for students that watched the recorded lectures during the two weeks before the test. In itself, watching the recorded lectures does not guarantee that a student passes this test. We performed a two-tailed Fisher’s exact test on the results for the four tests. Table 4.6 shows that for all four tests (T1-T4), the number of students that pass the test while having watched the recorded lectures is significantly higher than the expected number (P <.05).
It was not possible to determine a base line for the students. The student group for the C01 course consists of students from different departments and with different backgrounds or previous courses.
4.7 Conclusions There are a number of steps required to clean and combine the available data into a dataset that can be used to analyse students’ use of recorded lectures. In doing so, we were able to eliminate data that was not relevant for our research question. This also helped to obtain a clearer understanding of the students’ actions while using the recorded lectures.
The analysis shows that it is useful to perform a triangulation of the survey data and the data logged by the system because there are differences between both data sets. The learner session analysis, for example, does not confirm the comment by students that they used the recorded lectures as a structural substitute for lecture attendance. Students do sometimes watch the full recorded lecture, but for the C01 course, none of students watched all recorded lectures in full and only a few of them watched all of the recorded lectures. The analysis does seem to confirm remarks by students that they re-use recorded lectures from an earlier year if the course isn’t re-recorded or if they prefer the recordings due to the lecturer that was recorded. Twenty-three percent of all learner sessions are on recorded lectures that have been recorded in the previous academic year.
The usage analysis shows that use of the recorded lectures is influenced more by the schedule of the exams than by the lecture schedule. We found evidence that studying the recorded lectures during exam preparation increases the chances of passing the exam. This does not, however, preclude the hypothesis that these students were generally more active
Usage Reporting on Recorded Lectures using Educational Data Mining
68
and more involved in the course overall. There are still a number of caveats. It was not possible to create a baseline for the students in the study or to compare the results for this course with similar courses. This means we are not able to determine if the recorded lectures helped the better students to perform even better, or that it helped weaker students pass the course where they otherwise would have failed. We also do not have an explanation for the reasons behind the usage pattern found. How does that use of the recorded lectures fit into the overall study pattern of the students? Is the use of the recorded lectures indicative of the way they plan their learning for this course, meaning that they focus their efforts on the final weeks before the exam? The only sure way to determine this is by direct observation. However, not only is that not practical, it also often influences the students’ behaviour.
This research was not aimed at determining whether the availability of recorded lectures changes the way students study or whether it improves their exam scores. The aim was to improve our understanding of the use of recorded lectures by students so that we can better support them while they are navigating to the parts of the recorded lecture that they want to view. For that, improving the options they have to navigate within and between multiple recorded lectures during exam preparation would be a good start.
In conclusion, our research is beneficial to institutions using a LCS because it shows them how they can use educational data mining based on the log data provided by the LCS as an addition to student surveys to create usage reports of the recorded lectures. These metrics provide a clearer picture of the actual use of the recorded lectures by students than unfiltered reports or student surveys alone.
69
Chapter 5 Methodological triangulation of the students’
use of recorded lectures*
5.1 Abstract Recorded lectures provide an integral recording of live lectures, enabling students to review those lecture at their own pace whenever they want. A lot of research into the use of recorded lectures by students has been done by using surveys or interviews. In this article we will show that triangulation of multiple data sources is needed. We will discuss the following research questions: How do students use recorded lectures according to their self-report? And what actual usage of the recorded lectures can we derive from the data on the system and does that match with what students report? Data was collected using a survey, interviews and by using the log data of a Lecture Capture System (LCS) used at the Eindhoven University of Technology in the Netherlands. We will present the data collections and cover areas where the data can be triangulated to increase the credibility of the results or to question the student responses. The results of this triangulation show its value in that it both shows convergence and divergence between the analyses of the individual data sets. There are discrepancies between the students’ responses and the log data in particular where it concerns their perceptions of the amount of use * This chapter has been published as: Gorissen, P., Van Bruggen, J. M. & Jochems, W. (2013). Methodological triangulation of the students’ use of recorded lectures, International Journal of Learning Technology. Vol. 8, No.1, pp. 20-40. DOI: 10.1504/IJLT.2013.052825
A shorter version of this chapter has been published as: Gorissen, P., Van Bruggen, J. M. & Jochems, W. (2012). Analysing Students' Use of Recorded Lectures through Methodological Triangulation. In: Uden, L., Rodríguez, E. S. C., De Paz Santana, J. F. & De La Prieta, F., eds. Workshop on Learning Technology for Education in Cloud (LTEC'12), 2012 Salamanca, Spain. Springer, pp. 145-156. DOI: 10.1007/978-3-642-30859-8_14
Methodical triangulation of the students’ use of recorded lectures
70
of the recorded lectures. For example, although 70% of all students indicate that they usually watch 75%-100% of a recorded lecture; this is actually only the case for 2.7% of the students based on the LCS log data. The vast majority of all students (69.8%), on average, only received between 10%-25% of the video of each recorded lecture. In other areas, like the number of times that they viewed recorded lectures, there is consensus. The triangulation also shows that we lack data for a number of areas. We will need high-quality surveys, interviews combined with the log data to get a complete picture. To perform triangulation, we need to be able to link both data sets together based on the identification of the individual students, which might raise privacy issues if not addressed properly.
5.2 Introduction The lecture method has been around since before the time of the printed book, when monks would read a book aloud, at a lectern, and scholars would copy down what was said word for word (Exley & Dennick, 2004). Its effectiveness as an instructional method has been questioned (Jones, 2007; Phillips, 2005) but a recent survey amongst more than 23,000 lectures at the University of California (Hurtado et al., 2012) showed that although the lectures had increased their use of other instructional methods, the use of extensive lecturing had remained fairly stable during the last decade. In some areas, 69.7% of all lecturers reported to use extensive lecturing in all or most of the courses they teach.
The availability of more advanced lecture capture systems (LCS) has allowed a growing number of universities to create recordings of these lectures (Leoni & Lichti, 2009), allowing students to review lectures at their own pace and at a time and place of their choosing. A LCS handles the simultaneous capture of both the audio and video of the lecturer and everything that is being projected during the lecture, usually a PowerPoint presentation. It handles the automatic synchronisation of all the captured media, uploads the recorded lecture to a server and can post a link to the recording in the Virtual Learning Environment (VLE), notifying students the recording is available. The students can then view the recording in a web browser. Figure 5.1 shows an example of a recorded lecture with both
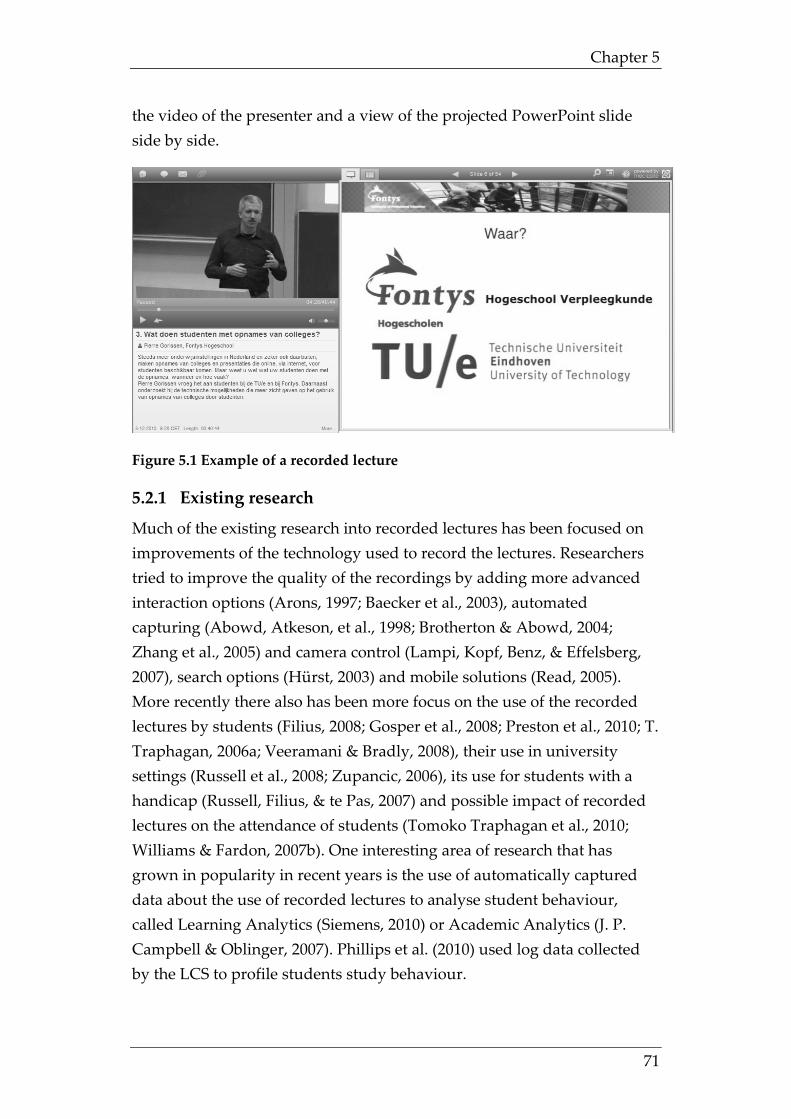
Chapter 5
71
the video of the presenter and a view of the projected PowerPoint slide side by side.
Figure 5.1 Example of a recorded lecture
5.2.1 Existing research
Much of the existing research into recorded lectures has been focused on improvements of the technology used to record the lectures. Researchers tried to improve the quality of the recordings by adding more advanced interaction options (Arons, 1997; Baecker et al., 2003), automated capturing (Abowd, Atkeson, et al., 1998; Brotherton & Abowd, 2004; Zhang et al., 2005) and camera control (Lampi, Kopf, Benz, & Effelsberg, 2007), search options (Hürst, 2003) and mobile solutions (Read, 2005). More recently there also has been more focus on the use of the recorded lectures by students (Filius, 2008; Gosper et al., 2008; Preston et al., 2010; T. Traphagan, 2006a; Veeramani & Bradly, 2008), their use in university settings (Russell et al., 2008; Zupancic, 2006), its use for students with a handicap (Russell, Filius, & te Pas, 2007) and possible impact of recorded lectures on the attendance of students (Tomoko Traphagan et al., 2010; Williams & Fardon, 2007b). One interesting area of research that has grown in popularity in recent years is the use of automatically captured data about the use of recorded lectures to analyse student behaviour, called Learning Analytics (Siemens, 2010) or Academic Analytics (J. P. Campbell & Oblinger, 2007). Phillips et al. (2010) used log data collected by the LCS to profile students study behaviour.
Methodical triangulation of the students’ use of recorded lectures
72
5.2.2 Triangulation
Often, research in this area is only based on surveys and verbal reports by students of their use of recorded lectures. The data of these surveys are in general accepted at face value, even though they often correlate poorly with observational data (H. W. Smith, 1975). More than sixty years ago, Deming (1944) identified thirteen possible factors that can account for errors in surveys. They range from variability in response to bias arising from non-response or the selection of the respondents or errors in the interpretation of the questions by respondents or changes in the attitudes of respondents. Exclusive reliance on one method may bias or distort the researcher’s picture of the reality being investigated. Confidence that the results are not merely artefacts of the data collection method used can be increased by comparing the results of multiple collection methods (Cohen, Manion, & Morrison, 2007). Thus the integration of multiple techniques not only improves the results in a quantitative way by increasing the amount of data available, but also in a qualitative way (Sieber, 1973).
The use of two or more methods of data collection in the study of some aspect of human behaviour is called triangulation (Cohen et al., 2007). This multi-method view on triangulation has a precursor in the multi-trait multi-method approach to concurrent validity brought forward by D. T. Campbell and Fiske (1959). There are a number of different types of triangulation (N. Denzin, 1970; H. W. Smith, 1975):
1. Data triangulation; 2. Investigator triangulation; 3. Theory triangulation; 4. Methodological triangulation;
Data triangulation employs data sources that differ in time, space and/or the persons involved. The event under analysis stays constant, but is collected from dissimilar groups or at different times, like consecutive years or semesters. An example would be to analyse different groups of students or different courses at a single university individually, to select students from different universities, or to repeat a survey multiple semesters or years in a row. Investigator triangulation simply means that multiple observers collect the data; this removes the potential bias that comes from the observations of a single person. An example would be to
Chapter 5
73
have researchers code the transcripts of an interview with students instead of one, and then compare and combine their results. Theory triangulation tests alternative theories against the same body of data. For example, one study might find that students that view a lot of recorded lectures tend to skip the live lectures (Williams & Fardon, 2007b), while another study links study styles and approaches in problem solving (Laurillard, 2005) and a third study describes the purpose and functions of live lectures (Bligh, 1998). All three studies together can help to better explain the observations. Methodological triangulation can be categorised as within-method triangulation and between-method (or across-method) triangulation. The within-method triangulation takes one method (for example a survey) and uses multiple strategies within that method to examine the data. This however comes with the inherent flaw that it only uses one method of data collection. The between-method triangulation employs different methods on different sets of data concerning the same object of study.
5.2.3 Research questions
Little is known, still, about the way in which students navigate within the recordings or how they find (the parts of) the recordings they want to watch. The goal of our research is to get a better understanding of how students use recorded lectures and how we can help them to navigate more efficiently to the parts of the recordings they want to view. This paper is part of a larger research project into the use of recorded lectures by students. The main research questions for that project are:
• How do students use recorded lectures? • How do students use recorded lectures according to their self-
report? • What actual usage of the recorded lectures can we derive from the
data on the system and does that match with what students report? • What usage patterns can we identify in both the reported and
actual usage of recorded lectures by students? • How can we facilitate the usage of recorded lectures by students?
The main focus of this paper is the first research question and its two sub questions: How do students use recorded lectures? How do students use recorded lectures according to their self-report? And what actual usage of
Methodical triangulation of the students’ use of recorded lectures
74
the recorded lectures can we derive from the data on the system and does that match with what students report?
We used both data triangulation and methodological triangulation to increase the validity of the results obtained. In this paper, we will present the three data collection methods used and look at the areas where we can triangulate the collected data. What data can be provided by the LCS log data and do we still need surveys to ask students about their use of recorded lectures? We will first describe the method of data collection and then focus on the use of methodological triangulation to determine convergence and divergence between the results of the analysis of the two data sets.
5.3 Method For our research we used three methods of data collection: first we conducted an online survey that was followed up by semi-structured interviews to collect verbal reports by students (Gorissen et al., 2012b). A third method was the collection log data generated by the LCS (Gorissen, van Bruggen, & Jochems, 2012c).
5.3.1 Online survey
Participants in the survey were students from various faculties of the Eindhoven University of Technology (TU/e) and the School of Nursing at Fontys University of Applied Sciences in the Netherlands. Both the TU/e and Fontys use the Mediasite LCS to create recorded lectures. In the survey we wanted to address the following questions: Where and when do students watch the recorded lectures? With what purpose do they watch? If they did not watch the recorded lectures, for what reason did they not watch? Is there a relationship between the use of recorded lectures and the level of ambition of students, the ease of use of the recorded lectures, or the use of other resources available to the student?
The first part of the survey asked students for their interest in the topic of the course, the perceived importance of the course for their course of study and the grade they wished to achieve for the course. In the second part of the survey, students rated the effectiveness of a number of available activities (e.g., attending face-to-face lectures) and supporting resources (e.g., slides, lecture notes, etc.) in helping them to succeed in the
Chapter 5
75
course. It also asked about any previous experience with lecture recordings, and whether they had used the recorded lectures for the course in question. In part three of the survey, those students who had used the lecture recordings were surveyed in more detail about their experiences during that use. Those questions were not displayed to students that indicated they had not used the recorded lectures. The final part of the survey contained questions for all students, seeking out reasons they did not watch one or more of the recorded lectures (if applicable). We reviewed the survey and tested it online with a number of peers and experts.
Student selection for the survey was based on recent participation in a course that used recorded lectures with recordings being made on a regular basis (weekly or more often). We also wanted to make sure that there was minimal overlap between the courses so that we could question the students about one specific course. For Fontys, these criteria limited the number of available students to 203 students participating in a single course. At the TU/e we selected six courses that matched our criteria.
All of the recordings for the selected courses are of traditional university-style lectures with the teacher standing in front of the class lecturing. Exceptions to this were lectures where assignments and the test were discussed. All recordings are between 40-45 minutes long. In all of the recordings, video of the lecturer is recorded and displayed. Five of the courses used PowerPoint or other computer-based applications recorded alongside the video of the lecturer. Two of the courses contained recordings of the lecturer and the blackboard. All students in the courses had a choice between attending the lecture, viewing it online, or doing both. Table 5.1 shows the seven selected courses for the survey, the number of students per course, the response rate per course for the survey, what was being recorded and the number of recordings per course.
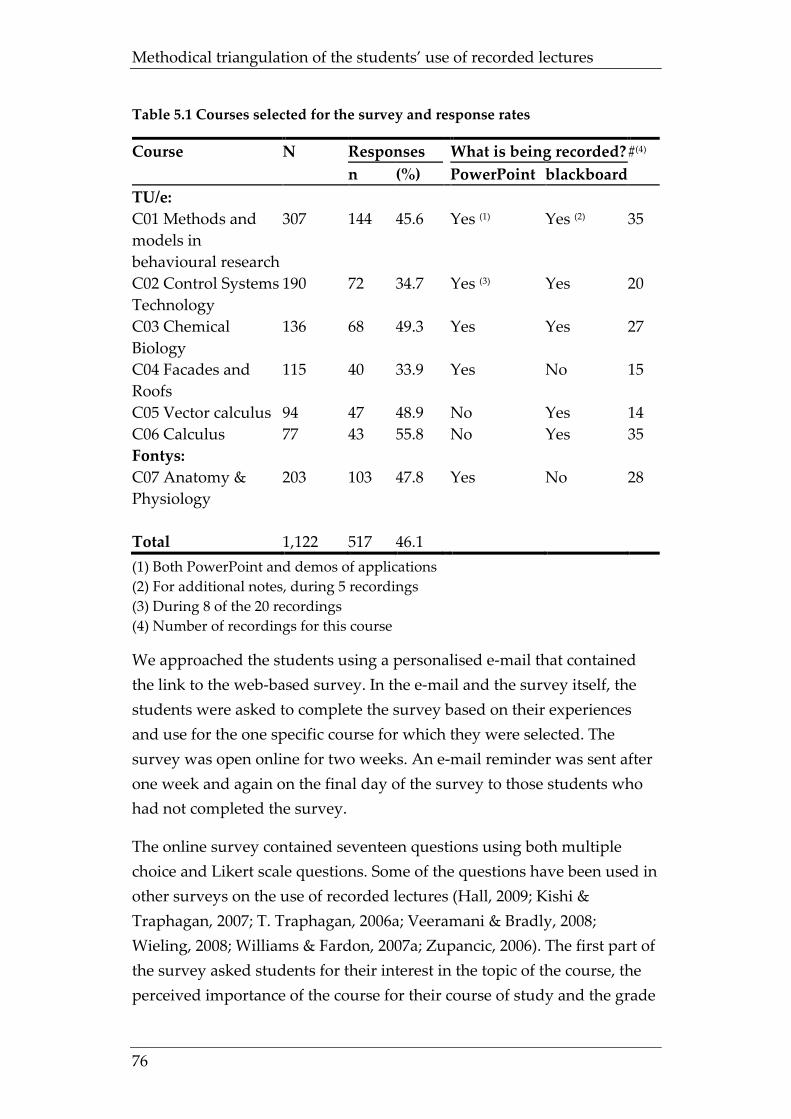
Methodical triangulation of the students’ use of recorded lectures
76
Table 5.1 Courses selected for the survey and response rates
Course N Responses What is being recorded? #(4) n (%) PowerPoint blackboard TU/e: C01 Methods and models in behavioural research
307 144 45.6 Yes (1) Yes (2) 35
C02 Control Systems Technology
190 72 34.7 Yes (3) Yes 20
C03 Chemical Biology
136 68 49.3 Yes Yes 27
C04 Facades and Roofs
115 40 33.9 Yes No 15
C05 Vector calculus 94 47 48.9 No Yes 14 C06 Calculus 77 43 55.8 No Yes 35 Fontys: C07 Anatomy & Physiology
203 103 47.8 Yes No 28
Total 1,122 517 46.1 (1) Both PowerPoint and demos of applications (2) For additional notes, during 5 recordings (3) During 8 of the 20 recordings (4) Number of recordings for this course
We approached the students using a personalised e-mail that contained the link to the web-based survey. In the e-mail and the survey itself, the students were asked to complete the survey based on their experiences and use for the one specific course for which they were selected. The survey was open online for two weeks. An e-mail reminder was sent after one week and again on the final day of the survey to those students who had not completed the survey.
The online survey contained seventeen questions using both multiple choice and Likert scale questions. Some of the questions have been used in other surveys on the use of recorded lectures (Hall, 2009; Kishi & Traphagan, 2007; T. Traphagan, 2006a; Veeramani & Bradly, 2008; Wieling, 2008; Williams & Fardon, 2007a; Zupancic, 2006). The first part of the survey asked students for their interest in the topic of the course, the perceived importance of the course for their course of study and the grade
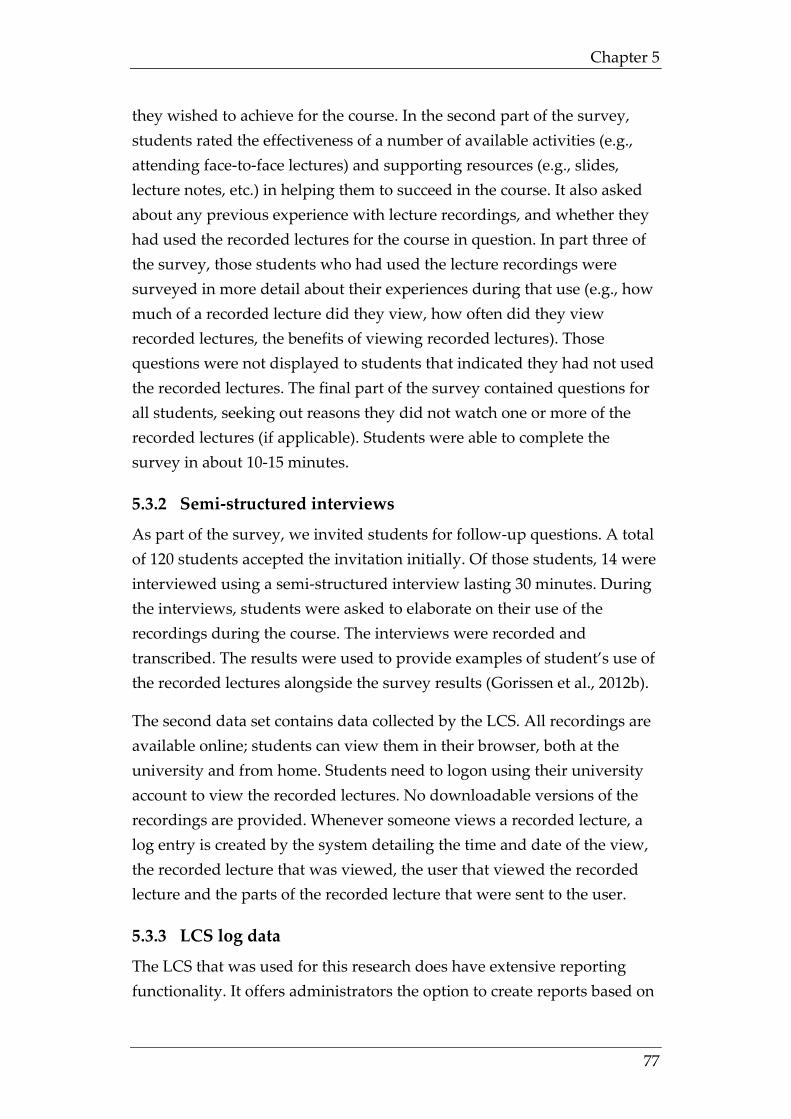
Chapter 5
77
they wished to achieve for the course. In the second part of the survey, students rated the effectiveness of a number of available activities (e.g., attending face-to-face lectures) and supporting resources (e.g., slides, lecture notes, etc.) in helping them to succeed in the course. It also asked about any previous experience with lecture recordings, and whether they had used the recorded lectures for the course in question. In part three of the survey, those students who had used the lecture recordings were surveyed in more detail about their experiences during that use (e.g., how much of a recorded lecture did they view, how often did they view recorded lectures, the benefits of viewing recorded lectures). Those questions were not displayed to students that indicated they had not used the recorded lectures. The final part of the survey contained questions for all students, seeking out reasons they did not watch one or more of the recorded lectures (if applicable). Students were able to complete the survey in about 10-15 minutes.
5.3.2 Semi-structured interviews
As part of the survey, we invited students for follow-up questions. A total of 120 students accepted the invitation initially. Of those students, 14 were interviewed using a semi-structured interview lasting 30 minutes. During the interviews, students were asked to elaborate on their use of the recordings during the course. The interviews were recorded and transcribed. The results were used to provide examples of student’s use of the recorded lectures alongside the survey results (Gorissen et al., 2012b).
The second data set contains data collected by the LCS. All recordings are available online; students can view them in their browser, both at the university and from home. Students need to logon using their university account to view the recorded lectures. No downloadable versions of the recordings are provided. Whenever someone views a recorded lecture, a log entry is created by the system detailing the time and date of the view, the recorded lecture that was viewed, the user that viewed the recorded lecture and the parts of the recorded lecture that were sent to the user.
5.3.3 LCS log data
The LCS that was used for this research does have extensive reporting functionality. It offers administrators the option to create reports based on
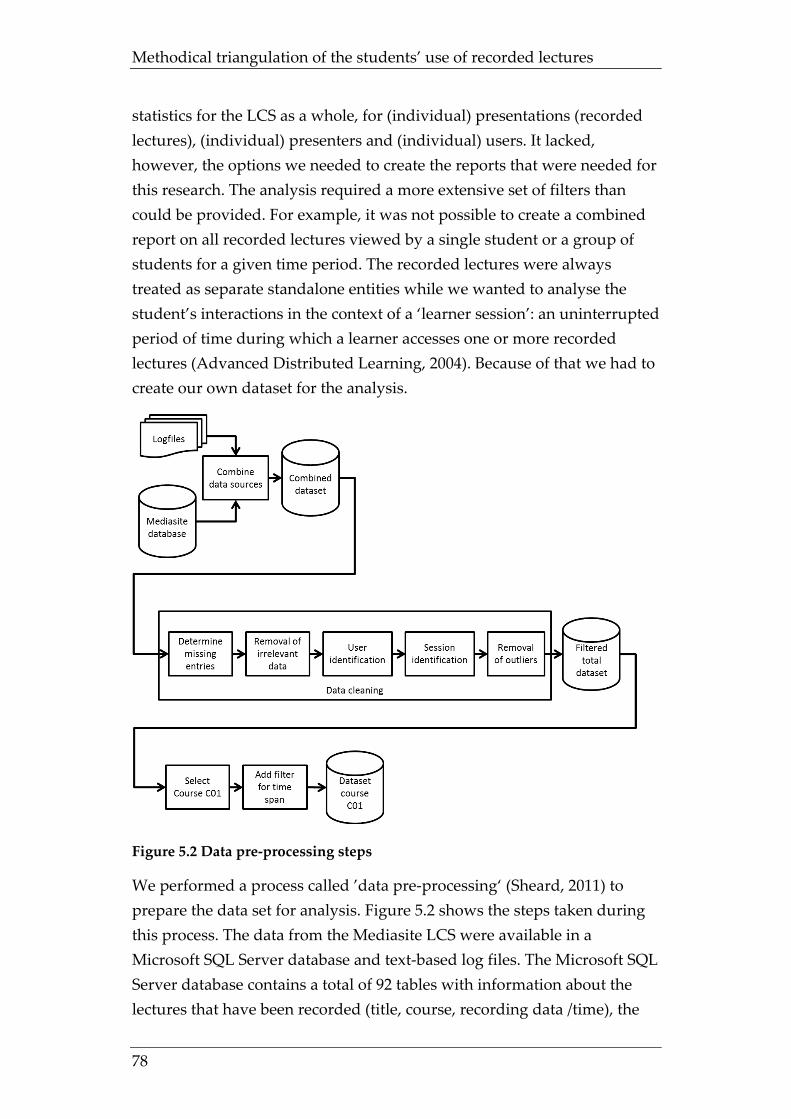
Methodical triangulation of the students’ use of recorded lectures
78
statistics for the LCS as a whole, for (individual) presentations (recorded lectures), (individual) presenters and (individual) users. It lacked, however, the options we needed to create the reports that were needed for this research. The analysis required a more extensive set of filters than could be provided. For example, it was not possible to create a combined report on all recorded lectures viewed by a single student or a group of students for a given time period. The recorded lectures were always treated as separate standalone entities while we wanted to analyse the student’s interactions in the context of a ‘learner session’: an uninterrupted period of time during which a learner accesses one or more recorded lectures (Advanced Distributed Learning, 2004). Because of that we had to create our own dataset for the analysis.
Figure 5.2 Data pre-processing steps
We performed a process called ’data pre-processing‘ (Sheard, 2011) to prepare the data set for analysis. Figure 5.2 shows the steps taken during this process. The data from the Mediasite LCS were available in a Microsoft SQL Server database and text-based log files. The Microsoft SQL Server database contains a total of 92 tables with information about the lectures that have been recorded (title, course, recording data /time), the
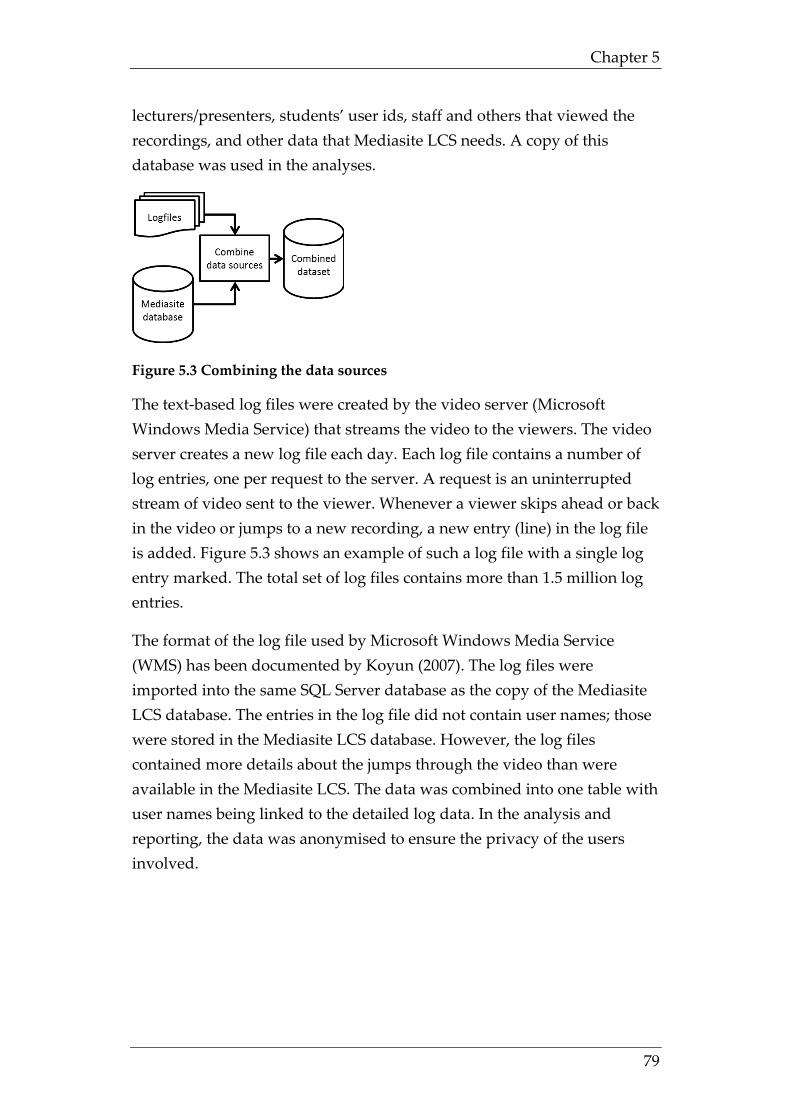
Chapter 5
79
lecturers/presenters, students’ user ids, staff and others that viewed the recordings, and other data that Mediasite LCS needs. A copy of this database was used in the analyses.
Figure 5.3 Combining the data sources
The text-based log files were created by the video server (Microsoft Windows Media Service) that streams the video to the viewers. The video server creates a new log file each day. Each log file contains a number of log entries, one per request to the server. A request is an uninterrupted stream of video sent to the viewer. Whenever a viewer skips ahead or back in the video or jumps to a new recording, a new entry (line) in the log file is added. Figure 5.3 shows an example of such a log file with a single log entry marked. The total set of log files contains more than 1.5 million log entries.
The format of the log file used by Microsoft Windows Media Service (WMS) has been documented by Koyun (2007). The log files were imported into the same SQL Server database as the copy of the Mediasite LCS database. The entries in the log file did not contain user names; those were stored in the Mediasite LCS database. However, the log files contained more details about the jumps through the video than were available in the Mediasite LCS. The data was combined into one table with user names being linked to the detailed log data. In the analysis and reporting, the data was anonymised to ensure the privacy of the users involved.
Methodical triangulation of the students’ use of recorded lectures
80
Figure 5.4 Data cleaning
After combining the datasets, we performed a number of data cleaning steps.
The Mediasite database contains data starting March 29, 2004 (the oldest recoding still available live online); the log files available for our analysis range from January 9, 2008 up to and including August 31, 2010. For our analysis, we needed data from both sources, so we limited the set to the range January 9, 2008 up to and including August 31, 2010. Further analysis of the dataset showed the Mediasite database did not contain data for the time period January 19, 2009 – July 27, 2009. This means we were unable to connect the detailed information in the log files to individual users. Therefore, data emerging from this time frame was also excluded from our dataset.
Next we removed all data irrelevant to the analysis. The LCS used at the TU/e system not only records lectures but makes recordings of seminars, public speakers and other events that take place during the year as well. We removed all data that was not related to recorded lectures from the data set. Because we were able to identify individual users, we could also remove the data for all users other than students. This included other staff, the professors/lecturers, and the researchers conducting this analysis.
The next step of the data cleaning involved the identification of learner sessions. The number of views or hits by students, still is the most used metric when reporting the success of lecture capturing (Collegerama, 2012; Echo 360, 2012; Gosper et al., 2008; Harley et al., 2003; Janssen & Dekker, 2007). This only reports how many students have started watching the recorded lecture. This metric does not distinguish between students who just watched briefly to check out the topic of the recorded lecture or the ones that actually view a significant part of one or more recorded lectures.
The aim of this study is to analyse the interaction of the student with the recorded lectures. This interaction has a clearly marked beginning: the
Chapter 5
81
first request for video from a recorded lecture. However, the interaction does not have an equally clear ending. The student does not press a ’stop‘ button at the end of a session. He or she might just close the browser, or simply stop watching and leave the browser open. The Mediasite system does not receive a notification when a student is finished viewing lecture recordings. This can only be determined by the absence of new requests for video. It is a problem that is directly linked to the semi-stateless nature of the World Wide Web. For Web analysis, usually a fixed period of time of inactivity is taken after which a session is considered ended (Burby et al., 2007). For the purpose of our analysis we defined the learner session as: an uninterrupted period of time during which a learner accesses one or more recorded lectures. This definition is based on the definition of the Advanced Distributed Learning (2004) for a session within the context of learning management systems.
The end of a learner session is then defined as:
<learner session end> = <date of log entry > + <time of log entry> + <video duration> + <time-out period>
In this definition, date of log entry + time of log entry are the start date and time of the last request that a student made for video of a recorded lecture. Video duration is the length (in seconds) of the amount of video that the student received; time-out period is a (chosen) fixed period of time after which the learner session is considered to have ended. As mentioned before, the LCS does not receive a signal indicating this end of a session. For regular websites the chosen time-out period usually is about 20-30 minutes. We, however, assume that students don’t simply just watch videos during a learner session. Based on the responses from survey and the interviews with the students, we learned they also read from the books while (re-)watching the recorded lectures, work on their assignments or study and complete their notes. We analysed the log files to find out if there was a logical time-out period, a given period of time which would clearly indicate an end of a learner session. However, there was no such clearly defined period that could be determined based on the log files. Because of that, the time-out chosen for this study, though somewhat arbitrarily, is four hours. This time-out causes the use of the recorded lectures on individual days to be separated into individual learner
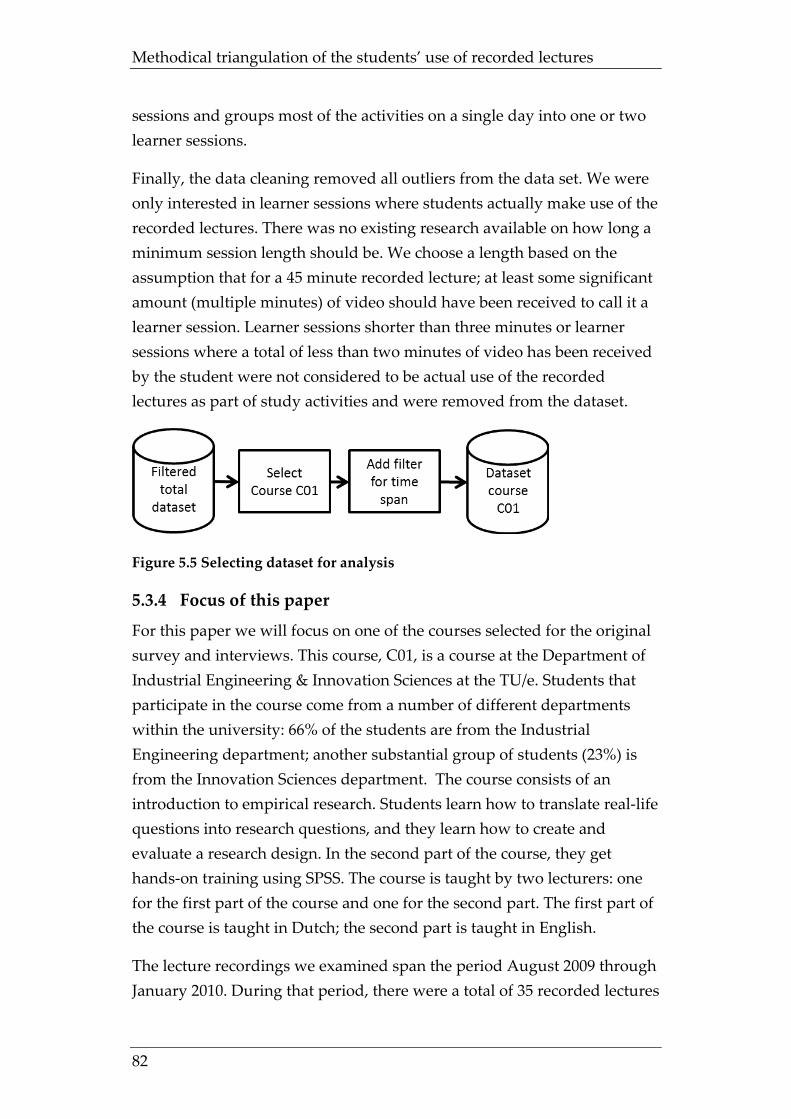
Methodical triangulation of the students’ use of recorded lectures
82
sessions and groups most of the activities on a single day into one or two learner sessions.
Finally, the data cleaning removed all outliers from the data set. We were only interested in learner sessions where students actually make use of the recorded lectures. There was no existing research available on how long a minimum session length should be. We choose a length based on the assumption that for a 45 minute recorded lecture; at least some significant amount (multiple minutes) of video should have been received to call it a learner session. Learner sessions shorter than three minutes or learner sessions where a total of less than two minutes of video has been received by the student were not considered to be actual use of the recorded lectures as part of study activities and were removed from the dataset.
Figure 5.5 Selecting dataset for analysis
5.3.4 Focus of this paper
For this paper we will focus on one of the courses selected for the original survey and interviews. This course, C01, is a course at the Department of Industrial Engineering & Innovation Sciences at the TU/e. Students that participate in the course come from a number of different departments within the university: 66% of the students are from the Industrial Engineering department; another substantial group of students (23%) is from the Innovation Sciences department. The course consists of an introduction to empirical research. Students learn how to translate real-life questions into research questions, and they learn how to create and evaluate a research design. In the second part of the course, they get hands-on training using SPSS. The course is taught by two lecturers: one for the first part of the course and one for the second part. The first part of the course is taught in Dutch; the second part is taught in English.
The lecture recordings we examined span the period August 2009 through January 2010. During that period, there were a total of 35 recorded lectures
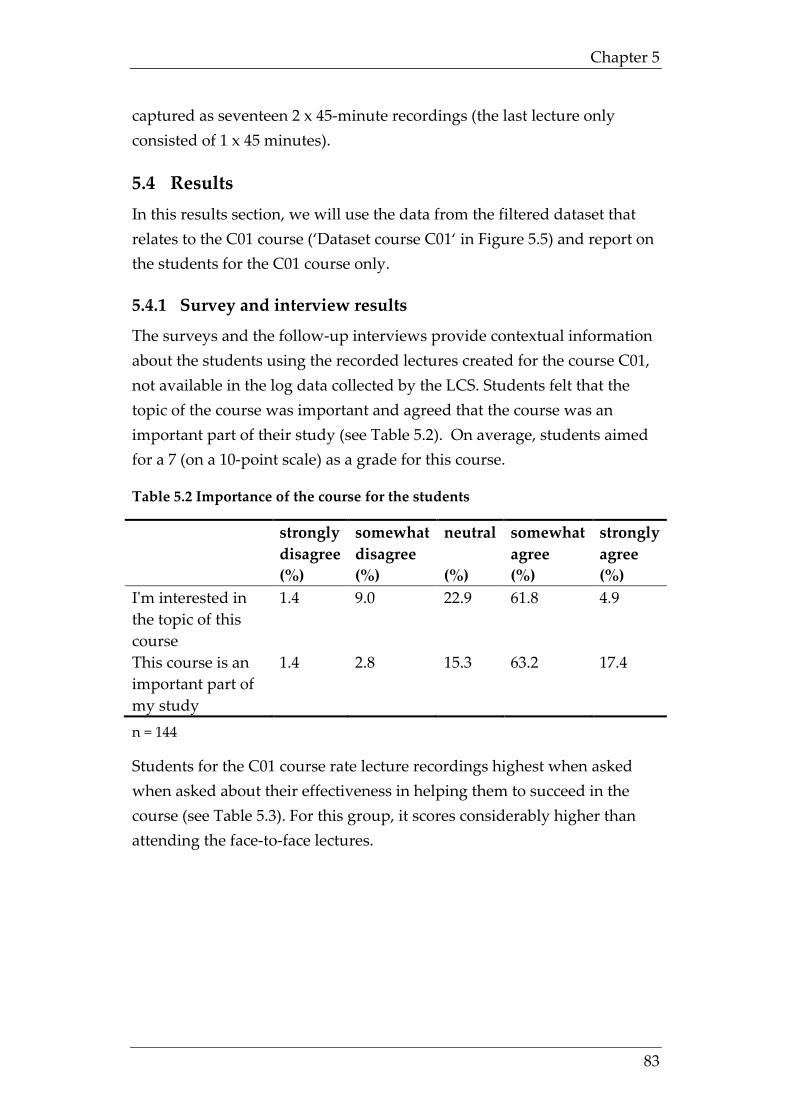
Chapter 5
83
captured as seventeen 2 x 45-minute recordings (the last lecture only consisted of 1 x 45 minutes).
5.4 Results In this results section, we will use the data from the filtered dataset that relates to the C01 course (‘Dataset course C01‘ in Figure 5.5) and report on the students for the C01 course only.
5.4.1 Survey and interview results
The surveys and the follow-up interviews provide contextual information about the students using the recorded lectures created for the course C01, not available in the log data collected by the LCS. Students felt that the topic of the course was important and agreed that the course was an important part of their study (see Table 5.2). On average, students aimed for a 7 (on a 10-point scale) as a grade for this course.
Table 5.2 Importance of the course for the students
strongly disagree (%)
somewhat disagree (%)
neutral (%)
somewhat agree (%)
strongly agree (%)
I'm interested in the topic of this course
1.4 9.0 22.9 61.8 4.9
This course is an important part of my study
1.4 2.8 15.3 63.2 17.4
n = 144
Students for the C01 course rate lecture recordings highest when asked when asked about their effectiveness in helping them to succeed in the course (see Table 5.3). For this group, it scores considerably higher than attending the face-to-face lectures.
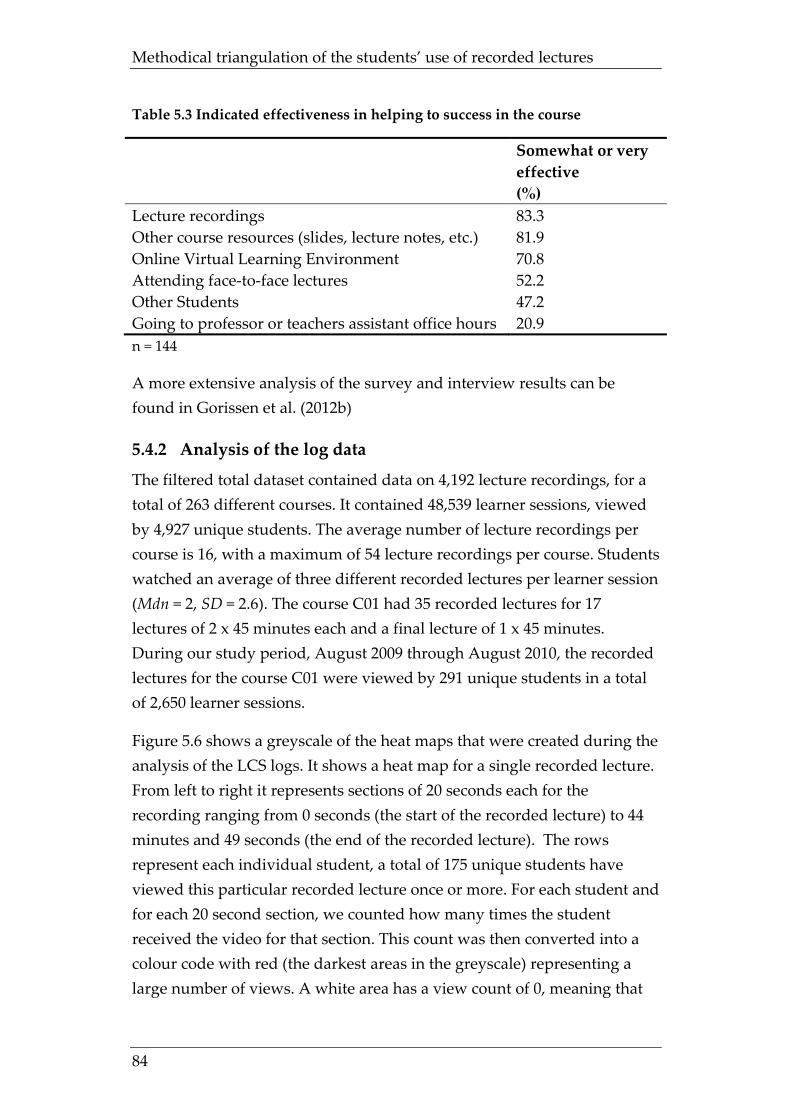
Methodical triangulation of the students’ use of recorded lectures
84
Table 5.3 Indicated effectiveness in helping to success in the course
Somewhat or very effective (%)
Lecture recordings 83.3 Other course resources (slides, lecture notes, etc.) 81.9 Online Virtual Learning Environment 70.8 Attending face-to-face lectures 52.2 Other Students 47.2 Going to professor or teachers assistant office hours 20.9 n = 144
A more extensive analysis of the survey and interview results can be found in Gorissen et al. (2012b)
5.4.2 Analysis of the log data
The filtered total dataset contained data on 4,192 lecture recordings, for a total of 263 different courses. It contained 48,539 learner sessions, viewed by 4,927 unique students. The average number of lecture recordings per course is 16, with a maximum of 54 lecture recordings per course. Students watched an average of three different recorded lectures per learner session (Mdn = 2, SD = 2.6). The course C01 had 35 recorded lectures for 17 lectures of 2 x 45 minutes each and a final lecture of 1 x 45 minutes. During our study period, August 2009 through August 2010, the recorded lectures for the course C01 were viewed by 291 unique students in a total of 2,650 learner sessions.
Figure 5.6 shows a greyscale of the heat maps that were created during the analysis of the LCS logs. It shows a heat map for a single recorded lecture. From left to right it represents sections of 20 seconds each for the recording ranging from 0 seconds (the start of the recorded lecture) to 44 minutes and 49 seconds (the end of the recorded lecture). The rows represent each individual student, a total of 175 unique students have viewed this particular recorded lecture once or more. For each student and for each 20 second section, we counted how many times the student received the video for that section. This count was then converted into a colour code with red (the darkest areas in the greyscale) representing a large number of views. A white area has a view count of 0, meaning that
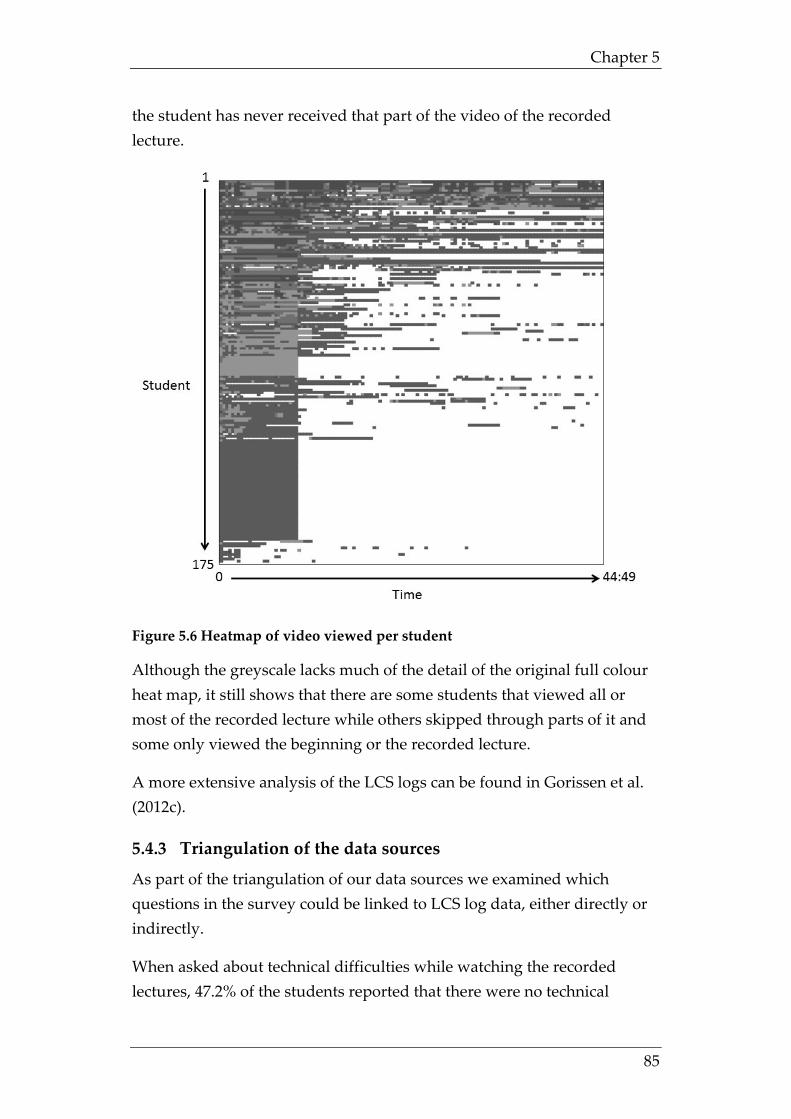
Chapter 5
85
the student has never received that part of the video of the recorded lecture.
Figure 5.6 Heatmap of video viewed per student
Although the greyscale lacks much of the detail of the original full colour heat map, it still shows that there are some students that viewed all or most of the recorded lecture while others skipped through parts of it and some only viewed the beginning or the recorded lecture.
A more extensive analysis of the LCS logs can be found in Gorissen et al. (2012c).
5.4.3 Triangulation of the data sources
As part of the triangulation of our data sources we examined which questions in the survey could be linked to LCS log data, either directly or indirectly.
When asked about technical difficulties while watching the recorded lectures, 47.2% of the students reported that there were no technical
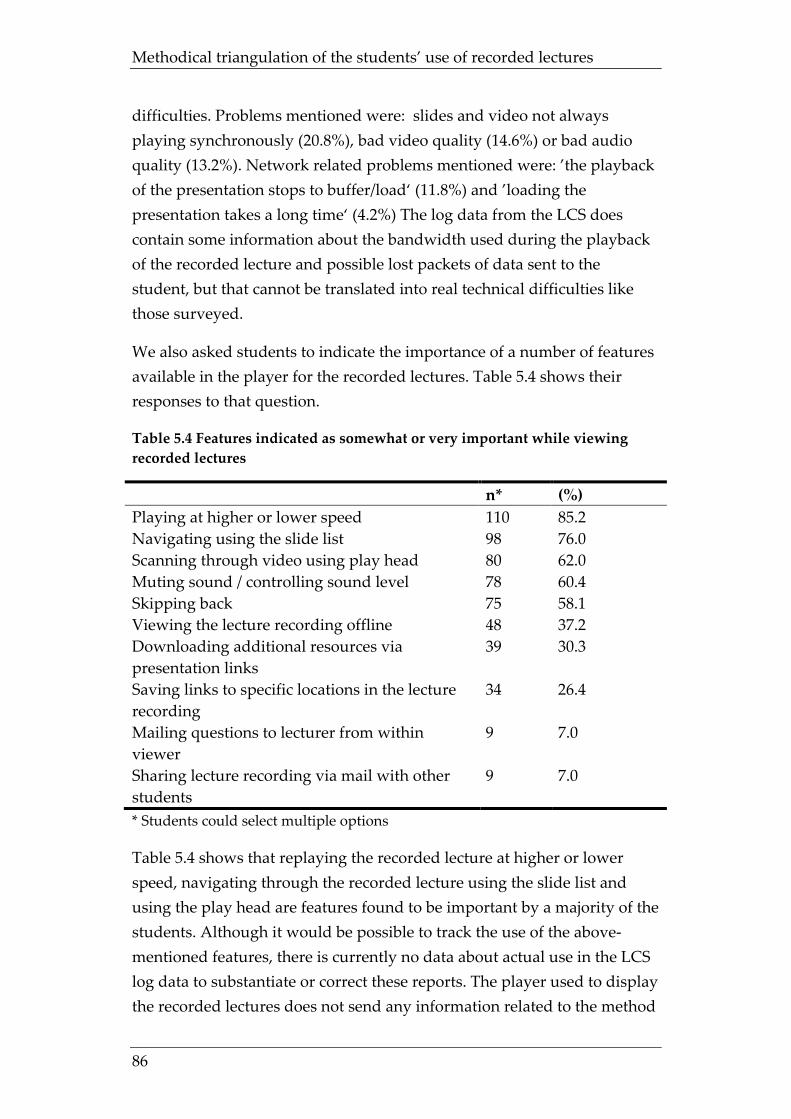
Methodical triangulation of the students’ use of recorded lectures
86
difficulties. Problems mentioned were: slides and video not always playing synchronously (20.8%), bad video quality (14.6%) or bad audio quality (13.2%). Network related problems mentioned were: ’the playback of the presentation stops to buffer/load‘ (11.8%) and ’loading the presentation takes a long time‘ (4.2%) The log data from the LCS does contain some information about the bandwidth used during the playback of the recorded lecture and possible lost packets of data sent to the student, but that cannot be translated into real technical difficulties like those surveyed.
We also asked students to indicate the importance of a number of features available in the player for the recorded lectures. Table 5.4 shows their responses to that question.
Table 5.4 Features indicated as somewhat or very important while viewing recorded lectures
n* (%) Playing at higher or lower speed 110 85.2 Navigating using the slide list 98 76.0 Scanning through video using play head 80 62.0 Muting sound / controlling sound level 78 60.4 Skipping back 75 58.1 Viewing the lecture recording offline 48 37.2 Downloading additional resources via presentation links
39 30.3
Saving links to specific locations in the lecture recording
34 26.4
Mailing questions to lecturer from within viewer
9 7.0
Sharing lecture recording via mail with other students
9 7.0
* Students could select multiple options
Table 5.4 shows that replaying the recorded lecture at higher or lower speed, navigating through the recorded lecture using the slide list and using the play head are features found to be important by a majority of the students. Although it would be possible to track the use of the above-mentioned features, there is currently no data about actual use in the LCS log data to substantiate or correct these reports. The player used to display the recorded lectures does not send any information related to the method
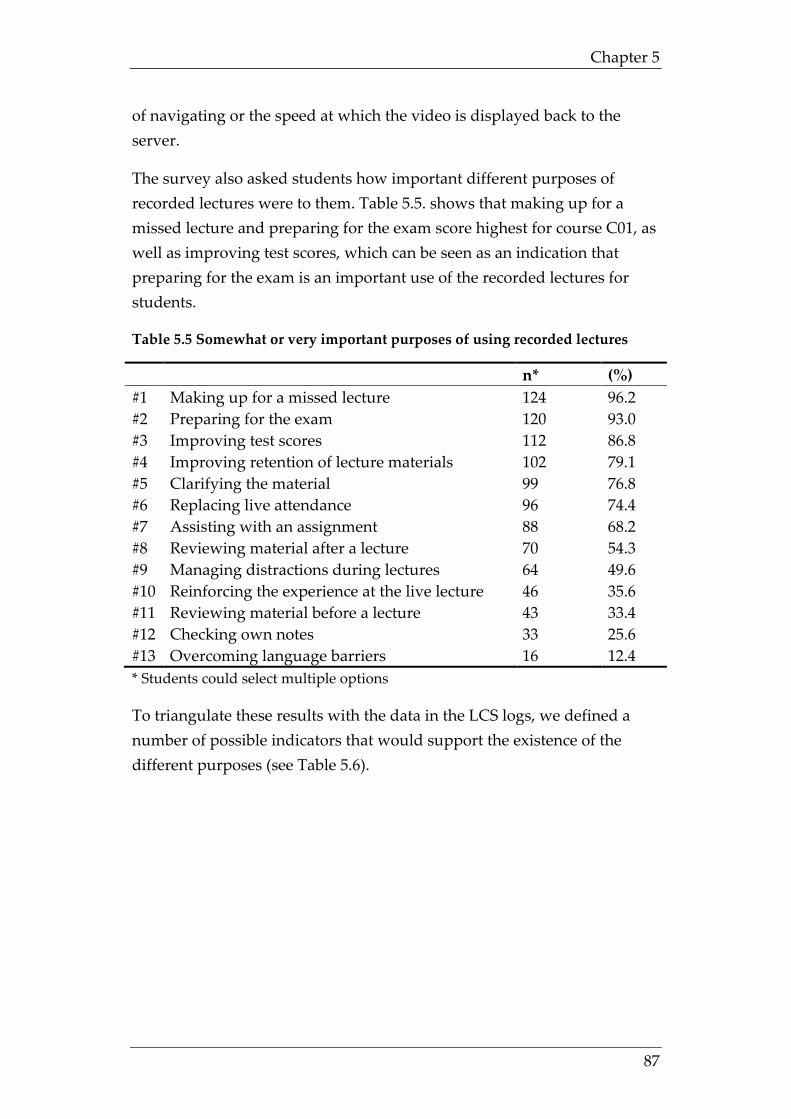
Chapter 5
87
of navigating or the speed at which the video is displayed back to the server.
The survey also asked students how important different purposes of recorded lectures were to them. Table 5.5. shows that making up for a missed lecture and preparing for the exam score highest for course C01, as well as improving test scores, which can be seen as an indication that preparing for the exam is an important use of the recorded lectures for students.
Table 5.5 Somewhat or very important purposes of using recorded lectures
n* (%) #1 Making up for a missed lecture 124 96.2 #2 Preparing for the exam 120 93.0 #3 Improving test scores 112 86.8 #4 Improving retention of lecture materials 102 79.1 #5 Clarifying the material 99 76.8 #6 Replacing live attendance 96 74.4 #7 Assisting with an assignment 88 68.2 #8 Reviewing material after a lecture 70 54.3 #9 Managing distractions during lectures 64 49.6 #10 Reinforcing the experience at the live lecture 46 35.6 #11 Reviewing material before a lecture 43 33.4 #12 Checking own notes 33 25.6 #13 Overcoming language barriers 16 12.4 * Students could select multiple options
To triangulate these results with the data in the LCS logs, we defined a number of possible indicators that would support the existence of the different purposes (see Table 5.6).
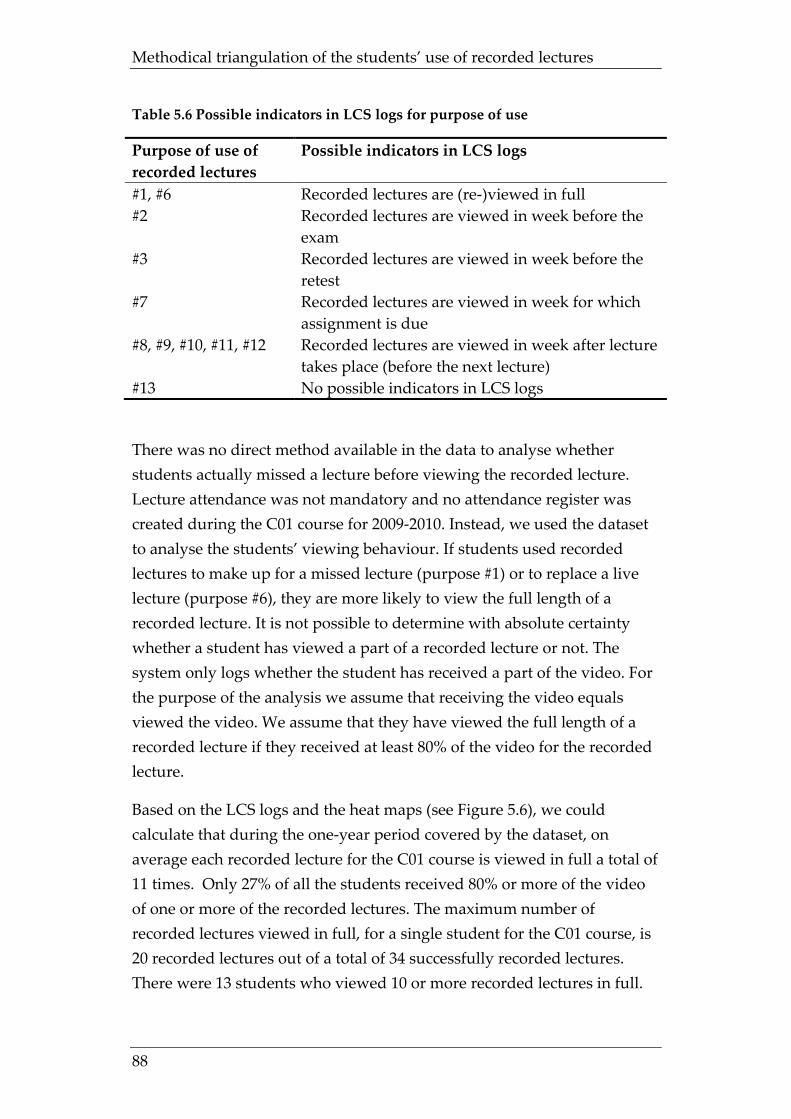
Methodical triangulation of the students’ use of recorded lectures
88
Table 5.6 Possible indicators in LCS logs for purpose of use
Purpose of use of recorded lectures
Possible indicators in LCS logs
#1, #6 Recorded lectures are (re-)viewed in full #2 Recorded lectures are viewed in week before the
exam #3 Recorded lectures are viewed in week before the
retest #7 Recorded lectures are viewed in week for which
assignment is due #8, #9, #10, #11, #12 Recorded lectures are viewed in week after lecture
takes place (before the next lecture) #13 No possible indicators in LCS logs
There was no direct method available in the data to analyse whether students actually missed a lecture before viewing the recorded lecture. Lecture attendance was not mandatory and no attendance register was created during the C01 course for 2009-2010. Instead, we used the dataset to analyse the students’ viewing behaviour. If students used recorded lectures to make up for a missed lecture (purpose #1) or to replace a live lecture (purpose #6), they are more likely to view the full length of a recorded lecture. It is not possible to determine with absolute certainty whether a student has viewed a part of a recorded lecture or not. The system only logs whether the student has received a part of the video. For the purpose of the analysis we assume that receiving the video equals viewed the video. We assume that they have viewed the full length of a recorded lecture if they received at least 80% of the video for the recorded lecture.
Based on the LCS logs and the heat maps (see Figure 5.6), we could calculate that during the one-year period covered by the dataset, on average each recorded lecture for the C01 course is viewed in full a total of 11 times. Only 27% of all the students received 80% or more of the video of one or more of the recorded lectures. The maximum number of recorded lectures viewed in full, for a single student for the C01 course, is 20 recorded lectures out of a total of 34 successfully recorded lectures. There were 13 students who viewed 10 or more recorded lectures in full.
Chapter 5
89
So the LCS log data does not support the responses by the students with regard to purposes #1 and #6.
To triangulate the other purposes, we analysed the number of learner sessions for the course C01 based on the LCS log data. Figure 5.7 shows the number of learner sessions for course C01 per week. It shows that there are four weeks in which there is an above-average use of the recorded lectures, indicated as [1] – [4] in Figure 5.7. These are the weeks in which the assignment for the course is due, a written test is planned, the laptop test is scheduled and the week before the retest takes place. The analysis shows that the LCS log data supports the response by students for purpose #2 and #3; the recorded lectures are viewed a lot in the week before an exam or retest. The figure also supports the response with regard to purpose #7, the use of the recorded lectures to assist with an assignment.
Although Figure 5.7 also shows use of the recorded lectures in the other weeks of the semester, use is much lower than for the four weeks with about-average use. The figure does not refute the response by the students, but the log analysis reported in Gorissen et al. (2012c) shows that usage patterns of the recordings are more influenced by the schedule of the exam than the lecture schedule. Less than 10% of all learner sessions take place within the first seven days after the recorded lecture has been made available. These findings do not correspond with purposes like #8, #9, #10, #11, and #12.
Our dataset did not contain information about the origin and language of students, so we were not able to determine whether non-Dutch students used the recorded lectures more often than Dutch students.
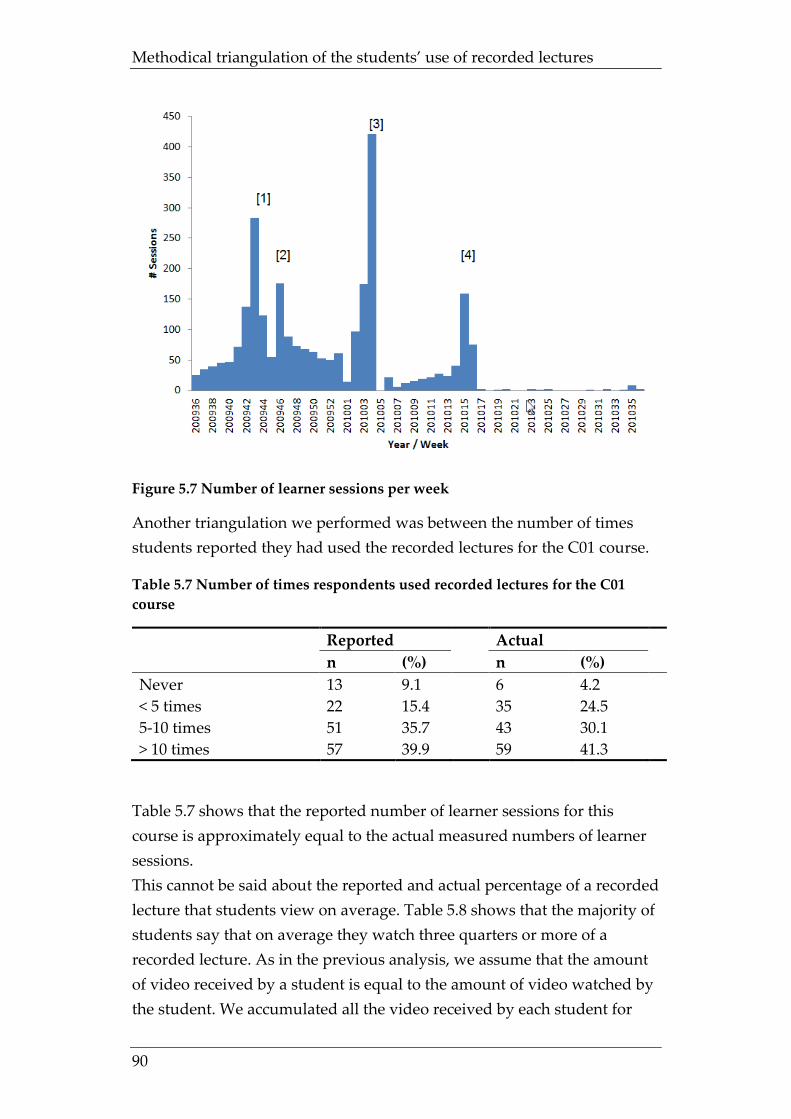
Methodical triangulation of the students’ use of recorded lectures
90
Figure 5.7 Number of learner sessions per week
Another triangulation we performed was between the number of times students reported they had used the recorded lectures for the C01 course.
Table 5.7 Number of times respondents used recorded lectures for the C01 course
Reported Actual n (%) n (%) Never 13 9.1 6 4.2 < 5 times 22 15.4 35 24.5 5-10 times 51 35.7 43 30.1 > 10 times 57 39.9 59 41.3
Table 5.7 shows that the reported number of learner sessions for this course is approximately equal to the actual measured numbers of learner sessions. This cannot be said about the reported and actual percentage of a recorded lecture that students view on average. Table 5.8 shows that the majority of students say that on average they watch three quarters or more of a recorded lecture. As in the previous analysis, we assume that the amount of video received by a student is equal to the amount of video watched by the student. We accumulated all the video received by each student for
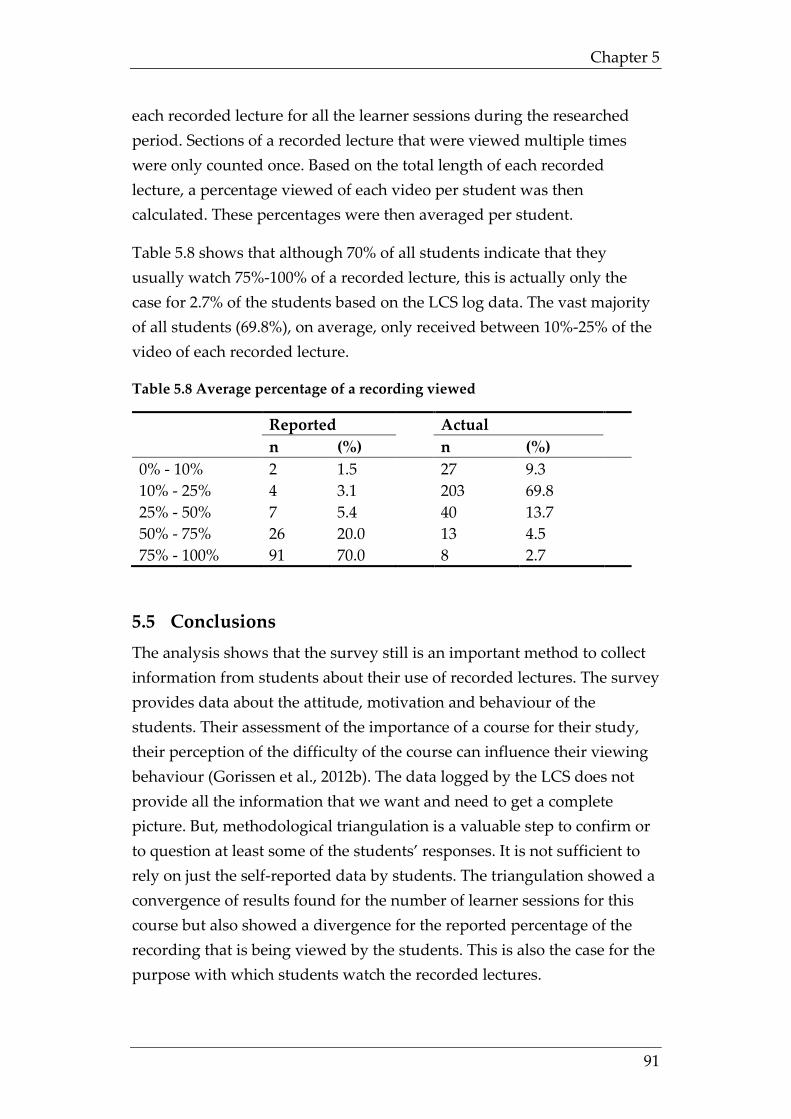
Chapter 5
91
each recorded lecture for all the learner sessions during the researched period. Sections of a recorded lecture that were viewed multiple times were only counted once. Based on the total length of each recorded lecture, a percentage viewed of each video per student was then calculated. These percentages were then averaged per student.
Table 5.8 shows that although 70% of all students indicate that they usually watch 75%-100% of a recorded lecture, this is actually only the case for 2.7% of the students based on the LCS log data. The vast majority of all students (69.8%), on average, only received between 10%-25% of the video of each recorded lecture.
Table 5.8 Average percentage of a recording viewed
Reported Actual n (%) n (%) 0% - 10% 2 1.5 27 9.3 10% - 25% 4 3.1 203 69.8 25% - 50% 7 5.4 40 13.7 50% - 75% 26 20.0 13 4.5 75% - 100% 91 70.0 8 2.7
5.5 Conclusions The analysis shows that the survey still is an important method to collect information from students about their use of recorded lectures. The survey provides data about the attitude, motivation and behaviour of the students. Their assessment of the importance of a course for their study, their perception of the difficulty of the course can influence their viewing behaviour (Gorissen et al., 2012b). The data logged by the LCS does not provide all the information that we want and need to get a complete picture. But, methodological triangulation is a valuable step to confirm or to question at least some of the students’ responses. It is not sufficient to rely on just the self-reported data by students. The triangulation showed a convergence of results found for the number of learner sessions for this course but also showed a divergence for the reported percentage of the recording that is being viewed by the students. This is also the case for the purpose with which students watch the recorded lectures.
Methodical triangulation of the students’ use of recorded lectures
92
Care should be taken when designing surveys aimed at collecting data about the use of recorded lectures by students. Respondent’s bias can greatly influence the results. For example, a positive attitude towards the use of recorded lectures could lead to over reporting of a student’s use of the recorded lecture or could lead to an over representation of possible use purposes to emphasise the importance of the availability of recorded lectures (Arnold & Feldman, 1981; Kopcha & Sullivan, 2007). Also, students’ accounts of their use of the recorded lectures can be fallible (Winne & Jamieson-Noel, 2002). This might be an explanation for the difference between the self-report of 70% of all students indicating that they usually watch 75%-100% of a recorded lecture, while this actually was only the case for 2.7% of the students based on the LCS log data. The vast majority of all students (69.8%), on average only received between 10%-25% of the video of each recorded lecture.
In cases where the data logged by the LCS currently is insufficient to perform triangulation, improvements can be made. For example, the methods that a student uses to navigate through the player interface is not yet logged, but could provide valuable information about whether the interface allows them to quickly find the parts of a recorded lecture that they want to view. If the data pre-processing steps described in Gorissen et al. (2012c) are incorporated into the LCS and reported on a regular basis, lecturers could be given access to the reports and use them when evaluating their lecture design. It would also enable time based triangulation where reports for recorded lectures of consecutive years or cohorts of students can be compared easily. More works also needed on further strengthening the definition of a learner session and the selection of outliers, sessions that are too short to be considered actual learner sessions. More works also is needed on the identification of purposes of use based on indicators in the LCS log data. Table 5.6 shows that a number of different purposes share a single indicator, making it impossible to distinguish between them based on just the LCS log data. Phillips et al. (2010) defined student profiles based on study behaviour combined with use of the recorded lectures. Although, their patterns did not yet incorporate the amount of use by a student (learner session length), they offer another possible direction of research.
Chapter 5
93
To be able to rely on this combination of data sets, unique identification of users is very important. We’ve seen examples where a single recording has been viewed on the same university computer by three different students on a single day. Just counting IP-addresses would provide incorrect information. Downloadable recorded lectures can only be counted but actual use of them cannot be tracked in detail. This also raises issues for universities that (also) provide their recorded lectures as open educational resources (OER); publicly on the internet for anyone to view. Surveys also cannot be anonymous. Although the data in the reports can be anonymised to assure the privacy of students, triangulation can only be performed if the survey data can be linked to the LCS log data of that same user. Universities should be aware of those effects on the completeness of reports they can create.
The selection of students for the survey is an example of the types of trade-offs that have to be considered in data triangulation: further triangulation by sampling students from a broader time and subject spectrum would prevent or at least lessen the power of the detailed analyses that eventually were performed.
A first step towards extending our analysis is to repeat the triangulation for the other six courses that were included in the original survey. Another option is to repeat the analysis for new cohorts of students or to add additional levels of triangulation by including additional data sources, e.g. by including log data from the virtual learning environment (VLE), containing data about the use of other course materials, assignments and exercises by the student. This allows us to validate the results and to determine the reliability of the observed convergence and divergence.
Another possible extension would be to integrate the survey more closely with the regular use of the recorded lectures. The survey already was conducted electronically and online, but it could be made part of the regular interface for the LCS. Like is done on some websites, students could be asked to complete the survey on a continuing basis. Care needs to be taken to not ask students this too often and it would only collect data for active users of the LCS, while the current survey also reached users that did not use the recorded lectures.
Methodical triangulation of the students’ use of recorded lectures
94
This page has been intentionally left blank
95
Chapter 6 Does tagging improve the navigation of
recorded lectures by students?*
6.1 Summary Students more and more have access to recordings of the lectures they attend at universities. The volume and length of these recorded lectures however makes them difficult to navigate. Research shows that students primarily watch the recorded lectures while preparing for their exams. They do not watch the full recorded lectures, but review only the parts that are relevant to them. While doing so, they often lack the required mechanisms to efficiently locate those parts of the recorded lecture that they want to view. In this paper we describe an experiment where expert tagging is used as a means to facilitate the students’ search. In the experiment students had the option to use tags to navigate recorded lectures. We used the data tracked by the lecture capture system to analyse the use of the tags by the students. We compared that data to students who did not use the tagging interface. Results show that the use of the tagging interface increases in time. Students use the TI more actively over time while reducing the amount of video that they view. The experiment also shows that students who use the tagging interface score higher grades when compared to students who use the regular interface.
6.2 Introduction During their academic careers, students spent a great number of hours attending lectures. More and more universities record these lectures and provide them online to their students (Leoni & Lichti, 2009). Research (Gosper et al., 2008; T. Traphagan, 2006a; Tomoko Traphagan et al., 2010; Veeramani & Bradly, 2008) shows that most students express a preference for courses accompanied by online recordings of the lectures. These
* This chapter has been submitted as: Gorissen, P., Van Bruggen, J. M. & Jochems, W. Does tagging improve the navigation of recorded lectures by students?
Does tagging improve the navigation of recorded lectures by students?
96
recorded lectures are created using a Lecture Capturing System (LCS). A LCS consists of a dedicated capture appliance in the lecture hall, capturing audio, video and the VGA signal of the lecturer’s laptop or desktop. The capture appliance can be started, stopped and monitored remotely by a system administrator. The capture appliance automatically synchronises the recorded audio, the video and the VGA signal into a single interface stored on the server. The lecture can be viewed live or on demand by the user using a web browser.
Because they are integral recordings from the live lectures, these recorded lectures are usually 40-45 minutes per recording. Research by Gorissen, van Bruggen, and Jochems (2012b, 2012c) shows that students typically do not watch the full recorded lecture from start to finish. Instead, they jump to the parts of the lecture they want to (re)view and only watch those segments. Analysis of their navigation behaviour shows that it often takes several jumps within the recording to find those parts they want to review. The research also shows that students use recorded lectures primarily while preparing for exams. Students use the recorded lectures as part of their regular learning activities. One other important activity is note taking. Taking notes during lectures is considered to be a key component of academic literacy (Badger, White, Sutherland, & Haggis, 2001). Lecture notes provide an encoding function: they help students learn and remember the information from the lecture. They also provide a storage function, preserving the information provided during the lecture for later use (Anderson & Armbruster, 1986). Bligh (1998, pp. 129-147) lists an overwhelming amount of research that shows that note taking aids students in their learning process, and there is strong evidence that note taking leads to higher achievement (Kiewra, 1989). Research by Gorissen et al. (2012b) showed that students use their notes to find the relevant part of the recorded lecture that they want to (re-)view. Most LCS, however, do not offer students easy textual clues. Students are limited to using a time based video slider or a slide based view to find those relevant parts.
Traditionally metadata is created by dedicated professionals (Gruber, 1993), tags on the other hand are a form of user created metadata (Mathes, 2004). Tags are textual keywords and phrases, that can link to a number of different resources (O'Reilly, 2005). In our case they are linking to locations within the recorded lectures. Tags became popular as part of the
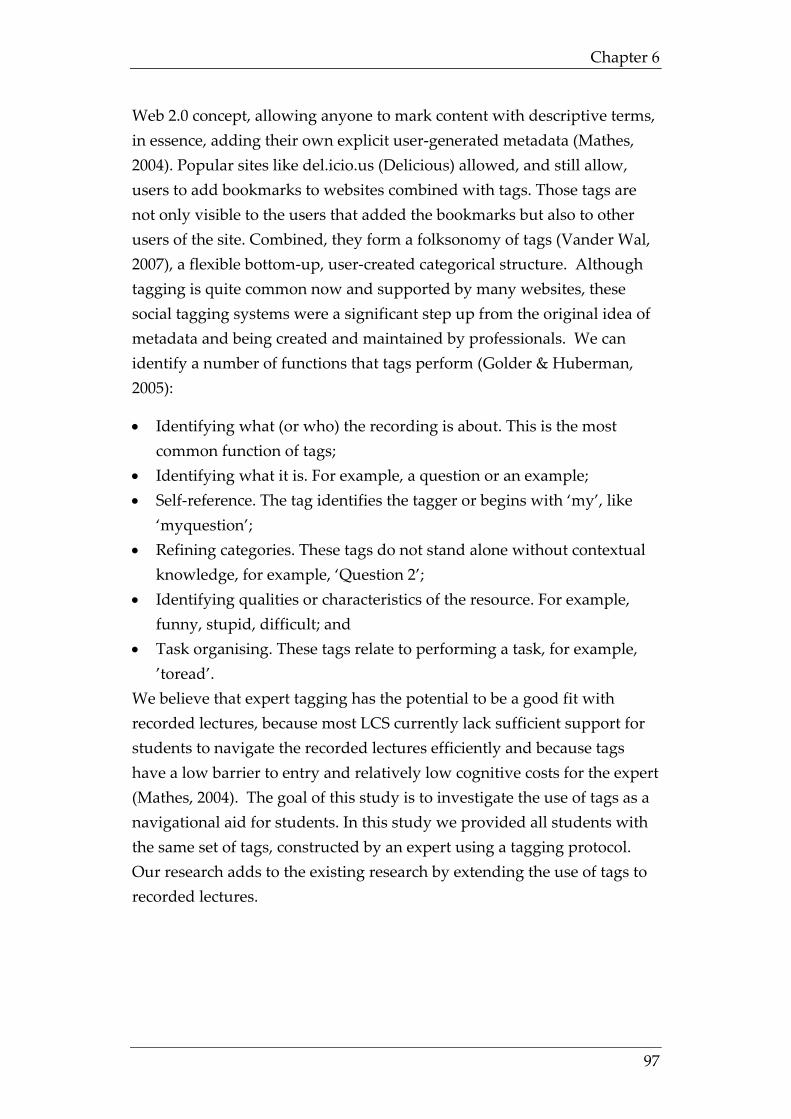
Chapter 6
97
Web 2.0 concept, allowing anyone to mark content with descriptive terms, in essence, adding their own explicit user-generated metadata (Mathes, 2004). Popular sites like del.icio.us (Delicious) allowed, and still allow, users to add bookmarks to websites combined with tags. Those tags are not only visible to the users that added the bookmarks but also to other users of the site. Combined, they form a folksonomy of tags (Vander Wal, 2007), a flexible bottom-up, user-created categorical structure. Although tagging is quite common now and supported by many websites, these social tagging systems were a significant step up from the original idea of metadata and being created and maintained by professionals. We can identify a number of functions that tags perform (Golder & Huberman, 2005):
• Identifying what (or who) the recording is about. This is the most common function of tags;
• Identifying what it is. For example, a question or an example; • Self-reference. The tag identifies the tagger or begins with ‘my’, like
‘myquestion’; • Refining categories. These tags do not stand alone without contextual
knowledge, for example, ‘Question 2’; • Identifying qualities or characteristics of the resource. For example,
funny, stupid, difficult; and • Task organising. These tags relate to performing a task, for example,
’toread’. We believe that expert tagging has the potential to be a good fit with recorded lectures, because most LCS currently lack sufficient support for students to navigate the recorded lectures efficiently and because tags have a low barrier to entry and relatively low cognitive costs for the expert (Mathes, 2004). The goal of this study is to investigate the use of tags as a navigational aid for students. In this study we provided all students with the same set of tags, constructed by an expert using a tagging protocol. Our research adds to the existing research by extending the use of tags to recorded lectures.
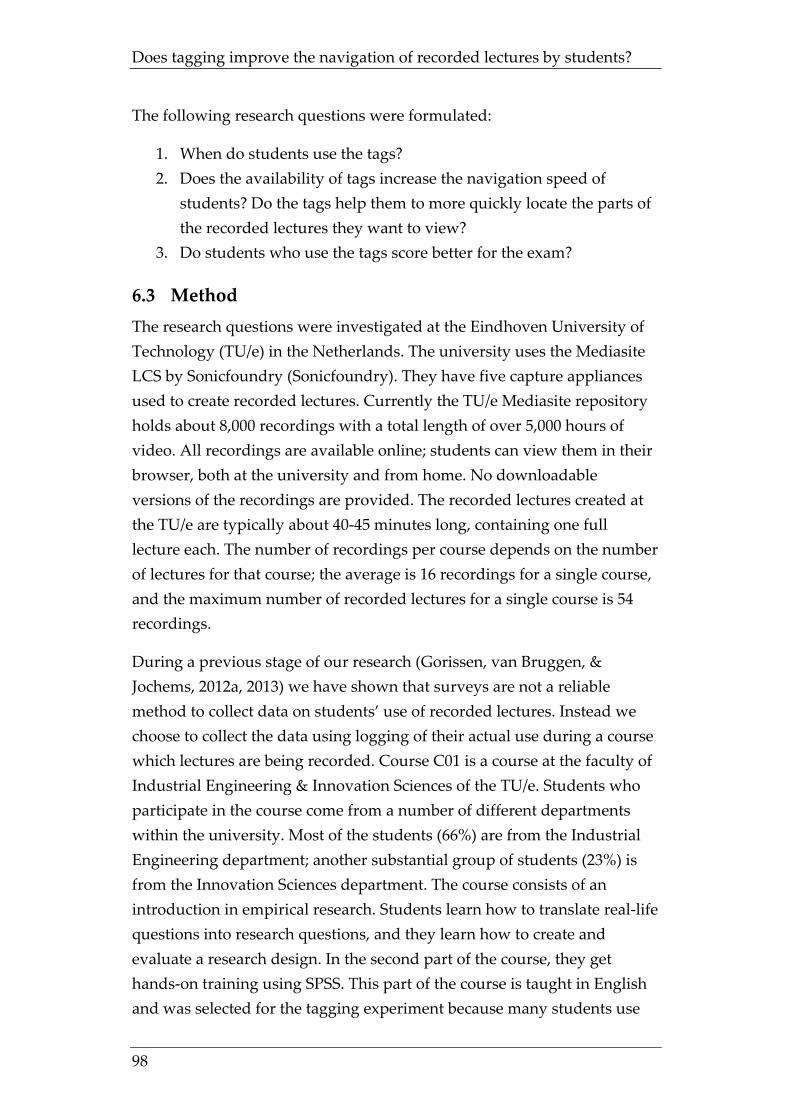
Does tagging improve the navigation of recorded lectures by students?
98
The following research questions were formulated:
1. When do students use the tags? 2. Does the availability of tags increase the navigation speed of
students? Do the tags help them to more quickly locate the parts of the recorded lectures they want to view?
3. Do students who use the tags score better for the exam?
6.3 Method The research questions were investigated at the Eindhoven University of Technology (TU/e) in the Netherlands. The university uses the Mediasite LCS by Sonicfoundry (Sonicfoundry). They have five capture appliances used to create recorded lectures. Currently the TU/e Mediasite repository holds about 8,000 recordings with a total length of over 5,000 hours of video. All recordings are available online; students can view them in their browser, both at the university and from home. No downloadable versions of the recordings are provided. The recorded lectures created at the TU/e are typically about 40-45 minutes long, containing one full lecture each. The number of recordings per course depends on the number of lectures for that course; the average is 16 recordings for a single course, and the maximum number of recorded lectures for a single course is 54 recordings.
During a previous stage of our research (Gorissen, van Bruggen, & Jochems, 2012a, 2013) we have shown that surveys are not a reliable method to collect data on students’ use of recorded lectures. Instead we choose to collect the data using logging of their actual use during a course which lectures are being recorded. Course C01 is a course at the faculty of Industrial Engineering & Innovation Sciences of the TU/e. Students who participate in the course come from a number of different departments within the university. Most of the students (66%) are from the Industrial Engineering department; another substantial group of students (23%) is from the Innovation Sciences department. The course consists of an introduction in empirical research. Students learn how to translate real-life questions into research questions, and they learn how to create and evaluate a research design. In the second part of the course, they get hands-on training using SPSS. This part of the course is taught in English and was selected for the tagging experiment because many students use
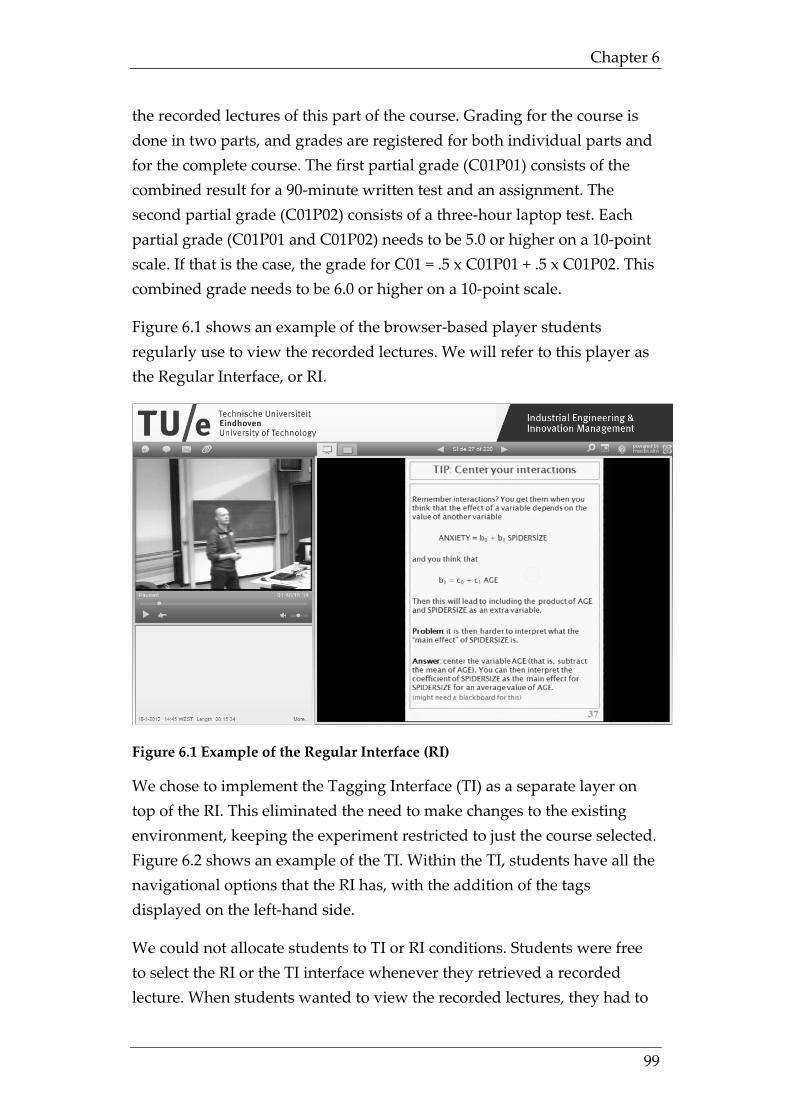
Chapter 6
99
the recorded lectures of this part of the course. Grading for the course is done in two parts, and grades are registered for both individual parts and for the complete course. The first partial grade (C01P01) consists of the combined result for a 90-minute written test and an assignment. The second partial grade (C01P02) consists of a three-hour laptop test. Each partial grade (C01P01 and C01P02) needs to be 5.0 or higher on a 10-point scale. If that is the case, the grade for C01 = .5 x C01P01 + .5 x C01P02. This combined grade needs to be 6.0 or higher on a 10-point scale.
Figure 6.1 shows an example of the browser-based player students regularly use to view the recorded lectures. We will refer to this player as the Regular Interface, or RI.
Figure 6.1 Example of the Regular Interface (RI)
We chose to implement the Tagging Interface (TI) as a separate layer on top of the RI. This eliminated the need to make changes to the existing environment, keeping the experiment restricted to just the course selected. Figure 6.2 shows an example of the TI. Within the TI, students have all the navigational options that the RI has, with the addition of the tags displayed on the left-hand side.
We could not allocate students to TI or RI conditions. Students were free to select the RI or the TI interface whenever they retrieved a recorded lecture. When students wanted to view the recorded lectures, they had to
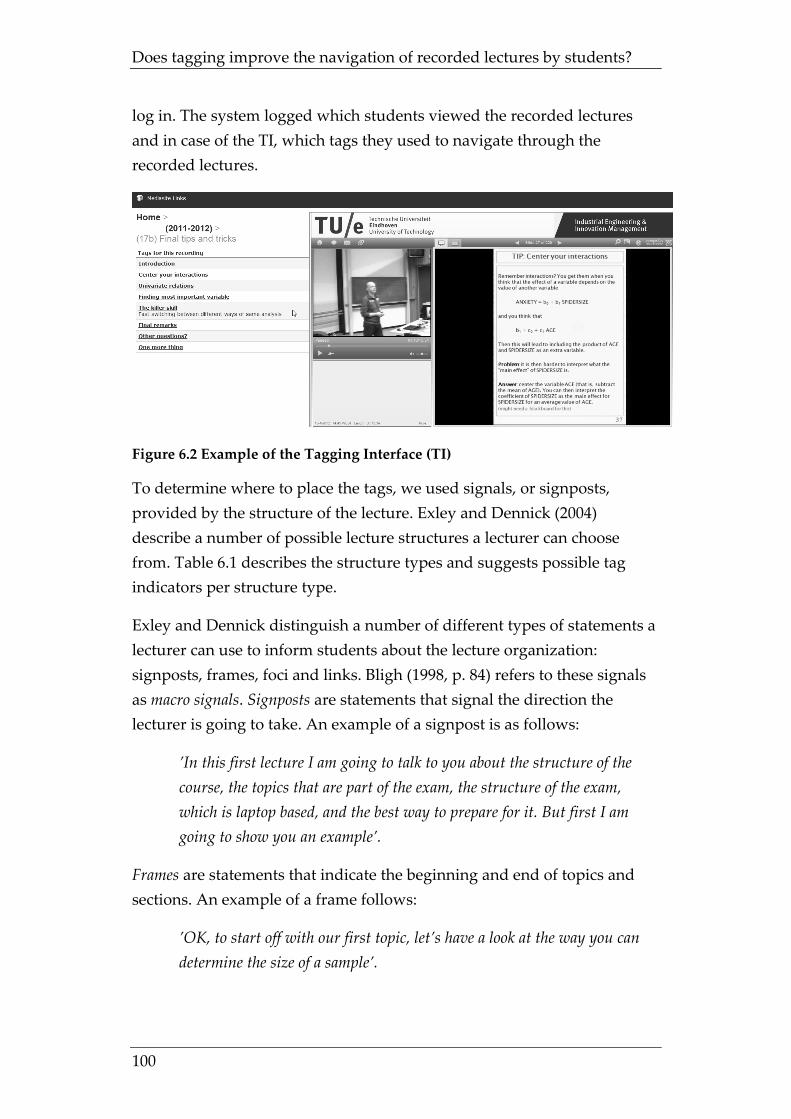
Does tagging improve the navigation of recorded lectures by students?
100
log in. The system logged which students viewed the recorded lectures and in case of the TI, which tags they used to navigate through the recorded lectures.
Figure 6.2 Example of the Tagging Interface (TI)
To determine where to place the tags, we used signals, or signposts, provided by the structure of the lecture. Exley and Dennick (2004) describe a number of possible lecture structures a lecturer can choose from. Table 6.1 describes the structure types and suggests possible tag indicators per structure type.
Exley and Dennick distinguish a number of different types of statements a lecturer can use to inform students about the lecture organization: signposts, frames, foci and links. Bligh (1998, p. 84) refers to these signals as macro signals. Signposts are statements that signal the direction the lecturer is going to take. An example of a signpost is as follows:
’In this first lecture I am going to talk to you about the structure of the course, the topics that are part of the exam, the structure of the exam, which is laptop based, and the best way to prepare for it. But first I am going to show you an example’.
Frames are statements that indicate the beginning and end of topics and sections. An example of a frame follows:
’OK, to start off with our first topic, let’s have a look at the way you can determine the size of a sample’.
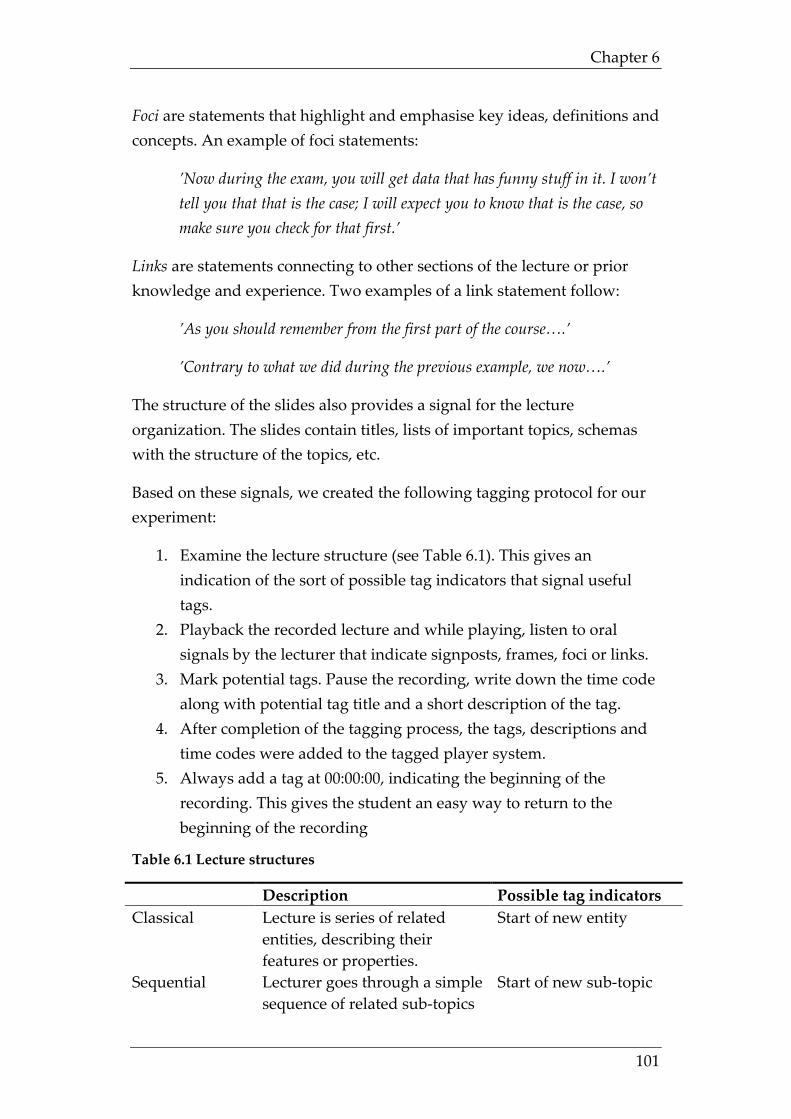
Chapter 6
101
Foci are statements that highlight and emphasise key ideas, definitions and concepts. An example of foci statements:
’Now during the exam, you will get data that has funny stuff in it. I won’t tell you that that is the case; I will expect you to know that is the case, so make sure you check for that first.’
Links are statements connecting to other sections of the lecture or prior knowledge and experience. Two examples of a link statement follow:
’As you should remember from the first part of the course….’
’Contrary to what we did during the previous example, we now….’
The structure of the slides also provides a signal for the lecture organization. The slides contain titles, lists of important topics, schemas with the structure of the topics, etc.
Based on these signals, we created the following tagging protocol for our experiment:
1. Examine the lecture structure (see Table 6.1). This gives an indication of the sort of possible tag indicators that signal useful tags.
2. Playback the recorded lecture and while playing, listen to oral signals by the lecturer that indicate signposts, frames, foci or links.
3. Mark potential tags. Pause the recording, write down the time code along with potential tag title and a short description of the tag.
4. After completion of the tagging process, the tags, descriptions and time codes were added to the tagged player system.
5. Always add a tag at 00:00:00, indicating the beginning of the recording. This gives the student an easy way to return to the beginning of the recording
Table 6.1 Lecture structures
Description Possible tag indicators Classical Lecture is series of related
entities, describing their features or properties.
Start of new entity
Sequential Lecturer goes through a simple sequence of related sub-topics
Start of new sub-topic
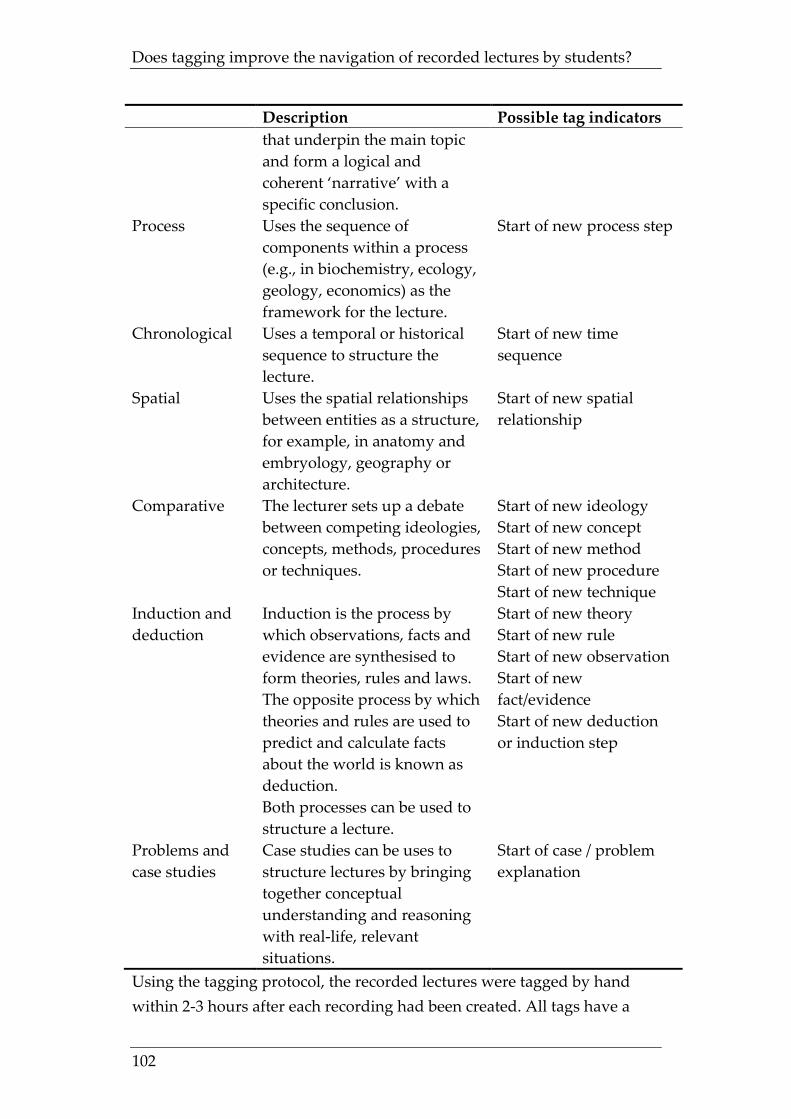
Does tagging improve the navigation of recorded lectures by students?
102
Description Possible tag indicators that underpin the main topic and form a logical and coherent ‘narrative’ with a specific conclusion.
Process
Uses the sequence of components within a process (e.g., in biochemistry, ecology, geology, economics) as the framework for the lecture.
Start of new process step
Chronological
Uses a temporal or historical sequence to structure the lecture.
Start of new time sequence
Spatial
Uses the spatial relationships between entities as a structure, for example, in anatomy and embryology, geography or architecture.
Start of new spatial relationship
Comparative
The lecturer sets up a debate between competing ideologies, concepts, methods, procedures or techniques.
Start of new ideology Start of new concept Start of new method Start of new procedure Start of new technique
Induction and deduction
Induction is the process by which observations, facts and evidence are synthesised to form theories, rules and laws. The opposite process by which theories and rules are used to predict and calculate facts about the world is known as deduction. Both processes can be used to structure a lecture.
Start of new theory Start of new rule Start of new observation Start of new fact/evidence Start of new deduction or induction step
Problems and case studies
Case studies can be uses to structure lectures by bringing together conceptual understanding and reasoning with real-life, relevant situations.
Start of case / problem explanation
Using the tagging protocol, the recorded lectures were tagged by hand within 2-3 hours after each recording had been created. All tags have a
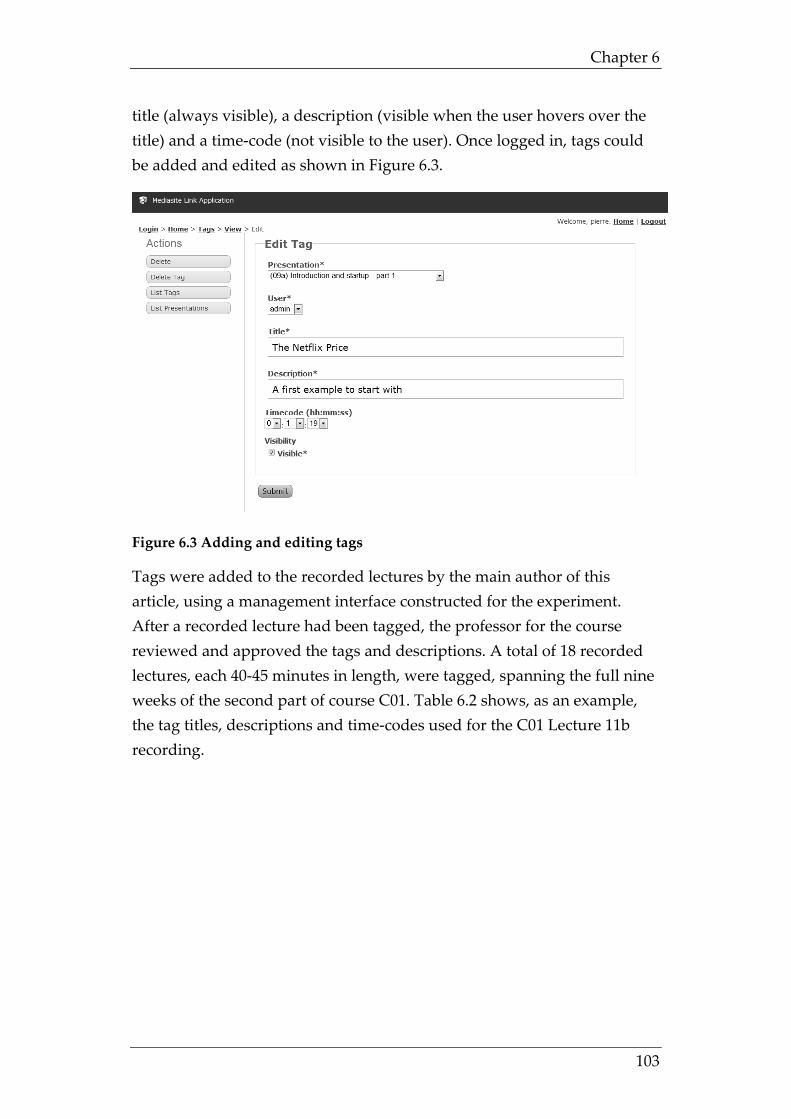
Chapter 6
103
title (always visible), a description (visible when the user hovers over the title) and a time-code (not visible to the user). Once logged in, tags could be added and edited as shown in Figure 6.3.
Figure 6.3 Adding and editing tags
Tags were added to the recorded lectures by the main author of this article, using a management interface constructed for the experiment. After a recorded lecture had been tagged, the professor for the course reviewed and approved the tags and descriptions. A total of 18 recorded lectures, each 40-45 minutes in length, were tagged, spanning the full nine weeks of the second part of course C01. Table 6.2 shows, as an example, the tag titles, descriptions and time-codes used for the C01 Lecture 11b recording.
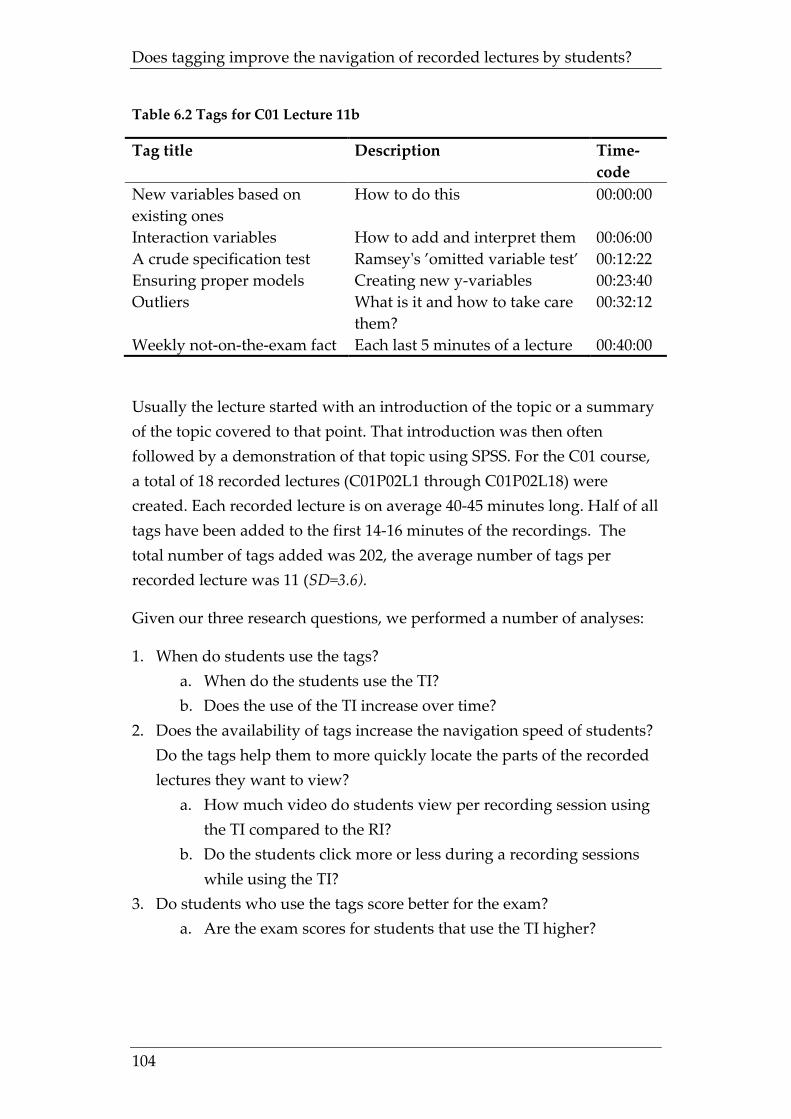
Does tagging improve the navigation of recorded lectures by students?
104
Table 6.2 Tags for C01 Lecture 11b
Tag title Description Time-code
New variables based on existing ones
How to do this 00:00:00
Interaction variables How to add and interpret them 00:06:00 A crude specification test Ramsey's ’omitted variable test’ 00:12:22 Ensuring proper models Creating new y-variables 00:23:40 Outliers What is it and how to take care
them? 00:32:12
Weekly not-on-the-exam fact Each last 5 minutes of a lecture 00:40:00
Usually the lecture started with an introduction of the topic or a summary of the topic covered to that point. That introduction was then often followed by a demonstration of that topic using SPSS. For the C01 course, a total of 18 recorded lectures (C01P02L1 through C01P02L18) were created. Each recorded lecture is on average 40-45 minutes long. Half of all tags have been added to the first 14-16 minutes of the recordings. The total number of tags added was 202, the average number of tags per recorded lecture was 11 (SD=3.6).
Given our three research questions, we performed a number of analyses:
1. When do students use the tags? a. When do the students use the TI? b. Does the use of the TI increase over time?
2. Does the availability of tags increase the navigation speed of students? Do the tags help them to more quickly locate the parts of the recorded lectures they want to view?
a. How much video do students view per recording session using the TI compared to the RI?
b. Do the students click more or less during a recording sessions while using the TI?
3. Do students who use the tags score better for the exam? a. Are the exam scores for students that use the TI higher?
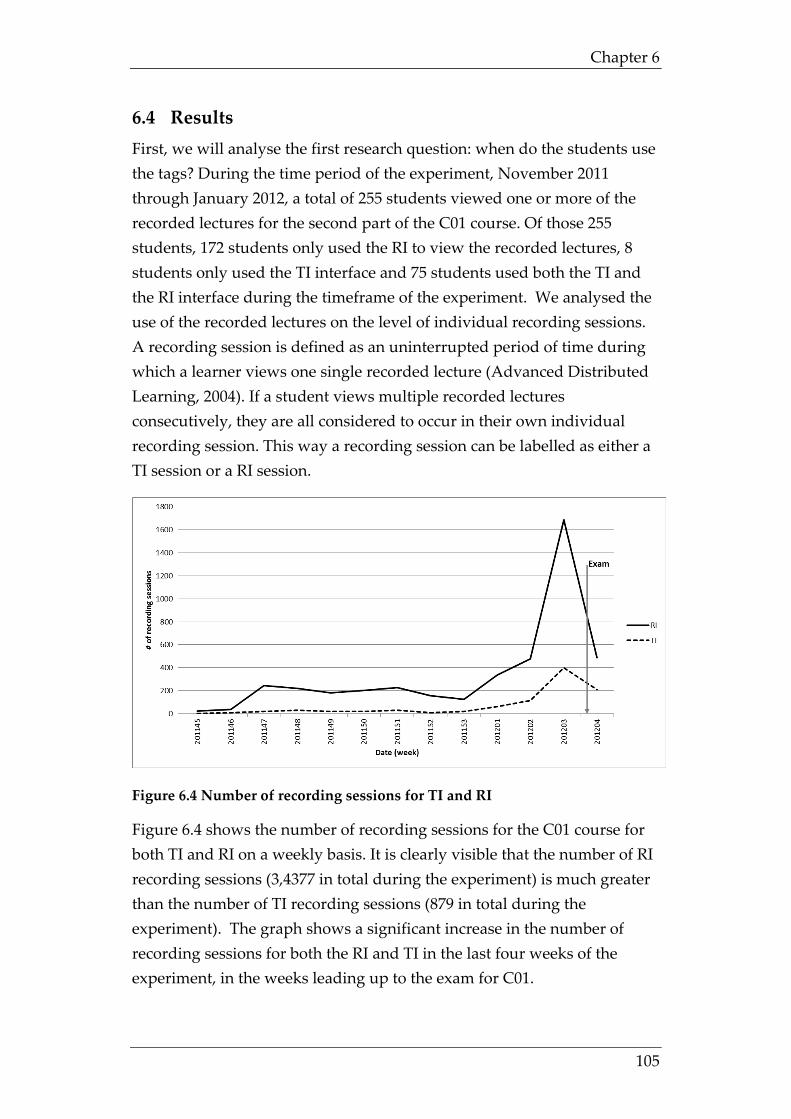
Chapter 6
105
6.4 Results First, we will analyse the first research question: when do the students use the tags? During the time period of the experiment, November 2011 through January 2012, a total of 255 students viewed one or more of the recorded lectures for the second part of the C01 course. Of those 255 students, 172 students only used the RI to view the recorded lectures, 8 students only used the TI interface and 75 students used both the TI and the RI interface during the timeframe of the experiment. We analysed the use of the recorded lectures on the level of individual recording sessions. A recording session is defined as an uninterrupted period of time during which a learner views one single recorded lecture (Advanced Distributed Learning, 2004). If a student views multiple recorded lectures consecutively, they are all considered to occur in their own individual recording session. This way a recording session can be labelled as either a TI session or a RI session.
Figure 6.4 Number of recording sessions for TI and RI
Figure 6.4 shows the number of recording sessions for the C01 course for both TI and RI on a weekly basis. It is clearly visible that the number of RI recording sessions (3,4377 in total during the experiment) is much greater than the number of TI recording sessions (879 in total during the experiment). The graph shows a significant increase in the number of recording sessions for both the RI and TI in the last four weeks of the experiment, in the weeks leading up to the exam for C01.
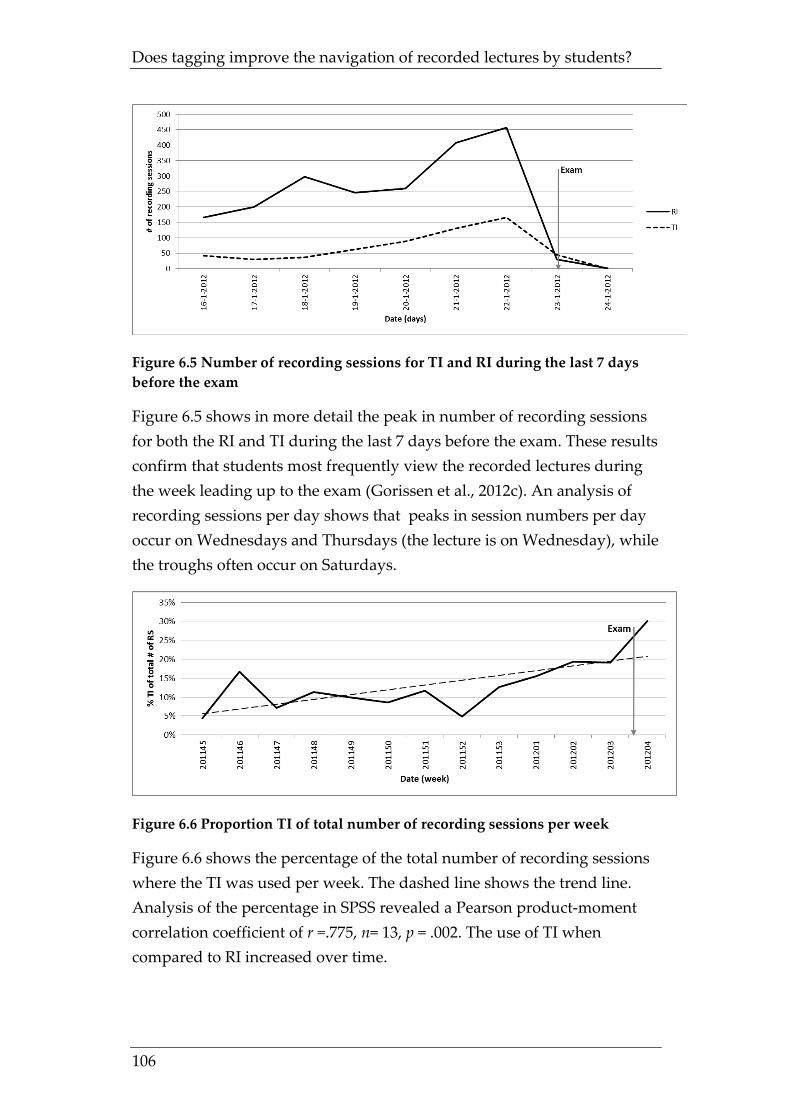
Does tagging improve the navigation of recorded lectures by students?
106
Figure 6.5 Number of recording sessions for TI and RI during the last 7 days before the exam
Figure 6.5 shows in more detail the peak in number of recording sessions for both the RI and TI during the last 7 days before the exam. These results confirm that students most frequently view the recorded lectures during the week leading up to the exam (Gorissen et al., 2012c). An analysis of recording sessions per day shows that peaks in session numbers per day occur on Wednesdays and Thursdays (the lecture is on Wednesday), while the troughs often occur on Saturdays.
Figure 6.6 Proportion TI of total number of recording sessions per week
Figure 6.6 shows the percentage of the total number of recording sessions where the TI was used per week. The dashed line shows the trend line. Analysis of the percentage in SPSS revealed a Pearson product-moment correlation coefficient of r =.775, n= 13, p = .002. The use of TI when compared to RI increased over time.
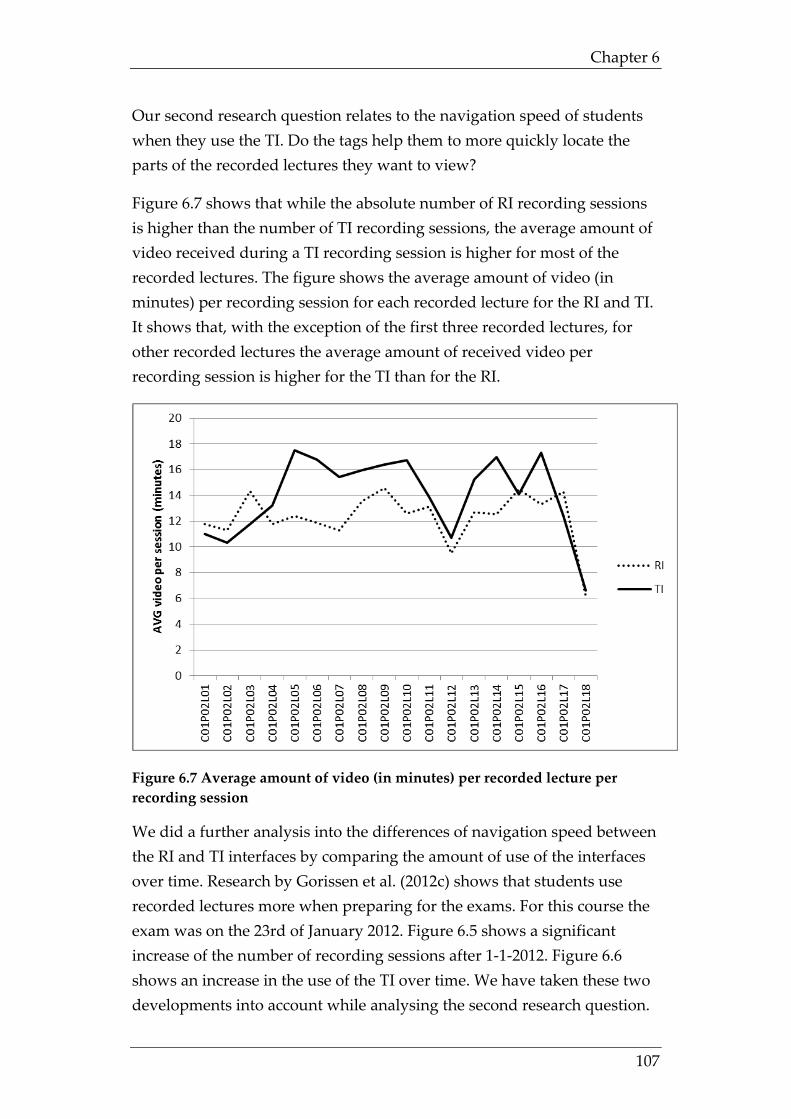
Chapter 6
107
Our second research question relates to the navigation speed of students when they use the TI. Do the tags help them to more quickly locate the parts of the recorded lectures they want to view?
Figure 6.7 shows that while the absolute number of RI recording sessions is higher than the number of TI recording sessions, the average amount of video received during a TI recording session is higher for most of the recorded lectures. The figure shows the average amount of video (in minutes) per recording session for each recorded lecture for the RI and TI. It shows that, with the exception of the first three recorded lectures, for other recorded lectures the average amount of received video per recording session is higher for the TI than for the RI.
Figure 6.7 Average amount of video (in minutes) per recorded lecture per recording session
We did a further analysis into the differences of navigation speed between the RI and TI interfaces by comparing the amount of use of the interfaces over time. Research by Gorissen et al. (2012c) shows that students use recorded lectures more when preparing for the exams. For this course the exam was on the 23rd of January 2012. Figure 6.5 shows a significant increase of the number of recording sessions after 1-1-2012. Figure 6.6 shows an increase in the use of the TI over time. We have taken these two developments into account while analysing the second research question.
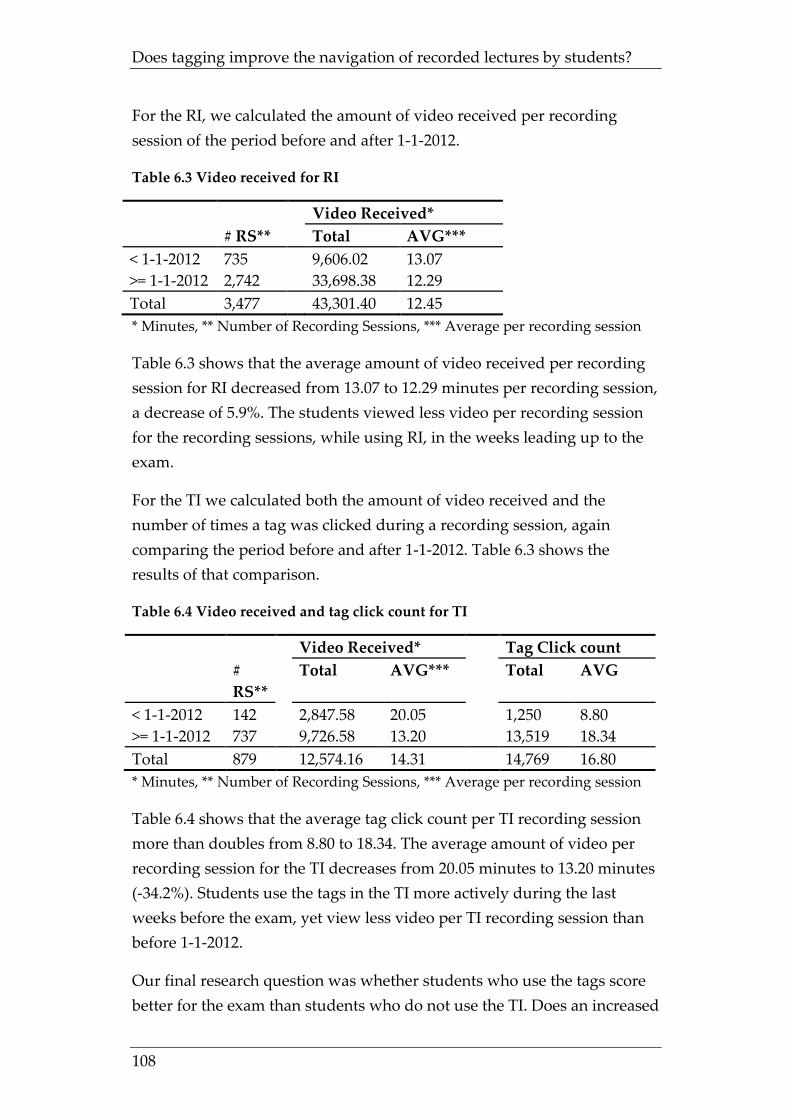
Does tagging improve the navigation of recorded lectures by students?
108
For the RI, we calculated the amount of video received per recording session of the period before and after 1-1-2012.
Table 6.3 Video received for RI
Video Received* # RS** Total AVG*** < 1-1-2012 735 9,606.02 13.07 >= 1-1-2012 2,742 33,698.38 12.29 Total 3,477 43,301.40 12.45 * Minutes, ** Number of Recording Sessions, *** Average per recording session
Table 6.3 shows that the average amount of video received per recording session for RI decreased from 13.07 to 12.29 minutes per recording session, a decrease of 5.9%. The students viewed less video per recording session for the recording sessions, while using RI, in the weeks leading up to the exam.
For the TI we calculated both the amount of video received and the number of times a tag was clicked during a recording session, again comparing the period before and after 1-1-2012. Table 6.3 shows the results of that comparison.
Table 6.4 Video received and tag click count for TI
Video Received* Tag Click count #
RS** Total AVG*** Total AVG
< 1-1-2012 142 2,847.58 20.05 1,250 8.80 >= 1-1-2012 737 9,726.58 13.20 13,519 18.34 Total 879 12,574.16 14.31 14,769 16.80 * Minutes, ** Number of Recording Sessions, *** Average per recording session
Table 6.4 shows that the average tag click count per TI recording session more than doubles from 8.80 to 18.34. The average amount of video per recording session for the TI decreases from 20.05 minutes to 13.20 minutes (-34.2%). Students use the tags in the TI more actively during the last weeks before the exam, yet view less video per TI recording session than before 1-1-2012.
Our final research question was whether students who use the tags score better for the exam than students who do not use the TI. Does an increased
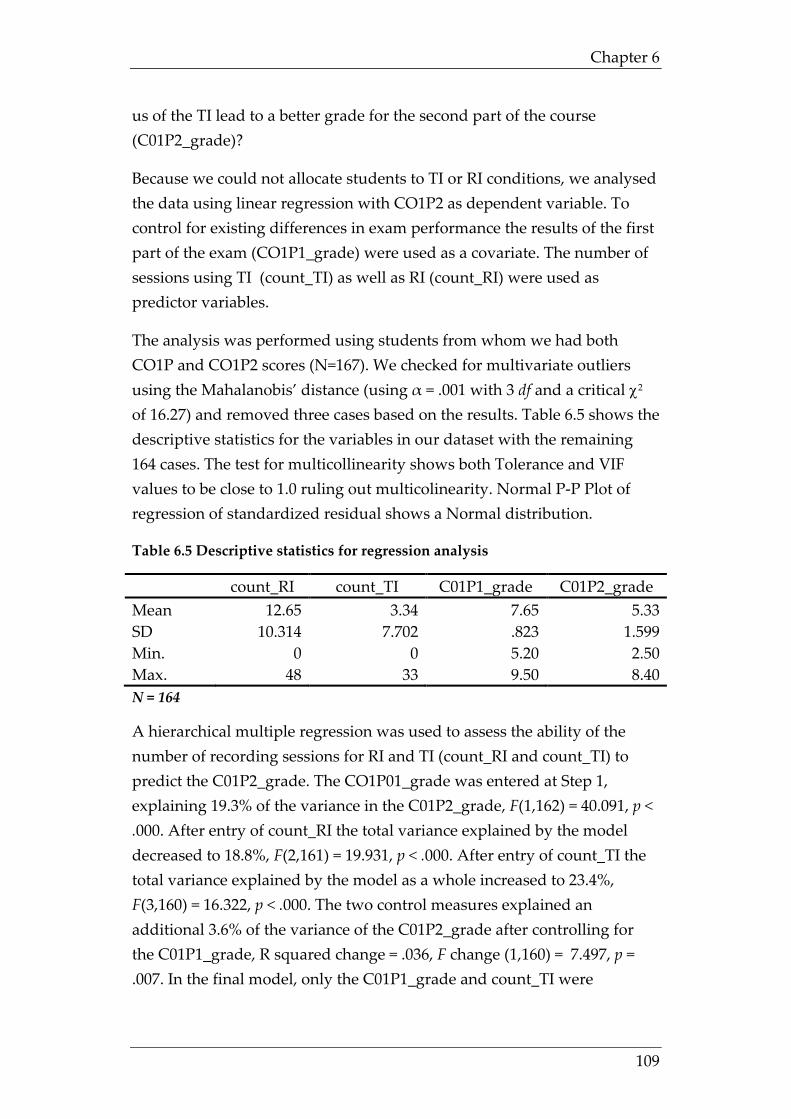
Chapter 6
109
us of the TI lead to a better grade for the second part of the course (C01P2_grade)?
Because we could not allocate students to TI or RI conditions, we analysed the data using linear regression with CO1P2 as dependent variable. To control for existing differences in exam performance the results of the first part of the exam (CO1P1_grade) were used as a covariate. The number of sessions using TI (count_TI) as well as RI (count_RI) were used as predictor variables.
The analysis was performed using students from whom we had both CO1P and CO1P2 scores (N=167). We checked for multivariate outliers using the Mahalanobis’ distance (using α = .001 with 3 df and a critical χ2 of 16.27) and removed three cases based on the results. Table 6.5 shows the descriptive statistics for the variables in our dataset with the remaining 164 cases. The test for multicollinearity shows both Tolerance and VIF values to be close to 1.0 ruling out multicolinearity. Normal P-P Plot of regression of standardized residual shows a Normal distribution.
Table 6.5 Descriptive statistics for regression analysis
count_RI count_TI C01P1_grade C01P2_grade Mean 12.65 3.34 7.65 5.33 SD 10.314 7.702 .823 1.599 Min. 0 0 5.20 2.50 Max. 48 33 9.50 8.40 N = 164
A hierarchical multiple regression was used to assess the ability of the number of recording sessions for RI and TI (count_RI and count_TI) to predict the C01P2_grade. The CO1P01_grade was entered at Step 1, explaining 19.3% of the variance in the C01P2_grade, F(1,162) = 40.091, p < .000. After entry of count_RI the total variance explained by the model decreased to 18.8%, F(2,161) = 19.931, p < .000. After entry of count_TI the total variance explained by the model as a whole increased to 23.4%, F(3,160) = 16.322, p < .000. The two control measures explained an additional 3.6% of the variance of the C01P2_grade after controlling for the C01P1_grade, R squared change = .036, F change (1,160) = 7.497, p = .007. In the final model, only the C01P1_grade and count_TI were
Does tagging improve the navigation of recorded lectures by students?
110
statistically significant, with the C01P01_grade recording a higher beta value (beta = .44 p < .000) than the count_RI (beta = .194, p = .007).
6.5 Conclusions and discussion In this study we provided students with the choice to use a tagged interface (TI) instead of the regular interface (RI) available to them. Both the RI and TI are used most in the weeks leading up to the exam. And although the RI is used more often than the TI throughout the semester, there is a significant increase in the relative use of the TI in time. This could be because the students needed to get used to TI, because the found the use of the TI useful and increased their use of the TI or because the topics covered in the recorded lectures were perceived by the students as more difficult, making the availability of tags to find relevant parts of the recorded lectures more useful. A next step would be to analyse the use of tags by a group of students over a number of courses to determine whether the growth in use is consistent or whether course related criteria, like the topic of the course of the perceived difficulty of the course influence the use of the tags.
During the first part of the semester (before 1-1-2012), students who use the TI, view considerably more video per recording session than the students who use the RI. In the second part of the semester however (after 1-1-2012), this difference is almost reduced to zero. At the same time, the use of the tags per recording session more than doubles. This suggests not only that the students use the TI more actively, but also that the availability of tags helps the students to watch the recorded lectures more efficiently.
Students viewed less of the recorded lectures when using the TI. And while this means a decrease in their time on task, the regression analysis shows that the use the TI interface had an, albeit small, positive influence on the predicted grade for the course, even when controlled for the grade for the first part of the course. But, of course, most of the variance in the exam results is not accounted for in the simple model tested here. Such a model not only has to include well known predictors such as students’ approach to studying, prior knowledge, intelligence and motivation (Entwistle, Hanley, & Hounsell, 1979; C. Smith & Whiteley, 2002; Trigwell, Prosser, & Waterhouse, 1999), but social-economic ones as well, as was
Chapter 6
111
demonstrated in the extensive literature study by Ben Youssef and Dahmani (2010) who showed that students’ socio-economic characteristics like age, gender, family structure, level of parents’ education et cetera have a significant influence on the students’ performance and their ability to benefit from the availability of ICT during their academic career. These characteristics may have been influential in the choice of a student for the TI interface, although de Boer, Kommers, and de Brock (2011) found no strong correlations between (preferred) viewing styles and personal traits like learning styles and short-term memory.
We are not able to determine if the tags helped the better students to perform even better, or that it helped weaker students pass the course where they otherwise would have failed. In a more process oriented perspective, the results found can be seen as consistent with results reported by Bligh (1998, pp. 129-147) who showed that note taking aids students in their learning process, and that it leads to higher achievement (Kiewra, 1989). Like the notes, the tags provide students with a structured study aid while preparing for the exam. Further research along these lines is needed.
This study used expert tagging. It did not research whether the wording of the tags was optimal for students. It may be possible that the students prefer a different vocabulary or would place tags at different time locations within the recorded lecture. For example to link the tags more directly to the notes they create. Further research needs to determine whether the creation of tags by students does indeed improve the speed with which students find the parts of the recorded lectures that they want to review.
Does tagging improve the navigation of recorded lectures by students?
112
This page has been intentionally left blank
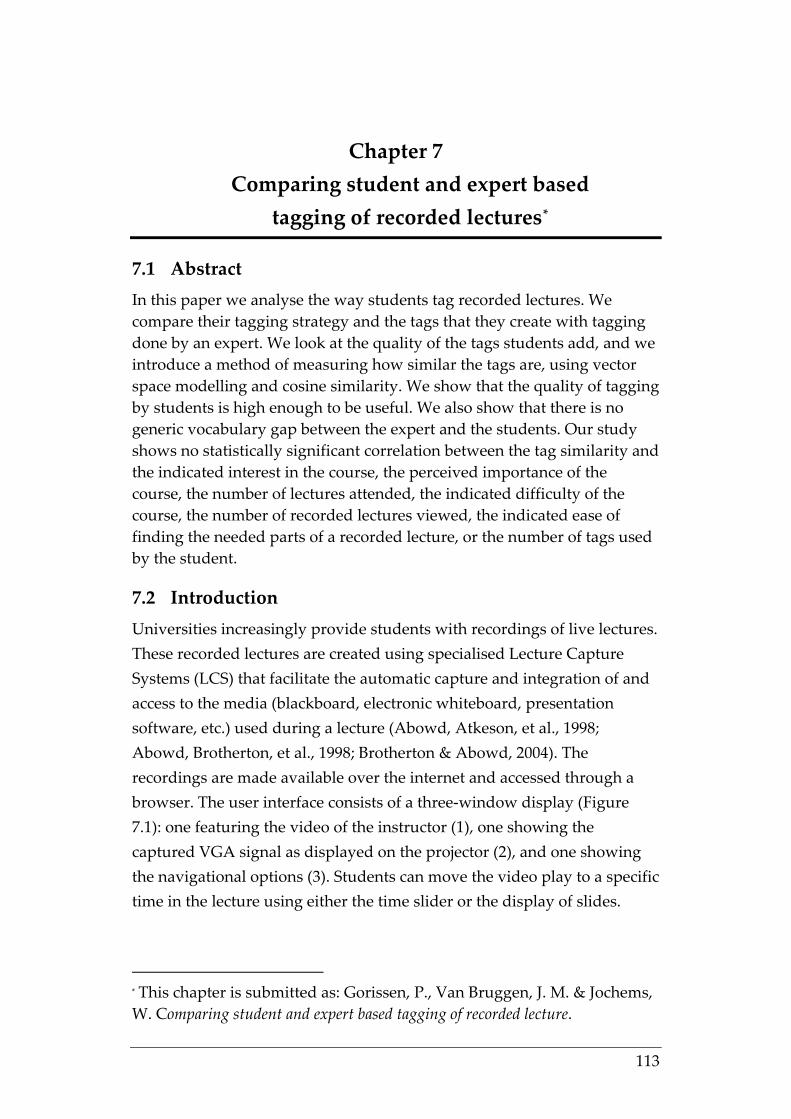
113
Chapter 7 Comparing student and expert based
tagging of recorded lectures*
7.1 Abstract In this paper we analyse the way students tag recorded lectures. We compare their tagging strategy and the tags that they create with tagging done by an expert. We look at the quality of the tags students add, and we introduce a method of measuring how similar the tags are, using vector space modelling and cosine similarity. We show that the quality of tagging by students is high enough to be useful. We also show that there is no generic vocabulary gap between the expert and the students. Our study shows no statistically significant correlation between the tag similarity and the indicated interest in the course, the perceived importance of the course, the number of lectures attended, the indicated difficulty of the course, the number of recorded lectures viewed, the indicated ease of finding the needed parts of a recorded lecture, or the number of tags used by the student.
7.2 Introduction Universities increasingly provide students with recordings of live lectures. These recorded lectures are created using specialised Lecture Capture Systems (LCS) that facilitate the automatic capture and integration of and access to the media (blackboard, electronic whiteboard, presentation software, etc.) used during a lecture (Abowd, Atkeson, et al., 1998; Abowd, Brotherton, et al., 1998; Brotherton & Abowd, 2004). The recordings are made available over the internet and accessed through a browser. The user interface consists of a three-window display (Figure 7.1): one featuring the video of the instructor (1), one showing the captured VGA signal as displayed on the projector (2), and one showing the navigational options (3). Students can move the video play to a specific time in the lecture using either the time slider or the display of slides.
* This chapter is submitted as: Gorissen, P., Van Bruggen, J. M. & Jochems, W. Comparing student and expert based tagging of recorded lecture.
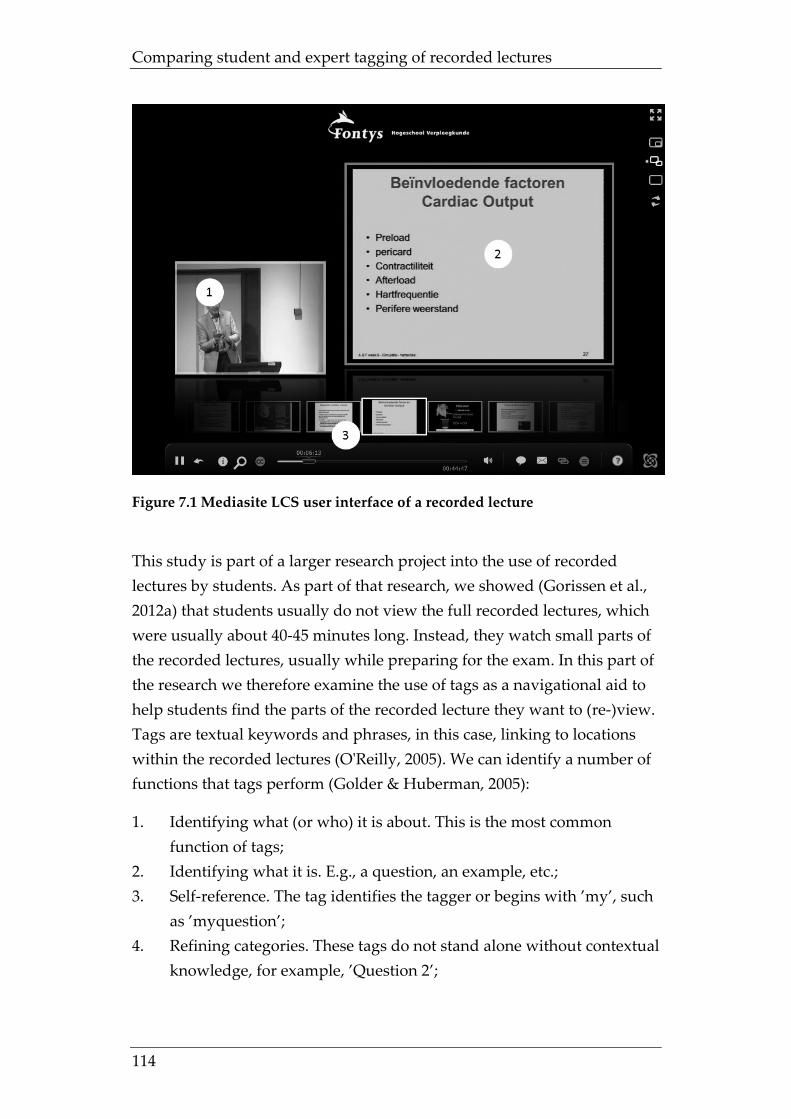
Comparing student and expert tagging of recorded lectures
114
Figure 7.1 Mediasite LCS user interface of a recorded lecture
This study is part of a larger research project into the use of recorded lectures by students. As part of that research, we showed (Gorissen et al., 2012a) that students usually do not view the full recorded lectures, which were usually about 40-45 minutes long. Instead, they watch small parts of the recorded lectures, usually while preparing for the exam. In this part of the research we therefore examine the use of tags as a navigational aid to help students find the parts of the recorded lecture they want to (re-)view. Tags are textual keywords and phrases, in this case, linking to locations within the recorded lectures (O'Reilly, 2005). We can identify a number of functions that tags perform (Golder & Huberman, 2005):
1. Identifying what (or who) it is about. This is the most common function of tags;
2. Identifying what it is. E.g., a question, an example, etc.; 3. Self-reference. The tag identifies the tagger or begins with ’my’, such
as ’myquestion’; 4. Refining categories. These tags do not stand alone without contextual
knowledge, for example, ’Question 2’;
Chapter 7
115
5. Identifying qualities or characteristics of the resource. For example, funny, stupid, difficult;
6. Task organizing. These tags relate to performing a task, for example, ’toread’.
In an earlier experiment (see Chapter 6), we provided all students with the same set of tags, constructed by an expert who worked according to a predefined tagging protocol based on the structure of the lecture, signals by the lecturer (Exley & Dennick, 2004), and signals provided by the slides (see Appendix 1). The experiment showed an increase in the active use of tags by students during the course. It showed that the tags helped them watch the recorded lectures more efficiently. Also, the tags had a positive influence, albeit small, on the predicted grade for the course. During this first experiment, all students were provided with the same set of tags, added by the expert. The experiment, however, did not test whether the wording of the tags, the location of the tags, or the topics covered by the tags were optimal for the students.
Tagging is a reflective practice that can give students an opportunity to summarise new ideas (Bateman et al., 2007) in a way similar to that in which note taking aids their learning process (Bligh, 1998, pp. 129-147). In this paper, we report on a second experiment, where we provide students with short clips of recorded lectures and asked them to add tags. This study does not focus on the effects of the tags the students added, but focusses on the process of tagging itself. We want to answer the following research questions:
• What tagging strategy do students use when they tag recorded lectures?
• Is tagging by students a useful addition to expert tagging?
To analyse the tagging strategy students use, we want to determine what signals students use to decide on the location and the contents of the tag. To answer the question whether student tagging is a useful addition to expert tagging, we compare the tags the students added with the tags added by the expert using the predefined tagging protocol. If the tags added by the expert and the students are very similar, then it does not have much added value for both to add tags. If there is a low similarity between the tags added by the expert and the tags added by the students,
Comparing student and expert tagging of recorded lectures
116
there could be a number of explanations. For instance, it could mean students and expert use different words to describe the tags (use a different vocabulary), or they may be triggered by different things while tagging (different tagging strategy). It could also mean that they add a different number of tags (more tags or less tags), or that some students have problems understanding the videos and tag them differently or incorrectly. We will approach this question by first analyzing the degree of similarity present and then by looking at possible explanations.
7.3 Method For our study, we used a set of 10 video clips, each about 15 minutes long, taken from a set of five lectures for the course Anatomy & Physiology, part of the School of Nursing at Fontys University of Applied Sciences in the Netherlands. The recordings were made during the time period September 2011 – February 2012. Each recording originally was about 40-45 minutes long and was available to all students who participated in the course. We approached students who had already participated in the course by mail and asked them to participate in the experiment. A total of 24 students agreed to participate. All students were randomly assigned a set of three clips from the total set of 10. Each student received a personalised e-mail with a unique link that provided them access to the online environment created for the experiment. In both the invitation e-mail and the online environment, students were presented with the following instructions:
• The goal of this experiment is to research how students add tags to recorded lectures;
• You will be presented with 3 video clips, each about 15 minutes long, taken from the course Anatomy & Physiology;
• Assign tags to these clips so that they become more useful for other students who are going to participate in this course. So you are not tagging (just) for personal use;
• After completing the tagging experiment, you will be asked to describe how you tagged the video clips.
Figure 7.2 shows the interface (in Dutch) of the online environment presented to the students. Just like in the regular interface, in which the students had been able to review the full recorded lectures, the online
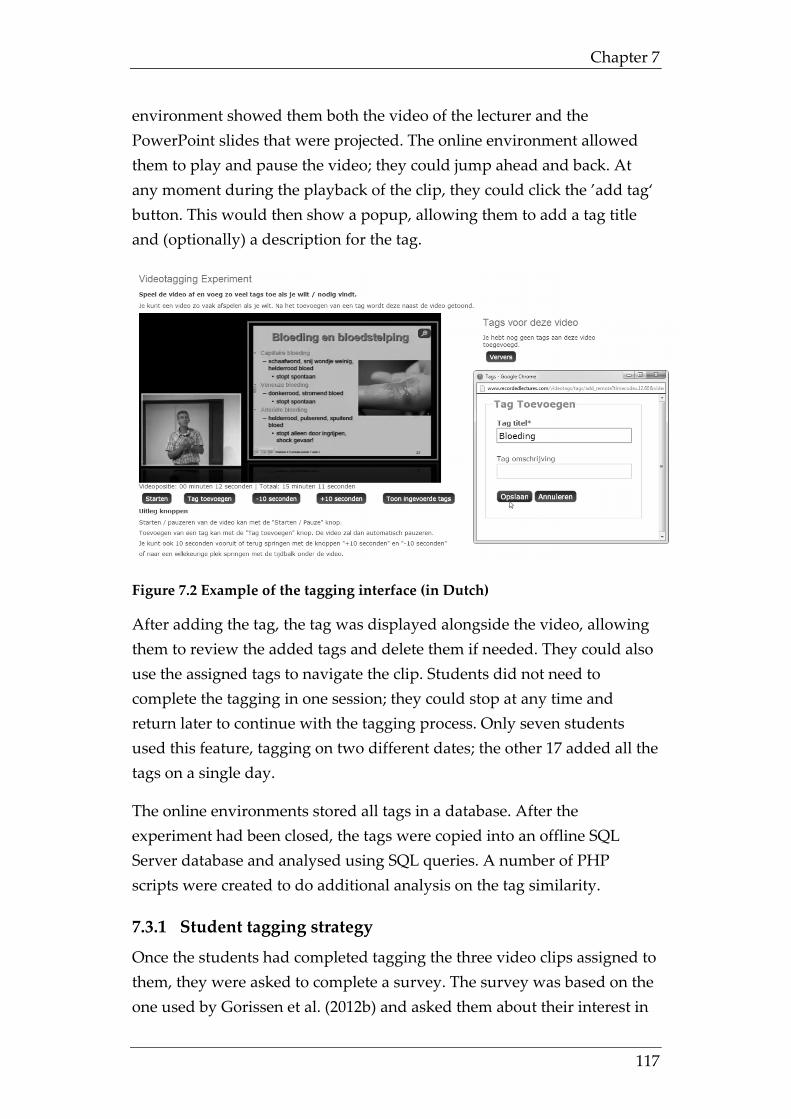
Chapter 7
117
environment showed them both the video of the lecturer and the PowerPoint slides that were projected. The online environment allowed them to play and pause the video; they could jump ahead and back. At any moment during the playback of the clip, they could click the ’add tag‘ button. This would then show a popup, allowing them to add a tag title and (optionally) a description for the tag.
Figure 7.2 Example of the tagging interface (in Dutch)
After adding the tag, the tag was displayed alongside the video, allowing them to review the added tags and delete them if needed. They could also use the assigned tags to navigate the clip. Students did not need to complete the tagging in one session; they could stop at any time and return later to continue with the tagging process. Only seven students used this feature, tagging on two different dates; the other 17 added all the tags on a single day.
The online environments stored all tags in a database. After the experiment had been closed, the tags were copied into an offline SQL Server database and analysed using SQL queries. A number of PHP scripts were created to do additional analysis on the tag similarity.
7.3.1 Student tagging strategy
Once the students had completed tagging the three video clips assigned to them, they were asked to complete a survey. The survey was based on the one used by Gorissen et al. (2012b) and asked them about their interest in
Comparing student and expert tagging of recorded lectures
118
the topic of the course, whether they thought the course was an important part of their study, how difficult they thought the course was, whether they had used the recorded lectures for the course often, and whether it was their first experience with a course that recorded lectures. It also included questions about their opinion of the quality of the audio and video of the recorded lectures, whether the recorded lectures were easy to find online, whether they were available online fast enough, whether it was easy to find the part of the recorded lecture that they want to (re-)view, and whether they thought the recorded lectures helped them to succeed in the course.
The survey concluded with an open answer question asking them to describe how they tagged the video clips, describe when they add a tag, how they decide the name of the tag, and what specific other things they pay attention to while tagging. The text of the provided tagging strategies has been analysed to separate the description into answers to the individual questions.
7.3.2 Student tagging versus expert tagging
To analyse whether tagging by students is a useful addition to expert tagging, we developed two main questions:
1. Are the tags students add of sufficient quality? 2. Do students and the expert add different tags, and if so, what can
explain this difference?
We will use the criteria provided by Guy and Tonkin (2006) to examine whether the tags added by the student are of sufficient quality. They provide a number of examples of tags of bad quality:
• Misspelled tags; • Badly encoded tags, such as unlikely compound word groupings; • Tags that do not follow convention in issues such as case and
number (singular versus plural form); • Personal tags that are without meaning to the wider community; • Single-use tags that appear only once in the database.
Guy and Tonkin (2006) opine that most users don’t give much thought to the way they add tags, suggesting that the tags added by students who
Chapter 7
119
did not receive training in tagging or a predefined tagging protocol would be of low quality.
To answer the second question, we will calculate the similarity between the tags students attached to the clips and the tags added by the expert. We used a method from the information retrieval and natural language processing domain (Manning & Schütze, 1999). The foundation of this method is that the tags are translated into vectors. This translation results in a vector space where the tags are the axes of the space and the students and expert data who added the tags are the points or vectors in this space. This space is very high dimensional: the 25 vectors each have a single dimension for each tag, although most of the entries within those dimensions are zero, indicating that a tag was not used by a student. By calculating the cosine similarity of the vectors, we can calculate a measure for the similarity of the set of tags students attached to the clips.
In Appendix 2 we include an example, using one video clip, four students and five tags, to explain the steps taken to create the vectors during the analysis. In our experiment, we used 10 video clips. Each student added tags to three of those clips, meaning that we had to create similarity matrices for each of the 10 individual video clips first, with just the students who added tags for that video, and then combine them into one overall similarity score table.
Using the full multi-word tags when calculating the similarity has the disadvantage that it is very strict. Tags like ’function of the kidney’, ’functions of the kidney’, and ’kidney functions‘ are all treated as different (not similar) tags, while they obviously have identical meaning to our students. To work around this problem, we converted all multi-word tags into lower case and then split them into individual words. This collection of words was then cleaned to eliminate words and characters that were not suitable as tags. All punctuation marks like ‘ “ ? ! . # ( ) [ ] were removed and characters like = / ; : were replaced with a single space. The tags were then compared against a stop word list removing common words like de (the), een (a), van (from), etc. After that, a process called stemming (Kraaij & Pohlmann, 1994; Porter, 1997) was used to further condense the number of tags. Stemming is the process of reducing words to their stem, or root, form. The resulting root does not have to be identical
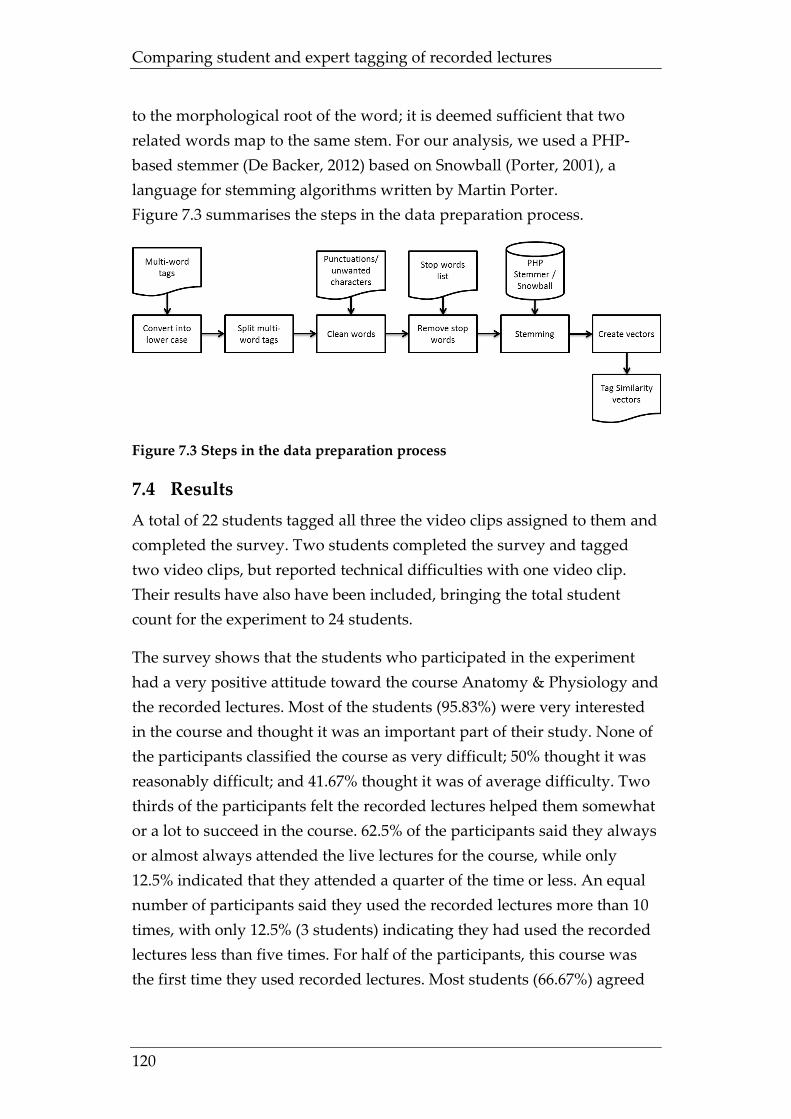
Comparing student and expert tagging of recorded lectures
120
to the morphological root of the word; it is deemed sufficient that two related words map to the same stem. For our analysis, we used a PHP-based stemmer (De Backer, 2012) based on Snowball (Porter, 2001), a language for stemming algorithms written by Martin Porter. Figure 7.3 summarises the steps in the data preparation process.
Figure 7.3 Steps in the data preparation process
7.4 Results A total of 22 students tagged all three the video clips assigned to them and completed the survey. Two students completed the survey and tagged two video clips, but reported technical difficulties with one video clip. Their results have also have been included, bringing the total student count for the experiment to 24 students.
The survey shows that the students who participated in the experiment had a very positive attitude toward the course Anatomy & Physiology and the recorded lectures. Most of the students (95.83%) were very interested in the course and thought it was an important part of their study. None of the participants classified the course as very difficult; 50% thought it was reasonably difficult; and 41.67% thought it was of average difficulty. Two thirds of the participants felt the recorded lectures helped them somewhat or a lot to succeed in the course. 62.5% of the participants said they always or almost always attended the live lectures for the course, while only 12.5% indicated that they attended a quarter of the time or less. An equal number of participants said they used the recorded lectures more than 10 times, with only 12.5% (3 students) indicating they had used the recorded lectures less than five times. For half of the participants, this course was the first time they used recorded lectures. Most students (66.67%) agreed
Chapter 7
121
the recorded lectures were easy to find; however, only 29.17% thought the same about the individual parts of a recorded lecture.
Students were critical about the speed with which the recorded lectures became available online: 45.83% agreed they were on time, 37.5% were neutral, and 16.67% thought they were not made available online in a timely manner. The same number of students though the quality of the audio and video of the recorded lectures could be improved.
7.4.1 Student tagging strategy
We asked the students to describe their tagging strategy in their own words. This is an example of one of the longer strategy descriptions:
I have just started watching the videos and listened to what was being said. I also use the slides that are being shown. When a new topic is started of which I think it is new, or something that is important for me because it is more difficult to me, then [I] create a tag. Of course it helps that I have already taken the course, so I know a little which topics are being covered.
But, usually I have not only taken the topic as the tag title, but also the title of the slide, and then I have used the tag description option to add some additional important keywords or used it to give a short summary of what was being explained and what the principle was about. I create the tag as soon as the topic starts, so a tag can cover up to three slides, while sometimes a tag can also be about a single slide.
Other strategy descriptions were much briefer:
I have placed tags at points where the topic changed or when the slide changed. For the tag name I usually used the slide name. Simple and clear enough for myself.
The introduction of a new topic was mentioned most often by students as a reason to create a tag, followed by (important) keywords. Some students indicated that the length of the topic determined whether they would add additional tags for sub topics. The third most often mentioned trigger for a new tag was a slide change. None of the students explicitly mentioned actions by the lecturer as a trigger to add a new tag. Interestingly, neither did they mention the importance of a topic for the test as a criterion for a tag.
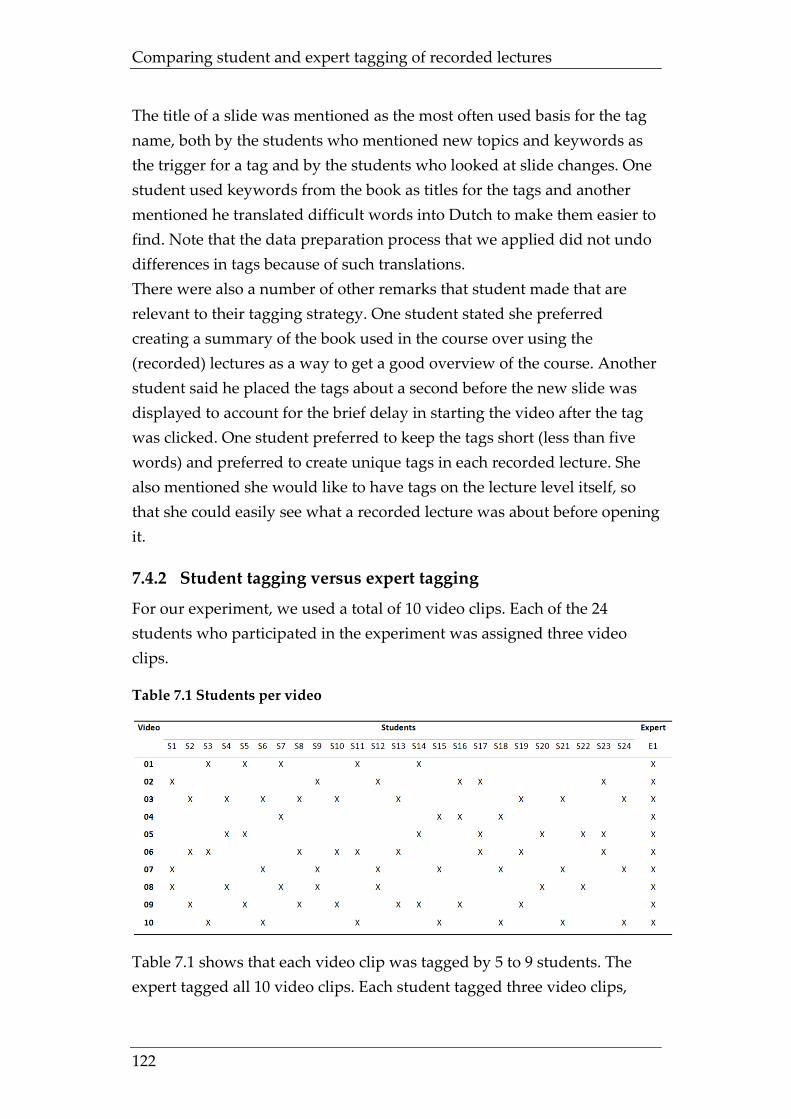
Comparing student and expert tagging of recorded lectures
122
The title of a slide was mentioned as the most often used basis for the tag name, both by the students who mentioned new topics and keywords as the trigger for a tag and by the students who looked at slide changes. One student used keywords from the book as titles for the tags and another mentioned he translated difficult words into Dutch to make them easier to find. Note that the data preparation process that we applied did not undo differences in tags because of such translations. There were also a number of other remarks that student made that are relevant to their tagging strategy. One student stated she preferred creating a summary of the book used in the course over using the (recorded) lectures as a way to get a good overview of the course. Another student said he placed the tags about a second before the new slide was displayed to account for the brief delay in starting the video after the tag was clicked. One student preferred to keep the tags short (less than five words) and preferred to create unique tags in each recorded lecture. She also mentioned she would like to have tags on the lecture level itself, so that she could easily see what a recorded lecture was about before opening it.
7.4.2 Student tagging versus expert tagging
For our experiment, we used a total of 10 video clips. Each of the 24 students who participated in the experiment was assigned three video clips.
Table 7.1 Students per video
Table 7.1 shows that each video clip was tagged by 5 to 9 students. The expert tagged all 10 video clips. Each student tagged three video clips,
Chapter 7
123
with the exception of students 20 and 22, who reported technical problems with one of the clips assigned to them. They only tagged 2 videos each.
Students added a total of 481 tags to the 10 video clips; on average, they added about 20 tags per student in total (SD = 10.4), or seven tags per student per video clip (SD = 3.1). The expert added 101 tags, an average of 10 tags per video clip. The average length of a student tag was 17.6 characters (Max = 69 char., Min = 3 char., SD = 9.65). A tag could be multi-word and the maximum number of words in a tag was 13; however, the average number of words in a tag was 2.2 (SD = 1.6), with 122 tags (25.36%) having more than two words and 203 using single word tags (42.20%). Using the Stemming script, the 582 multi-word tags were translated into 725 single-stemmed word tags. This increase in number of tags is due to the fact that one multi-word tag can lead to multiple single-stemmed word tags.
If we compare the tags added by the students with the six functions identified by Golder and Huberman (2005) , we see that most of the tags added identify subject matter/topic (function #1). We did find some tags (like ’summary’, ’repetition of questions’, ’quiz‘) that simply identify what it was (function #2), and we also found a number of tags (like ’question 1’, ’question 2’, ’osmosis II’, ’osmosis III’, etc.) that only have meaning within the context of the specific recorded lecture (function #4). We did not find any tags that identify the tagger or used any form of self-reference (function #3), nor did we find any tags that identified qualities or characteristics of the resource (function #5). Only one tag related to performing a task (function #6), or actually, more to not performing a task: ’not important to learn’. That particular tag could also be considered as being a characteristic of the resource (function #6).
In our tag set, we found a small number (five in total) of misspelled tags, like ’humoral immunity’, instead of ’humeral immunity’. Compound word grouping was not a problem, because the students could use multi-word tags. There were, however, some small differences between the multi-word tags. For example, there were tags labelled ’function of cells’, as well as tags labelled ’functions of the cells’. Guy and Tonkin (2006) consider this a quality problem, because in a traditional system where the tags are used as entered, this example would count as separate tags, even
Comparing student and expert tagging of recorded lectures
124
though they have the same meaning. Tagging systems that use Stemming combined with a list word list however do not have this problem because they would store both ’function of cells‘ and ’functions of the cells‘ as ’function‘ and ’cell‘, removing the difference in plurality and the words ’of‘ and ’the‘ from the index.
A final quality criterion mentioned by Guy and Tonkin (2006) is the existance of tags that are only used once. Almost half of the multi-word tags (47%, N=582) were only used once; for the Stemmed tags, this constituted 20% (N=725). Golder and Huberman (2006) showed that only after about 100 users, a stable system of tags is formed. Given the small number of students who tagged the clips, a higher number of single-use tags is expected.
The second question we posed for this research project was whether the additional tags added by students have enough added value when compared to the tags added by the expert. We answer this question by comparing the similarity between the tags added by students and the tags added by the expert. We first translated the tags into vectors (Manning & Schütze, 1999) using the steps described in the method section and in Appendix 2. This resulted in 10 similarity matrices, one for each clip, plus an aggregated similarity matrix for all clips combined. We cannot include all resulting 10 matrices in this paper but will list two examples that show how different the results can be.
Table 7.2 shows the similarity matrix for video 1 for the five students who added tags (S3, S5, S7, S11, S14) and the expert (E1). It is clear there are a number of students who do not have any similarity with either one or more of the other students and/or the expert (the value is 0).
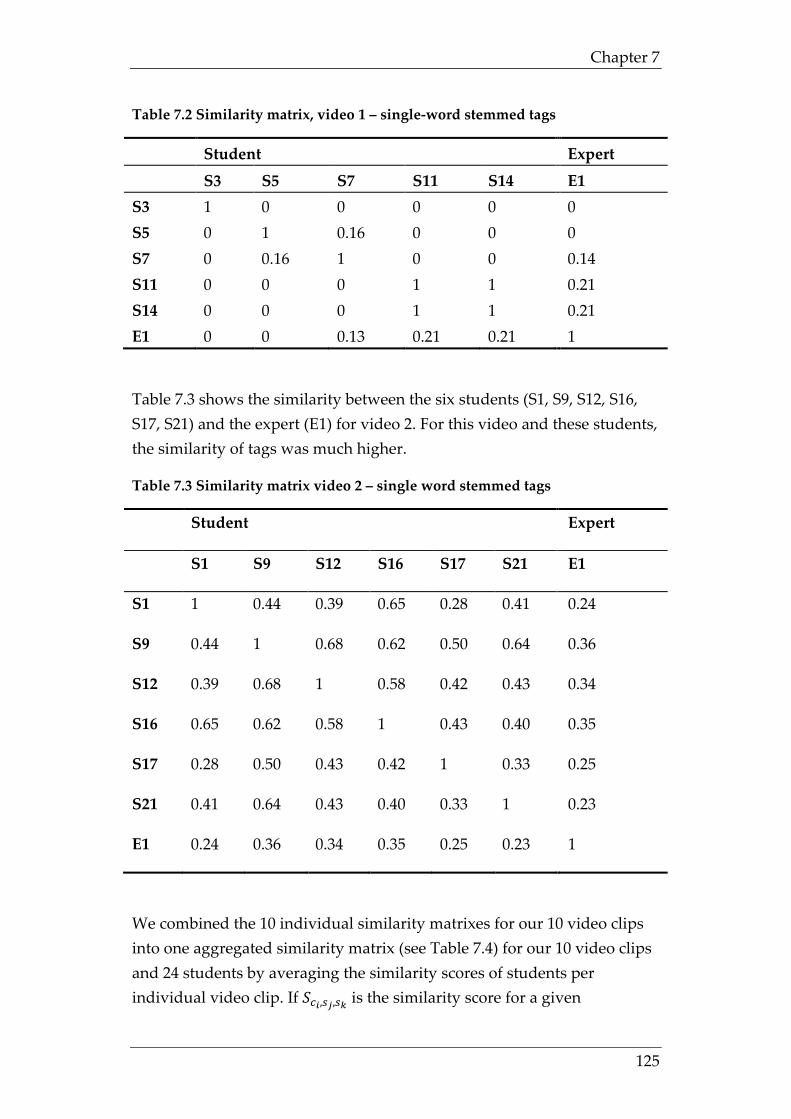
Chapter 7
125
Table 7.2 Similarity matrix, video 1 – single-word stemmed tags
Student Expert S3 S5 S7 S11 S14 E1 S3 1 0 0 0 0 0 S5 0 1 0.16 0 0 0 S7 0 0.16 1 0 0 0.14 S11 0 0 0 1 1 0.21 S14 0 0 0 1 1 0.21 E1 0 0 0.13 0.21 0.21 1
Table 7.3 shows the similarity between the six students (S1, S9, S12, S16, S17, S21) and the expert (E1) for video 2. For this video and these students, the similarity of tags was much higher.
Table 7.3 Similarity matrix video 2 – single word stemmed tags
Student Expert
S1 S9 S12 S16 S17 S21 E1
S1 1 0.44 0.39 0.65 0.28 0.41 0.24
S9 0.44 1 0.68 0.62 0.50 0.64 0.36
S12 0.39 0.68 1 0.58 0.42 0.43 0.34
S16 0.65 0.62 0.58 1 0.43 0.40 0.35
S17 0.28 0.50 0.43 0.42 1 0.33 0.25
S21 0.41 0.64 0.43 0.40 0.33 1 0.23
E1 0.24 0.36 0.34 0.35 0.25 0.23 1
We combined the 10 individual similarity matrixes for our 10 video clips into one aggregated similarity matrix (see Table 7.4) for our 10 video clips and 24 students by averaging the similarity scores of students per individual video clip. If 𝑆𝑐𝑖,𝑠𝑗,𝑠𝑘 is the similarity score for a given
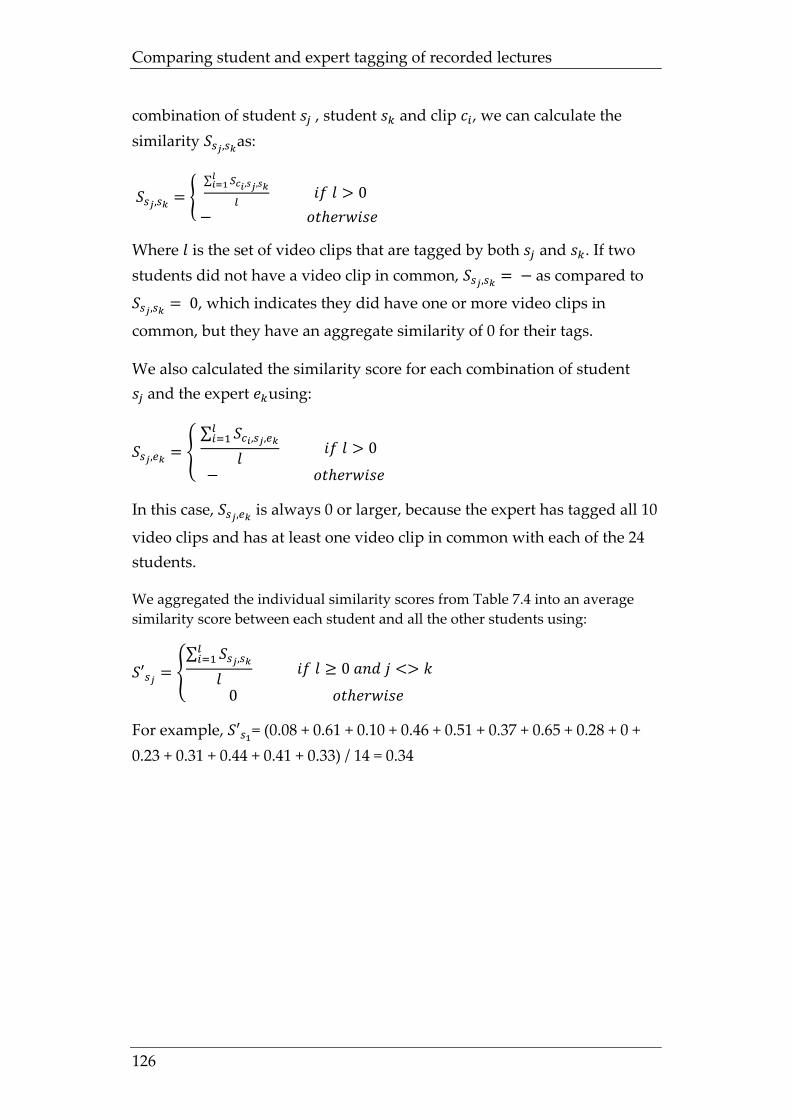
Comparing student and expert tagging of recorded lectures
126
combination of student 𝑠𝑗 , student 𝑠𝑘 and clip 𝑐𝑖, we can calculate the similarity 𝑆𝑠𝑗,𝑠𝑘as:
𝑆𝑠𝑗,𝑠𝑘 = �∑ 𝑆𝑐𝑖,𝑠𝑗,𝑠𝑘𝑙𝑖=1
𝑙 𝑖𝑓 𝑙 > 0
− 𝑜𝑡ℎ𝑒𝑟𝑤𝑖𝑠𝑒
Where 𝑙 is the set of video clips that are tagged by both 𝑠𝑗 and 𝑠𝑘. If two students did not have a video clip in common, 𝑆𝑠𝑗,𝑠𝑘 = − as compared to
𝑆𝑠𝑗,𝑠𝑘 = 0, which indicates they did have one or more video clips in
common, but they have an aggregate similarity of 0 for their tags.
We also calculated the similarity score for each combination of student 𝑠𝑗 and the expert 𝑒𝑘using:
𝑆𝑠𝑗,𝑒𝑘 = �∑ 𝑆𝑐𝑖,𝑠𝑗,𝑒𝑘𝑙𝑖=1
𝑙 𝑖𝑓 𝑙 > 0
− 𝑜𝑡ℎ𝑒𝑟𝑤𝑖𝑠𝑒
In this case, 𝑆𝑠𝑗,𝑒𝑘 is always 0 or larger, because the expert has tagged all 10
video clips and has at least one video clip in common with each of the 24 students.
We aggregated the individual similarity scores from Table 7.4 into an average similarity score between each student and all the other students using:
𝑆′𝑠𝑗 = �∑ 𝑆𝑠𝑗,𝑠𝑘𝑙𝑖=1
𝑙 𝑖𝑓 𝑙 ≥ 0 𝑎𝑛𝑑 𝑗 <> 𝑘
0 𝑜𝑡ℎ𝑒𝑟𝑤𝑖𝑠𝑒
For example, 𝑆′𝑠1= (0.08 + 0.61 + 0.10 + 0.46 + 0.51 + 0.37 + 0.65 + 0.28 + 0 + 0.23 + 0.31 + 0.44 + 0.41 + 0.33) / 14 = 0.34
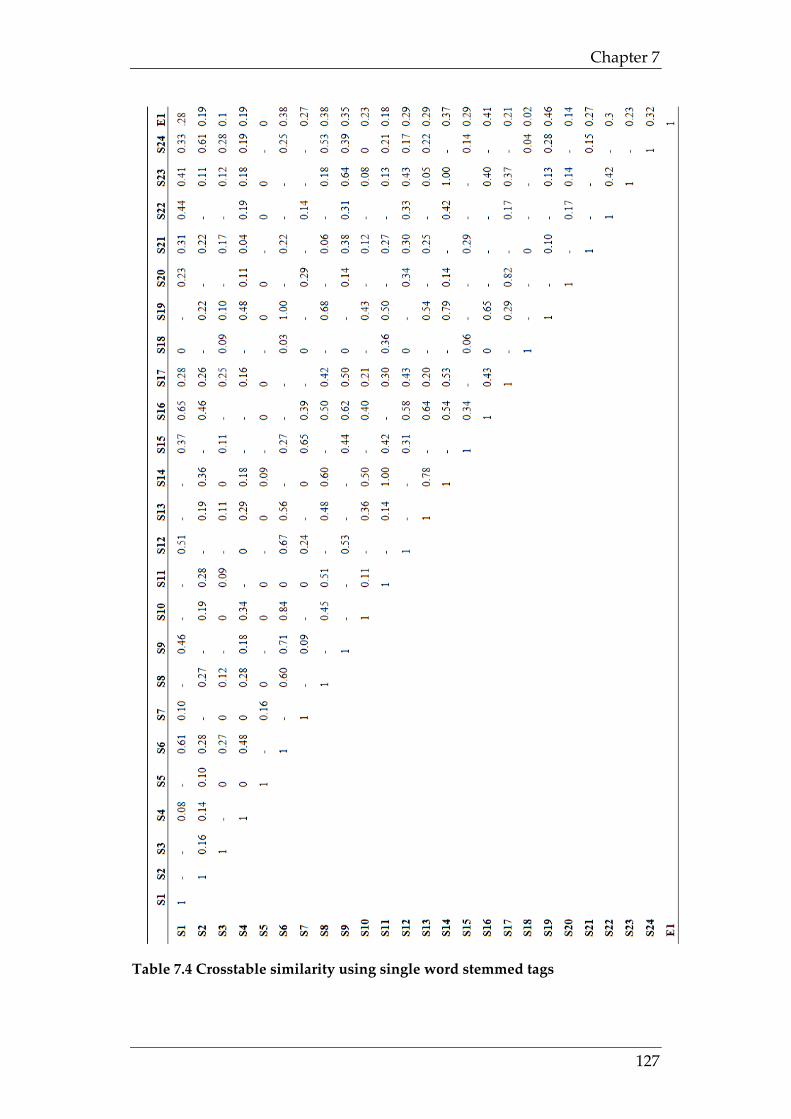
Chapter 7
127
Table 7.4 Crosstable similarity using single word stemmed tags
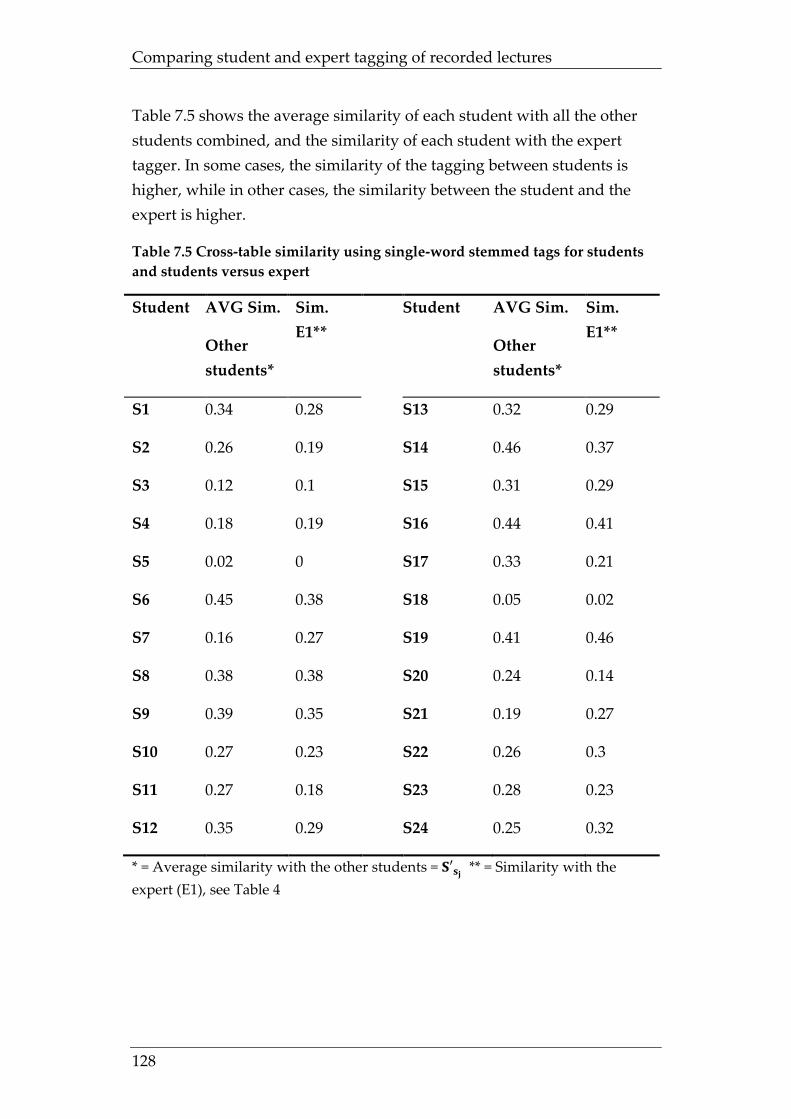
Comparing student and expert tagging of recorded lectures
128
Table 7.5 shows the average similarity of each student with all the other students combined, and the similarity of each student with the expert tagger. In some cases, the similarity of the tagging between students is higher, while in other cases, the similarity between the student and the expert is higher.
Table 7.5 Cross-table similarity using single-word stemmed tags for students and students versus expert
Student AVG Sim.
Other students*
Sim. E1**
Student AVG Sim.
Other students*
Sim. E1**
S1 0.34 0.28 S13 0.32 0.29
S2 0.26 0.19 S14 0.46 0.37
S3 0.12 0.1 S15 0.31 0.29
S4 0.18 0.19 S16 0.44 0.41
S5 0.02 0 S17 0.33 0.21
S6 0.45 0.38 S18 0.05 0.02
S7 0.16 0.27 S19 0.41 0.46
S8 0.38 0.38 S20 0.24 0.14
S9 0.39 0.35 S21 0.19 0.27
S10 0.27 0.23 S22 0.26 0.3
S11 0.27 0.18 S23 0.28 0.23
S12 0.35 0.29 S24 0.25 0.32
* = Average similarity with the other students = 𝐒′𝐬𝐣 ** = Similarity with the expert (E1), see Table 4
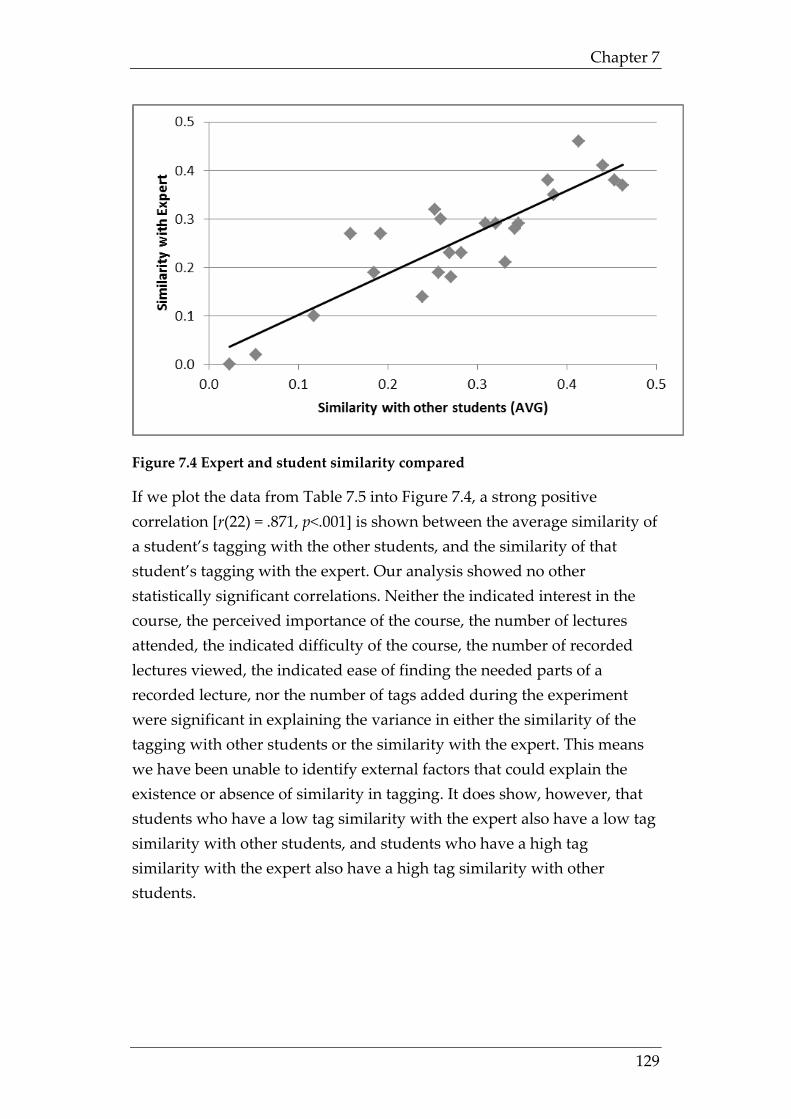
Chapter 7
129
Figure 7.4 Expert and student similarity compared
If we plot the data from Table 7.5 into Figure 7.4, a strong positive correlation [r(22) = .871, p<.001] is shown between the average similarity of a student’s tagging with the other students, and the similarity of that student’s tagging with the expert. Our analysis showed no other statistically significant correlations. Neither the indicated interest in the course, the perceived importance of the course, the number of lectures attended, the indicated difficulty of the course, the number of recorded lectures viewed, the indicated ease of finding the needed parts of a recorded lecture, nor the number of tags added during the experiment were significant in explaining the variance in either the similarity of the tagging with other students or the similarity with the expert. This means we have been unable to identify external factors that could explain the existence or absence of similarity in tagging. It does show, however, that students who have a low tag similarity with the expert also have a low tag similarity with other students, and students who have a high tag similarity with the expert also have a high tag similarity with other students.
Comparing student and expert tagging of recorded lectures
130
7.5 Conclusions and discussion Despite their lack of training in tagging, the tags added by the students did not show the lack of quality expected based on Guy and Tonkin (2006). Unlike the tagging experiment conducted by Verburg (2010), we did not encounter any non-relevant tags. The descriptions of the tagging protocols by the students shows that, although they do not appear to follow the same tagging protocol as the expert, they use a relatively structured approach. Giving them additional instructions on how to best tag the recorded lectures could further improve their tagging behaviour.
Lecturers should be aware of the importance of their slides during a recorded lecture. Titles on slides were indicated by students as possible tag titles. The tagging process can be supported and guided by using clear, structured slides with titles that are short and to the point. This can increase the tag similarity between the students, and the lecturer can use this to increase the occurrence of certain important tags at key parts of the lecture. This can then increase the efficiency with which students find certain parts of the recorded lecture.
Our study shows that student tagging has added value when compared to just expert tagging. The similarity between the tags students add and the tags an expert adds differs between students and between clips, and it is small enough to warrant the additional effort needed for the combination of both expert and student tagging.
We do not yet have an explanation for a higher or lower similarity score. Our analysis showed no statistically significant correlations between the similarity score and the indicated interest in the course, the perceived importance of the course, the number of lectures attended, the indicated difficulty of the course, the number of recorded lectures viewed, the indicated ease of finding the needed parts of a recorded lecture, or the number of tags added during the experiment. The study does not show a generic difference in vocabulary used by the students when compared to the expert. Students who use different tags than the expert also have a small tag similarity when compared to other students, and vice versa.
A low similarity score does not mean the quality of the tags added by a student is low. It only means the student creates tags that are less
Chapter 7
131
common. A low tag similarity score between two students simply indicates their tags are less useful to teach other. But it can also mean that those tags are a useful addition to the tags a student has already placed himself.
We must take into account that the students who tagged the video clips had already participated in the Anatomy & Physiology course from which the video clips were taken. Their knowledge of the structure and contents of the full course may have increased the quality of their tags. In the next phase of this research, we will have students who have not yet taken the Anatomy & Physiology tag the video clips so we can compare their results with this group of students. We also plan to have students rate the tags added by other students for usefulness. This would give us a better understanding of the relationship between tag similarity and usefulness of the tags. This experiment will be conducted using full-length recorded lectures in a live situation so that students can not only add and rate tags, but also use them to navigate the recorded lectures. This will increase the test group from the small sample we used in this study to a larger group.
In this paper, we used cosine similarity as a method to calculate the tag similarity. This is not the only possible method for accomplishing this type of analysis. Markines et al. (2009) compared a number of similarity measures and concluded that the mutual information method worked best when retrieving documents based on tags. In their case, however, the user (the student) had a free choice of the resources being tagged. Within those resources, the user again had a free choice for tags. This means not only the tags chosen by the user have meaning, but also the resource chosen (Srinivas, Tandon, & Varma, 2010). However, in our study, the resources were assigned to participating students, even though the student had a choice as to where within that video a tag is placed. Cosine similarity does not imply such free choice and makes it easier to translate the usual comparison of similarity of documents into a comparison of the similarity of students. This would still be true if we take into account the time codes for the tags.
Comparing student and expert tagging of recorded lectures
132
Appendix 1 Tagging protocol To determine where to place the tags, we used signals, or signposts, provided by the structure of the lecture. Exley and Dennick (2004) describe a number of possible lecture structures a lecturer can choose from. They distinguish a number of different types of statements a lecturer can use to inform students about the lecture organization: signposts, frames, foci, and links. Besides these statements by the lecturer, the structure of the slides also provides a signal for the lecture organization. The slides contain titles, lists of important topics, schemas with the structure of the topics, etc. Based on these signals, we created the following tagging protocol for our experiments:
1. Examine the lecture structure (see Table 7.6). This gives an indication of the sort of possible tag indicators that signal useful tags.
2. Playback the recorded lecture, and while playing, listen to oral signals by the lecturer that indicate signposts, frames, foci, or links.
3. Mark potential tags. Pause the recording, write down the time code along with potential tag title and a short description of the tag.
4. After completion of the tagging process, the tags, descriptions, and time codes were added to the tagged player system.
5. Always add a tag at 00:00:00, indicating the beginning of the recording. This gives the student an easy way to return to the beginning of the recording.
Table 7.6 Lecture structures
Description Possible tag indicators
Classical Lecture is series of related entities, describing their features or properties.
Start of new entity
Sequential Lecturer goes through a simple sequence of related sub-topics that underpin the main topic and form a logical and coherent narrative with a specific conclusion.
Start of new sub-topic
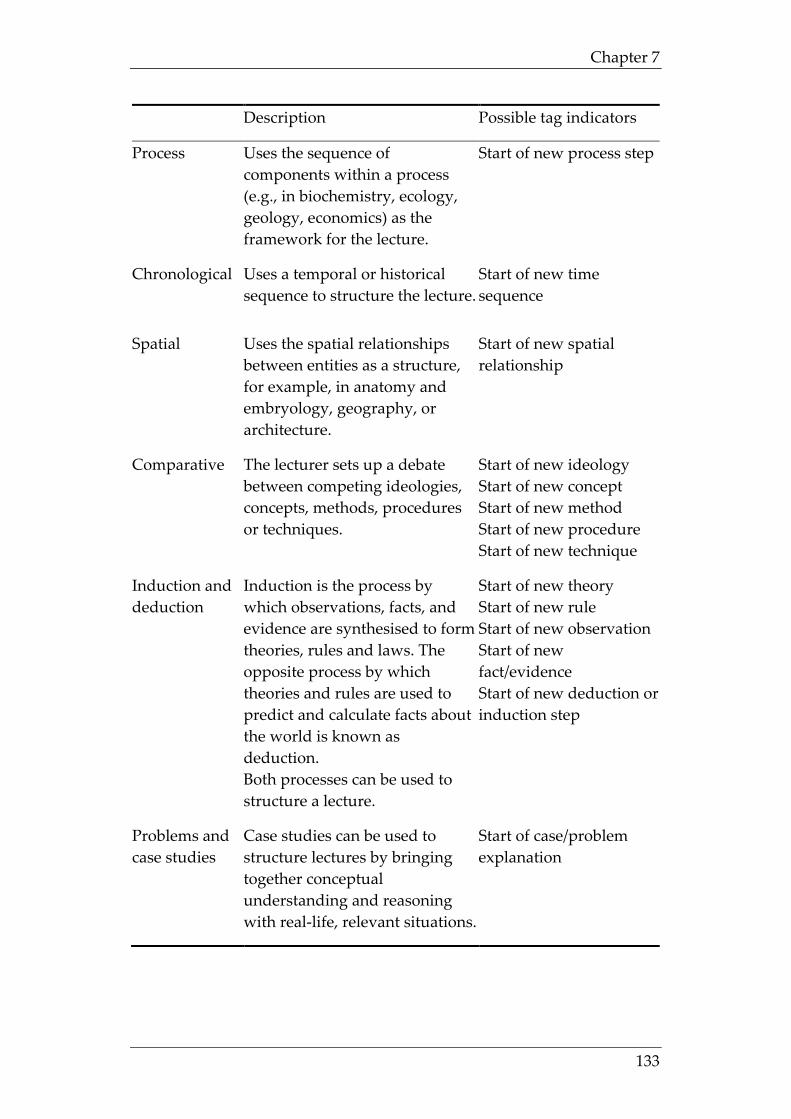
Chapter 7
133
Description Possible tag indicators
Process
Uses the sequence of components within a process (e.g., in biochemistry, ecology, geology, economics) as the framework for the lecture.
Start of new process step
Chronological
Uses a temporal or historical sequence to structure the lecture.
Start of new time sequence
Spatial
Uses the spatial relationships between entities as a structure, for example, in anatomy and embryology, geography, or architecture.
Start of new spatial relationship
Comparative
The lecturer sets up a debate between competing ideologies, concepts, methods, procedures or techniques.
Start of new ideology Start of new concept Start of new method Start of new procedure Start of new technique
Induction and deduction
Induction is the process by which observations, facts, and evidence are synthesised to form theories, rules and laws. The opposite process by which theories and rules are used to predict and calculate facts about the world is known as deduction. Both processes can be used to structure a lecture.
Start of new theory Start of new rule Start of new observation Start of new fact/evidence Start of new deduction or induction step
Problems and case studies
Case studies can be used to structure lectures by bringing together conceptual understanding and reasoning with real-life, relevant situations.
Start of case/problem explanation
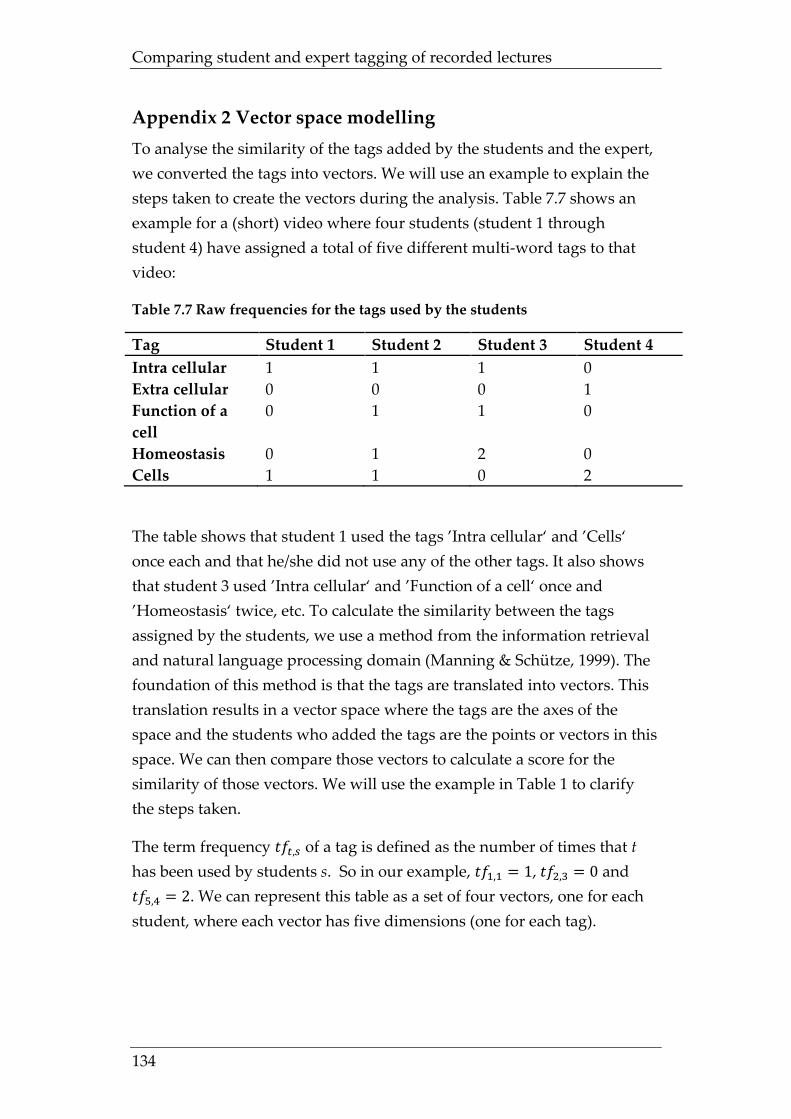
Comparing student and expert tagging of recorded lectures
134
Appendix 2 Vector space modelling To analyse the similarity of the tags added by the students and the expert, we converted the tags into vectors. We will use an example to explain the steps taken to create the vectors during the analysis. Table 7.7 shows an example for a (short) video where four students (student 1 through student 4) have assigned a total of five different multi-word tags to that video:
Table 7.7 Raw frequencies for the tags used by the students
Tag Student 1 Student 2 Student 3 Student 4 Intra cellular 1 1 1 0 Extra cellular 0 0 0 1 Function of a cell
0 1 1 0
Homeostasis 0 1 2 0 Cells 1 1 0 2
The table shows that student 1 used the tags ’Intra cellular‘ and ’Cells‘ once each and that he/she did not use any of the other tags. It also shows that student 3 used ’Intra cellular‘ and ’Function of a cell‘ once and ’Homeostasis‘ twice, etc. To calculate the similarity between the tags assigned by the students, we use a method from the information retrieval and natural language processing domain (Manning & Schütze, 1999). The foundation of this method is that the tags are translated into vectors. This translation results in a vector space where the tags are the axes of the space and the students who added the tags are the points or vectors in this space. We can then compare those vectors to calculate a score for the similarity of those vectors. We will use the example in Table 1 to clarify the steps taken.
The term frequency 𝑡𝑓𝑡,𝑠 of a tag is defined as the number of times that t has been used by students s. So in our example, 𝑡𝑓1,1 = 1, 𝑡𝑓2,3 = 0 and 𝑡𝑓5,4 = 2. We can represent this table as a set of four vectors, one for each student, where each vector has five dimensions (one for each tag).
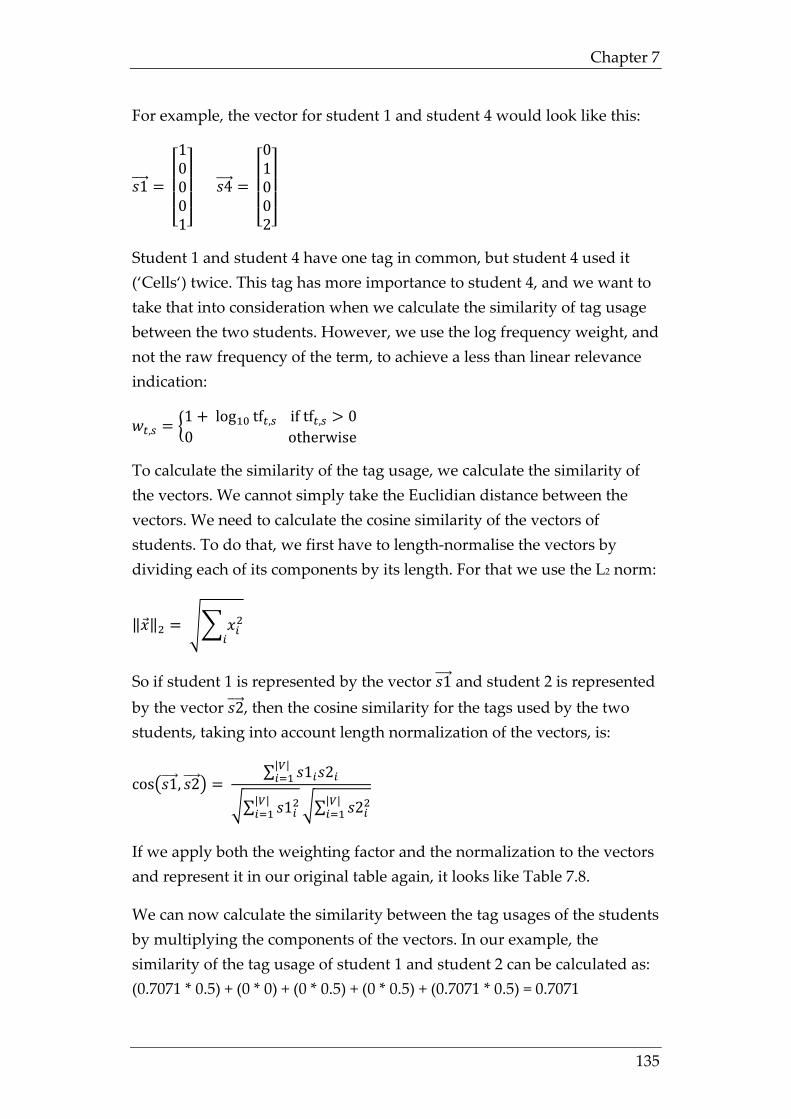
Chapter 7
135
For example, the vector for student 1 and student 4 would look like this:
𝑠1����⃗ =
⎣⎢⎢⎢⎡10001⎦⎥⎥⎥⎤ 𝑠4����⃗ =
⎣⎢⎢⎢⎡01002⎦⎥⎥⎥⎤
Student 1 and student 4 have one tag in common, but student 4 used it (‘Cells‘) twice. This tag has more importance to student 4, and we want to take that into consideration when we calculate the similarity of tag usage between the two students. However, we use the log frequency weight, and not the raw frequency of the term, to achieve a less than linear relevance indication:
𝑤𝑡,𝑠 = �1 + log10 tf𝑡,𝑠 if tf𝑡,𝑠 > 00 otherwise
To calculate the similarity of the tag usage, we calculate the similarity of the vectors. We cannot simply take the Euclidian distance between the vectors. We need to calculate the cosine similarity of the vectors of students. To do that, we first have to length-normalise the vectors by dividing each of its components by its length. For that we use the L2 norm:
‖�⃗�‖2 = �� 𝑥𝑖2𝑖
So if student 1 is represented by the vector 𝑠1����⃗ and student 2 is represented by the vector 𝑠2����⃗ , then the cosine similarity for the tags used by the two students, taking into account length normalization of the vectors, is:
cos�𝑠1����⃗ , 𝑠2����⃗ � = ∑ 𝑠1𝑖𝑠2𝑖
|𝑉|𝑖=1
�∑ 𝑠1𝑖2|𝑉|𝑖=1 �∑ 𝑠2𝑖2
|𝑉|𝑖=1
If we apply both the weighting factor and the normalization to the vectors and represent it in our original table again, it looks like Table 7.8.
We can now calculate the similarity between the tag usages of the students by multiplying the components of the vectors. In our example, the similarity of the tag usage of student 1 and student 2 can be calculated as: (0.7071 * 0.5) + (0 * 0) + (0 * 0.5) + (0 * 0.5) + (0.7071 * 0.5) = 0.7071
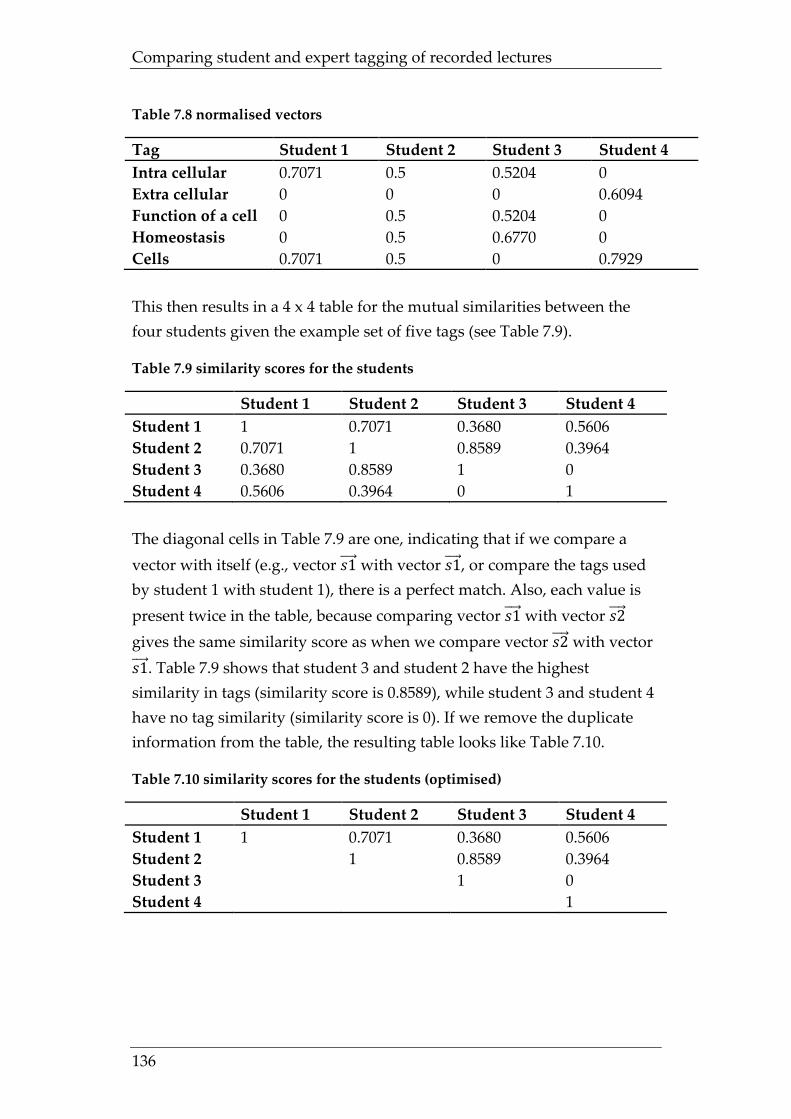
Comparing student and expert tagging of recorded lectures
136
Table 7.8 normalised vectors
Tag Student 1 Student 2 Student 3 Student 4 Intra cellular 0.7071 0.5 0.5204 0 Extra cellular 0 0 0 0.6094 Function of a cell 0 0.5 0.5204 0 Homeostasis 0 0.5 0.6770 0 Cells 0.7071 0.5 0 0.7929 This then results in a 4 x 4 table for the mutual similarities between the four students given the example set of five tags (see Table 7.9).
Table 7.9 similarity scores for the students
Student 1 Student 2 Student 3 Student 4 Student 1 1 0.7071 0.3680 0.5606 Student 2 0.7071 1 0.8589 0.3964 Student 3 0.3680 0.8589 1 0 Student 4 0.5606 0.3964 0 1 The diagonal cells in Table 7.9 are one, indicating that if we compare a vector with itself (e.g., vector 𝑠1����⃗ with vector 𝑠1����⃗ , or compare the tags used by student 1 with student 1), there is a perfect match. Also, each value is present twice in the table, because comparing vector 𝑠1����⃗ with vector 𝑠2����⃗ gives the same similarity score as when we compare vector 𝑠2����⃗ with vector 𝑠1����⃗ . Table 7.9 shows that student 3 and student 2 have the highest similarity in tags (similarity score is 0.8589), while student 3 and student 4 have no tag similarity (similarity score is 0). If we remove the duplicate information from the table, the resulting table looks like Table 7.10.
Table 7.10 similarity scores for the students (optimised)
Student 1 Student 2 Student 3 Student 4 Student 1 1 0.7071 0.3680 0.5606 Student 2 1 0.8589 0.3964 Student 3 1 0 Student 4 1
137
Chapter 8 Conclusions and discussion
8.1 Introduction
Our research focusses on the use of asynchronous recorded lectures in higher education. The main research question is:
How do students use recorded lectures and how can we facilitate effective use?
This research question has led to three subsidiary questions:
1. How do students use recorded lectures according to their self-report?
2. What actual usage of the recorded lectures can we derive from the data on the system, and does that match with what students report?
3. How can we facilitate the use of recorded lectures by students using expert tagging and tagging by the students themselves.
To answer these questions we have conducted a number of studies:
• Use of recorded lectures by students based on self-report (Chapter 3)
• Use of recorded lectures by students based on educational data mining (Chapter 4)
• Use of recorded lectures by students based on triangulation of multiple sources (Chapter 5)
We then looked at ways to facilitate the usage of recorded lectures by students. For this research, we focussed on the use of tags as a navigational aid for students. We investigated both the use of expert tagging and tagging by the students themselves. These studies are reported on in the following chapters:
• The use of expert tags by students (Chapter 6) • The use of expert tags compared to student tags (Chapter 7)
While answering these questions, we focussed on the delimitation of our research while choosing the students and recordings included in the studies.
Conclusions and discussion
138
In this concluding chapter, we present an overview of the methods used along with the main findings, and we reflect on the results of the studies. In section 8.2, we will describe and reflect on the methods used. We will look at how they contributed to the strengthening of the research methodology used. In section 8.3, we will present the main findings and conclusions; in section 8.4 we will discuss these findings and provide recommendations based on the findings. In section 8.5, we discuss the limitations of the research and suggest improvements that could strengthen the research. Finally, in section 8.6, we offer suggestions for further research.
8.2 Methods used In this section, we describe the methods used during our research. During our studies, we could not simply replicate methods used by existing research, but often had to adapt existing methods from other research areas or develop new methods and tools to perform the research needed by our study.
8.2.1 Survey and interviews
During the first stage of our research, we used an online survey (see section 3.4). Some of the questions were based on questions used in other surveys on the use of recorded lectures (Hall, 2009; Kishi & Traphagan, 2007; T. Traphagan, 2006a; Veeramani & Bradly, 2008; Wieling, 2008; Williams & Fardon, 2007b; Zupancic, 2006). However, we applied a sampling method that is different from those other studies. We specifically selected students with recent exposure to recorded lectures and surveyed them about their use within a single specific course. Both users of the recorded lectures and non-users were included in the study. The subjects were all on-campus students who were able to attend the face-to-face lectures. The online survey was followed up by a number of semi-structured interviews where we asked students to elaborate on their use of the recordings during the course. The interviews were recorded and transcribed.
We reported the results of the survey and interviews anonymously (see Chapter 3), but the data collected was not. This allowed us to triangulate
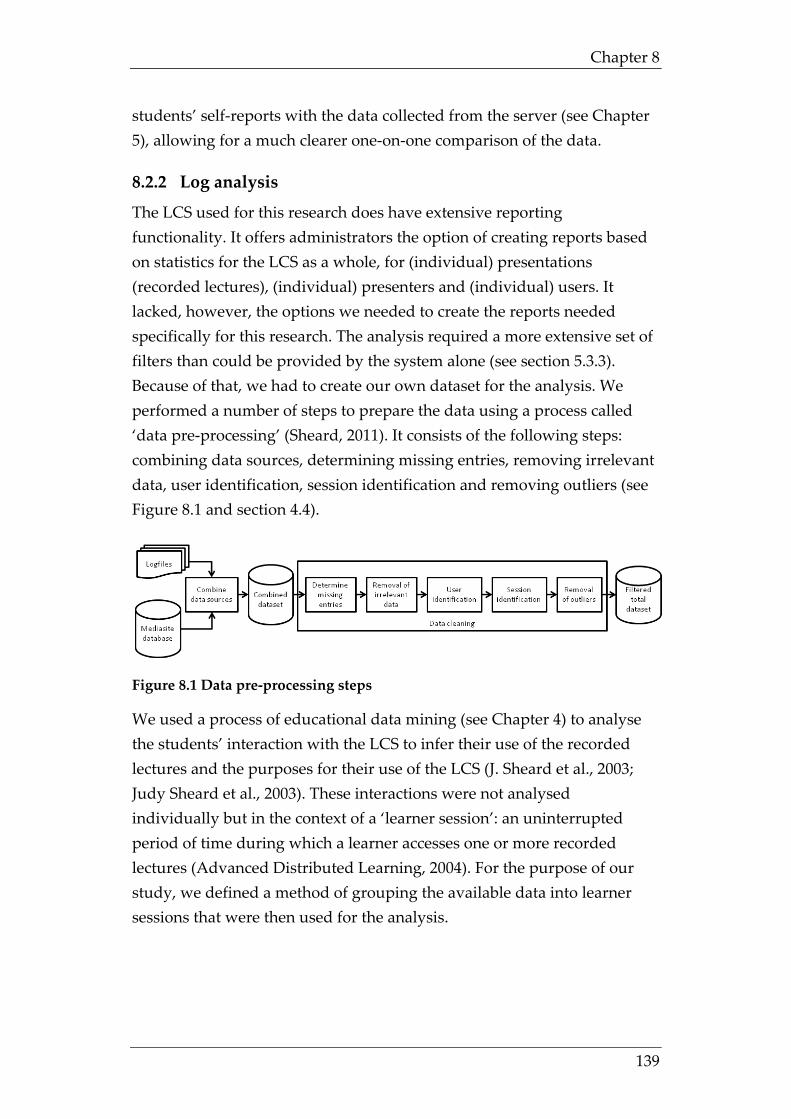
Chapter 8
139
students’ self-reports with the data collected from the server (see Chapter 5), allowing for a much clearer one-on-one comparison of the data.
8.2.2 Log analysis
The LCS used for this research does have extensive reporting functionality. It offers administrators the option of creating reports based on statistics for the LCS as a whole, for (individual) presentations (recorded lectures), (individual) presenters and (individual) users. It lacked, however, the options we needed to create the reports needed specifically for this research. The analysis required a more extensive set of filters than could be provided by the system alone (see section 5.3.3). Because of that, we had to create our own dataset for the analysis. We performed a number of steps to prepare the data using a process called ‘data pre-processing’ (Sheard, 2011). It consists of the following steps: combining data sources, determining missing entries, removing irrelevant data, user identification, session identification and removing outliers (see Figure 8.1 and section 4.4).
Figure 8.1 Data pre-processing steps
We used a process of educational data mining (see Chapter 4) to analyse the students’ interaction with the LCS to infer their use of the recorded lectures and the purposes for their use of the LCS (J. Sheard et al., 2003; Judy Sheard et al., 2003). These interactions were not analysed individually but in the context of a ‘learner session’: an uninterrupted period of time during which a learner accesses one or more recorded lectures (Advanced Distributed Learning, 2004). For the purpose of our study, we defined a method of grouping the available data into learner sessions that were then used for the analysis.
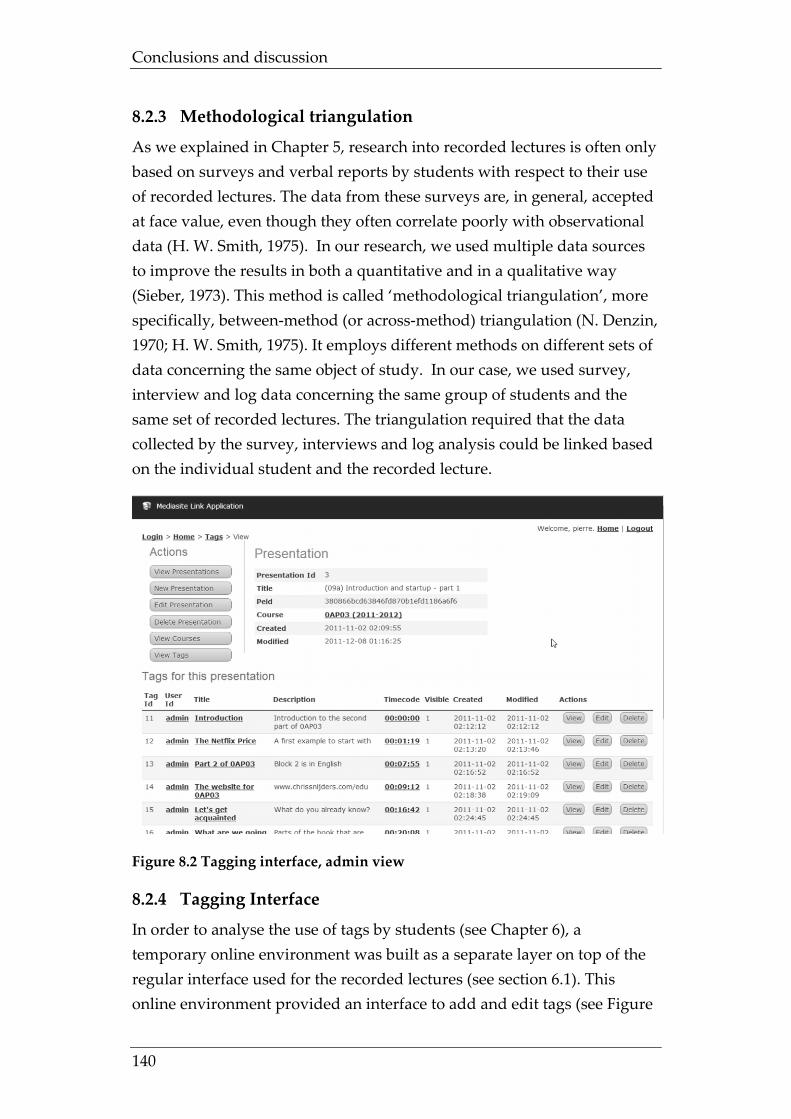
Conclusions and discussion
140
8.2.3 Methodological triangulation
As we explained in Chapter 5, research into recorded lectures is often only based on surveys and verbal reports by students with respect to their use of recorded lectures. The data from these surveys are, in general, accepted at face value, even though they often correlate poorly with observational data (H. W. Smith, 1975). In our research, we used multiple data sources to improve the results in both a quantitative and in a qualitative way (Sieber, 1973). This method is called ‘methodological triangulation’, more specifically, between-method (or across-method) triangulation (N. Denzin, 1970; H. W. Smith, 1975). It employs different methods on different sets of data concerning the same object of study. In our case, we used survey, interview and log data concerning the same group of students and the same set of recorded lectures. The triangulation required that the data collected by the survey, interviews and log analysis could be linked based on the individual student and the recorded lecture.
Figure 8.2 Tagging interface, admin view
8.2.4 Tagging Interface
In order to analyse the use of tags by students (see Chapter 6), a temporary online environment was built as a separate layer on top of the regular interface used for the recorded lectures (see section 6.1). This online environment provided an interface to add and edit tags (see Figure
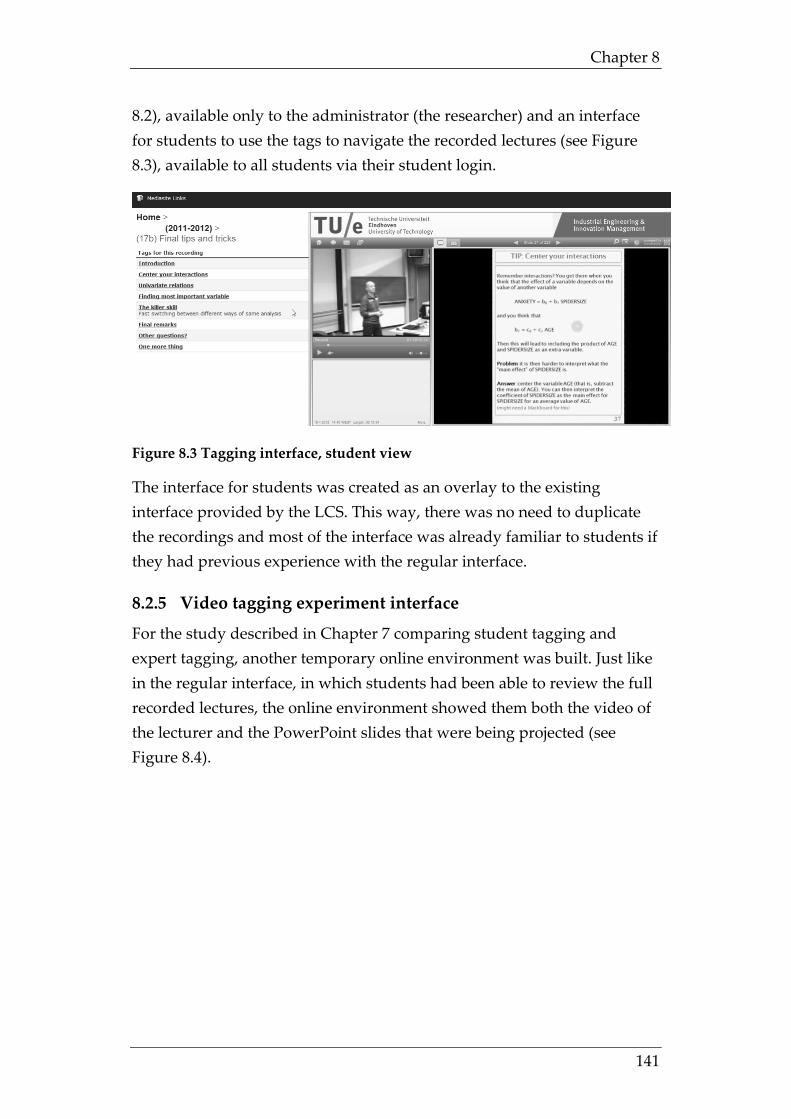
Chapter 8
141
8.2), available only to the administrator (the researcher) and an interface for students to use the tags to navigate the recorded lectures (see Figure 8.3), available to all students via their student login.
Figure 8.3 Tagging interface, student view
The interface for students was created as an overlay to the existing interface provided by the LCS. This way, there was no need to duplicate the recordings and most of the interface was already familiar to students if they had previous experience with the regular interface.
8.2.5 Video tagging experiment interface
For the study described in Chapter 7 comparing student tagging and expert tagging, another temporary online environment was built. Just like in the regular interface, in which students had been able to review the full recorded lectures, the online environment showed them both the video of the lecturer and the PowerPoint slides that were being projected (see Figure 8.4).
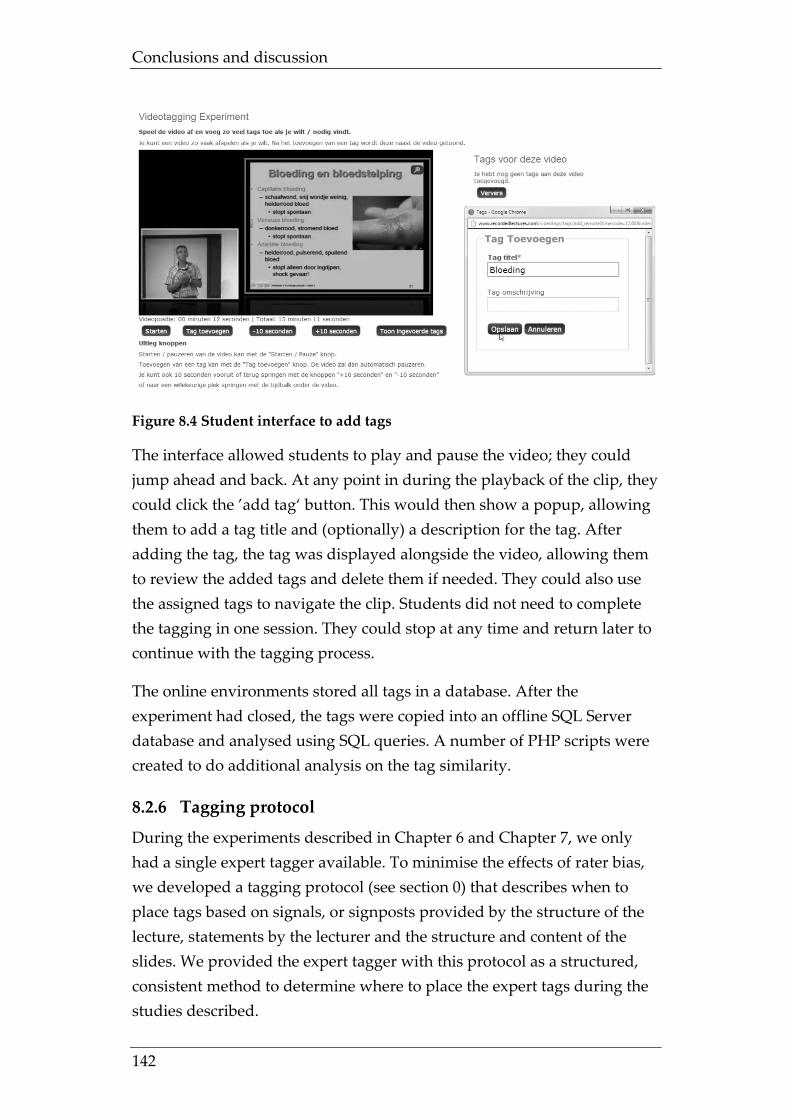
Conclusions and discussion
142
Figure 8.4 Student interface to add tags
The interface allowed students to play and pause the video; they could jump ahead and back. At any point in during the playback of the clip, they could click the ’add tag‘ button. This would then show a popup, allowing them to add a tag title and (optionally) a description for the tag. After adding the tag, the tag was displayed alongside the video, allowing them to review the added tags and delete them if needed. They could also use the assigned tags to navigate the clip. Students did not need to complete the tagging in one session. They could stop at any time and return later to continue with the tagging process.
The online environments stored all tags in a database. After the experiment had closed, the tags were copied into an offline SQL Server database and analysed using SQL queries. A number of PHP scripts were created to do additional analysis on the tag similarity.
8.2.6 Tagging protocol
During the experiments described in Chapter 6 and Chapter 7, we only had a single expert tagger available. To minimise the effects of rater bias, we developed a tagging protocol (see section 0) that describes when to place tags based on signals, or signposts provided by the structure of the lecture, statements by the lecturer and the structure and content of the slides. We provided the expert tagger with this protocol as a structured, consistent method to determine where to place the expert tags during the studies described.
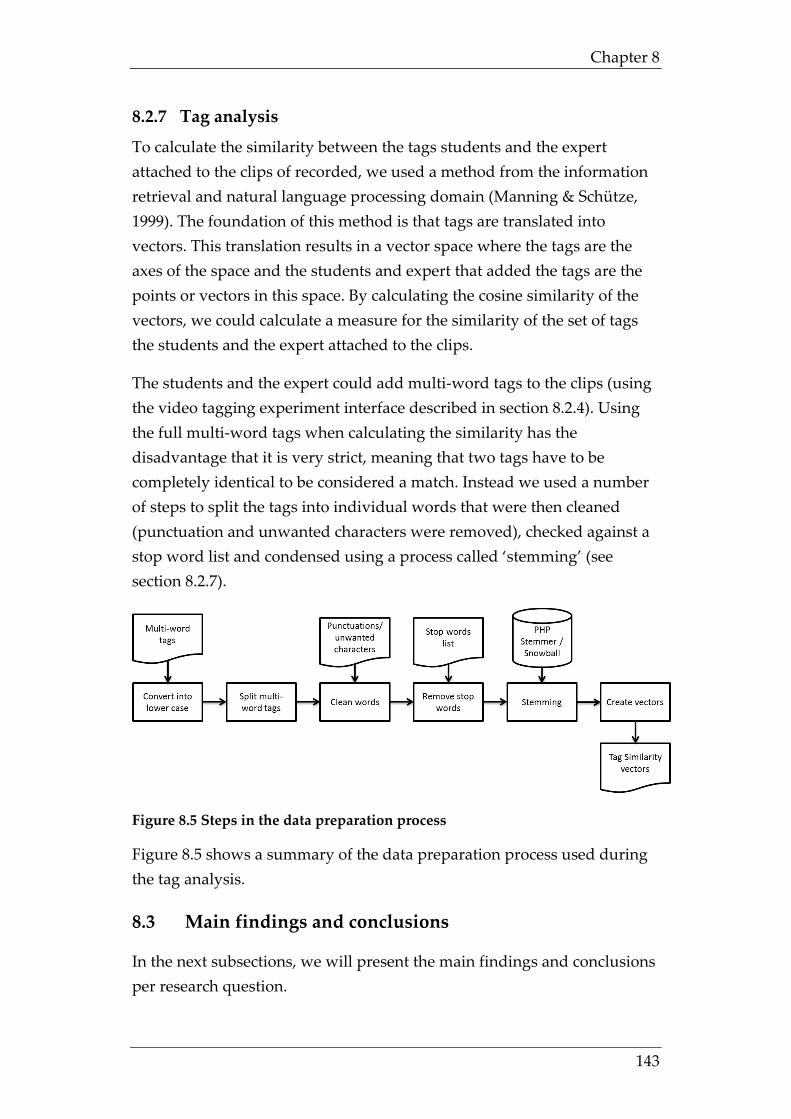
Chapter 8
143
8.2.7 Tag analysis
To calculate the similarity between the tags students and the expert attached to the clips of recorded, we used a method from the information retrieval and natural language processing domain (Manning & Schütze, 1999). The foundation of this method is that tags are translated into vectors. This translation results in a vector space where the tags are the axes of the space and the students and expert that added the tags are the points or vectors in this space. By calculating the cosine similarity of the vectors, we could calculate a measure for the similarity of the set of tags the students and the expert attached to the clips.
The students and the expert could add multi-word tags to the clips (using the video tagging experiment interface described in section 8.2.4). Using the full multi-word tags when calculating the similarity has the disadvantage that it is very strict, meaning that two tags have to be completely identical to be considered a match. Instead we used a number of steps to split the tags into individual words that were then cleaned (punctuation and unwanted characters were removed), checked against a stop word list and condensed using a process called ‘stemming’ (see section 8.2.7).
Figure 8.5 Steps in the data preparation process
Figure 8.5 shows a summary of the data preparation process used during the tag analysis.
8.3 Main findings and conclusions
In the next subsections, we will present the main findings and conclusions per research question.
Conclusions and discussion
144
8.3.1 Research question 1: How do students use recorded lectures according to their self-report?
In Chapter 3, we presented a study into the use of recorded lectures based on students’ self-reports. We used a survey to ask groups of students about their use of recorded lectures and followed that up with semi-structured interviews. Students reported to use the recorded lectures for different ’usage scenarios‘ (see section 3.7), such as a replacement for missed lectures, either incidentally or as a structural replacement for lectures. They also report using them for specific purposes, such as exam preparation, reviewing material before a lecture or to improve the retention of lecture materials.
The results of the survey and the interviews show interesting differences in reported use of the recorded lectures between students from Fontys and the TU/e. The Fontys students use the recorded lectures more than the TU/e students for activities such as managing distractions during lectures, checking their notes, reinforcing the experiences obtained at the live lecture and reviewing material before and after a lecture. These differences can be caused by differences in previous experience (or lack thereof) with recorded lectures, differences in gender, content of the actual recorded lectures, course or department.
Students, even when prompted, did not mentioned quality of the lecture or lack thereof as being a decisive factor for watching or not watching a recorded lecture. There is a tendency, though, for the recorded lectures for courses that only use the blackboard to be viewed less often. Students’ reported interest in the topic of the course, the indicated importance of that topic for their study and the grade that students aim for does not appear to influence the number of times that students use the recorded lectures. Practical considerations, like already having attended the lecture live or lack of time, were much more important.
Only a small number of students indicate they prefer the recorded lecture over the live lecture, although lectures on Monday morning and Friday afternoon are at risk of the occasional student skipping a lecture that is being recorded. This confirms the findings by (T. Traphagan, 2006a)) that while some students are tempted to skip class because of the availability
Chapter 8
145
of recorded lectures, other factors affect attendance as much or more than this availability does.
8.3.2 Research question 2: What actual usage of the recorded lectures can we derive from the data on the system and does that match with what students report?
In Chapter 4, we described the process needed to pre-process the available data into a dataset that could be used to analyse students’ use of recorded lectures based on learner sessions. We eliminated data that was not relevant for our research question. We found that this helped us to get a clearer understanding of the students’ actions. It also enabled us to combine the data in a way that allowed for an analysis based on the use by individual students.
The data from the dataset does seem to confirm the remarks by students during the survey and interviews that they re-used recorded lectures. The analysis showed that the use of the recorded lectures is influenced more by the schedule of the exams than by the lecture schedule. We found evidence that studying the recorded lectures during exam preparation increases the chances of passing the exam. This does not, however, preclude the hypothesis that these students were generally more active and more involved in the course overall.
In Chapter 5, we combined the data from the survey and the interviews with the data from the LCS log files. The biggest difference found during this triangulation was the self-report of 70% of all students indicating that they usually watch 75%-100% of a recorded lecture, while according to analysis based on the LCS log data, this actually was only the case for 2.7% of the students. The vast majority of all students (69.8%), on average only received between 10%-25% of the video of each recorded lecture. Based on this triangulation, we can conclude that the survey has some important limitations. The survey can provide data about the attitude and motivation of the students. However, care should be taken when using surveys as the main or only method to collect data about the use of recorded lectures by students. Respondent bias can greatly influence the results. For example, a positive attitude towards the use of recorded lectures could lead to over reporting of a student’s use of the recorded lecture or to an over representation of possible use purposes to emphasise
Conclusions and discussion
146
the importance of the availability of recorded lectures (Arnold & Feldman, 1981; Kopcha & Sullivan, 2007). Triangulation of the data collected through self-report by students is needed to prevent incorrect conclusions.
8.3.3 Research question 3: How can we facilitate the use of recorded lectures by students using expert tagging and tagging by the students themselves.
In section 2.4, we explained that we were interested in both tagging as a means to retrieve parts of the recorded lectures and in tagging as a reflective practice, where students add the tags for purposes similar to taking notes.
In Chapter 6, we analysed the use of expert tags as a way for students to navigate within recorded lectures. The study showed an increase in the use of the tagging interface (TI) over time as the exam approached. The analysis of the use of the expert tags showed that students viewed less of the recorded lectures when using the tagging interface. We assume this is because they navigated faster through the recorded lectures. It also showed that students who used the TI scored better for the exam than students who did not use the tagging interface.
In Chapter 7, we analysed the use of expert tags and student tags. The analysis of the use of student tagging showed that students can provide tags of sufficient quality. They do not appear to follow the same tagging protocol as the expert does and often use different tags. The degree of similarity of the tags created differs between students and between recorded lectures.
Students tag differently when compared to the expert in our study, and despite their lack of training in tagging, the tags added by the students did not show the lack of quality expected based on (Guy & Tonkin, 2006). And unlike (Verburg, 2010), we did not encounter non-relevant tags. The similarity between the tags that students add and the tags an expert adds differs between students and between clips, and it is small enough to warrant the additional effort needed for the combination of both expert and student tagging.
We do not yet have an explanation for a higher or lower similarity score. Our analysis showed no statistically significant correlations between the
Chapter 8
147
similarity score and the indicated interest in the course, the perceived importance of the course, the number of lectures attended, the indicated difficulty of the course, the number of recorded lectures viewed, the indicated ease of finding the needed parts of a recorded lecture, or the number of tags added during the experiment. The study does not show a generic difference in vocabulary used by the students when compared to the expert. Students who use different tags than the expert also have a small tag similarity when compared to other students and vice versa.
A low similarity score does not mean that the quality of the tags added by a student is low. It only means that the student creates tags that are less common. A low tag similarity score between two students may indicate that their tags are less useful to each other. It can also mean that those tags are a useful addition to the tags a student has already placed himself.
8.4 Discussion and recommendations
The results of our research can be applied in a number of ways. The method described in Chapter 4 shows how institutions using a LCS can use educational data mining of log data provided by the LCS as an addition to student surveys to create usage reports of the recorded lectures. These metrics, based on triangulation of the available data sources, provide a clearer picture of the actual use of the recorded lectures by students than the individual data sources do. Analysis of the placement of the tags and differences between the tags used, as discussed in Chapter 7, can help lecturers determine which parts of the lectures were perceived as difficult or harder to understand. Combining student tagging and expert tagging gives the students the flexibility to add their own tags while enabling the lecturer to guide them through the addition of tags for important sections of the recorded lecture. The student tagging can also be a signal for other students with respect to which sections are the more difficult parts of the lecture.
The research shows that the popular ’total views for all recordings‘ metric, often used by universities to report the success of recorded lectures, has limited meaning. Those reports lack a definition of what a ’view‘ is, usually combine different types of recordings and users into a single
Conclusions and discussion
148
report and do not answer the question whether more views is better or that students had a harder time finding what they needed to view.
In cases where the data logged by the LCS currently is insufficient to perform triangulation, improvements can be made. For example, the methods that students use to navigate through the player interface is not yet logged but could provide valuable information about whether the interface allows them to quickly find the parts of a recorded lecture they want to view. The reporting options available in the LCS should be improved, for example, using the data pre-processing steps described in Chapter 4. Lecturers could be given access to the reports and use them when evaluating their lecture design. It would also enable time-based triangulation where reports for recorded lectures of consecutive years or cohorts of students can be compared easily.
In order to be able to rely on this combination of data sets, unique identification of users is very important. We’ve seen examples where a single recording has been viewed on the same university computer by three different students on a single day. Simply counting IP addresses would provide incorrect information. Downloadable recorded lectures can be counted, but actual use of them cannot be tracked in detail. This also raises issues for universities that (also) provide their recorded lectures as open educational resources (OER), publicly on the internet for anyone to view. Surveys also cannot be anonymous. Although the data in the reports can be anonymised to assure the privacy of students, triangulation can only be performed if the survey data can be linked back to the LCS log data of that same user. Universities should be aware of those effects on the completeness of reports they can create.
Our research also has added value for institutions that are involved in the development of Massive Open Online Courses (Cormier & Siemens, 2010; McAuley, Stewart, Siemens, & Cormier, 2010) or who are ‘flipping the classroom’ (Bergmann & Sams, 2012). A Massive Open Online Course, or MOOC, is an online course with the option of free and open registration, a publicly shared curriculum, and open-ended outcomes. MOOCs share in some of the conventions of an ordinary course, such as a predefined timeline and weekly topics for consideration, but generally have no fees, no prerequisites other than Internet access and interest, no predefined
Chapter 8
149
expectations for participation, and no formal accreditation (McAuley et al., 2010, p. 10). Because MOOCs take place online, over the internet, pre-recorded online lectures play an important role.
The Flipped Classroom (Bergmann, Overmyer, & Willie, 2011) is seen as a classroom where students who are absent due to illness or extra-curricular activities, such as athletics or field-trips, don't get left behind, because content is permanently archived for review or remediation. One way to achieve this in the flipped classroom is by creating video clips replacing (part of) the classroom instruction.
For both MOOCs and flipped classrooms, knowing how and when students use the video clips is important for the lecturer to be able to guide the students and to help them learn to take responsibility for their learning process. This research has shown that lecturers cannot simply assume that students have watched the recordings, not even if they said that they watched them. Since the test and assessment schedule has been shown to be of great influence on the use of the recordings, regular testing of the progress of the students is recommended.
8.5 Limitations of the study
In this section, we discuss some limitations in our study with regard to the sample size and data acquisition and the design of the study and the instruments used.
8.5.1 Sample size and data collection
From the start, we set out to collect data in a way that made it possible to identify individual courses and individual students during the data collection that was part of the study into research questions 1 and 2. This resulted in the selection of a group of students and courses for which we could combine the data collected in the survey and interviews with the data collected from the LCS log files. For the detailed analysis of those logs and the tagging experiments, we zoomed in even further to the level of a single course. We know from both the survey and the LCS log files that there are differences in the viewing behaviour of students for different courses and between students with different backgrounds (Fontys versus the TU/e). Increasing the group of participants to include more students,
Conclusions and discussion
150
courses or even more universities would have improved the possibilities of extrapolation of the results.
The survey was kept as short as possible; students were able to complete the survey in about 10-15 minutes, which probably contributed to the response rate of 46.1%. A more extensive survey, however, would have enabled a more critical examination of the students self-report of their use of recorded lectures. This may give us better insight into the reasons behind the differences in use of the recorded lectures or the use of tags by students.
University policy meant that we were not able to randomly assign a group of students that had access to the expert tags versus a similar control group that did not have access to the expert tags. It was not considered acceptable to deprive one group of students from potentially useful resources, while another group did get access to them. Having two identical groups that only differ in the intervention researched (in this case the recorded lectures with tags) would have given a clearer picture of the effects of the intervention.
8.5.2 Design and instruments used
The goal of our study was to research the use of recorded lectures in their current setting. This meant that we did not question the length, structure or content of the lectures that were being recorded, even though those might merit reconsideration. We also did not research alternatives to presenting the recorded lectures to the students, for example, in the form of smaller clips or with additional resources presented alongside the recorded lecture.
For the tagging experiments, we had to develop two prototype environments in which to conduct the experiments. We did not research possible effects that the user interface design may have had on the use of the environments by the students.
This research was not aimed at determining whether the availability of recorded lectures changes the way students study or whether it improves their exam scores. The aim was to improve our understanding of the use of recorded lectures by students so that we can better support them while they are navigating to the parts of the recorded lecture that they want to
Chapter 8
151
view. So, although in some of the studies we did analyse the results, it was not possible to create a baseline for the students in the study or to compare the results of the courses we analysed with similar courses. This meant we were not able to determine if the recorded lectures helped the better students perform even better, or whether it helped weaker students pass the course where they otherwise would have failed. We also do not have an explanation for all of the reasons behind the use of the recorded lectures by the students. How does that use of the recorded lectures fit into the overall study pattern of the students? Is the use of recorded lectures indicative of the way they plan their learning for this course, meaning that they focus their efforts on the final weeks before the exam? The only sure way to determine this is by direct observation, preferably in a controlled situation, for example in a lab. However, not only is that not practical, it also often influences the students’ behaviour in and of itself. So, although it would result in more empirical data, it might not measure actual use.
8.6 Suggestions for further research
We started our research with this main question:
How do students use recorded lectures and how can we facilitate effective use?
We have shown how to analyse the use of recorded lectures by students in a given context, described in section 2.5. However, this is not the only context or set of conditions available, and there are a number of questions that remain with regard to the use when the context is different from that presented in our study. For example:
• How are live streams of lectures being viewed? Do students watch more of a recorded lecture during a live stream?
• What are the uses of recordings for different distribution methods (streaming, download, mobile)? Is there a difference in use on a mobile device or when they are able to download the material?
• What is the effect of more interaction? Does adding interaction, for example through a forum linked to the recordings, change the clips that students watch? Does it make them watch the recordings at different times during the course?
Conclusions and discussion
152
• How do students use recordings created in different educational settings? Are short(er) clips, like those created as part of MOOCs or as part of the flipped classroom, being watched more often, at different times or in similar ways?
Another suggestion for further research is to integrate the usage analysis described in this research into the LCS. The LCS used in this research already has quite extensive reporting options, yet it still lacks a way for lecturers and staff to get a good overview of how groups of students use the recorded lectures. The reports should take the learner session as a starting point for the analysis of the use of recorded lectures instead of the individual recordings, allowing for a more coherent analysis. This also means that the proper measures need to be taken to assure that all privacy regulations in this regard are being met.
Finally, we have shown that both student and expert tagging have added value. We have shown that students benefit from the use of tags, and students that have participated in the course can add tags of sufficient quality. However, we have not yet fully determined the added value of tagging, for example, with regards to tagging by students that have not yet completed a course. Given the cost of manually added metadata and the lack of the availability of this metadata, further research in this area is warranted.
153
References
Abelson, H. (2008). The creation of OpenCourseWare at MIT. Journal of Science Education and Technology, 17(2), 164-174.
Abowd, G., Atkeson, C., Brotherton, J., Enqvist, T., Gulley, P., & LeMon, J. (1998). Investigating the capture, integration and access problem of ubiquitous computing in an educational setting. Paper presented at the SIGCHI conference on Human factors in computing systems, Los Angeles, California, United States.
Abowd, G., Atkeson, C., Feinstein, A., Hmelo, C., Kooper, R., Long, S., . . . Tani, M. (1996). Teaching and learning as multimedia authoring: the classroom 2000 project. Paper presented at the fourth ACM international conference on Multimedia, Boston, Massachusetts, United States.
Abowd, G., Brotherton, J., & Bhalodia, J. (1998). Classroom 2000: a system for capturing and accessing multimedia classroom experiences. Paper presented at the CHI 98 conference on Human factors in computing systems, Los Angeles, California, United States.
Advanced Distributed Learning. (2004). SCORM Run-Time Environment Version 1.3 Retrieved 16-9-2010, from http://www.adlnet.org/
Allers, J. (2007). Triple L evaluatie – Pilot UvA. Amsterdam: UvA. Anderson, T. H., & Armbruster, B. B. (1986). The value of taking notes
during lectures. Cambridge, Massachusetts: University of Illinois. ANP. (2012, 12-8-2012). Piratenpartij wil colleges op internet hebben
[Pirate Party wants lectures on the Internet], Volkskrant. Retrieved from http://www.volkskrant.nl/vk/nl/5288/Onderwijs/article/detail/3299998/2012/08/12/Piratenpartij-wil-colleges-op-internet-hebben.dhtml
Arnold, H. J., & Feldman, D. C. (1981). Social desirability response bias in self-report choice situations. Academy of Management Journal, 24(2), 377-385.
Arons, B. (1997). SpeechSkimmer: a system for interactively skimming recorded speech. ACM Transactions on Computer-Human Interaction (TOCHI), 4(1), 3-38. doi: http://doi.acm.org/10.1145/244754.244758
Badger, R., White, G., Sutherland, P., & Haggis, T. (2001). Note perfect: an investigation of how students view taking notes in lectures. System, 29(3), 405-417.
Baecker, R. M., Moore, G., & Zijdemans, A. (2003). Reinventing the lecture: Webcasting made interactive. Paper presented at the Proceedings of HCI International 2003, Crete.
References
154
Baker, R. S. J. d., Penelope, P., Eva, B., & Barry, M. (2010). Data Mining International Encyclopedia of Education (pp. 112-118). Oxford: Elsevier.
Bateman, S., Brooks, C., McCalla, G., & Brusilovsky, P. (2007). Applying collaborative tagging to e-learning. Proc. of ACM WWW, 3(4).
Behr, A. L. (1988). Exploring the lecture method: An empirical study. Studies in Higher Education, 13(2), 189-200.
Belanger, Y. (2005). Duke University iPod first year experience final evaluation report. Durham: Center for Instructional Technology.
Bell, T., Cockburn, A., McKenzie, B., & Vargo, J. (2001). Digital Lectures: If You Make Them, Will Students Use Them? Constraints on Effective Delivery of Flexible Learning Systems. Interactive Multimedia Electronic Journal of Computer-Enhanced Learning, 3(2).
Ben Youssef, A., & Dahmani, M. (2010). The impact of ICT’s on students’ performance in Higher Education: Direct effects, Indirect effects and Organizational change.
Bergmann, J., Overmyer, J., & Willie, B. (2011). The Flipped Class: Myths vs. Reality. The Daily Riff, (June 21). Retrieved from http://www.thedailyriff.com/articles/the-flipped-class-conversation-689.php
Bergmann, J., & Sams, A. (2012). Flip Your Classroom: Reach Every Student in Every Class Every Day. Washington, DC: International Society for Technology in Education.
Bligh, D. (1998). What is the Use of Lectures? (5 ed.). Bristol, UK: Intellect Books.
Bregman, R. (2013, 2-1-2013). Hoogleraar: verplaats colleges naar het internet [Professor: move lectures to the internet], Volkskrant. Retrieved from http://www.volkskrant.nl/vk/nl/5288/Onderwijs/article/detail/3371083/2013/01/02/Hoogleraar-verplaats-colleges-naar-het-internet.dhtml
Brotherton, J., & Abowd, G. (2004). Lessons learned from eClass: Assessing automated capture and access in the classroom. ACM Transactions on Computer-Human Interaction (TOCHI), 11(2), 121–155.
Brown, F., & Brown, Y. (1994). Distance education around the world. In B. Willis (Ed.), Distance education: Strategies and tools (pp. 3-39). Englewood Cliffs, New Jersey: Educational Technology Publications.
Brown, G., & Bakhtar, M. (1988). Styles of Lecturing: A Study and Its Implications. Research Papers in Education, 3(2), 131-153.
References
155
Brown, G., & Manogue, M. (2001). Refreshing lecturing: a guide for lecturers. AMEE Medical Education Guide No 22. Medical Teacher, 23, 231-244.
Burby, J., Brown, A., & Committee, W. S. (2007). Web Analytics Definitions. Washington DC: Web Analytics Association.
Campbell, D. T., & Fiske, D. W. (1959). Convergent and discriminant validation by the multitrait-multimethod matrix. Psychological Bulletin, 56(2), 81-105.
Campbell, G. (2005). There’s something in the air: Podcasting in education. EDUCAUSE Review, 40(6), 33–44.
Campbell, J. P., & Oblinger, D. G. (2007). Academic Analytics. Washington, D.C.: Educause.
Chan, A., Lee, M., & McLoughlin, C. (2006). Everyone's learning with podcasting: A Charles Sturt University experience. Paper presented at the Proceedings of the 23rd Annual Conference of the Australasian Society for Computers in Learning in Tertiary Education: Who’s Learning? Whose Technology?, Sydney, Australia.
Chang, S. (2007). Academic perceptions of the use of Lectopia: A University of Melbourne example. Paper presented at the Ascilite conference 2007, Singapore.
Chaudron, C., & Richards, J. C. (1985). The Effect of Discourse Markers on the Comprehension of Lectures. Applied Logistics, 7(2), 113-127.
Cohen, L., Manion, L., & Morrison, K. (2007). Research methods in education (sixth ed.). New York, NY: Routledge.
Collegerama. (2012) Retrieved 28-8-2012, from http://www.collegerama.nl/live/
Cormier, D., & Siemens, G. (2010). The Open Course: Through the Open Door--Open Courses as Research, Learning, and Engagement. EDUCAUSE Review, 45(4), 30-32.
Craig, J., Brittan-Powell, C., El-Haggan, A., Gregory, S., & Braha, H. (2009). Lecture Capture Systems - Are They Worth It? Paper presented at the Mid-Atlantic Regional Conferences.
Day, J. (2008). Investigating Learning With Web lectures. PhD diss., Georgia Institute of Technology, Atlanta, Georgia, US. Retrieved from http://hdl.handle.net/1853/22627
De Backer, G. (2012). PHP Dutch Stemmer Retrieved 10-12-2012, from http://code.google.com/p/php-dutch-stemmer/
de Boer, J., Kommers, P. A. M., & de Brock, B. (2011). Using learning styles and viewing styles in streaming video. Computers & Education, 56(3), 727-735. doi: http://dx.doi.org/10.1016/j.compedu.2010.10.015
Deal, A. (2007). Lecture Webcasting, A Teaching with Technology White Paper: Carnegie Mellon University.
References
156
Dekker, P., & Allers, J. (2007). Overall Evaluatieverslag Triple L pilots [Overall Evaluation Report Triple L pilots]. Amsterdam: Triple L.
Delicious. Retrieved 21-1-2013, from https://delicious.com/ Deming, W. E. (1944). On Errors in Surveys. American Sociological Review,
9(4), 359-369. Denzin, N. (1970). Strategies of multiple triangulation. In N. K. Denzin
(Ed.), The Research Act in Sociology: A Theoretical Introduction to Sociological Methods (pp. 297-313). London: Butterworth.
Denzin, N. (2006). Sociological Methods: A Sourcebook (5th ed.). Piscataway, New Jersey: Transaction Publishers.
Echo 360. (2012). Student Usage Reporting. EchoSystem 5.1 Documentation Retrieved 28-8-2012, from http://confluence.echo360.com/display/51/Student+Usage+Reporting
Elias, T. (2011). Learning Analytics: Defintions, Processes and Potential: Athabasa University.
Entwistle, N., Hanley, M., & Hounsell, D. (1979). Identifying distinctive approaches to studying. Higher Education, 8(4), 365-380.
Exley, K., & Dennick, R. (2004). Giving a lecture: From presenting to teaching. New York, NY: Routledge/Falmer.
Fardon, M. (2003). Internet streaming of lectures; a matter of style. Paper presented at the Conference Proceedings of Educause in Australasia, Adelaide, Australia.
Filius, R. (2008). De huiskamer als cursuslokaal, flexibel leren met weblectures [The living room as a classroom, flexible learning using weblectures]. Develop, 4, 30-41.
Filius, R., & Lam, I. (2009). Rapport Evaluatie weblectures Universiteit Utrecht [Report Evaluation weblectures Utrecht University]. Utrecht: Utrecht University.
Fontys. (2013). About Fontys, from http://fontys.edu/about.fontys/default.aspx
Frederick, P. J. (1986). The lively lecture: 8 variations. College Teaching, 43-50.
Geerligs, J., Mittendorff, K., & Nieuwenhuis, L. (2004). Succesvol innoveren van (beroeps) onderwijs [Successful innovation of (vocational) education.]: Wageningen: Stoas.
Gibson, J. J. (1979). The Theory of Affordances The Ecological Approach to Visual Perception (pp. 127-129). Hillsdale, New Jersey: Lawrence Erlbaum Associates.
Golder, S. A., & Huberman, B. A. (2005). The structure of collaborative tagging systems: HP.com.
References
157
Golder, S. A., & Huberman, B. A. (2006). Usage patterns of collaborative tagging systems. Journal of information science, 32(2), 198-208.
Gorissen, P., van Bruggen, J. M., & Jochems, W. (2012a). Analysing Students' Use of Recorded Lectures through Methodological Triangulation. Paper presented at the Workshop on Learning Technology for Education in Cloud (LTEC'12), Salamanca, Spain.
Gorissen, P., van Bruggen, J. M., & Jochems, W. (2012b). Students and recorded lectures: Survey on current use and demands for higher education. Research in Learning Technology, 20(3), 297-311.
Gorissen, P., van Bruggen, J. M., & Jochems, W. (2012c). Usage Reporting on Recorded Lectures using educational data mining. International Journal of Learning Technology, 7(1), 23-40. doi: 10.1504/IJLT.2012.046864
Gorissen, P., van Bruggen, J. M., & Jochems, W. (2013). Methodological triangulation of the students’ use of recorded lectures. International Journal of Learning Technology, 8(1), 20-40.
Gosper, M., Green, D., McNeill, M., Phillips, R., Preston, G., & Woo, K. (2008). The Impact of Web-Based Lecture Technologies on Current and Future Practices in Learning and Teaching. Strawberry Hills, NSW, Australia: Australian Learning & Teaching Council.
Gruber, T. R. (1993). A translation approach to portable ontology specifications. Knowledge acquisition, 5(2), 199-220.
Guy, M., & Tonkin, E. (2006). Tidying up tags. D-Lib Magazine, 12(1), 1082-9873.
Hall, D. (2009). MyMedia Student Evaluation 2009. Adelaide, Australia: Centre for Learning and Professional Development, University of Adelaide.
Harley, D., Henke, J., Lawrence, S., McMartin, F., Maher, M., Gawlik, M., & Muller, P. (2003). Costs, Culture, and Complexity: An Analysis of Technology Enhancements in a Large Lecture Course at UC Berkeley. Berkeley: University of California.
Hermann, C., Hürst, W., & Welte, M. (2006). The electure-portal: an advanced archive for lecture recordings. Informatics Education Europe.
Hoven, T. (2013, 4-1-2013). Online studeren? Dat is pas ouderwets [Study online? Now that is old-fashioned], Volkskrant. Retrieved from http://www.volkskrant.nl/vk/nl/4884/Bezuinigingen-in-het-hoger-onderwijs/article/detail/3372116/2013/01/04/Online-studeren-Dat-is-pas-ouderwets.dhtml
Hürst, W. (2003). Indexing, searching, and skimming of multimedia documents containing recorded lectures and live presentations. Paper presented at
References
158
the Eleventh ACM international Conference on Multimedia, Berkeley, CA, USA.
Hürst, W., Lauer, T., Bürfent, C., & Götz, G. (2005). Forward and Backward Speech Skimming with the Elastic Audio Slider. Paper presented at the Proceedings of HCI 2005.
Hürst, W., Lauer, T., & Götz, G. (2005). Audio-visual data skimming for e-learning applications. Paper presented at the Proceedings of the 19th British HCI Group Annual Conference (HCI 2005), Edinburgh, UK.
Hurtado, S., Eagan, K., Pryor, J. H., Whang, H., & Tran, S. (2012). Undergraduate Teaching Faculty: The 2010–2011 HERI Faculty Survey (pp. 104). Los Angeles, USA: University of California.
Isaacs, G. (1994). Lecturing practices and note-taking purposes. Studies in Higher Education, 19(2), 203-216.
Janssen, M., & Dekker, P. (2007). Evaluatierapport experiment webcolleges 2006/2007 [Evaluation report Weblecture Experiment 2006/2007]. Amsterdam: Hogeschool van Amsterdam.
Jones, S. E. (2007). Reflections on the lecture: outmoded medium or instrument of inspiration? Journal of Further and Higher Education, 31(4), 397-406. doi: 10.1080/03098770701656816
Kamabathula, V. K., & Iyer, S. (2011). Automated Tagging to Enable Fine-Grained Browsing of Lecture Videos. Paper presented at the IEEE International Conference on Technology for Education (T4E) 2011 Chennai, India.
Kiewra, K. (1989). A review of note-taking: The encoding-storage paradigm and beyond. Educational Psychology Review, 1(2), 147-172. doi: 10.1007/bf01326640
Kishi, C., & Traphagan, T. (2007). Lecture webcasting at the University of Texas at Austin. Paper presented at the Proceedings of the 23rd Annual Conference on Distance Teaching & Learning, Madison, Wisconsin, USA.
Kopcha, T. J., & Sullivan, H. (2007). Self-presentation bias in surveys of teachers’ educational technology practices. Educational technology research and development, 55(6), 627-646.
Koyun, H. (2007). Logging Model for Windows Media Services Retrieved 01-09-2009, from http://www.microsoft.com/windows/windowsmedia/howto/articles/loggingmodel.aspx
Kraaij, W., & Pohlmann, R. (1994). Porter’s stemming algorithm for Dutch. Informatiewetenschap, 167-180.
Lampi, F., Kopf, S., Benz, M., & Effelsberg, W. (2007). An automatic cameraman in a lecture recording system. Paper presented at the Proceedings of the international workshop on Educational
References
159
multimedia and multimedia education, Augsburg, Bavaria, Germany.
Lane, B. (2008). Uni students say no to podcasts. Australian IT. Retrieved from http://www.australianit.news.com.au/story/0,24897,24323671-15306,00.html
Laurillard, D. (2002). Rethinking university teaching: A framework for the effective use of educational technology: Routledge London.
Laurillard, D. (2005). Styles and Approaches in Problem-Solving. In F. Marton, D. Hounsell & N. Entwistle (Eds.), The Experience of Learning: Implications for teaching and studying in higher education (pp. 126-144). Edinburgh: University of Edinburgh, Centre for Teaching, Learning and Assessment.
Leoni, K., & Lichti, S. (2009). Lecture Capture in Higher Education. Evanston: Northwestern University.
Liu, Q., Rui, Y., Gupta, A., & Cadiz, J. (2001). Automating camera management for lecture room environments. Paper presented at the Proceedings of the SIGCHI conference on Human factors in computing systems, Seattle, Washington, United States.
Manning, C. D., & Schütze, H. (1999). Foundations of statistical natural language processing: MIT press.
Markines, B., Cattuto, C., Menczer, F., Benz, D., Hotho, A., & Stumme, G. (2009). Evaluating similarity measures for emergent semantics of social tagging.
Marlow, C., Naaman, M., Boyd, D., & Davis, M. (2006). Position paper, tagging, taxonomy, flickr, article, toread. Paper presented at the Collaborative Web Tagging Workshop at WWW2006, Edinburgh, Scotland.
Mathes, A. (2004). Folksonomies-cooperative classification and communication through shared metadata. Computer Mediated Communication, 47(10).
McAuley, A., Stewart, B., Siemens, G., & Cormier, D. (2010). The MOOC model for digital practice. SSHRC Knowledge Synthesis Grant on the Digital Economy.
Mertens, R., Schneider, H., Müller, O., & Vornberger, O. (2004). Hypermedia Navigation Concepts for Lecture Recordings. Paper presented at the World Conference on E-Learning in Corporate, Government, Healthcare, and Higher Education 2004, Chesapeake, VA.
O'Reilly, T. (2005). What is Web 2.0: Design Patterns and Business Models for the Next Generation of Software. Communications & Strategies(65), 17.
References
160
Opencast project. (2010). Roles Involved in Coursecasting Retrieved 02-16-2010, from http://www.opencastproject.org/wiki/roles_involved_coursecasting
Phillips, R. (2005). Challenging the primacy of lectures: The dissonance between theory and practice in university teaching. Journal of University Teaching & Learning Practice, 2(1), 2.
Phillips, R., Preston, G., Roberts, P., Cumming-Potvin, W., Herrington, J., Maor, D., & Gosper, M. (2010). Using academic analytic tools to investigate studying behaviours in technology-supported learning environments. Paper presented at the Ascilite 2010, Sidney.
Porter, M. F. (1997). An algorithm for suffix stripping. In K. Sparck Jones & P. Willett (Eds.), Readings in information retrieval (pp. 313-316): Morgan Kaufmann Publishers.
Porter, M. F. (2001). Snowball: A language for stemming algorithms Retrieved 10-12-2012, from http://snowball.tartarus.org/texts/introduction.html
Preston, G., Phillips, R., Gosper, M., McNeill, M., Woo, K., & Green, D. (2010). Web-based lecture technologies: Highlighting the changing nature of teaching and learning. Australasian Journal of Educational Technology, 26(6), 717-728.
Read, B. (2005). Lectures on the Go. Information Technology, The Chronicle of Higher Education. Retrieved from http://chronicle.com/article/Lectures-on-the-Go/7794
Romero, C., Ventura, S., Pechenizkiy, M., & Baker, R. S. J. D. (2011). Handbook of Educational Data Mining. Boca Raton, FL: Chapmann & Hall/CRC Press.
Russell, K., Fass, H., & Bloothooft, G. (2008). Rapportage project Weblectures [Report project weblectures]. Utrecht: Utrecht University.
Russell, K., Filius, R., & te Pas, S. (2007). Verslag Grassroots project Opnemen en uitzenden van hoorcolleges voor studenten met een handicap [Report Grassroots project Recording and broadcasting of weblectures for students with disabilities]. Utrecht: Utrecht University.
Sanchez, D. (2008). Class Capture at the University of New Mexico. University of New Mexico. Albuquerque, NM, USA.
Schok, M. (2007). Videocolleges op de TU/e [Recorded lectures at the TU/e]. SURFnet Expertiseseminar: Streaming video in de onderwijspraktijk [SURFnet Expert seminar: streaming video in practice]. Presentation. Utrecht, The Netherlands. Retrieved from http://www.surfnet.nl/nl/bijeenkomsten/archief/Pages/bijeenkomst_188694.aspx
References
161
Sheard, J. (2011). Basics of Statistical Analysis of Interactions. Data from Web-Based Learning Environments. In C. Romero, S. Ventura, M. Pechenizkiy & R. S. J. D. Baker (Eds.), Handbook of Educational Data Mining (pp. 27-40). Boca Raton, FL: Chapmann & Hall/CRC Press.
Sheard, J., Ceddia, J., Hurst, J., & Tuovinen, J. (2003). Determining website usage time from interactions: Data preparation and analysis. Journal of Educational Technology Systems, 32(1), 101-121.
Sheard, J., Ceddia, J., Hurst, J., & Tuovinen, J. (2003). Inferring Student Learning Behaviour from Website Interactions: A Usage Analysis. Education and Information Technologies, 8(3), 245-266.
Sheely, S. (2006). Persistent technologies: Why can't we stop lecturing online? Paper presented at the Proceedings of the 23rd Annual Conference of the Australasian Society for Computers in Learning in Tertiary Education: Who’s Learning? Whose Technology?, Adelaide, Australia.
Sieber, S. D. (1973). The Integration of Fieldwork and Survey Methods. American Journal of Sociology, 78(6), 1335-1359.
Siemens, G. (2010). What are Learning Analytics. Elearningspace - Learning, Networks, Knowledge, Technology, Community Retrieved 10-12-2011, from http://www.elearnspace.org/blog/2010/08/25/what-are-learning-analytics/
Smith, C., & Whiteley, H. (2002). Learners, Learning Styles and Learning Media. Paper presented at the The New Educational Benefits of ICT in Higher Education: Proceedings (2002), Rotterdam.
Smith, H. W. (1975). Strategies of Social Research: The Methodological Imagination. London: Prentice Hall.
Sonicfoundry. (2010). MediaSite Retrieved 11/15/2010, from http://www.sonicfoundry.com/mediasite/
Srinivas, G., Tandon, N., & Varma, V. (2010). A weighted tag similarity measure based on a collaborative weight model. Paper presented at the Proceedings of the 2nd international workshop on Search and mining user-generated contents.
Traphagan, T. (2005a). Class Lecture Webcasting, Fall 2004 and Spring 2005: A Case Study. Austin: University of Texas.
Traphagan, T. (2005b). Class Lecture Webcasting, Fall 2004 and Spring 2005: A Case Study - Program Evaluation Report. Austin, Texas, USA: University of Texas.
Traphagan, T. (2006a). Class Lecture Webcasting, Fall 2004, Spring 2005, and Fall 2005: Summary of Three Case Studies. Austin, Texas, USA: University of Texas.
Traphagan, T. (2006b). Class Lecture Webcasting, Fall 2005: A Case Study. Austin, Texas, USA: University of Texas.
References
162
Traphagan, T., Kucsera, J., & Kishi, K. (2010). Impact of class lecture webcasting on attendance and learning. Educational technology research and development, 58(1), 19-37. doi: 10.1007/s11423-009-9128-7
Trigwell, K., Prosser, M., & Waterhouse, F. (1999). Relations between teachers' approaches to teaching and students' approaches to learning. Higher Education, 37(1), 57-70.
TU/e. (2010). Facts and Figures Edition 2010. Udell, J. (2004). Name that genre: screencast Retrieved 01/01/2009, from
http://weblog.infoworld.com/udell/2004/11/15.html#a1114 van Gemert, E. (2013, 4-1-2013). Het hoorcollege is een inspiratie voor
student én docent [The lecture is a source of inspiration for both students and teachers], Volkskrant. Retrieved from http://www.volkskrant.nl/vk/nl/3184/opinie/article/detail/3371823/2013/01/04/Het-hoorcollege-is-een-inspiratie-voor-student-en-docent.dhtml
van Hoof, S. (2013, 5-1-2013). Goed onderwijs is gebaat bij regelmatig contact tussen docent en student [Good education will benefit from regular contact between teacher and student], Volkskrant.
Vander Wal, T. (2007). Folksonomy Retrieved 21-1-2013, from http://vanderwal.net/folksonomy.html
Veeramani, R., & Bradly, S. (2008). Insights regarding undergraduate preference for lecture capture. Madison, WI, USA: University of Wisconsin-Madison E-Business Institute.
Velsen, L., & Melenhorst, M. (2008). User Motives for Tagging Video Content.
Verburg, J. (2010). Live & Social Tagging van Weblectures [Live and Social Tagging of Weblectures]. Hogeschool Utrecht, Utrecht.
Westera, W. (2008). The Problem of Web Lectures. Retrieved from http://hdl.handle.net/1820/1466
Wieling, M. (2008). De effecten van het aanbieden van videocolleges als aanvulling op de reguliere hoorcolleges binnen de Faculteit Rechten [The effects of recorded lectures as a supplement to regular lectures at the Law department]. Groningen University. Groningen, Netherlands.
Williams, J., & Fardon, M. (2007a). Perpetual Connectivity: Lecture Recordings and Portable Media Players. Paper presented at the Proceedings ascilite Singapore 2007, Singapore.
Williams, J., & Fardon, M. (2007b). Recording lectures and the impact on student attendance. Paper presented at the Alt-C 2007. http://cmalt.com/altc2007/timetable/files/1064/2007_AltC_Williams_Attendance.pdf
Winne, P. H., & Jamieson-Noel, D. (2002). Exploring students’ calibration of self reports about study tactics and achievement. Contemporary
References
163
Educational Psychology, 27(4), 551-572. doi: http://dx.doi.org/10.1016/S0361-476X(02)00006-1
Witten, I. H., & Frank, E. (2002). Data mining: practical machine learning tools and techniques with Java implementations. ACM SIGMOD Record, 31(1), 76-77.
Woo, K., Gosper, M., McNeill, M., Preston, G., Green, D., & Phillips, R. (2008). Web-based lecture technologies: blurring the boundaries between face-to-face and distance learning. ALT-J, 16(2), 81-93.
Zhang, C., Crawford, J., Rui, Y., & He, L. (2005). An automated end-to-end lecture capturing and broadcasting system. Paper presented at the Proceedings of the 13th annual ACM international conference on Multimedia, Hilton, Singapore.
Zhang, C., Rui, Y., Crawford, J., & He, L. (2008). An automated end-to-end lecture capture and broadcasting system. ACM Transactions on Multimedia Computing, Communications, and Applications, 4(1), 1-23. doi: http://doi.acm.org/10.1145/1324287.1324293
Ziewer, P. (2004). Navigational Indices and Full-Text Search by Automated Analyses of Screen Recorded Data. Paper presented at the World Conference on E-Learning in Corporate, Government, Healthcare, and Higher Education 2004, Chesapeake.
Zupancic, B. (2006). Vorlesungsaufzeichnungen und digitale Annotationen: Einsatz und Nutzen in der Lehre [Lecture recording and digital annotations: Use and Benefits in Teaching]. PhD diss., Universität Freiburg, Fakultät für Angewandte Wissenschaften, Freiburg, Germany.
References
164
This page has been intentionally left blank
165
Summary
Ever since the start of the information and communication technology (ICT) era, universities and educational institutions all over the world have strived to incorporate its use into their pallet of instructional methods. The use of video, be it in the form of television broadcasts, DVDs or as video over the internet, has long been one of the important manifestations of the search for attractive learning materials that can be used independent of time and place.
The recording and broadcasting of lectures has been an important solution for distance education (F. Brown & Brown, 1994). But more and more, universities enhance parts of their courses aimed at on-campus students with online video components and lecture recordings. They do this to allow students to review lectures at their own pace and at a time and place of their choosing. With this increase in use, the main research question for this PhD research became increasingly more relevant:
How do students use recorded lectures and how can we facilitate effective use?
There is previous research into this question, but studies show various shortcomings, such as lack of focus, meaning that the uses, technology and user groups were combined in a way that made it difficult to apply the results to our own situation. To establish some common ground, this dissertation starts with a description of a framework that more accurately determines the context of the research (see Chapter 2).
Our research was conducted at two of institutions in the higher education sector in the Netherland, Fontys University of Applied Sciences and the Eindhoven University of Technology (TU/e). Both universities use a commercially available Lecture Capture System (LCS) to create recorded lectures, with the teacher standing in front of the class lecturing. The recorded lectures we researched are created primarily for both full-time and part-time students who have the opportunity to attend the live lecture. See section 2.5 for a full description of the context based on the framework.
Summary
166
Our main question raises a number of subsidiary questions. The first question this research addresses is:
Research question 1: How do students use recorded lectures according to their self-report?
In Chapter 3, we studied the use of the recorded lectures by students at the two institutions using a survey and semi-structured interviews. The results correspond with the findings of Traphagan (2006a), Veeramani and Bradly (2008) and Gosper et al. (2008), where students report using the recorded lectures for different usage scenarios, such as a replacement for missed lectures, either incidentally or as a structural replacement for lectures, but also for use for specific purposes, such as exam preparation, reviewing of material before a lecture or to improve the retention of lecture materials. We found interesting differences in the reported use of the recorded lectures between students from Fontys and the TU/e. The Fontys students use the recorded lectures more than the TU/e students for activities such as managing distractions during lectures, checking their notes, reinforcing the experiences obtained at the live lecture and reviewing material before and after a lecture. These differences can be caused by differences in previous experience (or lack thereof) with recorded lectures, differences in gender, contents of the actual recorded lectures, course or department.
Students, even when prompted, did not mention quality of the lecture or lack thereof as a decisive factor for watching or not watching a recorded lecture, although there is a tendency for recorded lectures in courses that only use the blackboard to be viewed less often. Only a small number of students indicate they prefer the recorded lecture over the live lecture, although lectures on Monday morning and Friday afternoon are at risk of the occasional student skipping a lecture that is being recorded.
Whether these self-report data accurately describe actual usage remains to be seen, leading to our next question:
Research question 2: What actual usage of the recorded lectures can we derive from the data on the system and does that match with what students report?
In Chapter 4, we describe the steps taken to pre-process the data collected by the LCS into a dataset that allowed us to analyse the actual usage of the
Summary
167
recorded lectures by the students. That data was then triangulated with the data from the survey and the semi-structured interviews. Chapter 5 describes this process.
The analysis showed that the use of the recorded lectures is influenced more by the schedule of the exams than by the lecture schedule. We found evidence that studying the recorded lectures during exam preparation increased the chances of passing the exam. The biggest difference found during the triangulation was in usage. In their self-report, 70% of all students indicated they usually watched 75%-100% of a recorded lecture. The LCS log data showed that this actually was only the case for 2.7% of the students. The vast majority of all students (69.8%), on average requested between 10%-25% of the video of each recorded lecture.
In the next part of the research, we examined the second part of the original research question: How can we facilitate effective use of the recorded lectures? This is formulated as the third research question:
Research question 3: How can we facilitate the use of recorded lectures by students using expert tagging and tagging by the students themselves?
We looked at improving the navigational support of the use of recorded lectures by offering tags that could be used to directly access specific parts of the recorded lecture. We investigated both the use of expert tagging and of tags created by the students themselves. In Chapter 6, we describe a study into the use of expert tagging as a way to facilitate the students’ navigation of the recorded lectures. Whenever they accessed a recorded lecture, students were given a choice to use the Regular Interface (RI) or the Tagging Interface (TI) The study showed an increase in the use of the TI over time as the exam approached. The analysis showed that students viewed less of the recorded lectures when using the tagging interface, and we assume this is the case because they located the parts that they wanted to view quicker. The analysis also showed that students who used the TI scored better for the exam than students who did not use the tagging interface.
In Chapter 7, we describe the use of expert tagging and student tagging. The study shows that student tagging may have added value over just expert tagging. The similarity between the tags that students add and the
Summary
168
tags an expert adds differs between students and between clips, and it is small enough to warrant the additional effort needed for the combination of both expert and student tagging. Analysis of the placement of the tags and differences between the tags used, as discussed in Chapter 7, can help lecturers determine which parts of the lectures were perceived as difficult or harder to understand. Combining student tagging and expert tagging gives students the flexibility to add their own tags while enabling the lecturer to guide them through the addition of tags for important sections of the recorded lecture. Student tagging can also signal other students as to which are the more difficult parts of the lecture.
Finally, in Chapter 8, we summarise this research, its main conclusions and also its limitations. We offer a number of recommendations and suggestions for further research. We have shown how to analyse the use of recorded lectures by students in a given context, described in section 2.5. However, this is not the only context or set of conditions available, and there are a number of questions that remain with regards to the use when the context is different. Another suggestion for further research is to integrate the usage analysis described in this research into the LCS itself, making it an integral part of the reporting available for lecturers and staff. This enables a better understanding of the use of the recorded lectures by students and may enable the identification of parts of the lecture that are more difficult for the students. This can also be important for popular settings, such as MOOCs and flipped classrooms.
169
Samenvatting
Al vanaf het begin van het Informatie- en Communicatietechnologie (ICT) tijdperk hebben universiteiten en onderwijsinstellingen over de hele wereld er naar gestreefd om de mogelijkheden ervan op te nemen in het pallet van beschikbare instructiemethoden. Het gebruik van video, zowel in de vorm van televisie-uitzendingen, Dvd’s of video die via internet verstuurd wordt, is al lang een van de belangrijke manifestaties van de zoektocht naar aantrekkelijk leermateriaal dat onafhankelijk van tijd en plaats gebruikt kan worden.
Het opnemen en uitzenden van colleges was lang een oplossing die toegepast werd bij afstandsonderwijs (F. Brown & Brown, 1994). Maar steeds vaker gebruiken universiteiten ook online video en opnames van colleges als uitbreiding bij vakken voor reguliere studenten. Ze doen dit zodat studenten de colleges in hun eigen tempo en op een plaats en tijdstip naar keuze kunnen bekijken. Met deze toename van het gebruik, werd de hoofdonderzoeksvraag van dit promotieonderzoek steeds relevanter:
Hoe maken studenten gebruik van opnames van colleges en hoe kunnen we effectief gebruik faciliteren?
Er is al bestaand onderzoek naar het antwoord op deze vraag, maar hierbij is er sprake van verschillende tekortkomingen, zoals een gebrek aan focus doordat gebruiksmogelijkheden, technologie en gebruikersgroepen gecombineerd worden op een manier die het moeilijk maakt om de resultaten te vertalen naar de eigen situatie. Om tot een gemeenschappelijke basis te komen, start dit promotieonderzoek met de beschrijving van een raamwerk dat nauwkeuriger de context van het onderzoek bepaalt (zie hoofdstuk 2).
Het onderzoek heeft plaats gevonden bij twee hoger onderwijs instellingen in Nederland: Fontys Hogescholen en de Technische Universiteit Eindhoven (TU/e). Beide onderwijsinstellingen maken gebruik van een commercieel systeem voor het maken van opnames van colleges (in dit proefschrift: “lecture capture system” of LCS ). De opnames (“recorded lectures”) die onderzocht zijn bestaan uit colleges
Samenvating
170
waarbij de docent voor een groep studenten college geeft. De opnames zijn primair bedoelt voor voltijd en deeltijd studenten die in principe de gelegenheid hebben om de colleges op de campus bij te wonen. Zie paragraaf 2.5 voor een gedetailleerdere beschrijving van de afbakening op basis van het raamwerk.
De hoofdonderzoeksvraag roept een aantal deelvragen op. De eerste deelvraag die in dit onderzoek aan bod komt is:
Onderzoeksvraag 1: Hoe zeggen studenten dat ze gebruik maken van opnames van colleges?
In hoofdstuk 3 beschrijven we het onderzoek naar het gebruik van de opnames door studenten dat we op basis van een vragenlijst en semigestructureerde interviews hebben uitgevoerd bij de twee onderwijsinstellingen. De resultaten van dat onderzoek komen overeen met de bevindingen van T. Traphagan (2006a), Veeramani en Bradly (2008) en Gosper et al. (2008), waarbij studenten aangaven de opnames voor verschillende gebruikssituaties in te zetten, zoals het incidenteel of structureel vervangen van gemiste colleges, maar ook voor het voorbereiden van tentamens, het bestuderen van materiaal voor het volgende college of voor het beter onthouden van de inhoud van de colleges. We vonden interessante verschillen tussen het gerapporteerde gebruik door de studenten van Fontys en de TU/e. De Fontys studenten gebruikten de opnames, vaker dan de studenten van de TU/e, voor zaken als het verminderen van afleiding tijdens colleges, het controleren van hun eigen aantekeningen, het bevestigen van de ervaringen opgedaan tijdens het college en het nogmaals bekijken van het materiaal voor en na een college. Deze verschillen kunnen veroorzaakt worden door (een gebrek aan) eerdere ervaringen met opnames, verschillen in geslacht, de inhoud van de opnames, het vak of de opleiding.
Ook toen ze er expliciet naar gevraagd werden, noemden studenten nooit de kwaliteit (of het gebrek aan kwaliteit) van een college als een doorslaggevende reden om wel of niet naar een opname te kijken. Wel is er een tendens zichtbaar dat opnames van vakken die alleen het bord gebruiken minder bekeken worden. Slechts een klein aantal studenten geeft aan dat ze de voorkeur geven aan de opname van een college boven deelname aan het live college. Al lopen colleges op maandagochtend en
Samenvatting
171
vrijdagmiddag de kans op het (incidenteel) afwezig zijn van studenten als ze worden opgenomen.
Of deze data die door de studenten zelf werd aangeleverd, het daadwerkelijk gebruik van de opnames beschrijft, was de vraag die tot de tweede onderzoeksvraag leidde:
Onderzoeksvraag 2: Welk daadwerkelijk gebruik van de opnames kunnen we afleiden van de data die het systeem opslaat en komt dit overeen met de informatie afkomstig van de studenten?
In hoofdstuk 4 beschrijven we de stappen die zijn ondernomen om de data die afkomstig was van het LCS om te zetten in een dataset die ons in staat stelde om het daadwerkelijk gebruik van de opnames door de studenten te analyseren. De resultaten daarvan zijn daarna vergeleken (getrianguleerd) met de gegevens uit de vragenlijst en de interviews. Hoofdstuk vijf beschrijft dit proces.
De analyse van de data van het LCS liet zien dat het gebruik van de opnames meer beïnvloed wordt door het tijdstip van de tentamens dan door de planning van de colleges. We vonden aanwijzingen dat het bestuderen van de opnames tijdens de tentamenvoorbereiding de kansen van slagen voor dat tentamen verhogen. Het belangrijkste verschil dat tijdens de triangulatie gevonden werd had te maken met het gebruik van de opnames. In de vragenlijst hadden 70% van de studenten aangegeven dat zijn 75%-100% van de opnames bekeken. De data van het LCS liet zien dat dit in werkelijkheid slechts het geval was voor 2,7% van de studenten. De overgrote meerderheid van de studenten (69,8%) vroeg gemiddeld tussen de 10%-25% van de video van de opnames op.
In het volgende onderdeel van het onderzoek hebben we het tweede deel van de oorspronkelijke onderzoekvraag geanalyseerd: “hoe kunnen we effectief gebruik faciliteren?”. Dit is geformuleerd in de derde onderzoeksvraag:
Onderzoeksvraag 3: Hoe kunnen we het gebruik van de opnames door studenten ondersteunen met behulp van tags die door een expert zijn toegevoegd en tags die door de studenten zelf zijn toegevoegd?
Samenvating
172
We hebben gekeken naar verbeteringen in de ondersteuning van de navigatie binnen de opnames via het aanbieden van tags die gebruikt kunnen worden om direct naar specifieke onderdelen van de opname te springen. We hebben zowel het gebruik van tags die door een expert zijn toegevoegd als het gebruik van tags die door de studenten zijn toegevoegd onderzocht. In hoofdstuk 6 beschrijven we een onderzoek waarbij we tags die toegevoegd worden door een expert gebruiken om studenten te laten navigeren in de opname. Elke keer als de studenten de opname wilde starten hadden ze de mogelijkheid om te kiezen tussen een Reguliere Interface (RI) en een Tagging Interface (TI). Het onderzoek laat zien dat er in de tijd een toename plaats vond van het gebruik van de TI met het naderen van het tentamen. De analyse laat zien dat studenten minder van een opname bekeken als ze gebruik maakten van de TI, we gaan er vanuit dat ze de delen van de opname die ze wilden zien sneller konden vinden met behulp van de tags. De analyse laat ook zien dat studenten die gebruik maakten van de TI beter scoorden voor het tentamen dan studenten die er geen gebruik van maakten. In hoofdstuk 7 beschrijven we het gebruik van tags die door een expert zijn toegevoegd en tags die door studenten zijn toegevoegd. Het onderzoek laat zien dat tags die door studenten toegevoegd worden meerwaarde kunnen hebben naast tags die door de expert worden toegevoegd. De mate van overeenstemming tussen de tags van studenten en de expert verschilt van student tot student en tussen opnames. En de overeenstemming is klein genoeg om de extra inspanning van het toevoegen van beide groepen tags te verantwoorden. Analyse van de plaats van de tags en de verschillen tussen de tags, zoals in hoofdstuk 7 beschreven wordt, kunnen docenten helpen om vast te stellen welke delen van de colleges als moeilijk ervaren worden. De combinatie van tags die door de studenten en de expert worden toegevoegd, geeft studenten enerzijds de vrijheid om hun eigen tags toe te voegen, terwijl de docent de mogelijkheid heeft om de studenten te (bege)leiden via het toevoegen van tags bij belangrijke onderdelen van de opname van het college. De tags die door studenten worden toegevoegd kunnen daarnaast een signaal zijn voor andere studenten met betrekking tot de moeilijke onderdelen van een opname van een college.
Samenvatting
173
Tot slot vatten we in hoofdstuk 8 van dit proefschrift het onderzoek samen. We beschrijven de belangrijkste conclusies en beperkingen van het onderzoek. Er worden een aantal aanbevelingen en suggesties voor vervolgonderzoek gedaan. We hebben in dit onderzoek laten zien hoe het gebruik van opnames van colleges door studenten, gegeven de context die beschreven wordt in paragraaf 2.5, kan worden geanalyseerd. Echter, dit is niet de enige mogelijk context en er blijven een aantal vragen open op het moment dat de context wijzigt. Een andere suggestie voor vervolgonderzoek is het integreren van de gebruiksanalyse in het LCS zodat het integraal onderdeel uit gaat maken van de rapportages die beschikbaar zijn voor docenten en ondersteuners. Dat stelt hen in staat om een beter begrip te krijgen van het gebruik van de opnames van colleges door studenten en maakt het mogelijk om die onderdelen van een college die moeilijk zijn te identificeren. Dit kan ook van belang zijn het gebruik van video binnen bijvoorbeeld MOOCs of flipped classrooms.

Samenvating
174
This page has been intentionally left blank
175
List of Publications
Articles in peer-reviewed journals:
Gorissen, P., Van Bruggen, J. M. & Jochems, W. (2012) Students and recorded lectures: Survey on current use and demands for higher education, Research in Learning Technology. Vol. 20, pp. 297-311. DOI: 10.3402/rlt.v20i0.17299
Gorissen, P., Van Bruggen, J. M. & Jochems, W. (2012) Usage Reporting on Recorded Lectures, International Journal of Learning Technology, Vol 7, No 1, pp.23-40. DOI: 10.1504/IJLT.2012.046864
Gorissen, P., Van Bruggen, J. M. & Jochems, W. (2013). Methodological triangulation of the students’ use of recorded lectures, International Journal of Learning Technology. Vol. 8, No.1, pp. 20-40. DOI: 10.1504/IJLT.2013.052825
Gorissen, P., Van Bruggen, J. M. & Jochems, W. (manuscript submitted for publication). Does tagging improve the navigation of recorded lectures by students?
Gorissen, P., Van Bruggen, J. M. & Jochems, W. (manuscript submitted for publication). Comparing student and expert based tagging of recorded lecture.
Conference proceedings:
Gorissen, P., Van Bruggen, J. M. & Jochems, W. (2012). Analysing Students' Use of Recorded Lectures through Methodological Triangulation. In: Uden, L., Rodríguez, E. S. C., De Paz Santana, J. F. & De La Prieta, F. (eds.) Workshop on Learning Technology for Education in Cloud (LTEC'12), 2012 Salamanca, Spain. Springer, pp. 145-156. DOI: 10.1007/978-3-642-30859-8_14
List of Publications
176
Conference contributions (without proceedings)
Gorissen, P. (2013). Weblectures hoe werkt dat? [Weblectures, how does that work?] Presentation during the Fontys Docent event [Teacher event], Eindhoven, the Netherlands
Gorissen, P. (2012). Weblectures in het Onderwijs. [Weblectures in Education] Presentation for the Fontys School of Nursing, Eindhoven, the Netherlands
Gorissen, P. (2012). Do you count what counts? Presentation during the Mediasite Usergroup EU Forum 2012, Amsterdam, the Netherlands
Gorissen, P. (2012). Tellen we wel wat Telt? [Do we count what counts?] Presentation during the annual meeting of the Fontys research group Educational functions of ICT, Echt, the Netherlands
Gorissen, Pierre, Van Bruggen, J.M. & Jochems W. (2011). Analysing the use of recorded lectures by students. Short paper presented during the ALT-C conference in Leeds, UK
Gorissen, P., Van Bruggen, J.M. & Jochems W. (2011), Using methodological triangulation to analyse students’ use of recorded lectures. Paper presented at the Joint Meeting of Research School, Hamburg, Germany
Gorissen, P., Van Bruggen, J.M. & Jochems W. (2011) Het gebruik van opnames van colleges door studenten [The use of recorded lectures by students]. Paper presented at the ORD 2011, Maastricht, the Netherlands
Gorissen, P. (2011) Do you know what your students do with your lecture recordings? Presentation at the Unleash 2011 conference, Madison, Wisconsin
Gorissen, P. (2010) Meten is weten: wat doen studenten met opnames van colleges? [To measure is to know: what do students do with recordings of lectures?]. Presentation at the Educational Days, Utrecht, the Netherlands
Gorissen, P., Van Bruggen, J.M. & Jochems W. (2010), Facilitating the use of recorded lectures with social tagging. Poster presentation at the ORD 2010, Enschede, the Netherlands
List of Publications
177
Gorissen, P., Van Bruggen, J.M. & Jochems W. (2010), Facilitating the use of recorded lectures with social tagging. Poster presentation at the Joint Meeting of Research Schools, Helsinki, Finland
Gorissen, P. (2009), Faciliteren van het gebruik van recorded lectures met behulp van social tagging [Facilitating the use of recorded lectures with social tagging]. Presentation at the Platform Education and ICT, Eindhoven, the Netherlands

List of Publications
178
This page has been intentionally left blank
179
Curriculum Vitae
Pierre Gorissen was born on 20 February 1970 in Beek, the Netherlands. After completing his master’s degree in Business Informatics, he completed a master’s degree in Business Economics and a certification as a fully qualified teacher at the University of Tilburg in 1994.
He started his career at Fontys University of Applied Sciences in 1994 at the predecessor of the current Fontys International Business School in Venlo, teaching both Dutch and German students in a number of Business Informatics-related courses. In 2000, he assumed a position as a consultant for the Educational and Research department at Fontys in Eindhoven. He was involved in a wide variety of projects, like the introduction of the virtual learning environment, interactive whiteboards, virtual worlds, videoconferencing, electronic books and weblectures. During this time he worked part time as an educational technologist at the Open University in the Netherlands (2003-2004), where he participated in various European projects; he was Project Manager Learning Technology at SURF (2002 – 2009) and was, on their behalf, involved in the development of learning technology specifications within the IMS Global Learning Consortium. He was also Innovation Advisor at SURFnet (2010 – 2011) and a member of the Dutch NEN Norm committee for learning technology (2002 – 2010).
Facilitated by the Fontys STIP professionalization project, he started his PhD project at the beginning of 2009 at the Eindhoven School of Education.
Pierre blogs about IT and Education at: http://ictoblog.nl/ (in Dutch)
Curriculum Vitae
180
This page has been intentionally left blank
181
Eindhoven School of Education dissertation series
Sande, R. A. W. van de (2007). Competentiegerichtheid en scheikunde leren: over metacognitieve opvattingen, leerresultaten en leeractiviteiten.
Hooreman, R. (2008). Synchronous coaching of trainee teachers: an experimental approach.
Rajuan, M. (2008). Student teachers’ perceptions of learning to teach as a basis for supervision of the mentoring relationship.
Raessens, B. A. M. (2009). De E-kubus: een analysemodel voor curricula.
Rohaan, E. J. (2009). Testing teacher knowledge for technology teaching in primary schools.
Oemar Said, E. (2009). De Da Vinci Case: een onderzoek naar de relaties tussen vernieuwende leeromgevingen en de motivatie en regulatievoorkeuren van leerlingen in het MBO.
Koopman, M. (2010). Students’ goal orientations, information processing strategies and knowledge development in competence-based pre-vocational secondary education.
Mittendorff, K. M. (2010). Career conversations in senior secondary vocational education.
Crasborn, F. J. A. J., & Hennissen, P. P. M. (2010). The skilled mentor. Mentor teachers’ use and acquisition of supervisory skills.
Bragt, C. A. C. van (2010). Students’ educational careers in Higher Education: A search into key factors regarding study outcome.
Bakker, G. de (2010). Allocated only reciprocal peer support via instant messaging as a candidate for decreasing the tutoring load of teachers.
Vos, M. A. J. (2010). Interaction between teachers and teaching materials: on the implementation of context-based chemistry education.
Bruin-Muurling, G. (2010). The development of proficiency in the fraction domain.
Eindhoven School of Education dissertation series
182
Cornelissen, L. J. F. (2011). Knowledge processes in school-university research networks.
Kraemer, J-M. (2011). Oplossingsmethoden voor aftrekken tot 100.
Stiphout, I. M. van (2011). The development of algebraic proficiency.
Saeli, M. (2012). Teaching programming for secondary school: a pedagogical content knowledge based approach.
Putter-Smits, L. G. A. de (2012). Science teachers designing context-based curriculum materials: developing context-based teaching competence.
Ketelaar, E. (2012). Teachers and innovations: on the role of ownership, sense-making and agency.
Dehing, F. (2012). Preparing students for workplace learning in higher engineering education.
Vrijnsen-de Corte, M. C. W. (2012). Researching the teacher-researcher. Practice-based research in Dutch professional development schools.
Doppenberg, J. J. (2012). Collaborative teacher learning: settings, foci and powerful moments.
Linden, P.W.J. van der (2012). A design-based approach to introducing student teachers in conducting and using research.
Diggelen, M. R. van (2013). Effects of a self-assessment procedure on VET teachers’ competencies in coaching students’ reflection skills.
Stellingen
Behorende bij het proefschrift
Facilitating the use of recorded lectures: analysing students’ interactions to understand their navigational needs
van Petrus Johannes Barbara Gorissen
1. Elke student kan leren, maar niet op dezelfde dag en niet op dezelfde manier, hetgeen ook blijkt uit hun kijkgedrag bij recorded lectures. (Evans, G.; paragraaf 5.4.2 & hoofdstuk 3 en 4, dit proefschrift)
2. Na de constatering dat ook bij het taggen van recorded lectures studenten en docenten van elkaar verschillen, resteert de belangrijke vraag hoe ze elkaar zo goed mogelijk kunnen aanvullen. (hoofdstuk 7, dit proefschrift)
3. Mede ingegeven door sociaal wenselijk gedrag overschatten studenten de omvang van hun gebruik van recorded lectures in belangrijke mate. (paragraaf 8.3.2, dit proefschrift)
4. Ook al weten we wel beter, toch zal “total views for all recordings” nog lang de meest gebruikte statistiek voor het succes van recorded lectures blijven. (paragraaf 8.4, dit proefschrift)
5. De wens om studenten via learning analytics te ondersteunen bij het inrichten van hun onderwijs staat op gespannen voet met het recht van de student op privacy. (Boyd, D. , 2010; Campbell, J. P., DeBlois, P. B., & Oblinger, D. G., 2007)
6. Het Nederlands onderwijs blijkt veel van de technologische ontwikkelingen in de VS met enige afstand te volgen: we zetten vaak dezelfde stappen, maar stappen ook in dezelfde valkuilen.
7. Het is maar de vraag of meer gebruiken van technologie studenten beter maakt of dat betere studenten meer technologie gebruiken.
8. Als aan studenten gevraagd wordt of zij meer ondersteuning willen bij hun onderwijs, zullen ze deze vraag vrijwel altijd met ja beantwoorden.
9. Ondanks de opkomst van het elektronische boek, blijft ook dit proefschrift een artefact van de wetenschap dat op papier wordt verspreid.
10. Als je niet de eerste of de beste bent, kun je maar beter extra genieten van de rit.
Related Documents