1 FACILITATING DIAGNOSIS OF COLORECTAL CANCER WITH COMPUTED TOMOGRAPHIC COLONOGRAPHY DR DARREN JOHN BOONE MB BS BSC MRCS FRCR UNIVERSITY COLLEGE LONDON SUBMITTED FOR THE DEGREE OF DOCTOR OF MEDICINE (RESEARCH)

Welcome message from author
This document is posted to help you gain knowledge. Please leave a comment to let me know what you think about it! Share it to your friends and learn new things together.
Transcript
1
FACILITATING DIAGNOSIS OF COLORECTAL CANCER WITH COMPUTED TOMOGRAPHIC COLONOGRAPHY
DR DARREN JOHN BOONE MB BS BSC MRCS FRCR
UNIVERSITY COLLEGE LONDON
SUBMITTED FOR THE DEGREE OF DOCTOR OF MEDICINE (RESEARCH)

2
I, DARREN JOHN BOONE, CONFIRM THAT THE WORK PRESENTED IN THIS THESIS IS MY OWN. WHERE INFORMATION HAS BEEN DERIVED FROM OTHER SOURCES, I CONFIRM THAT THIS HAS BEEN INDICATED IN THE THESIS.

3
FOR MY WIFE AND CHILDREN:
WENDY, DANIEL, JOSEPH, ALANNAH AND MALACHI
DEDICATED TO MY FATHER:
GRAHAM SYDNEY BOONE; 1942-2013

4
ABSTRACT
Computed tomographic colonography (CTC) is a diagnostic technique involving helical volume
acquisition of the cleansed, distended colorectum to detect colorectal cancer or potentially
premalignant polyps. This Thesis summarises the evidence base, identifies areas in need of
further research, quantifies sources of bias and presents novel techniques to facilitate
colorectal cancer diagnosis using CTC.
CTC literature is reviewed to justify the rationale for current implementation and to identify
fruitful areas for research. This confirms excellent diagnostic performance can be attained
providing CTC is interpreted by trained, experienced observers employing state-of-the-art
implementation. The technique is superior to barium enema and consequently, it has been
embraced by radiologists, clinicians and health policy-makers. Factors influencing
generalisability of CTC research are investigated, firstly with a survey of European educational
workshop participants which revealed limited CTC experience and training, followed by a
systematic review exploring bias in research studies of diagnostic test accuracy which
established that studies focussing on these aspects were lacking. Experiments to address these
sources of bias are presented, using novel methodology: Conjoint analysis is used to ascertain
patients‘ and clinicians’ attitudes to false-positive screening diagnoses, showing that both
groups overwhelmingly value sensitivity over specificity. The results inform a weighted
statistical analysis for CAD which is applied to the results of two previous studies showing the
incremental benefit is significantly higher for novices than experienced readers. We have
employed eye-tracking technology to establish the visual search patterns of observers reading
CTC, demonstrated feasibility and developed metrics for analysis. We also describe
development and validation of computer software to register prone and supine endoluminal
surface locations demonstrating accurate matching of corresponding points when applied to a
phantom and a generalisable, publically available, CTC database. Finally, areas in need of future
development are suggested.

5
TABLE OF CONTENTS
Abstract .................................................................................................................................. 4
Table of Contents ................................................................................................................... 5
Preface ................................................................................................................................. 10
Acknowledgements .............................................................................................................. 11
List of Tables ......................................................................................................................... 13
Table of Figures .................................................................................................................... 14
Ethical approval statement .................................................................................................. 16
Glossary ............................................................................................................................... 17
THESIS OVERVIEW: ............................................................................................................ 18
BACKGROUND, HYPOTHESES AND STRATEGY ................................................................................. 18
Background .......................................................................................................................... 18
Research questions, Rationale, Hypotheses and Aims ......................................................... 21
Thesis strategy ......................................................................................................................27
SECTION A: ........................................................................................................................ 29
HISTORY, DEVELOPMENT, CURRENT STATUS AND FUTURE DIRECTIONS OF CT
COLONOGRAPHY ............................................................................................................... 29
1. HISTORY AND DEVELOPMENT OF CT COLONOGRAPHY................................................................. 30
1.1 Introduction .............................................................................................................. 30
1.2 The decline of the Barium Enema ............................................................................. 31
1.3 The rise of multi-detector CT ..................................................................................... 31
1.4 The birth of ‘Virtual colonoscopy’ ............................................................................. 32
1.5 Optimising technical implementation ....................................................................... 33
1.6 Early observer studies ............................................................................................... 34
1.7 New meeting, new name .......................................................................................... 35
1.8 International interest ................................................................................................ 35
1.9 Early European Research ........................................................................................... 36
1.10 The first large multi-centre trials ........................................................................... 38
1.11 International consensus on CTC............................................................................. 39

6
1.12 Ongoing research themes ...................................................................................... 39
1.13 Multicentre Performance studies; Evidence based technique ............................... 48
1.14 So what ever happened to the Barium Enema? .................................................... 50
1.15 The end of the beginning ....................................................................................... 51
2. CTC: CURRENT STATUS AND FUTURE DIRECTIONS ....................................................................... 53
2.1 Introduction .............................................................................................................. 53
2.2 Diagnostic Performance ............................................................................................ 53
2.3 Cost-effectiveness of CTC for primary screening ....................................................... 56
2.4 Training, standards, and validation .......................................................................... 56
2.5 patient acceptability and Bowel preparation .............................................................57
2.6 Safety ........................................................................................................................ 58
2.7 Who should report CTC? ........................................................................................... 59
2.8 Extracolonic findings ................................................................................................. 59
2.9 Computer aided detection (CAD) .............................................................................. 60
2.10 Conclusion ................................................................................................................ 62
SECTION B: ........................................................................................................................ 63
IDENTIFYING AND QUANTIFYING LIMITATIONS IN CTC RESEARCH ....................................... 63
Overview .............................................................................................................................. 63
3. WHO ATTENDS CTC TRAINING? A SURVEY OF PARTICIPANTS AT EUROPEAN EDUCATIONAL WORKSHOPS .. 64
3.1 Introduction .............................................................................................................. 64
3.2 Methods .................................................................................................................... 65
3.3 Results ....................................................................................................................... 66
3.4 Discussion .................................................................................................................. 73
4. SYSTEMATIC REVIEW: SOURCES OF BIAS IN STUDIES OF DIAGNOSTIC TEST ACCURACY ............................ 76
4.1 Introduction ...............................................................................................................76
4.2 Methods .................................................................................................................... 78
4.3 Results ....................................................................................................................... 82
4.3.1 Description of studies investigating clinical context ...........................................................................82
4.3.2 Study Characteristics and settings (Table 11) .....................................................................................83

7
4.3.3 Primary study design ..........................................................................................................................83
4.3.4 Observer and case characteristics (Table 11) .....................................................................................83
4.3.5 Effect of sample disease prevalence (Table 12) ..................................................................................84
4.3.6 Effect of blinding observers to disease prevalence (Table 12) ............................................................84
4.3.7 Effect of reporting intensity (Table 13) ............................................................................................... 87
4.3.8 Effect of observer recall bias (Figure 14) ............................................................................................88
4.3.9 ‘Laboratory’ vs. ‘field’ study context ..................................................................................................89
4.4 Discussion .................................................................................................................. 90
SECTION C: ........................................................................................................................ 94
IMPLEMENTING NEW TECHNIQUES AND STRATEGIES IN CTC RESEARCH .............................. 94
Overview .............................................................................................................................. 94
5. WHAT IS THE RELATIVE IMPORTANCE PLACED ON FALSE POSITIVE VS TRUE POSITIVE DETECTIONS AT CTC? A
DISCRETE CHOICE EXPERIMENT .................................................................................................. 96
5.1 Introduction .............................................................................................................. 96
5.2 Methods .................................................................................................................... 98
5.3 Results ..................................................................................................................... 105
5.4 Discussion ................................................................................................................ 110
6. INCREMENTAL NET-EFFECT OF COMPUTER AIDED DETECTION (CAD) FOR INEXPERIENCED AND EXPERIENCED
READERS OF CTC ................................................................................................................ 114
6.1 Introduction ............................................................................................................ 114
6.2 Methods .................................................................................................................. 117
6.3 Results ..................................................................................................................... 124
6.4 Discussion ................................................................................................................ 130
7. ESTABLISHING VISUAL SEARCH PATTERNS DURING CTC: TECHNICAL DEVELOPMENT OF EYE TRACKING
TECHNOLOGY, PROPOSED METRICS FOR ANALYSIS AND PILOT STUDY .................................................. 133
7.1 Introduction ............................................................................................................ 134
7.2 Materials and Methods ........................................................................................... 135
7.3 Results ..................................................................................................................... 138
7.4 Discussion ................................................................................................................ 144
8
SECTION D: ..................................................................................................................... 146
DEVELOPMENT AND VALIDATION OF A NOVEL COMPUTER ALGORITHM TO FACILITATE CT
COLONOGRAPHY INTERPRETATION .................................................................................. 146
Overview ............................................................................................................................ 146
8. DEVELOPMENT OF A NOVEL COMPUTER ALGORITHM FOR MATCHING PRONE AND SUPINE ENDOLUMINAL
LOCATIONS DURING CTC INTERPRETATION ................................................................................. 148
8.1 Introduction ............................................................................................................ 148
8.2 Methods: Algorithm development .......................................................................... 149
8.3 Results: Validation ................................................................................................... 160
8.4 Discussion ................................................................................................................ 169
9. AUTOMATED PRONE TO SUPINE HAUSTRAL FOLD MATCHING USING A MARKOV RANDOM FIELD MODEL
....................................................................................................................................... 172
9.1 Introduction ............................................................................................................ 173
9.2 Methods: Algorithm development ...........................................................................176
9. 3 Methods: Validation ................................................................................................ 179
9.4 Results ..................................................................................................................... 180
9.5 Conclusion ............................................................................................................... 181
10. DEVELOPMENT OF A PORCINE COLONIC PHANTOM FOR OPTIMISATION OF PRONE-SUPINE REGISTRATION
ALGORITHMS ...................................................................................................................... 183
10.1 Introduction ......................................................................................................... 183
10.2 Materials and Methods ....................................................................................... 185
10.3 Results ................................................................................................................. 188
10.4 Discussion ............................................................................................................ 192
11. COMPUTER ASSISTED SUPINE-PRONE REGISTRATION (CASPR): EXTERNAL CLINICAL VALIDATION ..... 194
11.1 Introduction ......................................................................................................... 194
11.2 Materials and Methods ....................................................................................... 195
11.3 Results ................................................................................................................. 203
11.4 Discussion ............................................................................................................ 209

9
SECTION E: ...................................................................................................................... 213
CONCLUSIONS AND RECOMMENDATIONS FOR FUTURE RESEARCH ................................... 213
Overview ............................................................................................................................ 213
12. DISCUSSION, CONCLUSIONS AND SUMMARY ......................................................................... 214
12.1 Discussion of results ............................................................................................ 214
12.2 The Future ............................................................................................................ 222
12.3 Conclusion ........................................................................................................... 226
APPENDICES
APPENDI X A:
PUBLICATIONS ARISING FROM THIS THESIS ................................................................................. 227
Book Chapters .....................................................................................................................227
Invited reviews and editorials .............................................................................................227
Original articles ...................................................................................................................227
Abstracts ............................................................................................................................ 231
APPENDIX B:
ESGAR WORKSHOP QUESTIONNAIRE ...................................................................................... 234
APPENDIX C:
ACRIN CTC TRIAL CASES USED FOR VALIDATION ......................................................................... 236

1 0
PREFACE
This Thesis represents original work by the author and has not been submitted in any form to
any other University. Where use has been made of the work of others it has been duly
acknowledged in the text.
The research described in this Thesis was carried out at the Centre for Medical Imaging,
University College London (UCL) and University College Hospital (UCLH) with additional data
collection from European educational workshops organised by the European Society of
Gastrointestinal and Abdominal Radiology (ESGAR)
Research described in this Thesis was carried out under the supervision of Professor Steve
Halligan and Professor Stuart Taylor, Centre for Medical Imaging, University College London.
A proportion of this work represents independent research commissioned by the National
Institute for Health (NIHR) Research under its Programme Grants for Applied Research funding
scheme (RP-PG-0407-10338). Research was undertaken at UCLH and UCL, which receive a
proportion of funding from the NIHR Comprehensive Biomedical Research Centre funding
scheme. The views expressed in this publication are those of the author and not necessarily
those of the project supervisors, the NHS, the NIHR or the Department of Health.
1 1
ACKNOWLEDGEMENTS
I would like to express sincere thanks to the following individuals, without whom this Thesis
would not have been possible.
Firstly to my mentor, supervisor and friend, Professor Steve Halligan: His passion for research
and clinical excellence is an inspiration. I am very grateful for his unfaltering enthusiasm,
expertise and patience; it has been a privilege.
I am also indebted to my co-supervisor, Professor Stuart Taylor, for stimulating an interest in
clinical research at the outset of my specialist training. He has provided balanced, practical
support from my first research project through to the completion of this Thesis.
Professor Halligan has assembled a peerless team of collaborators alongside whom I feel
honoured to have worked. In particular, I would like to extend my sincere thanks to Professor
Douglas Altman and Dr Susan Mallett (Centre for Statistics in Medicine in Oxford), Professor
David Hawkes, Holger Roth, Tom Hampshire, Dr Mingxing Hu, Dr Jamie McClelland (Centre for
Medical Image Computing, UCL); Professor David Manning and Dr Peter Phillips (University of
Cumbria); Professor Richard Lilford, Dr Lily Yeo, Dr Shihau Zhu, (School of Health and
Population Sciences, University of Birmingham); Dr Christian von Wagner, Alex Ghanouni, Sam
Smith and Professor Jane Wardle (Department of Health Behaviour Research, University
College London).
Particular thanks go to research administrators Heather Fitzke and Nichola Bell, without whom
the Centre for Medical Imaging, University College London, would not run so smoothly.
In addition, I am grateful for the assistance of the European Society of Gastrointestinal and
Abdominal Radiology (ESGAR) CTC committee for their contributions, advice and assistance
with several studies in this Thesis. Namely, Dr Roger Frost (Salisbury NHS Trust, Salisbury, UK),
Professor Clive Kay (Bradford Royal Infirmary, UK), Professor Jaap Stoker , (Academic Medical
Center, Amsterdam, the Netherlands), Dr Philippe Lefere (Stedelijk Ziekenhuis, Roeselare,

1 2
Belgium), Dr Emanuele Neri (University of Pisa, Pisa, Italy); Professor Andrea Laghi (La Sapienza,
Rome, Italy). I would also like to extend my thanks to members of the ESGAR CTC educational
faculty, and the ESGAR administrators Simone Semler and Brigitte Lindlbauer. Thanks also to Dr
David Burling for advice regarding Thesis format and compilation.
I would also like to thank the administrative staff and radiographers at University College
Hospital for their friendship and support throughout my research fellowship. In particular,
Elaine Atkins and Heena Patel who went beyond the line of duty to assist with my porcine
phantom experiment.
I also gratefully acknowledge Andy Humphries of Humphries’ Slaughterhouse, Brentwood,
Essex for providing the porcine colonic specimen.
I am very grateful to Medcisght plc (London, UK), in particular Greg Slabaugh, and Justine
McQuillan, for providing interpretation software and test cases used for these studies.
Image data for external validation were obtained from The Cancer Imaging Archive
(http://cancerimagingarchive.net/) sponsored by the Cancer Imaging Program, DCTD/NCI/NIH.
Thanks go to Prof Carl Jaffe for his assistance with the archive.
This Thesis was funded by the UK National Institute for Health Research (NIHR) under its
Programme Grants for Applied Research funding scheme (RP-PG-0407-10338). Without their
financial support, this Thesis would not have been possible.
Above all, I thank my wife and children for their patience, understanding and encouragement
over the course of my research fellowship.

1 3
LIST OF TABLES
Table 1: Diagnostic performance of CTC compared to same-day, unblinded colonoscopy ....................... 49
Table 2: Milestones in the history of CTC .................................................................................................. 52
Table 3: Occupation of workshop participants .......................................................................................... 68
Table 4: CTC service provision at participants’ local hospitals ................................................................... 69
Table 5: Workshop participants’ previous CTC training and experience ................................................... 69
Table 6: Attitudes of workshop participants to the optimal role of CTC .................................................... 72
Table 7: Attitudes of participants to extracolonic findings at CTC ............................................................. 73
Table 8: Primary search strategy: Search for related systematic reviews. ................................................. 78
Table 9: Secondary search strategy: Details of the 10 ‘key publications’, ................................................. 79
Table 10: Table detailing the Boolean search strings used for the tertiary search strategy ...................... 81
Table 11: Details of the 12 publications included in the systematic review. ............................................. 85
Table 12: Articles investigating the effect of manipulating the prevalence of abnormality ...................... 87
Table 13: Estimation of reporting intensity and generalisability to daily practice of ‘lab’ studies ............ 88
Table 14: Discrete choice experiment design: Overview of attributes and levels for polyp detection ...... 99
Table 15: Discrete choice experiment design: Overview of attributes and levels for cancer detection .. 100
Table 16: Demographic characteristics and household annual income of participants .......................... 106
Table 17: False positive rate trade-off values and relative weighting for cancer and polyp detection ... 109
Table 18: Patient and professionals’ willingness to pay for a 0.1 increase in sensitivity ......................... 110
Table 19: Paradigms for integration of CAD into CTC interpretation. ...................................................... 119
Table 20: Relative weighting values ‘W’ determined from Patient and Professional groups ................... 121
Table 21: Per-patient results for CAD assistance when used in concurrent mode .................................. 126
Table 22: Per-polyp sensitivity for CAD assistance when used in concurrent mode ............................... 127
Table 23: Effect of CAD assistance when used in second-read mode for interpretation ......................... 128
Table 24: Summary of errors of search and errors of recognition for 6 readers ..................................... 139
Table 25: Time to first pursuit and cumulative dwell for each polyp, for each reader. ........................... 140
Table 26: Number of times each polyp was viewed by each reader during its time on screen. .............. 141
1 4
Table 27: Decision time (s) for each reader for each polyp, with the average overall for each polyp ..... 141
Table 28: Registration error in mm for 13 polyps in the 13, paired colonography datasets .................... 166
Table 29: Initial validation using observer-identified haustral fold correspondences ............................. 180
Table 30: Surface registration initialisation with non-collapsed cases. ................................................... 181
Table 31: Registration error for surface registration algorithm applied to porcine colonic phantom ...... 189
Table 32: Comparison of registration error with and without feature-based initialisation ..................... 191
Table 33: Case and polyp selection criteria used to provide a validation sample ................................... 196
Table 34: Proportion of validation cases with inadequate distension or excess colonic residue ............ 197
Table 35: Summary of gross 3D error across all polyps in validation sample. ......................................... 197
Table 36: Per segment distribution of polyps in the validation sample .................................................. 198
Table 37: Multiplanar review clinical utility score: Description of pre-specified conspicuity criteria ..... 205
Table 38: 3D endoluminal clinical utility score: Description of pre-specified conspicuity criteria .......... 206
TABLE OF FIGURES
Figure 1: Single oblique, magnified projection from a double contrast, BaE examination. .................... 31
Figure 2: Axial CT following full bowel catharsis, spasmolysis and carbon dioxide insufflation. ............... 32
Figure 3: Endoluminal CTC viewed from the caecum. ............................................................................... 33
Figure 4: Left: Supine, axial CTC. ............................................................................................................... 34
Figure 5: 2D coronal (Left) and 3D endoluminal CTC (right) at the level of the mid-rectum. ................... 37
Figure 6: Coronal CTC.with incidental aortic aneurysm ............................................................................ 41
Figure 7: Endoluminal CTC with CAD. ........................................................................................................ 43
Figure 8: Axial CTC following oral contrast. Homogenous fluid ‘tagging’ .................................................. 47
Figure 9: Geographical distribution of delegates attending ESGAR CTC courses. .................................... 67
Figure 10: Participants’ CTC practice ......................................................................................................... 68
Figure 11: Level of prior training among inexperienced readers .............................................................. 70
Figure 12: Technical implementation of CTC ............................................................................................. 71

1 5
Figure 13: Participants’ preferred reading paradigm ................................................................................. 72
Figure 14: Duration and scientific justification of the ‘washout’ to reduce observer recall bias .............. 89
Figure 15: Example question from the DCE cancer detection scenario. ................................................. 101
Figure 16: Distribution of patients’ and professionals’ maximum trade-off for polyps and cancer. ....... 108
Figure 17: Number of additional FP detections traded for one additional true-positive diagnosis ........ 111
Figure 18: Volume rendered endoluminal CTC displaying a CAD prompt ............................................... 115
Figure 19: Ranked trade-off values for Professional respondents from the DCE ..................................... 122
Figure 20: Ranked trade-off values for Patient respondents from the DCE ............................................. 123
Figure 21: Frame-by-frame ROIs around a 12mm polyp at 3D CTC ........................................................ 137
Figure 22: Schematic time course of identified gaze and mouse events................................................. 139
Figure 23: Distribution of a reader’s gaze in a 25s video case with a 12mm polyp. ................................ 142
Figure 24: Time course of reader eye gaze and polyp extent for a single reader .................................... 143
Figure 25: The calculated distance from gaze to the polyp boundary ..................................................... 143
Figure 26: The principle of colon surface registration between prone and supine CTC .......................... 150
Figure 27: Centreline extraction using the fast marching method on a synthetic image ........................ 152
Figure 28: Left: Enlarged view of handles caused by limitation of the segmentation quality ................. 153
Figure 29: Sampling the unfolded mesh to generate raster-images suitable for registration. ................ 155
Figure 30: The shape index (SI): a normalised measurement to describe local surface structures. ....... 156
Figure 31: Supine, prone and deformed supine to match prone raster images ...................................... 156
Figure 32: Deformation field on a section of colon at the final, highest resolution step. ....................... 158
Figure 33: Descending colon is collapsed supine but fully distended in prone CTC. .............................. 159
Figure 34: Cylindrical representation as raster images of the collapsed supine and prone CTC. ............ 160
Figure 35: Marked distension discrepancy between prone and supine CTC ........................................... 161
Figure 36: Differing distension causing dissimilar local features in the cylindrical images. .................... 161
Figure 37: Delineating 3D polyp volumes using ITK-snap ........................................................................ 162
Figure 38: Masking polyps to ensure they do not influence subsequent registration ............................ 163
Figure 39: Overlay of masked out polyps before and after B-spline registration. ................................... 164
Figure 40: Polyp localisation after registration using prone and supine virtual endoscopic views. ........ 164
Figure 41: Distributions of reference points along the centreline from caecum to rectum .................... 167

1 6
Figure 42: Normalised histograms of the Fold Registration Error (FRE) distributions in mm .................. 168
Figure 43: External 3D rendered view of prone (left) and supine (right) datasets. ................................. 174
Figure 44: Endoluminal CTC showing morphologically disparate corresponding folds ........................... 176
Figure 45: External (a) and internal (b) endoluminal reconstructions showing haustra ......................... 178
Figure 46: Unprepared porcine intestinal specimen ............................................................................... 185
Figure 47: Excised, cleansed colonic specimen with short residual terminal ileum ................................ 185
Figure 48: Specimen sutured at each end with indwelling insufflation catheter in situ ......................... 185
Figure 49: The colonic specimen is distended with water via the insufflation catheter ......................... 186
Figure 50: Colonic specimen distended at 40mmHg to test integrity ..................................................... 186
Figure 51: Colonic specimen placed within its artificial ‘mesentery’ ...................................................... 186
Figure 52: Insufflated colonic specimen, suspended via the ‘artificial mesentery’ ................................. 187
Figure 53: CTC of porcine phantom. ........................................................................................................ 188
Figure 54: Porcine colonography acquisitions which to test the algorithm. ........................................... 189
Figure 55: Surface rendered CTC of porcine colonic phantom ................................................................ 190
Figure 56: Comparison of registration error with and without feature-based initialisation ................... 191
Figure 57: Example of polyp conspicuity score of 5 (direct hit) using a 120o 3D endoluminal FOV ........ 200
Figure 58: Example of polyp conspicuity score of 4 (near miss) using a 120o 3D endoluminal FOV ....... 200
Figure 59: Example of polyp conspicuity score of 2 or 3 (partial) using a 120o 3D endoluminal FOV .... 201
Figure 60: Example of polyp conspicuity score of 1 (failure) using a 120o 3D endoluminal FOV ............ 201
Figure 61: Conspicuity of polyps at multiplanar review following CASPR .............................................. 207
Figure 62: 3D error. Conspicuity of polyps at endoluminal review following automated CASPR. ........... 208
ETHICAL APPROVAL STATEMENT
Research Ethics Committee approval was sought and obtained for all research detailed in this
Thesis. All patients contributing data to this Thesis gave written informed consent unless a
waiver was in place. Specifically, full permission for data-sharing was obtained where
anonymised CTC data were analysed across different centres.

1 7
GLOSSARY
ACR: American College of Radiology
ACRIN: American College of Radiology Imaging Network
AGA: American Gastroenterological Association
CAD: Computer Aided Detection
CASPR: Computer Aided Supine-Prone Registration
CI: Confidence Interval
CMS: Centers for Medicare and Medicaid Services
CRADS: CTC reporting and data system
CRC: Colorectal Cancer
CT: Computed Tomography
CTC: Computed tomographic colonography
DCE: Discrete Choice Experiment
DoD: Department of Defence (US)
ESGAR: European Society of Gastrointestinal and Abdominal Radiology
FOBT: Faecal occult blood test
FN: False Negative (detection)
FP: False Positive (detection)
HIPAA Health Insurance Portability and Accountability Act
LREC: Local Research Ethics Committee
MRF Markov Random Field
NDACC Normalised distance along the colonic centreline
p: Probability value
RCT: Randomized controlled trial
ROC: Receiver Operating Characteristic
ROC AUC: Area under the ROC curve
ROI: Region of interest
SIGGAR: Special Interest Group in Gastrointestinal and Abdominal Radiology
SD: Standard deviation

1 8
THESIS OVERVIEW: BACKGROUND, HYPOTHESES AND STRATEGY
BACKGROUND
Timely and efficient colorectal cancer diagnosis is an international healthcare priority; the
disease is responsible for over 600,000 deaths worldwide each year (1). Diagnosis and removal
of potentially premalignant adenomatous polyps has been shown to reduce the lifetime risk of
colorectal cancer death by over 25% (2) yet, uptake of colorectal cancer screening remains
poor (3). The gold-standard whole-colon examination, optical colonoscopy, is expensive, time-
consuming and invasive, carrying a small, but well recognised mortality (4). Therefore, it has
been suggested that a safer, less invasive investigation could increase screening uptake and
hence, reduce missed cancer diagnosis. However, for many years, the radiological colorectal
examination of choice has been the double contrast barium enema (BaE) which has been
shown to be insufficiently sensitive for screening (5) and, despite being relatively safe, is
disliked by many patients(6). Consequently, there has been considerable interest in developing
an alternative radiological technique that could serve as a viable substitute for colonoscopy.
Computed tomographic colonography (CTC) is a relatively novel diagnostic technology used to
examine the large bowel. The technique combines helical CT scanning and three-dimensional
(3D) image rendering of the cleansed, distended colorectum mimicking the view of the
conventional colonoscopist, hence the alternative title ‘virtual colonoscopy’(7). Studies have
shown CTC to be safe (8) and acceptable to patients (9). Moreover, CTC is more accurate than
BaE and preferred by patients(10). Furthermore, multicentre comparative studies from the USA
have suggested that CTC could rival the sensitivity and specificity of colonoscopy for the
detection of polyps and cancer in populations with a high incidence of colorectal cancer (11,
12) and asymptomatic subjects (13, 14); meta-analysis also suggests diagnostic performance is
comparable to colonoscopy in certain circumstances (15). While these data are encouraging,
1 9
the results of large trials in academic institutions may not be generalisable to daily practice:
Several sources of bias that influence the transferability of diagnostic test performance studies
from the ‘laboratory’ setting to the ‘field’ are recognised but their impact remains unquantified
presently. For example, observers involved in CTC validation studies have usually undergone
extensive training and, in some cases, stringent examinations prior to trial participation (16).
Conversely, the level of training and experience of those interpreting CTC in European clinical
practice is unknown and, at present, there is no requirement for formal accreditation.
Moreover, while it is recognised that experienced, trained observers outperform novice
readers, the mechanism behind this remains poorly understood(17) and a coherent strategy for
CTC training remains elusive. Other branches of diagnostic imaging such as mammography
have medical image perception literature to inform implementation(18) yet, to date, this has
not been applied to complex 3D interpretation tasks such as CTC.
Reacting to the need to improve diagnostic sensitivity, particularly among less experienced
readers, research groups have developed and validated computer aided detection (CAD)
technology (19, 20). However, the largest multicase, multireader trials have also utilised
experienced observers from large academic centres (20, 21). While studies have suggested CAD
can narrow the gap between novice and experienced readers, sufficiently powered research
remains awaited(22). Moreover, where CAD increases sensitivity, there is usually an
accompanying reduction in specificity(23) yet the potential clinical implications of this trade-off
are poorly understood. While the consequences of a false negative diagnosis (e.g. missed polyp
or cancer) usually outweigh a false positive detection (e.g. unnecessary colonoscopy) standard
statistical analyses may not account for this and, hence, underestimate the clinical benefit of
such technology. For example, regulatory approval often requires comparison of the area under
the receiver operating characteristic curve (ROC AUC) to approve new diagnostic technology,
yet this method inherently combines sensitivity and specificity with equal weighting and,
consequently, may not be appropriate where the clinical consequences of reductions and gains
in sensitivity and specificity are not equivalent(24). Collaborators have devised a novel
statistical method (19) to incorporate a weighting based upon the clinical consequences of
changes in sensitivity vs. specificity but at present, the relative value clinicians and patients
ascribe to these test attributes remains speculative.

2 0
Finally, despite correct annotation by CAD, even experienced readers incorrectly disregard true
positive pathology (25). This reinforces the interpretative challenge and suggests there remains
a need for further developments in human-computer interaction to maximise reader
performance. By way of example, the importance of matching endoluminal locations between
prone and supine CT acquisitions to differentiate mobile colonic residue from fixed mural
pathology is well recognised (26). However, this task is complicated by considerable colonic
deformation which takes place when the patient changes position (27). Therefore,
development of computer software which can accurately match endoluminal surface loci
between prone and supine datasets has the potential to facilitate interpretation.
In summary, extensive research has brought CTC from an experimental technique in specialised
academic units to everyday radiological practice yet there remains considerable scope to
improve training, interpretation, CAD and to develop novel computer technologies to improve
diagnostic accuracy using CTC.

2 1
RESEARCH QUESTIONS, RATIONALE, HYPOTHESES AND AIMS
WHAT IS THE RATIONALE FOR CURRENT CTC IMPLEMENTATION?
AIM:
i) Summarise the history and development of CTC from its inception to present day. In
particular, to review landmark evidence that has shaped current practice.
ii) Review CTC literature published between 1st April 2010 and 31st March 2011 to describe
present status, limitations and areas requiring further research.
WHAT IS THE LEVEL OF CTC EXPERIENCE AND TRAINING AMONG EUROPEAN RADIOLOGISTS?
RATIONALE:
Comparative studies from the USA and Europe have suggested that CTC can achieve high
sensitivity for the detection of polyps and cancer in at-risk populations (11, 12) and screening
populations (13, 14). However, the data are heterogeneous and some trials have shown
discrepant performance (28, 29). While the reasons for this are multifactorial, the level of
reader training and experience are widely accepted as contributory. Each participating
radiologist in the ACRIN National CTC trial (16) had experience of >500 CTC cases (or took part
in 2 days’ focused individual training) and had to achieve a sensitivity of at least 0.90 for large
polyps in a qualifying examination. Conversely, current European and UK consensus statements
(30, 31) recommend a minimum experience of just 50 validated datasets and no formal process
of accreditation exists.

2 2
HYPOTHESIS:
At present, the level of training and experience of European radiologists reporting CTC is
insufficient; diagnostic accuracy suggested by research studies is likely non-generalisable to
daily clinical practice.
AIM:
To survey European radiologists attending directed CTC training workshops with a view to
establishing their level of experience, prior training, and CTC implementation.
TO WHAT EXTENT DOES RESEARCH METHODOLOGY BIAS STUDIES OF DIAGNOSTIC TEST ACCURACY?
RATIONALE:
Performing research in an artificial ‘laboratory’ environment, for example, by blinding
observers to the a priori expectation of disease or by enriching the sample’s prevalence of
abnormality, can introduce bias. Although essential for evidence-based application of CTC
performance studies, these sources of bias are poorly researched. Conversely, attempts to
minimise additional potential sources of bias such as ‘observer recall’ increase time, expense
and complexity of CTC research but without compelling evidence to support the practice.
HYPOTHESIS:
Currently employed research methodology may introduce potential sources of bias into studies
of diagnostic test accuracy but these are poorly researched and their impact, unquantified.
AIM:
To perform a systematic review to identify sources of bias in studies of diagnostic test accuracy.
In particular, to quantify those influencing the generalisability of research performed in the
‘laboratory’ to the ‘field,’ via manipulating sample prevalence and reporting intensity.
2 3
WHAT IS THE RELATIVE VALUE OF TRUE VS. FALSE POSITIVE DIAGNOSIS WHEN SCREENING USING CTC?
RATIONALE:
Qualitative research confirms that patients and clinicians value gains in sensitivity far beyond
losses in specificity; the clinical consequences of misclassification are profoundly different (32,
33). However, customary quantitative methods such as Likert scales are unable to determine
the relative value of these two attributes as there is no requirement for the respondent to
compromise when test attributes are inter-related. Conjoint analysis is a relatively novel
technique that could be employed to ascertain the relative weightings clinicians and patients
ascribe to false positive vs. false negative detection at CTC. This, in turn could be used to inform
novel statistical methods.
HYPOTHESIS:
Conjoint analysis can be applied successfully to CTC research to determine the opinions of
patients and clinicians to false positive and false negative diagnosis.
AIM:
To develop and perform a discrete choice experiment to determine the relative weighting
clinicians and patients ascribe to diagnostic sensitivity vs. specificity in the context of colorectal
cancer screening with CTC.
CAN A NOVEL WEIGHTED STATISTICAL ANALYSIS BE APPLIED TO STUDIES OF CAD FOR CTC?
RATIONALE:
CAD increases reader sensitivity, particularly among inexperienced observers, but often at the
expense of reduced specificity (19, 34). CAD software alerts the reader to suspicious areas on
the endoluminal surface that may represent genuine polyps or spurious residue. While this can

2 4
enable detection of pathology, otherwise overlooked, it also increases the likelihood of FP
characterisation. If CAD increases sensitivity but with a corresponding reduction in specificity,
contingent upon the statistical analysis used, these changes may ‘cancel each other out’
leading to non-significant results. However, the clinical consequences of FP and FN diagnoses
differ markedly (i.e. unnecessary colonoscopy vs. missed cancer) and statistical analysis should
be able to account for this.
HYPOTHESIS:
A weighted statistical measure that considers the discrepant clinical consequences of
diagnostic misclassifications can be applied to CAD studies.
AIM:
To apply this novel analysis using the weighting determined by conjoint analysis to the results
of two previous multireader, multicase CTC CAD studies (19, 34) and compare the incremental
benefit of CAD when used by experienced readers and inexperienced readers.
IS IT POSSIBLE TO MEASURE VISUAL SEARCH STRATEGY DURING CTC INTERPRETATION USING EYE-TRACKING?
RATIONALE:
Radiological errors usually result from either failure to detect abnormalities (perceptive error)
or incorrect characterisation of pathology (classification error). The majority of false negative
diagnoses at CTC (i.e. missed polyps or cancers) have been shown to be perceptive errors,
particularly among inexperienced readers (35). Therefore, training should focus on improving
detection. However, CTC data display is complex and interpretation varies considerably
between readers with little consensus existing regarding the optimum reading paradigm (30,
31, 36). Consequently, a coherent training strategy remains unclear. Medical image perception

2 5
research has been central to optimising the display of chest radiographs, orthopaedic films and
mammograms(37-39). However, eye-tracking technology is currently limited to plain 2D static
radiographic images. The need to develop state-of-the art eye-tracking methodology has been
identified (18) but at present this is impossible for complex, moving 3D displays, such as CTC.
HYPOTHESIS:
Eye-tracking technology can be successfully applied to CTC; visual search patterns from readers
with varying expertise can be recorded and compared.
AIM
To establish if eye-tracking technology can be applied to record visual search strategies during
CTC interpretation.
CAN AN AUTOMATED PRONE-SUPINE REGISTRATION ALGORITHM ACCURATELY MATCH CORRESPONDING
ENDOLUMINAL SURFACE LOCATIONS?
RATIONALE:
Matching corresponding endoluminal locations between prone and supine datasets is a
cornerstone of competent CTC interpretation (26). However, considerable colonic deformation
takes place during patient repositioning (27) which complicates the radiologist’s task, prolongs
interpretation and may engender error. Current vendor platforms enable approximate prone-
supine registration by comparing the distance along the computed colonic centreline(40) but
this is inherently one-dimensional and therefore cannot provide a 3D endoluminal surface
location. Moreover, centreline methods are prone to error in cases with luminal collapse (41-
43). Development of a computer algorithm to automate endoluminal location matching would
likely facilitate CTC interpretation and could improve existing CAD algorithms.

2 6
HYPOTHESIS:
A novel computer registration algorithm can establish accurate corresponding endoluminal
locations between prone and supine CTC acquisitions.
AIM:
To develop, train and validate computer software that can accurately match 3D endoluminal
locations between prone and supine CTC acquisitions while remaining resistant to regions of
colonic collapse or suboptimal distension.

2 7
THESIS STRATEGY
This Thesis comprises twelve Chapters grouped into five Sections as outlined below. Unless
otherwise stated, all work is that of the author. Peer-reviewed publications linked to each
Chapter are outlined in Appendix A.
Section A summarises the evidence base for CTC with a comprehensive review of published
literature to date. In particular, this Section identifies limitations in existing research and areas
requiring further development. This provides background to this Thesis and the motivation for
the original research studies presented in the following Chapters. Chapter 1 introduces CTC
with a narrative précis of the landmark publications which have shaped the technique from its
first description as an experimental procedure to becoming the radiological examination of
choice for detecting colorectal neoplasia. Chapter 2 discusses the current evidence for CTC
implementation and performance with a review of the literature published during one year (1st
April 2010 to 31st March 2011). This provides an overview of current CTC research and outlines
the key themes providing the focus for future development.
Drawing upon recurring themes identified in Section A, Section B attempts to address sources
of bias and factors limiting the generalisability of CTC research. Chapter 3 aims to establish the
level of CTC experience and training of European radiologists via a survey of participants
attending a number of educational workshops. Chapter 4 provides a broader perspective on
the limitations affecting studies of diagnostic test accuracy via systematic review. Sources of
bias related to an artificial ‘laboratory’ setting such as enriched disease prevalence, concealed
clinical information and repeated interpretation of the same data are investigated and
quantified. Recommendations from this Chapter inform the design of subsequent experiments
within this Thesis.
Section C builds upon limitations identified thus far and introduces three experimental
techniques not previously applied to CTC research: Chapter 5 describes the use of ‘probability
equivalence‘ conjoint analysis (discrete choice experiment) to determine the relative value of
sensitivity vs. specificity in the context of screening for colorectal neoplasia. Chapter 6 employs
2 8
the results from chapter 5 to inform a novel statistical method; the results of the discrete
choice experiment provide the ‘weighting’ required for the analysis. This statistical technique is
applied to two previous multireader, multicase studies to determine the incremental benefit
derived by novice and experienced observers when interpreting CTC with CAD. Chapter 6 also
reinforces the marked discrepancy in polyp detection performance among observers of varying
experience, despite the assistance of CAD. However, as identified in section A, the reasons for
this disparity remain poorly researched. Therefore, Chapter 7 describes the technical
development of eye-tracking methodology to enable assessment of observers’ visual search
patterns during CTC.
The results of Section C suggest that even experienced radiologists can benefit from computer
assistance. Therefore, Section D describes the development and validation of computer
algorithms to match endoluminal locations in prone and supine colonography data despite
colonic deformation and luminal collapse. Chapter 8 summarises development of a technique
for applying non-rigid registration of cylindrical representations of the endoluminal surface to
provide surface correspondence between prone and supine acquisitions. Despite promising
performance on a carefully selected validation dataset, limitations exist in terms of automation
and overcoming poor luminal distension. Therefore, Chapter 9 describes a separate algorithm
to match haustral folds using a Markov Random Field technique. The result of combining these
algorithms is presented in Chapter 10 using a porcine phantom and Chapter 11 describes the
results of clinical validation using a well characterised, publicly available CTC database.
Section E concludes the Thesis; Chapter 12 summarises the key findings and suggests topics for
future development.

2 9
SECTION A: HISTORY, DEVELOPMENT, CURRENT STATUS AND FUTURE DIRECTIONS OF CT COLONOGRAPHY

3 0
CHAPTER 1 1. HISTORY AND DEVELOPMENT OF CT COLONOGRAPHY
AUTHOR DECLARATION
The review presented in this Chapter was compiled and written by the author under the
supervision of Professor Steve Halligan and Professor Stuart Taylor. Related work was published
in the book chapter: Boone D, Halligan S, Taylor SA (2013). CTC Background and Development
in Cash, B. (Ed.), Colorectal Cancer Screening and Computerized Tomographic Colonography: A
Comprehensive Overview (pp 41-58). New York, USA: Springer
1.1 INTRODUCTION
Colorectal imaging using CT coupled with full laxative bowel preparation and gaseous
insufflation was first described in the early 1980s(44). However, the technique did not gain
widespread recognition until 1994 when advances in computer processing technology enabled
Vining and co-workers (45) to demonstrate the feasibility of using volumetric CT data to
generate a 3D, endoluminal reconstruction, termed ‘virtual colonoscopy.’ Since then, research
relating to CTC has continued to gather exponential momentum, developing implementation,
interpretation and diagnostic performance. Consequently, CTC has grown from a novel
technique practiced in a handful of specialist academic centres to one that has widely
surpassed the barium enema (BaE) as the preferred colorectal imaging modality in radiological
departments. This Chapter charts the evolution of CTC over the last two decades, focusing in
particular on research that has shaped current practice.

3 1
1.2 THE DECLINE OF THE BARIUM ENEMA
Prior to the advent of CTC, the preferred radiologic investigation for suspected colorectal
cancer (CRC) or adenomatous polyps was the double-contrast barium enema (BaE) (Figure 1).
Compared to the gold-standard, colonoscopy, optimally performed BaE could achieve
sensitivity for detecting cancer or large polyps in excess of 0.80 (46, 47). This was considered
reasonable for a safe, relatively non-invasive examination. However, by the turn of the century,
evidence was accumulating that enthusiasm for performing BaE was deteriorating (48) and
consequently, so too was its interpretation; accuracy was considerably lower than believed
previously (49). Confidence in the technique was diminished by the National Polyp Study(50),
which found a sensitivity of 0.48 for large polyps (>1 cm) prompting an accompanying editorial
to suggest that it was no longer appropriate to offer BaE for colorectal screening (51). Despite
strong opposition(52), the radiological community was unable to provide sufficient evidence to
refute these claims and interpretation has continued to decline.
Figure 1: Single oblique, magnified projection
from a double contrast, BaE examination. This
optimally prepared examination demonstrates a
10mm pedunculated sigmoid polyp (arrow).
1.3 THE RISE OF MULTI-DETECTOR CT
Around this time, while BaE was falling out of favour, CT was enjoying a renaissance due to the
development of helical, multi-detector scanners. The capability to acquire volumetric data
within a single breath-hold stimulated research interest in abdominopelvic CT. For example,
while seeking an alternative to BaE in frail, elderly patients, researchers from Cambridge, found
CT could be used to demonstrate colorectal cancer, particularly after opacifying the colon by
administering dilute oral contrast hours in advance of the study(53, 54). Therefore, it followed

3 2
naturally that established techniques to optimise BaE such as bowel catharsis, spasmolysis and
gaseous insufflation were applied to CT (Figure 2); UK researchers named the resulting
procedure, ‘CT pneumocolon’ - a term which remains in sporadic use today(55). Although
related research continued in specialist academic centres (particularly University College,
London), BaE was well established in daily practice and remained the cornerstone of
radiological colorectal investigation for several years.
Figure 2: Axial CT following full bowel catharsis,
spasmolysis and carbon dioxide insufflation.
Note the use of oral ‘faecal tagging’ to opacify
residual colonic content (arrow) and that
intravenous contrast has been administered.
Extensive research has taken place over recent
years to optimise technical implementation (see
below).
1.4 THE BIRTH OF ‘VIRTUAL COLONOSCOPY ’
By 1994, the radiology community eagerly awaited a technique that could exploit the latest CT
technology to provide a viable alternative to BaE. In the United States, in particular, there was
an imperative to develop a radiological alternative to colonoscopic screening; in Europe,
radiological investigation has historically been reserved for symptomatic patients. Therefore,
the stage was set for a celebrated presentation at the 23rd Annual Meeting of the Society of
Gastrointestinal Radiologists where Vining et al introduced ‘virtual colonoscopy’ presenting an
endoluminal flythrough video accompanied by Wagner’s ‘Flight of the Valkyries’. The
subsequent publication (45) is widely regarded as the earliest description of CTC (Figure 3).
3 3
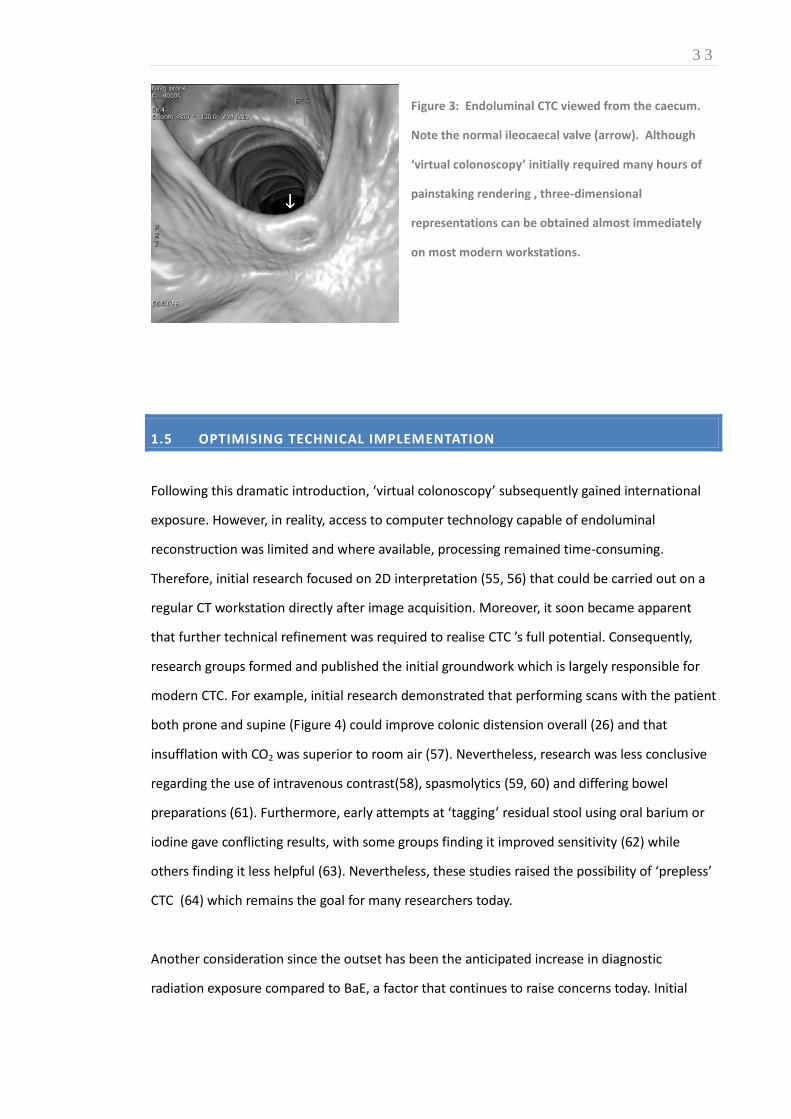
Figure 3: Endoluminal CTC viewed from the caecum.
Note the normal ileocaecal valve (arrow). Although
‘virtual colonoscopy’ initially required many hours of
painstaking rendering , three-dimensional
representations can be obtained almost immediately
on most modern workstations.
1.5 OPTIMISING TECHNICAL IMPLEMENTATION
Following this dramatic introduction, ‘virtual colonoscopy’ subsequently gained international
exposure. However, in reality, access to computer technology capable of endoluminal
reconstruction was limited and where available, processing remained time-consuming.
Therefore, initial research focused on 2D interpretation (55, 56) that could be carried out on a
regular CT workstation directly after image acquisition. Moreover, it soon became apparent
that further technical refinement was required to realise CTC ’s full potential. Consequently,
research groups formed and published the initial groundwork which is largely responsible for
modern CTC. For example, initial research demonstrated that performing scans with the patient
both prone and supine (Figure 4) could improve colonic distension overall (26) and that
insufflation with CO2 was superior to room air (57). Nevertheless, research was less conclusive
regarding the use of intravenous contrast(58), spasmolytics (59, 60) and differing bowel
preparations (61). Furthermore, early attempts at ‘tagging’ residual stool using oral barium or
iodine gave conflicting results, with some groups finding it improved sensitivity (62) while
others finding it less helpful (63). Nevertheless, these studies raised the possibility of ‘prepless’
CTC (64) which remains the goal for many researchers today.
Another consideration since the outset has been the anticipated increase in diagnostic
radiation exposure compared to BaE, a factor that continues to raise concerns today. Initial

3 4
research employing phantom models (65-67) was instrumental in optimising acquisition
parameters and low dose protocols exploiting the intrinsic contrast between soft tissue and gas
were introduced with promising results (68). Once individual research groups had settled upon
suitable preparation and scanning parameters, it was not long before they began to perform
CTC on patients undergoing subsequent colonoscopy in order to compare appearances of
various colorectal lesions (69, 70). Having demonstrated feasibility (71), exploratory reader
studies rapidly followed to establish the diagnostic accuracy of this new technique.
Figure 4: Left: Supine, axial CTC. The lumen is collapsed around the rectal insufflation catheter
(arrow). Right: The same patient was re-examined in the prone position. Note the improved rectal
distension has revealed irregular mural thickening (arrow); colonoscopy confirmed a 35mm carcinoma.
1.6 EARLY OBSERVER STUDIES
Initial studies, predominantly conducted in the USA, used small retrospective samples of high-
risk patients scheduled for colonoscopy. For example, Royster et al (72) studied 20 high-risk
patients and found CTC detected all colonic masses (>2cm) and 12 of 15 polyps (>6mm).
Similarly, Dachman et al performed CTC in 44 high-risk patients(73) achieving a per-polyp
sensitivity of 0.83 and 1.00 for two observers compared to the colonoscopic reference
standard. Ferrucci’s group was also instrumental in providing these initial performance data
from small, high prevalence cohorts (69, 72). However, while remarkable sensitivity was
3 5
demonstrated, a prospective trial was needed, preferably without such high disease
prevalence. This was provided in 1997 by Hara et al (74) who compared 70 patients undergoing
CTC to routine abdomino-pelvic CT and to colonoscopy. Two observers read the cases and each
achieved 0.75 sensitivity and 0.90 specificity for polyps 10mm or larger. Furthermore, this was
the first study to demonstrate superiority over standard CT, which obtained a sensitivity of 0.58
for polyps ≥10mm. Interestingly, patients were scanned only in the supine position, illustrating
that consensus had not been reached regarding what is now established as a fundamental
element of CTC practice. Indeed, it was seven years before convincing research by Yee et al
closed the debate on the value of prone and supine acquisitions (75). Prone/supine matching
is now considered pivotal to competent interpretation and is the focus of Section D of this
Thesis.
1.7 NEW MEETING, NEW NAME
By the late 1990’s several research groups were pioneering this new technique independently,
so in October 1998, key researchers arranged the first international meeting dedicated to CTC:
The International Symposium on Virtual Colonoscopy(VC) (76) in Boston. It is also worthy of
note that many opinion leaders in CTC research at this time were gastroenterologists. Later
that year, the community settled on ‘CTC’ as the accepted scientific terminology (77). Although
other descriptive terms such ‘CT colography,’ ‘CT pneumocolon,’ and ‘virtual endoscopy’ were
subsequently abandoned, ‘virtual colonoscopy’ remains in widespread use, not least because it
is readily understood by the public.
1.8 INTERNATIONAL INTEREST
The following year, CTC’s international profile was elevated considerably by research published
in the New England Journal of Medicine led by Dr Helen Fenlon (11), an Irish radiologist
undertaking a fellowship with Dr Joseph Ferrucci in Chicago. This prospective trial of 100 high-

3 6
risk patients (49 with endoscopically proven colorectal neoplasia, 51 with negative
colonoscopy) was the largest to date and utilised ‘state-of-the-art’ technique. For example,
interpretation used both 2D and 3D assessment in all patients - a factor some considered
instrumental in achieving excellent performance. CTC achieved a sensitivity of 1.00 for cancer,
0.91 for polyps 10mm or larger and 0.82 for polyps 6–9 mm in diameter. On a per-patient basis,
a 10mm threshold would have resulted in 0.96 sensitivity and 0.96 specificity. Publication of
Fenlon’s work stimulated considerable worldwide interest; within a few months the British
Medical Journal commissioned a review of the technique (7). Thereafter, several other
European radiologists undertaking Fellowships in the USA returned home and introduced CTC
to their practice. Subsequently, European research groups formed and began conducting their
own studies.
1.9 EARLY EUROPEAN RESEARCH
In common with North American research described above, European studies initially focused
on optimising technical aspects such as acquisition parameters(57, 67, 78, 79), bowel
preparation(80-82), effect of spasmolytics, and insufflation(60, 83). European researchers were
also early to recognise that ionising radiation exposure could hinder CTC uptake and developed
low-dose techniques (84, 85). On the surface, repeating this groundwork may appear excessive,
yet it was mandatory to account for Europe’s differing legislation, regulation and patient case-
mix. For example, in the UK, hyoscine butylbromide is licensed for diagnostic spasmolysis and
researchers soon showed it improved distension during CTC (83). In addition, European studies
have paid particular attention to patient acceptability (9, 86-89), particularly by reducing or
avoiding cathartic bowel preparation (64, 90). Around this time, European CTC researchers
began to collaborate with their neighbours via the European Society of Gastrointestinal and
Abdominal Radiology (ESGAR).
In 2003, opinion leaders from the UK (Halligan, Taylor, Frost, Breen), Italy (Laghi), Belgium
(Lefere), and the Netherlands (Stoker), established the ESGAR CTC committee and initiated
3 7
training workshops. The committee has since expanded and has been instrumental in
promoting pan-European academic collaboration and training. Subsequently, ESGAR has
actively facilitated CTC research and has funded multicentre studies (91-93). Indeed, research
outlined in Chapters 3 and 7 of this Thesis would not have been possible without the
collaborative efforts of ESGAR CTC committee members.
As described above, the most striking international difference in CTC research has related to its
potential clinical role; the focus in the USA has been to establish a viable screening tool while in
Europe there has been an additional focus on symptomatic patients. Inevitably, studies
specifically investigating patients at increased colorectal cancer risk soon followed (13, 94-96).
However, European researchers also recognised that the vast majority of published studies
from the USA had actually examined symptomatic patients even though the emphasis of
interpretation was directed towards screening. ESGAR funded a systematic review and meta-
analysis that established CTC had high sensitivity for diagnosis of symptomatic colorectal
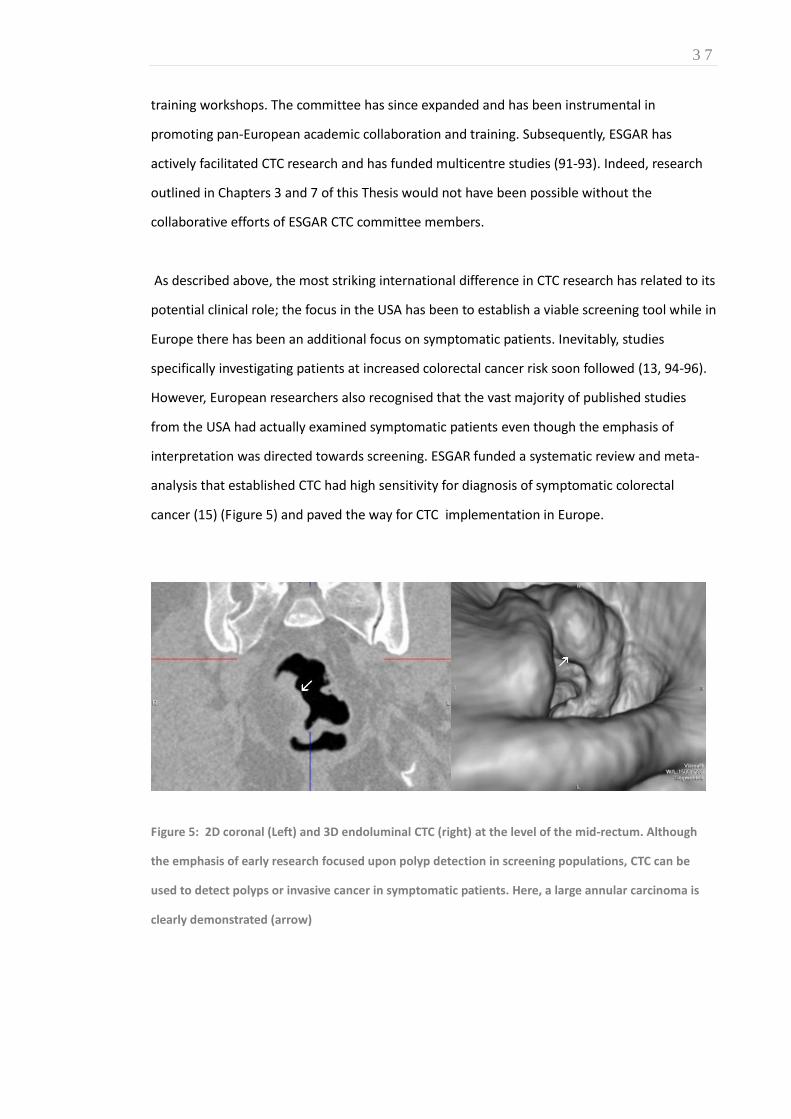
cancer (15) (Figure 5) and paved the way for CTC implementation in Europe.
Figure 5: 2D coronal (Left) and 3D endoluminal CTC (right) at the level of the mid-rectum. Although
the emphasis of early research focused upon polyp detection in screening populations, CTC can be
used to detect polyps or invasive cancer in symptomatic patients. Here, a large annular carcinoma is
clearly demonstrated (arrow)

3 8
1.10 THE FIRST LARGE MULTI-CENTRE TRIALS
While European research was still gaining momentum, in the USA further prospective trials
continued to demonstrate good sensitivity for large polyp detection (12, 97). Moreover, 2003
saw the publication of the largest and most influential CTC study to date: Dr Perry Pickhardt’s
Department of Defence (DoD) trial(14). This three-centre prospective study of 1233,
asymptomatic, average-risk adults compared CTC against a new, enhanced reference standard:
‘unblinded colonoscopy.’ Prior to this, studies had been subject to potential verification bias
due to an imperfect gold-standard (i.e. a polyp seen on CTC that is not subsequently verified at
colonoscopy would be considered a CTC FP whereas, in reality, it could represent ao OC FN).
The DoD study ‘unblinded’ the colonoscopist to CTC findings after their initial assessment, to
allow re-evaluation of each colonic segment in the light of CTC findings. Primary 3D
endoluminal reading was performed in all cases; most studies thus far had used 3D for
problem-solving only. CTC achieved sensitivities of 0.94 and 0.89 for polyps at least 10 mm and
6mm respectively. Using the same thresholds, colonoscopy’s sensitivity was 0.88 and 0.92. The
impact of these results was moderated by the ensuing publication of preliminary findings from
the American College of Radiology Imaging Network (ACRIN) National CTC trial(98) led by Dr
Daniel Johnston: Johnson et al studied 703 higher-than-average risk, asymptomatic patients
who underwent CTC followed by same-day colonoscopy. Results were disappointing with wide
intra-observer variability and sensitivities for detecting large polyps of only 0.34, 0.32, 0.73, for
three experienced readers. The following year, Cotton et al (29) published further disappointing
results in a multicentre study which examined 615 patients undergoing CTC and same-day,
unblinded colonoscopy. CTC achieved a sensitivity of 0.55 for polyps at least 10 mm, compared
to 0.99 for colonoscopy. Furthermore, CTC missed 2 out of 8 cancers. Finally, in 2005 Rockey et
al (28) obtained similar results to Cotton in a prospective evaluation of high risk patients: CTC
achieved a sensitivity of only 0.59 for polyps of 10mm or larger compared to 0.99 for
colonoscopy. The reasons for these conflicting results were debated fiercely; overall the success
of the DoD trial was attributed to well-trained, experienced observers using primary 3D
interpretation of fluid-tagged cases. It is the author’s opinion that, unfortunately the DoD
results do not reflect current performance in daily practice, which provides the rationale for
Section B of this Thesis. In any event, these discrepant results prompted the development of
clearly defined standards for both implementation and interpretation.
3 9
1.11 INTERNATIONAL CONSENSUS ON CTC
Discussion of these recent trials at the 2005 annual Boston VC symposium led to the
development of the first international CTC standards document. Barish et al (36) surveyed 31
key opinion leaders’ attitudes to cathartic preparation, faecal tagging, prone and supine
positioning, intravenous contrast, scanning parameters, spasmolytics, optimal reading
paradigm and polyp size threshold for reporting. The results were collated, drafted, sent to
respondents for approval, and a consensus statement published. At around the same time,
Zalis et al published the CRADS system for CTC reporting (99)and shortly thereafter, ESGAR
commissioned its own consensus statement to provide a European perspective (30). It is
important to note at this juncture that in 2006, the American Gastroenterological Association
(AGA) released a position statement (100), aimed primarily at gastroenterologists with an
interest in reporting CTC . Disappointingly, the ensuing controversy provided clear evidence of
an evolving ‘turf battle’ between specialties which has inevitably shaped the direction of
research over recent years. Therefore, it is encouraging to note that the most recent guidelines
from the International Collaboration for CTC Standards have been developed in direct
collaboration between a radiologist, Dr David Burling and the UK National Lead for Endoscopy
Services, Dr Roland Valori, supported by an extensive multidisciplinary team (31).
1.12 ONGOING RESEARCH THEMES
By 2005, comparative trials and meta-analysis had suggested that CTC could achieve a
sensitivity approaching that of colonoscopy for large polyps and the technique was starting to
disseminate outside academic environments(101). Furthermore, publication of consensus
guidelines shifted research focus away from technical issues and towards several discrete
themes: Training, reading technique, CAD, patient experience, and reducing bowel preparation.
The current status of these topics is covered in greater detail in Chapter 2; important
milestones are described briefly below.

4 0
1.12.1 TRAINING, VALIDATION AND AUDIT
It is unsurprising that the earliest CTC performance studies suggested a learning curve for this
novel technique. Indeed, some authors experienced this first hand while collating their initial
data. For example, Spinzi et al (102) studied a random selection of 96 patients undergoing CTC
followed by colonoscopy and failed to detect five out of six polyps during review of the first 25
cases, with a resulting sensitivity of just 0.32. However, by the final 20 patients, they obtained a
far more satisfactory sensitivity of 0.92. The authors openly attributed their poor initial
performance to inexperience. In 2005 an editorial by Soto et al (103) reviewed the available
evidence and concluded a variable learning curve exists for all readers and that many readers
may never achieve satisfactory performance regardless of training. Nevertheless, the nature of
the learning curve remains elusive, as does the optimal training programme: For example, an
early study of 3 radiologists of differing general experience revealed interesting results;
performance varied considerably and one observer actually deteriorated after training(17). The
authors extended this work to a multi-centre European setting, funded by ESGAR, investigating
the effect of administering a directed training schedule of 50 cases to novice readers and then
comparing their performance to that of experienced observers. Again the authors found that
there was considerable variation and that competence could not be assumed after training.
Moreover, the performance of some experienced readers was far from ‘expert’ (104).
In allied radiological sub-specialties, such as mammography, medical image perception studies
have provided valuable insight into the interpretation technique of readers with varying
expertise(18). Despite extensive eye-tracking of plain radiographic interpretation, none exists
currently for complex cross-Sectional imaging, least of all 3D modalities where the image is
moving. The development of new eyetracking metrics for this scenario and a feasibility study
provide the focus of Chapter 7 of this Thesis.
Guidelines from The American College of Radiology (105), the American Gastroenterological
Association Institute(106) and the International Collaboration for CT Colonography Standards
(31) have all recommended individual training with exposure to a range of endoscopically
validated pathology. Hands-on training workshops are now well established to meet this need;
ESGAR CTC courses have trained over 1000 radiologists worldwide (Chapter 3) while in the
USA, the Society of Gastrointestinal Radiologists, American Roentgen Ray Society, and

4 1
American College of Radiology all offer hands on workshops. However, the level of prior
experience and training of those attending workshops and details of their clinical practice are
unknown. Therefore, while there is professional and political imperative for European
radiologists to interpret CTC, it remains unclear how many have sufficient training or
experience to do so at present. This is explored in Chapter 3 of this Thesis.
Once outside of a research environment, assessment of CTC performance becomes more
challenging, not least because it is impossible in most cases to establish a reference standard.
To address this, in 2009, the American College of Radiology recommended quality metrics
including complication rates, the proportion of technically inadequate studies, and significant
extracolonic findings (Figure 6) to establish benchmarks against which departments can audit
their performance in the absence of same-day comparisons with colonoscopy(105). Given the
heterogeneous response to training, it is likely that only ongoing performance review will
enable readers to ascertain their fitness to practice the technique.
Figure 6: Coronal CTC. Note
the calcified, ectatic
abdominal aorta detected
incidentally on this
unenhanced CTC
examination. The potential
impact of these
serendipitous extracolonic
detections has become the
subject of extensive debate.

4 2
1.12.2 OPTIMAL READING PARADIGM
It is difficult to speculate about what would have become of CTC without the advent of 3D
endoluminal reconstructions; it was the ‘virtual colonoscopy’ aspect that sparked medical and
media interest in the technique. However, by necessity many researchers with neither the time
nor resources to generate 3D reconstructions, initially published research using a 2D reading
approach alone. Subsequently, computer hardware developed rapidly and it was not long
before workstations capable of rapid endoluminal reconstruction were readily available (albeit
at considerable expense) and debate surrounding the relative benefits of 2D and 3D reading
has existed ever since. The explanation for this revolves primarily around reading time: Even
once resource-intensive 3D reconstructions could be generated rapidly, studies soon confirmed
what many researchers already suspected – primary 3D reading was considerably slower than
2D interpretation (107). Indeed, as early as 1998, Dachman et al had suggested using a
compromise of 2D images for the primary read while reserving endoluminal views for ‘problem
solving’(73). Nevertheless, studies by Fenlon et al and Pickhardt et al (14) that used primary 3D
interpretation prompted some authors to claim that their interpretation technique was
responsible for the impressive sensitivity in these trials. Furthermore, perceived limitations of
2D reading provided a plausible explanation for the poor performance achieved by Johnson et
al (98), Cotton et al (29) and Rockey et al(28) around the same time. Nonetheless, in 2005, the
majority of key opinion leaders were familiar with 2D interpretation and, given the
considerable differences which existed between software platforms (40), despite relatively
compelling evidence, the International Consensus Statement recommended 2D reading(36).
However, before long, most software platforms were considered 3D-ready and by the time the
ACRIN II protocol was designed, readers were encouraged to read cases using the paradigm
with which they were most familiar/comfortable. Subgroup analysis showed no significant
difference in diagnostic performance between reading paradigms(16) and recent consensus
guidelines do not favour one primary method over another (31). The debate subsequently
subsided and the matter has largely become one of personal preference (108); all agree that a
combination of 2D and 3D visualisation is optimal.
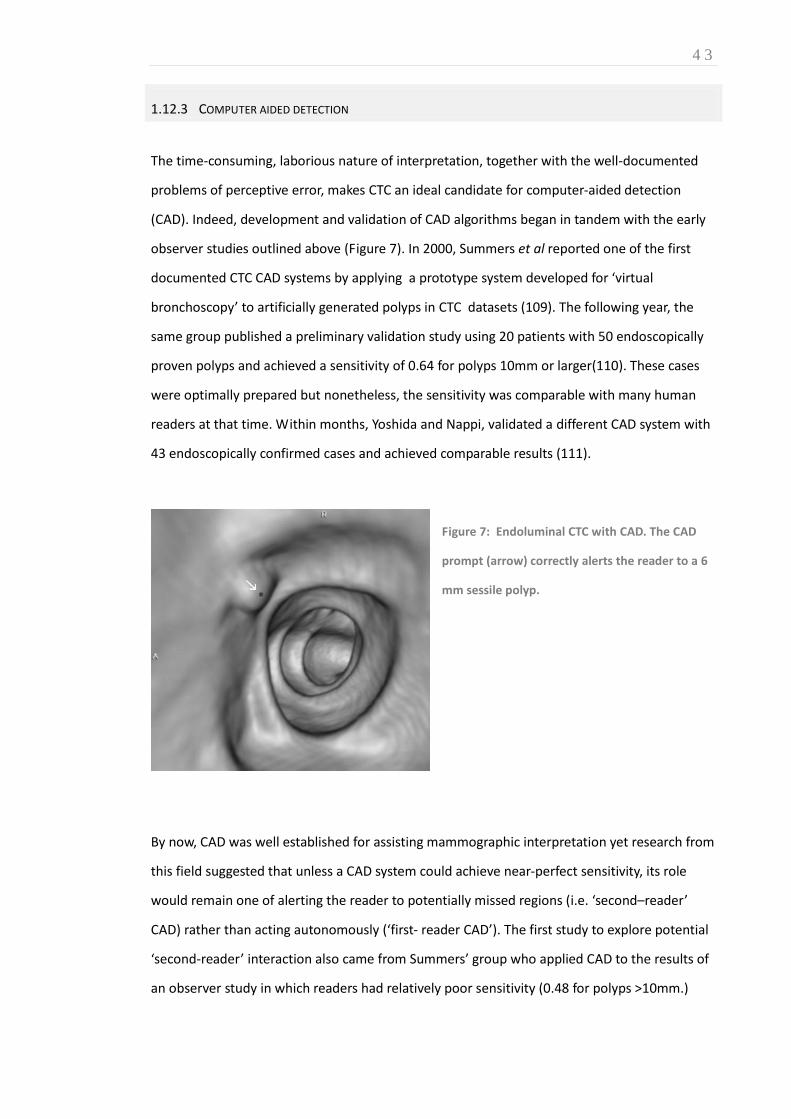
4 3
1.12.3 COMPUTER AIDED DETECTION
The time-consuming, laborious nature of interpretation, together with the well-documented
problems of perceptive error, makes CTC an ideal candidate for computer-aided detection
(CAD). Indeed, development and validation of CAD algorithms began in tandem with the early
observer studies outlined above (Figure 7). In 2000, Summers et al reported one of the first
documented CTC CAD systems by applying a prototype system developed for ‘virtual
bronchoscopy’ to artificially generated polyps in CTC datasets (109). The following year, the
same group published a preliminary validation study using 20 patients with 50 endoscopically
proven polyps and achieved a sensitivity of 0.64 for polyps 10mm or larger(110). These cases
were optimally prepared but nonetheless, the sensitivity was comparable with many human
readers at that time. Within months, Yoshida and Nappi, validated a different CAD system with
43 endoscopically confirmed cases and achieved comparable results (111).
Figure 7: Endoluminal CTC with CAD. The CAD
prompt (arrow) correctly alerts the reader to a 6
mm sessile polyp.
By now, CAD was well established for assisting mammographic interpretation yet research from
this field suggested that unless a CAD system could achieve near-perfect sensitivity, its role
would remain one of alerting the reader to potentially missed regions (i.e. ‘second–reader’
CAD) rather than acting autonomously (‘first- reader CAD’). The first study to explore potential
‘second-reader’ interaction also came from Summers’ group who applied CAD to the results of
an observer study in which readers had relatively poor sensitivity (0.48 for polyps >10mm.)
4 4
CAD detected four large polyps out of 13 which had not been reported by human readers,
allowing the authors to infer that CAD could potentially increase reader sensitivity by alerting
them to polyps which they had missed during their unassisted read (112). Because observer
studies to assess the direct effect of CAD on readers’ interpretations are time-consuming and
expensive, algorithm ‘standalone’ performance is usually used as a surrogate to gauge its
potential impact on interpretative accuracy. Consequently, several such studies have been
published in recent years, their size reflecting the ever increasing availability of algorithms and
endoscopically validated data. For example, a screening cohort of 1186 well-characterised
datasets, all of which had undergone unblinded colonoscopy, was used to test standalone CAD
performance (113), which achieved a sensitivity of 0.89 for polyps >1cm and, on average, 2.1
FP detections per patient.
However, excellent standalone performance does not necessarily translate into equivalent
levels of diagnostic accuracy when integrated with radiologist interpretation in clinical practice.
There are likely two main reasons for this: readers may be misled by FP CAD prompts, reducing
their specificity, or they may incorrectly classify a true positive CAD prompt as false-negative,
reducing potential gains in sensitivity. Taylor et al examined 111 polyps that had been
incorrectly dismissed by radiologists despite appropriate CAD prompting(25) and found,
surprisingly, that large polyps were often disregarded incorrectly when atypical. Also, the
optimal reading paradigm for integrating CAD into workflow is yet to be established (114, 115).
Therefore, realistic estimates of CAD utility in clinical practice require that large numbers of
observers interpret cases with and without CAD assistance. Recently, two groups have
published multi-reader, multi-case studies (19, 20) and these are described in greater detail in
Chapter 2. However, common to large trials involving unassisted observers, these studies
recruited experienced readers who are unlikely to reflect those interpreting CTC in daily
practice. While one could reasonably speculate that novice readers with low baseline
performance may benefit more from CAD than those with extensive CTC experience (who may
already be performing optimally) as yet, no published study has sufficient statistical power to
confirm this (22). This is the subject of Chapter 6 of this Thesis.

4 5
1.12.4 PATIENT EXPERIENCE
Although early diagnosis and removal of adenomatous polyps can reduce colorectal cancer
mortality significantly (116), fewer than 50% of eligible patients attend colorectal screening
(117). The reasons for this are poorly understood but inconvenience, embarrassment,
discomfort and safety concerns are all likely to contribute. Given that patients may expect
‘virtual colonoscopy’ to be less invasive than other whole-colon tests, high hopes exist that a
CTC screening program could increase compliance. Consequently, recent years have seen
considerable efforts to compare patient preferences for CTC, colonoscopy, and BaE.
Early questionnaire surveys (86, 89) comparing the attitudes of patients who had undergone
both CTC and colonoscopy found the majority favoured CTC. Subsequently, more elaborate
studies also suggested patients would prefer subsequent investigation with CTC rather than
colonoscopy (118) or BaE (9). However, in common with diagnostic performance studies
conducted at the time, research relating to patient preference was rapidly evolving from small,
high-risk cohorts to large screening populations. In 2003, Glueker et al published a large
prospective study of asymptomatic individuals(88); 696 patients scheduled to undergo
colonoscopy and 617 patients due to have BaE were offered additional CTC . Patients
completed questionnaires exploring their attitudes to inconvenience, discomfort, preparation,
willingness to repeat examinations and examination preference. Overall, patients preferred CTC
to colonoscopy (72% vs 5%) and to BaE (97% vs 0.4%). Moreover, regardless of the modality,
the majority of patients found bowel preparation the most uncomfortable and inconvenient
aspect.
Most patient preference surveys thus far had been led by a radiologist with an interest in CTC
(often without gastroenterologist co-authors) which prompted accusations of bias; studies led
by gastroenterologists found that CTC failed to offer any advantage over colonoscopy (29).
Consequently, multidisciplinary research has been considered essential for ensuring the
modality is presented fairly and patients’ views are represented correctly. For example, in 2005,
a study by van Gelder(119), working with health psychologists and gastroenterologists,
obtained interesting results: While patients initially preferred CTC to colonoscopy, this was no
longer the case after a five week interval. The authors suggested that once short-term concerns
such as pain and inconvenience had subsided, long-term considerations such as test accuracy

4 6
became more influential. Moreover, a recent qualitative study has suggested that patients may
be willing to trade considerable discomfort for very modest increases in sensitivity (32) yet no
quantitative preference survey to date has provided patients with crucial diagnostic
performance information.
In any event, the rationale for comparing CTC to colonoscopy is questionable; patients with
positive or equivocal CTC findings will continue to need therapeutic colonoscopy regardless.
Therefore, stimulated by cost-effectiveness debate, research focus has returned to the
germane consideration: Can CTC increase screening uptake? Recent research addressing this
question is presented in Chapter 2.
1.12.5 OPTIMISING BOWEL PREPARATION
Although a certain degree of overlap exists with patient acceptability research, studies
investigating reduced bowel preparation have a somewhat different emphasis: Although
reducing the laxative burden during CTC preparation may improve the experience, ensuring
comparable sensitivity with full laxative preparation is the primary concern. Initially, bowel
preparation prior to CTC reflected that used for BaE or colonoscopy. Although this varied from
one institution to the next, as a general rule, laxative ‘wet’ preparations involving two or more
litres of polyethylene glycol (PEG) were favoured in the USA while ‘dry’ preparations based
around sodium picosulfate were preferred in Europe. However, it soon became apparent that
residual faecal fluid and residue represented a barrier to accurate diagnosis and researchers
began to investigate alternative preparations. An early study confirmed picosufate resulted in
less residue than PEG (61) while others found drinking large volumes of PEG was disliked by
some patients more than the ensuing diarrhoea(120). Subsequently dryer preparations
replaced PEG in many centres.
While studies continued to compare the quality of various laxative regimens(82), a small
number of researchers directed their efforts on avoiding catharsis altogether. The first study
suggesting adequate performance could be achieved by non-laxative CTC was published in
2001(64) and since then a limited number of studies have continued to produce impressive

4 7
results(90, 121, 122). Despite the obvious attraction of non-laxative CTC, it remains unpopular
with readers who favour primary endoluminal interpretation (which necessitates a clean
colon). Nevertheless, it is likely that early research into laxative-free preparation was
responsible for the introduction of positive oral contrast faecal tagging during full-preparation
CTC (123), which is considered routine practice today. From experience with BaE, colonoscopy
was considered unsatisfactory in the presence of colonic barium, so to enable same-day
colonoscopy, oral iodine solutions were included in the DoD(14) and ACRIN(16) study protocols
instead of barium. Given the performance demonstrated by these studies, full colonic cleansing
coupled with iodine solutions is generally regarded as the ‘gold standard’(31) (Figure 8).
Figure 8: Axial CTC following oral contrast.
Homogenous fluid ‘tagging’ enables
confident diagnosis of a 10mm
pedunculated polyp (arrow) despite being
partially submerged in colonic residue. Note
the fat attenuation in this endoscopically
proven lipoma.
However, it is important to note that some oral iodinated contrast (e.g. melgumine diatrizoate)
acts as a strong osmotic laxative in its own right, and in combination with full catharsis may
give a rather harsh preparation. Nevertheless, these additional laxative properties have been
used to advantage by several groups for designing new regimens: These so-called ‘reduced
preparation’ techniques have proved particularly popular in Europe where CTC is generally
used to investigate symptomatic patients(87, 124-126). However, in common with non-laxative
preparations, the main obstacle to reduced preparation is the difficulty in reading 3D
endoluminal CTC in the presence of residual fluid. The development of ‘digital cleansing’ (62,
121) aims to make reduced preparation CTC a realistic compromise between diagnostic
4 8
performance and tolerability. Nagata et al (127) published convincing claims that full purgation
is no longer required: One-hundred and one consecutive high-risk patients scheduled to
undergo CTC were alternately assigned to either full (2l PEG) or ‘minimal’ preparation (45ml
sodium diatrizoate for 3 days and 10ml sodium picosulfate solution the night before CTC).
‘Minimal’ preparation CTC achieved a comparable, high sensitivity for detecting polyps 6 mm or
larger (0.88 compared to 0.97 for full laxative CTC). While the regimen could not be described
as ‘non-laxative,’ a questionnaire survey indicated a strong preference for the reduced
preparation. However, as previously demonstrated, retaining high sensitivity comes at a cost:
Specificity was markedly reduced from 0.92 to 0.68. Intriguingly, the authors concluded that
patients should be offered the reduced laxative CTC if they were willing to accept the decrease
in specificity – very little is known about patients’ understanding of specificity, least of all how
they might trade-off against side-effects. The complex relationship between patients’ attitudes
to sensitivity and specificity is the focus of Chapter 5 of this Thesis.
1.13 MULTICENTRE PERFORMANCE STUDIES; EVIDENCE BASED TECHNIQUE
While research described above was instrumental in shaping current practice, three recent
studies have been central to validating CTC performance when conducted using evidence-
based technique in asymptomatic populations. In particular, the ACRIN II(16), IMPACT(128) and
Munich(129) study groups, all performed prospective trials comparing CTC against an
enhanced reference standard comprising same-day colonoscopy with segmental unblinding
(p.38) (Table 1): The ACRIN National CTC Trial (16) recruited 2600 average risk, screenees from
15 centres. The primary end point was detection of endoscopically proven large adenoma or
adenocarcinoma (≥10mm). The trial employed meticulous technique and highly experienced
observers achieving a mean per-patient sensitivity of 0.90 (SD 0.03) and specificity of 0.86 (SD
0.02). However, despite either completing a 1.5 day training course or reading over 500 cases,
more than half of would-be observers in the ACRIN II study(16) failed to meet the basic entry
requirements for the trial (0.90 sensitivity for polyps >1cm over 50 cases) leading to concerns
regarding the generalisability of these results into daily practice.

4 9
The IMPACT study(128) recruited patients at increased risk of colonic neoplasia such as those
with a personal history of adenomatous polyps, a family history of advanced colorectal
neoplasia, or a positive faecal occult blood test (FOBT). Overall, 1103 patients were recruited
from 11 Italian sites and one in Belgium. CTC detected 151 of 177 participants with advanced
neoplasia (≥ 6 mm) resulting in a sensitivity of 0.85 (95% CI, 0.79 to 0.90) and a specificity of
0.88; (95% CI, 0.85 to 0.90). Considering larger polyps (≥10mm), CTC had sensitivity of 0.91
(95% CI, 0.84 to 0.95) with positive and negative predictive values of 0.62 and 0.96,
respectively. Subgroup analysis of the FOBT-positive group found a significantly lower negative
predictive value (0.85; 95% CI, 0.76 to 0.91; p < 0.001), which is of concern given the high
prevalence of important colonic abnormalities in these patients.
Table 1: Diagnostic performance of CTC compared to same-day, unblinded colonoscopy; Comparison
of three recent trials.
Johnson et al, 2008 (16) Regge et al, 2009 (128) Graser et al, 2009 (129)
Risk of neoplasia Predominantly average risk (89%) All considered at increased risk
(see text)
All considered average risk
Mean age (years) 58 60 61
Per patient sensitivity
Cancer 86% 95% 100%
Per patient specificity
Adenoma ≥6 mm* 88% 88% 93%
Adenoma ≥10 mm* 86% 85% 98%
*Munich trial(129) used >5 and >9mm thresholds
The Munich Colorectal Cancer Prevention Trial (129) examined asymptomatic patients with an
average colorectal cancer risk. 307 patients with 511 endoscopically detected adenomas
underwent five different screening tests in parallel: CTC, colonoscopy, flexible sigmoidoscopy,

5 0
and guaiac-based FOBT and immunochemical stool tests. Akin to the IMPACT study,
performance was compared to same-day colonoscopy as the reference standard. CTC detected
94% of adenomas larger than 9mm and although sensitivity for sub-centimetre adenomas
(including those less than 5mm) was lower at 0.66, only one missed adenoma showed
advanced histology, enabling the authors to report a sensitivity of 0.94 for ‘advanced
neoplasia.’ Encouragingly, per-patient specificity for polyps larger than 5 mm was 0.93.
1.14 SO WHAT EVER HAPPENED TO THE BARIUM ENEMA?
By now, the reader would be forgiven for assuming the appetite and justification for BaE among
radiologists and referring clinicians has all but disappeared; the evidence is compelling that CTC
is far superior (130) and more acceptable (88). However, barium examinations have been, by
no means, consigned to the pages of history. Indeed, it is estimated that 3.7 million procedures
were performed worldwide in 2008 (pers. comm. Bracco Diagnostics Inc.) The reasons for this
are beyond the scope of this Thesis, but it is important to note that the examination is often
performed by radiographic technicians using fully depreciated fluoroscopic equipment with
minimal impact on valuable radiologist resources or CT capacity. Given the economic climate at
the time of writing, even convincing evidence is not always sufficient to ensure policymakers
endorse a potentially expensive, resource-intensive technique. Moreover, in the USA, BaE
remains approved for colorectal cancer detection while the recent landmark decision by the
Centers for Medicare and Medicaid Services (CMS) has declined approval of CTC for screening
(131). The main criticism levelled at CTC was the absence of ‘level 1’ evidence in the form of a
randomised controlled trial (RCT). However, as no RCT supports BaE, some authors have
claimed new health technologies are being subjected to tougher standards than existing
techniques, provoking international debate (132).
The UK Department of Health, via the Health Technology Assessment programme (HTA),
commissioned a RCT to determine the likely future role of CTC within the NHS, via comparison
with BaE or colonoscopy. The resulting SIGGAR trial(10), (named after the UK Special Interest
Group in Gastrointestinal and Abdominal Radiology) was led by the supervisor of this Thesis,
5 1
Professor Steve Halligan and Professor Wendy Atkin with the first patient randomised in April
2004 and accrual completed by November 2007: The primary end point was detection rates for
colorectal cancer or polyps ≥1cm in symptomatic adults (133). The results of this trial (10, 133-
136) are described in detail in Chapter 2 but suffice it to say that as a result of these data, the
DH has deleted BaE from its colorectal cancer national screening program and recommends
CTC in its place. The repercussions are expected to have worldwide impact on CTC
implementation.
1.15 THE END OF THE BEGINNING
Advances in both CT and computer technology have allowed techniques established for BaE to
be successfully transferred to CTC. Since then, developments in the USA and later worldwide,
have seen CTC grow from feasibility studies in academic units to international daily practice
(Table 2). Recent research has established excellent comparative performance with
colonoscopy and accuracy which supersedes BaE but concerns exist regarding generalisability
of these results to daily practice. This is explored in greater detail in Section B of this Thesis.
Research continues apace to refine technical implementation, particularly reduced preparation
methods which may increase adherence with screening programs and to ensure that readers,
potentially with the assistance of CAD, achieve the same diagnostic performance as those from
successful multicentre trials.

5 2
Table 2: Milestones in the history of CTC
Year Milestone in the history of CT Colonography development
1983 First report of CT imaging of the cleansed, distended colorectum (44)
1994 Vining et al present ‘virtual colonoscopy’ (45)
1997 First exploratory observer study of CTC performance (74)
1998 Feasibility demonstrated in patients with endoscopically proven findings (69)
1998 Boston International Symposium on Virtual Colonoscopy introduced (76).
1998 ‘CTC’ becomes preferred terminology (77)
1999 Landmark study shows very favourable performance for CTC and initiates international interest (11)
2000 The National Polyp Study published; poor performance brings BaE use into question (50)
2000 First CAD systems developed for CTC (109)
2001 Iodine tagging of liquid stool shown to benefit (62, 121)
2001 First attempts at non-laxative CTC reported (64)
2001 CAD undergoes preliminary clinical validation (110)
2003 Prospective patient attitude survey finds CTC preferable colonoscopy and to BaE(88)
2003 ESGAR form CTC working group
2003 DoD trial published (14).
2003 ACRIN trial published (98)
2004 Comparative study shows CTC superior to Barium enema (130)
2005 Metaanalysis of CTC performance for cancer detection published (15)
2005 First International CTC standards document published (36)
2007 AGA release own guidelines (106)
2007 ESGAR publish consensus statement (30)
2008 ACRIN II study published (16)
2009 CMS declines coverage of CTC for screening (131)
2010 Studies provide convincing evidence for ‘second reader’ CAD (19, 20)
2010 Preliminary results of first RCT of CTC presented (SIGGAR trial) (133)
2010 UK Department of Health discontinues Barium enema in favour of CTC for CRC screening program

5 3
CHAPTER 2 2. CTC: CURRENT STATUS AND FUTURE DIRECTIONS
AUTHOR DECLARATION
Work presented in this Chapter was led by the author; literature searching, compilation and
manuscript writing was completed under the supervision of Professor Steve Halligan and
Professor Stuart Taylor. A proportion of this Chapter forms the basis of: Boone D, Halligan S,
Taylor SA. Evidence review and status update on computed tomography colonography. Curr
Gastroenterol Rep. 2011; 13(5):486-94. (Appendix A)
2.1 INTRODUCTION
Chapter 1 summarised the key milestones which have shaped current CTC practice; inevitably,
for an emerging technique, early studies concentrated on optimising technical implementation
and providing sufficient evidence to ‘validate’ CTC for routine clinical use. Subsequently, the
landscape of CTC research has changed considerably: The focus has moved towards
generalisability of CTC into daily practice (the focus of Section B), cost effectiveness and the
impact of extra-colonic findings (137). Furthermore, the debate over who is should interpret
CTC (radiologists, gastroenterologists, radiographic technicians or even computer algorithms)
continues to intensify. The focus of this Chapter is to present the current status of CTC research
with review of literature published between 1st April 2010 and 31st March 2011.
2.2 DIAGNOSTIC PERFORMANCE
As outlined in Chapter 1, excellent sensitivity for detecting advanced colorectal neoplasia has
been reported in several large comparative studies. However, until recently, randomised
5 4
controlled trail data have been unavailable to support this evidence base. Therefore,
presentation of preliminary results from the UK Special Interest Group in Gastrointestinal and
Abdominal Radiology (SIGGAR) trial (133) was one of the most significant developments during
the period under review.
2.2.1 DIAGNOSTIC PERFORMANCE IN SYMPTOMATIC PATIENTS: THE SIGGAR TRIAL
The SIGGAR multi-centre study comprised two parallel randomised controlled trials (RCT)
comparing CTC to BaE and CTC to colonoscopy(10); a total of 5,448 patients were randomised.
The primary end point was the detection rate for colorectal cancer or polyps ≥ 1cm in
symptomatic adults. In the BaE subtrial, patients aged 55 or over with symptoms suggestive of
colorectal cancer who were referred by their clinician for BaE were randomised (in a 2:1 ratio)
to either BaE (2,541) or CTC (1,280). In an intent-to-treat analysis, colorectal cancer or polyps ≥
10mm were diagnosed significantly more frequently in patients assigned to CTC than to BaE
(7.4% vs. 5.6% , p=0.0312). Using national registry data to capture cancer miss rates
(diagnosed within 2-years of randomisation), BaE had twice the miss rate of CTC (14% vs. 7%).
Additional colonic investigations occurred significantly more frequently following CTC than BaE
(23% vs. 18%), mainly due to higher polyp detection rates. 1,338 previously unknown extra-
colonic findings were reported in the 1,206 patients who underwent CTC as their randomised
procedure. Eighty-six patients were referred for further tests as a result of their extra-colonic
findings, leading to diagnosis of a malignant tumour in 12 patients (13).
The colonoscopy subtrial (12) found a much higher prevalence of endpoints amongst those
randomised (11% vs 4% for the BaE subtrial). In an intent to treat analysis, there was no
significant difference in the detection rate of significant colorectal neoplasia between the two
arms (11.6% for colonoscopy vs. 10.7% for CTC, p=0.61) but the referral rate for a subsequent
confirmatory procedure was much higher after CTC (31.4% for CTC vs. 7.2% for colonoscopy),
raising important questions regarding cost efficiency and the need for well-defined, evidence-
based criteria for referral following CTC in symptomatic patients. As stated in Chapter 1,
consequent upon these data, the UK Department of Health no longer endorses BaE for
screening but recommends CTC instead in those patients in whom colonoscopy is
contraindicated or cannot be performed.

5 5
2.2.2 DIMINUTIVE LESIONS
Few authors, if any, would disagree that the sensitivity and specificity of CTC is relatively poor
for diminutive polyps and the focus has therefore been on detecting polyps larger than 5mm,
ideally those with high-grade dysplasia (i.e. advanced adenomas). Benson et al compared 1700
average-risk screening patients undergoing colonoscopy and 1,307 having CTC (138) finding
nearly five times more non-advanced adenomas were removed in the colonoscopy group.
However, while all referrals were made from the same patient population, groups were not
randomised. Moreover, no significant difference was observed for detection of advanced
adenomas. Furthermore, while much is known about the natural history of colorectal cancer, it
remains unclear whether detection and excision of small adenomas is clinically desirable. For
example, a meta-analysis of four studies comprising 20562 screening patients by Hassan et al
(139) found that advanced adenomas were detected in 1155 (5.6%) subjects, with the overall
incidence of advanced histological characteristics in polyps <6mm, 6-9mm and ≥10mm of 4.6%,
7.9% and 87.5% respectively. They concluded that a 10-mm threshold for colonoscopy referral
would identify 88% of advanced neoplasia while a 6-mm polyp size threshold would identify
over 95%. Additional complexity results from the well-documented systematic differences in
polyp measurement between radiological and endoscopic techniques. De Vries et al assessed
endoscopic and colonographic measurement of 51 polyps (140) and found CTC judged polyps
to be between 0.7 to 2.3 mm larger than equivalent endoscopic estimates. Debate also
continues as to how endoscopic and colonographic definitions of flat neoplasia can be
reconciled to allow meaningful comparisons. Ignjatovic et al performed a comprehensive
review of the subject (141), and suggested the most appropriate radiological definition was
that based upon a well-established pathological description (i.e. the Paris classification) and
that flat neoplasia should be defined on CTC as lesions with a vertical height of 3mm or less
above the surrounding mucosa. In support, a single centre study of 5107 consecutive CTC
screening patients found that 125 (93.2%) lesions characterised as flat at endoscopy measured
less than 3mm at CTC (142). Interestingly, the study also noted that flat lesions between 6 and
30 mm in size were less likely to be neoplastic than similar sized sessile polyps (25.0% vs.
60.3%).
5 6
2.3 COST-EFFECTIVENESS OF CTC FOR PRIMARY SCREENING
Although CTC has proven efficacy for advanced adenoma detection, whether it represents a
cost-effective primary screening tool remains under scrutiny. Just prior to the period reviewed,
conflicting recommendations were published by two North American consensus guideline
groups: A joint statement by the American Cancer Society, the Multi-Society Task Force on
Colorectal Cancer and the American College of Radiology, recommended CTC as a first-line
preventive screening test in patients at average risk of developing colorectal cancer (143).
Conversely, the US Preventive Services Task Force considered the existing evidence insufficient
(144) and CTC has been rejected for coverage by the Centers for Medicare and Medicaid
Services(131). Although full discussion of this debate is beyond the scope of this Thesis,
excellent commentaries are provided by Cash (145) Schoen (146) and Burke (147).
Although these developments primarily concern North American practice, their impact on CTC
implementation and future research has international ramifications. In particular, recent
research has focussed extensively upon addressing uncertainties in baseline assumptions used
to drive cost-effectiveness modelling analyses, notably the impact of low specificity, extra-
colonic findings, management of diminutive polyps and the potential to increase patient
compliance with colorectal cancer screening. These topics are considered separately
throughout this Chapter.
2.4 TRAINING, STANDARDS, AND VALIDATION
A consistent theme in the CTC literature, even amongst the larger successful studies, has been
notable variation in diagnostic accuracy for individual radiologists. It is therefore surprising that
recent research has contributed relatively little to our understanding of the effects of reader
experience and training on interpretative accuracy. Fletcher et al compared the performance of
ten radiologists during a one-day educational workshop with their subsequent diagnostic
accuracy in a prospective multi-centre screening study (148) and found a 1.5-fold increase in
the odds of making a true positive diagnosis for every additional 50 validated cases studied.

5 7
The latest CTC standards document, developed by the International CT Colonography
Standards Collaboration(31), has reinforced the need for adequate training and has suggested
formal accreditation. Furthermore, the American college of Radiology has recently published
guidance on recommended quality metrics(105) including rates of complications, inadequate
studies and significant extracolonic findings. Where patients undergo subsequent colonoscopy
they advise registering sensitivity and per-patient specificity for polyps ≥1cm. The aim is to
establish benchmarks against which departments can audit their performance.
2.5 PATIENT ACCEPTABILITY AND BOWEL PREPARATION
Early research regarding patient acceptability was described in Chapter 1. While these initial
studies remain widely cited, methodology has improved considerably over recent years, in
particular, minimising bias through multidisciplinary collaboration. Moreover, there has been a
change in focus from establishing patients’ post-procedural experience to gauging the potential
for CTC to increase screening uptake. For example, analysis by Knudsen et al (149) concluded
that a substantial increase in screening attendance (>25%) would be required for CTC to be cost
effective in comparison to colonoscopy. In response, Pickhardt et al argued that CTC screening
would increase compliance comfortably, notably amongst patients who currently refuse
colonoscopic screening (150). They cite a survey by Moawad et al, which found 40% of patients
attending CTC screening would have foregone investigation altogether had the examination not
been available (151) and a survey of colonoscopy non-attendees, of whom over 80% stated
that they would have attended CTC if offered (152). However, caution must be applied to both
surveys - the first was prone to selection bias as all respondents had already chosen to attend
CTC and the second had a response rate of only 39% raising concerns about the generalisability
of results. Moreover, patient preference for CTC is by no means universal or consistent in the
indexed literature.
It is worth noting at this juncture that qualitative patient preference studies are particularly
susceptible to framing bias. For example, the sensitivity quoted for CTC varies considerably but
the value presented to participants (and the manner in which they are presented) will have

5 8
considerable impact on their attitudes and responses. The methodological challenge involved
in minimising bias when designing quantitative research is explored in Chapter 5.
Recent abstracted data (153) (subsequently published in 2012 by Stoop et al (154)) provide the
most convincing evidence to date that CTC can enhance screening adherence. A recent RCT
recruited 2920 asymptomatic screenees to reduced-preparation CTC and 5924 to colonoscopy,
completing accrual in August 2010. Significantly fewer invitees attended screening with
colonoscopy compared to CTC (22% vs 34%; p<0.0001) (34%). However, detection rate for
advanced neoplasia was significantly higher for colonoscopy than CTC (8.7 vs 6.1 per 100
examinations; p=0.02). Consequently, overall diagnostic yield per 100 invitees did not differ
significantly (1.9 vs 2.1 detections for CTC and colonoscopy respectively; p=0.56) suggesting
primary screening with reduced preparation CTC would be effective, in part due to improved
uptake.
2.6 SAFETY
While it is widely accepted that CTC is safe, with a perforation rate considerably lower than
that of colonoscopy, risks do exist, both related to bowel preparation and colonic insufflation,
and knowledge of these continues to inform best practice. A meta-analysis by Atalla et al,
supplemented by a retrospective multicentre study (155), identified only two cases of
perforation from 3458 CTC procedures resulting in an incidence of 0.06%. Risk factors common
to both cases were older age, manual colonic insufflation, diverticulosis, recent colonoscopy
and biopsy. The potential relationship to prior colonoscopic biopsy is of interest, but given the
low rates of CTC-related perforations in the literature, there remains insufficient evidence on
which to base clear guidelines for the timing of CTC following endoscopic biopsy. This issue will
likely become of increasing importance as many institutions attempt to offer same-day CTC
following incomplete colonoscopy. Likewise, CTC has been shown to be safe following metallic
stent placement for obstructive colorectal cancer (156). It is well established that aggressive
bowel purgation carries a risk of biochemical disturbance, particularly in frail elderly patients.
However, a retrospective study of patients aged over 70 years demonstrated no significant
5 9
changes in serum urea, sodium, potassium or estimated glomerular filtration rate when using
sodium picosulphate-magnesium citrate catharsis prior to CTC (157). Finally, although it has
been suggested that bacteria introduced during insufflation could risk infection of prosthetic
vascular grafts, a study of 100 consecutive patients subject to serial blood cultures following
CTC failed to showed significant bacteraemia and suggested antibiotic prophylaxis is not
required (158).
2.7 WHO SHOULD REPORT CTC?
Due to pressure of work, European radiologists have studied the feasibility of delegating CTC
interpretation to radiographers, albeit with the assistance of computer aided detection (CAD)
software (159). Radiographers performed the primary interpretation in 303 consecutive
symptomatic patients detecting 100% cancers, 72% of large polyps and 70% medium (6-9mm)
sized polyps. However, observer specificity was poor and would have resulted in inappropriate
referral for colonoscopy in 37% of the patients studied. Overall, the authors concluded that CTC
interpretation by radiographers may be useful for rapid patient triage post-procedure, but
ultimately not for independent reporting.
2.8 EXTRACOLONIC FINDINGS
One factor which cannot be ignored when considering who should report CTC is the high
prevalence of incidental extra-colonic findings. The additional cost and patient morbidity from
the work-up of extra-colonic findings is likely to be considerable; a recent study of 2777
screening patients identified extra colonic findings in 46%, and ‘significant’ findings in
11%(160). Further evaluation resulted in 280 radiological examinations and 19 surgical
operations. Conversely, the incidence of unexpected extracolonic malignancy is relatively low:
A retrospective review of 10,286 outpatient adults undergoing screening CTC (137) reported 36
unexpected extra-colonic malignancies (0.35%) including 11 renal cell carcinomas, eight lung

6 0
cancers and six cases of non-Hodgkin’s lymphoma. In addition, Pickhardt et al assessed
incidental indeterminate adnexal masses in 2869 asymptomatic women undergoing
colonography screening (161) and found that while ovarian lesions were common (4.1%),
subsequent work-up revealed no ovarian cancers. Moreover, a normal CTC did not exclude
subsequent development of ovarian cancer.
Intuitively, the serendipitous discovery of incidental extra-colonic malignancy should be of
benefit to patients yet long term data on improved patient outcomes are currently lacking and
the financial implications are complex.
2.9 COMPUTER AIDED DETECTION (CAD)
As described briefly in Chapter 1, CAD has been applied to CTC for over 12 years (109) but akin
to research relating to CTC diagnostic performance, sufficiently powered observer studies have
only emerged relatively recently due to the resource requirement for such studies. Therefore,
for several years, standalone CAD detection characteristics were utilised by extrapolation as a
surrogate measure for diagnostic performance when used by radiologists, often with striking
results. For example, a recent retrospective study of a cohort of 3042 screening patients, 373 of
whom had medium or large polyps, found standalone per-patient sensitivities for CAD of 93.8%
and 96.5% at 6 and 10mm thresholds respectively (162). Moreover, the median FP rate was
only 3 per CTC series. Similar high levels of CAD performance were obtained in a much smaller
study of 29 patients at high-risk of colorectal neoplasia (with 86 polyps) (163). However, as
discussed in Chapter 1 (p43) standalone performance does not necessarily translate into
diagnostic accuracy when CAD is used by a radiologist in daily clinical practice: Readers may be
misled by FP CAD prompts, reducing their specificity, or they may incorrectly classify a TP CAD
prompt as false-negative, reducing potential gains in sensitivity. Therefore, realistic assessment
of CAD’s impact on reader performance requires studies where observers read cases both with
and without CAD assistance.

6 1
Two groups have recently published multi-reader, multi-case studies using CAD as a ‘second
reader’, i.e. the CAD prompts are only interrogated by the reader only after a thorough
unassisted review has been performed first. Dachman et al (20)used a cohort of 100
endoscopically-validated cases, 48 of which were normal and 52 of which contained 74 polyps.
19 readers interpreted each case unassisted and with CAD as a second-reader. Readers' per-
segment, per-patient, and per-polyp sensitivity were significantly higher (p < 0.011, 0.007,
0.005, respectively) with CAD compared to unassisted readings when using a ROC AUC analysis.
However CAD reduced readers’ specificity by 0.025 (p =0.05). Halligan et al found similar results
(19): Sixteen experienced radiologists interpreted CTC from 112 patients (132 polyps in 56
patients) on three separate occasions either unassisted, using CAD concurrently, or with CAD as
a second-reader (Please see Chapter 6 for a more detailed explanation). CAD significantly
increased mean per-patient sensitivity both when used as a second-reader (mean increase,
0.07; 95% confidence interval (CI): 0.04 to 0.098) or when used concurrently (mean increase,
0.045; 95% CI: 0.008 to 0.082). Furthermore, CAD resulted in no significant decrease in per-
patient specificity for these readers. These are the largest reader studies of CAD to date and
argue strongly that CAD would be beneficial if used in clinical practice by experienced
radiologists.
Nevertheless, there remains considerable scope for research into how CAD should best
integrate into radiologists’ workflow (115). Furthermore, a recent pilot study by Summers’
group found that TP CAD prompts were more likely to be correctly classified by readers when
prompts were present on both the prone and corresponding supine acquisitions (164).
Therefore, there is growing interest in automating the registration task between prone and
supine acquisitions(165) and this forms the focus of Section D of this Thesis.

6 2
2.10 CONCLUSION
Recent research has continued to demonstrate that CTC has excellent sensitivity compared to
colonoscopy and is significantly more accurate than BaE, which should be abandoned. Adverse
events are uncommon and patient acceptability is good. Reduced bowel preparation regimens
continue to show considerable promise. Evidence is mounting that the impressive stand-alone
detection rates of CAD translate into improved radiologist accuracy. Controversy continues
regarding the impact of incidental extra-colonic detections, who should interpret CTC, whether
compliance with screening programmes is genuinely enhanced by CTC, and whether the
technique is ultimately cost effective. Moreover, doubt remains whether results from those
trials cited as exemplars by the radiology community can be generalisable to daily practice. This
is explored in further detail in Section B. An additional recurring theme is the trade-off
between sensitivity and specificity for CTC, particularly when assessing adjuncts to
interpretation such as CAD. This forms the main focus of Section C.
Finally, alongside the high-profile multicentre studies described in this Section, there is a
wealth of published literature that occupies the periphery of the CTC research field. Doubtless,
some of this research which will evolve into the mainstream over the upcoming years. For
example, over 30 papers were published over the 1-year period reviewed detailing algorithms
designed to improve digital cleansing, 3D data display, and other complex computer
applications. Therefore, while on the surface, the rate of progress may appear to have slowed,
it has simply taken new directions. The development of novel computer algorithms to improve
colonographic interpretation is explored in Section D of this Thesis.
6 3
SECTION B: IDENTIFYING AND QUANTIFYING LIMITATIONS IN CTC RESEARCH
OVERVIEW
As outlined in Section A, it is now widely accepted that CTC has undergone sufficient validation
for widespread clinical implementation. However, most multicentre trials, upon which these
assumptions are based, have been carried out on healthy screening populations using highly
experienced observers in North American academic centres. It is unlikely that either the
observers or patient sample reflect European daily practice. However, this remains speculative
as practically nothing is known about the level of training and experience of those interpreting
CTC in Europe. Likewise, while historically, radiological investigation in Europe has been
reserved for symptomatic patients, there are no recent data to confirm this remains the case.
In addition to factors influencing the generalisability of CTC research, studies of diagnostic test
accuracy must make pragmatic compromises (such as repeat reading of the same cases or
enriching sample prevalence to ensure adequate statistical power) to reduce the complexity
and resource demands of the study. This may introduce further sources of bias, yet their
impact remains unquantified.
Thus, Section B consists of two Chapters exploring generalisability of research data and sources
of bias in CTC research: Chapter 3 describes the level of training, experience and pattern of
clinical practice across Europe via a survey of participants at educational CTC workshops.
Chapter 4 encompasses a broad investigation into bias affecting studies of diagnostic test
accuracy by means of a systematic review.

6 4
CHAPTER 3 3. WHO ATTENDS CTC TRAINING? A SURVEY OF PARTICIPANTS AT EUROPEAN EDUCATIONAL WORKSHOPS
AUTHOR DECLARATION
Work presented in this Chapter was led by the author with the guidance of the ESGAR CTC
committee (including both Supervisors). The online survey was distributed by ESGAR
administrators; data collection, analysis and presentation were performed by the author. The
manuscript was compiled under the supervision of Professor Steve Halligan and Professor
Stuart Taylor. This research has been published in: Boone D, Halligan S, Frost R, et al. CT
Colonography: Who attends training? A survey of participants at educational workshops. Clin
Radiol. 2011;66(6):510-6.(166)
3.1 INTRODUCTION
As described in Section A of this Thesis, the last two decades have seen sustained CTC research
with several clinical trials confirming that the technique can detect colorectal polyps and
cancers with high accuracy (14, 16, 167). Consequently, CTC is currently disseminating widely
into clinical practice, both in Europe(101, 168) and the USA(169). Furthermore, recently
released data from the SIGGAR trial (10, 133) have prompted the UK Department of Health to
delete BaE from its FOBT-based, colorectal cancer screening programme, instead endorsing
CTC. It is expected that other European states will follow suit. Increased public awareness and
saturation of endoscopy services has placed clinical and political imperatives on radiology
departments to provide a CTC service: In comparison to a 2006 study where just over one third
of UK NHS hospitals were performing the technique (101), preliminary data from a recent UK

6 5
survey suggest over 80% of departments are now providing a service(170). However, it is well
recognised that CTC is difficult and time-consuming to interpret, has a defined learning curve
and that reader accuracy is closely related to experience (17, 102, 171). As a result,
international expert consensus statements from both Europe(30) and the USA (36) agree that
specific training is essential for competent interpretation. In particular, hands-on educational
workshops, where participants receive face-to-face training using real case data, have been
shown to measurably improve reader accuracy (172). However, at present there is no formal
requirement for training, validation or accreditation to interpret CTC in Europe, raising
concerns about the standard to which the technique is being performed in daily practice.
Moreover, despite clinicians, policy makers and well-motivated patients expecting CTC
performance to reflect that seen in the North American literature, this is unlikely unless the
local radiologist has equivalent expertise.
While much is known about the opinions of key leaders in the field (30, 36), relatively little is
known regarding those who interpret CTC in daily practice. In particular, data are lacking
regarding the professional background of workshop attendees, their prior expertise and
experience of CTC interpretation, their motivation for attending, and their future intentions. In
order to obtain these data, the author surveyed participants attending hands-on educational
CTC workshops.
3.2 METHODS
A waiver to publish an analysis of demographic data obtained anonymously from workshop
attendees was obtained from the author’s local Research Ethics Committee; no patients were
involved in this study. The author surveyed participants at five CTC workshops conducted in
Edinburgh (UK), Malmo (Sweden), Amsterdam (Netherlands), Pisa and Stresa (Italy) between
February 2007 and April 2010. Workshops were organised by ESGAR and advertised on their
website several months in advance (www.esgar.org). Participants registering for the workshops
were contacted by the course organisers via email one week prior to the event. The invitation
contained a hyperlink that directed the recipient to an anonymous, online questionnaire
(Appendix B). The most recent workshop (Amsterdam) was cancelled due to the volcanic
6 6
environmental crisis of April 2010, but data from participants registered in advance are
included below.
The questionnaire was designed by members of the ESGAR CTC Workshop Committee, who are
radiologists of consultant grade experienced in interpretation of CTC in day-to-day clinical
practice. A multiple-choice format meant that the questionnaire could be completed in less
than five minutes since minimal free text was required. The questionnaire was broadly divided
into four sections relevant to this Thesis:
The professional background of the participant and their prior experience of CTC
(including numbers of cases and preferred interpretation display if relevant).
The personal intentions for subsequent clinical practice of the technique.
Current CTC practice in the host institution(s) including details of how the examination
was performed and subsequently interpreted.
Respondents’ opinions on the potential clinical role of CTC in their future practice.
Responses were collated and raw frequencies calculated by the author.
3.3 RESULTS
Overall, 476 participants were registered for the five workshops and 348 of these completed
the survey; a response rate of 73%. The workshops attracted a wide geographical variation
(Figure 9) with a mean of 64% attendees working outside the host country (range 26% to 84%).
Indeed, the two most recent workshops (Stresa, Italy; September 2009 and Amsterdam,
Netherlands; April 2010) attracted registrants from 20 European member-states and seven
countries outside Europe, namely North America (4 participants), Australia (5 participants),
Brazil, Israel, United Arab Emirates, Singapore and Thailand (1 each).
The courses were attended almost exclusively by radiologists (97%), with radiographic
technologists and gastroenterologists representing only 3% and 0.6% respectively during the
period studied (Table 3). Overall, 20% of the radiologists were trainees. The remainder where
staff radiologists of whom 40% considered themselves subspecialists in gastrointestinal
radiology. The remainder was approximately equally divided between general radiologists and
radiologists with a subspecialty interest in cross-sectional imaging (Table 3).

6 7
Figure 9: Geographical distribution of delegates attending ESGAR CTC courses. Mean number of
delegates per workshop: Blue 1 to 10; orange 11 to 20; red 21 or above.
Three-quarters (63%-85%) of respondents were already providing a CTC service in their own
hospital (Table 4) and practically all remaining participants (99%) intended to practice CTC in
the near future.
Practice setting, split by workshop, is shown in Figure 10. Overall 69% reported CTC exclusively
in the public sector; 23% were restricted to private practice; 8% reported in both settings. Of
those reporting in the private sector, 45% were carrying out screening investigations only.
Prior to the course, 86% of respondents had been reporting CTC. Amongst these, there was a
broad range of prior experience; 76% had interpreted less than 50 cases, and of those, 63% had
reported less than 10. In contrast 6% of respondents stated they had already personally
interpreted over 300 cases).

6 8
Figure 10: Participants’ CTC practice
Table 3: Occupation of workshop participants
Edinburgh
(Feb 07)
Pisa
(Sep 07)
Malmo
(Sep 08)
Stresa
(Sep 09)
Amsterdam
(Apr 10)
Total Mean
Occupation Number(%) Number (%) Number (%) Number (%) Number (%) Number (%)
Trainee radiologist 19(20) 12(16) 19(23) 7(15) 12(27) 69 20
Staff radiologist
with interest in GI
imaging
29(31) 28(36) 24(29) 14(29) 13(29) 108 31
Staff radiologist
with interest in CT
28(30) 9(12) 12(14) 11(23) 5(11) 65 18
Staff radiologist
with general
interest
17(18) 24(31) 24(29) 15(31) 14(31) 94 28
Non-radiologist
physician
0(0) 0(0) 1(1) 1(2) 0(0) 2 1
Radiographic
technician
2(2) 4(5) 3(4) 0(0) 1(2) 10 3

6 9
Table 4: CTC service provision at participants’ local hospitals
Edinburgh
(Feb 07)
Pisa
(Sep 07)
Malmo
(Sep 08)
Stresa
(Sep 09)
Amsterdam
(Apr 10)
Total Mean
CTC service Number(%) Number(%) Number(%) Number(%) Number(%) Number (%)
Do not offer a
service
24(25) 21(37) 21(25) 7(14) 6(13) 79 23
Public sector
service
63(66) 36(63) 52(63) 37(77) 34(76) 222 69
Private sector
service
26(27) 0 (0) 13(16) 11(23) 9(20) 59 17
Table 5: Workshop participants’ previous CTC training and experience
Edinburgh
(Feb 07)
Pisa (Sep
07)
Malmo (Sep
08)
Stresa (Sep
09)
Amsterdam
(Apr 10)
Total Mean
Previous training in
CTC
Number(%) Number(%) Number(%) Number(%) Number(%) Number (%)
None whatsoever 27(28) 19(25) 27(33) 3(6) 13(29) 89 24
Watched others
report locally
21(22) 20(26) 22(33) 15(31) 11(29) 89 24
Interpreted cases
independently
49(52) 41(53) 34(27) 25(52) 20(24) 169 49
Attended a
previous workshop
0(0) 0(0) 5(6) 13(27) 3(7) 21 8
Interpreted
validated datasets
6(6) 9(12) 6(7) 8(17) 9(20) 38 12
Validated cases
<10 24(38) 22(38) 50(60) 17(35) 31(69) 144 48
10-49 27(42) 21(36) 16(19) 15(31) 4(9) 83 28
50 – 99 5(8) 6(10) 5(6) 5(10) 7(15) 28 10
100-299 7(11) 4(7) 7(8) 5(10) 2(4) 25 8
300 or more 1(2) 5(9) 5(6) 6(13) 1(2) 6 13

7 0
Likewise, the level of prior hands-on training was highly variable. Of those currently practicing
CTC, 8% had attended a previous dedicated workshop, 12% had interpreted educational
datasets and 26% had observed others reporting. Surprisingly, the remaining 54% had no prior
formal training
Table 5). Indeed, 8% of those reporting CTC independently at the time of their course
registration had no prior training and had reported less than 10 cases (Figure 11).
Figure 11: Level of prior training among inexperienced readers
Full cathartic colonic cleansing was adopted by the majority of respondents (88%) with the
remainder using a reduced preparation regimen in young and elderly patient groups equally
(Figure 12). There was a slight increase in the use of water-soluble contrast material for tagging
residual faecal material and fluid over the study period, with one third (97; 35%) routinely
using such preparation. Moreover, there had been a sustained upward trend with only 11%
tagging in 2007 compared with 44% in 2010. Half of respondents were using carbon dioxide to
insufflate the colon rather than room air and 76% routinely used an antispasmodic in the
majority of cases (Figure 12).

7 1
Figure 12: Technical implementation of CTC
Regarding CT technology, on average just under half (48%) had access to a machine with 64
detector rows or more. However, there was a steady rise in the number using such machines
from 23% to 65% over the study period. Likewise, the proportion routinely employing 3D
reconstruction software for interpretation saw an increase from 59% to 82% (Figure 13).
Concerning interpretation, over the course of the survey the proportion restricting themselves
exclusively to 2D interpretation fell from 23% to 11%, while those performing a primary 3D
read increased from zero to 38%. The majority continued to favour a primary 2D read with 3D
reconstruction reserved for problem solving.
Approximately half of the respondents predicted the future role of CTC would focus on the
investigation of symptomatic patients while those remaining predicted a role for screening
(Table 6).
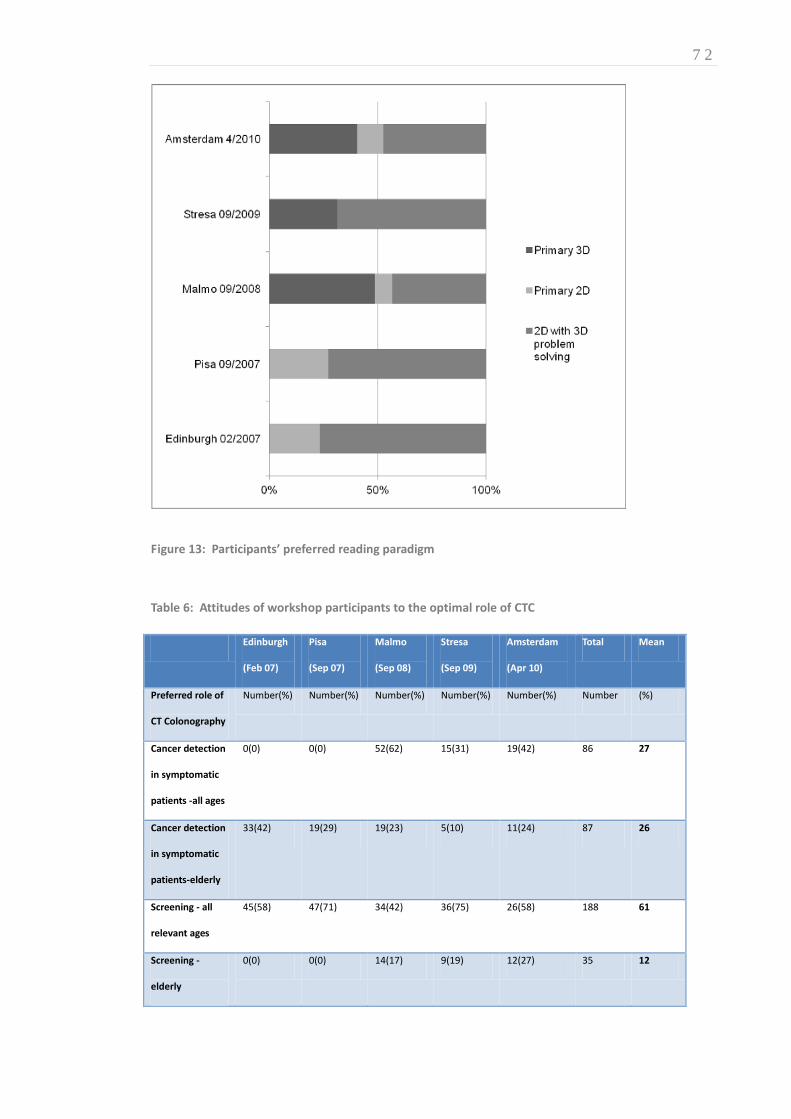
7 2
Figure 13: Participants’ preferred reading paradigm
Table 6: Attitudes of workshop participants to the optimal role of CTC
Edinburgh
(Feb 07)
Pisa
(Sep 07)
Malmo
(Sep 08)
Stresa
(Sep 09)
Amsterdam
(Apr 10)
Total Mean
Preferred role of
CT Colonography
Number(%) Number(%) Number(%) Number(%) Number(%) Number (%)
Cancer detection
in symptomatic
patients -all ages
0(0) 0(0) 52(62) 15(31) 19(42) 86 27
Cancer detection
in symptomatic
patients-elderly
33(42) 19(29) 19(23) 5(10) 11(24) 87 26
Screening - all
relevant ages
45(58) 47(71) 34(42) 36(75) 26(58) 188 61
Screening -
elderly
0(0) 0(0) 14(17) 9(19) 12(27) 35 12

7 3
The incidental detection of extra-luminal disease was believed to be beneficial by, on average,
83% of respondents for symptomatic patients and by 61% for the screening population (Table
7).
Table 7: Attitudes of participants to extracolonic findings at CTC
Edinburgh
(02/2007)
Pisa
(09/2007)
Malmo
(09/2008)
Stresa
(09/2009)
Amsterdam
(04/2010)
Total Mean
Attitude to
extracolonic findings
Number(%) Number(%) Number(%) Number(%) Number(%) Number (%)
A good thing in
symptomatic
patients.
83(87) 67(87) 77(92) 33(69) 35(78) 295 83
A bad thing in
symptomatic
patients.
1(1) 3(4) 2(2) 0(0) 2(4) 8 2
A good thing in
asymptomatic
screening patients
57(60) 45(58) 43(52) 38(79) 24(53) 207 61
A bad thing in
asymptomatic
screening patients
23(14) 14(18) 10(12) 4(8) 10(22) 61 17
3.4 DISCUSSION
This research has determined the professional background and prior expertise of workshop
registrants wishing to learn CTC, their motivations for attending for training, and their future
intentions for clinical practice. While we anticipated that the majority of attendees would be
radiologists, we were surprised that this group represented practically all of those registered,
despite apparent interest from other professional groups in interpreting the procedure (92,
100, 173). While international consensus statements strongly recommend that those intending
7 4
to practice CTC attend a hands-on training workshop (30, 36), there is a perception that access
to such courses is restricted (174). This may account for the striking geographical spread of
workshop attendees with participants travelling from many different countries to attend.
The workshops attracted not only those individuals intending to practice CTC in the future but
also a significant proportion of those currently providing a CTC service. The majority of these
had not interpreted 50 cases, which is commonly believed to be the minimum level of
experience recommended for independent reporting (30). Likewise only a small proportion had
any formal training prior to the workshop. These data are worrying because they imply strongly
that medical practitioners are interpreting radiological examinations in daily practice for which
they have no prior experience. The consequence is that the test characteristics suggested by
large clinical trials(14, 16, 28, 167, 175) and meta-analysis (15), often performed in centres with
experienced practitioners, are unlikely to reflect performance in generalised practice.
While suggested criteria for prior training and experience were not fulfilled, most respondents
satisfied the technical requirements for obtaining good-quality image data and were
performing CTC in accordance with published European guidelines; the majority employed
antispasmodics, full cathartic cleansing, modern scanning technology, and dedicated 3D
visualisation software. We identified a recent trend towards reduced bowel cleansing and
tagging of liquid residue that is likely to reflect subsequent uptake of recent research evidence
supporting these modifications (90, 127). We also identified a recent increase in the proportion
of those currently practicing CTC who choose to interpret using a primary 3D read, which again
may reflect subsequent uptake of research findings that have predominantly attributed high
sensitivity to this method of data display for interpretation (176, 177).
Despite the undoubted economic burden posed by incidental detection of extra-luminal
pathology and its subsequent evaluation (178), the majority of respondents believed that
detection of extra-colonic lesions was an advantage of CTC in both symptomatic and screening
populations, beliefs that are in accord with the concerns of patients themselves (33). It will be
interesting to observe if these beliefs change if health-economic data from large, randomised
pragmatic trials show that there is no net benefit, or even disutility from this practice(10).
Our study does have limitations. A potential limitation is the online nature of the survey.
However, a response rate of over 60% is generally considered a representative sample(179),

7 5
and we achieved 73%. While the workshops themselves were concentrated in only four
countries, there was a wide geographical variation amongst those who attended which should
enhance the generalisability of our results. Although no restrictions were placed on registration
there may have been a spectrum bias. Radiologists are more likely to be aware of ESGAR
workshops than gastroenterologists or radiographers. Advertising is aimed primarily at the
radiological literature with discounts available for society members. These factors may explain
the very low number of gastroenterologists attending the workshops.
In summary, this survey suggests that hands-on educational CTC workshops primarily attract
radiologists, with limited interest from other groups. Participants are generally inexperienced
and untrained but, despite this, a significant proportion is actively interpreting CTC in their
daily practice, which gives rise to considerable concern.

7 6
CHAPTER 4 4. SYSTEMATIC REVIEW: SOURCES OF BIAS IN STUDIES OF DIAGNOSTIC TEST ACCURACY
AUTHOR DECLARATION
Work presented in this Chapter was led by the Author under the supervision of Professor Steve
Halligan and Professor Stuart Taylor with significant statistical contributions from Dr Susan
Mallett and Professor Douglas Altman. The author designed the literature search strategy,
performed the systematic review, extracted data and drafted the manuscript. This research has
been published in: Boone D, Halligan S, Mallett S, Taylor SA, Altman DG. Systematic review: bias
in imaging studies - the effect of manipulating clinical context, recall bias and reporting
intensity. Eur Radiol. 2012; 22(3):495-505.
4.1 INTRODUCTION
Studies of diagnostic test performance should be designed to minimise bias, a principle that
underpins guidance for both reporting (180) and appraising the quality of diagnostic test
research (181, 182). At the same time, study results should ideally be generalisable to everyday
clinical practice. Balancing bias against generalisability is not straightforward. For example, in
order to reduce the risk of clinical review bias, it is generally accepted that study observers
should be blind to prior investigations (183). However, concealing information contrasts with
daily practice where patients’ clinical history, examination and prior investigations are known
to the observer when formulating a diagnosis. Particularly in the fields of radiology,
histopathology and endoscopy, test interpretation involves a significant subjective element that
could be influenced by methods which manipulate the clinical context.
7 7
In addition to individual patient information, study observers are often unaware of sample
characteristics, notably disease prevalence. This issue is potentially important when assessing
diagnostic tests intended for screening: In daily practice, observers will expect asymptomatic
patients to have low likelihood and lower stage of disease (i.e. more subtle pathology).
However, it is unclear how the observer’s a priori expectations influence subsequent
interpretation, if at all: Some studies have found diminished vigilance when prevalence is low
(184) while clustering of abnormal cases in high prevalence situations may also bias
interpretation (185). Nevertheless, studies of diagnostic test accuracy usually increase the
prevalence of abnormality to achieve adequate statistical power within a feasible study size
(23, 186). Therefore, results of studies performed in the ‘laboratory’ may not be transferable to
lower prevalence, screening populations in ‘the field.’
Other pragmatic issues may also influence generalisability. For example, in order to complete
research within a reasonable time-scale, reporting intensity (the number of cases reported
within a given timescale) frequently exceeds normal practice and is often exacerbated by the
requirement to re-evaluate cases under different conditions (e.g. when comparing MR to CT)
(23) or on more than one occasion (e.g. with and without computer aided detection).
Moreover, because it is widely believed that prior exposure will influence subsequent
interpretation (observer recall bias), it is recommended that consecutive interpretations are
separated by a ‘washout phase’ (187). However, the ideal duration is unknown and there is
little evidence that such procedures are effective or necessary.
While these potential ‘laboratory effects’ (188, 189) have been discussed in the methodology
literature(185, 189-192), their impact remains unverified. In order to attempt to quantify their
magnitude, we performed a systematic review of studies where the context of interpretation
was manipulated or investigated (i.e. ‘laboratory’ versus ‘field’). In particular, we wished to
investigate the effect of varying sample characteristics, for example, enriching disease
prevalence or increasing reporting intensity. Moreover we aimed to explore the effect of
concealing sample information (especially prevalence) from observers. We were also interested
in studies that addressed ‘memory effect’ due to observer recall bias.

7 8
4.2 METHODS
4.2.1 DATA SOURCES AND SEARCH STRATEGIES
The author searched the biomedical literature to March 2010 using three complementary
search strategies. A primary search identified any existing systematic reviews dealing with our
research questions (Table 8).
Table 8: Primary search strategy: Search for related systematic reviews using six keywords or phrases
identified by hand-searching the ten ‘key publications’ described in Table 9.
Keyword /phrase queried through Pubmed
using the ‘systematic(sb)’ systematic review filter
Total abstracts
(including duplicates)
Full text examined for
relevance
Report* & intens* 123 1
Recall &bias 71 1
Prevalen* 5142 44
Prior & knowledge 301 2
Lab*& effect* 45 1
Clinical & info* 368 6
Additional relevant references via ‘snowballing’ 1
Total 6050 56
Articles for data extraction following application of selection criteria 1
Because our review was not restricted to a specific test, diagnosis or clinical situation (which
would facilitate keyword identification), we initiated our search by identifying 10 key
publications (185, 188, 193-200) known to the authors in the fields of radiology, medical
statistics and image perception, that had dealt with case-specific information (Table 9).
Relevant keywords/phrases identified from these 10 articles were; clinical information; recall
bias; intensity; prevalence; prior knowledge; and laboratory effect. The MEDLINE database was
then searched via PubMed (http://www.nlm.nih.gov/pubmed) applying the systematic review
filter to each term in turn. ‘Snowballing,’ an iterative process for searches of complex material

7 9
(201), identified potentially relevant publications by reintroducing new key words, repeating
the process until no new relevant material emerged.
Table 9: Secondary search strategy: Details of the 10 ‘key publications’, the related record search, and
the number of publications citing each key publication.
Key publication Number of references
cited by key publication
Related record search for
publications with ≥2 references in
common with the key publication
Number of articles citing
key publication
Kundel, 1982(199) 2 279 15
Swensson, 1985 (200) 7 567 39
Berbaum,1988a (195) 12 232 45
Berbaum1988b (196) 5 152 42
Berbaum,1989 (194) 8 59 25
Good, 1990(198) 8 86 37
Samuel, 1995 (193) 10 92 36
Aideyan, 1995 (194) 9 67 16
Egglin, 1996(185) 16 544 63
Gur, 2008 (188) 5 335 15
Total abstracts reviewed
Full texts examined
Full texts included
82
2
0
2413
27
4
333
5
2
A secondary search was performed to, A) identify indexed literature that shared two or more of
the references cited by the 10 key publications and, B) identify all indexed literature citing a key
publication (using ‘related records’ and ‘citation map’ searches through Web of Knowledge -
http://www.isiknowledge.com). Citations were collated, duplicates eliminated and abstracts
reviewed (or titles if abstracts were unavailable) for potential inclusion (Table 9).
Lastly a tertiary search (Table 10) was initiated by retrieving Medical Subject Heading (MeSH)
terms from each potentially relevant publication identified by the primary and secondary
8 0
searches. Terms were ranked in order of frequency and terms likely to be non-discriminatory
excluded (e.g. adult, male, female, mammography, CT). Multiple suffixes (e.g. radiology,
radiological) were substituted by a truncated heading (e.g. radiol*). Related disciplines (e.g.
histopathology, endoscopy) were linked with ‘OR’ operators. Ultimately there were three
‘modality’ terms (endoscop*, radiol* and (cyto* OR histo* OR patho*)) and six ‘manipulation’
terms (prevalen*, attention, Bayes theorem, bias*, observer varia*, and research design),
which were paired using the ‘AND’ operator. MEDLINE was searched using these strings using
the ‘diagnosis’ option in the ‘Clinical Queries’ filter. Duplicates were excluded and abstracts
examined (Table 10). Potentially relevant publications were expanded using the secondary
search strategy previously described and any new publication introduced using snowballing
(201).
The search strategies were tested: The secondary search identified all 10 key publications. The
tertiary search identified all articles from which the MeSH headings had been compiled, and 7
of the 10 key publications.
4.2.2 INCLUSION CRITERIA
English language studies to March 2010 inclusive were eligible if they investigated the effect of
experimentally modifying the context of observers’ interpretations on diagnosis. In particular,
the effects of varying disease prevalence, blinding to sample characteristics, reporting intensity,
and studies investigating recall bias. Studies exploring artificial ‘laboratory’ conditions on
outcome were also eligible. However, we excluded studies whose focus was manipulation of
case-specific information (e.g. concealment of individual-patient information) since this has
been investigated previously by systematic review(183). Participants were human observers
(interpretation solely by computer-assisted detection was excluded), making subjective
diagnoses based on interpretation of visual data, blind to reference results. Studies were
excluded if the number of observers or cases interpreted was unreported. There was no
restriction to disease type. We anticipated most studies would be radiological, but subjective
interpretation of any medical image (e.g. endoscopy, histopathology) was eligible. Non-medical
interpretation was excluded (e.g. airport security X-ray), as were narrative reviews.

8 1
Table 10: Table detailing the Boolean search strings used for the tertiary search strategy and the
number of individual abstracts identified by each term, with details of the full texts subsequently
examined.
‘Modality' MeSH term ‘Manipulation' MeSH term
Total Abstracts (including duplicates)
Full texts retrieved (Duplicates removed)
Full text examined for relevance
& Attention 25 1 0
& Bayes theorem 6 0 0
Endoscopy1 & bias* 84 8 3
& observer variation 86 3 0
& prevalen* 64 2 0
& research design 69 1 1
& Attention 2 1 1
& Bayes theorem 0 0 0
Radiology2 & bias* 708 14 1
& observer variation 699 36 0
& prevalen* 89 5 2
& research design 185 10 0
& Attention 4 0 0
& Bayes theorem 21 1 0
Pathology3 & Bias 96 3 3
& observer variation 19 10 2
& prevalen* 131 14 0
& research design 81 2 0
2369 111 13
Selection criteria applied
Additional references via ‘snowballing’
3
2
Total for data extraction 5
Search String: Endoscopy1 =(endoscop*(MH)); Radiology2 = (radiol* (MH)); Pathology3 = ((cyto* OR histo* OR patho*)(MH))
8 2
4.2.3 DATA EXTRACTION
The author extracted data from the full-text articles consulting Professors Halligan and Taylor,
who are both experienced in systematic review, if uncertain. Differences of opinion were
resolved by consensus. Data were extracted into a data-sheet incorporating measures
developed from QUADAS(181) and QAREL(182), with additional fields specific to the review
question. The following was extracted: Author, Journal; imaging modality; topic; number of
observers/cases and their characteristics (e.g. professional background and experience);
reference standard; case and observer concealment of population characteristics; blinding
observers to study participation and purpose; reporting intensity; washout period; prevalence
of abnormality and whether this varied; data clustering (grouping of normal/abnormal cases).
4.3 RESULTS
The primary search (Table 8) found 6050 abstracts. 56 full articles were retrieved; one was
suitable(202). The secondary search (Table 9) identified 2828 publications with the full text
retrieved for 34: ultimately 6 were included (185, 189, 203-206) and 28 rejected because the
research focused on case-specific information. The tertiary search (Table 10) identified 74
MeSH terms which were combined into 18 Boolean search strings: These identified 111
potential articles with a further 2 via snowballing; 5 articles were ultimately included (190, 191,
207-209). Overall, 11247 abstracts were reviewed, 201 full articles retrieved, and 12 ultimately
included for systematic review (Table 11).
4.3.1 DESCRIPTION OF STUDIES INVESTIGATING CLINICAL CONTEXT
Of the 12 identified studies that investigated the effect of manipulating clinical context, 3
focused on varying the prevalence of abnormality (185, 189, 203). The remaining 9 studies
investigated observer performance in different situations with fixed prevalence: 4 compared
performance in the laboratory to daily practice (188, 190, 209); 3 investigated observer
blinding to previous clinical investigations (206-208); 1 investigated training (204); 1
investigated varying reporting conditions(202); 1 investigated recall bias (205). The 4 studies

8 3
that investigated interpretation in ‘the field’ used retrospective data obtained from normal
clinical practice (188, 190, 202, 209). 1 study recruited from an international conference (207).
The remaining 7 used a laboratory environment exclusively.
4.3.2 STUDY CHARACTERISTICS AND SETTINGS (TABLE 11)
The following diagnostic tests were investigated by the 12 included studies: 9 studies were
radiological (5 mammographic (188, 190, 202, 205, 206), 3 chest radiology (189, 203, 204), 1
angiographic(185)), 2 endoscopic (207, 209), and 1 histopathological (208). A single research
group contributed 5 studies (188, 189, 203-205).
4.3.3 PRIMARY STUDY DESIGN
All primary studies used a design with an independent reference standard excepting a single
study of observer agreement (208). With the exception of that one study (208), all observers
were blinded to the research hypothesis. Furthermore, one study (207) used observers who
were unaware that they were taking part in research. However, despite attempts to overcome
‘study knowledge bias’ (192) (an area of interest to this review) this was not formally
quantified, for example by repeating the study with observers who were aware of they were
participating in research.
4.3.4 OBSERVER AND CASE CHARACTERISTICS (TABLE 11)
In all primary studies, the observers were medically qualified/board certified with a median of
8 observers per study (inter-quartile range (IQR) 3.5 to 14, range 2 to 129), with 6 studies
restricted to observers who were ‘specialists’ (188, 202, 208) or ‘experienced’ (205, 206, 209);
but only 2 studies (188, 205) quantified this. Five studies included less-experienced observers,
e.g. residents (185, 189, 203, 204, 207). In one study, the authors did not detail experience
(190). The median number of cases per study was 300 (IQR 100 to 1761, range 5 to 9520). Case
selection criteria were well-defined for 9 (75%) studies. Of these, in 4 studies (188, 190, 202,

8 4
206) recruitment was consecutive, 4 (189, 203, 207, 208) selected cases for optimal technical
quality, and 1 (205) selected ‘stress’ cases (specifically, cases misinterpreted previously in
clinical practice). In all 12 studies technically acceptable material was used, e.g. genuine
radiographs, video endoscopy.
4.3.5 EFFECT OF SAMPLE DISEASE PREVALENCE (TABLE 12)
Three articles investigated the effect of varying the prevalence of abnormality on observers’
diagnoses (Table 12). The earliest (185) investigated context bias (to determine if clustering of
abnormal cases influenced interpretation of subsequent cases), finding that sensitivity for
pulmonary embolus increased significantly (from 60% to 75%) when prevalence was increased
from 20% to 60% (7). Two studies by Gur and colleagues (189, 203) increased the prevalence of
subtle chest radiographic findings from 2% to 28% in a sample of 3208 cases read by 14
observers of varying experience, in a laboratory environment. While no significant effect on
observer performance (via ROC AUC) was demonstrated (189), reader confidence scores
increased at higher prevalence levels (203). However, the effects on sensitivity, or indeed the
ROC curve itself were not addressed. Furthermore, the maximum prevalence used was 28% but
researchers frequently increase prevalence far beyond this level: 6 (50%) studies in this review
used prevalence between 50 and 100% (23, 185, 204, 207-209).
4.3.6 EFFECT OF BLINDING OBSERVERS TO DISEASE PREVALENCE (TABLE 12)
Of the 12 primary studies reviewed, 8 (66%) concealed the prevalence of disease from
participants. One mammographic study(188), informed observers that the prevalence of
abnormality in the sample was enriched (while concealing the exact extent and proportion) but
that BiRads ratings should be assigned as if reading in a screening environment. Of the
remaining three studies, observers were told the sample prevalence (205), aware of prevalence
because they designed the study (208), or aware of prevalence because the entire study was
performed in the clinic (202).

8 5
Table 11: Details of the 12 publications included in the systematic review.
Publication Diagnostic test assessed
and condition tested
Research focus and relevance to the
review
Sample
size
Case sample selection
Sample prevalence
of abnormality
Observer
Sample
size
Observer
qualification and
experience
Observer blinding to
prevalence of disease
Summary of findings
Gur
1990(204)
Chest radiography: Lung
nodules, interstitial
disease and
pneumothorax
Laboratory effect; The effect of
training observers to use the extent
of the ROC scale in observer studies
300 Unclear Enriched; 80% 4 Board certified,
variable experience
Yes No significant training affect for detecting
interstitial disease and pneumothoraces.
Accuracy of Lung nodule detection was affected
for two readers and the overall accuracy
increased for one reader.
Egglin
1996(185)
Pulmonary angiography:
Pulmonary emboli
Tests prevalence effect, context bias.
Effect of deliberate clustering of
abnormal cases during observer
interpretation of enriched datasets.
24 Unclear Enriched; 20% or
60%
6 Board certified,
variable experience
Yes Enriching prevalence from 20% to 60% led to an
increase in observer sensitivity from 60% to 75%.
Rutter
2000(190)
Mammography:
Breast cancer
Lab vs field, population blinding,
prevalence effect.
1890 in
clinic
120 in
lab
Consecutive for field
cases. Characteristics
of laboratory cases
unclear
Enriched;25% in ‘lab’
cases
Population
prevalence in ‘field’
cases
27 Board certification
implied
Yes Mean sensitivity and specificity are both higher in
routine practice compared to an artificial
research setting.
Meining
2002(209)
Endoscopic ultrasound:
Oesophageal and
pancreatic cancer
Lab vs field, effect of blinding.
Performance of interpretation in
artificial setting both with and
without prior information
100 Unclear Enriched;
100% in ‘lab’ cases,
but not in ‘field’
cases
2 Board certified,
Experienced
Yes Observer performance was reduced in the
research setting compared to interpretation in
the clinic but this effect was reduced when
observers were unblinded to prior information.
Gur,
2003(189)
Imaging, radiography:
Lung nodules, fractures
pneumothorax and
consolidation
Prevalence effect, blinding to
population characteristics. Effect of
deliberately enriching prevalence of
abnormality
1632 Selected for optimum
quality
Enriched,
2 to 28%
14 Board certified,
variable experience
Observers instructed to
consider the cases as
screening tests. Yet
prevalence up to 25%
No significant increase in sensitivity when
observers report studies in a sample with
prevalence enriched up to 28%
Burnside,
2005(202)
Mammography:
Breast cancer
Reporting intensity; Effect of
changing clinical reporting
environment to high intensity
9522 Consecutive Population risk;
0.05%
5 Board certified,
specialist
No; known screening
population
Recall rates were 20.1% before and 16.2% after
the introduction of high intensity batch reading.
Cancer detection rates were not significantly

8 6
reading different.
Hardesty,
2005(205)
Mammography:
Breast cancer
Memory effect, recall bias.
Effect of reading cases which had
been previously interpreted in the
past and recall of those cases
182 Difficult to interpret
cases only (previously
incorrectly reported)
5%, enriched
compared with
screening population
8 Board certified,
Experienced
7-20 years
Observers correctly
informed the population
was enriched
No significant difference in average performance
between mammograms observers had
interpreted in clinic and those they had not. 7 out
of 8 observers did not remember previously
interpreting any of the mammograms
Irwig
2006(206)
Mammography, and
ultrasound: Breast cancer
Blinding. Interpretation bias due to
incorrect interpretation of test
results in the light of contextual
information.
480 Consecutive Enriched;
50%
2 Board certified,
Experienced
Yes Blind analysis of USS read with mammography was
4.6% higher than without mammography. Comparing
combined accuracy of mammography and ultrasound
read with and without prior knowledge showed much
smaller differences
Bytzer,
2007(207)
Gastroscopy:
Ulceration, gastritis,
cancer
Effect of providing misleading
contextual information. Effect of
population blinding and ‘study
knowledge bias’
5 Attendees at a medical
conference
Enriched;
100%
129 Board certified,
variable experience
Yes; observers unaware of
study participation
Only 23% observers gave the same diagnosis for
two identical cases when deliberately misleading
contextual information was provided.
Gur
2007(203)
Chest radiography: Lung
nodules, interstitial
disease and
pneumothoraces
Prevalence effect, blinding to
population characteristics. Effect of
deliberately enriching prevalence of
abnormality
1632 Selected for optimum
technical quality
Enriched;
2 to 28%
14 Board certified,
variable experience
Observers instructed to
consider the cases as
screening investigations
yet prevalence up to 28%
Varying prevalence resulted in no significant bias
demonstrated in terms of reader accuracy.
However, observer confidence that a specific
abnormality is truly present is higher in low (2%)
than in high prevalence (28%) settings
Fandel
2008(208)
Histopathology: Prostate
cancer
Lab vs field bias. Interpretation bias
due to unavoidable exposure to bias
inherent in the interpretation
techniques.
178 Selected for optimum
technical quality
Enriched; 100% 3 Board certified,
specialist
No; two observers
involved in study Design
Blinding pathologists to features present on low
power in the lab significantly improved accuracy
of high power field interpretation
Gur
2008(188)
Mammography:
Breast Cancer
Lab vs field. Comparison between
observer performances when lab
interpretations are compared to
performance reading the same
mammograms in the clinic.
3000 Consecutive Enriched; 25% in ‘lab’
cases, population
prevalence in ‘field’
cases
9 Board certified,
specialist >3000 read
per year. 6 to 32
years experience
Observers instructed to
consider the cases as
screening investigations
yet prevalence up to 28%
Mean sensitivity and specificity were both higher
in the clinic compared to a research setting.

8 7
Although 2 studies (189) (203) varied the sample prevalence without informing readers, these
studies did not specifically test the effects of revealing the sample prevalence on observers‘
interpretation. Hence the effect of blinding readers to the spectrum of abnormality in the study
sample remains uncertain.
Table 12: Articles investigating the effect of manipulating the prevalence of abnormality on studies of
diagnostic test accuracy
Publication Imaging modality Observers blinded to prevalence of pathology in study sample
Clustering of abnormal cases avoided
Prevalence of abnormality in study sample
Egglin,
1996(185)
Imaging, angiography
Yes Deliberate clustering of abnormal cases
60% or 20%
Gur,
2003(189)
Imaging, chest radiographs
Yes Yes 2-28%
Gur,
2007 (203)
Imaging, chest radiographs
Yes Yes 2-28%
4.3.7 EFFECT OF REPORTING INTENSITY (TABLE 13)
We did not identify any research that specifically manipulated reporting intensity (i.e. burden
of cases requiring interpretation) in the laboratory or compared it to daily practice. While a
retrospective analysis of mammography in daily practice found that false-positive diagnoses
diminished, following implementation of high-intensity, batch-reading (202), the change was
unquantified. The researchers believed improved performance was due to decreased
disruption. Of the remaining 11 studies, 6 detailed setting, observer experience, and case-load
enabling an inference of reporting intensity vs. normal practice (Table 13). Observers each read
a median of 300 (IQR 100 to 3208) cases at a median rate of 50 (IQR 40 to 50) cases per
session. One angiographic study (185) stipulated interpretation within three minutes, which
likely exceeded normal practice. Intensity was either unreported or unclear in 5 studies. No
article attempted to justify reporting intensity.

8 8
Table 13: Estimation of reporting intensity and generalisability to daily practice of ‘lab’ studies
Publication Total number of cases read per reader
Reporting intensity Diagnostic test employed in test conditions as per clinical practice
Reporting intensity and environment judged equivalent to daily practice
Gur 1990(204) 300 50 per session ?interval Yes Yes
Egglin
1996(185)
40 Three minutes per angiogram. Selected images only reviewed.
Selected images only reviewed. No additional views available
No: higher
Rutter 2000(190)
120 30 per hour every 2 weeks Yes Yes
Gur, 2003(189) 3208 >50 per session, fortnightly over 18 months
Yes Yes
Gur 2007(203) 3208 >50 per session, fortnightly over 18 months
Yes Yes
Gur 2008(188)
300 20-60 films per session
Yes Yes
4.3.8 EFFECT OF OBSERVER RECALL BIAS (FIGURE 14)
One article investigated recall bias specifically (205), asking observers to reinterpret
mammograms reported by them in clinical practice 14 to 36 months previously. One observer
recognised a single mammogram, but subsequently reported it incorrectly. The authors
concluded that recall is rare and unlikely to bias studies. The same group (189) tested for 2
week recall via subgroup analysis, finding no effect, but the study was neither designed nor
powered for this analysis. 8 (66%) studies included repeated observations of the same cases.
One study(207), did not account for recall bias at all, requiring reinterpretation within minutes.
The remaining studies incorporated a washout period between observations, with 3 studies
using between 2 to 8 weeks and 3 indicating 14 to 36 months, and the exact duration unclear
in 1 article (Figure 14). Moreover, only one article (189) justified the interval and, even then,
based this upon anecdotal opinion.
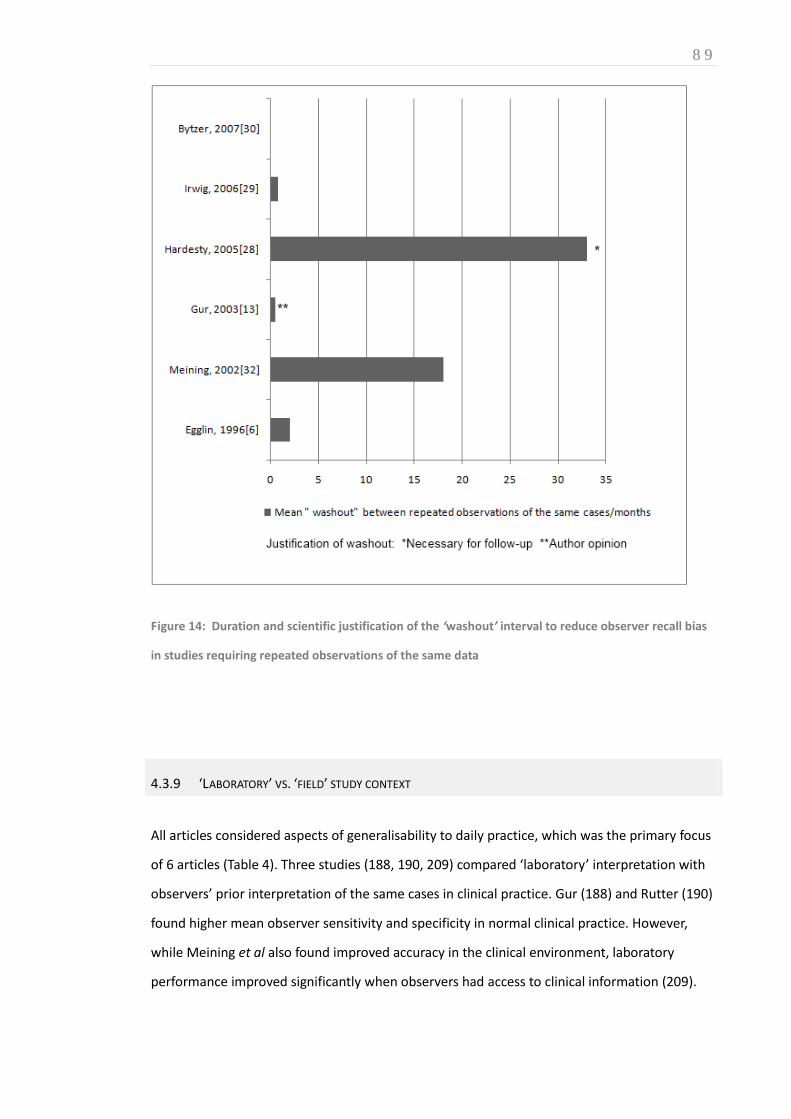
8 9
Figure 14: Duration and scientific justification of the ‘washout’ interval to reduce observer recall bias
in studies requiring repeated observations of the same data
4.3.9 ‘LABORATORY’ VS. ‘FIELD’ STUDY CONTEXT
All articles considered aspects of generalisability to daily practice, which was the primary focus
of 6 articles (Table 4). Three studies (188, 190, 209) compared ‘laboratory’ interpretation with
observers’ prior interpretation of the same cases in clinical practice. Gur (188) and Rutter (190)
found higher mean observer sensitivity and specificity in normal clinical practice. However,
while Meining et al also found improved accuracy in the clinical environment, laboratory
performance improved significantly when observers had access to clinical information (209).

9 0
Irwig (206) questioned whether results from standard tests should be revealed when new
diagnostic alternatives are assessed, believing that observers may give undue weight to
standard tests with which they are familiar, and so confound the assessment. The authors
concluded that such practice is acceptable only when the standard test is both sensitive and
specific. One histopathological study examined whether unavoidable initial viewing of low-
magnification images may bias subsequent interpretation of high-magnification images (208),
arguing that performance would be diminished if studies were restricted to high-power fields.
One article (204) explored ‘checkbox’ bias in ROC methodology, concluding that measures
encouraging readers to use the full extent of confidence scales might itself introduce bias.
4.4 DISCUSSION
We wished to investigate and quantify the effect on diagnostic accuracy results of blinding
observers interpreting medical images to sample information, including disease prevalence.
We found that, although manipulation/concealment of individual case information is relatively
well-investigated, including a 2004 meta-analysis of 14 studies(183), few researchers have
addressed information relating to the study sample. Our systematic review identified only 12
primary studies (9 radiological) that investigated generalisability of results from laboratory
environments to daily practice and, of these, only 3 focused specifically on prevalence (185,
189, 203), 2 from the same research group. Furthermore, only 2 modalities have been
investigated, angiography (185) and chest radiography (189, 203). The literature base is
therefore very insubstantial indeed. We had originally intended to perform a meta-analysis to
quantify the effect of the potential biases investigated, but the paucity of available data
prevented this.
Enriched prevalence may be an unavoidable aspect of study design, in order to complete within
an acceptable timeframe, within available resources and without undue observer burden. It is
important to distinguish between two potential reasons why prevalence might affect
sensitivity: Firstly, high prevalence clinical settings are often associated with a more severe
disease spectrum, which in itself, will increase sensitivity. Secondly, prevalence may be

9 1
increased without an increase in disease severity, a situation often encountered in research
studies, especially of screening technologies. In this latter situation, it is uncertain how
increased prevalence will affect study results. For results to be generalisable we must know the
effect, if any, of these enriched study designs on measures of diagnostic test performance, and
to what degree and in what direction. It is widely believed that increasing prevalence raises
sensitivity because disease is encountered more frequently than in daily practice (199); a view
supported by Egglin et al(185). However, it is only where an increased prevalence is associated
with an increase in disease severity that there are theoretical reasons to expect prevalence to
affect the ROC curve(210). It is important to note that although Gur et al did not demonstrate a
significant difference in ROC AUC, despite varying prevalence(189), it does not necessarily
follow that a prevalence effect does not exist. Indeed the authors cautioned in a separate
editorial(191) that while results obtained in enriched populations should be generalisable to
lower prevalence lab-based studies (provided they were analysed using ROC AUC methods),
this is not the case for clinical practice. In addition, it is important to consider that while the
maximum prevalence was 28%, this level is still well below that often employed by researchers.
Our interest in sample prevalence was precipitated by studies of CTC for colorectal cancer
screening but we could find no research that addressed the design of these studies. Screening
for lung and colorectal cancer by CT, and for breast cancer by mammography, are the subject of
considerable primary research but it is currently impossible to draw evidence-based
conclusions regarding the effect of sample prevalence on measures of diagnostic test accuracy.
It is intuitive that observers’ prior knowledge of sample prevalence in a study will influence
their expectation of disease and we were interested whether this might affect measures of
diagnostic accuracy. For example, it is believed that vigilance is reduced in situations where
expected (and actual) prevalence is low (e.g. screening), because disease is encountered
infrequently (211). Surprisingly, we could identify no research that specifically addressed this
issue, either by blinding/unblinding, or by misleading readers. Most studies concealed
prevalence altogether whereas some altered prevalence, but without readers’ knowledge.
Recall bias (i.e. where interpretation is influenced by recollection of prior interpretations) is a
related issue. Many studies incorporated a ‘washout’ phase between consecutive
interpretations of identical cases but we could find no research that specifically investigated the

9 2
impact of varying the duration of the washout phase. It could be argued that the repetitive
nature of screening (in terms of material and task) argues for short washout. Indeed, one study
concluded recall bias does not exist (205). We could find no research that specifically addressed
the effect of manipulating reporting intensity on measures of diagnostic test performance.
Although anecdotal opinion suggests that observers’ performance in an artificial ‘laboratory’
environment (reviewing cases enriched with pathology, remote from the pressures of normal
daily practice) should exceed that achieved in ‘the clinic,’ the available evidence identified by
our review (188, 190, 209) actually suggests the opposite. The fact that clinical information is
available in normal practice might help explain this but meta-analysis suggests the effect is
small(183). Another possible explanation is that observers in laboratory studies are aware their
assessments will have no clinical consequences; ‘study knowledge bias’ is also likely to
influence observer studies but we found no research to substantiate this. Lastly, a substantial
reporting burden associated with research studies (often performed at unsocial hours so as to
not interfere with normal duties) may explain why accuracy is diminished. This discrepancy
between ‘lab’ and ‘field’ performance has important implications, not only for evaluation of
diagnostic tests, but also for how radiologists’ performance is assessed in isolation. For
example, the PERFORMS programme for evaluating mammographic interpretation uses a
cancer prevalence of 22%(212) and so may not reflect radiologist performance in clinical
practice. Toms et al suggested a more accurate assessment would be obtained by sporadically
introducing abnormal test cases into normal daily reporting (213)
Our review revealed that the existing evidence-base is too insubstantial to guide many aspects
of study design. High-quality research is needed to investigate and quantify the biases we
investigated. Inevitably, studies specifically designed to answer the questions we posed will be
expensive and time-consuming. For example, most studies we identified used observer
samples in the single digits and variance is likely to be high; much larger studies are required.
The authors predict that funding would be difficult to achieve for large-scale methodological
research specifically designed to quantify these potential biases. However, given that funding
agencies have previously provided very substantial support for large-scale studies of screening
technologies, the authors suggest that future studies incorporate additional research that aims
to estimate bias and generalisability. For example, this could be achieved via sub-
9 3
studies/parallel/nested studies that incorporate unblinded observers, different contexts, or by
varying the duration of washout period for different groups of observers. Such an approach
would combine large-scale diagnostic test accuracy studies with methodological research for
relatively little additional cost.
Our review does have limitations. In particular, relevant research may have been missed
because of a lack of search terms specific to our review question. For example, many papers
will discuss potential bias but few will test this as a primary outcome. Aware of this, we used
multiple search strategies and snowballing to maximise studies retrieved. Even so, the total
body of relevant literature we identified was rather small and was heterogeneous in the issues
addressed.
In summary, this systematic review revealed that several issues central to the design of studies
of diagnostic test accuracy have not been well-researched, with the result that there is an
insufficient evidence-base to guide many aspects of study design. High quality research is
needed to address potential bias resulting from observers’ knowledge of prevalence and the
effects of recall bias across several imaging technologies and diseases, most notably for studies
of screening methodologies.

9 4
SECTION C: IMPLEMENTING NEW TECHNIQUES AND STRATEGIES IN CTC RESEARCH
OVERVIEW
Section A established there is a relatively sound evidence base for current CTC implementation.
However, Section B has shown that commonly utilised methodology for assessing diagnostic
test accuracy may introduce presently unquantified sources of bias that may encumber
transferability into daily practice. Furthermore, at present, the suboptimal level of CTC training
and experience among European radiologists may impact upon the generalisability of such
studies’ results. Although consensus guidelines(30, 36) recommend a minimum level of
experience for safe CTC interpretation, the relationship between performance and experience
is not straightforward(214); this is the focus of this Section.
Studies have shown CAD can increase reader sensitivity for both inexperienced radiologists
(215) and radiographic technicians (159) but the potential benefit to patients in clinical practice
is poorly understood, not least due an accompanying increase in false positive (FP) detections.
When sensitivity and specificity change simultaneously, as is usually the case(216), a summary
statistic combining both measures is convenient for comparing results from different research
studies. For example, the area under the receiver operating curve (ROC AUC) could be

9 5
compared for observers interpreting CTC with and without CAD assistance. However, the
limitation of this technique is that gains in sensitivity are considered statistically equivalent to
losses in specificity when both are equal in magnitude yet the clinical consequences of FP and
FN detections (e.g. unnecessary colonoscopy vs. missed cancer diagnosis) are clearly far from
equal. Therefore, if an increase in sensitivity due to CAD assistance is counterbalanced by an
equivalent fall in specificity, there will be no significant difference in ROC AUC, potentially
underestimating the benefit of this technology in clinical practice(24). In order to account for
different clinical utilities of FP and FN diagnoses, collaborators, Dr Susan Mallett and Professor
Douglas Altman have developed a novel statistical analysis as an alternative to ROC AUC: the
‘CAD net effect measure’ (21).
CAD net effect = ΔSE + (ΔSP · (1/W) · ((1 – P)/P)))
P denotes the prevalence of abnormality within the sample.
W denotes the relative ‘weighting’ ascribed to the clinical value of sensitivity vs. specificity.
However, the value of ‘W’ is not presently quantified with precision. While qualitative research
suggests patients and clinicians value sensitivity far above specificity, existing quantitative
assessments have not assessed willingness to trade these attributes against one-another.
Therefore, Chapter 5 describes a conjoint analysis (discrete choice experiment) to ascertain the
relative value clinicians and patients place upon sensitivity and specificity when using CTC for
colorectal cancer screening. Having established the weighting value ‘W’, Chapter 6 implements
the novel statistical method to compare the incremental benefit of CAD when employed by
experienced and inexperienced observers during two previous multireader, multicase studies.
The results of Chapter 6 reaffirm the complex relationship between experience and
performance. However, differences in interpretative technique between readers remains
poorly understood. Medical image perception has featured extensively in plain radiographic
research (18) yet eye-tracking technology has not previously been applied to 3D radiological
image display. Therefore, Chapter 7 concludes this Section with a technical description and
preliminary evaluation of novel eye-tracking methodology to assess differences in visual search
during CTC interpretation.
9 6
CHAPTER 5 5. WHAT IS THE RELATIVE IMPORTANCE PLACED ON FALSE POSITIVE VS TRUE POSITIVE DETECTIONS AT CTC? A DISCRETE CHOICE EXPERIMENT
AUTHOR DECLARATION
Work presented in this Chapter was led by the author under the supervision of Professor Steve
Halligan and Professor Stuart Taylor with significant contributions from Dr Susan Mallett,
Professor Douglas Altman and Professor Richard Lilford. The author obtained ethical approval,
designed and piloted the discrete choice experiment, compiled survey software, and recruited
and interviewed participants. Approximately 50% of interviews were performed by
psychologist, Miss Nichola Bell. Statistical analysis was performed by the author and Dr Susan
Mallett with contributions from Dr Shihau Zhu and Dr Lily Yao.
Abstracted data have been published in: Boone D, Halligan S, Bell N, et al. How do patients and
doctors weight the relative importance of false-positive and false-negative diagnoses of cancer
by CT colonography: Discrete choice experiment. Insights into Imaging. 2012; 3 (suppl 2):455-
503. A journal article is currently under consideration for indexed publication: Boone D,
Halligan S, Mallett S, et al. Patients’ and healthcare professionals’ preferences regarding false
positive diagnosis during colorectal cancer screening with CT colonography: Discrete choice
experiment.
5.1 INTRODUCTION
Understanding the diagnostic performance of a test is essential for evidence-based practice
(182, 217), particularly for screening where risks and benefits must be balanced carefully(187).
No screening test is 100% sensitive and disease may be missed. Consequences of imperfect
9 7
sensitivity are readily understood: A false-negative (FN) diagnosis may delay or prevent cure.
Specificity is also important for screening because prevalence of abnormality is low. Therefore,
while relatively few will benefit from early detection, many healthy individuals may undergo
procedures such as endoscopy, biopsy or surgery because of a false-positive screening result.
False-positive (FP) diagnoses cause anxiety, morbidity, and even mortality, all for no
benefit(218). Test modifications that increase sensitivity usually diminish specificity. For
example, CAD (219), digital imaging(220), and a shorter interval between screenings(221) all
increase mammographic sensitivity for breast cancer but decrease specificity.
As described above, a combined measure of sensitivity and specificity, such as the area under
the receiver-operating-characteristic (ROC) curve, facilitates comparisons between different
tests or tests under different conditions (187, 210, 222, 223). The ROC curve displays
graphically how sensitivity and specificity change with the test result; regulatory bodies may
require a significant increase in area-under-the-curve (AUC) to approve a new imaging test.
When calculating curve shape and AUC, similar changes in sensitivity and specificity are
weighted equally. For example, if an increase in sensitivity (e.g. from use of CAD) is offset by an
identical decrease in specificity, net AUC may not change, and the new intervention could be
judged ineffective. However, although similar changes in sensitivity and specificity assume
equal statistical importance, they may not be clinically equivalent.
In the case of screening for colorectal cancer with CTC, qualitative work suggests that patients
value sensitivity over specificity(33), but the magnitude of that preference is unknown. Such
data are important because analyses not accounting for differential weightings may
underestimate test value. For example, the Medicaid/Medicare decision to not reimburse CTC
did not consider that gains in sensitivity over alternative tests may be regarded more positively
by screenees even when specificity is reduced (131).
Net-benefit methods offer an alternative combined measure to ROC AUC and have the
advantage of being able to incorporate clinically relevant relative values for TP versus FP
diagnoses(24) but these values have not been determined for colorectal cancer screening.
Accordingly, we aimed to establish the relative weighting given by patients and healthcare
professionals to additional TP diagnoses versus additional FP diagnoses when using CTC for
colorectal cancer screening.

9 8
5.2 METHODS
Ethical committee approval was granted; all participants gave written informed consent.
Participants’ opinions were elicited using a discrete choice experiment (DCE)(224-226),
designed and conducted according to recent guidelines(226). Scenarios encompassing paired
hypothetical tests were presented and specificity systematically varied, asking participants to
indicate their preference. We then ascertained the relative value participants ascribed to
sensitivity and specificity.
5.2.1 CHOICE OF ATTRIBUTES AND LEVELS
Specificity is conceptually challenging for patients; many are unaware that FP detections occur
(32). It is also known that patients value sensitivity so highly that even small changes may mask
the influence of other attributes(226). We therefore used a ‘probability equivalence’ design to
establish respondents’ attitudes to just two attributes: Sensitivity and specificity. We devised a
hypothetical ‘alternative’ screening test differing from ‘standard’ CTC only in sensitivity and
specificity. No other attributes were changed, to simplify/focus decision-making.
For ‘standard’ CTC we chose sensitivity and specificity for cancer of 0.85 and 0.95 respectively
and 0.80 and 0.85 for polyps ≥6mm. ‘Alternative’ CTC raised sensitivity to 0.95 for cancer and
0.90 for polyps. These values were arrived at because we wished to present a relative
difference in sensitivity of 0.10 but did not wish the ‘alternative’ test to be perfect, since this is
rarely achieved. Screening data suggest 0.2% cancer prevalence (i.e. 10 patients per 5000
screened) (227) and 25% polyp prevalence (i.e. 1250 patients per 5000 screened) (228, 229),
thus increasing sensitivity by 0.10 detects one additional cancer and 125 additional polyps per
5000 screenees. We then varied specificity of ‘alternative’ CTC incrementally from 0.95 down
to 0.10 to form test scenarios presented (Table 14). Such extremely low specificity is unlikely in
real practice but necessary to calculate ‘trade-off values’ for the DCE.
5.2.2 INFORMATION PROVISION
Because DCEs are difficult to comprehend, especially via postal questionnaires (230), for
patients an interviewer-led face-to-face design was used to maximise participant spectrum
9 9
(231). A multimedia presentation of colorectal cancer screening by colonoscopy and CTC was
presented on a laptop, including information on survival benefit and clinical consequences of
FP diagnosis (e.g. need for colonoscopy following CTC; risk of perforation). Since inconsistent
framing may introduce bias (232), both absolute and relative risks were displayed textually and
graphically (Figure 15).
Table 14: Discrete choice experiment design: Overview of attributes and levels presented in cancer (A)
and polyp (B) detection scenarios.
A: CANCER DETECTION SCENARIO
Question
number
‘STANDARD’ CTC
Baseline diagnostic
performance
‘ALTERNATIVE’ CTC
Increased sensitivity but
variable specificity
PARTICIPANT TRADE-OFF REQUIRED IN EXCHANGE FOR 0.1
INCREASE IN SENSITIVITY
Sensitivity
for
detection
of cancer
(%)
Specificity
for
detection
of cancer
(%)
Sensitivity
for
detection
of cancer
(%)
Specificity
for
detection
of cancer
(%)
Change in
specificity
compared to
baseline
(%)
Additional FP
detections per
5000 screening
examinations
Additional true
positive detections
per 5000 screening
examinations
1c 85 95 95 95 0 0 1
2c 85 95 95 95 0 0 1
3c 85 95 95 90 5 250 1
4c 85 95 95 80 15 750 1
5c 85 95 95 70 25 1250 1
6c 85 95 95 50 45 2250 1
7c 85 95 95 40 55 2750 1
8c 85 95 95 30 65 3250 1
9c 85 95 95 20 75 3750 1
10c 85 95 95 10 85 4250 1
Questions 1 to 10 are delivered in random order using an interactive multimedia presentation which displays the diagnostic performance data of both tests graphically and numerically. Please see Figure 15 *Questions 1 and 2 both favour test B for both sensitivity and specificity. Respondents choosing test A in response to both questions are considered to have misunderstood the task.
1 0 0
Table 15: Discrete choice experiment design: Overview of attributes and levels presented in cancer (A)
and polyp (B) detection scenarios.
B: POLYP DETECTION SCENARIO
Question
number
‘STANDARD’ CTC
Baseline diagnostic
performance
‘ALTERNATIVE’ CTC
Increased sensitivity but
variable specificity
PARTICIPANT TRADE-OFF REQUIRED IN EXCHANGE FOR 0.1
INCREASE IN SENSITIVITY
Sensitivity
for
detection
of polyps
(%)
Specificity
for
detection
of polyps
(%)
Sensitivity
for
detection
of polyps
(%)
Specificity
for
detection
of polyps
(%)
Change in
specificity
compared to
baseline
(%)
Additional FP
detections per
5000 screening
examinations
Additional TP
detections per
5000 screening
examinations
1p* 80 85 90 90 -5 -250 125
2p 80 85 90 85 0 0 125
3p** 80 85 90 80 5 250 125
4p 80 85 90 80 5 250 125
5p 80 85 90 70 15 750 125
6p 80 85 90 60 25 1250 125
7p 80 85 90 50 35 1750 125
8p 80 85 90 40 45 2250 125
9p 80 85 90 30 55 2750 125
10p*** 80 85 90 20 65 3250 125
**Questions 4 and 5 are identical and hence this is a test for internal consistency.
***Participants choosing ‘Alternative’ CTC in response to question 10 are considered potential non-traders: Rather than disregard
these responses, additional information is displayed and the question repeated.

1 0 1
Figure 15: Example question from the cancer detection scenario. Each tally mark represents one of
5000 potential outcomes for a patient undergoing screening: TP (blue), FN (yellow), true negative
(white), or FP (red). Participants were informed that if they were to undertake the test in question,
their odds of receiving any of the above outcomes are represented by the chance of picking any of
these tally-marks at random. Data are also represented numerically using both relative and absolute
percentages. This question represents the median ‘trade-off’ for patients and professional
respondents: On average, participants favoured ‘alternative’ CTC in view of its enhanced sensitivity up
to, but not beyond, this level of additional FPs; where scenarios presented a lower specificity patients
usually opt for ‘standard CTC’
5.2.3 EXPERIMENT CHARACTERISTICS
For both cancer and polyp detection scenarios, participants were asked to assume they were
average risk: Polyp prevalence 25%, cancer prevalence 0.2% (lifetime risk 5%). Participants
1 0 2
were asked to assume more timely polypectomy due to enhanced sensitivity would reduce
lifetime disease-specific mortality by 25% (lifetime risk of 5% to 4%) (233). Participants were
asked to assume that while early cancer detection facilitated early treatment(234), this was not
always curative. Subjects were told that FP CTC resulted in unnecessary colonoscopy. For
clarity, only the most serious complication was presented, perforation, at 1:500 risk, based on
combined North American and European estimates (3, 235).
5.2.4 PILOT
To inform design and sample size (236) the questionnaire was piloted on 10 ‘naïve’ staff.
Although they comprehended attributes and levels, and completed the DCE without undue
burden, we noted some did not trade (i.e. the lowest level of specificity presented was judged
acceptable in exchange for 0.10 gain in sensitivity). We therefore introduced additional
information reinforcing pros and cons of each test. Repeat piloting on the same staff found the
number of ‘non-traders’ reduced. Piloting also showed that simultaneously considering both
cancer and polyp scenarios confused participants. We therefore divided the DCE into separate
polyp and cancer scenarios.
5.2.5 DISCRETE CHOICE EXPERIMENTS
For both cancer and polyp DCEs, participants indicated their preference for ‘standard’ or
‘alternative’ CTC during 10 scenarios. To recap, ‘standard’ CTC had fixed sensitivity and
specificity throughout. In every scenario, standard CTC and was presented against a variant of
‘alternative’ CTC whose sensitivity was always 0.10 higher but whose specificity varied
incrementally between 0.90 and 0.05. Scenario ordering was randomised. There was no opt-
out; participants had to indicate a test preference for each scenario. Participants accepting the
lowest specificity for ‘alternative’ CTC (‘non-traders’) were automatically presented with
additional information by the software, stressing risks (e.g. of perforation in false-positive
cases), to assess whether heuristic bias anchored their decision. A random scenario was
repeated in order to test response consistency. A scenario in which one option was

1 0 3
unquestionably superior for both sensitivity and specificity sought ‘irrational’ responders.
Finally, we incorporated ‘willingness-to-pay’ assessment to provide a generic metric with which
to compare how participants value specificity: Standard CTC was pitched against CTC with
sensitivity raised by 0.10 but with no reduction in specificity. Participants were told the
alternative test cost more and were asked how much they would pay (if anything) over-and-
above standard CTC.
The author and a clinical psychologist, Nichola Bell, conducted DCEs in random order. We
clarified understanding for participants where necessary, and had the opportunity for
qualitative exploration afterwards, especially with non-traders. All participants were asked
their age, ethnicity, education, and household income bracket. Medically-qualified participants
(see below) could opt to perform the DCEs online to facilitate their recruitment since they were
already familiar with the concepts presented.
5.2.6 RECRUITMENT
We recruited consecutive consenting adults of screening age (55-79 years), scheduled for non-
cancer outpatient ultrasound/plain-radiographic investigations at a teaching hospital, identified
via booking systems. Information/consent forms were mailed and responders interviewed on
the day of their appointment. We excluded respondents with a personal history of/or being
investigated for bowel cancer since their opinions may be biased(33). All participants were
offered a £10 gift voucher. To investigate any attitudinal difference between patients and
healthcare professionals, via internal email we recruited staff who requested, performed, or
interpreted colorectal imaging: Radiologists, gastroenterologists, surgeons, nurse-specialists
and radiographers.
5.2.7 ANALYSIS
Our primary outcome measure was the decrease in specificity participants were willing to
‘trade’ for a 0.10 (i.e. 10% absolute) increase in sensitivity for cancer and for polyp detection.
Participants’ responses were collated and scenarios ranked in descending order of specificity. In

1 0 4
general, participants favour ‘alternative’ CTC when it provides equivalent or higher specificity
to ‘standard’ CTC. However, as the false positive rate (FPR; 1-specificty) increases, trading
participants switch to preferring ‘standard’ CTC at a certain point (the ‘tipping point’). This
point reflects the maximum FPR participants would accept before deciding that the additional
risk of unnecessary colonoscopy outweighed improved sensitivity. Correcting for baseline FPR
(by subtracting from 0.05 for cancer and 0.15 for polyp detection scenarios) gives the
additional FPR (∆FPR) compared to ‘standard’ CTC the participant would consider in exchange
for 0.10 increase in sensitivity for cancer or polyps (∆FPRcancer and ∆FPRpolyp respectively).
Our pilot suggested the mean ∆FPRcancer approximated 0.45 (i.e. on average, participants traded
a fall in specificity from 0.95 to 0.50 in exchange for a 0.10 increase in sensitivity for cancer
detection). To estimate ∆FPRcancer within ±5% at two-sided alpha 0.05 (within 95% CI) required a
sample of 96 (N= 4σ zcrit2/W2 where, σ =p(1-p), P=0.45, Zcrit =1.960, W=0.10 (237)). Mean
∆FPRpolyp approximated 0.3, requiring a sample of 81. We pre-specified a secondary outcome
comparing patients and professionals, for which we estimated 62 participants (two equal
groups of 31) were required for 90% power to detect an absolute difference in ∆FPRcancer of
0.10. Because our pilot suggested a non-normal distribution, we aimed to recruit a further 15%
participants(237), requiring 72 participants in total.
Non-traders were defined as participants accepting ‘alternative’ CTC despite a FPR increase of
0.65 for polyps and 0.85 for cancer (i.e. rejecting ‘standard’ CTC in favour of a test with
absolute specificity 0.2 and 0.1, respectively). Where their opinion changed following
additional information, their highest ∆FPR value was taken; others were deemed persistent
non-traders and excluded from primary analysis but retained for socio-demographic
comparison between traders and non-traders.
The mean values of ∆FPRcancer and ∆FPRpolyp were calculated for participants overall and for
patients and healthcare professionals separately. 95% confidence intervals were calculated
using 1000 bootstraps. Relative weightings (Wpolyp and Wcancer) ascribed to changes in sensitivity
vs. specificity were obtained by dividing ∆FPRcancer and ∆FPRpolyp by the increase in sensitivity
(0.10). Incorporating prevalence allows calculation of the absolute number of additional FPs
participants would trade for a single cancer or polyp detection. For example, when screening a
population with cancer prevalence of 0.2%, an increase in sensitivity of 0.10 would yield 1

1 0 5
additional detection per 5000 examinations. Therefore, FPs per additional cancer detection was
calculated by multiplying ∆FPRcancer by 5000, and FPs per additional polyp by multiplying
∆FPRpolyp by 40 (0.10 increase in sensitivity at 25% prevalence detects 1 additional polyp per 40
screenees). Tipping points were compared between participants interviewed by the two
researchers and also between professionals’ responses accrued face-to-face versus online.
Kolmogorov-Smirnov analysis suggested non-normality. The Mann-Whitney U test statistic was
used for continuous data and Pearson’s Chi-squared test statistic used for categorical
proportions (Stata V11.0, Stata Corporation, College Station, Texas).
5.3 RESULTS
75 patients and 50 healthcare professionals participated (5 radiologists, 5 surgeons, 5
gastroenterologists, 10 specialist registrars, 5 nurse-specialists, 20 radiographers). In total,
invitations were sent to 112 consecutive patients and 62 professionals resulting in response
rates of 67% and 81% respectively. Three patients’ attempted but could not complete the
survey and two medical professionals gave partial responses resulting in 120 complete and 2
partial responses. No participant failed the internal consistency test. The author interviewed 53
participants, Ms Bell interviewed 48; 21 responses were obtained online. Demographic data are
presented in Table 16. Compared to professionals, patients were significantly older,
discontinued education earlier, and had lower household income.
5.3.1 NON-TRADERS
Four professionals (8%) failed to trade during the cancer scenario; of these, 2 (4%) would not
trade during the cancer scenario. In contrast, significantly more patients were non-traders
(p<0.001); 27 (38%) patients refused to trade during the cancer scenario and of these 18 (25%)
continued to refuse trading during the polyp scenario. All non-traders in the polyp scenario
also refused to trade when considering cancer detection. Non-traders were significantly older
(median age 64.5 vs 44.5; p=0.001) and less educated than traders (15% vs 2% with no formal
qualifications; p<0.001).

1 0 6
Table 16: Demographic characteristics and household annual income of patient and professional
participants including non-traders
Characteristic Patients (n=72)* Professionals (n=50)** Total (n=122)
N (%) N (%) N (%)
Gender
Female 49 (68) 24 (48) 73 (60)
Male 23 (32) 26 (52) 49 (40)
Age (year)
25-34 0 (0) 26 (52) 26 (21)
35-54 0 (0) 23 (46) 26 (21)
55-59 18 (25) 1 (2) 16 (13)
60-69 40 (56) 0 (0) 40 (33)
70-79 14 (19) 0 (0) 14 (11)
Ethnicity
White 49 (69) 33 (69) 82 (69)
Other 22 (31) 15 (31) 37 (31)
Income/GBP
< 10000/yr 3 (6) 0 (0) 3 (3)
10001-20000/yr 14 (28) 0 (0) 14 (25)
20001-30000/yr 19 (38) 3 (7) 22 (23)
30001-40000/yr 10 (20) 10 (23) 20 (21)
>40000/yr 4 (8) 31 (70) 35 (37)
*Of the original 75 patient participants accrued to the study, 3 discontinued the survey, without providing any consistent data.
Qualitative exploration by the interviewer revealed they did not comprehend the concept of false positive diagnosis.
**Comprising 5 gastroenterologists, 5 radiologists, 5 colorectal surgeons, 10 Specialist registrars in these specialities, 5 bowel
cancer screening nurses and 20 CT radiographers.
1 0 7
There was no difference in gender (59% vs 61% female; p=0.56) or ethnicity (30% vs 33% non-
white; p=0.57). Considering patients alone, non-traders (n=27) were older (median age 66.8 vs
60.1; p=0.001), less affluent (median household income GBP10001 to 20000 vs. GBP20001 to
£30000 per annum; p=0.029) and less qualified (median school leaving age 16 vs 18yrs;
p=0.021) than traders (n=45). Excluding non-traders and incomplete responses, 56 patients and
48 professionals were included for the polyp detection scenario, with 45 and 44 respectively
for the cancer scenario.
5.3.2 CANCER DETECTION
Overall, the mean false positive rate(FPR) increase accepted for cancer diagnosis scenarios
(∆FPRcancer) was 0.41 (95%CI: 0.35 to 0.47;Table 17; Figure 16). Therefore, on average,
participants would trade a 0.41 reduction in specificity for a 0.10 increase in sensitivity for
cancer, resulting a weighting of 4.1x. At population prevalence of 0.2%, this equates to 2050
(95% CI: 1750 to 2350) additional false-positives per additional true-positive diagnosis.
∆FPRcancer was significantly higher for patients (mean 0.57. 95%CI: 0.49 to 0.66) than
professionals (mean 0.24, 95%CI: 0.19 to 0.31, p=0.001). The data were not normally
distributed and were almost bimodal (Figure 16). Therefore we calculated both means and
medians for participants willing to trade (Table 17). Many of the participants reporting higher
values were asked extra questions because of unwillingness to trade (Figure 17). There was no
difference in patients’ overall mean ∆FPRcancer elicited by different interviewers, (0.55 vs. 0.59;
p=0.57) nor between professionals’ ∆FPRcancer obtained face-to-face vs. online (mean 0.25 vs.
0.21; p=0.59).
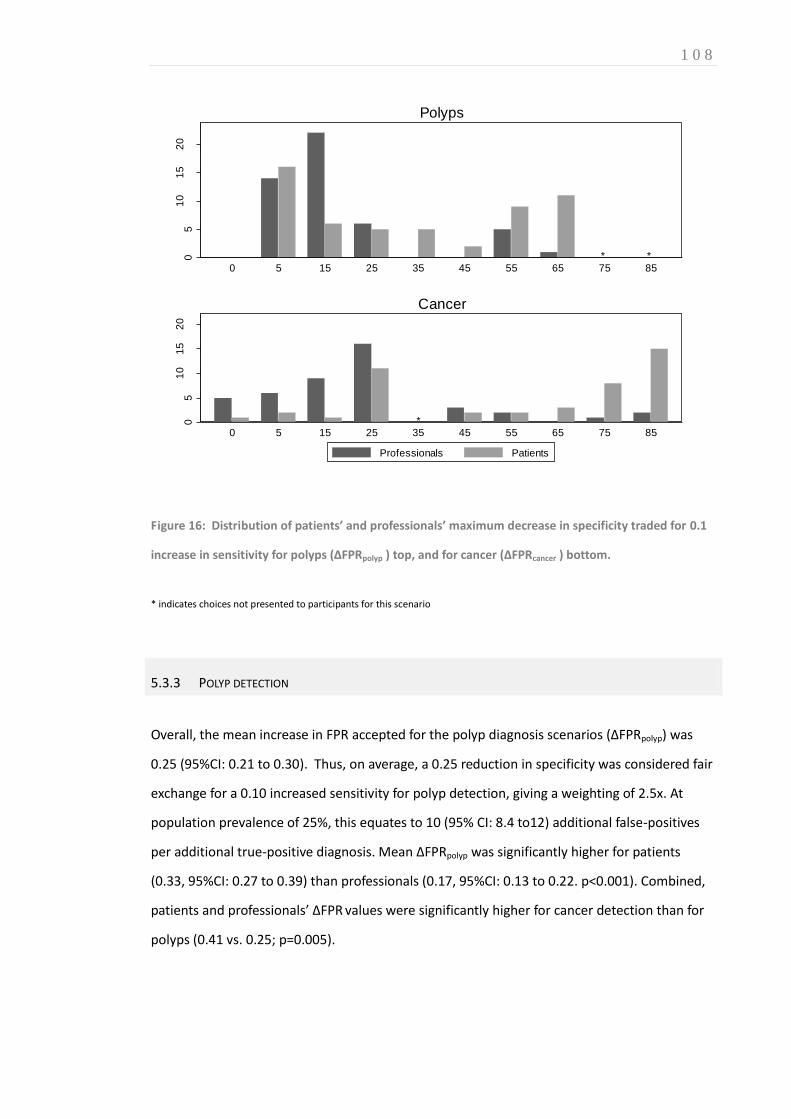
1 0 8
**05
10
15
20
Nu
mb
er
pa
rtic
ipa
nts
0 5 15 25 35 45 55 65 75 85
Polyps
*05
10
15
20
Nu
mb
er
pa
rtic
ipa
nts
0 5 15 25 35 45 55 65 75 85
Cancer
Professionals Patients
Figure 16: Distribution of patients’ and professionals’ maximum decrease in specificity traded for 0.1
increase in sensitivity for polyps (∆FPRpolyp ) top, and for cancer (∆FPRcancer ) bottom.
* indicates choices not presented to participants for this scenario
5.3.3 POLYP DETECTION
Overall, the mean increase in FPR accepted for the polyp diagnosis scenarios (∆FPRpolyp) was
0.25 (95%CI: 0.21 to 0.30). Thus, on average, a 0.25 reduction in specificity was considered fair
exchange for a 0.10 increased sensitivity for polyp detection, giving a weighting of 2.5x. At
population prevalence of 25%, this equates to 10 (95% CI: 8.4 to12) additional false-positives
per additional true-positive diagnosis. Mean ∆FPRpolyp was significantly higher for patients
(0.33, 95%CI: 0.27 to 0.39) than professionals (0.17, 95%CI: 0.13 to 0.22. p<0.001). Combined,
patients and professionals’ ∆FPR values were significantly higher for cancer detection than for
polyps (0.41 vs. 0.25; p=0.005).

1 0 9
Table 17: False positive rate (FRP) trade-off values and relative weighting for cancer and polyp
detection scenarios calculated for patients, professionals, and all participants combined
Tipping point Relative weighting (W) Average number of
FP per additional TP
detection
Mean 95%CI Median IQR Mean 95%CI
Patients
Polyp 0.33 0.27 to 0.39 0.25 0.05 to 0.55 3.3 2.7 to 3.9 13.2
Cancer 0.57 0.49 to 0.66 0.70 0.25 to 0.85 5.7 4.9 to 6.6 2850
Professionals
Polyp 0.17 0.13 to 0.22 0.15 0.05 to 0.15 1.7 1.3 to 2.2 6.8
Cancer 0.24 0.19 to 0.31 0.25 0.08 to 0.25 2.4 1.9 to 3.1 1200
Combined
Polyp 0.25 0.21 to 0.0.30 0.15 0.05 to 0.46 2.5 2.1 to 3.0 10
Cancer 0.41 0.35 to 0.47 0.25 0.15 to 0.75 4.1 3.5 to 4.7 2050
5.3.4 WILLINGNESS-TO-PAY (WTP)
Median WTP for 0.10 increased sensitivity with maintained specificity was significantly higher
for cancer than polyps: 201 to 500GBP (IQR 101 to 200GBP to 501 to 1000 GBP) vs. 101 to 200
GBP (IQR 51 to 100 to 201 to 500 GBP), p<0.001.
There was no significant difference in WTP between patients and professionals for polyps
(p=0.97) but patients’ WTP was significantly higher than professionals’ for cancer detection:
median 201 to 500 GBP (IQR 101 to 200 GBP to 201 to 500GBP) vs median 101 to 200 GBP (IQR
51 to 100 GBP to 201 to 500 GBP, p=0.036). Moreover, median household income was
significantly lower for patients than professionals: 20001 to 25000GBP vs >40000GBP; p=0.021
(Table 18).
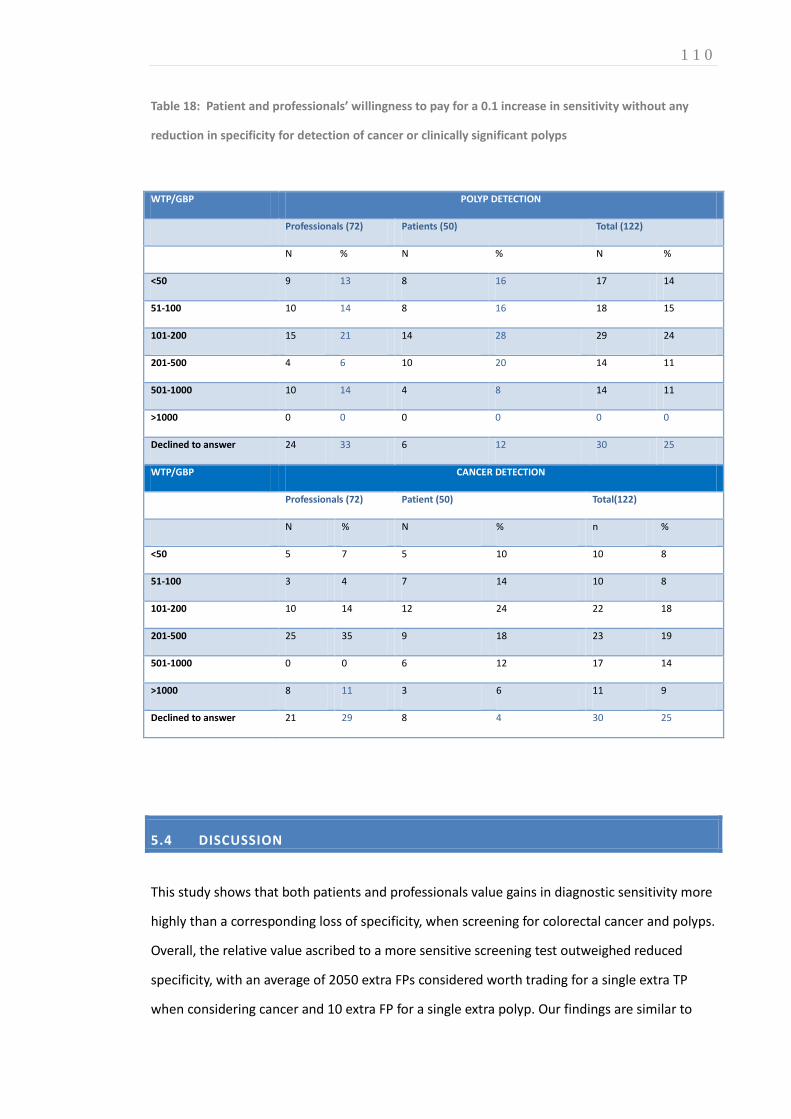
1 1 0
Table 18: Patient and professionals’ willingness to pay for a 0.1 increase in sensitivity without any
reduction in specificity for detection of cancer or clinically significant polyps
WTP/GBP POLYP DETECTION
Professionals (72) Patients (50) Total (122)
N % N % N %
<50 9 13 8 16 17 14
51-100 10 14 8 16 18 15
101-200 15 21 14 28 29 24
201-500 4 6 10 20 14 11
501-1000 10 14 4 8 14 11
>1000 0 0 0 0 0 0
Declined to answer 24 33 6 12 30 25
WTP/GBP CANCER DETECTION
Professionals (72) Patient (50) Total(122)
N % N % n %
<50 5 7 5 10 10 8
51-100 3 4 7 14 10 8
101-200 10 14 12 24 22 18
201-500 25 35 9 18 23 19
501-1000 0 0 6 12 17 14
>1000 8 11 3 6 11 9
Declined to answer 21 29 8 4 30 25
5.4 DISCUSSION
This study shows that both patients and professionals value gains in diagnostic sensitivity more
highly than a corresponding loss of specificity, when screening for colorectal cancer and polyps.
Overall, the relative value ascribed to a more sensitive screening test outweighed reduced
specificity, with an average of 2050 extra FPs considered worth trading for a single extra TP
when considering cancer and 10 extra FP for a single extra polyp. Our findings are similar to
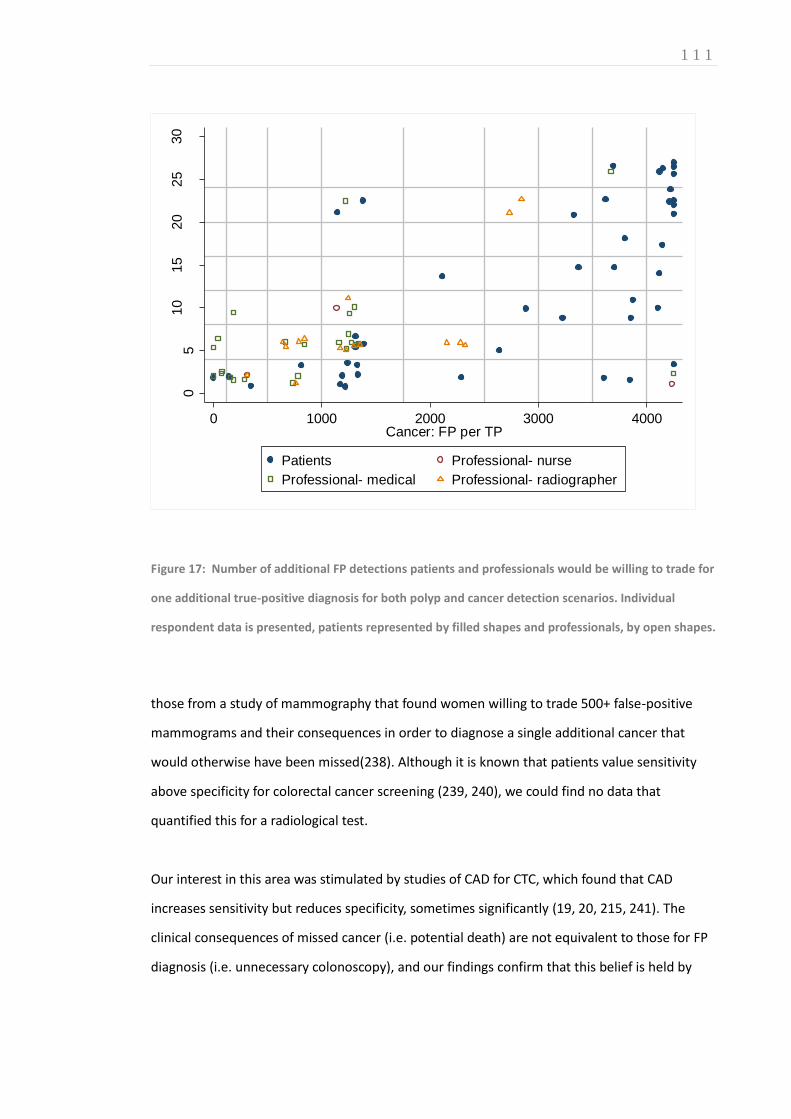
1 1 1
05
10
15
20
25
30
Poly
p: F
P p
er
TP
0 1000 2000 3000 4000Cancer: FP per TP
Patients Professional- nurse
Professional- medical Professional- radiographer
Figure 17: Number of additional FP detections patients and professionals would be willing to trade for
one additional true-positive diagnosis for both polyp and cancer detection scenarios. Individual
respondent data is presented, patients represented by filled shapes and professionals, by open shapes.
those from a study of mammography that found women willing to trade 500+ false-positive
mammograms and their consequences in order to diagnose a single additional cancer that
would otherwise have been missed(238). Although it is known that patients value sensitivity
above specificity for colorectal cancer screening (239, 240), we could find no data that
quantified this for a radiological test.
Our interest in this area was stimulated by studies of CAD for CTC, which found that CAD
increases sensitivity but reduces specificity, sometimes significantly (19, 20, 215, 241). The
clinical consequences of missed cancer (i.e. potential death) are not equivalent to those for FP
diagnosis (i.e. unnecessary colonoscopy), and our findings confirm that this belief is held by

1 1 2
both patients and professionals. It is therefore important that analysis of research studies take
account of this asymmetry and this is explored in more detail in the following Chapter.
We elected to use a discrete choice experiment, a relatively novel methodology for establishing
preferences (242). Traditionally, ranking exercises are used to elicit preferences (243), with test
attributes considered in isolation. Results are predictable: Patients and professionals favour
tests that are sensitive, specific, inexpensive, readily available, and non-invasive. This does not
reflect real-world choices, especially for test characteristics that usually move in opposite
directions, such as sensitivity and specificity. In contrast, DCE requires respondents to ‘trade’
between different test characteristics and are increasingly advocated because they better
reflect choices necessary in daily practice(224-226, 243-245).
However, DCEs are complex. To simplify and focus the cognitive task, we compared just two
attributes, sensitivity and specificity. Change in attributes’ relative weighting between
scenarios is more important than their absolute level. Thus, we chose a baseline sensitivity of
85% for cancer detection by CTC, which is likely an underestimate but necessary so that we
could inflate sensitivity for the new test by 0.10 (e.g. CTC with CAD). In addition, we delivered
the experiment face-to-face to facilitate participation (excluding 21 medical professionals who
opted for the online facility). This was beneficial: of those interviewed 99 out of 102 gave
complete, consistent, responses with only three participants feeling unable to complete the
task. Likewise, targeting the professional group online facilitated participation with 19 out of 21
responders providing full responses and the remaining 2 completing the polyp scenario only.
Face-to-face, interviewer-led surveys can increase generalisability of results by increasing the
spectrum of respondents. Nevertheless, this methodology could introduce interviewer bias.
However, we found no significant difference in participants’ responses whether interviewed by
a psychologist or radiologist nor was there a significant difference in responses obtained face to
face or accrued online. Moreover, an interview allows responses to be explored in more detail.
For example, 38% of patients would not trade during the cancer scenario and while DCE
analysis usually excludes these responses from analysis, they are not necessarily ‘irrational.’
Some non-traders used a heuristic (‘rule of thumb’), always choosing the option with the
highest sensitivity. However, others defended their decision to choose a test with minimal
specificity stating that an FP would lead to the gold-standard test, and with it, reassurance.
Moreover, many acknowledged such a test would be unrealistic from a logistic/economic

1 1 3
standpoint. These attitudes reflect those of women surveyed regarding false-positive
mammography (238).
We did identify differences between patients and professionals. Inevitably, demographic and
socioeconomic characteristics varied. We attempted to account for this via a willingness-to-pay
assessment, informed by knowledge of respondent’s income. Compared to professionals,
patients were more inclined to trade sensitivity for specificity for both polyps and cancer.
Interestingly, despite having approximately half the annual household income, patients
ascribed monetary value to enhanced sensitivity approximately twice that of professionals. If
analyses of new diagnostic tests for screening are to account for discrepant weightings
between sensitivity and sensitivity, the question arises, whose weightings should be used? One
could argue that healthcare professionals, particularly clinicians, provide the most balanced
responses, as they are likely to have the best grasp of pros and cons, and to take an informed
overall perspective. Conversely, there is increasing expectation that patients’ expectations are
incorporated when developing screening modalities.
Our study has limitations. As we have stated, DCEs can be challenging for participants(246) and
require motivation, literacy, and numeracy, which may introduce selection bias (231). We
attempted to counter this via a face-to-face delivery rather than using a postal questionnaire.
Although we had adequate power, larger and/or different samples may better represent
different patient and professional groups. Strategies for design and analysis also need further
investigation(247, 248). Potentially important missing data from non-traders was excluded from
this DCE analysis. However, a potential strategy to incorporate their responses is described in
the following Chapter. Common to all hypothetical scenarios, subjects’ actions in real life may
not mirror those expressed in the DCE. It should be stressed that the weightings we derived are
specific to colorectal cancer screening.
In summary, via DCE we found that both patients and healthcare professionals consider gains in
sensitivity more important than corresponding loss of specificity, when considering diagnostic
tests for colorectal cancer screening. Discrepancy was greatest for cancer detection (vs. polyps)
and for patients rather than professionals.
1 1 4
CHAPTER 6 6. INCREMENTAL NET-EFFECT OF COMPUTER AIDED DETECTION (CAD) FOR INEXPERIENCED AND EXPERIENCED READERS OF CTC
AUTHOR DECLARATION
Work presented in this Chapter was led by the Author under the supervision of Professor Steve
Halligan and Professor Stuart Taylor with statistical analysis performed by Dr Susan Mallett and
Professor Douglas Altman. Research based upon this Chapter’s content is currently under
consideration for indexed publication: Boone D, Halligan S, Taylor S, Altman DG, Mallett S.
Assessment of the relative benefit of computer-aided detection (CAD) for interpretation of CTC
by experienced and inexperienced readers.
6.1 INTRODUCTION
As outlined in Section A (Chapters 1.12.3 and 2.9) of this Thesis, CAD aims to improve the
diagnostic performance of CTC by using visual prompts to alert radiologists to pathology that
might otherwise be missed (249, 250)(Figure 18). CAD systems make both TP and FP prompts,
which are then categorised by the interpreting radiologist. Radiologist categorisations may be
correct or incorrect. While it has frequently been hypothesised that CAD may diminish the
need for prior reader experience(34), the two largest studies of CAD published to date have
used experienced readers alone(20, 21). Very few studies have directly compared experienced
and inexperienced readers, and those that have done so are limited by their small size and low
statistical power(22). For example, Mang and colleagues asked two ‘expert’ and two
‘nonexpert’ observers to interpret 52 patient datasets using CAD in a second-read paradigm,
finding that CAD was only beneficial for the less experienced readers(251). Research described

1 1 5
in this Chapter aimed to quantify the incremental effect of CAD for inexperienced versus
experienced readers by comparing data across two large multi-reader, multi-case studies of CTC
using a CAD net-effect analysis incorporating weightings derived from the DCE described in the
previous Chapter.
Figure 18: Volume rendered
endoluminal CTC displaying a computer-
aided-detection (CAD) prompt (small red
marker) correctly annotating a 5mm
sessile polyp.
6.1.1 CAD SOFTWARE OVERVIEW
Several CAD products have secured regulatory approval for routine clinical use in Europe and
the USA (115). The CAD algorithm utilised for research reported in this thesis, ColonCAD V3.1,
was developed by MedicSight Plc, Hammersmith, London, UK; the Author gratefully
acknowledges their support. While early CAD studies required use of dedicated visualisation
software, CAD products are now generally integrated into proprietary vendor workstations.
While the algorithms and displays differ, all CAD systems share a common theme; the reader is
guided to irregularities in the endoluminal surface by visual prompts which must be scrutinised
to determine if likely to represent genuine colonic pathology.
The performance of CAD products is often described in terms of standalone polyp detection.
This corresponds to a ‘1st reader’ paradigm (Table 19), whereby the prompts generated by CAD

1 1 6
are compared to true positive polyps established, preferably, using a radiological-endoscopic
ground truth reference standard. To avoid bias, the dataset upon which the CAD software is
evaluated should not include cases used for algorithm development. The process of ‘external
clinical validation’ (222) is described in more detail in Chapter 11 of this Thesis.
A comprehensive description of ColonCAD V3.1 standalone performance has been reported by
Lawrence et al (162). In summary, CAD was applied retrospectively to a cohort of 3077 patients
undergoing screening with CTC between March 2006 and December 2008. All participants
underwent CTC with laxative bowel preparation and faecal tagging. Experienced radiologists
provided a consensus reference standard for all cases using subsequent colonoscopic findings
to confirm positive findings; 607 polyps were confirmed in 373 patients. Positive CAD prompts
were compared to this ‘ground truth.’
On a per patient basis, CAD sensitivity for polyps ≥6mm was 93.8% (95% CI: 90.9% to 96.1%)
and for polyps ≥10mm CAD achieved sensitivity of 96.5% (95% CI: 92.0% to 98.8%). On a per-
polyp basis, CAD sensitivities for all polyps was 90.1% (95% CI: 88.0% to 92.8%) and 96.0% (95%
CI: 91.9% to 98.4%) at 6mm and 10mm thresholds respectively. Moreover, CAD sensitivity for
advanced neoplasia was 97.0% (95% CI: 92.4% to 99.2%) with 100% (95% CI: 79.4% to 100%)
sensitivity for cancer.
However, on a per patient basis, a CAD system can obtain (spurious) high sensitivity, by
incorrectly assigning a false positive prompt to a true positive case and hence, considerable
emphasis has been placed on CAD false positive rate (FPR). Using ColonCAD, mean FPR was 9.4
and median FPR was 6 per patient, illustrating that reader interaction remains essential at
present, not least to prevent unnecessary colonoscopy in healthy patients.
Nevertheless, among 373 patients with a positive finding at CT colonography, ColonCAD
marked an additional 15 endoscopically confirmed polyps ≥6mm (including four large polyps)
that were missed at initial radiological interpretation. Clearly, the interaction between software
and radiologist are central to the potential benefit conferred by any CAD product; even highly
experienced readers will dismiss genuine lesions, correctly annotated by CAD (25). Therefore,
standalone performance is a limited surrogate marker of performance in clinical practice.
A more realistic estimate of CAD performance in daily interpretation requires a multireader,
multicase study where readers evaluate cases both with and without CAD assistance. Two such
studies have evaluated ColonCAD (referred to hereafter as CAD): The most recent study, (19)
1 1 7
required observers to read 112 CTC examinations (132 polyps in 56 patients) with and without
CAD assistance. Sixteen experienced radiologists interpreted these datasets on three separate
occasions either unassisted, using CAD concurrently, or with CAD as a second-reader. CAD
significantly increased mean per-patient sensitivity both when used as a second-reader (mean
increase, 7.0%; 95% confidence interval (CI): 4.0 to 9.8%) or when used concurrently (mean
increase, 4.5; 95% CI: 0.8 to 8.2%). Furthermore, CAD resulted in no significant decrease in per-
patient specificity for these readers.
The earlier study(215) recruited 10 readers trained in CT but without special expertise in
colonography to interpret 107 CTC cases (60 patients with 142 polyps), first without CAD and
then with concurrent CAD after a washout period of 2 months. With CAD, per-patient
sensitivity increased significantly in 70% of readers, while specificity dropped significantly in
only one. Polyp detection increased significantly with CAD with, on average, 9.1% more polyps
detected by each reader (95% CI, 5.2% to 12.8%).
While these studies varied in design and observer experience, the CAD software and test
dataset were effectively equivalent. This chapter draws upon the novel analysis methods
outlined above to compare the net benefit of CAD when applied by inexperienced and
experienced readers.
6.2 METHODS
6.2.1 DATA SOURCES AND READERS
We obtained original reader data acquired from two multi-reader, multi-case studies of CAD for
CTC, published previously by the supervisors of this Thesis (21, 34). Both studies had full ethical
committee approval for data sharing. The first study investigated 10 radiologist readers with no
prior experience of CTC who interpreted 107 patient datasets both unaided and when using
CAD in a concurrent paradigm(34). The second study investigated 16 radiologist readers all of
whom had prior experience of CTC interpretation (mean 264 cases, range 50 to >1000)(21).
These readers interpreted 112 patient datasets unaided and with CAD, using both second-read
and concurrent paradigms (Table 19).

1 1 8
6.2.2 DATA CHARACTERISTICS
118 discrete patient cases were used for the two studies with 102 patient cases common to
both. We selected reader data from these 102 cases to enable paired comparisons of
experienced and inexperienced groups without the need for imputation to account for missing
data. Thus, any differences could be attributed directly to differences in experience rather than
due to confounding because of different case mix. We calculated the difference between
novices and experienced readers on a per case basis so allowing ideal data clustering to be
included in the analysis, generating more appropriate 95% confidence intervals. Cases were a
mix of symptomatic and asymptomatic subjects aggregated from three USA and two European
centres. Prone and supine CTC had been performed in each case using multidetector-row
machines and following full bowel purgation, adhering to published guidelines for data
acquisition(30, 36).
A reference truth against which the CAD and reader output could be judged was established for
each case by three experienced readers (none of whom were readers in the studies, and
including Professors Steve Halligan and Stuart Taylor). A pair read each case with the benefit of
the original radiological report supplemented with colonoscopic and histological data where
available, and achieved consensus regarding the case classification and size and location of any
polyp(21, 34). Ultimately, of the 102 cases, 46 were judged normal and 56 had at least one
polyp. There were 132 polyps in total: 15 polyps ≥10mm, 41 polyps 6mm to 9mm, 76 polyps
≤5mm, with 12, 25 and 19 cases where these were the largest polyps respectively. In 37 cases
the largest polyp was at least 6mm.
6.2.3 READING ENVIRONMENT AND CAD PARADIGM
For the study of inexperienced readers, readers interpreted all cases in a quiet environment
without CAD over the course of one week and then repeated the interpretation two months
later, this time using CAD in a concurrent paradigm(34). For the study of experienced readers,
cases were read in three batches of one-month each, with a temporal separation of at least
one-month between batches(21). All cases were read once in each batch, using one of three

1 1 9
paradigms (unassisted, concurrent-CAD, second-read CAD; Table 19), with the reading
paradigm randomised between batches.
CAD
Implementation
paradigm
Description
Unassisted Readers analyse the entire case without CAD, just as in normal daily practice. Where CAD is integrated into
the vendor workstation it is disabled.
1st reader CAD CAD is activated and presents a list of CAD prompts for review. The reader reviews all CAD prompts
sequentially accepting lesions he or she considers genuine pathology and rejecting those felt to be spurious.
Interpretation is restricted to the CAD marks only; an unassisted radiological review of the endoluminal
surface is not performed. Hence any pathology undetected by CAD is likely to remain undiagnosed; this
algorithm is not recommended for clinical practice.
2nd reader CAD The reader performs a full, unassisted case review with CAD disabled. Once analysis is complete, readers
apply CAD and then review the case again, usually by interrogating sequential CAD candidates rather than
the entire endoluminal surface. Readers are not permitted to disregard lesions previously considered true
pathology during their unassisted read, regardless of whether or not they are marked by CAD. This ensures
CAD acts as a ‘safety net’ and at present, European and US regulatory approval is restricted to this
paradigm only.
Concurrent CAD CAD is applied from the outset. The reader performs a full review of the case, searching for pathology as
they would for an unassisted read. CAD-prompted candidate lesions are scrutinised as they appear during
the full endoluminal review. This is therefore a hybrid of 1st and 2nd reader CAD where the case is read only
once with the CAD marks visible throughout. According to the available evidence, concurrent reading is less
effective than the second-read paradigm and its routine use is not recommended at this time.
Table 19: Paradigms for integration of CAD into CTC interpretation. Please note, at present, only 2nd
reader CAD is recommended for routine clinical practice (115)
Thus unassisted interpretation and concurrent-CAD interpretation of each individual case were
common to both studies, with a temporal separation between reads of at least one-month. For
the concurrent paradigm, readers interpreted CAD annotated CTC data simultaneously with un-
annotated data(34). As described above, the same CAD system was used for both studies, so

1 2 0
that correctly annotated polyps and FP detections were the same (Colon CAD V 3.1,
Medicsight, Hammersmith, UK). A proprietary CTC package was used to view CTC data for the
study of inexperienced readers. For the study of experienced readers, CAD was implemented
into commercially available workstations (either Viatronix V3D, Stony Brook NY, USA, or Vital
Images, Minnetonka, Minn, USA).
Readers were asked to indicate whether they believed a polyp was present at the case-level or
not. If they believed the case was positive, they were asked to indicate the segmental location
of all polyps detected and note the CT coordinates. They also estimated the maximum
diameter of each polyp using software callipers. Responses were made on study datasheets
collated subsequently by a study coordinator.
6.2.4 STATISTICAL ANALYSIS
The collated datasheet responses were compared to the reference truth diagnosis for each case
so that each reader response could be classified as TP, TN, FP, or FN at the case level. Each
individual polyp detected by readers was also categorised as TP or FP.
CAD NET EFFECT MEASURE
Our pre-specified analysis was the comparison of the ‘CAD net effect measure’ (the rationale
for which is explained previously in this Section), defined as follows:
sensitivity + (specificity x [prevalence adjustment] x [1/W])
sensitivity and specificity are the change in sensitivity and specificity from baseline
when cases were read with CAD
The adjustment for prevalence of abnormality within the dataset (0.5) was defined as
(1-prevalence/prevalence) where prevalence is a proportion.
The weighting value ‘ W’ was based on the discrete choice experiment described in
Chapter 5, with an adjustment for non-trader missing data explained below.

1 2 1
CALCULATING ‘W’ FROM THE RESULTS OF CONJOINT ANALYSIS
The method for eliciting the relative value patients’ and professionals’ ascribe to TP vs FP
diagnoses is described in detail in chapter 5. However, as noted, the study had limitations
regarding missing non-trader data which were overcome as follows:
The distribution of ‘tipping points’ for polyp detection (i.e. the point at which loss of specificity
outweighed a 0.10 gain in sensitivity) was determined for all respondents and expressed as the
number of FPs per additional true positive diagnosis. Cumulative data points were plotted for
healthcare professionals and patients (Figure 19 and Figure 20 respectively). While the ‘tipping
point’ for non-traders is unknown it must be higher than the maximum choice they were
presented (i.e. less than the lowest specificity in any trading scenario). Hence, their responses
are plotted beyond the maximum tipping point tested (25FP per TP). Hence, the 50%
cumulative point (median) appropriately estimates the tipping point at which 50% of
respondents would trade (and 50% would decline, a proportion of whom are non-traders.)
The median tipping point is adjusted for prevalence (0.25 for polyps; 0.02 for cancer in the DCE:
Therefore TP/FP ratio is divided by 3 for polyp and 499 for cancer detection scenarios following
[p/1-p] as described above), ultimately resulting in a value of Wpolyp of 4.7 (Table 20).
Table 20: Relative weighting values ‘W’ determined from Patient and Professional groups for polyp and
cancer detection scenarios tested during the discrete choice experiment (Chapter 5)
FP vs TP absolute values Relative weighting W*
Participants Polyps Cancer Polyps Cancer
Patients 22 4250 7.33* 8.5
Professionals 6 1250 2.0* 2.5
Average at 50% population 14 2750 4.67* 5.5
PRIMARY OUTCOME MEASURE
The primary analysis was a comparison of the CAD net effect measure between inexperienced
and experienced readers when using a concurrent CAD paradigm, for a per-patient analysis of
patients with polyps of any size.

1 2 2
SECONDARY OUTCOME MEASURES
The following secondary outcomes were pre-specified for experienced and inexperienced
readers, and the difference between them:
Per-patient sensitivity and specificity when unassisted, when using concurrent CAD,
and the change when using CAD, for patients with all polyps and restricted to those
with polyps ≥6mm
Per-polyp sensitivity when unassisted, when using CAD, and the change when using
CAD, for patients with all polyps, polyps ≥6mm, and polyps ≤5mm.
The mean number of patients correctly classified as true-positive solely as a
consequence of false-positive detections.
Mean reading time with and without CAD, and the difference between the two.
To speculate on the potential gain for inexperienced readers using CAD in a second-
read paradigm by quantifying the difference in accuracy between concurrent and
second-read CAD paradigms for experienced readers via existing data(21).
020
40
60
80
100
Perc
ent pro
fessio
nals
0 5 10 15 20 25Polyps: FP per TP
Figure 19: Ranked trade-off values for Professional respondents from the discrete choice experiment
Polyp detection scenario (Chapter 5). Note data points beyond the maximum trade-off (25 FP per TP)
represent missing data from non-traders

1 2 3
020
40
60
80
100
Perc
ent patient
0 5 10 15 20 25Polyps: FP per TP
Figure 20: Ranked trade-off values for Patient respondents from the discrete choice experiment polyp
detection scenario (Chapter 5). Note data points beyond the maximum trade-off (25 FP per TP)
represent missing data from non-traders.
Average estimates were calculated from 2000 bootstrap samples generated by random
sampling patients and readers, retaining data clustering. Positive and negative patients were
bootstrapped separately and the same case bootstrapping used for both studies. Readers were
bootstrapped separately for each study. Differences between novices and experienced readers
were calculated within each case prior to averaging across all cases. Calculations of the net-
effect for CAD were based on 50% prevalence. Meta-analysis with equal weighting per reader
was used to obtain an average across all readers. For per-polyp sensitivity bootstrap analysis
accounted for the clustering of multiple polyps per patient.
Confidence intervals were calculated by taking the 2.5% and 97.5% percentiles of the
cumulative distribution of the 2000 estimates. Although underpowered for analysis at the 1cm
threshold, we calculated the median number of patients detected. Interpretation times for
experienced readers were based on 15 readers (one had missing data). Sensitivity and
specificity, and changes in these are expressed as decimals. Results are reported with 95%
confidence intervals (CI). Differences with confidence intervals not including zero were
considered to be statistically significant.
1 2 4
6.3 RESULTS
6.3.1 PER-PATIENT ANALYSES
A net benefit for CAD was identified in 83% of cases for both inexperienced and experienced
readers; detection of patients with polyps increased in 70% and 57% of cases over 10 and 16
readers respectively. Per-patient sensitivity and specificity (with 95%CI) for readers when
unassisted and when using CAD are shown in Table 21. There was a statistically significant
mean gain in sensitivity for all polyps of 14.1% for inexperienced readers when using CAD
(rising from 39.1% to 53.2%). Sensitivity for all polyps was higher for experienced readers but
the mean gain of 4.6% with CAD was not significant (rising from 57.5% to 62.1%).
Inexperienced readers benefitted by a mean gain in sensitivity approximately 3-times that for
experienced readers, a significant difference of 9.6% (95%CI: 1.2% to 17.7%). The mean drop in
specificity of -6.1% with CAD was non-significant for inexperienced readers (falling from 94.1%
to 88.0%). Likewise, the mean drop in specificity of -2.7% with CAD was non-significant for
experienced readers (falling from 91.0% to 88.3%). Thus, in a series of 200 patients (100 with
polyps) inexperienced readers using CAD would correctly identify 14 additional patients with
polyps on average, at the cost of approximately 6 additional false-positives, whereas
experienced readers would identify 4 or 5 additional patients with polyps at cost of 2 or 3
additional false-positives. For our primary outcome, these data gave a significant mean CAD net
benefit of 12.9 (95%CI: 5.5-20.0) for inexperienced readers, versus a non-significant net effect
of 4 (95%CI: -0.8 to 8.8) for experienced. Net benefit was significantly greater among
inexperienced readers than for the experienced group, with a mean difference of 8.9 (95%CI:
0.5 to 17.1) (Table 21).
With the analyses restricted to patients with polyps ≥6mm there was a significant mean gain in
sensitivity with CAD of 11.6% for inexperienced readers (rising from 49.5% unassisted to 61.1%)
compared with a non significant mean gain of 4.2% for experienced readers (rising from 65.9%
to 70.1%)(Table 21). The fall in specificity with CAD was non-significant for both groups, with a
mean change of -3.4% for inexperienced readers and -0.8% for experienced readers.
1 2 5
Thus, in a series of 200 patients (100 with polyps) inexperienced readers using CAD would
correctly identify 11 or 12 additional patients with polyps on average, at the cost of
approximately 3 or 4 additional false-positives, whereas experienced readers would identify 4
or 5 additional patients with polyps at the cost of 1 additional false-positive.
Mean net effect was significant for inexperienced readers (10.8, 95% CI: 1.2 to 20.0) but not for
experienced subjects (4.0, 95%CI: -2.3 to 10.3) resulting in a non-significant difference
between groups (6.8, 95%CI: -3.1 to 16.4) (Table 21).
6.3.2 PER-POLYP ANALYSES
Per-polyp sensitivity for readers when unassisted and when using CAD are shown in 6.3.4
Other analyses
On a per patient basis, it is possible to achieve a fortuitous true-positive diagnosis while failing
to identify a true polyp through erroneously assigning a false-positive polyp. The mean number
of such patients was 4.3% for both experienced and inexperienced readers when unassisted,
falling with CAD to 3.9% for experienced readers and rising to 5.0% for inexperienced readers.
Thus the proportion of such patients is small and the increase in sensitivity found with CAD was
not due to increased false-positive detections at the per-patient level.
When unassisted, mean reading time for inexperienced readers was 11.2 min (95%CI 10.7 to
11.7) compared with 7.9 min (7.4 to 8.2) for experienced readers. When using CAD
concurrently, this fell to 8.9 (8.3 to 9.4) for inexperienced readers but rose to 8.7 (8.2 to 9.3) for
experienced readers.
Table 22. For all polyps there was a significant mean gain in sensitivity with CAD of 9.0% for
inexperienced readers (rising from 15.4 unassisted to 24.4%) and a mean gain of 4.1% for
experienced readers (rising from 30.3% to 34.4%), which was also significant. Restricting
analysis to polyps ≥6mm the mean gain of 10.0% (rising from 28.5% to 38.5%) for
inexperienced readers was significant but the mean gain of 3.0% (rising from 51.0% to 54.0%)
for experienced readers was not. When the analysis was restricted to polyps ≤5mm the mean
gain in sensitivity with CAD was significant for both groups, 8.3% (rising from 5.9% to 14.2%)
for inexperienced readers and 4.8% (15.3% rising to 20.1%) for experienced readers. The
magnitude of benefit with CAD was not significantly different between the two groups.

1 2 6
Table 21: Per-patient results for CAD assistance when used in concurrent mode for interpretation of
CTC by inexperienced and experienced readers. All comparisons with CAD assistance are minus
performance when unassisted. Net effect RED; statistical significance denoted by underlined figures.
Inexperienced readers
[mean (95%CI)] (%)
Experienced readers
[mean (95%CI)] (%)
Difference Inexperienced –
Experienced
[mean (95%CI)] (%)
CAD net effect measure
(all polyps)
12.9
(5.5 to 20.0)
4.0
(-0.8 to 8.8)
8.9
(0.5 to 17.1)
Unassisted sensitivity
(all polyps)
39.1
(30.9 to 47.0)
57.5
(49.6 to 65.2)
-18.5
(-25.3 to -11.9)
Unassisted specificity
(all polyps)
94.1
(90.0 to 97.4)
91.0
(87.0 to 94.8)
3.1
(-1.7 to 7.9)
Sensitivity with CAD
(all polyps)
53.2
(43.9 to 61.4)
62.1
(54.1 to 70.3)
-8.9
(-16.6 to -1.9)
Specificity with CAD
(all polyps)
88.0
(82.2 to 93.3)
88.3
(83.8 to 92.4)
-0.3
(-5.6 to 5.0)
Change in sensitivity
with CAD (all polyps)
14.1
(6.8 to 21.4)
4.6
(-0.2 to 9.3)
9.6
(1.2 to 17.7)
Change in specificity
with CAD (all polyps)
-6.1
(-12.0 to -0.2)
-2.7
(-6.3 to 0.8)
-3.4
(-9.6 to 3.0)
CAD net effect measure
(polyps ≥6mm)
10.8
(1.2 to 20.0)
4.0
(-2.3 to 10.3)
6.8
(-3.1 to 16.4)
Unassisted sensitivity
(polyps ≥6mm)
49.5
(40.0 to 58.9)
65.9
(56.4 to 74.7)
-16.4
(-24.0 to -8.3)
Unassisted specificity
(polyps ≥6mm)
92.6
(89.0 to 95.5)
93.5
(90.5 to 95.9)
-0.9
(-4.4 to 2.5)
Sensitivity with CAD
(polyps ≥6mm)
61.1
(50.0 to 71.1)
70.1
(60.5 to 78.7)
-9.0
(-18.4 to -0.3)
Specificity with CAD
(polyps ≥6mm)
89.2
(84.7 to 92.8)
92.7
(89.0 to 95.5)
-3.5
(-7.4 to 0.2)
Change in sensitivity
with CAD (polyps
≥6mm)
11.6
(1.9 to 20.5)
4.2
(-2.0 to 10.5)
7.5
(-2.6 to 16.8)
Change in specificity
with CAD (polyps
≥6mm)
-3.4
(-8.0 to 0.8)
-0.8
(-3.4 to 1.7)
-2.6
(-7.5 to 2.0)
1 2 7
6.3.3 SECOND-READ CAD
Data for second-read CAD were only available for experienced readers (as this reading
paradigm was not tested directly in the earlier study of inexperienced readers) and are shown
in Table 23. There was a significant rise in mean sensitivity of 6.9% for patients with all polyps
(rising from 57.5% to 64.4%), with a non-significant fall in mean specificity of -2.0% (falling from
91.0% to 89.0%). Thus in a series of 200 patients (100 with polyps) experienced readers would
identify 6 or 7 additional patients with polyps on average, at a cost of 2 additional false-
positives. These data gave a significant CAD net benefit of 6.5 (95%CI: 2.2 to 10.9). Mean per-
patient sensitivity for patients with polyps ≥6mm rose significantly by 6.9% also, with a non-
significant fall in specificity of -0.9%.
Second-read CAD was not tested on inexperienced readers but we can infer at least a similar
impact to that seen in the experienced reader group, with second-read CAD likely to confer
positive net benefit. Using second-read CAD experienced readers achieved an average
sensitivity 25% above that when using concurrent CAD (6.9% increase with second read, 4.6%
increase with concurrent read; Table 21 & Table 23). Furthermore, the reduction in specificity
for experienced readers was 0.7% less using second-read CAD compared to concurrent reading
(-2.0 change for second-read versus -2.7 change for concurrent; Table 21 & Table 23).
Conservative estimates suggest a significant increase in sensitivity for inexperienced readers of
16.6% (14.1 plus 25%; Table 21) with a potentially significant decrease in specificity of
approximately -5.5% (-6.1% plus +0. 7%; Table 21).
Per-polyp sensitivity rose significantly by a mean of 7.2% for all polyps, with significant gains in
mean sensitivity of 9.1% for polyps ≥6mm and 5.8% for polyps ≤5mm.
6.3.4 OTHER ANALYSES
On a per patient basis, it is possible to achieve a fortuitous true-positive diagnosis while failing
to identify a true polyp through erroneously assigning a false-positive polyp. The mean number
of such patients was 4.3% for both experienced and inexperienced readers when unassisted,

1 2 8
falling with CAD to 3.9% for experienced readers and rising to 5.0% for inexperienced readers.
Thus the proportion of such patients is small and the increase in sensitivity found with CAD was
not due to increased false-positive detections at the per-patient level.
When unassisted, mean reading time for inexperienced readers was 11.2 min (95%CI 10.7 to
11.7) compared with 7.9 min (7.4 to 8.2) for experienced readers. When using CAD
concurrently, this fell to 8.9 (8.3 to 9.4) for inexperienced readers but rose to 8.7 (8.2 to 9.3) for
experienced readers.
Table 22: Per-polyp sensitivity for CAD assistance when used in concurrent mode for interpretation of
CTC by inexperienced and experienced readers. All comparisons with CAD assistance are minus
performance when unassisted.
Novice
readers
(mean) (%)
Experienced
readers
(mean) (%)
Difference
(Novice –
Experienced) (%)
Unassisted sensitivity (all polyps) 15.4
(11.3 to 20.8)
30.3
(23.9 to 37.7)
-14.9
(-19.6 to -10.5)
Sensitivity with CAD concurrent (all polyps) 24.4
(18.8 to 31.3)
34.4
(27.4 to 42.5)
-10.0
(-14.7 to -5.4)
Change in sensitivity with CAD (all polyps) 9.0
(5.1 to 13.2)
4.1
(1.0 to 7.5)
4.9
(0.3 to 9.5)
Unassisted sensitivity (polyps ≥6mm) 28.5
(20.2 to 36.9)
51.0
(40.4 to 60.9)
-22.5
(-29.9 to -14.7)
Sensitivity with CAD (polyps ≥6mm) 38.5
(29.7 to 48.3)
54.0
(43.0 to 64.7)
-15.5
(-23.0 to -7.6)
Change in sensitivity with CAD (polyps
≥6mm)
10.0
(3.0 to 17.3)
3.0
(-2.1 to 8.7)
7.0
(-1.2 to 14.7)
Unassisted sensitivity (polyps ≤5mm) 5.9
(3.0 to 10.0)
15.3
(10.4 to 21.2)
-9.3
(-14.3 to -5.6)
Sensitivity with CAD (polyps ≤5mm) 14.2
(8.4 to 21.4)
20.1
(13.9 to 28.0)
-5.9
(-10.6 to -0.9)
Change in sensitivity with CAD (polyps
≤5mm)
8.3
(4.1 to 13.6)
4.8
(1.5 to 8.7)
3.5
(-1.2 to 8.9)
Table 23: Effect of CAD assistance when used in second-read mode for interpretation of CTC by
experienced readers. All comparisons with CAD assistance are minus performance when unassisted.
Net effect RED; statistical significance denoted by underlined figures.

1 2 9
Per-Patient analysis
[mean (95%CI)] (%)
Per-polyp analysis
(mean) (%)
CAD net effect measure
(all polyps)
6.5
(2.2 to 10.9)
n/a
Unassisted sensitivity
(all polyps)
57.5
(49.6 to 65.2)
30.3
(23.9 to 37.7)
Unassisted specificity
(all polyps)
91.0
(87.0 to 94.8)
n/a
Sensitivity with CAD
(all polyps)
64.4
(56.6 to 72.3)
37.5
(29.5 to 46.1)
Specificity with CAD
(all polyps)
89.0
(84.1 to 93.3)
n/a
Change in sensitivity with CAD
(all polyps)
6.9
(2.8 to 11.2)
7.2
(3.9 to 10.6)
Change in specificity with CAD
(all polyps)
-2.0
(-6.2 to 1.6)
n/a
CAD net effect measure
(polyps ≥6mm)
6.7
(1.5 to 12.2)
n/a
Unassisted sensitivity
(polyps ≥6mm)
65.9
(56.4 to 74.7)
51.0
(40.4 to 60.9)
Unassisted specificity
(polyps ≥6mm)
93.5
(90.5 to 95.9)
n/a
Sensitivity with CAD
(polyps ≥6mm)
72.8
(63.3 to 81.4)
60.1
(48.9 to 70.4)
Specificity with CAD
(polyps ≥6mm)
92.6
(89.0 to 95.6)
n/a
Change in sensitivity with CAD
(polyps ≥6mm)
6.9
(1.9 to 12.5)
9.1
(3.8 to 13.8)
Change in specificity with CAD
(polyps ≥6mm)
-0.9
(-3.7 to 1.8)
n/a
Unassisted sensitivity
(polyps ≤5mm)
n/a 15.3
(10.4 to 21.2)
Sensitivity with CAD
(polyps ≤5mm)
n/a 21.1
(14.3 to 29.7)
Change in sensitivity with CAD
(polyps ≤5mm)
n/a 5.8
(2.3 to 9.7)

1 3 0
6.4 DISCUSSION
This study aimed to quantify the incremental benefit of CAD for inexperienced versus
experienced readers; both groups read the same CTC data using a concurrent CAD paradigm.
Our primary outcome was a weighted combination of sensitivity and specificity for detection of
patients with polyps of all sizes. We found that inexperienced readers achieved a significant,
beneficial net-effect when using concurrent CAD but that experienced readers did not. The
magnitude of net benefit for inexperienced readers using CAD was approximately three-times
that achieved for experienced readers. This was achieved despite a significant fall in specificity
with CAD for inexperienced readers (a phenomenon that did not occur with experienced
readers), confirming that the rise in sensitivity outweighed the corresponding diminished
specificity. For both inexperienced and experienced readers, the impact of CAD was spread
across 83% of cases with polyps, indicating that benefit was not limited to a relatively small
number of pivotal cases and suggesting that our findings are generalisable.
Our primary outcome was for detection of patients with polyps of all sizes, but secondary
outcomes for patients with polyps ≥6mm also confirmed CAD continued to confer a significant
mean net-benefit for inexperienced readers, but not for the experienced group. Per-polyp
analyses also found that inexperienced readers achieved significant gains in sensitivity when
CAD-assisted for polyps of all sizes and also when restricted to polyps ≥6mm and ≤5mm.
Experienced readers also achieved significant gains in sensitivity for the ‘all polyps’ and ‘≤5mm’
analyses, mainly due to increased detection of both medium and smaller polyps; statistical
power was limited for analyses of polyps ≥6mm, which will impact on the ability to identify
significance.
Several studies have investigated the effect of CAD-assistance on inexperienced readers of CTC,
both radiologists(34, 252-254) and technicians(159). However, direct comparisons of
inexperienced and experienced readers are uncommon, possibly because experienced readers
are more difficult to recruit to research studies than less experienced individuals (who are
often trainees and/or those who wish to lean CTC). Mang and colleagues(251) used a second-
reader paradigm, finding that CAD increased the sensitivity of two inexperienced readers to
levels close to those achieved by two experienced readers. Our findings suggest that while CAD
improves the diagnostic accuracy of inexperienced readers, in isolation CAD is insufficient to
compensate for a lack of proper training and experience. For example, CAD assisted per-polyp

1 3 1
sensitivity for lesions ≥6mm (considered a threshold for ‘clinical significance’) was just 38.5%
for inexperienced readers versus 54.0% for experienced readers. Supporting this, a study of 6
inexperienced readers who had participated in a prior study of CAD for CTC found that a single
day of focussed clinical training resulted in a significant incremental gain in mean sensitivity
subsequently (172). Likewise, researchers have also investigated the role of CAD prompting of
potential polyps to facilitate training inexperienced readers(255).
Our comparison used concurrent CAD because both groups used this paradigm to read the
same cases. However, we found that second-read CAD (tested only by experienced readers)
provided a significant net-benefit to experienced readers whereas concurrent CAD did not. This
suggests the second-read paradigm provides the greatest diagnostic accuracy. Other
researchers have also found second-read CAD beneficial for experienced readers, using ROC
AUC as the primary analysis(20). Although second-read CAD was not tested on inexperienced
readers, it is plausible to expect at least a similar net-benefit to that seen in experienced
readers; i.e. second-read CAD is likely to be more effective than concurrent CAD. A conservative
estimate would assume a similar improvement in the inexperienced readers’ diagnostic
performance between concurrent and second-read paradigms to that observed for
experienced readers. This assumption suggests that per-patient sensitivity for all polyps would
increase significantly by approximately 16.6% with a potentially significant decrease in
specificity of approximately -5.5%
Our primary outcome was based on detection of patients with polyps of all sizes. We chose this
endpoint because the clinical trajectory for a patient found to have polyps is likely to be
colonoscopy, and this usually applies irrespective of the number of polyps found as long as one
crosses the size threshold for referral. We chose not to apply a size threshold for our primary
outcome because doing so would reduce power (by reducing the number of patient endpoints)
and there is also disagreement between radiologists and gastroenterologists regarding the
appropriate diameter threshold for referral to endoscopy(256). Moreover, 3 or more
diminutive polyps alone may indicate a patient at risk of developing colorectal cancer,
attracting a higher CRADS score (99) and also prompting colonoscopy. Also, since smaller
polyps are more difficult to detect than larger polyps, the a priori expectation would be that
CAD is likely to have most impact on this category.
1 3 2
Mean unassisted interpretation time was significantly longer for inexperienced readers, by
approximately 3 minutes, a finding that did not surprise us since we would expect experienced
readers to be quicker (although it could be argued that the most accurate interpretations are
the result of slow, careful inspection of the imaging data). However, the effect of using
concurrent CAD was different, shortening interpretation time for inexperienced readers (by
over two minutes) and raising it for experienced readers (by just under a minute). The reasons
why this happened are unclear but it seems likely that when using CAD concurrently,
inexperienced readers were paying less attention to un-annotated areas of the colonic lumen
than they did when unassisted, which suggests an ‘over-reliance’ on CAD prompts. This
phenomenon was not observed with experienced readers, possibly because they were more
aware that CAD may be inaccurate, although both groups were told in advance that the CAD
algorithm made both TP and FP prompts, and that it may miss polyps altogether.
This study does have limitations. Reading environment differed between groups (inexperienced
participants read under ‘laboratory’ conditions over a week whereas experienced readers’
interpretations occurred over a month, at their place of work). However, the systematic review
presented in Chapter 4 suggests this is unlikely to have resulted in significant bias. Also, while
the CAD algorithm was identical for both reader groups (and so TP and FP prompting was
identical between studies), the reading platform was different: Inexperienced readers used an
in-house interface whereas experienced readers used commercially-available workstations with
the CAD algorithm integrated. Our expectation that second-read CAD would lead to an even
greater benefit for inexperienced readers is based on the direct comparison between the two
groups using the concurrent paradigm, and the incremental benefit of second-read concurrent
over concurrent for experienced readers. Although statistically plausible, our estimate remains
speculative.
In summary, we found that concurrent CAD resulted in a significant beneficial net-effect when
used by inexperienced readers to identify patients with any size polyp by CTC. The net-effect
was approximately three-times the magnitude of that observed in experienced readers.
Experienced readers had a significantly increased net effect with second-read CAD but did not
benefit significantly from concurrent CAD when used to identify patients with polyps of any
size. This suggests that second-read CAD would also be more effective than concurrent CAD
when used by inexperienced readers.

1 3 3
CHAPTER 7: 7. ESTABLISHING VISUAL SEARCH PATTERNS DURING CTC: TECHNICAL DEVELOPMENT OF EYE TRACKING TECHNOLOGY, PROPOSED METRICS FOR ANALYSIS AND PILOT STUDY
AUTHOR DECLARATION
Research presented in this Chapter has been published as: Phillips P, Boone D, Mallett S, et al.
Tracking gaze during interpretation of endoluminal 3D CT Colonography: Technical description
and proposed metrics for analysis. Radiology. 2013;267(3):924-31 and represents a sample of
the author’s ongoing collaborative work co-led with Dr Peter Phillips, medical image perception
scientist, Cumbria University under the joint supervision of Professor Steve Halligan, Professor
David Manning, and Professor Alistair Gale. Novel analysis metrics were designed by Dr Susan
Mallett and Professor Douglas Altman with clinical guidance from the author, Professor
Halligan, Professor Taylor and image perception input from Professor Manning.
The author compiled the study protocol, obtained ethical permission, recruited subjects both in
the UK and Europe, contributed to metric development methodology and analysis, produced
3D CTC video for gaze tracking experiments and edited the manuscript. Eye-tracking data
collection was performed by Dr Phillips.
1 3 4
7.1 INTRODUCTION
Medical image perception research can provide valuable insight into radiological interpretation.
There are quantifiable differences in visual search strategy that can be related to reader
expertise(257-259) and certain search parameters such as saccadic amplitude and the ‘time to
first hit’ on a target have been used as surrogates for search efficiency and accuracy (260).
Moreover, eye-tracking can characterise false negative detections into errors of visual search
vs. those of misclassification as it can establish whether the observer failed to see a missed
lesion or simply chose to disregard it. This is potentially valuable for directing reader training.
However, to date, eyetracking has been confined to mammography (258), chest radiography
(39) and more recently, high-resolution thoracic CT (261). However, the visual task faced by
radiologists is becoming increasingly complex with cross-sectional imaging acquiring volumetric
information requiring review of multiple images, usually in several planes, and now with
moving images in the case of CTC. Continuous interaction with the display is necessary to
navigate these data, increasing the perceptual and cognitive burden for the reader. CTC
colonography is a prime example: Colonic navigation to detect mural abnormalities often
combines endoluminal and multiplanar reconstructions; simultaneous review of the
complementary prone dataset adds another layer of complexity. Therefore, it is unsurprising
that interpretation of CTC is difficult and requires considerable training(262). It is know that
diagnostic performance varies considerably among observers but little is known regarding the
search strategies used by experienced and inexperienced readers.
The technical challenge posed by recording visual search during CTC is significant; rather than a
consistent abnormality on a 2D image, the target pathology (e.g. a polyp in an endoluminal
flythrough) is moving, changing in size and direction, and may remain in the field-of-view for
only a short period of time. Furthermore, metrics for analysing eyetracking that are well-
established in the 2D literature are unlikely to transfer readily to the 3D domain.
We aimed to separate perceptual error in CTC into either failure of search (i.e. failure to ‘look’
at a lesion), or failure of recognition (i.e. failing to diagnose the lesion despite having looked at
it). In order to achieve this we aimed to develop eye-tracking applicable to 3D images, notably
where the target pathology (in contrast to 2D display) is both moving and changing in size.
1 3 5
7.2 MATERIALS AND METHODS
LREC approval was granted to record eye-tracking data from six readers recruited from
participants at an ESGAR CTC workshop, Stresa, Italy, 2009. All were radiology consultants or
registrars and gave written informed consent. Participants completed the same questionnaire
as in Chapter 3 (Appendix B) to establish previous training and experience. None had attended
a prior CTC course or had experience of eye-tracking.
7.2.1 CASE PREPARATION
Anonymised CTC datasets were selected from the multicentre CAD studies described in Chapter
6 (19, 215); both studies had full ethical committee approval for data sharing. Cases included
both symptomatic and screening patients from four centres. All had undergone CTC according
to best practice guidelines (30, 36) followed by endoscopy. A consensus reference standard was
available for each case.
To ensure polyp detection was suitably challenging, collaborating statistician, Dr Susan Mallett,
selected 20 CTC cases in whom a false-negative or false-positive polyp diagnosis had been
made by approximately 50% of readers in the prior studies(19, 215). The author reviewed MPR
images using a proprietary workstation (V3D Colon, Viatronix Inc, Stony Brook, USA) using
reference standard reports to locate lesions. 11 cases were excluded because the lesion could
not be demonstrated on either endoluminal projection or because it was within five seconds’
navigation of the anorectal junction or caecal pole. A further case was excluded because of
concurrent true- and false-positive polyps. Ultimately five true-positive cases (6, 8, 11, 12,
25mm according to reference standard) and two false-positive cases (5, 7mm according to
study reader) were selected.
The author produced short (mean 27s; range 24 to 31s) endoluminal fly-through video clips
(15fps; 384x384 pixel matrix) incorporating each lesion. Automated navigation was recorded at
75% maximum speed (considered by the author to reflect clinical practice) and edited to
ensure the lesion became visible between 5 and 25 seconds at a random time-point generated
using STATA (StataCorp, College Station, TX). Total clip duration, time of lesion appearance, time
1 3 6
of disappearance were noted and screenshots of the index lesion captured. One FP case was
duplicated resulting in 8 video clips in total.
7.2.2 CASE READING
Eye-tracking was performed by a medical image perception scientist, Dr Peter Phillips, using a
Tobii X50 eye-tracker located under the screen and Studio capture software (Tobii Technology
AB, Danderyd, Sweden) hosted on a laptop. Eye-tracker accuracy was 0.5°, approximately 20
screen pixels at 60cm viewing distance. Tracker angle and orientation were entered as
parameters in the tracking software.
All eight video clips were shown on an LCD monitor (Samsung SyncMaster 723N. Resolution
1280x1024. One pixel=0.264mm). Readers viewed cases in a quiet environment free from
disturbance; no chin rest or head restraint was used. Readers remained unaware of the study
hypothesis and prevalence of abnormality – they were merely told that some cases would
include polyps. Spectacles and contact lenses were worn as normal. A five-point calibration
routine matched reader gaze to screen location. When viewing the videos, readers were asked
to identify any potential polyps that they would scrutinise further if encountered in normal
daily practice, with a mouse click. Following an introductory video (excluded from analysis) test
cases were shown in two blocks with a different random order for each reader. Eye-tracking
only took place during playback. Readers could not see their data being recorded. The total
time to review all cases was approximately 10 minutes.
7.2.3 DATA PREPARATION AND ANALYSIS
Dr Phillips examined each video frame-by-frame. The size and position of both TP and FP
polyps were manually outlined using circular regions of interest (ROI), a process overseen by
the author. ROI coordinates described a circle epicentre and radius from the point of lesion
appearance to its eventual disappearance from view. Therefore, each video generated a
equence of circular ROIs, one per frame, encircling the index lesion to provide a representation
of the size and position of the 3D ROI as viewed on the 2D screen (Figure 21)

1 3 7
Figure 21: Frame-by-frame ROIs for
the 12mm polyp. Each individual circle
is the ROI for each individual frame
(frame rate 15Hz).
Eye tracking from each reader/case pair was checked to confirm gaze data were contained
within the video area. This acted as a secondary check on the initial calibration and monitored
any drift in reported eye position during recording. Readers’ gaze moved to keep the pathology
in foveal view, which we termed ‘pursuit’. This involved both fixation and ‘smooth pursuit’ eye
movements(263) with the result that grouping gaze points using existing fixation methods(264)
(e.g. in terms of averaged x,y points) was problematic. Therefore, gaze points were grouped
into pursuits based on the distance to the polyp ROI boundary. This reframed measurements in
terms of the relationship between gaze and polyp, rather than gaze within the video. For each
point of gaze data acquired during a visible polyp, the distance from the gaze point to the ROI
margin was calculated. Points were marked as polyp fixations if within a 50 pixel threshold
around the polyp ROI boundary. Four or more contiguous region-related fixations were
considered to constitute pursuit. These data were used to calculate: time to first hit (time from
first polyp appearance on the screen to the reader’s first fixation within the ROI); cumulative
dwell time on the ROIs; number of ROI fixations. The time from first hit to mouse click (i.e.
decision time) was also calculated. A TP detection was registered if gaze intersected a ROI
threshold and a mouse click was registered at this time. Two types of FN detections were
identifiable: A perceptual error occurred when no gaze intersected with the moving ROI; a
classification error occurred when gaze data intersected a ROI but no mouse click was
registered. All other mouse clicks were considered FPs.
1 3 8
7.2.4 STATISTICAL ANALYSIS
Missing data was interpolated by Dr Mallett using multiple imputation methods(265) adapted
for missing longitudinal data. Eye pursuits were defined when within 50 pixels from polyp ROI
boundary for at least 80msec. Allowing for measurement error, the end of each pursuit was
defined as at least 20msec when the average pursuit distance plus two standard deviations,
was more than 50 pixels. Eye metrics were defined as in
Figure 22 (time to first pursuit corresponding to B-A; overall decision time E-A); cumulative
dwell being total time within 50 pixel distance from polyp ROI boundary. The number of
pursuits was averaged across five imputed datasets and rounded to an integer.
Data were analysed using STATA 11.0 (StataCorp, College Station, TX).
7.3 RESULTS
Eye-tracking was technically feasible and data were acquired for all readers. Of the 6 readers, 1
had experience of interpreting less than 10 CTC cases, 3 had interpreted between 11 and 50,
and 2 had interpreted between 101 to 200 prior to the course. Of the 8 possible positive polyp
identifications, the highest score (7 identifications) was made by a reader with prior experience
of 11 to 50 cases; the lowest score (4 identifications) was made by a reader with prior
experience of 101 to 200 cases.
Perception and recognition errors for each polyp are shown in Table 24. Of the 48 decisions, 16
(33.3%) were errors: The vast majority (15) of these errors were errors of classification. A
search error occurred in a single case. Interestingly, the smallest (5mm) and largest (25mm)
polyps were the most prone to error, suggesting error was not related to polyp diameter alone.
The single perceptual (search) error occurred in the case with the smallest (5mm) lesion.
Table 26 shows the number of times each polyp was viewed during its time on screen. There
was only one search error. The largest polyp (case 3) was viewed by all readers at least twice
but only indicated with a click by a single reader (Table 27). With the exception of reader 4
looking at case 2, detection decisions indicated by a mouse click were associated with more
than one gaze at the polyp.

1 3 9
Figure 22: Schematic time course of identified gaze and mouse events recorded during time of polyp
visibility (time A to F). In this instance the reader’s gaze first fixes the polyp at time B. Reader gaze
revisits the polyp twice more (time C and D) between viewing other regions of the colon video. The
reader clicks the mouse to indicate suspicion, occurring at time E. The polyp disappears from the field
of view at time F. The time to first hit is B - A. The overall reader decision time is E - B. The polyp was
fixed 3 times (B,C,D).
Table 27 shows the decision time for each detection. The polyp on screen for the shortest time
(case1, 2.47s) had the shortest decision time of 2.0s for readers who clicked on this polyp (but
a high average decision time of 81% when expressed as a percentage of polyp visibility). This
case had the shortest average time to first pursuit time (0.3s) and on average the cumulative
eye dwell was 52% of the time the polyp was on the screen.
Table 24: Summary of errors of search and errors of recognition for 6 readers asked to interpret 5 TP
CTC and 3 FP CTC cases.
TP polyp cases FP polyp cases
1 2 3 4 5 6 7 8
Polyp diameter (mm) 12 6 25 11 8 7 7 5
Screen Time (seconds) 2.47 3.40 4.20 8.87 7.27 7.93 7.93 2.93
Total Errors 1 2 5 1 0 0 2 5
Search Errors 0 0 0 0 0 0 0 1
Recognition Errors 1 2 5 1 0 0 2 4
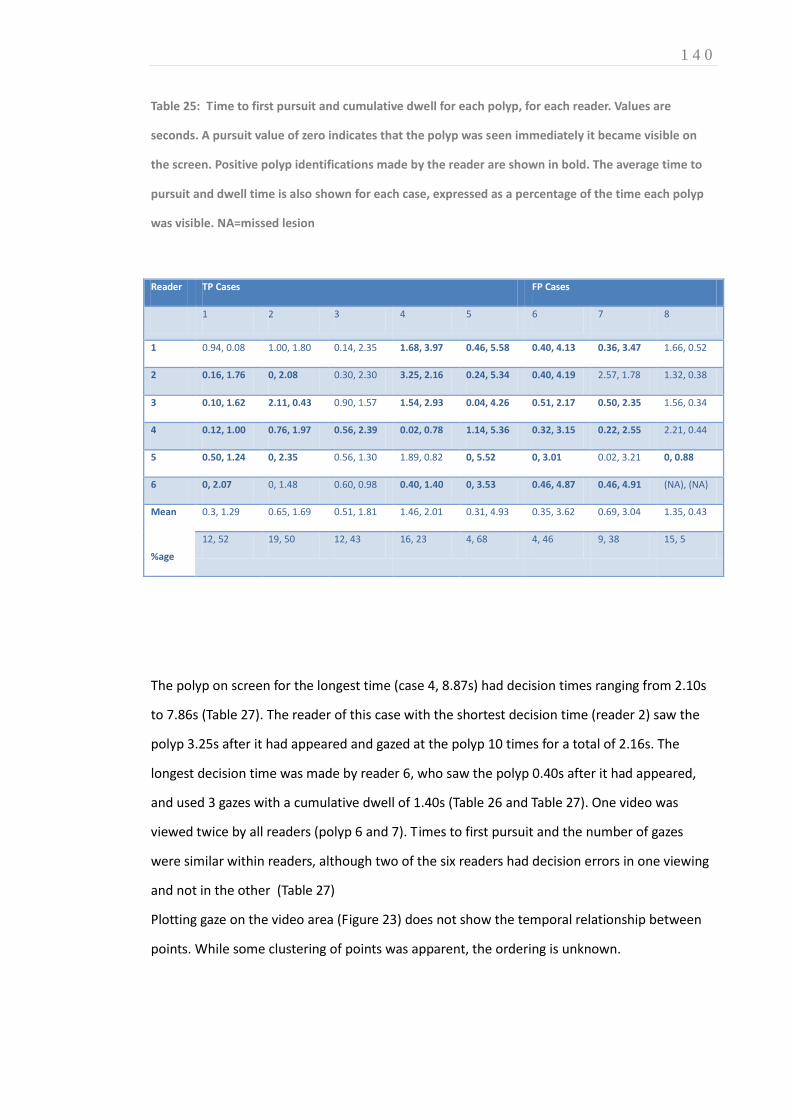
1 4 0
Table 25: Time to first pursuit and cumulative dwell for each polyp, for each reader. Values are
seconds. A pursuit value of zero indicates that the polyp was seen immediately it became visible on
the screen. Positive polyp identifications made by the reader are shown in bold. The average time to
pursuit and dwell time is also shown for each case, expressed as a percentage of the time each polyp
was visible. NA=missed lesion
Reader TP Cases FP Cases
1 2 3 4 5 6 7 8
1 0.94, 0.08 1.00, 1.80 0.14, 2.35 1.68, 3.97 0.46, 5.58 0.40, 4.13 0.36, 3.47 1.66, 0.52
2 0.16, 1.76 0, 2.08 0.30, 2.30 3.25, 2.16 0.24, 5.34 0.40, 4.19 2.57, 1.78 1.32, 0.38
3 0.10, 1.62 2.11, 0.43 0.90, 1.57 1.54, 2.93 0.04, 4.26 0.51, 2.17 0.50, 2.35 1.56, 0.34
4 0.12, 1.00 0.76, 1.97 0.56, 2.39 0.02, 0.78 1.14, 5.36 0.32, 3.15 0.22, 2.55 2.21, 0.44
5 0.50, 1.24 0, 2.35 0.56, 1.30 1.89, 0.82 0, 5.52 0, 3.01 0.02, 3.21 0, 0.88
6 0, 2.07 0, 1.48 0.60, 0.98 0.40, 1.40 0, 3.53 0.46, 4.87 0.46, 4.91 (NA), (NA)
Mean
%age
0.3, 1.29 0.65, 1.69 0.51, 1.81 1.46, 2.01 0.31, 4.93 0.35, 3.62 0.69, 3.04 1.35, 0.43
12, 52 19, 50 12, 43 16, 23 4, 68 4, 46 9, 38 15, 5
The polyp on screen for the longest time (case 4, 8.87s) had decision times ranging from 2.10s
to 7.86s (Table 27). The reader of this case with the shortest decision time (reader 2) saw the
polyp 3.25s after it had appeared and gazed at the polyp 10 times for a total of 2.16s. The
longest decision time was made by reader 6, who saw the polyp 0.40s after it had appeared,
and used 3 gazes with a cumulative dwell of 1.40s (Table 26 and Table 27). One video was
viewed twice by all readers (polyp 6 and 7). Times to first pursuit and the number of gazes
were similar within readers, although two of the six readers had decision errors in one viewing
and not in the other (Table 27)
Plotting gaze on the video area (Figure 23) does not show the temporal relationship between
points. While some clustering of points was apparent, the ordering is unknown.

1 4 1
Table 26: Number of times each polyp was viewed by each reader during its time on screen. View was
defined by the reader’s gaze crossing the region threshold and remaining within it for a minimum of 4
points (80ms). Figures in bold denote a positive identification made by the reader.
Reader TP polyp cases FP polyp cases
1 2 3 4 5 6 7 8
1 1 5 2 5 2 8 7 1
2 3 7 5 10 7 7 8 2
3 4 4 3 9 7 7 6 2
4 2 1 4 2 4 9 5 1
5 3 2 2 2 6 9 9 2
6 3 4 2 3 7 10 5 (missed)
Table 27: Decision time (s) for each reader for each polyp, with the average overall for each polyp.
Recognition errors are denoted by a blank cell. The single search error is shown by an asterisk.
Reader True positive polyp cases FP polyp cases
1 2 3 4 5 6 7 8
1 7.31 4.90 6.09 6.23
2 1.84 3.13 2.10 3.91 6.16
3 2.21 1.20 4.73 5.47 6.67 5.73
4 2.26 1.86 2.86 5.65 4.78 6.42 6.07
5 1.74 2.35 6.36 6.94 2.15
6 1.97 7.86 6.01 7.27 6.03 *
Average decision time (sec)
Percentage of polyp visibility time
2.00
(81%)
2.14
(63%)
2.86
(68%)
5.53
(62%)
5.24
(72%)
6.59
(83%)
6.01
(76%)
2.15
(73%)

1 4 2
Figure 23: Distribution of a reader’s gaze in a 25s video case with a 12mm polyp. Each individual dot
represents a gaze point (sample rate 50Hz).
However, it was possible to visualize the temporal component of the data by plotting x and y
coordinates as separate lines (Figure 24). Since time was preserved, the polyp centre position and
maximum extent could be plotted as separate x and y areas. Thus polyps are plotted as areas
rather than discrete lines or points, each box being 66.7ms wide, the interval of one video
frame (Figure 24). The extent of the area added due to the distance thresholding is also plotted.
The calculated distance from the polyp boundary to gaze points is shown in Table 26. Two
pursuits can be identified. The first is the initial 200ms when the polyp is on screen. The
reader’s gaze was already in the region where the polyp appeared, and tracked the polyp
approximately 40 pixels from the polyp boundary. The second pursuit is approximately 16550
to 17200ms, a duration of 650ms. In this instance the pursuit follows the edge of the polyp as it
moves and increases in area.

1 4 3
Figure 24: Time course of reader eye gaze and polyp extent for a single reader (reader 5) reading case 8 (5mm polyp). The line
represents reader gaze position in the Y (top) and Y (bottom) video coordinates. The maximum extent of the polyp in the
horizontal (X) and vertical (Y) directions for each video frame is shown in green, bounded by the 50 pixel distance threshold
(grey border). X and Y extent increases as the polyp approaches the edges of the screen. Both X and Y gaze components must be
contained within the polyp & threshold region for a minimum of four points to be deemed a pursuit.
Figure 25: The calculated distance from gaze to the polyp boundary (line), over the same time axis as
Figure 24. Two dashed lines are shown: the upper line is the 50 pixel distance threshold, the lower line
represents the boundary of the polyp. A point with a negative distance value indicates that the point is
within the polyp region.
1 4 4
7.4 DISCUSSION
In order to investigate interpretation of modern 3D medical image displays, we have developed
a novel method to track visual gaze when pathology is both moving and changing in size. We
have shown that data collection is feasible and have developed suitable metrics derived from
plotting gaze and calculating intersections with the region of pathology.
Polyps were described frame-by-frame by circular ROIs, and individual gaze points were
grouped into ‘pursuits’ based on distance to the time-appropriate ROI boundary. It is the
boundary, the edge of the polyp against the background, which contains useful visual
information. Figure 23 shows a single pursuit where reader gaze maintained a fixed distance to
the polyp ROI boundary, despite the polyp changing size and position over the lifetime of the
pursuit; the reader’s attention was focused on the polyp edge rather than the centre. Metrics
such as time-to-first-hit and number-of-dwells, used in pulmonary nodule (266) and
mammographic (38) interpretation, have been reinterpreted for gaze pursuits of moving lesions
with changing size.
Endoluminal navigation requires a visual search strategy that samples ROIs before they move
out of view. However, competition from other features, perhaps closer to the screen edge and
therefore larger and more detailed, may mean other ROIs must be revisited later. Readers must
judge the optimal time to look at a feature, trading size and detail against remaining screen
time. Gaze tracking demonstrates how readers allocate attention. Our metrics can resolve
differences in reader visual search behaviour. The example of two readers (2 and 6) of the
longest case on screen (case 4), shows different approaches to identification: There is marked
difference in the number of pursuits, but both result in a positive identification. Reader 2 made
their decision quickly and early, but with multiple gazes (10 – average 216ms), indicating that
they had to attend to other features during their decision. Reader 6 saw the polyp early but
attended to other areas for longer, making fewer (but longer) gazes at the polyp (3 – average
467ms) and not making a decision until the polyp was about to go off screen. Both readers had
similar experience and identifications (11-to-50 case; 5 of 8 correct identifications).
This study does have limitations: We investigated endoluminal fly-through, but only in
automatic mode. Readers clicked to indicate interest, but could not stop and inspect as per

1 4 5
usual daily practice. Also, irregular polyps and those seen in profile were difficult to
characterise precisely using a single circular ROI. Other boundary descriptions are possible to
improve boundary accuracy but will require more complex calculations. The 50 pixel distance
threshold was constant across all polyp sizes. A side-effect of this decision is that distant polyps
can be called as ‘seen’ too early. A threshold based on a percentage of the polyp region radius
would have the opposite effect; larger polyps would have a large threshold. Any future
thresholding technique must be able to account for polyps at both small and large scales. We
limited our investigation to inexperienced readers; it will be informative to investigate
differences between experienced readers and between inexperienced and experienced
readers.
In summary, eye-tracking volumetric data presents unique challenges for recording what is on
the screen where and when, and synchronising that data with gaze data. The properties of
volume imaging modalities, particularly that not all scan data is visible simultaneously,
challenges standard 2D metrics. We have reframed the problem by considering the relationship
between gaze and lesion, rather than screen/image area. The metrics we developed can
describe differences in reader gaze behaviour and attention distribution when interpreting an
automatic CTC fly-through. Perceptual errors can be classified into visual search errors and
recognition errors. Classification errors are most frequent in inexperienced readers.
The next Section describes development and validation of novel computer algorithms that aim
to improve lesion classification by providing accurate corresponding endoluminal locations in
prone and supine CTC datasets.
1 4 6
SECTION D: DEVELOPMENT AND VALIDATION OF A NOVEL COMPUTER ALGORITHM TO FACILITATE CT COLONOGRAPHY INTERPRETATION
OVERVIEW
The research discussed thus far reaffirms the observation that CTC interpretation is difficult;
the results of Chapter 6 suggest some experienced readers may achieve relatively disappointing
performance even despite CAD assistance. Moreover, while CAD can partially compensate for
inexperience, many novice readers continue to perform well below satisfactory levels. This is of
particular concern given the significant number of radiologists interpreting CTC in daily
European practice with little experienced suggested in Chapter 3. Moreover, increasing
sensitivity comes at the expense of additional FP detections and while Chapter 5 suggests this
may be considered of little clinical consequence by patients, it has profound impact on cost-
effectiveness and subsequent implementation. Although sample size is small, our eye-tracking
research suggested that, among inexperienced observers, most errors were due to suboptimal
lesion characterisation; facilitating classification of potential pathology should improve reader

1 4 7
performance. As discussed at the outset of this Thesis, matching polyps on both the prone and
supine acquisitions is central to accurate lesion characterisation but is also challenging: The
gas-filled bowel undergoes significant deformation and movement during the change of
position(27), complicating polyp matching, prolonging reporting time, and potentially
engendering error. Our group has developed a non-rigid computer aided registration
technique that can match prone and supine endoluminal surface points despite colonic
deformation, with the aim of facilitating CTC interpretation and hence, improving diagnostic
performance.
The CASPR (Computer Assisted Supine-Prone Registration) algorithm development described in
the following Section was led by computer scientists, Mr Holger Roth (Chapter 8) and Mr
Thomas Hampshire (Chapter 9) under the supervision of Professor David Hawkes, University
College London. Methodological descriptions, figures and equations have been adapted with
their kind permission to provide the technical introduction to the Author’s in vitro (Chapter 10)
and in vivo (Chapter 11) validation of this novel software.

1 4 8
CHAPTER 8 8. DEVELOPMENT OF A NOVEL COMPUTER ALGORITHM FOR MATCHING PRONE AND SUPINE ENDOLUMINAL LOCATIONS DURING CTC INTERPRETATION
AUTHOR DECLARATION
The research presented in this Chapter was published in: Roth HR, McClelland JR, Boone DJ, et
al. Registration of the endoluminal surfaces of the colon derived from prone and supine CTC.
Medical Physics, 2011;38:3077-89.(267). Holger Roth led this project under the supervision of
Professor David Hawkes, and the technical description contained in this Chapter is reproduced
with their permission. The author’s collaboration involved establishing ethical approval to
recruit patients for algorithm development, gathering CTC data thus generated, designing and
performing the clinical validation study, and editing manuscripts. While the author contributed
to algorithm development, programming and implementation were performed by
collaborators.
8.1 INTRODUCTION
As described above, interpretation of CTC is difficult and time consuming even for experienced
readers. Although the technical quality of the CT data has an impact on diagnostic accuracy,
perceptual error on the part of the reporting radiologist accounts for the majority of missed
pathology. Retained faecal matter or anatomical structures such as thickened haustral folds can
closely simulate pathology, and collapsed segments impair visualisation. CTC is therefore
performed routinely with the patient in both the prone and supine position. This procedure
redistributes gas and faeces and presents the opportunity for abnormalities masked on one
acquisition to become visible on the other. Also, potential abnormalities identified on one scan

1 4 9
are more likely to represent true polyps if identified in an identical position on the other, since
polyps (in general) do not move whereas fluid and residue does. Matching identical colonic
locations between the prone and supine data acquisitions is thus a cornerstone of
interpretation. Unfortunately however, the colon is tortuous and deformable with the result
that positional shifts between the prone and supine acquisitions complicate the observer’s task
of matching corresponding locations. In order to address this, we have developed a novel
computational method to aided prone-supine image registration, so that corresponding
locations between the two scans can be identified rapidly by the reader, with the aim of
reducing interpretation time and increasing diagnostic accuracy.
8.2 METHODS 1: ALGORITHM DEVELOPMENT
8.2.1 SUMMARY OF THE IMAGE REGISTRATION PRINCIPLE
Establishing a cylindrical representation of the 3D endoluminal colonic surface enables each
surface point to be described in two dimensions. Therefore, each endoluminal point can be
described using two indices x and y , where x describes the length along the colon and
y denotes its angular orientation. Nevertheless, the colorectum is not a simple cylinder and
transforming a complex 3D structure in two dimensions poses considerable geometric
challenges. In addition, it is necessary to preserve the complex surface information such as
haustra and, most importantly, mural pathology. Methods have been developed to ‘unwrap’
such cylindrical representations known as ‘virtual dissection’ or ‘filet’ views. These visualisation
techniques have been adopted by several workstation vendors(40) as they enable a rapid
overview of the colonic surface(268).
One solution for mapping the colonic surface to a cylinder utilises conformal mapping.
Conformal maps are typically applied to triangulated surface meshes to enable simplified
representation of the 3D object in 2D space. These methods are based on differential geometry
and ensure one-to-one mapping of the 3D surface to 2D space while preserving local angles in

1 5 0
the triangles of the mesh(269). This, consequently preserves the appearance of local
structures, e.g. polyps and haustral folds(270).
The registration algorithm described in this Chapter is based on the following principle:
A prone endoluminal colonic surface pS in 3R can be transformed using conformal one-to-one
mapping pf to a parameterisation pP in 2R . Likewise, the supine surface sS is mapped to the
supine parameterisation sP using the mapping function sf . Applying a transformation cylT it is
possible to transform the cylindrical representation pP to sP . However this transformation
must be non-rigid in order to account for colonic deformations such as torsion and stretching,
introduced when the patient changes position from prone to supine(27). Having established
cylT then the transformation psT required to transform between the surfaces pS and sS
follows as shown in Figure 26:
Figure 26: The principle of colon surface registration between prone and supine CTC using a cylindrical
2D parameterisation. The colour scale indicates the shape index at each coordinate of the surface
computed from the 3D endoluminal colon surfaces. The hepatic and splenic flexures are marked as
hfp/s and sf p/s respectively (p/s denotes prone/supine).
Therefore, the process can be broken down into a series of discrete stages: firstly, the 3D
endoluminal surface must be extracted from the colonography data; this is then converted to a
triangulated mesh. The mesh is converted to a cylinder whilst preserving surface curvature
information using conformal mapping; the same is performed for the opposing prone
colonography data. Having achieved two cylindrical surface parameterisations, the freeform
deformation required to transform between the cylinders is calculated. This then enables the

1 5 1
calculation of a corresponding point for any location on either endoluminal surface. These
steps are considered in greater detail below.
8.2.2 SEGMENTATION OF THE ENDOLUMINAL SURFACE FROM CTC DATA
The result of the segmentation process should be familiar to anyone who interprets CTC as this
is the fundamental step in generating the endoluminal fly-through. There are several methods;
we implemented the technique described by Slabaugh et al(271). Using proprietary software
(MedicRead 3.0, Medicsight Ltd, Hammersmith, London) high attenuation luminal oral contrast
is subtracted to provide ‘digitally cleansed’ prone and supine datasets. Next, the inflated
lumena L are extracted by identifying gas-density voxels within each dataset. Other gas-
containing structures such as small bowel and the lung bases are often erroneously segmented
simultaneously, either separately or in continuity with the colonic lumen. Indeed, most
colonography workstations enable the reader to check the segmentation to ensure it has not
included terminal ileum. Extracolonic gas is excluded using a combination of shrinking
(‘eroding’) and re-dilating the lumen. Ultimately, although the process is automated, a final
manual check is made to ensure accurate segmentation, just as the reader would when
performing a fly-through in clinical practice.
8.2.3 CENTRELINE EXTRACTION
Another crucial step involved in generating an automated endoluminal flythrough is extraction
of the central path along the colonic lumen - the centreline. The centreline can be extracted
with the method described by Deschamps et al(272) based on evolving a wave front through
the colon using the fast marching method(273). This is illustrated in Figure 27 using a synthetic
colonic image. Other methods such as Sadleir’s (274) could be used providing they guarantee
the extraction of a topologically correct centreline.

1 5 2
Figure 27: Centreline extraction using the fast marching method on a synthetic image: a map of the
distance to the endoluminal surface (left) is used as a speed function F(x). After wave propagation
through the colon (right), the centreline path can be extracted by following the steepest gradient of
the wave function (colour coded from blue to red).
The path should run from the anorectal junction to the tip of the caecal pole and extraction
requires a defined start- and end-point. Usually, the most caudal point in the colonic lumen is
selected as this corresponds to the patient's anorectal junction in both projections. The caecal
endpoint can be identified from the most caudal luminal point to the right of the abdomino-
pelvic volume. These positions tend to be relatively fixed due to their retroperitoneal or sub
peritoneal locations; good point correspondence improves similarity between the prone and
supine rectal and caecal surface areas when conformally mapping to a cylinder as described
below (8.2.8)
8.2.4 TOPOLOGICAL CORRECTION
The colonic lumen L is now represented as a single 3-dimensional structure with a start and a
finish. However, topological errors occur due to reconstruction artefacts, image noise, or
attempted subtraction of inhomogeneously tagged fluid (secondary to suboptimal faecal
tagging). In particular, this occurs at flexures or haustra where the thin-walled colon folds back
upon itself, resulting in surface connections known as ‘handles’ (270) (Figure 28). The
centreline is used to remove these handles by adapting a topology correction method used for
the extraction of topologically correct thickness measurements of the human brain(275).

1 5 3
Figure 28: Left: Enlarged view of handles and an erroneous connection caused by limitation of the
segmentation quality, resulting in incorrect topology. Right: the same surface region after topological
correction. Comparison of the highlighted surface areas shows that the handles are now removed and
the endoluminal surface is of genus zero.
8.2.5 COLONIC SURFACE EXTRACTION
Having performed topological correction of the luminal volumes ( corrL ), it follows the surfaces
extracted from the gas-tissue interface of these volumes are also topologically correct (i.e. of
genus zero). Therefore, the endoluminal colonic surfaces S are modelled as triangulated
meshes on the surfaces of corrLusing the ‘marching cubes’ algorithm (276) with subsequent
smoothing using the method described by Taubin(277). This facilitates convergence to a 2D
parameterisation as described below. Furthermore, the mesh is decimated using a quadric
edge collapsing method(278) to reduce complexity and shorten computation time. We
automatically detected any resulting self-intersecting faces and vertices using the utilities
available in the open source software Meshlab(279) (http://meshlab.sourceforge.net/).
This procedure results in a simply connected genus-zero surface S of the colonic lumen corrL .
On average, the resulting surface meshes for cases described in this Chapter had around
60,000 faces with typical edge lengths of 3.3 ( 1.3) mm.

1 5 4
8.2.6 CYLINDRICAL REPRESENTATION OF THE ENDOLUMINAL COLONIC SURFACE VIA DISCRETE RICCI FLOW
As described above, the endoluminal colon surfaces S can be modelled as piecewise-linear
meshes composed of vertices iv that are connected using triangular faces. Those surfaces S
can be transformed using a conformal mapping method. One such method to parameterise
arbitrary discrete surfaces was introduced by Hamilton (280) for Riemannian geometry based
on Ricci flow. Ricci flow deforms the surface proportionally to its local Gaussian curvature
similar to a heat diffusion process until it converges towards a desired Gaussian curvature. It
can be formulated for discrete surfaces such as triangulated meshes(281). Rather than mapping
the surface to a rectangle as with other methods(282), the Ricci flow does not require a
boundary. Many other conformal mapping methods require the definition of a boundary along
the surface in order to enable a mapping of this boundary from 3D to 2D(269). This typically
requires selecting an arbitrary path (often the shortest path) where the surface can be sliced
open. This path is then mapped onto the boundary of a rectangle in 2D which constrains how
all other vertices are mapped to 2D. When computing parameterisations using Ricci flow, there
is no requirement to define such a boundary which is advantageous. Qiu et al(283) were the
first to apply Ricci flow to a colonic surface using volume rendering for the purpose of
visualisation; we implement a modification of their approach.
The original genus-zero surface S has to be converted to a surface SD of genus-one for the
purpose of cylindrical endoluminal surface parameterisation (281). This involves converting a
spheroid surface to a torus-like surface. Therefore, we create holes in the surface mesh by
removing vertices and connected triangular faces closest to the previously selected caecal and
rectal points. The remaining surface is doubled, inverted the remaining surface to create the
torus. The resulting surface SD serves then as input to the Ricci flow algorithm.
8.2.7 EMBEDDING INTO TWO-DIMENSIONAL SPACE
Following Ricci flow convergence, the surface mesh has its local Gaussian curvatures iK
tending to zero everywhere and hence, can be embedded into two-dimensional space 2R ,
using the edge lengths of each triangle to iteratively add remaining triangular faces, similar to
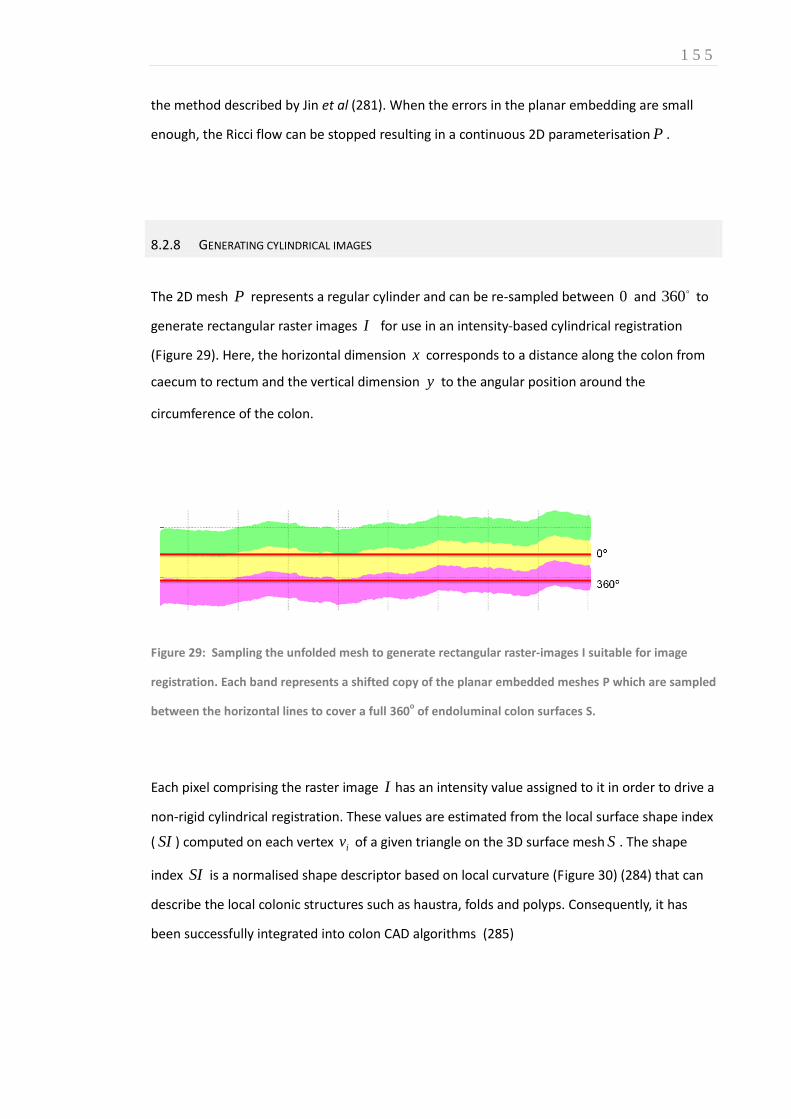
1 5 5
the method described by Jin et al (281). When the errors in the planar embedding are small
enough, the Ricci flow can be stopped resulting in a continuous 2D parameterisation P .
8.2.8 GENERATING CYLINDRICAL IMAGES
The 2D mesh P represents a regular cylinder and can be re-sampled between 0 and 360 to
generate rectangular raster images I for use in an intensity-based cylindrical registration
(Figure 29). Here, the horizontal dimension x corresponds to a distance along the colon from
caecum to rectum and the vertical dimension y to the angular position around the
circumference of the colon.
Figure 29: Sampling the unfolded mesh to generate rectangular raster-images I suitable for image
registration. Each band represents a shifted copy of the planar embedded meshes P which are sampled
between the horizontal lines to cover a full 360o of endoluminal colon surfaces S.
Each pixel comprising the raster image I has an intensity value assigned to it in order to drive a
non-rigid cylindrical registration. These values are estimated from the local surface shape index
( SI ) computed on each vertex iv of a given triangle on the 3D surface mesh S . The shape
index SI is a normalised shape descriptor based on local curvature (Figure 30) (284) that can
describe the local colonic structures such as haustra, folds and polyps. Consequently, it has
been successfully integrated into colon CAD algorithms (285)

1 5 6
Figure 30: The shape index (SI) is a normalised shape measurement to describe local surface
structures(285).
Sampling this curvature intensity information onto the parameterisation P results in ‘heat
map’ raster-images I for supine and prone endoluminal colon surfaces as shown in Figure 31
(top, middle). The top and bottom edges of the images I correspond to the same line along
the endoluminal surface S , running from caecum to rectum. Thus, these images I represent
the endoluminal colonic surface as cylinders. Corresponding features, like haustral folds or the
teniae coli are clearly visible in Figure 31. By using this curvature data to drive an intensity-
based registration method, the cylindrical images can be non-rigidly aligned to provide full
spatial correspondence between the prone and supine endoluminal surfaces pS and sS as
follows.
Figure 31: Supine (top), prone (middle) and deformed supine deformed to match prone (bottom)
raster images where each pixel has the value of the corresponding shape index computed on the
endoluminal colonic surface. The x-axis is the position along the colon, while the y-axis is its
circumferential location. The x-positions for the detected hepatic and splenic flexures are marked as
xhepatic and xsplenic. The location of a polyp is marked before (top) and after registration (middle,
bottom).

1 5 7
8.2.9 ESTABLISHING SPATIAL CORRESPONDENCE BETWEEN PRONE AND SUPINE DATASETS
The complex 3D endoluminal prone and supine colonography surfaces have now been
simplified to 2D cylindrical representations. However, the anatomical structures remain
misaligned due to torsion and linear deformations that take place between CT acquisitions.
Consequently non-rigid image registration can be employed to align these local anatomical
structures based upon their surface curvature information described above. To provide
reproducible points from which to initialise the registration algorithm, corresponding hepatic
flexure ( sp/hf ) and splenic flexure ( sp/sf ) surface points are identified in both datasets. Flexure
detection is based on the local maxima of the centreline z-coordinate, i.e. the two most cranial
points on the luminal volume must represent the splenic and hepatic flexures. The hepatic
flexure is easily identified as it is closest to the caecum. The corresponding x -positions for the
hepatic and splenic flexures are extrapolated by linear scaling onto the surface
parameterisations, marked as hepaticx and splenicx in Figure 31. These flexure positions are used
to initialise non-rigid deformation.
8.2.10 FREE-FORM DEFORMATION AND NON-RIGID IMAGE REGISTRATION
As described previously, the cylindrical representations are used to generate shape index raster
images pI and sI , where each pixel corresponds to a voxel position on the endoluminal
colonic surface in 3D. Alignment between pI and sI is established using a cylindrical non-rigid
B-spline registration method, based upon free-form deformation developed by Rueckert et al
(286) with fast implementation provided by Modat et al(287) using the open-source software
package NiftyReg (http://sourceforge.net/projects/niftyreg). Displacement along the x -axis
(along the centreline) at the colonic ends is avoided by fixing the x -displacement of the first
and last points ensuring the rectum and caecum remain aligned yet allowing for colonic
torsion. When optimising B-spline registration parameters, we examined a sub-set of available
cases visually for haustral fold alignment and for polyp alignment following registration.
Registration itself follows a coarse-to-fine approach, first registering to the largest
deformations and then resolving the smaller differences between both images where pI is the

1 5 8
target and sI is the source. The image resolutions are doubled until reaching 4096 256
( yx nn ) pixels. The cylindrical B-spline registration results in a continuous transformation
around the entire endoluminal colon surface and allows the mapping x
cylT between pP and
sP in cylindrical space. From this 2D mapping it is straightforward to determine the full 3D
mapping psT between pS and sS using pf and sf as shown previously in Figure 26. Figure 32
illustrates the registration result obtained by applying a B-spline deformation field to a colonic
segment.
Figure 32: Deformation field on a Section of the colon at the final, highest resolution step. The
deformation field has been used to deform a regular B-spline grid and been overlaid on top of the
deformed supine (red) and target (cyan) cylindrical images.
8.2.11 DEALING WITH COLONIC UNDER-DISTENSION
Despite optimal CTC technique (mechanical CO2 insufflation, spasmolysis etc.)(30) , segments
of colonic collapse occur, particularly when the patient changes position from supine to
prone(288). Furthermore, residual colonic fluid due to suboptimal bowel preparation can
occlude the colonic lumen. This situation is encountered commonly in daily practice; data from
the ACRIN CTC trial (16) suggest collapse and distension affect approximately 50% of
colonography cases (288). Consequently, the segmentation process described above (p151)

1 5 9
will extract a discontinuous luminal volume and hence multiple segments for endoluminal
surface extraction. Many vendor workstations allow the radiologist to manually select the
order in which these disjointed colonic segments lie along the centreline.
Figure 33 illustrates one such patient with distal colonic collapse (or luminal occlusion by fluid
residue) in the supine dataset.
Figure 33: A case where the descending colon is collapsed in the supine position (marked, right
image) but fully distended in the prone (left).
It follows that any registration method relying upon the distance along the centreline will be
hindered by a discontinuous colonic lumen unless the length of the ‘missing’ segment can be
calculated and interpolated. Furthermore, even if algorithms are developed to estimate the
length of the collapsed segment, complex biomechanical models are required to calculate the
potential length of this region when fully distended. Nonetheless, some centreline-based
methods appear to overcome local colonic collapse to register with reasonable accuracy (289-
291). However, centreline algorithms provide only a 1D correspondence from which to begin
searching for pathology; the focus of this Chapter is providing 3D, voxel-level correspondence.
At the time of writing, only Suh et al. (292) have published 3D registration results in cases with

1 6 0
luminal collapse; they report limited accuracy. This subject is discussed in further detail in
Chapter 11.
The algorithm version validated later in this Chapter relied upon manual delineation of
collapsed segments (Figure 34). Subsequent algorithm development and integration into a
feature-based initialisation has overcome this limitation and is the focus of Chapter 9.
Figure 34: Cylindrical representation as raster images of the collapsed supine (top), prone (middle)
and deformed supine (bottom) endoluminal colon surface. The length of the collapsed segment (solid
black bar) is interpolated manually in this version of the algorithm. Note the accuracy of polyp
alignment (white arrows) is unaffected by the luminal discontinuity in this instance.
8.3 METHODS: VALIDATION
Ethical permission was obtained to utilise anonymised CTC data acquired as part of routine day-
to-day clinical practice at University College Hospital, London. CTC had been performed in
accordance with consensus recommendations(30) and any abnormality subsequently validated
via optical colonoscopy. Initially, to ensure spatial correspondence could be achieved across
complete endoluminal surfaces, we selected 24 patients with optimal colonic cleansing and
distension. While cases with minimal colonic residue were included, cases with homogenous
faecal tagging were preferred; digital cleansing enabled continuous segmentation around the
full colonic lumen as described above (p151). Cases were chosen with a widespread
distribution of polyps to enable assessment of registration over the entire endoluminal surface.

1 6 1
The datasets were subdivided into 12 development sets and 12 validation sets by random
permutation. During development, difficulty with visual identification of corresponding
features in cylindrical image representations was noted for some cases. Further examination
revealed this was due to either large differences in colonic distension between the prone and
supine data or to insufficient fluid tagging, causing endoluminal surface artefacts. Large
differences in distension can lead to dissimilarity of surface features (such as distorted haustral
folds) and this can also influence conformal mapping. For example, Figure 35 and Figure 36
show such a case with marked differences in cylindrical representations, resulting from
differing distension. Visual inspection of the surface representations led to exclusion of 4
development datasets with marked differences in local distension. Moreover, 4 validation set
cases were excluded on the same grounds resulting in a total of 8 data sets with continuous
colonic segmentations for validation.
Figure 35: Marked distension discrepancy changes the shape index of the cylindrical representations
in supine (top) and prone (bottom). 3D renderings are shown below
Figure 36: Differing distension in prone and supine acquisitions causes dissimilar local features in the
cylindrical images.

1 6 2
A further 5 cases with local colonic collapse were selected for validation providing the 3D
endoluminal surfaces S were judged visually to have sufficiently similar distension in the non-
collapsed regions. This selection process resulted in a total of 13 cases (8 fully connected sets
and 5 with local colonic collapse)for validation using polyps and haustral fold reference points
as described in the following paragraphs.
8.3.1 VALIDATION USING POLYP REFERENCE POINTS
The author preformed a directed search for polyps in both prone and supine CTC scans using
multi-planar reformats and endoscopy reference data. Coordinates describing the endoluminal
surface location of polyps were derived by modifying the approach of Yushkevich (293): Using a
segmentation tool for medical images, ITK-SNAP (www.itksnap.org), the author manually
circumscribed each polyp, frame-by-frame, on both acquisitions providing corresponding prone
and supine endoluminal surface coordinates to test the algorithm Figure 37.
Figure 37: Delineating 3D polyp volumes using ITK-snap, a tool for segmentation of medical images.
Note the 3cm caecal mass is overlaid by a red mask. Such volumes can be mapped onto the cylindrical
representations to test algorithm registration accuracy.

1 6 3
The author manually labelled polyp masks in the prone and supine data by visual inspection of
the unfolded cylindrical representations. Prior to registration, polyps were masked in the 2D
cylindrical images I as shown in Figure 38 thus preventing polyps’ surface features from
influencing the results.
.
Figure 38: Masking polyps to ensure they do not influence subsequent registration: polyps in unfolded
view (left). Masked polyps (right) to be ignored in registration. The centre of mass c which is used as a
reference point is marked (white cross)
To calculate registration accuracy, a single point correspondence ),( yxc was chosen at the
centre of each polyp on the 2D representations. These points lie on the surfaces pS and sS
respectively and approximate closely to the polyp apex (Figure 38, right). Each 2D reference
point ),( yxc corresponds to a 3D point ),,( zyxci on the endoluminal surface S . Therefore,
each polyp reference point sc on the supine endoluminal surface sS was transformed using the
3D mapping function psT to find the corresponding point sps cT on corresponding prone
endoluminal surface pS . The 3D Euclidean distance to pc , on surface pS is the gross 3D
registration error.
All 8 datasets used to refine the algorithm had clearly corresponding features in both prone
and supine 2D representations, as shown in Figure 31. By using a ‘heatmap’ approach to
display surface curvature intensity (shape index) information, folds and polyps are readily
conspicuous as yellow-red areas whereas relatively featureless intervening haustration is

1 6 4
shown as blue-green. Likewise, following cylindrical B-spline registration, the corresponding
features are well aligned (Figure 31, bottom). The registration results are shown in Figure 39
and Figure 40
Figure 39: Overlay of masked out polyps before (left) and after (right) B-spline registration. The prone
image is coloured red with a yellow polyp mask, and the supine is coloured cyan with a blue polyp
mask. After establishing spatial correspondence, aligned features display gray and the overlapping
region of polyp masks in green.
Figure 40: Polyp localisation after registration using the prone (left) and supine (right) virtual
endoscopic views. The black dot shows the resulting correspondence in the 2D (bottom) and 3D (top)
renderings.

1 6 5
Having optimised the registration parameters using the development patient data, the
algorithm was locked for further tuning during this validation phase.
Table 28 shows the results of assessing the registrations using the polyps from all 13 validations
sets. The error after simply mapping the endoluminal surfaces to cylinders is the Polyp
Parameterisation Error ( PPE ) and the error following B-spline registration is denoted Polyp
Registration Error ( PRE ). The PPE results confirm that cylindrical parameterisation in
isolation is insufficient to align the datasets with precision; non-rigid B-spline registration is
required for accurate alignment. Indeed, following full surface registration, the PRE achieved
a mean error of 5.7mm (SD 3.4mm) across all validation polyps; all 13 polyps were well aligned.
This result suggests the registration algorithm could successfully direct the radiologist to a
mural location close to the true corresponding endoluminal point, even in the case of local
colonic collapse. Reassuringly, the mean registration error (PRE) over 9 polyp correspondences
following registration of the 8 development cases was 6.6 mm(SD 4.2mm) and therefore
slightly higher than mean error in the validation set, to which the algorithm was naive.
8.3.2 VALIDATION OF SPATIAL CORRESPONDENCE USING ANATOMICAL LANDMARKS
Polyps can provide reliable corresponding point coordinates with which to test registration
accuracy. Indeed, the apex of a small, sessile polyp likely provides the most robust landmark in
vivo. However, pedunculated polyps can undergo considerable deformation(294) and faecal
residue can complicate the observer task and reduce the accuracy of the reference standard.
Moreover, most patients have few (if any) polyps and these tend to reside within the distal
colorectum (295). Over 200 CTC cases were reviewed to select the data required for the
validation study described above and hence, in order to increase sample size, an extensive
database would need to be examined. This is explored in greater detail in later in this Thesis
(Chapter 11). However, all colonography datasets have alternative, surface features such as
haustral folds and flexures which can provide paired matching points over the entire
endoluminal surface. The algorithm designer, computer scientist Holger Roth, identified
haustral folds in both the prone and supine acquisitions of each validation dataset using a

1 6 6
graph-cut method developed by fellow computer scientist Tom Hampshire (outlined in Chapter
9). Using cylindrical representations to identify regions of likely correspondence and
endoluminal reconstructions for confirmation, the author manually matched an average of 90
pairs of matched haustral folds for each of the validation datasets described above. This
provided a total of 1175 matched folds pairs over all 13 prone and supine colonography
studies. The central point of each corresponding fold was calculated and used as a reference
point for assessing the registration.
Table 28: Registration error in mm for 13 polyps in the 13, paired colonography datasets used for
validation (the first 8 from optimally distended cases and the following 5 from patients with local
colonic collapse. The Polyp Parameterisation Error (PPE) gives the error in aligning the polyps after
cylindrical parameterisation but before registration, the Polyp Registration Error (PRE) gives the error
after surface registration.
Patient Polyp location Collapsed
location in prone
Collapsed
location in supine
PPE (mm) PRE (mm)
9 (optimal) AC none none 32.4 3.0
10 (optimal) Caecum none none 13.7 6.0
11 (optimal) Caecum none none 30.2 3.1
12 (optimal) Caecum none none 41.9 2.4
13 (optimal) DC none none 15.7 6.8
14 (optimal) AC none none 11.8 4.6
15 (optimal) DC none none 23.9 3.6
16 (optimal) AC none none 18.5 11.1
17 (collapsed) Caecum none 1 x DC 24.8 9.4
18 (collapsed) AC none 1 x SC 62.6 3.9
19 (collapsed) Rectum 1 x DC 1 x DC 55.9 6.0
20 (collapsed) Caecum 3 x (DC, SC) none 13.3 12.4
21 (collapsed) AC 1 x DC 1 x DC 39.0 1.5
Mean (mm) 29.5 5.7
SD (mm) 16.4 3.4
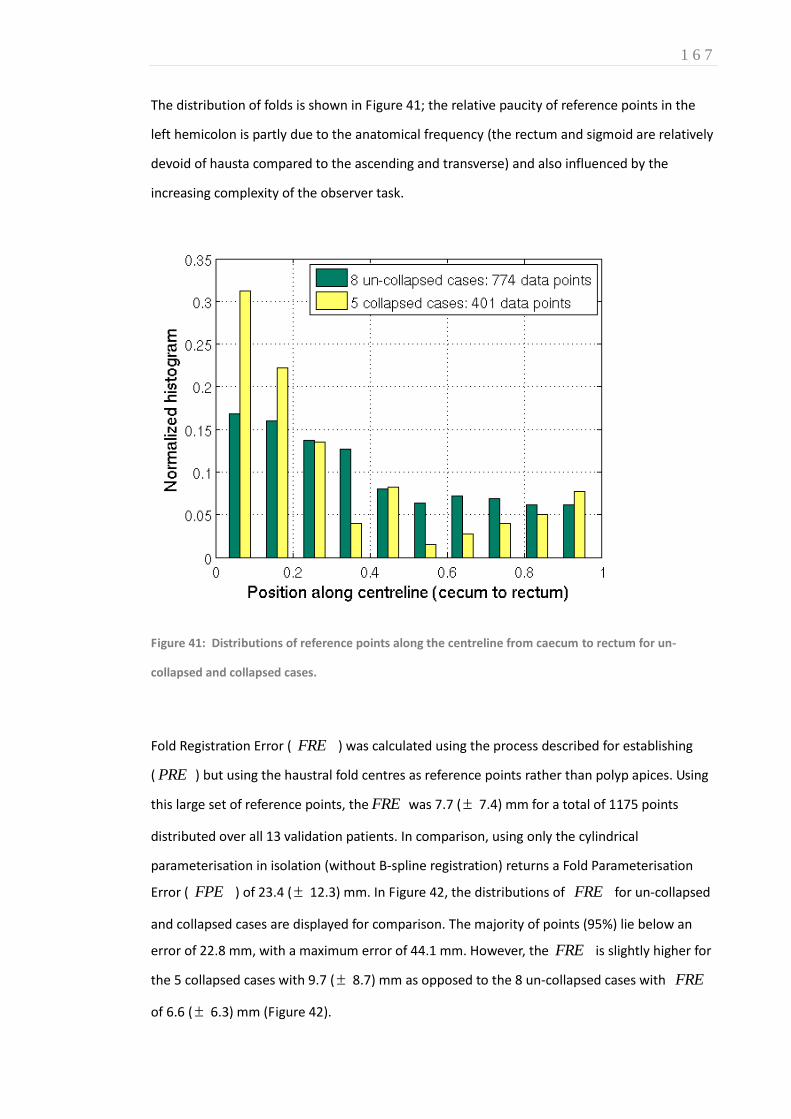
1 6 7
The distribution of folds is shown in Figure 41; the relative paucity of reference points in the
left hemicolon is partly due to the anatomical frequency (the rectum and sigmoid are relatively
devoid of hausta compared to the ascending and transverse) and also influenced by the
increasing complexity of the observer task.
Figure 41: Distributions of reference points along the centreline from caecum to rectum for un-
collapsed and collapsed cases.
Fold Registration Error ( FRE ) was calculated using the process described for establishing
( PRE ) but using the haustral fold centres as reference points rather than polyp apices. Using
this large set of reference points, the FRE was 7.7 ( 7.4) mm for a total of 1175 points
distributed over all 13 validation patients. In comparison, using only the cylindrical
parameterisation in isolation (without B-spline registration) returns a Fold Parameterisation
Error ( FPE ) of 23.4 ( 12.3) mm. In Figure 42, the distributions of FRE for un-collapsed
and collapsed cases are displayed for comparison. The majority of points (95%) lie below an
error of 22.8 mm, with a maximum error of 44.1 mm. However, the FRE is slightly higher for
the 5 collapsed cases with 9.7 ( 8.7) mm as opposed to the 8 un-collapsed cases with FRE
of 6.6 ( 6.3) mm (Figure 42).

1 6 8
Figure 42: Normalised histograms of the Fold Registration Error (FRE) distributions in mm using
reference points spread over the endoluminal colon surface for un-collapsed and collapsed cases.
The nature of the registration method ensures that any haustral fold is almost invariably
aligned with a haustral fold in the corresponding dataset. However, as the registration errors
outlined above confirm, alignment is not always to the correct, corresponding fold. However,
82% of all 1175 reference points were assigned correctly and 15% were misaligned by just one
fold. Furthermore, apparent misregistration is likely partly due to an imperfect reference
standard; the author can attest that the observer task was challenging and prone to reader
error. Avoiding this verification bias was the motivation for the porcine phantom experiment
described later in Chapter 10.
1 6 9
8.4 DISCUSSION
This Chapter describes the development and preliminary validation of a novel algorithm for
registering prone and supine CTC data to calculate corresponding endoluminal surfaces
locations. Implementing conformal mapping to convert the complex, convoluted 3-dimensional
colonic surface onto a cylindrical parameterisation, while preserving the surface curvature
information (via the Ricci Flow) simplifies prone-supine surface registration from a 3D to a 2D
task. Moreover, the addition of freeform deformation of these cylindrical parameterisations
using B-spline registration results in considerable improvements in point matching accuracy as
illustrated above. This process can establish accurate correspondence between the 2D
cylindrical parameterisations, and hence provide spatial correspondence over the full 3D
endoluminal surface despite the deformations and torsion that occurs during patient
repositioning; while overall colonic configuration undergoes large deformation the shape of
individual surface structures remains sufficiently similar to enable surface alignment.
During algorithm development 8 of the 24 ‘optimally distended’ cases contained extensive
regions where the surfaces structures differed markedly between the prone and supine
acquisitions. This was due to large differences in colonic distension or inhomogeneous fluid
tagging (precluding successful digital cleansing and leaving an air fluid level within the lumen).
The generalisability of the registration results is limited considerably by exclusion of these cases
as it is likely a large proportion of colonography is similarly distended in routine practice.
However, other methods presented in the literature that aim to generate 3D surface
correspondence (including feature based methods(282) and voxel based methods(43, 292)) are
also likely to encounter similar difficulties with cases where the surface features differ between
the two datasets. Nevertheless, the proportion of such cases observed in this study suggests
that such cases are not infrequent, and methods that can address these cases must be
developed to achieve maximum clinical benefit. This is the focus of the next Chapter.
A further consideration for clinically effective CTC registration is the relatively high prevalence
of cases containing at least one region of complete colonic collapse (or occlusion with retained,
untagged fluid). Preliminary results using 5 cases with collapse in at least one dataset achieved
promising results. Moreover, the data suggest the algorithm can overcome multiple collapses in
both views. Some centreline-based registration methods claim to handle regions of local

1 7 0
collapse, but these only give approximate correspondence based on the shape of the centreline
and are unable to provide 3D correspondence over the endoluminal surface. At the time of
writing, only one other research group has published 3D surface correspondence in collapsed
cases(292), with limited accuracy. Moreover, their validation cases each contained at least one
fully distended series.
This algorithm does rely upon high quality CTC surface data for accurate registration. Therefore,
pre-processing steps involving segmentation and topological correction were necessary to
extract suitable surfaces. Moreover, despite improved technical implementation of CTC over
recent years, poor cleansing, insufficient tagging and local under-distension remain common
problems in routine clinical practice (288) and this is likely to hinder the transferability of
registration performance described in this Chapter. Chapter 11 describes a more extensive
clinical validation study following integration of an additional algorithm described in Chapter 9.
During the preliminary validation phase, the algorithm required significant manual interaction.
In particular, providing colonic start- and end-points, correcting colonic segmentation,
excluding the insufflation catheter and performing a visual inspection of segmentation quality.
These steps have subsequently been automated as described in the following Chapters but it is
possible that human interaction contributed to the registration performance presented in this
Chapter. For example, when spanning collapsed segments, the interpolated segment was
estimated following visual inspection of the 2D parameterisations.
Another limitation that could inhibit clinical implementation of this algorithm is the duration
taken to process each case. For surface meshes of the size used in this study (approximately
60000 triangular faces), single processor implementation of the Ricci flow conformal mapping
currently takes several hours to achieve sufficient convergence. However, this is reminiscent of
early CAD systems, which had to process overnight yet now take only minutes. GPU-based
implementation(283) would reduce processing time considerably. Alternatively, other
conformal mapping methods could be used, e.g. (296), which require less computation time;
obtaining rapid cylindrical parameterisation was not the focus of this study. There have been a
number of alternative conformal mapping techniques presented in the literature (269, 270,
296), any of which could prove more suitable but this remains the subject of future research to
1 7 1
produce appropriate parameterisations in a clinically feasible time frame. In contrast to the
cylindrical parameterisation, the cylindrical B-spline registration provides a result within a few
minutes, which is fast enough to be clinically useful. Nonetheless, the results confirm there
remains a need for robust initialisation, superior to calculating flexure locations from local
maxima. This provides the focus of the next Chapter.
In conclusion, this Chapter describes a novel technique for aligning prone and supine CTC. The
method comprises conformal mapping of CT endoluminal surface features onto a cylindrical
surface, followed by a non-rigid registration of these features. This enables dense
correspondence throughout the extracted colonic surface with promising registration results
for polyp detection and for matching corresponding haustral folds on a limited sample of
colonography datasets. The following Chapters continue to build upon this with the
development of a haustral fold based initialisation algorithm (Chapter 10), testing and
optimisation using a porcine phantom (Chapter 9) and finally, clinical validation (Chapter 11)
using a large, publically available CTC archive.

1 7 2
CHAPTER 9: 9. AUTOMATED PRONE TO SUPINE HAUSTRAL FOLD MATCHING USING A MARKOV RANDOM FIELD MODEL
AUTHOR DECLARATION
Research presented in this Chapter was published in: Hampshire T, Roth H, Hu M, Boone D et
al. Automatic prone to supine haustral fold matching in CTC using a Markov random field
model. Med Image Comput Comput Assist Interv. 2011; 14(Pt 1):508-15 (297).
Thomas Hampshire led this project under the supervision of Professor David Hawkes; technical
description and figures contained in this Chapter are reproduced with their kind permission.
The author’s collaboration involved establishing ethical approval, gathering CTC data for
algorithm testing and development, designing and performing the validation study, and editing
the manuscript. The author contributed clinical guidance during algorithm development;
programming and implementation were performed by collaborators.

1 7 3
9.1 INTRODUCTION
The results presented in Chapter 8 demonstrate that surface correspondence between prone
and supine CTC datasets can be achieved using a combination of conformal endoluminal
surface mapping onto a cylindrical parameterisation followed by non-rigid registration.
Moreover, preliminary validation showed promising performance. However, the study was not
without limitations, not least the requirement for manual interaction which precludes efficient
integration into clinical practice and may influence registration results. Furthermore, while the
algorithm showed potential for overcoming regions of luminal collapse (Figure 43), cases with
differing distension were excluded from the analysis, which also limits the generalisability of
the results.
The focus of this Chapter is the design, development and initial validation of a separate
registration algorithm to identify and match corresponding haustral folds between CTC
datasets. The motivation is to provide robust, automated initialisation of the surface-matching
algorithm described in the preceding Chapter to facilitate implementation and enable
registration in a more heterogeneous sample of CTC studies.
Voxel based registration methods rely predominantly on surface feature similarities such as the
morphology of haustral fold complexes, flexures and other conspicuous mural structures.
Consequently they can be susceptible to misregistration of long, continuous sections due to
the similarities of (non-corresponding) neighbouring features.
This was noted during haustral fold-based validation described in Chapter 8: Short colonic
sections were misaligned by one or two haustral folds. Despite contributing little to gross
registration error, this could be relevant in clinical practice, particularly as pathology can be
concealed behind a fold. Moreover, in cases with luminal collapse such as those encountered
frequently in daily practice(288), registration error can be influenced by the manual interaction
required to bridge regions of missing data (Figure 43). During Chapter 8, surface
parameterisations were initially aligned by visual inspection and consequently, corresponding
surface points generally aligned to within approximately 20mm of each other, even prior to

1 7 4
Figure 43: External 3D rendered view of prone (left) and supine (right) datasets. The dotted line
indicates luminal collapse. The surface parameterisation (bottom) shows the conformally mapped
prone and supine surfaces around the sigmoid with a colour-coded ‘heat map’ representing shape
index intensity. Red areas indicate regions of collapse (Black lines show detected fold
correspondences). Note that the length of missing data was manually determined following visual
inspection of the surface features; interpolation with equivalent lengths would likely stress the non-
rigid registration process.
performing non-rigid registration. This degree of user interaction would not be appropriate in
clinical use and does not reflect how the algorithm would perform if fully automated. Although
relatively fixed colonic locations such as the flexures, caecum and anorectal junction can help
provide gross alignment between the datasets, simply extracting local maxima and minima can
result in differing anatomical landmarks. However, this issue is not unique to our registration
algorithm; other methods involving conformal mapping of the colonic surface have recently
been described which share similar limitations. For example, Zeng et al combined conformal
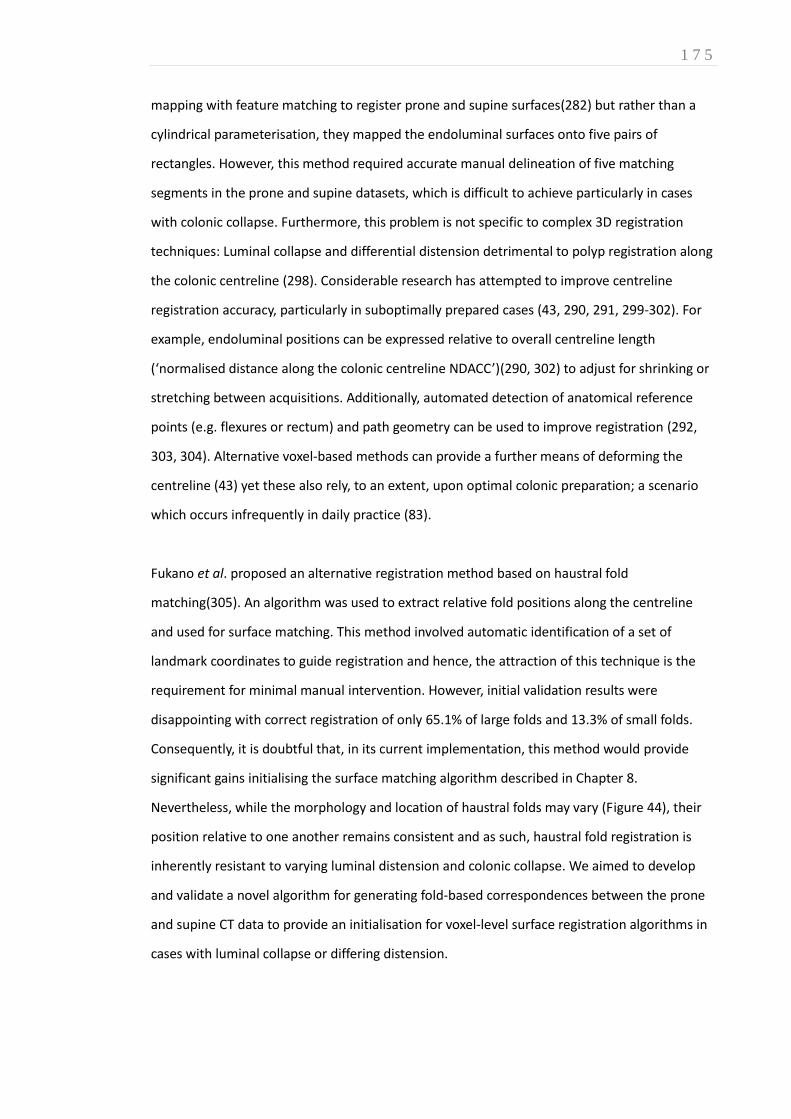
1 7 5
mapping with feature matching to register prone and supine surfaces(282) but rather than a
cylindrical parameterisation, they mapped the endoluminal surfaces onto five pairs of
rectangles. However, this method required accurate manual delineation of five matching
segments in the prone and supine datasets, which is difficult to achieve particularly in cases
with colonic collapse. Furthermore, this problem is not specific to complex 3D registration
techniques: Luminal collapse and differential distension detrimental to polyp registration along
the colonic centreline (298). Considerable research has attempted to improve centreline
registration accuracy, particularly in suboptimally prepared cases (43, 290, 291, 299-302). For
example, endoluminal positions can be expressed relative to overall centreline length
(‘normalised distance along the colonic centreline NDACC’)(290, 302) to adjust for shrinking or
stretching between acquisitions. Additionally, automated detection of anatomical reference
points (e.g. flexures or rectum) and path geometry can be used to improve registration (292,
303, 304). Alternative voxel-based methods can provide a further means of deforming the
centreline (43) yet these also rely, to an extent, upon optimal colonic preparation; a scenario
which occurs infrequently in daily practice (83).
Fukano et al. proposed an alternative registration method based on haustral fold
matching(305). An algorithm was used to extract relative fold positions along the centreline
and used for surface matching. This method involved automatic identification of a set of
landmark coordinates to guide registration and hence, the attraction of this technique is the
requirement for minimal manual intervention. However, initial validation results were
disappointing with correct registration of only 65.1% of large folds and 13.3% of small folds.
Consequently, it is doubtful that, in its current implementation, this method would provide
significant gains initialising the surface matching algorithm described in Chapter 8.
Nevertheless, while the morphology and location of haustral folds may vary (Figure 44), their
position relative to one another remains consistent and as such, haustral fold registration is
inherently resistant to varying luminal distension and colonic collapse. We aimed to develop
and validate a novel algorithm for generating fold-based correspondences between the prone
and supine CT data to provide an initialisation for voxel-level surface registration algorithms in
cases with luminal collapse or differing distension.

1 7 6
Figure 44: Endoluminal CTC showing morphologically disparate corresponding folds in the prone (left)
and supine (right). The complexity of the observer task and thus the likely imperfect reference
standard results from uncertainty matching folds such as these where there are no other contributory
surface features (such as diverticula).
9.2 METHODS: ALGORITHM DEVELOPMENT
9.2.1 CTC SAMPLE SELECTION
Separate development and validation CTC datasets were selected from the collection accrued
during development of the algorithm described in Chapter 8. Cleansing and insufflation had
been performed in all cases according to best-practice recommendations(30). Ethical approval
was obtained to use these patient data to develop the additional algorithm. As previously
described, all patients provided informed consent; data were anonymised. In total, all 13
validation cases were retained to test this new algorithm. A random selection of 5 development
cases was selected to tune algorithm parameters.
1 7 7
9.2.2 ALGORITHM DESCRIPTION
Unlike previous methods (282, 305), which have attempted to match corresponding folds based
on spatial location and size alone, we aimed for this algorithm to incorporate endoluminal
visual renderings in addition to local geometric information. The proposed matching problem is
modelled using a Markov Random Field (MRF) and the maximum a posteriori labelling solution
is estimated to provide correspondence.
9.2.3 ENDOLUMINAL SURFACE PREPARATION
The procedure for digital cleansing, colonic segmentation, topological correction and extraction
of the endoluminal surface from prone and supine CTC data is described previously in Section
8.3. Multifaceted triangulated surfaces meshes (approximately 60000 faces), were again
constructed using Lorensens’s ‘marching cubes’ algorithm(276). However, the present
algorithm has no requirement for 2D surface parameterisation (for example, by implementing
the Ricci flow conformal mapping algorithm) and can be performed in 3D space. This avoids
introducing similar limitations to those described in the preceding Chapter.
9.2.4 GRAPH CUT HAUSTRAL FOLD SEGMENTATION
As haustral folds are elongated, mural protrusions, they can be identified by examining surface
curvature measurements from an endoluminal surface reconstruction. Maximum ( 1k ) and
minimum ( 2k ) values of the normal curvature at any point are known as the principal
curvatures. At the centre of a fold, 0>>1k and 02 k . Therefore, the metric
||||= 21 kkM can classify each vertex on the endoluminal mesh as belonging to a fold, or
otherwise. The parameter penalises the metric against curvature in any direction other than
in the maximum, to separate the folds at the teniae coli. Thereafter, the surface mesh is
considered as a graph, with the vertices comprising the nodes and triangles edges defining the
graph edges. A graph cut segmentation(306) is thus performed differentiating folds from non-
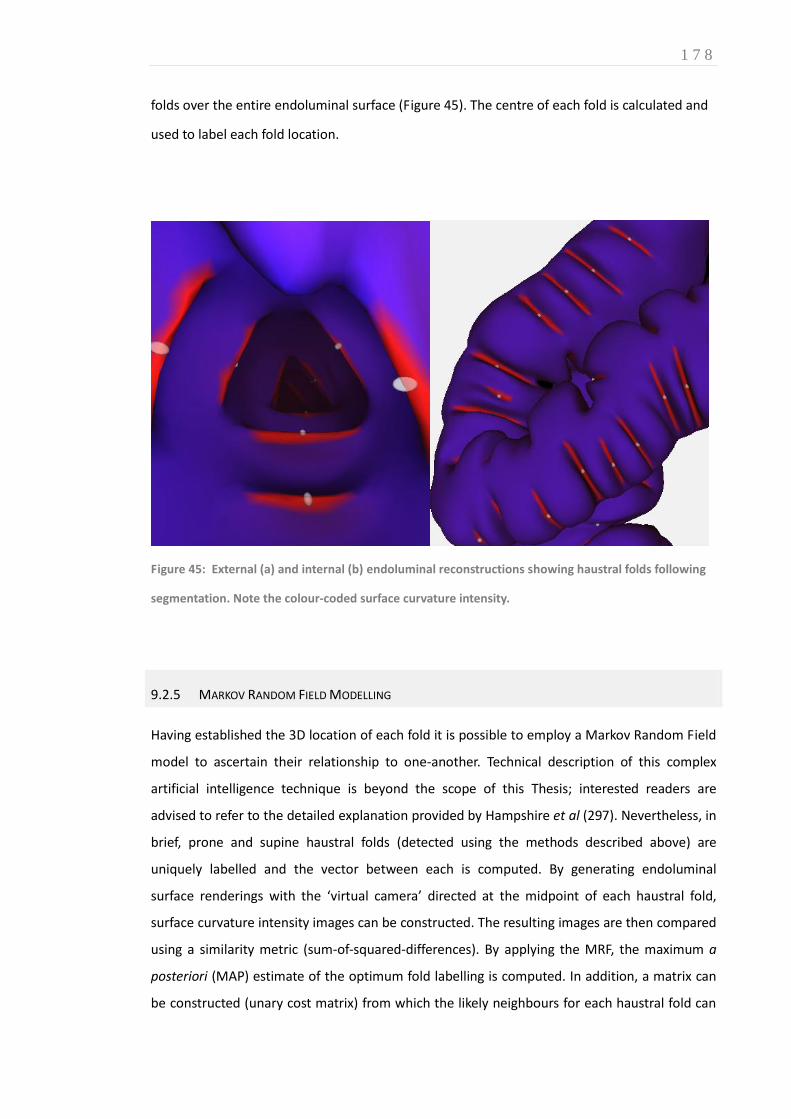
1 7 8
folds over the entire endoluminal surface (Figure 45). The centre of each fold is calculated and
used to label each fold location.
Figure 45: External (a) and internal (b) endoluminal reconstructions showing haustral folds following
segmentation. Note the colour-coded surface curvature intensity.
9.2.5 MARKOV RANDOM FIELD MODELLING
Having established the 3D location of each fold it is possible to employ a Markov Random Field
model to ascertain their relationship to one-another. Technical description of this complex
artificial intelligence technique is beyond the scope of this Thesis; interested readers are
advised to refer to the detailed explanation provided by Hampshire et al (297). Nevertheless, in
brief, prone and supine haustral folds (detected using the methods described above) are
uniquely labelled and the vector between each is computed. By generating endoluminal
surface renderings with the ‘virtual camera’ directed at the midpoint of each haustral fold,
surface curvature intensity images can be constructed. The resulting images are then compared
using a similarity metric (sum-of-squared-differences). By applying the MRF, the maximum a
posteriori (MAP) estimate of the optimum fold labelling is computed. In addition, a matrix can
be constructed (unary cost matrix) from which the likely neighbours for each haustral fold can

1 7 9
be determined (i.e. the probability that folds neighbour one-another) to drive registration.
Development datasets were used to optimise algorithm parameters and no training took place
using validation data
9. 3 METHODS: VALIDATION
9.3.1. VALIDATION USING HAUSTRAL FOLD MATCHING
The validation dataset used to test haustral fold matching accuracy consisted of the same cases
used for validation in Section 8.3, with 13 patient cases, 5 of which contained at least one
region of luminal discontinuity, either due to suboptimal distension or excess retained fluid.
Likewise, the process by which the author manually identified corresponding haustral fold pairs
is described in detail in Section 8.3.2. Consequently, coordinates for 1175 matching fold pairs
were recorded over 13 datasets, 5 of which contained at least one region of local colonic
collapse in one or both acquisitions. To assess the degree of intra-observer variability, after a
period of three months, the author repeated the matching exercise using a random selection of
three colonography datasets. Fold matching accuracy was assessed by comparing the
correspondences generated by the algorithm with the reference standard points provided by
the author.
9.3.2. IMPROVING ACCURACY OF THE SURFACE REGISTRATION ALGORITHM BY FOLD BASED INITIALISATION
The results of this fold matching algorithm provided automated initialisation for the surface-
based registration technique described in Chapter 8. The fold positions identified by this
algorithm are mapped onto the surface parameterisations described previously to enable
linear scaling between haustral folds in the direction of the centreline. This step is performed
prior to B-spline registration and effectively automates the alignment which previously
performed manually (potentially introducing bias). Using this enhanced initialisation, the
surface registration is compared to polyp and fold-based reference points in an identical
manner to that described in Section 8.3 providing 3D Euclidean registration error that can be
compared in using a Related Samples Wilcoxon Signed Rank Test to those reported previously
in Chapter 8.
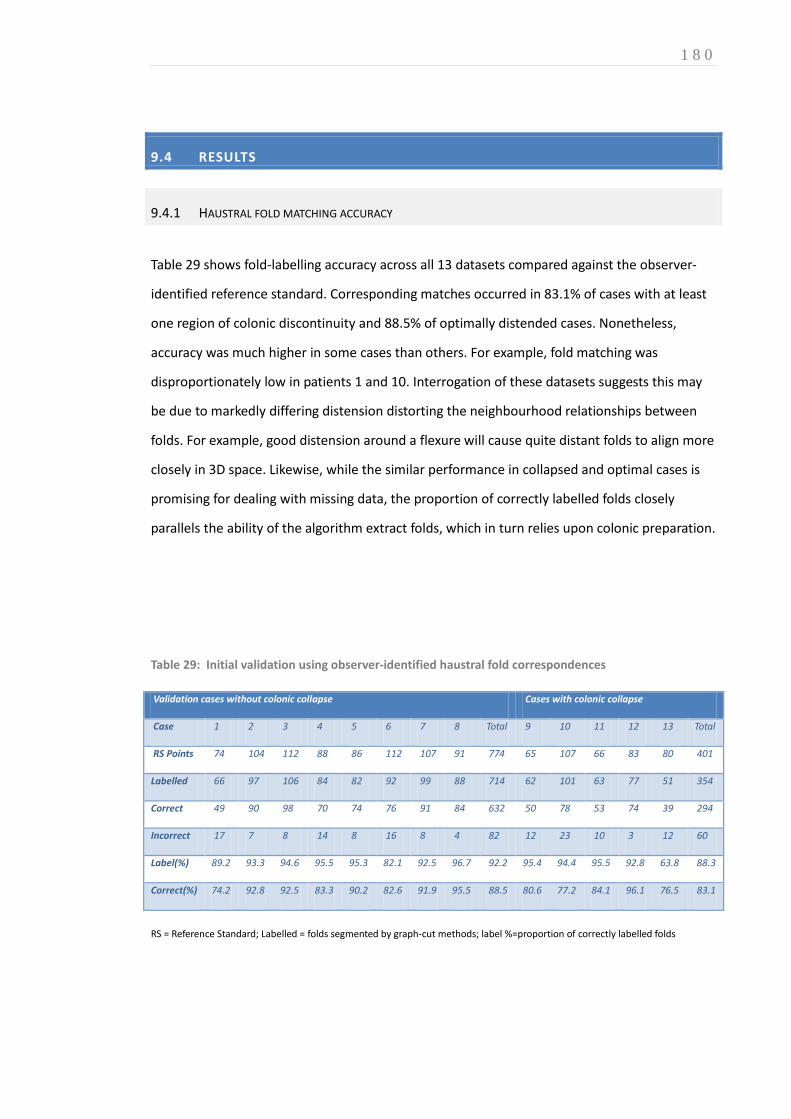
1 8 0
9.4 RESULTS
9.4.1 HAUSTRAL FOLD MATCHING ACCURACY
Table 29 shows fold-labelling accuracy across all 13 datasets compared against the observer-
identified reference standard. Corresponding matches occurred in 83.1% of cases with at least
one region of colonic discontinuity and 88.5% of optimally distended cases. Nonetheless,
accuracy was much higher in some cases than others. For example, fold matching was
disproportionately low in patients 1 and 10. Interrogation of these datasets suggests this may
be due to markedly differing distension distorting the neighbourhood relationships between
folds. For example, good distension around a flexure will cause quite distant folds to align more
closely in 3D space. Likewise, while the similar performance in collapsed and optimal cases is
promising for dealing with missing data, the proportion of correctly labelled folds closely
parallels the ability of the algorithm extract folds, which in turn relies upon colonic preparation.
Table 29: Initial validation using observer-identified haustral fold correspondences
Validation cases without colonic collapse Cases with colonic collapse
Case 1 2 3 4 5 6 7 8 Total 9 10 11 12 13 Total
RS Points 74 104 112 88 86 112 107 91 774 65 107 66 83 80 401
Labelled 66 97 106 84 82 92 99 88 714 62 101 63 77 51 354
Correct 49 90 98 70 74 76 91 84 632 50 78 53 74 39 294
Incorrect 17 7 8 14 8 16 8 4 82 12 23 10 3 12 60
Label(%) 89.2 93.3 94.6 95.5 95.3 82.1 92.5 96.7 92.2 95.4 94.4 95.5 92.8 63.8 88.3
Correct(%) 74.2 92.8 92.5 83.3 90.2 82.6 91.9 95.5 88.5 80.6 77.2 84.1 96.1 76.5 83.1
RS = Reference Standard; Labelled = folds segmented by graph-cut methods; label %=proportion of correctly labelled folds

1 8 1
9.4.2 INITIALISATION OF THE SURFACE BASED REGISTRATION METHOD
The results for cases with and without colonic collapse are shown in Table 30 using the same
reference standard as for the previous experiment. Initialisation significantly improved
registration in cases with colonic collapse, decreasing mean error from 9.7mm (SD 8.7mm) to
7.7mm (SD 7.1mm) (p=0.009). However in cases with optimal colonic distension, the mean
error was unchanged at 6.6mm (p=0.317). This suggests that the fold matching algorithm
enhances surface-based registration in cases of poor insufflation but cannot improve upon the
surface-based registration in well prepared data.
Table 30: Surface registration initialisation with non-collapsed cases. The number of Reference
Standard (RS) points are shown. Error 1 and 2 show the error of the surface-based registration without
and with using points as an initialisation.
Without colonic collapse With colonic collapse
Case 1 2 3 4 5 6 7 8 Total 9 10 11 12 13 Total
RS Points 74 104 112 88 86 112 107 91 774 65 107 66 83 80 401
Error 1 (mm) 11.5 8.6 5.3 5.7 5.5 5.2 5.8 6.7 6.6 12.2 6.5 7.8 13.5 9.6 9.7
Error 2 (mm) 11.5 7.2 5.5 5.7 5.8 5.5 6.1 6.9 6.6 7.9 5.8 7.8 8.7 9.1 7.7
Difference(
mm)
0.0 1.4 0.2 0.0 0.3 0.3 0.3 0.2 0.0 -4.3 0.7 0 -4.8 0.5 -2
9.5 CONCLUSION
The initial motivation behind developing this fold-matching algorithm was to align folds
detected at colonoscopy with those extracted from CTC data (research which remains ongoing).
However, it was apparent that this algorithm, although unable to provide dense, voxel-level
surface correspondence, could overcome some of the limitations inherent in the surface
matching software described in Chapter 8 and that applying the algorithms together could
improve registration. Indeed, applying this method to initialise the surface-based registration

1 8 2
technique appears to reduce registration error. However, the main limitation of this study
stems from the author’s imperfect reference standard; repeated observations performed on
three random validation sets showed intra-observer agreement of 85.3%. Moreover, the when
the fold matching exercise was recently repeated by collaborators Dr Andrew Plumb and Dr
Emma Helbren (307) resulting inter-observer agreement was 87.8 % and 80% compared to
repeated fold matching in consensus with the algorithm designer, Tom Hampshire. It is difficult
to conceive a more reliable in vivo reference standard and hence a reliable ground truth is
required. An in vitro study using a colonic phantom is likely to be required and this is the focus
of the following Chapter.
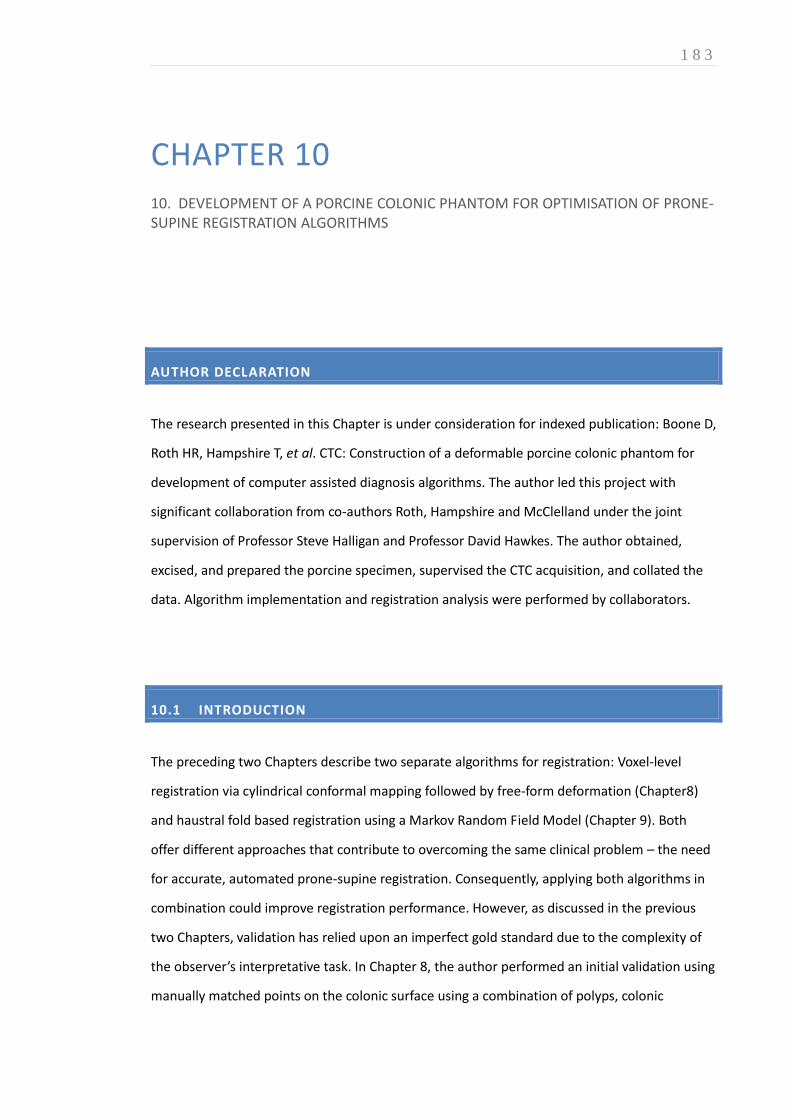
1 8 3
CHAPTER 10 10. DEVELOPMENT OF A PORCINE COLONIC PHANTOM FOR OPTIMISATION OF PRONE-SUPINE REGISTRATION ALGORITHMS
AUTHOR DECLARATION
The research presented in this Chapter is under consideration for indexed publication: Boone D,
Roth HR, Hampshire T, et al. CTC: Construction of a deformable porcine colonic phantom for
development of computer assisted diagnosis algorithms. The author led this project with
significant collaboration from co-authors Roth, Hampshire and McClelland under the joint
supervision of Professor Steve Halligan and Professor David Hawkes. The author obtained,
excised, and prepared the porcine specimen, supervised the CTC acquisition, and collated the
data. Algorithm implementation and registration analysis were performed by collaborators.
10.1 INTRODUCTION
The preceding two Chapters describe two separate algorithms for registration: Voxel-level
registration via cylindrical conformal mapping followed by free-form deformation (Chapter8)
and haustral fold based registration using a Markov Random Field Model (Chapter 9). Both
offer different approaches that contribute to overcoming the same clinical problem – the need
for accurate, automated prone-supine registration. Consequently, applying both algorithms in
combination could improve registration performance. However, as discussed in the previous
two Chapters, validation has relied upon an imperfect gold standard due to the complexity of
the observer’s interpretative task. In Chapter 8, the author performed an initial validation using
manually matched points on the colonic surface using a combination of polyps, colonic
1 8 4
diverticula and folds. The task was technically challenging and blinded repeat matching
(following a period of washout) revealed an intra-observer error of 8.2mm (SD 12.5 mm). Not
only does this reinforce the difficulties encountered in clinical practice when attempting to find
matching endoluminal locations, it also suggests the algorithms’ true performance could have
been underestimated due to verification bias. Moreover, lack of a suitable reference standard
for testing both algorithms hinders accurate assessment of the incremental benefit of applying
the algorithms in combination. A colonic phantom containing fixed reproducible landmarks
would facilitate matching of anatomical locations despite colonic deformation and provide a
robust ‘ground truth’ against which to test both algorithms. This enabled development of a
combined registration algorithm prior to formal clinical validation in patients (Chapter 11)
While a human specimen would be preferable, panproctocolectomy is usually carried out for
severe colitis, cancer or multiple polyposis syndromes – all of which render the specimen
potentially unsuitable for our purposes. Porcine colon is readily available and morphologically
similar to human colon, albeit with less haustration, and some ethical issues are avoided. For
this reason it is used extensively in optical colonoscopy training(308) and CTC research(309,
310). However, specific to this phantom experiment, the specimen must be constrained in such
a way that the haustral fold pattern is not disrupted. Distension reduces mural thickness (which
is of the order of 1-4mm) so to provide suitable CT contrast resolution, the specimen is
generally immersed in fluid of similar attenuation value to abdominal tissue. However, the
insufflated colon is buoyant; previous phantom studies have overcome this by submerging the
specimen under bags of normal saline(309). However, this inevitably deforms colonic
morphology and distorts haustral configuration. Ideally, therefore, the porcine colonic phantom
should conform naturally with minimal extrinsic deformation.
The aim of the study therefore was to construct a porcine colonic phantom labelled with
radiopaque markers along its length, and to image it in a variety of orientations to simulate in-
vivo colonic deformation that takes place during prone to supine repositioning. Furthermore,
the colon must be constrained such that the haustral pattern remains consistent.

1 8 5
10.2 MATERIALS AND METHODS
10.2.1 SPECIMEN PREPARATION
Porcine bowel was obtained (Humphries’ Slaughterhouse, Brentwood, Essex) from a pig
previously slaughtered for human consumption (Figure 46).
Figure 46: Unprepared porcine intestinal specimen from an
animal slaughtered for human consumption. The colonic
specimen remains distended due to (extensive) retained
residue at this stage. Note the haustral fold pattern is not
dissimilar to human colon.
The author excised the colon, washed, trimmed and sutured the specimen (Figure 47). The
distal end was sutured using a purse-string around the rectal insufflation catheter (Trimline DC;
E-Z-Em, Westbury, NY) and the proximal end closed with continuous blanket sutures using 2/0
Vicryl (Ethicon Endo-Surgery, Cincinnati, Ohio) (Figure 48).
Figure 47: Excised, cleansed colonic specimen with short residual terminal ileum
Figure 48: Specimen sutured at each end with indwelling insufflation catheter in situ

1 8 6
Wound closure clips (3M™ Precise™) were placed evenly along the serosal surface of specimen
to act as radiopaque markers for the subsequent registrations (Figure 49).
Figure 49: The colonic specimen is distended with
water via the insufflation catheter to enable
placement of radiopaque markers. Although not
placed endoluminally, the colonic wall is sub-
millimetre thickness at this degree of distension.
Having tested the colonic anastamotic integrity by insufflation to 40mmHg underwater (Figure
50), the specimen was placed inside an acrylic 60 denier stocking, into which loops of suture
material were attached via radiopaque plastic hooks, orientated to approximate in vivo colonic
configuration . In particular, the flexures, rectum and caecum were relatively immobile with
respect to the transverse colon. The prepared colon was placed inside a 500 x300x300mm
sealable plastic crate and transferred to the CT scanning suite (Figure 51).
Figure 50: Colonic specimen distended at 40mmHg to test integrity
Figure 51: Colonic specimen placed within its artificial ‘mesentery’

1 8 7
The crate was filled with 20 L of 0.9% saline to which 60 ml of diatrizoate meglumine containing
370 mg of iodine per millilitre has been added (Gastrografin; Schering Health Care, Burgess Hill,
West Sussex, England), resulting in an average attenuation value of approximately 40 HU,
similar to that of human abdominal tissue(66). The specimen was inflated with CO2 via an
automated insufflator (MediCO2lon, Medicsight Plc), until sufficiently distended (Figure 52).
Figure 52: The buoyant insufflated colonic
specimen, suspended via the ‘artificial mesentery’
has minimal haustral deformation. The ‘mesenteric
attachments’ can be adjusted to simulate the
deformation during positional change from prone to
supine.
10.2.2 IMAGING
Multi-detector CT was be performed by Heena Patel and Elaine Atkins using a SOMATOM
Sensation 64 machine (Siemens, Germany), with routine CTC acquisition parameters; 0.6mm
collimation, 120KV, 150mAs, pitch 0.75, reconstruction thickness 1mm with 50% slice overlap.
After the initial scan, the specimen was deformed by adjusting the position of its ‘mesenteric
attachments’ (sutures attached to the base of the crate) to simulate prone to supine
repositioning and rescanned using identical parameters.
10.2.3 IMAGE ANALYSIS
Images were transferred to a 3D CTC workstation, MedicRead™ 3.0 (Medicsight Plc,
Hammersmith, London, UK) and segmentation performed for endoluminal review (Figure 53).
Using multiplanar reformats, the radiopaque markers were identified and 3D coordinates
recorded serially from the rectum to the caecum for each colonography dataset. Computer
scientists, Holger Roth and Tom Hampshire applied the algorithms to all five datasets, providing

1 8 8
ten individual permutations with which to test the algorithm. 3D error for each point
correspondence was calculated following surface registration (Chapter 8), first in isolation and
then following haustral fold-based initialisation (Chapter 9). The radiopaque markers were
masked to avoid influencing the registration process.
Figure 53: CTC of porcine phantom. Note the
relatively sparse haustral folds but the overall
similarity with less densely haustrated human
colonic segments such as rectum and sigmoid.
10.2.4 STATISTICAL ANALYSIS
Mean registration error followed a parametric distribution; a paired t-test statistic was used to
compare error before and after feature-based initialisation.
10.3 RESULTS
Overall, 5 porcine CTC datasets with differing deformation were obtained, enabling 10 separate
comparisons, each with coordinates for 12 radiopaque markers (Figure 54 and Figure 55). In
each case, the algorithm was able to register the endoluminal surface, resulting in 120 paired
point correspondences with which to test registration accuracy.

1 8 9
Figure 54: Porcine colonography acquisitions A through to E (left to right). While haustral fold
morphology remains similar, there is considerable deformation within the mid-transverse colon and
differential distension at the rectal and caecal ends. Performing registrations between each dataset
provided 10 permutations with which to test the algorithm.
Following registration without fold-based initialisation, mean 3D registration error (standard
deviation; SD) over all 120 points was 24.7mm (36.8mm), with a median error of 5mm (range
0.4 to 146.2mm). Individual registration results are displayed in (Table 31).
Table 31: Gross registration error for endoluminal surface registration algorithm (Chapter 8) applied to
of porcine colonic phantom CTC data without feature-based initialisation algorithm (Chapter 9)
Combination: A to B A to C A to D A to E B to C B to D B to E C to D C to E D to E
Mean 56.00 4.57 9.44 8.82 17.50 56.70 59.10 16.18 14.35 4.11
SD 47.64 2.98 15.13 15.18 33.12 46.67 50.34 20.56 21.93 3.75
Median 63.36 4.17 3.31 2.59 4.20 65.26 62.93 7.99 4.71 2.38
Min 2.52 0.86 0.50 0.45 0.53 1.77 1.12 0.73 2.37 1.01
Max 146.18 11.57 48.51 42.00 98.07 122.24 142.69 57.65 62.89 12.01

1 9 0
Figure 55: Surface rendered CTC of porcine colonic phantom showing distribution of radiopaque
markers and correspondence error vectors following registration of endoluminal surfaces A to C.
Following fold based initialisation, there was a significant reduction in mean Euclidean 3D
registration error to 4.9mm (SD 4.0mm) with a median error of 3.7mm (range 0.12 to 23.0mm)
(p=0.024) (Table 32). In particular, the highest mean pre-initialisation error (greater than 2
standard deviations from the mean) obtained when registering endoluminal surface B (A to B,
B to D and B to E) reduced to within 1 SD of the mean following initialisation (Figure 56).
1 9 1
Table 32: Comparison of registration error with and without feature-based initialisation when
registering porcine colonic phantom CTC datasets.
Combination Registration error without fold-based initialisation
(mm)
Registration error with fold-based initialisation
(mm)
A to B 56.00 4.61
A to C 4.57 4.96
A to D 9.44 4.63
A to E 8.82 2.73
B to C 17.50 4.01
B to D 56.70 4.58
B to E 59.10 4.28
C to D 16.18 8.24
C to E 14.35 6.59
D to E 4.11 4.48
Mean* 24.68 4.91
SD 36.77 4.03
Median 5.13 3.72
Range 0.45 to 146.18 0.12 to 23.03
*Significant reduction in registration error when fold-based registration algorithm is used to initialise
voxel-level surface registration (p=0.024)
Figure 56: Comparison of registration error with and without feature-based initialisation when
registering porcine colonic phantom CTC datasets. The marked increase in error when registering
surface B is likely due to artefact introduced during deformation.

1 9 2
10.4 DISCUSSION
Porcine phantom experiments have featured in CTC research since the 1990’s (66, 309-312).
Indeed, many technical acquisition parameters used in current clinical practice stem from the
early phantom studies described in Chapter 1. Nevertheless, this study posed unique
challenges, not least the requirement to maintain submersion of the insufflated colonic
specimen while minimising extrinsic haustral distortion. To the author’s knowledge, this is the
first description of a technique to constrain the in vitro colonic specimen yet facilitating the
realistic deformations required for testing prone-supine registration.
This colonic phantom study provided an objective ‘ground truth’ reference standard which
cannot be replicated in vivo and hence, should provide the most reliable estimate of algorithm
performance. However, the registration error of 24.7mm (SD 36.8mm) is disappointing when
compared to the mean polyp registration error of 5.1mm (SD 2.9mm) reported in Chapter 8.
However, this discrepancy is not surprising in retrospect because the endoluminal surface
algorithm relies upon strong surface features to drive the B-spline non-rigid transformation and
these are relatively sparse in the porcine colon as compared to the human colon. Nevertheless,
there was a significant improvement in registration accuracy when the fold-based registration
algorithm was used for initialisation. Although these results may not necessarily be reflected in
vivo, they are promising, particularly for improving registration in similarly featureless colonic
segments such as the left colon in many patients.
This study is not without limitations. The deformations applied to the phantom likely were not
as marked as those encountered in vivo during prone-supine repositioning. In particular, the
specimen was constrained such that colonic torsion was minimised. However, more extensive
deformations attempting to stress the registration algorithm were degraded by haustral
distortion due to the buoyancy of the insufflated specimen. An alternative solution to
submerging the gas-filled colon in water would be to fill the colonic specimen with water,
surrounded by room air. After inverting the image the gas/fluid contrast would allow
colonographic segmentation.

1 9 3
In summary, by constraining a submerged porcine colonic specimen via an ‘artificial mesentery,’
it is possible to construct a phantom suitable for assessing the accuracy of prone-supine
registration. Surface registration results were disappointing due to the relative paucity of
haustral folds in porcine colon but were satisfactory following integration of haustral fold-based
initialisation. It is likely that combining the registration algorithms described in Chapters 8 and
9 will enhance registration accuracy in vivo but this remains unquantified; clinical validation
using a representative sample of CTC datasets is required to infer the utility of these algorithms
in daily practice. This is the subject of the next Chapter.

1 9 4
CHAPTER 11: 11. COMPUTER ASSISTED SUPINE-PRONE REGISTRATION (CASPR): EXTERNAL CLINICAL VALIDATION
AUTHOR DECLARATION
The research presented in this Chapter was led and submitted for publication by the author:
Boone D, Halligan S, Roth H, et al. CT Colonography: External Clinical Validation of an Algorithm
for Computer Assisted Prone-Supine Registration. Radiology. 2013 Sep; 268(3):752-60.
The author obtained ethical approval, collated CTC data, constructed the reference standard,
manually circumscribed polyp volumes, and performed the clinical validation experiment with
collaborator Dr Emma Helbren. Algorithm programming and implementation were performed
by Holger Roth and Thomas Hampshire under the supervision of Professor David Hawkes. The
author compiled the manuscript under the supervision of Professor Steve Halligan and
Professor Stuart Taylor.
11.1 INTRODUCTION
As described thus far in this Section, we have developed and performed preliminary validation
of two separate registration algorithms and used a porcine phantom to combine them into
computer-assisted supine-prone registration software (CASPR) to indicate corresponding points
on the endoluminal surface of prone and supine acquisitions. The initialisation step (Chapter 9)
compares patterns of neighbouring haustral folds to establish landmark-based correspondence;
full 3D spatial correspondence is achieved by mapping the endoluminal surfaces to cylindrical
representations followed by non-rigid registration (Chapter 8). Having demonstrated technical
feasibility using optimised cases and a porcine phantom (Chapter 10), clinical validation is now

1 9 5
required using patient examinations representative of daily clinical practice. While no
equivalent 3D surface registration algorithm is available for direct comparison to CASPR,
centreline registration methods are widely incorporated into vendor workstations(40). The
‘normalised distance along the colonic centreline’ (NDACC) proposed by Summers et al (290)
corrects for discrepancies in centreline registration by expressing the distance relative to the
overall centreline length and is relatively well researched (289-291, 301, 302). Although the
exact mechanism of centreline registration in proprietary workstations is not publicised, it is
likely that they are based on this technique. In order to avoid bias, validation should use data
from centres that have not contributed cases for algorithm development (‘external validation’)
to ensure prior exposure to the test data or similar does not influence results (215) (313).
Therefore, the aim of this Chapter is to describe external validation of a CASPR for CTC and to
compare to this to the well-described NDACC (290) registration method.
11.2 METHODS AND MATERIALS
11.2.1 CASE CHARACTERISTICS AND SELECTION
Cases were obtained from the National CT Colonography Trial (ACRIN 6664) (16) via the
National Cancer Institute’s National Biomedical Imaging Archive (NBIA)
(https://imaging.nci.nih.gov/ncia/). The CASPR algorithm was naive to these data. The ACRIN
6664 trial protocol (http://www.acrin.org/TabID/151/Default.aspx) has been described
previously. In brief, 2604 asymptomatic adults scheduled for colonoscopy were recruited from
15 USA centres (16). All patients underwent CTC with full catharsis, carbon dioxide insufflation
and faecal tagging followed by same-day colonoscopy. The archive comprises 825 CTC cases
randomly selected from the trial (‘CT Colonography’ collection at The Cancer Imaging Archive:
http://cancerimagingarchive.net/). Of these, 35 have at least one polyp ≥10mm. A further 68
contain ≥1 polyp 6-9mm (one case is duplicated). Reference data (diameter, segment, axial
slice) are available for 62 cases (29 where the largest polyp ≥10mm and 33 where the largest
polyp measured 6-9mm) (https://wiki.cancerimagingarchive.net/x/DQE2). Datasets were
downloaded and transferred to a CTC workstation (MedicRead 3.0, Medicsight Plc, London,
1 9 6
UK). The author used these reference data to locate polyps in prone and supine datasets. To
maintain an external reference standard, cases were included only if pathology was identified
at the axial location in the accompanying spreadsheet; no attempt was made to search for
polyps using segmental location alone. Cases were selected if ≥1matched polyp ≥6mm was
visible in both prone and supine acquisitions (Table 33). Three cases were excluded due to
incomplete CT data, 5 where polyps were submerged in untagged fluid, and 3 where polyps
were obscured by complete luminal collapse. Where cases contained multiple polyps, each
individual polyp was subject to the above criteria: A further 3 polyps ≥10mm and 14 polyps 6-
9mm were thus included. Hence, the validation sample (Appendix B) was 51 patients with 68
polyps (31 ≥10mm; 37, 6-9mm).
Table 33: Case and polyp selection criteria used to provide a validation sample from the publically
available ACRIN CTC study dataset
Case Exclusion criteria Polyp exclusion criteria Total cases included
Additional polyps suitable for inclusion in cases with multiple polyps**
Total polyps Included to test algorithm
Total cases available on archive
External radiologic reference data missing or inconsistent
Incomplete CTC dataset
Polyp concealed in either prone or supine view by untagged residue
Polyp concealed in either prone or supine view by luminal collapse
6-9mm
≥10mm
At least one polyp, the largest of which is 6-9mm
68 35 2 3 2 26 11 0 37
At least one polyp 10mm or larger
35 6 1 2 1 25 3 3 31
Total 103 41 3 5 3 51 14 3 68
For each study (including those excluded), the author recorded a subjective impression of
distension and residue (Table 34), employing an established score used previously for the
ACRIN CTC database (288). Cases were deemed ‘poorly prepared’ if >50% residual fluid was
present in one or more colonic segments, and ‘collapsed’ if ≥1 region of complete luminal
occlusion was present in either acquisition(125).

1 9 7
Table 34: Proportion of validation cases with inadequate distension or excess colonic residue
compared to those in the overall ACRIN CTC study sample
Total Cases with
polyps
≥6mm
Number of cases with
excess colonic residue/
n(%)
Polyp-positive cases with at
least one collapsed segment/
n(%)
ACRIN CTC study sample undergoing full
cathartic bowel preparation
2525 825 1313 (52%)* Unavailable
Publicly available subset of ACRIN study
with polyps ≥6mm undergoing full bowel
preparation
547 103 295(54%) 50 (49%)
Validation sample 51 51 32 (63%)** 37(73%)
*After Hara et al (288)
** Applying criteria described by Hara et al on the publicly available data
No case was excluded on this basis however; rather, these data were collected to assess the
generalisability of our sample (Table 34) and to perform pre-specified subgroup analysis (Table
35). Per-polyp segmental location was also recorded (Table 36).
Table 35: Summary of gross 3D error across all polyps in validation sample. Subgroup analysis of
registration error in cases with poor luminal distension and/ or cleansing and comparison with NDACC
Algorithm Registration error (mm) NDAAC
error (mm)
Polyp
size
(mm)
Polyp in dataset
with at least
one luminal
collapse (n=37)
Polyp in dataset
without luminal
collapse (n=31)
Polyp in
dataset with
excess colonic
residue*
(n=38)
Polyp in
dataset with
low colonic
residue (n=30)
Overall gross
registration
error (n=68)
Overall gross
registration
error (n=68)
Mean 12.0 21.8 17.7** 23.4 15.5*** 19.9 27.4
S.D. 9.2 19.5 21.6 21.3 18.7 20.4 15.1
Range 6 to 55 1.2 to 85.8 1.0 to 76.9 1.0 to 85.8 1.1 to 76.9 1.0 to 85.8 4.1 to 92.0
Median 8 17.0 8.2 19.2 8.4 12.3 23.5****
*Excess colonic residue defined as >50% luminal fluid in one or more colonic segments **No Significant difference in 3D (p=0.066) registration error in cases with one or more areas of complete luminal collapse. ***No significant difference in 3D registration error in poorly cleansed cases compared to well prepared cases (p=0.060) ****Overall, algorithm registration error over all 68 polyps is significantly smaller compared to NDACC (p=0.001)

1 9 8
Table 36: Per segment distribution of polyps in the validation sample compared to the overall ACRIN
CTC dataset and mean registration error per colonic segment
Total polyps ≥6mm in
ACRIN CTC Study
sample
Polyps ≥6mm included
in this validation
Sample
CASPR Mean gross
registration error per
colonic segment
NDACC Mean gross
registration error per
colonic segment
n (%) n (%) 3D error/mm* 3D error/mm**
Rectum 90 (16) 14 (21) 19.2 24.3
Sigmoid 147(27) 15(22) 22.2 30.8
Descending 58 (11) 11 (16) 18.1 31.0
Transverse 95 (17) 7 (10) 25.5 32.7
Ascending 97 (18) 13 (19) 21.7 25.9
Caecum 60 (11) 8 (12) 11.7 19.1
Total 547 68 19.9 27.4***
*No significant change in algorithm 3D registration error due to polyp position per colonic segment (p=0.76 , Kruskal-Wallis
statistic).
**NDACC 3D error is calculated as the smallest vector from a centreline point tangential to the true polyp location.
***Algorithm total mean registration error significantly smaller than NDACC (p=0.001)
11.2.2 RECORDING 3D POLYP LOCATIONS
For each polyp, 3D endoluminal location was recorded using ITK-SNAP (www.itksnap.org) (293)
using the method described in Chapter 8. The author manually circumscribed each polyp on
both acquisitions, thereby providing corresponding prone and supine endoluminal surface
coordinates with which to test the algorithm.
11.2.3 ALGORITHM DEVELOPMENT AND IMPLEMENTATION
After development described previously in this Section, the algorithm was locked; no ACRIN
data were used for algorithm development. 3D endoluminal visualisation software designed by
Tom Hampshire was used to test the algorithm. The tool displayed 120-degree 3D endoluminal
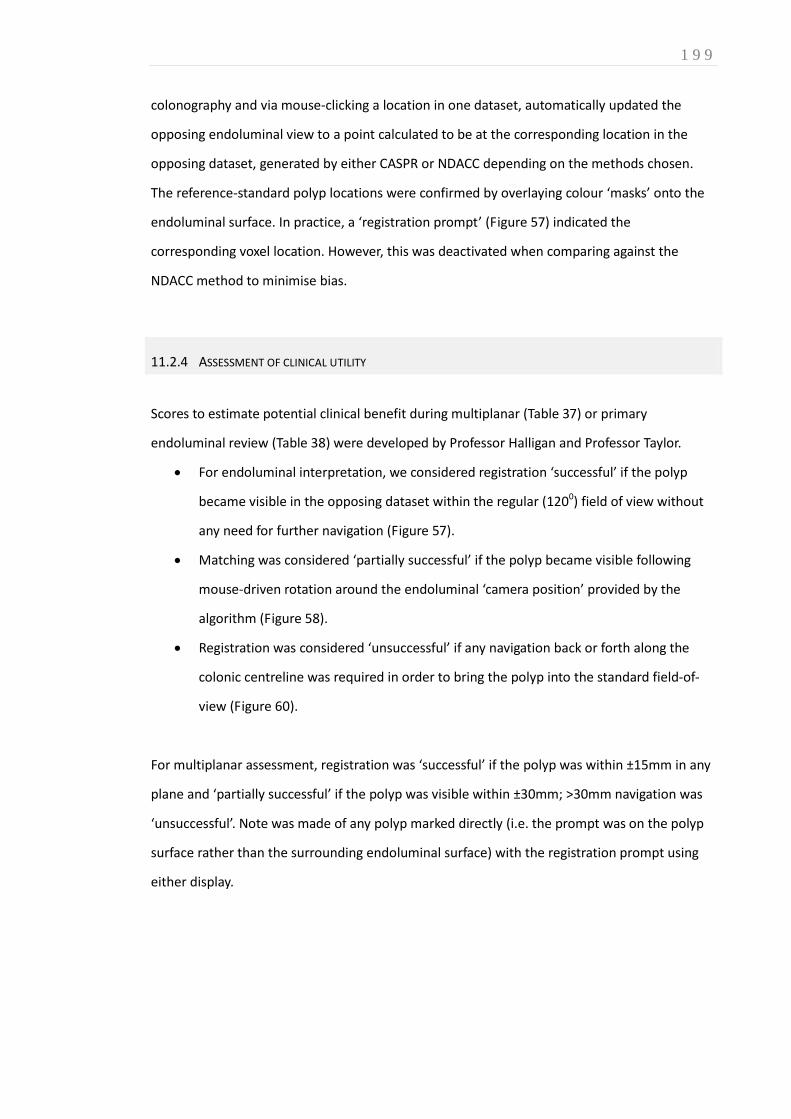
1 9 9
colonography and via mouse-clicking a location in one dataset, automatically updated the
opposing endoluminal view to a point calculated to be at the corresponding location in the
opposing dataset, generated by either CASPR or NDACC depending on the methods chosen.
The reference-standard polyp locations were confirmed by overlaying colour ‘masks’ onto the
endoluminal surface. In practice, a ‘registration prompt’ (Figure 57) indicated the
corresponding voxel location. However, this was deactivated when comparing against the
NDACC method to minimise bias.
11.2.4 ASSESSMENT OF CLINICAL UTILITY
Scores to estimate potential clinical benefit during multiplanar (Table 37) or primary
endoluminal review (Table 38) were developed by Professor Halligan and Professor Taylor.
For endoluminal interpretation, we considered registration ‘successful’ if the polyp
became visible in the opposing dataset within the regular (1200) field of view without
any need for further navigation (Figure 57).
Matching was considered ‘partially successful’ if the polyp became visible following
mouse-driven rotation around the endoluminal ‘camera position’ provided by the
algorithm (Figure 58).
Registration was considered ‘unsuccessful’ if any navigation back or forth along the
colonic centreline was required in order to bring the polyp into the standard field-of-
view (Figure 60).
For multiplanar assessment, registration was ‘successful’ if the polyp was within ±15mm in any
plane and ‘partially successful’ if the polyp was visible within ±30mm; >30mm navigation was
‘unsuccessful’. Note was made of any polyp marked directly (i.e. the prompt was on the polyp
surface rather than the surrounding endoluminal surface) with the registration prompt using
either display.
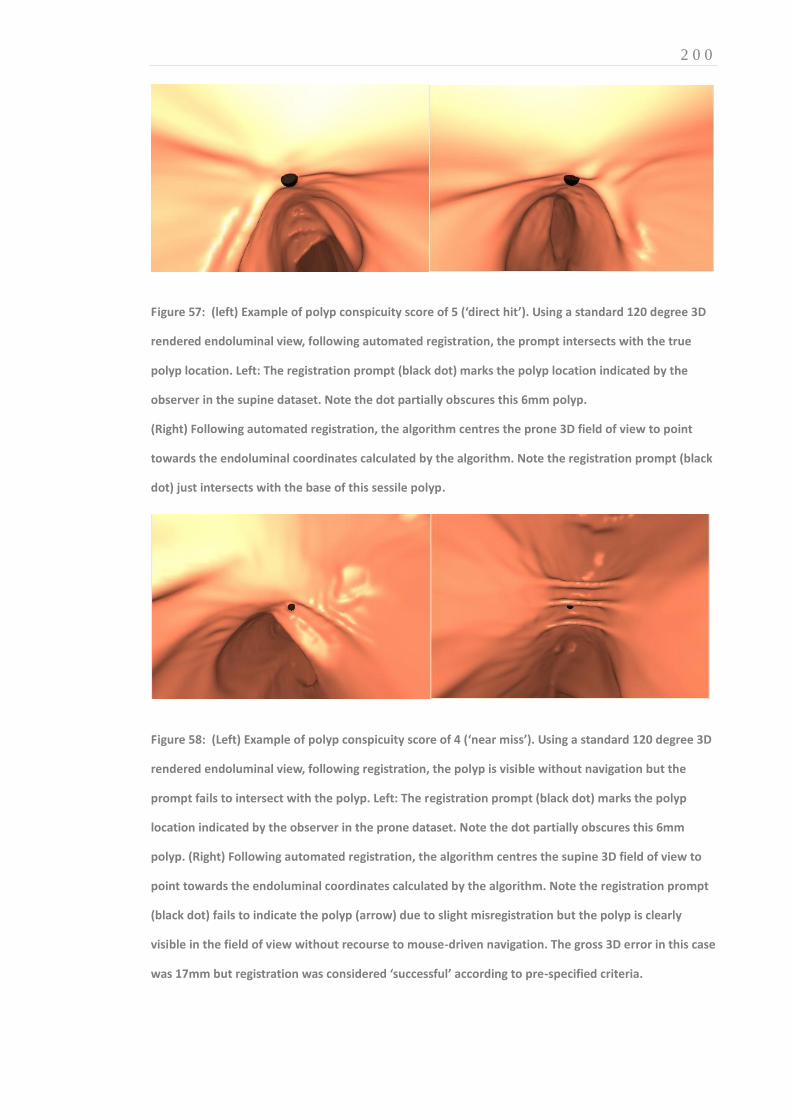
2 0 0
Figure 57: (left) Example of polyp conspicuity score of 5 (‘direct hit’). Using a standard 120 degree 3D
rendered endoluminal view, following automated registration, the prompt intersects with the true
polyp location. Left: The registration prompt (black dot) marks the polyp location indicated by the
observer in the supine dataset. Note the dot partially obscures this 6mm polyp.
(Right) Following automated registration, the algorithm centres the prone 3D field of view to point
towards the endoluminal coordinates calculated by the algorithm. Note the registration prompt (black
dot) just intersects with the base of this sessile polyp.
Figure 58: (Left) Example of polyp conspicuity score of 4 (‘near miss’). Using a standard 120 degree 3D
rendered endoluminal view, following registration, the polyp is visible without navigation but the
prompt fails to intersect with the polyp. Left: The registration prompt (black dot) marks the polyp
location indicated by the observer in the prone dataset. Note the dot partially obscures this 6mm
polyp. (Right) Following automated registration, the algorithm centres the supine 3D field of view to
point towards the endoluminal coordinates calculated by the algorithm. Note the registration prompt
(black dot) fails to indicate the polyp (arrow) due to slight misregistration but the polyp is clearly
visible in the field of view without recourse to mouse-driven navigation. The gross 3D error in this case
was 17mm but registration was considered ‘successful’ according to pre-specified criteria.
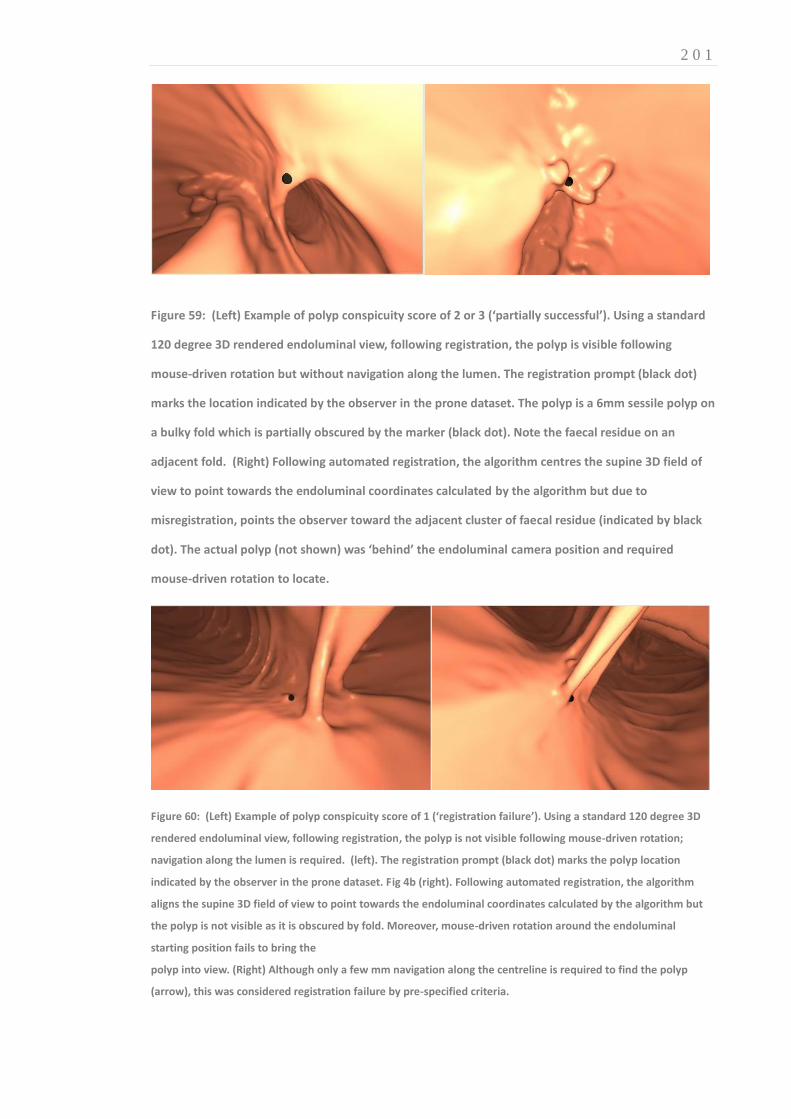
2 0 1
Figure 59: (Left) Example of polyp conspicuity score of 2 or 3 (‘partially successful’). Using a standard
120 degree 3D rendered endoluminal view, following registration, the polyp is visible following
mouse-driven rotation but without navigation along the lumen. The registration prompt (black dot)
marks the location indicated by the observer in the prone dataset. The polyp is a 6mm sessile polyp on
a bulky fold which is partially obscured by the marker (black dot). Note the faecal residue on an
adjacent fold. (Right) Following automated registration, the algorithm centres the supine 3D field of
view to point towards the endoluminal coordinates calculated by the algorithm but due to
misregistration, points the observer toward the adjacent cluster of faecal residue (indicated by black
dot). The actual polyp (not shown) was ‘behind’ the endoluminal camera position and required
mouse-driven rotation to locate.
Figure 60: (Left) Example of polyp conspicuity score of 1 (‘registration failure’). Using a standard 120 degree 3D
rendered endoluminal view, following registration, the polyp is not visible following mouse-driven rotation;
navigation along the lumen is required. (left). The registration prompt (black dot) marks the polyp location
indicated by the observer in the prone dataset. Fig 4b (right). Following automated registration, the algorithm
aligns the supine 3D field of view to point towards the endoluminal coordinates calculated by the algorithm but
the polyp is not visible as it is obscured by fold. Moreover, mouse-driven rotation around the endoluminal
starting position fails to bring the
polyp into view. (Right) Although only a few mm navigation along the centreline is required to find the polyp
(arrow), this was considered registration failure by pre-specified criteria.

2 0 2
11.2.5 TESTING ALGORITHM PERFORMANCE
Polyp conspicuity following registration was assessed separately by the author and also by
collaborator Dr Emma Helbren, with technical assistance from Holger Roth. Roth loaded each
patient case into the display software, located the polyp using reference data, and selected
either CASPR or NDACC according to a randomisation table. The ‘registration prompt’ was
disabled to prevent unblinding observers to the method under test. Having identified and
clicked the polyp in either the prone or supine dataset (again, randomly allocated), the
software automatically updated the opposing display to align the ‘virtual endoscope’ either at
the anticipated mural location generated by CASPR or along the centreline (NDACC), depending
on the registration method under investigation. The radiologist observer then attempted to
locate the target polyp, using mouse driven navigation, where necessary and then grading its
conspicuity using the pre-specified score (Table 38). The process was repeated for all polyps,
prone to supine and then supine to prone, using both registration methods. Roth collated
responses and where the registration algorithm scored a ‘successful’ result, the author re-
examined cases with the ‘registration prompt’ activated to assess its proximity to the polyp.
Multiplanar conspicuity was assessed using the polyp reference volumes delineated above. For
each polyp, corresponding paired mural coordinates (CASPR) or endoluminal locations (NDACC)
were calculated. Starting with these point correspondences the minimum axial, coronal or
sagittal navigation required to locate the polyp in the opposing dataset was determined for
both methods. Results were scored according to pre-specified criteria (Table 37). Polyps with
overlapping volumes following registration were examined for registration prompt accuracy.
The distance between points on the centreline closest to the polyp apex and algorithm-
generated surface correspondence was measured to simulate (1D) registration error along the
centreline. Finally, the gross 3D registration error was calculated from the vector between the
polyp apex and the corresponding mural coordinates (CASPR) or the closest position on the
centreline (NDACC), following the approach described by Wang et al (304)

2 0 3
11.2.6 STATISTICAL ANALYSIS
Polyp location was assumed to be non-parametric; p-values less than 0.05 were considered
statistically significant. Pairwise Wilcoxon-Signed Rank tests were used to compare the
algorithm’s results (multiplanar, 1D, and Euclidean 3D registration error, multiplanar and 3D
polyp conspicuity scores) to those generated from NDACC. McNemar tests were used to
compare 'successful' conspicuity scores between CASPR and NDACC. Subgroup analysis was
performed to compare distributions of registration error in cases with differing bowel
preparation and endoluminal collapse. The segmental distribution of polyps ≥6mm in both the
validation sample and the entire ACRIN CTC dataset were also compared. Comparisons used
the Kruskal-Wallis statistical test when comparing per-segment polyp distribution and
segmental collapse. The Mann-Witney-U statistical test was used to compare error
distributions in cases with differing colonic cleansing.
11.3 RESULTS
Overall, 51 patient cases containing 68 polyps were included. In 100% cases, the algorithm was
able to register the endoluminal surface, providing 68 paired point correspondences with
which to test the algorithm.
11.3.1 VALIDATION SAMPLE CHARACTERISTICS
The segmental distribution of polyps in the validation sample (n=68) (Table 36) were compared
to polyps ≥6mm (n=547) from the entire ACRIN CTC study (16) (n=2525) to investigate the
likely generalizability of our results. By adopting the criteria proposed by Hara et al (288), 53%
of validation cases (n=27) had excess residual fluid compared to 52% (1313) of the total CTC
studies from the same trial. 49% (25) had at least one region of complete luminal collapse
(Table 34) similar to the 48% (50) observed in the total, 103, positive cases in the publicly
available database.

2 0 4
11.3.2 REGISTRATION PERFORMANCE: GROSS 3D AND 1D ERROR (TABLE 36)
Overall mean 3D registration error (Standard Deviation; SD) over all 68 polyps was 19.9mm
(20.4mm), with a median error of 12.3mm (range 1.0mm to 85.8mm). 3D registration accuracy
did not vary significantly when comparing differing colonic segments (p=0.76) (Table 35), or
varying distension (p=0.066). Furthermore, the difference in registration accuracy was not
significant among cases with excess residual fluid (23.4mm, n=38) compared to well-cleansed
cases (15.5mm; n=30) (p=0.06) (Table 35). In comparison, mean Euclidean 3D registration error
was significantly greater using NDACC: 27.4mm (SD 15.1mm) (p =0.001). Likewise, although the
algorithm’s simulated 1D centreline error (mean 17.6mm) was not significantly less than for
NDACC (mean 20.8mm) over the entire colon, when considering the most mobile sigmoid,
transverse and descending colonic segments (27), mean error was significantly less than for
NDACC (19.3mm vs 26.9mm; p=0.047).
11.3.3 COMPARATIVE PERFORMANCE, MULTIPLANAR CONSPICUITY (TABLE 37)(FIGURE 61)
Using a multiplanar approach, CASPR generated 48 (70.6%) ‘successful’ matches. Moreover, 43
(63.2%) polyps were marked directly with the registration prompt. 13.2% were ‘partially
successful’ and 16.5% polyp matching tasks failed according to our pre-specified criteria. In
comparison, using NDACC, 23.5% polyp matching tasks were ‘successful’ and 58.8% ‘partially
successful.’ Consequently, NDACC generated significantly fewer successful matches (p<0.001)
11.3.4 COMPARATIVE PERFORMANCE: OBSERVER GRADED POLYP CONSPICUITY (TABLE 38)(FIGURE 62)
Ease of polyp visualisation following registration was assessed from prone to supine and vice
versa in all 51 cases; 68 corresponding polyp-pairs generated 136 individual polyp matching
tasks. Using a 3D endoluminal approach (Fig 6)(Table 38), following registration using CASPR,
two observers, the author and Dr Helbren graded 82% overall (83.1% and 80.9% respectively)
polyp matches as ‘successful’ and 8.8% (both 8.8%) ‘partially successful’ according to pre-
specified criteria. Moreover, review of the successful cases confirmed 64.8% (68.4% and 61.1%
respectively) of the total polyp matches were marked directly with the registration prompt.
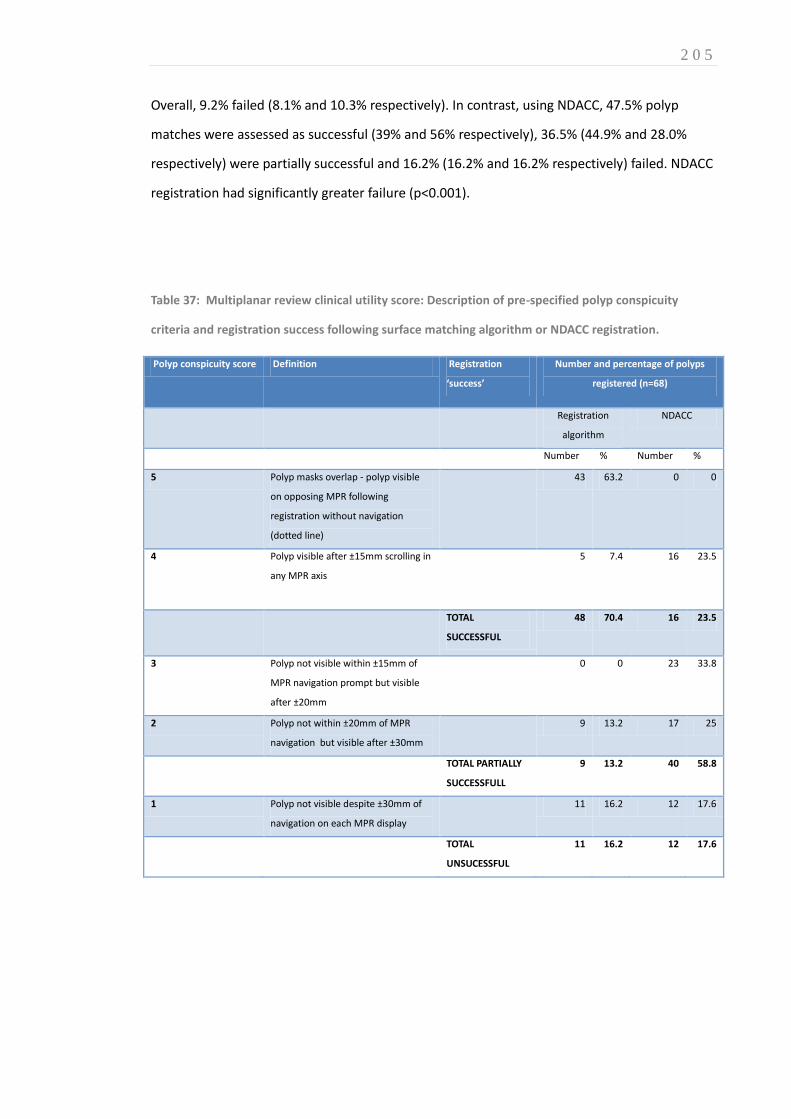
2 0 5
Overall, 9.2% failed (8.1% and 10.3% respectively). In contrast, using NDACC, 47.5% polyp
matches were assessed as successful (39% and 56% respectively), 36.5% (44.9% and 28.0%
respectively) were partially successful and 16.2% (16.2% and 16.2% respectively) failed. NDACC
registration had significantly greater failure (p<0.001).
Table 37: Multiplanar review clinical utility score: Description of pre-specified polyp conspicuity
criteria and registration success following surface matching algorithm or NDACC registration.
Polyp conspicuity score Definition Registration
‘success’
Number and percentage of polyps
registered (n=68)
Registration
algorithm
NDACC
Number % Number %
5 Polyp masks overlap - polyp visible
on opposing MPR following
registration without navigation
(dotted line)
43 63.2 0 0
4 Polyp visible after ±15mm scrolling in
any MPR axis
5 7.4 16 23.5
TOTAL
SUCCESSFUL
48 70.4 16 23.5
3 Polyp not visible within ±15mm of
MPR navigation prompt but visible
after ±20mm
0 0 23 33.8
2 Polyp not within ±20mm of MPR
navigation but visible after ±30mm
9 13.2 17 25
TOTAL PARTIALLY
SUCCESSFULL
9 13.2 40 58.8
1 Polyp not visible despite ±30mm of
navigation on each MPR display
11 16.2 12 17.6
TOTAL
UNSUCESSFUL
11 16.2 12 17.6
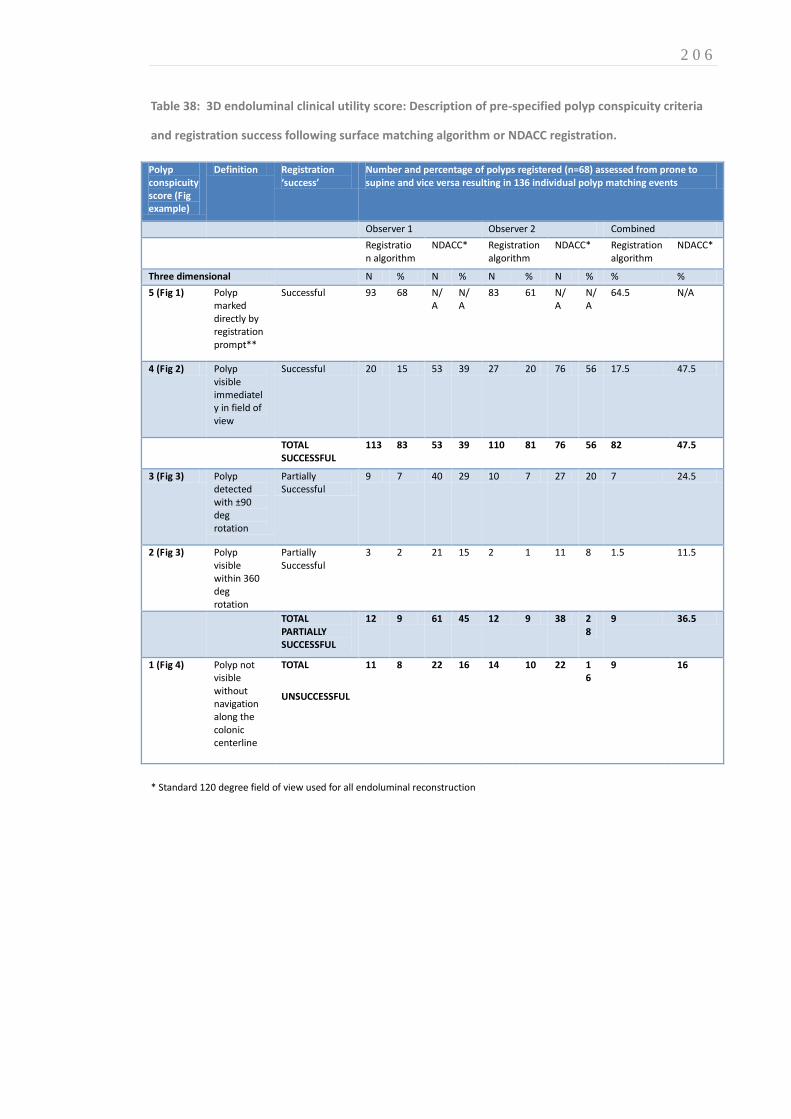
2 0 6
Table 38: 3D endoluminal clinical utility score: Description of pre-specified polyp conspicuity criteria
and registration success following surface matching algorithm or NDACC registration.
Polyp conspicuity score (Fig example)
Definition Registration ‘success’
Number and percentage of polyps registered (n=68) assessed from prone to supine and vice versa resulting in 136 individual polyp matching events
Observer 1 Observer 2 Combined
Registration algorithm
NDACC* Registration algorithm
NDACC* Registration algorithm
NDACC*
Three dimensional N % N % N % N % % %
5 (Fig 1) Polyp marked directly by registration prompt**
Successful 93 68 N/A
N/A
83 61 N/A
N/A
64.5 N/A
4 (Fig 2) Polyp visible immediately in field of view
Successful 20 15 53 39 27 20 76 56 17.5 47.5
TOTAL SUCCESSFUL
113 83 53 39 110 81 76 56 82 47.5
3 (Fig 3) Polyp detected with ±90 deg rotation
Partially Successful
9 7 40 29 10 7 27 20 7 24.5
2 (Fig 3) Polyp visible within 360 deg rotation
Partially Successful
3 2 21 15 2 1 11 8 1.5 11.5
TOTAL PARTIALLY SUCCESSFUL
12 9 61 45 12 9 38 28
9 36.5
1 (Fig 4) Polyp not visible without navigation along the colonic centerline
TOTAL
UNSUCCESSFUL
11 8 22 16 14 10 22 16
9 16
* Standard 120 degree field of view used for all endoluminal reconstruction

2 0 7
Figure 61: Conspicuity of polyps at multiplanar review following automated colonic registration using
either the prone-supine registration algorithm or NDACC. Pre-specified criteria are outlined in table
37. Note the proportion of ‘successful’ polyp matches enclosed within the dotted line represents those
marked directly by the algorithm’s registration prompt.

2 0 8
Figure 62: 3D error. Conspicuity of polyps at endoluminal review following automated colonic
registration using either the prone-supine registration algorithm or NDACC. Pre-specified criteria are
outlined in table 38. Note the proportion of ‘successful’ polyp matches enclosed within the dotted line
represents those marked directly by the algorithm’s registration prompt.

2 0 9
11.4 DISCUSSION
Computer-assisted registration for CTC is not new; once methods to compute the luminal
centreline were developed (314), they were rapidly incorporated into vendor workstations (40)
to provide approximate corresponding endoluminal locations between prone and supine
acquisitions. However, luminal collapse and residual fluid are encountered regularly in daily
practice and impair centreline matching of corresponding endoluminal locations (298).
Therefore, algorithms have been designed to overcome this. For example, expressing the
endoluminal position relative to total centreline length (NDACC) has been shown to improve
upon regular centreline matching (290, 302). Likewise, anatomical reference points (e.g.
flexures or rectum) can be used to shrink or stretch centreline geometry to improve
registration (292, 303, 304) often with promising results. However, despite correcting for
colonic torsion using teniae coli to improve upon existing 2D centreline methods (315), Huang
et al achieved a registration error of ±61mm. This probably reflects the use of a representative
sample (14) with similar selection criteria to the present study; their results are likely more
generalisable than those using optimized datasets (42, 298, 316). Therefore, the 3D error
(20.4mm) presented in this study compares favourably.
Furthermore, centreline studies usually assess registration accuracy by linear distance
measurements (42, 298, 316), the significance of which does not transfer readily to clinical
practice. In contrast, De Vries et al(289) attempted to estimate clinical utility by testing
endoluminal polyp visibility following registration using 32 representative datasets obtained
from an unrelated observer study. They found that 70% of polyps were visible following
registration using an ‘unfolded cube’ visualisation, which is much larger than a standard
120degree field-of-view(317). Using a comparable endoluminal field of view, the current
algorithm would reveal 91% polyps, over half of which would be marked directly with a
registration prompt. Moreover, while we chose a standard 1200 viewing angle to provide the
most generalisable reflection of how the technology could perform in everyday practice,
increasingly, vendor platforms are offering ultra-wide (>1500) rendering as standard. Future
research should evaluate CASPR performance when applied to wider viewing angles and
potentially alternative display methods such fillet views.

2 1 0
While this study compared CASPR to NDACC matching due the lack of an equivalent technology
against which to gauge performance, this was somewhat artificial. In particular, indicating a
specific location on the endoluminal surface provides the observer with considerably more
information than simply providing a position from which to search; centreline methods
inherently cannot provide a 3D mural location. In addition to outperforming NDACC using both
standalone and observer measures, following registration 64.7% of polyps would have been
correctly marked with the CASPR ‘registration prompt’ providing a further clinical advantage
over centreline registration. However, to avoid unblinding the observer to the registration
algorithm under test, this function had to be disabled during the observer study. Therefore, the
clinical impact of an endoluminal prompt on diagnostic performance and reading time remains
untested and is the subject of future research.
Other algorithms have been developed to provide 3D endoluminal surface correspondence:
Suh et al modified a centreline based rigid registration (aided by automated anatomical
landmark detection) to initialise a voxel based non-rigid deformation intended to provide true
3D correspondence(43). They reported a registration error of 13.8mm (SD 6.2 mm) when
aligning 24 polyps in 21 patients but all cases were optimally distended. A subsequent study of
four cases with colonic collapse saw mean error increase to 30.1 mm(292). Moreover, each
collapsed segment was matched with a fully distended segment on the opposing acquisition so
that missing data could be interpolated; it is our experience that, luminal collapse is often
present in the same segment in both datasets. Fukano et al(305) attempted surface
correspondence via matching haustral folds and reported 65.1% of ‘large’ folds matched
correctly. When developing our own haustral-fold-based initialisation (Chapter 9) we found
that colonic torsion induced errors in both registration and reference standard observations.
Nevertheless, our method achieved fold-matching accuracy of 83.1% and 88.5% with and
without local colonic collapse, irrespective of fold size. Recently, Zeng (282) used automated
feature detection to create five colonic segments, subsequently mapping each endoluminal
surface to a rectangle. They found an average 3D error of 5.65 mm for 20 paired polyps within
optimally distended colons but no data for collapse were presented.
At the time of writing, all previous attempts at endoluminal surface registration require manual
initiation and delineation of fixed colonic landmarks. The present algorithm is essentially
automated; the reader reviews the proposed colonic segmentation, excludes small bowel, and
2 1 1
confirms the sequence of colonic segments, defining start and end points, just as when
generating a 3D flythrough. We used external validation (i.e. validation used cases from
hospitals uninvolved with algorithm development), to obtain a generalisable estimate of
algorithm performance in normal practice. Our study sample closely paralleled the ACRIN CTC
study data with respect to bowel preparation quality and distension. Our registration method
compares favourably with centreline based methods and surface-based registration, especially
considering the heterogeneity of the sample.
Our study has limitations. Cases were excluded from validation where there was an incomplete
external radiologic reference standard or where polyp locations could not be confirmed,
despite accounting for inconsistencies in axial slice numbering between vendor platforms.
However, both the distribution of polyps and the proportion of cases with ‘poor’ bowel
preparation in our sample parallels the ACRIN data overall (16, 288). We excluded cases with
absent or incomplete faecal tagging because the algorithm relies on matching surface features
and digitally cleansing is necessary to achieve this in the presence of significant residual fluid.
However, as described in Section A, optimisation of both colonic preparation and digital are the
subject of considerable research. Although alternative displays (e.g. ‘filet’ or ‘unfolded cube’)
would have increased successful registrations according to our pre-specified criteria, we believe
standard endoluminal display is most generalisable. In addition to prone and supine
acquisitions, current implementation guidelines recommend an additional decubitus series in
selected patients; registration of decubitus datasets is the subject of future research. The polyp
conspicuity scales we developed may not reflect utility in normal practice although we did base
the scale on a priori discussions of clinical benefit. We plan studies of clinical utility in everyday
practice. Although it is intuitive that accurate endoluminal registration will facilitate and
shorten interpretation, this needs quantification as does any effect on sensitivity/specificity. It
is possible that observers using automated matching could incorrectly reject TP polyps if
incorrectly registered just as those using CAD may incorrectly reject false-negative polyps (25).
Moreover, just as CAD only has regulatory approval as a ‘second reader’ (20, 21), it is unclear
how a registration algorithm such as CASPR should integrate into clinical interpretation.
In summary, we have tested a computer-assisted prone-supine registration algorithm (CASPR)
on a representative subset of CTC data from a large multicenter trial, with successful results.

2 1 2
The ability to rapidly and automatically match potential polyp locations between acquisitions is
likely to facilitate CTC interpretation.

2 1 3
SECTION E: CONCLUSIONS AND RECOMMENDATIONS FOR FUTURE RESEARCH
OVERVIEW
This Thesis describes multidisciplinary, collaborative research intended to facilitate colorectal
cancer and precursor polyp diagnosis with CTC. The research comprising each Chapter has
been published or is under consideration. The studies described explore diverse themes and
methodology, none of which would have been possible without input from an equally diverse
group of academics; statisticians, computer scientists, radiologists, clinical psychologists, and
health economists, to whom I am indebted. While the research is presented from a clinical
perspective, their contributions, often from a different standpoint, permeate this Thesis and I
have aspired to provide a contribution to colorectal cancer research that amounts to more than
the sum of its parts. This Chapter concludes the Thesis with a discussion of the results
presented and proposes areas in need of further research.

2 1 4
CHAPTER 12
12. DISCUSSION, CONCLUSIONS AND SUMMARY
12.1 DISCUSSION OF RESULTS
The opening pages of this Thesis outlined the research questions and hypotheses tested over
the ensuing research studies. These are now revisited and the pertinent findings discussed:
WHAT IS THE RATIONALE FOR CURRENT CTC IMPLEMENTATION?
Section A of this Thesis provides a review of CTC research from its inception to present day. The
trajectory from an experimental modality in specialised academic centres to widespread
implementation in daily practice was driven by a number of landmark publications and in the
UK by research seeking an alternative to BaE. Early research was instrumental in optimising
technical parameters and subsequently, by performing CTC according to consensus guidelines,
multicentre studies demonstrated promising diagnostic accuracy in asymptomatic (14, 16)and
high risk screening populations(128). Recently, the SIGGAR RCT(10, 133) has confirmed that
CTC is significantly more accurate than BaE which has consequently been abandoned for
colorectal cancer screening purposes in the UK(318).
In addition, the literature to date confirm that adverse events during CTC are uncommon(155)
and that patient acceptability is good when compared to the alternatives (88). Bowel
preparation ‘tagging’ regimens aimed at improving specificity continue to show considerable
promise(319) and recent RCT data suggest that reduced-laxative CTC could significantly
enhance uptake for colorectal cancer screening(154). Furthermore, evidence is mounting that
2 1 5
impressive stand-alone detection rates for CAD translate into improved diagnostic accuracy for
radiologists (20, 21).
However, opinions remain divided on some issues. While the American Cancer Society, the US
Multi-Society Task Force on Colorectal Cancer, and the American College of Radiology(143)
endorse CTC, CMS(131) declined coverage, citing a lack of evidence for improved diagnostic
accuracy compared to existing alternatives. While this decision was not well received by the
radiological community (132, 149, 320), it is important to understand how such a decision
might come about: There remains a paucity of published level 1 evidence of benefit and, even
then, concerns exist regarding the transferability of the available research into daily practice.
In addition, controversy continues to surround the potential impact of incidental extracolonic
detections, who should interpret CTC, and whether the technique is ultimately cost-effective.
While a relatively extensive synopsis of the published literature was discussed, narrative
reviews are inherently limited and the evidence described is, by no means, exhaustive.
Nevertheless, there appears to be a promising recent trend towards well-designed
collaborative research studies which may go some way to addressing these issues.
WHAT IS THE LEVEL OF CTC EXPERIENCE AND TRAINING AMONG EUROPEAN RADIOLOGISTS?
The survey described in this Thesis illustrates that many participants at CTC workshops had
little formal training or experience. While it would be reasonable to argue that attendees at
educational symposia are unrepresentative of those reporting CTC in clinical practice
unsupervised, we found that the majority (86%) were nonetheless doing exactly this.
The majority of these (76%) had interpreted fewer than 50 cases, which is commonly believed
to be the absolute minimum level of experience recommended for independent reporting; 49%
had reported less than 10 individual cases. The level of CTC training among those interpreting
CTC independently also gave cause for concern: Only a small proportion (8%) had any formal
training prior to the workshop and 54% had none whatsoever. These data imply that
radiologists are interpreting specialised examinations in daily practice of which they have little
prior experience. The consequence is that the test characteristics suggested by large clinical

2 1 6
trials and metaanalysis, often performed in centres with experienced practitioners, are
presently unlikely generalisable to daily European practice. However, it was promising to note
that most respondents were performing the CTC examination (i.e. acquiring the medical image
data) in accordance with published European guidelines.
This survey obtained a good (73%) response rate suggesting the results are likely to be
representative of those attending ESGAR workshops. However, the germane limitation is that
the level of experience and training of those not undergoing training remain unquantified and
this should be the subject of future research.
This survey was performed during a period of escalating demand for CTC across the UK
corresponding to introduction of the NHS BCSP and publication of guidelines recommending
CTC in lieu of BaE(318). Abstracted data from a recent survey of UK practice has shown a
significant increase in the volume of CTC performed since 2004 (170). Hence, there are clinical
and political imperatives for radiologists to interpret CTC in daily practice, some of whom, like
many of those surveyed above, will be insufficiently prepared for the task. Specific
accreditation for interpretation is likely to be rejected on pragmatic grounds at present.
Therefore, ongoing audit of departments and individuals is suggested to determine if adequate
performance can be demonstrated and sustained in clinical practice.
TO WHAT EXTENT DOES RESEARCH METHODOLOGY BIAS STUDIES OF DIAGNOSTIC TEST ACCURACY?
Despite employing a complex, comprehensive search strategy, the systematic review outlined
in Chapter 4 failed to identify a sufficient volume of quality research with which to perform the
planned metaanalysis. Therefore, point estimates around the potential sources of bias
discussed remain unquantified. However, this finding, in itself, confirms the author’s suspicions
that several issues central to the design of studies of diagnostic test accuracy have been
insufficiently researched to date.
Further research in this area is important so that sources of bias can be identified, quantified if
present, and so inform study methodology. For example, peer-review of the research described
in Chapter 11 stated that insufficient washout had been allowed to minimise observer recall
bias, prolonging study publication by several months since the study had to be repeated. This

2 1 7
attitude is not unexpected since such a source of bias is widely assumed to exist. However,
Chapter 4’s systematic review concluded that there is no evidence that such ‘memory effects’
exist (albeit on the basis of few studies) and, even ignoring this fact, there is no available
evidence regarding what constitutes a suitable washout interval between repeated
interpretations of the same data.
Similar concerns exist when manipulating sample prevalence. The argument that reader
performance for datasets with enriched prevalence will not resemble performance in clinical
practice was not borne out either; our systematic review found the opposite, albeit again on
the basis of very little available data. However, the studies which did manipulate prevalence did
not do so beyond 28% yet prevalence is regularly enriched to at least 50% in other studies
reviewed in this Thesis. Therefore, future research is needed to determine whether bias
resulting from altered prevalence, observers’ knowledge of prevalence, and the effects of recall
bias exist and, if so, to quantify the magnitude of any such bias. This should be enabled across
several imaging technologies and diseases, and particularly in the context of screening.
Avoidance of bias in studies of diagnostic imaging tests often requires research to take place in
controlled, ‘laboratory’ conditions and while it has been postulated that this may give rise to
spuriously elevated diagnostic test performance, we found what little research exists suggests
the converse is true: Diagnostic performance achieved in daily practice may exceed that in
research studies. While this issue also remains insufficiently researched, available data are
reassuring.
In summary, at present the available evidence is insufficient to demonstrate a measurable bias
arising from the methodological strategies considered in our systematic review. Nevertheless,
overall research is limited and moreover, none deals specifically with CT colonography. Hence,
further research is necessary to ensure methodology employed in diagnostic test research does
not impair transferability into daily practice.
WHAT IS THE RELATIVE VALUE OF TRUE VS. FALSE POSITIVE DIAGNOSIS WHEN SCREENING USING CTC?
Any diagnostic test can perform with high sensitivity providing little regard is given to the
consequences of FP detections; in an extreme example, all tests could simply be considered

2 1 8
positive. However, given the personal and economic impact of reduced specificity, there is
clearly a point at which reduced specificity renders a test result unhelpful and meaningless.
While acknowledging that there is a trade-off between improved sensitivity in the face of
diminished specificity, we believe that numerically equivalent trade-offs are not necessarily
clinically equivalent, although regarded as such by analyses such as ROC AUC. We believe a
metric that combines both sensitivity and specificity while allowing each to be weighted
differently (and so enable the researcher to adjust this weighting) is necessary to compare
existing tests with newer, potentially enhanced alternatives in a fair and equitable manner.
However, the degree to which patients and/or health professionals value gains in sensitivity
over and above a corresponding fall in specificity was unknown at the outset of this Thesis. We
employed a ‘probability equivalence’ discrete choice analysis to address this research question,
which requires respondents to make trade-offs. This avoided some limitations inherent to
certainty-equivalence methods such as determining values for utilities (248) with the aim of
replicating realistic decision-making.
We found that when considering colorectal cancer screening, both patients and healthcare
professionals believed gains in diagnostic sensitivity to be more important than equivalent
losses in specificity. Overall, we found patients and healthcare professionals combined were
willing to accept an additional 2050 false-positive diagnoses of cancer by CTC in order to avoid
a single missed tumour. Gains in sensitivity were considered less important for diagnosis of
polyps but were still valued over and above corresponding loss of specificity: Overall, patients
and healthcare professionals were willing to accept an additional 10 false-positive diagnoses of
polyps by CTC in order to avoid a single missed lesion. Moreover, we found patients valued
gains in sensitivity significantly more than do healthcare professionals, a finding that applied to
both polyps and cancers. Despite having lower average annual household income than
healthcare professionals, patients were willing to pay more for a test that raised sensitivity
without diminishing specificity.
We found that several of our participants refused to trade, a phenomenon commonly
attributed to heuristic bias – i.e. the cognitive challenge is too high and hence a ‘rule of thumb’
is applied to simplify the problem. Such responses were exhibited by over 25% of participants
in our DCE, suggesting that this attitude cannot simply be dismissed as ‘irrational.’ Further

2 1 9
research is needed to understand these responses more fully. Evidence is accumulating that
incorporating patient preferences into design of screening tests can improve uptake(321) and
future studies should elaborate upon the methods described here and extend them to other
diagnostic scenarios.
CAN A NOVEL WEIGHTED STATISTICAL ANALYSIS BE APPLIED TO STUDIES OF CAD FOR CTC?
The study outlined in Chapter 6 demonstrated it is possible to apply a weighted net-effect
analysis to provide a combined measure of diagnostic performance that incorporates
consideration (and control) of the discrepant clinical consequences of different types of
diagnostic misclassifications. This overcomes some limitations inherent in using ROC AUC
methods (24) and allowed meaningful cross-study comparison between readers of varying
experience.
Using a CAD net-effect measure that favoured sensitivity over specificity (with the weighting
based on data from our discrete choice experiment), the research outlined in Chapter 6
demonstrated that despite generating more FP detections among inexperienced readers, the
increase in sensitivity achieved with CAD was likely to be perceived by patients and health care
professionals as clinically beneficial overall. The beneficial net-effect of CAD was approximately
3-times higher for inexperienced vs. experienced readers suggesting that relative novices
benefit considerably more from CAD than their experienced counterparts.
Reflecting upon the results of multicentre trials described in Section A, it is interesting to note
the relatively poor performance of the experienced readers in this study. While one might
expect inexperienced readers to perform sub-optimally, experienced readers had a mean
sensitivity for patients with polyps (without CAD assistance) of only 57.5% (95%CI 49.6 to
65.2%). These results are discrepant from those obtained by either the DoD or ACRIN II studies
but part of this will be explained by the fact that this research did not employ a diameter
threshold for detection. CTC test data were collated from multiple centres prior to 2006 and
one could also argue that technical differences in CT data acquisition are partly responsible
(e.g. not all studies had oral faecal tagging and some US studies used PEG preparation). In any

2 2 0
event, the unassisted reader performance reinforces that marked heterogeneity exists across
CTC observer studies, and hence, generalisability must be interpreted with a degree of caution.
While the assisted performance of inexperienced readers in this study was disappointing, the
crucial finding is that CAD increases sensitivity significantly, and while this may come at the
cost of additional FP diagnoses, the net-effect is beneficial. In contrast to previous studies that
have used weightings derived from expert opinion, we used weightings derived from our
discrete choice experiment that are likely to better reflect the thresholds adopted by health
care workers and patients in daily practice. Future research should extend this analysis into
other areas of radiology and diagnostic test evaluation where novel techniques are compared
against existing methods, to ensure potentially useful technology is appropriately appraised.
IS IT POSSIBLE TO MEASURE VISUAL SEARCH STRATEGY DURING CTC INTERPRETATION?
The author believes research described in this Thesis constitutes a paradigm shift for medical
image perception research. We have developed a method to apply eye-tracking methodology
to complex 3D volumetric renderings where the target pathology is both moving and changing
in size simultaneously. We have also developed metrics that can be used to compare visual
search patterns between different observers; we have had to quantify ‘pursuit’ during which
readers scrutinise a moving lesion. Moreover, while during 2D eye-tracking, a lapse in visual
search merely prolongs “time-to-first hit”, during CTC, missing data during the short interval for
which lesions were visible complicates analysis further. Overcoming this issue required
development of multiple imputation methods. While our studies have demonstrated
feasibility, much further research is required to understand the diagnostic consequences of
differing visual search patterns between observers. In particular, work is ongoing to compare
search in novice vs. experienced observers and to ascertain the effect of visual CAD prompts
upon gaze patterns.

2 2 1
CAN AN AUTOMATED PRONE-SUPINE REGISTRATION ALGORITHM ACCURATELY MATCH CORRESPONDING
ENDOLUMINAL SURFACE LOCATIONS?
The final Section of this Thesis encompasses the development, in vitro and, in vivo validation of
a novel software algorithm that aims to facilitate colorectal neoplasia characterisation by
automatically aligning corresponding endoluminal surface locations across prone and supine
datasets.
The collaborative research described in Chapter 8 demonstrated that using geometric
parameterisation to transform the complex 3D colonic structure into a cylindrical
representation can simplify the prone-supine registration task. Preliminary validation achieved
a polyp matching accuracy of 5.7mm using a selection of optimally-prepared datasets that
compared favourably with alternative published methods. However, the study was limited by
an imperfect reference standard and non-generalisable CTC data. Moreover, manual
initialisation, particularly to span regions of colonic under-distension, limited clinical utility.
Chapter 9 presented an alternative, artificial intelligence (MRF) method of registering CTC
datasets, this time concentrating on the distribution of haustral folds. This achieved fold
matching accuracy of 96.0% and 96.1% in cases with and without colonic collapse. Moreover,
this algorithm significantly improved the surface matching algorithm described in Chapter 8 by
initialisation, reducing mean registration error to 6.0mm (p < 0.001), across 1743 reference
points in 17 CTC datasets. Again, while these data were promising, the author’s manual fold
locations constituted an imperfect reference standard. To overcome this limitation, a porcine
phantom was constructed as described in Chapter 10.
While porcine phantoms are well described in the CTC literature, prone-supine registration
research brings unique challenges. For example, simply depressing the specimen using bags of
saline (as performed previously by other authors) distorted the colonic specimen rendering it
unusable for feature-based registration. We therefore developed a novel method of
constraining the phantom which allowed for relatively realistic deformations without undue
morphological distortion. This experiment enabled further development of software
parameters to combine both methods into a single computer assisted supine-prone registration
algorithm (CASPR). This required validation using a generalisable test dataset. Therefore,
Chapter 11 describes clinical validation of CASPR to match polyps across prone and supine
datasets from a publically available subset of the ACRIN CTC study. While no equivalent

2 2 2
registration method was available against which to test this algorithm, variations upon the
available registration technology (NDACC) are incorporated into vendor workstations and
hence comparison was made using this: Using an endoluminal display CASPR provided 82%
‘successful’ polyp matches according to our predefined criteria compared to 48% for NDACC
(p<0.001). Likewise, using a multiplanar approach, 71% polyp matching tasks were successful
compared to 24% for MPR (p<0.001).
Our clinical validation suggested that the algorithm could provide radiologists with accurate
endoluminal surface correspondence, which improves considerably upon currently available
technology (that simply provides a comparable position along the colonic centreline). While
our results are promising, the question remains as to how this algorithm might influence
interpretation in daily practice, both in terms of interpretation time and diagnostic accuracy,
and this is the subject of ongoing research. Moreover, this Section demonstrates that while CTC
data display has improved considerably since Vining’s original description in 1994, there is still
potential for continued improvement. Future research will explore the optimal reading
paradigm for integration of CASPR into clinical practice and will also examine how the
identification (or not) of corresponding endoluminal surface features could enhance the
sensitivity and specificity of CAD algorithms.
12.2 FUTURE PERSPECTIVES
Timely diagnosis of cancer and precursor polyps remains an international healthcare priority
with screening programmes established throughout European countries (322).
However, despite considerable research into patient preferences and targeted media
campaigns, uptake of whole-colon screening tests remains worryingly low; bowel preparation
and concerns regarding invasive testing are often implicated{Power, 2009 #596}. Moreover,
endoscopy may not be achievable or desirable in a significant number of patients. Therefore, a
suitable radiological alternative in the form of optimally performed CTC is necessary.
However, CTC is a relatively novel technique, performance of which continues to evolve;
dissemination of CTC from research centres into daily practice took place rapidly, often before
imaging departments and interpreting radiologists were fully prepared. While a large volume
2 2 3
of CTC literature exists, this Thesis raises doubts regarding fundamentals of study methodology
and diagnostic performance in daily practice. The studies cited in support of widespread CTC
implementation are not generalisable due to discrepant levels of training and experience,
particularly in non-academic environments. Therefore, it is the author’s opinion that the most
important development that can take place over the next few years will be to introduce formal
training, assessment and accreditation for those reporting CTC to ensure adequate
performance in daily practice.
While this may appear to be a rather humble expectation, a recent study of UK CTC practice
(323) confirms that many centres offering CTC for the NHS bowel cancer screening programme
(BCSP), currently fail to practice according to consensus guidelines. Moreover, while there
remains no formal UK CTC accreditation, examinations continue to be interpreted by
radiologists with little training or experience. Promisingly, procedures have already been
introduced to rectify this: Recently published guidance (324) specifies criteria for performing
and reporting CTC as well as stipulating minimum levels of experience for reporting BCSP
examinations. Moreover, the requirement for ongoing audit, if nationally collated and analysed
could provide far better insight into routine clinical CTC interpretation than any laboratory-
based research study. In addition, the guidance suggests those reporting CTC will soon need to
demonstrate competence via a formal assessment.
However, at present very little is understood regarding radiology training and expertise in
general, not least for CTC. The minimum level of experience remains unquantified and the
mechanism to test performance is yet to be established. For example, the disappointing results
obtained by experienced readers detailed in chapter 6, suggests that threshold sensitivity for
detecting clinically significant polyps of only 70% would classify the majority of these (expert)
radiologists unfit to interpret CTC. Furthermore, it remains unclear as to what extent observer
performance in laboratory conditions would reflect their practice in a busy clinical
environment. Moreover, the relative clinical value of sensitivity and specificity would also have
to been considered for an assessment to have practical relevance. Nonetheless, the author
speculates that within five years, systems of quality assurance akin to those employed in breast
radiology will be routine practice for CTC in the UK and much of Europe. Moreover, this is likely
to be extended to other branches of radiology: Radiologists will need to provide evidence of
2 2 4
their audited results and depending on how stringent the level of accreditation, it is almost
inevitable that a degree of centralisation will have to take place.
While the diagnostic performance of experienced radiologists described previously is of
concern, it is important to note that many of the validation cases used during the studies
analysed in Chapter 6 were conducted almost 10 years ago. While examinations were
performed according to consensus guidelines at the time, one should not underestimate the
impact of optimally performed CTC. Improved faecal tagging, routine use of mechanical CO2
insufflators and training of CTC technicians to take ownership of examinations and ensure high
quality acquisitions are relatively recent developments contributing to accurate polyp
detection. Furthermore, these developments have not taken place at the expense of patient
acceptability. It is likely that as researchers refine reduced laxative preparations, the use of
harsh purgatives will diminish in the near future. Moreover, it remains the ultimate goal of
many researchers to perform CTC avoiding laxatives altogether. While at present, this seems
infeasible, developments in CT technology such as multiple energy sources may increase the
contrast between stool and the endoluminal surface sufficiently to cleanse untagged or
minimally labelled stool. This would represent a paradigm shift in practice and it is hoped that
such theoretical technical developments will soon become reality. Likewise, new CT scanners
are likely to reduce radiation exposure in addition to improving image resolution,
simultaneously improving patient safety and diagnostic performance.
As reinforced throughout this Thesis, it is the Author’s opinion that CTC should not be
considered an alternative to colonoscopy; unlike endoscopy, CTC has no therapeutic role.
Conversely, it seems highly improbable that future colonoscopy research will negate the
necessity for bowel cleansing or reduce the test’s invasive nature. In this respect, the two
techniques should be considered complementary. Nevertheless, this view is not universally
accepted, particularly outside Europe. The author predicts the colonoscopy vs CTC ‘turf battle’
will not only continue, but as CTC technique is refined, the debate is likely to intensify. While
this may seem uncomfortable on the surface, competition between protagonists of each
technique, has unquestionably driven forward high quality research in both fields in the past,
and is likely to continue to do so in years to come, benefiting individual patients and colorectal
cancer research in general.

2 2 5
Nevertheless, the author believes that the future of CTC lies in collaborative research. Not only
will CTC continue to occupy a niche alongside colonoscopy but ultimately, it is hoped that
technological developments will enable true integration of CTC and colonoscopy. It is the
author’s view that the ultimate goal of CTC research at present is CT-guided colonoscopic
polypectomy. In a few years it is possible that patients will undergo CTC as a first line
investigation to stratify risk and then, where positive findings are detected, colonoscopy can be
carried out a purely therapeutic procedure, freeing endoscopic resources and streamlining
patient care. However, to succeed, this will require optimal CTC implementation in routine
practice, continued technological developments in image registration and, above all,
cooperation between all interested parties.
It is my sincere hope that the themes explored in this Thesis continue to be developed and
researched over future years. Not only are several sources of bias poorly understood and
incompletely researched, in many cases they appear to be completely unknown to researchers
designing new studies. Furthermore, there remains considerable scope for improving human-
computer interaction, not only for CTC but for radiology in general. CAD algorithms are likely to
improve, as too are the ways in which the observer implements the software. For example, one
research group has recently described a novel reading paradigm where CAD acts as a first
reader(325) yet despite promising results, it is likely that extensive validation will be necessary
before this reading technique can be considered safe enough to gain regulatory approval.
Likewise, new technology such as CASPR will need refinement before integration into
workstations for routine use is permitted. Ultimately, the author envisages the combination of
CASPR and CAD into a single entity whereby the endoluminal surface information assimilated
by CAD could improve CASPR accuracy while incorporating accurate prone-supine
correspondence into CAD would improve polyp detection and dismissal of false positives.
Providing computer processing power continues to progress at its current pace, it is likely that
fully automated CTC interpretation will be theoretically achievable within a few years (whether
or not radiologists consider this desirable). Nonetheless, for the foreseeable future, human
interaction will remain mandatory for interpretation of investigations performed in clinical
practice.
2 2 6
However, at present our knowledge of the relationships between training, experience,
expertise and competence across all radiological subspecialties is very limited. The author
considers that exploring why some radiologists outperform others is central to optimising
training and that eye-tracking technology likely holds the key to this complex subject. However,
it is important to stress that our understanding of visual search, beyond plain radiographic
interpretation, remains in its infancy and the small volume of research presented in this Thesis
belies the extensive collaboration required between eye-tracking scientists, radiologists and
statisticians to arrive at what is essentially the very first step on a long path.
Unfortunately, methodology and medical image perception, while potentially of immense
value, seem to be considered relatively peripheral to cancer research; the direct clinical impact
is not readily appreciated. Consequently, it may be difficult to secure funding when intense
competition exists for limited resources. It is the author’s hope that collaboration with
scientists working across disciplines continues to develop in the future, enabling such crucial
research to be nested into larger, diagnostic performance studies.
Moreover, while research presented in this Thesis relates to gastrointestinal radiology, it is
anticipated that some of the issues raised and method developed may disseminate into a wider
radiological context.
12.3 CONCLUSION
In summary, I believe CTC, optimally implemented, has the potential to improve diagnosis of
colorectal neoplasia and have described research that aims to facilitate this. The current level
of CTC training and experience are of concern and the generalisability of the evidence base is
often questionable. However, my research into observer study design, conjoint analysis and
representative statistical analyses should translate into improved methodology and I am
hopeful that studies of CAD and computer assisted registration described in this Thesis will
ultimately improve diagnostic performance.
Dr Darren Boone. 30th October 2013

2 2 7
APPENDIX A: PUBLICATIONS ARISING FROM THIS THESIS
BOOK CHAPTERS
Boone D, Halligan S, Taylor SA (2013). CTC Background and Development. In: Cash, B. (Ed.),
Colorectal Cancer Screening and Computerized Tomographic Colonography: A Comprehensive
Overview (pp 41-58). New York, USA: Springer
Boone D, Taylor SA, Halligan S. (2013). Rectal cancer. In: E. Neri, L. Faggioni, C. Bartolozzi.(Eds.),
CT Colonography Atlas (pp 133-150). Berlin Heidelberg. Springer-Verlag
INVITED REVIEWS AND EDITORIALS
Boone D, Taylor SA, Halligan S. Evidence Review and Status Update on Computed Tomography
Colonography. Curr Gastroenterol Rep. 2011;13(5):486-94
ORIGINAL ARTICLES
Boone D, Halligan S, Zhu S, Yoa G, Bell N, Ghanouni A, et al. CT Colonography: Discrete choice
experiment of patients' and healthcare professionals’ preferences to FP diagnosis during
colorectal cancer screening. (Under consideration for indexed publication).
Boone D, Halligan S, Taylor S, Altman DG, Mallett S. Assessment of the relative benefit of
computer-aided detection (CAD) for interpretation of CTC by experienced and inexperienced
readers. (Under consideration for indexed publication).

2 2 8
Plumb A, Boone D, Fitzke H, Helbren E, Mallett S. Detection of extracolonic pathology by CTC
colonography: A discrete choice experiment of perceived benefits versus harms. (Under
consideration for indexed publication)
Ghanouni A, Halligan S, Boone D, Taylor SA, Plumb AO,et al. Sensitivity and specificity of CT
colonography for pre-cancerous polyps vs. burden of bowel preparation: Quantifying patients’
preferences via a discrete choice experiment (Under consideration for indexed publication)
Helbren E, Halligan S, Phillips P, Boone D, Fanshawe T, Taylor SA, Manning D, Gale A, Altman
DG, Mallett S. Towards a framework for analysis of eye-tracking studies in the 3D environment:
A study of visual search by experienced readers of endoluminal CT Colonography. (Under
consideration for indexed publication)
Boone D, Halligan S, Roth H, Hampshire T, Helbren E, Slabaugh G, et al. CT Colonography:
External Clinical Validation of an Algorithm for Computer Assisted Prone-Supine Registration
Radiology. 2013 Sep; 268(3):752-60.
Phillips P, Boone D, Mallett S, Taylor SA, Altman DG, Manning D, et al. Method for tracking eye
gaze during interpretation of endoluminal 3D CT colonography: technical description and
proposed metrics for analysis. Radiology 2013;267(3):924-31.
Ghanouni A, Halligan S, Taylor SA, Boone D, Plumb A, Wardle J, et al. Evaluating patients'
preferences for type of bowel preparation prior to screening CT colonography: Convenience
and comfort versus sensitivity and specificity. Clin Radiol 2013.
Ghanouni A, Smith SG, Halligan S, Plumb A, Boone D, Yao GL, et al. Public preferences for
colorectal cancer screening tests: a review of conjoint analysis studies. Expert Rev Med Devices
2013;10(4):489-99.
Ghanouni A, Smith SG, Halligan S, Taylor SA, Plumb A, Boone D, et al. An interview study
analysing patients' experiences and perceptions of non-laxative or full-laxative preparation with
faecal tagging prior to CT colonography. Clin Radiol 2013;68(5):472-8.

2 2 9
Hampshire T, Roth HR, Helbren E, Plumb A, Boone D, Slabaugh G, et al. Endoluminal surface
registration for CT colonography using haustral fold matching. Med Image Anal 2013;17(8):946-
58.
Boone D, Halligan S, Mallett S, Taylor SA, Altman DG. Systematic review: bias in imaging studies
- the effect of manipulating clinical context, recall bias and reporting intensity. Eur Radiol
2012;22(3):495-505.
Ghanouni A, Smith SG, Halligan S, Plumb A, Boone D, Magee MS, et al. Public perceptions and
preferences for CT colonography or colonoscopy in colorectal cancer screening. Patient Educ
Couns 2012;89(1):116-21.
Boone D, Halligan S, Frost R, Kay C, Laghi A, Lefere P, et al. CT Colonography: Who attends
training? A survey of participants at educational workshops. Clin Radiol 2011; 66(6):510-6.
Ghanouni A, Smith S, Halligan S, Taylor S, Plumb A, Boone D, et al. Exploring patients’
experiences and perceptions of either non-laxative or full-laxative preparation with fecal
tagging prior to CTC: An interview study. Clinical Radiology 2012; (In press).
Roth HR, McClelland JR, Boone DJ, Modat M, Cardoso MJ, Hampshire TE, et al. Registration of
the endoluminal surfaces of the colon derived from prone and supine CT colonography.
Medical Physics 2011;38(6):3077-89.
Taylor SA, Robinson C, Boone D, Honeyfield L, Halligan S. Polyp characteristics correctly
annotated by computer-aided detection software but ignored by reporting radiologists during
CT colonography. Radiology 2009;253(3):715-23.
2 3 0
PEER REVIEWED WORKSHOP PROCEEDINGS
Roth H, Boone D, Halligan S, Hampshire T, Slabaugh G, McQuillan J, et al. External Clinical
Validation of Prone and Supine CT Colonography Registration, Abdominal Imaging.
Computational and Clinical Applications, Lecture Notes in Computer Science, 7601, 10-19, Oct
2012.
Hampshire T, Roth H, Boone D, Slabaugh G, Halligan S, Hawkes D, Prone to Supine CT
Colonography: Registration Using a Landmark and Intensity Composite Method, Abdominal
Imaging. Computational and Clinical Applications, Lecture Notes in Computer Science, 7601, 1-
9, Oct 2012.
Roth H, Hampshire T, McClelland J, Hu M, Boone D, Slabaugh G, Halligan S, Hawkes D, Inverse
consistency error in the registration of prone and supine images in CT colonography, MICCAI
Workshop on Computational and Clinical Applications in Abdominal Imaging 2011, Lecture
Notes in Computer Science, 7029, 1-7, 2012.
PEER-REVIEWED CONFERENCE PROCEEDINGS
Roth H, McClelland J, Modat M, Hampshire T, Boone D, Hu M, Ourselin S, Halligan S, Hawkes D,
CT colonography: inverse-consistent symmetric registration of prone and supine inner colon
surfaces, SPIE Medical Imaging 2013.
Hampshire T, Roth H, Hu M, Boone D, Slabaugh G, Punwani S, Halligan S, Hawkes D, Automatic
prone to supine haustral fold matching in CT colonography using a Markov random field
model, 14th International Conference on Medical Image Computing and Computer Assisted
Intervention (MICCAI), Oct 2011.

2 3 1
Hampshire T, Roth H, Hu M, Boone D, Slabaugh G, Punwani S, et al. Automatic prone to supine
haustral fold matching in CT colonography using a Markov random field model. Med Image
Comput Comput Assist Interv. 2011;14(Pt 1):508-15.
Roth H, McClelland J, Modat M, Boone D, Hu MX, Ourselin S, et al. Establishing Spatial
Correspondence between the Inner Colon Surfaces from Prone and Supine CT Colonography.
Ed: Jiang T, Navab N, Pluim JPW, Viergever MA. Medical Image Computing and Computer-
Assisted Intervention - MICCAI 2010, Pt Iii, 2010:497-504.
Roth H, McClelland J, Boone D, Hu M, Ourselin S, Slabaugh G, Halligan S, Hawkes D, Conformal
Mapping of the Inner Colon Surface to a Cylinder for the Application of Prone to Supine
Registration, 14th conference on Medical Image Understanding and Analysis (MIUA), Jul 2010.
Roth H, McClelland J, Modat M, Boone D, Hu M, et al. Establishing spatial correspondence
between the inner colon surfaces from prone and supine ct colonography. Medical Image
Computing and Computer-Assisted Intervention 2010; 497-50
ABSTRACTS
Plumb AO, Halligan S, Boone D, Helbren E, Zhu S. True- and false-positive diagnosis of
extracolonic cancers by CT colonography: discrete choice experiment. Insights Imaging. 2013
June; 4(Suppl 2): 467–518.
Hampshire TE, Roth HR, Helbren E, Plumb A, Boone D, Slabaugh, Halligan S, Hawkes DJ. CT
colonography: Accurate registration of prone and supine endoluminal surfaces of the colon.
Insights into imaging, 2013;4(suppl 1):S328-9
Boone D, Halligan S, Bell N, et al. How do patients and doctors weight the relative importance
of false-positive and false-negative diagnoses of cancer by CT colonography: discrete choice
experiment. Insights into Imaging. 2012;3 (suppl 2):455-503.

2 3 2
Boone D, Halligan S, Mallett S, et al. Computer-aided detection (CAD) for CT colonography:
Incremental benefit for inexperienced over experienced readers. Insights into Imaging.
2012;3(Suppl. 2).
Roth H, McClelland J, Modat M, Hampshire T, Boone D, et al. Inverse-consistent symmetric
registration of inner colon surfaces derived from prone and supine CT colonography, AAPM
2012
Hampshire T, Roth H, Hu M, Boone D et al. Automatic prone to supine haustral fold matching in
CT colonography using a Markov random field model. Med Image Comput Comput Assist
Interv. 2011;14(Pt 1):508-15.
Ye X, Roth H, Hampshire T, Boone D et al. Computer-aided Detection for CT Colonography:
False-Positive Reduction Using Surface-based Prone-Supine Registration. Radiological Society of
North America 2011;2011.
Boone D, Roth H, Hampshire T, et al. CT Colonography: Development and Validation of a Novel
Registration Algorithm to Align Prone and Supine Scans. Radiological Society of North America.
2011.
Boone D, Halligan S, Mallett S, Taylor S, Altman DG. Systematic review: the effect of
manipulating clinical context on studies of diagnostic test accuracy. Insights into Imaging.
2011;2(Suppl. 2).
Boone D, Roth H, Hampshire T, et al. CT colonography: development and validation of a novel
registration algorithm to align prone and supine scans. Insights into Imaging. 2011;2 (Suppl. 1 -
ECR Book of abstracts).
Boone D, Halligan S, Phillips P, et al. CT colonography: Comparison of visual search patterns in
experienced and novice readers. Insights into Imaging. 2011;2(Suppl. 1 - ECR book of abstracts).

2 3 3
Boone D, Roth H, Halligan S, et al. CT colonography: development and validation of a novel
registration algorithm to align prone and supine scans. Insights into Imaging. ESGAR
2011;2(Suppl.2 - ESGAR books of abstracts).
Boone D, Halligan S, Phillips P, et al. CT colonography: Comparison of visual search patterns in
experienced and novice readers. Insights into Imaging. ECR 2011;2(Suppl. 2 - ESGAR book of
abstracts).
Phillips, P., Boone, D., Mallett, S., Taylor, S., Manning, D., Gale, A., Halligan, S., Altman, D. Eye
Tracking The Interpretation Of Endoluminal Fly-Through In CT Colonography. Medical Image
Perception Society XIV, Dublin, Ireland. August 2011.
Roth H, McClelland J, Boone D, et al. Conformal Mapping of the Inner Colon Surface to a
Cylinder for the Application of Prone to Supine Registration. Med Image Comput Comput Assist
Interv 2010.
Roth H, McClelland J, Modat M, Boone D et al. Establishing spatial correspondence between
the inner colon surfaces from prone and supine CT colonography. Med Image Comput Comput
Assist Interv. 2010;13(Pt 3):497-504.
Boone D, Frost R, Kay C, et al. CTC: who attends for training? a survey of participants attending
the ESGAR CTC workshops. European Radiology. 2010;20(Suppl. 1):8.
Boone D, Phillips P, Mallett S, et al. Recording of visual search pattern during interpretation of
CTC: feasibility study and pilot data. European Radiology. 2010;20(Suppl 1):9.
Mallett S, Boone D, Phillips P, et al. Statistical design and preliminary analysis of eye tracking
studies to investigate diagnostic performance in CT colonography. Methods for Evaluating
Medical Tests and Biomarkers: Second International Symposium. 2010.

2 3 4
APPENDIX B: ESGAR WORKSHOP QUESTIONNAIRE
Dear Dr. ….. Thank you very much for your registration for the (WORKSHOP NUMBER) ESGAR CT-Colonography Workshop that takes place in (WORKSHOP LOCATION) next week. The ESGAR CTC Committee is evaluating some statistical data of our participants for research purposes. Therefore, may I kindly ask you on their behalf, to complete a pre-survey (by using the link below)? The results will also allow the faculty to be prepared for the correct target group. The compilation of this survey should not take you longer than 5 minutes. WEB-LINK We wish you a nice trip to (WORKSHOP LOCATION). Kind regards, The ESGAR Office On behalf of the CTC Committee
1. Are you (please tick the single response that best describes you): Medical: Trainee radiologist
Medical: Staff radiologist with a subspecialty interest in GI radiology Medical: Staff radiologist with a subspecialty interest in CT scanning Medical: Staff radiologist with a general interest Medical: Non-radiologist (e.g. gastroenterologist) Non-medical (e.g. radiographic technician) 2. Are you working in (HOST COUNTRY)? Yes No 3. Have you had any hands-on experience of CTC interpretation before this workshop? Please tick all that apply. None whatsoever I have sat in when others have interpreted cases at my local hospital I have interpreted some cases myself I have previously been to a colonography workshop I have previously interpreted some educational colonography datasets 4. If you have interpreted some cases yourself, what is your experience to date? Fewer than 10 cases Fewer than 50 cases Fewer than 100 cases 100 cases or more 300 cases or more 5. How do you practice (or intend to practice) CTC? (Please tick all that apply at this point in time).
Public hospital practice; symptomatic patients. Private hospital practice; symptomatic patients Private hospital practice; asymptomatic patients (i.e. screening) I don’t intend to practice – I’m just curious.
6. Is CTC being performed at the local hospital(s) in which you work? Please tick all that apply.
No. Yes, in the public hospital Yes, in the private hospital
7. If CTC is being performed at the local hospital(s) in which you work, how is the patients’ colon usually prepared? Please tick all that apply.

2 3 5
Full bowel preparation in most cases A reduced preparation used in most cases Full bowel preparation in younger patients, reduced in older
8. If CTC is being performed at the local hospital(s) in which you work, do you use faecal tagging (i.e. positive contrast) to label residual stool? Please tick all that apply.
Yes, in most patients No, in most patients
9. If CTC is being performed at the local hospitals in which you work, what gas do you most often use to insufflate the colon?
Room air Carbon dioxide
10. If CTC is being performed at the local hospitals in which you work, do you usually administer a spasmolytic routinely (eg Buscopan, glucagon)
Yes No
11. If CTC is being performed at the local hospitals in which you work, how are the cases most often interpreted?
A primary 2D read alone A primary 2D read with 3D for problem areas
A primary 3D read (includes ‘virtual disSection’ etc) 12. What sort of CT machine are you using (or intend to use) for CTC? Please tick all that apply at your local hospital(s). Helical single slice 4-detector row
8-detector row 16-detector row 32-detector row 40-detector row 64-detector row
13. Do you have dedicated CTC interpretation software available at your local hospital(s)? If so, please state which: (FREE TEXT BOX) 14. What do you think will be the present or future role of CTC in the following clinical situations that pertain to the colon? Please tick all responses that apply to you. Detecting colon cancers in symptomatic patients of all ages.
Detecting colon cancers, but mostly restricted to elderly symptomatic patients. Screening for colorectal cancer & polyps in patients of all relevant ages Screening for colorectal cancer & polyps, but mostly restricted to elderly attendees.
15. It is well-established that CTC can detect pathology outside the colon. On balance overall, do you think that this attribute is: (please tick all that apply):
A good thing in symptomatic patients. A bad thing in symptomatic patients.
A good thing in asymptomatic patients (ie screenees). A bad thing in asymptomatic patients (ie screenees)
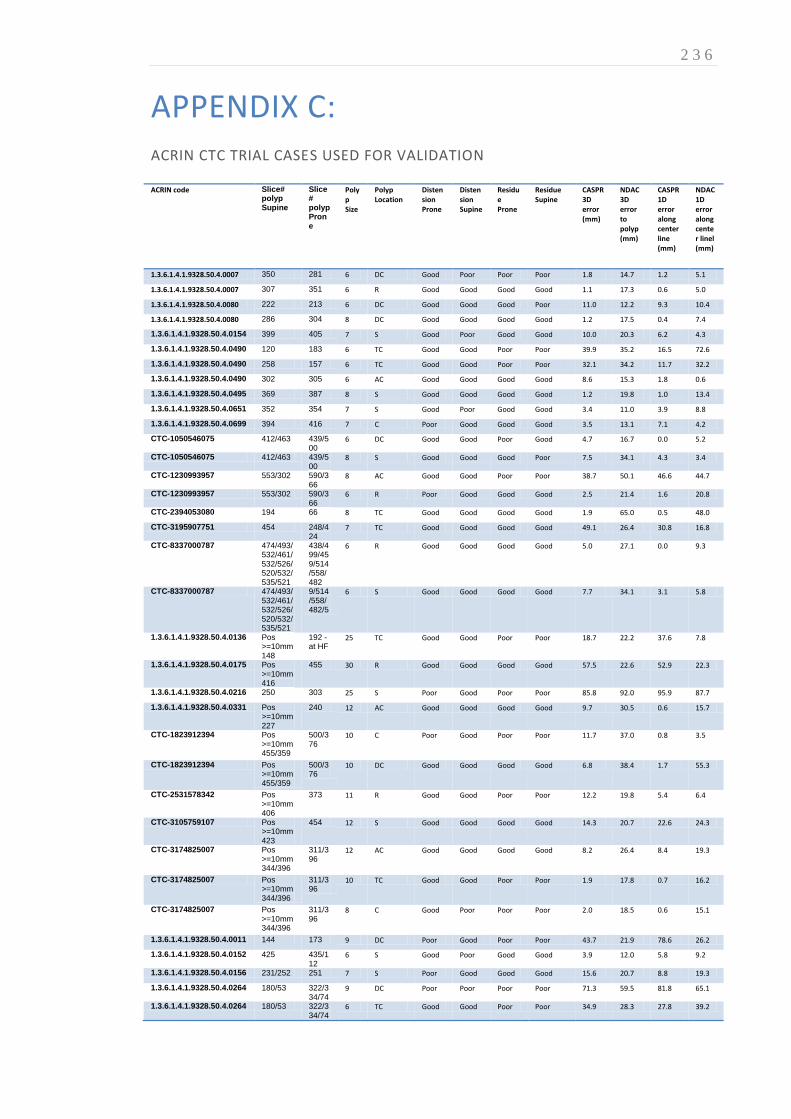
2 3 6
APPENDIX C: ACRIN CTC TRIAL CASES USED FOR VALIDATION
ACRIN code Slice# polyp Supine
Slice# polyp Prone
Polyp Size
Polyp Location
Distension Prone
Distension Supine
Residue Prone
Residue Supine
CASPR 3D error (mm)
NDAC 3D error to polyp (mm)
CASPR 1D error along center line (mm)
NDAC 1D error along center linel (mm)
1.3.6.1.4.1.9328.50.4.0007 350 281 6 DC Good Poor Poor Poor 1.8 14.7 1.2 5.1
1.3.6.1.4.1.9328.50.4.0007 307 351 6 R Good Good Good Good 1.1 17.3 0.6 5.0
1.3.6.1.4.1.9328.50.4.0080 222 213 6 DC Good Good Good Poor 11.0 12.2 9.3 10.4
1.3.6.1.4.1.9328.50.4.0080 286 304 8 DC Good Good Good Good 1.2 17.5 0.4 7.4
1.3.6.1.4.1.9328.50.4.0154 399 405 7 S Good Poor Good Good 10.0 20.3 6.2 4.3
1.3.6.1.4.1.9328.50.4.0490 120 183 6 TC Good Good Poor Poor 39.9 35.2 16.5 72.6
1.3.6.1.4.1.9328.50.4.0490 258 157 6 TC Good Good Poor Poor 32.1 34.2 11.7 32.2
1.3.6.1.4.1.9328.50.4.0490 302 305 6 AC Good Good Good Good 8.6 15.3 1.8 0.6
1.3.6.1.4.1.9328.50.4.0495 369 387 8 S Good Good Good Good 1.2 19.8 1.0 13.4
1.3.6.1.4.1.9328.50.4.0651 352 354 7 S Good Poor Good Good 3.4 11.0 3.9 8.8
1.3.6.1.4.1.9328.50.4.0699 394 416 7 C Poor Good Good Good 3.5 13.1 7.1 4.2
CTC-1050546075 412/463 439/500
6 DC Good Good Poor Good 4.7 16.7 0.0 5.2
CTC-1050546075 412/463 439/500
8 S Good Good Good Poor 7.5 34.1 4.3 3.4
CTC-1230993957 553/302 590/366
8 AC Good Good Poor Poor 38.7 50.1 46.6 44.7
CTC-1230993957 553/302 590/366
6 R Poor Good Good Good 2.5 21.4 1.6 20.8
CTC-2394053080 194 66 8 TC Good Good Good Good 1.9 65.0 0.5 48.0
CTC-3195907751 454 248/424
7 TC Good Good Good Good 49.1 26.4 30.8 16.8
CTC-8337000787 474/493/532/461/532/526/520/532/535/521
438/499/459/514/558/482
6 R Good Good Good Good 5.0 27.1 0.0 9.3
CTC-8337000787 474/493/532/461/532/526/520/532/535/521
9/514/558/482/5
6 S Good Good Good Good 7.7 34.1 3.1 5.8
1.3.6.1.4.1.9328.50.4.0136 Pos >=10mm 148
192 - at HF
25 TC Good Good Poor Poor 18.7 22.2 37.6 7.8
1.3.6.1.4.1.9328.50.4.0175 Pos >=10mm 416
455 30 R Good Good Good Good 57.5 22.6 52.9 22.3
1.3.6.1.4.1.9328.50.4.0216 250 303 25 S Poor Good Poor Poor 85.8 92.0 95.9 87.7
1.3.6.1.4.1.9328.50.4.0331 Pos >=10mm 227
240 12 AC Good Good Good Good 9.7 30.5 0.6 15.7
CTC-1823912394 Pos >=10mm 455/359
500/376
10 C Poor Good Poor Poor 11.7 37.0 0.8 3.5
CTC-1823912394 Pos >=10mm 455/359
500/376
10 DC Good Good Good Good 6.8 38.4 1.7 55.3
CTC-2531578342 Pos >=10mm 406
373 11 R Good Good Poor Poor 12.2 19.8 5.4 6.4
CTC-3105759107 Pos >=10mm 423
454 12 S Good Good Good Good 14.3 20.7 22.6 24.3
CTC-3174825007 Pos >=10mm 344/396
311/396
12 AC Good Good Good Good 8.2 26.4 8.4 19.3
CTC-3174825007 Pos >=10mm 344/396
311/396
10 TC Good Good Poor Poor 1.9 17.8 0.7 16.2
CTC-3174825007 Pos >=10mm 344/396
311/396
8 C Good Poor Poor Poor 2.0 18.5 0.6 15.1
1.3.6.1.4.1.9328.50.4.0011 144 173 9 DC Poor Good Poor Poor 43.7 21.9 78.6 26.2
1.3.6.1.4.1.9328.50.4.0152 425 435/112
6 S Good Poor Good Good 3.9 12.0 5.8 9.2
1.3.6.1.4.1.9328.50.4.0156 231/252 251 7 S Poor Good Good Good 15.6 20.7 8.8 19.3
1.3.6.1.4.1.9328.50.4.0264 180/53 322/334/74
9 DC Poor Poor Poor Poor 71.3 59.5 81.8 65.1
1.3.6.1.4.1.9328.50.4.0264 180/53 322/334/74
6 TC Good Good Poor Poor 34.9 28.3 27.8 39.2

2 3 7
ACRIN code Slice# polyp Supine
Slice# polyp Prone
Polyp Size
Polyp Location
Distension Prone
Distension Supine
Residue Prone
Residue Supine
CASPR 3D error (mm)
NDAC 3D error to polyp (mm)
CASPR 1D error along center line (mm)
NDAC 1D error along center linel (mm)
1.3.6.1.4.1.9328.50.4.0264 180/53 322/334/74
6 DC Good Poor Good Good 12.5 22.2 15.4 15.4
1.3.6.1.4.1.9328.50.4.0269 465/429 490/435
7 S Poor Poor Good Good 41.2 17.9 47.2 14.6
1.3.6.1.4.1.9328.50.4.0455 302/185/395/499
305/447/532
8 R Good Poor Good Good 20.2 23.8 21.4 2.0
1.3.6.1.4.1.9328.50.4.0633 265 310 7 AC Good Good Poor Poor 50.4 31.6 48.0 19.6
1.3.6.1.4.1.9328.50.4.0633 265 310 7 AC Good Poor Good Good 76.9 28.6 88.6 21.2
1.3.6.1.4.1.9328.50.4.0635 307 338 8 DC Good Good Poor Poor 8.2 30.6 1.1 15.0
1.3.6.1.4.1.9328.50.4.0635 307 338 6 DC Good Poor Good Poor 27.0 56.3 1.6 46.5
CTC-1137132466 196 220 8 R Poor Good Good Good 6.9 25.9 0.0 17.1
CTC-1626846173 382 373 7 S Good Poor Poor Poor 30.1 51.7 12.7 41.3
CTC-1639466381 397 386 8 R Poor Good Good Good 31.4 23.9 31.2 21.9
CTC-3105782108 226/165/67
285/166/60
6 R Poor Good Good Good 12.7 24.5 8.0 1.2
CTC-3105782108 226/165/67
285/166/60
6 R Good Good Poor Good 40.7 21.9 19.4 8.7
CTC-3304961391 277 308 6 C Poor Poor Good Poor 1.0 4.1 0.7 0.7
CTC-6234351055 382 373 8 DC Good Poor Poor Poor 11.4 51.1 8.1 51.3
1.3.6.1.4.1.9328.50.4.0233 Pos >=10mm 353
355 18 S Poor Good Good Poor 24.9 21.3 21.1 22.1
1.3.6.1.4.1.9328.50.4.0259 Pos >=10mm 259
243 30 C Good Poor Good Good 33.3 34.3 57.1 37.0
1.3.6.1.4.1.9328.50.4.0290 Pos >=10mm 460
266/526
20 R Poor Poor Poor Poor 21.2 17.2 15.0 13.9
1.3.6.1.4.1.9328.50.4.0326 Pos >=10mm 194
21 C Poor Poor Poor Poor 2.7 5.5 1.1 2.0
1.3.6.1.4.1.9328.50.4.0326 Pos >=10mm 194
6 R Good Poor Good Poor 19.7 35.4 18.1 25.3
1.3.6.1.4.1.9328.50.4.0434 Pos >=10mm 251
244 12 AC Poor Poor Good Good 10.8 28.7 0.9 11.2
1.3.6.1.4.1.9328.50.4.0516 Pos >=10mm 240
257 20 AC Good Good Good Poor 3.3 23.1 1.2 7.7
1.3.6.1.4.1.9328.50.4.0518 Pos >=10mm 343/423/400
429/370
19 S Poor Poor Poor Good 4.6 14.6 6.1 18.1
1.3.6.1.4.1.9328.50.4.0518 Pos >=10mm 343/423/400
429/370
12 AC Good Poor Poor Poor 27.2 8.7 29.8 8.4
1.3.6.1.4.1.9328.50.4.0552 Pos >=10mm 178
11 C Good Good Poor Good 15.1 29.0 1.6 11.3
1.3.6.1.4.1.9328.50.4.0552 Pos >=10mm 178
6 AC Poor Poor Good Good 2.5 20.3 1.7 5.1
1.3.6.1.4.1.9328.50.4.0660 Pos >=10mm 256/246
160 10 S Good Good Good Good 4.7 36.0 1.6 28.8
CTC-1038654821 Pos >=10mm 75
87 40 AC Good Poor Poor Poor 1.2 22.2 11.6 25.6
CTC-1968343337 Pos >=10mm 189
127/212
14 S Poor Poor Poor Poor 78.2 55.3 72.6 52.4
CTC-2414824407 Pos >=10mm 524
533 10 R Good Good Poor Poor 17.0 45.1 1.8 39.1
CTC-3097916992 Pos >=10mm 223
142 25 AC Good Good Good Poor 31.6 26.3 32.8 27.7
CTC-7657031778 Pos >=10mm 428
436 14 R Poor Poor Good Poor 20.9 14.5 7.9 12.3
1.3.6.1.4.1.9328.50.4.0040 Pos >=10mm 147/275
148/311
55 AC Good Poor Good Good 12.4 25.5 44.8 43.0
1.3.6.1.4.1.9328.50.4.0104 Pos >=10mm 392/68
347/86
30 C Poor Good Poor Poor 23.9 11.5 12.3 8.2
mean 19.9 27.4 17.9 21.0
std 20.7 15.1 23.9 18.5
median 11.9 23.5 8.0 15.5

2 3 8
BIBLIOGRAPHY
1. World.Health.Organisation. Cancer. 2012.
2. Atkin WS, Edwards R, Kralj-Hans I, et al. Once-only flexible sigmoidoscopy screening in prevention of
colorectal cancer: A multicentre randomised controlled trial. The Lancet. 2010;375(9726):1624-33.
3. Winawer SJ. Colorectal cancer screening. Best Practice & Research Clinical Gastroenterology.
2007;21(6):1031-48.
4. Taku K, Sano Y, Fu KI, et al. Iatrogenic perforation associated with therapeutic colonoscopy: a
multicenter study in Japan. J Gastroenterol Hepatol. 2007;22(9):1409-14.
5. Glick SN. Comparison of colonoscopy and double-contrast barium enema. N Engl J Med.
2000;343(23):1728; author reply 9-30.
6. Taylor SA, Halligan S, Burling D, Bassett P, Bartram CI. Intra-individual comparison of patient
acceptability of multidetector-row CT colonography and double-contrast barium enema. Clin Radiol.
2005;60(2):207-14.
7. Halligan S, Fenlon HM. Virtual colonoscopy. BMJ. 1999;319(7219):1249-52.
8. Burling D, Halligan S, Slater A, Noakes MJ, Taylor SA. Potentially serious adverse events at CT
colonography in symptomatic patients: national survey of the United Kingdom. Radiology. 2006;239(2):464-
71.
9. Taylor SA, Halligan S, Saunders BP, Bassett P, Vance M, Bartram CI. Acceptance by patients of
multidetector CT colonography compared with barium enema examinations, flexible sigmoidoscopy, and
colonoscopy. Am J Roentgenol. 2003;181(4):913-21.
10. Halligan S, Lilford RJ, Wardle J, et al. Design of a multicentre randomized trial to evaluate CT
colonography versus colonoscopy or barium enema for diagnosis of colonic cancer in older symptomatic
patients: the SIGGAR study. Trials. 2007;8:32.
11. Fenlon HM, Nunes DP, Schroy PC, Barish MA, Clarke PD, Ferrucci JT. A comparison of virtual and
conventional colonoscopy for the detection of colorectal polyps. N Engl J Med. 1999;341(20):1496-503.
12. Yee J, Akerkar GA, Hung RK, Steinauer-Gebauer AM, Wall SD, McQuaid KR. Colorectal neoplasia:
performance characteristics of CT colonography for detection in 300 patients. Radiology. 2001;219(3):685-92.
13. Van Gelder RE, Nio CY, Florie J, et al. Computed tomographic colonography compared with
colonoscopy in patients at increased risk for colorectal cancer. Gastroenterology. 2004;127(1):41-8.
14. Pickhardt PJ, Choi JR, Hwang I, et al. Computed tomographic virtual colonoscopy to screen for
colorectal neoplasia in asymptomatic adults. N Engl J Med. 2003;349(23):2191-200.
15. Halligan S, Altman DG, Taylor SA, et al. CT colonography in the detection of colorectal polyps and
cancer: systematic review, meta-analysis, and proposed minimum data set for study level reporting. Radiology.
2005;237(3):893-904.
16. Johnson CD, Chen M-H, Toledano AY, et al. Accuracy of CT colonography for detection of large
adenomas and cancers. N Engl J Med. 2008;359(18799557):1207-17.
17. Taylor S, Halligan S, Burling D, et al. CT colonography: effect of experience and training on reader
performance. European Radiology. 2004;14(6):1025-33.
18. Krupinski EA, Berbaum KS. The Medical Image Perception Society Update on Key Issues for Image
Perception Research1. Radiology. 2009;253(1):230-3.
19. Halligan S, Mallett S, Altman DG, et al. Incremental Benefit of Computer-aided Detection when Used
as a Second and Concurrent Reader of CT Colonographic Data: Multiobserver Study. Radiology. 2010.
20. Dachman AH, Obuchowski NA, Hoffmeister JW, et al. Effect of computer-aided detection for CT
colonography in a multireader, multicase trial. Radiology. 2010;256(3):827-35.
21. Halligan S, Mallett S, Altman DG, et al. Incremental benefit of computer-aided detection when used
as a second and concurrent reader of CT colonographic data: multiobserver study. Radiology.
2011;258(21084409):469-76.
22. Obuchowski NA, Hillis SL. Sample size tables for computer-aided detection studies. AJR Am J
Roentgenol. 2011;197(22021528):821-8.
23. Bossuyt PM, Irwig L, Craig J, Glasziou P. Comparative accuracy: assessing new tests against existing
diagnostic pathways. BMJ. 2006;332(7549):1089-92.
24. Mallett S, Halligan S, Thompson M, Collins GS, Altman DG. Interpreting diagnostic accuracy studies
for patient care. BMJ. 2012;345.

2 3 9
25. Taylor SA, Robinson C, Boone D, Honeyfield L, Halligan S. Polyp characteristics correctly annotated by
computer-aided detection software but ignored by reporting radiologists during CT colonography. Radiology.
2009;253(3):715-23.
26. Chen SC, Lu DS, Hecht JR, Kadell BM. CT colonography: value of scanning in both the supine and
prone positions. AJR Am J Roentgenol. 1999;172(10063842):595-9.
27. Punwani S, Halligan S, Tolan D, Taylor SA, Hawkes D. Quantitative assessment of colonic movement
between prone and supine patient positions during CT colonography. Br J Radiol. 2009;82(978):475-81.
28. Rockey DC, Paulson E, Niedzwiecki D, et al. Analysis of air contrast barium enema, computed
tomographic colonography, and colonoscopy: prospective comparison. Lancet. 2005;365(9456):305-11.
29. Cotton PB, Durkalski VL, Pineau BC, et al. Computed tomographic colonography (virtual
colonoscopy): a multicenter comparison with standard colonoscopy for detection of colorectal neoplasia.
JAMA. 2004;291(14):1713-9.
30. Taylor SA, Laghi A, Lefere P, Halligan S, Stoker J. European Society of Gastrointestinal and Abdominal
Radiology (ESGAR): Consensus statement on CT colonography. European Radiology. 2007;17(2):575-9.
31. Burling D. CT colonography standards. Clin Radiol. 2010;65(6):474-80.
32. Von Wagner C, Halligan S, Atkin WS, Lilford RJ, Morton D, Wardle J. Choosing between CT
colonography and colonoscopy in the diagnostic context: a qualitative study of influences on patient
preferences. Health Expectations. 2009;12(1):18-26.
33. Von Wagner C, Knight K, Halligan S, et al. Patient experiences of colonoscopy, barium enema and CT
colonography: a qualitative study. Br J Radiol. 2009;82(973):13-9.
34. Halligan S, Altman DG, Mallett S, et al. Computed tomographic colonography: assessment of
radiologist performance with and without computer-aided detection. Gastroenterology.
2006;131(17087934):1690-9.
35. Slater A, Taylor SA, Tam E, et al. Reader error during CT colonography: causes and implications for
training. Eur Radiol. 2006;16(10):2275-83.
36. Barish MA, Soto JA, Ferrucci JT. Consensus on current clinical practice of virtual colonoscopy. AJR Am
J Roentgenol. 2005;184(3):786-92.
37. Krupinski EA. Visual scanning patterns of radiologists searching mammograms. Acad Radiol.
1996;3(2):137-44.
38. Krupinski EA. Visual search of mammographic images: influence of lesion subtlety. Acad Radiol.
2005;12(8):965-9.
39. Kundel HL, Nodine CF, Toto L. Searching for lung nodules. The guidance of visual scanning. Invest
Radiol. 1991;26(9):777-81.
40. Pickhardt PJ. Three-dimensional endoluminal CT colonography (virtual colonoscopy): comparison of
three commercially available systems. AJR Am J Roentgenol. 2003;181(6):1599-606.
41. Acar B, Napel S, Paik D, et al. Medial axis registration of supine and prone CT colonography data.
Engineering in Medicine and Biology Society, 2001 Proc 23rd Annual International Conference of the IEEE.
2002;3:2433-6.
42. Acar B, Napel S, Paik DS, Li P, Yee J, Beaulieu CF. Registration of supine and prone CT colonography
data: Method and evaluation. Radiology. 2001;221:332-3.
43. Suh JW, Wyatt CL. Deformable registration of supine and prone colons for computed tomographic
colonography. J Comput Assist Tomogr. 2009;33(6):902-11.
44. Coin CG, Wollett FC, Coin JT, Rowland M, DeRamos RK, Dandrea R. Computerized radiology of the
colon: a potential screening technique. Comput Radiol. 1983;7(4):215-21.
45. Vining DJ GD, Bechtold RE, et al. Technical feasibility of colon imaging with helical CT and virtual
reality. Am J Roentgenol. 1994;162(S):1.
46. Steine S, Stordahl A, Lunde OC, Loken K, Laerum E. Double-contrast barium enema versus
colonoscopy in the diagnosis of neoplastic disorders: aspects of decision-making in general practice. Fam
Pract. 1993;10(3):288-91.
47. Rex DK, Rahmani EY, Haseman JH, Lemmel GT, Kaster S, Buckley JS. Relative sensitivity of colonoscopy
and barium enema for detection of colorectal cancer in clinical practice. Gastroenterology. 1997;112(1):17-23.
48. Halligan S, Marshall M, Taylor S, et al. Observer variation in the detection of colorectal neoplasia on
double-contrast barium enema: implications for colorectal cancer screening and training. ClinRadiol.
2003;58(12):948-54.
49. Glick S. Double-contrast barium enema for colorectal cancer screening: a review of the issues and a
comparison with other screening alternatives. AJR Am J Roentgenol. 2000;174(6):1529-37.
2 4 0
50. Winawer SJ, Stewart ET, Zauber AG, et al. A comparison of colonoscopy and double-contrast barium
enema for surveillance after polypectomy. National Polyp Study Work Group. N Engl J Med.
2000;342(24):1766-72.
51. Fletcher RH. The end of barium enemas? N Engl J Med. 2000;342(24):1823-4.
52. Levine MS, Glick SN, Rubesin SE, Laufer I. Double-contrast barium enema examination and colorectal
cancer: a plea for radiologic screening. Radiology. 2002;222(2):313-5.
53. Fink M, Freeman AH, Dixon AK, Coni NK. Computed tomography of the colon in elderly people. BMJ.
1994;308(6935):1018.
54. Dixon AK, Freeman AH, Coni NK. CT of the colon in frail elderly patients. SeminUltrasound CT MR.
1995;16(2):165-72.
55. Amin Z, Boulos PB, Lees WR. Technical report: spiral CT pneumocolon for suspected colonic
neoplasms. ClinRadiol. 1996;51(1):56-61.
56. Harvey CJ, Renfrew I, Taylor S, Gillams AR, Lees WR. Spiral CT pneumocolon: applications, status and
limitations. EurRadiol. 2001;11(9):1612-25.
57. Rogalla P, Meiri N, Ruckert JC, Hamm B. Colonography using multislice CT. Eur J Radiol.
2000;36(2):81-5.
58. Morrin MM, Farrell RJ, Kruskal JB, Reynolds K, McGee JB, Raptopoulos V. Utility of intravenously
administered contrast material at CT colonography. Radiology. 2000;217(11110941):765-71.
59. Yee J, Hung RK, Akerkar GA, Wall SD. The usefulness of glucagon hydrochloride for colonic distention
in CT colonography. AJR Am J Roentgenol. 1999;173(10397121):169-72.
60. Morrin MM, Farrell RJ, Keogan MT, Kruskal JB, Yam C-S, Raptopoulos V. CT colonography: colonic
distention improved by dual positioning but not intravenous glucagon. Eur Radiol. 2002;12(11870464):525-30.
61. Macari M, Lavelle M, Pedrosa I, et al. Effect of different bowel preparations on residual fluid at CT
colonography. Radiology. 2001;218(11152814):274-7.
62. Zalis ME, Hahn PF. Digital subtraction bowel cleansing in CT colonography. AJR Am J Roentgenol.
2001;176(11222197):646-8.
63. Fletcher JG, Johnson CD, Welch TJ, et al. Optimization of CT colonography technique: prospective
trial in 180 patients. Radiology. 2000;216(10966698):704-11.
64. Callstrom MR, Johnson CD, Fletcher JG, et al. CT colonography without cathartic preparation:
feasibility study. Radiology. 2001;219(11376256):693-8.
65. Beaulieu CF, Napel S, Daniel BL, et al. Detection of colonic polyps in a phantom model: implications
for virtual colonoscopy data acquisition. JComputAssistTomogr. 1998;22(4):656-63.
66. Dachman AH, Lieberman J, Osnis RB, et al. Small simulated polyps in pig colon: sensitivity of CT
virtual colography. Radiology. 1997;203(2):427-30.
67. Taylor SA, Halligan S, Bartram CI, et al. Multi-detector row CT colonography: effect of collimation,
pitch, and orientation on polyp detection in a human colectomy specimen. Radiology. 2003;229(1):109-18.
68. Hara AK, Johnson CD, Reed JE, et al. Reducing data size and radiation dose for CT colonography. AJR
Am J Roentgenol. 1997;168(9129408):1181-4.
69. Fenlon HM, Clarke PD, Ferrucci JT. Virtual colonoscopy: imaging features with colonoscopic
correlation. AJR AmJRoentgenol. 1998;170(5):1303-9.
70. Hara AK, Johnson CD, Reed JE. Colorectal lesions: evaluation with CT colography. Radiographics.
1997;17(5):1157-67.
71. Fenlon HM, Nunes DP, Clarke PD, Ferrucci JT. Colorectal neoplasm detection using virtual
colonoscopy: a feasibility study. Gut. 1998;43(6):806-11.
72. Royster AP, Fenlon HM, Clarke PD, Nunes DP, Ferrucci JT. CT colonoscopy of colorectal neoplasms:
two-dimensional and three-dimensional virtual-reality techniques with colonoscopic correlation. AJR Am J
Roentgenol. 1997;169(5):1237-42.
73. Dachman AH, Kuniyoshi JK, Boyle CM, et al. CT colonography with three-dimensional problem solving
for detection of colonic polyps. AJR AmJRoentgenol. 1998;171(4):989-95.
74. Hara AK, Johnson CD, Reed JE, et al. Detection of colorectal polyps with CT colography: initial
assessment of sensitivity and specificity. Radiology. 1997;205(1):59-65.
75. Yee J, Kumar NN, Hung RK, Akerkar GA, Kumar PR, Wall SD. Comparison of supine and prone
scanning separately and in combination at CT colonography. Radiology. 2003;226(3):653-61.
76. Fenlon HM, Ferrucci JT. First International Symposium on Virtual Colonoscopy. AJR Am J Roentgenol.
1999;173(3):565-9.
77. Johnson CD, Hara AK, Reed JE. Virtual endoscopy: what's in a name? AJR Am J Roentgenol.
1998;171(5):1201-2.

2 4 1
78. Laghi A, Catalano C, Panebianco V, Iannaccone R, Iori S, Passariello R. [Optimization of the technique
of virtual colonoscopy using a multislice spiral computerized tomography]. Radiol Med. 2000;100(6):459-64.
79. Laghi A, Iannaccone R, Mangiapane F, Piacentini F, Iori S, Passariello R. Experimental colonic phantom
for the evaluation of the optimal scanning technique for CT colonography using a multidetector spiral CT
equipment. Eur Radiol. 2003;13(3):459-66.
80. Rogalla P, Meiri N. CT colonography: data acquisition and patient preparation techniques. Semin
Ultrasound CT MR. 2001;22(5):405-12.
81. Robinson P, Burnett H, Nicholson DA. The use of minimal preparation computed tomography for the
primary investigation of colon cancer in frail or elderly patients. Clin Radiol. 2002;57(12014937):389-92.
82. Taylor SA, Halligan S, Goh V, Morley S, Atkin W, Bartram CI. Optimizing Bowel Preparation for
Multidetector Row CT Colonography: Effect of Citramag and Picolax. Clinical Radiology. 2003;58(9):723-32.
83. Taylor SA, Halligan S, Goh V, et al. Optimizing colonic distention for multi-detector row CT
colonography: effect of hyoscine butylbromide and rectal balloon catheter. Radiology. 2003;229(1):99-108.
84. van Gelder RE, Venema HW, Serlie IW, et al. CT colonography at different radiation dose levels:
feasibility of dose reduction. Radiology. 2002;224(1):25-33.
85. Iannaccone R, Laghi A, Catalano C, et al. Detection of colorectal lesions: lower-dose multi-detector
row helical CT colonography compared with conventional colonoscopy. Radiology. 2003;229(3):775-81.
86. Svensson MH, Svensson E, Lasson A, Hellstrom M. Patient acceptance of CT colonography and
conventional colonoscopy: prospective comparative study in patients with or suspected of having colorectal
disease. Radiology. 2002;222(2):337-45.
87. Lefere PA, Gryspeerdt SS, Dewyspelaere J, Baekelandt M, Van Holsbeeck BG. Dietary fecal tagging as
a cleansing method before CT colonography: initial results polyp detection and patient acceptance. Radiology.
2002;224(2):393-403.
88. Gluecker TM, Johnson CD, Harmsen WS, et al. Colorectal cancer screening with CT colonography,
colonoscopy, and double-contrast barium enema examination: prospective assessment of patient perceptions
and preferences. Radiology. 2003;227(2):378-84.
89. Thomeer M, Bielen D, Vanbeckevoort D, et al. Patient acceptance for CT colonography: what is the
real issue? Eur Radiol. 2002;12(6):1410-5.
90. Iannaccone R, Laghi A, Catalano C, et al. Computed tomographic colonography without cathartic
preparation for the detection of colorectal polyps. Gastroenterology. 2004;127(5):1300-11.
91. European Society of Gastrointestinal and Abdominal Radiology CT Colonography Study Group
Investigators E. Effect of directed training on reader performance for CT colonography: multicenter study.
Radiology. 2007;242(1):152-61.
92. Burling D, Halligan S, Altman DG, et al. CT colonography interpretation times: effect of reader
experience, fatigue, and scan findings in a multi-centre setting. Eur Radiol. 2006;16(8):1745-9.
93. Burling D, Halligan S, Altman DG, et al. Polyp measurement and size categorisation by CT
colonography: effect of observer experience in a multi-centre setting. Eur Radiol. 2006;16(8):1737-44.
94. Laghi A, Iannaccone R, Carbone I, et al. Computed tomographic colonography (virtual colonoscopy):
blinded prospective comparison with conventional colonoscopy for the detection of colorectal neoplasia.
Endoscopy. 2002;34(6):441-6.
95. Taylor SA, Halligan S, Vance M, Windsor A, Atkin W, Bartram CI. Use of multidetector-row computed
tomographic colonography before flexible sigmoidoscopy in the investigation of rectal bleeding. Br J Surg.
2003;90(9):1163-4.
96. Neri E, Giusti P, Battolla L, et al. Colorectal cancer: role of CT colonography in preoperative evaluation
after incomplete colonoscopy. Radiology. 2002;223(3):615-9.
97. Macari M, Bini EJ, Xue X, et al. Colorectal neoplasms: prospective comparison of thin-section low-
dose multi-detector row CT colonography and conventional colonoscopy for detection. Radiology.
2002;224(2):383-92.
98. Johnson CD, Harmsen WS, Wilson LA, et al. Prospective blinded evaluation of computed tomographic
colonography for screen detection of colorectal polyps. Gastroenterology. 2003;125(2):311-9.
99. Zalis ME, Barish MA, Choi JR, et al. CT colonography reporting and data system: a consensus
proposal. Radiology. 2005;236(1):3-9.
100. Position of the American Gastroenterological Association (AGA) Institute on Computed Tomographic
Colonography. Gastroenterology. 2006;131(5):1627-8.
101. Burling D, Halligan S, Taylor SA, Usiskin S, Bartram CI. CT colonography practice in the UK: a national
survey. ClinRadiol. 2004;59(1):39-43.

2 4 2
102. Spinzi G, Belloni G, Martegani A, Sangiovanni A, Del Favero C, Minoli G. Computed tomographic
colonography and conventional colonoscopy for colon diseases: A prospective, blinded study. Am J
Gastroenterol. 2001;96(2):394-400.
103. Soto JA, Barish MA, Yee J. Reader Training in CT Colonography: How Much Is Enough?1. Radiology.
2005;237(1):26-7.
104. Burling D, Halligan S, Atchley J, et al. CT colonography: interpretative performance in a non-academic
environment. Clin Radiol. 2007;62(5):424-9; discussion 30-1.
105. McFarland EG, Fletcher JG, Pickhardt P, et al. ACR Colon Cancer Committee White Paper: Status of CT
Colonography 2009. Journal of the American College of Radiology. 2009;6(11):756-72.e4.
106. Rockey DC, Barish M, Brill JV, et al. Standards for Gastroenterologists for Performing and Interpreting
Diagnostic Computed Tomographic Colonography. Gastroenterology. 2007;133(3):1005-24.
107. Macari M, Milano A, Lavelle M, Berman P, Megibow AJ. Comparison of time-efficient CT
colonography with two- and three-dimensional colonic evaluation for detecting colorectal polyps. AJR Am J
Roentgenol. 2000;174(10845478):1543-9.
108. Lenhart DK, Babb J, Bonavita J, et al. Comparison of a unidirectional panoramic 3D endoluminal
interpretation technique to traditional 2D and bidirectional 3D interpretation techniques at CT colonography:
preliminary observations. Clinical Radiology. 2010;65(2):118-25.
109. Summers RM, Beaulieu CF, Pusanik LM, et al. Automated polyp detector for CT colonography:
feasibility study. Radiology. 2000;216(1):284-90.
110. Summers RM, Johnson CD, Pusanik LM, Malley JD, Youssef AM, Reed JE. Automated polyp detection
at CT colonography: feasibility assessment in a human population. Radiology. 2001;219(1):51-9.
111. Yoshida H, Nappi J. Three-dimensional computer-aided diagnosis scheme for detection of colonic
polyps. IEEE Trans Med Imaging. 2001;20(12):1261-74.
112. Summers RM, Jerebko AK, Franaszek M, Malley JD, Johnson CD. Colonic polyps: complementary role
of computer-aided detection in CT colonography. Radiology. 2002;225(2):391-9.
113. Summers RM, Yao J, Pickhardt PJ, et al. Computed tomographic virtual colonoscopy computer-aided
polyp detection in a screening population. Gastroenterology. 2005;129(6):1832-44.
114. Taylor SA, Halligan S, Slater A, et al. Polyp detection with CT colonography: primary 3D endoluminal
analysis versus primary 2D transverse analysis with computer-assisted reader software. Radiology.
2006;239(3):759-67.
115. Regge D, Halligan S. CAD: How it works, how to use it, performance. European Journal of Radiology.
2012;(epub ahead of print)(0).
116. Atkin WS, Edwards R, Kralj-Hans I, et al. Once-only flexible sigmoidoscopy screening in prevention of
colorectal cancer: a multicentre randomised controlled trial. Lancet. 2010;375(9726):1624-33.
117. Seeff LC, Nadel MR, Klabunde CN, et al. Patterns and predictors of colorectal cancer test use in the
adult U.S. population. Cancer. 2004;100(10):2093-103.
118. Ristvedt SL, McFarland EG, Weinstock LB, Thyssen EP. Patient preferences for CT colonography,
conventional colonoscopy, and bowel preparation. Am J Gastroenterol. 2003;98(3):578-85.
119. van Gelder RE, Birnie E, Florie J, et al. CT colonography and colonoscopy: assessment of patient
preference in a 5-week follow-up study. Radiology. 2004;233(2):328-37.
120. Gryspeerdt S, Lefere P, Dewyspelaere J, Baekelandt M, van Holsbeeck B. Optimisation of colon
cleansing prior to computed tomographic colonography. JBR-BTR. 2002;85(6):289-96.
121. Zalis ME, Perumpillichira JJ, Magee C, Kohlberg G, Hahn PF. Tagging-based, electronically cleansed CT
colonography: evaluation of patient comfort and image readability. Radiology. 2006;239(1):149-59.
122. Bielen D, Thomeer M, Vanbeckevoort D, et al. Dry preparation for virtual CT colonography with fecal
tagging using water-soluble contrast medium: initial results. Eur Radiol. 2003;13(3):453-8.
123. Thomeer M, Carbone I, Bosmans H, et al. Stool tagging applied in thin-slice multidetector computed
tomography colonography. J Comput Assist Tomogr. 2003;27(2):132-9.
124. Lefere P, Gryspeerdt S, Marrannes J, Baekelandt M, Van Holsbeeck B. CT colonography after fecal
tagging with a reduced cathartic cleansing and a reduced volume of barium. AJR Am J Roentgenol.
2005;184(6):1836-42.
125. Taylor SA, Slater A, Burling DN, et al. CT colonography: optimisation, diagnostic performance and
patient acceptability of reduced-laxative regimens using barium-based faecal tagging. Eur Radiol.
2008;18(1):32-42.
126. Jensch S, de Vries AH, Peringa J, et al. CT colonography with limited bowel preparation: performance
characteristics in an increased-risk population. Radiology. 2008;247(1):122-32.
2 4 3
127. Nagata K, Okawa T, Honma A, Endo S, Kudo SE, Yoshida H. Full-laxative versus minimum-laxative
fecal-tagging CT colonography using 64-detector row CT: prospective blinded comparison of diagnostic
performance, tagging quality, and patient acceptance. Acad Radiol. 2009;16(7):780-9.
128. Regge D, Laudi C, Galatola G, et al. Diagnostic Accuracy of Computed Tomographic Colonography for
the Detection of Advanced Neoplasia in Individuals at Increased Risk of Colorectal Cancer. JAMA: The Journal
of the American Medical Association. 2009;301(23):2453-61.
129. Graser A, Stieber P, Nagel D, et al. Comparison of CT colonography, colonoscopy, sigmoidoscopy and
faecal occult blood tests for the detection of advanced adenoma in an average risk population. Gut.
2009;58(2):241-8.
130. Johnson CD, MacCarty RL, Welch TJ, et al. Comparison of the relative sensitivity of CT colonography
and double-contrast barium enema for screen detection of colorectal polyps. Clin Gastroenterol Hepatol.
2004;2(4):314-21.
131. Dhruva SS, Phurrough SE, Salive ME, Redberg RF. CMS's landmark decision on CT colonography--
examining the relevant data. N Engl J Med. 2009;360(26):2699-701.
132. Garg S, Ahnen DJ. Is computed tomographic colonography being held to a higher standard? Ann
Intern Med. 2010;152(3):178-81.
133. Taylor S, Halligan S, Atkin W, al e. Clinical trials and Experiences: SIGGAR. Presented at the 11th
International Symposium on Virtual Colonoscopy Westin Copley Place, Boston, MA October 25-27, 2010.
2010.
134. Halligan S, Wooldrage K, Dadswell E, et al. Computed tomographic colonography versus barium
enema for diagnosis of colorectal cancer or large polyps in symptomatic patients (SIGGAR): a multicentre
randomised trial. The Lancet. 2013;381(9873):1185-93.
135. Atkin W, Dadswell E, Wooldrage K, et al. Computed tomographic colonography versus colonoscopy
for investigation of patients with symptoms suggestive of colorectal cancer (SIGGAR): a multicentre
randomised trial. The Lancet. 2013;381(9873):1194-202.
136. Halligan S, Waddingham J, Dadswell E, Wooldrage K, Atkin W, SIGGAR Trial investigators. Detection of
extracolonic lesions by CTC in symptomatic patients: Their frequency and severity in a randomised controlled
trial. Eur Radiol. 2010;20(Suppl 1):S8.
137. Pickhardt PJ, Kim DH, Meiners RJ, et al. Colorectal and extracolonic cancers detected at screening CT
colonography in 10,286 asymptomatic adults. Radiology. 2010;255(1):83-8.
138. Benson M, Dureja P, Gopal D, Reichelderfer M, Pfau PR. A Comparison of Optical Colonoscopy and CT
Colonography Screening Strategies in the Detection and Recovery of Subcentimeter Adenomas. Am J
Gastroenterol. 2010.
139. Hassan C, Pickhardt PJ, Kim DH, et al. Systematic review: distribution of advanced neoplasia
according to polyp size at screening colonoscopy. Aliment Pharmacol Ther. 2010;31(2):210-7.
140. de Vries AH, Bipat S, Dekker E, et al. Polyp measurement based on CT colonography and
colonoscopy: variability and systematic differences. Eur Radiol. 2010;20(6):1404-13.
141. Ignjatovic A, Burling D, Ilangovan R, et al. Flat colon polyps: what should radiologists know? Clinical
Radiology. 2010;65(12):958-66.
142. Pickhardt PJ, Kim DH, Robbins JB. Flat (nonpolypoid) colorectal lesions identified at CT colonography
in a U.S. screening population. Acad Radiol. 2010;17(6):784-90.
143. Levin B, Lieberman DA, McFarland B, et al. Screening and surveillance for the early detection of
colorectal cancer and adenomatous polyps, 2008: A joint guideline from the American Cancer Society, the US
Multi-Society Task Force on Colorectal Cancer, and the American College of Radiology. Gastroenterology.
2008;134(5):1570-95.
144. Force USPST. Screening for Colorectal Cancer: U.S. Preventive Services Task Force Recommendation
Statement. Annals of Internal Medicine. 2008;149(9):627-37.
145. Cash BD. CT colonography: Ready for prime time? Am J Gastroenterol. 2010;105(10):2128-32.
146. Schoen RE, Hashash JG. Con: CT colonography-not yet ready for community-wide implementation.
Am J Gastroenterol. 2010;105(10):2132-7.
147. Burke CA. A balancing view: the good, the bad, and the unknown. Am J Gastroenterol.
2010;105(10):2137-8.
148. Fletcher JG, Chen MH, Herman BA, et al. Can radiologist training and testing ensure high
performance in CT colonography? Lessons From the National CT Colonography Trial. AJR Am J Roentgenol.
2010;195(1):117-25.
149. Knudsen AB, Lansdorp-Vogelaar I, Rutter CM, et al. Cost-effectiveness of computed tomographic
colonography screening for colorectal cancer in the medicare population. J Natl Cancer Inst.
2010;102(16):1238-52.

2 4 4
150. Pickhardt PJ, Kim DH, Hassan C. Re: cost-effectiveness of computed tomographic colonography
screening for colorectal cancer in the medicare population. J Natl Cancer Inst. 2010;102(21):1676.
151. Moawad FJ, Maydonovitch CL, Cullen PA, Barlow DS, Jenson DW, Cash BD. CT colonography may
improve colorectal cancer screening compliance. AJR Am J Roentgenol. 2010;195(5):1118-23.
152. Ho W, Broughton DE, Donelan K, Gazelle GS, Hur C. Analysis of barriers to and patients' preferences
for CT colonography for colorectal cancer screening in a nonadherent urban population. AJR Am J Roentgenol.
2010;195(2):393-7.
153. de Haan M, Stoop E, de Wijkerslooth T, et al. A randomized controlled trial comparing participation
and diagnostic yield in colonoscopy and CT-colonography for population-based colorectal cancer screening.
Insights into Imaging. 2011;2(Suppl. 2):S428.
154. Stoop EM, de Haan MC, de Wijkerslooth TR, et al. Participation and yield of colonoscopy versus non-
cathartic CT colonography in population-based screening for colorectal cancer: a randomised controlled trial.
Lancet Oncol. 2012;13(22088831):55-64.
155. Atalla MA, Rozen WM, Niewiadomski OD, Croxford MA, Cheung W, Ho YH. Risk factors for colonic
perforation after screening computed tomographic colonography: a multicentre analysis and review of the
literature. J Med Screen. 2010;17(2):99-102.
156. Cha EY, Park SH, Lee SS, et al. CT colonography after metallic stent placement for acute malignant
colonic obstruction. Radiology. 2010;254(3):774-82.
157. Mc Laughlin P, Eustace J, Mc Sweeney S, et al. Bowel preparation in CT colonography: electrolyte and
renal function disturbances in the frail and elderly patient. Eur Radiol. 2010;20(3):604-12.
158. Ridge CA, Carter MR, Browne LP, et al. CT colonography and transient bacteraemia: implications for
antibiotic prophylaxis. Eur Radiol. 2010.
159. Burling D, Wylie P, Gupta A, et al. CT colonography: accuracy of initial interpretation by radiographers
in routine clinical practice. Clin Radiol. 2010;65(20103434):126-32.
160. Veerappan GR, Ally MR, Choi JH, Pak JS, Maydonovitch C, Wong RK. Extracolonic findings on CT
colonography increases yield of colorectal cancer screening. AJR Am J Roentgenol. 2010;195(3):677-86.
161. Pickhardt PJ, Hanson ME. Incidental adnexal masses detected at low-dose unenhanced CT in
asymptomatic women age 50 and older: implications for clinical management and ovarian cancer screening.
Radiology. 2010;257(1):144-50.
162. Lawrence EM, Pickhardt PJ, Kim DH, Robbins JB. Colorectal polyps: stand-alone performance of
computer-aided detection in a large asymptomatic screening population. Radiology. 2010;256(3):791-8.
163. Wi JY, Kim SH, Lee JY, Kim SG, Han JK, Choi BI. Electronic cleansing for CT colonography: does it help
CAD software performance in a high-risk population for colorectal cancer? Eur Radiol. 2010;20(8):1905-16.
164. Summers RM, Liu J, Rehani B, et al. CT colonography computer-aided polyp detection: Effect on
radiologist observers of polyp identification by CAD on both the supine and prone scans. Acad Radiol.
2010;17(8):948-59.
165. Roth H, McClelland J, Modat M, et al. Establishing spatial correspondence between the inner colon
surfaces from prone and supine CT colonography. Med Image Comput Comput Assist Interv. 2010;13(Pt
3):497-504.
166. Boone D, Halligan S, Frost R, et al. CT Colonography: Who attends training? A survey of participants
at educational workshops. Clin Radiol. 2011.
167. Kim DH, Pickhardt PJ, Taylor AJ, et al. CT colonography versus colonoscopy for the detection of
advanced neoplasia. N Engl J Med. 2007;357(14):1403-12.
168. Fisichella V, Hellstrom M. Availability, indications, and technical performance of computed
tomographic colonography: a national survey. Acta Radiol. 2006;47(3):231-7.
169. Rockey DC. Computed tomographic colonography: current perspectives and future directions.
Gastroenterology. 2009;137(1):7-14.
170. Lowe A, Culverwell A, Punekar S, et al. National survey of colonic imaging in the UK. Insights into
Imaging 2012;3 (Suppl. 2).
171. Gluecker T, Meuwly J-Y, Pescatore P, et al. Effect of investigator experience in CT colonography. Eur
Radiol. 2002;12(6):1405-9.
172. Taylor SA, Burling D, Roddie M, et al. Computer-aided detection for CT colonography: incremental
benefit of observer training. Br J Radiol. 2008;81(963):180-6.
173. van Dam J, Cotton P, Johnson CD, et al. AGA future trends report: CT colonography. Gastroenterology.
2004;127(3):970-84.
174. Burling D, Moore A, Taylor S, La Porte S, Marshall M. Virtual colonoscopy training and accreditation:
a national survey of radiologist experience and attitudes in the UK. Clin Radiol. 2007;62(7):651-9.

2 4 5
175. Rockey DC, Gupta S, Matuchansky C, et al. Accuracy of CT Colonography for Colorectal Cancer
Screening. N Engl J Med. 2008;359(26):2842-4.
176. Pickhardt PJ. Missed lesions at primary 2D CT colonography: further support for 3D polyp detection.
Radiology. 2008;246(2):648; author reply -9.
177. Pickhardt PJ, Lee AD, Taylor AJ, et al. Primary 2D versus primary 3D polyp detection at screening CT
colonography. AJR Am J Roentgenol. 2007;189(6):1451-6.
178. Xiong T, McEvoy K, Morton DG, Halligan S, Lilford RJ. Resources and costs associated with incidental
extracolonic findings from CT colonogaphy: a study in a symptomatic population. Br J Radiol.
2006;79(948):948-61.
179. Babbie E. Survey Research. The practice of social research (11th ed), Thompson-Wadsworth
Learning, Belmont, CA, USA
2007:243-64.
180. Bossuyt PM, Reitsma JB, Bruns DE, et al. Towards complete and accurate reporting of studies of
diagnostic accuracy: The STARD Initiative. Radiology. 2003;226(1):24-8.
181. Whiting P, Rutjes AW, Reitsma JB, Bossuyt PM, Kleijnen J. The development of QUADAS: a tool for the
quality assessment of studies of diagnostic accuracy included in systematic reviews. BMC Med Res Methodol.
2003;3:25.
182. Lucas NP, Macaskill P, Irwig L, Bogduk N. The development of a quality appraisal tool for studies of
diagnostic reliability (QAREL). J Clin Epidemiol. 2010;63(8):854-61.
183. Loy CT, Irwig L. Accuracy of diagnostic tests read with and without clinical information: a systematic
review. JAMA. 2004;292(13):1602-9.
184. Wolfe JM, Horowitz TS, Kenner NM. Cognitive psychology: rare items often missed in visual searches.
Nature. 2005;435(7041):439-40.
185. Egglin TKP, Feinstein AR. Context bias - A problem in diagnostic radiology. Jama-Journal of the
American Medical Association. 1996;276(21):1752-5.
186. Wagner RF, Beiden SV, Campbell G, Metz CE, Sacks WM. Assessment of medical imaging and
computer-assist systems: lessons from recent experience. AcadRadiol. 2002;9(11):1264-77.
187. Metz CE. Some practical issues of experimental design and data analysis in radiological ROC studies.
Invest Radiol. 1989;24(3):234-45.
188. Gur D, Bandos AI, Cohen CS, et al. The "Laboratory" effect: Comparing radiologists' performance and
variability during prospective clinical and laboratory mammography interpretations. Radiology.
2008;249(1):47-53.
189. Gur D, Rockette HE, Armfield DR, et al. Prevalence effect in a laboratory environment. Radiology.
2003;228(1):10-4.
190. Rutter CM, Taplin S. Assessing mammographers' accuracy. A comparison of clinical and test
performance. J Clin Epidemiol. 2000;53(5):443-50.
191. Gur D, Rockette HE, Warfel T, Lacomis JM, Fuhrman CR. From the laboratory to the clinic: The
"prevalence effect"'. Academic Radiology. 2003;10(11):1324-6.
192. Gur D. Imaging technology and practice assessments: diagnostic performance, clinical relevance, and
generalizability in a changing environment. Radiology. 2004;233(2):309-12.
193. Samuel S, Kundel HL, Nodine CF, Toto LC. Mechanism of satisfaction of search: eye position
recordings in the reading of chest radiographs. Radiology. 1995;194(3):895-902.
194. Aideyan UO, Berbaum K, Smith WL. Influence of prior radiologic information on the interpretation of
radiographic examinations. Academic Radiology. 1995;2(3):205-8.
195. Berbaum KS, Elkhoury GY, Franken EA, Kathol M, Montgomery WJ, Hesson W. Impact of clinical
history on fracture detection with radiography. Radiology. 1988;168(2):507-11.
196. Berbaum KS, Franken EA, Dorfman DD, Barloon TJ. Influence of clinical history upon detection of
nodules and other lesions. Investigative Radiology. 1988;23(1):48-55.
197. Berbaum KS, Franken EA, Elkhoury GY. Impact of clinical history on radiographic detection of
fractures - a comparison of radiologists and orthopedists. American Journal of Roentgenology.
1989;153(6):1221-4.
198. Good BC, Cooperstein LA, DeMarino GB, et al. Does knowledge of the clinical history affect the
accuracy of chest radiograph interpretation? Am J Roentgenol. 1990;154(4):709-12.
199. Kundel HL. Disease Prevalence and Radiological Decision Making. Investigative Radiology.
1982;17(1):107-9.
200. Swensson RG, Hessel SJ, Herman PG. The value of searching films without specific preconceptions.
Investigative Radiology. 1985;20(1):100-7.
2 4 6
201. Greenhalgh T, Peacock R. Effectiveness and efficiency of search methods in systematic reviews of
complex evidence: audit of primary sources. BMJ. 2005;331(7524):1064-5.
202. Burnside ES, Park JM, Fine JP, Sisney GA. The use of batch reading to improve the performance of
screening mammography. American Journal of Roentgenology. 2005;185(3):790-6.
203. Gur D, Bandos AI, Fuhrman CR, Klym AH, King JL, Rockette HE. The prevalence effect in a laboratory
environment: Changing the confidence ratings. Academic Radiology. 2007;14(1):49-53.
204. Gur D, Rockette HE, Good WF, et al. Effect of observer instruction on ROC study of chest images.
Invest Radiol. 1990;25(3):230-4.
205. Hardesty LA, Ganott MA, Hakim CM, Cohen CS, Clearfield RJ, Gur D. "Memory effect" in observer
performance studies of mammograms. Acad Radiol. 2005;12(3):286-90.
206. Irwig L, Macaskill P, Walter SD, Houssami N. New methods give better estimates of changes in
diagnostic accuracy when prior information is provided. J Clin Epidemiol. 2006;59(3):299-307.
207. Bytzer P. Information bias in endoscopic assessment. Am J Gastroenterol. 2007;102(8):1585-7.
208. Fandel TM, Pfnur M, Schafer SC, et al. Do we truly see what we think we see? The role of cognitive
bias in pathological interpretation. J Pathol. 2008;216(2):193-200.
209. Meining A, Dittler HJ, Wolf A, et al. You get what you expect? A critical appraisal of imaging
methodology in endosonographic cancer staging. Gut. 2002;50(5):599-603.
210. Metz CE. Receiver Operating Characteristic Analysis: A Tool for the Quantitative Evaluation of
Observer Performance and Imaging Systems. Journal of the American College of Radiology. 2006;3(6):413-22.
211. Rich AN, Kunar MA, Van Wert MJ, Hidalgo-Sotelo B, Horowitz TS, Wolfe JM. Why do we miss rare
targets? Exploring the boundaries of the low prevalence effect. J Vis. 2008;8(15):15 1-7.
212. Esserman L, Cowley H, Eberle C, et al. Improving the Accuracy of Mammography: Volume and
Outcome Relationships. Journal of the National Cancer Institute. 2002;94(5):369-75.
213. Toms AP. The war on terror and radiological error? Clinical Radiology. 2010;65(8):666-8.
214. Taylor SA, Halligan S, Burling D, et al. CT colonography: effect of experience and training on reader
performance. Eur Radiol. 2004;14(6):1025-33.
215. Halligan S, Taylor SA, Dehmeshki J, et al. Computer-assisted detection for CT colonography: external
validation. Clin Radiol. 2006;61(9):758-63.
216. Grimes DA, Schulz KF. Uses and abuses of screening tests. Lancet. 2002;359(9309):881-4.
217. Mallett S, Deeks JJ, Halligan S, Hopewell S, Cornelius V, Altman DG. Systematic reviews of diagnostic
tests in cancer: review of methods and reporting. BMJ. 2006;333(7565):413-.
218. Salz T, Richman AR, Brewer NT. Meta-analyses of the effect of false-positive mammograms on generic
and specific psychosocial outcomes. Psychooncology. 2010;19(10):1026-34.
219. Fenton JJ, Taplin SH, Carney PA, et al. Influence of computer-aided detection on performance of
screening mammography. N Engl J Med. 2007;356(14):1399-409.
220. Skaane P, Hofvind S, Skjennald A. Randomized trial of screen-film versus full-field digital
mammography with soft-copy reading in population-based screening program: follow-up and final results of
Oslo II study. Radiology. 2007;244(3):708-17.
221. Yankaskas BC, Taplin SH, Ichikawa L, et al. Association between mammography timing and measures
of screening performance in the United States. Radiology. 2005;234(2):363-73.
222. Altman DG, Vergouwe Y, Royston P, Moons KG. Prognosis and prognostic research: validating a
prognostic model. BMJ. 2009;338:b605.
223. Shiraishi J, Pesce LL, Metz CE, Doi K. Experimental Design and Data Analysis in Receiver Operating
Characteristic Studies: Lessons Learned from Reports in Radiology from 1997 to 20061. Radiology.
2009;253(3):822-30.
224. Ryan M. Discrete choice experiments in health care. BMJ. 2004;328(7436):360-1.
225. Ryan M, Farrar S. Using conjoint analysis to elicit preferences for health care. BMJ.
2000;320(7248):1530-3.
226. Bridges JF, Hauber AB, Marshall D, et al. Conjoint analysis applications in health--a checklist: a report
of the ISPOR Good Research Practices for Conjoint Analysis Task Force. Value Health. 2011;14(4):403-13.
227. Jemal A, Siegel R, Ward E, Hao YP, Xu JQ, Thun MJ. Cancer Statistics, 2009. CA-Cancer J Clin.
2009;59(4):225-49.
228. Schoenfeld P, Cash B, Flood A, et al. Colonoscopic Screening of Average-Risk Women for Colorectal
Neoplasia. New England Journal of Medicine. 2005;352(20):2061-8.
229. Pisani P, Bray F, Parkin DM. Estimates of the world-wide prevalence of cancer for 25 sites in the adult
population. International Journal of Cancer. 2002;97(1):72-81.

2 4 7
230. Marshall D, Bridges JF, Hauber B, et al. Conjoint Analysis Applications in Health - How are Studies
being Designed and Reported?: An Update on Current Practice in the Published Literature between 2005 and
2008. Patient. 2010;3(4):249-56.
231. Boynton PM, Wood GW, Greenhalgh T. Reaching beyond the white middle classes. BMJ.
2004;328(7453):1433-6.
232. Spiegelhalter D, Pearson M, Short I. Visualizing Uncertainty About the Future. Science.
2011;333(6048):1393-400.
233. Group UCCSP. Results of the first round of a demonstration pilot of screening for colorectal cancer in
the United Kingdom. BMJ. 2004;329:133.
234. Gatta G, Capocaccia R, Sant M, et al. Understanding variations in survival for colorectal cancer in
Europe: a EUROCARE high resolution study. Gut. 2000;47(4):533-8.
235. Robinson MH, Hardcastle JD, Moss SM, et al. The risks of screening: data from the Nottingham
randomised controlled trial of faecal occult blood screening for colorectal cancer. Gut. 1999;45(4):588-92.
236. Boynton PM, Greenhalgh T. Selecting, designing, and developing your questionnaire. BMJ.
2004;328(7451):1312-5.
237. Eng J. Sample Size Estimation: How Many Individuals Should Be Studied?1. Radiology.
2003;227(2):309-13.
238. Schwartz LM, Woloshin S, Sox HC, Fischhoff B, Welch HG. US women's attitudes to false positive
mammography results and detection of ductal carcinoma in situ: cross sectional survey. BMJ.
2000;320(7250):1635-40.
239. Nayaradou M, Berchi C, Dejardin O, Launoy G. Eliciting population preferences for mass colorectal
cancer screening organization. Med Decis Making. 2010;30(2):224-33.
240. Marshall DA, Johnson FR, Phillips KA, Marshall JK, Thabane L, Kulin NA. Measuring patient
preferences for colorectal cancer screening using a choice-format survey. Value Health. 2007;10(5):415-30.
241. Summers RM, Franaszek M, Miller MT, Pickhardt PJ, Choi JR, Schindler WR. Computer-aided
detection of polyps on oral contrast-enhanced CT colonography. AJR Am J Roentgenol. 2005;184(1):105-8.
242. Ryan M, Bate A, Eastmond CJ, Ludbrook A. Use of discrete choice experiments to elicit preferences.
Qual Health Care. 2001;10 Suppl 1:i55-60.
243. Ryan M, Scott DA, Reeves C, et al. Eliciting public preferences for healthcare: a systematic review of
techniques. Health Technol Assess. 2001;5(5):1-186.
244. Yi D, Ryan M, Campbell S, et al. Using discrete choice experiments to inform randomised controlled
trials: an application to chronic low back pain management in primary care. Eur J Pain. 2011;15(5):531 e1-10.
245. Watson V, Carnon A, Ryan M, Cox D. Involving the public in priority setting: a case study using
discrete choice experiments. J Public Health (Oxf). 2011.
246. Ozdemir S, Mohamed AF, Johnson FR, Hauber AB. Who pays attention in stated-choice surveys?
Health Econ. 2010;19(1):111-8.
247. de Bekker-Grob EW, Ryan M, Gerard K. Discrete choice experiments in health economics: a review of
the literature. Health Econ. 2012;21(2):145-72.
248. Arnold D, Girling A, Stevens A, Lilford R. Comparison of direct and indirect methods of estimating
health state utilities for resource allocation: review and empirical analysis. BMJ. 2009;339(jul20_3):b2688-.
249. Yoshida H, Dachman AH. CAD techniques, challenges, and controversies in computed tomographic
colonography. Abdom Imaging. 2005;30(1):26-41.
250. Robinson C, Halligan S, Taylor SA, Mallett S, Altman DG. CT colonography: a systematic review of
standard of reporting for studies of computer-aided detection. Radiology. 2008;246(18227540):426-33.
251. Mang T, Peloschek P, Plank C, et al. Effect of computer-aided detection as a second reader in
multidetector-row CT colonography. Eur Radiol. 2007;17(17351780):2598-607.
252. Fisichella VA, Jaderling F, Horvath S, et al. Computer-aided detection (CAD) as a second reader using
perspective filet view at CT colonography: effect on performance of inexperienced readers. Clin Radiol.
2009;64(19748002):972-82.
253. Baker ME, Bogoni L, Obuchowski NA, et al. Computer-aided detection of colorectal polyps: can it
improve sensitivity of less-experienced readers? Preliminary findings. Radiology. 2007;245(17885187):140-9.
254. Hock D, Ouhadi R, Materne R, et al. Virtual dissection CT colonography: evaluation of learning curves
and reading times with and without computer-aided detection. Radiology. 2008;248(3):860-8.
255. Neri E, Faggioni L, Regge D, et al. CT colonography: role of a second reader CAD paradigm in the
initial training of radiologists. Eur J Radiol. 2011;80(2):303-9.
256. Lieberman D. Debate: small (6-9 mm) and diminutive (1-5 mm) polyps noted on CTC: how should
they be managed? Gastrointest Endosc Clin N Am. 2010;20(2):239-43.
2 4 8
257. Leong JJ, Nicolaou M, Emery RJ, Darzi AW, Yang GZ. Visual search behaviour in skeletal radiographs: a
cross-specialty study. Clin Radiol. 2007;62(11):1069-77.
258. Nodine CF, Kundel HL, Mello-Thoms C, et al. How experience and training influence mammography
expertise. Acad Radiol. 1999;6(10):575-85.
259. Nodine CF, Mello-Thoms C, Kundel HL, Weinstein SP. Time course of perception and decision making
during mammographic interpretation. AJR Am J Roentgenol. 2002;179(4):917-23.
260. Poole A, Ball, L. J., & Phillips, P In search of salience: A response time and
eye movement analysis of bookmark recognition. In S Fincher, P Markopolous, D
Moore, & R Ruddle (Eds), People and Computers XVIII-Design for Life: Proceedings
of HCI 2004 London: Springer-Verlag Ltd. 2004.
261. Ellis SM, Hu X, Dempere-Marco L, Yang GZ, Wells AU, Hansell DM. Thin-section CT of the lungs: eye-
tracking analysis of the visual approach to reading tiled and stacked display formats. Eur J Radiol.
2006;59(2):257-64.
262. ESGAR-CTC-Investigators. Effect of Directed Training on Reader Performance for CT Colonography:
Multicenter Study. Radiology. 2007;242(1):152-61.
263. Palmer SE. Vision Science: Photons to Phenomenology. MIT Press. 1999.
264. Salvucci DD, Goldberg JH. Identifying fixations and saccades in eye-tracking protocols. Proceedings of
the 2000 symposium on Eye tracking research \& applications. Palm Beach Gardens, Florida, United States:
ACM, 2000; p. 71-8.
265. White IR, Royston P, Wood AM. Multiple imputation using chained equations: Issues and guidance
for practice. Stat Med. 2011;30(21225900):377-99.
266. Krupinski EA, Berger WG, Dallas WJ, Roehrig H. Searching for nodules: what features attract attention
and influence detection? Acad Radiol. 2003;10(12945920):861-8.
267. Roth HR, McClelland JR, Boone DJ, et al. Registration of the endoluminal surfaces of the colon
derived from prone and supine CT colonography. Med Phys. 2011;38(6):3077-89.
268. Johnson K, Johnson C, Fletcher J, MacCarty R, Summers R. CT colonography using 360-degree virtual
dissection: A feasibility study. Am J Roentgenol. 2006;186:90-5.
269. Floater MS, Hormann K. Surface parameterization: a tutorial and survey. Advances in multiresolution
for geometric modelling. 2005:157-86.
270. Hong W, Gu X, Qiu F, Jin M, Kaufman A. Conformal virtual colon flattening. Proc 2006 ACM
Symposium on Solid and Physical Modeling. 2006:85-93.
271. Slabaugh G, Yang X, Ye X, Boyes R, Beddoe G. A robust and fast system for CTC computer-aided
detection of colorectal lesions. Algorithms. 2010;3(1):21-43.
272. Deschamps T, Cohen LD. Fast extraction of minimal paths in 3D images and applications to virtual
endoscopy. Med Image Anal. 2001;5(4):281-99.
273. Adalsteinsson D, Sethian JA. A fast level set method for propagating interfaces. J Comput Phys.
1995;118(2):269-77.
274. Sadleir RJT, Whelan PF. Fast colon centreline calculation using optimised 3D topological thinning.
Computerized Medical Imaging and Graphics. 2005;29(4):251-8.
275. Cardoso M, Clarkson M, Modat M, Ourselin S. On the Extraction of Topologically Correct Thickness
Measurements Using Khalimsky’s Cubic Complex. Information Processing in Medical Imaging: Springer Berlin /
Heidelberg, 2011; p. 159-70.
276. Lorensen WE, Cline HE. Marching cubes: A high resolution 3D surface construction algorithm. ACM
Siggraph Computer Graphics1987; p. 163-9.
277. Taubin G, Zhang T, Golub G. Optimal surface smoothing as filter design. Computer Vision ECCV.
1996:283-92.
278. Hoppe H. New quadric metric for simplifying meshes with appearance attributes. Proc Article on
Visualization'99: Celebrating Ten Years. 1999:59-66.
279. Cignoni P, Corsini M, Ranzuglia G. Meshlab: an open-source 3d mesh processing system. ERCIM
News. 2008;73:45-6.
280. Hamilton RS. Three-manifolds with positive Ricci curvature. J Differential Geom. 1982;17(2):255-306.
281. Jin M, Kim J, Luo F, Gu X. Discrete surface Ricci flow. IEEE Trans Vis Comput Graphics.
2008;14(5):1030-43.
282. Zeng W, Marino J, Chaitanya Gurijala K, Gu X, Kaufman A. Supine and prone colon registration using
quasi-conformal mapping. IEEE Trans Vis Comput Graph. 2010;16(6):1348-57.
283. Qiu F, Fan Z, Yin X, Kaufman A, Gu XD. Colon flattening with discrete Ricci flow. Proc MICCAI
workshop. 2008:97-102.
284. Koenderink JJ. Solid shape: Cambridge, Massachusetts: MIT Press, 1990.

2 4 9
285. Yoshida H, Nappi J. Three-dimensional computer-aided diagnosis scheme for detection of colonic
polyps. IEEE Trans Med Imaging. 2002;20(12):1261-74.
286. Rueckert D, Sonoda LI, Hayes C, Hill DLG, Leach MO, Hawkes DJ. Nonrigid registration using free-form
deformations: Application to breast MR images. IEEE Trans Med Imaging. 1999;18(8):712-21.
287. Modat M, McClelland J, Ourselin S. Lung registration using the NiftyReg package. Proc MICCAI
Medical Image Analysis for the Clinic: A Grand Challenge, EMPIRE10. 2010.
288. Hara AK, Kuo MD, Blevins M, et al. National CT Colonography Trial (ACRIN 6664): Comparison of
Three Full-Laxative Bowel Preparations in More Than 2500 Average-Risk Patients. American Journal of
Roentgenology. 2011;196(5):1076-82.
289. de Vries AH, Truyen R, van der Peijl J, et al. Feasibility of automated matching of supine and prone
CT-colonography examinations. Br J Radiol. 2006;79(945):740-4.
290. Summers RM, Swift JA, Dwyer AJ, Choi JR, Pickhardt PJ. Normalized Distance Along the Colon
Centerline: A Method for Correlating Polyp Location on CT Colonography and Optical Colonoscopy. American
Journal of Roentgenology. 2009;193(5):1296-304.
291. Wang S, Yao J, Liu J, et al. Registration of prone and supine CT colonography scans using correlation
optimized warping and canonical correlation analysis. Med Phys. 2009;36(12):5595-603.
292. Suh JW, Wyatt CL. Registration Of Prone And Supine Colons In The Presence Of Topological Changes.
Proc of SPIE 2008;Vol. 6916:69160.
293. Yushkevich PA, Piven J, Hazlett HC, et al. User-guided 3D active contour segmentation of anatomical
structures: significantly improved efficiency and reliability, 2006.
294. Laks S, Macari M, Bini EJ. Positional change in colon polyps at CT colonography. Radiology.
2004;231(3):761-6.
295. Williams AR, Balasooriya BA, Day DW. Polyps and cancer of the large bowel: a necropsy study in
Liverpool. Gut. 1982;23(10):835-42.
296. Haker S, Angenent S, Tannenbaurn A, Kikinis R. Nondistorting flattening maps and the 3-D
visualization of colon CT images. IEEE Trans Med Imaging. 2000;19(7):665-70.
297. Hampshire T, Roth H, Hu M, et al. Automatic Prone to Supine Haustral Fold Matching in CT
Colonography Using a Markov Random Field Model
Medical Image Computing and Computer-Assisted Intervention – MICCAI 2011. In: Fichtinger G, Martel A,
Peters T, eds. Medical Image Computing and Computer-Assisted Intervention: Springer Berlin / Heidelberg,
2011; p. 508-15.
298. Li P, Napel S, Acar B, et al. Registration of central paths and colonic polyps between supine and prone
scans in computed tomography colonography: Pilot study
Registration of prone and supine CT colonography scans using correlation optimized warping and canonical
correlation analysis. Medical Physics. 2004;31(10):2912-23.
299. Yao J, Chowdhury A, Aman J, Summers R. Reversible Projection Technique for Colon Unfolding. IEEE
Trans Biomed Eng. 2010.
300. Wan M, Liang Z, Ke Q, Hong L, Bitter I, Kaufman A. Automatic centerline extraction for virtual
colonoscopy. Medical Imaging, IEEE Transactions on. 2002;21(12):1450-60.
301. Van Uitert RL, Summers RM. Automatic correction of level set based subvoxel precise centerlines for
virtual colonoscopy using the colon outer wall. Medical Imaging, IEEE Transactions on. 2007;26(8):1069-78.
302. Iordanescu G, Summers RM. Automated centerline for computed tomography colonography1.
Academic Radiology. 2003;10(11):1291-301.
303. Nappi J, Okamura A, Frimmel H, Dachman A, Yoshida H. Region-based supine-prone correspondence
for the reduction of false-positive CAD polyp candidates in CT colonography. Acad Radiol. 2005;12(6):695-707.
304. Wang S, Yao J, Liu J, et al. Registration of prone and supine CT colonography scans using correlation
optimized warping and canonical correlation analysis. Medical Physics. 2009;36(12):5595-603.
305. Fukano E, Oda M, Kitasaka T, et al. Haustral fold registration in CT colonography and its application to
registration of virtual stretched view of the colon. In: Nico K, Ronald MS, eds.: SPIE, 2010; p. 762420.
306. Boykov Y, Kolmogorov V. An experimental comparison of min-cut/max-flow algorithms for energy
minimization in vision. IEEE Trans Pattern Anal Mach Intell. 2004;26(9):1124-37.
307. Hampshire T, Roth H, Helbren E, et al. Automated Registration in CT Colonography using a Markov
Random Field Composite Method. Medical Image Analysis. 2012;(In press).
308. von Renteln D, Rudolph HU, Schmidt A, Vassiliou MC, Caca K. Endoscopic closure of duodenal
perforations by using an over-the-scope clip: a randomized, controlled porcine study. Gastrointest
Endosc;71(1):131-8.

2 5 0
309. Slater A, Taylor SA, Burling D, Gartner L, Scarth J, Halligan S. Colonic polyps: effect of attenuation of
tagged fluid and viewing window on conspicuity and measurement--in vitro experiment with porcine colonic
specimen. Radiology. 2006;240(1):101-9.
310. Lee MW, Kim SH, Park HS, et al. An anthropomorphic phantom study of computer-aided detection
performance for polyp detection on CT colonography: a comparison of commercially and academically
available systems. AJR Am J Roentgenol. 2009;193(2):445-54.
311. Luz O, Schafer J, Dammann F, Vonthein R, Heuschmid M, Claussen CD. [Evaluation of different 16-row
CT colonography protocols using a porcine model]. Rofo. 2004;176(10):1493-500.
312. Choi JI, Kim SH, Park HS, et al. Comparison of accuracy and time-efficiency of CT colonography
between conventional and panoramic 3D interpretation methods: An anthropomorphic phantom study. Eur J
Radiol. 2010.
313. Altman DG, Royston P. What do we mean by validating a prognostic model? Stat Med.
2000;19(4):453-73.
314. Samara Y, Fiebich M, Dachman AH, Kuniyoshi JK, Doi K, Hoffmann KR. Automated calculation of the
centerline of the human colon on CT images. Academic Radiology. 1999;6(6):352-9.
315. Huang A, Roy DA, Summers RM, et al. Teniae Coli–based Circumferential Localization System for CT
Colonography: Feasibility Study1. Radiology. 2007;243(2):551-60.
316. Suh JW, Wyatt CL. Deformable registration of prone and supine colons for CT colonography. Conf
Proc IEEE Eng Med Biol Soc. 2006;1:1997-2000.
317. Vos FM, van Gelder RE, Serlie IW, et al. Three-dimensional display modes for CT colonography:
conventional 3D virtual colonoscopy versus unfolded cube projection. Radiology. 2003;228(3):878-85.
318. Patnick J, Burling D. NHS BCSP Publication No 5 September 2010. 2010.
319. Mahgerefteh S, Fraifeld S, Blachar A, Sosna J. CT colonography with decreased purgation: balancing
preparation, performance, and patient acceptance. AJR Am J Roentgenol. 2009;193(6):1531-9.
320. Friedman AC, Lance P. Re: "CMS's landmark decision on CT colonography": misguided and short-
sighted: pay me now or pay me later. J Am Coll Radiol. 2010;7(2):159-60.
321. Bridges JF, Kinter ET, Kidane L, Heinzen RR, McCormick C. Things are Looking up Since We Started
Listening to Patients: Trends in the Application of Conjoint Analysis in Health 1982-2007. Patient.
2008;1(4):273-82.
322. von Karsa L, Patnick J, Segnan N, et al. European guidelines for quality assurance in colorectal cancer
screening and diagnosis: overview and introduction to the full supplement publication. Endoscopy.
2013;45(1):51-9.
323. Plumb AA, Halligan S, Taylor SA, Burling D, Nickerson C, Patnick J. CT colonography in the English
Bowel Cancer Screening Programme: national survey of current practice. Clin Radiol. 2013;68(5):479-87.
324. Plumb AA, Halligan S, Nickerson C, et al. Use of CT colonography in the English Bowel Cancer
Screening Programme. Gut. 2013.
325. Iussich G, Correale L, Senore C, et al. CT Colonography: Preliminary Assessment of a Double-Read
Paradigm That Uses Computer-aided Detection as the First Reader. Radiology. 2013;268(3):743-51.
Related Documents