ORIGINAL PAPER Facile one step synthesis of novel TiO 2 nanocoral by sol–gel method using Aloe vera plant extract K S Venkatesh 1 , S R Krishnamoorthi 1 , N S Palani 1 , V Thirumal 1 , S P Jose 2 , F-M Wang 3 and R Ilangovan 1 * 1 Nanoelectronics Laboratory, Department of Nanoscience and Technology, Alagappa University, Karaikudi 630 004, Tamil Nadu, India 2 School of Physics, Madurai Kamaraj University, Madurai 625 021, Tamil Nadu, India 3 Graduate Institute of Applied Science and Technology, National Taiwan University of Science and Technology, 43 Keelung Road, Section 4, Taipei 106, Taiwan Received: 17 June 2014 / Accepted: 08 September 2014 / Published online: 12 October 2014 Abstract: Titanium oxide (TiO 2 ) nanoparticles (NPs) were synthesized by sol gel method using Aloe vera plant extract as a biological capping agent and a cauliflower-nanocoral morphology was observed in this technique. The assynthesized TiO 2 nanopowder was calcined at a range of temperatures (300–600 °C) for 1 h. The influence of A. vera plant extract on the thermal, structural and morphological properties of TiO 2 nanopowder was evaluated. Thermogravimetric analysis/ differential thermal analysis was employed to study the thermal properties of the assynthesized TiO 2 nanopowder. The crystallinity, phase transformation and the crystallite size of the calcined samples were studied by X-ray diffraction technique. XRD result confirmed the presence of TiO 2 with anatase phase. FT Raman spectra showed the Raman active modes pertaining to the TiO 2 anatase phase and Raman band shift was also observed with respect to particle size variation. The different functional group vibrations of as dried pure A. vera plant extract were compared with the mixture of TiO 2 and A. vera plant extract by FT-IR analysis. The scanning electron microscopy images apparently showed the formation of spherical shaped NPs and also it demonstrated the effect of A. vera plant extract on the reduction of particles size. The surface area of the TiO 2 NPs was measured through Brunauer–Emmett–Teller analysis. Transmission electron microscopy images ascertained that the spherical shaped TiO 2 NPs were formed with cauliflower-nanocoral morphology decorated with nanopolyps with the size range between 15 and 30 nm. Keywords: Aloe vera; TiO 2 nanocorals; X-ray diffraction; Raman spectroscopy; Electron microscopy PACS Nos.: 81.16.Ta; 77.84.Bw; 61.05.cp; 78.30.Am; 78.30.Fs; 68.37.Hk; 68.37.Lp 1. Introduction In the past few decades, nanomaterials are highly attracted by researchers to exploit their excellent properties for various applications. Among the semiconductor metal oxides, TiO 2 is a fascinating and one of the technologically important materials in the field of nanotechnology and it governs the keen interest of scientific community, due to its salient properties such as high chemical stability, wide band gap, good mechanical resistance and high optical transmittance in visible and IR spectral range [1]. TiO 2 exists in three poly- morphs: rutile (Tetragonal), anatase (Tetragonal) and brookite (Orthorhombic). One dimensional TiO 2 nanowire structure has the potential application in dye sensitized solar cells (DSSCs) [2–6] and also TiO 2 is being greatly used in many applications such as photo catalysts [7, 8], gas sensors [9], electro chromic devices [10], antibacterial activity [11] and it also finds applications in biomedical sciences such as bone, tissue engineering and in pharmaceutical industries due to its non toxicity [12] and so on. TiO 2 nanoparticles (NPs) with different nanostructures have been synthesized by electrospinning method [13], hydrothermal method [14, 15], template method [16] etc. Aloe barbadensis miller is one of the important medic- inal plants and also it is known as the ‘‘Lily of the Desert’’. The raw pulp of Aloe vera contains approximately 0.5 % solid material consists of a variety of compounds including *Corresponding author, E-mail: [email protected] Indian J Phys (May 2015) 89(5):445–452 DOI 10.1007/s12648-014-0601-8 Ó 2014 IACS

Welcome message from author
This document is posted to help you gain knowledge. Please leave a comment to let me know what you think about it! Share it to your friends and learn new things together.
Transcript
ORIGINAL PAPER
Facile one step synthesis of novel TiO2 nanocoral by sol–gel methodusing Aloe vera plant extract
K S Venkatesh1, S R Krishnamoorthi1, N S Palani1, V Thirumal1, S P Jose2, F-M Wang3 and R Ilangovan1*1Nanoelectronics Laboratory, Department of Nanoscience and Technology, Alagappa University, Karaikudi 630 004, Tamil Nadu, India
2School of Physics, Madurai Kamaraj University, Madurai 625 021, Tamil Nadu, India
3Graduate Institute of Applied Science and Technology, National Taiwan University of Science and Technology, 43 Keelung Road, Section 4,
Taipei 106, Taiwan
Received: 17 June 2014 / Accepted: 08 September 2014 / Published online: 12 October 2014
Abstract: Titanium oxide (TiO2) nanoparticles (NPs) were synthesized by sol gel method using Aloe vera plant extract
as a biological capping agent and a cauliflower-nanocoral morphology was observed in this technique. The assynthesized
TiO2 nanopowder was calcined at a range of temperatures (300–600 �C) for 1 h. The influence of A. vera plant extract on
the thermal, structural and morphological properties of TiO2 nanopowder was evaluated. Thermogravimetric analysis/
differential thermal analysis was employed to study the thermal properties of the assynthesized TiO2 nanopowder. The
crystallinity, phase transformation and the crystallite size of the calcined samples were studied by X-ray diffraction
technique. XRD result confirmed the presence of TiO2 with anatase phase. FT Raman spectra showed the Raman active
modes pertaining to the TiO2 anatase phase and Raman band shift was also observed with respect to particle size variation.
The different functional group vibrations of as dried pure A. vera plant extract were compared with the mixture of TiO2 and
A. vera plant extract by FT-IR analysis. The scanning electron microscopy images apparently showed the formation of
spherical shaped NPs and also it demonstrated the effect of A. vera plant extract on the reduction of particles size. The
surface area of the TiO2 NPs was measured through Brunauer–Emmett–Teller analysis. Transmission electron microscopy
images ascertained that the spherical shaped TiO2 NPs were formed with cauliflower-nanocoral morphology decorated
with nanopolyps with the size range between 15 and 30 nm.
Keywords: Aloe vera; TiO2 nanocorals; X-ray diffraction; Raman spectroscopy; Electron microscopy
PACS Nos.: 81.16.Ta; 77.84.Bw; 61.05.cp; 78.30.Am; 78.30.Fs; 68.37.Hk; 68.37.Lp
1. Introduction
In the past few decades, nanomaterials are highly attracted by
researchers to exploit their excellent properties for various
applications. Among the semiconductor metal oxides, TiO2
is a fascinating and one of the technologically important
materials in the field of nanotechnology and it governs the
keen interest of scientific community, due to its salient
properties such as high chemical stability, wide band gap,
good mechanical resistance and high optical transmittance in
visible and IR spectral range [1]. TiO2 exists in three poly-
morphs: rutile (Tetragonal), anatase (Tetragonal) and
brookite (Orthorhombic). One dimensional TiO2 nanowire
structure has the potential application in dye sensitized solar
cells (DSSCs) [2–6] and also TiO2 is being greatly used in
many applications such as photo catalysts [7, 8], gas sensors
[9], electro chromic devices [10], antibacterial activity [11]
and it also finds applications in biomedical sciences such as
bone, tissue engineering and in pharmaceutical industries
due to its non toxicity [12] and so on. TiO2 nanoparticles
(NPs) with different nanostructures have been synthesized
by electrospinning method [13], hydrothermal method [14,
15], template method [16] etc.
Aloe barbadensis miller is one of the important medic-
inal plants and also it is known as the ‘‘Lily of the Desert’’.
The raw pulp of Aloe vera contains approximately 0.5 %
solid material consists of a variety of compounds including*Corresponding author, E-mail: [email protected]
Indian J Phys (May 2015) 89(5):445–452
DOI 10.1007/s12648-014-0601-8
� 2014 IACS
water soluble and fat soluble vitamins, minerals, enzymes,
polysaccharides, phenolic compounds, organic acids and
remaining 99.5 % are water [17–19].
Synthesis of gold nano triangles and silver NPs using
A. vera plant extract as reducing agent has been reported
[20, 21]. Moreover, A. vera plant extract has been used to
synthesize metal oxide NPs such as ZnO [22, 23], CuO
[24], MFe2O4 (where M = Cu, Ni and Zn) NPs [25],
hydroxyapatite (HAp) powders [26], In2O3 [27] and
microorganisms have also been reported for the synthesis
of metal oxides [28]. NPs synthesized by chemical methods
are involved with toxic chemicals and adsorbed on its
surface, which causes adverse effect in the medical appli-
cations. Synthesis of NPs using bio-capping agents offer
non toxic, facile and one step synthesis with easiest pro-
tocol, sustainable and easy scale up to the industrial pro-
duction at lower cost. Moreover, the uses of
environmentally benign materials for the synthesis of NPs
offer eco-friendliness and compatibility for pharmaceutical
and biomedical applications as they do not use toxic
chemical for the synthesis protocol [24]. Synthesis of dif-
ferent nanostructures is gaining a great importance in both
fundamental scientific research and technological applica-
tions owing to their interesting physico-chemical proper-
ties. A nanocoral is one of the novel architecture and it has
potential application in DSSCs. Synthesis of TiO2 nano-
corals is highly difficult and it has been achieved by means
of multi step hydrothermal process [29], polymer gel
templating procedure [30] etc. These methods involve
multistep processes, time, power consuming, toxic chemi-
cals and expensiveness and so on.
Sol–gel method is one of the best methods for the
preparation of metal oxides. It offers an easy synthesis
procedure to achieve nano scale counterparts by controlling
the synthesis conditions. This method provides many
advantages and to name a few are room temperature syn-
thesis under atmospheric pressure, purity, homogeneity, to
introduce desire amount of dopants, stoichiometry control
and financially viable. However, it is very difficult to
individually control the three reactions such as hydrolysis,
condensation and agglomeration, which occurs simulta-
neously in sol–gel process. So, a slight change in experi-
mental condition modifies the particle size and morphology
[31, 32]. A fresh A. vera plant extract contains many bio-
logically active components, such as polysaccharides
vitamins, proteins, lipids, polyphenols, heterocyclic and
carbonyl compounds and so on. In the extracellular syn-
thesis of NPs using plants, on one hand, some biomolecules
can act as reducing agent, on the other hand, some bio-
logical constituents can act as capping agent for the
resulting NPs. As a result, the aggregation of resulting NPs
could be impeded by means of stabilization due to the
protein- nanoparticle interaction and also the surface
morphology can be influenced by the shape-directing
ability of the carbonyl compound present in the A. vera
plant extract. Hence, it is anticipated that this synergistic
effect of A. vera plant extract (both stabilization and cap-
ping) might influence on the morphology and size of TiO2.
In this communication, the facile one step sol–gel syn-
thesis of novel TiO2 nanocoral architecture using A. vera
plant extract as a bio-capping agent is reported. It has been
clearly observed that A. vera plant extract proves its effi-
cacy on the thermal, structural and morphological proper-
ties of TiO2 NPs as expected. A novel TiO2 nanocoral
architecture through simple experimental procedure such
as sol gel method using A. vera plant extract as bio-capping
agent is demonstrated.
2. Experimental details
Titanium isopropoxide (SD Fine Chemicals), Ethanol,
absolute (MERCK) and A. vera plant extract were used as
starting materials for the preparation of pure and A. vera
capped TiO2 precursor solution. Fresh and matured leaves
of A. vera plant were harvested from the local agricultural
land. Then, 30 g of thoroughly washed A. vera leaves were
finely cut and boiled in 100 ml of deionized water. The
resulting extract was used for further experiments [20].
Pure TiO2 precursor solution was prepared by drop wise
addition of 3 ml of Titanium isopropoxide in 20 ml of
ethanol under magnetic stirring. Similarly, A. vera capped
TiO2 precursor solution was prepared by adding 0.5, 0.75
and 1 ml of A. vera plant extract during the preparation of
pure TiO2 precursor solution and they were coded as 1AT,
2AT and 3AT respectively. After 3 h under continuous
stirring, the pure and A. vera capped TiO2 precursor
solutions were subjected to heating (100 �C) under stirring,
until the xerogel completely dried and finally cooled to
room temperature. By adding titanium isopropoxide in
ethanol solution, Ti(OH)4 was formed. Upon subsequent
heating at 100 �C, the formation of TiO2 took place due to
the condensation process. The relevant chemical reaction
process were followed, as given in Eqs. (1a) and (1b).
Ti OCH CH3ð Þ2� �
4þ4C2H5OH �! Ti OHð Þ4þ4 CH3ð Þ2
�CH�O�C2H5 ð1aÞ
Ti OHð Þ4��������!D 100 �Cð Þ
TiO2 þ 2H2O ð1bÞ
The dried precursor was crushed into fine powder using
agate mortar and pestle. Finally, the grinded powder was
calcined at different temperatures in a tubular furnace
(Carbolite, UK) in an ambient atmosphere. Before
calcination, the thermal behavior of the as-synthesized
TiO2 powder was analyzed by means of Thermo
Gravimetric and Differential Thermal Analysis (EXSTAR
446 K S Venkatesh et al.
6000 TG/DTA) from ambient to 900 �C with the heating
rate of 10 �C/min in air atmosphere. XRD pattern was
recorded by Cu Ka radiation (1.54060 A) using
PANalytical X-PERT PRO diffractometer system. The
morphology was examined by scanning electron
microscopy (SEM) (Model: Hitachi S3000 H SEM). The
surface area was measured by Brunauer–Emmett–Teller
(BET) using MICROMETRICS ASAP 2020
POROSIMETER. FT- Raman spectra were obtained by
BRUKER RFS 27 FT-Raman spectrometer. The functional
group vibrations of the 2AT and the pure A. vera plant
extract powders were analyzed by FTIR analysis (Model:
Perkin Elmer Spectrum RX I). Transmission Electron
Microscopy (Model: JEOL-200 FXII) was employed to
confirm the nanocoral structure and also to measure the
size of the NPs.
3. Results and discussion
In the preparation of TiO2 precursor solution, it has been
observed that the precursor solution is clear even after the
addition of titanium isopropoxide with the ethanol solution,
which manifests the complete dissolution of the metal
alkoxide in the solvent. This clear solution immediately
becomes to slurry with pale green colour followed by the
addition of A. vera plant extract and it has been happened
due to the rapid reaction of the precursor solution through
hydrolysis and condensation caused by the presence of
water molecules in A. vera plant extract. The colour change
indicates the encapsulation of TiO2 particles by small
amount of solid biomolecules (0.5–1 %) contain in the
A. vera plant extract and also the pale green colour
becomes rich with respect to the increase of A. vera plant
extract. The colour of the as-synthesized powder has been
changed to pure white, after the calcination process which
implies the elimination of biomolecules from the powder.
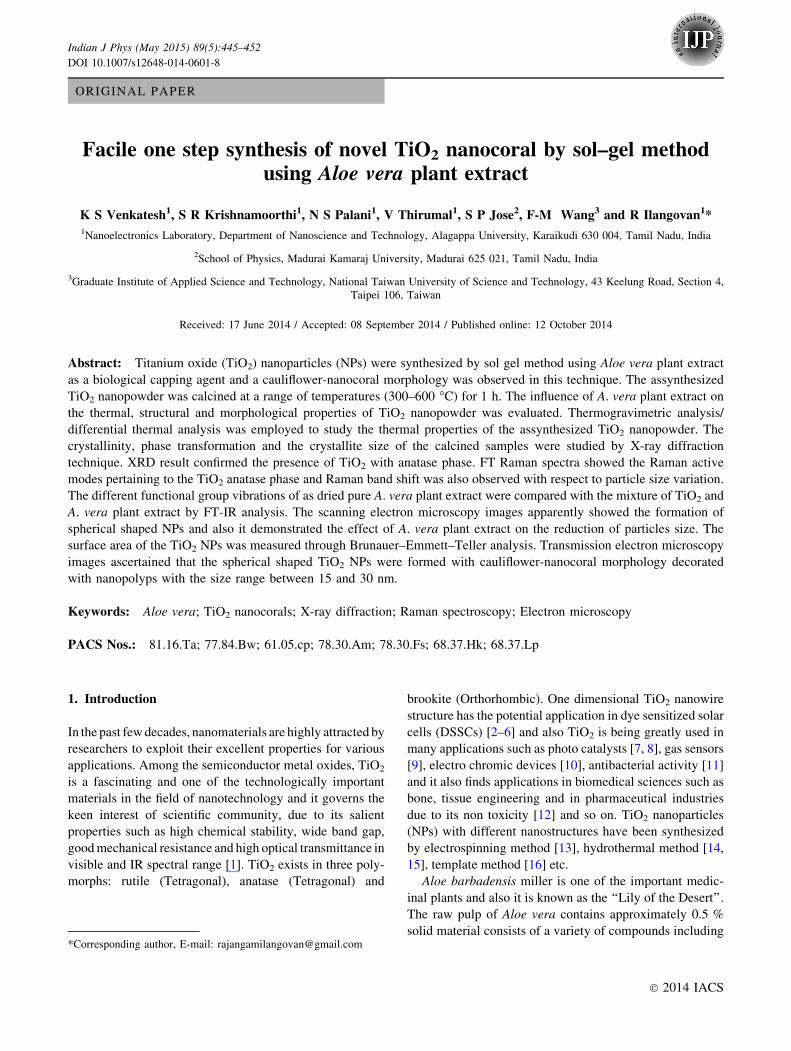
The TGA/DTA analysis has been performed for the as-
synthesized (1AT and 3AT) TiO2 nanopowder. In TGA
curve of 1AT sample, the weight loss around 100 �C is
attributed to the removal of physically and chemically
entrapped water and a further weight loss at 210 �C is
attributed to the elimination of organic matrix, as shown in
Fig. 1(a). There is no further weight loss after 300 �C and
in association with DTA curve, the oxidation process of the
powder is initiated at the same temperature (300 �C),
which indicates the formation of metal oxide. In the case of
3AT sample, physically and chemically entrapped water
removed at 100 �C and the removal of organic matrix takes
place around 235 �C, as shown in Fig. 1(b). This small
increase in temperature for 3AT is due to the presence of
more surface energy offered by the NPs compared to the
1AT sample. Hence it is understood that biological
molecules enter in the metal oxide matrix and serve as
capping agent. In DTA curve (3AT) a small exothermic
region around 300 �C indicates the crystallization of the
TiO2 nanopowder followed by the oxidation process. In
TGA curve, the further weight loss is observed till 420 �C
associated with the strong exothermic peak in DTA curve,
which is due to complete removal of the sheath of biomass
present over the NPs. In both cases, a small change
observed at around 670 �C may be attributed to the phase
transformation of TiO2 from anatase to rutile.
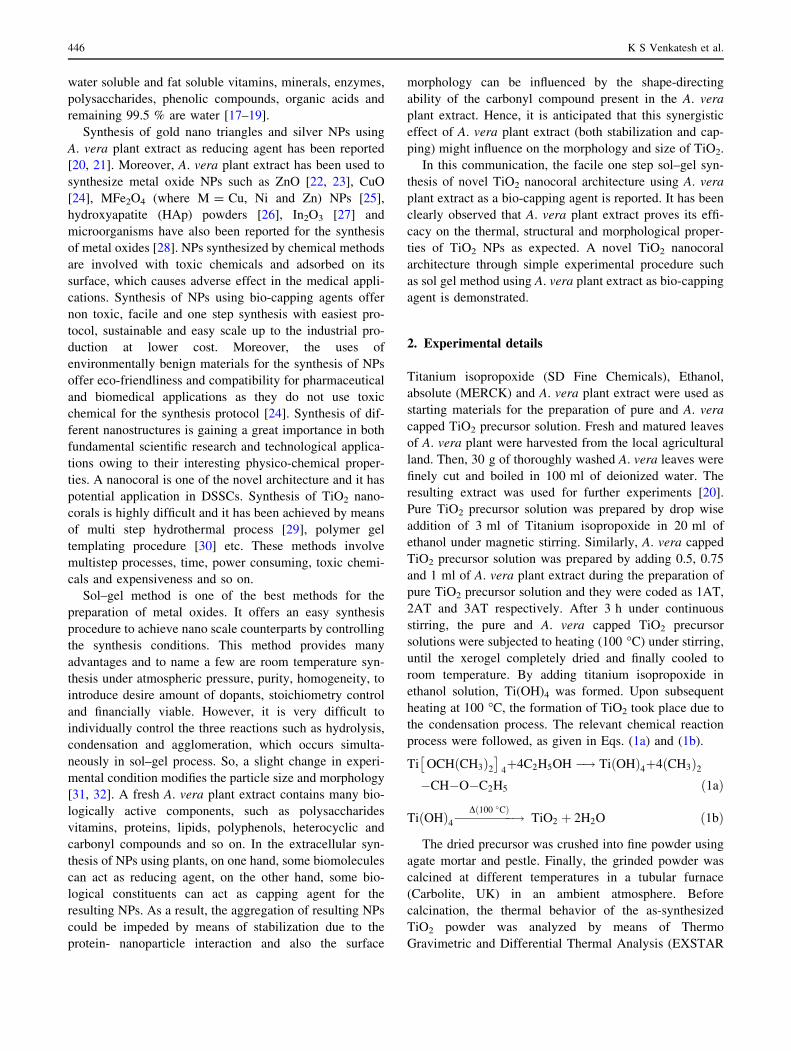
As shown in the XRD pattern of 1AT and 2AT samples,
the as-synthesized TiO2 nanopowder is amorphous. After
the calcination, the predominant peak found out for the
1AT, 2AT and 3AT samples at 25.3� (2h) with (101) plane
and other planes such as (004), (200), (211), (204), (116),
(103), (112), (113), (105) are corresponding to anatase
phase as shown in Fig. 2(a)–2(c). In the case of 1AT, the
rutile phase of TiO2 is also observed only at the calcination
temperature of 600 �C and the planes (110), (101), (111),
(210), (211), (220), (310) refers to the rutile phase, as
shown in Fig. 2(a). All the observed diffraction peak values
are closely match with the standard diffraction data
(JCPDS File No: 89-4921, 89-4920). The crystallization
Fig. 1 TGA/DTA curve of as-synthesized TiO2 nanopowder.
(a) 1AT and (b) 3AT
Facile one step synthesis of novel TiO2 nanocoral 447
temperature of as-synthesized TiO2 nanopowder has been
observed at 300 �C for 1AT and 3AT samples and this is
consistent with the TGA/DTA results. The free energy of
rutile phase is always less than that of anatase phase,
making the rutile is more stable phase at all temperatures.
But the rutile phase has been not observed for 2AT and
3AT even at higher calcination temperature (600 �C)
owing to higher concentration (0.75, 1 ml) of A. vera plant
extract. The A. vera plant extract (0.75 onwards), which
hinders the grain growth, thereby leads to the NPs and also
retards the phase transformation. Hence, the phase trans-
formation of TiO2 from anatase to rutile can be controlled
by bio-capping agent. Indeed, the improvement in the
degree of crystallinity has been clearly observed with the
increase of calcination temperature.
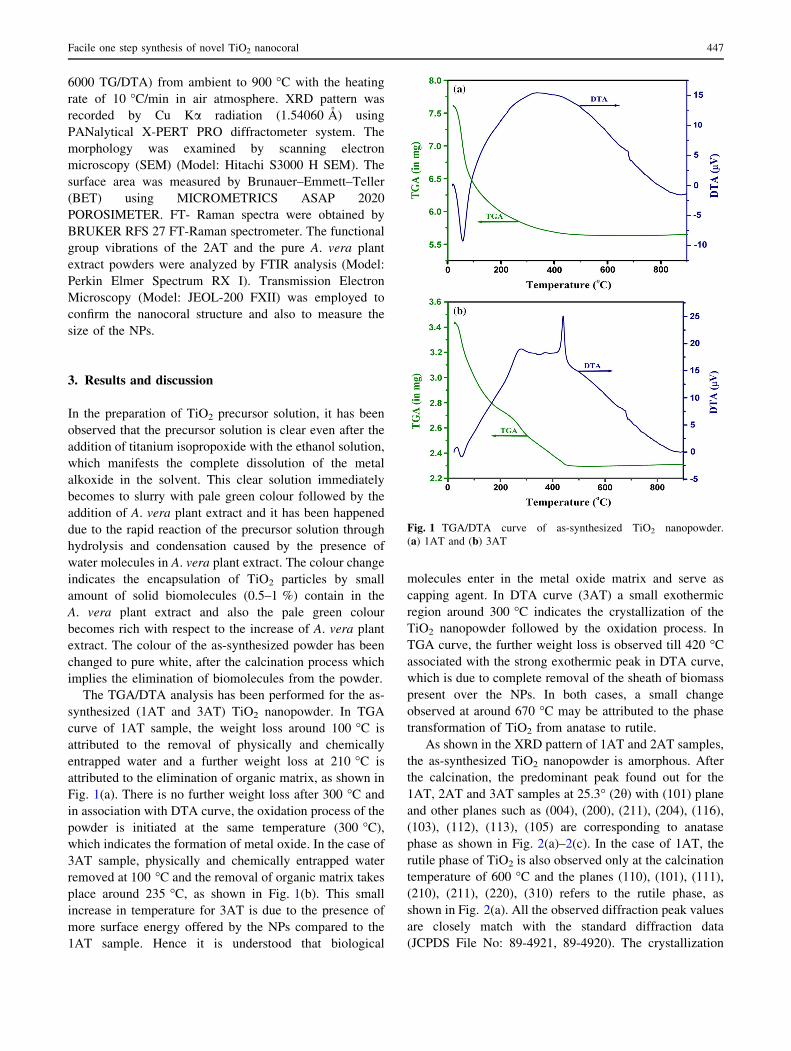
The crystallite size of the synthesized TiO2 nanopowder
has been calculated using scherrer equation (Eq. 2).
D ¼ 0:9kb cos h
ð2Þ
1
d2¼ h2 þ k2
a2þ l2
cð3Þ
where 0.9 is a constant, k is the wavelength of X-ray
source, b is the full width at the half maximum in radians, his the Bragg’s diffraction angle. The effect of concentration
of A. vera plant extract and the calcination temperature on
the crystallite size of the synthesized TiO2 nanopowder is
presented in Fig. 3. The lattice constants are calculated
using X ray diffraction data from the formula of Tetragonal
crystal system (Eq. 3). The calculated lattice constants are
presented in Table 1. These values are in close agreement
with the standard values of both anatase and rutile phasesFig. 2 XRD patterns of TiO2 nanopowder. (a) 1AT, (b) 2AT and
(c) 3AT
Fig. 3 Crystallite size versus calcination temperature of TiO2
nanopowder
448 K S Venkatesh et al.
of TiO2. A small deviation in both phases of calculated
lattice constant values with respect to those standard values
may be due to the strain of the TiO2 nanopowder caused by
the heat treatment (calcination) and/or may be due to the
instrumental error.
It is well known that TiO2 exists in three polymorphs
namely anatase, rutile and brookite. Rutile is thermody-
namically stable, whereas anatase and brookite undergo
irreversible exothermic transformation to rutile with
respect to the range of temperature. Rutile, anatase and
brookite phases of TiO2 have 4, 6 and 36 Raman active
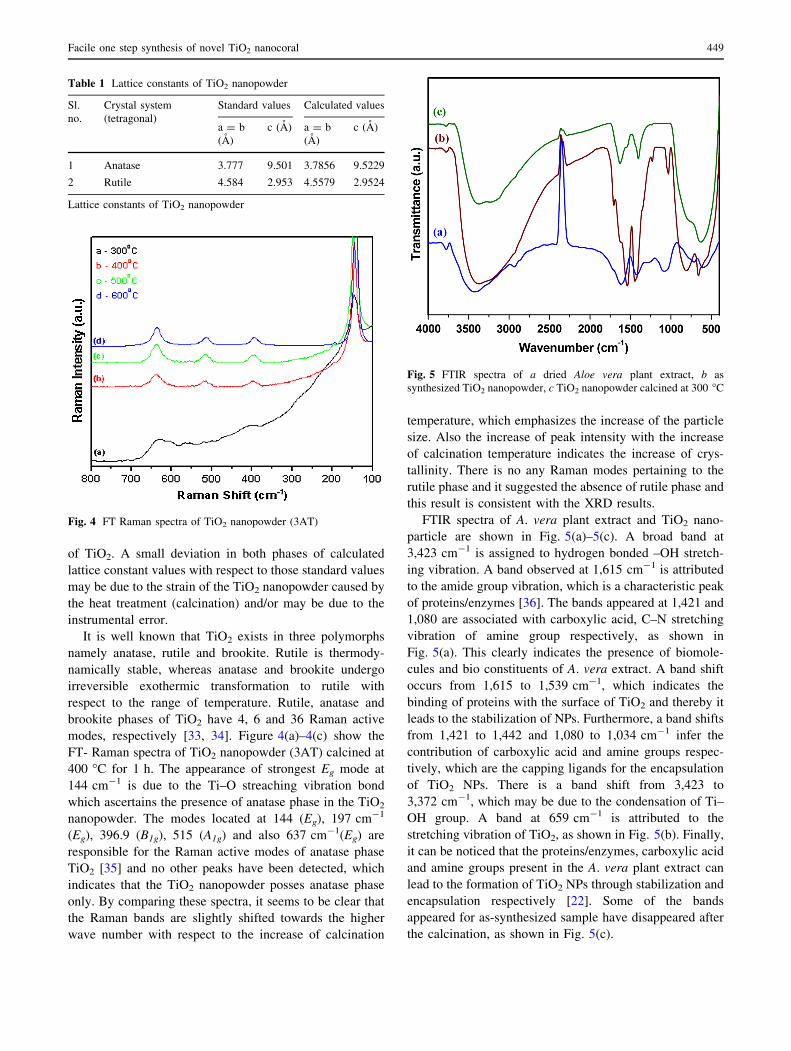
modes, respectively [33, 34]. Figure 4(a)–4(c) show the
FT- Raman spectra of TiO2 nanopowder (3AT) calcined at
400 �C for 1 h. The appearance of strongest Eg mode at
144 cm-1 is due to the Ti–O streaching vibration bond
which ascertains the presence of anatase phase in the TiO2
nanopowder. The modes located at 144 (Eg), 197 cm-1
(Eg), 396.9 (B1g), 515 (A1g) and also 637 cm-1(Eg) are
responsible for the Raman active modes of anatase phase
TiO2 [35] and no other peaks have been detected, which
indicates that the TiO2 nanopowder posses anatase phase
only. By comparing these spectra, it seems to be clear that
the Raman bands are slightly shifted towards the higher
wave number with respect to the increase of calcination
temperature, which emphasizes the increase of the particle
size. Also the increase of peak intensity with the increase
of calcination temperature indicates the increase of crys-
tallinity. There is no any Raman modes pertaining to the
rutile phase and it suggested the absence of rutile phase and
this result is consistent with the XRD results.
FTIR spectra of A. vera plant extract and TiO2 nano-
particle are shown in Fig. 5(a)–5(c). A broad band at
3,423 cm-1 is assigned to hydrogen bonded –OH stretch-
ing vibration. A band observed at 1,615 cm-1 is attributed
to the amide group vibration, which is a characteristic peak
of proteins/enzymes [36]. The bands appeared at 1,421 and
1,080 are associated with carboxylic acid, C–N stretching
vibration of amine group respectively, as shown in
Fig. 5(a). This clearly indicates the presence of biomole-
cules and bio constituents of A. vera extract. A band shift
occurs from 1,615 to 1,539 cm-1, which indicates the
binding of proteins with the surface of TiO2 and thereby it
leads to the stabilization of NPs. Furthermore, a band shifts
from 1,421 to 1,442 and 1,080 to 1,034 cm-1 infer the
contribution of carboxylic acid and amine groups respec-
tively, which are the capping ligands for the encapsulation
of TiO2 NPs. There is a band shift from 3,423 to
3,372 cm-1, which may be due to the condensation of Ti–
OH group. A band at 659 cm-1 is attributed to the
stretching vibration of TiO2, as shown in Fig. 5(b). Finally,
it can be noticed that the proteins/enzymes, carboxylic acid
and amine groups present in the A. vera plant extract can
lead to the formation of TiO2 NPs through stabilization and
encapsulation respectively [22]. Some of the bands
appeared for as-synthesized sample have disappeared after
the calcination, as shown in Fig. 5(c).
Fig. 4 FT Raman spectra of TiO2 nanopowder (3AT)
Fig. 5 FTIR spectra of a dried Aloe vera plant extract, b as
synthesized TiO2 nanopowder, c TiO2 nanopowder calcined at 300 �C
Table 1 Lattice constants of TiO2 nanopowder
Sl.
no.
Crystal system
(tetragonal)
Standard values Calculated values
a = b
(A)
c (A) a = b
(A)
c (A)
1 Anatase 3.777 9.501 3.7856 9.5229
2 Rutile 4.584 2.953 4.5579 2.9524
Lattice constants of TiO2 nanopowder
Facile one step synthesis of novel TiO2 nanocoral 449
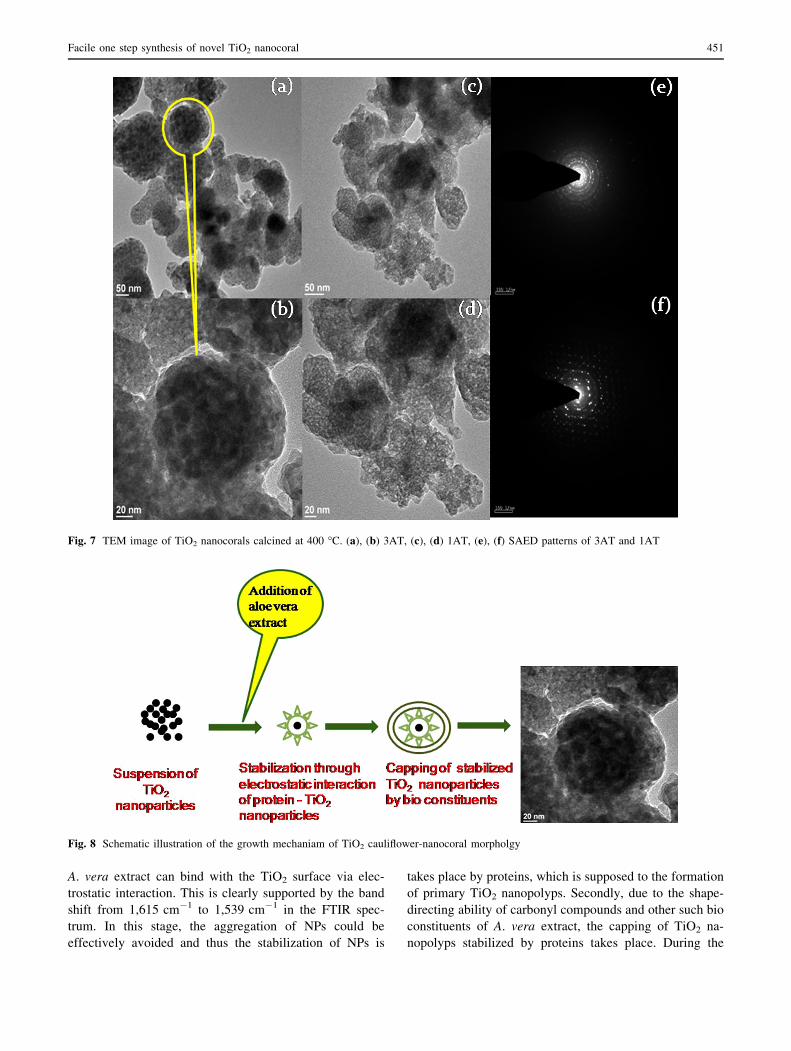
Figure 6(a) shows the SEM image of pure TiO2 powder,
in which the particles are highly agglomerated due to the
simultaneous hydrolysis, condensation and aggregation. It is
apparently seen from the Fig. 6(b)–6(f) that the impact of
A. vera plant extract is clearly observed on the control of
agglomeration as well as reduction in particles size of TiO2
nanopowder. It elucidates the decrease of particles size with
the increase of A. vera plant extract and also it indicates the
spherical shape of the particles. Moreover, the uniformity of
the particles (2AT and 3AT) implies the well association of
biomolecules with TiO2 NPs during the synthesis process. In
order to ascertain the morphology and particle size (3AT), it
has been further subjected to TEM analysis.
The surface area of the TiO2 nanocorals (3AT sample)
calcined at 400 �C has been measured using nitrogen gas
adsorption by BET analysis and the specific surface area is
27.6238 m2/g.
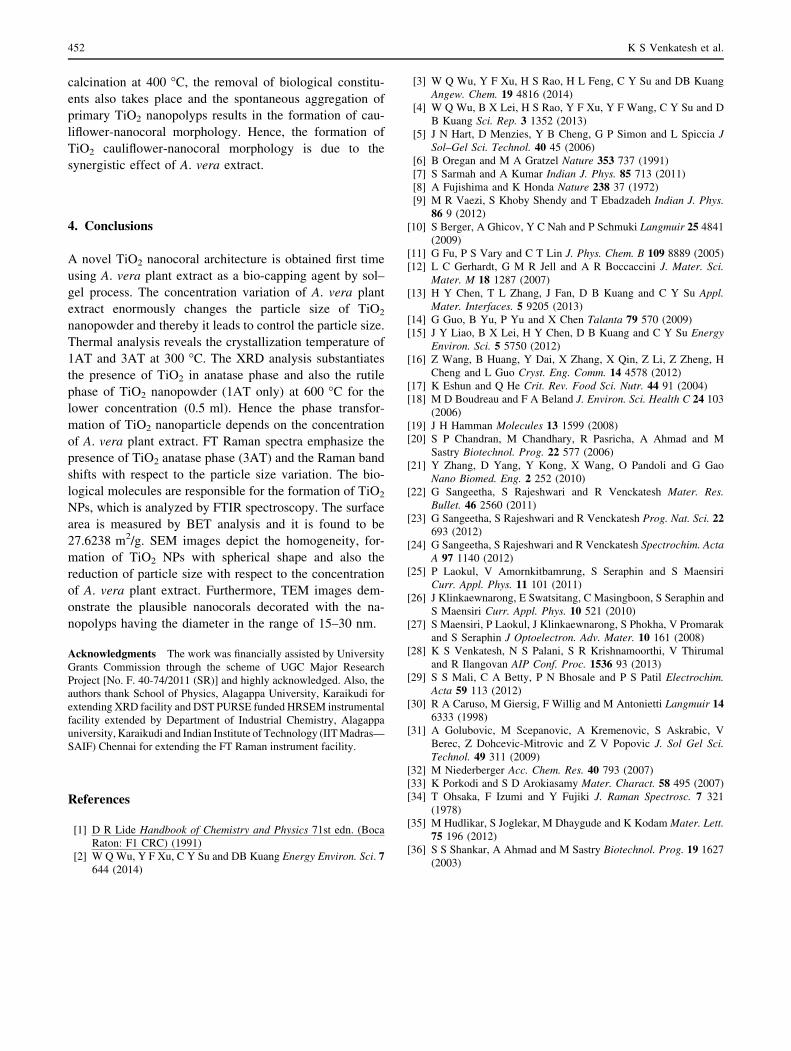
As shown in the TEM image, it perspicuously depicted
the presence of plausible nanocorals Fig. 7(a)–7(d) with
the diameter in the range of 80–200 nm. It can be clearly
visualize that the nanocorals are decorated with the na-
nopolyps of titanium oxide (TiO2) having the size in the
range between 15 and 30 nm. SAED pattens of the syn-
thesized TiO2 nanopowder show a polycrystalline nature in
Fig. 7(e) and 7(f).
The possible growth mechanism for the resultant TiO2
cauliflower morphology is still unclear but it is understood
on the basis of observed experimental results presented in
Fig. 8. As already discussed, the addition of A. vera extract
results the change of TiO2 precursor solution from its clear
nature to slurry. This indicates the rapid reaction of A. vera
extract with TiO2 precursor solution. The growth mecha-
nism may occur in two stages. Firstly, the protein/enzyme–
nanoparticle interaction takes place i.e. the protein of the
Fig. 6 SEM image of TiO2 nanopowder calcined at 400 �C. (a) Pure TiO2 without Aloe vera plant extract. (b) 1AT, (c) and (d) 2AT, (e) and
(f) 3AT
450 K S Venkatesh et al.
A. vera extract can bind with the TiO2 surface via elec-
trostatic interaction. This is clearly supported by the band
shift from 1,615 cm-1 to 1,539 cm-1 in the FTIR spec-
trum. In this stage, the aggregation of NPs could be
effectively avoided and thus the stabilization of NPs is
takes place by proteins, which is supposed to the formation
of primary TiO2 nanopolyps. Secondly, due to the shape-
directing ability of carbonyl compounds and other such bio
constituents of A. vera extract, the capping of TiO2 na-
nopolyps stabilized by proteins takes place. During the
Fig. 7 TEM image of TiO2 nanocorals calcined at 400 �C. (a), (b) 3AT, (c), (d) 1AT, (e), (f) SAED patterns of 3AT and 1AT
Fig. 8 Schematic illustration of the growth mechaniam of TiO2 cauliflower-nanocoral morpholgy
Facile one step synthesis of novel TiO2 nanocoral 451
calcination at 400 �C, the removal of biological constitu-
ents also takes place and the spontaneous aggregation of
primary TiO2 nanopolyps results in the formation of cau-
liflower-nanocoral morphology. Hence, the formation of
TiO2 cauliflower-nanocoral morphology is due to the
synergistic effect of A. vera extract.
4. Conclusions
A novel TiO2 nanocoral architecture is obtained first time
using A. vera plant extract as a bio-capping agent by sol–
gel process. The concentration variation of A. vera plant
extract enormously changes the particle size of TiO2
nanopowder and thereby it leads to control the particle size.
Thermal analysis reveals the crystallization temperature of
1AT and 3AT at 300 �C. The XRD analysis substantiates
the presence of TiO2 in anatase phase and also the rutile
phase of TiO2 nanopowder (1AT only) at 600 �C for the
lower concentration (0.5 ml). Hence the phase transfor-
mation of TiO2 nanoparticle depends on the concentration
of A. vera plant extract. FT Raman spectra emphasize the
presence of TiO2 anatase phase (3AT) and the Raman band
shifts with respect to the particle size variation. The bio-
logical molecules are responsible for the formation of TiO2
NPs, which is analyzed by FTIR spectroscopy. The surface
area is measured by BET analysis and it is found to be
27.6238 m2/g. SEM images depict the homogeneity, for-
mation of TiO2 NPs with spherical shape and also the
reduction of particle size with respect to the concentration
of A. vera plant extract. Furthermore, TEM images dem-
onstrate the plausible nanocorals decorated with the na-
nopolyps having the diameter in the range of 15–30 nm.
Acknowledgments The work was financially assisted by University
Grants Commission through the scheme of UGC Major Research
Project [No. F. 40-74/2011 (SR)] and highly acknowledged. Also, the
authors thank School of Physics, Alagappa University, Karaikudi for
extending XRD facility and DST PURSE funded HRSEM instrumental
facility extended by Department of Industrial Chemistry, Alagappa
university, Karaikudi and Indian Institute of Technology (IIT Madras—
SAIF) Chennai for extending the FT Raman instrument facility.
References
[1] D R Lide Handbook of Chemistry and Physics 71st edn. (Boca
Raton: F1 CRC) (1991)
[2] W Q Wu, Y F Xu, C Y Su and DB Kuang Energy Environ. Sci. 7644 (2014)
[3] W Q Wu, Y F Xu, H S Rao, H L Feng, C Y Su and DB Kuang
Angew. Chem. 19 4816 (2014)
[4] W Q Wu, B X Lei, H S Rao, Y F Xu, Y F Wang, C Y Su and D
B Kuang Sci. Rep. 3 1352 (2013)
[5] J N Hart, D Menzies, Y B Cheng, G P Simon and L Spiccia J
Sol–Gel Sci. Technol. 40 45 (2006)
[6] B Oregan and M A Gratzel Nature 353 737 (1991)
[7] S Sarmah and A Kumar Indian J. Phys. 85 713 (2011)
[8] A Fujishima and K Honda Nature 238 37 (1972)
[9] M R Vaezi, S Khoby Shendy and T Ebadzadeh Indian J. Phys.
86 9 (2012)
[10] S Berger, A Ghicov, Y C Nah and P Schmuki Langmuir 25 4841
(2009)
[11] G Fu, P S Vary and C T Lin J. Phys. Chem. B 109 8889 (2005)
[12] L C Gerhardt, G M R Jell and A R Boccaccini J. Mater. Sci.
Mater. M 18 1287 (2007)
[13] H Y Chen, T L Zhang, J Fan, D B Kuang and C Y Su Appl.
Mater. Interfaces. 5 9205 (2013)
[14] G Guo, B Yu, P Yu and X Chen Talanta 79 570 (2009)
[15] J Y Liao, B X Lei, H Y Chen, D B Kuang and C Y Su Energy
Environ. Sci. 5 5750 (2012)
[16] Z Wang, B Huang, Y Dai, X Zhang, X Qin, Z Li, Z Zheng, H
Cheng and L Guo Cryst. Eng. Comm. 14 4578 (2012)
[17] K Eshun and Q He Crit. Rev. Food Sci. Nutr. 44 91 (2004)
[18] M D Boudreau and F A Beland J. Environ. Sci. Health C 24 103
(2006)
[19] J H Hamman Molecules 13 1599 (2008)
[20] S P Chandran, M Chandhary, R Pasricha, A Ahmad and M
Sastry Biotechnol. Prog. 22 577 (2006)
[21] Y Zhang, D Yang, Y Kong, X Wang, O Pandoli and G Gao
Nano Biomed. Eng. 2 252 (2010)
[22] G Sangeetha, S Rajeshwari and R Venckatesh Mater. Res.
Bullet. 46 2560 (2011)
[23] G Sangeetha, S Rajeshwari and R Venckatesh Prog. Nat. Sci. 22693 (2012)
[24] G Sangeetha, S Rajeshwari and R Venckatesh Spectrochim. Acta
A 97 1140 (2012)
[25] P Laokul, V Amornkitbamrung, S Seraphin and S Maensiri
Curr. Appl. Phys. 11 101 (2011)
[26] J Klinkaewnarong, E Swatsitang, C Masingboon, S Seraphin and
S Maensiri Curr. Appl. Phys. 10 521 (2010)
[27] S Maensiri, P Laokul, J Klinkaewnarong, S Phokha, V Promarak
and S Seraphin J Optoelectron. Adv. Mater. 10 161 (2008)
[28] K S Venkatesh, N S Palani, S R Krishnamoorthi, V Thirumal
and R Ilangovan AIP Conf. Proc. 1536 93 (2013)
[29] S S Mali, C A Betty, P N Bhosale and P S Patil Electrochim.
Acta 59 113 (2012)
[30] R A Caruso, M Giersig, F Willig and M Antonietti Langmuir 146333 (1998)
[31] A Golubovic, M Scepanovic, A Kremenovic, S Askrabic, V
Berec, Z Dohcevic-Mitrovic and Z V Popovic J. Sol Gel Sci.
Technol. 49 311 (2009)
[32] M Niederberger Acc. Chem. Res. 40 793 (2007)
[33] K Porkodi and S D Arokiasamy Mater. Charact. 58 495 (2007)
[34] T Ohsaka, F Izumi and Y Fujiki J. Raman Spectrosc. 7 321
(1978)
[35] M Hudlikar, S Joglekar, M Dhaygude and K Kodam Mater. Lett.
75 196 (2012)
[36] S S Shankar, A Ahmad and M Sastry Biotechnol. Prog. 19 1627
(2003)
452 K S Venkatesh et al.
Related Documents


