Edited by Gábor Soós and Violetta Zentai Comparative Papers from Central and Eastern Europe Local Government and Public Service Reform Initiative Faces of Local Democracy

Welcome message from author
This document is posted to help you gain knowledge. Please leave a comment to let me know what you think about it! Share it to your friends and learn new things together.
Transcript
Edited byGábor Soós and Violetta Zentai
Comparative Papers from Central and Eastern Europe
Local Governmentand Public Service Reform Initiative
Faces of Local Democracy
Faces of
Local Democracy
Comparative Papers
from Central and Eastern Europe
Local Governmentand Public ServiceReform Initiative
E d i t e d b y
G S V Z
L G P S R I
O S I–B
Address
Nádor utca 11.
H-1051 Budapest, Hungary
Mailing address
P.O. Box 519
H-1357 Budapest, Hungary
Telephone
(36-1) 327-3104
Fax
(36-1) 327-3105
Web Site
http://lgi.osi.hu/
First published in 2005
by Local Government and Public Service Reform Initiative, Open Society Institute–Budapest
© OSI/LGI, 2005
ISBN: 963 9419 54 0
The judgments expressed herein do not necessarily reflect the views of the above two sponsors.
All rights reserved. No part of this book may be reprinted or reproduced or utilized in any form or
by any electronic, mechanical or other means, now known or hereafter invented, including photocopying and
recording, or in any information storage or retrieval system, without permission in writing from the publishers.
Copies of the book can be ordered by e-mail or post from LGI.
Copy editor: Kim Fraser
Cover photo: © Panos Pictures
Printed in Budapest, Hungary, January 2005
Design & Layout by Createch Ltd.
OPEN SOCIETY INSTITUTE
TM and Copyright © 2005 Open Society Institute
iii
Contents
List of Contributors .....................................................................v
List of Tables and Figures ...........................................................vii
Introduction .................................................................................1
Parties and Political Culture in Central
and Eastern European Local Governments
Paweł Swianiewicz, Adam Mielczarek ..........................................13
The Gender Gap in Local Political Leaderships
in Central and Eastern Europe
Zsolt Nyiri, Richard Vengroff ........................................................79
The Influence of Local Media on Local Government
Performance, and Why It Matters
Tania Gosselin ...........................................................................123
Municipality Size and Citizens’ Effectiveness:
Hungary, Poland, and Romania
Daniel Pop ................................................................................169
Approaches to Local Representation in Poland,
Estonia, and Bulgaria
Cristina Nicolescu, Amelia Gorcea ..............................................207
Political Parties in Local Governance: Do Delegates
Represent Local or National Interests?
Filip Franek ..............................................................................243
Institutional Balance in Local Government: Council,
Mayor, and City Manager in Local Policymaking
Georg Sootla, Kristina Grau .......................................................275
Index ........................................................................................301

v
List of Contributors
Filip Franek is employed at the Oxfordshire County Council in England. After obtain-
ing an M.A. from Masaryk University in Brno, the Czech Republic, he completed a
Masters degree in Nationalism Studies from Central European University in Budapest,
Hungary.
Amelia Gorcea is a program assistant at the Ethnocultural Diversity Resource Center
in Cluj Napoca, Romania.
Tania Gosselin is a Ph.D. candidate in political science at Central European University
in Budapest, Hungary.
Kristina Grau is a research assistant at Tallinn University of Educational Sciences,
Tallinn, Estonia.
Adam Mielczarek is a sociologist who runs an independent Centre for Local Studies
in Warsaw, Poland.
Cristina Nicolescu is employed at the Pro Vobis National Volunteer Center in Cluj
Napoca, Romania, and is a Senior Fellow with the Johns Hopkins International Fellows
in Philanthropy Program at Johns Hopkins University in Baltimore, USA.
Daniel Pop is an associate lecturer in political science at Babes-Bolyai University,
Romania.
Zsolt Nyíri is a Ph.D. candidate in political science at the University of Connecticut,
U.S.A.
Gábor Soós is a research fellow at the Tocqueville Research Center, Budapest.
Georg Sootla is a professor of public policy in the Department of Government, Tallinn
University of Educational Sciences, Tallinn, Estonia.
vi
Paweł Swianiewicz is a professor in the Centre for European Regional and Local Stud-
ies, Warsaw University, Poland.
Richard Vengroff is a professor of political science at the University of Connecticut,
specializing in comparative politics (Africa and Canada), development administration,
and management.
Violetta Zentai is the director of the Center for Policy Studies (Central European
University) and a project manager at the Local Government Initiative (Open Society
Institute), Budapest, Hungary.
vii
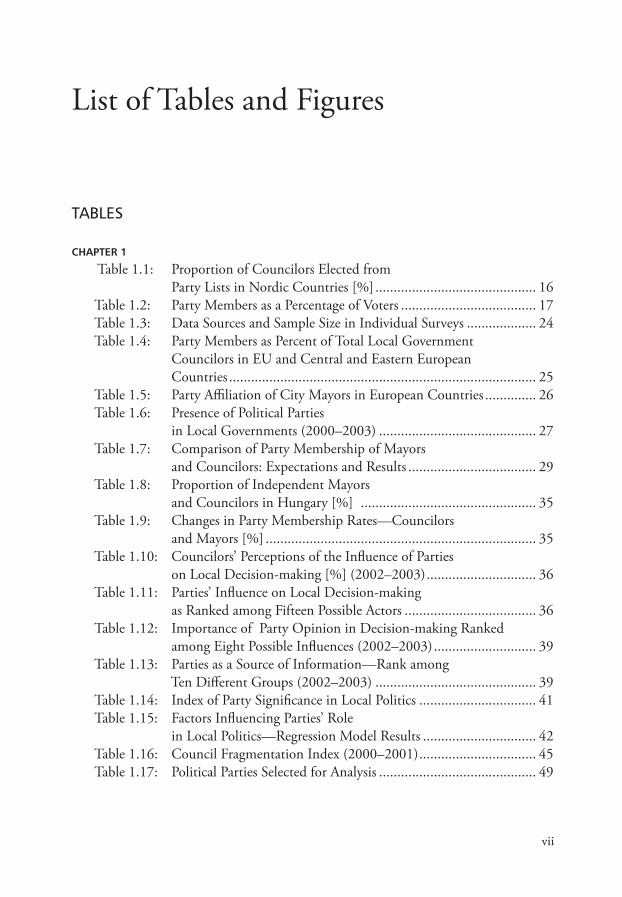
List of Tables and Figures
TABLES
CHAPTER 1
Table 1.1: Proportion of Councilors Elected from
Party Lists in Nordic Countries [%] ............................................ 16
Table 1.2: Party Members as a Percentage of Voters ..................................... 17
Table 1.3: Data Sources and Sample Size in Individual Surveys ................... 24
Table 1.4: Party Members as Percent of Total Local Government
Councilors in EU and Central and Eastern European
Countries .................................................................................... 25
Table 1.5: Party Affiliation of City Mayors in European Countries .............. 26
Table 1.6: Presence of Political Parties
in Local Governments (2000–2003) ........................................... 27
Table 1.7: Comparison of Party Membership of Mayors
and Councilors: Expectations and Results ................................... 29
Table 1.8: Proportion of Independent Mayors
and Councilors in Hungary [%] ................................................ 35
Table 1.9: Changes in Party Membership Rates—Councilors
and Mayors [%] .......................................................................... 35
Table 1.10: Councilors’ Perceptions of the Influence of Parties
on Local Decision-making [%] (2002–2003) .............................. 36
Table 1.11: Parties’ Influence on Local Decision-making
as Ranked among Fifteen Possible Actors .................................... 36
Table 1.12: Importance of Party Opinion in Decision-making Ranked
among Eight Possible Influences (2002–2003) ............................ 39
Table 1.13: Parties as a Source of Information—Rank among
Ten Different Groups (2002–2003) ............................................ 39
Table 1.14: Index of Party Significance in Local Politics ................................ 41
Table 1.15: Factors Influencing Parties’ Role
in Local Politics—Regression Model Results ............................... 42
Table 1.16: Council Fragmentation Index (2000–2001) ................................ 45
Table 1.17: Political Parties Selected for Analysis ........................................... 49
viii
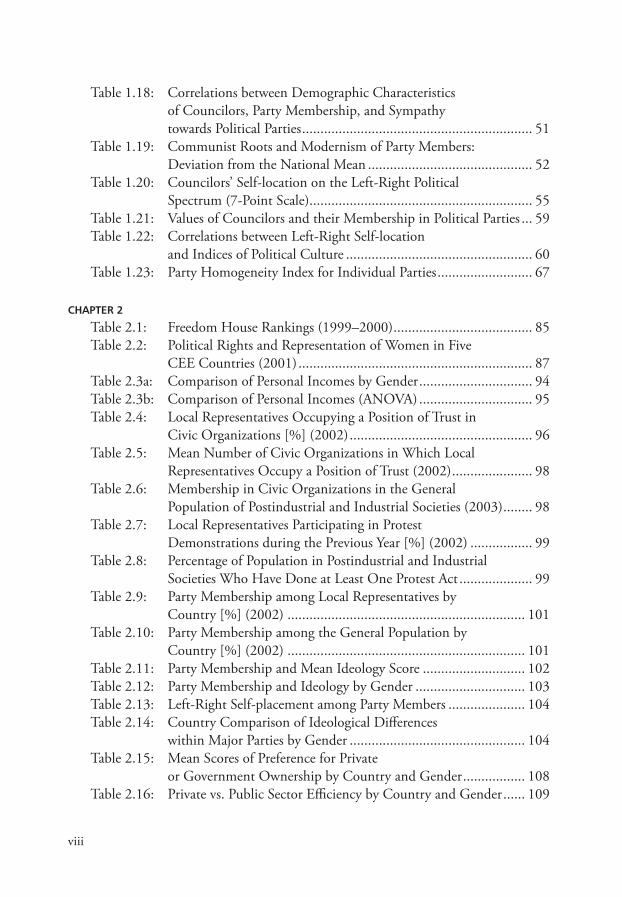
Table 1.18: Correlations between Demographic Characteristics
of Councilors, Party Membership, and Sympathy
towards Political Parties ............................................................... 51
Table 1.19: Communist Roots and Modernism of Party Members:
Deviation from the National Mean ............................................. 52
Table 1.20: Councilors’ Self-location on the Left-Right Political
Spectrum (7-Point Scale) ............................................................. 55
Table 1.21: Values of Councilors and their Membership in Political Parties ... 59
Table 1.22: Correlations between Left-Right Self-location
and Indices of Political Culture ................................................... 60
Table 1.23: Party Homogeneity Index for Individual Parties .......................... 67
CHAPTER 2
Table 2.1: Freedom House Rankings (1999–2000) ...................................... 85
Table 2.2: Political Rights and Representation of Women in Five
CEE Countries (2001) ................................................................ 87
Table 2.3a: Comparison of Personal Incomes by Gender ............................... 94
Table 2.3b: Comparison of Personal Incomes (ANOVA) ............................... 95
Table 2.4: Local Representatives Occupying a Position of Trust in
Civic Organizations [%] (2002) .................................................. 96
Table 2.5: Mean Number of Civic Organizations in Which Local
Representatives Occupy a Position of Trust (2002) ...................... 98
Table 2.6: Membership in Civic Organizations in the General
Population of Postindustrial and Industrial Societies (2003) ........ 98
Table 2.7: Local Representatives Participating in Protest
Demonstrations during the Previous Year [%] (2002) ................. 99
Table 2.8: Percentage of Population in Postindustrial and Industrial
Societies Who Have Done at Least One Protest Act .................... 99
Table 2.9: Party Membership among Local Representatives by
Country [%] (2002) ................................................................. 101
Table 2.10: Party Membership among the General Population by
Country [%] (2002) ................................................................. 101
Table 2.11: Party Membership and Mean Ideology Score ............................ 102
Table 2.12: Party Membership and Ideology by Gender .............................. 103
Table 2.13: Left-Right Self-placement among Party Members ..................... 104
Table 2.14: Country Comparison of Ideological Differences
within Major Parties by Gender ................................................ 104
Table 2.15: Mean Scores of Preference for Private
or Government Ownership by Country and Gender ................. 108
Table 2.16: Private vs. Public Sector Efficiency by Country and Gender ...... 109
ix
Table 2.17: Role of Government Score by Country and Gender .................. 110
Table 2.18: Within Cohort Gender Gap—Role of Government II
(Norris and Inglehart Measure ) ................................................ 111
Table 2.19: Left-Right Self-placement by Country and Gender ................... 112
Table 2.20: Within-Cohort Gender Gap: Left-Right Self-placement
by Country ............................................................................... 113
Table 2.21: OLS Regression Models with the Role of Government
Dependent ................................................................................ 117
CHAPTER 3
Table 3.1: Localities per Number of Media Outlets [%] (2001) ................. 127
Table 3.2: Impact of Media Presence on Decisional
and Democratic Performance .................................................... 140
Table 3.3: The Impact of Media Features on Decisional
and Democratic Performance .................................................... 142
Table 3.4: The Impact of Media Features, Civic Organizations,
Political Parties, Citizens’ Initiatives, Unemployment,
Education of Local Government Staff, and Population
Cleavages on Performance ......................................................... 143
CHAPTER 4
Table 4.1: Municipalities by Population Size and Number of Inhabitants .... 174
Table 4.2: Municipalities’ Share in Type of Citizen Participation
in Local Politics ......................................................................... 176
Table 4.3: Citizen Effectiveness in Influencing Local Decision-making
in Hungary (by Size of Municipality) ........................................ 180
Table 4.4: Share of Municipalities in Which Citizen Participation
Occurred at Least Once (Hungary) ........................................... 180
Table 4.5: Revenue Rigidity by Municipality Size in Hungary ................... 182
Table 4.6: Citizens’ Effectiveness in Influencing Local Decision-making
in Poland (by Municipality Size) ............................................... 184
Table 4.7: Share of Municipalities with at Least One Case
of Citizen Participation (Poland) ............................................... 185
Table 4.8: Revenue Rigidity by Municipality Size (Poland) ........................ 186
Table 4.9: Citizens’ Effectiveness in Influencing Local Decision-making
by Municipality Size (Romania) ................................................ 189
Table 4.10: Share of Municipalities in Which Citizen Participation
Was Undertaken at Least Once (Romania) ................................ 190
Table 4.11: Revenue Rigidity by Municipality Size (Romania) .................... 191
x
Table 4.12: Citizen Effectiveness in Influencing Local Decision-making
in All Three Countries [%] ........................................................ 192
Table 4.13: Ratio of Share of Government Transfers to the Total Number
of Municipalities ...................................................................... 193
Table 4.14: Share of Government Transfers to Small Municipalities ............. 194
Table 4.15: Share of Government Transfers to Medium-size Municipalities ... 194
Table 4.16: Share of Government Transfers to Large Municipalities ............. 195
Table 4.17: Citizen Participation in Local Politics
by Type (Small Municipalities) .................................................. 196
Table 4.18: Citizen Participation in Local Politics by Type
(Medium-size Municipalities) .................................................... 197
Table 4.19: Citizen Participation in Local Politics by Type
(Large Municipalities) ............................................................... 197
CHAPTER 5
Table 5.1: Freedom House Country Ratings (1991 to 2002) ..................... 215
Table 5.2: Demographic Characteristics of Local Representatives
in Poland, Bulgaria, and Estonia (2002) .................................... 217
Table 5.3: Political Views and Membership of Local Representatives
in Poland, Bulgaria, and Estonia (2002) .................................... 218
Table 5.4: Position of Surveyed Local Representatives in the Local
Administrative System (2002) ................................................... 218
Table 5.5: Level of Generalized Trust among Local Representatives
in Estonia, Poland, and Bulgaria (2002) .................................... 221
Table 5.6: Ranking of Strategic Goals by Local Representatives
in Bulgaria, Poland, and Estonia [%] (2002) ............................. 225
Table 5.7: Value Orientations of Local Representatives in Bulgaria,
Poland, and Estonia [%] (2002) ................................................ 225
Table 5.8: Experience of Local Representatives in Holding Public Office ... 227
Table 5.9: Items Considered for the Final Distribution
of the Dependent Variable ........................................................ 229
Table 5.10: Frequency Distribution of the Dependent Variable [%] ............ 229
Table 5.11: Logistic Regression Coefficients for Estonia .............................. 231
Table: 5.12: Logistic Regression Coefficients for Bulgaria and Poland ........... 231
CHAPTER 6
Table 6.1: Frequency of Requests to Explain Position (Means) .................. 259
Table 6.2: Groups of Special Consideration (Means) ................................. 259
Table 6.3: Bulgaria (Pearson Correlation) .................................................. 262
Table 6.4: Estonia (Pearson Correlation) ................................................... 263
xi
Table 6.5: Hungary (Pearson Correlation) ................................................. 266
Table 6.6: Party and NGO Membership in Estonia ................................... 267
Table 6.7: Party and NGO Membership in Hungary ................................. 268
Table 6.8: Party Membership and Participation
in Demonstrations in Hungary ................................................. 268
Table 6.9: Party Membership and Embeddedness
in the Municipality in Hungary ................................................ 269
Table 6.10: Representation of Local vs. National Interests in Hungary ........ 285
CHAPTER 7
Table 7.1: Distribution of Sent and Received Survey Samples
by Region in Estonia ................................................................. 286
Table 7.2: The Impact of Different Institutional Actors on LG Decisions
According to Top Officials and Councilors (Means) .................. 287
Table 7.3: Impact of Committees on LG Decisions by Size
of Community (Means) ............................................................ 288
Table 7.4: Cooperation between Council and Mayor in Latvia,
Hungary, and Estonia [%] ......................................................... 290
Table 7.5: Impact of Politicization of the Mayor on the Level
of Cooperation between Mayor and Council [%] ...................... 290
Table 7.6: Frequency of Political Party Membership of Mayors [%] ........... 291
Table 7.7: Number of Factions per Council [%] ........................................ 292
Table 7.8: Public Agreement about the Establishment
of a Majority Coalition [%] ...................................................... 293
Table 7.9: Frequency of Unanimous Decisions .......................................... 294
Table 7.10: Voting Behavior in Estonian Councils
by Size of Local Community (Means) ....................................... 295
Table 7.11: Intensity of Review of Costs and Efficiency
of Administration by Councils [%] ........................................... 296
FIGURES
CHAPTER 1
Figure 1.1: Party Membership and Net Sympathy of Councilors
toward Political Parties (2002–2003) .......................................... 31
Figure 1.2: Party Membership and Net Sympathy of Mayors toward
Political Parties (2000–2002) ...................................................... 31
Figure 1.3: Typology of Political Parties’ Culture
(Ward’s Hierarchical Method) ..................................................... 64
Figure 1.4: Typology of Political Parties’ Culture .......................................... 64
xii
CHAPTER 2
Figure 2.1: Comparison of Rankings on Gender-related
Development and the Gender Empowerment Measure ............... 86
Figure 2.2: The Ratio of Estimated Female
to Male Earned Income (2001) ................................................... 88
Figure 2.3: Gender and Education among
Local Representatives (2002–2003) ............................................. 89
Figure 2.4: Representatives Speaking a Foreign Language,
by Gender [%] ............................................................................ 90
Figure 2.5: General Optimism about the Future of the Municipality ............ 91
Figure 2.6: Country and Gender Differences
on the Optimism Index (2002–2003) ......................................... 91
Figure 2.7: Hours Local Representatives Spend on their Activities
by Gender (2002–2003) ............................................................. 92
Figure 2.8: Provision of Office Hours for Constituents,
by Gender (2002–2003) ............................................................. 93
Figure 2.9: Personal Income Relative to the Community,
by Gender (2002–2003) ............................................................. 93
Figure 2.10: Personal Income Relative to Community
by Country (2002–2003) ............................................................ 95
Figure 2.11: Left-Right Self-placement and Party Membership (2003) ......... 102
Figure 2.12: Left-Right Self-placement and Party Membership
by Gender (2003) ..................................................................... 103
Figure 2.13: Preference for Private or Government Ownership
by Country and Gender ............................................................ 107
Figure 2.14: Personal Beliefs on Relative Efficiency of Private
and Public Sectors, by Country and Gender .............................. 109
Figure 2.15: Role of Government Score by Country and Gender .................. 110
Figure 2.16: Within Cohort Gender Gap in Role of Government
by Cohort and Country ............................................................ 111
Figure 2.17: Left-Right Self-placement by Country and Gender ................... 112
Figure 2.18: Within Cohort Gender Gap: Self-placement
on Left-Right Scale by Country ................................................ 113
CHAPTER 3
Figure 3.1: Regression Lines Predicting Democratic Performance
from the Number of Local Media Outlets in Hungary .............. 147

xiii
CHAPTER 4
Figure 4.1: Hungary: Model Summary, ANOVA, and Coefficients ............. 179
Figure 4.2: Poland: Model Summary, ANOVA, and Coefficients ................ 183
Figure 4.3: Romania: Model Summary, ANOVA, and Coefficients ............. 188
CHAPTER 7
Figure 7.1: Proportion of Local Councils with and without Factions [%] ... 293
Figure 7.2: Proportion of Local Councils with Formal
or Informal Coalition Agreements [%] ..................................... 294
1
Introduction
Gábor Soós, Violetta Zentai
1. RATIONALE FOR MONITORING DEMOCRACY AT THE LOCAL LEVEL
Local democracy and the transformation of the local government system have often
remained in the shadow of more appealing topics related to the larger political transfor-
mations in the post-socialist context. Councilors of local municipalities or municipal
decision-making processes rarely capture the attention of researchers and analysts in
contrast to, for example, the ideological struggles of ascending and descending politi-
cal parties or the power struggle between a prime minister’s office and line ministries.
Yet, no one would deny that strengthening the pillars of local democracy is an essential
aspect of the broader democracy-building endeavors in the societies concerned. This
self-evident conception receives a closer scrutiny from those research and developmental
organizations whose mission is to study and enhance democratic governance on the
local level, which is often no less complicated than on the central level.
The Local Government and Public Service Reform Initiative (LGI), in partner-
ship with the Tocqueville Research Center (T–RC) in Budapest, has been conducting
a multi-year project entitled ‘Indicators of Local Democratic Governance’ (hereafter:
‘Indicators’). The project aims to help decision-makers and researchers assess and explain
the state of local democracy in the countries of Central and Eastern Europe. While there
are numerous international research initiatives examining the condition of democracy
on a national level, only a limited number of comparative inquiries have been launched
at the subnational level. The ‘Indicators’ project is a modest but perhaps unique enter-
prise, having three broad aims: (a) the generation of original survey data and collection
of other relevant statistical data; (b) regular reporting on the state of local democracy
in Central and Eastern Europe; and (c) the dissemination of results and standardized
datasets to inform developmental and policy reform initiatives.
Local government systems take a very different shape in ‘old Western democracies’
depending on historical and political circumstances.1 European Union integration,
despite having some important effects on these systems, does not stipulate particular
political and administrative structures for the national and subnational levels. On the
contrary, it values diversity of traditions. Certain principles are spelled out, but those
2
F A C E S O F L O C A L D E M O C R A C Y
do not stipulate systemic changes for the old or new member states. In CEE, SEE, and
CIS countries, local government systems are in the making, replacing the old hierarchical
territorial structures of the single party state (although in the latter group authoritarian
structures are still prevalent). In some countries, mostly in the new EU member states,
the reform or the radical rebuilding process (including constitutional and legal changes;
elections, institutional, and public finance reforms; property restructuring) started more
than a decade ago and has resulted in different but more or less democratic governance
systems. In several states of SEE and the CIS, local governments are in a transient state,
often subject to progressive or nonprogressive changes, or simply stuck in national politi-
cal stalemates. They exist, but their autonomy is frequently formal and their mandates
and governance structures are undecided or unstable. The study of the latter geographical
group is equally as important as the former. The first of the large, multi-year initiatives
of the ‘Indicators’ project has a prime interest in countries that are beyond certain stages
of democratization and modernization of their government systems. The study remains
open to further geographical and conceptual expansion at a later stage.
The ‘Indicators’ initiative is working on the underlying assumption that building
core institutions of democracy has a genuine value on its own, and it is also a precondi-
tion for efficient policymaking at both the central and local levels. Practical experience
from both the Western and post-socialist contexts, however, shows that, on the one
hand, democracy is often not a guarantee to efficient policymaking, and on the other,
satisfactory policy performance is at times supported by political systems that are not
democratic or are only partially so, or even worse. Nonetheless, as a holistic and nor-
mative concept, we propose that democratic political institutions are public goods in
themselves, whereas their actual local configurations have different potentials for efficient
policymaking to promote social and economic progress.
The conceptual frame of the ‘Indicators’ initiative addresses those pillars of de-
mocracy that local governments build within their own bodies and processes, and also
those that the social environment offers. Local communities (in the most neutral sense
of the term) do produce or cultivate institutions that help to build local democracy.
Some elements of administrative and policy performance are included in the ‘Indica-
tors’ inquiry, but the main emphasis is elsewhere. Primarily, the initiative promotes
a democracy-monitoring exercise to the benefit of researchers, policymakers, and local
administrators. It is expected that further research initiatives, whether affiliated with the
‘Indicators’ project or not, could use the methodology and the data to seek correlations
between democracy and policy performance in the case of particular local governments
or whole governmental systems.
Though local pillars of democracy provide the focus of its investigations, the ‘Indi-
cators’ initiative resonates with a recent conceptual shift that emphasizes governance in
addition to, in combination with, or often instead of government.2 Governance embraces
other social actors in decision-making and policy-implementing practices. Governance
3
I N T R O D U C T I O N
highlights processes and outcomes instead of putting trust solely in institutional struc-
tures empowered to govern. By the same token, some balance between institutions and
process-driven thinking is important to maintain. In this part of the world, the fear
of bureaucratic and power-driven governance is prevalent and justified. But this fear
should not make one blind to the value of democratically empowered institutions; that
is, structures that are not like drawings in the sand. Ultimately, the ‘Indicators’ project
investigates the potentials of local democratic governance in CEE as characterized by
institutions as well as by actors, processes, and outcomes that go beyond the realms of
local governments.
Despite the differences in the pace and scope of systemic changes, all countries in
our inquiry are influenced by the dominant paradigm of decentralization.3 Decentrali-
zation has been accepted as an unavoidable direction of reforms, yet the connotations
and policy impacts of the concept differ. In addition to the devolution of power, the
meanings of the term embrace democratization, reform of the policymaking process,
and administrative and public finance reform. Sometimes decentralization represents
a deliberate shift to enhance subnational layers of power and administration; in other
instances it is a consequence of the shrinking or weakening state. As the most common
trend in the region, decentralization signifies the growing importance of local govern-
ments as they obtain larger mandates but not necessarily adequate financial resources and
democratic incentives. Decentralization undoubtedly creates possibilities for enhancing
local democracy, but this is far from being a self-evident, causal relation.
Decentralization distinctively alters relations between levels of government. The
‘Indicators’ project intends to address some of the issues of intergovernmental relations,
but strictly from the perspective of the local level and not delving into the complexity
of mid-tier levels of government. The project does cast light on how local democratic
governance creates and relies on distinctive interfaces between national and subnational
forces in a democracy. Most notably, local governance embraces political parties, is
dependent on national civil service regulations, and is influenced by media property
structures and general NGO regulations. Our inquiry intends to study the subtleties of
these interfaces without subscribing deterministic or dependency theorems.
It is often noted that even more developed government structures in the region are
embedded in the frailty of political institutions, slowly-moving public administration
reform, haphazard or frozen territorial restructuring, debated civil service reform, not
to speak of battles over election reform and party systems. Nonetheless, there has been
a general belief in a wide democratization process that reaches all corners of the post-
socialist world as well as other places in the post-cold-war international context. In
the new millennium, this belief started to fade with the rise of populism in the CEE
countries; the tensions that European integration have generated in the former ‘socialist
block’; the uneven potentials for democratic change in the postwar western Balkans;
the anti-democratic arrangements of consolidated presidential power in Russia; and,
4
F A C E S O F L O C A L D E M O C R A C Y
the clearly authoritarian trend in many Central Asian countries, just to name a few
experiences. The export of democracy has become more difficult due to the growing
discontent with the workings of international development organizations and the highly
controversial profile of the only superpower in the world.4 In the shadow of these larger
concerns, the perplexities of newly established local government systems in CEE have
also started to reveal themselves.
The belief that power practices within and for smaller communities must be more
democratic than those on the societal level (since they are closer to the public eye)
has become challenged. Simplified accounts of local democracy-building have been
undermined by instances of local power elites with great autonomy to privatize public
assets being caught in improper deals, paralyzing in-fights in elected bodies, and lack
of transparency in decision-making justified by democratic elections. Careful studies
must examine the extent to which structural causes allow the misuse or abuse of power,
in contrast to simply pointing fingers at leaders with character faults. We believe that
the ‘Indicators’ project will contribute to these studies and will create incentives to go
further in democracy-building, rather than allowing it to slow down due to discontent
or disappointments accumulated over a decade and a half.
2. CONCEPTUAL FRAMEWORK, DATA AND OUTCOMES
Democracy is a contested term. The ‘Indicators’ project draws on Beetham’s concep-
tualization of democracy, nowadays one of the most frequently used frameworks in
democracy evaluations.5 Beetham argues that democracy implies decision-making about
collectively binding rules and policies. A decision-making process is democratic to the
degree that it is “subject to the control of all members of the collectivity considered
as equals.”6 Therefore, the two key principles of democracy are popular control over
decision-making (or at least decision-makers) and political equality. For the purpose of
evaluation, democratic audits break down these two principles into four criteria.
a) A guaranteed framework of equal rights. This includes access to justice and the rule
of law, the basic civil and political rights. Citizens’ rights and their enforcement
also provide limitations on government.
b) Institutions of representative government. Free and fair elections are a basic in-
strument of democracy to promote popular control. Elections are democratic
if they are meaningful, inclusive, fair, and uninfluenced by government power.
The idea of meaningful and fair elections also includes competition amongst
political forces, which have equal access to communication.
c) Institutions of open and accountable government. A democratic government is
transparent, and politically, legally, and financially accountable to other bodies.
The power of democratic government is limited by other formal institutions.
5
I N T R O D U C T I O N
d) A civil or democratic society. Independent associations have the potential to en-
courage government responsiveness to public opinion and to increase equality
among citizens. An organized society with a democratic political culture is a
powerful instrument of democracy.
These four dimensions can be also adapted as a monitoring framework for local
democracy. Nevertheless, they are not of equal importance in the analysis of local
democracy in Central and Eastern Europe, and they must be adapted to the specific
properties of local government systems. The ‘Indicators’ project devotes more attention
to mapping the contribution of civil society to local democracy than, for example, to
analyzing the problem of civil rights, which are better researched by other initiatives
and show less variance in CEE.
The assessment of local democracy requires two additional dimensions. The first
comes from the local nature of the subject of analysis. A distinctive feature of local gov-
ernments is their autonomy, i.e., their freedom from the direct involvement of external
forces. If local administrative units have no legal, political, and financial autonomy, the
term ‘local (self-) government’ loses its meaning. The degree of autonomy is a crucial
element in the assessment of local democracy. Swedish audits of democracy point to
the relevance of a second criterion in addition to the above. As the history of regime
collapse in the 1930s demonstrates, a viable democracy requires a certain level of effec-
tiveness. Consequently, policy performance is a crucial dimension of a local democracy
assessment. In sum, local democracy is conceptualized as a local government that is
autonomous, effective, open, and representative, surrounded by a civil society in the
framework of guaranteed political rights.
The ‘Indicators’ project collects two types of quantitative survey data: (1) data on
the major actors in local democratic governance (2) comprehensive, longitudinal and
cross-national data on local democratic governance. The Local Government Survey (LGS)
collects comprehensive data on local governance such as objective information about
the activities of local governments (especially concerning inclusive decision-making)
and their social and political environment (parties, NGOs, and local media). In 2001
administrative leaders of (in total) 2024, municipalities in Latvia, Poland, Hungary, and
Romania were interviewed in the framework of LGS. The questionnaire was updated
in 2002. The T–RC and its local partners completed a second round of data collection
in all the municipalities in Estonia, Bulgaria, and Slovakia in 2003–2004.
The data on local politicians is derived from the Local Representative Survey (LRS),
which focuses on the activities, values, opinions, and demography of local councilors.
In 2001 a pilot was conducted in Hungary to test both the questionnaire and the mail
survey method. The mail surveys of LRS were conducted in Estonia, Poland, Slovakia,
Hungary, and Bulgaria in 2002–2004. The currently available multi-country database
includes the responses of approximately 5,000 local councilors and mayors from within
the surveyed countries.7
6
F A C E S O F L O C A L D E M O C R A C Y
The initiative has resulted in two sets of country reports on the state of local demo-
cratic governance in seven countries. The first volume, published in 2002, portrays
Hungary, Latvia, Romania, and Poland.8 The second volume, describing Bulgaria,
Estonia, and Slovakia, will come out in 2005. Following this conceptual framework,
the structure of the country reports is organized around six pillars or dimensions of
local democratic governance. As those are not equally important in the political reality
of Central and Eastern Europe, two dimensions (representation and civil society) are
given more attention. The first part of the country reports covers four components of
local democracy (autonomy, effectiveness, rights and the rule of law, and transparency
and accountability). The conciseness of this discussion is explained by the availability
of other publications (e.g., decentralization and effectiveness are covered by other LGI
initiatives and publications) and the focus of the original data gathered by the surveys
of the project. The second part of the country reports highlights issues of representa-
tion (local elections and referenda, local parties and factions, local representatives, and
responsiveness), and the third part addresses civil society components (local media, local
civil society organizations, and citizens’ political culture). Country report writers used
not only the actual survey data of the ‘Indicators’ project, but available statistical data
and information derived from secondary analysis as well.
3. COMPARATIVE INQUIRIES
The conceptual framework and the survey data generated by the ‘Indicators’ initiative
inspired LGI and T–RC to commission comparative analyses on various distinctive pil-
lars or dimensions of local democratic governance. Comparative inquiries were invited
to explain country-specific correlations between different variables of the research and
to explore variances across the region. An open call for proposals was announced, to
which numerous applicants responded, and the selected authors completed their analyses
independently in 2003–2004. Authors were to embrace at least three countries from
the pool and to use survey data in correspondence with their thematic choice and ini-
tial hypotheses. The topical and geographical interest of the proposed analyses turned
out to be naturally diverse without any intervention. The current volume presents the
seven best studies prepared in the framework of the first comparative analytical phase
of the ‘Indicators’ project.
In chapter 1, Pawel Swianiewicz and Adam Mielczarek explore the roles of political
parties in forming local democracies through observation of a complex set of variables.
Their analysis partially proves the hypothesis that the role of political parties in local
politics has gradually increased over the last twelve years. This increase has been faster
in countries with more consolidated territorial systems (Poland, Bulgaria rather than
Estonia, Latvia, Hungary, and Slovakia). The size of the local government appears as a
7
I N T R O D U C T I O N
very powerful variable explaining the importance of parties in local politics. The role
of parties is more significant in countries with proportional electoral systems than in
countries with one-ward, majority local council elections. The analysis of survey data
shows that popular beliefs of both politicians and experts overestimate the impact of the
mayors’ nomination method on the role of parties in local politics. Political fragmen-
tation and the volatility of local councils is significant in the countries observed, and
may weaken the management capabilities of local governments. The party orientation
(sympathy and membership) of local councilors and mayors is only loosely correlated
with their political culture and policy preferences. Finally, the examination of the ideo-
logical landscape of local party factions upholds left-right cleavages, with variations in
the meanings of left and right across countries. The authors suggest that cleavages are
much more coherent than one might expect on the basis of popular beliefs concerning
the chaotic character of the political scene in CEE countries, but it is also far from fully
logical and consistent.
In chapter 2, Zsolt Nyíri and Richard Vengroff examine gender differences, par-
ticularly the so-called gender gap among local representatives in five countries: Bulgaria,
Estonia, Hungary, Poland, and Slovakia. The authors assert that women are relatively
well represented in local government in the region. Male and female locally elected
officials in these countries share common educational backgrounds, a sense of opti-
mism regarding their respective municipalities, and belief in democracy as the best
form of government. Although there are gender-related differences in commitment to
core democratic values, these differences are relatively small. Female officials are more
likely to be independent rather than formal members of political parties, indicating
that their political bases and electoral support are built on personal networks as well
as associational groups. This is further reinforced by ideological self-placement, which
shows women generally to the left of their male counterparts and growth in this gap
from generation to generation. The inquiry found that even among members of the
same political party there is a small but persistent difference between male and female
councilors, with women again tending to the left. Even when the analysis controls for
a variety of other factors, such as education, postmaterialism, age, trust in government
institutions, ideology, democratic values, organizational memberships, and country,
gender remains a significant but by no means the strongest predictor of political percep-
tions of the preferred role of government.
In chapter 3, Tania Gosselin illuminates the linkages between local media and the
decisional performance and inclusive policy-making practices of local governments,
respectively, in Hungary, Latvia, Poland, and Romania. The author’s first set of hypoth-
eses articulates that localities endowed with more media outlets, where the ownership
structure is more diverse, where the quality of coverage is higher and where more citizens
consume local media, are expected to display better democratic performance. The mixed
findings are explained by a potential threshold effect: the number of media appears to
8
F A C E S O F L O C A L D E M O C R A C Y
have an effect on performance only above a certain threshold; in turn, once a local media
system’s ownership structure is diverse enough, it may ‘take over’ the positive impact of
the number of local outlets. The analysis also shows that the impact of the media features
identified, notably the positive effect of coverage quality on democratic performance,
is quite robust. The second stage of the analysis explores three potential channels of
media effects on democratic performance. Accordingly, the presence and dynamism of
civil society enhances the impact of media on democratic performance. The number
of NGOs in the locality and citizens’ public interest-oriented activities also enhance
the impact of media features on democratic performance. The chapter concludes that
further research is required to better understand local media, to formulate more precise
hypotheses about their effects, and to interpret findings with greater accuracy.
In chapter 4, Daniel Pop addresses the systematic relationship between municipal-
ity size and citizens’ effectiveness in influencing local matters in Hungary, Poland, and
Romania. The author argues that the state of local democracy in these three countries
seems to be rather weak in terms of system capacity to respond. A common finding for
all three countries is that municipalities are highly dependent on central government
transfers, and therefore there is not much incentive for citizens to participate. The general
trend found for all three country-cases is that the smaller the municipality, the higher
its expenditure rigidity. Larger municipalities are more likely to have higher rates both
of citizen participation and citizens’ effectiveness in influencing local matters. Participa-
tion becomes minimal only in very large units, but the three countries concerned do
not have many of these large units. In conclusion, the success of citizens’ participation
depends on the structure of the municipal system in these countries. By reducing the
share of extremely small municipalities, in which the citizens’ effectiveness is the low-
est, it would be possible to create opportunities to build a more vibrant and dynamic
community life. The editors stress that these findings will be somewhat surprising but
very instructive to those, in particular, who believe unconditionally in the democracy
effects of extreme decentralization.
In chapter 5, Georg Sootla and Kristina Grau seek quantitative evidence for the
existence of different models of local government in different countries, using the examples
of Estonia, Hungary, and Latvia. Even if the main variable accounting for differences
among the countries is the legal frameworks, the authors find considerable variation
among local governments within one country, indicating that rather different patterns
of actual behavior and attitudes do exist in the same legal framework. The analysis un-
covers clear differences between Estonia and Latvia in institutional configurations, the
distribution of authority, and patterns of behavior under different legal contexts in those
two countries. In Estonia the strong role of the executive and in Latvia the strong role of
council is emphasized. Accordingly, consistent committee and cabinet systems produce
internally more homogeneous local governance in comparison with the council-mayor
system. In Hungary such differences are caused not only by political variables but also
9
I N T R O D U C T I O N
by differences in the legal context at elections in both small and large communities. The
authors formulate a question for further analysis: does this flexibility of institutional and
role configurations contribute to the effectiveness of local democracy?
In chapter 6, Philip Franek examines the links between the concept of delegates
and trustees, classifying local councilors and their declared representation of national
vs. local interests.
The correlation was present in the case of all three countries observed (Bulgaria,
Estonia, and Hungary). The author found that councilors who declared a preference
for solving local problems rather than pursuing national goals voted more often accord-
ing to their own opinion (trustees), gave less special consideration to the party, had no
aspiration for a future political career on the national level, and in the case of Hungary,
did not have professional political training. At the same time, there was no correla-
tion between preference for national vs. local goals and political party membership.
This result suggests that the dividing line between councilors who are oriented to local
or national goals is more related to the concept of delegates or trustees than to party
membership. The data for Bulgaria and Hungary show that party membership has an
influence on the relation between the other variables. The comparative analysis tried to
identify how delegates and trustees differ in terms of civic engagement, embeddedness
in the municipality, professional political training, and plans for the future, but no
significant links were captured.
In chapter 7, Cristina Nicolescu and Amelia Gorcea explore the factors influencing
the approach that local representatives take towards their constituency by comparing
Bulgaria, Estonia, and Poland. Besides considering the notion of social capital, the
analysis relies on other variables, such as value orientations and socialization of coun-
cilors, and some context influences. As for social capital, the tested models have shown
that institutional trust and generalized trust have different explanatory impacts, sup-
porting those scholars who propose to approach the two concepts separately as they are
of different origins. The three country cases show differences in the determinants that
have an impact on the relationship between the representatives and their constituents,
even if the dependent variable shows the prevalence of the same approach of local
representatives towards their constituency in all countries. The Estonian case shows
unexpectedly that an overwhelming majority of local representatives relate to their
constituency horizontally, whereas at the other end, the Polish representatives showed
a highly balanced distribution of behavior. The authors suggest that the combination
of factors that stimulate local representatives to act as citizen-oriented decision-makers
is far from being exhaustively explained by their study.
The selected comparative studies offer some general lessons for scholars, critics,
experts, and advocates of local democratic governance in post-socialist countries.
The editors value, in particular, those findings that reveal the shortcomings of some
mainstream scholarly beliefs. These beliefs often replicate popular accounts when making
10
F A C E S O F L O C A L D E M O C R A C Y
strong statements on the nature of local governance systems (e.g., the role of political
parties, the nature of ideological cleavages, and the impact of electoral systems) with
little evidence or based on simplified analogies with national political systems. The study,
which reveals that citizens’ interest and actual involvement in shaping the decisions of
local governments are lowest in the extremely small municipalities (mainly due to their
lack of financial autonomy which, realistically, will remain the state of affairs in this
region for some time), also undermines some frequently voiced political convictions.
The editors stress that these findings will be somewhat surprising but very instructive
to those, in particular, who believe unconditionally in the ultimate democracy effects
of the maximum degree of decentralization.
The analyses published in this volume powerfully demonstrate that there are some
aspects of local democratic governance that are poorly researched, and the ‘Indicators’
project provides much needed data for their study. The problem of gender and media are
cases in point. Nonetheless, the authors of both the gender and the media topics argue
that a more refined inquiry and more ambitious data generation would be essential to
produce subtle analyses of local governance structures in the region in their respective
problem areas. This commonality stands in spite of the fact that the gender issue has
had a relatively lower profile than the media in recent broader democracy debates.
This volume sends a strong invitation to both researchers affiliated with the ‘Indi-
cators’ project and to any external collaborating parties to identify further measurable
components of local democratic governance. These might explain, for example, the
different role models (delegates and trustees) and leadership styles of local representa-
tives that have a crucial impact on the quality of local democracy and of policymaking
processes. The editors stress that, in addition to finding the missing variables of political
culture, the ‘Indicators’ inquiry should also contemplate developing case studies in the
countries already researched, that portray the subtleties of interplay between different
variables of the quantitative analysis.
Finally, through the work of the authors in this volume we are shown not only the
achievements of the ‘Indicators’ project, but also its lacunae. Topics of autonomy in
the context of intergovernmental relations, the significance of transparency, mainstream
and experimental forms of inclusive policymaking, and the correlation of democracy
performance and policy effectiveness should be addressed in all areas where the project
is generating knowledge: data gathering, analyses, and advocacy as well.
11
I N T R O D U C T I O N
4. BEYOND RESEARCH
Democracy-monitoring projects could and should have an impact beyond the wider
research community. The ‘Indicators’ project has concentrated so far on gathering and
anlyzing data indispensable for evaluating the performance of local democracies. In
the next phase of the project, the sponsoring and implementing institutions will mo-
bilize interest on the part of various national and subnational actors who have some
leverage to inspire the prime actors in local governance to reflect critically upon their
practices. Along with other potential instruments, the survey data could also be used to
rank the performance of local democracy within particular countries, thus stimulating
some healthy competition among cities/municipalities. The monitoring methodology
could, for example, be adopted as a collective exercise to be used by associations of local
municipalities within a particular country. Individual municipal governments seeking
accessible and affordable self-evaluation methods could also apply the methodology for
their own purposes. National governments could rely on it as a measure of the outcomes
of major political and policy reform initiatives. International organizations could add
their governance assessment outcomes to the results of the ‘Indicators’ project, to produce
more comprehensive data. Finally, regular reports on the status of local democracy in any
post-socialist country should be seen as a serious effort to shed light on the fundamental
issues of social and political transformation.
NOTES
1 See Mouritzen, E. and J. Svara (2002). Leadership at the Apex. Pittsburgh: University of Pittsburgh
Press; Page, E. and M. Goldsmith (1987). Central and Local Government Relations. Beverly Hills, CA:
Sage; John Peter (2001). Local Governance in Western Europe. London: Sage; Hesse, J.J. and L.J. Sharpe
(1991). Conclusions. In: J.J. Hesse (ed.). Local Government and Urban Affairs in an International
Perspective. Baden-Baden.
2 See a comprehensive analysis of the paradigm shift in: Pierre, Jon, and B. Guy Peters (2000). Govern-
ance, Politics, and the State. London: MacMillan Press.
3 Horváth, Tamás M. (ed.) (2000). Decentralization: Experiments and Reforms. Vol. 1 of the Local
Governments in Central and Eastern Europe. LGI Books. Budapest: Local Government and Public
Service Reform Initiative, Open Society Institute–Budapest.
4 Carothers, Tom (2004). Critical Mission. Essays on Democracy Promotion. Washington: Carnegie
Endowment for International Peace. See in particular Section 4.
5 The most important democratic audit projects:
The UK Democratic Audit (http://www.fhit.org/democratic_audit/index.html), International IDEA’s
program on the “State of Democracy”(http://www.idea.int/ideas_work/14_political_state.htm), The
SNS Democratic Audit of Sweden (http://www.const.sns.se/dr/english/), The Canada Democratic Audit
12
F A C E S O F L O C A L D E M O C R A C Y
(http://www.mta.ca/faculty/arts/canadian_studies/audit.htm), The Democratic Audit of the Institutions
of European Integration (http://www.one-europe.ac.uk/cgi-bin/esrc/world/db.cgi/proj.htm?id=29),
The Democratic Audit of Australia (http://democratic.audit.anu.edu.au/)
6 David Beetham (ed.) (1994). Key Principles and Indices for a Democratic Audit. In: Defining and
Measuring Democracy. London: SAGE. p. 28.
7 Survey instruments as well as the anonymous aggregate data of surveys can be viewed electronically at
the website of the Tocqueville Research Center (http://www.t-rc.org). Individual data can be obtained
in SPSS format from T–RC, with the permission of LGI.
8 Gábor Soós, Gábor Toka, and Glen Wright (2002). The State of Local Democracy in Central
Europe. Budapest: Local Government and Public Service Reform Initiative, Open Society Institute–
Budapest.
13
Parties and Political Culture in Central
and Eastern European Local Governments
Paweł Swianiewicz, Adam Mielczarek
ABSTRACT
This chapter discusses issues related to the presence and significance of parties in
the local politics of seven countries of Central and Eastern Europe. First, we look at
how many councilors and mayors belong to parties or use party support in election
campaigns, and then we consider the relative importance of party politics in the local
decision-making process. As there is a great variation among the seven countries on
this issue, we have tested the variation against some possible institutional factors: the
nature of the electoral system (proportional or majoritarian), the position and method
of appointment of mayors (strong mayoralty versus collective leadership), and the type
of territorial organization (fragmented or consolidated systems). Our analysis confirms
that territorial organization and electoral systems have a significant impact, but fails
to find convincing evidence on the impact of the mayor’s position. We also examine
political fragmentation of local councils and find that it is usually significantly higher
than in Western European countries.
Another factor germane to our topic is the political culture of individual parties and
its possible influence on the views of the local councilors. Our approach was to check
the views of councilor-members of different parties on certain topics: their self-location
on the left-right political scale, market individualism, social individualism, egalitarian-
ism, elitism (paternalism), and their acceptance of the general direction of political
transformation. We conclude that the most vital cleavage still seems to be the division
between post-communists and groups rooted in the former democratic opposition. But
the parties themselves are not homogeneous—councilors from the same party differ
significantly in their views related to political culture, and this variation is not much
lower than it is among all the councilors from various parties.
15
Parties and Political Culture in Central
and Eastern European Local Governments
Paweł Swianiewicz, Adam Mielczarek
1. INTRODUCTION
The role of party politics in local governments in Central and Eastern Europe has not
yet received the attention it deserves. An unspoken and rather naive assumption persists
that party politics on a local level is not (and should not be) important. Facts and events
that obviously contradict this assumption are treated as embarrassing distortions rather
than as a natural part of the fabric of local politics.
But in classical theories of representative democracy, political parties are treated as an
essential aspect of pluralist societies (Dahl and Tufte 1973; Dahl 1961). In his compara-
tive study of urban community power structures, Clark (1967) suggests that having a
strong system of political parties increases the chances for pluralist, as opposed to elitist,
local decision-making. And party politics is increasingly being seen as important at the
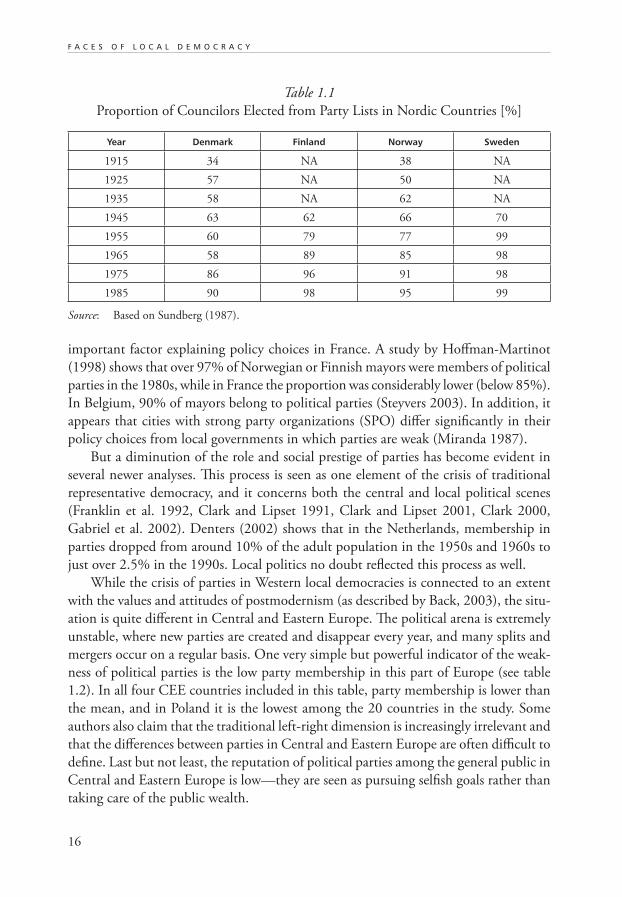
local government level in various countries. Sundberg (1987) noted the politicization
of municipal elections in Nordic countries, where the role of political parties in the
nomination of local councilors increased consistently over time. His study shows that
between the 1930s and 1990s the proportion of councilors in parties increased from
less than half to over 90% (see table 1.1).
Another example of highly politicized local government is found in the UK, where
several studies have confirmed the role of parties in making policy choices. Perhaps the
most comprehensive was a study of Sharpe and Newton (1984), who argued that party
color had an increasing importance on spending patterns during the 1960s and 1970s.
They came to the conclusion that parties “are not mere transmission belts of majority
interests or needs, but they have views of their own as to what policies they wish to pursue,
and they only modify these views if forced to do so because they have a close competitor”
(p. 202). Several other studies have confirmed these observations (e.g., Barnett et al.
1990, Page et al. 1990, Hoggart 1984, Hoggart and Shrives 1991).
The role of parties in local government has been somewhat weaker in southern
Europe, although Balme (1989), for example, shows that political color has been an
16
F A C E S O F L O C A L D E M O C R A C Y
important factor explaining policy choices in France. A study by Hoffman-Martinot
(1998) shows that over 97% of Norwegian or Finnish mayors were members of political
parties in the 1980s, while in France the proportion was considerably lower (below 85%).
In Belgium, 90% of mayors belong to political parties (Steyvers 2003). In addition, it
appears that cities with strong party organizations (SPO) differ significantly in their
policy choices from local governments in which parties are weak (Miranda 1987).
But a diminution of the role and social prestige of parties has become evident in
several newer analyses. This process is seen as one element of the crisis of traditional
representative democracy, and it concerns both the central and local political scenes
(Franklin et al. 1992, Clark and Lipset 1991, Clark and Lipset 2001, Clark 2000,
Gabriel et al. 2002). Denters (2002) shows that in the Netherlands, membership in
parties dropped from around 10% of the adult population in the 1950s and 1960s to
just over 2.5% in the 1990s. Local politics no doubt reflected this process as well.
While the crisis of parties in Western local democracies is connected to an extent
with the values and attitudes of postmodernism (as described by Back, 2003), the situ-
ation is quite different in Central and Eastern Europe. The political arena is extremely
unstable, where new parties are created and disappear every year, and many splits and
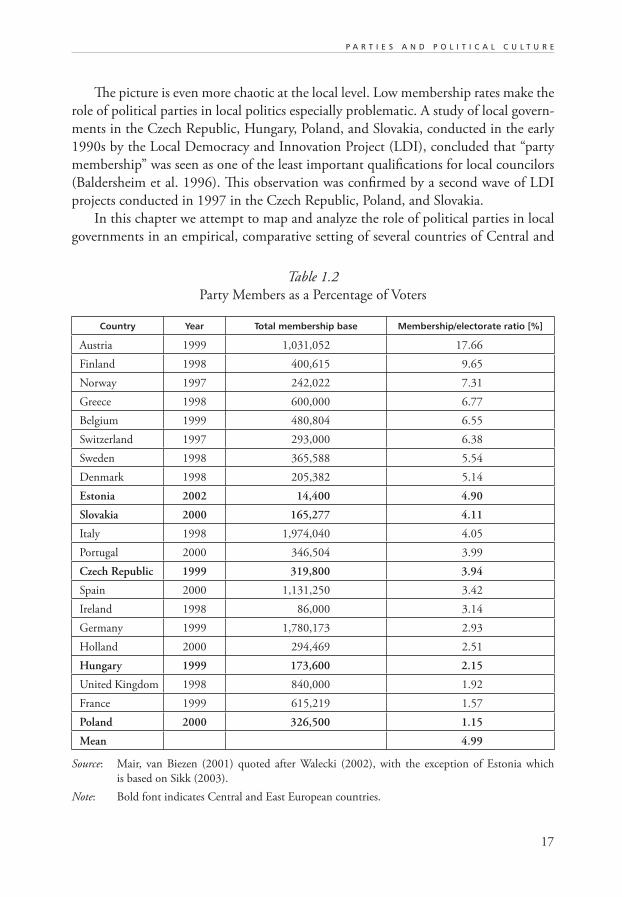
mergers occur on a regular basis. One very simple but powerful indicator of the weak-
ness of political parties is the low party membership in this part of Europe (see table
1.2). In all four CEE countries included in this table, party membership is lower than
the mean, and in Poland it is the lowest among the 20 countries in the study. Some
authors also claim that the traditional left-right dimension is increasingly irrelevant and
that the differences between parties in Central and Eastern Europe are often difficult to
define. Last but not least, the reputation of political parties among the general public in
Central and Eastern Europe is low—they are seen as pursuing selfish goals rather than
taking care of the public wealth.
Table 1.1
Proportion of Councilors Elected from Party Lists in Nordic Countries [%]
Year Denmark Finland Norway Sweden
1915 34 NA 38 NA
1925 57 NA 50 NA
1935 58 NA 62 NA
1945 63 62 66 70
1955 60 79 77 99
1965 58 89 85 98
1975 86 96 91 98
1985 90 98 95 99
Source: Based on Sundberg (1987).
17
P A R T I E S A N D P O L I T I C A L C U L T U R E
The picture is even more chaotic at the local level. Low membership rates make the
role of political parties in local politics especially problematic. A study of local govern-
ments in the Czech Republic, Hungary, Poland, and Slovakia, conducted in the early
1990s by the Local Democracy and Innovation Project (LDI), concluded that “party
membership” was seen as one of the least important qualifications for local councilors
(Baldersheim et al. 1996). This observation was confirmed by a second wave of LDI
projects conducted in 1997 in the Czech Republic, Poland, and Slovakia.
In this chapter we attempt to map and analyze the role of political parties in local
governments in an empirical, comparative setting of several countries of Central and
Table 1.2
Party Members as a Percentage of Voters
Country Year Total membership base Membership/electorate ratio [%]
Austria 1999 1,031,052 17.66
Finland 1998 400,615 9.65
Norway 1997 242,022 7.31
Greece 1998 600,000 6.77
Belgium 1999 480,804 6.55
Switzerland 1997 293,000 6.38
Sweden 1998 365,588 5.54
Denmark 1998 205,382 5.14
Estonia 2002 14,400 4.90
Slovakia 2000 165,277 4.11
Italy 1998 1,974,040 4.05
Portugal 2000 346,504 3.99
Czech Republic 1999 319,800 3.94
Spain 2000 1,131,250 3.42
Ireland 1998 86,000 3.14
Germany 1999 1,780,173 2.93
Holland 2000 294,469 2.51
Hungary 1999 173,600 2.15
United Kingdom 1998 840,000 1.92
France 1999 615,219 1.57
Poland 2000 326,500 1.15
Mean 4.99
Source: Mair, van Biezen (2001) quoted after Walecki (2002), with the exception of Estonia which
is based on Sikk (2003).
Note: Bold font indicates Central and East European countries.
18
F A C E S O F L O C A L D E M O C R A C Y
Eastern Europe. The first part of the analysis focuses on the changing role of political
parties in Central and East European local governments, as well as the differences both
between and within individual countries. The second part looks at differences in the
political cultures of parties present in local governments, as measured by the values and
opinions declared by the local politicians who are members of these parties.
1.1 Approaching the Topic: Research Questions
The very wide range of questions asked in our research prohibits discussion of every
single issue in depth. But rather than limit the scope of the analysis, we decided to
take a broad approach. Since this topic has never been the subject of a comprehensive
analysis, we feel it is more valuable to explore wide-ranging aspects of it, even if (due to
space and data limitations) some of our conclusions must be regarded as temporary and
needing confirmation through more detailed analysis in the future. Four basic research
questions, discussed below, provided the direction for our study.
1.1.1 What Is the Role of Political Parties in Local Politics?
In looking at this issue we want to discover, first, if parties are present (i.e., do they have
their councilors and mayors) and second, how influential they are (i.e., do they play a
role in local decision-making).
The second question is asked in several ways. First, we use the “reputational” method
derived from Hunter’s classic community power study (1953) to determine whether
political parties are seen as important actors in local politics. Second, we ask councilors
and mayors to what extent they consider the opinion of their party committees when
they make important decisions. Third, we ask how important the parties are to councilors
and mayors as a source of information on local policy issues.
As mentioned earlier, party membership is at a low level in Central and Eastern
Europe. We also know that parties are rather disliked by the general public and that the
dominant ideology of local government reform has been anti-partisan. A typical slogan
used by many reformers but also by local leaders is that “a hole in the bridge is not a
political issue.” This supposes that the issues local governments deal with are politically
neutral or “objective” and do not leave much space for partisan or ideological debate.
The slogan itself is highly controversial. One could argue that while a “hole” may not
be political, the question of who should fix it, or how, can be easily connected to ideo-
logical value choices. Based on the results of a 1991 LDI project survey, Baldersheim
et al. (1996) has noted that “not being a member of a political party” was among the
most desirable characteristics of an “ideal local councilor.” A 1997 LDI survey showed
19
P A R T I E S A N D P O L I T I C A L C U L T U R E
quite similar results. However, new parties are gradually establishing their place in the
political system, and local government is an important field for their activity.
These observations lead us to hypothesize that:
• The role of political parties in local politics is not very important (e.g., the mem-
bership rate among mayors and councilors is significantly lower than in countries
of the European Union), but has been gradually increasing during the last twelve
years.
1.1.2 What Is the Variation in the Role of Political Parties
in Different Municipalities?
The essence of local democracy is variation. What is true and important in one town
can be irrelevant in another, and the same applies to the role of political parties. One
can expect that the shape of local politics varies from one country to another, but also
from one municipality to another within one country. The variation may be accounted
for by a number of factors, loosely grouped as:
(i) country-specific factors, such as political culture, and
(ii) the institutional features of the local government system.
We have focussed on the latter group, and particularly on the factors mentioned at
the beginning of this section.
Parties, like other organized groups, are usually more numerous and more active in
larger communities (Dahl and Tufte 1973, Clark 1967). Also, as noted in the introduc-
tory section, political parties are usually more significant in the territorially consolidated
countries of northern Europe than in southern Europe which is more geographically
fragmented. It is perhaps not a coincidence that the rapid increase in the level of party
membership of councilors in Nordic countries (see table 1.1) occurred at the same time
as the territorial amalgamation reforms.
These observations have led to our next two hypotheses:
• The increase in the role of parties in local politics is faster in countries with more
consolidated territorial systems (Poland, and Bulgaria rather than Estonia, Latvia,
Hungary, and Slovakia).
• The increase is also faster in big cities (in which party organizations often play a
decisive role in local politics) than in small communities (where parties are often still
nonexistent and most councilors as well as mayors are elected as independents).
Proportional representation forces the candidates to be organized in larger electoral
lists, and such a system requires that the groups have recognizable labels that voters can
vote for. For this reason our fourth hypothesis expects that:
20
F A C E S O F L O C A L D E M O C R A C Y
• The role of parties is bigger in countries with proportional electoral systems than in
countries with one-ward, majority local council elections.
Comparative studies of the local government systems of CEE countries (Horváth
2000, Kandeva 2001) indicate that most of the analyzed countries belong to the first
group (Bulgaria, Estonia, Latvia, Romania), while Slovakia represents the majority sys-
tem (although elections are organized in multi-councilor wards). Hungary and Poland
are more complicated, as election is based on the majority principle in municipalities
with a population below 10,000 in Hungary and below 20,000 in Poland. The larger
Polish local governments have a proportional system, while in the larger cities of Hun-
gary the system is more complex and could be classified as mixed. This may strengthen
the difference between small and large units, as we suggested earlier. However, the
experience of EU countries suggests that a high intensity of partisan politics in local
governments may also coincide with majoritarian electoral systems (e.g., local govern-
ments in the UK).
The position of mayor is another important factor. There is a clear distinction
between countries where the council elects the mayor (Estonia and Latvia) and those
where a popular election by the general public occurs (all remaining countries). Poland
is a particularly interesting case, as the system was changed in 2002, and an open goal
of the electoral reform was to limit party influence on local governance. In the UK,
the introduction of direct election of mayors resulted in non-partisan mayors in half
of the communities that adopted this institutional arrangement (Elcock and Fenwick
2003). Mayor Ken Livingstone in London is perhaps the best known example of this
phenomenon.
However, empirical data from OECD countries are inconsistent on this question.
Mouritzen and Svara (2002, 176, 184–190) note that in “strong-mayor” systems (parts
of the USA, France, Italy, and Portugal), the role of local politician as a spokesperson
for a party is usually perceived as much less important than it is in “committee-leader”
or “collective-leader” systems1 (Sweden, Denmark, the UK, and the Netherlands).
Countries with “council-manager” systems (parts of the USA, Finland, and Norway) are
much more diversified, but on average they are closer to weak than strong with respect
to the role of the spokesperson for a party. Although this observation is made on the
basis of Chief Executive Officers’ (CEOs) opinions on the characteristics of an “ideal
politician,” Mouritzen and Svara note that “the attitudes of CEOs do not determine
the behaviour of elected officials, but they presumably contribute to the definition of
norms of appropriate behavior that elected officials seek to meet” (185). On the other
hand, Mouritzen and Svara discovered in the same research that in CEOs’ perceptions
of the actual roles performed by mayors, partisan leadership was the most frequent in
the committee-leader form, followed by the strong-mayor system, while it was weakest
in countries with council-manager and collective forms of government (69–71). (It
21
P A R T I E S A N D P O L I T I C A L C U L T U R E
is interesting that the council-manager form is perceived as the least partisan in both
instances.)
Of all the CEE countries analyzed, Estonia, Latvia, and Poland before the 2002
reform have the closest to a collective form of leadership (although in many respects the
situation in Poland before 2002 was similar to the committee-leader form). Hungary,
where the council plays a strong role and where most executive functions are performed
by the CEO, is not far from the council-manager form, although the direct election of
the mayor and a more than ceremonial role for him or her is a deviation from the ideal
model. The situation in Bulgaria, Poland (after 2002), Slovakia, or Romania is more
difficult to classify. It is definitely close to the strong-mayor system, but a frequent lack
of control of the majority of the council is an important difference from the description
provided by Mouritzen and Svara. The same applies to limitations on the hiring or firing
of key persons in the administration, which are not too severe in Slovakia or Romania,
but considerably limit the power of mayors in Poland (where approval is needed for the
nomination of the city treasurer or city secretary) or in Bulgaria (where council appoints
deputy mayors). Perhaps this form could be called “strong-mayor with a strong control
by the council,” which is closer to “sharing leadership”—to use the label of Getimis
and Grigoriadou (2003).
Disregarding the conflicting conclusions which may be drawn from the Mouritzen
and Svara study, and considering instead the frequently stated goals of executive power
reforms in CEE local governments, a fifth hypothesis emerges:
• The role of parties in local politics is larger in countries with collective forms of
leadership (Latvia, Estonia, Poland before 2002) than in countries closer to the
strong-mayor system (Slovakia, Bulgaria, Romania, Poland after 2002), and even
larger in Hungary where the system is closest to the council-manager form.
1.1.3 How Fragmented and Volatile Is the Local Political Scene?
The political environment is an important condition shaping the capacity of local gov-
ernments to act effectively. We can expect that a very fragmented local council as well
as frequently changing governing coalitions will make implementation of long-term
policies extremely difficult. Mouritzen and Svara (2002) cite data according to which
chief administrators see conflicts between political parties as one of the significant factors
having a negative effect on their performance. Although party fragmentation is not the
only factor influencing the intensity of conflicts between countries (e.g., the absence
or presence of a consensual style of politics is also important), there is no doubt that
conflicts within highly consolidated councils are less likely to occur. Our earlier study
suggests that political fragmentation in local governments in Polish cities is much larger
than in the cities of Western Europe (see Swianiewicz and Klimska 2003, as well as
22
F A C E S O F L O C A L D E M O C R A C Y
Gabriel et al. 2002). We expect that the same may be true in other countries of Central
and Eastern Europe, so our next hypothesis states that:
• Political fragmentation and volatility of local councils is significant (more than is
typical in West European cities) and may be potentially dangerous for the manage-
ment capabilities of local governments.
Another factor that may potentially influence the capacity to implement coherent
long-term policies is the volatility of political parties in local elections. We expect that
this is quite high in Central and Eastern Europe. This expectation is based on the general
observation that rapid changes occur in the political arena of the analyzed countries.2 This
high political volatility is well documented in Polish local governments (see Swianiewicz
and Klimska 2003 for comparison of 1998 and 2002 local election results), but unfor-
tunately our data do not permit extending this analysis to other countries as well.
1.1.4 Do Different Parties Represent Distinct
and Coherent Political Cultures?
Are local parties significantly different from each other? Do local councilors who are
members of or declare support for different parties have distinct values and different
policy preferences? What are the typical features of the political culture of supporters
and members of various parties?
Earlier attempts to answer these questions have not produced a very clear picture.
An analysis of the variation of political cultures of the supporters of different parties in
the Czech Republic, Hungary, Poland, and Slovakia, based on a 1991 survey, was rather
inconclusive (Swianiewicz and Clark 1996). However, a few years later, an analysis of a
Polish local government election in 1994 gave an unexpectedly coherent picture of the
variation between local party members (Swianiewicz 1996).
In our analysis we distinguish between several dimensions of political culture:3
• the left-right self-location of local politicians;
• market individualism;
• social individualism;
• egalitarianism; and
• elitism (paternalism).
In addition to this set of general values local leaders believe in, we take into account
three dimensions that are particularly important in Central and Eastern Europe at the
present time:
23
P A R T I E S A N D P O L I T I C A L C U L T U R E
• the level of “acceptance for general system changes” after 1990 (measured by ac-
ceptance of a democratic system and integration with the European Union);
• “communist roots/path dependency” of party members; and
• modernism (measured by education level and Internet use).
The general picture of the political arena in the analyzed countries is often somewhat
chaotic. Frequent changes of party maps, unexpected changes in governing coalitions,
and unclear ideological differences between the main political opponents on important
policy issues are all typical elements of the picture in Central and Eastern Europe. These
observations lead us to a further hypothesis that:
• The party orientation (sympathy, membership) of local councilors and mayors is only
loosely correlated with their political culture and policy preferences. Nevertheless,
parties differ from each other and our report will attempt to map these differences.
Also, we propose that:
• There is not a clear international pattern of differences between parties. Parties
that use similar labels (such as liberal, social-democrat, and in particular left- and
right-wing) in different countries are not necessarily similar to each other.
1.2 Sources of Data
The Indicators of Local Democratic Governance Project (ILDGP) survey, conducted
in 2000–2003, has provided the most important source of data. The ILDGP project
included an extensive survey of councilors and mayors (Local Representatives Survey—
LRS), and another of chief executive officers, from which we derive information on the
political composition of local councils as well as the political position of mayors.
Some supplementary, comparative data have also been drawn from surveys in 1991
and 1997 that were part of the Local Democracy and Innovation project (LDI).4
Most of the analysis is based on a survey of councilors and mayors conducted dur-
ing 2002 and 2003 in five countries: Bulgaria, Estonia, Hungary, Poland, and Slovakia.
A survey of chief administrative officers conducted in 2000 and 2001 within the same
project has made it possible to extend our data in some cases to Latvia and Romania.
Historical analyses based on LDI surveys are limited to Hungary, Poland, and Slovakia.
Table 1.3 illustrates the sources of data and the sample size in individual surveys.
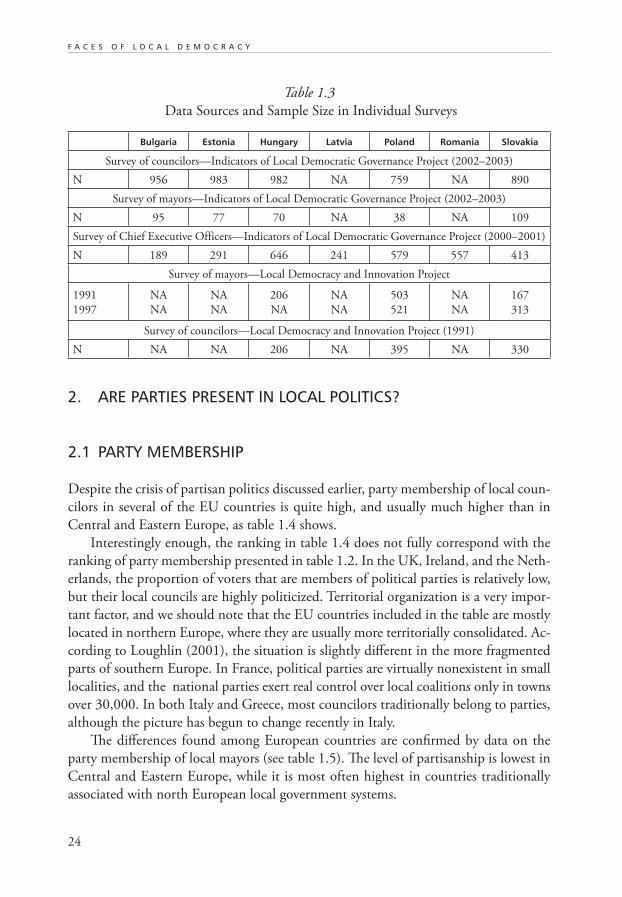
24
F A C E S O F L O C A L D E M O C R A C Y
2. ARE PARTIES PRESENT IN LOCAL POLITICS?
2.1 PARTY MEMBERSHIP
Despite the crisis of partisan politics discussed earlier, party membership of local coun-
cilors in several of the EU countries is quite high, and usually much higher than in
Central and Eastern Europe, as table 1.4 shows.
Interestingly enough, the ranking in table 1.4 does not fully correspond with the
ranking of party membership presented in table 1.2. In the UK, Ireland, and the Neth-
erlands, the proportion of voters that are members of political parties is relatively low,
but their local councils are highly politicized. Territorial organization is a very impor-
tant factor, and we should note that the EU countries included in the table are mostly
located in northern Europe, where they are usually more territorially consolidated. Ac-
cording to Loughlin (2001), the situation is slightly different in the more fragmented
parts of southern Europe. In France, political parties are virtually nonexistent in small
localities, and the national parties exert real control over local coalitions only in towns
over 30,000. In both Italy and Greece, most councilors traditionally belong to parties,
although the picture has begun to change recently in Italy.
The differences found among European countries are confirmed by data on the
party membership of local mayors (see table 1.5). The level of partisanship is lowest in
Central and Eastern Europe, while it is most often highest in countries traditionally
associated with north European local government systems.
Table 1.3
Data Sources and Sample Size in Individual Surveys
Bulgaria Estonia Hungary Latvia Poland Romania Slovakia
Survey of councilors—Indicators of Local Democratic Governance Project (2002–2003)
N 956 983 982 NA 759 NA 890
Survey of mayors—Indicators of Local Democratic Governance Project (2002–2003)
N 95 77 70 NA 38 NA 109
Survey of Chief Executive Officers—Indicators of Local Democratic Governance Project (2000–2001)
N 189 291 646 241 579 557 413
Survey of mayors—Local Democracy and Innovation Project
1991
1997
NA
NA
NA
NA
206
NA
NA
NA
503
521
NA
NA
167
313
Survey of councilors—Local Democracy and Innovation Project (1991)
N NA NA 206 NA 395 NA 330
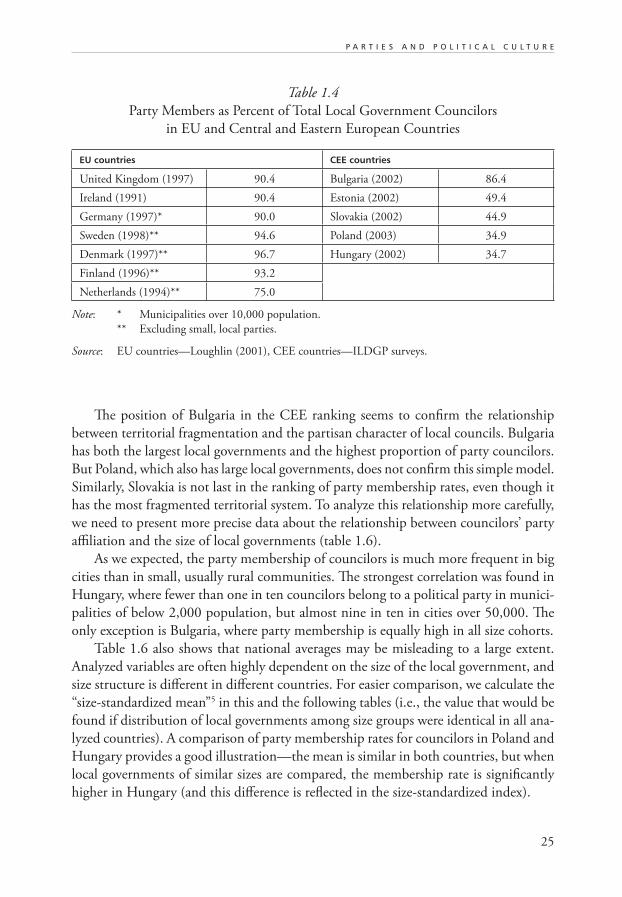
25
P A R T I E S A N D P O L I T I C A L C U L T U R E
The position of Bulgaria in the CEE ranking seems to confirm the relationship
between territorial fragmentation and the partisan character of local councils. Bulgaria
has both the largest local governments and the highest proportion of party councilors.
But Poland, which also has large local governments, does not confirm this simple model.
Similarly, Slovakia is not last in the ranking of party membership rates, even though it
has the most fragmented territorial system. To analyze this relationship more carefully,
we need to present more precise data about the relationship between councilors’ party
affiliation and the size of local governments (table 1.6).
As we expected, the party membership of councilors is much more frequent in big
cities than in small, usually rural communities. The strongest correlation was found in
Hungary, where fewer than one in ten councilors belong to a political party in munici-
palities of below 2,000 population, but almost nine in ten in cities over 50,000. The
only exception is Bulgaria, where party membership is equally high in all size cohorts.
Table 1.6 also shows that national averages may be misleading to a large extent.
Analyzed variables are often highly dependent on the size of the local government, and
size structure is different in different countries. For easier comparison, we calculate the
“size-standardized mean”5 in this and the following tables (i.e., the value that would be
found if distribution of local governments among size groups were identical in all ana-
lyzed countries). A comparison of party membership rates for councilors in Poland and
Hungary provides a good illustration—the mean is similar in both countries, but when
local governments of similar sizes are compared, the membership rate is significantly
higher in Hungary (and this difference is reflected in the size-standardized index).
Table 1.4
Party Members as Percent of Total Local Government Councilors
in EU and Central and Eastern European Countries
EU countries CEE countries
United Kingdom (1997) 90.4 Bulgaria (2002) 86.4
Ireland (1991) 90.4 Estonia (2002) 49.4
Germany (1997)* 90.0 Slovakia (2002) 44.9
Sweden (1998)** 94.6 Poland (2003) 34.9
Denmark (1997)** 96.7 Hungary (2002) 34.7
Finland (1996)** 93.2
Netherlands (1994)** 75.0
Note: * Municipalities over 10,000 population.
** Excluding small, local parties.
Source: EU countries—Loughlin (2001), CEE countries—ILDGP surveys.
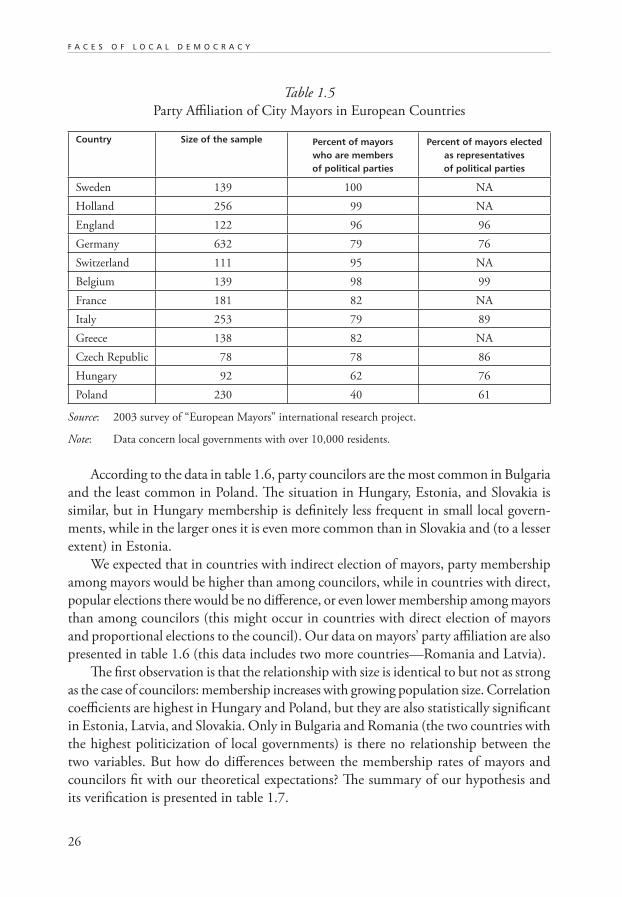
26
F A C E S O F L O C A L D E M O C R A C Y
According to the data in table 1.6, party councilors are the most common in Bulgaria
and the least common in Poland. The situation in Hungary, Estonia, and Slovakia is
similar, but in Hungary membership is definitely less frequent in small local govern-
ments, while in the larger ones it is even more common than in Slovakia and (to a lesser
extent) in Estonia.
We expected that in countries with indirect election of mayors, party membership
among mayors would be higher than among councilors, while in countries with direct,
popular elections there would be no difference, or even lower membership among mayors
than among councilors (this might occur in countries with direct election of mayors
and proportional elections to the council). Our data on mayors’ party affiliation are also
presented in table 1.6 (this data includes two more countries—Romania and Latvia).
The first observation is that the relationship with size is identical to but not as strong
as the case of councilors: membership increases with growing population size. Correlation
coefficients are highest in Hungary and Poland, but they are also statistically significant
in Estonia, Latvia, and Slovakia. Only in Bulgaria and Romania (the two countries with
the highest politicization of local governments) is there no relationship between the
two variables. But how do differences between the membership rates of mayors and
councilors fit with our theoretical expectations? The summary of our hypothesis and
its verification is presented in table 1.7.
Table 1.5
Party Affiliation of City Mayors in European Countries
Country Size of the sample Percent of mayors who are members of political parties
Percent of mayors elected as representatives of political parties
Sweden 139 100 NA
Holland 256 99 NA
England 122 96 96
Germany 632 79 76
Switzerland 111 95 NA
Belgium 139 98 99
France 181 82 NA
Italy 253 79 89
Greece 138 82 NA
Czech Republic 78 78 86
Hungary 92 62 76
Poland 230 40 61
Source: 2003 survey of “European Mayors” international research project.
Note: Data concern local governments with over 10,000 residents.
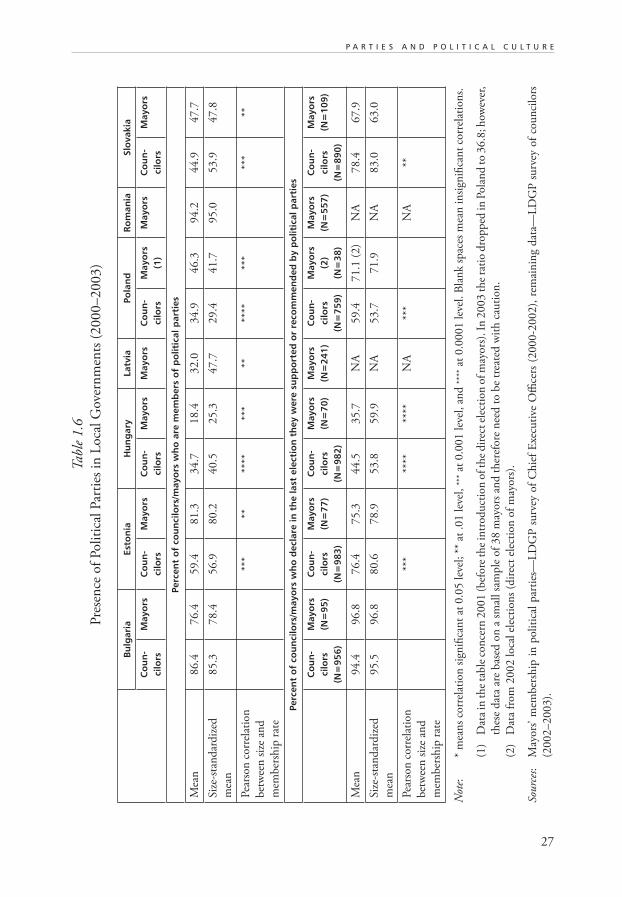
27
P A R T I E S A N D P O L I T I C A L C U L T U R E
Tab
le 1
.6
Pre
sen
ce o
f Poli
tica
l P
arti
es i
n L
oca
l G
over
nm
ents
(2000–2003)
Bu
lgar
iaEs
ton
ia
Hu
ng
ary
Latv
iaPo
lan
dR
om
ania
Slo
vaki
a
Co
un
-ci
lors
May
ors
Co
un
-ci
lors
May
ors
Co
un
-ci
lors
May
ors
May
ors
Co
un
-ci
lors
May
ors
(1)
May
ors
Co
un
-ci
lors
May
ors
Perc
ent
of
cou
nci
lors
/may
ors
wh
o a
re m
emb
ers
of
po
litic
al p
arti
es
Mea
n86.4
76.4
59.4
81.3
34.7
18.4
32.0
34.9
46.3
94.2
44.9
47.7
Siz
e-st
and
ard
ized
mea
n
85.3
78.4
56.9
80.2
40.5
25.3
47.7
29.4
41.7
95.0
53.9
47.8
Pea
rson
corr
elat
ion
bet
wee
n s
ize
and
mem
ber
ship
rat
e
***
****
****
***
****
***
***
**
Perc
ent
of
cou
nci
lors
/may
ors
wh
o d
ecla
re in
th
e la
st e
lect
ion
th
ey w
ere
sup
po
rted
or
reco
mm
end
ed b
y p
olit
ical
par
ties
Co
un
-ci
lors
(N=
95
6)
May
ors
(N=
95
)C
ou
n-
cilo
rs(N
=9
83
)
May
ors
(N=
77
)C
ou
n-
cilo
rs(N
=9
82
)
May
ors
(N=
70
)M
ayo
rs(N
=2
41
)C
ou
n-
cilo
rs(N
=7
59
)
May
ors
(2
)(N
=3
8)
May
ors
(N=
55
7)
Co
un
-ci
lors
(N=
89
0)
May
ors
(N=
10
9)
Mea
n94.4
96.8
76.4
75.3
44.5
35.7
NA
59.4
71.1
(2)
NA
78.4
67.9
Siz
e-st
and
ard
ized
mea
n
95.5
96.8
80.6
78.9
53.8
59.9
NA
53.7
71.9
NA
83.0
63.0
Pea
rson
corr
elat
ion
bet
wee
n s
ize
and
mem
ber
ship
rat
e
***
****
****
NA
***
NA
**
Not
e:
* m
ean
s co
rrel
atio
n s
ign
ifica
nt
at 0
.05 lev
el; **
at
.01 lev
el,
***
at 0
.001 lev
el, an
d *
***
at 0
.0001 lev
el. B
lan
k s
pac
es m
ean
in
sign
ifica
nt
corr
elat
ion
s.
(1)
Dat
a in
th
e ta
ble
con
cern
2001 (
bef
ore
th
e in
trod
uct
ion
of th
e d
irec
t el
ecti
on
of m
ayors
). I
n 2
003 th
e ra
tio d
rop
ped
in P
ola
nd
to 3
6.8
; how
ever
,
thes
e d
ata
are
bas
ed o
n a
sm
all sa
mp
le o
f 38 m
ayors
an
d t
her
efore
nee
d t
o b
e tr
eate
d w
ith
cau
tion
.
(2)
Dat
a fr
om
2002 loca
l el
ecti
on
s (d
irec
t el
ecti
on
of
may
ors
).
Sourc
es:
May
ors
’ m
ember
ship
in
poli
tica
l p
arti
es—
LD
GP
su
rvey
of
Ch
ief
Exe
cuti
ve O
ffice
rs (
2000-2
002),
rem
ain
ing
dat
a—L
DG
P s
urv
ey o
f co
un
cilo
rs
(2002–
2003).
28
F A C E S O F L O C A L D E M O C R A C Y
We expect that direct election of mayors pushes down and indirect election pushes
up party membership among mayors. Similarly, a proportional electoral system pushes
up and a majoritarian system pushes down party membership among councilors.
Basically, our hypotheses have been confirmed. The most telling case is Poland, where
the first of the analyzed surveys was conducted before 2002 and the second after 2002,
when the direct election of mayors was introduced. After the reform the proportion
of mayors that are party members dropped, and in big cities (with a proportional elec-
toral system for councils) it is lower nowadays than among councilors (the opposite was
true before the 2002 reform). Indeed, we can find numerous examples of successful mayoral
candidates who run without the clear support of any party, or even against the will of the
apparatus of their former party (Swianiewicz and Klimska 2003). A huge difference between
membership rates among councilors in small (with majoritarian) and big (with a propor-
tional system) local governments in Hungary and Poland also confirms our theory.
But country specific factors matter too. If institutional factors were solely valid, we
would observe the highest party membership rate among Estonian, Latvian, and Polish
(before 2002) mayors. In reality it was still relatively low in Poland and highest in
Romania, with its direct elections of mayors. In addition, institutional factors cannot
explain big differences between membership rates in small local governments in Hun-
gary and Slovakia.
2.2 Party Support in Local Elections
Occasionally a candidate in a council or mayoral election is not a party member but is still
closely connected with a political group, which recommends or supports him or her in the
campaign. The lower part of table 1.6 confirms that using a “party flag” or party organi-
zational machinery in the campaign is much more frequent than formal membership.
With councilors in Bulgaria and Hungary, the difference between the proportion
of party members and those using partisan support in the election is not large. But in
Poland, Estonia, and Slovakia it is quite significant, especially in relatively small local
governments. The support probably takes a different form depending on the electoral
system. In Estonia (with proportional elections) the candidates, not being formal mem-
bers, are included on official party lists. In Poland and Slovakia (with a majoritarian
system in small local governments), formally independent candidates receive financial
and organizational support from parties.
With respect to mayors, the difference between formal membership and party sup-
port is greatest in Poland and Slovakia and least in Estonia. The difference is probably
explained by the indirect election of mayors in the Baltic countries and the direct system
in Poland and Slovakia. In direct elections there is more space for formally independent
candidates to use organizational support from a political group.
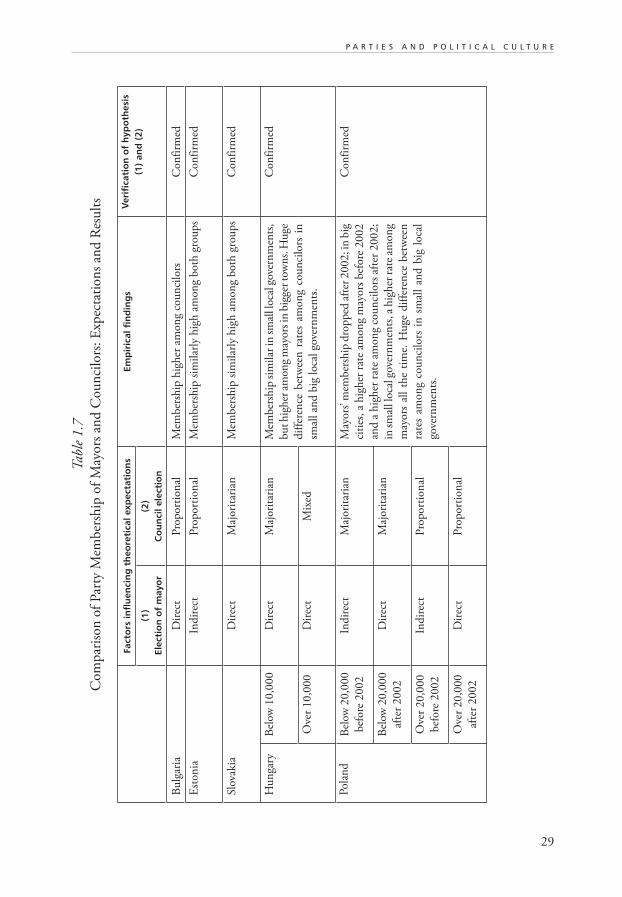
29
P A R T I E S A N D P O L I T I C A L C U L T U R E
Tab
le 1
.7
Com
par
ison
of
Par
ty M
ember
ship
of
May
ors
an
d C
ou
nci
lors
: E
xpec
tati
on
s an
d R
esu
lts
Fact
ors
infl
uen
cin
g t
heo
reti
cal e
xpec
tati
on
sEm
pir
ical
fin
din
gs
Ver
ifica
tio
n o
f h
ypo
thes
is
(1)
and
(2
)(1
)El
ecti
on
of
may
or
(2)
Co
un
cil e
lect
ion
Bu
lgar
iaD
irec
t P
rop
ort
ion
al
Mem
ber
ship
hig
her
am
on
g co
un
cilo
rsC
on
firm
ed
Est
on
iaIn
dir
ect
Pro
port
ion
al
Mem
ber
ship
sim
ilar
ly h
igh
am
on
g both
gro
up
sC
on
firm
ed
Slo
vakia
Dir
ect
Maj
ori
tari
an
Mem
ber
ship
sim
ilar
ly h
igh
am
on
g both
gro
up
sC
on
firm
ed
Hu
nga
ryB
elow
10,0
00
Dir
ect
M
ajori
tari
an
Mem
ber
ship
sim
ilar
in s
mal
l loca
l gov
ern
men
ts,
bu
t h
igh
er a
mon
g m
ayors
in b
igge
r to
wn
s. H
uge
dif
fere
nce
bet
wee
n r
ates
am
on
g co
un
cilo
rs i
n
smal
l an
d b
ig loca
l go
vern
men
ts.
Con
firm
ed
Ove
r 10,0
00
Dir
ect
Mix
ed
Pola
nd
Bel
ow
20,0
00
bef
ore
2002
Ind
irec
t M
ajori
tari
an
May
ors
’ mem
ber
ship
dro
pp
ed a
fter
2002; i
n b
ig
citi
es, a
hig
her
rat
e am
on
g m
ayors
bef
ore
2002
and
a h
igh
er r
ate
amon
g co
un
cilo
rs a
fter
2002;
in s
mal
l loca
l gov
ern
men
ts, a
hig
her
rat
e am
on
g
may
ors
all t
he
tim
e. H
uge
dif
fere
nce
bet
wee
n
rate
s am
on
g co
un
cilo
rs i
n s
mal
l an
d b
ig l
oca
l
gove
rnm
ents
.
Con
firm
ed
Bel
ow
20,0
00
afte
r 2002
Dir
ect
Maj
ori
tari
an
Ove
r 20,0
00
bef
ore
2002
Ind
irec
t P
rop
ort
ion
al
Ove
r 20,0
00
afte
r 2002
Dir
ect
Pro
port
ion
al
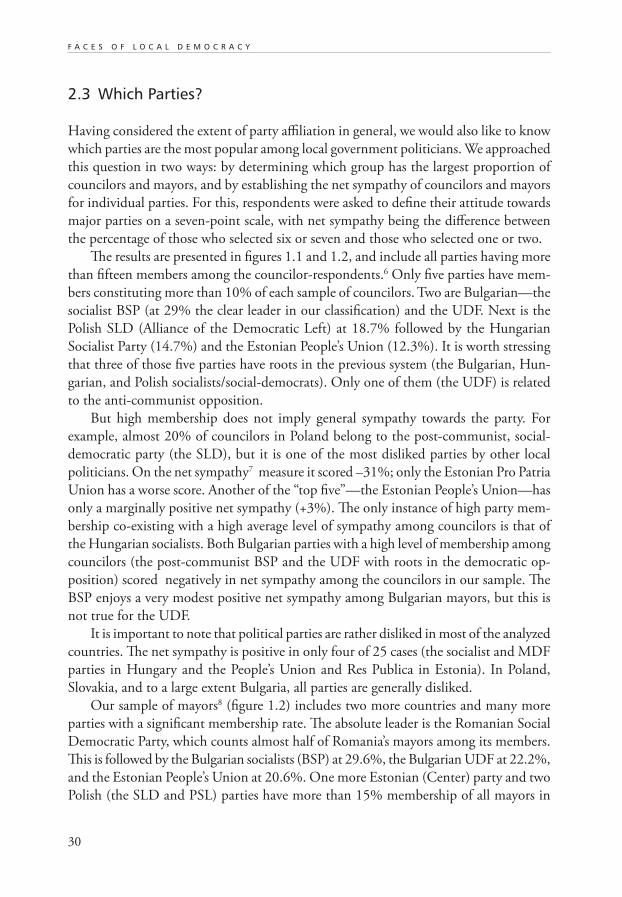
30
F A C E S O F L O C A L D E M O C R A C Y
2.3 Which Parties?
Having considered the extent of party affiliation in general, we would also like to know
which parties are the most popular among local government politicians. We approached
this question in two ways: by determining which group has the largest proportion of
councilors and mayors, and by establishing the net sympathy of councilors and mayors
for individual parties. For this, respondents were asked to define their attitude towards
major parties on a seven-point scale, with net sympathy being the difference between
the percentage of those who selected six or seven and those who selected one or two.
The results are presented in figures 1.1 and 1.2, and include all parties having more
than fifteen members among the councilor-respondents.6 Only five parties have mem-
bers constituting more than 10% of each sample of councilors. Two are Bulgarian—the
socialist BSP (at 29% the clear leader in our classification) and the UDF. Next is the
Polish SLD (Alliance of the Democratic Left) at 18.7% followed by the Hungarian
Socialist Party (14.7%) and the Estonian People’s Union (12.3%). It is worth stressing
that three of those five parties have roots in the previous system (the Bulgarian, Hun-
garian, and Polish socialists/social-democrats). Only one of them (the UDF) is related
to the anti-communist opposition.
But high membership does not imply general sympathy towards the party. For
example, almost 20% of councilors in Poland belong to the post-communist, social-
democratic party (the SLD), but it is one of the most disliked parties by other local
politicians. On the net sympathy7 measure it scored –31%; only the Estonian Pro Patria
Union has a worse score. Another of the “top five”—the Estonian People’s Union—has
only a marginally positive net sympathy (+3%). The only instance of high party mem-
bership co-existing with a high average level of sympathy among councilors is that of
the Hungarian socialists. Both Bulgarian parties with a high level of membership among
councilors (the post-communist BSP and the UDF with roots in the democratic op-
position) scored negatively in net sympathy among the councilors in our sample. The
BSP enjoys a very modest positive net sympathy among Bulgarian mayors, but this is
not true for the UDF.
It is important to note that political parties are rather disliked in most of the analyzed
countries. The net sympathy is positive in only four of 25 cases (the socialist and MDF
parties in Hungary and the People’s Union and Res Publica in Estonia). In Poland,
Slovakia, and to a large extent Bulgaria, all parties are generally disliked.
Our sample of mayors8 (figure 1.2) includes two more countries and many more
parties with a significant membership rate. The absolute leader is the Romanian Social
Democratic Party, which counts almost half of Romania’s mayors among its members.
This is followed by the Bulgarian socialists (BSP) at 29.6%, the Bulgarian UDF at 22.2%,
and the Estonian People’s Union at 20.6%. One more Estonian (Center) party and two
Polish (the SLD and PSL) parties have more than 15% membership of all mayors in
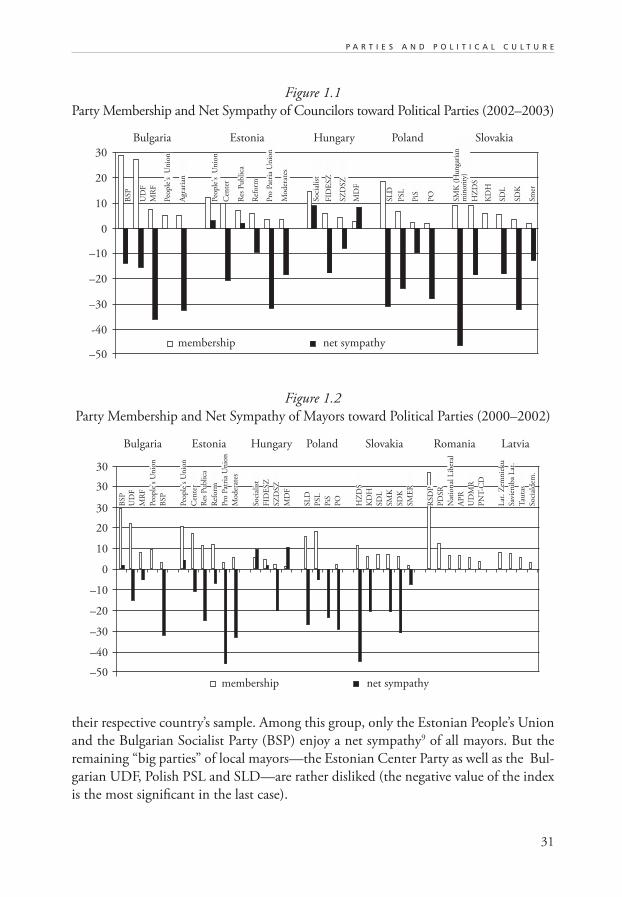
31
P A R T I E S A N D P O L I T I C A L C U L T U R E
their respective country’s sample. Among this group, only the Estonian People’s Union
and the Bulgarian Socialist Party (BSP) enjoy a net sympathy9 of all mayors. But the
remaining “big parties” of local mayors—the Estonian Center Party as well as the Bul-
garian UDF, Polish PSL and SLD—are rather disliked (the negative value of the index
is the most significant in the last case).
Figure 1.1
Party Membership and Net Sympathy of Councilors toward Political Parties (2002–2003)
membership net sympathy–50
-40
–30
–20
–10
0
10
20
30
BSP
UD
F
MR
F
Peo
ple
's U
nio
n
Agr
aria
n
Peo
ple
's U
nio
n
Cen
ter
Res
Pu
bli
ca
Ref
orm
Pro
Pat
ria
Un
ion
Mod
erat
es
Soci
alis
t
FID
ESZ
SZ
DSZ
MD
F
SL
D
PSL
PiS
PO
KD
H
SD
L
SD
K
Smer
HZ
DS
SM
K (
Hun
gari
anm
inor
ity)
Bulgaria Estonia Hungary Poland Slovakia
Figure 1.2
Party Membership and Net Sympathy of Mayors toward Political Parties (2000–2002)
–50
–40
–30
–20
–10
0
10
20
30
membership net sympathy
30
30
BSP
UD
F
MR
F
Peo
ple
's U
nio
n
BSP
Cen
ter
Peo
ple
's U
nio
n
Res
Pu
bli
ca
Ref
orm
Pro
Pat
ria
Un
ion
Mod
erat
es
Soci
alis
t
FID
ESZ
SZ
DSZ
MD
F
SL
D
PSL
PiS
PO
HZ
DS
KD
H
SD
L
SM
K
SD
K
SM
ER
RSD
P
PD
SR
Nat
ion
al L
iber
al
AP
R
UD
MR
PN
T-C
D
Lat
. Z
emn
ieku
Sav
ien
iba
Lat
.
Tau
tas
Soci
ald
em.
Bulgaria Estonia Hungary Poland Slovakia Romania Latvia
32
F A C E S O F L O C A L D E M O C R A C Y
2.4 Historical Evolution
We noted earlier that we should expect a gradual growth in the role of political parties
in local governments. Can we find empirical confirmation of this expectation?
The answer is not straightforward. There is definitely a growing (although still low)
party membership among Polish local politicians. The 1990 elections were organized
just as the political transformation in Poland was beginning, and they could be described
as “non-party” elections. In 1990 the old (post-communist) parties were mostly com-
promised and the new ones had not yet had enough time to develop. Local elections
were dominated by Civic Committees (Komitety Obywatelskie) rooted in the Solidarity
movement. Kowalczyk (1991) offers data showing that the Civic Committees won over
40% of all seats in local councils. Political parties were able to win (either independ-
ently or in coalitions) only about 8% of seats, and independent candidates won almost
40%. The low share of party councilors winning elections may be related to the fact
that only 23% of councilors elected in 1990 had ever served as councilors before the
1990 political turn-over (“Radni pierwszej kadencji” 1994). Most of the remaining 77%
came from the opposition movement, which had not yet started to organize political
parties at that time.
The 1994 Polish local elections could be characterized as “hidden” partisan. The
politicization of the election was a very clear trend in the large cities. In most cities with
a proportional system, the majority of the seats in local councils was divided between
three blocks: the SLD (post-communist social-democrats, often in coalition with the
PSL), the Democratic Union (at that moment the strongest of the parties to emerge
from the Solidarity movement) and coalitions of smaller rightist parties. This situation
gave room for a variety of local coalitions. The relative balance between the blocks was
one reason for the very long and difficult process of electing executive bodies (e.g., in
Warsaw it took almost three months to elect the mayor). About 30% of candidates
country-wide, but 60% in medium and big cities, were nominated by political parties
(Halamska 2001).
But this does not mean that party labels were highly visible during the 1994 elec-
tion campaign. Especially in small towns, candidates tried to avoid admitting to any
political orientation. Responding to the popular disappointment with party politics,
candidates most frequently used a strategy that assumed the “ideal” candidate did not
belong to any party and represented no one except the community as a whole. Only
such a candidate could be accepted by a considerable part of electorate as “our man”
(i.e., not belonging to “them”—in this case the political elite). An anecdote from one
of the medium-size cities illustrates this well. Two interviewed candidates unwillingly
admitted they were members of the political party but immediately stressed that this
membership had absolutely nothing to do with their electoral program or with what
they planned to do as councilors (Swianiewicz 1996). Even in large cities, it was often
33
P A R T I E S A N D P O L I T I C A L C U L T U R E
difficult to find any trace of party activity. Because of the proportional electoral system,
candidates obviously needed to organize in groups, but they tried to avoid any party labels
and used local names instead. In most cases a well-informed voter could easily recognize
which party was hidden behind the name of a particular “local committee,” but candidates
still considered it safer to avoid having the party name spelled out. The election campaign
in Kraków provides a good example of this cautiousness: the major parties used com-
mittee names that communicate as little as possible, such as Your City, Self-governing
Kraków, Alliance for Kraków, etc. (Swianiewicz 1996).
The 1998 local elections were more clearly dominated by national political parties.
This time they used their own names, at least in the big cities. Although we do not have
any precise statistics, we know that the majority of seats in the councils were divided
between the post-communist SLD and a coalition of rightist post-Solidarity parties called
the AWS (Akcja Wyborcza Solidarność—Electoral Action Solidarity), with the centrist
Union of Freedom (UW) sometimes playing an important role in the big cities and the
agrarian PSL in the smaller municipalities. As in the previous elections, independent
candidates—at least, those who did not formally expose their party affiliation during
the election campaign—played an important role in smaller municipalities, but in big
cities the domination of the major political parties was very clear. Data provided by
Halamska (2001) shows that in the whole country the AWS won 14% of council seats,
the SLD 11%, the PSL (in coalition with two other small parties) 6%, and the UW
1.5%, although it remained very important in major cities. In 2003 almost two-thirds
of councilors were still not members of any political party.
Similar changes occurred with the political affiliations of mayors. An unprecedented
turnover of mayors took place in 1990. Almost none of the former communist execu-
tives in cities over 40,000 and only about 15% in smaller local governments kept their
positions after the first democratic elections (Swianiewicz 1996). Almost 60% of new
mayors came from the Solidarity Civic Committees (Baldersheim et al. 1996). A ma-
jority of Polish mayors interviewed in 1991 declared they were not members of any
political party (Bartkowski 1996), and a large proportion had no clear party preference.
In 1991, when asked for whom they would vote in a parliamentary election, over 30%
answered they did not know! In 1997, 73% of mayors (and over 65% of mayors in
municipalities with a population over 20,000) still declared they were not members of
any political party. According to the 2000 IDLG survey, the proportion of non-partisan
mayors dropped to 54%, but in 2003 (after the reform introducing direct election of
mayors) it increased again to 63%.
The growth in partisan affiliation among local councilors and executive mayors in
Poland during the 1990s may seem to be a natural evolution of local politics in times
of transition and the building of a new party system. However, it is interesting that this
phenomenon is not as strong in some other Central and Eastern European countries.
In Slovakia there is a very clear difference between trends in council and mayoral elec-
34
F A C E S O F L O C A L D E M O C R A C Y
tions. The percentage of Slovak deputies who ran as independents (i.e., neither members
of parties nor recommended by any party) dropped from as much as 16% in 1990 to
9% in 1998 (Bernatova et al. 2001). A parallel situation is not observed among mayors
in direct elections in Slovakia, where LDI project data suggest that the proportion of
mayors who are members of political parties has remained relatively stable. Also, if
we disregard those councilors who are recommended by political parties but are not
members, the membership rate dropped after 1990 and has remained relatively stable
during the last two elections.
In Hungary, also, the partisan affiliation ratio of mayors dropped after the extension
of the direct election system to all local governments in 1994, while for councilors it
remains at a relatively stable level. To be more precise: the ratio of independent councilors
seems to slowly increase in small local governments (with a simple majority electoral system),
while there is a slight opposite tendency in larger cities. This is illustrated by table 1.8.
Summing up, an increase in party involvement of local politicians is neither obvious
nor common for all countries of Central and Eastern Europe. A summary of available
survey data on the recent situation is presented in table 1.9.10
3. HOW INFLUENTIAL ARE THE PARTIES?
We know the extent to which parties are present in local governments, but how influential
are they? Do they play a major role in crucial decisions? Do councilors take into account
their party’s perspective when voting on important issues? We attempt to answer these
questions using the classic “reputational” method in which we ask councilors about their
perception of the role of various actors in local decision-making. Tables 1.10 and 1.11
illustrate their opinions on the influence of parties on important decisions.
A comparison at the level of countries shows the influence of parties is definitely
strongest in Bulgaria, followed by Poland (the two countries with the most territorially
consolidated systems). Bulgaria is the only country in which more respondents think
that parties are very influential than those who think parties’ influence is very low (22%
and 14%, respectively). The opposite is true in Poland, but the difference is not very
large (16% think parties are very influential and 29% think their influence is very low).
In the remaining three countries the number of those who believe parties’ influence is
very low is several times larger than those who think the opposite.
Party influence is significantly correlated with the size of local government, and this
relationship has been found in all the analyzed countries.
We get similar results when we compare the perceived influence of parties with
the influence of other actors. Councilors were asked to assess the importance of each
of fifteen groups. In Bulgaria parties ranked fourth in influence, but in Slovakia they
placed second-last in the ranking.
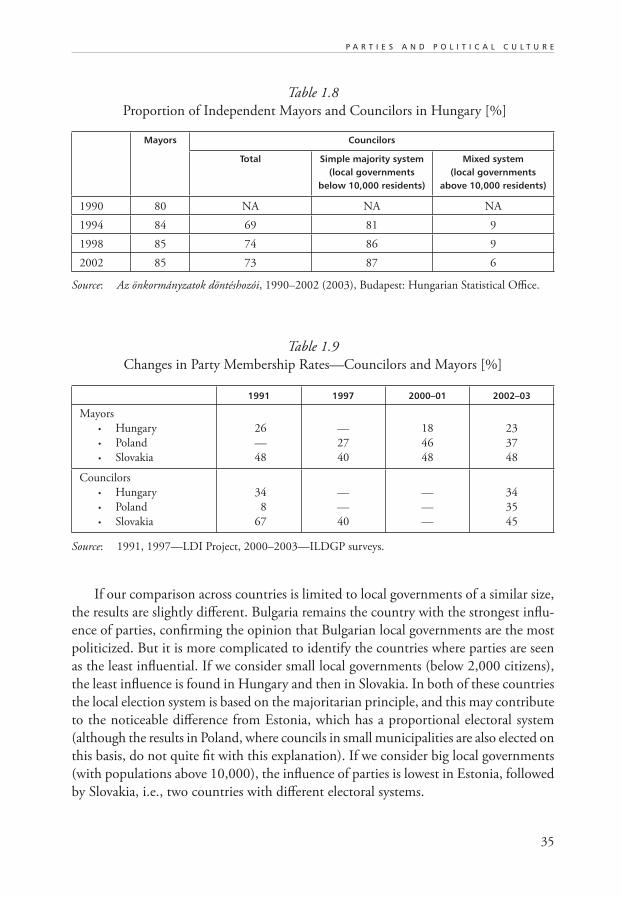
35
P A R T I E S A N D P O L I T I C A L C U L T U R E
Table 1.8
Proportion of Independent Mayors and Councilors in Hungary [%]
Mayors Councilors
Total Simple majority system (local governments
below 10,000 residents)
Mixed system (local governments
above 10,000 residents)
1990 80 NA NA NA
1994 84 69 81 9
1998 85 74 86 9
2002 85 73 87 6
Source: Az önkormányzatok döntéshozói, 1990–2002 (2003), Budapest: Hungarian Statistical Office.
Table 1.9
Changes in Party Membership Rates—Councilors and Mayors [%]
1991 1997 2000–01 2002–03
Mayors
• Hungary
• Poland
• Slovakia
26
—
48
—
27
40
18
46
48
23
37
48
Councilors
• Hungary
• Poland
• Slovakia
34
8
67
—
—
40
—
—
—
34
35
45
Source: 1991, 1997—LDI Project, 2000–2003—ILDGP surveys.
If our comparison across countries is limited to local governments of a similar size,
the results are slightly different. Bulgaria remains the country with the strongest influ-
ence of parties, confirming the opinion that Bulgarian local governments are the most
politicized. But it is more complicated to identify the countries where parties are seen
as the least influential. If we consider small local governments (below 2,000 citizens),
the least influence is found in Hungary and then in Slovakia. In both of these countries
the local election system is based on the majoritarian principle, and this may contribute
to the noticeable difference from Estonia, which has a proportional electoral system
(although the results in Poland, where councils in small municipalities are also elected on
this basis, do not quite fit with this explanation). If we consider big local governments
(with populations above 10,000), the influence of parties is lowest in Estonia, followed
by Slovakia, i.e., two countries with different electoral systems.
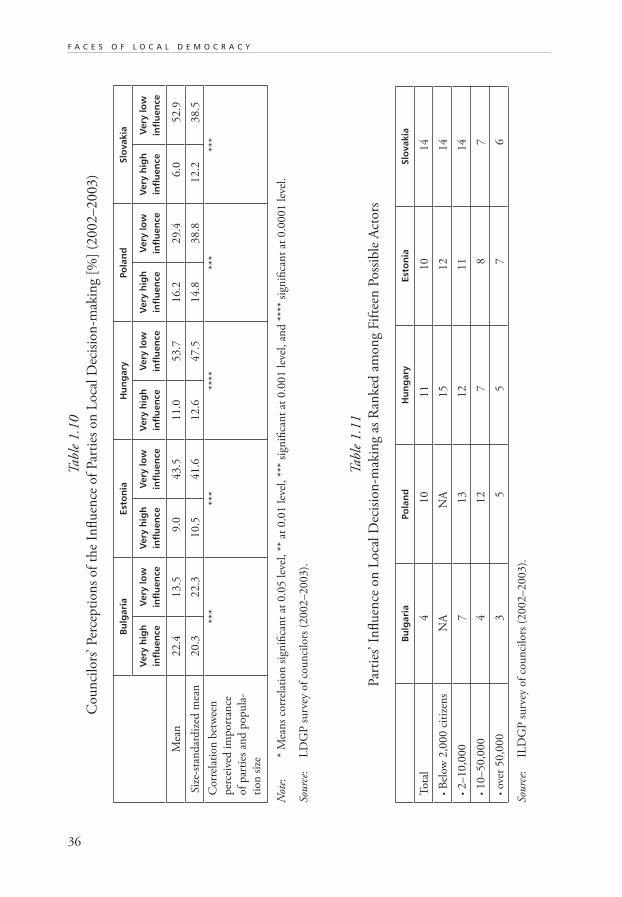
36
F A C E S O F L O C A L D E M O C R A C Y
Tab
le 1
.10
Cou
nci
lors
’ Per
cep
tion
s of
the
Infl
uen
ce o
f P
arti
es o
n L
oca
l D
ecis
ion
-mak
ing
[%]
(2002–2003)
Bu
lgar
iaEs
ton
iaH
un
gar
yPo
lan
dSl
ova
kia
Ver
y h
igh
in
flu
ence
Ver
y lo
w
infl
uen
ceV
ery
hig
h
infl
uen
ceV
ery
low
in
flu
ence
Ver
y h
igh
in
flu
ence
Ver
y lo
w
infl
uen
ceV
ery
hig
h
infl
uen
ceV
ery
low
in
flu
ence
Ver
y h
igh
in
flu
ence
Ver
y lo
w
infl
uen
ce
Mea
n22.4
13.5
9.0
43.5
11.0
53.7
16.2
29.4
6.0
52.9
Siz
e-st
and
ard
ized
mea
n20.3
22.3
10.5
41.6
12.6
47.5
14.8
38.8
12.2
38.5
Corr
elat
ion
bet
wee
n
per
ceiv
ed i
mp
ort
ance
of
par
ties
an
d p
op
ula
-
tion
siz
e
***
***
****
***
***
Not
e:
* M
ean
s co
rrel
atio
n s
ign
ifica
nt
at 0
.05 lev
el, **
at
0.0
1 lev
el, **
* si
gnifi
can
t at
0.0
01 lev
el, an
d *
***
sign
ifica
nt
at 0
.0001 lev
el.
Sourc
e:
LD
GP
su
rvey
of
cou
nci
lors
(2002–2003).
Tab
le 1
.11
Par
ties
’ In
flu
ence
on
Loca
l D
ecis
ion
-mak
ing
as R
anked
am
on
g F
ifte
en P
oss
ible
Act
ors
Bu
lgar
iaPo
lan
dH
un
gar
yEs
ton
iaSl
ova
kia
Tota
l4
10
11
10
14
• B
elow
2,0
00 c
itiz
ens
NA
NA
15
12
14
• 2–10,0
00
713
12
11
14
• 10–50,0
00
412
78
7
• ov
er 5
0,0
00
35
57
6
Sourc
e:
ILD
GP
su
rvey
of
cou
nci
lors
(2002–2003).
37
P A R T I E S A N D P O L I T I C A L C U L T U R E
We also expected that the influence of parties might be larger in countries with a
collective form of leadership where the mayor is nominated by council (Estonia) than
in countries with direct, popular elections (the remaining four countries in tables 1.9
and 1.10). However, such a relationship is not supported by our data.
Finally, we expected that the influence of political parties has grown gradually during
the last decade, together with clarification and stabilization of the new political map.
We may only partially verify this opinion thanks to LDI surveys conducted in Hungary,
Poland, and Slovakia in 1991 and 1997. Since mayors responded to the LDI surveys
and councilors were included in our newer data sets, the data are not fully comparable.
We need to be careful in drawing conclusions; nevertheless, our hypothesis seems to be
confirmed to a large extent.
The change is clearer in Hungary, where parties’ influence ranked 14th in 1991
but 11th in 2002, and in Poland with a ranking of 15th in 1991 and 1997, but 10th in
2003. The former case mainly applies in bigger towns, and the latter predominantly in
smaller municipalities where parties have gradually come to play a role in local decision-
making. In Slovakia the increase of party influence is less visible (a ranking of fourteen
in all three surveys), but it may be noted in medium-size and big cities as well (a ranking
of eight in cities over 50,000 in 1997, but six in 2002).
The perceived importance of parties relative to other actors in decision-making is
not the only way we can learn about their influence. Respondents—councilors and
mayors—were also asked whose opinion they usually take into consideration when
making important decisions. They were asked to assess the impact of eight different
groups, of which parties were one.
The results are summarized in table 1.12. As we might expect, Bulgaria confirms
its opinion of having the most partisan local government system. But in the remaining
countries respondents (perhaps with the exception of Slovak mayors) declare consid-
eration of parties’ opinions more often than one might expect, judging on the basis of
the answers on the relative influence of parties on local decision-making. The largest
difference is in Estonia, where the perceived influence of parties is relatively modest,
but most of the respondents admit to serious consideration of parties’ opinions when
making important decisions. This difference, which is especially big in small munici-
palities, could be related to the proportional system of elections (while in Hungarian
or Slovak villages of identical size, elections are based on the majoritarian principle). If
the chances of a councilor in the next election depend to a large extent on his or her
position on a party list, then considering party opinion while making crucial decisions
is a highly advisable strategy. A comparison of the answers of Estonian, Slovak, and
Hungarian mayors also suggests that consideration of parties’ opinion is more frequent
if mayors are nominated by the council (as in Estonia) than when they are elected
directly by all citizens (as in Hungary and Slovakia). Bulgaria does not quite fit with
these conclusions, but as Bulgarian local governments are much more politicized than
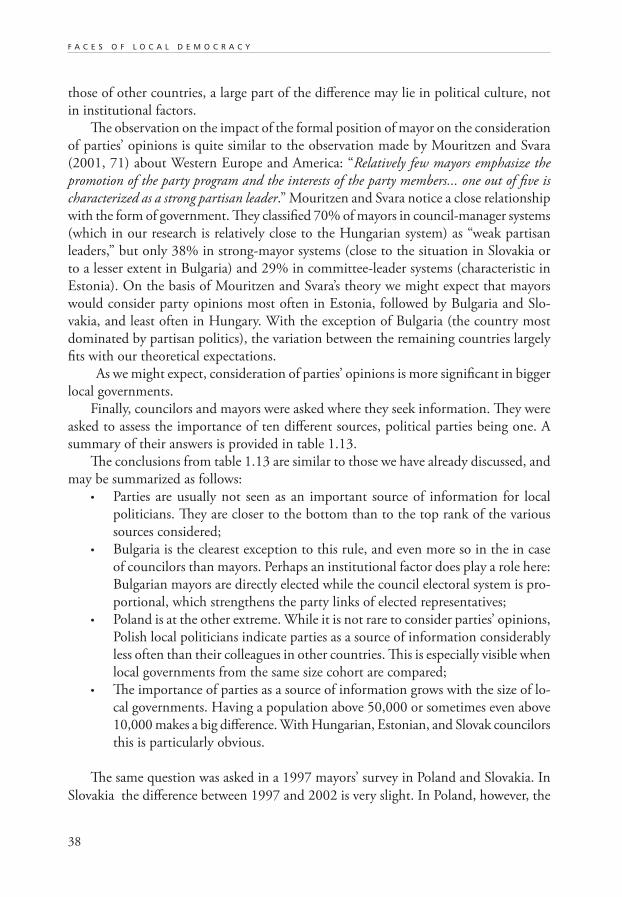
38
F A C E S O F L O C A L D E M O C R A C Y
those of other countries, a large part of the difference may lie in political culture, not
in institutional factors.
The observation on the impact of the formal position of mayor on the consideration
of parties’ opinions is quite similar to the observation made by Mouritzen and Svara
(2001, 71) about Western Europe and America: “Relatively few mayors emphasize the
promotion of the party program and the interests of the party members... one out of five is
characterized as a strong partisan leader.” Mouritzen and Svara notice a close relationship
with the form of government. They classified 70% of mayors in council-manager systems
(which in our research is relatively close to the Hungarian system) as “weak partisan
leaders,” but only 38% in strong-mayor systems (close to the situation in Slovakia or
to a lesser extent in Bulgaria) and 29% in committee-leader systems (characteristic in
Estonia). On the basis of Mouritzen and Svara’s theory we might expect that mayors
would consider party opinions most often in Estonia, followed by Bulgaria and Slo-
vakia, and least often in Hungary. With the exception of Bulgaria (the country most
dominated by partisan politics), the variation between the remaining countries largely
fits with our theoretical expectations.
As we might expect, consideration of parties’ opinions is more significant in bigger
local governments.
Finally, councilors and mayors were asked where they seek information. They were
asked to assess the importance of ten different sources, political parties being one. A
summary of their answers is provided in table 1.13.
The conclusions from table 1.13 are similar to those we have already discussed, and
may be summarized as follows:
• Parties are usually not seen as an important source of information for local
politicians. They are closer to the bottom than to the top rank of the various
sources considered;
• Bulgaria is the clearest exception to this rule, and even more so in the in case
of councilors than mayors. Perhaps an institutional factor does play a role here:
Bulgarian mayors are directly elected while the council electoral system is pro-
portional, which strengthens the party links of elected representatives;
• Poland is at the other extreme. While it is not rare to consider parties’ opinions,
Polish local politicians indicate parties as a source of information considerably
less often than their colleagues in other countries. This is especially visible when
local governments from the same size cohort are compared;
• The importance of parties as a source of information grows with the size of lo-
cal governments. Having a population above 50,000 or sometimes even above
10,000 makes a big difference. With Hungarian, Estonian, and Slovak councilors
this is particularly obvious.
The same question was asked in a 1997 mayors’ survey in Poland and Slovakia. In
Slovakia the difference between 1997 and 2002 is very slight. In Poland, however, the
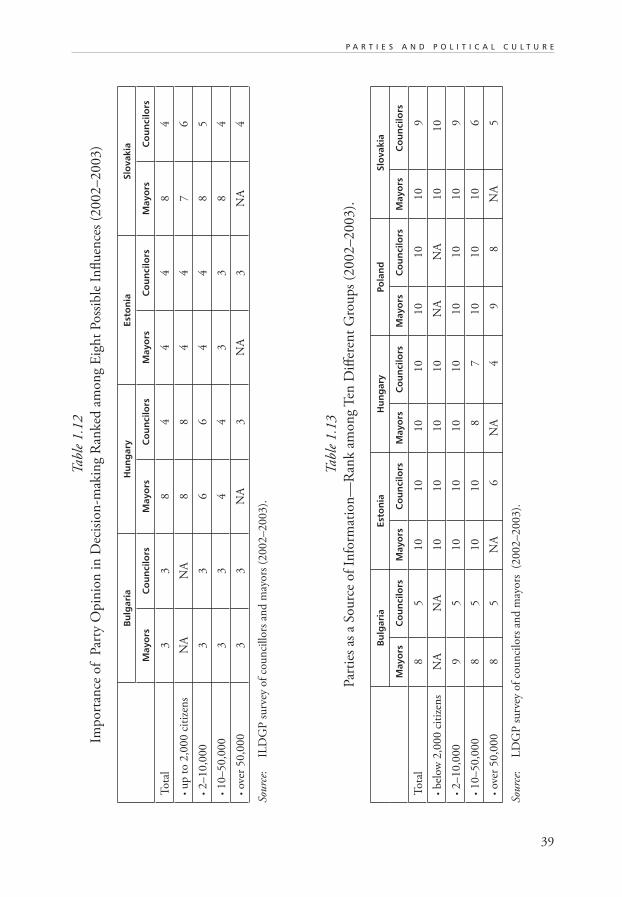
39
P A R T I E S A N D P O L I T I C A L C U L T U R E
Tab
le 1
.12
Imp
ort
ance
of
Par
ty O
pin
ion
in
Dec
isio
n-m
akin
g R
anked
am
on
g E
igh
t Poss
ible
In
flu
ence
s (2
002–2003)
Bu
lgar
iaH
un
gar
yEs
ton
iaSl
ova
kia
May
ors
Co
un
cilo
rsM
ayo
rsC
ou
nci
lors
May
ors
Co
un
cilo
rsM
ayo
rsC
ou
nci
lors
Tota
l3
38
44
48
4
• u
p t
o 2
,000 c
itiz
ens
NA
NA
88
44
76
• 2–10,0
00
33
66
44
85
• 10–50,0
00
33
44
33
84
• ov
er 5
0,0
00
33
NA
3N
A3
NA
4
Sourc
e:
ILD
GP
su
rvey
of
cou
nci
llors
an
d m
ayors
(2
002–2003).
Tab
le 1
.13
Par
ties
as
a Sou
rce
of
Info
rmat
ion
—R
ank a
mon
g T
en D
iffer
ent
Gro
up
s (2
002–2003
).
Bu
lgar
iaEs
ton
iaH
un
gar
yPo
lan
dSl
ova
kia
May
ors
Co
un
cilo
rsM
ayo
rsC
ou
nci
lors
May
ors
Co
un
cilo
rsM
ayo
rsC
ou
nci
lors
May
ors
Co
un
cilo
rs
Tota
l8
510
10
10
10
10
10
10
9
• bel
ow
2,0
00 c
itiz
ens
NA
NA
10
10
10
10
NA
NA
10
10
• 2–10,0
00
95
10
10
10
10
10
10
10
9
• 10–50,0
00
85
10
10
87
10
10
10
6
• ov
er 5
0,0
00
85
NA
6N
A4
98
NA
5
Sourc
e:
LD
GP
su
rvey
of
cou
nci
lors
an
d m
ayors
(2
002–2003).
40
F A C E S O F L O C A L D E M O C R A C Y
role of parties as a source of important information has significantly decreased. Most
likely this shift is associated with a change in the way mayors are nominated (by the
council before 2002 and in popular elections since then).
4. THE ROLE OF PARTIES IN LOCAL POLITICS: A SUMMARY MODEL
How we can summarize the influence of parties on local political life in Central and
Eastern Europe? First, we have created an index of party importance based on a weighted
sum of the following indicators:11
• Party membership rate of councilors
• Party membership rate of mayors
• Party support for councilors in the last election campaign
• Party support for mayors in the last election campaign
• Perceived influence of parties on local decision-making
• Parties as a source of information for local councilors.
(Due to missing data for Poland, the question on consideration of parties’ opinion
while making important decisions was excluded from the index.)
Table 1.14 presents the results of the calculations. The highest significance of politi-
cal parties is in Bulgaria, while in the remaining four countries it is much lower. In all
countries it is significantly correlated with the size of local government—i.e., the index
grows with the size of municipalities.
Although the correlation is significant at the 0.001 level in each of the countries,
it is weakest in Bulgaria and highest in Hungary. In Bulgaria, Estonia, and Slovakia the
relationship is relatively flat (i.e., there is growth in party significance with increasing
size, but the change is relatively slow), while in Poland and especially in Hungary it is
very steep.
The significance of parties is lowest in small Hungarian municipalities (below 2,000
citizens), a few times lower than in Estonian or Slovak local governments of comparable
size according to the index. In the next size cohort (2,000–10,000) the index for Hungary
is still lower than for Estonia or Slovakia, but in the two remaining groups (over 10,000
citizens) it is far higher in Hungary, and only marginally lower than in Bulgaria.
The size-standardized index allows a comparison of the significance of political parties
regardless of differences in the size structure of the samples in individual countries. On
average it is the lowest in Poland, somewhat higher in Hungary, and by far the highest in
Bulgaria. This means that the highest value of a “normal index” mean cannot be reduced
to just the territorial consolidation of the Bulgarian local government system.
How we can explain the variation? To answer this question and to test our initial
hypothesis we constructed a regression model in which “party significance index” is
41
P A R T I E S A N D P O L I T I C A L C U L T U R E
a dependent variable. Independent variables in the model might be clustered in two
groups:
• National political culture—represented by dummy variables for each of the
countries;
• Institutional factors represented by:
— Population size of the local government (territorial consolidation);
— Method of mayors’ nomination (by the council in Estonia and by popular
elections in the remaining four countries);
— Method of council election (proportional in Bulgaria, Estonia, Hungarian12
governments with over 10,000, and Polish over 20,000 population, and
majoritarian in Slovakia and smaller Hungarian and Polish municipalities).
The weakness of the model (at least in relationship to our data) is the fact that the
manner of mayors’ nomination differs from popular elections in one country only (Es-
tonia). Therefore, we cannot statistically distinguish the impact of “Estonian culture”
from the impact of the method of nomination of mayors.
The results from the testing of our model are briefly presented in table 1.15. First of
all, the model proved to be highly statistically significant, i.e., the selected independent
variables explain much of the variation in party significance.
If controlled for other variables, the most significant are the method of council elec-
tion and the size of local government. As expected, in big cities and in councils elected
by the proportionality principle the importance of parties is higher.
Interestingly, Slovak political culture seems to favor party influence. In spite of
Slovakia’s majoritarian electoral system, party influence is relatively high. Bulgarian
culture also has the effect of increasing the importance of parties, but in this case the
influence is lower, since the high scores for Bulgaria may be partially explained by its
Table 1.14
Index of Party Significance in Local Politics
Bulgaria Poland Hungary Estonia Slovakia
Mean value 73.6 47.6 33.9 50.8 49.5
Size-standardized mean 70.9 43.3 44,5 53,0 48,9
Correlation of the index
with population size
*** *** **** *** ***
Note: 0—means no significance, 100—a very large significance of parties in local politics.
Note: * means correlation significant at 0.05 level, ** at 0.01 level, *** significant at 0.001 level, and
**** significant at 0.0001 level.
Source: Own calculations on the basis of the ILDGP survey of councilors and mayors (2002–2003).
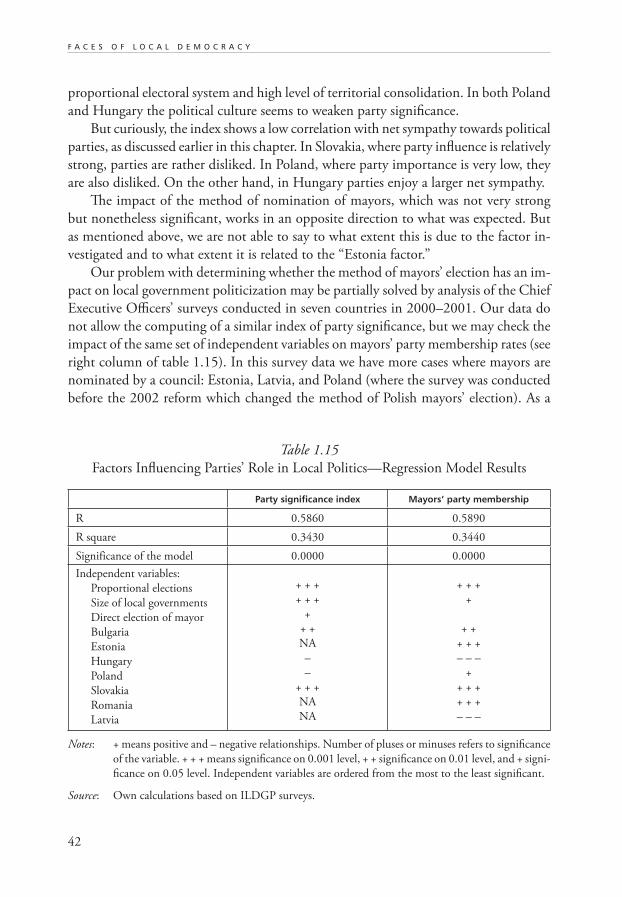
42
F A C E S O F L O C A L D E M O C R A C Y
proportional electoral system and high level of territorial consolidation. In both Poland
and Hungary the political culture seems to weaken party significance.
But curiously, the index shows a low correlation with net sympathy towards political
parties, as discussed earlier in this chapter. In Slovakia, where party influence is relatively
strong, parties are rather disliked. In Poland, where party importance is very low, they
are also disliked. On the other hand, in Hungary parties enjoy a larger net sympathy.
The impact of the method of nomination of mayors, which was not very strong
but nonetheless significant, works in an opposite direction to what was expected. But
as mentioned above, we are not able to say to what extent this is due to the factor in-
vestigated and to what extent it is related to the “Estonia factor.”
Our problem with determining whether the method of mayors’ election has an im-
pact on local government politicization may be partially solved by analysis of the Chief
Executive Officers’ surveys conducted in seven countries in 2000–2001. Our data do
not allow the computing of a similar index of party significance, but we may check the
impact of the same set of independent variables on mayors’ party membership rates (see
right column of table 1.15). In this survey data we have more cases where mayors are
nominated by a council: Estonia, Latvia, and Poland (where the survey was conducted
before the 2002 reform which changed the method of Polish mayors’ election). As a
Table 1.15
Factors Influencing Parties’ Role in Local Politics—Regression Model Results
Party significance index Mayors’ party membership
R 0.5860 0.5890
R square 0.3430 0.3440
Significance of the model 0.0000 0.0000
Independent variables:
Proportional elections
Size of local governments
Direct election of mayor
Bulgaria
Estonia
Hungary
Poland
Slovakia
Romania
Latvia
+ + +
+ + +
+
+ +
NA
–
–
+ + +
NA
NA
+ + +
+
+ +
+ + +
– – –
+
+ + +
+ + +
– – –
Notes: + means positive and – negative relationships. Number of pluses or minuses refers to significance
of the variable. + + + means significance on 0.001 level, + + significance on 0.01 level, and + signi-
ficance on 0.05 level. Independent variables are ordered from the most to the least significant.
Source: Own calculations based on ILDGP surveys.
43
P A R T I E S A N D P O L I T I C A L C U L T U R E
result, we can distinguish the impact of the mayors’ election factor from the impact of
the country variable.
But we found that the method of mayors’ nomination remained insignificant when
controlled for other independent variables. Other results are not very much different
than what has already been presented in the party significance index. Proportionality in
elections is confirmed as an important factor. This result may look surprising since it is
not directly related to mayors’ party membership. But in countries where the mayor is
elected by the council, the method of council election is definitely very important—a
more partisan council elected in a proportional system is more likely to nominate a par-
tisan mayor. The council election system may also have an indirect impact in countries
in which the mayor is directly elected by all voters. Even in this case, a mayor needs to
cooperate with the council. We should remember that the position of directly elected
mayors in CEE countries is usually relatively weak. For example, they have to rely on
council approval in appointing important staff members. However, party mayors have
a better chance of success in cooperation with highly partisan councils elected in a pro-
portional system. In countries with majoritarian electoral systems, councils are more
likely non-partisan and they may cooperate more easily with an independent mayor.
There are also country-specific variables that remain important. Estonia, Romania,
Slovakia, and to a lesser extent Bulgaria are more likely to have partisan mayors. In
Latvia and Hungary, independent mayors are more likely to be elected, assuming that
the impact of other (institutional) factors is eliminated. There is an interesting differ-
ence between the impact of the “Poland” variable in both regression models. “Poland”
had a modestly negative impact on the 2003 party significance index, while the impact
of the same variable on the 2000 mayors’ partisanship analysis was modestly negative.
The change of sign might be related to the 2002 reform of Polish mayoralty election
methods (although, as mentioned earlier, this variable’s high significance has not been
confirmed).
Do our results shed light on whether there are parties that govern in Central and East
European local politics? The proper answer is—it depends where and when. We have
been able to identify countries in which there is a tendency for strong party influence
(Slovakia, Bulgaria, and Romania). But institutional factors also play a role—especially
the territorial fragmentation of the local government system and the method of council
election.
5. POLITICAL FRAGMENTATION WITHIN LOCAL GOVERNMENTS
In addition to the question of whether councilors are party members or politically
independent, the number and size of the various factions in a local council are impor-
tant issues for the management of local governments. Is there one group with a clearly
44
F A C E S O F L O C A L D E M O C R A C Y
dominant position that can easily implement its policies, or are there several small groups
that necessitate stable or ad hoc coalitions for each decision that is made? To measure
levels of political fragmentation we use an index called the Rae-Taylor fragmentation
index. The formula for this index is:
FRA = 1 – ∑s(i)2,
where FRA is a fragmentation index for the council, and s(i) is a share of mandates
possessed by the faction.
One can find two versions of this index (see Gabriel et al. 2002): the “electoral
fragmentation index,” which reflects fragmentation of votes in the election, and the
“parliamentary/council fragmentation index,” which takes into account the division of
seats among party groups. The former better reflects the variation in citizens’ political
options. But we will concentrate on the latter, as it illustrates the environment for day-
to-day local government management.
The index differs from 0 to 1, where 0 means a situation in which all seats in the
council belong to the same political group (or all voters voted for one party, if we take the
“electoral” version of an index), while 1 means that each councilor is independent and
there are no factions in the council (or every councilor belongs to different political party).
Table 1.16 illustrates the fragmentation of local councils in seven CEE countries.
The analyzed countries may be divided into those with a high or low fragmentation
index. The overall fragmentation was by far the highest in Hungary with an average
score above 0.9, then in Poland (0.818), and in Latvia (0.809). In the group with a low
fragmentation index we find Romania (0.727), Slovakia (0.731), Bulgaria (0.744), and
Estonia (0.747). But if we take into account differences in the size of local governments,
the lowest score is for Slovakia.
We expected that fragmentation would be lower in the big cities, where parties play
a more important role and there are fewer independent councilors who do not belong
to any faction. The last row in table 1.16 shows that this is definitely the case in Hun-
gary, to a slightly lesser extent in Poland, and much less in Slovakia. In the remaining
countries the correlation is insignificant (Bulgaria, Romania, and Latvia) or even points
weakly in the opposite direction (Estonia).
The data on a fragmentation index is static and cannot show changes over time.
But as the party system in Central and Eastern Europe is far from stable, we can expect
that fragmentation within the council changes significantly during the term of the
council. Some groups and coalitions break down after the election and new factions are
formed, which increases the level of fragmentation. The opposite can also happen, but
our observations suggest this is much less frequent. We cannot verify this in a systematic
way, but the hypothesis can be partially confirmed by data from Poland. The index of
fragmentation calculated in 1998 for all Polish cities above 100,000 citizens was 0.614
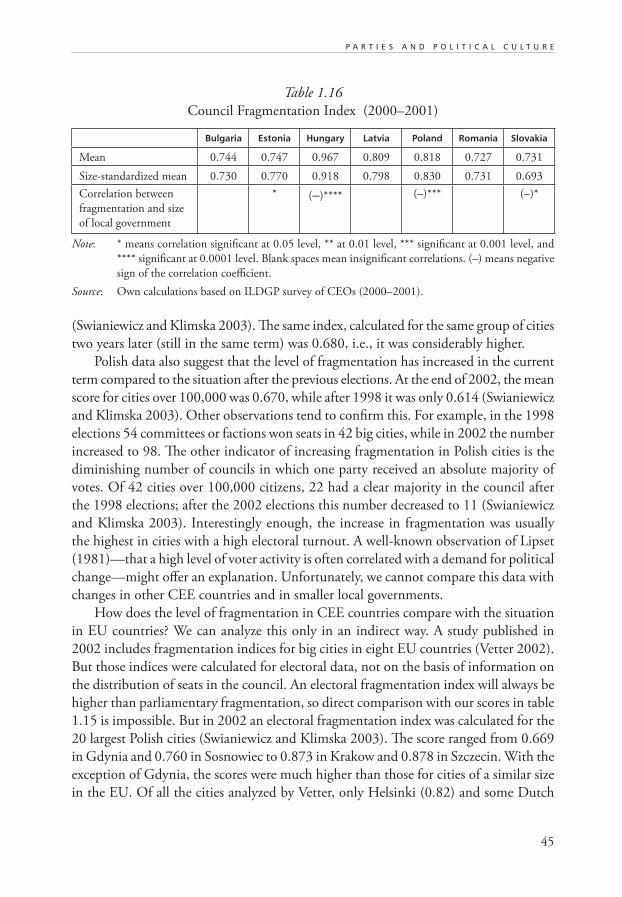
45
P A R T I E S A N D P O L I T I C A L C U L T U R E
(Swianiewicz and Klimska 2003). The same index, calculated for the same group of cities
two years later (still in the same term) was 0.680, i.e., it was considerably higher.
Polish data also suggest that the level of fragmentation has increased in the current
term compared to the situation after the previous elections. At the end of 2002, the mean
score for cities over 100,000 was 0.670, while after 1998 it was only 0.614 (Swianiewicz
and Klimska 2003). Other observations tend to confirm this. For example, in the 1998
elections 54 committees or factions won seats in 42 big cities, while in 2002 the number
increased to 98. The other indicator of increasing fragmentation in Polish cities is the
diminishing number of councils in which one party received an absolute majority of
votes. Of 42 cities over 100,000 citizens, 22 had a clear majority in the council after
the 1998 elections; after the 2002 elections this number decreased to 11 (Swianiewicz
and Klimska 2003). Interestingly enough, the increase in fragmentation was usually
the highest in cities with a high electoral turnout. A well-known observation of Lipset
(1981)—that a high level of voter activity is often correlated with a demand for political
change—might offer an explanation. Unfortunately, we cannot compare this data with
changes in other CEE countries and in smaller local governments.
How does the level of fragmentation in CEE countries compare with the situation
in EU countries? We can analyze this only in an indirect way. A study published in
2002 includes fragmentation indices for big cities in eight EU countries (Vetter 2002).
But those indices were calculated for electoral data, not on the basis of information on
the distribution of seats in the council. An electoral fragmentation index will always be
higher than parliamentary fragmentation, so direct comparison with our scores in table
1.15 is impossible. But in 2002 an electoral fragmentation index was calculated for the
20 largest Polish cities (Swianiewicz and Klimska 2003). The score ranged from 0.669
in Gdynia and 0.760 in Sosnowiec to 0.873 in Krakow and 0.878 in Szczecin. With the
exception of Gdynia, the scores were much higher than those for cities of a similar size
in the EU. Of all the cities analyzed by Vetter, only Helsinki (0.82) and some Dutch
Table 1.16
Council Fragmentation Index (2000–2001)
Bulgaria Estonia Hungary Latvia Poland Romania Slovakia
Mean 0.744 0.747 0.967 0.809 0.818 0.727 0.731
Size-standardized mean 0.730 0.770 0.918 0.798 0.830 0.731 0.693
Correlation between
fragmentation and size
of local government
* (–)**** (–)*** (–)*
Note: * means correlation significant at 0.05 level, ** at 0.01 level, *** significant at 0.001 level, and
**** significant at 0.0001 level. Blank spaces mean insignificant correlations. (–) means negative
sign of the correlation coefficient.
Source: Own calculations based on ILDGP survey of CEOs (2000–2001).
46
F A C E S O F L O C A L D E M O C R A C Y
cities (e.g., Amsterdam) showed values similar to those in Poland. But the fragmenta-
tion of votes in cities in Denmark, Sweden, Norway, the UK, France, and Germany was
much lower. For example, in the six biggest English cities the score ranges from 0.60 in
Manchester to 0.65 in Liverpool. It is also very low in several French cities—0.569 in
Tours, 0.572 in Nantes, and 0.584 in Bordeaux (Hoffman-Martinot 2002).
From our data we know that the parliamentary fragmentation index in Polish cities
over 100,000 citizens is usually lower than in other big cities of Central and Eastern
Europe (except in Slovakia). Indirectly, therefore, we may conclude that the level of po-
litical fragmentation in CEE cities is much higher than in most of the EU countries.
It appears that weakness in the party system in CEE countries leads to consider-
able fragmentation of local councils and can potentially produce complications in local
management. Another potential complication is that the mayor does not always have a
majority in the council—the opposite of the situation resulting from recent reforms in
southern Europe. This may lead, and actually often does lead, to serious management
problems when a mayor faces a majority opposition on council. Recalling the connection
between low stability and high fragmentation of political parties in CEE countries, we
can expect numerous cases in which effective decision-making may be difficult. Only
seven mayors in the 42 Polish cities with a population over 100,000 have the clear support
of the majority of councilors. In most of the remaining cases the mayor needs to rely on
more or less stable coalitions. In five cities the situation is even more complicated—the
majority in the council is held by a group that is definitely in opposition to the mayor
(Swianiewicz and Klimska 2003). Similar problems are reported in other countries.
Sometimes they concern major cities such as the Romanian capital, Bucharest, or the
Albanian capital, Tirana. But this issue goes beyond the scope of our analysis here.
6. COUNCILORS’ PARTY AFFILIATIONS AND POLITICAL CULTURE
We turn now to party membership and its meaning. How do the party programs differ
from each other? Are the programs really internalized by local party members who are
municipal councilors? Are the parties groups of people believing in similar values and
trying to achieve common goals? Or are they pragmatic groups of friends and colleagues
whose reasons for coming together are not strongly related to ideological choices?
6.1 Setting the Context
The political party system in Central and Eastern Europe, as stated earlier, is far from
stable. Of course, the situation differs from one country to another, but the general
observation remains true throughout the whole region.
47
P A R T I E S A N D P O L I T I C A L C U L T U R E
The most volatile is perhaps the party system in Poland. The rise and decline of AWS
(initially a loose coalition of post-Solidarity groups and then a single political party),
which won the 1997 parliamentary election only to almost completely disappear after
the 2001 election, is the best but not the only example. UW (Freedom Union)—a party
which until recently seemed to be a stable element of the Polish transition—has almost
disappeared from the political scene since 2001. Among six major parties represented
in the present Parliament, only two (the PSL and the SLD) were present in the previ-
ous term as well. These rapid changes are obviously reflected in local governments (see
Swianiewicz and Klimska 2003).
Slovakia is not much more stable. Former Prime Minister Mečiar’s HZDS, the Christian-
Democratic KDH, the leftist SDL, or the Hungarian minority SMK have been active
and significant for over ten years. But recently the strong position of some new parties
such as the ANO or the SMER (the latter having the highest support of voters accord-
ing to some polls from the summer of 2003) has contributed to a generally unstable
picture. In both Poland and Slovakia the system does not seem to be moving towards
greater consolidation, and this observation is connected, above all, to the right wing of
a political scene that has a strong tendency towards instability and fragmentation.
In Bulgaria in 2001 the explosion of support for a newly created party of the former
Tsar Symeon (National Movement) has totally demolished the relatively stable political
scene.
Hungary and Estonia seem to be the most stable. It is interesting that three of the
four parties identified by Swianiewicz and Clark (1996) as the most frequently repre-
sented in local councils in 1991 are still among the strongest political groups in 2002.
(The fourth, currently among the strongest, is the post-communist MSzP, which was
also the sixth largest among the councilors in 1991). But this does not mean that the
picture has remained unchanged for over ten years. Apart from the growth of support
for MSzP, we also witnessed a radical consolidation of the center-right. In 1994 there
were four center-right parties in the Hungarian Parliament, each having between 7%
and 12% support, while in 2002 the scene was clearly dominated by one group—the
FIDESZ—with over 40% support (Fowler 2003). On the other hand the Christian
Democratic KDNP, which was relatively strong ten years ago, completely disintegrated
and disappeared from the political scene (C. Nikolenyi 2003).
For a long time Estonia might have been seen as the most stable among the countries
that are the focus of our analysis. The list of “strongest parties” has been quite stable,
and volatility indices have been clearly below CEE averages (Sikk 2003). However, the
appearance of a strong new party—“Res Publica”—in the 2003 parliamentary elections
seems to undermine the prior relative persistence of the party system (Sikk 2003). It
should be added, however, that “Res Publica” had existed for a long time; during the
1990s it had connections to other political parties (Pro Patria and the Reform Party), and
2003 was just its first strong appearance as an independent player in the election game.
48
F A C E S O F L O C A L D E M O C R A C Y
The older roots of “Res Publica” did not prevent it from basing its election campaign
on anti-establishment rhetoric.
While these observations concern central level politics, much less is known about
the parties in local governments. Table 1.17 lists the parties that are included in our
analysis. Membership of these parties in internationals, indicated in the right column,
should help us in establishing the parties’ ideological profile, which we will later compare
to the councilors’ values as declared in the IDLG survey.
Looking first at the age of the councilors, we find that the average varies from 45
to 51 years. Those who are party members are usually a bit older than the independent
councilors. Post-communist parties (the BSP in Bulgaria, the MSzP in Hungary, and
the SDL in Slovakia) usually have older than average members. The youngest parties
are those that evolved from the youth opposition movement like FIDESZ in Hungary
and the recently established Res Publica in Estonia. (In FIDESZ, the average member-
councilor is over ten years younger than his or her colleagues in other parties.)
The share of female councilors varies from below 20% in Bulgaria, Hungary, and
Poland to slightly over 30% in Estonia. But there are more women among independent
than among party councilors. In Poland the share of female councilors is more or less
even across parties, unlike Hungary, where FIDESZ and MDF have a very low rate of
women councilors (only 6% and 8%, respectively). Other highly masculinized parties
are the Bulgarian BANU and MRF parties and the Estonian Pro Patria (with only one
woman among 33 councilors!).
The proportion of councilors with a university degree is lowest in Slovakia (38%)
and highest in Bulgaria (79%). This variation can probably be explained by the extent
of territorial fragmentation, as councilors in big municipalities are often more educated
than those in small, rural villages. In Hungary and Poland party councilors usually have
a higher level of education than the independents. But the opposite is true in Bulgaria,
and in Slovakia or Estonia there is no statistically significant relationship. Not surpris-
ingly, a low level of education can be found in agrarian political groups and those of
the national minorities.
Before turning to the subject of political culture, we will look at the characteristics
of councilors who are members or supporters of individual political parties. Table 1.17
presents a summary of the demographic variation of supporters of the main parties in
the analyzed countries.
The picture changes when we look at respondents who are sympathetic toward but
not members of various political parties. Different demographic variables are significant
in different countries. In Bulgaria, Estonia, and Hungary, support for parties is related
to age—particular parties are supported by older or younger councilors and there are
only a few for which this variable is not important. Hungary is also the only country
in which gender is relevant: the Socialists (MSzP) and Liberals (SzDSz) are supported
more often by women than by men.
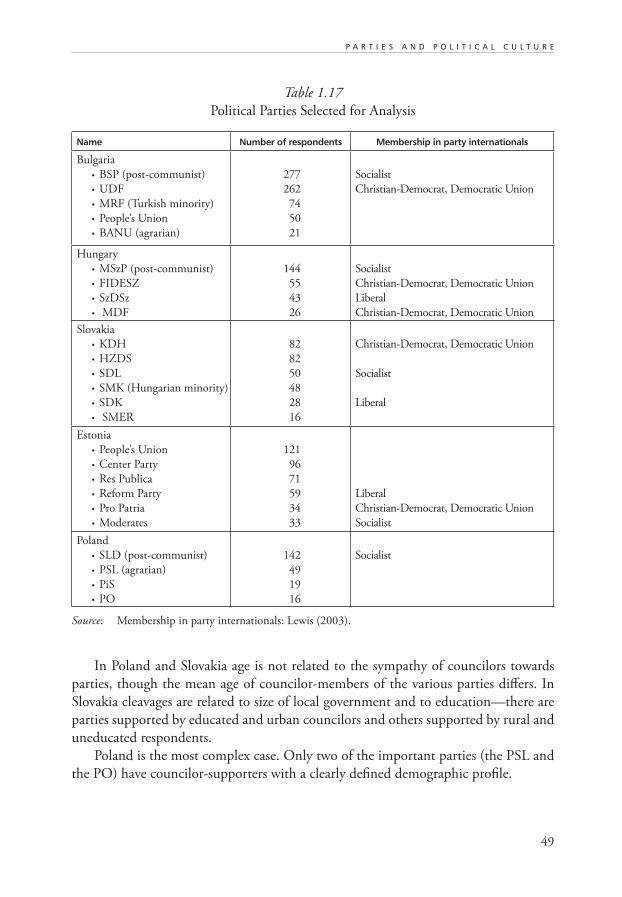
49
P A R T I E S A N D P O L I T I C A L C U L T U R E
Table 1.17
Political Parties Selected for Analysis
Name Number of respondents Membership in party internationals
Bulgaria
• BSP (post-communist)
• UDF
• MRF (Turkish minority)
• People’s Union
• BANU (agrarian)
277
262
74
50
21
Socialist
Christian-Democrat, Democratic Union
Hungary
• MSzP (post-communist)
• FIDESZ
• SzDSz
• MDF
144
55
43
26
Socialist
Christian-Democrat, Democratic Union
Liberal
Christian-Democrat, Democratic Union
Slovakia
• KDH
• HZDS
• SDL
• SMK (Hungarian minority)
• SDK
• SMER
82
82
50
48
28
16
Christian-Democrat, Democratic Union
Socialist
Liberal
Estonia
• People’s Union
• Center Party
• Res Publica
• Reform Party
• Pro Patria
• Moderates
121
96
71
59
34
33
Liberal
Christian-Democrat, Democratic Union
Socialist
Poland
• SLD (post-communist)
• PSL (agrarian)
• PiS
• PO
142
49
19
16
Socialist
Source: Membership in party internationals: Lewis (2003).
In Poland and Slovakia age is not related to the sympathy of councilors towards
parties, though the mean age of councilor-members of the various parties differs. In
Slovakia cleavages are related to size of local government and to education—there are
parties supported by educated and urban councilors and others supported by rural and
uneducated respondents.
Poland is the most complex case. Only two of the important parties (the PSL and
the PO) have councilor-supporters with a clearly defined demographic profile.
50
F A C E S O F L O C A L D E M O C R A C Y
Two further questions are of interest here: (1) to what extent are members of political
parties rooted in the communist system, and (2) what is the level of their modernization.
The communist roots factor is measured by the number of members of political
parties before 1990, the number holding an official position in a political party before
1990, and the number of councilors before 1990. To analyze the variation between
parties, we relate the communist roots factor to a national average. If the value is lower
than 1, the role of communist roots among party members is lower than the average
in the country; if it is higher than 1, then the members of that party have more com-
munist roots.13
Membership in parties before 1990 is most frequently reported by members of
“post-communist”groups, although this relationship is much weaker in the Polish SLD
than in the Bulgarian BSP, Hungarian MSzP, or Slovak SD. Over 70% of BSP or MSzP
members stated that they had belonged to “old” parties before 1990. Many members of
former parties are also found in agrarian groups—the Polish PSL and Bulgarian BANU.
One should remember that both agrarian parties existed before 1990 as satellites of
communist, but formally independent parties.
The extent of communist roots is fairly uniform in Estonia. This may reflect the
difference between the communist system in the Soviet Union and in satellite countries
(especially in ones like Poland or Hungary) where some amount of democratic opposition
could exist and party membership was slightly less of a sine qua non for holding public
office. In all countries except Estonia, left-wing means more rooted in the communist
system (see table 1.22).
Finally, we characterize political parties through the “modernism” of local coun-
cilors. The modernism index is measured by three variables: education, e-mail use, and
Internet use.14
Estonian councilors are the most frequent users of e-mail and the Internet. In Hun-
gary, Poland, and Slovakia usage of e-mail and the Internet is more frequent among party
members than independent councilors, but in Bulgaria or Estonia no such relationship
could be found (see table 1.19).
Computer usage is usually strongly correlated with level of education, although the
SMK party in Slovakia is an exception, having a relatively low level of education but a
high ratio of e-mail usage. In general, however, parties having less educated councilors
lag behind even more in the use of e-mail. This relationship is clear both in countries
where Internet use by councilors is not common (e.g., Bulgaria, Poland, and Slovakia),
and in Estonia, where as many as 58% councilors’ declare they have access to the Internet
(although 45% of members of the Moderate Party and 47% of those in the People’s
Union report using it). In the Polish PSL 10% of members use the Internet while the
national average is over 30%; in the Slovak HZDS the figure is 13% compared to the
Slovak average of 32%; and in the Bulgarian MRF 13% and the BANU 17% compared
to an average for Bulgarian councilors of 28%.
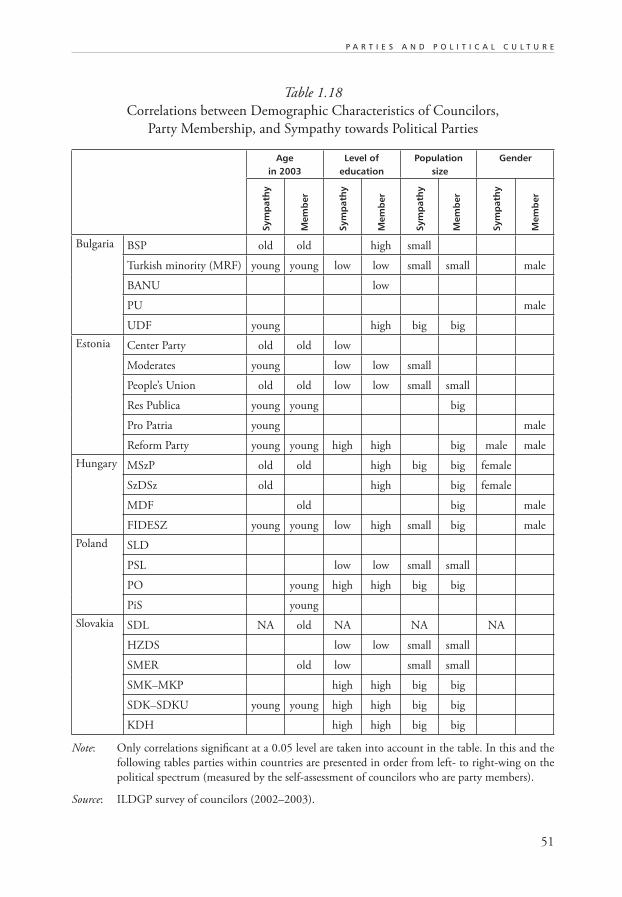
51
P A R T I E S A N D P O L I T I C A L C U L T U R E
Table 1.18
Correlations between Demographic Characteristics of Councilors,
Party Membership, and Sympathy towards Political Parties
Age in 2003
Level of education
Population size
Gender
Sym
pat
hy
Mem
ber
Sym
pat
hy
Mem
ber
Sym
pat
hy
Mem
ber
Sym
pat
hy
Mem
ber
Bulgaria BSP old old high small
Turkish minority (MRF) young young low low small small male
BANU low
PU male
UDF young high big big
Estonia Center Party old old low
Moderates young low low small
People’s Union old old low low small small
Res Publica young young big
Pro Patria young male
Reform Party young young high high big male male
Hungary MSzP old old high big big female
SzDSz old high big female
MDF old big male
FIDESZ young young low high small big male
Poland SLD
PSL low low small small
PO young high high big big
PiS young
Slovakia SDL NA old NA NA NA
HZDS low low small small
SMER old low small small
SMK–MKP high high big big
SDK–SDKU young young high high big big
KDH high high big big
Note: Only correlations significant at a 0.05 level are taken into account in the table. In this and the
following tables parties within countries are presented in order from left- to right-wing on the
political spectrum (measured by the self-assessment of councilors who are party members).
Source: ILDGP survey of councilors (2002–2003).
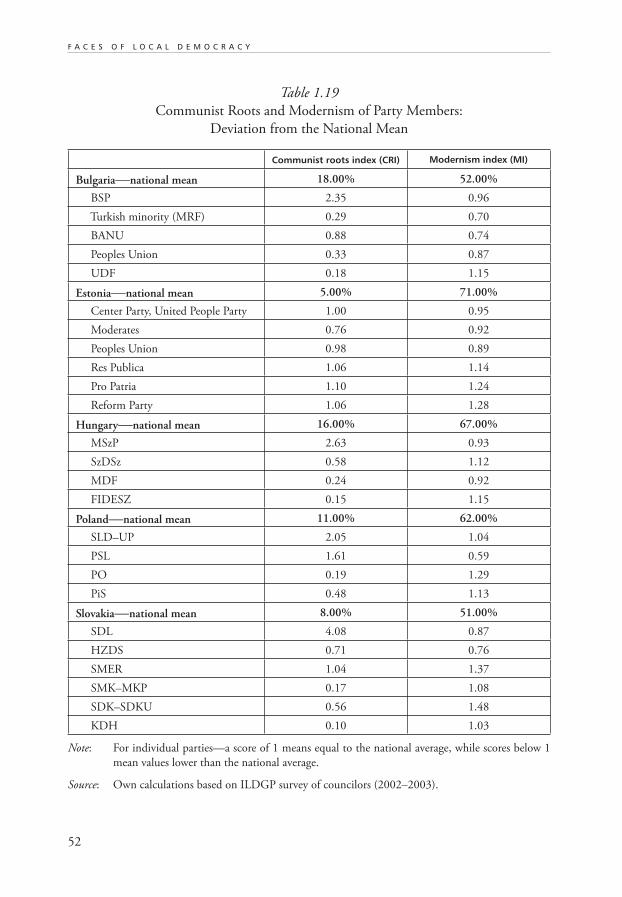
52
F A C E S O F L O C A L D E M O C R A C Y
Table 1.19
Communist Roots and Modernism of Party Members:
Deviation from the National Mean
Communist roots index (CRI) Modernism index (MI)
Bulgaria—national mean 18.00% 52.00%
BSP 2.35 0.96
Turkish minority (MRF) 0.29 0.70
BANU 0.88 0.74
Peoples Union 0.33 0.87
UDF 0.18 1.15
Estonia—national mean 5.00% 71.00%
Center Party, United People Party 1.00 0.95
Moderates 0.76 0.92
Peoples Union 0.98 0.89
Res Publica 1.06 1.14
Pro Patria 1.10 1.24
Reform Party 1.06 1.28
Hungary—national mean 16.00% 67.00%
MSzP 2.63 0.93
SzDSz 0.58 1.12
MDF 0.24 0.92
FIDESZ 0.15 1.15
Poland—national mean 11.00% 62.00%
SLD–UP 2.05 1.04
PSL 1.61 0.59
PO 0.19 1.29
PiS 0.48 1.13
Slovakia—national mean 8.00% 51.00%
SDL 4.08 0.87
HZDS 0.71 0.76
SMER 1.04 1.37
SMK–MKP 0.17 1.08
SDK–SDKU 0.56 1.48
KDH 0.10 1.03
Note: For individual parties—a score of 1 means equal to the national average, while scores below 1
mean values lower than the national average.
Source: Own calculations based on ILDGP survey of councilors (2002–2003).
53
P A R T I E S A N D P O L I T I C A L C U L T U R E
Members of post-communist parties are usually less “modernized” than the national
average, but the Polish SLD is an exception to this rule. In general, right-wing coun-
cilors score higher on the scale of modernism in Slovakia, Estonia, and Bulgaria, while
in Hungary and Poland there is no statistically significant relationship.
6.2 Self-identification on the Left-Right Axis
An analysis of councilors’ ideology should begin with their own stated location on the
left-right political spectrum. Whether or not these terms adequately characterize the
present political arena in Central and Eastern Europe cannot be discussed at length here,
but it should be noted that quite often the meaning of “left-wing” and “right-wing” in
CEE countries is different from the traditional interpretation based on the 19th century
experience of European parliamentary systems. In this region of Europe, the terms left
and right arise from a different context and different political debates.
For this reason we do not treat the terms as archetypical conglomerates of values, but
as terms from the history of political ideas—terms that are learnt by people in the same
way as other abstract terms and definitions. In Central and Eastern Europe the learning
of these terms took place in a very concrete historical context, and their meaning was
often the subject of political battles involving media and political groups.
In most of the analyzed countries, the terms left and right are used to distinguish
between two main blocks: (1) post-communist, and (2) groups arising from the demo-
cratic opposition active during the communist period. Data from Bulgaria, Hungary,
Poland, and Slovakia clearly support this observation. In all of these countries there
is also a significant correlation between membership in political parties before 1990
and present left-wing self-location. Members of post-communist groups (the BSP in
Bulgaria, MSzP in Hungary, SLD in Poland, and SDL in Slovakia) are those who most
often declare themselves as leftist, and this identification is much stronger than in any
other party. It is a paradox that members of small parties who use “socialist” or “social-
democratic” labels in their names, and whose program is often much more radical than
that of post-communist groups, usually declare themselves centrist rather than leftist.
The Bulgarian data provide a good example: in the case of Bulgarian Social Democracy,
twelve of fourteen respondents declare themselves as centrist, not left, and nine out of
ten in the Bulgarian Social Democratic Party declare themselves to be centrist. In the
Polish Unia Pracy (Labour Union) the number is three out of four.
We are not claiming that post-communist parties are not leftist (the ideological
content of individual parties will be discussed later), but we want to point out what the
popular meaning of the term actually entails.
But the use of leftist rhetoric by post-communist parties is not a “historical neces-
sity.” In Estonia, the term leftist has been strongly linked to communism and Soviet
54
F A C E S O F L O C A L D E M O C R A C Y
dictatorship. Consequently, the party established by former members of the communist
“nomenclatura” in Estonia is called the “Center Party” (Raun 1997; Kuczynski 2003)
and councilors who are members of that party declare themselves as centrist. Ironically,
in spite of the name of the party they are more leftist than other councilors in Estonia.
The unwillingness to use the term “left” in Estonia is a very clear difference between
Estonia and the other analyzed countries. In the remaining four countries the percent-
age of leftist councilors varies from 19% to 30%, but in Estonia it is only 5% (see table
1.20)! As we will demonstrate, this verbal resistance to the label of “leftist” is often but
not always correlated with more liberal economic programs.
There is a strong correlation between self-location and membership in a particular
party. The general rule is that most councilors prefer not to choose the extreme val-
ues on our scale (with the exception of Bulgaria). The tendency towards self-location
in the center is most visible in Estonia and is clearly related to the negative attitude
towards the term “left.” As we can see in table 1.20, the proportion of Estonian
respondents choosing rightist affiliation is not significantly higher than in other countries.
Although the mean value is the highest (most “rightist”) in Estonia, the highest number
of respondents clearly declaring their rightist location is found in Bulgaria. The center
location is also a very frequent choice in Poland. We tend to relate this phenomenon
to the deep crisis recently experienced for various reasons by leading leftist and rightist
political parties in Poland.
As for leftist values, Hungary is the country with the highest number of councilors
declaring such values. As we will show later, the Hungarian left wing presents the most
coherent set of values. Hungary is the only country in which more respondents declare
left- than right-wing political affiliation.
Table 1.20 also indicates that centrist affiliation is most often chosen by non-party
members. This indirectly supports our claim that self-location on the left or right wing of
politics is less an expression of opinions on social or economic issues, and more a declara-
tion of support for one or another of the dominant political groups. If we are right, a
declaration of being in the center may simply mean unwillingness to choose between the
main political parties. We assume that this logic lies behind the choices of the Turkish
minority in Bulgaria (74% of those in the Movement for Rights and Freedom choose
the center option), or of members of the populist protest party Samoobrona in Poland
(all four members in our sample declare themselves as centrist). For various reasons,
members of these groups want to show that they are far from both the post-communist
left and their main opponents, the rightist parties. Several small parties also follow this
rule. In Estonia such a relationship is not evident, but it is easy to understand why—if
all major political parties locate themselves in the center, then demonstrating independ-
ence through a specific location on the left-right political axis makes little sense.
The relationship between party membership and left-right self-location is very clear
in Bulgaria. As previously observed, it is a country with a very high level of party mem-
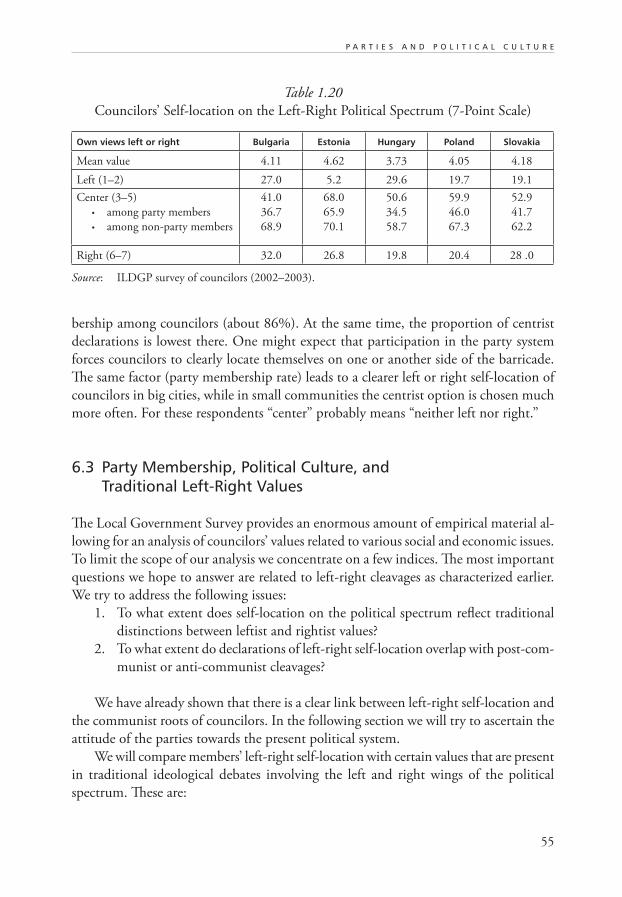
55
P A R T I E S A N D P O L I T I C A L C U L T U R E
Table 1.20
Councilors’ Self-location on the Left-Right Political Spectrum (7-Point Scale)
Own views left or right Bulgaria Estonia Hungary Poland Slovakia
Mean value 4.11 4.62 3.73 4.05 4.18
Left (1–2) 27.0 5.2 29.6 19.7 19.1
Center (3–5)
• among party members
• among non-party members
41.0
36.7
68.9
68.0
65.9
70.1
50.6
34.5
58.7
59.9
46.0
67.3
52.9
41.7
62.2
Right (6–7) 32.0 26.8 19.8 20.4 28 .0
Source: ILDGP survey of councilors (2002–2003).
bership among councilors (about 86%). At the same time, the proportion of centrist
declarations is lowest there. One might expect that participation in the party system
forces councilors to clearly locate themselves on one or another side of the barricade.
The same factor (party membership rate) leads to a clearer left or right self-location of
councilors in big cities, while in small communities the centrist option is chosen much
more often. For these respondents “center” probably means “neither left nor right.”
6.3 Party Membership, Political Culture, and Traditional Left-Right Values
The Local Government Survey provides an enormous amount of empirical material al-
lowing for an analysis of councilors’ values related to various social and economic issues.
To limit the scope of our analysis we concentrate on a few indices. The most important
questions we hope to answer are related to left-right cleavages as characterized earlier.
We try to address the following issues:
1. To what extent does self-location on the political spectrum reflect traditional
distinctions between leftist and rightist values?
2. To what extent do declarations of left-right self-location overlap with post-com-
munist or anti-communist cleavages?
We have already shown that there is a clear link between left-right self-location and
the communist roots of councilors. In the following section we will try to ascertain the
attitude of the parties towards the present political system.
We will compare members’ left-right self-location with certain values that are present
in traditional ideological debates involving the left and right wings of the political
spectrum. These are:
56
F A C E S O F L O C A L D E M O C R A C Y
• Market individualism (MI). After Clark and Swianiewicz (1996, 144) indi-
vidualism (as opposed to collectivism) is defined here as support for political
conditions that maximize the ability of all citizens to realize their private wishes...
Market individualism involves support for minimal government intervention in
private economic transactions. The index of MI is calculated as the sum of the
answers to three questions illustrating the attitude towards public ownership
in the economy.
• Social individualism (SI), according to the definition of Clark and Swianiewicz,
is related to the freedom to attain more subjective, qualitative goals in the non-eco-
nomic arena… social individualism emphasizes freedom of speech, press, assembly,
religion and the liberty to make personal lifestyle choices (144). In our analysis SI is
an index based on three variables related to: (1) special protection of minorities,
(2) acceptance of freedom of speech on controversial issues, and (3) tolerance
towards extremist groups. The first of the three variables may raise some doubts,
since it is non-correlated (and in some countries even negatively correlated) with
the remaining two. But we suggest that it reflects a well-known controversy
related to the idea of “freedom for the enemies of freedom.” Nevertheless, all
three variables comprising the index are clearly related to universal values that
can be easily considered social individualism. It is more difficult to relate this
index to left-right cleavages than it is for market individualism or egalitarian-
ism. On the one hand, Lipset (1981) provides arguments that “protection of
minorities” is more often a feature of leftist parties, and members of minor-
ity groups vote often for left-wing parties. Also, some extreme rightist groups
sometimes advocate censorship in controversial issues. On the other hand, in
the CEE context of the last half-century, censorship and lack of social tolerance
have been ascribed instead to left-wing politicians.
• Egalitarianism (E) is defined after Clark and Swianiewicz (1996, 144) as a sup-
port for the use of government to equalize social, economic and political outcomes
among all citizens... Egalitarians favor extensive government regulation of market
transactions and extensive social service spending. The index of E is obtained from
the sum of answers on two questions related to the distribution of personal
income and the redistributive role of the state.
• (non)Paternalism/Populism (P). Paternalism involves support for the insti-
tutionalization of mediating structures between citizens and the executors of
political decisions (Clark and Swianiewicz 1996, 144). Populism, the opposite, is
understood as directly and decisively referring to the voters’ will in any decision-
making. The P index is calculated as the sum of support for the following
opinions: (1) decisions should be based on the opinions of experts, (2) the wide
participation of citizens in decision-making leads to unnecessary conflicts and
loss of time, and (3) in the case of conflict between the opinion of a councilor
57
P A R T I E S A N D P O L I T I C A L C U L T U R E
and of the majority of voters, the respondent would use his or her own judg-
ment and would not follow the opinion of voters. The latter variable is clearly
related to one of the classic dilemmas in the theory of representative democracy
(see, for example, Pitkin 1972). This dilemma may be summarized briefly as
mandate doctrine (the representative must do what his/ her principal would do, and
must act as if the principal himself/herself were acting-- Pitkin 1972, 144) versus
independence doctrine (the representative as a free agent, a trustee, an expert who is
best left alone to do his/her work—Pitkin 1972, 147). This is another dimension,
along with social individualism, that is more difficult to relate to the traditional
left-right dimension. But one may expect that left-wing parties would represent
paternalist values more often than their right-wing colleagues, at least in the
Central and East European context.
Also, in case there are contradictions between councilors’ abstract verbal declarations
and their attitudes towards the practical issues they happen to be confronted with, we analyze
the extent to which their market individualism translates into practical opinions on:
• The contracting out of services for which local governments are responsible.
We are also interested in the attitude of local party members towards the general di-
rection of political changes during the last decade. Therefore, we created an index of:
• Acceptance for the new political system. This index describes approval for the
general direction of changes in Central and Eastern Europe. Citizens of Central
and Eastern Europe have experienced a long period of governments with a very
low level of political legitimacy. But in the democratic system, general accept-
ance of the direction of the most important changes is a very important factor
influencing the performance of the political system. We try to measure this
level of acceptance through three indicators: (1) acceptance of the democratic
system, (2) a comparison of the performance of present local governments with
communist local administrations, and (3) approval for European integration.
Most of the variables were measured on a seven-point scale and the rest were con-
verted to the same scale. We recoded some of them in such a way that a positive value
will always mean more liberal choices (i.e., market or social individualist, non-egalitarian,
and non-paternalist) and higher acceptance for political transformation, while negative
values mean support for state intervention, paternalism, and lack of support for general
changes in CEE. We may also expect that high values in the indices will coincide with a
right-wing location and lower values with a left-wing orientation. However, as explained
above, in the case of social individualism and paternalism/populism this relationship
is less obvious than it is for market individualism, contracting out, egalitarianism, or
system acceptance.
58
F A C E S O F L O C A L D E M O C R A C Y
Table 1.21 presents a summary of the results. Taking into account popular opinion
on the incoherent character of ideological differences between parties, the scores for
market individualism are surprisingly consistent with left-right self-location. At the level
of countries, Hungarian councilors declare themselves to be the most leftist and they are
also the least market individualist. Estonians, who are closest to the right wing of the
political spectrum, are second in market individualism (after Bulgarian councilors).
Table 1.22 shows that the correlation between the two indices is statistically sig-
nificant in all five countries, with the highest occurring in Bulgaria and Slovakia. Only
in Hungary (where it is the weakest) is it not significant at the 0.01 level. In Hungary
we also find the only examples where councilors from the party declaring a radical
right-wing orientation are leftist in their market orientation (FIDESZ), and also the
opposite—councilors from the SzDSz party, located left-of-center, are radical market
individualists (in the Hungarian context). Post-communist parties (the BSP, SLD, and
SDL parties) that are the furthest left in their countries also have below-average scores
on market individualism. The only exception comes again from Hungary—where post-
communist MSzP councilors declare themselves to be radically left, but their score on
market individualism is just above the national average.
But on the issue of the contracting out of local services—a practical test of readi-
ness to implement market values—the picture is less coherent. Bulgarian councilors
who declare the most radical market-individualist values are the most sceptical about
contracting out. Estonians, who in their self-assessment are by far the most distant from
the left wing, are just after Bulgarian councilors in opposing market solutions in urban
services. The opposite is true of Hungarian local politicians, who support privatization
of urban services even though they are sceptical of market values in general and declare
themselves to be leftist more often than respondents from the other countries.
The variation is just slightly more coherent when we consider individual countries
separately. In Bulgaria, Estonia, and Poland the correlation between left-right self-lo-
cation and support for contracting out is statistically significant. But this relationship
exists in neither Hungary nor Slovakia. In Hungary, councilors from the rather leftist
SzDSz are the strongest supporters of the privatization of urban services, while rightist
councilors in the MDF are the most frequent opponents. The leftist MSzP is above the
average national score of this index, and also above the score of the most right-wing
of the analyzed parties, FIDESZ. In Slovakia, although the two parties with the most
declared supporters of contracting out are the rightist SDK and KDH parties, the third
in the rank is the post-communist and leftist SDL.
An anti-market attitude does not seem to be most typical for post-communist groups.
In Slovakia the most anti-liberal in economic terms is the Slovak SDL, but the HZDS
is not much different. In Poland, the agrarian PSL is more radically anti-market than
the post-communist SLD. In Hungary, MSzP support for market solutions is clearly
above the national average, while rightist FIDESZ is closer to the opposite extreme. The
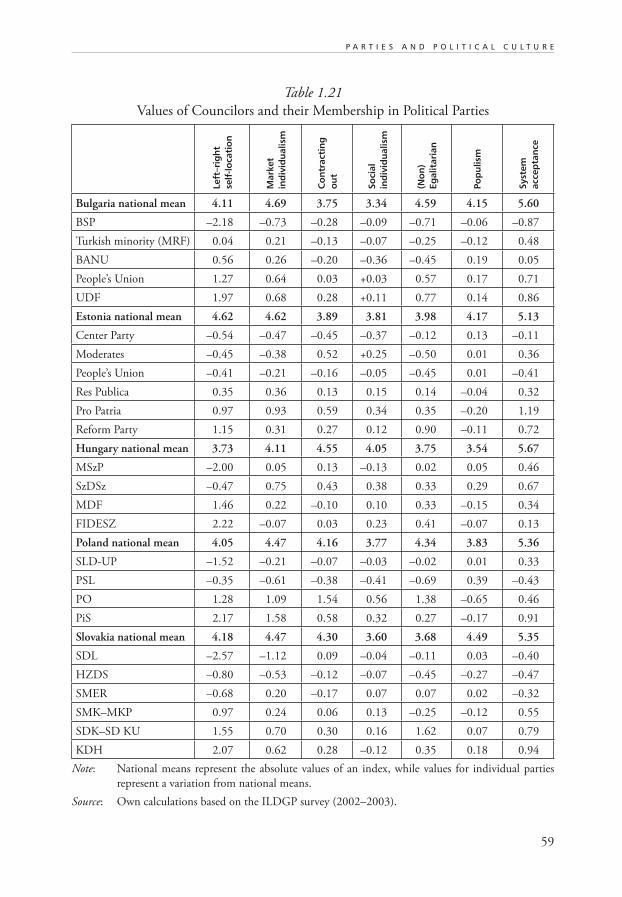
59
P A R T I E S A N D P O L I T I C A L C U L T U R E
Table 1.21
Values of Councilors and their Membership in Political Parties
Left
–rig
ht
self
-lo
cati
on
Mar
ket
ind
ivid
ual
ism
Co
ntr
acti
ng
o
ut
Soci
al
ind
ivid
ual
ism
(No
n)
Egal
itar
ian
Pop
ulis
m
Syst
em
acce
pta
nce
Bulgaria national mean 4.11 4.69 3.75 3.34 4.59 4.15 5.60
BSP –2.18 –0.73 –0.28 –0.09 –0.71 –0.06 –0.87
Turkish minority (MRF) 0.04 0.21 –0.13 –0.07 –0.25 –0.12 0.48
BANU 0.56 0.26 –0.20 –0.36 –0.45 0.19 0.05
People’s Union 1.27 0.64 0.03 +0.03 0.57 0.17 0.71
UDF 1.97 0.68 0.28 +0.11 0.77 0.14 0.86
Estonia national mean 4.62 4.62 3.89 3.81 3.98 4.17 5.13
Center Party –0.54 –0.47 –0.45 –0.37 –0.12 0.13 –0.11
Moderates –0.45 –0.38 0.52 +0.25 –0.50 0.01 0.36
People’s Union –0.41 –0.21 –0.16 –0.05 –0.45 0.01 –0.41
Res Publica 0.35 0.36 0.13 0.15 0.14 –0.04 0.32
Pro Patria 0.97 0.93 0.59 0.34 0.35 –0.20 1.19
Reform Party 1.15 0.31 0.27 0.12 0.90 –0.11 0.72
Hungary national mean 3.73 4.11 4.55 4.05 3.75 3.54 5.67
MSzP –2.00 0.05 0.13 –0.13 0.02 0.05 0.46
SzDSz –0.47 0.75 0.43 0.38 0.33 0.29 0.67
MDF 1.46 0.22 –0.10 0.10 0.33 –0.15 0.34
FIDESZ 2.22 –0.07 0.03 0.23 0.41 –0.07 0.13
Poland national mean 4.05 4.47 4.16 3.77 4.34 3.83 5.36
SLD-UP –1.52 –0.21 –0.07 –0.03 –0.02 0.01 0.33
PSL –0.35 –0.61 –0.38 –0.41 –0.69 0.39 –0.43
PO 1.28 1.09 1.54 0.56 1.38 –0.65 0.46
PiS 2.17 1.58 0.58 0.32 0.27 –0.17 0.91
Slovakia national mean 4.18 4.47 4.30 3.60 3.68 4.49 5.35
SDL –2.57 –1.12 0.09 –0.04 –0.11 0.03 –0.40
HZDS –0.80 –0.53 –0.12 –0.07 –0.45 –0.27 –0.47
SMER –0.68 0.20 –0.17 0.07 0.07 0.02 –0.32
SMK–MKP 0.97 0.24 0.06 0.13 –0.25 –0.12 0.55
SDK–SD KU 1.55 0.70 0.30 0.16 1.62 0.07 0.79
KDH 2.07 0.62 0.28 –0.12 0.35 0.18 0.94
Note: National means represent the absolute values of an index, while values for individual parties
represent a variation from national means.
Source: Own calculations based on the ILDGP survey (2002–2003).
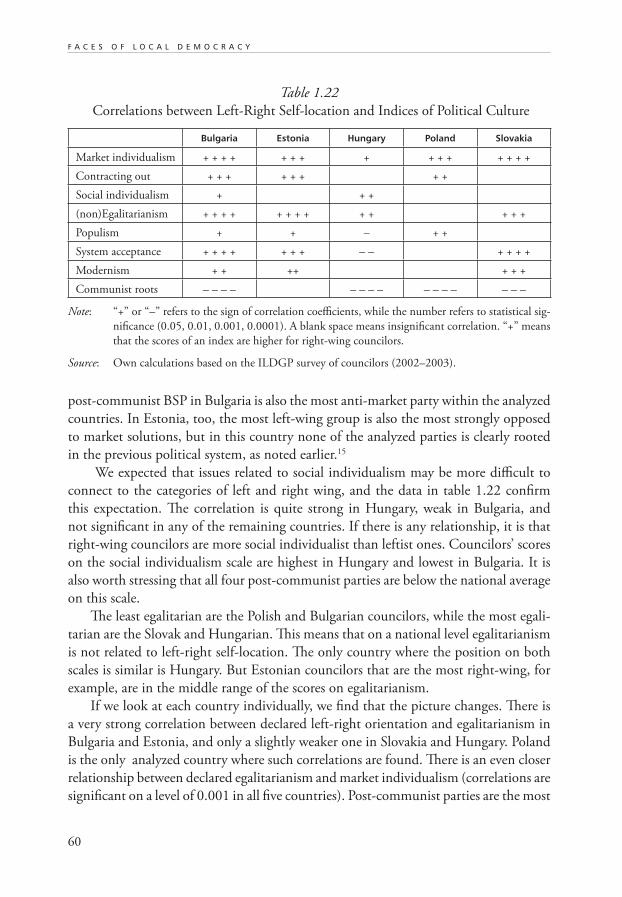
60
F A C E S O F L O C A L D E M O C R A C Y
post-communist BSP in Bulgaria is also the most anti-market party within the analyzed
countries. In Estonia, too, the most left-wing group is also the most strongly opposed
to market solutions, but in this country none of the analyzed parties is clearly rooted
in the previous political system, as noted earlier.15
We expected that issues related to social individualism may be more difficult to
connect to the categories of left and right wing, and the data in table 1.22 confirm
this expectation. The correlation is quite strong in Hungary, weak in Bulgaria, and
not significant in any of the remaining countries. If there is any relationship, it is that
right-wing councilors are more social individualist than leftist ones. Councilors’ scores
on the social individualism scale are highest in Hungary and lowest in Bulgaria. It is
also worth stressing that all four post-communist parties are below the national average
on this scale.
The least egalitarian are the Polish and Bulgarian councilors, while the most egali-
tarian are the Slovak and Hungarian. This means that on a national level egalitarianism
is not related to left-right self-location. The only country where the position on both
scales is similar is Hungary. But Estonian councilors that are the most right-wing, for
example, are in the middle range of the scores on egalitarianism.
If we look at each country individually, we find that the picture changes. There is
a very strong correlation between declared left-right orientation and egalitarianism in
Bulgaria and Estonia, and only a slightly weaker one in Slovakia and Hungary. Poland
is the only analyzed country where such correlations are found. There is an even closer
relationship between declared egalitarianism and market individualism (correlations are
significant on a level of 0.001 in all five countries). Post-communist parties are the most
Table 1.22
Correlations between Left-Right Self-location and Indices of Political Culture
Bulgaria Estonia Hungary Poland Slovakia
Market individualism + + + + + + + + + + + + + + +
Contracting out + + + + + + + +
Social individualism + + +
(non)Egalitarianism + + + + + + + + + + + + +
Populism + + – + +
System acceptance + + + + + + + – – + + + +
Modernism + + ++ + + +
Communist roots – – – – – – – – – – – – – – –
Note: “+” or “–” refers to the sign of correlation coefficients, while the number refers to statistical sig-
nificance (0.05, 0.01, 0.001, 0.0001). A blank space means insignificant correlation. “+” means
that the scores of an index are higher for right-wing councilors.
Source: Own calculations based on the ILDGP survey of councilors (2002–2003).
61
P A R T I E S A N D P O L I T I C A L C U L T U R E
egalitarian in their countries. This is very clear in Bulgaria and Slovakia. In Poland, the
SLD follows the agrarian PSL in this respect, but the scores of both parties are higher
than the national average. Hungary is a special case. The MSzP score on the egalitarian-
ism index is the lowest of the parties analyzed, but all parties have positive scores (i.e.,
above the national average). This suggests that the remaining councilors (independent
or belonging to small parties of marginal importance on the national level) are much
more egalitarian than those from the four “establishment” parties. A similar phenom-
enon shows up in the analysis of Hungarian scores on market individualism and the
acceptance of system changes (discussed below).
Slovakia is the highest on the populism scale, while Hungary and Poland are at
the other extreme (paternalism). This dimension is only loosely connected to left-wing
self-location. In Poland and to a much lesser extent in Bulgaria and Estonia, rightist
councilors are also more populist. In Hungary the correlation goes in the opposite direc-
tion, although it is weak. Inter-party differences are the strongest in Poland, where the
agrarian PSL is the most populist, while the liberal PO is at the other extreme. On the
populism index, the PO also has the lowest score among all 25 parties analyzed.
Finally, we attempt to measure the level of general acceptance for the direction of
political and economic transformation (the last column of table 1.21). The index may
help us to see whether there is a real consensus on the general direction of system evolu-
tion and to identify parties whose attitude differs from that general consensus.
In general, our data suggest that the support for changes is quite high. In each of the
countries the average score is above five on a one-to-seven scale. The consensus is broadest
in Hungary—the mean value of the index is the highest, and the standard deviation of
answers is very low. Also, the standard deviation of answers within individual parties is
low, which means that there is a high homogeneity of opinions within parties.
The second country with a high level of consensus (low standard deviation of an-
swers) is Estonia. At the same time, Estonia is the country with the lowest mean value
on the system acceptance index. This is related to a very low level of acceptance for Eu-
ropean integration (the average opinion is just above neutral and the value for the most
enthusiastic party on this issue—Pro Patria—is below six on the one-to-seven scale).
The situation in the remaining countries seems to generate more potential conflicts.
In these countries the standard deviation of answers is much higher—from 1.82 in
Bulgaria to almost 1.95 in Poland and Slovakia. In Bulgaria, the post-communist BSP
questions the direction of changes the most often. BSP members question the view that
present local governments work better than the former communist administration, but
they are also sceptical on other issues.
In Poland both the post-communist SLD and groups rooted in the former demo-
cratic opposition accept the most important system changes. But this consensus is not
shared by the agrarian PSL nor by members of small, “other” parties (which are not
presented in our summary tables). In the latter case the index has a negative value, i.e.,
62
F A C E S O F L O C A L D E M O C R A C Y
more councilors have a negative than positive attitude towards the direction of system
changes. This means that in Poland, more clearly than in other analyzed countries, we
can identify the opposition, which is reflected in the party system (although not in the
mainstream parties) and which questions the general direction of changes in Central
and Eastern Europe.
Hungary is another country in which a post-communist party (MSzP) accepts the
main directions of political transformation. As in Poland, Hungarian councilors who
are either independent or belong to small “other” parties are much more critical in their
evaluation of system changes than local politicians from the main “establishment parties.”
(But as mentioned above, the general acceptance of systemic changes in Hungary is much
higher than in Poland, and consequently this anti-system opposition has a less radical
character—the average score for “others” and “independents” is just above neutral.)
In Slovakia the index of system acceptance and measures of homogenity have even
lower values. But political cleavages take a different shape. The specificity of Slovakia is
due to the presence of a very strong party (HZDS) which questions, to a large extent,
the general direction of changes. Another party with a clearly critical attitude is the
post-communist SDL. In different ways, in both Poland (PSL) and Slovakia (HZDS
and SDL) the anti-system opposition is clearly reflected by the party system.
Generally speaking, the index of system acceptance has the highest values in parties
rooted in the former democratic opposition or in currently governing parties such as
the post-communist parties in Hungary and Poland. Being in power and not in op-
position, it is much easier for them to accept system changes. In parties having roots in
the former system the acceptance is much lower, especially if those parties are now in
opposition (e.g., the BSP in Bulgaria or the SDL in Slovakia).
In such circumstances, the shape of the relationship between left-right self-location
and general acceptance of systemic changes should not be surprising. As we can see in
table 1.22, there is much stronger support for changes among right-wing councilors
in Bulgaria, Estonia, and Slovakia. But there is no such relationship in Poland, and an
opposite correlation in Hungary.
6.4 Typology of Parties’ Political Culture
The typology of parties (viewed through the declarations of their councilor-members)
is based on the indices discussed above, using Ward’s hierarchical cluster analysis. To
minimize the impact of country specific factors, we took into account each party’s
variation from the national average (e.g., how much lower or higher from the national
average the index of market individualism for a given party is).
Before we discuss in detail the results of the typology, we should make one important
methodological observation. Ward’s cluster analysis method (as any other formal typology
63
P A R T I E S A N D P O L I T I C A L C U L T U R E
method) produces classes that are relatively homogenous (i.e., differences within group
members are lower than between groups), but that does not mean that all the charac-
teristics of a group mean are always true for every group member. Analysis of intra- and
inter-group standard deviations suggests that the results of our typology reflect very well
the differences in left-right self-location, in communist roots of party members, and to a
slightly lesser extent in market individualism. But it is less ideal from the point of view
of variation in the indices of populism, social individualism, and modernism.
Figure 1.3 illustrates the results of the typology, while figure 1.4 summarizes the
identified groups’ main characteristics. By applying Ward’s hierarchical method, we
distinguish five types of political party whose main characteristics are presented in Figure
1.4. The most internally homogenous are groups V and I, while groups IV and III are
more heterogeneous. However, in the latter case intra-group differences are obviously
substantially lower than the average variation among the analyzed parties.
Type I includes four parties of the post-communist left (the Hungarian MSzP, the
Polish SLD, the Slovak SDL, and the Bulgarian BSP). All of the parties classified within
this cluster are members of the European socialist international (see table 1.16). Their
most pronounced features are the strong leftist identification and communist roots of
a large proportion of their councilors. They are also usually market collectivist (i.e.,
opposing market or individualist solutions) and egalitarian. Regarding other charac-
teristics, the position of this cluster is less clear. As presented in figure 1.3, this type, in
fact, consists of two sub-groups: the Hungarian MSzP and Polish SLD are very similar
to each other, while their taxonomic distance from the SDL and BSP is considerably
higher. The first sub-group might be called “reformed post-communist”—characterized
by high system acceptance, a high level of modernism, and a more ambivalent attitude
towards market individualism than the other sub-group. Again, it is important to stress
that both of these parties currently hold power at the central government level.
The second sub-group (BSP and SDL) might be called “unreformed post-commu-
nist” and is characterized by a low level of acceptance for system changes, a low level of
modernism of their councilors, and radical anti-market values.
Type II, which we call “anti-modernist left” (since it is characterized by the lowest
modernism index, the lowest index of social individualism, and low acceptance of po-
litical transformation) consists of three Estonian parties (the Center Party, the People’s
Union, and the Moderates), two Slovak (HZDS and SMER), and one Polish (the agrarian
PSL). An additional characteristic of this group is its strong egalitarianism and low level
of acceptance for market solutions. This group could be also called “eurosceptics.” Three
of the six parties belonging to this group have been classified by Taggort and Szczerbiak
(2003) as “soft eurosceptics” (the Estonian Center Party, the Slovak HZDS, and the
Polish PSL). One could easily add the Slovak SMER to the same group. Two remaining
parties—the Estonian People’s Union and the Moderates—come from a country in which
identified scepticism towards EU integration is the highest in general. We have already
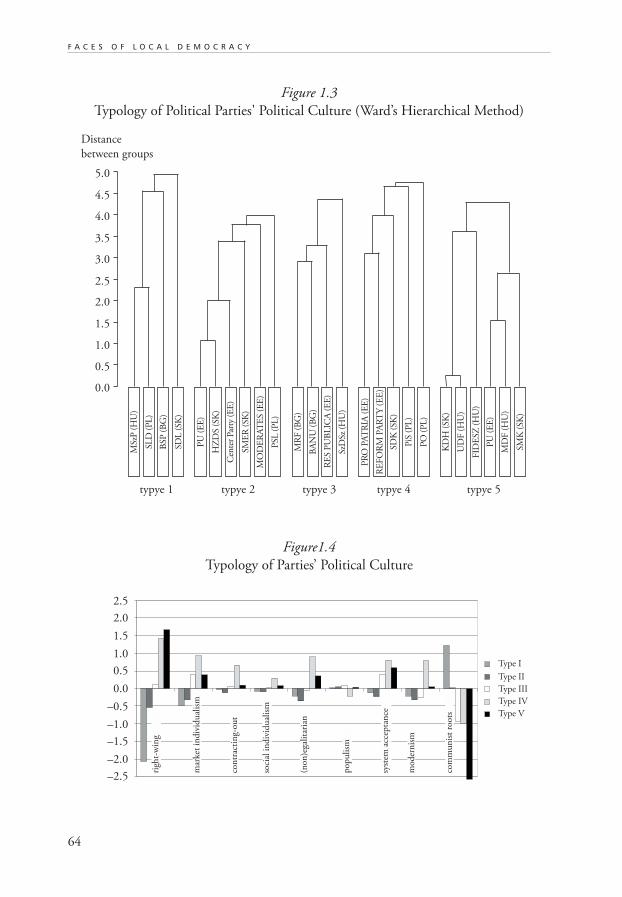
64
F A C E S O F L O C A L D E M O C R A C Y
Figure 1.3
Typology of Political Parties' Political Culture (Ward’s Hierarchical Method)
2.0
1.5
1.0
0.5
0.0
–0.5
–1.0
–1.5
–2.0
–2.5
2.5
Type I
Type II
Type III
Type IV
Type V
righ
t-w
ing
mar
ket
in
div
idu
alis
m
con
trac
tin
g-ou
t
soci
al i
nd
ivid
ual
ism
(non
)ega
lita
rian
pop
uli
sm
syst
em a
ccep
tan
ce
mod
ern
ism
com
mu
nis
t ro
ots
Figure1.4
Typology of Parties’ Political Culture
MSz
P (
HU
)
SLD
(P
L)
BSP
(B
G)
SDL
(SK
)
PU
(E
E)
HZ
DS
(SK
)
Cen
ter
Par
ty (
EE
)
SME
R (
SK)
MO
DE
RA
TE
S (E
E)
PSL
(P
L)
MR
F (
BG
)
BA
NU
(B
G)
RE
S P
UB
LIC
A (
EE
)
SzD
Sz (
HU
)
PR
O P
AT
RIA
(E
E)
RE
FO
RM
PA
RT
Y (
EE
)
SDK
(SK
)
PiS
(P
L)
PO
(P
L)
KD
H (
SK)
UD
F (
HU
)
FID
ESZ
(H
U)
PU
(E
E)
MD
F (
HU
)
SMK
(SK
)
typye 1 typye 2 typye 3 typye 4 typye 5
5.0
4.5
4.0
3.5
3.0
2.5
2.0
1.5
1.0
0.5
0.0
Distance
between groups
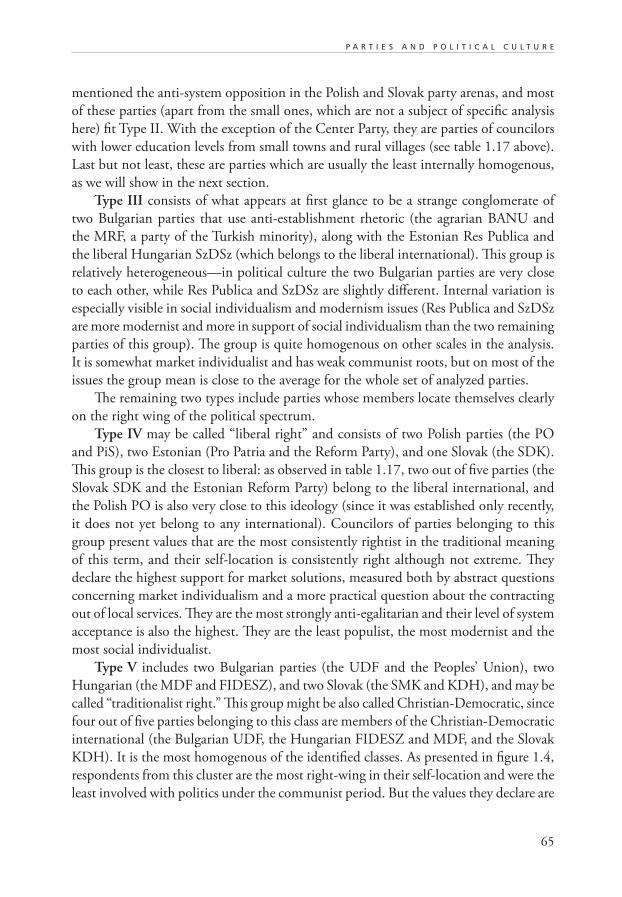
65
P A R T I E S A N D P O L I T I C A L C U L T U R E
mentioned the anti-system opposition in the Polish and Slovak party arenas, and most
of these parties (apart from the small ones, which are not a subject of specific analysis
here) fit Type II. With the exception of the Center Party, they are parties of councilors
with lower education levels from small towns and rural villages (see table 1.17 above).
Last but not least, these are parties which are usually the least internally homogenous,
as we will show in the next section.
Type III consists of what appears at first glance to be a strange conglomerate of
two Bulgarian parties that use anti-establishment rhetoric (the agrarian BANU and
the MRF, a party of the Turkish minority), along with the Estonian Res Publica and
the liberal Hungarian SzDSz (which belongs to the liberal international). This group is
relatively heterogeneous—in political culture the two Bulgarian parties are very close
to each other, while Res Publica and SzDSz are slightly different. Internal variation is
especially visible in social individualism and modernism issues (Res Publica and SzDSz
are more modernist and more in support of social individualism than the two remaining
parties of this group). The group is quite homogenous on other scales in the analysis.
It is somewhat market individualist and has weak communist roots, but on most of the
issues the group mean is close to the average for the whole set of analyzed parties.
The remaining two types include parties whose members locate themselves clearly
on the right wing of the political spectrum.
Type IV may be called “liberal right” and consists of two Polish parties (the PO
and PiS), two Estonian (Pro Patria and the Reform Party), and one Slovak (the SDK).
This group is the closest to liberal: as observed in table 1.17, two out of five parties (the
Slovak SDK and the Estonian Reform Party) belong to the liberal international, and
the Polish PO is also very close to this ideology (since it was established only recently,
it does not yet belong to any international). Councilors of parties belonging to this
group present values that are the most consistently rightist in the traditional meaning
of this term, and their self-location is consistently right although not extreme. They
declare the highest support for market solutions, measured both by abstract questions
concerning market individualism and a more practical question about the contracting
out of local services. They are the most strongly anti-egalitarian and their level of system
acceptance is also the highest. They are the least populist, the most modernist and the
most social individualist.
Type V includes two Bulgarian parties (the UDF and the Peoples’ Union), two
Hungarian (the MDF and FIDESZ), and two Slovak (the SMK and KDH), and may be
called “traditionalist right.” This group might be also called Christian-Democratic, since
four out of five parties belonging to this class are members of the Christian-Democratic
international (the Bulgarian UDF, the Hungarian FIDESZ and MDF, and the Slovak
KDH). It is the most homogenous of the identified classes. As presented in figure 1.4,
respondents from this cluster are the most right-wing in their self-location and were the
least involved with politics under the communist period. But the values they declare are
66
F A C E S O F L O C A L D E M O C R A C Y
not necessarily very close to the traditional meaning of the term “right-wing politics.”
They support market individualism and are non-egalitarian, but not as strongly as the
parties in Type IV (and in the latter case even less than Type III). However, it would
not be fair to say that their right-wing orientation is only ideological. The mean score
on most scales is substantially different from Types I and II (which are the closest to the
extreme left of the scale), but not as different as one might expect on the basis of their
own self-location and their non-communist past.
The typology shows that the political map of parties in Central and Eastern Europe
is not one of chaos without any order. The opinions of councilors that are members of
parties of similar character show many similarities across countries. The amount of order
is actually surprising, given the turbulent political scenes observed in these countries. It
reconfirms the observation that organizational changes (the emergence of new parties,
splits and internal conflicts) are not necessarily the result of variation in ideological
choices. They might also be the result of personal conflicts or the low organizational
skills of party leaders. Nevertheless, the internal homogeneity of individual parties is
relatively low as we will see in the next section.
6.5 Political Concurrence within Parties
It is assumed that the presence of parties helps to create order in political debate. In
democratic theory parties articulate more or less coherent programs on behalf of voters
and—if they successfully pass the electoral test—try to implement them. How close
is this normative statement to the actual situation in Central and Eastern European
local governments? How coherent are the opinions of local councilors from the same
party?
We try to answer these questions by using a standard deviation of answers as well
as an “index of party homogeneity”16 that takes into consideration the variation of all
nine indices analyzed previously. In general, the variation of opinions is greatest in Bul-
garia and Slovakia, and least in Estonia. The homogeneity index for individual parties
is presented in table 1.23.
Usually the index values are below 1, which means that the variation of opinions
within parties is lower than general among all councilors in the country. The Estonian
People’s Union is the only exception to this rule. Other very heterogeneous parties are
the Estonian Center Party and the Moderates, the Hungarian SzDSz, the Polish PSL,
and the Slovak HZDS.
At the other extreme, the most homogeneous parties are the Bulgarian UDF and
Peoples’ Union, the Estonian Reform Party, the Polish PO and PiS, the Hungarian
FIDESZ, and the Slovak KDH. It can be easily seen here that the opinions of right-
wing councilors are usually more homogeneous than those of their colleagues from
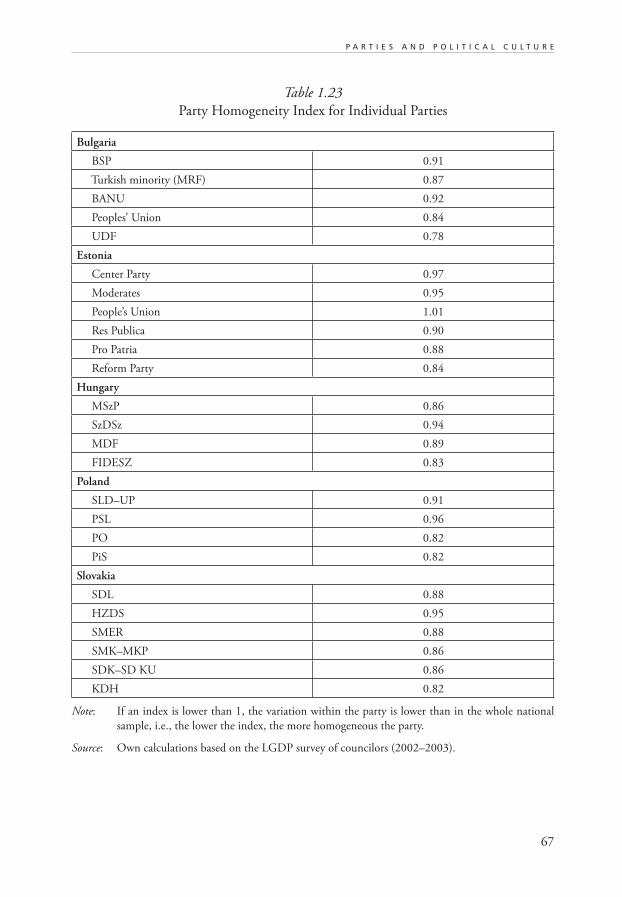
67
P A R T I E S A N D P O L I T I C A L C U L T U R E
Table 1.23
Party Homogeneity Index for Individual Parties
Bulgaria
BSP 0.91
Turkish minority (MRF) 0.87
BANU 0.92
Peoples’ Union 0.84
UDF 0.78
Estonia
Center Party 0.97
Moderates 0.95
People’s Union 1.01
Res Publica 0.90
Pro Patria 0.88
Reform Party 0.84
Hungary
MSzP 0.86
SzDSz 0.94
MDF 0.89
FIDESZ 0.83
Poland
SLD–UP 0.91
PSL 0.96
PO 0.82
PiS 0.82
Slovakia
SDL 0.88
HZDS 0.95
SMER 0.88
SMK–MKP 0.86
SDK–SD KU 0.86
KDH 0.82
Note: If an index is lower than 1, the variation within the party is lower than in the whole national
sample, i.e., the lower the index, the more homogeneous the party.
Source: Own calculations based on the LGDP survey of councilors (2002–2003).
68
F A C E S O F L O C A L D E M O C R A C Y
left-wing parties. Indeed, the correlation between the two indices is 0.58 (statistically
significant on a 0.01 level). This is definitely a surprising finding.17 In Poland (but not
only in Poland, as the same applies to the Slovak right, for example) rightist parties
are famous for being undisciplined. The high number of disputes in these parties and
the consequent splits and mergers make the right side of the political scene extremely
unstable and chaotic. Their inability to act together is well known. Nevertheless, our
research shows that members of these groups are similar to each other, and their opinions
on important policy issues are more uniform than in other parties!
Even more surprising, the high homogeneity is sustained when we treat all councilors
belonging to various Polish “center-right” parties as one group. The right-wing councilors’
homogenity is usually higher than in post-communist groups, which have a reputation
of being relatively uniform and disciplined. But in our opinion this observation is not
necessarily in contradiction with the famous tradition of quarrels and turbulences in
right-wing groups. Parties that have been created on the basis of the former democratic
opposition have been based (at least historically) on common values and ideological
choices. If they are not able to utilize this capital to build a stable political organization,
the reason lies in their lack of practical skills and sometimes their inability to seek a
consensus, but not in the lack of common ideological ground. On the other hand, our
results confirm a claim that leftist groups (especially post-communist parties) are often
glued by common interest, not by common ideas. Our analysis also confirms an obser-
vation of Szczerbiak (2003) that the splits and instability of Polish right-wing groups
are related more to low institutional skills than to ideological inconsistency.
High homogeneity is typical for most of the parties classified by us in clusters IV
and V. On the other hand, the most heterogeneous are the parties in Type II. These
are groups that are afraid of the changes initiated by the 1990 political turn-over, and
probably these fears provide the main glue for their organizations (rather than a com-
mon, coherent, positive program). These parties’ electorates often recruit from groups
with a lower education, so the theoretical coherence of party programs has only limited
importance for their voters.
In contrast to what Clark and Swianiewicz suggested in their analysis based on the
1991 data, party homogeneity is not a strong factor influencing their stability. There are
several examples of groups among the parties analyzed in this chapter whose members
have very diverse opinions on many issues, but which are still very stable.
But for most Central and East European parties the index is only slightly lower than
1. There is only one party (the UDF in Bulgaria) for which the index of homogeneity
is lower than 0.80.18
69
P A R T I E S A N D P O L I T I C A L C U L T U R E
7. CONCLUSIONS
We now refer back to the various hypotheses presented at the beginning of this chapter,
and determine whether or not they have been confirmed by the analysis.
• The role of political parties in local politics is not very important but has been gradu-
ally increasing during the last twelve years.
First of all, the role of political parties is diversified—it differs among countries as
well as between big and small municipalities. But the idea that it has been gradually
increasing has only partially been confirmed. The trend of increasing partisanship in local
elections and local politics has certainly been observed in Poland, but data from Hungary
and Slovakia are much less conclusive. Unfortunately, we do not have time-serious data
for other countries. Thus, the first hypothesis has been only partially confirmed and its
validity does not seem to be universal in all CEE countries.
• The increase in the role of parties in local politics is faster in countries with more
consolidated territorial systems (Poland and Bulgaria rather than Estonia, Latvia,
Hungary and Slovakia).
Yes, territorial consolidation definitely contributed to high scores in Bulgaria, while
a high level of territorial fragmentation in Hungary led to low scores on the party
importance index. But the role of parties depends also on “country-specific” variables,
and in Poland, for example, it is much lower than one might expect on the basis of its
territorial organization.
• The increase is also faster in big cities (in which party organizations often play a
decisive role in local politics) than in small communities (where parties are often still
nonexistent and most councilors as well as mayors are elected as independents).
Yes, the size of the local government proved to be a very powerful variable explaining
the importance of parties in local politics. The correlation is stronger in some countries
(e.g., Hungary) and weaker in others (e.g., Bulgaria), but it seems to be universal across
the whole CEE region. The comparison of national means with “size-standardized means”
is a very convincing illustration of this relationship.
• The role of parties is bigger in countries with proportional electoral systems than in
countries with one-ward, majority local council elections.
Yes, definitely it is. In fact, proportional versus majoritarian electoral systems proved
to be the most powerful explanatory variable in some of the regression analyses.
70
F A C E S O F L O C A L D E M O C R A C Y
• The role of parties in local politics is larger in countries with collective forms of
leadership (Latvia, Estonia, and Poland before 2002) than in countries closer to the
strong-mayor system (Slovakia, Bulgaria, Romania, and Poland after 2002) and
even larger in Hungary where the system is closest to the council-manager form.
We failed to find evidence to support this; on the other hand, neither did we find evi-
dence that the opposite relationship (as suggested in some of Mouritzen and Svara’s results)
might be true. It seems that the popular beliefs of both politicians and experts overestimate
the impact of the mayors’ nomination method on the role of parties in local politics.
• Political fragmentation and volatility of local councils is significant and may be
potentially dangerous for the management capabilities of local governments.
Yes, this proposition has definitely been confirmed. Data on volatility are only
partial and mostly limited to Poland, but political fragmentation is clearly higher than
in most EU cities, and cases of management problems, which might be related to this
fragmentation, are often reported.
• The party orientation (sympathy, membership) of local councilors and mayors is only
loosely correlated with their political culture and policy preferences. Nevertheless,
parties differ from each other and our report will attempt to map these differences.
The question of the strength of the relationship between individual party member-
ship and opinions on various policy issues is probably the most difficult to answer in
a definite way. We do not have fully comparable data from countries in other regions,
but we suggest that there is usually low homogeneity in the analyzed parties of Central
and Eastern Europe. In one of the parties (the People’s Union in Estonia) the varia-
tion in opinion within the party was even higher than in the whole national sample of
councilors. In some others such as the Slovak HZDS, the Polish PSL, and the Estonian
Center Party and the Moderates, it is just a little bit lower. In other parties the internal
variation is lower, but nevertheless very high. However, as we noted earlier, one cannot
make predictions about the stability of the party system simply on the basis of their
internal homogeneity. Sometimes parties that are not homogenous on policy issues (such
as most of the post-communist parties) are much more stable than more homogeneous
rightist groups.
Finally, we have noticed that differences between parties in Estonia and to a some-
what lesser extent in Hungary are lower than in other countries. Summing up, it would
not be fair to say that party membership of councilors or mayors is only loosely related
to their political culture. But at the same time, low homogeneity of party members’
71
P A R T I E S A N D P O L I T I C A L C U L T U R E
opinions on crucial issues leaves us unable to call the present party system clearly and
fully coherent.
There is not a clear international pattern of differences between parties. Parties
that use similar labels (such as liberal, social-democrat, and in particular left- and
right-wing) in different countries are not necessarily similar to each other.
The most vital cleavage still seems to be a division between post-communists and
those that are rooted in democratic opposition groups. Except for Estonia, this line is
to a large extent identical with the division between politicians who declare their ori-
entation to be right-wing or left-wing. This distinction is largely reflected in ideological
choices on such issues as market individualism or egalitarianism (i.e., values that are
important dimensions of the traditional left-right cleavages). But there are important
exceptions to this general rule. For example, left-right location is not significantly cor-
related with market individualism in Hungary or with egalitarianism in Poland. At the
same time, “leftist” or “rightist” orientations are much more weakly reflected in more
concrete policy choices. In the case of willingness to contract out local services (which
may be interpreted as a practical test for market individualism) the correlation with the
left-right dimension is problematic in most of the analyzed countries. In Hungary, “left”
and “right” parties have similar opinions on the economy, but economic liberalism is
characteristic for councilor-members of SzDSz, which is close to the center.
At the same time, applying a formal classification method brought more or less
coherent results. We were able to group the analyzed parties into five clusters that dif-
fer in political culture and in the biographies of their members-councilors. Moreover,
it has been possible to identify parties of a similar type in various countries (one group
consisting of post-communist parties, and another of parties identifying themselves
with Christian-Democracy). On the other hand, the final result of classification is not
always coherent. Some groups that are “forced” by the formal clustering method look a
bit artificial and are quite heterogeneous—e.g., Hungarian liberals from FIDESZ being
in the same group as the Bulgarian agrarian BANU or a party of the Turkish minority
in Bulgaria.
It should be added that the picture arising from such a typology of parties is more like
the traditional picture of left-right cleavages. Unlike what Clark suggests in his modern
theories of New Political Culture or New Fiscal Populism (Clark and Fergusson 1983,
Clark and Hoffmann-Martinot 1998) parties which are “leftist” on market issues are
also “leftist” on social issues. To conclude, the picture of cleavages is much more coher-
ent than one might expect on the basis of popular beliefs in the chaotic character of the
political scene in CEE countries, but it is also far from fully logical and explicable.
72
F A C E S O F L O C A L D E M O C R A C Y
NOTES
1 Classification of local executive management systems refers to Mouritzen and Svara (2002) typology.
2 We return to this issue at the beginning of section on parties’ local political culture.
3 More precise definitions of individual dimensions are included in relevant section of this paper.
4 Local Democracy and Innovation project has been funded by the Norwegian Research Council for
Applied Social Sciences and coordinated by prof. Harald Baldersheim (see Baldersheim et al. 1996,
Baldersheim et al. 2003).
5 To calculate “size-standardized mean” we take into account size distribution which is averaged for
all analyzed countries. For the size cohorts that are empty in our samples (e.g., we have no local
governments below 1,000 residents in Bulgaria or in Poland), we use an extrapolation of the trend
from the existing size cohorts.
6 There are 25 such parties in the five analyzed countries. The same list of parties is analyzed in the
following section where we discuss the variation in political culture.
7 The surveys do not provide data on sympathy towards two of the analyzed parties: the SDL in
Slovakia and the People’s Union in Bulgaria.
8 Party membership of mayors is known from the survey of Chief Executive Officers (see section 1.3).
9 We do not have data on mayors’ sympathy towards Romanian parties.
10 Survey data for Hungary slightly differ from actual data concerning the whole population (presented
in table 1.7). But these differences are small and—generally speaking—confirm the accuracy of our
information gathered through surveys.
11 The applied method of index calculation perhaps requires a methodological footnote. The index is
calculated on the basis of mean values for each indicator taken into account. To get a size-standardized
index, the means have been calculated individually for seven size cohorts of local governments (below
1,000 residents; 1–2,000; 2–5,000; 5–10,000; 10–50,000; 50–100,000; over 100,000). Missing
values (for example, there are no local governments below 1,000 residents in Bulgaria) have been
handled in the way described in footnote 6. To avoid a strong domination of membership and
support in elections in the index, the weight of the first four variables is 0.5, while for the last two
variables the weight is 1. The index is presented on a scale from 0 to 100, where 0 means the lack of
any presence of parties while 100 means the domination of parties in local political life.
12 Strictly speaking, the electoral system in larger Hungarian cities is not purely proportional and
might be described as “mixed.” But in our model we group it together with Bulgaria or Estonia, to
distinguish the situation in the local governments from typical majority systems that exist in Slovakia
or in small Hungarian and Polish local governments.
13 Communist roots index (CRI) is calculated as: com(partymean)/com(countrymean) and
com = crcomm + crcomoff + croldrep
3
Crcomm—membership of political parties before 1990.
Crcomoff—party officers before 1990.
Croldrep—councilors before 1990.
73
P A R T I E S A N D P O L I T I C A L C U L T U R E
14 The index of modernism is calculated in the same way as the index of communist roots. A 100%
value for the national average (as presented in table 1.17) would mean that all councilors use e-mail,
use Internet, and have a university degree.
15 At least, these are the verbal declarations of all party members. Some other analyses—for example,
Raun 1997, Kuczynski 2003—suggest that the Center Party was created by the former communist
party establishment. But this finding is not confirmed by our data. Is this perhaps not a concern of
present local councilors? Or do they just not want to admit their communist past?
16 Such an index has been suggested by Swianiewicz and Clark (1996). It consists of the mean standard
deviation for the party divided by the standard deviation for the national sample.
17 We claim this finding is surprising in the Central and East European context, since it goes against
the popular stereotype of a uniform left together with fragmented and incoherent right-wing parties.
However, we should mention that the phenomenon of increasing diversification of left-wing parties
has been observed in Western democracies. Lipset (2001) indicates that following changes in the
social structure in modern societies, left parties now seek to appeal more to the growing middle
strata than to industrial workers, and the “New Left” is looking for more market solutions. Lipset
concludes that the Social Democratic and Labour parties are now socially and ideologically pluralistic
(p.252).
18 Our intuition tells that if indices are so close to 1, parties’ homogeneity should be assessed as rather
low. But perhaps it is typical for most parties, even those in more stabilized democratic systems such
as in Western Europe. Unfortunately, we do not have fully comparative data, but we applied the same
method to a few questions related to values similar to those we have discussed here, which were asked
to mayors in the Fiscal Austerity and Urban Innovation (FAUI) Project in the 1980s and 1990s. The
index of parties’ homogenity was between 0.57 and 0.93 for five French parties, and between 0.80
and 0.99 for three Norwegian parties. This very imperfect check confirms our suggestion that there
are larger variations of opinion within CEE party members than typically in Western Europe.
REFERENCES
Az önkormányzatok döntéshozói, 1990–2002. 2003. Budapest: Hungarian Statistical
Office.
Back, H. 2004. The institutional setting of local political leadership and community
involvement. In: H. Heinelt, M. Haus, and M. Stewart (eds.). Democratic Choices
for Cities. London: Routledge.
Baldersheim, H., M. Illner, A. Offerdal, L. Rose, and P. Swianiewicz (eds.). 1996.
Local Democracy and the Process of Transformation in East-Central Europe. Boulder,
Colorado: Westview Press.
Balme, R. 1989. Analysing determinants of fiscal policies in French cities. In: S. Clarke
(ed.). Urban Innovation & Autonomy: Political Implications of Policy Change. Newbury
Park-London-New Delhi: Sage.
74
F A C E S O F L O C A L D E M O C R A C Y
Barnett, R., R. Levaggi, and P. Smith. 1990. The impact of party politics on pat-
terns of service provision in English local authorities. Policy & Politics. Vol. 18. 3:
217–229.
Bartkowski, J. 1996. Lokalne elity władzy w Polsce w latach 1966–1995 (Local Elites in
Poland: 1966–1995). Warsaw: Instytut Socjologii, Warsaw University.
Bernatova, M., P. Kuklis, L. Malikova, I. Roncak, and A. Vanova. 2001. Public perception
of local government in Slovakia. In: P. Swianiewicz (ed.). 2001. Public Perception of
Local Governments. Budapest: OSI–LGI.
Clark, T.N. 1967. Power and community structure: who governs, where and when. The
Sociological Quarterly, Vol. 8, No. 3.
Clark, T.N. and L.C. Fergusson. 1983. City Money. New York: Columbia University
Press.
Clark, T.N. and S.M. Lipset. 1991. Are social classes dying? International Sociology 6,
No. 4.
Clark, T.N. and V. Hoffmann-Martinot (eds.). 1998. The New Political Culture. Boulder,
Colorado: Westview.
Clark, T.N. 2000. Old and new paradigms for urban research. Urban Affairs Review
36: 3–45.
Clark, T. N. and S.M. Lipset (eds.). 2001. The Breakdown of Class Politics. Washington-
Baltimore-London: Woodrow Wilson Center Press, The John Hopkins University
Press.
Dahl, R. 1961. Who Governs. Yale University Press.
Dahl, R. and E.R. Tufte. 1973. Size and Democracy. Stanford University Press.
Denters, S.A.H. 2002. Urban democracies in the Netherlands: social and political
change, institutional continuities. In: O.V. Gabriel, V. Hoffmann-Martinot, and
H.V. Savitch (eds.). 2002. Urban Democracy. Opladen: Leske+Budrich.
Elcock, H. and J. Fenwick. 2003. Lesson drawing can fail: leadership in local govern-
ment. Paper presented at the ECPR conference, Marburg 18–21.09.
Fowler, B. 2003. Centre-right parties in Hungary. Paper presented at the ECPR confer-
ence, Marburg 18–21.09.
Gabriel, O.V., V. Hoffman-Martinot, and H.V Savitch (eds.). 2002. Urban Democracy.
Opladen: Leske+Budrich.
Getimis, P. and G. Despoina. 2004, forthcoming. Changes in urban political leadership:
leadership types and styles in the era of urban governance. In: H. Heinelt, M. Haus,
and M. Stewart (eds.). Democratic Governance in Cities. London: Routledge.
75
P A R T I E S A N D P O L I T I C A L C U L T U R E
Halamska, M. 2001. Reprodukcja czy wymiana? Przekształcenia lokalnych elit politycznych
w Polsce w latach 1990–1998 (Reproduction or Replacement? Changes in Local Political
Elites in Poland 1990–1998). EUROREG: Warsaw University.
Hoffmann-Martinot, V. 1998. Urban political parties: the role and transformation. In
T.N. Clark, and V. Hoffmann-Martinot (eds.). The New Political Culture. Boulder,
Colorado: Westview.
———. 2002. The fragmented democracy of French big cities. In: O.V. Gabriel, V.
Hoffman-Martinot, and H.V. Savitch (eds.). 2002. Urban Democracy. Opladen: Leske
+Budrich.
Hoggart, K. 1986. Property tax resources and political party control in England,
1974–1984. Urban Studies 23:33–46.
Hoggart K. and E.J.R Shrives. 1991. Political party influence on preschool services in
England, 1977–88. Environment & Planning C: Government & Policy 9:95–110.
Horváth, T. (ed.) 2000. Decentralization: Experiments and Reforms. Budapest: LGI–OSI.
Hunter, F. 1953. Community Power Structure. Chapel Hill, NC: The University of
North Carolina Press.
Inglehart, R. 1977. The Silent Revolution. Princeton, NJ: The Princeton University
Press.
———. 1982. Changing values in Japan and the West. Comparative Political Studies 14.
Kandeva, E. (ed.). 2001. Stabilization of Local Governments. Budapest: OSI–LGI.
Kowalczyk, A. 1991. Local elections in Poland in 1990. In: G. Péteri (ed.). Events and
Changes: The First Steps of Local Transition in East-Central Europe. Budapest: OSI.
Kuczyński, G. 2003. Estonia pod rządami prawicy (Estonia under right-wing govern-
ment). Międzynarodowy Przegląd Polityczny 4/2003.
Lewis, P. 2003. Political Parties. In: S. White, J. Batt, and P. Lewis (eds.). Developments
in Central and East European Politics. Durham: Duke University Press,
Lipset, S.M. 1981. Political Man: The Social Bases of Politics. Baltimore: The John Hop-
kins University Press.
———. 2001. The decline of class ideologies. In: T.N. Clark and S.M. Lipset (eds.).
The Breakdown of Class Politics. Washington-Baltimore-London: Woodrow Wilson
Center Press, The John Hopkins University Press.
Loughlin, J. John. 2001. Subnational Democracy in the European Union. Oxford Uni-
versity Press.
Mair, P. and I. Van Biezen. 2001. Party membership in twenty European democracies
1980–2000. Party Politics 7, No. 1.
76
F A C E S O F L O C A L D E M O C R A C Y
Miranda, R. 1994. Containing cleavages: parties and other hierarchies. In: T.N. Clark
(ed.). Urban Innovation. Thousand Oaks-London-New Delhi: Sage.
Mouritzen, P.E. and J.H. Svara. 2002. Leadership at the Apex: Politicians and Adminis-
trators in Western Local Governments. University of Pittsburgh Press.
Nikolenyi, C. 2003. From fragmentation towards unity: the centre-right in the Hungar-
ian party system. Paper presented at the ECPR conference, Marburg 18–21.09.
Page, E.C., M. Goldsmith, and P. Kousgaard. 1990. Time, parties and budgetary change:
fiscal decisions in English cities 1974–1988. British Journal of Political Sciences
1:43–61.
Pitkin, H.F. 1972. The Concept of Representation. Berkeley-Los Angeles-London: The
University of California Press.
Radni pierwszej kadencji (Councillors in the First Term). 1994. Komunikat z Badań CBOS
nr 85/94.
Raun, T.U. 1997. Democratisation and political development in Estonia 1987-1996.
In: K. Dawisha and B. Parrott (eds.). Deconsolidation of Democracy in East-Central
Europe. Cambridge University Press.
Sharpe, L.J. and K. Newton. 1984. Does Politics Matter? Oxford: Clarendon Press.
Sikk, A. 2003. Cartel party system in a post-communist country? The case of Estonia.
Paper presented at the ECPR conference, Marburg 18–21.09.
Soós, G., G. Toka, and G. Wright (eds.). 2002. The State of Local Democracy in Central
Europe. Budapest: OSI–LGI.
Steyvers, K., M. Breuillard, and H. Reynaert. 2003. Elected mayor reforms and local
leadership in Belgium, Britain and France. Paper presented at the ECPR confer-
ence, Marburg 18–21.09.
Sundberg J. 1991. Participation in Local Government: A Source of Social Deradicalization
in Scandinavia. Bergen: LOS.
Stoker, G. (ed.) 2000. The New Politics of British Local Governments. London: Macmillan.
Swianiewicz, P. 1996. The policy preferences and ideologies of candidates in the 1994
Polish local election. International Journal of Urban and Regional Research 20, No. 4.
Swianiewicz, P. (ed.). 2002. Consolidation or Fragmentation? The Size of Local Govern-
ments in Central and Eastern Europe. Budapest: OSI–LGI.
Swianiewicz, P. 2003. Partisan cleavages in local governments in Poland after 1990.
In: T. Zarycki and G. Kolankiewicz (eds.). Regional Issues in Polish Politics. School
of Slavonic and East European Studies, University College London. Occasional
Papers 60:179–201.
77
P A R T I E S A N D P O L I T I C A L C U L T U R E
Swianiewicz, P. 2004. Cities in states in transition. In: M. Haus, H. Heinelt, and M.
Stewart (eds.). Democratic Choices for Cities. London: Routledge.
Swianiewicz, P. and T.N. Clark. 1996. The new local parties. In: H. Baldersheim, M.
Illner, A. Offerdal, L. Rose, and P. Swianiewicz (eds.). Local Democracy and the Process
of Transformation in East-Central Europe. Boulder, Colorado: Westview.
Swianiewicz, P. and U. Klimska. 2003. Czy wielkie miasta są sterowalne? Wpływ sytuacji
politycznej na warunki zarządzania największymi miastami Polski (Are big cities
managable? The impact of politics on the management of Poland’s biggest cities.
Samorząd Terytorialny 3:12–28.
Szczerbiak, A. 2003. Centre right parties in Poland. Paper presented at the ECPR con-
ference, Marburg 18–21.09.
Taggart, P. and A. Szczerbiak. 2003. Europisation, Euroscepticism and party systems:
party-based Euroscepticism in the candidate states of Central and Eastern Europe.
In: P. Lewis and P. Webb (eds.). Pan-European Perspectives on Party Politics. Leiden-
Boston: Brill.
Vetter, A. 2002. Democracy in big cities: a comparative view. In: O.V. Gabriel, V.
Hoffman-Martinot, and H.V. Savitch (eds.). 2002. Urban Democracy. Opladen:
Leske+Budrich.
79
The Gender Gap in Local Political Leaderships
in Central and Eastern Europe
Zsolt Nyíri, Richard Vengroff
ABSTRACT
This chapter presents a comparative study of gender differences in the attitudes and
beliefs of local representatives in five transitional countries of Central and Eastern Europe:
Bulgaria, Estonia, Hungary, Poland, and Slovakia.1 Looking at the special characteristics
of women representatives is important since women are, or are close to being, a critical
mass of local officials in all five countries (21–32%). The research is based on surveys
of about 1,000 locally elected officials in each of the five countries. Our findings for
locally elected officials are consistent with findings for the general population and with
trends in the gender gap worldwide. We find gender differences in perceptions of the very
nature of the role of the state, and this is consistent from country to country. Women
see a greater role for the state in the economy and in the provision of help and support
to citizens. Differences at the local level are especially important because it is here that
many of the issues having a direct impact on the lives of women are addressed on a daily
basis. The existing gap seems to be growing, as we see clear generational (age cohort)
differences consistent with growth in the gap over time. This is further reinforced by
the data on ideological self-identification, which shows women generally to the left of
their male counterparts and growth in this gap from generation to generation. However,
support for democracy and democratic values is quite consistent across gender.
81
The Gender Gap in Local Political Leaderships
in Central and Eastern Europe
Zsolt Nyíri, Richard Vengroff
1. INTRODUCTION
A recent survey of local legislatures (LRS 2002–2003) was sent out to thousands of local
representatives in five countries of Central and Eastern Europe (CEE): Bulgaria, Esto-
nia, Hungary, Poland, and Slovakia. While the survey had many objectives, including
gathering information about the activities, values, opinions, and demographics of locally
elected officials, these data also provided an opportunity to examine important differ-
ences in the attitudes, preferences, and perceptions of male and female representatives.
The data have allowed us to place in comparative perspective the gender differences, and
particularly the so-called gender gap, among local representatives in these five countries.
We can see to what extent these data are consistent with findings on the gender gap
at other levels. Moreover, the survey allows us to make interesting comparisons across
countries in the CEE region.
Our findings on this issue are unique and potentially quite important. There is a lack
of available research identifying in what ways female and male locally elected officials
actually differ and how those differences affect their policy choices. The idea that more
equitable gender representation is good for democratic development and will result in
more diverse policymaking at the local level is based on the assumption that there are
gender-related differences in the values, goals, priorities, and perceptions of representa-
tives. In addition, since the research focuses on local councilors instead of national or
state representatives, it will add to our understanding of the nature and potential benefits
of decentralization. These data also provide the opportunity to examine the nature of the
“gender gap” among locally elected elites compared to the gap found within the general
population of the five countries included in the study. Finally, the research investigates
the local situation in a relatively new wave of democracies in Central and Eastern Europe
and adds to our understanding of democratic transitions.
82
F A C E S O F L O C A L D E M O C R A C Y
1.1 Decentralization and Gender Representation
In recent decades “decentralization” has become increasingly popular as a means of
addressing major difficulties associated with the management of complex functions in
public administration, increasing the responsiveness of government, promoting greater
participation, and improving the quality of governance. Even traditionally highly cen-
tralized unitary states such as France have made significant moves in this direction
(Loughlin and Mazey 1995; Page 1991; Downs 1998; also see DeVries 2000 regarding
support for decentralization in Europe). Worldwide, both developing and transitional
countries have been under intense international pressure from the donor community
to decentralize authority as part of the democratization process. Understandably, many
post-socialist countries have welcomed decentralization as a way of breaking down the
over-centralized socialist state as part of their democratic transitions.
All five countries in our study have already established local self-governments with
constitutionally guaranteed rights. According to Tamás M. Horváth (2000), only Poland
and Hungary can be described as following a “coherent model of transition” of local
governments. For these two countries, the structure of local governments was established
early and elections at the local level were held at the time of the first parliamentary
elections. In CEE countries, however, it was more common that their institution of
local democracy developed gradually. The structures, functions, and financing of local
governments were the result of ongoing political disputes in which “temporary political
and legal techniques were adopted” (Horváth 2000). Nevertheless, the end product is
similar in all five cases in the sense that local government rests on the foundation of
democratically elected local bodies. Moreover, all the countries included in this study
consider the European Charter of Local Self-Government of the European Union as a
model in establishing pluralistic and democratic local governance. Local governments
also add a great deal of vitality to the political systems of each country. While the precise
structures and functions of local governments often differ from one country to another
in important ways, we believe enough similarities still exist to allow for meaningful
comparison.
The importance of the impact of local level governance on people’s lives is increasing,
and this raises several gender-related questions. To what extent do gender-related issues
become part of the local agenda? How well are women represented in elected councils
and legislatures at this level? In what ways do men and women differ in their views of
democracy and government? The number of women representatives, presumably with
their own values, unique views on public policy issues, and different backgrounds, may
have a critical impact on a broad range of policy issues in the future. Assuming that
there are significant differences between male and female locally elected officials, bet-
ter gender representation may result in decision-making bodies that are more likely to
represent the real values of the public (Thielemann and Stewart 1996).
83
T H E G E N D E R G A P
In addition to the critical areas of policy they address, locally elected bodies may
provide attractive opportunities and easier access for women. These legislatures offer seats
that are often less competitive, require less costly campaigns and are less likely to require
relocation away from familial demands, all conditions which have traditionally inhibited
women’s involvement in electoral politics (Lovenduski 1986). In addition, they may serve
as an important recruiting ground for women candidates for higher-level offices.
For example, a recent study by Susan J. Carroll found evidence of a significant
“gender gap” between the ideological orientations and attitudes on policy issues of rep-
resentatives in the United States. Carroll’s work confirmed earlier findings that women
representatives are more likely to hold liberal opinions on issues and are less likely to
call themselves conservatives—regardless of their party affiliation (Carroll 2002).
At the state level, Carey, Niemi, and Powel found important differences between
men and women legislators in the following areas:
• Level of political ambition
• Level of professionalization—the degree to which men were more ambitious,
experienced, and able to mobilize greater resources
• Legislative activities
• Policy positions
• Ideology.
Carey, Niemi, and Powel note that “women state legislators are different from their
male counterparts in important ways” (Thomas and Wilcox 1998, 87). Not only do they
differ, but this difference matters in the sense that it will affect their politics (Thomas
1994). As the number of women elected to public office grows, it is becoming more
and more important to explore these gender-based differences. Moreover, earlier studies
neglected gender differences at the local or regional levels of politics.
1.2 Small Differences That Matter
Inglehart and Norris (2003) note that there exists “a modest but consistent” gender gap
between many aspects of policy-related values and beliefs such as the political activism
of male and female citizens of postindustrial, industrial, and agrarian societies. Loven-
duski and Norris (2003) conclude in their study of the British Parliament that the entry
of more women into the legislature will probably not generate radical revolution but
will end “politics as usual.” Others, such as Phillips, also confirm that the differences
between men’s and women’s experience of politics originates in rather small differences
and do not suggest that men and women are “essentially” different. Instead, “a fairly
small difference in experience can become a large difference in self-image and social
perception” (Phillips 1998).
84
F A C E S O F L O C A L D E M O C R A C Y
These seemingly small differences, therefore, can be very important. Anne Phillips
identifies some arguments why better gender representation and eventually gender parity
is essential in a democracy (Phillips 1998):
• Justice: it is unfair for men to monopolize political representation. Distorted
representation is the result of intentional or structural discrimination against
women representatives;
• Women’s interest: from the point of view of political realism, there is no public
interest. Instead, there are several different interests within the public. Women’s
interests are one of the many interests, and they are inadequately addressed in
a political system dominated by men;
• Revitalization of democracy: increasing the number of women representatives is
not only a pictorial or quota-related goal. Feminists think that gender representa-
tion matters because what female representatives do is different from their male
counterparts. Consequently, increasing the number of women representatives
enhances democracy and democratic institutions.
While much research has already been carried out on male to female ratios in elected
bodies, it is rare to investigate what actual difference it makes to have better gender
equity. In other words, how are male and female representatives different2 and what is
the policy impact of those differences?
1.3 Gender Representation in Post-socialist Countries
The five countries included in this study, and post-socialist countries in general, now
tend to share a similar experience with many developed western democracies. They
generally have relatively low levels of women represented in legislative offices when
compared to women’s share of the total population. This is especially surprising with
regard to formerly socialist countries, since these countries tended to have higher levels
of descriptive representation in their “socialist” past than they do in their democratic
present. Increasing the number of women in governmental bodies was part of the socialist
rhetoric of emancipating women from a double oppression: first, because of their class
and, second, due to their gender. Paradoxically, the relatively high level of descriptive
representation was only possible due to the fact that elections were not free. Thus,
the Socialist Party could influence nominations and votes according to its ideological
directives. During the last socialist elections in Hungary in 1985 women won 27% of
the parliamentary seats (compared to only 8% in the most recent national election)
and 21% of the positions in local governments. It is important to note, however, that
descriptive representation was not accompanied by substantive representation, and for
women as well as “for most people political participation meant passive attendance at
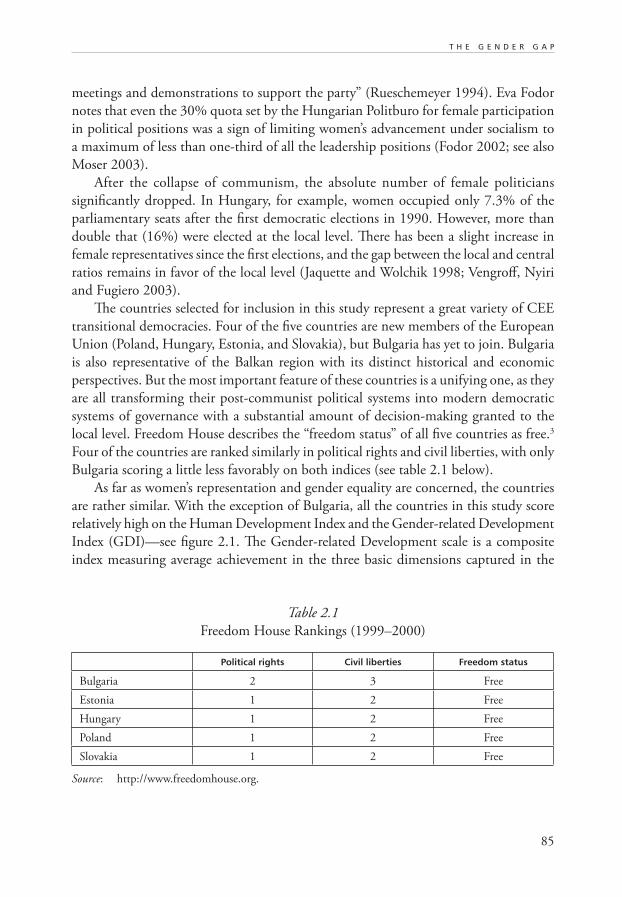
85
T H E G E N D E R G A P
meetings and demonstrations to support the party” (Rueschemeyer 1994). Eva Fodor
notes that even the 30% quota set by the Hungarian Politburo for female participation
in political positions was a sign of limiting women’s advancement under socialism to
a maximum of less than one-third of all the leadership positions (Fodor 2002; see also
Moser 2003).
After the collapse of communism, the absolute number of female politicians
significantly dropped. In Hungary, for example, women occupied only 7.3% of the
parliamentary seats after the first democratic elections in 1990. However, more than
double that (16%) were elected at the local level. There has been a slight increase in
female representatives since the first elections, and the gap between the local and central
ratios remains in favor of the local level (Jaquette and Wolchik 1998; Vengroff, Nyiri
and Fugiero 2003).
The countries selected for inclusion in this study represent a great variety of CEE
transitional democracies. Four of the five countries are new members of the European
Union (Poland, Hungary, Estonia, and Slovakia), but Bulgaria has yet to join. Bulgaria
is also representative of the Balkan region with its distinct historical and economic
perspectives. But the most important feature of these countries is a unifying one, as they
are all transforming their post-communist political systems into modern democratic
systems of governance with a substantial amount of decision-making granted to the
local level. Freedom House describes the “freedom status” of all five countries as free.3
Four of the countries are ranked similarly in political rights and civil liberties, with only
Bulgaria scoring a little less favorably on both indices (see table 2.1 below).
As far as women’s representation and gender equality are concerned, the countries
are rather similar. With the exception of Bulgaria, all the countries in this study score
relatively high on the Human Development Index and the Gender-related Development
Index (GDI)—see figure 2.1. The Gender-related Development scale is a composite
index measuring average achievement in the three basic dimensions captured in the
Table 2.1
Freedom House Rankings (1999–2000)
Political rights Civil liberties Freedom status
Bulgaria 2 3 Free
Estonia 1 2 Free
Hungary 1 2 Free
Poland 1 2 Free
Slovakia 1 2 Free
Source: http://www.freedomhouse.org.
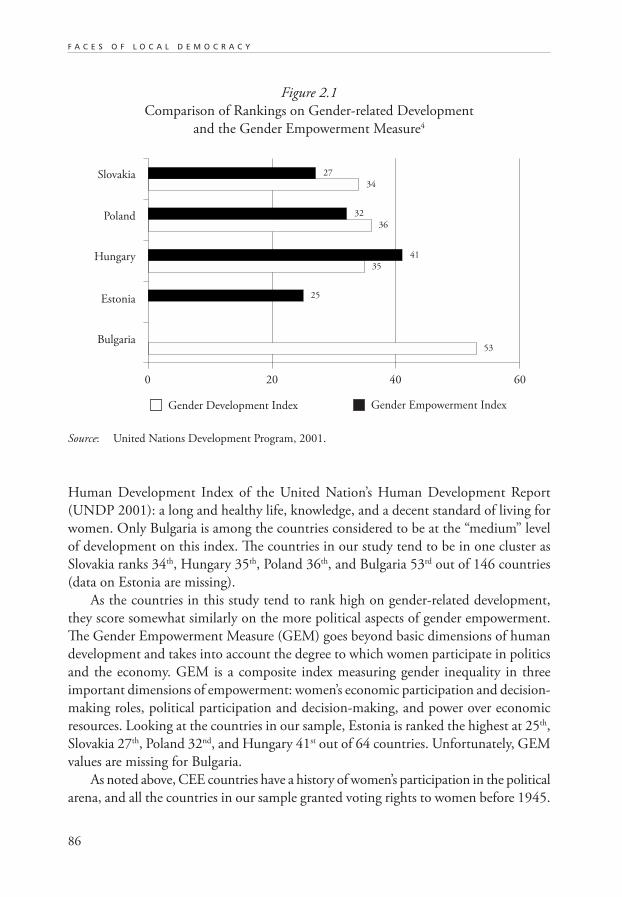
86
F A C E S O F L O C A L D E M O C R A C Y
Human Development Index of the United Nation’s Human Development Report
(UNDP 2001): a long and healthy life, knowledge, and a decent standard of living for
women. Only Bulgaria is among the countries considered to be at the “medium” level
of development on this index. The countries in our study tend to be in one cluster as
Slovakia ranks 34th, Hungary 35th, Poland 36th, and Bulgaria 53rd out of 146 countries
(data on Estonia are missing).
As the countries in this study tend to rank high on gender-related development,
they score somewhat similarly on the more political aspects of gender empowerment.
The Gender Empowerment Measure (GEM) goes beyond basic dimensions of human
development and takes into account the degree to which women participate in politics
and the economy. GEM is a composite index measuring gender inequality in three
important dimensions of empowerment: women’s economic participation and decision-
making roles, political participation and decision-making, and power over economic
resources. Looking at the countries in our sample, Estonia is ranked the highest at 25th,
Slovakia 27th, Poland 32nd, and Hungary 41st out of 64 countries. Unfortunately, GEM
values are missing for Bulgaria.
As noted above, CEE countries have a history of women’s participation in the political
arena, and all the countries in our sample granted voting rights to women before 1945.
Figure 2.1
Comparison of Rankings on Gender-related Development
and the Gender Empowerment Measure4
Source: United Nations Development Program, 2001.
Bulgaria
Estonia
Hungary
Poland
Slovakia
0 20 40 60
Gender Development Index Gender Empowerment Index
27
34
32
36
41
35
25
53
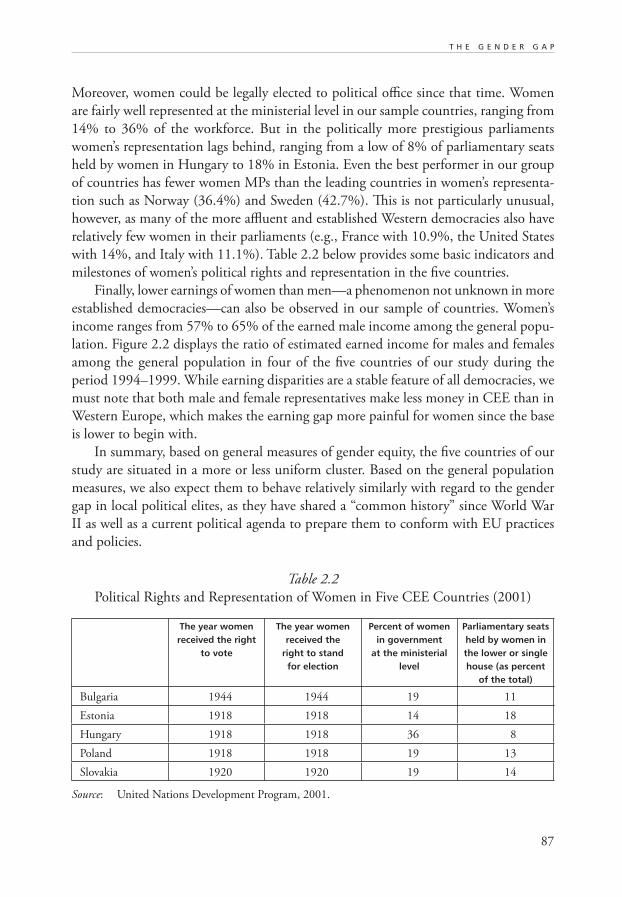
87
T H E G E N D E R G A P
Moreover, women could be legally elected to political office since that time. Women
are fairly well represented at the ministerial level in our sample countries, ranging from
14% to 36% of the workforce. But in the politically more prestigious parliaments
women’s representation lags behind, ranging from a low of 8% of parliamentary seats
held by women in Hungary to 18% in Estonia. Even the best performer in our group
of countries has fewer women MPs than the leading countries in women’s representa-
tion such as Norway (36.4%) and Sweden (42.7%). This is not particularly unusual,
however, as many of the more affluent and established Western democracies also have
relatively few women in their parliaments (e.g., France with 10.9%, the United States
with 14%, and Italy with 11.1%). Table 2.2 below provides some basic indicators and
milestones of women’s political rights and representation in the five countries.
Finally, lower earnings of women than men—a phenomenon not unknown in more
established democracies—can also be observed in our sample of countries. Women’s
income ranges from 57% to 65% of the earned male income among the general popu-
lation. Figure 2.2 displays the ratio of estimated earned income for males and females
among the general population in four of the five countries of our study during the
period 1994–1999. While earning disparities are a stable feature of all democracies, we
must note that both male and female representatives make less money in CEE than in
Western Europe, which makes the earning gap more painful for women since the base
is lower to begin with.
In summary, based on general measures of gender equity, the five countries of our
study are situated in a more or less uniform cluster. Based on the general population
measures, we also expect them to behave relatively similarly with regard to the gender
gap in local political elites, as they have shared a “common history” since World War
II as well as a current political agenda to prepare them to conform with EU practices
and policies.
Table 2.2
Political Rights and Representation of Women in Five CEE Countries (2001)
The year women received the right
to vote
The year women received the
right to stand for election
Percent of women in government
at the ministerial level
Parliamentary seats held by women in the lower or single house (as percent
of the total)
Bulgaria 1944 1944 19 11
Estonia 1918 1918 14 18
Hungary 1918 1918 36 8
Poland 1918 1918 19 13
Slovakia 1920 1920 19 14
Source: United Nations Development Program, 2001.
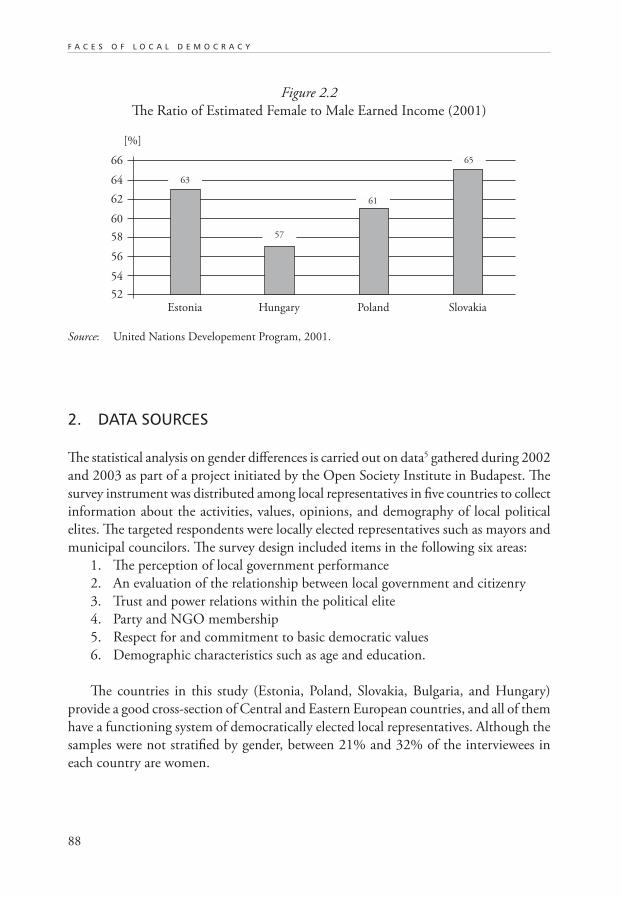
88
F A C E S O F L O C A L D E M O C R A C Y
2. DATA SOURCES
The statistical analysis on gender differences is carried out on data5 gathered during 2002
and 2003 as part of a project initiated by the Open Society Institute in Budapest. The
survey instrument was distributed among local representatives in five countries to collect
information about the activities, values, opinions, and demography of local political
elites. The targeted respondents were locally elected representatives such as mayors and
municipal councilors. The survey design included items in the following six areas:
1. The perception of local government performance
2. An evaluation of the relationship between local government and citizenry
3. Trust and power relations within the political elite
4. Party and NGO membership
5. Respect for and commitment to basic democratic values
6. Demographic characteristics such as age and education.
The countries in this study (Estonia, Poland, Slovakia, Bulgaria, and Hungary)
provide a good cross-section of Central and Eastern European countries, and all of them
have a functioning system of democratically elected local representatives. Although the
samples were not stratified by gender, between 21% and 32% of the interviewees in
each country are women.
Figure 2.2
The Ratio of Estimated Female to Male Earned Income (2001)
52Estonia
54
56
58
60
62
64
66
[%]
57
61
65
63
Hungary Poland Slovakia
Source: United Nations Developement Program, 2001.
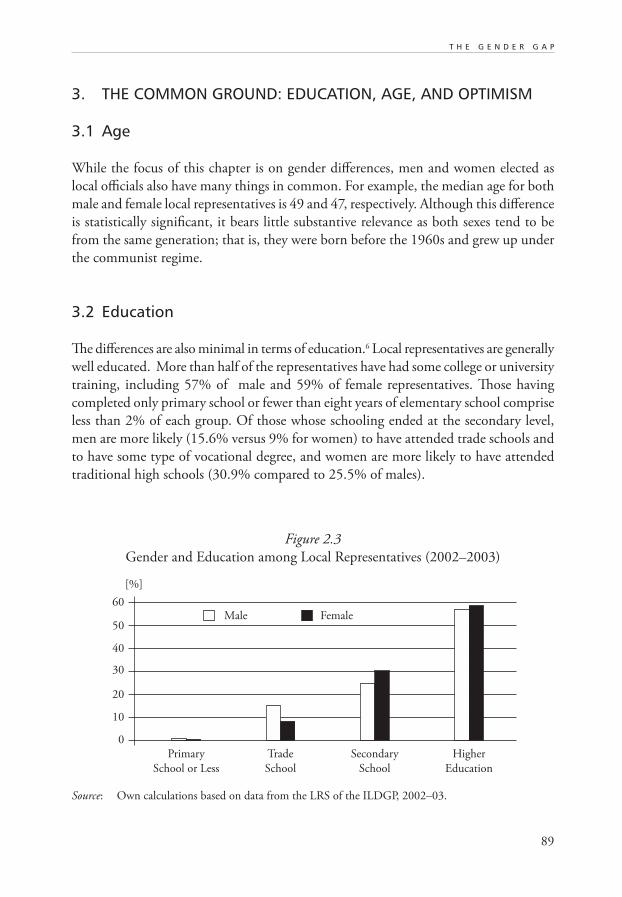
89
T H E G E N D E R G A P
3. THE COMMON GROUND: EDUCATION, AGE, AND OPTIMISM
3.1 Age
While the focus of this chapter is on gender differences, men and women elected as
local officials also have many things in common. For example, the median age for both
male and female local representatives is 49 and 47, respectively. Although this difference
is statistically significant, it bears little substantive relevance as both sexes tend to be
from the same generation; that is, they were born before the 1960s and grew up under
the communist regime.
3.2 Education
The differences are also minimal in terms of education.6 Local representatives are generally
well educated. More than half of the representatives have had some college or university
training, including 57% of male and 59% of female representatives. Those having
completed only primary school or fewer than eight years of elementary school comprise
less than 2% of each group. Of those whose schooling ended at the secondary level,
men are more likely (15.6% versus 9% for women) to have attended trade schools and
to have some type of vocational degree, and women are more likely to have attended
traditional high schools (30.9% compared to 25.5% of males).
Figure 2.3
Gender and Education among Local Representatives (2002–2003)
0
Primary
School or Less
10
20
30
40
50
60
[%]
Trade
School
Secondary
School
Higher
Education
Male Female
Source: Own calculations based on data from the LRS of the ILDGP, 2002–03.
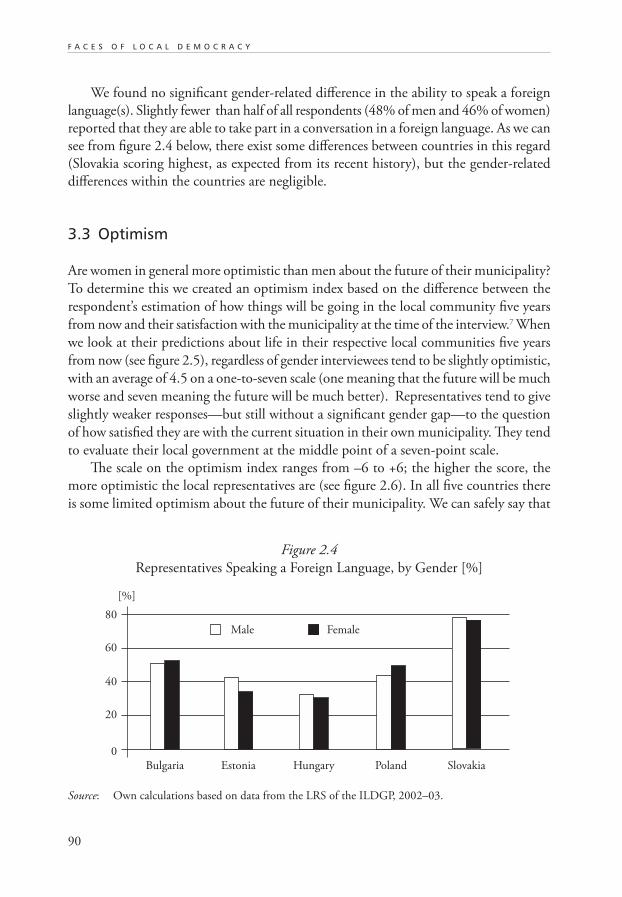
90
F A C E S O F L O C A L D E M O C R A C Y
We found no significant gender-related difference in the ability to speak a foreign
language(s). Slightly fewer than half of all respondents (48% of men and 46% of women)
reported that they are able to take part in a conversation in a foreign language. As we can
see from figure 2.4 below, there exist some differences between countries in this regard
(Slovakia scoring highest, as expected from its recent history), but the gender-related
differences within the countries are negligible.
3.3 Optimism
Are women in general more optimistic than men about the future of their municipality?
To determine this we created an optimism index based on the difference between the
respondent’s estimation of how things will be going in the local community five years
from now and their satisfaction with the municipality at the time of the interview.7 When
we look at their predictions about life in their respective local communities five years
from now (see figure 2.5), regardless of gender interviewees tend to be slightly optimistic,
with an average of 4.5 on a one-to-seven scale (one meaning that the future will be much
worse and seven meaning the future will be much better). Representatives tend to give
slightly weaker responses—but still without a significant gender gap—to the question
of how satisfied they are with the current situation in their own municipality. They tend
to evaluate their local government at the middle point of a seven-point scale.
The scale on the optimism index ranges from –6 to +6; the higher the score, the
more optimistic the local representatives are (see figure 2.6). In all five countries there
is some limited optimism about the future of their municipality. We can safely say that
Figure 2.4
Representatives Speaking a Foreign Language, by Gender [%]
Source: Own calculations based on data from the LRS of the ILDGP, 2002–03.
0
Bulgaria
20
40
60
80
[%]
Estonia Poland Slovakia
Male Female
Hungary
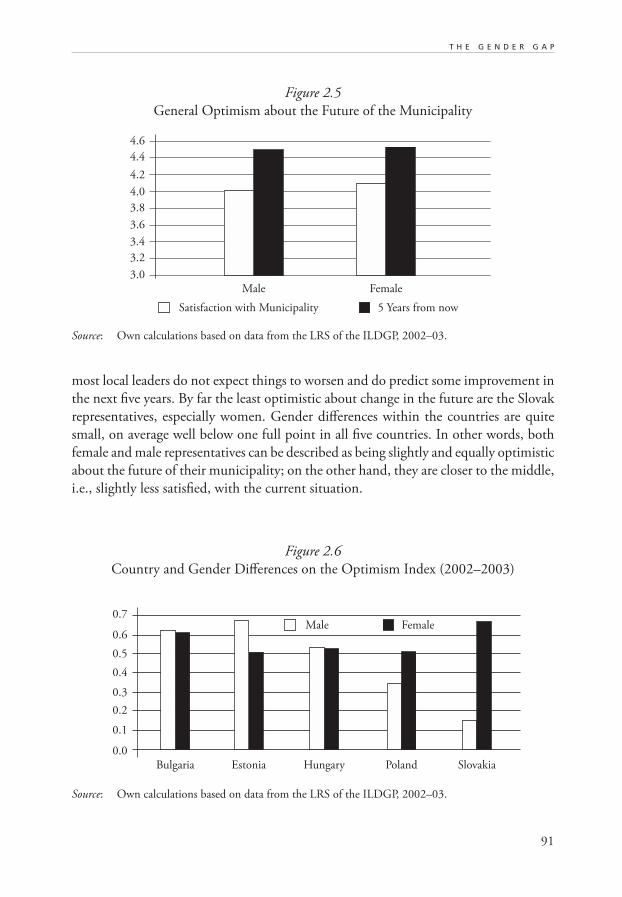
91
T H E G E N D E R G A P
most local leaders do not expect things to worsen and do predict some improvement in
the next five years. By far the least optimistic about change in the future are the Slovak
representatives, especially women. Gender differences within the countries are quite
small, on average well below one full point in all five countries. In other words, both
female and male representatives can be described as being slightly and equally optimistic
about the future of their municipality; on the other hand, they are closer to the middle,
i.e., slightly less satisfied, with the current situation.
3.0
3.2
3.4
3.6
3.8
4.0
4.2
4.4
4.6
Male Female
Satisfaction with Municipality 5 Years from now
Figure 2.5
General Optimism about the Future of the Municipality
Source: Own calculations based on data from the LRS of the ILDGP, 2002–03.
Figure 2.6
Country and Gender Differences on the Optimism Index (2002–2003)
0.0
Bulgaria
0.1
0.2
0.3
0.4
Estonia Poland Slovakia
Male Female
Hungary
0.5
0.6
0.7
Source: Own calculations based on data from the LRS of the ILDGP, 2002–03.
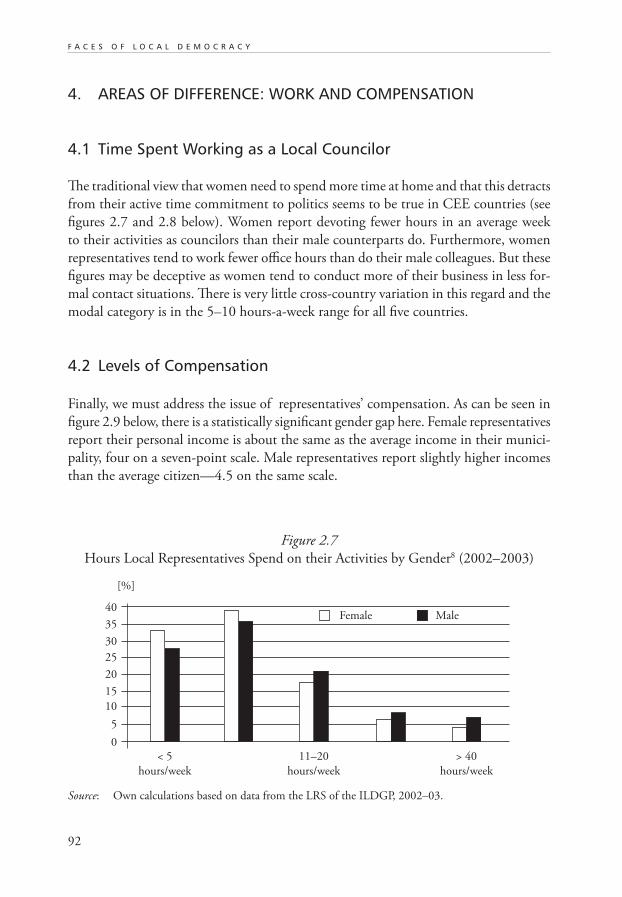
92
F A C E S O F L O C A L D E M O C R A C Y
4. AREAS OF DIFFERENCE: WORK AND COMPENSATION
4.1 Time Spent Working as a Local Councilor
The traditional view that women need to spend more time at home and that this detracts
from their active time commitment to politics seems to be true in CEE countries (see
figures 2.7 and 2.8 below). Women report devoting fewer hours in an average week
to their activities as councilors than their male counterparts do. Furthermore, women
representatives tend to work fewer office hours than do their male colleagues. But these
figures may be deceptive as women tend to conduct more of their business in less for-
mal contact situations. There is very little cross-country variation in this regard and the
modal category is in the 5–10 hours-a-week range for all five countries.
4.2 Levels of Compensation
Finally, we must address the issue of representatives’ compensation. As can be seen in
figure 2.9 below, there is a statistically significant gender gap here. Female representatives
report their personal income is about the same as the average income in their munici-
pality, four on a seven-point scale. Male representatives report slightly higher incomes
than the average citizen—4.5 on the same scale.
0
< 5
hours/week
5
10
15
20
> 40
hours/week
Female Male
11–20
hours/week
25
30
35
40
[%]
Figure 2.7
Hours Local Representatives Spend on their Activities by Gender8 (2002–2003)
Source: Own calculations based on data from the LRS of the ILDGP, 2002–03.
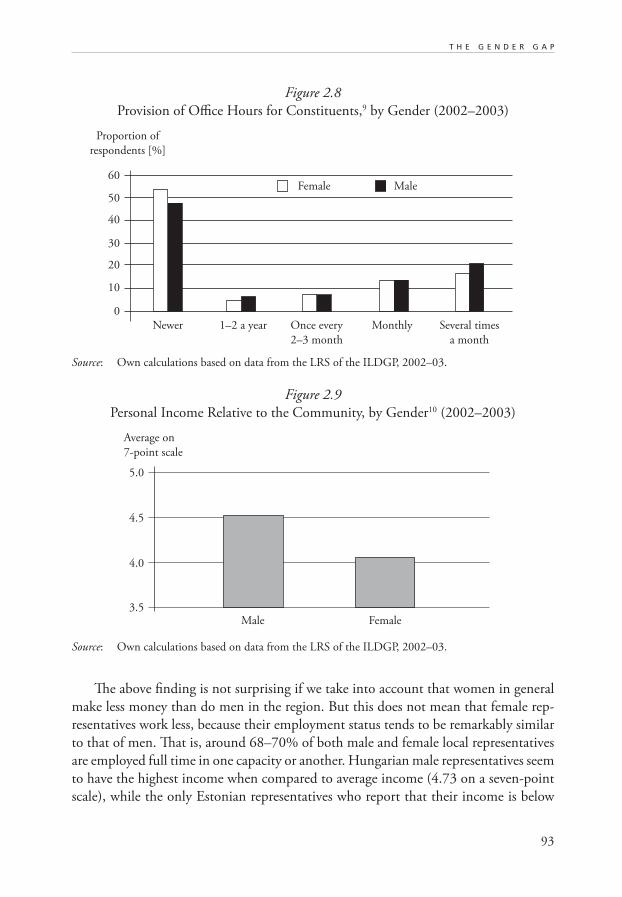
93
T H E G E N D E R G A P
Figure 2.8
Provision of Office Hours for Constituents,9 by Gender (2002–2003)
Source: Own calculations based on data from the LRS of the ILDGP, 2002–03.
0
Newer
10
20
30
40
Several times
a month
Female Male
Once every
2–3 month
50
60
1–2 a year Monthly
Proportion of
respondents [%]
The above finding is not surprising if we take into account that women in general
make less money than do men in the region. But this does not mean that female rep-
resentatives work less, because their employment status tends to be remarkably similar
to that of men. That is, around 68–70% of both male and female local representatives
are employed full time in one capacity or another. Hungarian male representatives seem
to have the highest income when compared to average income (4.73 on a seven-point
scale), while the only Estonian representatives who report that their income is below
3.5
4.0
4.5
5.0
Male Female
Average on
7-point scale
Figure 2.9
Personal Income Relative to the Community, by Gender10 (2002–2003)
Source: Own calculations based on data from the LRS of the ILDGP, 2002–03.
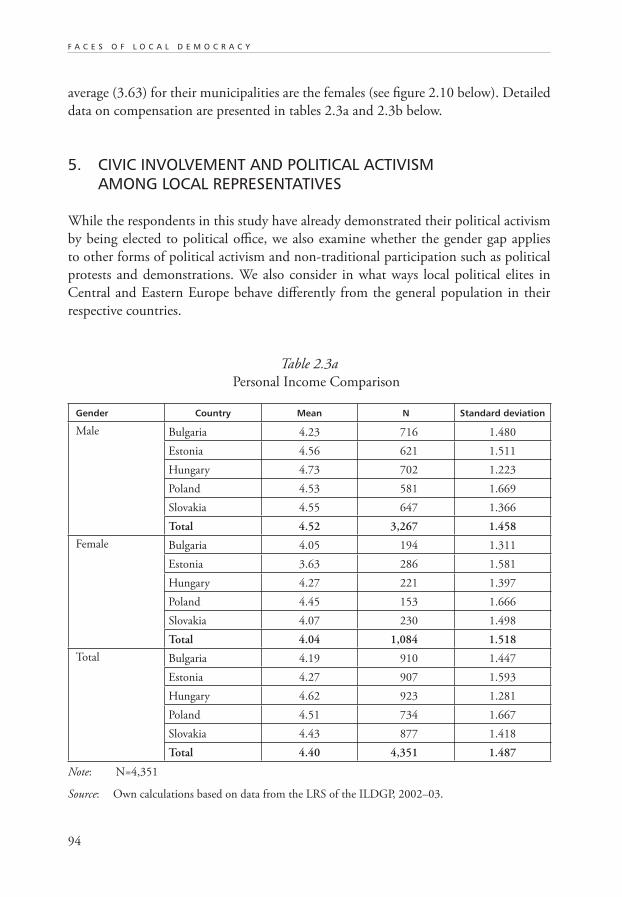
94
F A C E S O F L O C A L D E M O C R A C Y
average (3.63) for their municipalities are the females (see figure 2.10 below). Detailed
data on compensation are presented in tables 2.3a and 2.3b below.
5. CIVIC INVOLVEMENT AND POLITICAL ACTIVISM AMONG LOCAL REPRESENTATIVES
While the respondents in this study have already demonstrated their political activism
by being elected to political office, we also examine whether the gender gap applies
to other forms of political activism and non-traditional participation such as political
protests and demonstrations. We also consider in what ways local political elites in
Central and Eastern Europe behave differently from the general population in their
respective countries.
Table 2.3a
Personal Income Comparison
Gender Country Mean N Standard deviation
Male Bulgaria 4.23 716 1.480
Estonia 4.56 621 1.511
Hungary 4.73 702 1.223
Poland 4.53 581 1.669
Slovakia 4.55 647 1.366
Total 4.52 3,267 1.458
Female Bulgaria 4.05 194 1.311
Estonia 3.63 286 1.581
Hungary 4.27 221 1.397
Poland 4.45 153 1.666
Slovakia 4.07 230 1.498
Total 4.04 1,084 1.518
Total Bulgaria 4.19 910 1.447
Estonia 4.27 907 1.593
Hungary 4.62 923 1.281
Poland 4.51 734 1.667
Slovakia 4.43 877 1.418
Total 4.40 4,351 1.487
Note: N=4,351
Source: Own calculations based on data from the LRS of the ILDGP, 2002–03.
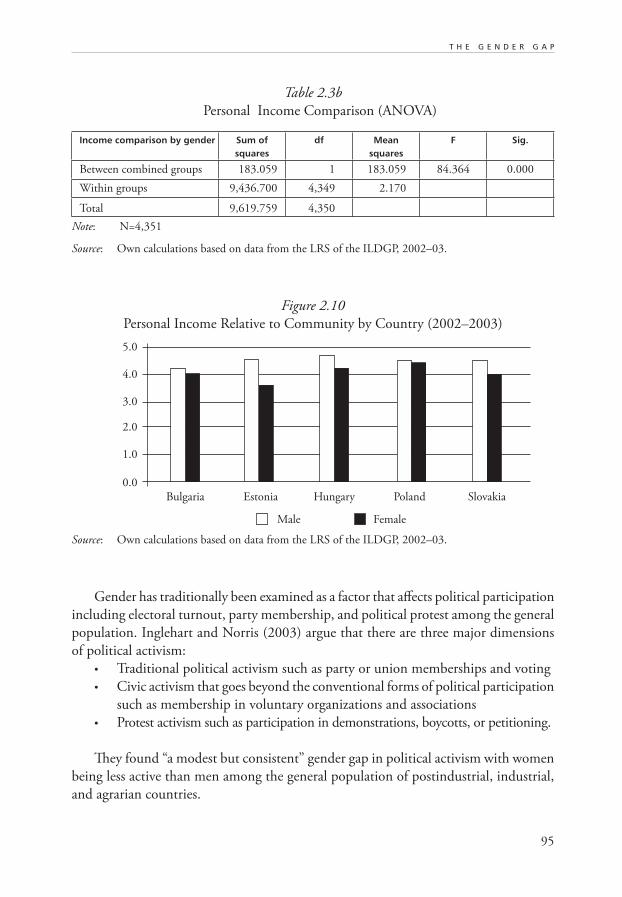
95
T H E G E N D E R G A P
Table 2.3b
Personal Income Comparison (ANOVA)
Income comparison by gender Sum of squares
df Meansquares
F Sig.
Between combined groups 183.059 1 183.059 84.364 0.000
Within groups 9,436.700 4,349 2.170
Total 9,619.759 4,350
Note: N=4,351
Source: Own calculations based on data from the LRS of the ILDGP, 2002–03.
Gender has traditionally been examined as a factor that affects political participation
including electoral turnout, party membership, and political protest among the general
population. Inglehart and Norris (2003) argue that there are three major dimensions
of political activism:
• Traditional political activism such as party or union memberships and voting
• Civic activism that goes beyond the conventional forms of political participation
such as membership in voluntary organizations and associations
• Protest activism such as participation in demonstrations, boycotts, or petitioning.
They found “a modest but consistent” gender gap in political activism with women
being less active than men among the general population of postindustrial, industrial,
and agrarian countries.
Figure 2.10
Personal Income Relative to Community by Country (2002–2003)
Source: Own calculations based on data from the LRS of the ILDGP, 2002–03.
Male Female
0.0
Bulgaria
1.0
2.0
3.0
4.0
SlovakiaHungary
5.0
Estonia Poland
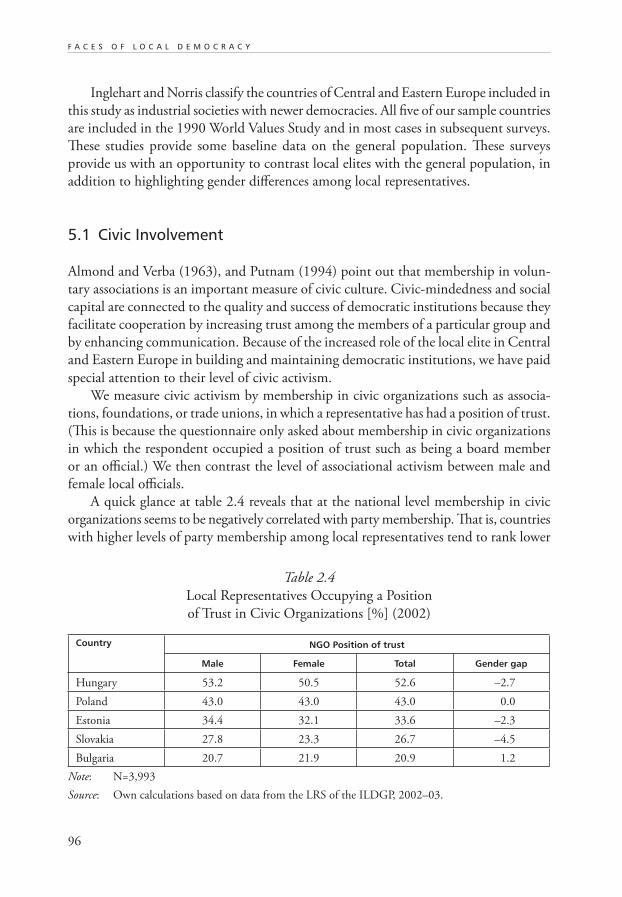
96
F A C E S O F L O C A L D E M O C R A C Y
Inglehart and Norris classify the countries of Central and Eastern Europe included in
this study as industrial societies with newer democracies. All five of our sample countries
are included in the 1990 World Values Study and in most cases in subsequent surveys.
These studies provide some baseline data on the general population. These surveys
provide us with an opportunity to contrast local elites with the general population, in
addition to highlighting gender differences among local representatives.
5.1 Civic Involvement
Almond and Verba (1963), and Putnam (1994) point out that membership in volun-
tary associations is an important measure of civic culture. Civic-mindedness and social
capital are connected to the quality and success of democratic institutions because they
facilitate cooperation by increasing trust among the members of a particular group and
by enhancing communication. Because of the increased role of the local elite in Central
and Eastern Europe in building and maintaining democratic institutions, we have paid
special attention to their level of civic activism.
We measure civic activism by membership in civic organizations such as associa-
tions, foundations, or trade unions, in which a representative has had a position of trust.
(This is because the questionnaire only asked about membership in civic organizations
in which the respondent occupied a position of trust such as being a board member
or an official.) We then contrast the level of associational activism between male and
female local officials.
A quick glance at table 2.4 reveals that at the national level membership in civic
organizations seems to be negatively correlated with party membership. That is, countries
with higher levels of party membership among local representatives tend to rank lower
Table 2.4
Local Representatives Occupying a Position
of Trust in Civic Organizations [%] (2002)
Country NGO Position of trust
Male Female Total Gender gap
Hungary 53.2 50.5 52.6 –2.7
Poland 43.0 43.0 43.0 0.0
Estonia 34.4 32.1 33.6 –2.3
Slovakia 27.8 23.3 26.7 –4.5
Bulgaria 20.7 21.9 20.9 1.2
Note: N=3,993
Source: Own calculations based on data from the LRS of the ILDGP, 2002–03.
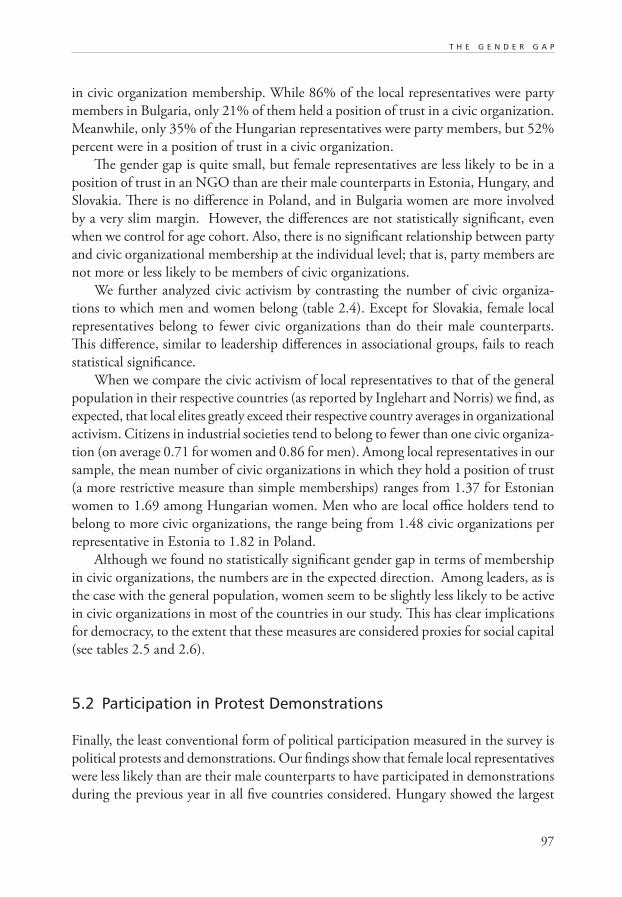
97
T H E G E N D E R G A P
in civic organization membership. While 86% of the local representatives were party
members in Bulgaria, only 21% of them held a position of trust in a civic organization.
Meanwhile, only 35% of the Hungarian representatives were party members, but 52%
percent were in a position of trust in a civic organization.
The gender gap is quite small, but female representatives are less likely to be in a
position of trust in an NGO than are their male counterparts in Estonia, Hungary, and
Slovakia. There is no difference in Poland, and in Bulgaria women are more involved
by a very slim margin. However, the differences are not statistically significant, even
when we control for age cohort. Also, there is no significant relationship between party
and civic organizational membership at the individual level; that is, party members are
not more or less likely to be members of civic organizations.
We further analyzed civic activism by contrasting the number of civic organiza-
tions to which men and women belong (table 2.4). Except for Slovakia, female local
representatives belong to fewer civic organizations than do their male counterparts.
This difference, similar to leadership differences in associational groups, fails to reach
statistical significance.
When we compare the civic activism of local representatives to that of the general
population in their respective countries (as reported by Inglehart and Norris) we find, as
expected, that local elites greatly exceed their respective country averages in organizational
activism. Citizens in industrial societies tend to belong to fewer than one civic organiza-
tion (on average 0.71 for women and 0.86 for men). Among local representatives in our
sample, the mean number of civic organizations in which they hold a position of trust
(a more restrictive measure than simple memberships) ranges from 1.37 for Estonian
women to 1.69 among Hungarian women. Men who are local office holders tend to
belong to more civic organizations, the range being from 1.48 civic organizations per
representative in Estonia to 1.82 in Poland.
Although we found no statistically significant gender gap in terms of membership
in civic organizations, the numbers are in the expected direction. Among leaders, as is
the case with the general population, women seem to be slightly less likely to be active
in civic organizations in most of the countries in our study. This has clear implications
for democracy, to the extent that these measures are considered proxies for social capital
(see tables 2.5 and 2.6).
5.2 Participation in Protest Demonstrations
Finally, the least conventional form of political participation measured in the survey is
political protests and demonstrations. Our findings show that female local representatives
were less likely than are their male counterparts to have participated in demonstrations
during the previous year in all five countries considered. Hungary showed the largest
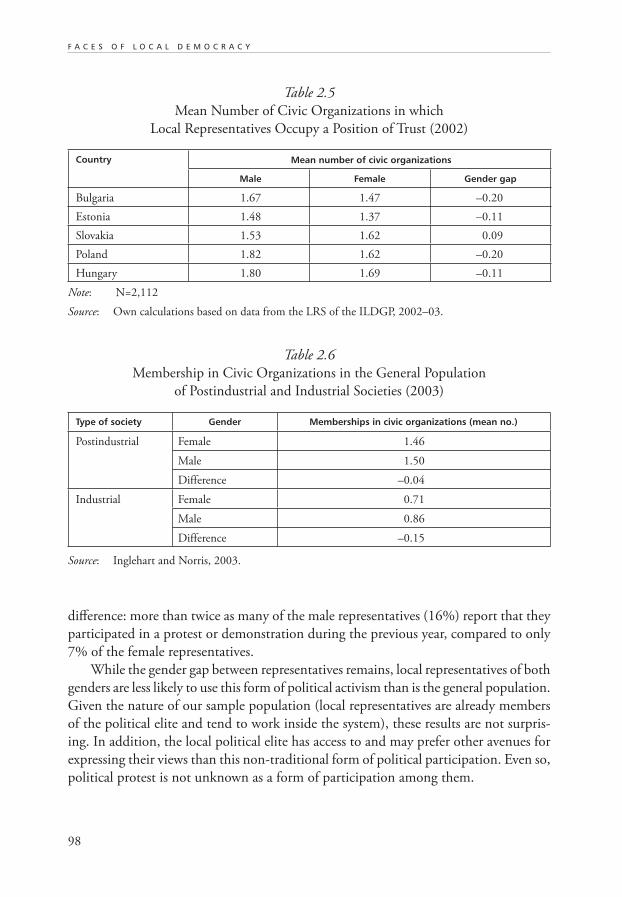
98
F A C E S O F L O C A L D E M O C R A C Y
difference: more than twice as many of the male representatives (16%) report that they
participated in a protest or demonstration during the previous year, compared to only
7% of the female representatives.
While the gender gap between representatives remains, local representatives of both
genders are less likely to use this form of political activism than is the general population.
Given the nature of our sample population (local representatives are already members
of the political elite and tend to work inside the system), these results are not surpris-
ing. In addition, the local political elite has access to and may prefer other avenues for
expressing their views than this non-traditional form of political participation. Even so,
political protest is not unknown as a form of participation among them.
Table 2.5
Mean Number of Civic Organizations in which
Local Representatives Occupy a Position of Trust (2002)
Country Mean number of civic organizations
Male Female Gender gap
Bulgaria 1.67 1.47 –0.20
Estonia 1.48 1.37 –0.11
Slovakia 1.53 1.62 0.09
Poland 1.82 1.62 –0.20
Hungary 1.80 1.69 –0.11
Note: N=2,112
Source: Own calculations based on data from the LRS of the ILDGP, 2002–03.
Table 2.6
Membership in Civic Organizations in the General Population
of Postindustrial and Industrial Societies (2003)
Type of society Gender Memberships in civic organizations (mean no.)
Postindustrial Female 1.46
Male 1.50
Difference –0.04
Industrial Female 0.71
Male 0.86
Difference –0.15
Source: Inglehart and Norris, 2003.
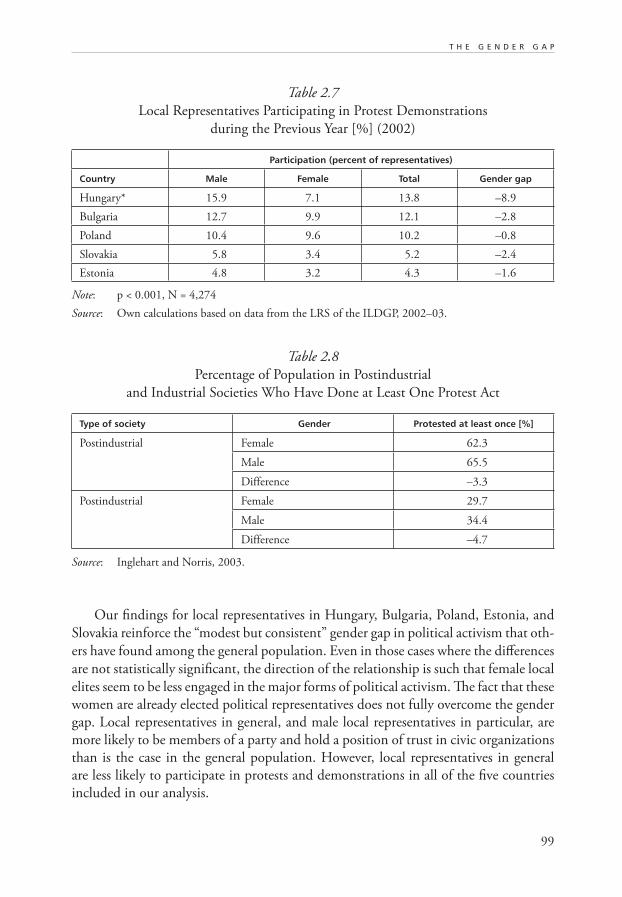
99
T H E G E N D E R G A P
Our findings for local representatives in Hungary, Bulgaria, Poland, Estonia, and
Slovakia reinforce the “modest but consistent” gender gap in political activism that oth-
ers have found among the general population. Even in those cases where the differences
are not statistically significant, the direction of the relationship is such that female local
elites seem to be less engaged in the major forms of political activism. The fact that these
women are already elected political representatives does not fully overcome the gender
gap. Local representatives in general, and male local representatives in particular, are
more likely to be members of a party and hold a position of trust in civic organizations
than is the case in the general population. However, local representatives in general
are less likely to participate in protests and demonstrations in all of the five countries
included in our analysis.
Table 2.7
Local Representatives Participating in Protest Demonstrations
during the Previous Year [%] (2002)
Participation (percent of representatives)
Country Male Female Total Gender gap
Hungary* 15.9 7.1 13.8 –8.9
Bulgaria 12.7 9.9 12.1 –2.8
Poland 10.4 9.6 10.2 –0.8
Slovakia 5.8 3.4 5.2 –2.4
Estonia 4.8 3.2 4.3 –1.6
Note: p < 0.001, N = 4,274
Source: Own calculations based on data from the LRS of the ILDGP, 2002–03.
Table 2.8Percentage of Population in Postindustrial
and Industrial Societies Who Have Done at Least One Protest Act
Type of society Gender Protested at least once [%]
Postindustrial Female 62.3
Male 65.5
Difference –3.3
Postindustrial Female 29.7
Male 34.4
Difference –4.7
Source: Inglehart and Norris, 2003.
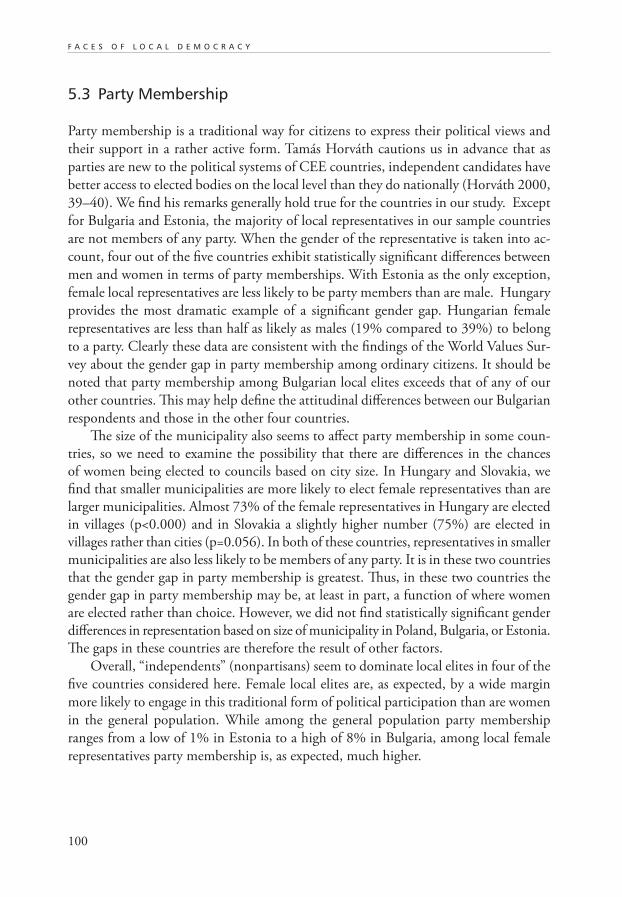
100
F A C E S O F L O C A L D E M O C R A C Y
5.3 Party Membership
Party membership is a traditional way for citizens to express their political views and
their support in a rather active form. Tamás Horváth cautions us in advance that as
parties are new to the political systems of CEE countries, independent candidates have
better access to elected bodies on the local level than they do nationally (Horváth 2000,
39–40). We find his remarks generally hold true for the countries in our study. Except
for Bulgaria and Estonia, the majority of local representatives in our sample countries
are not members of any party. When the gender of the representative is taken into ac-
count, four out of the five countries exhibit statistically significant differences between
men and women in terms of party memberships. With Estonia as the only exception,
female local representatives are less likely to be party members than are male. Hungary
provides the most dramatic example of a significant gender gap. Hungarian female
representatives are less than half as likely as males (19% compared to 39%) to belong
to a party. Clearly these data are consistent with the findings of the World Values Sur-
vey about the gender gap in party membership among ordinary citizens. It should be
noted that party membership among Bulgarian local elites exceeds that of any of our
other countries. This may help define the attitudinal differences between our Bulgarian
respondents and those in the other four countries.
The size of the municipality also seems to affect party membership in some coun-
tries, so we need to examine the possibility that there are differences in the chances
of women being elected to councils based on city size. In Hungary and Slovakia, we
find that smaller municipalities are more likely to elect female representatives than are
larger municipalities. Almost 73% of the female representatives in Hungary are elected
in villages (p<0.000) and in Slovakia a slightly higher number (75%) are elected in
villages rather than cities (p=0.056). In both of these countries, representatives in smaller
municipalities are also less likely to be members of any party. It is in these two countries
that the gender gap in party membership is greatest. Thus, in these two countries the
gender gap in party membership may be, at least in part, a function of where women
are elected rather than choice. However, we did not find statistically significant gender
differences in representation based on size of municipality in Poland, Bulgaria, or Estonia.
The gaps in these countries are therefore the result of other factors.
Overall, “independents” (nonpartisans) seem to dominate local elites in four of the
five countries considered here. Female local elites are, as expected, by a wide margin
more likely to engage in this traditional form of political participation than are women
in the general population. While among the general population party membership
ranges from a low of 1% in Estonia to a high of 8% in Bulgaria, among local female
representatives party membership is, as expected, much higher.
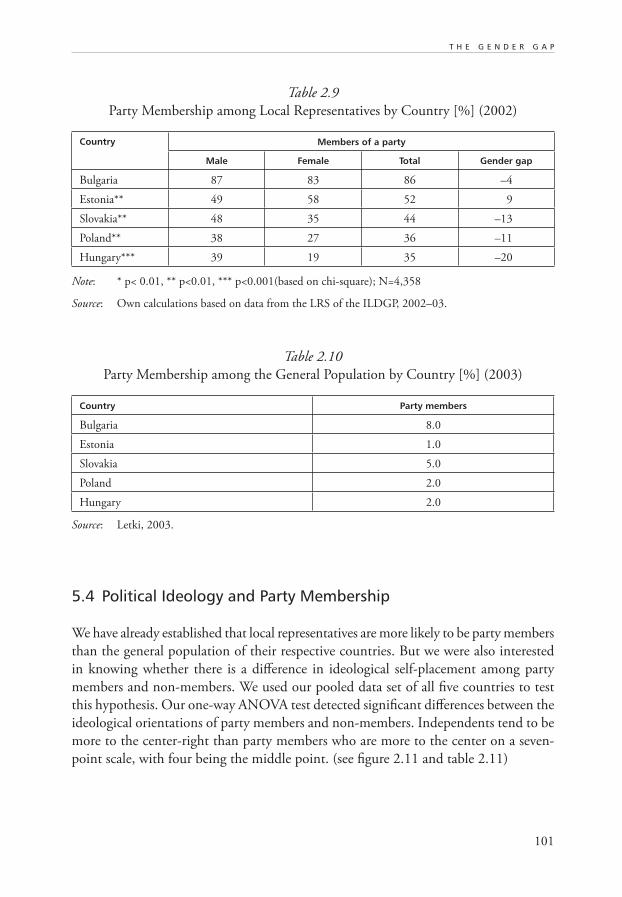
101
T H E G E N D E R G A P
Table 2.9
Party Membership among Local Representatives by Country [%] (2002)
Country Members of a party
Male Female Total Gender gap
Bulgaria 87 83 86 –4
Estonia** 49 58 52 9
Slovakia** 48 35 44 –13
Poland** 38 27 36 –11
Hungary*** 39 19 35 –20
Note: * p< 0.01, ** p<0.01, *** p<0.001(based on chi-square); N=4,358
Source: Own calculations based on data from the LRS of the ILDGP, 2002–03.
Table 2.10
Party Membership among the General Population by Country [%] (2003)
Country Party members
Bulgaria 8.0
Estonia 1.0
Slovakia 5.0
Poland 2.0
Hungary 2.0
Source: Letki, 2003.
5.4 Political Ideology and Party Membership
We have already established that local representatives are more likely to be party members
than the general population of their respective countries. But we were also interested
in knowing whether there is a difference in ideological self-placement among party
members and non-members. We used our pooled data set of all five countries to test
this hypothesis. Our one-way ANOVA test detected significant differences between the
ideological orientations of party members and non-members. Independents tend to be
more to the center-right than party members who are more to the center on a seven-
point scale, with four being the middle point. (see figure 2.11 and table 2.11)
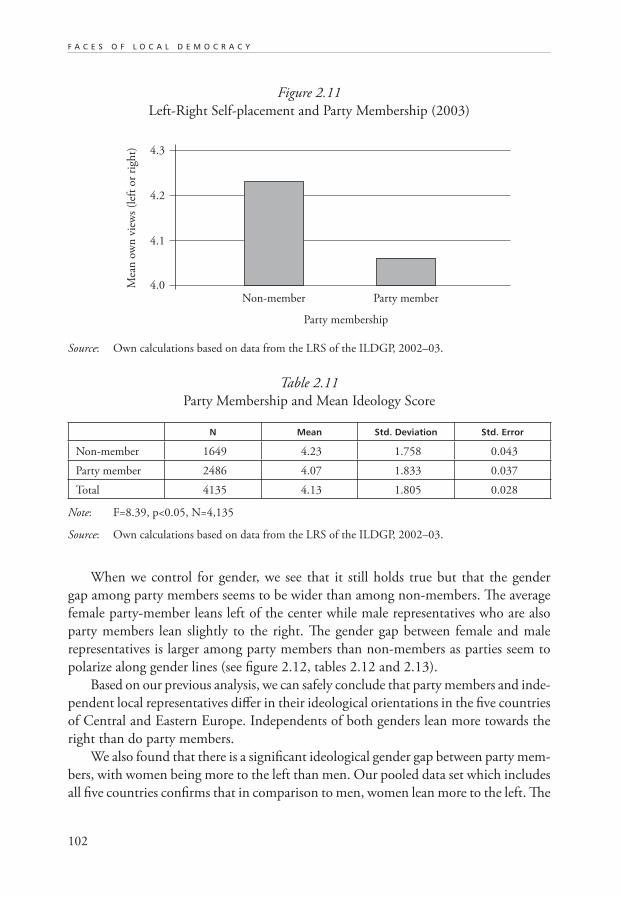
102
F A C E S O F L O C A L D E M O C R A C Y
4.0
4.1
4.2
4.3
Non-member Party member
Mea
n o
wn
vie
ws
(lef
t or
righ
t)
Party membership
Figure 2.11
Left-Right Self-placement and Party Membership (2003)
Source: Own calculations based on data from the LRS of the ILDGP, 2002–03.
When we control for gender, we see that it still holds true but that the gender
gap among party members seems to be wider than among non-members. The average
female party-member leans left of the center while male representatives who are also
party members lean slightly to the right. The gender gap between female and male
representatives is larger among party members than non-members as parties seem to
polarize along gender lines (see figure 2.12, tables 2.12 and 2.13).
Based on our previous analysis, we can safely conclude that party members and inde-
pendent local representatives differ in their ideological orientations in the five countries
of Central and Eastern Europe. Independents of both genders lean more towards the
right than do party members.
We also found that there is a significant ideological gender gap between party mem-
bers, with women being more to the left than men. Our pooled data set which includes
all five countries confirms that in comparison to men, women lean more to the left. The
Table 2.11
Party Membership and Mean Ideology Score
N Mean Std. Deviation Std. Error
Non-member 1649 4.23 1.758 0.043
Party member 2486 4.07 1.833 0.037
Total 4135 4.13 1.805 0.028
Note: F=8.39, p<0.05, N=4,135
Source: Own calculations based on data from the LRS of the ILDGP, 2002–03.
103
T H E G E N D E R G A P
gender gap between male and female representatives is also more pronounced among
party members than non-members.
We expanded our analysis of party membership further by checking whether there
is a gender gap in political ideology after we control for party membership. The sample
sizes were too small to run statistical tests for all the parties within each country. There-
fore, we picked the most “popular” party in each country. After identifying these (i.e.,
those with the most local representatives in our sample) among local representatives
39
40
41
42
43
Non-member Party member
Male Female
Mea
n o
wn
vie
ws
(lef
t or
righ
t)
Figure 2.12
Left-Right Self-placement and Party Membership by Gender (2003)
Source: Own calculations based on data from the LRS of the ILDGP, 2002–03.
Table 2.12
Party Membership and Ideology by Gender
Own views left or right
Party membership Gender Mean N Standard deviation
Non-member
Male 4.24 1,253 1.783
Female 4.18 369 1.676
Total 4.23 1,622 1.759
Party member
Male 4.11 1,859 1.829
Female 3.94 600 1.833
Total 4.07 2,459 1.831
Total Male 4.16 3,112 1.812
Female 4.03 969 1.778
Total 4.13 4,081 1.804
Note: F=7.638, p<0.006, N=4,081
Source: Own calculations based on data from the LRS of the ILDGP, 2002–03.
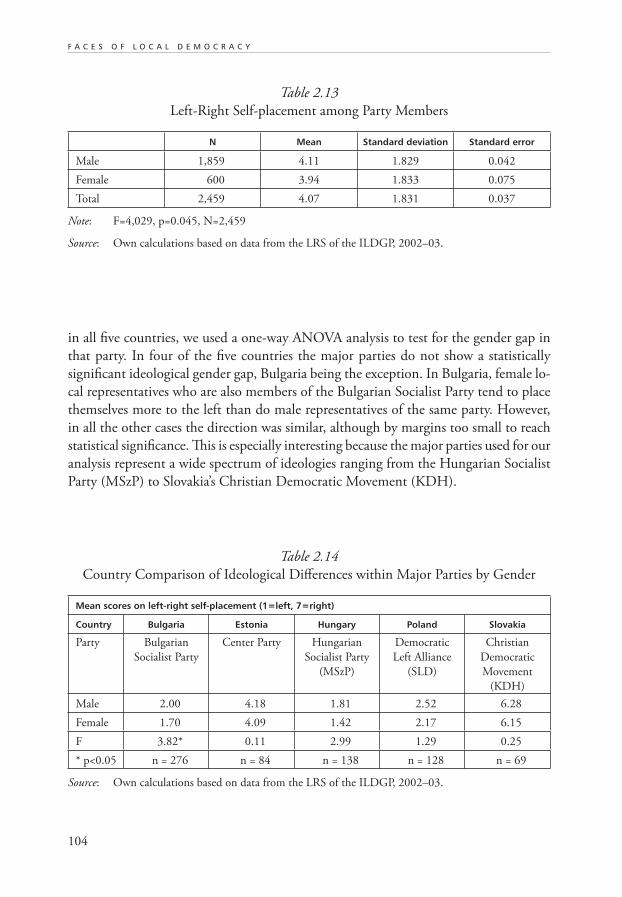
104
F A C E S O F L O C A L D E M O C R A C Y
in all five countries, we used a one-way ANOVA analysis to test for the gender gap in
that party. In four of the five countries the major parties do not show a statistically
significant ideological gender gap, Bulgaria being the exception. In Bulgaria, female lo-
cal representatives who are also members of the Bulgarian Socialist Party tend to place
themselves more to the left than do male representatives of the same party. However,
in all the other cases the direction was similar, although by margins too small to reach
statistical significance. This is especially interesting because the major parties used for our
analysis represent a wide spectrum of ideologies ranging from the Hungarian Socialist
Party (MSzP) to Slovakia’s Christian Democratic Movement (KDH).
Table 2.13
Left-Right Self-placement among Party Members
N Mean Standard deviation Standard error
Male 1,859 4.11 1.829 0.042
Female 600 3.94 1.833 0.075
Total 2,459 4.07 1.831 0.037
Note: F=4,029, p=0.045, N=2,459
Source: Own calculations based on data from the LRS of the ILDGP, 2002–03.
Table 2.14
Country Comparison of Ideological Differences within Major Parties by Gender
Mean scores on left-right self-placement (1=left, 7=right)
Country Bulgaria Estonia Hungary Poland Slovakia
Party Bulgarian
Socialist Party
Center Party Hungarian
Socialist Party
(MSzP)
Democratic
Left Alliance
(SLD)
Christian
Democratic
Movement
(KDH)
Male 2.00 4.18 1.81 2.52 6.28
Female 1.70 4.09 1.42 2.17 6.15
F 3.82* 0.11 2.99 1.29 0.25
* p<0.05 n = 276 n = 84 n = 138 n = 128 n = 69
Source: Own calculations based on data from the LRS of the ILDGP, 2002–03.
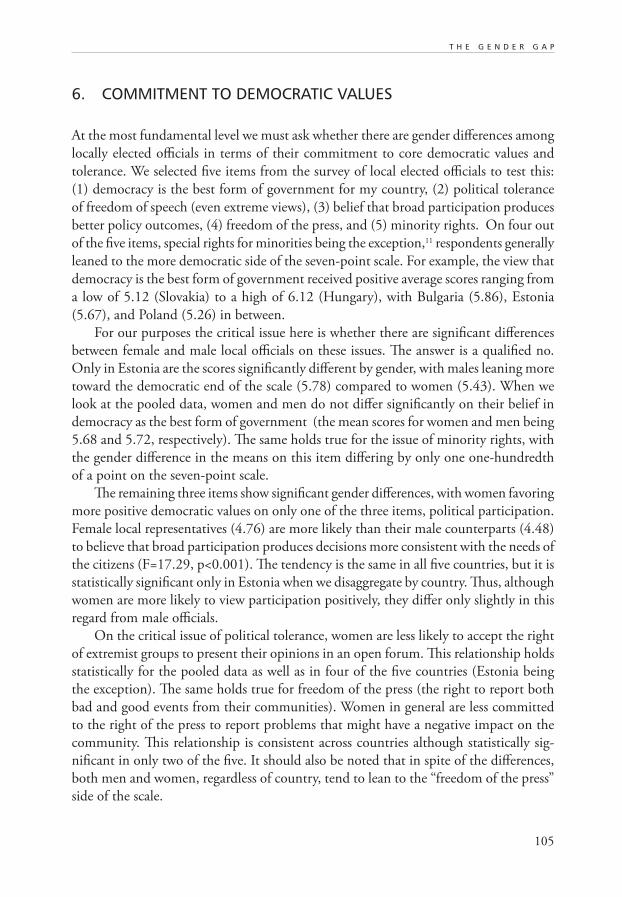
105
T H E G E N D E R G A P
6. COMMITMENT TO DEMOCRATIC VALUES
At the most fundamental level we must ask whether there are gender differences among
locally elected officials in terms of their commitment to core democratic values and
tolerance. We selected five items from the survey of local elected officials to test this:
(1) democracy is the best form of government for my country, (2) political tolerance
of freedom of speech (even extreme views), (3) belief that broad participation produces
better policy outcomes, (4) freedom of the press, and (5) minority rights. On four out
of the five items, special rights for minorities being the exception,11 respondents generally
leaned to the more democratic side of the seven-point scale. For example, the view that
democracy is the best form of government received positive average scores ranging from
a low of 5.12 (Slovakia) to a high of 6.12 (Hungary), with Bulgaria (5.86), Estonia
(5.67), and Poland (5.26) in between.
For our purposes the critical issue here is whether there are significant differences
between female and male local officials on these issues. The answer is a qualified no.
Only in Estonia are the scores significantly different by gender, with males leaning more
toward the democratic end of the scale (5.78) compared to women (5.43). When we
look at the pooled data, women and men do not differ significantly on their belief in
democracy as the best form of government (the mean scores for women and men being
5.68 and 5.72, respectively). The same holds true for the issue of minority rights, with
the gender difference in the means on this item differing by only one one-hundredth
of a point on the seven-point scale.
The remaining three items show significant gender differences, with women favoring
more positive democratic values on only one of the three items, political participation.
Female local representatives (4.76) are more likely than their male counterparts (4.48)
to believe that broad participation produces decisions more consistent with the needs of
the citizens (F=17.29, p<0.001). The tendency is the same in all five countries, but it is
statistically significant only in Estonia when we disaggregate by country. Thus, although
women are more likely to view participation positively, they differ only slightly in this
regard from male officials.
On the critical issue of political tolerance, women are less likely to accept the right
of extremist groups to present their opinions in an open forum. This relationship holds
statistically for the pooled data as well as in four of the five countries (Estonia being
the exception). The same holds true for freedom of the press (the right to report both
bad and good events from their communities). Women in general are less committed
to the right of the press to report problems that might have a negative impact on the
community. This relationship is consistent across countries although statistically sig-
nificant in only two of the five. It should also be noted that in spite of the differences,
both men and women, regardless of country, tend to lean to the “freedom of the press”
side of the scale.
106
F A C E S O F L O C A L D E M O C R A C Y
In sum, although there are differences in commitment to democratic values based
on gender, these differences tend to be small. Furthermore, elected officials, regardless
of gender or country, seem to be relatively more committed to democratic values as
measured by our indices.
7. GENDER DIFFERENCES ON ECONOMIC ISSUES
In their book, Rising Tide: Gender Equality and Cultural Change around the World,
Inglehart and Norris (2003) argue that both voting behavior and public opinion dem-
onstrate that there is a significant gender gap in countries all around the world. This
gender gap is especially notable in the area of left-right self-placement, but in policy
terms manifests itself in perspectives on the role of government. Historically, the gender
gap was one in which males were more likely to be to the left of women on the key is-
sue of the role of the state in the economy. However, there has been a major change in
this gap over time, with women now taking a more “statist” or social democratic view
of the role of government and men tending more toward the right-wing, neo-liberal
perspective. In fact, of some 70 countries for which Inglehart and Norris present data
(2003), 64 show a gender gap where men are to the right of their female compatriots.
There is also a voting gap to complement the opinion differences, with women being
more likely to support parties of the left than men. Changes in this gap have been at-
tributed to a variety of social, cultural, economic, and institutional changes, including
the rise of “postmaterialism.”
Cross-national data indicate that these phenomena are prevalent in the transitional
democracies of Central and Eastern Europe as well as the more advanced industrial
democracies, and in this section we examine the data for our five selected transitional
countries. But the individuals studied here, rather than being drawn from a mass sample,
are selected from a survey of political elites—the locally elected officials at the county
and municipal levels.
We hope to see whether the attitudinal and ideological gaps noted at the mass level
persist among locally elected elites. If gender-related differences in citizen attitudes are
to eventually be manifested in policy, we would expect to see basic differences at the
elite level as well. It is also important to note the direction of change. While this is not
directly possible because we are dealing with cross-sectional data, we can infer change
by comparing age cohorts. This is particularly important because we can identify major
periods of transition, especially for those who grew up in the post-World-War-II period
when the Cold War dominated. Alternatively, those socialized in the later period of the
Cold War and during the transition to democracy may have different expectations and
attitudes.
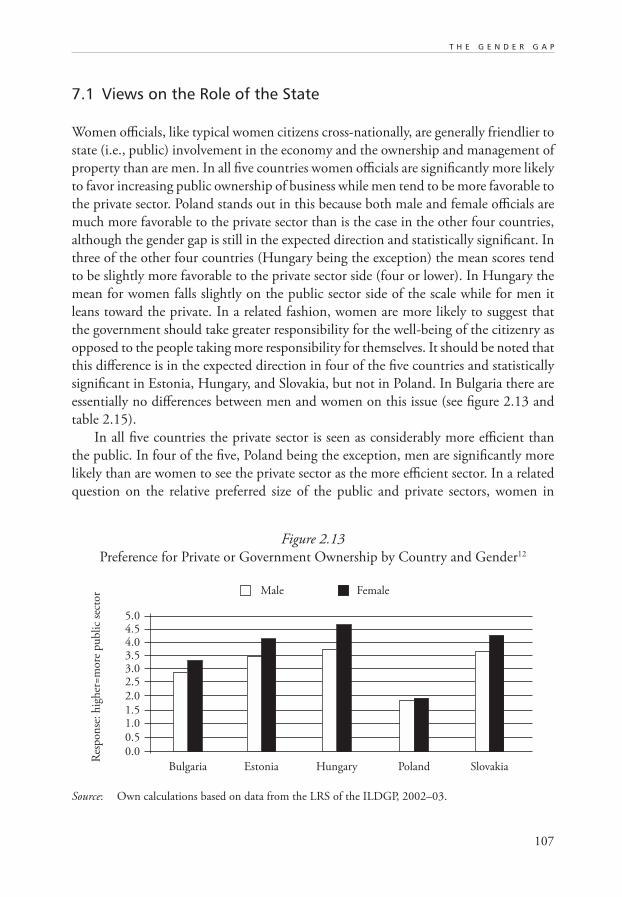
107
T H E G E N D E R G A P
7.1 Views on the Role of the State
Women officials, like typical women citizens cross-nationally, are generally friendlier to
state (i.e., public) involvement in the economy and the ownership and management of
property than are men. In all five countries women officials are significantly more likely
to favor increasing public ownership of business while men tend to be more favorable to
the private sector. Poland stands out in this because both male and female officials are
much more favorable to the private sector than is the case in the other four countries,
although the gender gap is still in the expected direction and statistically significant. In
three of the other four countries (Hungary being the exception) the mean scores tend
to be slightly more favorable to the private sector side (four or lower). In Hungary the
mean for women falls slightly on the public sector side of the scale while for men it
leans toward the private. In a related fashion, women are more likely to suggest that
the government should take greater responsibility for the well-being of the citizenry as
opposed to the people taking more responsibility for themselves. It should be noted that
this difference is in the expected direction in four of the five countries and statistically
significant in Estonia, Hungary, and Slovakia, but not in Poland. In Bulgaria there are
essentially no differences between men and women on this issue (see figure 2.13 and
table 2.15).
In all five countries the private sector is seen as considerably more efficient than
the public. In four of the five, Poland being the exception, men are significantly more
likely than are women to see the private sector as the more efficient sector. In a related
question on the relative preferred size of the public and private sectors, women in
0.0
Bulgaria
0.5
1.01.5
2.0
Estonia Poland Slovakia
Male Female
Hungary
2.53.03.54.04.55.0
Res
pon
se: h
igh
er=m
ore
pu
bli
c se
ctor
Source: Own calculations based on data from the LRS of the ILDGP, 2002–03.
Figure 2.13
Preference for Private or Government Ownership by Country and Gender12
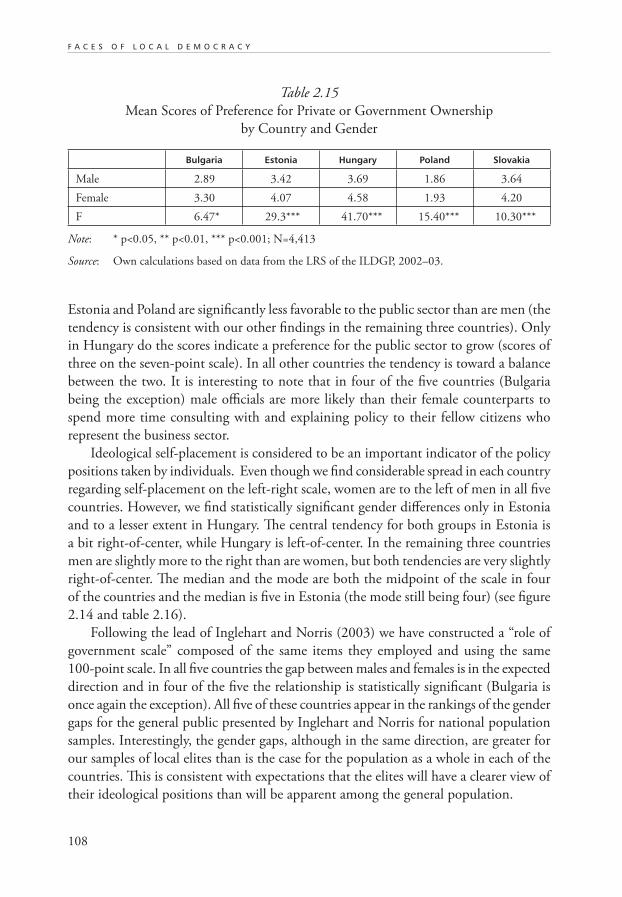
108
F A C E S O F L O C A L D E M O C R A C Y
Estonia and Poland are significantly less favorable to the public sector than are men (the
tendency is consistent with our other findings in the remaining three countries). Only
in Hungary do the scores indicate a preference for the public sector to grow (scores of
three on the seven-point scale). In all other countries the tendency is toward a balance
between the two. It is interesting to note that in four of the five countries (Bulgaria
being the exception) male officials are more likely than their female counterparts to
spend more time consulting with and explaining policy to their fellow citizens who
represent the business sector.
Ideological self-placement is considered to be an important indicator of the policy
positions taken by individuals. Even though we find considerable spread in each country
regarding self-placement on the left-right scale, women are to the left of men in all five
countries. However, we find statistically significant gender differences only in Estonia
and to a lesser extent in Hungary. The central tendency for both groups in Estonia is
a bit right-of-center, while Hungary is left-of-center. In the remaining three countries
men are slightly more to the right than are women, but both tendencies are very slightly
right-of-center. The median and the mode are both the midpoint of the scale in four
of the countries and the median is five in Estonia (the mode still being four) (see figure
2.14 and table 2.16).
Following the lead of Inglehart and Norris (2003) we have constructed a “role of
government scale” composed of the same items they employed and using the same
100-point scale. In all five countries the gap between males and females is in the expected
direction and in four of the five the relationship is statistically significant (Bulgaria is
once again the exception). All five of these countries appear in the rankings of the gender
gaps for the general public presented by Inglehart and Norris for national population
samples. Interestingly, the gender gaps, although in the same direction, are greater for
our samples of local elites than is the case for the population as a whole in each of the
countries. This is consistent with expectations that the elites will have a clearer view of
their ideological positions than will be apparent among the general population.
Table 2.15
Mean Scores of Preference for Private or Government Ownership
by Country and Gender
Bulgaria Estonia Hungary Poland Slovakia
Male 2.89 3.42 3.69 1.86 3.64
Female 3.30 4.07 4.58 1.93 4.20
F 6.47* 29.3*** 41.70*** 15.40*** 10.30***
Note: * p<0.05, ** p<0.01, *** p<0.001; N=4,413
Source: Own calculations based on data from the LRS of the ILDGP, 2002–03.
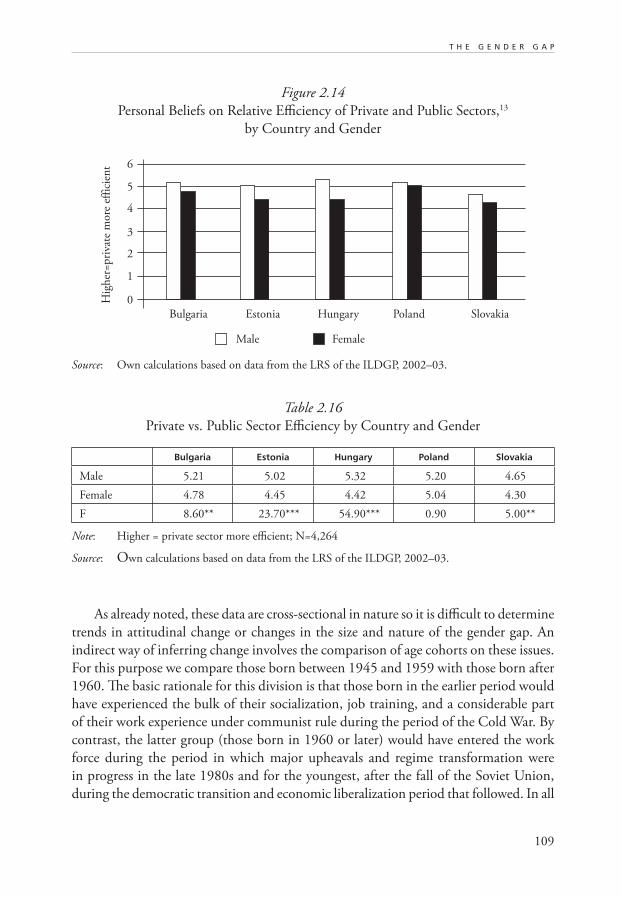
109
T H E G E N D E R G A P
As already noted, these data are cross-sectional in nature so it is difficult to determine
trends in attitudinal change or changes in the size and nature of the gender gap. An
indirect way of inferring change involves the comparison of age cohorts on these issues.
For this purpose we compare those born between 1945 and 1959 with those born after
1960. The basic rationale for this division is that those born in the earlier period would
have experienced the bulk of their socialization, job training, and a considerable part
of their work experience under communist rule during the period of the Cold War. By
contrast, the latter group (those born in 1960 or later) would have entered the work
force during the period in which major upheavals and regime transformation were
in progress in the late 1980s and for the youngest, after the fall of the Soviet Union,
during the democratic transition and economic liberalization period that followed. In all
0
Bulgaria
1
2
3
4
SlovakiaHungary
5
6
Estonia Poland
Male Female
Hig
her
=p
riva
te m
ore
eff
icie
nt
Figure 2.14
Personal Beliefs on Relative Efficiency of Private and Public Sectors,13
by Country and Gender
Source: Own calculations based on data from the LRS of the ILDGP, 2002–03.
Table 2.16
Private vs. Public Sector Efficiency by Country and Gender
Bulgaria Estonia Hungary Poland Slovakia
Male 5.21 5.02 5.32 5.20 4.65
Female 4.78 4.45 4.42 5.04 4.30
F 8.60** 23.70*** 54.90*** 0.90 5.00**
Note: Higher = private sector more efficient; N=4,264
Source: Own calculations based on data from the LRS of the ILDGP, 2002–03.
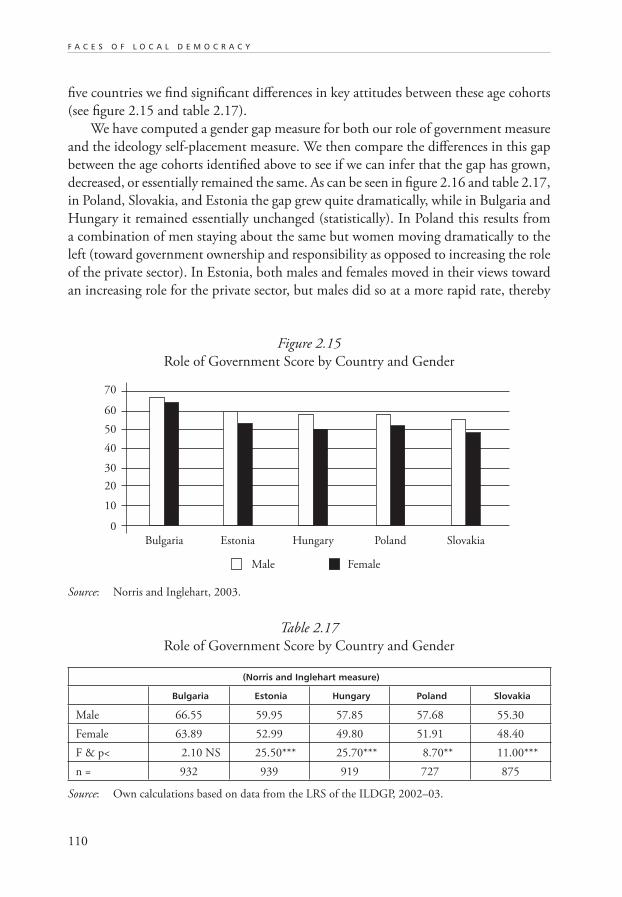
110
F A C E S O F L O C A L D E M O C R A C Y
five countries we find significant differences in key attitudes between these age cohorts
(see figure 2.15 and table 2.17).
We have computed a gender gap measure for both our role of government measure
and the ideology self-placement measure. We then compare the differences in this gap
between the age cohorts identified above to see if we can infer that the gap has grown,
decreased, or essentially remained the same. As can be seen in figure 2.16 and table 2.17,
in Poland, Slovakia, and Estonia the gap grew quite dramatically, while in Bulgaria and
Hungary it remained essentially unchanged (statistically). In Poland this results from
a combination of men staying about the same but women moving dramatically to the
left (toward government ownership and responsibility as opposed to increasing the role
of the private sector). In Estonia, both males and females moved in their views toward
an increasing role for the private sector, but males did so at a more rapid rate, thereby
Table 2.17
Role of Government Score by Country and Gender
(Norris and Inglehart measure)
Bulgaria Estonia Hungary Poland Slovakia
Male 66.55 59.95 57.85 57.68 55.30
Female 63.89 52.99 49.80 51.91 48.40
F & p< 2.10 NS 25.50*** 25.70*** 8.70** 11.00***
n = 932 939 919 727 875
Source: Own calculations based on data from the LRS of the ILDGP, 2002–03.
Figure 2.15
Role of Government Score by Country and Gender
Source: Norris and Inglehart, 2003.
0
Bulgaria
10
20
30
40
Estonia Poland Slovakia
Male Female
Hungary
50
60
70
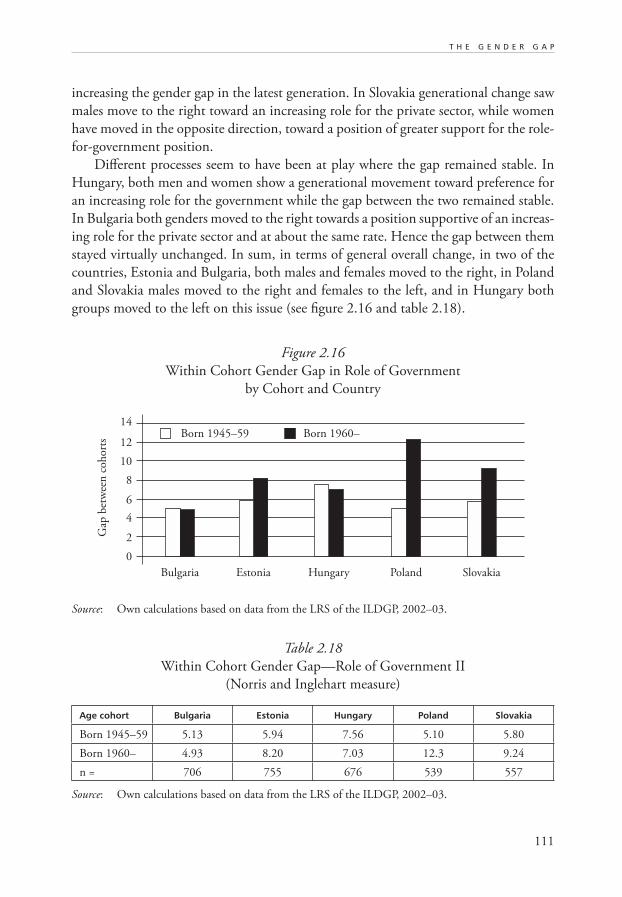
111
T H E G E N D E R G A P
increasing the gender gap in the latest generation. In Slovakia generational change saw
males move to the right toward an increasing role for the private sector, while women
have moved in the opposite direction, toward a position of greater support for the role-
for-government position.
Different processes seem to have been at play where the gap remained stable. In
Hungary, both men and women show a generational movement toward preference for
an increasing role for the government while the gap between the two remained stable.
In Bulgaria both genders moved to the right towards a position supportive of an increas-
ing role for the private sector and at about the same rate. Hence the gap between them
stayed virtually unchanged. In sum, in terms of general overall change, in two of the
countries, Estonia and Bulgaria, both males and females moved to the right, in Poland
and Slovakia males moved to the right and females to the left, and in Hungary both
groups moved to the left on this issue (see figure 2.16 and table 2.18).
Figure 2.16
Within Cohort Gender Gap in Role of Government
by Cohort and Country
Source: Own calculations based on data from the LRS of the ILDGP, 2002–03.
0
Bulgaria
2
4
6
8
Estonia Poland Slovakia
Born 1945–59 Born 1960–
Hungary
10
12
14
Gap
bet
wee
n c
oh
ort
s
Table 2.18
Within Cohort Gender Gap—Role of Government II
(Norris and Inglehart measure)
Age cohort Bulgaria Estonia Hungary Poland Slovakia
Born 1945–59 5.13 5.94 7.56 5.10 5.80
Born 1960– 4.93 8.20 7.03 12.3 9.24
n = 706 755 676 539 557
Source: Own calculations based on data from the LRS of the ILDGP, 2002–03.
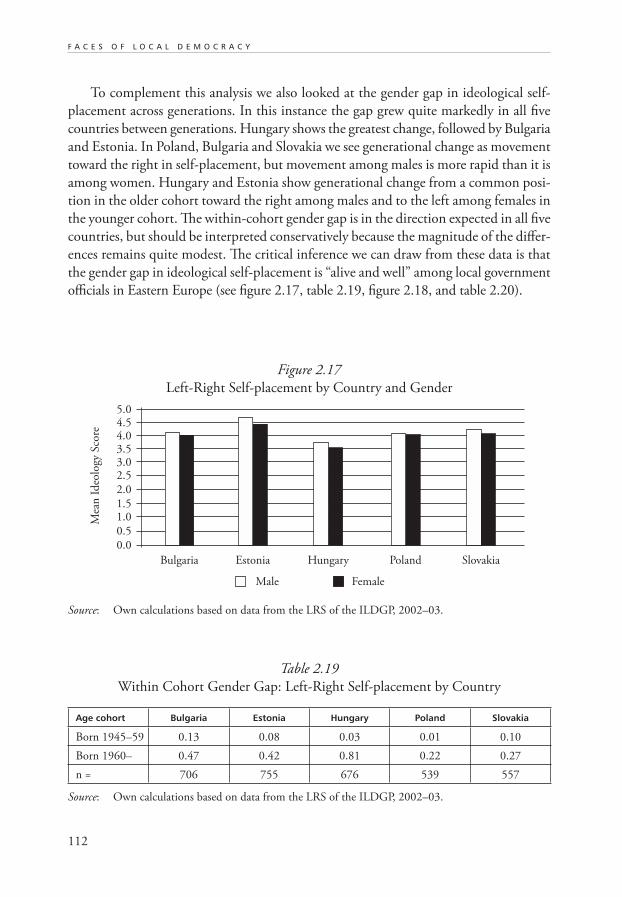
112
F A C E S O F L O C A L D E M O C R A C Y
To complement this analysis we also looked at the gender gap in ideological self-
placement across generations. In this instance the gap grew quite markedly in all five
countries between generations. Hungary shows the greatest change, followed by Bulgaria
and Estonia. In Poland, Bulgaria and Slovakia we see generational change as movement
toward the right in self-placement, but movement among males is more rapid than it is
among women. Hungary and Estonia show generational change from a common posi-
tion in the older cohort toward the right among males and to the left among females in
the younger cohort. The within-cohort gender gap is in the direction expected in all five
countries, but should be interpreted conservatively because the magnitude of the differ-
ences remains quite modest. The critical inference we can draw from these data is that
the gender gap in ideological self-placement is “alive and well” among local government
officials in Eastern Europe (see figure 2.17, table 2.19, figure 2.18, and table 2.20).
0.0
Bulgaria
0.5
1.01.5
2.0
Estonia Poland Slovakia
Male Female
Hungary
2.53.03.54.04.55.0
Mea
n I
deo
logy
Sco
re
Figure 2.17
Left-Right Self-placement by Country and Gender
Source: Own calculations based on data from the LRS of the ILDGP, 2002–03.
Table 2.19
Within Cohort Gender Gap: Left-Right Self-placement by Country
Age cohort Bulgaria Estonia Hungary Poland Slovakia
Born 1945–59 0.13 0.08 0.03 0.01 0.10
Born 1960– 0.47 0.42 0.81 0.22 0.27
n = 706 755 676 539 557
Source: Own calculations based on data from the LRS of the ILDGP, 2002–03.
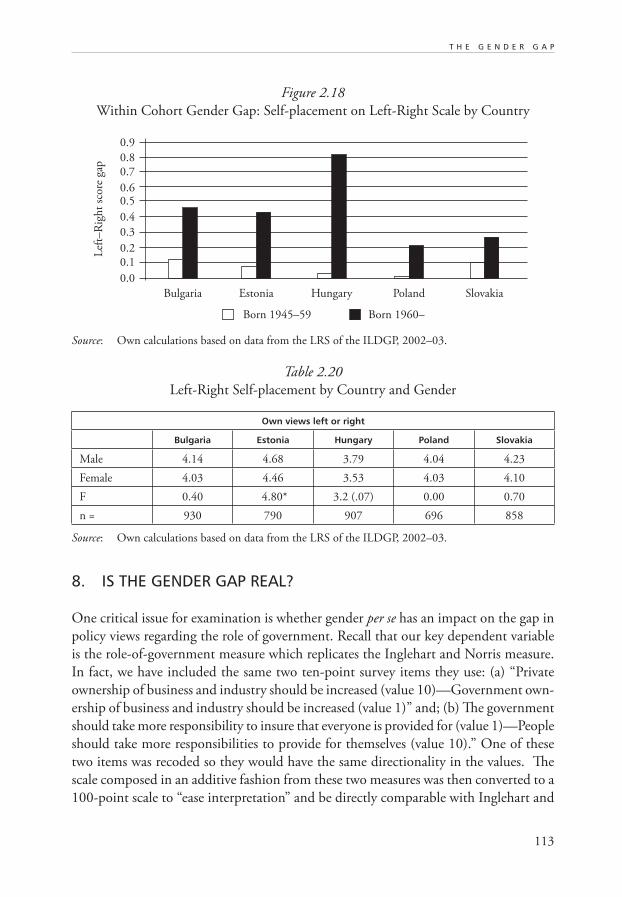
113
T H E G E N D E R G A P
Table 2.20
Left-Right Self-placement by Country and Gender
Own views left or right
Bulgaria Estonia Hungary Poland Slovakia
Male 4.14 4.68 3.79 4.04 4.23
Female 4.03 4.46 3.53 4.03 4.10
F 0.40 4.80* 3.2 (.07) 0.00 0.70
n = 930 790 907 696 858
Source: Own calculations based on data from the LRS of the ILDGP, 2002–03.
Figure 2.18
Within Cohort Gender Gap: Self-placement on Left-Right Scale by Country
0.0
Bulgaria
0.1
0.2
0.3
0.4
Estonia Poland Slovakia
Born 1945–59 Born 1960–
Hungary
0.50.6
0.7
0.8
0.9
Lef
t–R
igh
t sc
ore
gap
Source: Own calculations based on data from the LRS of the ILDGP, 2002–03.
8. IS THE GENDER GAP REAL?
One critical issue for examination is whether gender per se has an impact on the gap in
policy views regarding the role of government. Recall that our key dependent variable
is the role-of-government measure which replicates the Inglehart and Norris measure.
In fact, we have included the same two ten-point survey items they use: (a) “Private
ownership of business and industry should be increased (value 10)—Government own-
ership of business and industry should be increased (value 1)” and; (b) The government
should take more responsibility to insure that everyone is provided for (value 1)—People
should take more responsibilities to provide for themselves (value 10).” One of these
two items was recoded so they would have the same directionality in the values. The
scale composed in an additive fashion from these two measures was then converted to a
100-point scale to “ease interpretation” and be directly comparable with Inglehart and
114
F A C E S O F L O C A L D E M O C R A C Y
Norris. The Inglehart and Norris scale was applied by them to data from national sam-
ples of individuals in 70 different countries between 1990 and 2001. The gaps between
male and female interviewees show women to the left (towards the “more government
involvement” side of the scale) in 65 of these countries. Interestingly, our analysis of local
officials closely mirrors the differences found at the mass level for each of the countries,
but the point differences are one to three points higher (on the 100-point scale).
A key question is whether the impact of gender is sustained when we control for a
variety of other factors. In order to further examine this possibility we have pooled our
data sets for the five Central and Eastern European countries included in the survey
of local officials. We have already noted that the male-female gender gap is statistically
significant for four of the five countries (Bulgaria being the lone exception). In our
pooled data set we first look at the “role of government” measure to determine if it re-
mains affected by gender among local government officials in all five countries. Using an
ANOVA we in fact find that the relationship is highly significant (F=65.1, p<0.001).
Our next strategy is to move beyond the bivariate relationship to a multivariate
analysis. We employ an OLS regression to see if the impact of gender remains important
after we control for a variety of other factors. The independent variables are handled
in four groups: (1) social background factors (age, education, and gender), (2) cultural
values (trust in institutions, postmaterialism, and left-right ideology), (3) democratic
values (democracy as the best system, political tolerance, minority rights, participation,
and media independence), and (4) a series of country dummy variables to sort out
country-specific effects.
Education is difficult to compare because of the lack of exact equivalencies across
nations. However, we are dealing with elected local government officials, about half of
whom have had at least some form of post secondary higher education. Hence we use
this break point for its comparative validity. The dummy variable we created is for some
higher education (1) or no post-secondary education (0). We also grouped individuals by
age to get a post-Cold-War and a pre-Cold-War generation (arbitrarily defined as those
born before and after 1960) and created a binary variable for age cohort. We also tested
the model with actual age as a variable. The “trust in government” variable is a combined
measure of responses to a series of questions on the trust in various government institu-
tions (executive, legislature, parties, police, justice system, etc.). The postmaterialism
scale is Inglehart’s standard four-point scale used cross-nationally in the World Values
and related surveys. We also ran these regressions with dummy variables for each of the
countries to further sort out possible country-specific effects.
In table 2.21 we test five models to explain “the role of government” index. In Model
One (not shown in the table) we examine the impact of gender alone. It remains quite
significant as a factor in our pooled data set. In Model Two we add in social background
characteristics. Age, higher education, and gender are all statistically significant in this
model. In Model Three we add in the cultural and democratic values dimensions.
115
T H E G E N D E R G A P
As can be seen in this model all three cultural values, trust in institutions, postmaterial-
ism, and left-right self-placement are statistically significant contributors. Among the
democratic values items, democracy as the best system, support for minority rights,
and media independence are statistically significant but neither political tolerance nor
the value placed on popular participation figure in the equation. Gender and higher
education remain significant but the age variable drops out in Model Three.
In Model Four we add in the organizational membership variables, party member-
ship, and membership in an NGO in which they hold a position of responsibility. The
other variables that are statistically significant in Model Three remain so, but the two
additional variables are significant, and the explained variance increased a bit. It is worth
noting that when we ran this same regression for each country sample individually,
the organizational membership variables are both significant only in Bulgaria. Party
membership but not NGO position is significant in Hungary.
In Model Five we include the same sets of variables but add in dummy variables
for country to sort out any country-specific effects. Interestingly, we see significant
country effects for Estonia, Hungary, Poland, and Slovakia. However, we can explain
the same variance by including only Bulgaria. When any other countries are included
with Bulgaria, the combination does not increase the explanatory power of our models.
Bulgaria appears to be somewhat different than the other four countries in the views of
local officials on the role of government. In Model Five we see that all of our background
factors, including age, all of the cultural values variables, the same three democratic
values, and the four country dummy variables are significant. However, the organiza-
tional membership variables drop out of the equation (in terms of significance).
These models confirm the ongoing impact of gender on overall perspectives on the
role of government in the economy. When we examine the standardized betas we see that
the more educated, the more right-wing ideologically, the more postmaterialist, and the
greater the level of trust in government institutions, the greater the support for a strong
private sector role or less government involvement in the economy and responsibility for
the well-being of the country’s citizens. The democratic values items show that greater
support for democracy as a system and for a free press are associated with support for
more government involvement in the economy, and greater commitment to minority
rights is associated with a preference for less government involvement. The impact of
gender is consistent with earlier findings. Women are more likely to support a larger
government role and collective responsibility for individual welfare than are men, who
seem to prefer the private sector and more individual responsibility. Age cohort did not
have a significant impact in the pooled data set, but age (as a continuous variable) did.
It has a very limited impact (approaching statistical significance) with the young being
only slightly more likely to support a stronger role for government.
When we entered in the country dummy variables, all were statistically significant,
and they had some impact on the dependent variable (as measured by the standardized
116
F A C E S O F L O C A L D E M O C R A C Y
betas). They did not affect the significance or impact of the other variables. Bulgaria
stands out in this respect as being somehow different than the other four. While the
signs for the betas for the other four countries are negative (more supportive of greater
government involvement), the sign for Bulgaria is positive. That is, Bulgarian local of-
ficials differ from their colleagues in the other countries in being much stronger in their
support for privatization and a greater role for the private sector. What is consistent across
all of these models, however, is the impact of gender. Therefore, our overall conclusion
is that the gap associated with gender does indeed have its origins there rather than in
other characteristics, and is of some importance (see table 2.21).
9. CONCLUSIONS
In this paper we examined gender differences, particularly the so-called gender gap
among local representatives in five countries of Central and Eastern Europe (CEE), e.g.,
Bulgaria, Estonia, Hungary, Poland, and Slovakia. Differences at this level are especially
important because it is in the locales that many of the issues that directly impact on the
lives of women are addressed on a daily basis. Our findings, based on a large sample of
local councilors in these countries, are consistent with those for the general population
and with trends in the gender gap worldwide.
Women are relatively well represented in local government in Central and Eastern
Europe. Male and female locally elected officials in these countries share common edu-
cational backgrounds, a sense of optimism regarding their respective municipalities, and
belief in democracy as the best form of government. Although there are gender-related
differences in commitment to core democratic values, these differences are relatively
small. Both men and women tend to place themselves on the more democratic side of
the scale.
We also examined gender differences in variables related to social capital such as civic
organizational memberships and activism. Here too, we find a small but consistent gap,
with males holding more organizational memberships and active roles. They are also
more willing and likely to participate in nontraditional forms of political participation
such as demonstrations. Women officials are more likely to be independents rather than
formally enrolled members of political parties. In other words, their political bases and
electoral support are built on personal networks as well as associational groups.
We find that perceptions of the very nature of the role of the state come into play.
The gender gap is consistent from country to country. Women see a greater role for the
state in the economy and in the provision of help and support to citizens. They are also
less convinced of the advantages of the private sector than are males occupying similar
roles and functions. The existing gap seems to be growing as we see clear generational
(age cohort) differences consistent with growth in the gap over time. This is further
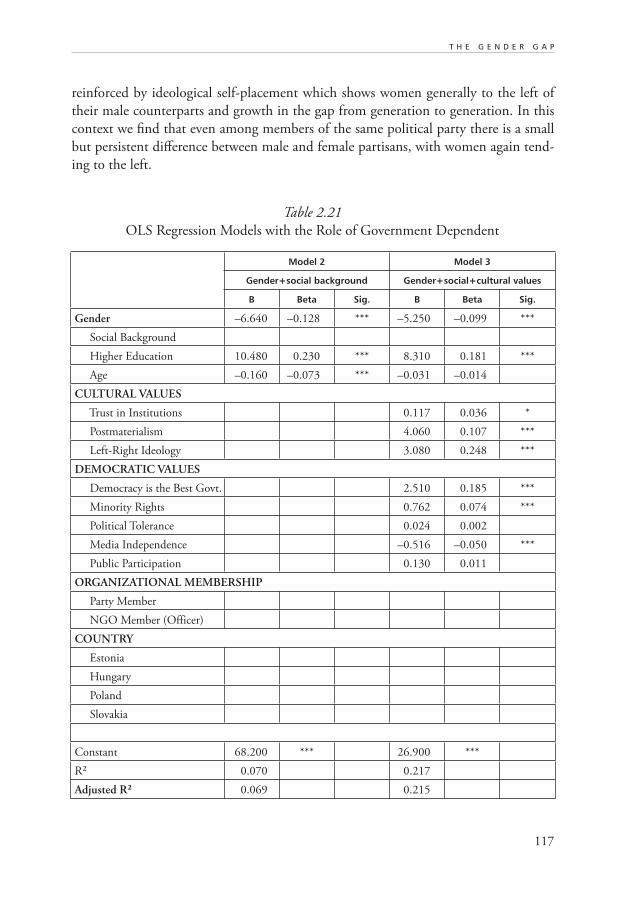
117
T H E G E N D E R G A P
Table 2.21
OLS Regression Models with the Role of Government Dependent
Model 2 Model 3
Gender+social background Gender+social+cultural values
B Beta Sig. B Beta Sig.
Gender –6.640 –0.128 *** –5.250 –0.099 ***
Social Background
Higher Education 10.480 0.230 *** 8.310 0.181 ***
Age –0.160 –0.073 *** –0.031 –0.014
CULTURAL VALUES
Trust in Institutions 0.117 0.036 *
Postmaterialism 4.060 0.107 ***
Left-Right Ideology 3.080 0.248 ***
DEMOCRATIC VALUES
Democracy is the Best Govt. 2.510 0.185 ***
Minority Rights 0.762 0.074 ***
Political Tolerance 0.024 0.002
Media Independence –0.516 –0.050 ***
Public Participation 0.130 0.011
ORGANIZATIONAL MEMBERSHIP
Party Member
NGO Member (Officer)
COUNTRY
Estonia
Hungary
Poland
Slovakia
Constant 68.200 *** 26.900 ***
R² 0.070 0.217
Adjusted R² 0.069 0.215
reinforced by ideological self-placement which shows women generally to the left of
their male counterparts and growth in the gap from generation to generation. In this
context we find that even among members of the same political party there is a small
but persistent difference between male and female partisans, with women again tend-
ing to the left.
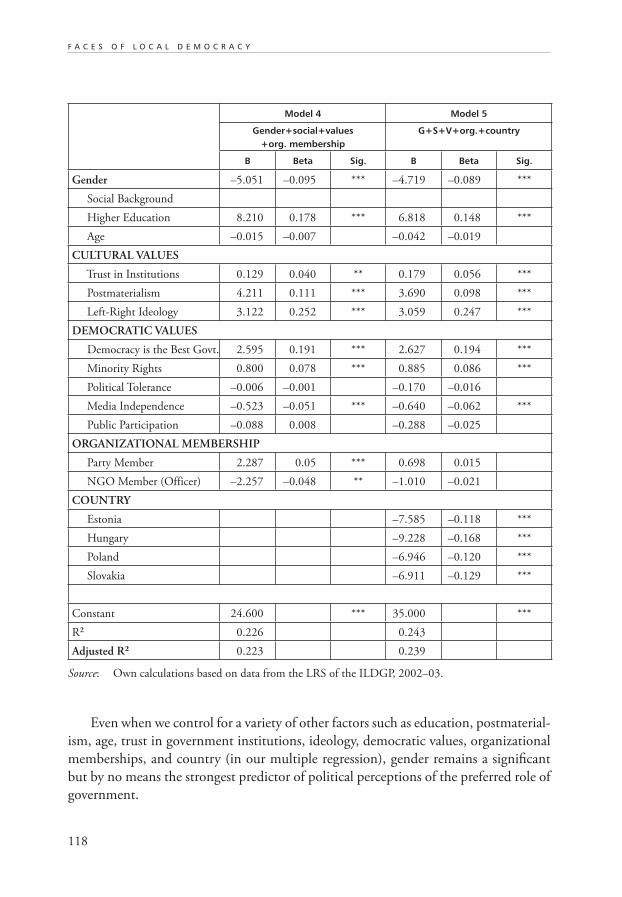
118
F A C E S O F L O C A L D E M O C R A C Y
Model 4 Model 5
Gender+social+values+org. membership
G+S+V+org.+country
B Beta Sig. B Beta Sig.
Gender –5.051 –0.095 *** –4.719 –0.089 ***
Social Background
Higher Education 8.210 0.178 *** 6.818 0.148 ***
Age –0.015 –0.007 –0.042 –0.019
CULTURAL VALUES
Trust in Institutions 0.129 0.040 ** 0.179 0.056 ***
Postmaterialism 4.211 0.111 *** 3.690 0.098 ***
Left-Right Ideology 3.122 0.252 *** 3.059 0.247 ***
DEMOCRATIC VALUES
Democracy is the Best Govt. 2.595 0.191 *** 2.627 0.194 ***
Minority Rights 0.800 0.078 *** 0.885 0.086 ***
Political Tolerance –0.006 –0.001 –0.170 –0.016
Media Independence –0.523 –0.051 *** –0.640 –0.062 ***
Public Participation –0.088 0.008 –0.288 –0.025
ORGANIZATIONAL MEMBERSHIP
Party Member 2.287 0.05 *** 0.698 0.015
NGO Member (Officer) –2.257 –0.048 ** –1.010 –0.021
COUNTRY
Estonia –7.585 –0.118 ***
Hungary –9.228 –0.168 ***
Poland –6.946 –0.120 ***
Slovakia –6.911 –0.129 ***
Constant 24.600 *** 35.000 ***
R² 0.226 0.243
Adjusted R² 0.223 0.239
Source: Own calculations based on data from the LRS of the ILDGP, 2002–03.
Even when we control for a variety of other factors such as education, postmaterial-
ism, age, trust in government institutions, ideology, democratic values, organizational
memberships, and country (in our multiple regression), gender remains a significant
but by no means the strongest predictor of political perceptions of the preferred role of
government.
119
T H E G E N D E R G A P
Although we have no direct evidence of actual policy differences or the impact of
these gender differences on local and municipal councils, several hypotheses do emerge
from this analysis. Women are or are close to a critical mass of local officials in all five
countries (ranging from 21%–32% of elected councilors). First, since their views on the
role of the state show some differences from those of their male counterparts, we expect
some local policy differences to emerge, with women taking a more social democratic
perspective and men leaning toward a more neo-liberal approach to social welfare issues.
Second, since women constitute a critical mass on many local councils, we expect that
there will be a rise in consideration of gender-related issues such as maternal health,
state-supported day care, and spousal abuse and violence. We hypothesize these will
become important subjects of local legislation and policy. Third, the election of many
women to local office provides a vital training ground for future leaders at higher levels.
Thus, we see the possibility of a longer-term influence of the local gender gap on national
representation and policy.
NOTES
1 Funding for our research was graciously provided by the Tocqueville Research Center Foundation,
under its program in Comparative Local Democracy in Central and Eastern Europe.
2 See Rule 1987; Welch and Studlar 1986; Bullock and MacManus 1991; Studlar and McAllister
1991; Studlar and Welch 1991; Chapman 1993; Caul, 1997; Maille 1990; Matland and Studlar
1996; Reynolds and Reilly et al. 1997; and Vengroff, Nyiri, and Fugiero 2003.
3 Political Rights and Civil Liberties are measured on a one-to-seven scale, with one representing the
highest degree of freedom and seven the lowest. Source http://www.freedomhouse.org.
4 Lower scores mean higher ranks.
5 These data are currently housed at the Tocqueville Research Center in Budapest.
6 Even though they are significant at the 0.000 level, using Chi Square test of significance.
7 The two questions used for comparison are: “Generally speaking, how satisfied are you with the way
things are going in the municipality where you are a representative of the local government?” and
“In your estimation, how will things be going in your local community five years from now?”
(1=much worse, 4=about the same, and 7=much better).
8 Respondents were asked: “Roughly how many hours in an average week do you usually devote to your
activities as a councilor?” (p<0.000 using Chi-Square).
9 “How often do you [plan to] hold office hours for residents?” (p<0.000 using Chi-Square).
10 “Comparing your own personal income with others in your municipality, is it higher or lower than
the average income in your municipality?” (p>0.000 using ANOVA).
11 It is possible to interpret this item in different ways because one pole is equal rights for everyone.
12 Higher score means preference for public sector.
120
F A C E S O F L O C A L D E M O C R A C Y
13 “Some people would agree, and some would disagree with the following statements about the political
and administrative system. Please indicate the extent to which you personally agree or disagree with
them on our seven-point scale. 1 means that you completely disagree with the statement; 7 means you
agree completely with the statement; and if your views fall somewhere in between, then choose one of
the numbers in between: In general the private sector is more efficient than the public sector.”
REFERENCES
Almond, G.A. and S. Verba. 1963. The Civic Culture: Political Attitudes and Democracy
in Five Nations. Princeton, NJ: Princeton University Press.
Bullock, C. and S. McManus. 1991. Municipal structure and the election of council-
women. Journal of Politics 53: 75–89.
Carroll, S.J. Partisan dynamics of the gender gap among state legislators. Spectrum: The
Journal of State Government 75 (Fall 2002): 18–23.
Chapman, J. 1993. Politics, Feminism and the Reformation of Gender. London:
Routledge.
Caul, M. 1997. Women’s representation in parliament: the role of political parties. UC
Irvine: Center for the Study of Democracy.
De Vries, M. 2000. The rise and fall of decentralization: a comparative analysis of argu-
ments and practices in European countries. European Journal of Political Research
38: 193–224.
Donley S. and S. Welch. 1991. Does district magnitude matter? Women candidates in
local London elections. Western Political Quarterly 44 (June 1991): 457–466.
Fodor, E. 2002. Smiling women and fighting men: the gender of the communist subject
in state socialist Hungary. Gender & Society 16 (2): 236–259.
Horváth, M.T. (ed.). 2000. Decentralization: Experiments and Reforms. Budapest: Open
Society Institute.
Inglehart, R. and P. Norris. 2003. Rising Tide: Gender Equality and Cultural Change
Around the World. Cambridge: Cambridge University Press.
Jaquette, J. and S. Wolchik (eds.). 1998. Women and Democracy. Baltimore: Johns
Hopkins University Press.
Letki, N. 2003. Explaining political participation in East-Central Europe: Social
capital, democracy and the communist past. In: Nuffield College Working Papers
in Politics.
Loughlin, J. and S. Mazey. 1995. The End of the French Unitary State?: Ten Years of
Regionalization in France. Portland, Oregon: Frank Cass.
121
T H E G E N D E R G A P
Lovendusi, J. 1986. Women and European Politics: Contemporary Feminism and Public
Policy. Amherst: The University of Massachusetts Press.
Lovenduski, J. and P. Norris. 2003. Westminster women: The politics of presence.
Political Studies 51 (1): 84–102.
Maille, C. 1990. Les Quebecoise a la conquete du pouvoir politique. Montreal: Editions
St. Martin.
Page, E. 1991. Localism and Centralism in Europe. New York: Oxford University Press.
Phillips, A. 1998. Feminism and Politics, Oxford Readings in Feminism. Oxford; New
York: Oxford University Press.
Putnam, R.D., R. Leonardi, and R. Nanetti. 1994. Making Democracy Work: Civic
Traditions in Modern Italy. Princeton NJ: Princeton University Press.
Reynolds, A. and B. Reilly et al. 1997. The International IDEA Handbook of Electoral
System Design. Stockholm: International Idea.
Rueschemeyer, M. 1994. Women in the Politics of Postcommunist Eastern Europe. Armonk,
NY: M.E. Sharpe.
Rule, W. 1987. Electoral systems, contextual factors and women’s opportunity for
election to parliament in twenty-three democracies.Western Political Quarterly 40:
477–498.
Studlar, D.T. and I. McAllister. 1991. Political recruitment to the Australian legislature:
Toward an explanation of women’s electoral disadvantages.Western Political Quarterly
44 (June 1991): 467–486.
Thielemann, G.S. and J. Stewart, Jr. 1996. A demand side perspective on the impor-
tance of representative bureaucracy. Public Administration Review 56 (March/April):
168–73.
Thomas, S. 1994. Women in state legislatures: one step at a time.” In: E. Cook, S. Tho-
mas, and C. Wilcox (eds.). The Year of the Woman. Boulder: Westview: 141–159.
Thomas, S. and C. Wilcox (eds.). 1998. Women and Elective Office. New York: Oxford
University Press.
UNDP (United Nations Development Programme). 2001. Human Development Report.
New York: Oxford University Press.
Vengroff, R., Z. Nyiri, and M. Fugiero. 2003. Electoral system and gender representation
in subnational legislatures. Political Research Quarterly 56 (June): 163–173.
Welch, S. and D. Studlar. 1986. British public opinion towards women in politics:
A comparative perspective. Western Political Quarterly 39: 138–154.
123
The Influence of Local Media
on Local Government Performance,
and Why It Matters
Tania Gosselin
ABSTRACT
This chapter considers the impact of local media on local government decision-making
(smoothness and efficiency) and on democratic performance (inclusiveness). Four as-
pects of local media systems are considered: the number of media outlets present in the
locality, the diversity of the ownership structure, the extent to which media cover local
political affairs, and the size of their audience. Findings show that coverage quality, the
number of outlets, and the diversity of the ownership structure are positively associated
with democratic performance. Such media features, however, have virtually no impact
on how quickly and smoothly local authorities reach decisions.
We also examine the hypothesis that the impact of the media on democratic perform-
ance may be enhanced by certain characteristics of the local civil society. In Hungary
and Romania, the coverage quality and the number of local media outlets were found
to exercise a greater influence on the performance of local governments in localities
having more civic organizations and where citizens were more involved in public life.
Further investigations of potential mechanisms of media influence on performance
reveals that beliefs of chief administrative officers and councilors regarding the influence
of local media outlets do not translate into greater or lesser impact of media features
on democratic performance.
The analysis shows that local media do have an impact on the democratic, inclusive
character of local authorities’ decision-making practices and allows us to quantify this
impact. While the available measures do not permit definite conclusions about the
mechanisms through which these influences operate, initial findings lend some support
to the theory that a livelier civil society contributes to the impact of political informa-
tion disseminated by the media.
125
The Influence of Local Media
on Local Government Performance,
and Why It Matters
Tania Gosselin
1. INTRODUCTION
People often observe that the media have an influence on the well-being of democracy,
and Dawisha writes: “It can be generally assumed that the greater the independence
and pluralism of the media ..., the greater will be the level of civic trust and civic in-
volvement” (1996, 54). This connection is also assumed to operate at the local level,
but there has been no attempt to validate this assumption, as the absence of literature
demonstrates. It has become almost a truism to say that the plurality and independence
of local media are important and have a positive effect on the performance of democratic
local government.
If it is true that politically well-informed citizens contribute to the well-being of
democracy, then such effects should be assessed. This chapter seeks to establish empiri-
cally whether and how local media enhance the quality of local governance. Relying
on survey data gathered within the framework of the Indicators of Local Democratic
Governance Project (ILDGP), we focus our analysis on the decisional and democratic
aspects of local government performance in more than 2,000 municipalities of Hungary,
Latvia, Poland, and Romania. We assess the links between certain characteristics of the
local media (number of outlets, ownership structure, the extent of coverage of public
affairs, and audience size) and the capacity of local governments to make decisions in
a timely and effective manner (decisional performance) that includes citizens in the
decision-making process (democratic performance).
Following some introductory remarks about the local media landscape in the four
countries included in the research, the chapter provides an overview of theories but-
tressing the assumption that media and local government performance may be linked.
This is followed by an outline of the hypotheses to be tested with respect to how media
presence, ownership structure, quality content, and penetration have an impact on per-
formance. We then describe the data and method of analysis, followed by our findings.
The conclusion presents our interpretation of the results, suggests new hypotheses, and
points towards further areas of exploration for increasing our understanding of media
effects on local government performance.
126
F A C E S O F L O C A L D E M O C R A C Y
2. THE LOCAL MEDIA LANDSCAPE: TAKING STOCK
The 1990s witnessed deep economic, social, and political reforms in Central and Eastern
Europe, and this included local government systems. The national media attracted a
significant amount of attention during this process and was assumed to have a major
impact on public opinion, although scant attention was given to local media and their
role in the development and strengthening of local democracy. Scholars and observ-
ers of the national outlets identified a variety of issues, including privatization (of the
press and of broadcast media); changes or the lack thereof in the values and attitudes of
journalists trained and socialized during the socialist era; and, perhaps most frequently,
politicization of the media (as accounts of the “media war” that raged in Hungary until
1996 well illustrate).
The main obstacles to media plurality and independence have been mapped out
by a number of authors, including those focusing on post-communist media (e.g.,
Bajomi-Lazar 1999, 2001, 2002; Galik 1996; Giorgi 1995; Goban-Klasz 1994; Gross
1996; Jakubowicz 1996; Kovats and Whiting 1995; O’Neil 1997; Splichal 1995; Sükösd
1997–98). They have examined factors such as monopoly situations, government control,
the grip of commercial interests, the legal framework, and, though less often mentioned,
weak political party competition. Specific information on local media is much harder
to obtain; scandals about local media rarely make headlines. But recent reports about
the increasing concentration of ownership and political manipulation of local outlets
in certain regions (see Preoteasa 2003 and SAR 2003 for examples from Romania) have
raised concerns that a significant number of people may not have access to adequate
information about local public affairs. These developments further underscore the gap
in our knowledge about the state of local media in Central and Eastern Europe.
2.1 Citizens’ Attention to Local Media
The local media in each country are organized somewhat differently. In Hungary and
Poland, for example, local print media are structured to a large extent to reflect territorial
divisions.1 Regional newspapers in Poland are distributed in at least one voivodship,
the largest territorial subunit of the country. Similarly, Hungarian regional papers are
distributed within counties. Other subnational papers in Hungary cover events in towns
or villages. In Poland, two levels of local media exist as a reflection of the three-tier
territorial organization: “local” papers cover less than a voivodship but at least one powiat
(the second largest territorial entity), and the “sublocal” media encompasses all other local
publications, i.e., municipal, town, or parish papers. Foreign ownership predominates
in both countries’ regional markets, while domestic owners are present at the local
level. A significant proportion of the local press is published by local governments in
the two countries.
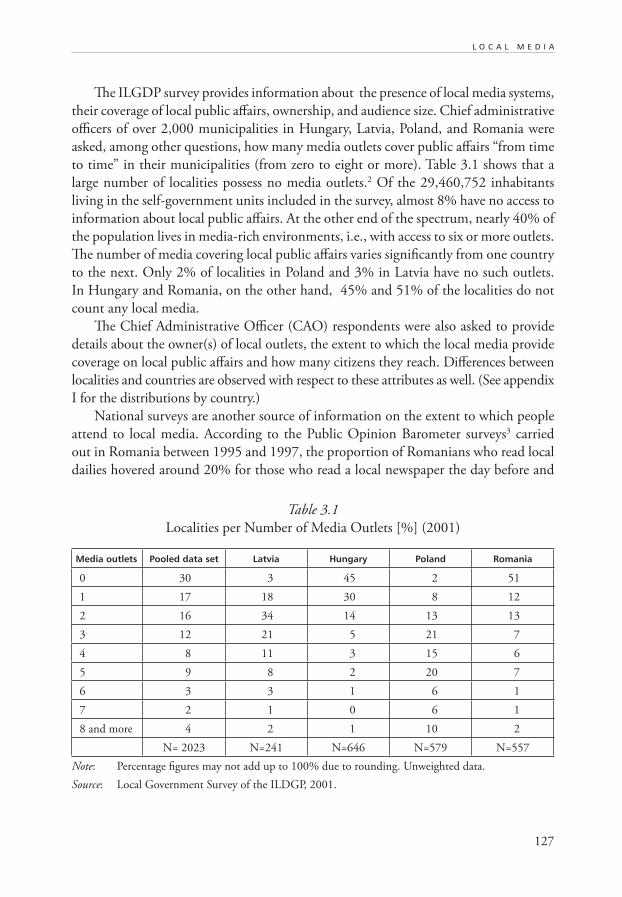
127
L O C A L M E D I A
The ILGDP survey provides information about the presence of local media systems,
their coverage of local public affairs, ownership, and audience size. Chief administrative
officers of over 2,000 municipalities in Hungary, Latvia, Poland, and Romania were
asked, among other questions, how many media outlets cover public affairs “from time
to time” in their municipalities (from zero to eight or more). Table 3.1 shows that a
large number of localities possess no media outlets.2 Of the 29,460,752 inhabitants
living in the self-government units included in the survey, almost 8% have no access to
information about local public affairs. At the other end of the spectrum, nearly 40% of
the population lives in media-rich environments, i.e., with access to six or more outlets.
The number of media covering local public affairs varies significantly from one country
to the next. Only 2% of localities in Poland and 3% in Latvia have no such outlets.
In Hungary and Romania, on the other hand, 45% and 51% of the localities do not
count any local media.
The Chief Administrative Officer (CAO) respondents were also asked to provide
details about the owner(s) of local outlets, the extent to which the local media provide
coverage on local public affairs and how many citizens they reach. Differences between
localities and countries are observed with respect to these attributes as well. (See appendix
I for the distributions by country.)
National surveys are another source of information on the extent to which people
attend to local media. According to the Public Opinion Barometer surveys3 carried
out in Romania between 1995 and 1997, the proportion of Romanians who read local
dailies hovered around 20% for those who read a local newspaper the day before and
Table 3.1
Localities per Number of Media Outlets [%] (2001)
Media outlets Pooled data set Latvia Hungary Poland Romania
0 30 3 45 2 51
1 17 18 30 8 12
2 16 34 14 13 13
3 12 21 5 21 7
4 8 11 3 15 6
5 9 8 2 20 7
6 3 3 1 6 1
7 2 1 0 6 1
8 and more 4 2 1 10 2
N= 2023 N=241 N=646 N=579 N=557
Note: Percentage figures may not add up to 100% due to rounding. Unweighted data.
Source: Local Government Survey of the ILDGP, 2001.
128
F A C E S O F L O C A L D E M O C R A C Y
up to 36% for those who read one in the previous seven days. In Hungary, more than
30% of respondents who participated in a recent survey reported reading a regional
daily every day or several times a week. Fewer than 15% said they listen to local radio
or watch local television channels equally frequently.4
The 1999 Polish General Social Survey showed that almost 54% of the 1,143
respondents read a regional newspaper at least once a week, while 27% stated they never
read such newspapers (the data reveal little difference between readership of regional
and national papers). A little more than 51% of respondents read national papers at
least once a week, while nearly 32% claimed never to read them.5
Finally, according to a survey conducted in Latvia in 2000, of nearly 1,000
respondents who were asked which newspaper they read most often and consider as
their main source of information, almost 15% identified local and regional publications.
When asked about their newspaper consumption, 23% said they regularly read a regional
or local paper in Latvian, and 9% a regional or local paper in Russian. Only 6% reported
listening to local radio programs.6 While these numbers come from observations at a
single point in time (except in the case of Romania) and provide more information about
print than broadcast outlets, they show that consumption of local media in Poland,
Hungary, Romania, and Latvia is far from negligible.
2.2 Links between Media, Citizens, and Local Government Performance
The belief that the media make a difference to the quality of democracy is not new.
Alexis de Tocqueville underlined the connection between civil society and media in his
famous Democracy in America. To secure cooperation, individuals have to be persuaded
that they serve their private interests by “voluntarily uniting [their] efforts to those
of all the others. That cannot be done habitually and conveniently without the help
of a newspaper. Only a newspaper can put the same thought at the same time before
a thousand readers. ... So hardly any democratic association can carry on without a
newspaper” (1990, 112–113).
The need for communication channels between citizens also arises from the
complexity of modern policymaking. Citizens require good information and access to
discussion about the merits of policies, particularly since it is impossible for any one
individual to pay attention to how a city is run all the time or to possess all the necessary
knowledge to evaluate representatives’ every decision (Page 1996, 2). Nowadays, the
mass media (notably television) have become the prime source of political information
(Ansolabehere, Behr, and Iyengar 1993), enabling citizens to identify and articulate
their interests, to voice them at election time, and to participate in public life in general.
Factual political information “assists individuals in their civic actions, helps explain
129
L O C A L M E D I A
group differences in political access, and serves as a collective good, strengthening the
likelihood that the polity functions both responsively and responsibly” (Delli Carpini and
Keeter 1996, xi). Except in very small communities, where interpersonal communication
provides nearly all strata of local society with access to information about local affairs,
the development of meaningful democracy (rather than just a more or less liberal oligarchy)
at the local level clearly requires substantial and diverse media coverage of local politics.
In classical liberal theory, this requirement was fulfilled by the existence of a
marketplace of ideas ensuring that citizens are exposed to diverse information and
points of view. Even if individual outlets were biased, competition would allow media
consumers to weed out true information from the false. From the early to mid-20th
century onward, this idea of the press as the cornerstone of representative democracy
—the “fourth estate”—gave way to calls for a more defined, substantial role for the
media. In the modern media context, competition was found either to be unrealized
or to privilege profit-making over other goals such as achieving political and other
freedoms. These changes gave rise to the notion of social responsibility of the media,
media ethics, and the development of journalists’ professional roles such as that of “watch
dog” (see McQuail 2000, 146ff. for a detailed account of these developments). In this
role, journalists and the media in general act as a check on authorities’ power, ready to
expose wrongdoings (Kocher 1986; Weaver 1996).7 Thus, media “publicity provides
an effective external control over the competence, responsiveness and accountability of
public officials” (Swoboda 1995).
Reasons to suppose that the media have an effect on local government performance
are not only based in normative theories and journalists’ discourse about their profes-
sional role. They are also rooted in two strands of research about media effects. The first
leans toward cognitive psychology and examines how media consumption or exposure
affects people’s knowledge, attitudes, and behavior. Studies belonging to this group have
been preoccupied with how people (and which people, in terms of socio-demographic
characteristics) learn and retain political information distilled by the media. Delli Carpini
and Keeter’s seminal book about the determinants of political knowledge in America is
a good example. Literature focusing on electoral campaigns has also contributed to this
stream, notably the agenda-setting theory and its extension, priming. Agenda-setting
holds that the media are able to influence what issues people think about. Priming takes
place when the media influence the importance that people assign to different issues or
considerations when making a choice (Iyengar 1991). A number of studies specifically
concerned with the impact of local media have addressed the relationship between media
consumption and community ties (Neuwirth, Salmon, and Neff 1989), and between
local media use and participation in local public affairs (McLeod et al. 1999; McLeod,
Scheufele, and Moy 1999).
A second stream of research concentrates on media effects at the aggregate rather
than the individual level. Recent studies have examined the association between access
130
F A C E S O F L O C A L D E M O C R A C Y
to media as well as media freedom on the one hand and good governance8 on the other
(Norris 2001). Links between the media ownership structure (public or private) and
national indicators of education, health, and freedom are another focus of interest
(Djankov, McLiesh, Nenova, and Shleifer 2001). Studies in this group address media
effects from a wide range of perspectives, including links between various local media
characteristics such as competition, ownership, and content (Lacy 1989; Bernstein and
Lacy 1992; Lacy, Coulson, and St. Cyr 1999). Media features have also been linked
with aspects of the local environment such as diversity of public opinion or ethnic
heterogeneity (Lasorsa 1991; Johnson and Wanta 1993; Hindman, Littlefield, Preston,
and Neumann 1999).9 None of these studies provides an applicable framework of
analysis for examining the relationship between media and decisional or democratic
performance of local governments. However, they do provide a useful theoretical and
empirical background against which to set it.
Another related strand of research, mostly qualitative but not exclusively so, has
been concerned with the impact of media on public policy and on policy-makers. Do
media have a direct impact on governmental decisions and the opinions of the decision-
makers, or does public opinion first mediate this influence?10 The question is relevant to
the concerns of this chapter. Media effects on local government procedures or policies
can occur when citizens learn the information they need to hold their representatives
accountable, to engage actively in local public life, and so on. The media can also affect
local representatives directly and, consequently, their performance as those who make
the decisions and establish the rules for how those decisions are arrived at. “Media
attention to an issue affects legislators’ attention, partly because members [of Congress]
follow mass media like other people, and partly because media affect their constituents,”
notes Kingdon (1995, 58). In their study, Lomax Cook et al. (1983) found that media
reports about fraud in public programs had an impact on policymakers’ opinions and
on policy mostly because of the “active relationship” that developed between journalists
and policymakers, rather than as a result of pressure from public opinion.
These last remarks highlight the complex nature of media effects. The aggregate
nature of the available survey data does not allow for a full account of the mechanisms
underlying local media influence on the performance of local governments in Hungary,
Latvia, Poland, and Romania. Nonetheless, the analysis will generate useful insights on
how local media work in the region, and what influence they have on (some of ) the
nuts and bolts of local democracy.
3. HYPOTHESES
Before we present our hypotheses linking media features with local government perform-
ance, a few words about the meaning and measures of local government performance
131
L O C A L M E D I A
used in this chapter are in order. When information is “sufficiently full, accurate, and
well interpreted, then citizens can decide what policies they want in an informed way,
consistent with their basic values and interests” (Page 1996, 2). Here, we assume that
citizens prefer a local government that runs smoothly, as opposed to one frequently
bogged down by delays, lack of quorum, and other similar impediments. Also, a central
tenet of democratic theory is that governments do what citizens want them to do. While
we do not have sufficient information to evaluate citizens’ preferences with respect to
local public matters, we assume it is more likely that the interests of citizens will be
reflected in decisions taken by the local assembly when they are more involved in the
decision-making process. The construction of the performance indices, described in
section 3.2, reflects these assumptions.
In this chapter, we evaluate the impact of local media with respect to two aspects
of local government performance: decisional, that is, the capacity of local authorities
to make decisions in a timely and effective manner; and democratic, defined as local
authorities’ ability to favor the input of citizens and various elements of local civil society
in the decision-making process. The indicators used to construct the two measures partly
follow the model set in the State of Local Democracy (2002), whose contributions describe
the main findings of the ILDGP survey data.11 The indices of decisional and democratic
performance take into account only elements that were included in the survey. It is useful
to keep in mind that, while attempting to design “universal” measures, surveys involve
a selection of questions and indicators that leaves other, potentially relevant dimensions
of performance unexplored.
3.1 Media Presence
Evidence abounds that the media have an impact on the way politics are run. To give
one famous example, the Watergate affair and Nixon’s resignation as a consequence of
it are considered to have happened because of media reports (Protess et al. 1991, 3–5).
Focusing on the individual level, Delli Carpini and Keeter (1996, 149) show that reading
newspapers is associated with a higher level of knowledge about local politics in the
United States. Reading local newspapers also has a positive and significant impact on
citizens’ participation as voters and in contacting public officials (McLeod, Scheufele, and
Moy 1999). This last point about the potential mobilizing role of the media leads us to
expect a more palpable impact of media on democratic than on decisional performance.
This applies not only to media presence, but to other media characteristics as well.12
• Hypothesis 1: Local governments in localities endowed with media outlets will display
better performance than others—especially democratic performance.
132
F A C E S O F L O C A L D E M O C R A C Y
3.2 Diversity of Ownership Structure
Much has been written about the impact of media owners and ownership on media
content, yielding sometimes compelling yet inconclusive accounts (e.g., Badgikian 1992;
see also Page 1996 for a review). Similarly, the effects of competition have been explored
in a number of studies. Most find that competition has little or no effect on newspapers’
content, but Rarrick and Hartman (1966, in Entman 1989, 93) found competition to
be associated with more local-oriented news.
Franklin’s (1988) investigation showed that the content of newspapers published
and distributed by English local authorities free of charge to each household was colored
by the perspective of the party in power in the local assembly.13 Assuming that local
politicians wish to be re-elected, it is not implausible to imagine that local governments
that have control over the media will ensure that the content is not overly critical of
their activities, if not blatantly biased in their favor (see Popescu and Tóka 2002 for a
description of such an occurrence in Hungary’s public television during the 1994 general
election campaign). Consequently, media presence in itself may not be sufficient to
ensure an impact on performance. What matters could well be who owns the outlet(s),
and thus whether local authorities are in a position to insulate themselves and their
activities from the media’s critical scrutiny.14
• Hypothesis 2. Local government performance (notably democratic) is expected to
improve when the media ownership structure is diverse; that is, when not only
government-controlled but also privately-owned, NGO-run, etc., outlets are avail-
able.
3.3 Quality of Content
Defining the quality of media content in quantitative terms is not an easy task.15 While
the general distinction between information and entertainment is useful, such a measure
can only be guided by content analysis. Given the unavailability of content analysis data,
and regardless of the mechanism potentially at work between media and performance,
it is plausible to suppose that whether local media report about local public affairs, and
to what extent, does matter for performance. Equally plausibly, reports about local
politics can be regarded as quality media content—generally defined as content of “social
or political significance… [that] is implicitly intended to help citizens in their role as
democratic decision-makers” (Zaller 1999).
• Hypothesis 3: Greater quality coverage by local media is more likely to be associated
with higher local government performance scores (particularly democratic perform-
ance scores).
133
L O C A L M E D I A
3.4 Extent of Media Penetration
In line with the hypotheses presented so far, greater penetration of local media outlets
among the population is also expected to bolster the performance of local authorities.
• Hypothesis 4: The greater the reach of local media among citizens, the better the
performance of local governments, especially its democratic aspect.
“If extensive political information is available somewhere in the system, not
everyone has to pay attention to it all the time,” writes Page (1996, 7). Because some
people—“opinion leaders”—will pay more attention to local political news, some of
this information will reach others in the community via face-to-face interaction with
family, friends, and co-workers (Sniderman, Tetlock, and Brady 1991). The theory of the
two-step flow of communication (Ansolebehere, Behr, and Iyengar 1993, 132) provides
grounds to expect that media presence, rather than penetration, could be playing a more
central role in influencing both types of performance (as long as a minimal threshold
of penetration is achieved by local outlets). If, however, the media should play a direct
mobilizing role, the impact of a greater number of people exposed to local outlets should
be felt, particularly on democratic performance.16
3.5 Other Factors Explaining Performance
The goal of the hypotheses presented so far has been to quantify the impact of media
features on the decisional and democratic aspects of local governments’ performance.
But obviously the media are not the only element influencing performance. Therefore,
to test for the robustness of findings related to the hypotheses above, a number of other
factors with the potential to bear on performance are considered.
• Unemployment:
In communities harder hit by unemployment, we expect people to be less engaged
in participatory activities, and thus to observe a moderately lower democratic per-
formance (moderate because the index of democratic performance also includes
elements such as the number of public hearings held. Attendance, rather than
the number of hearings, is likely to be affected by unemployment). Economic
adversity is also likely to generate obstacles for the local assembly in reaching
decisions, due to the compromises and trade-offs involved when resources are
limited (we posit here that unemployment reflects the general financial state of
the community).
• NGOs, Political Parties and Citizens’ Initiatives:
The presence of more parties is expected to decrease decisional performance;
when more voices are heard, agreement and decisions are likely to be harder and
134
F A C E S O F L O C A L D E M O C R A C Y
slower to reach. The presence of NGOs is anticipated to have a similar effect,
albeit to a lesser degree since they are not necessarily directly involved in deci-
sion-making. On the other hand, NGO presence should enhance democratic
performance. Indeed, where more NGOs can contribute to bringing citizens
together and better identifying and articulating their interests, it is more likely
that citizens will want to make their voices heard. Also, local authorities will
have more opportunities to engage in consultation and seek the contribution
of citizens before taking major decisions. The role of political parties in this
respect is not clear cut: considering that more parties implies the presence of
more groups with diverse interests in local society, we would expect this to reflect
positively on democratic performance. However, more political parties could
also monopolize the decision-making process to the detriment of other local
actors.Expectations with respect to the impact of citizens’ initiatives (petitions,
requests for meetings with local authorities, demonstrations, and challenges of
local government decisions in court) are similar to those related to the presence of
civic organizations. The active engagement of citizens in local public life should
reflect positively on democratic performance. However, it could also slow down
decision-making by adding to the chorus of voices involved in the process.
• Level of Education of Local Government Staff Members:
The survey queried chief administrative officers about the number of local
government staff members having completed higher education. More staff with
higher education is expected to impact positively on performance.
• Community Homogeneity:
When people are similar in many respects such as socio-demographic characteris-
tics, income, beliefs, etc., representation is less problematic. There should be less
dissent among local representatives and citizens as how to allocate the available
resources. Greater homogeneity is therefore expected to be connected with greater
decisional efficiency. The survey data provide information about a number of
local cleavages: income, religious beliefs, political views, areas within the locality,
urban/rural differences, ethnic origin, and long-time residents vs. newcomers. The
questions were formulated to obtain information about tensions caused by the
divides rather than about the “objective” divides themselves. While this formula-
tion may render the measure less precise in certain cases (e.g., ethnic cleavages),
in others it may prove useful in highlighting more salient cleavages.
We would expect more and stronger cleavages to be linked with poorer decisional
performance. Conversely, it is plausible that more diversity would bring more frequent
opportunities to draw citizens into the decision-making process. However, the positive
impact of cleavages on democratic performance might not be felt should these divides
have been translated into NGOs or political parties.
135
L O C A L M E D I A
Obviously, a larger number of factors would be required to explain performance
more fully.17 However, the goal of this analysis is not to explain all the observed variance
in performance, but to provide an evaluation of the part played by the media in it.
3.6 Interactions between Media Features and Other Factors
Due to the complex nature of media effects, the hypotheses below include the poten-
tial for interaction effects—that is, the possibility that the characteristics of media act
together with other variables to yield an effect that can neither be attributed entirely to
media nor to the other variables alone.
• Perception of Local Officials about Media Influence:
As mentioned in the previous section, media can have an impact on perform-
ance for a variety of reasons: via citizens’ knowledge of public affairs, by alerting
public opinion about wrongdoing, or directly on the policymakers themselves.
The survey data allow only for limited testing of the possible channels of media
effects. One possibility consists in using chief administrative officers’ (CAOs)
evaluation of local media influence on decisions taken by the local assembly.
Should CAOs’ stance about media influence be indicative of policymakers’ per-
ception and attention to local outlets, we expect a stronger positive relationship
between performance and media in municipalities where CAOs believe that
media significantly influence local decisions.
• Hypothesis 5a: Localities where chief administrative officers consider local media to
be a more potent influence on local authorities’ decisions will witness a larger impact
of media characteristics on performance.
The Local Representative Survey (LRS), also part of the Indicators of Local Gov-
ernment Project, provides another opportunity to test the idea that media influence is
potentially channeled through the perception of members of local authorities. Coun-
cilors’ views of the media might be crucial in shaping media influence, even more so
than the perception of CAOs. If the media matter for performance, they will matter
more, other things being equal, in places where local representatives hold the view
that the media are “powerful” at agenda-setting and help them to better take the pulse
of the citizenry. Kanervo and Kanervo (1989, 310) found that policymakers tend to
assign significant influence of media over their consumers, thus “sometimes even using
[newspaper] articles as a direct measure of public opinion.” Therefore, hypothesis 5b is
similar to what has been posited about CAOs’ perception of media influence.
• Hypothesis 5b: The impact of media is accentuated where councilors perceive the
media to be powerful in setting the citizens’ agenda and providing them with in-
formation about citizens’ views and opinions.
136
F A C E S O F L O C A L D E M O C R A C Y
Because the Local Representatives Survey (LRS) conducted in 2002 in Hungary and
Poland was administered after the local elections, data from the first LRS conducted in
Hungary in 2001 is used to test hypothesis 5b.
• Civil Society and Citizens’ Participation:
Delli Carpini and Keeter found that partisan individuals are more likely to learn
facts with a partisan color, and that contact by political parties and citizens’
knowledge about politics go up together. As they put it, parties and NGOs
provide “fertile ground for improving the information environment” (1996,
282). Consequently, investigating for potential interactions between media and
the presence of local organizations could tell us more about how local media
influence operates, and in which context. Hypotheses involving the interac-
tions between media and political/civil society specifically concern democratic
performance, notably due to the already mentioned “push” phenomenon (see
note 9). The first hypothesis predicts that the impact of media will be greater in
places where there are more NGOs to diffuse information and mobilize citizens
more effectively. Similarly, we expect that municipalities that are the theater of
citizens’ active engagement in public life will also see a greater influence of local
media.
• Hypothesis 6. The media features will have a greater impact on democratic perform-
ance in localities where more civic organizations are present.
• Hypothesis 7. The media features will have a greater impact on democratic perform-
ance in localities where local citizens have engaged in demonstrating, petitioning,
contacting local officials, or challenging local government decisions.
To summarize, we expect the number of media, the quality of their coverage of local
public affairs and their audience reach to “push up” performance, especially democratic
performance. The same should be true with greater diversity in the media ownership
structure. A denser civic network, generally gauged by the presence of NGOs and politi-
cal parties as well as by citizens’ initiatives, is likely to have different effects, depending
on the type of performance considered. If our general hypotheses are supported, more
associations, parties, and initiatives should go hand in hand with greater democratic
performance, but lower decisional performance. The effects of unemployment are ex-
pected to be negative. The diversity of interests represented in localities, measured by the
degree of tensions rooted in income, religious, geographic, and other differences among
inhabitants, should lead to lower decisional performance. Lastly, it is posited that the link
between media and performance might be stronger where chief administrative officers
and councilors estimate that the media exert greater influence on local authorities and
in making public affairs topics salient to the community. Similarly, opportunities for
137
L O C A L M E D I A
discussion and dissemination of political information (Huckfeldt and Sprague 1995, 5)
offered by local clubs, civic associations, and various NGOs could amplify the impact
of the media on democratic performance.
4. DATA AND METHOD OF ANALYSIS
The analysis below relies on survey data collected within the framework of the Indica-
tors of Local Democratic Governance Project (ILDGP) in the spring of 2001. Unless
indicated otherwise, the data come from the Local Government Survey (LGS), one
component of the ILDGP. Localities in the four countries covered in the first wave of
the LGS are included in the present study. The first step consists in verifying whether
there is a difference between localities endowed with media and those that have none
with respect to decisional and democratic performance. A first set of regression equations,
controlling for population size and the country in which the localities are situated, estimates
the impact of basic media presence (none versus at least one outlet), and also of the quantity
available in town (none to eight or more) on both types of performance. Then two linear
regression equations estimate the combined impact of the four local media characteristics
we are interested in on decisional and democratic performance.
A third set of equations assesses the relative impact of these media features together
with that of other factors likely to affect local government performance: the presence
of political parties and civic organizations, citizens’ active participation in public life
(measured by a dummy variable indicating whether at least one initiative was undertaken
in the locality), unemployment, local government capacity (measured by the number of
local government staff members with higher education), as well as community hetero-
geneity. Finally, another set of equations explores interaction effects, i.e., the potentially
greater effect of media features in local environments characterized by denser civic and
political networks and more active citizens. The paragraphs below briefly describe the
operationalization of the variables used to test the hypotheses presented in the previous
section. A detailed description of the variables can be found in appendix II.
The privileged unit of observation is the locality. Except where interaction effects
are concerned, the analyses are based on the pooled data set—that is, all the localities
from the four countries together. Dummy variables control for the country in which
municipalities are located. They capture country-level variations not accounted for by
the factors considered in the models. Hungary is used as the reference category. Popu-
lation size is also controlled for by using the natural logarithm (indicated by “log”) of
the population size of each locality. In all regression analyses, the data is weighted to
adjust for the overrepresentation of bigger localities in the sample, thus assigning equal
weight to all municipalities. Frequency distributions (shown in table 3.1 and in all but
one table in appendix I) are not weighted.
138
F A C E S O F L O C A L D E M O C R A C Y
Space constraints and the limited information available about the particularities
of local media systems in each country (aside from the characteristics assessed by the
ILDGP survey data) restrict the range of country-related hypotheses that that we can
draw and test. However, remarks about different country patterns are made in the
Findings section.
4.1 Media Variables
The variable measuring the number of local media covering local public affairs “from
time to time” ranges from zero to eight. When CAOs where asked to qualify the extent
to which outlets cover public affairs, how many citizens they reach, etc., they were re-
quested to provide information about the first five outlets. Consequently, the number of
media was adjusted to account for a maximum of five outlets in the analyses involving
other media characteristics.
The response categories of the question pertaining to media ownership were the
following: the local government or a company owned by the local government; another
government (regional or national) or a company owned by this government; a local public
institution; a political party; an NGO(s); a business enterprise(s); a private citizen(s) or
“other owner.” Chief administrative officers had the option of indicating that they did
not know who sponsored an outlet. The variable is coded from 1 to 5, given that diversity
cannot exceed the number of outlets for which ownership information is available.
As already mentioned, quality is not a concept that easily translates into quantitative
terms. Concepts such as fairness, lack of bias, good faith, and credibility are obviously
relevant (McQuail 1992, 211–2).
Since neither content analysis-based measures nor information pertaining to the
number of journalists employed, editorial budget, or circulation numbers are available
for all outlets, quality is measured by the presence/absence of four elements from local
media outlets’ regular coverage: (1) reports about decisions of the local assembly; (2)
reports about proposals debated in the assembly; (3) reports about arguments and coun-
terarguments discussed at the local assembly; and (4) interviews with local government
leaders or councilors. Absence of coverage is coded “0,” and “1” reflects the presence of
these quality elements in outlets’ coverage. The scores for the four elements were added
and divided by the total number of outlets in each municipality.
Audience size is computed using chief administrative officers’ estimates of the
number of citizens reached by each media outlet, on a scale ranging from 0 (“less than
one person out of 10”) to 10 (“almost everyone”). The estimates were added and then
divided by the number of outlets (up to five) to obtain an average penetration score.
139
L O C A L M E D I A
(Appendix I presents the distribution of media systems’ features for the pooled data set
as well as for localities grouped by countries.)
4.2 Performance Indices
The decisional index was constructed using CAOs’ answers to survey questions on the
number of occurrences of lack of quorum, the frequency of postponed decisions, budget
promptness (acceptance of the budget before the legal deadline), as well as the number
of extraordinary sessions held in 2000. The results were added to obtain a score for each
municipality. A higher score denotes a better decisional performance.18
The democratic index measures whether local authorities discussed budgetary plans
with local civic associations, whether they held a public forum about the budget and
published a draft of the document before it was passed. It also includes an indicator
of the number of local associations that participated in the decision-making process
during the year via membership in a municipal committee or as experts consulted by
the local authorities. The last indicator included is the number of public hearings held
in 2000.19 Again the measures were summed up. Like the decisional performance index,
the democratic index is positive: the higher the score, the better the performance.
Both indices are constructed so that each municipality is compared with other
localities in the same country. This step was taken to compensate for the inevitable fact
that the indices “perform” differently in each country. For example, a Polish regulation
states that the failure to respect the legal deadline to pass the yearly municipal budget
should result in the intervention and passing of the budget by a supervisory board. This
rule provides a strong incentive to complete the budget on time; accordingly, virtually
all municipalities in Poland met the budget deadline in 2000. In Latvia, where such an
incentive is absent, approximately 30% of municipalities did not meet the legal deadline
that same year. Does this mean that Polish cities are doing better than Latvian ones?
The indices do not allow such general conclusions. All we can say is that according to
the selected indicator—budget promptness in this case—Polish localities perform bet-
ter than their Latvian counterparts. It may well be that according to another indicator
not included in the survey, the reverse situation would be true. To control as much as
possible for such inevitable disparities, the indicators were centered around their mean,
using the mean of each country’s samples before they were added up. Consequently, a
Polish city that failed to pass the budget on time was assigned a very low score compared
to other, “timely” cities in the country. Latvian towns that did not manage to meet the
deadline also received a lower score than the Latvian localities that met it, but not as
low because the average of that indicator in Latvia is lower than in Poland.
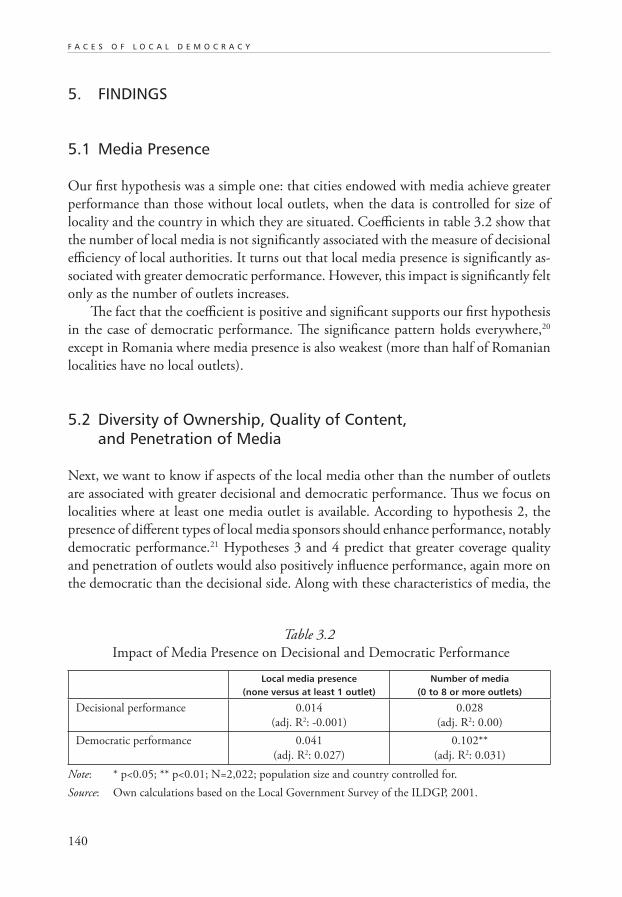
140
F A C E S O F L O C A L D E M O C R A C Y
5. FINDINGS
5.1 Media Presence
Our first hypothesis was a simple one: that cities endowed with media achieve greater
performance than those without local outlets, when the data is controlled for size of
locality and the country in which they are situated. Coefficients in table 3.2 show that
the number of local media is not significantly associated with the measure of decisional
efficiency of local authorities. It turns out that local media presence is significantly as-
sociated with greater democratic performance. However, this impact is significantly felt
only as the number of outlets increases.
The fact that the coefficient is positive and significant supports our first hypothesis
in the case of democratic performance. The significance pattern holds everywhere,20
except in Romania where media presence is also weakest (more than half of Romanian
localities have no local outlets).
5.2 Diversity of Ownership, Quality of Content, and Penetration of Media
Next, we want to know if aspects of the local media other than the number of outlets
are associated with greater decisional and democratic performance. Thus we focus on
localities where at least one media outlet is available. According to hypothesis 2, the
presence of different types of local media sponsors should enhance performance, notably
democratic performance.21 Hypotheses 3 and 4 predict that greater coverage quality
and penetration of outlets would also positively influence performance, again more on
the democratic than the decisional side. Along with these characteristics of media, the
Table 3.2
Impact of Media Presence on Decisional and Democratic Performance
Local media presence (none versus at least 1 outlet)
Number of media (0 to 8 or more outlets)
Decisional performance 0.014
(adj. R2: -0.001)
0.028
(adj. R2: 0.00)
Democratic performance 0.041
(adj. R2: 0.027)
0.102**
(adj. R2: 0.031)
Note: * p<0.05; ** p<0.01; N=2,022; population size and country controlled for.
Source: Own calculations based on the Local Government Survey of the ILDGP, 2001.
141
L O C A L M E D I A
number of outlets was retained in the equation (recoded to account for a maximum
of five, the highest number of outlets for which information is available regarding
ownership, quality, and audience size).
The results partly confirm our expectations. Coverage quality and a diverse owner-
ship structure of local media are positively associated with democratic performance.
Decisional performance fails to be significantly affected by any of the four features of
media. These results demonstrate that democratic performance responds to the shape
of the local media scene. The four characteristics of local media systems taken together,
along with population size and country dummies, explain slightly over 5% of the total
variance observed in democratic performance. Among the four media features, coverage
quality plays the largest role in influencing democratic performance: whether the media
cover local government affairs or not is what matters most. More media outlets with
diverse ownership also spells good news for democratic performance. (see table 3.3)
Conducting the same analysis for each country separately is informative. The positive
link between coverage quality and decisional performance already described emerges in
all four countries.22 The case of ownership diversity and number of media is particular
to each country: obviously, the two are related to some degree (a partial correlation
controlling for population size in the pooled data set yields a coefficient of 0.39). In fact,
diversity of ownership structure plays a major role in Poland, while in Hungary and Latvia
it is the number of media in town that makes a difference,23 with diversity not being
significant. Table A3.2 in appendix I clearly displays the fact that Polish municipalities
enjoy a much higher rate of diversity than their counterparts in other countries. It could
well be that a certain diversity threshold has to be reached before it can play a major role
and relegate to backstage the impact of the number of available media outlets. In other
words, a certain degree of competition, not reached except in Poland, could be required
before the effects of a diverse ownership structure on performance can be registered.
This hypothesis cannot be tested until more municipalities displaying greater media
competition, from a larger range of countries, can be included in a sample.
Interestingly, Romania is the only country where neither diversity nor the number
of media are associated with democratic performance. As mentioned above, it is the
country where local media outlets are least present, where they are consumed on average
by fewer people, and show less propensity to cover local public affairs.24 This could
explain why media features make little difference for performance.
Table 3.3 also shows that when only media factors are considered (with controls for
country), bigger localities generally experience greater democratic performance. This is
not surprising, given that the sheer presence of more citizens provides more opportunities
for their inclusion in the decision-making process, as well as (plausibly) greater grass-
roots pressure for such opportunities to be made available by local authorities. On the
other hand, in the case of decisional performance, greater size of locality is associated
(but not significantly) with less efficiency.
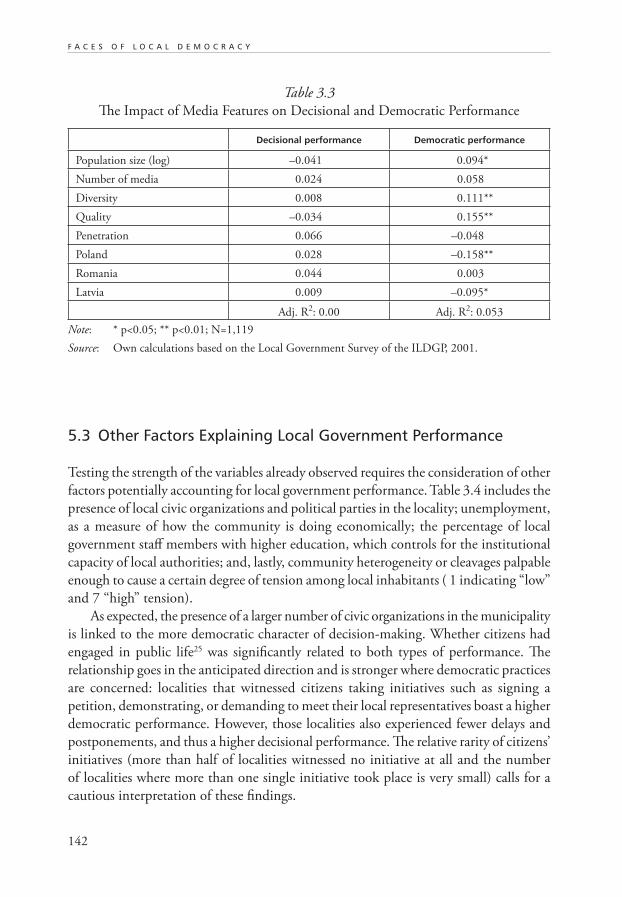
142
F A C E S O F L O C A L D E M O C R A C Y
5.3 Other Factors Explaining Local Government Performance
Testing the strength of the variables already observed requires the consideration of other
factors potentially accounting for local government performance. Table 3.4 includes the
presence of local civic organizations and political parties in the locality; unemployment,
as a measure of how the community is doing economically; the percentage of local
government staff members with higher education, which controls for the institutional
capacity of local authorities; and, lastly, community heterogeneity or cleavages palpable
enough to cause a certain degree of tension among local inhabitants ( 1 indicating “low”
and 7 “high” tension).
As expected, the presence of a larger number of civic organizations in the municipality
is linked to the more democratic character of decision-making. Whether citizens had
engaged in public life25 was significantly related to both types of performance. The
relationship goes in the anticipated direction and is stronger where democratic practices
are concerned: localities that witnessed citizens taking initiatives such as signing a
petition, demonstrating, or demanding to meet their local representatives boast a higher
democratic performance. However, those localities also experienced fewer delays and
postponements, and thus a higher decisional performance. The relative rarity of citizens’
initiatives (more than half of localities witnessed no initiative at all and the number
of localities where more than one single initiative took place is very small) calls for a
cautious interpretation of these findings.
Table 3.3
The Impact of Media Features on Decisional and Democratic Performance
Decisional performance Democratic performance
Population size (log) –0.041 0.094*
Number of media 0.024 0.058
Diversity 0.008 0.111**
Quality –0.034 0.155**
Penetration 0.066 –0.048
Poland 0.028 –0.158**
Romania 0.044 0.003
Latvia 0.009 –0.095*
Adj. R2: 0.00 Adj. R2: 0.053
Note: * p<0.05; ** p<0.01; N=1,119
Source: Own calculations based on the Local Government Survey of the ILDGP, 2001.
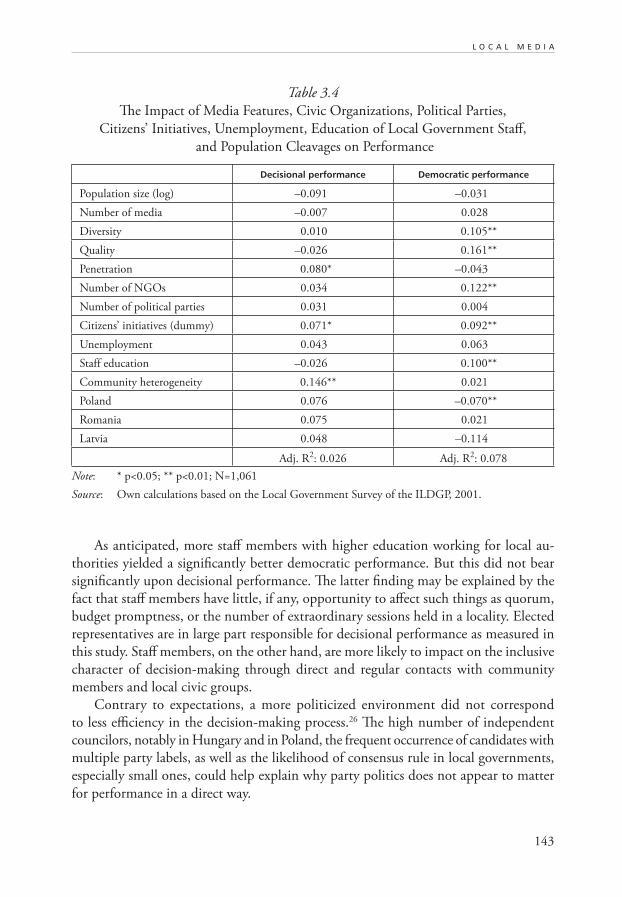
143
L O C A L M E D I A
As anticipated, more staff members with higher education working for local au-
thorities yielded a significantly better democratic performance. But this did not bear
significantly upon decisional performance. The latter finding may be explained by the
fact that staff members have little, if any, opportunity to affect such things as quorum,
budget promptness, or the number of extraordinary sessions held in a locality. Elected
representatives are in large part responsible for decisional performance as measured in
this study. Staff members, on the other hand, are more likely to impact on the inclusive
character of decision-making through direct and regular contacts with community
members and local civic groups.
Contrary to expectations, a more politicized environment did not correspond
to less efficiency in the decision-making process.26 The high number of independent
councilors, notably in Hungary and in Poland, the frequent occurrence of candidates with
multiple party labels, as well as the likelihood of consensus rule in local governments,
especially small ones, could help explain why party politics does not appear to matter
for performance in a direct way.
Table 3.4
The Impact of Media Features, Civic Organizations, Political Parties,
Citizens’ Initiatives, Unemployment, Education of Local Government Staff,
and Population Cleavages on Performance
Decisional performance Democratic performance
Population size (log) –0.091 –0.031
Number of media –0.007 0.028
Diversity 0.010 0.105**
Quality –0.026 0.161**
Penetration 0.080* –0.043
Number of NGOs 0.034 0.122**
Number of political parties 0.031 0.004
Citizens’ initiatives (dummy) 0.071* 0.092**
Unemployment 0.043 0.063
Staff education –0.026 0.100**
Community heterogeneity 0.146** 0.021
Poland 0.076 –0.070**
Romania 0.075 0.021
Latvia 0.048 –0.114
Adj. R2: 0.026 Adj. R2: 0.078
Note: * p<0.05; ** p<0.01; N=1,061
Source: Own calculations based on the Local Government Survey of the ILDGP, 2001.
144
F A C E S O F L O C A L D E M O C R A C Y
Another result not in line with expectations is that communities divided along a
higher number of cleavages witness a significantly smoother decision-making process.
It may be that tensions and the heightened awareness of potential disputes that is likely
to accompany them impose constraints that ultimately prove beneficial to decisional
performance. Where the balance between interests is more delicate, it may be that local
authorities cannot afford to be bogged down by procedural delays and obstacles, or that
differently-minded participants will act as checks upon each other. We not only initially
posited that cleavages, as a measure of the diversity of preferences among citizens, would
diminish efficiency but also that they would create an opportunity to boost democratic
performance. However, the number and depth of social, economic, and other local
fault lines as gauged by survey data do not have a visible impact on local governments’
participatory practices.27 It could be that, as speculated earlier, the divergent interests
rooted in local cleavages are channeled through civil society.
The unemployment coefficients fail to achieve significance in both equations.
Furthermore, their positive sign is not coherent with the initial hypothesis that the two
types of performance should be hampered by a higher unemployment rate. It could be
that unemployment figures given by CAOs do not constitute an adequate proxy for
the general financial state of the community. In addition, we cannot be entirely sure
that economic adversity has the usually assumed negative impact on participation28 at
the local level. For example, walking to the councilor’s office in a small town typically
takes less time than visiting a parliamentary representative, whose office is likely to
be located in the county’s largest city. A preliminary investigation of aggregate voting
behavior at the local level in Hungary shows that poorer localities experience higher
turnout than wealthier cities (Gosselin 2003a). A potential reason for this finding could
be the not negligible welfare benefits handed out by local governments in a number of
CEE countries.
The adjusted R-squared values of the full model remain relatively modest, indicat-
ing that factors other than those tested here are responsible for most of the variation in
performance observed between localities (2.6% of the observed variation is accounted
for in the case of decisional performance, almost 8% in the case of democratic perform-
ance). More interesting for our present purposes is that the two features of media systems
highlighted in table 3.3—coverage quality and diversity of the ownership structure—re-
tain a significant and positive relationship with democratic performance even when we
control for alternative explanations. Moreover, the strength of the relationships between
these media characteristics and democratic performance remains largely unaffected by
the inclusion of additional factors in the equation.
Lastly, the coefficient of penetration of local outlets is significant for decisional
performance once other factors are taken into consideration. In the absence of
other elements that could point to a pattern, the interpretation of this result is not
straightforward. In any case, the impact of the variable is limited since penetration
145
L O C A L M E D I A
coefficients were not significant in the first, media-features-only, equation (table 3.3). It
could be that a measure of penetration based on CAOs’ estimates does not adequately
reflect real audience size. Of the four media characteristics asked about in the LGS,
audience is probably the most difficult for CAOs to assess with accuracy (more difficult
than the number of outlets or the nature of their coverage).29
Separate country analyses confirm the importance of coverage quality’s impact on
democratic performance, statistically significant in all settings.30 Diversity of ownership
structure again plays a major role only in Poland. This time, the coefficient for the
number of media achieves significance in Latvia (where p<0.1) but not in Hungary.
This weakens the case for speculation about the prime role of the number of available
media outlets until ownership structure in the local media market becomes sufficiently
competitive, without dismissing it entirely until the hypothesis can be tested in a larger
number of settings.
5.4 Investigating Mechanisms of Media Influence on Democratic Performance
As highlighted in the theoretical discussion in section 2, media effects are complex and
difficult to circumscribe. Two hypotheses presented in section 3 proposed to explore the
possibility that linkages between local media and democratic performance run through
the perceptions of media held by local officials and elected representatives, and/or through
the characteristics of local civil society. The analyses of interaction effects performed
below assess whether the impact of media on democratic performance of local authori-
ties differs depending on characteristics of the local civil society, or depending on local
officials’ perceptions. Once the impact of media features is controlled for, a positive
interaction term would suggest that the influence of the selected local media attribute
on democratic performance is greater in localities where (for example) we find more
civic associations. The analyses of interaction effects focus on democratic performance,
because only this aspect of local government performance turned out to be significantly
linked to local media features in a manner fitting theoretical considerations.
5.4.1 Interactions between Media and Local Civil Society
All four media systems’ characteristics are combined separately with indicators of the pres-
ence and dynamism of local civil society to detect potential interaction effects: first with
the number of civic associations, then with citizens’ initiatives (measured by a dummy
variable). Earlier we hypothesized that the presence of local civic organizations provides
favorable ground for the diffusion of political information. In addition, if information
146
F A C E S O F L O C A L D E M O C R A C Y
goes hand in hand with mobilization, we also expect a stronger link between media
and performance where the local citizenry has proved more active. The analyses for the
two types of interactions (one with NGO presence, the other with citizens’ initiatives)
are conducted separately to avoid multiple collinearity problems; indeed, should many
variables behave in a very similar way, it would become impossible to distinguish their
respective impact.
The method used here follows the one suggested by Jaccard and Turrisi (2003) to
capture interaction effects in multivariate regressions. First, the two predicting vari-
ables assumed to interact with one another are centered around their mean (a constant
equivalent to the variable average is subtracted from each locality’s score). The product
of the two mean-centered variables constitutes a distinct, third variable. The democratic
performance index is then regressed onto the two mean-centered variables, as well as
the product term. A significant coefficient for the product term variable indicates that
the “moderating” factor (the number of civic associations or local citizens’ initiatives)
influences the impact of media features on democratic performance.
The first set of analyses of interaction effects takes the number of local civic
organizations as a moderating factor. Namely, the impact of media characteristics on
democratic performance is expected to vary according to the number of NGOs present
in town. A pooled data set analysis (including all municipalities in the four countries)
shows a positive and significant interaction effect between the number of associations31
and coverage quality, as well as between NGO presence and the number of local media
(up to five outlets).
Separate country analyses reveal that the interaction between NGO presence32 and
coverage quality plays a statistically significant role in Romania. The second interaction
effect, involving NGO presence and the number of media outlets, is significant in
Romania as well as in Hungary. NGO presence did not combine with either diversity
of media systems’ ownership structure nor audience size to produce a differential impact
on democratic performance.
Citizens’ initiatives are the second aspect of local environment allowed to interact
with the four media characteristics. Due to the skewed nature of the distribution of
citizens’ initiatives (more than 50% of localities did not witness any type of action in
2000), the variable was transformed into a dummy (coded “1” for cities where at least one
type of action was used, and “0” where none took place). Avowedly crude, this measure
of citizens’ involvement in local public affairs nonetheless interplays with the coverage
quality of local media to yield better democratic performance where inhabitants engaged
at least once in petitioning, requesting meetings with local officials, demonstrating,
or challenging a local government decision. The coefficient of the interaction term
is significant for the pooled data set. At the country level, Hungary’s and Romania’s
coefficients are significant at the 0.1 level. Citizens’ initiatives also significantly and
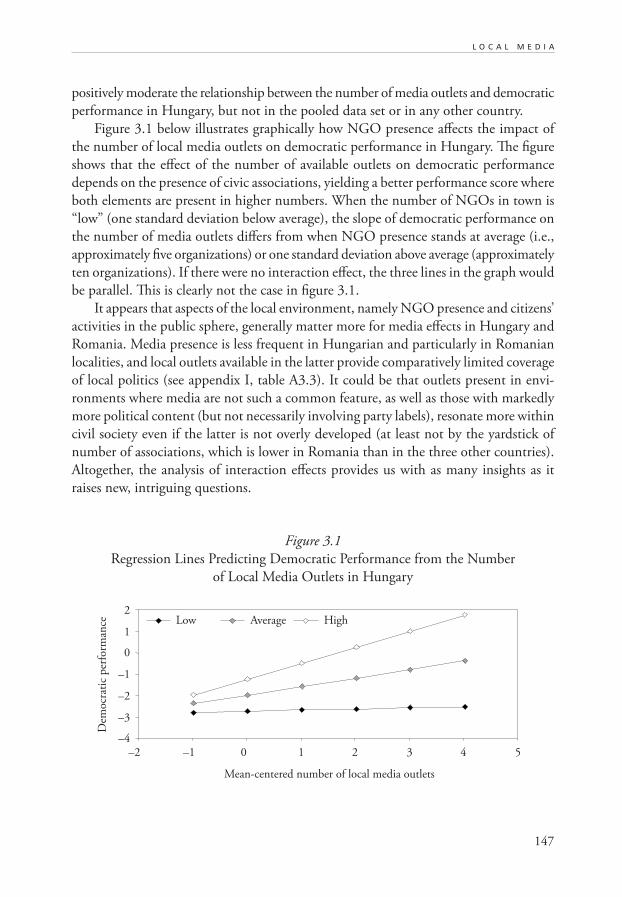
147
L O C A L M E D I A
positively moderate the relationship between the number of media outlets and democratic
performance in Hungary, but not in the pooled data set or in any other country.
Figure 3.1 below illustrates graphically how NGO presence affects the impact of
the number of local media outlets on democratic performance in Hungary. The figure
shows that the effect of the number of available outlets on democratic performance
depends on the presence of civic associations, yielding a better performance score where
both elements are present in higher numbers. When the number of NGOs in town is
“low” (one standard deviation below average), the slope of democratic performance on
the number of media outlets differs from when NGO presence stands at average (i.e.,
approximately five organizations) or one standard deviation above average (approximately
ten organizations). If there were no interaction effect, the three lines in the graph would
be parallel. This is clearly not the case in figure 3.1.
It appears that aspects of the local environment, namely NGO presence and citizens’
activities in the public sphere, generally matter more for media effects in Hungary and
Romania. Media presence is less frequent in Hungarian and particularly in Romanian
localities, and local outlets available in the latter provide comparatively limited coverage
of local politics (see appendix I, table A3.3). It could be that outlets present in envi-
ronments where media are not such a common feature, as well as those with markedly
more political content (but not necessarily involving party labels), resonate more within
civil society even if the latter is not overly developed (at least not by the yardstick of
number of associations, which is lower in Romania than in the three other countries).
Altogether, the analysis of interaction effects provides us with as many insights as it
raises new, intriguing questions.
Figure 3.1
Regression Lines Predicting Democratic Performance from the Number
of Local Media Outlets in Hungary
–4
Dem
ocr
atic
per
form
ance Low
–3
–2
–1
0
1
2
–2 –1 0 1 2 3 4 5
Average High
Mean-centered number of local media outlets
148
F A C E S O F L O C A L D E M O C R A C Y
5.4.2 Interactions between Media and Local Officials’ Attitudes about Media
In the LGS, chief administrative officers were asked to estimate on a scale of 1 to 7 the
influence of local media on decisions taken by the council. When added to the four
media features in a regression equation, the coefficient of this “media influence” variable
turns out to be significant when democratic performance is the dependent variable
(data not shown; the impact is similar to that of coverage quality in strength and the
R-squared is boosted to 0.069 when the variable is added to the equation presented in
table 3.3). However, product terms of media features and CAOs’ perceived influence
of local media are not significantly related to the performance index. This suggests that
perceptions about the media’s influence do not amplify the effect of media in localities
where CAOs estimate that this influence is greater. The finding that CAOs’ perceptions
of media influence are directly linked with performance seems to indicate that these
perceptions might not have much to do with the reality of the local media systems, at
least not in the way that this reality (defined by our four media features) is captured
by the survey data.33 As mentioned before, CAOs’ opinion on the matter of media
influence provides an approximate and arguably not the best measure of local officials’
perceptions about media.
Another tool is available to test the idea that perceptions of people within local
authorities make a difference. The 2001 Local Representative Survey (LRS), the second
component of the ILDGP project, was conducted in a number of localities in Hungary.
A total of 255 localities count respondents from both the LGS and LRS, making it
possible to merge information pertaining to the same year and same administrations.
The LRS was conducted by mail; between one and eighteen councilors completed ques-
tionnaires in the overlapping municipalities (with an average of six respondents per
locality). In the bulk of localities (60%), between three and eight respondents returned
the survey questionnaire. Councilors’ evaluation of the influence of media on agenda
setting (the capacity of local media content to influence what citizens think about), on
the extent to which local media influence local authorities’ decisions, as well as their
own opinions about local government issues, are averaged to obtain one score for each
type of perception per locality.34 The results vary between 1, standing for “little influence,”
to 7, indicating “great influence.” (On the agenda-setting scale, 1 stood for “no influ-
ence.”) This investigation did not unearth a systematic pattern of interactions between
media system features and councilors’ beliefs.35 However, we must keep in mind that the
exploration for potential interactions between three of the four media characteristics, on
the one hand, and beliefs of councilors, on the other, involved only 120 to 130 localities out
of the initial 255 (due to the more limited information available about the ownership,
coverage, and audience aspects of media systems), and that all were located in one country,
Hungary.36 In spite of these caveats, the LRS 2001 and LGS 2001 data sets do not lend
credence to the thesis that media impact on local government performance is channeled
through the beliefs of councilors and administrators about the influence of local media.
149
L O C A L M E D I A
6. CONCLUSION
This chapter explored the linkages between local media and the performance of local
governments in Hungary, Latvia, Poland, and Romania. Two aspects of performance
were considered: decisional performance, i.e., how efficiently local government officials
and representatives arrive at decisions, and democratic performance, i.e., how open to
citizens’ input the rules and practices of decision-making are.
The ILDGP surveys generated original data pertaining to local government opera-
tions, local media, political parties, and civil society in a large number of localities in
Central and Eastern European countries. The survey data shed light on various aspects
of local media scenes: the number of outlets available on the local market; whether local
governments or commercial interests are behind local media; how much local outlets
report about local public affairs, notably local government issues; and the extent to
which citizens attend to local media.
Statistical analysis was used to put to the test the hypothesis that these four attributes
of local media enhance the performance of local authorities where they are present,
especially democratic performance. The analysis mainly concerns a pooled data set
including more than 2,000 municipalities from the four countries considered in this
chapter, but also addresses country differences. Hypotheses and findings are summarized
in the two sections below.
• The direct impact of media characteristics on performance:
Hypotheses 1 to 4 respectively submit that localities endowed with more media
outlets, where the ownership structure of those outlets is more diverse (as op-
posed to only local-government controlled, for example), where the quality of
coverage is higher, and where more citizens consume local media, are expected
to display better performance, notably better democratic performance. The
first stage of the analysis shows that better coverage quality (measured by the
extent to which local outlets cover local public affairs), greater availability of
media outlets and greater diversity in the ownership structure are linked with
higher democratic performance scores, but register no impact on decisional
performance. The average reach of local outlets was associated with neither
of the two performance measures. A closer look at country patterns revealed
that coverage quality has a positive and significant impact in all settings. On
the other hand, the positive impact of diversity of ownership structure on the
democratic aspect of local authorities’ performance emerges only in Poland. In
Hungary and Latvia, it is rather the number of media outlets that accounts for
higher democratic performance, while neither the size of local media scenes
nor ownership diversity matter for democratic performance in Romania. These
mixed findings could be explained by a potential threshold effect. The number of
media appears to have an effect on performance only above a certain threshold;
150
F A C E S O F L O C A L D E M O C R A C Y
in turn, once a local media system’s ownership structure is diverse enough, it may
“take over” the positive impact of the number of local outlets. The ownership
structure of local media is not equally diverse in the four countries considered
in this research. Polish localities often count many outlets, owned or control-
led by different actors. There are also much fewer local media in Hungary and
Romania. In further research, localities from a larger number of countries need
to be examined to test a threshold hypothesis and fully disentangle effects due
to country settings and those attributed to media features.
A second multivariate analysis showed that the impact of media features
previously identified, notably the positive effect of coverage quality on demo-
cratic performance, is quite robust. The strength of the coefficients remains
largely unaltered once we have controlled for local political and civic activities
(number of political parties and of NGOs, and citizens’ activities connected to
public affairs), the communities’ characteristics such as size, unemployment, and
community heterogeneity, as well as the level of education of local government
staff. In a few words, these findings support Hypothesis 3 in all the country
settings examined in this chapter. Hypothesis 1 is confirmed only in Latvia and
Hungary (to a lesser extent in the latter country), while Hypothesis 2 holds up
in Poland. The data does yield support for Hypothesis 4.
• Channeling media influence—interactions between media features and the local
environment:
The linkages between media and government performance run through a number
of potential channels. Media can influence performance because citizens with
access to more abundant and better information about local public affairs are
more likely to hold their representatives accountable. Those citizens are also more
likely to better articulate their interests and concerns, and to voice them when
issues relevant to their daily lives, from welfare and primary school education to
garbage collection, are at stake. Media can also carry weight through the percep-
tions of local administrators and councilors; where the latter consider media as
potent agenda-setters and shapers of local public opinion, local authorities might
be more wary of inefficient practices, lack of transparency, delays, etc., which
could be publicized in the local media. The second stage of the analysis set out
to explore three potential channels of media effects on democratic performance
(decisional performance was not considered in this part of the analysis since
media features did not exhibit a statistically significant link with this aspect of
performance).
Hypotheses 5a and 5b posited that the impact of the four media features would be
stronger where chief administrative officers (CAOs) and local councilors believe that
local media successfully influence local authorities’ decisions, and that they are potent
151
L O C A L M E D I A
agenda-setters and shapers of local public opinion. Councilors and CAOs’ opinions in
these respects did not significantly modify the impact of media characteristics; however,
CAOs’ perceptions proved to be directly and positively linked with democratic perform-
ance. Thus Hypotheses 5a and 5b do not receive support. The fact that CAOs’ opinions
register a direct and positive impact on democratic performance could indicate, rather,
that the perception measure is not exactly what we intend it to be: it may have less to
do with the actual characteristics of local media than with those of the local officials
themselves.
Next, the study investigated how the presence and dynamism of civil society affect
the impact of media on democratic performance. Hypotheses 6 and 7 stated respec-
tively that the number of NGOs in town and citizens’ public issues-oriented activities
(requesting meetings with local authorities’ representatives, taking part in petitions or
demonstrations, or challenging a local government decision in front of courts) should en-
hance the impact of media features on democratic performance. Findings partly support
Hypotheses 6 and 7 in Hungary and Romania. In both cases, a stronger NGO presence
was associated with a greater impact of media attributes (of coverage quality in Romania;
of the number of outlets in Hungary and Romania) on democratic performance. The
enhancing effect of citizens’ active involvement is similar but weaker (citizens’ initiatives
corresponded with a stronger impact of coverage quality in Romania and Hungary; it
was also linked to larger effects of the number of outlets, but only in Hungary).
Overall, the media features examined in this study account for over 5% of variation
observed in democratic performance between localities. This is not negligible, given that
media effects are by nature difficult to circumscribe and thus to quantify. The difficulties
of the endeavour are increased by the paucity of available information about local media
in general, which received scant attention in transition studies compared to their national
counterparts. These findings tell us that media do matter for how local governments run
municipal public affairs. This is not a trivial conclusion, since assumptions about the
positive influence of plurality and independence of the media on local democracy have
so far had more currency than quantitative assessments of the influence of local media
on local authorities’ practices. Still, the results of this research cannot tell the whole
story of how local media matter for local government performance.
Focusing on the locality as the unit of observation, for which the available survey
data is well suited, has increased explanatory leverage with regard to the impact of
media features. However, the differences between media systems, as well as between
local government systems at the country level, compounded by the lack of information
about local media, pose a thought-provoking challenge. More information and further
research is required to better understand local media, formulate more precise hypotheses
about their effects, and interpret findings with greater accuracy. This chapter sought
to identify direct (and indirect, through interactions) linear effects of media systems’
characteristics on local government performance. Other, non-linear models have yet to
152
F A C E S O F L O C A L D E M O C R A C Y
be tested. As hypothesized in the case of diversity of ownership structure, an influence
might be detectable only after a certain threshold is reached. Media may also affect
performance following a more complex pattern of combinations between media features
and characteristics of local environments than has been examined in these pages. Our
study only begins the investigation of this so far neglected topic.
NOTES
1 See Bajomi-Lazar (2001) and Chorawski (2001). I am unaware of similar accounts about Romanian
and Latvian local media.
2 Throughout this chapter the term “local media” is used for the sake of convenience but all survey
questions refer to media outlets which provide information about local public affairs.
3 Survey data available from the Open Society Foundation–Romania at http://www.osf.ro/ro/bop/
cercetare.html.
4 Central European University Post-Election Survey 2002 (1,200 respondents), funded by the CEU
Foundation.
5 Available at http://www.iss.uw.edu.pl/osrodki/obs/pgss/en/index.html. The machine readable data file
1992–1999 of the Polish General Social Surveys is produced and distributed by the Institute for Social
Studies, University of Warsaw (2002). Investigators are Bogdan Cichomski (principal investigator),
Tomasz Jerzyński, and Marcin Zielinski.
6 The survey was conducted in the framework of the Baltic Institute of Social Sciences’ project “Towards
a Civic Society;” the data is available at http://www.bszi.lv.
7 This idea of journalism’s function in society also emerges in studies of the public’s expectations of what
the media should do (see Protess et al. [1991, 14] for an American survey).
8 In a nutshell, less corruption, greater administrative efficiency, higher political stability, and a more
effective rule of law.
9 The large majority of empirical studies of local media pertain to the American context, where detailed
information about local media markets and a number of content analyses are available.
10 See Cook Lomax et al. (1983) for an empirical approach, and Protess et al. (1991) for a qualitative
take on the issue.
11 The two other types of performance outlined in the book, responsiveness and implementation, were
left out for reasons of space constraints, data availability, as well as the need to focus on the most
comparable aspects of local governance procedures across countries.
12 It is quite possible that local authorities achieve higher democratic performance scores as a result of
their own behavior (a “pull” phenomenon), and as a consequence of local inhabitants’ and civic groups’
demands (“push”) to be included in the policy-making process. A “push” effect is less likely in the case
of indicators measuring decisional performance. For example, instances of lack of quorum (used as
an indicator of decisional performance) are related to councilors’ and mayors’ behavior rather than
citizens’ influence. This is why, in addition to the purported mobilization role of the media, democratic
performance should be more responsive than its decisional counterpart to the presence of media, as
well as to other media features.
153
L O C A L M E D I A
13 For different reasons on why local media coverage is generally favorable to local authorities, see Paletz,
Reichert, and McIntyre (1971).
14 As Popescu and Tóka’s (2002) investigation revealed, the expected positive impact for incumbents does
not automatically materialize. They found that when the government overtly used public television
as a tool for political propaganda during the 1994 electoral campaign, it actually had the reverse
impact on people’s voting choice—greater exposure to public television was associated with voting
for the challenger, thus showing that mobilization can take place when media outlets are used in an
outrageously self-serving manner by the government in power.
15 Most attempts to assess quality in a quantifiable manner have made use of content analysis. For example,
the proportion of local content in a news report or a newspaper has been used as a measure of quality
by students of local media. Others have used indicators such as the number of own news-gathering
staff (McQuail 1992, 268), the size of editorial budget, or the workload of journalists, defined as the
number or articles or news pieces produced per day (Riffe and Shaw 1990; Lacy and Fico 1990). In
the case of newspapers with relatively large circulation, a rule of thumb has been to rely on a ratio of
editorial staff/circulation (Turner 1995).
16 However, this measure of penetration does not reveal whether the same or different people are reached
by a locality’s outlets. Here the average audience of all outlets present in one locality has been selected
as the measure of penetration.
17 Notably, more detailed measures of financial capacities and autonomy. These elements can only be
controlled for adequately in the framework of country comparisons rather than in a study privileging
the locality as its prime unit of observation.
18 The indices are not meant as scales or as “objective” measures of performance; what constitutes
performance here is solely defined by the available data. The indicators used to build the indices do
not necessarily correlate with one another.
19 The question about discussion of budget plans with journalists was not retained because it is not
independent of the presence of media in the locality. A measure of the number of local referenda was
also not included because the question was not asked in Latvia.
20 In Hungary and Poland, significance levels are below 0.01. In Poland, the relationship is weaker,
significant at the 0.1 level.
21 The coefficient of a variable measuring whether or not the media scene was entirely controlled by the
local government was not significant when included in the equation instead of the ownership diversity
variable.
22 The significance level of the coverage quality’s coefficients in Latvia and Romania are 0.07 and 0.06
respectively.
23 In Hungary, the significance level of the number of media outlets variable is 0.01; in Latvia, 0.05.
24 However, we need to keep in mind the results of the Public Opinion Barometer surveys cited in
section 1.1, according to which readership of Romanian local papers is far from negligible (at least
between 1995 and 1997, when the surveys were carried out; the author could not find more recent
data pertaining to local media audience).
25 Localities were separated into two categories: those that witnessed no such initiatives (a little more
than half of the sample) and those where at least one activity took place.
26 The coefficient for the number of factions included in the ruling coalition of the local assembly was
not significant when included with or used instead of the number of parties.
154
F A C E S O F L O C A L D E M O C R A C Y
27 Equations including each type of cleavage separately did not yield significant coefficients.
28 One of the reasons frequently given to explain lower civic involvement is lack of resources (Brady,
Verba, and Schlozmann 1995).
29 Unlike the question about ownership, the one about audience size did not include the “Don’t know”
option as an answer.
30 In Hungary, Poland, and Romania, p<0.01. In Latvia, p=0.07.
31 The number of organizations ranges from none (35% of localities) to 98 or more. In analyses involving
interaction terms, the variable was recoded so that localities with ten local associations or more are
part of one category. Approximately 85% of localities count between zero and nine NGOs.
32 In Hungary, Poland, and Romania, the variable accounting for the number of local organizations has
been recoded so that approximately 15% of localities with the largest NGO presence are grouped
into one category (in Romania, the scale runs from zero to ten; in Hungary, from zero to fifteen; in
Poland, from zero to twenty). In Latvia, no recoding was used as the distribution of NGO presence
covered a narrower range, with 35 as the maximum number of associations reported.
33 CAOs’ perception of media influence and the number of media are only moderately correlated. This
could indicate that the perception of media influence of CAOs actually taps into something other
than the media reality of the locality. It could be that CAOs have a poor idea of media influence;
alternatively, the measure could be more indicative of the “open-mindedness” of respondents; yet
again, it could also measure the eagerness of respondents to paint their locality in a “democratic” light.
34 No weight is applied to the analyses pertaining to the merged LGS and LRS data sets.
35 Only two significant interaction effects emerge. The first is between the mean penetration of outlets
and councilors’ belief that local media are successful at influencing what citizens discuss and are
concerned with when it comes to matters of local public life. It indicates that when such a belief is
stronger, the slope of mean penetration on performance decreases. The second interaction occurs when
councilors perceive that the influence of local outlets on local government decisions is larger. Then,
the impact of the number of media on performance is enhanced. This second finding is more in line
with expectations than the first one.
36 Repeating the operation with other beliefs of councilors related to media, namely their trust in reports
about local government issues, to what extent they believe that local media should serve as watchdogs
for the community, or whether councilors think that citizens attempt to influence local government
by alerting the media, did not yield significant results.
REFERENCES
Ansolabehere, S., R. Behr, and S. Iyengar. 1993. The Media Game. American Politics in
the Television Age. New York-Toronto: Macmillan.
Bagdikian, B.H. 1997. The Media Monopoly. Boston: Beacon Press.
Bajomi-Lazar, P. 2002. Public service television in East Central Europe. Paper presented
at the Conference of the Federation of International Journalists. Budapest, February
15–17 (updated in July 2002).
155
L O C A L M E D I A
———. 2001. Regional and local media in Hungary. In: J. Adamowski and M.
Jablonowski (eds.). The Role of Local and Regional Media in the Democratization of
Eastern and Central European Societies. Warsaw: Institute of Journalism, University
of Warsaw.
———. 1999. Press freedom in Hungary, 1988–1998. Budapest. Unpublished.
Bernstein, J. M. and S. Lacy. 1992. Contextual coverage of government by local television
news. Journalism Quarterly 69 (2): 329–340.
Brady, H.E., S. Verba, and K. Lehman Schlozman. 1995. Beyond SES: A resource model
of political participation. The American Political Science Review 89 (2): 271–294.
Chorawski, W. 2001. The situation of local media in Poland as of the end of 2000:
experiences, practice, trends of development. In: J. Adamowski, and M. Jablonowski
(eds.). The Role of Local and Regional Media in the Democratization of Eastern and
Central European Societies. Warsaw: Institute of Journalism, University of Warsaw.
CIT Publications. 2001. Latvia. In: The Media Map of Eastern Europe. Exeter.
Dawisha, K. 1997. Democratization and political participation: research concepts and
methodologies. In: B. Parrot, and K. Dawisha (eds.). The Consolidation of Democracy
in East-Central Europe. Cambridge: Cambridge University Press.
Delli C., X. Micheal and S. Keeter. 1996. What Americans Know about Politics and Why
It Matters. New Haven: Yale University Press.
Djankov, S., C. McLiesh, T. Nenova, and A. Shleifer. 2001. Who owns the media?
Harvard Institute of Economic Research. Discussion paper No. 1919, April.
Downing, J. 1996. Internationalizing Media Theory. London: Sage.
Entman, R.M. 1989. Democracy without Citizens: Media and the Decay of American Politics. New York: Oxford University Press.
Franklin, B. 1987. Local parties, local media and the constituency campaign. In: I. Crewe
and M. Harrop (eds.). Political Communication: the General Election Campaign of
1987. 211–220. Cambridge: Cambridge University Press.
Galik, M. 1996. Foreign capital is welcomed here. Media Studies Journal 10 (2/3):
139–146.
Giorgi, L. 1995. The Post-socialist Media: What Power the West? Aldershot: Avebury.
Goban-Klas, T. 1994. The Orchestration of the Media: The Politics of Mass Communications
in Communist Poland and the Aftermath. Boulder: Westview Press.
Gosselin, T. 2003. Assessing the impact of ownership, civil society and party competition
on the size of local media systems. The cases of Hungary, Poland, Romania and
Latvia. Média kutató (Spring): 103–118 [In Hungarian].
156
F A C E S O F L O C A L D E M O C R A C Y
— ——. 2003a. Citizens’ political involvement in Hungary, Poland, Romania and
Latvia: local electoral turnout, collective actions and their determinants. Paper
presented at the ECPR Joint Sessions Workshop: Changes in political involvement.
Disenchantment, mobilization and electoral turnout. Edinburgh, Scotland, March
28–April 2.
Gross, P. 1996. Mass Media in Revolution and National Development. The Romanian
laboratory. Ames: Iowa State University Press.
Huckfeldt, R.R. and J.D. Sprague. 1995. Citizens, Politics, and Social Communication:
Information and Influence in an Election Campaign. Cambridge: Cambridge
University Press.
Hindman, D., R.L. Blanks, A. Preston, and D. Neumann. 1999. Structural pluralism,
ethnic pluralism and community newspapers. Journalism and Mass Communication
Quarterly 76 (2): 250–263.
Iyengar, S. 1991. Is Anyone Responsible? How Television Frames Political Issues. Chicago:
University of Chicago Press.
Jaccard, J. and R. Turrisi. 2003. Interactions Effects in Multiple Regression (2nd ed.). Sage
University Papers Series on Quantitative Applications in the Social Sciences, No.
07–072. Thousand Oaks, CA: Sage.
Jakubowicz, K. 1996. Television and elections in post-1989 Poland: How powerful is
the medium? In: D.L. Swanson and P. Mancini (eds.) Politics, Media and Modern
Democracy. 129–154. Westport, CT: Praeger.
Johnson, T.J., and W. Wanta. 1993. Newspaper competition and message diversity in
an urban market. Mass Communication Review 20 (3–4): 136–147.
Kalman, J. and G. Soós. 2002. Report on the state of local democracy in Hungary. In: G.
Soós, G. Tóka, and G. Wright (eds.). The State of Local Democracy in Central Europe.
16–105. Budapest: Local Government and Public Service Reform Initiative.
Kingdon, J.W. 1995. Agendas, Alternatives, and Public Policies (2nd ed.). New York:
Longman.
Kocher, R. 1986. Bloodhounds or missionaries: Role definitions of German and British
journalists. European Journal of Communication 1 (1): 43–64.
Kováts, I., and G. Whiting. 1995. Hungary. In: D.L. Paletz, K. Jakubowicz, and
P. Novosel (eds.). Media Change in Central and Eastern Europe. 221–231. Cresskill,
NJ: Hampton Press.
Lacy, S. 1989. A model demand for news: Impact of competition on newspapers’ content.
Journalism Quarterly 66 (1): 40–48.
157
L O C A L M E D I A
Lacy, S. and F. Fico. 1990. Newspaper quality and ownership: Rating the groups.
Newspaper Research Journal 11 (2): 42.
Lacy, S., D.C. Coulson, and C. St. Cyr. 1999. The impact of beat competition on city
hall coverage. Journalism and Mass Communication Quarterly 76 (2): 325–340.
Lasorsa, D.L. 1991. Effects of newspaper competition on public opinion diversity.
Journalism Quarterly 68 (1–2): 38–47.
Lomax C., Fay et al. 1983. Media and agenda setting: effects on the public, interest
group leaders, policy makers and policy. Public Opinion Quarterly 47: 16–35.
McLeod, J.M., D.A. Scheufele, and P. Moy. 1999. Community, communication, and
participation: the role of mass media and interpersonal discussion in local political
communication. Political Communication 16: 315–336.
McLeod, J. et al. 1999. Understanding deliberation. The effects of discussion networks
on participation in a public forum. Communication Research 26 (6): 743–774.
McLeod, J. et al. 1996. Community integration, local media use, and democratic
processes. Communication Research 23 (2): 179–209.
McQuail, D. 2000 (4th ed). McQuail’s Communication Theory. London: Sage.
———. 1992. Media Performance. London: Sage.
Neuwirth, K., C.T. Salmon, and M. Neff. 1989. Community orientation and media
use. Journalism Quarterly 66 (1) :31–39.
O’Neil, P.H. 1997. Post-communism and the Media in Eastern Europe. London: Frank
Cass.
Page, B.I. 1996. Who Deliberates? Mass Media in Modern Democracy. Chicago: University
of Chicago Press.
Paletz, D.L, P. Reichert, and B. McIntyre. 1971. How the media support local
governmental authority. Public Opinion Quarterly 35 (1): 80–92.
Pop, L. 2002. Local government administration in Romania. In: G. Soós, G. Tóka,
and G. Wright (eds.). The State of Local Democracy in Central Europe. 287–369.
Budapest: Local Government Public Service Reform Initiative.
Popescu, M. and G. Tóka. 2002. Campaign effects and media monopoly. The 1994
and 1998 parliamentary elections in Hungary. In: D.M. Farrell, and R. Schmitt-
Beck (eds.). Do Campaigns Matter? Campaign Effects in Elections and Referendums.
London: Routledge.
Preoteasa, M. 2003. Les politique à l’assaut du marché de la presse locale; Misères
de la presse locale; Les financements douteux de la presse locale. Capital May
158
F A C E S O F L O C A L D E M O C R A C Y
18–19. (Romanian weekly: French translations available at Courrier des Balkans,
http://www.balkans.eu.org/article3137.html).
Protess, D.L. et al. 1991. The Journalism of Outrage. Investigative Reporting and Agenda
Building in America. New York: The Guilford Press.
Riffe, D. and E.F. Shaw. 1990. Ownership, operating, staffing and content characteristics
of ‘news radio’ stations. Journalism Quarterly 67 (4): 684–691.
SAR (Romanian Academic Society). 2003. Policy warning report No. 1. Bucharest: SAR.
Soós, G., G. Tóka, and G. Wright (eds.). 2002. The State of Local Democracy in Central
Europe. Budapest: Local Government Public Service Reform Initiative.
Splichal, S. 1994. Media Beyond Socialism. Boulder: Westview Press.
Sükösd, M. 1997–8. Media and democratic transition in Hungary. Oxford International
Review 8 (3): 11–21.
Swoboda, D.P. 1995. Accuracy and accountability in reporting local government budget
activities: evidence from the newsroom and from newsmakers. Public Budgeting and
Finance 15 (3): 74–90.
Tocqueville, A. de. 1990. In: H. Reeve, F. Bowen, and P. Bradley (eds.). Democracy in
America. (2nd ed.). New York: Vintage Books.
Turner, G. 1995. A quantitative approach to quality in Australian newspapers. Gazette
55: 131–144.
Weaver, D. 1996. Journalists in comparative perspective. The Public 3 (4): 83–91.
Zaller, J. 1999. Market competition and news quality. Paper presented at the APSA
Annual Meeting, September 2–5, Atlanta, GA.
159
L O C A L M E D I A
APPENDIX I
Overview of Local Media Characteristics and Local Government Performance Indices
The appendix provides a brief overview of the local media landscape in the four coun-
tries included in the study. The main characteristics of local media systems explored are
their size (number of local media), the quality of their content, sponsorship (diversity
of ownership), and their estimated reach (penetration) among local citizens. Since those
four elements are interconnected to a certain degree, a table highlighting correlations
between size, quality, sponsorship, and penetration is also included below. We have de-
scribed the feature involving the number of available local outlets in the first section of
the chapter (see table 3.1). The tables below display the distribution of the three other
media features in the LGS sample.
The last section of the appendix describes how the local government performance
indices “perform,” not only in the pooled data set but in each country. For more details
on how the variables are constructed, see Appendix II.
• Ownership Structure
Local Government Survey (LGS) data show that in over 40% of localities, local
governments own at least one local media outlet. Private citizens and business
enterprises are also present in over 30% of local media scenes. Other types of
owner are less present in the local media; none of those included among the
answer options (NGOs, local institutions, other governments, or political par-
ties) can be found in more than 11% of all localities included in the sample.
Political parties own outlets in hardly a handful of localities, mostly located in
Poland (5.8%).* By law, political parties are not allowed to control broadcast
media in Latvia (CIT 2001).
In Hungary and Latvia, local governments are strong sponsors of the media,
with at least one outlet in 78% and 63% of localities where there are local media.
By contrast, only 10% of localities count local government-owned media in
Romania. Poland stands somewhere in between, with local government media
present in 27% of localities. The proportion of private media, owned either
by enterprises or private citizens, hovers between 40% (Hungary) and 65%
(Poland). Polish localities display the most diverse range of owners, notably with
* This does not mean that political parties do not publish local papers. For example, competition is
particularly fierce in some districts of Budapest where major parties provide readers/voters with small
newspapers after the model of the local government paper.
160
F A C E S O F L O C A L D E M O C R A C Y
a significant presence of public institutions (18%) and “other owners” (15%)
as sponsors of media outlets.
• Coverage Quality
The distribution for the Coverage Quality Index is displayed in table A3.3 for
both the pooled data set and by country. The index is composed of four indica-
tors: reports about local assembly’s decisions; reports about proposals debated
in the assembly; reports about arguments and counter-arguments discussed at
local assemblies; and interviews with local government leaders or councilors.
• Audience Size
Audience size, or the penetration score of media outlets for each city is calculated
using the mean of CAOs’ estimates of the audience reached by each outlet,
ranging on a scale from zero (“less than one person out of ten”) to ten (“almost
everyone”). For the sake of clarity, table A3.4 shows localities divided into five
categories ranging from “very low” to “very high” penetration scores.
• Correlations between Media Systems’ Features
The coefficients given below are indicators of the strength of the relationship
between pairs of variables, while controlled for population size. The analysis
is weighted to adjust for the over-sampling of bigger localities. Note that the
number of cases pertaining to each correlation is given in the boxes below the
standardized beta coefficients (table A3.5).
• Performance Indices
The measures of decisional and democratic performance constructed for the
purpose of this chapter are not significantly correlated. Thus, one does not
materialize at the expenses of the other (a common assumption in studies of
local governance). However, democratic performance is moderately correlated
to locality size (logged population size) (r=0.165). For the pooled data set and
for each country, the distributions of both types of performance have been
divided into five categories. Although the categories are roughly of equal size
within countries, there are observable differences between countries’ distribu-
tions, thus allowing a comparison of how the indices “perform” in the different
settings considered in this study (tables A3.6 and A3.7).
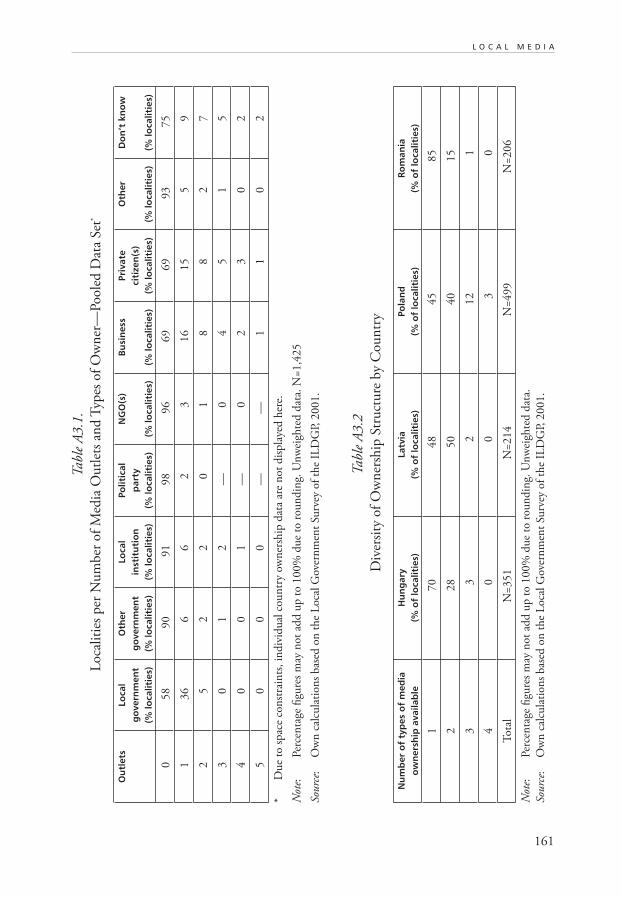
161
L O C A L M E D I A
Tab
le A
3.1
.
Loca
liti
es p
er N
um
ber
of
Med
ia O
utl
ets
and
Typ
es o
f O
wn
er—
Poole
d D
ata
Set
*
Ou
tlet
sLo
cal
go
vern
men
t(%
loca
litie
s)
Oth
er
go
vern
men
t(%
loca
litie
s)
Loca
l in
stit
uti
on
(% lo
calit
ies)
Polit
ical
par
ty(%
loca
litie
s)
NG
O(s
)
(% lo
calit
ies)
Bu
sin
ess
(% lo
calit
ies)
Priv
ate
citi
zen
(s)
(% lo
calit
ies)
Oth
er
(% lo
calit
ies)
Do
n’t
kn
ow
(% lo
calit
ies)
058
90
91
98
96
69
69
93
75
136
6
6
2
3
16
15
5
9
25
2
2
0
1
8
8
2
7
30
1
2
—0
4
5
1
5
40
0
1
—0
2
3
0
2
50
0
0
——
1
1
0
2
* D
ue
to s
pac
e co
nst
rain
ts, in
div
idu
al c
ou
ntr
y ow
ner
ship
dat
a ar
e n
ot
dis
pla
yed
her
e.
Not
e:
Per
cen
tage
figu
res
may
not
add
up
to 1
00%
du
e to
rou
nd
ing.
Un
wei
ghte
d d
ata.
N=1,4
25
Sourc
e:
Ow
n c
alcu
lati
on
s bas
ed o
n t
he
Loca
l G
over
nm
ent
Surv
ey o
f th
e IL
DG
P, 2
001.
Tab
le A
3.2
Div
ersi
ty o
f O
wn
ersh
ip S
tru
ctu
re b
y C
ou
ntr
y
Nu
mb
er o
f ty
pes
of
med
iao
wn
ersh
ip a
vaila
ble
H
un
gar
y(%
of
loca
litie
s)La
tvia
(% o
f lo
calit
ies)
Pola
nd
(% o
f lo
calit
ies)
Ro
man
ia(%
of
loca
litie
s)
1
70
48
45
85
2
28
50
40
15
33
212
1
40
03
0
Tota
lN
=351
N=214
N=499
N=206
Not
e:
Per
cen
tage
figu
res
may
not
add
up
to 1
00%
du
e to
rou
nd
ing.
Un
wei
ghte
d d
ata.
Sourc
e:
Ow
n c
alcu
lati
on
s bas
ed o
n t
he
Loca
l G
over
nm
ent
Surv
ey o
f th
e IL
DG
P, 2
001.
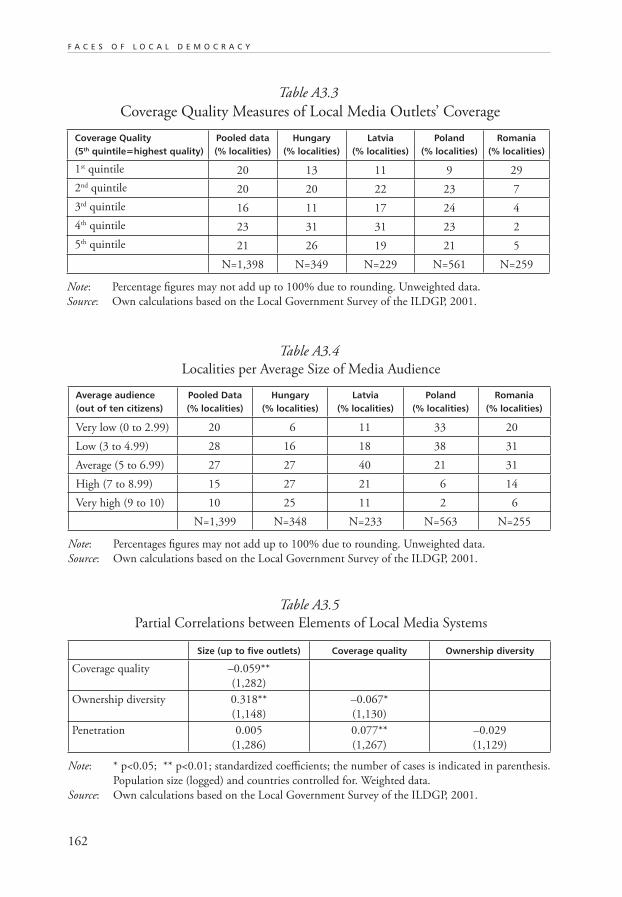
162
F A C E S O F L O C A L D E M O C R A C Y
Table A3.5
Partial Correlations between Elements of Local Media Systems
Size (up to five outlets) Coverage quality Ownership diversity
Coverage quality –0.059**
(1,282)
Ownership diversity 0.318**
(1,148)
–0.067*
(1,130)
Penetration 0.005
(1,286)
0.077**
(1,267)
–0.029
(1,129)
Note: * p<0.05; ** p<0.01; standardized coefficients; the number of cases is indicated in parenthesis.
Population size (logged) and countries controlled for. Weighted data.
Source: Own calculations based on the Local Government Survey of the ILDGP, 2001.
Table A3.3
Coverage Quality Measures of Local Media Outlets’ Coverage
Coverage Quality(5th quintile=highest quality)
Pooled data(% localities)
Hungary(% localities)
Latvia(% localities)
Poland(% localities)
Romania(% localities)
1st quintile 20 13 11 9 29
2nd quintile 20 20 22 23 7
3rd quintile 16 11 17 24 4
4th quintile 23 31 31 23 2
5th quintile 21 26 19 21 5
N=1,398 N=349 N=229 N=561 N=259
Note: Percentage figures may not add up to 100% due to rounding. Unweighted data.
Source: Own calculations based on the Local Government Survey of the ILDGP, 2001.
Table A3.4
Localities per Average Size of Media Audience
Average audience(out of ten citizens)
Pooled Data(% localities)
Hungary(% localities)
Latvia(% localities)
Poland (% localities)
Romania(% localities)
Very low (0 to 2.99) 20 6 11 33 20
Low (3 to 4.99) 28 16 18 38 31
Average (5 to 6.99) 27 27 40 21 31
High (7 to 8.99) 15 27 21 6 14
Very high (9 to 10) 10 25 11 2 6
N=1,399 N=348 N=233 N=563 N=255
Note: Percentages figures may not add up to 100% due to rounding. Unweighted data.
Source: Own calculations based on the Local Government Survey of the ILDGP, 2001.
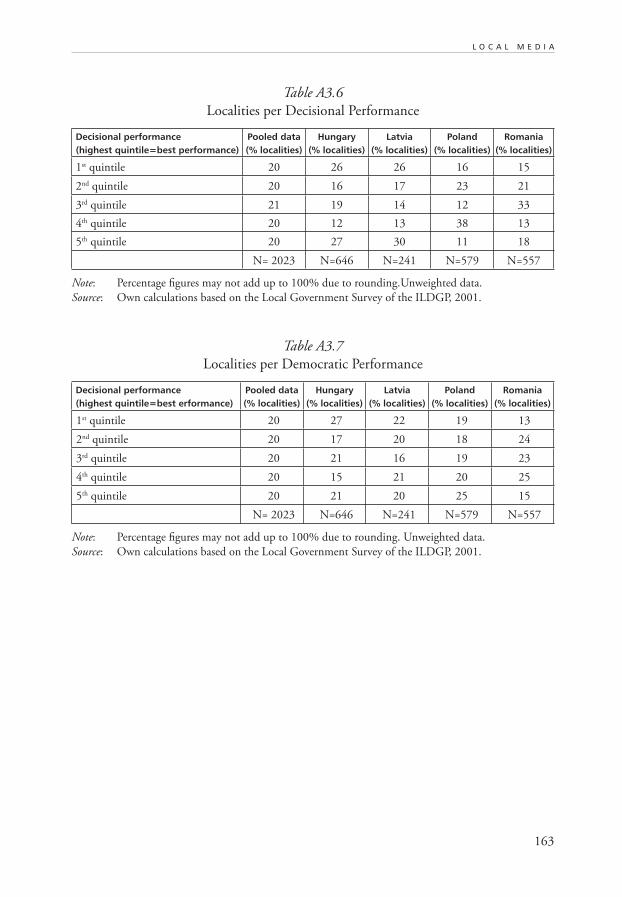
163
L O C A L M E D I A
Table A3.6
Localities per Decisional Performance
Decisional performance(highest quintile=best performance)
Pooled data(% localities)
Hungary(% localities)
Latvia(% localities)
Poland(% localities)
Romania(% localities)
1st quintile 20 26 26 16 15
2nd quintile 20 16 17 23 21
3rd quintile 21 19 14 12 33
4th quintile 20 12 13 38 13
5th quintile 20 27 30 11 18
N= 2023 N=646 N=241 N=579 N=557
Note: Percentage figures may not add up to 100% due to rounding.Unweighted data.
Source: Own calculations based on the Local Government Survey of the ILDGP, 2001.
Table A3.7
Localities per Democratic Performance
Decisional performance(highest quintile=best erformance)
Pooled data(% localities)
Hungary(% localities)
Latvia(% localities)
Poland(% localities)
Romania(% localities)
1st quintile 20 27 22 19 13
2nd quintile 20 17 20 18 24
3rd quintile 20 21 16 19 23
4th quintile 20 15 21 20 25
5th quintile 20 21 20 25 15
N= 2023 N=646 N=241 N=579 N=557
Note: Percentage figures may not add up to 100% due to rounding. Unweighted data.
Source: Own calculations based on the Local Government Survey of the ILDGP, 2001.
164
F A C E S O F L O C A L D E M O C R A C Y
APPENDIX II
Description of Variables and Performance Indices
The variables used in this chapter are listed and described below. Names of variables
referring to the Local Government and Local Representative Surveys’ codebooks are in
parentheses and italicized.
Performance Indices
• Decisional Performance Index. The index is composed of four indicators: budget
promptness (computed using the month and year of adoption of the 2000
budget), lack of quorum [decis03], frequency of postponed decisions [decis04],
and number of extraordinary sessions [decis02]. Extraordinary sessions are re-
coded into eight categories: the numbers of extraordinary sessions from 0 to 6
make up the first seven categories, and “7 or more sessions” form the last one.
The ordering is reversed so that a higher score reflects a lower number of sessions,
and thus greater efficiency in decision-making. Budget promptness is coded is
a similar fashion—lack of promptness receives a score of 1 while localities that
managed to respect the legal deadline for passing the budget are coded 2.
To capture a maximum of within-country variance in performance, the
index is calculated differently depending on the country where the municipality
is located. As explained in the chapter, the laws regulating the functioning of
local governments differ and a direct comparison of Latvian cities with Polish
ones with respect to budget promptness would tell us more about the legal
framework than about performance itself. Therefore, the mean and standard
deviation of the four components of the index were calculated on the basis of
country samples. Missing values were replaced with country-sample means.
Z-scores (the variable value minus the sample mean, divided by the standard
deviation) are then computed for each of the four variables. The Z-scores of the
four components are summed up in a Decisional Performance Index.
• Democratic Performance Index. The index is composed of five indicators: the
number of public hearings and forums held [info03], whether there was a public
forum about the draft budget [decis06b], whether the draft budget was published
[decis06c], whether the local authorities discussed the draft budget with local
civic organizations [decis06a], and how many such organizations, if any, were
included in the preparations of local governments’ decisions [civil01a].
The number of public hearings and forums was recoded into eight categories (zero,
one, two, three and four, five to seven, eight to ten, eleven or more). The initial response
options did not include “no forums were held.” Following the contributors to the first
165
L O C A L M E D I A
volume using the LGS data set (e.g., Kálmán and Soós 2002; Pop 2002, in The State
of Local Democracy in Central and Eastern Europe), missing values were treated as an
indication of a lack of hearings held in 2000.
Variables for the public forum about the budget and draft budget publication were
recoded so that better performance translates into a higher score (1=“no,” 2=“yes”). The
two last indicators (discussions of draft budget with civic associations and number of
associations included in decision preparations) imply the presence of civic associations
in the municipality. To evaluate the democratic performance of localities with respect
to their inclusion in decision preparations meaningfully, localities that count civic as-
sociations but do not include them in those preparations were assigned a score of 0.
Localities without associations were given a score of 1. Localities where such organiza-
tions are present and included in the decision-making process received a score of 2.
The variable indicating whether local authorities discussed the draft budget with civic
organizations was coded in a similar fashion. Missing values (in cases of localities where
civic organizations were reported) of the two indicators were replaced by the mean of
only those cities in the sample endowed with associations.
As for decisional performance, the means as well as the standard deviations used
to calculate the Z-scores of the five indicators are calculated on the basis of country
samples. Similarly, Z-score are added to yield a positive democratic performance index,
i.e., a higher value indicates better performance.
Media System Variables
• Number of Media [media1]. Coded from 0 to “8 or more” for the first analysis
(described in table 3.2), recoded from 0 to 5 in subsequent analyses.
• Coverage Quality Index [media7a to media7e, media8a to media8e, media9a to
media9e, media10a to media10e]. Initial variables were recoded 0=“no” and
1=“yes” to indicate whether the outlet includes the four indicators of quality
coverage (reports about the local assembly’s decisions; reports about proposals
debated in the assembly; reports about arguments and counterarguments
discussed at local assemblies; and lastly, interviews with local government
leaders or councilors) in its regular coverage. Mean scores for each of the four
indicators were computed for all outlets. The new variables were standardized
(i.e., “z-scored,” a process that centers the variable’s distribution around 0) and
then added up to obtain a measure of quality in each locality. Cases that had
missing values for two or more of the four indicators (and localities with no
media outlets) were not included in the index (625 cases were excluded).
• Diversity of Ownership Structure [media13a, media13b, media13c, media13d,
media13e]. The numbers of different types of ownership present in a locality
were added up. Cases for which no information (either missing or “don’t know”)
about ownership was available, as well as localities without media outlets, were
166
F A C E S O F L O C A L D E M O C R A C Y
not included. However, to maximize the number of cases that could be included
in the analysis, localities for which no ownership information was available
but where only one outlet was reported received a score of 1 (752 cases were
excluded.)
• Audience [media11a, media11b, media11c, media11d, media11e]. The origi-
nal variables are coded in such a way that the coding scheme does not fully
distinguish between the absence of outlet or a score of 0 (i.e., no audience).
To illustrate this point: in a number of localities with one or two outlets, the
penetration score assigned to (non existent) third, fourth, and fifth outlets was
“0” instead of an indication of missing outlets. To correct for this as much as
possible, I recoded as missing all outlets that were not reported when asked for
the total number of local media (media1a, up to five). For example, were three
outlets reported, the fourth and fifth columns were treated as missing instead of
“0” so as not to underestimate the audience of local media. The audience scores
of all outlets in town were meaned. Localities without outlets or for which no
audience information was available were left out and treated as missing (624
cases were excluded).
Local Civil Society Variables
• Number of NGOs [civil07]. The number of civic organizations in the locality.
• Number of Political Parties [parties]. The number of political parties active in
the locality.
• Citizens’ Initiatives [actio01a] (demonstrations), [actio02a] (petitions), [actio03a]
(requests for meetings), [actio04a] (challenges to local government decisions in
court). The localities that witnessed no initiatives were coded 0; those where at
least one of the four activities took place were coded 1.
Other Variables
• Unemployment [unemp]. The percentage of unemployed people in the locality.
• Community Heterogeneity [socio04a] (differences in income), [socio04b] (dif-
ferences in religious beliefs), [socio04f] (different parts of the municipality),
[socio04c] (differences in political views), [socio04e] (differences of ethnicity),
[socio04g] (differences between newcomers and long-established inhabitants).
Chief administrative officers’ evaluation of the degree of tension caused by
these various divides in the locality—rated from 1 for “low tension” to 7 for
“high tension.” Community heterogeneity is measured by taking the mean of
the tension score of all cleavages.
• Staff Level of Education [staffedu]. The percentage of local government staff with
higher education.
167
L O C A L M E D I A
Local Officials’ and Representatives’ Perception of Media Influence • Chief Administrative Officers’ Perception of Local Media Influence on Local Authori-
ties’ Decisions [decis08e].
• CAOs’ Perception * Number of Media Outlets. The product of the two variables
(both variables were centered on their mean by subtracting the mean from the
two variables’ scores before they were multiplied).
• CAOs’ Perception * Quality Coverage. The product of the two variables (both
variables were centered on their mean by subtracting the mean from the two
variables’ scores before they were multiplied).
• CAOs’ Perception * Ownership Diversity. The product of the two variables (both
variables were centered on their mean by subtracting the mean from the two
variables’ scores before they were multiplied).
• CAOs’ Perception * Penetration. The product of the two variables (both variables
were centered on their mean by subtracting the mean from the two variables’
scores before they were multiplied).
From the 2001 Hungary Local Representative Survey (LRS)
The observational unit of the LRS is the councilor, not the locality. Between one and
18 councilors returned the questionnaire in a number of Hungarian localities. The
media-related responses of councilors from the same town were averaged to yield one
measure for each type of perception per locality. The data were then merged with the
LGS data and localities common to both data files were retained (255 localities).
• Councilors’ Perception of Local Media Capacity to Influence:
– Local Authorities’ Decisions [q21d]. Coded between 1 (little influence) to
7 (great influence).
– Agenda-setting [q34] (capacity to influence what citizens think about concern-
ing local government issues). Coded 1 (no influence) to 7 (great influence).
– Own Opinion about Local Government Issues [q40j]. Coded 1 (little influ-
ence) to 7 (great influence).
• Councilors’ Perception of Media Influence on Local Government Decisions * Number
of Media Outlets (up to five). The product of the two variables (both variables
were centered on their mean by subtracting the mean from the two variables’
scores before they were multiplied).
• Councilors’ Perception of Media Influence on Agenda-Setting * Number of Media
Outlets (up to five). The product of the two variables (both variables were centered
on their mean by subtracting the mean from the two variables’ scores before
they were multiplied).
The three variables measuring councilors’ perceptions were mean-centered, then
multiplied first with the number of media outlets and second with the coverage
quality index score, for a total of twelve product terms.
169
Municipality Size and Citizens’ Effectiveness:
Hungary, Poland, and Romania
Daniel Pop
ABSTRACT
The relationship between the size of municipalities and the ability of citizens to influ-
ence local matters is the focus of this chapter. Our study looks at Hungary, Poland,
and Romania using data from the Indicators of Local Democratic Governance Project
(ILDGP), a joint project of the Local Government and Public Service Reform Initiative
(LGI) and the Tocqueville Research Center (T-RC). The data reflect attitudes expressed by
local public officials. In each of the three countries, the study shows less effective citizen
involvement in very small municipalities and greater effectiveness in larger centers. This
finding indicates that the high level of municipal fragmentation that is specific to the
three countries tends to have a negative impact on the overall quality of local democ-
racy. The evidence that system capacity is negatively related to the size of municipalities
further supports this finding. It appears that smaller municipalities are unable to fulfill
their potential to provide incentives for local participation, without which we cannot
consider these countries to have effective local democracies.
171
Municipality Size and Citizens’ Effectiveness:
Hungary, Poland, and Romania
Daniel Pop
1. INTRODUCTION
As the title suggests, this chapter deals with the relationship between municipality size
and citizens’ effectiveness in influencing local matters in the case of three countries
(Hungary, Poland, and Romania). We consider the effective engagement of citizens to
be a dimension of the quality of local democracy, and when examining this issue we will
need to look at the level and types of citizen participation as well as the system’s capacity
to provide incentives for such participation. Depending on the relationship between the
size of municipalities and citizens’ effectiveness, we could gain a better understanding
of the implications of municipal structure for the quality of local democracy.
The starting point is Dahl’s claim that “participation in very large units becomes
minimal and in very small units it becomes trivial” (1971, 960). This suggests that, on
the one hand, the participation of citizens is inhibited within very large municipalities,
while on the other hand it is even less effective in very small ones. If this claim is valid
in the three countries under study, it would imply that citizens’ effectiveness varies
according to the population size of municipalities—low in very small municipalities
and improved in larger ones. Since very large municipalities in the three countries are
extremely low in number and are mainly capital cities, we will not attempt to evaluate
the level of participation in very large units.
Our analysis is comparative, being conducted in three countries, and the hypothesis
to be tested is of special relevance to the three countries for at least two reasons. First, it
relates to the ongoing debate on the relationship between citizens’ ability to influence
local matters and the quality of local democracy. Second, the average size of municipali-
ties in all three countries under study is small compared to other democratic countries
such as Great Britain and Ireland, where the average population of municipalities is
120,000 and 103,000, respectively (Larsen 2002, 317). By comparison, in Hungary the
average size of municipalities is 3,229 inhabitants, in Poland 15,561, and in Romania
8,044 (Soós and Tóka 2002, 413). According to Larsen’s comparative data, Poland would
172
F A C E S O F L O C A L D E M O C R A C Y
qualify as having medium-size municipalities on average, while those in Hungary and
Romania would be small.
To determine if the relationship between municipality size and citizens’ effective-
ness holds for the three countries under study, we will evaluate the relationship between
the direct effects that municipality size has on citizen effectiveness in influencing local
decision-making, and also investigate the system capacity of municipalities to create
incentives for citizens to participate.
Path analysis will be used to evaluate the relationships among the variables. The
main reason for this choice is that there are significant levels of multi-colinearity among
our variables. This technique is useful because in addition to addressing the possible
relationship between the size of municipalities and citizens’ effectiveness in influencing
local policy matters, it is also sensitive to the indirect effects of municipality size.
The paper is organized in seven sections. Following this brief introduction to the
topic of our study, we present a short review of the literature dealing with the relation-
ship between municipality size and the quality of local democracy. Next, the main data
sources used in the analysis are presented. The fourth section describes the variables,
and the fifth deals with the analysis of individual country cases. The last two sections
present a comparative analysis as well as the findings and conclusions.
2. RESEARCH ON THE SIZE OF POLITICAL UNITS
In the early literature on the size of political units summarized by Almond and Verba
(1963, 231–236), the authors found no consistent relationship between the size of
municipalities and “subjective political competence.”1 In reanalyzing their data, Finifter
(1970) also found no zero-order relationship between the size of municipalities and
political competence; however, the author concluded that there was a relationship once
the level of education was taken into consideration.
Other authors measured citizens’ influence on local politics through direct political
participation. Using a “communal activity” index, Verba and Nie (1972) found a strong
negative relationship between the size of municipalities and citizens’ influence. Their
investigations supported the proposition that the larger the community the more
complicated and impersonal it becomes, leading to a reduced level of participation. In
contrast, citizens in small communities can see the results of their participation more
quickly, and this serves as an incentive for more involvement. Dahl (1971) estimated
that the ideal size of political units was between 50,000 and 100,000 inhabitants.
The start of modern research on the relationship between the size and the viability of
democratic polities was marked by Dahl and Tufte’s study entitled Size and Democracy,
published in 1973. In this book, the authors drew attention to the fact that democratic
theory had not evolved with historical reality and had thus become outdated. Their
173
M U N I C I P A L I T Y S I Z E A N D C I T I Z E N S ' E F F E C T I V E N E S S
solution was to update democratic theory by including the “neglected problem of politi-
cal units and their inter-relationship” (1973, 139). They came to the conclusion that it
was impossible to determine one optimal size for political units. As a result, they sug-
gested a mixture of small and large units, claiming that citizens could participate more
easily in the former, but the latter improved the effectiveness of citizen participation.
Nevertheless, the authors recognized that the problem of ineffectiveness in small units
and that of alienation in large ones might persist.
Besides the problem of diminishing avenues for political participation, Le Roy found
evidence that civil society organizations themselves could be perceived as agents of the
state (1995, 314). In the author’s view, this could lead to alienation or a “crisis of confi-
dence and trust that characterizes much of the West.” By contrast, in his research focusing
on the importance of proximity and capacity to influence local politics, Larsen considers
that even if citizens’ participation is higher in small municipalities, this does not imply
greater interest or knowledge or more positive views on local democracy (2002, 330).
These findings indicate that the absolute extent of citizen participation in itself is not
sufficient to account for the nature of local democracy. Lastly, the complex nature of
the relationship between municipality size and the performance of local democracy is
evident in the work of Keating (1995, 117), who directs our attention to the influence
of specific local factors.
3. DATA SOURCES
The main data used in this study were generated by the Local Government and Public
Service Reform Initiative (LGI) and the Tocqueville Research Center (T–RC) within the
Indicators of Local Democratic Governance Project (ILDGP). The first phase of the project
took place in 2001, when the Tocqueville Research Center conducted a four-country
survey, known as the Local Government Survey (LGS). The survey consisted of face-to-
face interviews with chief administrative officials from Hungary, Latvia, Poland, and
Romania.
Within the framework of the same project, the LGI published a volume entitled
State of Local Democracy in Central Europe, comprising the reports on local democracy
for the four countries mentioned above (Soós and Tóka 2002). This volume provided
the main source of data for our country case studies.
4. VARIABLES
The main variables for the three countries under analysis are introduced and described
below. They include: the size of municipality, citizens’ participation, citizens’ effective-
ness in influencing local matters, and system responsiveness.
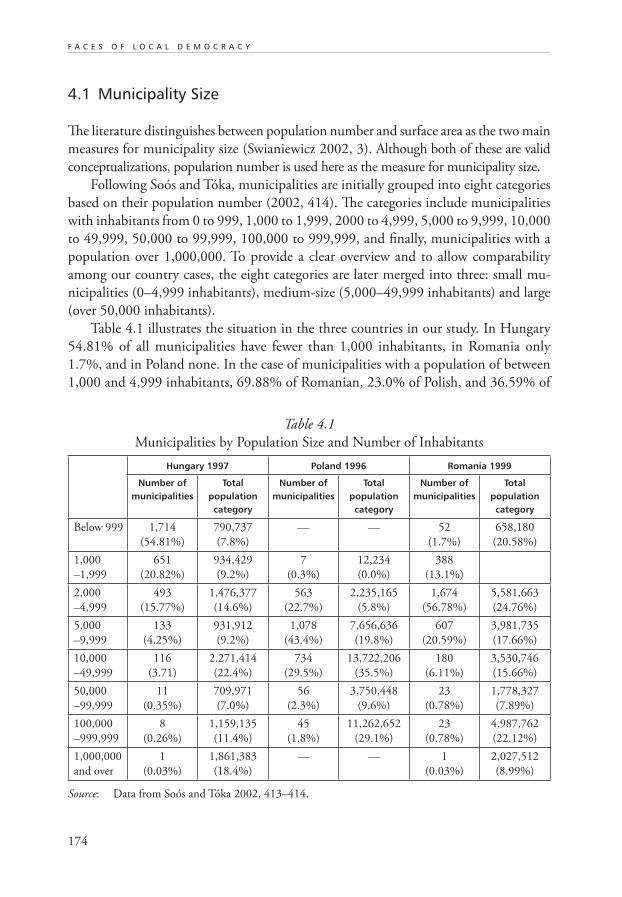
174
F A C E S O F L O C A L D E M O C R A C Y
4.1 Municipality Size
The literature distinguishes between population number and surface area as the two main
measures for municipality size (Swianiewicz 2002, 3). Although both of these are valid
conceptualizations, population number is used here as the measure for municipality size.
Following Soós and Tóka, municipalities are initially grouped into eight categories
based on their population number (2002, 414). The categories include municipalities
with inhabitants from 0 to 999, 1,000 to 1,999, 2000 to 4,999, 5,000 to 9,999, 10,000
to 49,999, 50,000 to 99,999, 100,000 to 999,999, and finally, municipalities with a
population over 1,000,000. To provide a clear overview and to allow comparability
among our country cases, the eight categories are later merged into three: small mu-
nicipalities (0–4,999 inhabitants), medium-size (5,000–49,999 inhabitants) and large
(over 50,000 inhabitants).
Table 4.1 illustrates the situation in the three countries in our study. In Hungary
54.81% of all municipalities have fewer than 1,000 inhabitants, in Romania only
1.7%, and in Poland none. In the case of municipalities with a population of between
1,000 and 4,999 inhabitants, 69.88% of Romanian, 23.0% of Polish, and 36.59% of
Table 4.1
Municipalities by Population Size and Number of Inhabitants
Hungary 1997 Poland 1996 Romania 1999
Number of municipalities
Total population category
Number of municipalities
Total population category
Number of municipalities
Total population category
Below 999 1,714
(54.81%)
790,737
(7.8%)
— — 52
(1.7%)
658,180
(20.58%)
1,000
–1,999
651
(20.82%)
934,429
(9.2%)
7
(0.3%)
12,234
(0.0%)
388
(13.1%)
2,000
–4,999
493
(15.77%)
1,476,377
(14.6%)
563
(22.7%)
2,235,165
(5.8%)
1,674
(56.78%)
5,581,663
(24.76%)
5,000
–9,999
133
(4.25%)
931,912
(9.2%)
1,078
(43.4%)
7,656,636
(19.8%)
607
(20.59%)
3,981,735
(17.66%)
10,000
–49,999
116
(3.71)
2.271,414
(22.4%)
734
(29.5%)
13,722,206
(35.5%)
180
(6.11%)
3,530,746
(15.66%)
50,000
–99,999
11
(0.35%)
709,971
(7.0%)
56
(2.3%)
3,750,448
(9.6%)
23
(0.78%)
1,778,327
(7.89%)
100,000
–999,999
8
(0.26%)
1,159,135
(11.4%)
45
(1.8%)
11,262,652
(29.1%)
23
(0.78%)
4,987,762
(22.12%)
1,000,000
and over
1
(0.03%)
1,861,383
(18.4%)
— — 1
(0.03%)
2,027,512
(8.99%)
Source: Data from Soós and Tóka 2002, 413–414.
175
M U N I C I P A L I T Y S I Z E A N D C I T I Z E N S ' E F F E C T I V E N E S S
Hungarian municipalities fall into this category. This shows that, while over 90% of
Hungarian and 71.58% of Romanian municipalities have below 5,000 inhabitants, in
Poland only 23% of the municipalities belong to this group. On the other hand, 72.9%
of Polish municipalities have between 5,000 and 49,999 inhabitants, while for Romania
the share is 26.7% and for Hungary it is only 7.96%. In all three countries the share
of municipalities with a population above 50,000 inhabitants is very small (0.64% for
Hungary, 4.1% for Poland, and 1.59% for Romania).
Although the number of very large municipalities (over 50,000) is small in all three
countries, their population still amounts to a significant share of the total population. In
Hungary, they account for almost 37% of the overall population of the country. In Poland
and Romania, 36.6% and 39% of the population respectively lives in large municipalities.
4.2 Citizen Participation
A direct measure of citizen participation is used in several analyses specific to the study
of the relationship between municipality size and participation. Authors seeking to
capture the elusive concept of citizen participation employ many different measures
including simple indicators such as voter turnout, and complex scales comprising a
variety of different direct and indirect forms of political participation.
The LGS collected data on five different forms of political participation (see table
4.2), including:
• attendance at public demonstrations concerning local matters
• collection of citizens’ signatures for petitions on various issues related to local
politics
• direct meetings between local officials and citizens or groups of citizens on local
political matters
• challenges to local government decisions in a court of law or at a higher admin-
istrative authority
• proposal writing or written requests by civil society organizations on any public
interest question.
The above table presents citizen participation rates for the different types of political
participation in the three countries under study as reported by chief administrative offic-
ers (CAOs). From their responses we learn that the preferred forms of activity by citizens
vary among the countries. In Hungary, civil society proposal writing and formulating
written requests are the most preferred forms of citizen participation. The same is true
for Poland, but the share of municipalities in which such action was undertaken is 15%
higher than in Hungary. In Romania, civil society proposal writing holds second place
at 14.5%, lower than in Hungary and Poland.
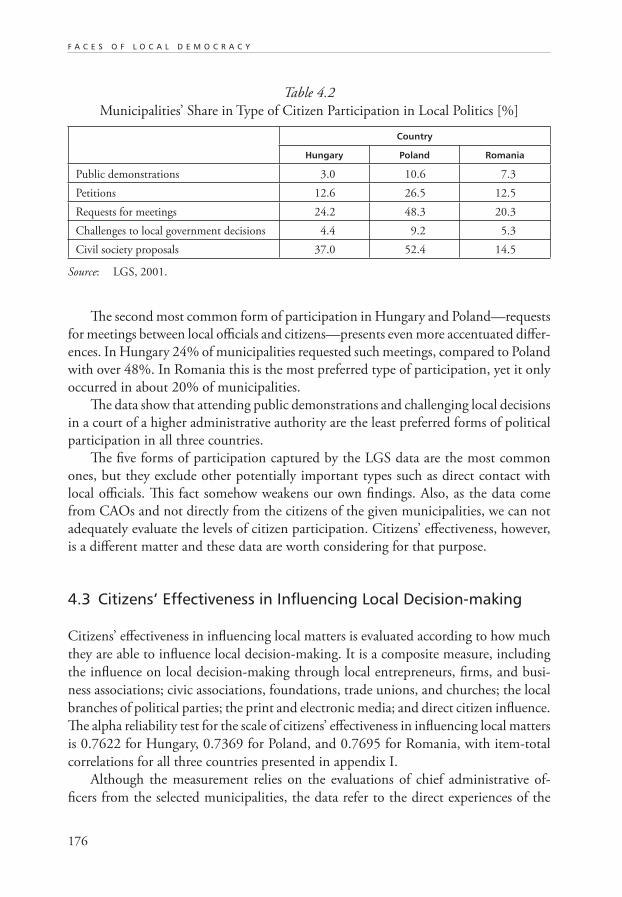
176
F A C E S O F L O C A L D E M O C R A C Y
The second most common form of participation in Hungary and Poland—requests
for meetings between local officials and citizens—presents even more accentuated differ-
ences. In Hungary 24% of municipalities requested such meetings, compared to Poland
with over 48%. In Romania this is the most preferred type of participation, yet it only
occurred in about 20% of municipalities.
The data show that attending public demonstrations and challenging local decisions
in a court of a higher administrative authority are the least preferred forms of political
participation in all three countries.
The five forms of participation captured by the LGS data are the most common
ones, but they exclude other potentially important types such as direct contact with
local officials. This fact somehow weakens our own findings. Also, as the data come
from CAOs and not directly from the citizens of the given municipalities, we can not
adequately evaluate the levels of citizen participation. Citizens’ effectiveness, however,
is a different matter and these data are worth considering for that purpose.
4.3 Citizens’ Effectiveness in Influencing Local Decision-making
Citizens’ effectiveness in influencing local matters is evaluated according to how much
they are able to influence local decision-making. It is a composite measure, including
the influence on local decision-making through local entrepreneurs, firms, and busi-
ness associations; civic associations, foundations, trade unions, and churches; the local
branches of political parties; the print and electronic media; and direct citizen influence.
The alpha reliability test for the scale of citizens’ effectiveness in influencing local matters
is 0.7622 for Hungary, 0.7369 for Poland, and 0.7695 for Romania, with item-total
correlations for all three countries presented in appendix I.
Although the measurement relies on the evaluations of chief administrative of-
ficers from the selected municipalities, the data refer to the direct experiences of the
Table 4.2
Municipalities’ Share in Type of Citizen Participation in Local Politics [%]
Country
Hungary Poland Romania
Public demonstrations 3.0 10.6 7.3
Petitions 12.6 26.5 12.5
Requests for meetings 24.2 48.3 20.3
Challenges to local government decisions 4.4 9.2 5.3
Civil society proposals 37.0 52.4 14.5
Source: LGS, 2001.
177
M U N I C I P A L I T Y S I Z E A N D C I T I Z E N S ' E F F E C T I V E N E S S
respondents (as in the case of citizens’ participation). Therefore, they are substantively
more reliable than in the case of CAOs reporting on citizens’ participation levels. Given
the data constraints, however, we also include institutional variables that influence the
structure of incentives to undertake political participation, i.e., the system’s capacity
to respond.
4.4 System Capacity to Respond
The capacity of the system to respond to citizens’ requests and to provide incentives for
participation is measured by “expenditure rigidity.” The legal status of municipalities
determines the responsibilities they are assigned to perform and therefore sets their level
of autonomy in decisions on local matters. Expenditure rigidity is the percentage of
own revenues in the total budget of the municipalities as reported by the local officials.
Own revenues are those incomes of municipalities over which they have the authority
to define both the pool and the amount of the payable taxes, fees or duties. Thus, all
the revenues that are collected at the national level and redistributed to municipalities
are excluded from this category. A reason for deciding to define own revenues in this
way is that the shared tax systems in these countries are largely biased by the earmarked
character of the transfers of the municipality revenue shares.
Similarly, national transfers are largely normative and earmarked. Although they
influence the income situation of municipalities, they do not contribute to an increase
in their fiscal independence. Instead, in adopting a strongly redistributive system in each
country, the intent was to guarantee the minimum provision of basic public services
in all municipalities.
Although legally there is no hierarchy among municipalities based on their size, and
in theory all municipalities perform similar functions, there is still a certain differentiation
based on the peculiarities of different municipalities and their level of fiscal independ-
ence. For instance, in Hungary and Romania there are municipalities with county
rights, which perform the functions of the County Council within their jurisdiction.
The difference between the two countries lies in the fact that, while in Hungary local
governments have the opportunity to decide which noncompulsory responsibilities to
assume, the Romanian local governments do not have this choice.
Another important distinction among municipalities is their urban or rural char-
acter. In the Romanian system, rural municipalities have only limited sources of own
revenues compared to urban municipalities. This is due to the fact that a large share
of the population in rural municipalities is active in various occupations related to
agriculture. Under the current shared taxation system, a certain percentage of all in-
come taxes collected in their jurisdictions is redistributed to local governments. This
amounted to 35% in 2000 and 36.5% in 2001. But since agricultural income is not
178
F A C E S O F L O C A L D E M O C R A C Y
taxable, the amounts collected by rural municipalities as a share of local income are
rather small. Various central government and county council equalization transfers are
meant to compensate for this lack of funds. Nevertheless, these often come in the form
of earmarked transfers, which determine both the scope of funds and the amount spent
on specific budget lines.
An important consequence of this is to reduce the policy space available for mu-
nicipalities and the ability of citizens to influence decisions; thus, we can theorize that
the higher the expenditure rigidity of municipalities, the less effective citizens are in
influencing local matters. On the other hand, from the findings of the research it seems
that the relationship between municipality size and revenue rigidity is substantial or
very strong for each country.
5. COUNTRY CASES
This section identifies the relationship between the population size of municipalities
and the level of citizens’ effectiveness in influencing policymaking for each of the three
countries. In each case, the scores on citizens’ effectiveness, participation and the level
of expenditure rigidity for each municipality size will be discussed.
5.1 Hungary
In the case of Hungary the correlation coefficient between municipality size (log) and
citizens’ effectiveness in influencing local matters is 0.355 and it is significant at the
0.01 level (see figure 4.1). This indicates a moderately strong direct relationship between
municipality size and citizens’ effectiveness in influencing local matters. The correlation
and significance results are reported below.
As expected from the findings of the earlier literature, the low score of R square
indicates that municipality size is not the best predictor of citizens’ effectiveness in in-
fluencing local matters. Although municipality size is not a strong predictor (it explains
only 12% of the total variation in citizens’ effectiveness), the low significance level implies
that R square can not be attributed to sampling error. In this sense, the findings agree
with the general findings of the earlier literature.
Table 4.3 shows that citizens’ effectiveness in influencing local matters varies with
the size of municipality in Hungary. According to the findings, only 15.1% of those
interviewed consider that citizens have a slightly, fairly, or very big influence on local
decision-making. By contrast, 67.1% of respondents believe that citizens’ effectiveness
in influencing local decision-making is very, fairly, or slightly small. This seems to sug-
gest that citizens’ ability to influence local decision-making is generally very limited in
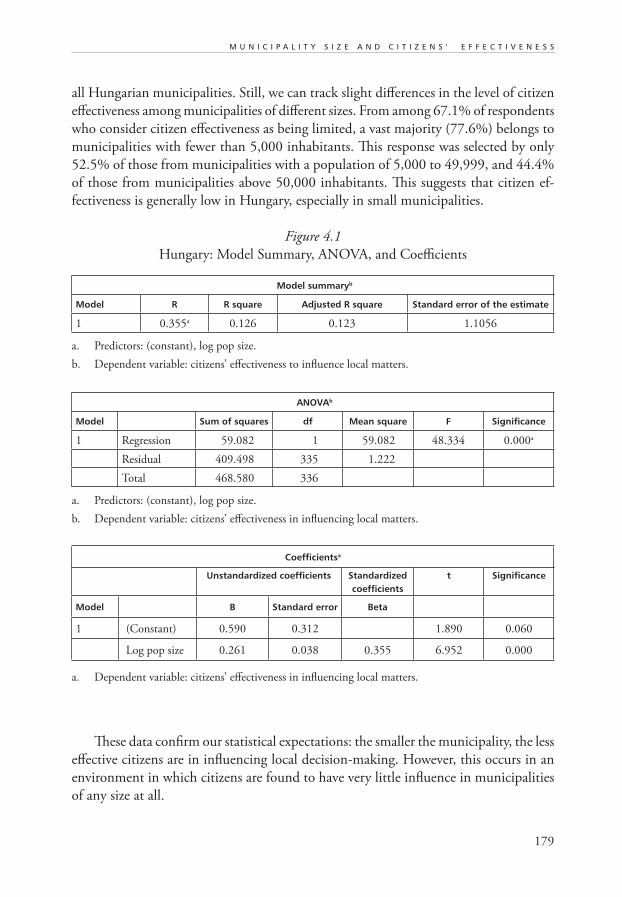
179
M U N I C I P A L I T Y S I Z E A N D C I T I Z E N S ' E F F E C T I V E N E S S
all Hungarian municipalities. Still, we can track slight differences in the level of citizen
effectiveness among municipalities of different sizes. From among 67.1% of respondents
who consider citizen effectiveness as being limited, a vast majority (77.6%) belongs to
municipalities with fewer than 5,000 inhabitants. This response was selected by only
52.5% of those from municipalities with a population of 5,000 to 49,999, and 44.4%
of those from municipalities above 50,000 inhabitants. This suggests that citizen ef-
fectiveness is generally low in Hungary, especially in small municipalities.
Figure 4.1
Hungary: Model Summary, ANOVA, and Coefficients
Model summaryb
Model R R square Adjusted R square Standard error of the estimate
1 0.355a 0.126 0.123 1.1056
a. Predictors: (constant), log pop size.
b. Dependent variable: citizens’ effectiveness to influence local matters.
ANOVAb
Model Sum of squares df Mean square F Significance
1 Regression 59.082 1 59.082 48.334 0.000a
Residual 409.498 335 1.222
Total 468.580 336
a. Predictors: (constant), log pop size.
b. Dependent variable: citizens’ effectiveness in influencing local matters.
Coefficientsa
Unstandardized coefficients Standardized coefficients
t Significance
Model B Standard error Beta
1 (Constant) 0.590 0.312 1.890 0.060
Log pop size 0.261 0.038 0.355 6.952 0.000
a. Dependent variable: citizens’ effectiveness in influencing local matters.
These data confirm our statistical expectations: the smaller the municipality, the less
effective citizens are in influencing local decision-making. However, this occurs in an
environment in which citizens are found to have very little influence in municipalities
of any size at all.
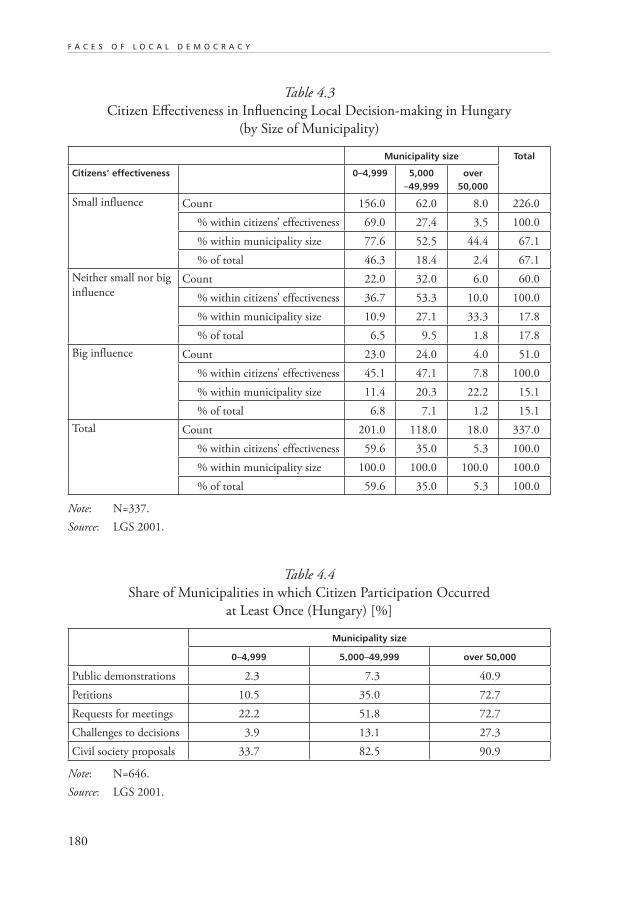
180
F A C E S O F L O C A L D E M O C R A C Y
Table 4.3
Citizen Effectiveness in Influencing Local Decision-making in Hungary
(by Size of Municipality)
Municipality size Total
Citizens’ effectiveness 0–4,999 5,000 –49,999
over 50,000
Small influence Count 156.0 62.0 8.0 226.0
% within citizens’ effectiveness 69.0 27.4 3.5 100.0
% within municipality size 77.6 52.5 44.4 67.1
% of total 46.3 18.4 2.4 67.1
Neither small nor big
influenceCount 22.0 32.0 6.0 60.0
% within citizens’ effectiveness 36.7 53.3 10.0 100.0
% within municipality size 10.9 27.1 33.3 17.8
% of total 6.5 9.5 1.8 17.8
Big influence Count 23.0 24.0 4.0 51.0
% within citizens’ effectiveness 45.1 47.1 7.8 100.0
% within municipality size 11.4 20.3 22.2 15.1
% of total 6.8 7.1 1.2 15.1
Total Count 201.0 118.0 18.0 337.0
% within citizens’ effectiveness 59.6 35.0 5.3 100.0
% within municipality size 100.0 100.0 100.0 100.0
% of total 59.6 35.0 5.3 100.0
Note: N=337.
Source: LGS 2001.
Table 4.4
Share of Municipalities in which Citizen Participation Occurred
at Least Once (Hungary) [%]
Municipality size
0–4,999 5,000–49,999 over 50,000
Public demonstrations 2.3 7.3 40.9
Petitions 10.5 35.0 72.7
Requests for meetings 22.2 51.8 72.7
Challenges to decisions 3.9 13.1 27.3
Civil society proposals 33.7 82.5 90.9
Note: N=646.
Source: LGS 2001.
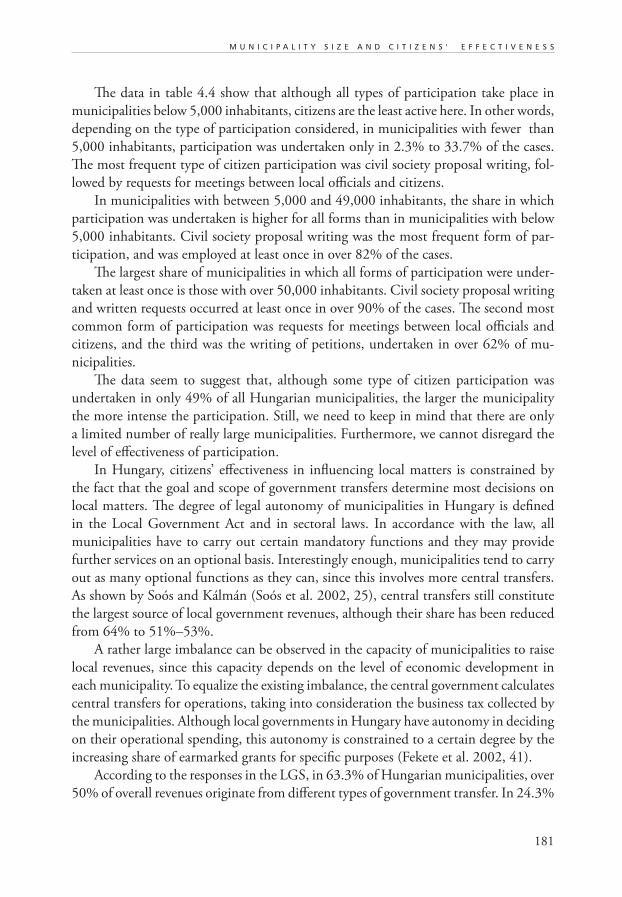
181
M U N I C I P A L I T Y S I Z E A N D C I T I Z E N S ' E F F E C T I V E N E S S
The data in table 4.4 show that although all types of participation take place in
municipalities below 5,000 inhabitants, citizens are the least active here. In other words,
depending on the type of participation considered, in municipalities with fewer than
5,000 inhabitants, participation was undertaken only in 2.3% to 33.7% of the cases.
The most frequent type of citizen participation was civil society proposal writing, fol-
lowed by requests for meetings between local officials and citizens.
In municipalities with between 5,000 and 49,000 inhabitants, the share in which
participation was undertaken is higher for all forms than in municipalities with below
5,000 inhabitants. Civil society proposal writing was the most frequent form of par-
ticipation, and was employed at least once in over 82% of the cases.
The largest share of municipalities in which all forms of participation were under-
taken at least once is those with over 50,000 inhabitants. Civil society proposal writing
and written requests occurred at least once in over 90% of the cases. The second most
common form of participation was requests for meetings between local officials and
citizens, and the third was the writing of petitions, undertaken in over 62% of mu-
nicipalities.
The data seem to suggest that, although some type of citizen participation was
undertaken in only 49% of all Hungarian municipalities, the larger the municipality
the more intense the participation. Still, we need to keep in mind that there are only
a limited number of really large municipalities. Furthermore, we cannot disregard the
level of effectiveness of participation.
In Hungary, citizens’ effectiveness in influencing local matters is constrained by
the fact that the goal and scope of government transfers determine most decisions on
local matters. The degree of legal autonomy of municipalities in Hungary is defined
in the Local Government Act and in sectoral laws. In accordance with the law, all
municipalities have to carry out certain mandatory functions and they may provide
further services on an optional basis. Interestingly enough, municipalities tend to carry
out as many optional functions as they can, since this involves more central transfers.
As shown by Soós and Kálmán (Soós et al. 2002, 25), central transfers still constitute
the largest source of local government revenues, although their share has been reduced
from 64% to 51%–53%.
A rather large imbalance can be observed in the capacity of municipalities to raise
local revenues, since this capacity depends on the level of economic development in
each municipality. To equalize the existing imbalance, the central government calculates
central transfers for operations, taking into consideration the business tax collected by
the municipalities. Although local governments in Hungary have autonomy in deciding
on their operational spending, this autonomy is constrained to a certain degree by the
increasing share of earmarked grants for specific purposes (Fekete et al. 2002, 41).
According to the responses in the LGS, in 63.3% of Hungarian municipalities, over
50% of overall revenues originate from different types of government transfer. In 24.3%
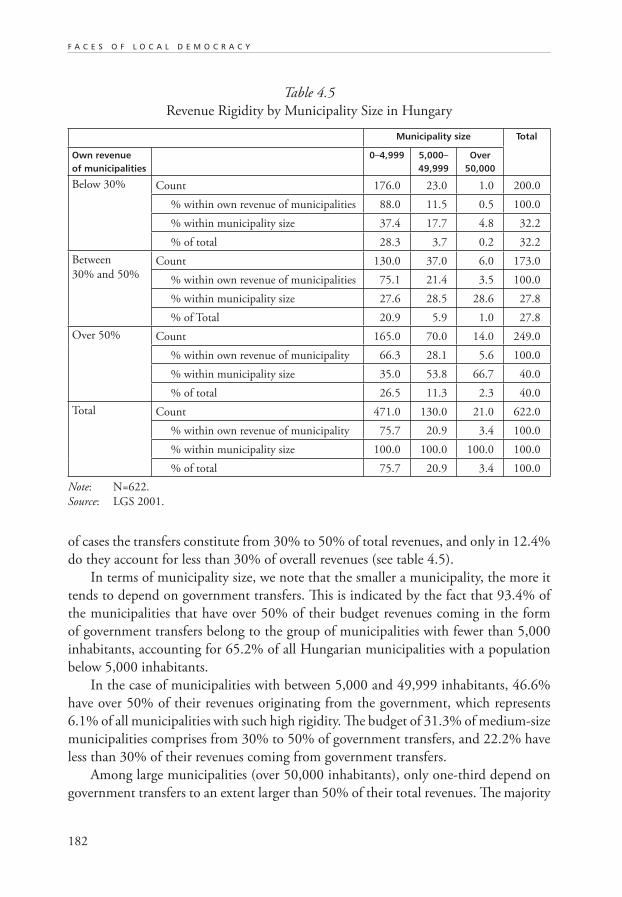
182
F A C E S O F L O C A L D E M O C R A C Y
of cases the transfers constitute from 30% to 50% of total revenues, and only in 12.4%
do they account for less than 30% of overall revenues (see table 4.5).
In terms of municipality size, we note that the smaller a municipality, the more it
tends to depend on government transfers. This is indicated by the fact that 93.4% of
the municipalities that have over 50% of their budget revenues coming in the form
of government transfers belong to the group of municipalities with fewer than 5,000
inhabitants, accounting for 65.2% of all Hungarian municipalities with a population
below 5,000 inhabitants.
In the case of municipalities with between 5,000 and 49,999 inhabitants, 46.6%
have over 50% of their revenues originating from the government, which represents
6.1% of all municipalities with such high rigidity. The budget of 31.3% of medium-size
municipalities comprises from 30% to 50% of government transfers, and 22.2% have
less than 30% of their revenues coming from government transfers.
Among large municipalities (over 50,000 inhabitants), only one-third depend on
government transfers to an extent larger than 50% of their total revenues. The majority
Table 4.5
Revenue Rigidity by Municipality Size in Hungary
Municipality size Total
Own revenue of municipalities
0–4,999 5,000– 49,999
Over 50,000
Below 30% Count 176.0 23.0 1.0 200.0
% within own revenue of municipalities 88.0 11.5 0.5 100.0
% within municipality size 37.4 17.7 4.8 32.2
% of total 28.3 3.7 0.2 32.2
Between
30% and 50%Count 130.0 37.0 6.0 173.0
% within own revenue of municipalities 75.1 21.4 3.5 100.0
% within municipality size 27.6 28.5 28.6 27.8
% of Total 20.9 5.9 1.0 27.8
Over 50% Count 165.0 70.0 14.0 249.0
% within own revenue of municipality 66.3 28.1 5.6 100.0
% within municipality size 35.0 53.8 66.7 40.0
% of total 26.5 11.3 2.3 40.0
Total Count 471.0 130.0 21.0 622.0
% within own revenue of municipality 75.7 20.9 3.4 100.0
% within municipality size 100.0 100.0 100.0 100.0
% of total 75.7 20.9 3.4 100.0
Note: N=622.
Source: LGS 2001.
183
M U N I C I P A L I T Y S I Z E A N D C I T I Z E N S ' E F F E C T I V E N E S S
of these municipalities (51.5%) rely on government transfers to a smaller degree, central
transfers constituting between 30% and 50% of their total revenues. Only 15.2% of large
municipalities have less than 30% of their revenues collected from government transfers.
As expected, the data show that the smaller a municipality in population size the
more rigid its revenues tend to be. However, this happens in the context of a system in
which transfers are significant in municipalities of all sizes.
5.2 Poland
The correlation coefficient between municipality size and citizens’ effectiveness is weaker
in Poland (0.26 and significant at the 0.01 level) than in Hungary. Although this level
of relationship indicates only a moderately direct relationship between municipality
size and citizens’ effectiveness in influencing local matters, it is positive and cannot be
attributed to sampling error.
Figure 4.2
Poland: Model Summary, ANOVA, and Coefficients
Model summaryb
Model R R square Adjusted R square Standard error of the estimate
1 0.260a 0.067 0.066 1.0926
a. Predictors: (constant), log population size.
b. Dependent variable: citizens’ effectiveness to influence local matters.
ANOVAb
Model Sum of squares df Mean square F Significance
1 Regression 47.147 1 47.147 39.494 0.000a
Residual 651.803 546 1.194
Total 698.950 547
a. Predictors: (constant), log population size.
b. Dependent variable: citizens’ effectiveness in influencing local matters.
Coefficientsa
Unstandardized coefficients Standardized coefficients
t Significance
Model B Standard error Beta
1 (Constant) 0.533 0.423 1.260 0.208
Log pop size 0.277 0.044 0.260 6.284 0.000
a. Dependent variable: citizens’ effectiveness in influencing local matters.
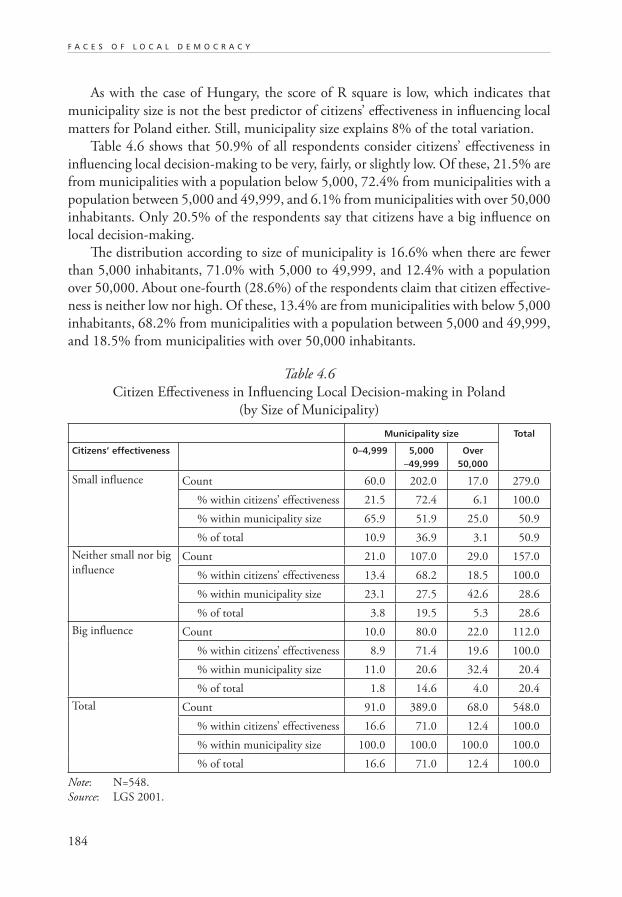
184
F A C E S O F L O C A L D E M O C R A C Y
As with the case of Hungary, the score of R square is low, which indicates that
municipality size is not the best predictor of citizens’ effectiveness in influencing local
matters for Poland either. Still, municipality size explains 8% of the total variation.
Table 4.6 shows that 50.9% of all respondents consider citizens’ effectiveness in
influencing local decision-making to be very, fairly, or slightly low. Of these, 21.5% are
from municipalities with a population below 5,000, 72.4% from municipalities with a
population between 5,000 and 49,999, and 6.1% from municipalities with over 50,000
inhabitants. Only 20.5% of the respondents say that citizens have a big influence on
local decision-making.
The distribution according to size of municipality is 16.6% when there are fewer
than 5,000 inhabitants, 71.0% with 5,000 to 49,999, and 12.4% with a population
over 50,000. About one-fourth (28.6%) of the respondents claim that citizen effective-
ness is neither low nor high. Of these, 13.4% are from municipalities with below 5,000
inhabitants, 68.2% from municipalities with a population between 5,000 and 49,999,
and 18.5% from municipalities with over 50,000 inhabitants.
Table 4.6
Citizen Effectiveness in Influencing Local Decision-making in Poland
(by Size of Municipality)
Municipality size Total
Citizens’ effectiveness 0–4,999 5,000 –49,999
Over 50,000
Small influence Count 60.0 202.0 17.0 279.0
% within citizens’ effectiveness 21.5 72.4 6.1 100.0
% within municipality size 65.9 51.9 25.0 50.9
% of total 10.9 36.9 3.1 50.9
Neither small nor big
influenceCount 21.0 107.0 29.0 157.0
% within citizens’ effectiveness 13.4 68.2 18.5 100.0
% within municipality size 23.1 27.5 42.6 28.6
% of total 3.8 19.5 5.3 28.6
Big influence Count 10.0 80.0 22.0 112.0
% within citizens’ effectiveness 8.9 71.4 19.6 100.0
% within municipality size 11.0 20.6 32.4 20.4
% of total 1.8 14.6 4.0 20.4
Total Count 91.0 389.0 68.0 548.0
% within citizens’ effectiveness 16.6 71.0 12.4 100.0
% within municipality size 100.0 100.0 100.0 100.0
% of total 16.6 71.0 12.4 100.0
Note: N=548.
Source: LGS 2001.
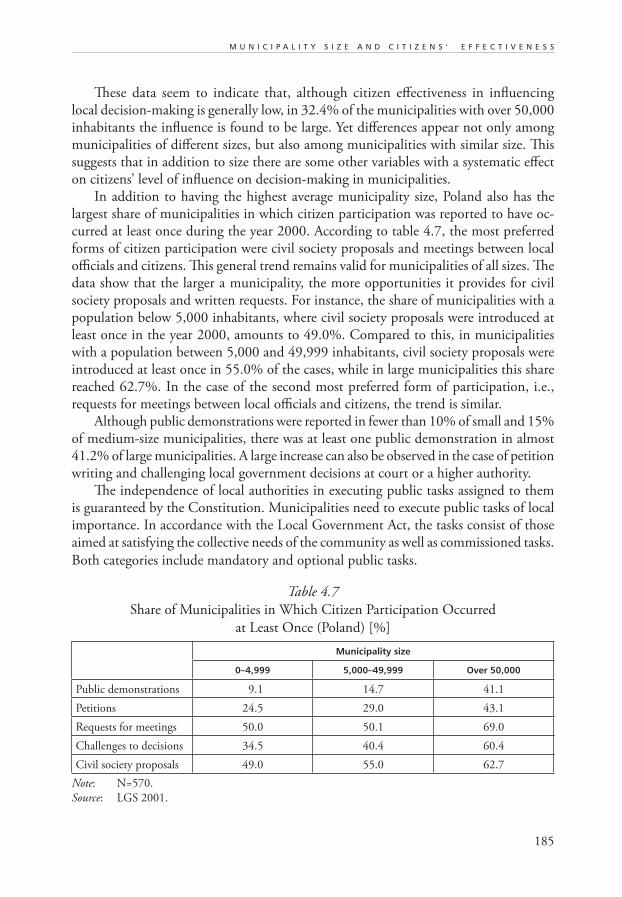
185
M U N I C I P A L I T Y S I Z E A N D C I T I Z E N S ' E F F E C T I V E N E S S
These data seem to indicate that, although citizen effectiveness in influencing
local decision-making is generally low, in 32.4% of the municipalities with over 50,000
inhabitants the influence is found to be large. Yet differences appear not only among
municipalities of different sizes, but also among municipalities with similar size. This
suggests that in addition to size there are some other variables with a systematic effect
on citizens’ level of influence on decision-making in municipalities.
In addition to having the highest average municipality size, Poland also has the
largest share of municipalities in which citizen participation was reported to have oc-
curred at least once during the year 2000. According to table 4.7, the most preferred
forms of citizen participation were civil society proposals and meetings between local
officials and citizens. This general trend remains valid for municipalities of all sizes. The
data show that the larger a municipality, the more opportunities it provides for civil
society proposals and written requests. For instance, the share of municipalities with a
population below 5,000 inhabitants, where civil society proposals were introduced at
least once in the year 2000, amounts to 49.0%. Compared to this, in municipalities
with a population between 5,000 and 49,999 inhabitants, civil society proposals were
introduced at least once in 55.0% of the cases, while in large municipalities this share
reached 62.7%. In the case of the second most preferred form of participation, i.e.,
requests for meetings between local officials and citizens, the trend is similar.
Although public demonstrations were reported in fewer than 10% of small and 15%
of medium-size municipalities, there was at least one public demonstration in almost
41.2% of large municipalities. A large increase can also be observed in the case of petition
writing and challenging local government decisions at court or a higher authority.
The independence of local authorities in executing public tasks assigned to them
is guaranteed by the Constitution. Municipalities need to execute public tasks of local
importance. In accordance with the Local Government Act, the tasks consist of those
aimed at satisfying the collective needs of the community as well as commissioned tasks.
Both categories include mandatory and optional public tasks.
Table 4.7
Share of Municipalities in Which Citizen Participation Occurred
at Least Once (Poland) [%]
Municipality size
0–4,999 5,000–49,999 Over 50,000
Public demonstrations 9.1 14.7 41.1
Petitions 24.5 29.0 43.1
Requests for meetings 50.0 50.1 69.0
Challenges to decisions 34.5 40.4 60.4
Civil society proposals 49.0 55.0 62.7
Note: N=570.
Source: LGS 2001.
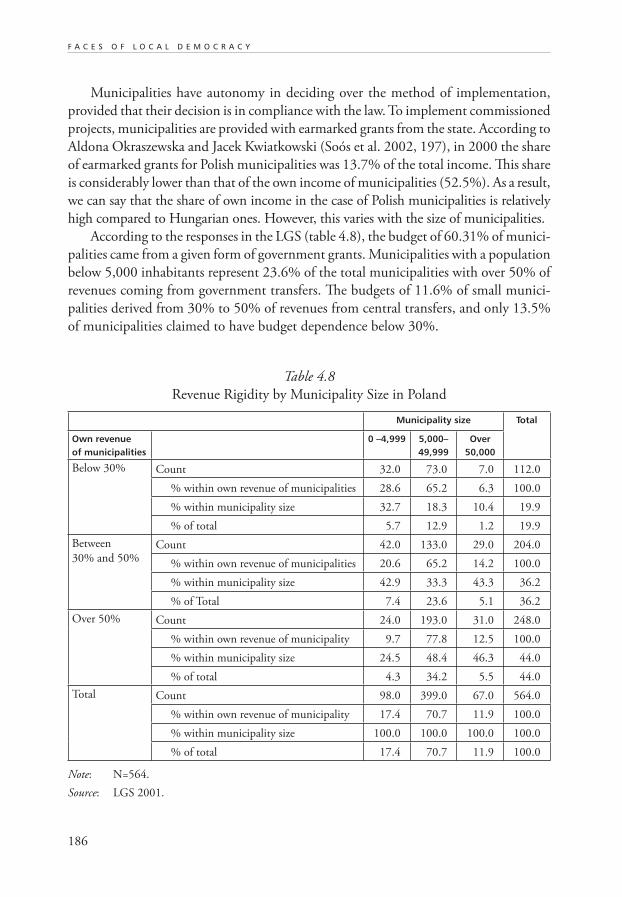
186
F A C E S O F L O C A L D E M O C R A C Y
Municipalities have autonomy in deciding over the method of implementation,
provided that their decision is in compliance with the law. To implement commissioned
projects, municipalities are provided with earmarked grants from the state. According to
Aldona Okraszewska and Jacek Kwiatkowski (Soós et al. 2002, 197), in 2000 the share
of earmarked grants for Polish municipalities was 13.7% of the total income. This share
is considerably lower than that of the own income of municipalities (52.5%). As a result,
we can say that the share of own income in the case of Polish municipalities is relatively
high compared to Hungarian ones. However, this varies with the size of municipalities.
According to the responses in the LGS (table 4.8), the budget of 60.31% of munici-
palities came from a given form of government grants. Municipalities with a population
below 5,000 inhabitants represent 23.6% of the total municipalities with over 50% of
revenues coming from government transfers. The budgets of 11.6% of small munici-
palities derived from 30% to 50% of revenues from central transfers, and only 13.5%
of municipalities claimed to have budget dependence below 30%.
Table 4.8
Revenue Rigidity by Municipality Size in Poland
Municipality size Total
Own revenue of municipalities
0 –4,999 5,000– 49,999
Over 50,000
Below 30% Count 32.0 73.0 7.0 112.0
% within own revenue of municipalities 28.6 65.2 6.3 100.0
% within municipality size 32.7 18.3 10.4 19.9
% of total 5.7 12.9 1.2 19.9
Between
30% and 50%Count 42.0 133.0 29.0 204.0
% within own revenue of municipalities 20.6 65.2 14.2 100.0
% within municipality size 42.9 33.3 43.3 36.2
% of Total 7.4 23.6 5.1 36.2
Over 50% Count 24.0 193.0 31.0 248.0
% within own revenue of municipality 9.7 77.8 12.5 100.0
% within municipality size 24.5 48.4 46.3 44.0
% of total 4.3 34.2 5.5 44.0
Total Count 98.0 399.0 67.0 564.0
% within own revenue of municipality 17.4 70.7 11.9 100.0
% within municipality size 100.0 100.0 100.0 100.0
% of total 17.4 70.7 11.9 100.0
Note: N=564.
Source: LGS 2001.
187
M U N I C I P A L I T Y S I Z E A N D C I T I Z E N S ' E F F E C T I V E N E S S
In the case of municipalities with a population of between 5,000 and 49,999 in-
habitants, 55.8% reported their dependence on government transfers to be over 50%,
which represents 72.9% of all municipalities with such high dependence. A dependence
rate between 30% and 50% was reported by 23.2% of municipalities with a popula-
tion between 5,000 and 49,999 inhabitants, which accounts for 82.3% of all sizes of
municipalities with this dependence rate.
Large municipalities (above 50,000 inhabitants) also show considerable dependence,
as 53.5% of these municipalities reported that more than 50% of their budgets came
from government transfers. Of the large municipalities 25.6% have between 30% and
50% of their budget originating from government transfers, and 20.9% have less than
30% from transfers.
Based on the above, we can conclude that in the case of Poland municipality size
does have an effect on the level of citizens’ effectiveness in influencing local matters. But
the direct relationship is very weak and is attributable to a large extent to the specific
features of local policy resulting from the economies of scale that local administrative
units confront. Concerning revenue rigidity, the data show no strong relationship be-
tween municipality size and rigidity level.
5.3 Romania
The Romanian data show a correlation between municipality size and citizens’ effective-
ness of .285 and this is also significant at the 0.01 level. This indicates a moderately strong,
direct relationship between municipality size and citizens’ effectiveness in influencing
local matters. The correlation and significance results are reported below.
In the case of Romania, too, the low score of R square indicates that municipality
size is not a strong predictor, and just as in the case of Poland, it explains only about
8% of the total variation in citizens’ effectiveness in influencing local matters.
In Romania (see table 4.9) 67.1% of all respondents consider that citizens have
only very little, small or slightly small influence on local decision-making. Of these
respondents, 41.6% are from municipalities with a population below 5,000 inhabitants,
23.6% from municipalities with a population between 5,000 and 49,999, and 2.0%
from municipalities with a population over 50,000.
Only 14.2% of all respondents consider that citizens have a big influence over lo-
cal decision-making, of which only 4.4% come from municipalities with fewer than
5,000 inhabitants, 7.3% from municipalities with a population of 5,000 to 49,999,
and 2.4% from municipalities with over 50,000 inhabitants. As regards the “neither
small nor large influence” response, which constitutes 14.2% of the total, 4.4% fall in
the category of municipalities with fewer than 5,000 inhabitants, 7.3% in the 5,000 to
49,999 category, and 2.9% in the over 49,999 category.
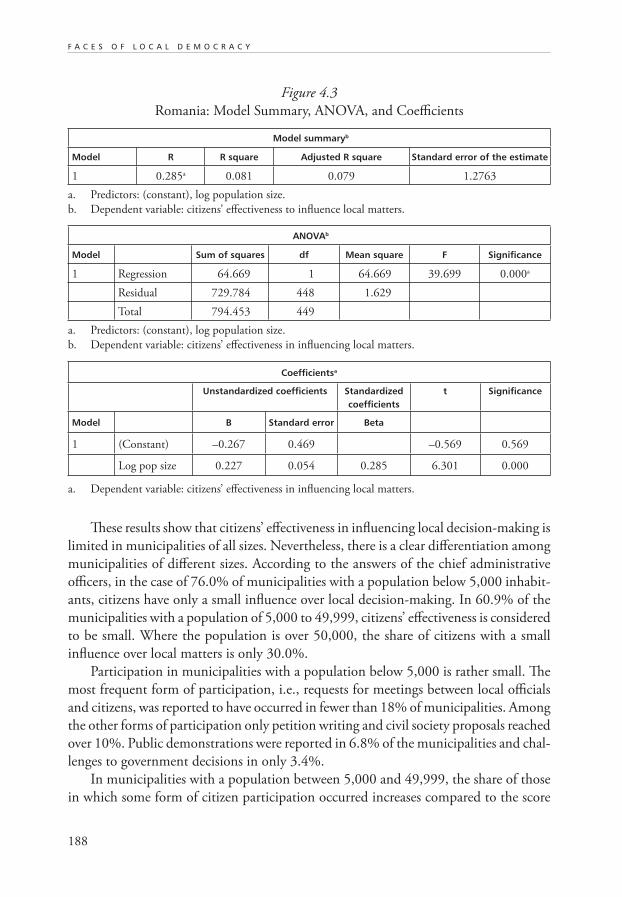
188
F A C E S O F L O C A L D E M O C R A C Y
Figure 4.3
Romania: Model Summary, ANOVA, and Coefficients
Model summaryb
Model R R square Adjusted R square Standard error of the estimate
1 0.285a 0.081 0.079 1.2763
a. Predictors: (constant), log population size.
b. Dependent variable: citizens’ effectiveness to influence local matters.
ANOVAb
Model Sum of squares df Mean square F Significance
1 Regression 64.669 1 64.669 39.699 0.000a
Residual 729.784 448 1.629
Total 794.453 449
a. Predictors: (constant), log population size.
b. Dependent variable: citizens’ effectiveness in influencing local matters.
Coefficientsa
Unstandardized coefficients Standardized coefficients
t Significance
Model B Standard error Beta
1 (Constant) –0.267 0.469 –0.569 0.569
Log pop size 0.227 0.054 0.285 6.301 0.000
a. Dependent variable: citizens’ effectiveness in influencing local matters.
These results show that citizens’ effectiveness in influencing local decision-making is
limited in municipalities of all sizes. Nevertheless, there is a clear differentiation among
municipalities of different sizes. According to the answers of the chief administrative
officers, in the case of 76.0% of municipalities with a population below 5,000 inhabit-
ants, citizens have only a small influence over local decision-making. In 60.9% of the
municipalities with a population of 5,000 to 49,999, citizens’ effectiveness is considered
to be small. Where the population is over 50,000, the share of citizens with a small
influence over local matters is only 30.0%.
Participation in municipalities with a population below 5,000 is rather small. The
most frequent form of participation, i.e., requests for meetings between local officials
and citizens, was reported to have occurred in fewer than 18% of municipalities. Among
the other forms of participation only petition writing and civil society proposals reached
over 10%. Public demonstrations were reported in 6.8% of the municipalities and chal-
lenges to government decisions in only 3.4%.
In municipalities with a population between 5,000 and 49,999, the share of those
in which some form of citizen participation occurred increases compared to the score
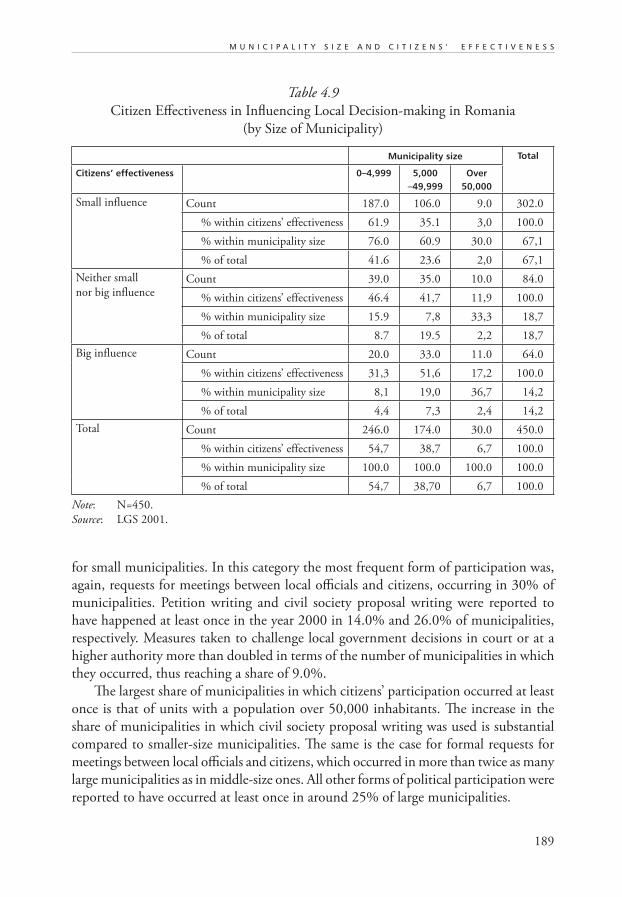
189
M U N I C I P A L I T Y S I Z E A N D C I T I Z E N S ' E F F E C T I V E N E S S
Table 4.9
Citizen Effectiveness in Influencing Local Decision-making in Romania
(by Size of Municipality)
Municipality size Total
Citizens’ effectiveness 0–4,999 5,000 –49,999
Over 50,000
Small influence Count 187.0 106.0 9.0 302.0
% within citizens’ effectiveness 61.9 35.1 3,0 100.0
% within municipality size 76.0 60.9 30.0 67,1
% of total 41.6 23.6 2,0 67,1
Neither small
nor big influenceCount 39.0 35.0 10.0 84.0
% within citizens’ effectiveness 46.4 41,7 11,9 100.0
% within municipality size 15.9 7,8 33,3 18,7
% of total 8.7 19.5 2,2 18,7
Big influence Count 20.0 33.0 11.0 64.0
% within citizens’ effectiveness 31,3 51,6 17,2 100.0
% within municipality size 8,1 19,0 36,7 14,2
% of total 4,4 7,3 2,4 14,2
Total Count 246.0 174.0 30.0 450.0
% within citizens’ effectiveness 54,7 38,7 6,7 100.0
% within municipality size 100.0 100.0 100.0 100.0
% of total 54,7 38,70 6,7 100.0
Note: N=450.
Source: LGS 2001.
for small municipalities. In this category the most frequent form of participation was,
again, requests for meetings between local officials and citizens, occurring in 30% of
municipalities. Petition writing and civil society proposal writing were reported to
have happened at least once in the year 2000 in 14.0% and 26.0% of municipalities,
respectively. Measures taken to challenge local government decisions in court or at a
higher authority more than doubled in terms of the number of municipalities in which
they occurred, thus reaching a share of 9.0%.
The largest share of municipalities in which citizens’ participation occurred at least
once is that of units with a population over 50,000 inhabitants. The increase in the
share of municipalities in which civil society proposal writing was used is substantial
compared to smaller-size municipalities. The same is the case for formal requests for
meetings between local officials and citizens, which occurred in more than twice as many
large municipalities as in middle-size ones. All other forms of political participation were
reported to have occurred at least once in around 25% of large municipalities.
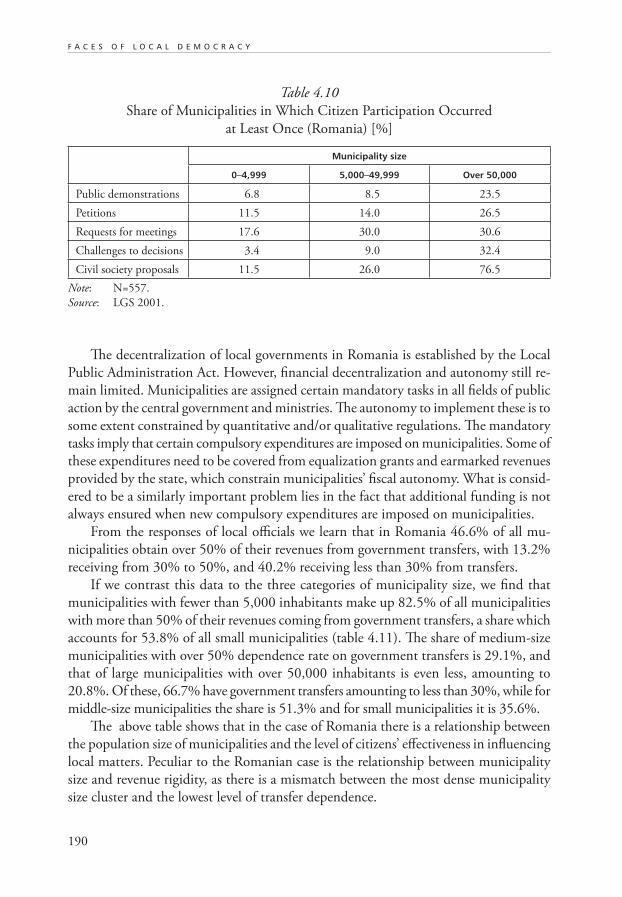
190
F A C E S O F L O C A L D E M O C R A C Y
The decentralization of local governments in Romania is established by the Local
Public Administration Act. However, financial decentralization and autonomy still re-
main limited. Municipalities are assigned certain mandatory tasks in all fields of public
action by the central government and ministries. The autonomy to implement these is to
some extent constrained by quantitative and/or qualitative regulations. The mandatory
tasks imply that certain compulsory expenditures are imposed on municipalities. Some of
these expenditures need to be covered from equalization grants and earmarked revenues
provided by the state, which constrain municipalities’ fiscal autonomy. What is consid-
ered to be a similarly important problem lies in the fact that additional funding is not
always ensured when new compulsory expenditures are imposed on municipalities.
From the responses of local officials we learn that in Romania 46.6% of all mu-
nicipalities obtain over 50% of their revenues from government transfers, with 13.2%
receiving from 30% to 50%, and 40.2% receiving less than 30% from transfers.
If we contrast this data to the three categories of municipality size, we find that
municipalities with fewer than 5,000 inhabitants make up 82.5% of all municipalities
with more than 50% of their revenues coming from government transfers, a share which
accounts for 53.8% of all small municipalities (table 4.11). The share of medium-size
municipalities with over 50% dependence rate on government transfers is 29.1%, and
that of large municipalities with over 50,000 inhabitants is even less, amounting to
20.8%. Of these, 66.7% have government transfers amounting to less than 30%, while for
middle-size municipalities the share is 51.3% and for small municipalities it is 35.6%.
The above table shows that in the case of Romania there is a relationship between
the population size of municipalities and the level of citizens’ effectiveness in influencing
local matters. Peculiar to the Romanian case is the relationship between municipality
size and revenue rigidity, as there is a mismatch between the most dense municipality
size cluster and the lowest level of transfer dependence.
Table 4.10
Share of Municipalities in Which Citizen Participation Occurred
at Least Once (Romania) [%]
Municipality size
0–4,999 5,000–49,999 Over 50,000
Public demonstrations 6.8 8.5 23.5
Petitions 11.5 14.0 26.5
Requests for meetings 17.6 30.0 30.6
Challenges to decisions 3.4 9.0 32.4
Civil society proposals 11.5 26.0 76.5
Note: N=557.
Source: LGS 2001.
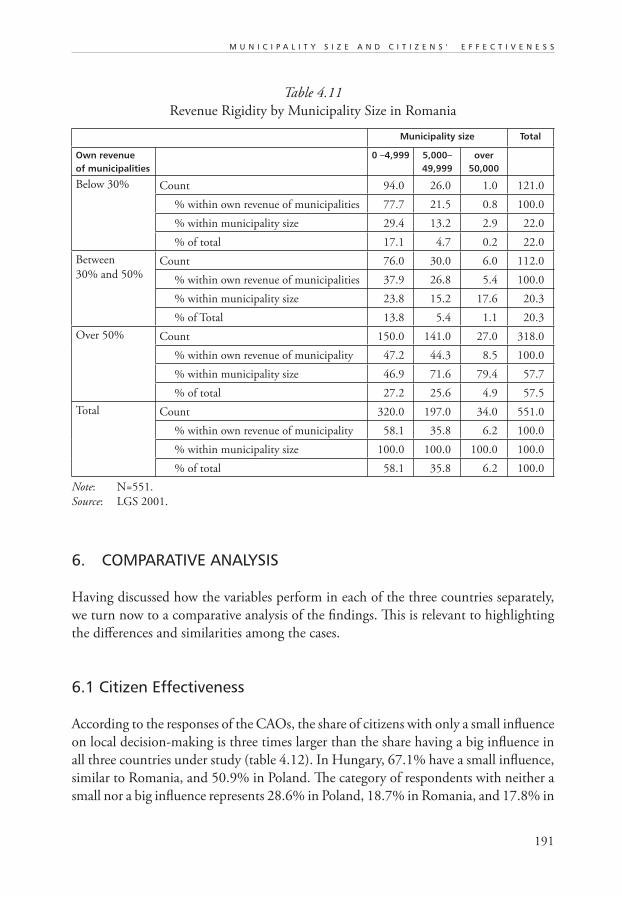
191
M U N I C I P A L I T Y S I Z E A N D C I T I Z E N S ' E F F E C T I V E N E S S
Table 4.11
Revenue Rigidity by Municipality Size in Romania
Municipality size Total
Own revenue of municipalities
0 –4,999 5,000– 49,999
over 50,000
Below 30% Count 94.0 26.0 1.0 121.0
% within own revenue of municipalities 77.7 21.5 0.8 100.0
% within municipality size 29.4 13.2 2.9 22.0
% of total 17.1 4.7 0.2 22.0
Between
30% and 50%Count 76.0 30.0 6.0 112.0
% within own revenue of municipalities 37.9 26.8 5.4 100.0
% within municipality size 23.8 15.2 17.6 20.3
% of Total 13.8 5.4 1.1 20.3
Over 50% Count 150.0 141.0 27.0 318.0
% within own revenue of municipality 47.2 44.3 8.5 100.0
% within municipality size 46.9 71.6 79.4 57.7
% of total 27.2 25.6 4.9 57.5
Total Count 320.0 197.0 34.0 551.0
% within own revenue of municipality 58.1 35.8 6.2 100.0
% within municipality size 100.0 100.0 100.0 100.0
% of total 58.1 35.8 6.2 100.0
Note: N=551.
Source: LGS 2001.
6. COMPARATIVE ANALYSIS
Having discussed how the variables perform in each of the three countries separately,
we turn now to a comparative analysis of the findings. This is relevant to highlighting
the differences and similarities among the cases.
6.1 Citizen Effectiveness
According to the responses of the CAOs, the share of citizens with only a small influence
on local decision-making is three times larger than the share having a big influence in
all three countries under study (table 4.12). In Hungary, 67.1% have a small influence,
similar to Romania, and 50.9% in Poland. The category of respondents with neither a
small nor a big influence represents 28.6% in Poland, 18.7% in Romania, and 17.8% in
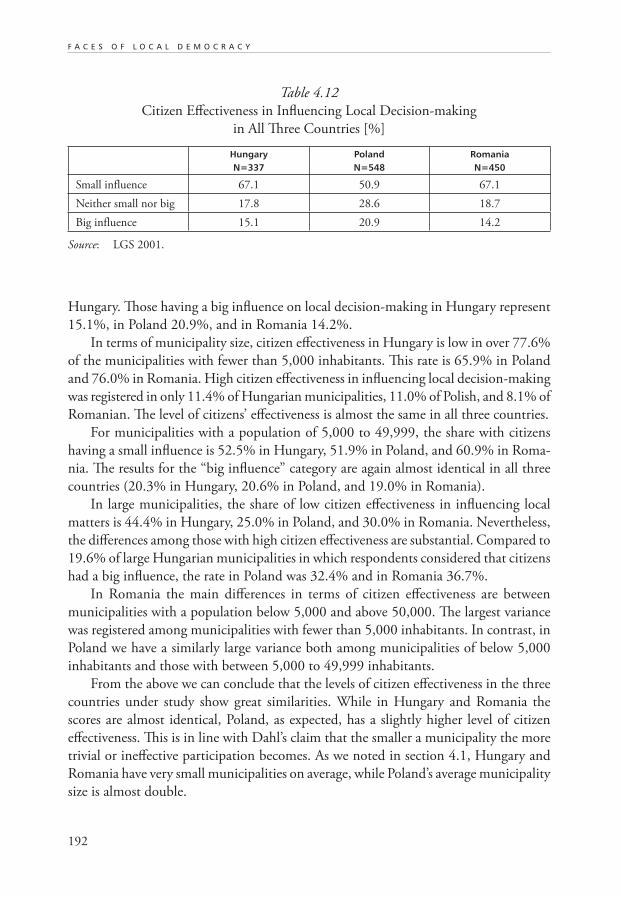
192
F A C E S O F L O C A L D E M O C R A C Y
Hungary. Those having a big influence on local decision-making in Hungary represent
15.1%, in Poland 20.9%, and in Romania 14.2%.
In terms of municipality size, citizen effectiveness in Hungary is low in over 77.6%
of the municipalities with fewer than 5,000 inhabitants. This rate is 65.9% in Poland
and 76.0% in Romania. High citizen effectiveness in influencing local decision-making
was registered in only 11.4% of Hungarian municipalities, 11.0% of Polish, and 8.1% of
Romanian. The level of citizens’ effectiveness is almost the same in all three countries.
For municipalities with a population of 5,000 to 49,999, the share with citizens
having a small influence is 52.5% in Hungary, 51.9% in Poland, and 60.9% in Roma-
nia. The results for the “big influence” category are again almost identical in all three
countries (20.3% in Hungary, 20.6% in Poland, and 19.0% in Romania).
In large municipalities, the share of low citizen effectiveness in influencing local
matters is 44.4% in Hungary, 25.0% in Poland, and 30.0% in Romania. Nevertheless,
the differences among those with high citizen effectiveness are substantial. Compared to
19.6% of large Hungarian municipalities in which respondents considered that citizens
had a big influence, the rate in Poland was 32.4% and in Romania 36.7%.
In Romania the main differences in terms of citizen effectiveness are between
municipalities with a population below 5,000 and above 50,000. The largest variance
was registered among municipalities with fewer than 5,000 inhabitants. In contrast, in
Poland we have a similarly large variance both among municipalities of below 5,000
inhabitants and those with between 5,000 to 49,999 inhabitants.
From the above we can conclude that the levels of citizen effectiveness in the three
countries under study show great similarities. While in Hungary and Romania the
scores are almost identical, Poland, as expected, has a slightly higher level of citizen
effectiveness. This is in line with Dahl’s claim that the smaller a municipality the more
trivial or ineffective participation becomes. As we noted in section 4.1, Hungary and
Romania have very small municipalities on average, while Poland’s average municipality
size is almost double.
Table 4.12
Citizen Effectiveness in Influencing Local Decision-making
in All Three Countries [%]
HungaryN=337
PolandN=548
RomaniaN=450
Small influence 67.1 50.9 67.1
Neither small nor big 17.8 28.6 18.7
Big influence 15.1 20.9 14.2
Source: LGS 2001.
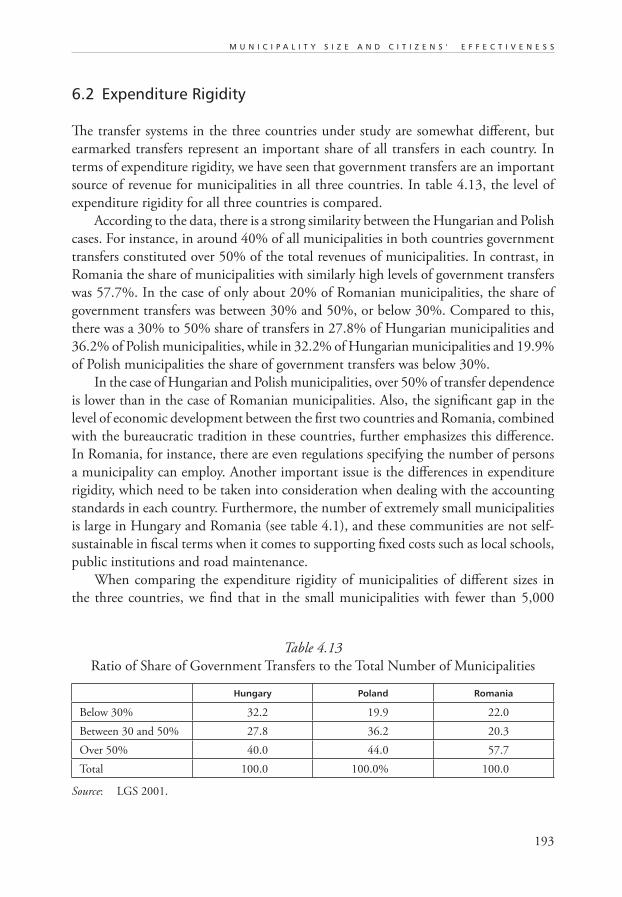
193
M U N I C I P A L I T Y S I Z E A N D C I T I Z E N S ' E F F E C T I V E N E S S
6.2 Expenditure Rigidity
The transfer systems in the three countries under study are somewhat different, but
earmarked transfers represent an important share of all transfers in each country. In
terms of expenditure rigidity, we have seen that government transfers are an important
source of revenue for municipalities in all three countries. In table 4.13, the level of
expenditure rigidity for all three countries is compared.
According to the data, there is a strong similarity between the Hungarian and Polish
cases. For instance, in around 40% of all municipalities in both countries government
transfers constituted over 50% of the total revenues of municipalities. In contrast, in
Romania the share of municipalities with similarly high levels of government transfers
was 57.7%. In the case of only about 20% of Romanian municipalities, the share of
government transfers was between 30% and 50%, or below 30%. Compared to this,
there was a 30% to 50% share of transfers in 27.8% of Hungarian municipalities and
36.2% of Polish municipalities, while in 32.2% of Hungarian municipalities and 19.9%
of Polish municipalities the share of government transfers was below 30%.
In the case of Hungarian and Polish municipalities, over 50% of transfer dependence
is lower than in the case of Romanian municipalities. Also, the significant gap in the
level of economic development between the first two countries and Romania, combined
with the bureaucratic tradition in these countries, further emphasizes this difference.
In Romania, for instance, there are even regulations specifying the number of persons
a municipality can employ. Another important issue is the differences in expenditure
rigidity, which need to be taken into consideration when dealing with the accounting
standards in each country. Furthermore, the number of extremely small municipalities
is large in Hungary and Romania (see table 4.1), and these communities are not self-
sustainable in fiscal terms when it comes to supporting fixed costs such as local schools,
public institutions and road maintenance.
When comparing the expenditure rigidity of municipalities of different sizes in
the three countries, we find that in the small municipalities with fewer than 5,000
Table 4.13
Ratio of Share of Government Transfers to the Total Number of Municipalities
Hungary Poland Romania
Below 30% 32.2 19.9 22.0
Between 30 and 50% 27.8 36.2 20.3
Over 50% 40.0 44.0 57.7
Total 100.0 100.0% 100.0
Source: LGS 2001.
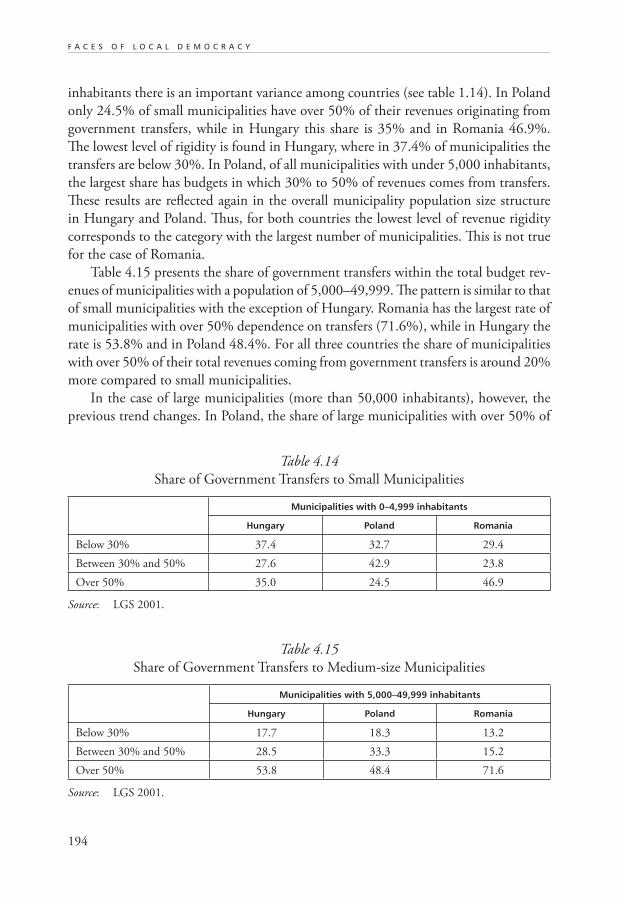
194
F A C E S O F L O C A L D E M O C R A C Y
inhabitants there is an important variance among countries (see table 1.14). In Poland
only 24.5% of small municipalities have over 50% of their revenues originating from
government transfers, while in Hungary this share is 35% and in Romania 46.9%.
The lowest level of rigidity is found in Hungary, where in 37.4% of municipalities the
transfers are below 30%. In Poland, of all municipalities with under 5,000 inhabitants,
the largest share has budgets in which 30% to 50% of revenues comes from transfers.
These results are reflected again in the overall municipality population size structure
in Hungary and Poland. Thus, for both countries the lowest level of revenue rigidity
corresponds to the category with the largest number of municipalities. This is not true
for the case of Romania.
Table 4.15 presents the share of government transfers within the total budget rev-
enues of municipalities with a population of 5,000–49,999. The pattern is similar to that
of small municipalities with the exception of Hungary. Romania has the largest rate of
municipalities with over 50% dependence on transfers (71.6%), while in Hungary the
rate is 53.8% and in Poland 48.4%. For all three countries the share of municipalities
with over 50% of their total revenues coming from government transfers is around 20%
more compared to small municipalities.
In the case of large municipalities (more than 50,000 inhabitants), however, the
previous trend changes. In Poland, the share of large municipalities with over 50% of
Table 4.14
Share of Government Transfers to Small Municipalities
Municipalities with 0–4,999 inhabitants
Hungary Poland Romania
Below 30% 37.4 32.7 29.4
Between 30% and 50% 27.6 42.9 23.8
Over 50% 35.0 24.5 46.9
Source: LGS 2001.
Table 4.15
Share of Government Transfers to Medium-size Municipalities
Municipalities with 5,000–49,999 inhabitants
Hungary Poland Romania
Below 30% 17.7 18.3 13.2
Between 30% and 50% 28.5 33.3 15.2
Over 50% 53.8 48.4 71.6
Source: LGS 2001.
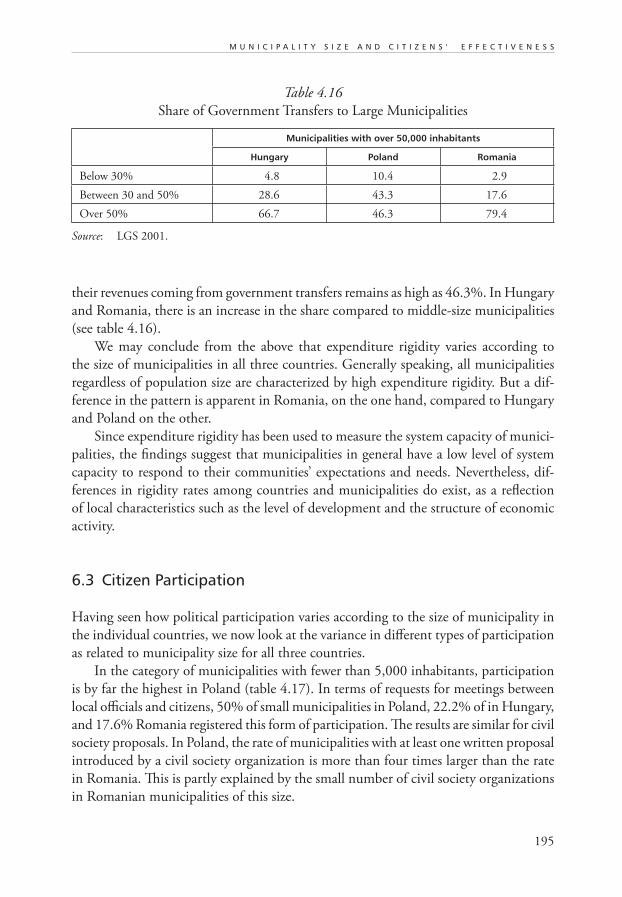
195
M U N I C I P A L I T Y S I Z E A N D C I T I Z E N S ' E F F E C T I V E N E S S
Table 4.16
Share of Government Transfers to Large Municipalities
Municipalities with over 50,000 inhabitants
Hungary Poland Romania
Below 30% 4.8 10.4 2.9
Between 30 and 50% 28.6 43.3 17.6
Over 50% 66.7 46.3 79.4
Source: LGS 2001.
their revenues coming from government transfers remains as high as 46.3%. In Hungary
and Romania, there is an increase in the share compared to middle-size municipalities
(see table 4.16).
We may conclude from the above that expenditure rigidity varies according to
the size of municipalities in all three countries. Generally speaking, all municipalities
regardless of population size are characterized by high expenditure rigidity. But a dif-
ference in the pattern is apparent in Romania, on the one hand, compared to Hungary
and Poland on the other.
Since expenditure rigidity has been used to measure the system capacity of munici-
palities, the findings suggest that municipalities in general have a low level of system
capacity to respond to their communities’ expectations and needs. Nevertheless, dif-
ferences in rigidity rates among countries and municipalities do exist, as a reflection
of local characteristics such as the level of development and the structure of economic
activity.
6.3 Citizen Participation
Having seen how political participation varies according to the size of municipality in
the individual countries, we now look at the variance in different types of participation
as related to municipality size for all three countries.
In the category of municipalities with fewer than 5,000 inhabitants, participation
is by far the highest in Poland (table 4.17). In terms of requests for meetings between
local officials and citizens, 50% of small municipalities in Poland, 22.2% of in Hungary,
and 17.6% Romania registered this form of participation. The results are similar for civil
society proposals. In Poland, the rate of municipalities with at least one written proposal
introduced by a civil society organization is more than four times larger than the rate
in Romania. This is partly explained by the small number of civil society organizations
in Romanian municipalities of this size.
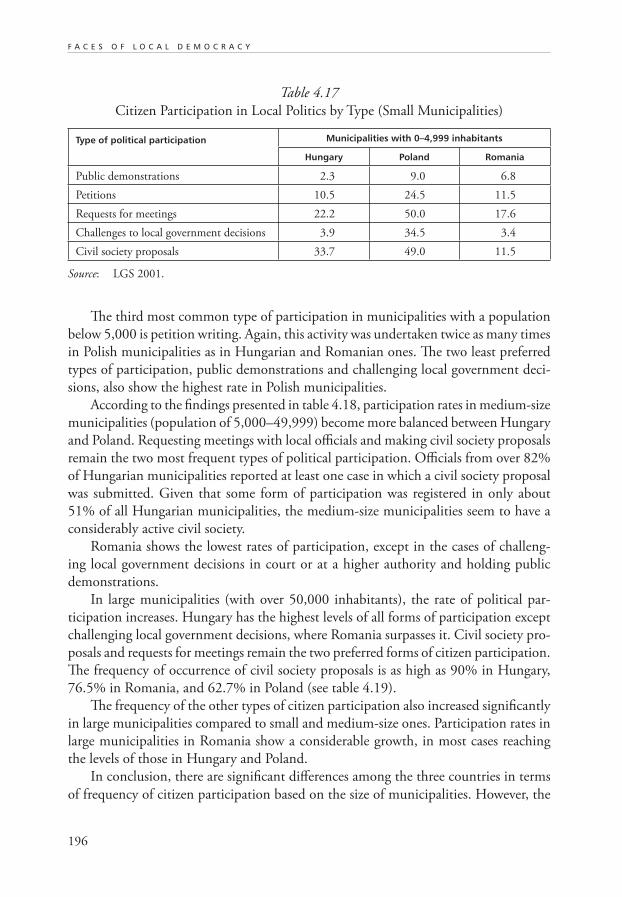
196
F A C E S O F L O C A L D E M O C R A C Y
The third most common type of participation in municipalities with a population
below 5,000 is petition writing. Again, this activity was undertaken twice as many times
in Polish municipalities as in Hungarian and Romanian ones. The two least preferred
types of participation, public demonstrations and challenging local government deci-
sions, also show the highest rate in Polish municipalities.
According to the findings presented in table 4.18, participation rates in medium-size
municipalities (population of 5,000–49,999) become more balanced between Hungary
and Poland. Requesting meetings with local officials and making civil society proposals
remain the two most frequent types of political participation. Officials from over 82%
of Hungarian municipalities reported at least one case in which a civil society proposal
was submitted. Given that some form of participation was registered in only about
51% of all Hungarian municipalities, the medium-size municipalities seem to have a
considerably active civil society.
Romania shows the lowest rates of participation, except in the cases of challeng-
ing local government decisions in court or at a higher authority and holding public
demonstrations.
In large municipalities (with over 50,000 inhabitants), the rate of political par-
ticipation increases. Hungary has the highest levels of all forms of participation except
challenging local government decisions, where Romania surpasses it. Civil society pro-
posals and requests for meetings remain the two preferred forms of citizen participation.
The frequency of occurrence of civil society proposals is as high as 90% in Hungary,
76.5% in Romania, and 62.7% in Poland (see table 4.19).
The frequency of the other types of citizen participation also increased significantly
in large municipalities compared to small and medium-size ones. Participation rates in
large municipalities in Romania show a considerable growth, in most cases reaching
the levels of those in Hungary and Poland.
In conclusion, there are significant differences among the three countries in terms
of frequency of citizen participation based on the size of municipalities. However, the
Table 4.17
Citizen Participation in Local Politics by Type (Small Municipalities)
Type of political participation Municipalities with 0–4,999 inhabitants
Hungary Poland Romania
Public demonstrations 2.3 9.0 6.8
Petitions 10.5 24.5 11.5
Requests for meetings 22.2 50.0 17.6
Challenges to local government decisions 3.9 34.5 3.4
Civil society proposals 33.7 49.0 11.5
Source: LGS 2001.
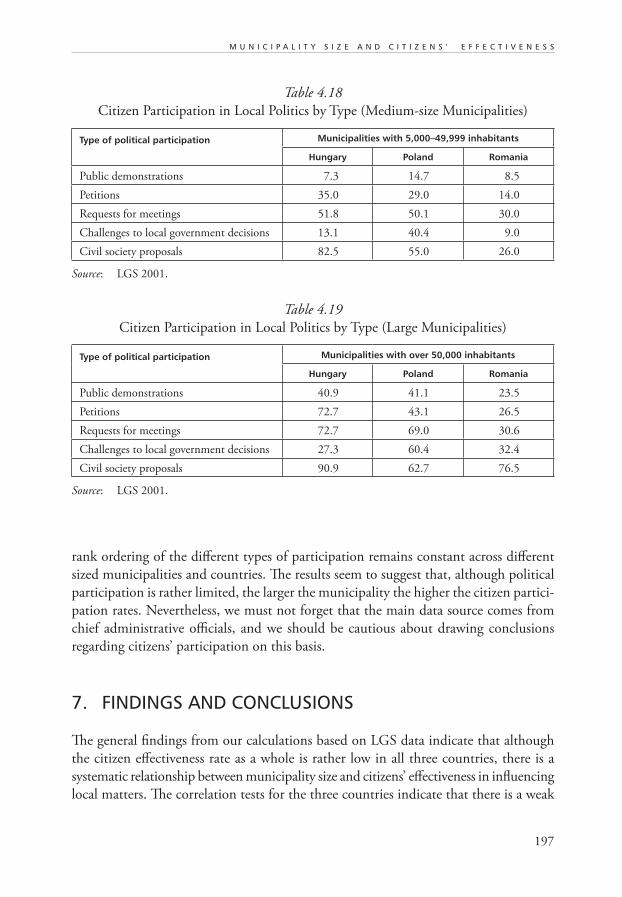
197
M U N I C I P A L I T Y S I Z E A N D C I T I Z E N S ' E F F E C T I V E N E S S
rank ordering of the different types of participation remains constant across different
sized municipalities and countries. The results seem to suggest that, although political
participation is rather limited, the larger the municipality the higher the citizen partici-
pation rates. Nevertheless, we must not forget that the main data source comes from
chief administrative officials, and we should be cautious about drawing conclusions
regarding citizens’ participation on this basis.
7. FINDINGS AND CONCLUSIONS
The general findings from our calculations based on LGS data indicate that although
the citizen effectiveness rate as a whole is rather low in all three countries, there is a
systematic relationship between municipality size and citizens’ effectiveness in influencing
local matters. The correlation tests for the three countries indicate that there is a weak
Table 4.18
Citizen Participation in Local Politics by Type (Medium-size Municipalities)
Type of political participation Municipalities with 5,000–49,999 inhabitants
Hungary Poland Romania
Public demonstrations 7.3 14.7 8.5
Petitions 35.0 29.0 14.0
Requests for meetings 51.8 50.1 30.0
Challenges to local government decisions 13.1 40.4 9.0
Civil society proposals 82.5 55.0 26.0
Source: LGS 2001.
Table 4.19
Citizen Participation in Local Politics by Type (Large Municipalities)
Type of political participation Municipalities with over 50,000 inhabitants
Hungary Poland Romania
Public demonstrations 40.9 41.1 23.5
Petitions 72.7 43.1 26.5
Requests for meetings 72.7 69.0 30.6
Challenges to local government decisions 27.3 60.4 32.4
Civil society proposals 90.9 62.7 76.5
Source: LGS 2001.
198
F A C E S O F L O C A L D E M O C R A C Y
but positive relation at a .01 significance level between municipality size and citizens’
effectiveness. Seen in this light, the municipality structure of the three countries in
terms of population does seem to have an impact on the quality of local democracy in
general.
The strongest relationship was found in Hungary, with a correlation coefficient
of 0.262, and the weakest in Poland, with a coefficient of 0.172. Romania stands in
between the two with a correlation coefficient of 0.182.
Although the correlation between municipality size and citizens’ effectiveness in
influencing local matters is weak and the explanatory power of the model is very limited,
the low significance level implies that r2 can not be attributed to sampling error. The
model explains only 12% in Hungary, 8% in Poland, and 8% in Romania of the total
variation in citizens’ effectiveness in influencing local matters. These findings subscribe
to the general findings of the earlier literature, i.e., that there is a weak but statistically
significant and positive correlation between citizens’ effectiveness in influencing lo-
cal matters and municipality size, once citizens decide to participate. This occurs in a
context in which the overall capacity of citizens to influence local matters is very low
in municipalities of all sizes and in all three countries.
More surprising is the very low participation level in local political matters as re-
ported by chief administrative officials. In absolute terms, occurrences of all five types of
participation included in the LGS are extremely limited. Interestingly enough, the two
countries with the largest differences in terms of municipality size structure, Hungary
and Poland, present the greatest similarities in terms of political participation rates. The
biggest variation was in expenditure rigidity, where—although a strong national trend
was found—no clear cross-country trend could be identified.
The state of local democracy in the three countries seems to be rather weak in
terms of system capacity to respond. A common finding for all three countries is that
municipalities are highly dependent on central government transfers, and therefore there
is not much incentive for citizens to participate. This also reduces the level of citizen
effectiveness. The general trend found for the three country cases is that the smaller
the municipality, the higher its expenditure rigidity. Larger municipalities are more
likely to have higher rates both of citizen participation and citizens’ effectiveness in
influencing local matters. As the hypothesis suggested, participation becomes minimal
only in very large units, and the three countries under study do not have many very
large units.
In conclusion, it seems that the influence of citizens over local matters is very
limited, because of the extremely low system capacity to respond to local needs and
concerns. If this is the case, the improvement of the quality of local democracy will
require enhancing the system’s capacity to respond to the requests of citizens. This in
turn might produce an environment in which citizens’ participation could be more
effective and consistent.
199
M U N I C I P A L I T Y S I Z E A N D C I T I Z E N S ' E F F E C T I V E N E S S
The success of such an effort also depends on the structure of the municipal system
in these countries. By reducing the share of extremely small municipalities, in which
the citizens’ effectiveness is the lowest, we would also improve the opportunity to have
a more vibrant and dynamic community life. Nevertheless, the implementation of any
reform to reduce the number of administrative units could prove difficult to achieve.
NOTE
1 “Subjective political competence” was the main measure used to evaluate residents’ perceptions about
their ability to influence local politics.
REFERENCESAlmond, G.A. and S. Verba. 1963. The Civic Culture: Political Attitude and Democracy
in Five Nations. Princeton, New Jersey: Princeton University Press.
Dahl, R.A. 1971. The city in the future of democracy. American Political Science Review
61: 953–70.
Dahl, R.A. and E.R.Tufte. 1973. Size and Democracy. Stanford: University Press.
Fekete, E.G. et al. 2002. Size of local governments, local democracy and local service
delivery in Hungary. In: P. Swianiewicz (ed.). Consolidation or Fragmentation—The
Size of Local Governments in Central and Eastern Europe. Budapest: Local Govern-
ment and Public Service Reform Initiative, Open Society Institute–Budapest.
Finifter, A.W. 1970. Dimensions of political alienation. American Political Science
Review 64: 389–410.
Held, D. 1996. Models of Democracy. Cambridge: Polity Press.
Keating, M. 1995. Size, efficiency and democracy: Consolidation, fragmentation and
public choice. In: D. Judge, G. Stoker, and H. Wolman (eds.). Theories of Urban
Politics. London: Sage.
Jamil, I. 1991. Size and Local Democracy in Norway. Bergen: LOS-Senteret.
Larsen, C.A. 2002. Municipal size and democracy: A critical analysis of the argument
of proximity based on the case of Denmark. Scandinavian Political Studies 25.
no. 4: 317–32.
Le Roy, M.K. 1995. Participation, size and democracy: Bridging the gap between citizens
and the Swedish state. Comparative Politics 27 (April): 297–316.
March, J.G. and J.P. Olsen. 1989. Rediscovering Institutions—The Organizational Bases
of Politics. New York: Free Press.
200
F A C E S O F L O C A L D E M O C R A C Y
Morlan, R.L. 1984. Municipal vs. national election voter turnout: Europe and the
United States. Political Science Quarterly 99 (autumn): 457–70.
Pettersen, P.A. and L.E. Rose. 1996. Participation in local politics in Norway: Some do,
some don’t; some will, some won’t. Political Behavior 18 (March), 51–97.
Schneider, M. 1989. The Competitive City: The Political Economy of Suburbia. Pittsburgh,
PA: University of Pittsburgh Press.
Soós, G. and G. Tóka. 2002. The State of Local Democracy in Central Europe. Budapest:
Local Government and Public Initiative Reform.
Verba S. and N.H. Nie. 1972. Participation in America. New York: Harper and Row.
Mouritzen, P.E. 1989. City size and citizens’ satisfaction: two competing theories revis-
ited. European Journal of Political Research. 17: 661–88.
Martins, M.R. 1995. Size of municipalities, efficiency, and citizen participation: A cross-
European Perspective. Environment and Planning C: Government and Policy.13(4):
379–532.
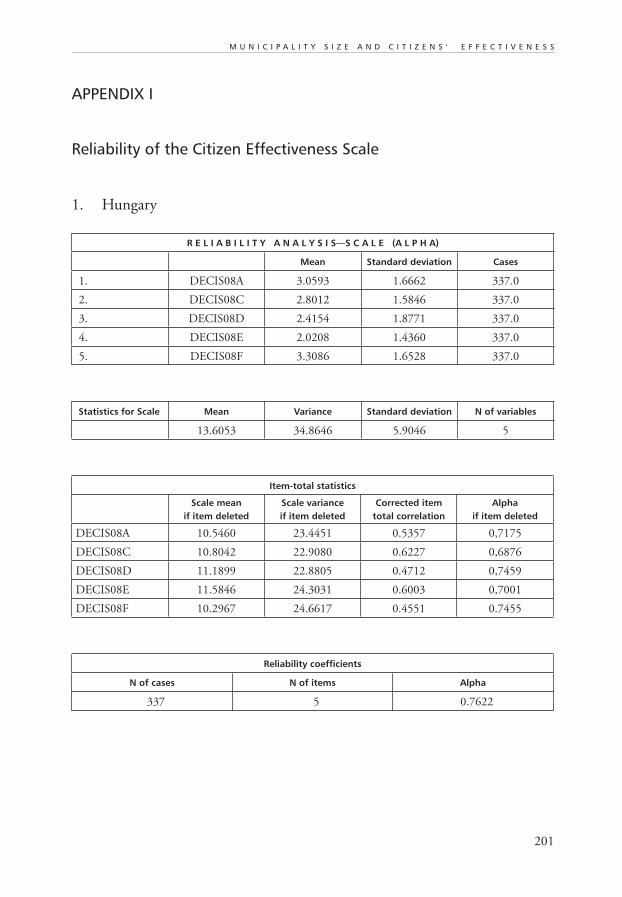
201
M U N I C I P A L I T Y S I Z E A N D C I T I Z E N S ' E F F E C T I V E N E S S
APPENDIX I
Reliability of the Citizen Effectiveness Scale
1. Hungary
R E L I A B I L I T Y A N A L Y S I S—S C A L E (A L P H A)
Mean Standard deviation Cases
1. DECIS08A 3.0593 1.6662 337.0
2. DECIS08C 2.8012 1.5846 337.0
3. DECIS08D 2.4154 1.8771 337.0
4. DECIS08E 2.0208 1.4360 337.0
5. DECIS08F 3.3086 1.6528 337.0
Statistics for Scale Mean Variance Standard deviation N of variables
13.6053 34.8646 5.9046 5
Item-total statistics
Scale mean if item deleted
Scale variance if item deleted
Corrected itemtotal correlation
Alpha if item deleted
DECIS08A 10.5460 23.4451 0.5357 0,7175
DECIS08C 10.8042 22.9080 0.6227 0,6876
DECIS08D 11.1899 22.8805 0.4712 0,7459
DECIS08E 11.5846 24.3031 0.6003 0,7001
DECIS08F 10.2967 24.6617 0.4551 0.7455
Reliability coefficients
N of cases N of items Alpha
337 5 0.7622
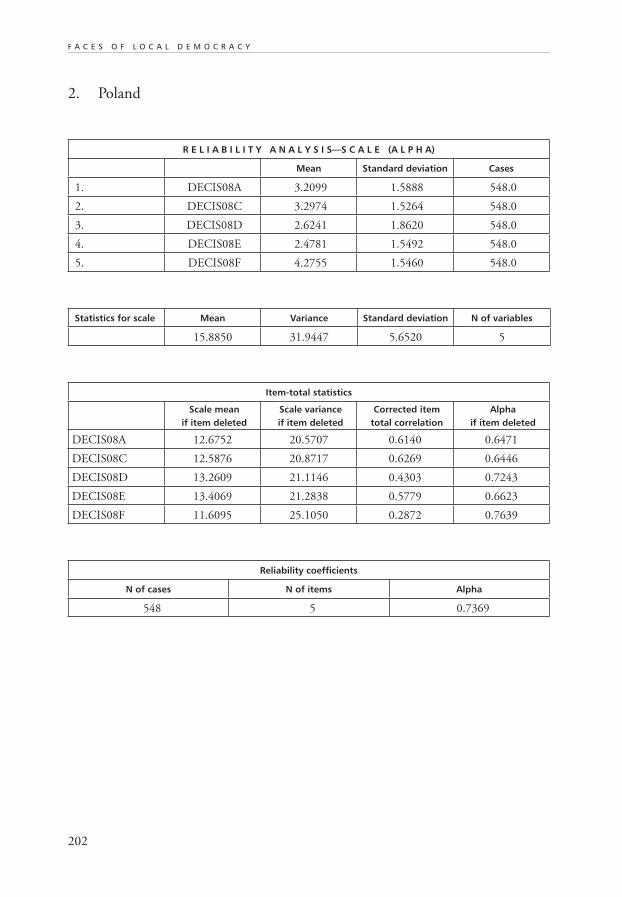
202
F A C E S O F L O C A L D E M O C R A C Y
2. Poland
R E L I A B I L I T Y A N A L Y S I S—S C A L E (A L P H A)
Mean Standard deviation Cases
1. DECIS08A 3.2099 1.5888 548.0
2. DECIS08C 3.2974 1.5264 548.0
3. DECIS08D 2.6241 1.8620 548.0
4. DECIS08E 2.4781 1.5492 548.0
5. DECIS08F 4.2755 1.5460 548.0
Statistics for scale Mean Variance Standard deviation N of variables
15.8850 31.9447 5.6520 5
Item-total statistics
Scale mean if item deleted
Scale variance if item deleted
Corrected itemtotal correlation
Alpha if item deleted
DECIS08A 12.6752 20.5707 0.6140 0.6471
DECIS08C 12.5876 20.8717 0.6269 0.6446
DECIS08D 13.2609 21.1146 0.4303 0.7243
DECIS08E 13.4069 21.2838 0.5779 0.6623
DECIS08F 11.6095 25.1050 0.2872 0.7639
Reliability coefficients
N of cases N of items Alpha
548 5 0.7369
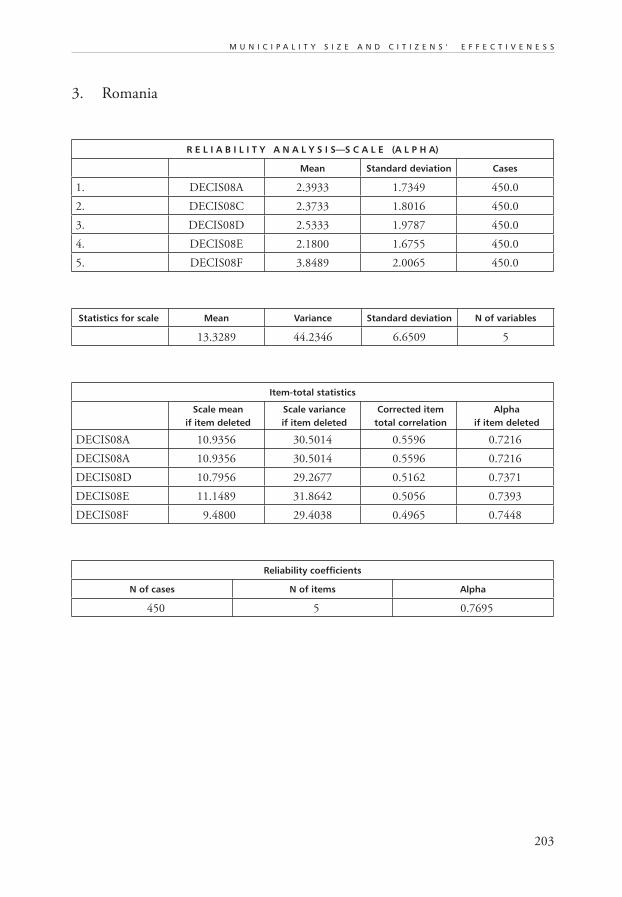
203
M U N I C I P A L I T Y S I Z E A N D C I T I Z E N S ' E F F E C T I V E N E S S
3. Romania
R E L I A B I L I T Y A N A L Y S I S—S C A L E (A L P H A)
Mean Standard deviation Cases
1. DECIS08A 2.3933 1.7349 450.0
2. DECIS08C 2.3733 1.8016 450.0
3. DECIS08D 2.5333 1.9787 450.0
4. DECIS08E 2.1800 1.6755 450.0
5. DECIS08F 3.8489 2.0065 450.0
Statistics for scale Mean Variance Standard deviation N of variables
13.3289 44.2346 6.6509 5
Item-total statistics
Scale mean if item deleted
Scale variance if item deleted
Corrected itemtotal correlation
Alpha if item deleted
DECIS08A 10.9356 30.5014 0.5596 0.7216
DECIS08A 10.9356 30.5014 0.5596 0.7216
DECIS08D 10.7956 29.2677 0.5162 0.7371
DECIS08E 11.1489 31.8642 0.5056 0.7393
DECIS08F 9.4800 29.4038 0.4965 0.7448
Reliability coefficients
N of cases N of items Alpha
450 5 0.7695
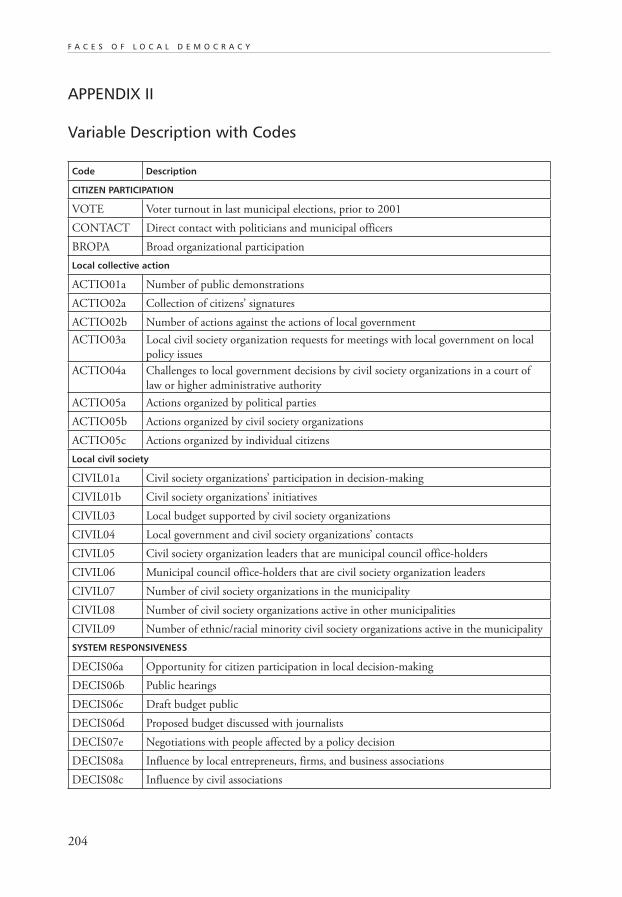
204
F A C E S O F L O C A L D E M O C R A C Y
APPENDIX II
Variable Description with Codes
Code Description
CITIZEN PARTICIPATION
VOTE Voter turnout in last municipal elections, prior to 2001
CONTACT Direct contact with politicians and municipal officers
BROPA Broad organizational participation
Local collective action
ACTIO01a Number of public demonstrations
ACTIO02a Collection of citizens’ signatures
ACTIO02b Number of actions against the actions of local government
ACTIO03a Local civil society organization requests for meetings with local government on local
policy issues
ACTIO04a Challenges to local government decisions by civil society organizations in a court of
law or higher administrative authority
ACTIO05a Actions organized by political parties
ACTIO05b Actions organized by civil society organizations
ACTIO05c Actions organized by individual citizens
Local civil society
CIVIL01a Civil society organizations’ participation in decision-making
CIVIL01b Civil society organizations’ initiatives
CIVIL03 Local budget supported by civil society organizations
CIVIL04 Local government and civil society organizations’ contacts
CIVIL05 Civil society organization leaders that are municipal council office-holders
CIVIL06 Municipal council office-holders that are civil society organization leaders
CIVIL07 Number of civil society organizations in the municipality
CIVIL08 Number of civil society organizations active in other municipalities
CIVIL09 Number of ethnic/racial minority civil society organizations active in the municipality
SYSTEM RESPONSIVENESS
DECIS06a Opportunity for citizen participation in local decision-making
DECIS06b Public hearings
DECIS06c Draft budget public
DECIS06d Proposed budget discussed with journalists
DECIS07e Negotiations with people affected by a policy decision
DECIS08a Influence by local entrepreneurs, firms‚ and business associations
DECIS08c Influence by civil associations
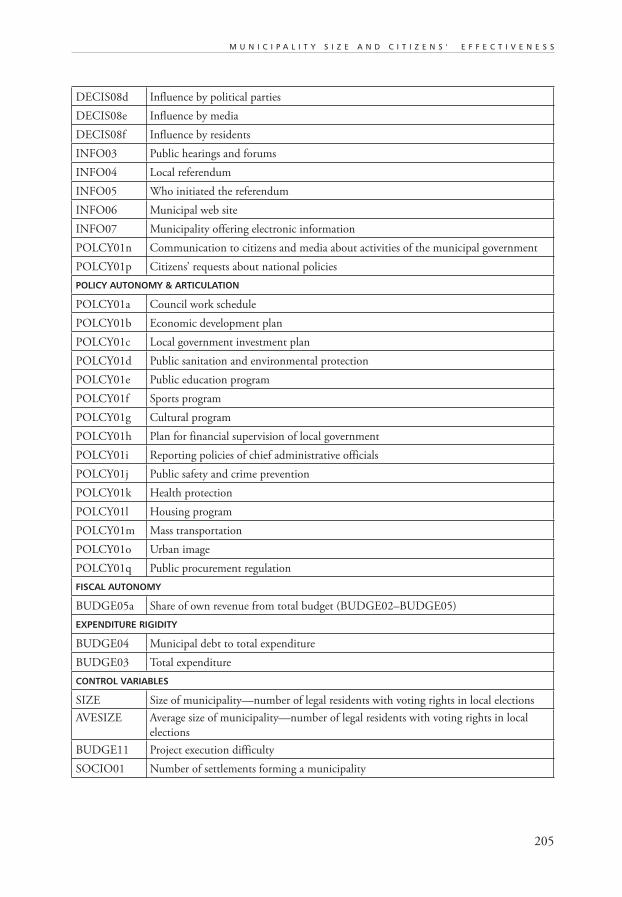
205
M U N I C I P A L I T Y S I Z E A N D C I T I Z E N S ' E F F E C T I V E N E S S
DECIS08d Influence by political parties
DECIS08e Influence by media
DECIS08f Influence by residents
INFO03 Public hearings and forums
INFO04 Local referendum
INFO05 Who initiated the referendum
INFO06 Municipal web site
INFO07 Municipality offering electronic information
POLCY01n Communication to citizens and media about activities of the municipal government
POLCY01p Citizens’ requests about national policies
POLICY AUTONOMY & ARTICULATION
POLCY01a Council work schedule
POLCY01b Economic development plan
POLCY01c Local government investment plan
POLCY01d Public sanitation and environmental protection
POLCY01e Public education program
POLCY01f Sports program
POLCY01g Cultural program
POLCY01h Plan for financial supervision of local government
POLCY01i Reporting policies of chief administrative officials
POLCY01j Public safety and crime prevention
POLCY01k Health protection
POLCY01l Housing program
POLCY01m Mass transportation
POLCY01o Urban image
POLCY01q Public procurement regulation
FISCAL AUTONOMY
BUDGE05a Share of own revenue from total budget (BUDGE02–BUDGE05)
EXPENDITURE RIGIDITY
BUDGE04 Municipal debt to total expenditure
BUDGE03 Total expenditure
CONTROL VARIABLES
SIZE Size of municipality—number of legal residents with voting rights in local elections
AVESIZE Average size of municipality—number of legal residents with voting rights in local
elections
BUDGE11 Project execution difficulty
SOCIO01 Number of settlements forming a municipality

206
F A C E S O F L O C A L D E M O C R A C Y
SOCIO03 Unemployment
SOCIO04a Social tensions due to income inequality
SOCIO04b Social tensions due to religious differences
SOCIO04c Social tensions due to political views
SOCIO04e Social tensions due to race/ethnicity
SOCIO04f Social tensions among parts of the municipality
207
Approaches to Local Representation
in Poland, Estonia‚ and Bulgaria
Cristina Nicolescu, Amelia Gorcea
ABSTRACT
The following analysis explores the relationship between local representatives and
citizens in Poland‚ Estonia, and Bulgaria examined from the point of view of the local
representatives. We consider two main approaches: a citizen-oriented one emphasiz-
ing enhanced collaboration and consultation, and a rather classical, system-oriented
approach entailing less input from citizens in government and more emphasis on rela-
tions in the inner administrative system. The two different approaches result from the
degree of openness that each region has acquired in its representation system since the
fall of communism, and from the speed at which changes in roles and loyalties at the
local level occurred. Our theoretical framework incorporates several approaches based
on social capital, value orientations and context, and socialization influences. We first
review the conceptual issues involved and then use these concepts to assess the nature
of the relationship between local representatives and citizens. The data for our analysis
of the variables used to measure the concepts comes from the ILDGP project’s Local
Representative Survey which focused on the activities, values, opinions‚ and demography
of local councilors. The main findings of the research reveal a propensity of the local
representatives towards a participatory approach in their relationship with citizens—an
approach based on collaboration, consultation‚ and openness to citizens’ input in their
activity as public representatives. We conclude from the analysis that social capital is
not sufficient to explain the approach taken by local representatives to their relation-
ship with citizens, and that the input of variables like socialization, context‚ and value
orientation contribute significantly to an understanding of this issue.
209
Approaches to Local Representation
in Poland, Estonia‚ and Bulgaria
Cristina Nicolescu, Amelia Gorcea
1. INTRODUCTION
The post-communist changes in Central and Eastern Europe have generated vigorous
debates about why the various countries in the region have evolved differently. The first
temptation was to test western models and explanations, while adapting them to specific
local conditions. At the same time, the idea of social capital‚ as elaborated in Putnam’s
Making Democracy Work‚ was capturing interest as a promising concept. More recently,
evaluations of the usefulness of this concept have ranged from overemphasizing it to
considering it inadequate for the situation in Central and Eastern Europe (Mihaylova
2003). Despite some unfulfilled expectations, the idea of social capital has proved to
be useful in analyzing the emergence and evolution of civil society in Central and
Eastern Europe. A higher degree of social capital is considered to be conducive to
good governance, which in turn enhances certain components of social capital such as
generalized trust (Uslaner 2003).1 We have thus considered it important to assess the
level of social capital of local representatives and the positive influence that it may have
on their relationship with citizens.
This report looks at the style adopted by elected representatives at the local level in
their relationship with citizens. Our framework distinguishes between two main styles
or approaches: a citizen-oriented one with enhanced collaboration and consultation
at the local level, and a rather classical system-oriented approach that involves less
input from citizens and more dynamic relations at the inner administrative level.
The development of a particular style is influenced by the degree of openness in the
representation system acquired after the fall of the communism and the speed with which
changes in the representatives’ roles and loyalties at the local level occurred. Neither
of the two approaches, of course, is to be found in a pure form. In some situations a
very citizen-oriented local representative may be compelled by circumstances to act in
a system-oriented manner, while system-oriented local representatives might sometimes
give the floor to citizens.
210
F A C E S O F L O C A L D E M O C R A C Y
We expect that a collaborative and consultative approach towards citizens will be
found among local representatives with higher levels of social capital who have been
exposed to political socialization before holding the present public office, are stimulated
by the local context and are predisposed toward postmaterialist values. The hypothesis
will be tested using data provided by the LRS survey2 of the ILDGP project, which
focuses on the activities, values, opinions‚ and demographic characteristics of local
councilors. The data comes from a randomly selected pool of municipalities whose local
representatives have been asked to take part in the survey, from which the final sample
is self-selected and includes those local representatives who completed and mailed back
the questionnaires on a voluntary basis.
We begin with a brief exploration of approaches to local representation and
the accountability of elected local representatives, and then investigate the specific
administrative systems of the analyzed countries. After describing the distribution of
local representatives according to their demographic characteristics, we explore the
theoretical concepts underpinning our framework and their application within the
analyzed units. Finally, we test successive models using a logistic regression method in
order to investigate the combination of characteristics that citizen- and system-oriented
local representatives rely on in their relationship with citizens.
2. LOCAL REPRESENTATION: CONTEXT AND APPROACHES
Theorists stress the importance of leadership style in the processes and performance of
administrative systems, and we believe it is also a relevant factor in explaining the dynam-
ics of the relationship between local representatives and citizens. Thus, we address this
issue of leadership style from the perspective of our interest in the different approaches
to local representation. We find accountability—defined as the extent to which people
feel their behavior is going to be observed and evaluated by others, and that meaning-
ful rewards and punishments are contingent upon these evaluations (Chemers 1993,
117)—to be an important component of local representatives’ conduct as local leaders.
Besides the factors strongly related to leader accountability such as laws and regulations,
specific evaluation systems‚ and mechanisms of social control, the individual orientations
of local representatives in their relations with citizens are also relevant to their conduct
as local leaders. Wherever provisions for citizen participation are assigned by law within
the local decision-making process, local representatives have specific tools to develop a
collaborative approach. Moreover, they are aware that electors have both the right and
the mechanisms to regularly evaluate their performance. Based on the extent to which
local representatives have met the electors’ initial expectations, there is always a chance
that they will lose electoral support. Whether the electors actually do reevaluate their local
leaders needs to be investigated further, as the focus of this paper is on the conduct of local
representatives and its determinants, not on the citizens’ social and electoral behavior.
211
L O C A L R E P R E S E N T A T I O N
What are the incentives for elected local leaders to take a citizen-oriented approach
to governance? Rather than looking at individual qualities and classical explanations
based on demographic characteristics, this report explores the impact of factors such
as social capital (assessed through levels of trust, networks‚ and participation), value
orientation, context influences‚ and socialization. We have used these factors in exam-
ining the actual practices of the local administrations in order to find the combination
of factors that better predicts the likelihood of local representatives upholding either a
citizen- or a system-oriented approach while acting as elected local leaders in Bulgaria,
Poland‚ and Estonia.
Our study is focused on the local representatives and the approach they choose to
take in their relationship with citizens at the local level, but this should not be interpreted
as disregarding the perspective of the citizens. The rationale for taking this approach
is based on previous findings (Verba, Schlozman‚ and Brady 1995, 390) that from the
wide range of people having the potential to get involved in social and political life,
those who are already mobilized (active in civil society) will be more likely to take ad-
vantage of opportunities to participate. In the light of such findings, the efforts of local
representatives to stimulate and encourage citizen participation could prove to be very
important to the success of local democracy in Southeastern Europe. Besides acting as
an incentive for extended civic engagement, an approach of local representatives that
encourages citizen participation will enhance or even supplement the legally provided
mechanisms of consultation between local representatives and citizens. Another principle
underlying our choice of focus is that local representatives are researched as common
citizens. Their activities, values, opinions‚ and demographic characteristics are linked
with the approach they take towards their relationship with citizens in the same way
that research on the activities, values, opinions‚ and demography of regular citizens links
such findings to their approach towards the political system.
Societal changes that have occurred in the context of the latest economic develop-
ments have in turn brought changes at the individual level and have shaped citizens’
relationship with the political system. As Inglehart has noted, “In the long run, indus-
trialized societies of both East and West must cope with long-term changes that are
making their publics less amenable to doing as they are told and more adept at telling
their governments what to do” (1999, 251). This approach, along with the extended
possibilities of civic participation that emerged after the fall of the communism, justifies
the inclusion in our explanatory model of a value orientation dimension‚ in addition to
the trust and participation components of social capital. The value dimension in this
paper consists of analyzing orientations to individual freedom, including the right to
have a word in the decision-making process as opposed to an overemphasis on the role
of the state in decision-making. Values in this case are not interpreted to mean personal
qualities (such as trust, reliability‚ or openness).
212
F A C E S O F L O C A L D E M O C R A C Y
The discussion in western countries of postmaterialist and postmodern values is
applicable to the present research to a certain extent. A limitation, of course, is the
difference in the emergence and extent of such social changes in the analyzed region
compared to the advanced industrialized democracies. Also, research into the effects
and influences of this value orientation has not yet been carried out in the countries
analyzed here. Nevertheless, we have chosen to consider this dimension because of the
existing postmaterialist orientations among the surveyed local representatives that could
have an influence on their approach. It is of interest that some local representatives be-
lieve maintaining order in the country to be more important than giving people more
say in government decision-making, or that some see solving local problems as more
important than achieving national goals. Such orientations could impact significantly
on the approach local representatives choose to take in their relationship with citizens,
as the analyzed data will show.
Other dimensions included in our model are the socialization of local representa-
tives and contextual influences. The literature on socialization ranges in subject matter
from the transfer of ideological orientations from parents to children (Westholm, Niemi
1992), to the impact of socio-economic status during childhood on an individual’s value
orientations as an adult (Inglehart 1990; Conway 1991). In investigating the approach
local representatives take towards their relationship with citizens, we use “political sociali-
zation” to refer to experiences such as the family tradition of holding public office and
also to having a personal history of being reelected to public office in the years following
the fall of communism (where the available data sets cover the relevant years).
The relationship between local representatives and citizens is also shaped by con-
textual influences reflected in the extent of community participation and how much
pressure it exerts on local government. Recent studies consider the contextual factor
to be very important for expanding social capital in communities. Sandu (2003) has
suggested that in Central and Eastern Europe, context should be understood as refer-
ring not only to the region or country, but also to the type of community. The present
research takes into consideration contextual influences as they were perceived by the
local representatives included in the surveys, as an indicator of how much they felt that
the social context compelled them to take an open and collaborative approach towards
their constituency.
2.1 Local Administrative Systems
Following the fall of the communist regimes in Central and Eastern Europe, several
challenges had to be faced simultaneously by the countries in the region. In addition
to the creation of a minimal legal framework for the new regime, decisions had to be
made on how best to address the population’s immediate social, political‚ and civil needs
213
L O C A L R E P R E S E N T A T I O N
(Przeworski 1995, 36). Several common features have marked the pathway undertaken
by each country throughout the region. Institutional incapacity and economic difficul-
ties are just two of the common challenges faced by the transitional countries. Each
country has also had to address specific problems related to the particular nature of the
previous regime.
In keeping with the methodological approach of analyzing dissimilar systems in an
attempt to find similar elements, we have selected the countries of Estonia, Poland‚ and
Bulgaria for our study. The three countries have different local government systems that
will be analyzed further in this section, but their evolution following the regime change
has several similarities that are also taken into account. Besides offering a comparative
analysis of the local government systems and of the legal framework for local govern-
ment in each country, this section will also provide some insights into the evolution of
political rights and civil liberties, based on the Freedom House ratings and on the latest
Human Development Index of the United Nations Development Program.
The local government systems in the three countries are distinguished by the number
of levels they possess: one level in Estonia, two in Bulgaria‚ and three in Poland. The
Estonian3 political system was established in the 1992 Constitution, which stated that
local issues should be managed and resolved by local authorities without involvement
from the central government. Public administration is authorized to act only on a legal
basis, but it is argued that Estonia’s public law and administration neglect organizational
democracy and participation. There are increasing regional imbalances and gaps between
the living standards of the rural and urban areas, providing evidence that the Estonian
central authorities are not fully able to fulfill their tasks. Local authorities often lack
opportunities to effectively represent the interests of their constituents, even though
the single-level system of local government was introduced to bring the authorities as
close to the people as possible and to guarantee the democratic involvement of citizens
within society (Haav 2000, 11).
The local government system has one level with two types of units: towns (linn) and
rural municipalities (vald). There also exists a higher unit—the county (maakond)—
which is part of the central government. The executive bodies of local government in
Estonia, all elected for three-year terms, are the council, elected by the citizens, and the
mayor, elected by the council, or the head of a rural municipality also elected by the
council. As established by the Constitution, local authorities manage and independently
resolve all local issues. Lately, efforts have been made to reduce and consolidate the overall
number of local authorities. Since most Estonian municipalities have between 1,000
and 3,000 residents, amalgamating them into a number of larger local governments
would improve each authority’s administrative and financial capacities.
Local representatives themselves have opposed such reform proposals due to certain
immediate negative consequences at the local level (Made 2001). Considering that
in most areas the municipal and state agencies are the biggest employers, one of the
214
F A C E S O F L O C A L D E M O C R A C Y
arguments is that unemployment will grow when the local bureaucracy no longer provides
jobs in the local government system. Besides this, the relationship with the population
would suffer because of the increased distance between the local center and the periphery.
Rural inhabitants would be penalized by having to use poor transportation systems to
travel longer distances to the new administrative center. Even if larger administrative
units could organize the redistribution of resources from richer to poorer units, the richer
municipalities have regarded this as an argument against the reforms. The proposed
governmental reform plan was to eliminate up to two-thirds of the administrative units,
but the results of the 2001 presidential elections have caused a postponement of the
announced reforms because the rural politicians’ candidate won the elections.
The local government system in Bulgaria4 has two levels: municipalities (obshtini)
and regions (oblasts). The municipalities comprise mayoralties or settlements, and their
decision-making authority is highly restricted. The executive branch is the mayor,
elected by the settlements for a four-year term. Regional governors appointed by the
Council of Ministers govern the regions, while local government units have very little
decision-making authority. Along with the fact that the governors are appointed, this
lack of power at the local level is likely to influence the kind of relationship that local
representatives can develop with the citizens in their constituency. Most of the changes
in local administration took effect under the 1991 Constitution, which established a
decentralized power structure and ensures the possibility of local referendums to be
held on the basis of universal, equal‚ and direct suffrage by secret ballot (Article 10),
and also under the Law on Local Self-Government and Public Administration. The
latest changes occurred with the Law on Administration of 1998 and the Law on Civil
Service of 1999. Even if there are regulations concerning the time frames in which state
administration (local or central) should respond to citizens’ requests, in practice there
still are problems with meeting the legal provisions. Besides the positive changes that
the two laws have brought, there are some provisions that impinge on bureaucratic
procedures. One of these concerns the duties of civil servants, which are defined in
terms of norms and regulations that are to be respected, including the need to respect
the hierarchy (Georgiev 1999).
The local government system in Poland5 is the most elaborate of the three countries.
The one-level system established by the Municipal Act in 1990 was changed in 1999
to a three-level local government system. The levels are: municipalities (gminas), which
have a directly-elected municipal council that in turn elects both the municipal board
and the mayor; a county level (powiat), which has a similar structure with a directly
elected council for a four-year term that elects both the county board and the head of
the county; and the highest local government level, the voivodship, which includes
representatives of the central government and is represented by the regional councils
elected by the citizens and the regional board elected by the council.
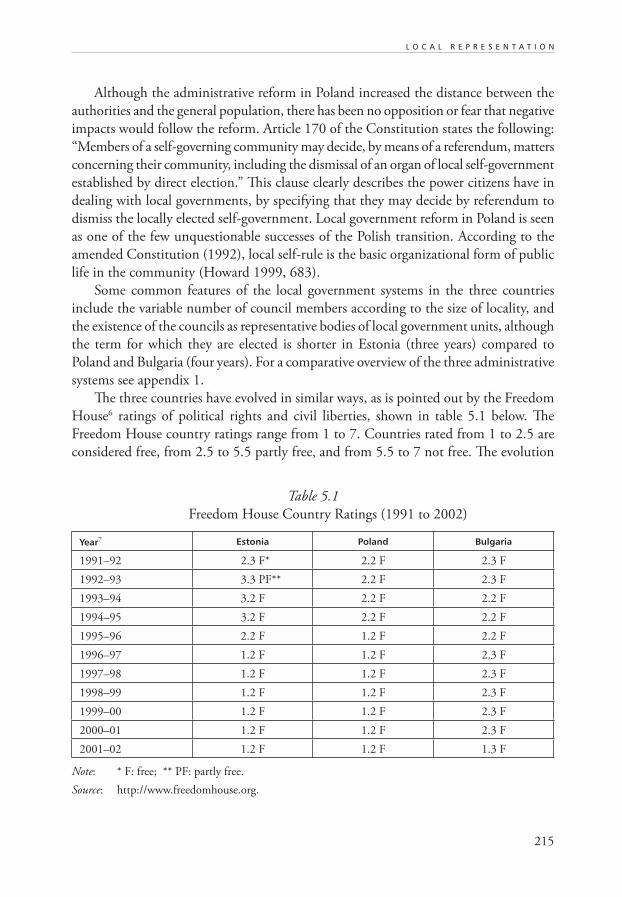
215
L O C A L R E P R E S E N T A T I O N
Although the administrative reform in Poland increased the distance between the
authorities and the general population, there has been no opposition or fear that negative
impacts would follow the reform. Article 170 of the Constitution states the following:
“Members of a self-governing community may decide, by means of a referendum, matters
concerning their community, including the dismissal of an organ of local self-government
established by direct election.” This clause clearly describes the power citizens have in
dealing with local governments, by specifying that they may decide by referendum to
dismiss the locally elected self-government. Local government reform in Poland is seen
as one of the few unquestionable successes of the Polish transition. According to the
amended Constitution (1992), local self-rule is the basic organizational form of public
life in the community (Howard 1999, 683).
Some common features of the local government systems in the three countries
include the variable number of council members according to the size of locality, and
the existence of the councils as representative bodies of local government units, although
the term for which they are elected is shorter in Estonia (three years) compared to
Poland and Bulgaria (four years). For a comparative overview of the three administrative
systems see appendix 1.
The three countries have evolved in similar ways, as is pointed out by the Freedom
House6 ratings of political rights and civil liberties, shown in table 5.1 below. The
Freedom House country ratings range from 1 to 7. Countries rated from 1 to 2.5 are
considered free, from 2.5 to 5.5 partly free‚ and from 5.5 to 7 not free. The evolution
Table 5.1
Freedom House Country Ratings (1991 to 2002)
Year7 Estonia Poland Bulgaria
1991–92 2.3 F* 2.2 F 2.3 F
1992–93 3.3 PF** 2.2 F 2.3 F
1993–94 3.2 F 2.2 F 2.2 F
1994–95 3.2 F 2.2 F 2.2 F
1995–96 2.2 F 1.2 F 2.2 F
1996–97 1.2 F 1.2 F 2.3 F
1997–98 1.2 F 1.2 F 2.3 F
1998–99 1.2 F 1.2 F 2.3 F
1999–00 1.2 F 1.2 F 2.3 F
2000–01 1.2 F 1.2 F 2.3 F
2001–02 1.2 F 1.2 F 1.3 F
Note: * F: free; ** PF: partly free.
Source: http://www.freedomhouse.org.
216
F A C E S O F L O C A L D E M O C R A C Y
toward political freedom of each of the three countries has been quite constant for the
last ten years. We should underline the rapid progress in Estonia, where only five years
were required to attain the level of Poland as far as Freedom House ratings are concerned,
while Bulgaria has stagnated for ten years before coming close to being rated at 1.3 on
the seven-item scale.
The Human Development Index used by the United Nations Development Pro-
gram also supports the hierarchy established among the three countries according to
their post-regime evolution. Poland is in 35th place, Estonia 41st‚ and Bulgaria 57th. We
chose to use this index because it is widely used to classify countries for multinational
analysis, being a measure that encompasses more than just the level of economic income.
The Human Development Index8 combines levels of literacy, education, health‚ and
income, and is used as a “standard model of societal modernization” (Norris 2002).
Both our analysis of local government systems in the three countries and the ratings
provided by the Freedom House and Human Development Index lead us to conclude
that Poland is the country with the most clearly positive evolution, followed by Estonia
and Bulgaria. These differences also show up in our analysis of the type of relationship
that local government representatives develop with the citizens in their constituencies
in the three countries, discussed below.
2.2 Characteristics of the Local Representatives
In this section we provide a short description and comparative analysis of the main char-
acteristics of the local representatives in the analyzed countries, based mainly on their
demographic profile. The analysis was conducted using data generated by the ILDGP
project’s Local Representative Survey (LRS), which inquired into the activities, values,
opinions‚ and demographic characteristics of local councilors in Poland, Bulgaria‚ and
Estonia. Table 5.2 shows the results of the survey of the local representatives from the
point of view of gender, education‚ and age distribution.
The above table mainly shows similar characteristics among the local representatives
included in the survey, with slight differences in the Estonian case. There is a significant
percentage of male local representatives in the three countries, with a slightly higher
percentage of female representatives in Estonia (31.8%). From the educational point
of view we should emphasize the more balanced distribution of local representatives
in Poland in all three categories, as compared to the balance in only two categories for
Estonia (secondary and higher education), while the Bulgarian case stands out with
17% not having completed their secondary education as opposed to 78.8% having
attended higher education, of which 60% are over 45 years old. The provisions of the
Civil Service Act of 1999, stipulating that higher education is mandatory for appoint-
ment to a managerial function, explains this high percentage of more highly educated
local representatives in Bulgaria.
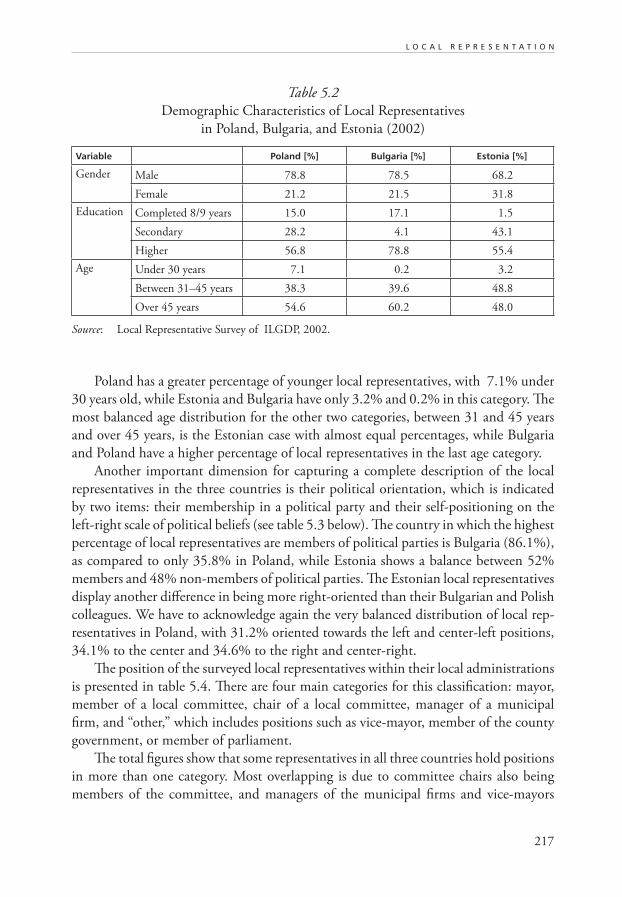
217
L O C A L R E P R E S E N T A T I O N
Poland has a greater percentage of younger local representatives, with 7.1% under
30 years old, while Estonia and Bulgaria have only 3.2% and 0.2% in this category. The
most balanced age distribution for the other two categories, between 31 and 45 years
and over 45 years, is the Estonian case with almost equal percentages, while Bulgaria
and Poland have a higher percentage of local representatives in the last age category.
Another important dimension for capturing a complete description of the local
representatives in the three countries is their political orientation, which is indicated
by two items: their membership in a political party and their self-positioning on the
left-right scale of political beliefs (see table 5.3 below). The country in which the highest
percentage of local representatives are members of political parties is Bulgaria (86.1%),
as compared to only 35.8% in Poland, while Estonia shows a balance between 52%
members and 48% non-members of political parties. The Estonian local representatives
display another difference in being more right-oriented than their Bulgarian and Polish
colleagues. We have to acknowledge again the very balanced distribution of local rep-
resentatives in Poland, with 31.2% oriented towards the left and center-left positions,
34.1% to the center and 34.6% to the right and center-right.
The position of the surveyed local representatives within their local administrations
is presented in table 5.4. There are four main categories for this classification: mayor,
member of a local committee, chair of a local committee, manager of a municipal
firm, and “other,” which includes positions such as vice-mayor, member of the county
government, or member of parliament.
The total figures show that some representatives in all three countries hold positions
in more than one category. Most overlapping is due to committee chairs also being
members of the committee, and managers of the municipal firms and vice-mayors
Table 5.2
Demographic Characteristics of Local Representatives
in Poland, Bulgaria‚ and Estonia (2002)
Variable Poland [%] Bulgaria [%] Estonia [%]
Gender Male 78.8 78.5 68.2
Female 21.2 21.5 31.8
Education Completed 8/9 years 15.0 17.1 1.5
Secondary 28.2 4.1 43.1
Higher 56.8 78.8 55.4
Age Under 30 years 7.1 0.2 3.2
Between 31–45 years 38.3 39.6 48.8
Over 45 years 54.6 60.2 48.0
Source: Local Representative Survey of ILGDP, 2002.
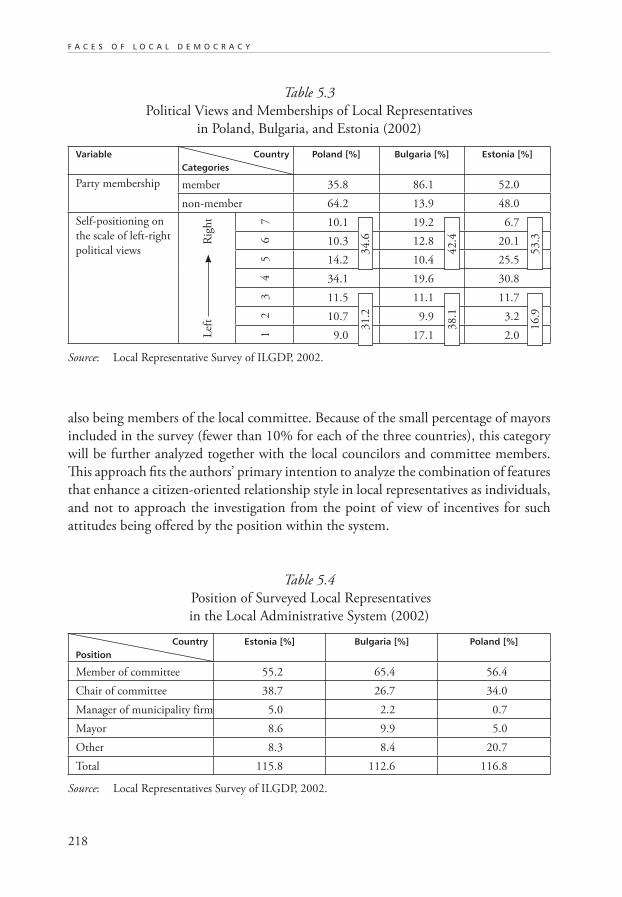
218
F A C E S O F L O C A L D E M O C R A C Y
also being members of the local committee. Because of the small percentage of mayors
included in the survey (fewer than 10% for each of the three countries), this category
will be further analyzed together with the local councilors and committee members.
This approach fits the authors’ primary intention to analyze the combination of features
that enhance a citizen-oriented relationship style in local representatives as individuals,
and not to approach the investigation from the point of view of incentives for such
attitudes being offered by the position within the system.
Table 5.3
Political Views and Memberships of Local Representatives
in Poland, Bulgaria, and Estonia (2002)
Variable CountryCategories
Poland [%] Bulgaria [%] Estonia [%]
Party membership member 35.8 86.1 52.0
non-member 64.2 13.9 48.0
Self-positioning on
the scale of left-right
political views
Lef
t R
igh
t 7 10.1 19.2 6.7
6 10.3 12.8 20.1
5 14.2 10.4 25.54 34.1 19.6 30.8
3 11.5 11.1 11.7
2 10.7 9.9 3.2
1 9.0 17.1 2.0
Source: Local Representative Survey of ILGDP, 2002.
Table 5.4
Position of Surveyed Local Representatives
in the Local Administrative System (2002)
CountryPosition
Estonia [%] Bulgaria [%] Poland [%]
Member of committee 55.2 65.4 56.4
Chair of committee 38.7 26.7 34.0
Manager of municipality firm 5.0 2.2 0.7
Mayor 8.6 9.9 5.0
Other 8.3 8.4 20.7
Total 115.8 112.6 116.8
Source: Local Representatives Survey of ILGDP, 2002.
34.6
42.4
53.3
31.2
38.1
16.9
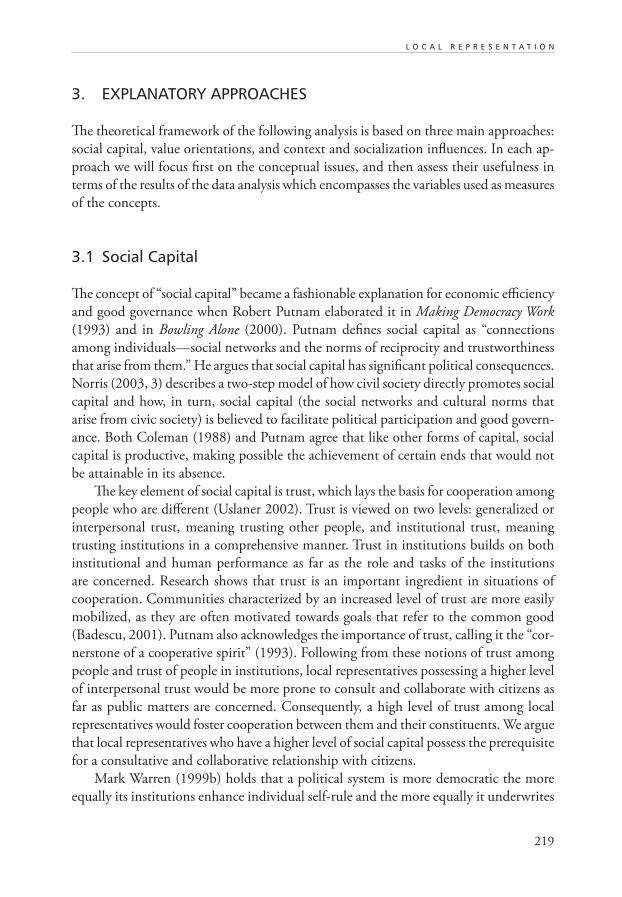
219
L O C A L R E P R E S E N T A T I O N
3. EXPLANATORY APPROACHES
The theoretical framework of the following analysis is based on three main approaches:
social capital, value orientations, and context and socialization influences. In each ap-
proach we will focus first on the conceptual issues, and then assess their usefulness in
terms of the results of the data analysis which encompasses the variables used as measures
of the concepts.
3.1 Social Capital
The concept of “social capital” became a fashionable explanation for economic efficiency
and good governance when Robert Putnam elaborated it in Making Democracy Work
(1993) and in Bowling Alone (2000). Putnam defines social capital as “connections
among individuals—social networks and the norms of reciprocity and trustworthiness
that arise from them.” He argues that social capital has significant political consequences.
Norris (2003, 3) describes a two-step model of how civil society directly promotes social
capital and how, in turn, social capital (the social networks and cultural norms that
arise from civic society) is believed to facilitate political participation and good govern-
ance. Both Coleman (1988) and Putnam agree that like other forms of capital, social
capital is productive, making possible the achievement of certain ends that would not
be attainable in its absence.
The key element of social capital is trust, which lays the basis for cooperation among
people who are different (Uslaner 2002). Trust is viewed on two levels: generalized or
interpersonal trust, meaning trusting other people, and institutional trust, meaning
trusting institutions in a comprehensive manner. Trust in institutions builds on both
institutional and human performance as far as the role and tasks of the institutions
are concerned. Research shows that trust is an important ingredient in situations of
cooperation. Communities characterized by an increased level of trust are more easily
mobilized, as they are often motivated towards goals that refer to the common good
(Badescu, 2001). Putnam also acknowledges the importance of trust, calling it the “cor-
nerstone of a cooperative spirit” (1993). Following from these notions of trust among
people and trust of people in institutions, local representatives possessing a higher level
of interpersonal trust would be more prone to consult and collaborate with citizens as
far as public matters are concerned. Consequently, a high level of trust among local
representatives would foster cooperation between them and their constituents. We argue
that local representatives who have a higher level of social capital possess the prerequisite
for a consultative and collaborative relationship with citizens.
Mark Warren (1999b) holds that a political system is more democratic the more
equally its institutions enhance individual self-rule and the more equally it underwrites
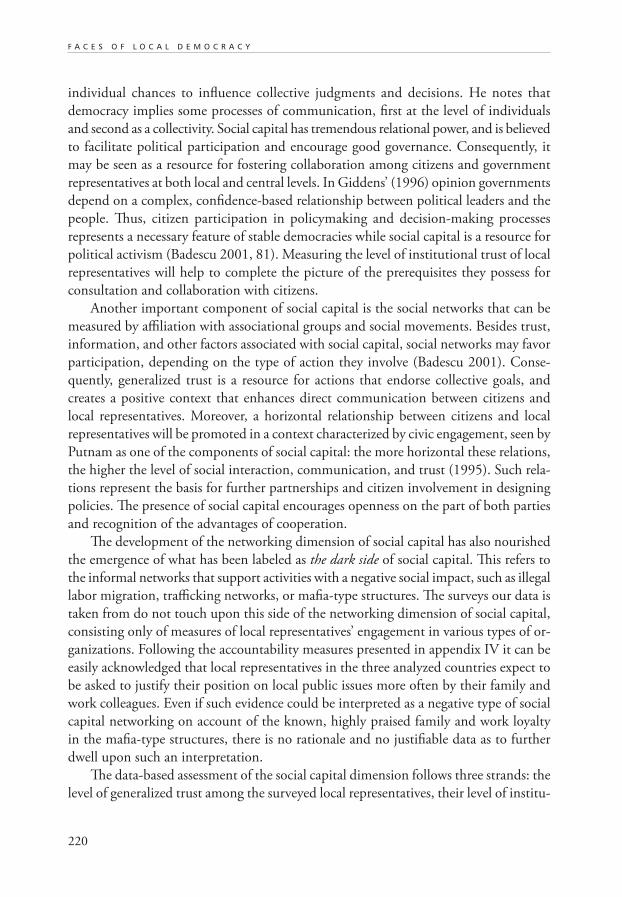
220
F A C E S O F L O C A L D E M O C R A C Y
individual chances to influence collective judgments and decisions. He notes that
democracy implies some processes of communication, first at the level of individuals
and second as a collectivity. Social capital has tremendous relational power, and is believed
to facilitate political participation and encourage good governance. Consequently, it
may be seen as a resource for fostering collaboration among citizens and government
representatives at both local and central levels. In Giddens’ (1996) opinion governments
depend on a complex, confidence-based relationship between political leaders and the
people. Thus, citizen participation in policymaking and decision-making processes
represents a necessary feature of stable democracies while social capital is a resource for
political activism (Badescu 2001, 81). Measuring the level of institutional trust of local
representatives will help to complete the picture of the prerequisites they possess for
consultation and collaboration with citizens.
Another important component of social capital is the social networks that can be
measured by affiliation with associational groups and social movements. Besides trust,
information, and other factors associated with social capital, social networks may favor
participation, depending on the type of action they involve (Badescu 2001). Conse-
quently, generalized trust is a resource for actions that endorse collective goals, and
creates a positive context that enhances direct communication between citizens and
local representatives. Moreover, a horizontal relationship between citizens and local
representatives will be promoted in a context characterized by civic engagement, seen by
Putnam as one of the components of social capital: the more horizontal these relations,
the higher the level of social interaction, communication, and trust (1995). Such rela-
tions represent the basis for further partnerships and citizen involvement in designing
policies. The presence of social capital encourages openness on the part of both parties
and recognition of the advantages of cooperation.
The development of the networking dimension of social capital has also nourished
the emergence of what has been labeled as the dark side of social capital. This refers to
the informal networks that support activities with a negative social impact, such as illegal
labor migration, trafficking networks, or mafia-type structures. The surveys our data is
taken from do not touch upon this side of the networking dimension of social capital,
consisting only of measures of local representatives’ engagement in various types of or-
ganizations. Following the accountability measures presented in appendix IV it can be
easily acknowledged that local representatives in the three analyzed countries expect to
be asked to justify their position on local public issues more often by their family and
work colleagues. Even if such evidence could be interpreted as a negative type of social
capital networking on account of the known, highly praised family and work loyalty
in the mafia-type structures, there is no rationale and no justifiable data as to further
dwell upon such an interpretation.
The data-based assessment of the social capital dimension follows three strands: the
level of generalized trust among the surveyed local representatives, their level of institu-
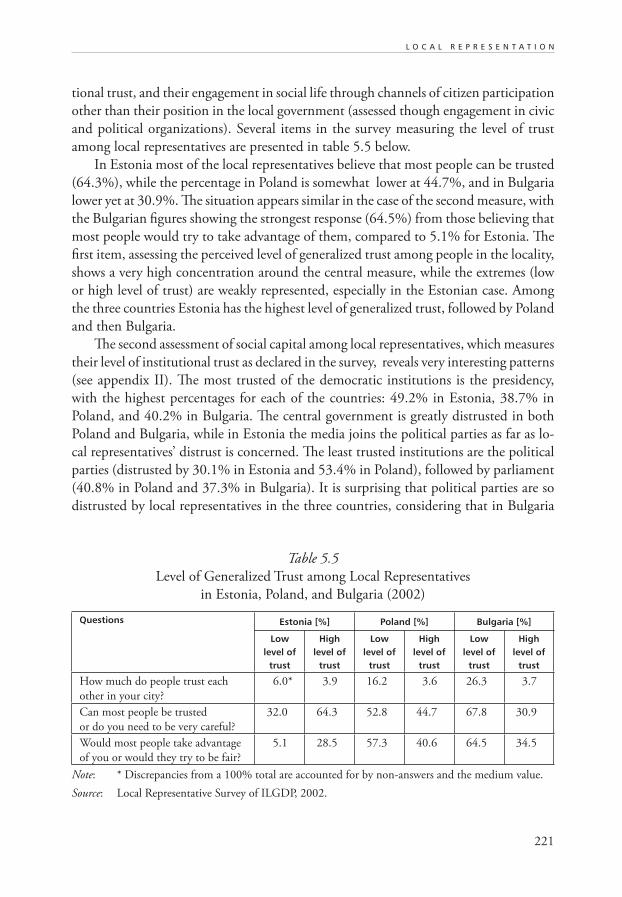
221
L O C A L R E P R E S E N T A T I O N
tional trust, and their engagement in social life through channels of citizen participation
other than their position in the local government (assessed though engagement in civic
and political organizations). Several items in the survey measuring the level of trust
among local representatives are presented in table 5.5 below.
In Estonia most of the local representatives believe that most people can be trusted
(64.3%), while the percentage in Poland is somewhat lower at 44.7%, and in Bulgaria
lower yet at 30.9%. The situation appears similar in the case of the second measure, with
the Bulgarian figures showing the strongest response (64.5%) from those believing that
most people would try to take advantage of them, compared to 5.1% for Estonia. The
first item, assessing the perceived level of generalized trust among people in the locality,
shows a very high concentration around the central measure, while the extremes (low
or high level of trust) are weakly represented, especially in the Estonian case. Among
the three countries Estonia has the highest level of generalized trust, followed by Poland
and then Bulgaria.
The second assessment of social capital among local representatives, which measures
their level of institutional trust as declared in the survey, reveals very interesting patterns
(see appendix II). The most trusted of the democratic institutions is the presidency,
with the highest percentages for each of the countries: 49.2% in Estonia, 38.7% in
Poland, and 40.2% in Bulgaria. The central government is greatly distrusted in both
Poland and Bulgaria, while in Estonia the media joins the political parties as far as lo-
cal representatives’ distrust is concerned. The least trusted institutions are the political
parties (distrusted by 30.1% in Estonia and 53.4% in Poland), followed by parliament
(40.8% in Poland and 37.3% in Bulgaria). It is surprising that political parties are so
distrusted by local representatives in the three countries, considering that in Bulgaria
Table 5.5
Level of Generalized Trust among Local Representatives
in Estonia, Poland, and Bulgaria (2002)
Questions Estonia [%] Poland [%] Bulgaria [%]
Lowlevel of
trust
Highlevel of
trust
Lowlevel of
trust
Highlevel of
trust
Lowlevel of
trust
Highlevel of
trust
How much do people trust each
other in your city?
6.0* 3.9 16.2 3.6 26.3 3.7
Can most people be trusted
or do you need to be very careful?
32.0 64.3 52.8 44.7 67.8 30.9
Would most people take advantage
of you or would they try to be fair?
5.1 28.5 57.3 40.6 64.5 34.5
Note: * Discrepancies from a 100% total are accounted for by non-answers and the medium value.
Source: Local Representative Survey of ILGDP, 2002.
222
F A C E S O F L O C A L D E M O C R A C Y
a significant 86.1% of the local representatives are party members and the parties they
belong to have nominated 82.5% of them in the elections. The figures for Estonia are
lower but still surprising, considering that 51.1% of the local representatives are party
members and the parties nominated 41.6% of them in the elections. The situation is
different in Poland, where just 34.9% of local representatives are party members and
only 35.7% were nominated by their party for the elections. The other 64.3% were
nominated by other organizational structures.
The third dimension used to assess the level of social capital among local repre-
sentatives is their engagement in participatory acts, analyzed from the perspective of
engagement in two types of organizations: civic and political. The first type of involve-
ment—holding a position of trust in a civic organization—applies to 40.8% of local
representatives in Poland, 24.9% in Estonia, and only 19.0% in Bulgaria. Another aspect
is the number of organizations in which they are involved. This ranges from none at
all to eight (in the case of one representative in Bulgaria). In Poland and Estonia the
highest number of memberships was six, but most local representatives are engaged
in only one organization, similar to the situation in all the analyzed countries. There
was also a very high number of non-respondents—up to 60% in Estonia and 76% in
Bulgaria. The situation in Poland is very different, with the highest percentage of local
representatives involved in civic organizations (89.7% are members in one or two or-
ganizations). Membership in political organizations (parties) reveals a highly politicized
situation in Bulgaria where 86.% of the local representatives surveyed belong to a political
party, as opposed to only 34.9% in Poland and 51.1% in Estonia. Of all the forms of
political engagement, collecting signatures is the most common practice identified by
representatives in the three countries, with 31.3% in Estonia, 47.1% in Bulgaria, and
51.1% in Poland. On the other hand, there is little engagement in protest politics by
local representatives in any of the countries; the highest level is in Bulgaria, with up to
12% participating in such activities.
3.2 Value Orientations
For a long time the explanatory power of economic factors as predictors of civic en-
gagement has been considered essential, especially as far as voting is concerned. But the
predictive value of economic indicators in the postmodern era is no longer what it used
to be (McAllister 1999, 201). In western industrialized democracies in particular, the
impact of political culture and historical context on citizen participation in government
has caused reconsideration of the factors involved. The consequences of unprecedented
economic development have entailed not only societal evolution, but also a reshaping
of how individual citizens see their relationship to the political system: “In the long
run, industrialized societies of both East and West must cope with long-term changes
223
L O C A L R E P R E S E N T A T I O N
that are making their publics less amenable to doing as they are told and more adept at
telling their governments what to do” (Inglehart 1999, 251). The same idea is reinforced
in recent studies showing that “the politics of choice appears to be replacing the politics
of loyalties” (Norris 2002, 1).
The extent to which this applies to Central and Eastern European countries has not
yet been assessed. Despite the enormous changes of the last fifteen years, there is still
a long way to go until this region reaches the unprecedented level of economic devel-
opment that was seen in the West, and from which postmodern theories concerning
civic engagement and democracy have emerged. Still, Central and Eastern European
countries have caught up rapidly in terms of some of the underlying factors that eventu-
ally led to what Inglehart calls the silent revolution (Inglehart 1977). The increasing level
of education, mass access to political information, and the diminishing effectiveness
of gender barriers (at least formally, if not entirely in practice) in Central and Eastern
Europe are some of the factors that can be expected to play a similar role in the evolution
of political behavior. Due to the prolonged lack of individual rights under the former
communist regimes, the emphasis now placed on such rights encourages adherence to
postmodern or postmaterialist values, even if the motivation has been different than
in the West.
Such changes are encompassed in a broader mechanism of social change known
as the social mobilization process, analyzed by Dalton, Flanagan, and Beck (1984),
Inglehart (1990), and also Dalton (1998). Social mobilization occurred as a conse-
quence of sweeping societal changes in the modern industrialized societies of the
West, and partially in Central and Eastern Europe after the regime changes. A marked
feature of this process in western societies has been the emergence of a highly political
and sophisticated citizenry that defines politics in terms of their own interests (Dalton
1998, 28) and has acquired the necessary levels of education, information, political skills,
and resources to be self-sufficient in politics and to engage in direct actions challenging
their governments. In the West, a more open, participatory, and individual-centered
form of democracy evolved in response to the social changes occurring along with
unprecedented economic development and material sufficiency. In Central and Eastern
Europe, however, citizens were either presented with a more open, participatory, and
individual-centered democracy following the fall of communism in the region, or they
had to challenge their governments to provide such opportunities for active citizenship
in an open, participatory democracy.
One distinctive aspect of the social changes discussed above is a shift in
western value preferences from physical security and economic well-being to non-
material needs such as self-expression and individual fulfillment. This “silent revolution”
is reflective of the postmodern political attitude, which “allows a much wider range
for individual autonomy in the pursuit of individual subjective well being” (Inglehart
1997, 238).
224
F A C E S O F L O C A L D E M O C R A C Y
More specifically, this new orientation expresses a shift toward postmaterialism,
which strongly de-emphasizes the previously lauded qualities of economic efficiency,
bureaucratic authority, and scientific rationality upon which modern societies were built,
and instead values individual autonomy, increased self-expression, and the acceptance
of diversity. Postmaterialist values have major behavioral and attitudinal consequences
for the way individuals relate to the political system and participate in social life. Citizens
with postmaterialist values are more likely to be actively engaged in social life and more
open to using unconventional and challenging modes of civic participation, including
protest actions.
The value orientations of local representatives in the analyzed countries were
assessed through two means. The first involved having the representatives prioritize the
following goals to be achieved in the country in the coming years:
• Maintaining order in the country
• Giving people more say in important government decisions
• Fighting rising prices
• Protecting freedom of speech.
Of these four items, maintaining order in the country proved to be the most highly
valued goal in each country: 54.5% considered it the highest priority in Bulgaria, 57.3%
in Estonia, and 62.2 % in Poland. The second priority, giving people more say in im-
portant government decisions, is also similar for the three countries. Fighting rising
prices and protecting freedom of speech share the last place in the order of priorities,
as shown in table 5.6.
The second item used to assess the value orientations of local representatives in
the analyzed countries is their agreement or disagreement with certain statements that
express contrasting orientations (traditional or postmodern) towards a variety of topics
(see table 5.7).
For each of the two contrasting items in table 5.7, the one on the left puts a more
traditional emphasis on increased state/government responsibility for providing goods
and for equality of income or rights, while the one on the right reflects a more indi-
vidual-oriented approach which is closer to the postmodern and postmaterialist value
orientations, without being exclusive or exhaustive.
The local representatives in the three countries adhere to similar value orientations
from the point of view of praising competition, private ownership, and the advantages
of widespread public participation. The Estonian local representatives showed slight
differences from the others in their favoring of income equality, additional rights for
minorities, and the primacy of solving local problems over achieving national goals. A
potential explanation for this may be the fact that Estonia, unlike Bulgaria and Poland,
was part of the former Soviet Union and experienced both the status of minority and
the primacy of the federation’s goals over local problems. Another difference worth
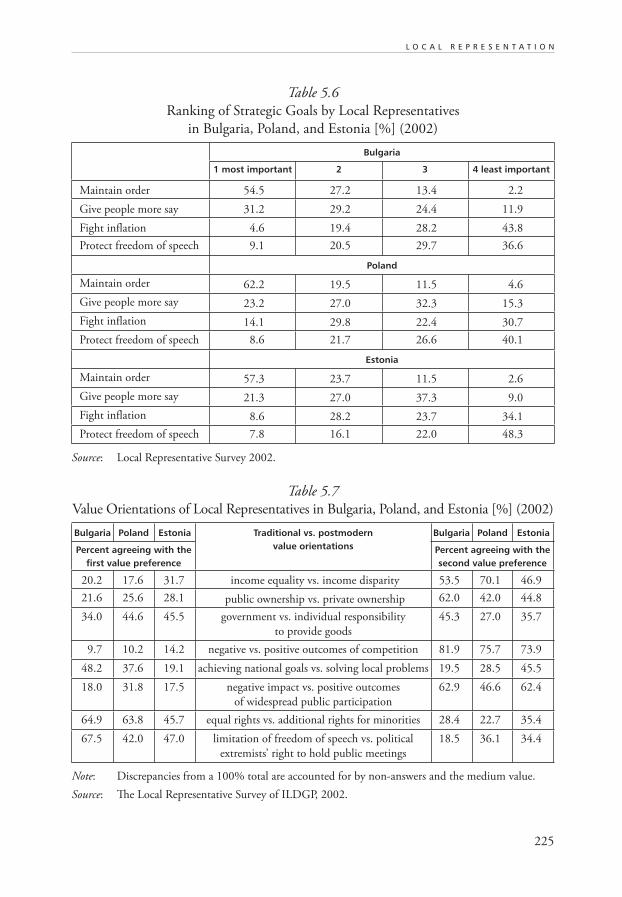
225
L O C A L R E P R E S E N T A T I O N
Table 5.6
Ranking of Strategic Goals by Local Representatives
in Bulgaria, Poland, and Estonia [%] (2002)
Bulgaria
1 most important 2 3 4 least important
Maintain order 54.5 27.2 13.4 2.2
Give people more say 31.2 29.2 24.4 11.9
Fight inflation 4.6 19.4 28.2 43.8
Protect freedom of speech 9.1 20.5 29.7 36.6
Poland
Maintain order 62.2 19.5 11.5 4.6
Give people more say 23.2 27.0 32.3 15.3
Fight inflation 14.1 29.8 22.4 30.7
Protect freedom of speech 8.6 21.7 26.6 40.1
Estonia
Maintain order 57.3 23.7 11.5 2.6
Give people more say 21.3 27.0 37.3 9.0
Fight inflation 8.6 28.2 23.7 34.1
Protect freedom of speech 7.8 16.1 22.0 48.3
Source: Local Representative Survey 2002.
Table 5.7
Value Orientations of Local Representatives in Bulgaria, Poland, and Estonia [%] (2002)
Bulgaria Poland Estonia Traditional vs. postmodern value orientations
Bulgaria Poland Estonia
Percent agreeing with the first value preference
Percent agreeing with the second value preference
20.2 17.6 31.7 income equality vs. income disparity 53.5 70.1 46.9
21.6 25.6 28.1 public ownership vs. private ownership 62.0 42.0 44.8
34.0 44.6 45.5 government vs. individual responsibility
to provide goods
45.3 27.0 35.7
9.7 10.2 14.2 negative vs. positive outcomes of competition 81.9 75.7 73.9
48.2 37.6 19.1 achieving national goals vs. solving local problems 19.5 28.5 45.5
18.0 31.8 17.5 negative impact vs. positive outcomes
of widespread public participation
62.9 46.6 62.4
64.9 63.8 45.7 equal rights vs. additional rights for minorities 28.4 22.7 35.4
67.5 42.0 47.0 limitation of freedom of speech vs. political
extremists’ right to hold public meetings
18.5 36.1 34.4
Note: Discrepancies from a 100% total are accounted for by non-answers and the medium value.
Source: The Local Representative Survey of ILDGP, 2002.
226
F A C E S O F L O C A L D E M O C R A C Y
noting is the individual-centered orientations of Bulgarian local representatives as far as
the responsibility for providing goods is concerned, with 45.5% of local representatives
believing that such responsibility belongs to the individual rather than to the government,
as compared with the 27% of Polish and 35.7% of Estonian local representatives.
3.3 Context Influences and Socialization
Political socialization is defined as “the processes by which individuals learn the political
norms, values and behavior patterns of the nations, groups or subgroups to which they
belong. These characteristics can be thought of as each group’s political culture. Political
socialization means the enduring attitudes and ways of behaving that characterize a group
over an extended period of time” (Lipset 1995). Some scholars (Patton 2001) place
the agents of socialization in two categories: first the home, which plays a major role
in shaping one’s world outlook from birth, with peer group pressure and contact with
friends also having an effect on one’s behavior and attitude, and second, the institutions
other than family (school, social clubs, places of work, mass media) that have an impact
on individuals’ behavior, values, knowledge, and actions. Social clubs and places of
work are often selected as a result of certain stimuli from one’s educational experience.
Yet, these factors are insufficient to explain by themselves the differences in national
levels of political activism. It is also important to take account of the broader context
set by societal modernization, institutional design, and mobilizing agencies (Norris
2003).
Discussion of the factors influencing the approach local representatives take to-
wards their relationship with citizens must necessarily include contextual influences.
Of the external contextual factors that are relevant for our purposes we selected certain
socialization influences, at the same time acknowledging that socialization means much
more than what this paper investigates. Despite such limitations, we believe important
insights for the purposes of this research can be gained by considering the influences
exerted by several variables fitting the broader patterns of context and socialization.
Socialization influences can be seen in local representatives in such things as the fam-
ily tradition of assuming public office, or in the personal experience of holding public
office before the present mandate. Contextual influences are measured by assessing
the pressure for accountability that comes from several groups within the society, and
the perceived influence on the decision-making process of several social actors, both
individuals and groups.
The family tradition of assuming public office is strongest in Poland and Bulgaria,
with a shifting position between engagement in political parties (45.8% in Bulgaria
and 23.3 % in Poland) and engagement in nongovernmental organizations (29.8% in
Bulgaria and 42.7% in Poland). Estonia is very weakly represented from this point of

227
L O C A L R E P R E S E N T A T I O N
view, with only 9.2% of the representatives’ parents engaged in political parties and
6.6% involved in nongovernmental organizations.
Prior experience in holding public office during recent years is very well represented,
with the majority of the local representatives included in the survey being reelected for
at least one term in each of the three countries. As many as 10% in Poland and 16% in
Estonia have been reelected more than three times, as is shown in table 5.8.
The context influences are measured by an item dealing with the influence of several
persons and groups on the decision-making of the local government. The components
can be divided into two distinct categories: influences from other institutions or repre-
sentatives (including civil servants, the chief administrative officer, the mayor, central
government, and local branches of political parties), and direct or indirect influences
from citizens (including church, interested citizens, media, civic organizations, unions,
and local businesses). The figures are presented in appendix III.
It is quite noticeable in all three countries that the highest influence is exerted by the
first category of factors, including other institutions and the direct hierarchical superiors
of the local representatives, while the second group has a visibly lower influence on the
decision-making process as perceived by the local representatives. The most influential
category in all the countries is the mayor with almost 70% perceiving a high influence,
while the influence of civic organizations and interested citizens is somewhere around
50%, higher in Bulgaria and Poland than in Estonia. Church representatives along with
unions and local business representatives share the lowest influence on local decision-
making in all the analyzed countries.
The persons or groups to whom local representatives expect to be held accountable
show a pattern of strong family networks. Most frequently, local representatives expect
that they will be held accountable by family, work colleagues, and the political party. On
the other hand, they have very little expectation of being held accountable by media,
nongovernmental organizations, or the business community. The figures are similar
for the three countries. In Estonia the figures are somewhat lower with regard to the
Table 5.8
Experience of Local Representatives in Holding Public Office
Reelected Bulgaria [%] Poland [%] Estonia [%]
One time 53.9 39.5 34.6
Two times 23.6 28.3 24.3
Three times 15.5 18.1 21.0
More than 3 times 2.0 10.7 16.0
Missing 5.0 3.3 3.8
Source: Local Representative Survey of ILDGP, 2002.
228
F A C E S O F L O C A L D E M O C R A C Y
frequency of accountability requirements, but not with regard to the groups to whom
local representatives feel accountable (for more detailed figures see appendix IV).
4. TESTING THE HYPOTHESIS
The initial hypothesis asserts that the approach local representatives take towards their
relationship with citizens is determined not only by the social capital of local repre-
sentatives, but also by other variables which we expected would include their value
orientations, socialization, and contextual influences. The dependent variable that we
aimed to explain is the approach local representatives take towards their relationship
with citizens, as defined by two categories: the classical system-oriented approach, with
decision-making based on hierarchical and classical bureaucratic procedures of the
administrative systems; and the participatory, citizen-oriented approach, based on con-
sultation, collaboration, and partnerships and aimed at opening the decision-making
process to input from citizens.
We used successive logistic regression models to compare the probability that local
representatives with certain characteristics would uphold the citizen-oriented approach
with the probability that they would uphold a system-oriented approach. The depend-
ent variable was computed by recoding a set of items from the questionnaire (see tables
5.9 and 5.10) measuring the actions of the local representatives and their approach to
their relationship with the citizens, using a high ranking for those options appropriate
for a collaborative and consultative approach (i.e., organizing consultative forums before
decision-making) and a low ranking for the more classical approach to decision-making
(without input from citizens). The final distribution has been obtained by assigning
a “citizen-oriented” description to local representatives when more than half of their
choices ranked at the high end of the scale, and a “system-oriented” description to those
who chose more than half at the low end.
Table 5.10 presents the final frequency distribution of the dependent variable (the
approach taken by the local representatives towards their relationship with citizens)
after recoding.
The categories of the dependent variable are balanced only in Poland, while in
Estonia and Bulgaria there is a clear trend towards the participatory approach, with a
surprising 90.3% favoring this approach in Estonia.
The hypothesis was tested using an initial explanatory model that includes de-
mographic characteristics and measures of civic engagement and generalized and
institutional trust. All of these are part of the broader explanatory variable—the local
representatives’ level of social capital. The alternative models include the other proposed
variables (socialization, context influences, accountability, and value orientations), with
the evolution of the indicators being compared successively, one by one. First we analyze
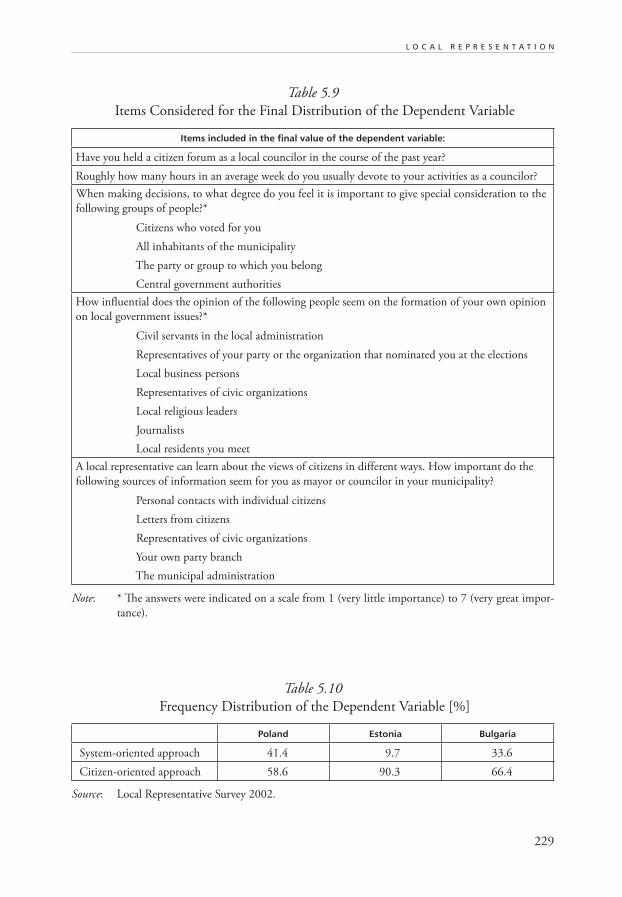
229
L O C A L R E P R E S E N T A T I O N
Table 5.9
Items Considered for the Final Distribution of the Dependent Variable
Items included in the final value of the dependent variable:
Have you held a citizen forum as a local councilor in the course of the past year?
Roughly how many hours in an average week do you usually devote to your activities as a councilor?
When making decisions, to what degree do you feel it is important to give special consideration to the
following groups of people?*
Citizens who voted for you
All inhabitants of the municipality
The party or group to which you belong
Central government authorities
How influential does the opinion of the following people seem on the formation of your own opinion
on local government issues?*
Civil servants in the local administration
Representatives of your party or the organization that nominated you at the elections
Local business persons
Representatives of civic organizations
Local religious leaders
Journalists
Local residents you meet
A local representative can learn about the views of citizens in different ways. How important do the
following sources of information seem for you as mayor or councilor in your municipality?
Personal contacts with individual citizens
Letters from citizens
Representatives of civic organizations
Your own party branch
The municipal administration
Note: * The answers were indicated on a scale from 1 (very little importance) to 7 (very great impor-
tance).
Table 5.10
Frequency Distribution of the Dependent Variable [%]
Poland Estonia Bulgaria
System-oriented approach 41.4 9.7 33.6
Citizen-oriented approach 58.6 90.3 66.4
Source: Local Representative Survey 2002.
230
F A C E S O F L O C A L D E M O C R A C Y
the changes for each of the three countries, and then we conclude with a comparative
analysis for the three countries.
The indicators for Estonia are presented in table 5.11. The first model shows a
positive influence of both generalized and institutional trust and civic engagement.
Age and gender do not have significant values, but education positively influences the
chances that a local representative with the described features will prefer a participa-
tory approach towards his or her relationship with citizens. The successive inclusion in
the following models of new variables has slightly decreased the indicators in the first
model, which mainly remained statistically significant. The influence of education and
civic engagement measures has been affected by the inclusion of the additional explana-
tory variables, and shows no statistical significance in the final model. The explanatory
power of the model has been slightly strengthened by the context, accountability and
value orientations measures, as indicators show (see table 5.11).
The initial model for Bulgaria shows a particular significance of age and education,
starting from the first model and remaining statistically significant throughout. Other
measures with a positive influence are civic engagement and institutional trust, which
prove to be more stable in influence than generalized trust. The newly included variables
have significant positive influences in the model, slightly strengthening its explanatory
power (see table 5.12).
The situation in Poland is slightly different with fewer statistically significant coef-
ficients. The influence of age, gender, and education is not significant, and age indicators
are very close to 1. Institutional trust and civic engagement have positive influences,
being significant for the first two models and reaching closer to 1 in the models includ-
ing context, accountability, and value orientations measures, which all have positive
influences and significant values.
A comparative analysis of the explanatory models for the three countries shows
some particularities that may explain the frequency distribution of the dependent vari-
able as presented in table 5.10. The case of Estonia, with 90.3% of local representatives
included in the survey leaning towards a participatory approach, may be explained by
the significant values of both generalized and institutional trust. These values retained
their significance in the models that included additional explanatory variables, which
was not the case for the civic engagement measures. Previous studies have also under-
scored that it is social trust rather than associational activism that strongly correlates
with levels of human and democratic development (Norris 2002).
The unexpected 90% propensity of Estonian local representatives towards a par-
ticipatory approach in their relationship with citizens can be explained by the patterns
of the administrative system and the embedded local government relationships which
have been established over time and show resistance towards attempts at reform. The
analyzed variables do not fully explain the high percentage of people-oriented local
representatives, but if we add the impact of the administrative system we find that such
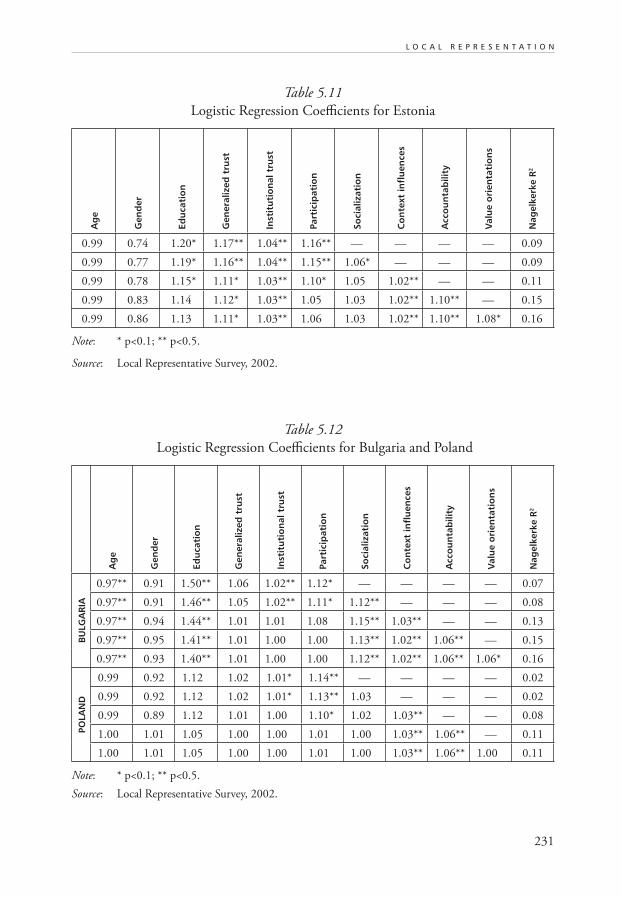
231
L O C A L R E P R E S E N T A T I O N
Table 5.11
Logistic Regression Coefficients for Estonia
Ag
e
Gen
der
Edu
cati
on
Gen
eral
ized
tru
st
Inst
itu
tio
nal
tru
st
Part
icip
atio
n
Soci
aliz
atio
n
Co
nte
xt in
flu
ence
s
Acc
ou
nta
bili
ty
Val
ue
ori
enta
tio
ns
Nag
elke
rke
R2
0.99 0.74 1.20* 1.17** 1.04** 1.16** — — — — 0.09
0.99 0.77 1.19* 1.16** 1.04** 1.15** 1.06* — — — 0.09
0.99 0.78 1.15* 1.11* 1.03** 1.10* 1.05 1.02** — — 0.11
0.99 0.83 1.14 1.12* 1.03** 1.05 1.03 1.02** 1.10** — 0.15
0.99 0.86 1.13 1.11* 1.03** 1.06 1.03 1.02** 1.10** 1.08* 0.16
Note: * p<0.1; ** p<0.5.
Source: Local Representative Survey, 2002.
Table 5.12
Logistic Regression Coefficients for Bulgaria and Poland
Ag
e
Gen
der
Edu
cati
on
Gen
eral
ized
tru
st
Inst
itu
tio
nal
tru
st
Part
icip
atio
n
Soci
aliz
atio
n
Co
nte
xt in
flu
ence
s
Acc
ou
nta
bili
ty
Val
ue
ori
enta
tio
ns
Nag
elke
rke
R2
BU
LGA
RIA
0.97** 0.91 1.50** 1.06 1.02** 1.12* — — — — 0.07
0.97** 0.91 1.46** 1.05 1.02** 1.11* 1.12** — — — 0.08
0.97** 0.94 1.44** 1.01 1.01 1.08 1.15** 1.03** — — 0.13
0.97** 0.95 1.41** 1.01 1.00 1.00 1.13** 1.02** 1.06** — 0.15
0.97** 0.93 1.40** 1.01 1.00 1.00 1.12** 1.02** 1.06** 1.06* 0.16
POLA
ND
0.99 0.92 1.12 1.02 1.01* 1.14** — — — — 0.02
0.99 0.92 1.12 1.02 1.01* 1.13** 1.03 — — — 0.02
0.99 0.89 1.12 1.01 1.00 1.10* 1.02 1.03** — — 0.08
1.00 1.01 1.05 1.00 1.00 1.01 1.00 1.03** 1.06** — 0.11
1.00 1.01 1.05 1.00 1.00 1.01 1.00 1.03** 1.06** 1.00 0.11
Note: * p<0.1; ** p<0.5.
Source: Local Representative Survey, 2002.
232
F A C E S O F L O C A L D E M O C R A C Y
an overwhelming figure is accounted for not only by the people within the administra-
tion, but also by the system itself, due to the small size of administrative units that have
favored a close relationship between local government and citizens for a long time. The
opposition of local governments to reform initiatives aimed at decreasing the number
of administrative units and consequently increasing the distance between the people
and the local government also accounts for this high percentage of people-oriented
local representatives.
The case of Bulgaria is different from the other two because of the significant and
constant negative influence of age and the positive influence of education measures,
which in the other cases are not significant and very close to neutral values. The dis-
tribution of local representatives in Bulgaria by age has shown that 60% of them are
over 45 years old. Bulgaria has the smallest number of young local representatives, with
only 0.2%. The constant and powerful influence of education is also explained by the
frequency distribution of the variable. The pattern of Bulgarian local representatives’
education is very different from the other two countries, having almost no middle cat-
egory values and an overwhelming 78.8% with higher education, of which over 60% are
in the last age category, thus strengthening the constant impact of the two variables in
the model. This is due to the mandatory higher education requirement for appointment
to a managerial position, stipulated in the Bulgarian Civil Service Act. The significant
and higher coefficients for socialization should also to be mentioned, as this strengthens
previous conclusions from section 3.3 showing the impact of the family tradition of
associational membership.
In the case of Poland, the highest percentages for the calculated coefficients models
show no statistical significance; thus, the models seem to have rather limited explanatory
power. The influence of civic engagement seems to be more significant and constant
when compared to this item in the other two cases, but the overall explanation provided
by the models does not seem to be very appropriate for this case, which had the most
balanced frequency distribution of the dependent variable. A potential explanation may
be found in the balanced frequency distribution of local representatives in Poland on
most of the variables considered. From the age distribution point of view, Poland has
the highest representation of local representatives under 30 years of age among the three
countries. Education is also very well balanced, with a slightly higher percentage of local
representatives having higher education, while the left-right self-positioning shows an
almost perfectly equal situation, around 30% in each of computed categories.
The only variable with an impact on the regression analysis results is the only one
on which Polish local representatives do not show a balanced frequency distribution:
the civic engagement variable. This is the point where Poland is significantly different
from the other two countries. Over 80% of local representatives in Poland are engaged
in civic organizations and 64.9% of them have been nominated in the elections by
an organization and not by a political party. Compared to the 60% missing answers
233
L O C A L R E P R E S E N T A T I O N
in Bulgaria and 76.5% missing answers in Estonia on this item and to the balanced
frequency distributions on other variables, this situation explains why civic engage-
ment is the only significant variable for Poland. Besides the distribution for the local
representatives themselves, Poland has a high percentage of parental engagement in civic
organizations, which is the case for neither Estonia nor Bulgaria.
5. CONCLUSION
The present report aimed to investigate the factors influencing the approach that local
representatives take towards their relationship with citizens, focusing the explanation not
only on social capital but also trying to identify other variables with considerable influ-
ence in each of the three countries—Estonia, Poland, and Bulgaria. Besides considering
the classical approach of social capital (assessed through level of trust, networks, and
participation) the research aimed at beginning a discussion about how variables such
as value orientations, socialization, and context influences might affect the relationship
between local representatives and citizens.
The main findings of the research show that there is a propensity from the local
representatives in the analyzed countries towards a participatory approach in relating to
citizens, based on collaboration and consultation with the latter and openness towards
input from the citizens in their activity as public representatives. The three cases show
various differences in the determinants that have an impact on the relationship between
the representatives and their constituents, even if the dependent variable shows the
prevalence of the same approach from the local representatives’ side, varying in percent-
age. The Estonian case shows an unexpected 90.3% of local representatives approaching
the citizens in their constituency horizontally; at the other end, the Polish representa-
tives showed a highly balanced distribution. The explanatory models have focused on
investigating the supplementary explanations provided by such variables as socialization,
context influences (including accountability issues), and value orientations, which have
been added one by one to the logistic regression-based models, considering at the same
time the specificities of the administrative systems from the three countries that helped
explain the significance of the variables included in the explanatory models.
The overall conclusion drawn from the analysis is that social capital by itself is not
sufficient to explain the approach local representatives have towards their relationship
with citizens, and the input of variables like socialization, context influences, and value
orientations significantly contribute to such explanatory attempts. Leadership style is also
relevant for the dynamics of the processes and performance of administrative systems,
influencing the relationship between local representatives and citizens. The combination
of factors that stimulate local representatives to act as citizen-oriented decision-makers
is far from being identified with certainty and exhaustively by this study. However, the
234
F A C E S O F L O C A L D E M O C R A C Y
study has succeeded in confirming the initial hypothesis for the cases of Estonia and
Bulgaria, while the case of Poland needs further investigation to find an appropriate set
of explanatory variables. Another important conclusion of our analysis is that when con-
sidering the explanatory power of social capital, the various components (namely trust,
networks, and participation) should be distinguished. In addition, differences should be
examined among the various dimensions of each component. The tested models have
shown that institutional trust and generalized trust have different explanatory impacts,
supporting the scholars who assert the need to separately approach the two concepts as
they are of different origins.
Consideration of the systemic features of local administrations in the three countries
has proved to be a valuable aspect of the research. The present study is far from shedding
full light on the combination of factors that influence the approach local representa-
tives choose to take towards their relationship with the citizens in the three analyzed
countries. This complex issue has to be further investigated, alternative models tested,
and appropriate sets of explanatory variables sought, in order to constantly enrich the
underlying theoretical principles of the relationships under study. An approach that
would definitely add much to the understanding of the broader relationship between
local representatives and citizens would be one that looked at the citizens’ own approach
towards the relationship. This would complete the investigation that we undertook in
the present report.
NOTES
1 Extract from the discussions at the conference Social Capital in the Balkans: The Missing Link? organized
by the Blue Bird Social Inclusion Group and the Center for Policy Studies, January 21st—February
1st 2003 at Babes-Bolyai University, Cluj-Napoca, Romania.
2 For more information on the samples and data collection methods please refer to Tocqueville Research
Center’s web site: http://www.t-rc.org.
3 The information is taken from the Local Government International Bureau web site:
http://www.lgib.gov.uk/enlargement/estonia.htm.
4 The information is taken from the Local Government International Bureau web site:
http://www.lgib.gov.uk/enlargement/bulgaria.htm.
5 The information is taken from the Local Government International Bureau web site:
http://www.lgib.gov.uk/enlargement/poland.htm.
6 The Freedom House country ratings are based on evaluation of political rights and civil liberties in
each country, attempting to judge by a single standard. The indicators do not rate governments per se,
but the rights and freedoms enjoyed by individuals. The surveys are not based solely on the political
conditions of a given country, but on the effects such conditions have on freedom. The ratings are
based on a broad range of international sources of information, including domestic and foreign news
reports, NGO publications, think tank and academic analysis, and individual professional contacts.
235
L O C A L R E P R E S E N T A T I O N
For more information on the criteria and methodology used to determine country ratings, please refer
to http://www.freedomhouse.org/research/freeworld/2000/methodology.htm.
7 The Freedom House ratings are shown starting only from1991 because this is the first year when
Estonia has been considered as an independent country in the surveys.
8 For more information on the methodology of calculating the index, please refer to http://www.undp.org/
hdr.
REFERENCES
Almond, G. and S. Verba. 1996. Cultura civica—atitudini politice si democratie in cinci
natiuni (Civic Culture—Political Attitudes and Democracy in Five Nations). Bucharest:
CEU Press.
Badescu, G. 2001. Participare politica si capital social in Romania (Political Participation
and Social Capital in Romania). Cluj-Napoca: Accent.
Bowman, A.O., M. Kearney, and C. Richard. 1990. State and Local Government
(Participation and Interest Groups). Boston: Houghton Mifflin Company.
Chemers, M.M. and R. Ayman (eds.). 1993. Leaders’ Theory and Research. Perspectives
and Directions. San Diego: Academic Press.
Chetwynd, E. and F.J. Chetwynd. 2001. Participarea cetăţenească pentru îmbunătăţirea
procesului decizional în administraţia publică locală (Citizen Participation for the
Improvement of the Local Decision Making Process). Bucharest: Research Triangle
Institute.
Conway, M. 1991. Political Participation in the United States. Washington DC:
Congressional Quarterly Press.
Dalton, R.J. 1988. Citizen Politics in Western Democracies—Public Opinion and Political
Parties in the United States, Great Britain, West Germany and France. Chatham NJ:
Chatham House Publishers.
Dalton, R.J., S.C. Flanagan, and P.A. Beck. 1984. Electoral Change in Advanced Industrial
Democracies—Realignment or Dealignment. Princeton NJ: Princeton Univ. Press.
DeSario, J. and S. Langton. 1987. Citizen Participation in Public Decision Making.
Westport CT: Green Wood Press.
Downs, A. 1957. An Economic Theory of Democracy. New York, NY: Harper Collins
Publishers.
Georgiev, B. 1999. Civil Services and State Administrations. Sofia. The Univ. of Sofia.
Haav, K. 2000. European integration and public administration reform in Estonia. Paper
presented at the 8th NISPAcee Annual Conference. Budapest: NISPAcee.
236
F A C E S O F L O C A L D E M O C R A C Y
Hardy, C. 1994. Managing Strategic Action. Mobilizing Change, Concepts, Readings and
Cases. London: Sage.
Howard, D.A.E. 1999. After communism: devolution in Central and Eastern Europe.
South Texas Law Review No 3. Vol. 40.
Inglehart, R. 1990. Culture Shift in Advanced Industrial Societies. Princeton NJ: Princeton
University Press.
Inglehart, R. 1999. Postmodernization erodes respect for authority, but increases support
for democracy. In: P. Norris. Critical Citizens—Global Support for Democratic
Governance. New York NY: Oxford University Press.
Kaase, M. and K. Newton. 1995. Beliefs in Government. Oxford: Oxford Univ. Press.
Karatnycky, A., A. Motyl, and A. Schnetzer (eds.). 2002. Nations in Transit. Freedom
House: Transaction Publishers.
Kingemann, H.D. and D. Fuchs (eds.). 1998. Citizens and the State. New York: Oxford
Univ. Press.
Lipset, S.M. 1995. The Encyclopedia of Democracy. London: Routledge.
Made, V. 2001. Electoral System for the Local Government Council Elections. Tallin:
Estonian School of Diplomacy.
Mihaylova, D. 2003. Defining social capital and civic engagement in Eastern Europe—
A critical assessment. Paper presented at conference: Social capital in the Balkans:
The missing link? Cluj-Napoca.
Newton, K. 1999. Social and political trust in established democracies. In: P. Norris.
Critical Citizens—Global Support for DemocraticGovernance. New York, NY: Oxford
University Press.
Norris, P. 2002. Democratic Phoenix—Reinventing Political Activism. New York, NY:
Cambridge University Press.
Patton, C. 2001. Psyche publishing. Freedom Journal Vol. 34.
Przeworski, A. 1995. Sustainable Democracy. New York, NY: Cambridge Univ. Press.
Putnam, R. 1980. Making Democracy Work—Civic Traditions in Modern Italy. Princeton,
NJ: Princeton University Press.
Reiljan, J., K. Timpmann, and K. Olenko. 2003. Key issues in developing the public
administration system. In: Estonia Before Joining the European Union. University of
Tartu, Faculty of Economics and Business Administration. Tartu: Tartu University
Press.
Rosenstone, S.J. and J.M. Hansen. 1993. Mobilization, Participation and Democracy in
America. New York: MacMillan Publishing Company.
237
L O C A L R E P R E S E N T A T I O N
Rotariu, T., et al. 2000. Metode Statistice Aplicate in Stiintele Sociale (Applied Statistical
Methods for the Social Sciences). Iasi: Polirom.
Sandu, D. 2003. Ambivalence of cumulative social capital: How people link to public
services. Paper presented at conference: Social capital in the Balkans: The missing
link? Cluj-Napoca.
Soós, G., G. Tóka, and G. Wright. 2002. The State of Local Democracy in Central Europe.
Budapest: Local Government and Public Service Reform Initiative, Open Society
Institute–Budapest.
Soós, G. 2003. The social participation of local politicians. Paper presented at the con-
ference: Social capital in the Balkans: The missing link? Cluj-Napoca.
Taras, R. 1995. Consolidating Democracy in Poland. Westview Press.
Uslaner, E. 1999. Democracy and social capital. In: M. Warren (ed.). Democracy and
Trust. Cambridge: Cambridge University Press.
Vasta, E. (ed.). 2000. Citizenship, Community and Democracy. London: Macmillan
Press.
Verba, S., L.K. Schlozman, and H. A. Brady. 1995. Voice and Equality—Civic Voluntar-
ism in American Politics. Cambridge, MA, and London, England: Harvard University
Press.
Warren, M.E. (ed.). 1999a. Democracy and Trust. Cambridge: Cambridge University
Press.
Warren, M.E. 1999b. Civil Society and Good Governance. Unpublished manuscript.
Westholm, A. and R.G. Niemi. 1992. Political institutions and political socialization:
A cross-national study. Comparative Politics 25: 25–41.
Wright, R.E. 1995. Logistic regression. In: L. Grimm, and P. Yarnold. Reading and
Understanding Multivariate Statistics. Washington, DC: American Psychological
Association.
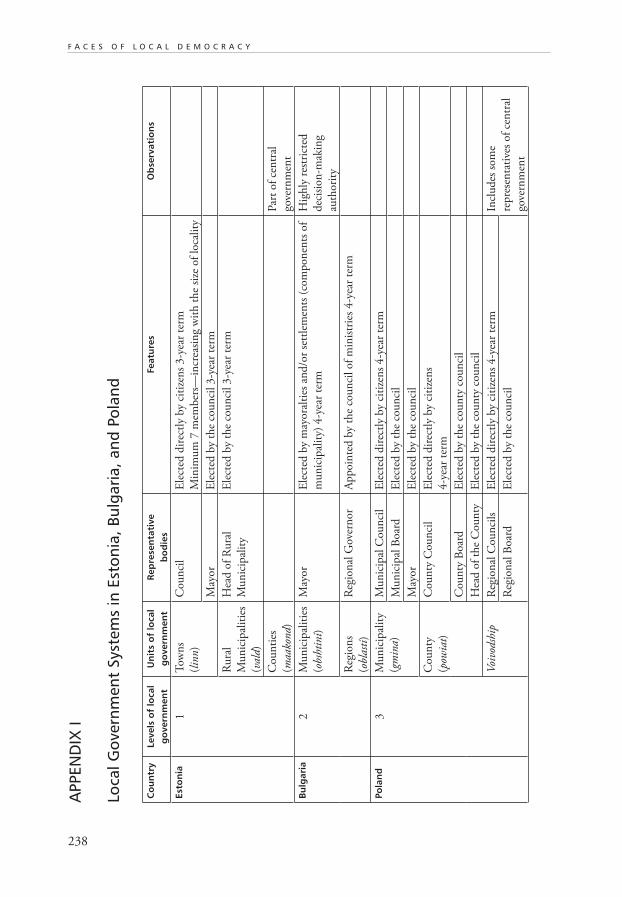
238
F A C E S O F L O C A L D E M O C R A C Y
APP
END
IX I
Loca
l Gov
ernm
ent
Syst
ems
in E
ston
ia, B
ulga
ria,
and
Pol
and
Co
un
try
Leve
ls o
f lo
cal
go
vern
men
tU
nit
s o
f lo
cal
go
vern
men
tR
epre
sen
tati
ve
bo
die
sFe
atu
res
Ob
serv
atio
ns
Esto
nia
1T
ow
ns
(lin
n)
Cou
nci
lE
lect
ed d
irec
tly
by
citi
zen
s 3-y
ear
term
Min
imu
m 7
mem
ber
s—in
crea
sin
g w
ith
th
e si
ze o
f lo
cali
ty
May
or
Ele
cted
by
the
cou
nci
l 3-y
ear
term
Ru
ral
Mu
nic
ipal
itie
s
(val
d)
Hea
d o
f R
ura
l
Mu
nic
ipal
ity
Ele
cted
by
the
cou
nci
l 3-y
ear
term
Cou
nti
es
(maa
kon
d)
Par
t of
cen
tral
gove
rnm
ent
Bu
lgar
ia2
Mu
nic
ipal
itie
s
(obs
hti
ni)
May
or
Ele
cted
by
may
ora
ltie
s an
d/o
r se
ttle
men
ts (
com
pon
ents
of
mu
nic
ipal
ity)
4-y
ear
term
Hig
hly
res
tric
ted
dec
isio
n-m
akin
g
auth
ori
ty
Reg
ion
s
(obl
asti
)
Reg
ion
al G
over
nor
Ap
poin
ted
by
the
cou
nci
l of
min
istr
ies
4-y
ear
term
Pola
nd
3M
un
icip
alit
y
(gm
ina)
Mu
nic
ipal
Cou
nci
lE
lect
ed d
irec
tly
by
citi
zen
s 4-y
ear
term
Mu
nic
ipal
Boar
dE
lect
ed b
y th
e co
un
cil
May
or
Ele
cted
by
the
cou
nci
l
Cou
nty
(pow
iat)
Cou
nty
Cou
nci
lE
lect
ed d
irec
tly
by
citi
zen
s
4-y
ear
term
Cou
nty
Boar
dE
lect
ed b
y th
e co
un
ty c
ou
nci
l
Hea
d o
f th
e C
ou
nty
Ele
cted
by
the
cou
nty
cou
nci
l
Voi
vodsh
ipR
egio
nal
Cou
nci
ls
Ele
cted
dir
ectl
y by
citi
zen
s 4-y
ear
term
Incl
ud
es s
om
e
rep
rese
nta
tive
s of
cen
tral
gove
rnm
ent
Reg
ion
al B
oar
dE
lect
ed b
y th
e co
un
cil
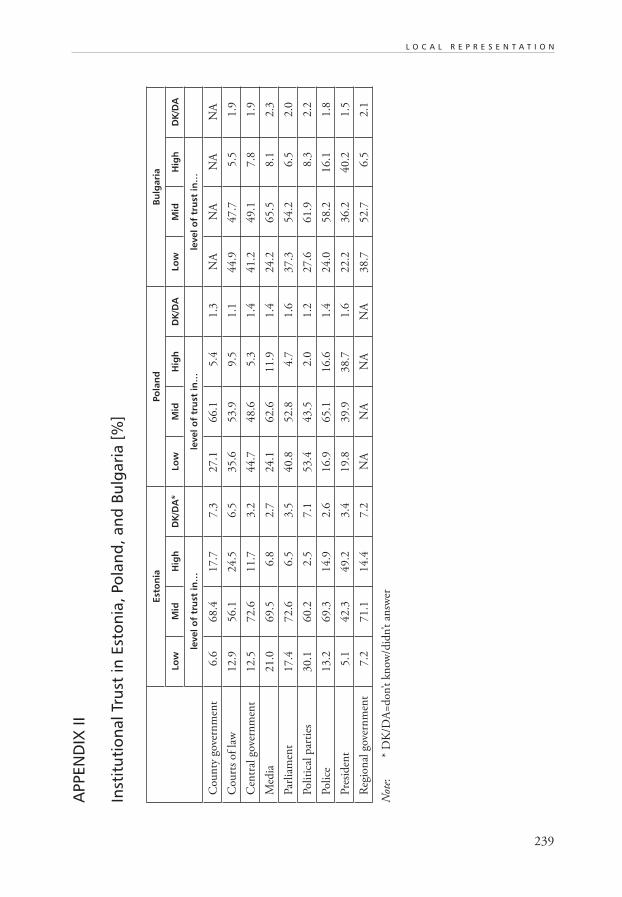
239
L O C A L R E P R E S E N T A T I O N
APP
END
IX II
Inst
itut
iona
l Tru
st in
Est
onia
, Pol
and,
and
Bul
gari
a [%
]
Esto
nia
Pola
nd
Bu
lgar
ia
Low
Mid
Hig
hD
K/D
A*
Low
Mid
Hig
hD
K/D
ALo
wM
idH
igh
DK
/DA
leve
l of
tru
st in
…le
vel o
f tr
ust
in…
leve
l of
tru
st in
…
Cou
nty
gov
ern
men
t6.6
68.4
17.7
7.3
27.1
66.1
5.4
1.3
NA
NA
NA
NA
Cou
rts
of
law
12.9
56.1
24.5
6.5
35.6
53.9
9.5
1.1
44.9
47.7
5.5
1.9
Cen
tral
gov
ern
men
t12.5
72.6
11.7
3.2
44.7
48.6
5.3
1.4
41.2
49.1
7.8
1.9
Med
ia21.0
69.5
6.8
2.7
24.1
62.6
11.9
1.4
24.2
65.5
8.1
2.3
Par
liam
ent
17.4
72.6
6.5
3.5
40.8
52.8
4.7
1.6
37.3
54.2
6.5
2.0
Poli
tica
l p
arti
es30.1
60.2
2.5
7.1
53.4
43.5
2.0
1.2
27.6
61
.98.3
2.2
Poli
ce13.2
69.3
14.9
2.6
16.9
65.1
16.6
1.4
24.0
58.2
16.1
1.8
Pre
sid
ent
5.1
42.3
49.2
3.4
19.8
39.9
38.7
1.6
22.2
36.2
40.2
1.5
Reg
ion
al g
over
nm
ent
7.2
71.1
14.4
7.2
NA
NA
NA
NA
38.7
52.7
6.5
2.1
Not
e:
* D
K/D
A=d
on’
t kn
ow
/did
n’t
answ
er
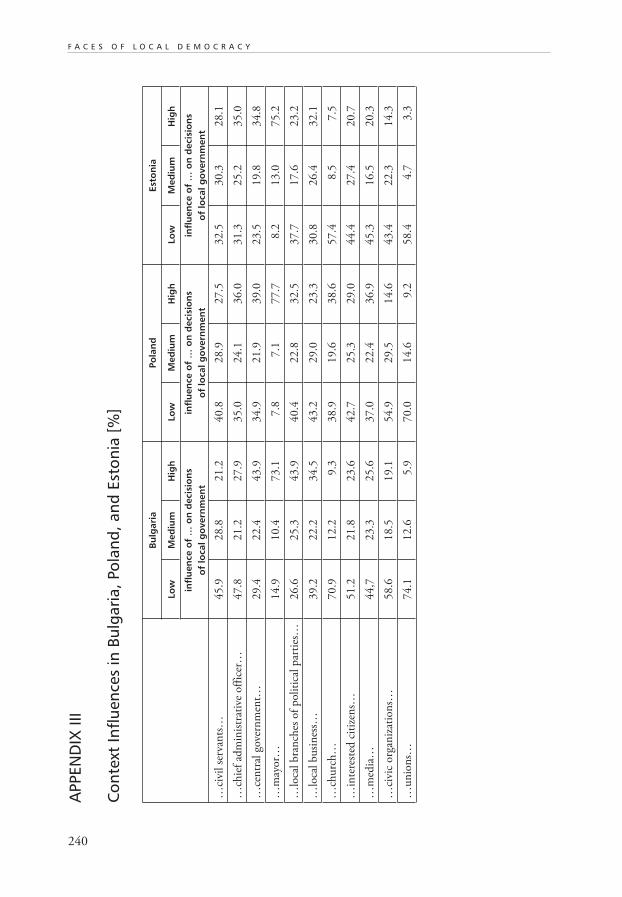
240
F A C E S O F L O C A L D E M O C R A C Y
APP
END
IX II
I
Con
text
Influ
ence
s in
Bul
gari
a, P
olan
d, a
nd E
ston
ia [
%]
Bu
lgar
iaPo
lan
dEs
ton
ia
Low
Med
ium
Hig
hLo
wM
ediu
mH
igh
Low
Med
ium
Hig
h
infl
uen
ce o
f …
on
dec
isio
ns
of
loca
l go
vern
men
tin
flu
ence
of
… o
n d
ecis
ion
so
f lo
cal g
ove
rnm
ent
infl
uen
ce o
f …
on
dec
isio
ns
of
loca
l go
vern
men
t
…ci
vil se
rvan
ts…
45.9
28.8
21.2
40.8
28.9
27.5
32.5
30.3
28.1
…ch
ief
adm
inis
trat
ive
off
icer
…47.8
21.2
27.9
35.0
24.1
36.0
31.3
25.2
35.0
…ce
ntr
al g
over
nm
ent…
29.4
22.4
43.9
34.9
21.9
39.0
23.5
19.8
34.8
…m
ayor…
14.9
10.4
73.1
7.8
7.1
77.7
8.2
13.0
75.2
…lo
cal bra
nch
es o
f p
oli
tica
l p
arti
es…
26.6
25.3
43.9
40.4
22.8
32.5
37.7
17.6
23.2
…lo
cal bu
sin
ess…
39.2
22.2
34.5
43.2
29.0
23.3
30.8
26.4
32.1
…ch
urc
h…
70.9
12.2
9.3
38.9
19.6
38.6
57.4
8.5
7.5
…in
tere
sted
cit
izen
s…51.2
21.8
23.6
42.7
25.3
29.0
44.4
27.4
20.7
…m
edia
…44,7
23.3
25.6
37.0
22.4
36.9
45.3
16.5
20.3
…ci
vic
org
aniz
atio
ns…
58.6
18.5
19.1
54.9
29.5
14.6
43.4
22.3
14.3
…u
nio
ns…
74.1
12.6
5.9
70.0
14.6
9.2
58.4
4.7
3.3
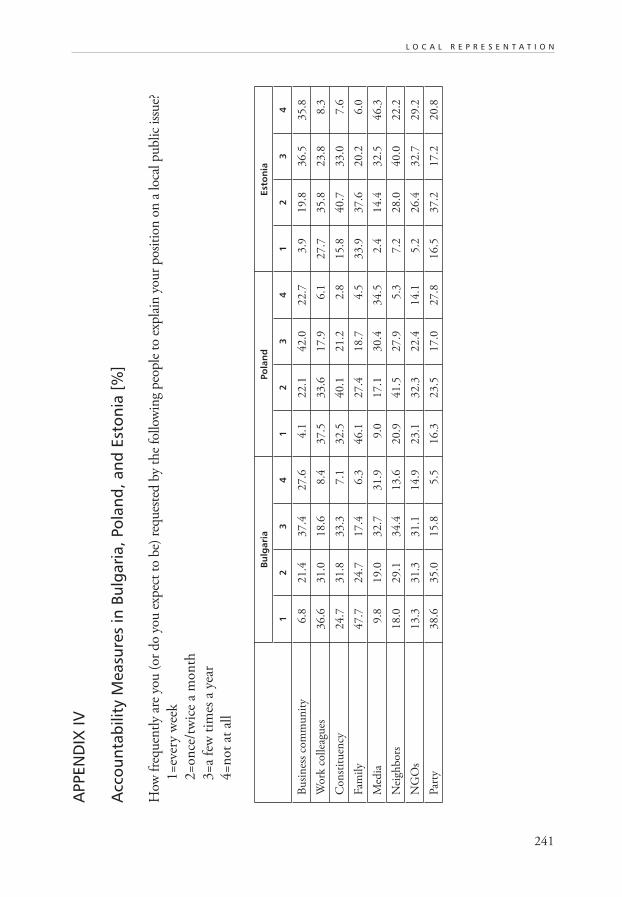
241
L O C A L R E P R E S E N T A T I O N
APP
END
IX IV
Acc
ount
abili
ty M
easu
res
in B
ulga
ria,
Pol
and,
and
Est
onia
[%
]
How
fre
quen
tly
are
you (
or d
o yo
u e
xpec
t to
be)
req
ues
ted b
y th
e fo
llow
ing
peo
ple
to
expla
in y
our
pos
itio
n o
n a
loca
l public
issu
e?
1=ev
ery
wee
k
2=on
ce/t
wic
e a
mon
th
3=a
few
tim
es a
yea
r
4=n
ot
at a
ll
Bu
lgar
iaPo
lan
d
Esto
nia
12
34
12
34
12
34
Bu
sin
ess
com
mu
nit
y6.8
21.4
37.4
27.6
4.1
22.1
42.0
22.7
3.9
19.8
36.5
35.8
Work
collea
gues
36.6
31.0
18.6
8.4
37.5
33.6
17.9
6.1
27.7
35.8
23.8
8.3
Con
stit
uen
cy24.7
31.8
33.3
7.1
32.5
40.1
21.2
2.8
15.8
40.7
33.0
7.6
Fam
ily
47.7
24.7
17.4
6.3
46.1
27.4
18.7
4.5
33.9
37.6
20.2
6.0
Med
ia9.8
19.0
32.7
31.9
9.0
17.1
30.4
34.5
2.4
14.4
32.5
46.3
Nei
ghbors
18.0
29.1
34.4
13.6
20.9
41.5
27.9
5.3
7.2
28.0
40.0
22.2
NG
Os
13.3
31.3
31.1
14.9
23.1
32.3
22.4
14.1
5.2
26.4
32.7
29.2
Par
ty38.6
35.0
15.8
5.5
16.3
23.5
17.0
27.8
16.5
37.2
17.2
20.8
243
Political Parties in Local Governance:
Do Delegates Represent
Local or National Interests?
Filip Franek
ABSTRACT
This chapter examines the role of political parties in local governments in Bulgaria,
Estonia, and Hungary, and asks whether political party members tend to behave more
like “delegates” within their local governments, and independent candidates more as
“trustees.” In Estonia and Hungary these characterizations appear to have merit, while
in Bulgaria the data indicate a tendency that would support such a claim. The main
research question addresses the connection between this concept of delegates and trus-
tees and the councilors’ own declared views on whether they represent local or national
interests. The data from the “Indicators Project” show that local politicians who declare a
preference for solving local problems rather than pursuing national goals vote according
to their own opinions more often. We consider these individuals to be trustees. At the
same time, there was not a significant relationship between political party membership
and local/national goals representation. The chapter also makes some observations about
the differences among the three countries, including a higher number of independent
councilors in Hungary, a greater influence of the central government on local issues in
Bulgaria, and a higher level of public participation in Hungary.
245
Political Parties in Local Governance:
Do Delegates Represent
Local or National Interests?
Filip Franek
1. INTRODUCTION
This chapter deals with local politicians, local political parties, and their function within
local governments in three countries: Bulgaria, Estonia, and Hungary. The research is
intended to contribute to the study of political parties in local government, particularly
the role they play in determining whether local representatives pursue local or national
interests. We will examine whether it is helpful to use the concept of delegate versus
trustee in this particular context. Delegates are generally defined as politicians who
follow the opinions of the groups they represent. They try to find out what their voters
want and then act accordingly. Trustees, on the other hand, act and vote on the basis
of their own view of what is best for their municipality or county as well as the nation
(Burns, Peltason, and Cronin 1989).
Hungary, Bulgaria, and Estonia were chosen for the study as particular representatives
of three geographical units within Central and Eastern Europe: Hungary as one of the
Visegrad countries, Bulgaria representing the South-East of Europe, and Estonia as one
of the Baltic states. Although there are some basic differences in the local governance
of these countries, their general development is rather similar. The main differences
include a higher number of independent councilors in Hungary, a greater influence of
the central government on local issues in Bulgaria, and a higher level of public partici-
pation in Hungary. Comparing these countries can be particularly valuable because of
the differences in their political cultures, the role of central government in local issues,
and the role of political parties in local government. These differences are elaborated
more specifically in section 3.
What the three countries have in common, of course, is their pre-1989 experience
of Soviet-type local governments characterized by a system of local councils that were
actually executive units of the central administration. Professional party organizations
directed every level of public administration; the party committees directed the local
246
F A C E S O F L O C A L D E M O C R A C Y
councils, decisions were made centrally, and finances were distributed in the same way.
Everything was organized hierarchically. After 1989, the post-communist states decided
to follow the path of decentralization, which required a centrally imposed legal and
political framework for the process of rendering local government independent from the
state hierarchy. In countries like Hungary and Poland, there was pressure from below
to promote the emerging local government, while other countries (e.g., Bulgaria) saw
a national policy to implement a local self-government system without actual demand
from the regions (Elander and Gustafsson 1991).
A political party is defined here as a group organized to support certain policies
on matters of public interest. The aim of a political party is to elect officials who will
try to carry out the party’s policies. Public interest issues informing the parties’ policies
may range from peace, war, and taxes, to how people should earn a living or pragmatic
questions such as whether or not to build a new bridge in the village.
In this chapter we will first examine if it is possible to identify political party mem-
bers as delegates and independent candidates as trustees. The data will indicate that
this works only for Estonia and Hungary. As the concepts of trustee and delegate are
measured on the basis of whether the councilors prefer to vote according to their own
views or on the basis of the opinion of their “group of special consideration,” the links
between these variables will be examined as well. The second research question attempts
to determine the distinct markers of the local politicians who can be characterized as
delegates and trustees. We propose that in the case of trustees, a personal history of civic
engagement and embeddedness in the municipality will be found. Delegates, on the
other hand, are expected to be less involved in civic projects and less embedded in the
municipality. The third question addresses the relation between the concept of delegate
and trustee and the councilors’ declared representation of local versus national interests.
Here we seek to identify the characteristics of the councilors who declare a preference
for local rather than national interests. Can differences among them be explained on
the basis of the distinction between delegate and trustee?
At the most general level, we adopt Chandler’s (1998) differentiation between elite
and pluralistic theories for the purposes of our study. We will ask whether delegates can
be described as typical councilors from the perspective of elite theories, which claim
that the community is ruled by a group of influential party leaders, local businessmen,
or civil servants. In the light of elite theory, the expectation is that councilors will nor-
mally vote in accordance with the position of the political party or other group that gave
them the opportunity to become council members. In an analogous way we consider
whether trustees, in their efforts to find out what is best for the community, might
reflect the norms and assumptions of pluralistic theories. A categorical differentiation
would clearly be rather simplistic, which is why such a link has only an indicative value.
Moreover, the results of the research in all three countries indicate that the majority
247
P O L I T I C A L P A R T I E S
of the councilors belong to neither of the two groups, as they decide how to vote on
the basis of the particular situation. The concept is nevertheless given rather extensive
attention due to the expected correlation between the representation of national versus
local interests and the concept of delegates and trustees. It is expected that in at least
one country delegates will declare a preference for the national interest while trustees
will express preference for local interests.
As stated earlier, within the operational terms of the “Indicators Project” delegates
are councilors who vote according to the opinions of their group of special consideration
rather than according to their own views. Trustees, on the other hand, vote according
to their own views.
2. THEORETICAL BACKGROUND
2.1 Normative Standpoints
Some authors (Newton, Dunleavy, and Stoker) suggest that political parties have a
tendency to separate the actual local issues from their local election campaign, which
leads to a lack of accountability at the local level. Political parties present their national
programs and local candidates are supported by national politicians, but local policies
are often left out of the spotlight. The success of a political party at the local level is then
determined by the position of the party at the national level. Such situations promote
the phenomenon of local politicians as delegates, as they find themselves in a position
where the only thing that matters for their political success is their loyalty to the party
secretariat. Later we will suggest, together with Kuroda and Wiatr (1974), that inde-
pendent candidates are more concerned about local issues. However, as Stoker (1991)
would add, that does not necessarily make them more efficient or more beneficial for
the community. Independent candidates’ concern for local issues can be understood
as their primary motive in entering politics. Such candidates are not attracted by the
possibility of furthering their political careers but by the opportunity to solve the issues
they are concerned about.
Be that as it may, the purposes of this chapter are essentially descriptive, not nor-
mative; that is, we do not intend to propose normative criticism of the role of political
parties in local governance. The theoretical debates about this issue, however, necessarily
include some important normative standpoints, such as the debate between protagonists
of localism and their critics. For this reason the following section will present some of
these normative highlights.
248
F A C E S O F L O C A L D E M O C R A C Y
2.2 Local Decision-makers
Wiatr (1974, 261) highlights four contextual spheres which influence local government
decision making:
• The structural characteristics of the political system (to what extent the local
government is autonomous)
• Socio-economic conditions
• Characteristics of the local leadership (the decision-makers themselves)
• The extent and type of public participation in decision-making.
The third sphere—the characteristics of local leaders, especially in the context of
their party membership or non-membership—is the one most relevant to the analysis
in this chapter. The first issue to be addressed is the motivation of local agents for their
involvement in local politics. Our initial assumption is that some candidates get in-
volved in local politics because of their concern with local issues, while others see local
politics as a good start for their future political career. Their concern is to get political
experience and recognition that will help them get involved in national politics. An
intuitive example of the reasonableness of this expectation is the fact that successful
ex-mayors of big cities are usually unbeatable candidates in majority vote elections (e.g.,
Czech Senate elections). It would be tempting to assume that the first group is mostly
represented by independent candidates and the second one by political party members,
but this is not necessarily the case. Also, it is important to stress that this distinction
does not imply that either independent or political party agents will be better or more
efficient actors in local politics.
The second question concerns how local leaders actually make their decisions.
Chandler (1998, 251) proposes two ways of answering this question. The first is in
line with elite theory and asserts that local government bodies are controlled by small
groups of political party chairs who are closely connected with local business circles
and/or important civil servants. The second is based on pluralistic theories and claims
that the elite persons who seem to make the final authoritative decisions are forced—if
they want to maintain their power—to acknowledge the requests of the larger groups
that express the majority opinion in their respective communities. At the end of the
day, the voters will judge them in elections on the basis of their perceived contribution
to the welfare of the county.
Chandler’s interpretation of elite and pluralistic theories at the level of local gov-
ernment is based on his observation that the construction of local politics in Europe
is—even in the smallest communities—influenced by political parties. In discussing some
European countries, he concludes that their local councils are not ruled by independent
local councilors but by certain political majorities. On the other hand, Kuroda (1974)
presents a more “localist” approach and proposes a participatory model where the idea
of local government springs from the explicit desire of the people to manage their local
249
P O L I T I C A L P A R T I E S
affairs. Kuroda claims that “citizens and residents of a community are interested in build-
ing self-governing bodies in the hope of improving the quality of their lives” (1974, 117).
In illustrating this kind of interest, Kuroda mentions such diverse goals as the attraction
of new industries or the conservation of the natural beauty of the community.
Both Kuroda’s participatory model and Chandler’s pluralistic theory stress the im-
portance of public participation in local decision-making. They assume that people can
actually make a difference and have a solid way of influencing local politics; they also
suppose that citizens are interested in doing so. This research, however, is not intent on
exploring the relations between civic participation and decision-making in detail. Instead
it will look at the possible influence that previous, civic involvement of the councilors
can have on their decision-making.
2.3 Criticism of Political Parties in Local Government
Stoker’s book, The Politics of Local Government (1991), based on an analysis of local
government in the UK, opposes Kuroda’s localist ideas. Stoker sees local government as
a focus for the broader conflicts between political parties, as well as an arena for political
competition between business groups, trade unions, community action groups, ethnic
minorities, etc. He describes the politicization of locally elected local governments
through their opposition to the administration, as a consequence of growing party control
over local authorities. “It is now almost universal practice for councilors of the same
political party on an authority to organize themselves into a political group which meets
to pre-determine the line to be taken on matters coming before the council,” contends
Stoker (1991, 39). He goes on to stress the importance of values like group discipline,
cohesion, and solidarity, which in his view are central to political party members. This can
be supported by the observation that 92% of the Conservative and 99% of the Labour
groups, when in power, vote together. Moreover, the argument goes, the organization
of local authorities is based on party lines and, crucially, such politicization also entails
the management and the strengthening of the parties and party organizations within the
local government. This view, based on the situation in the UK, might be supported by
the experience in several Central European countries where, in spite of a great number
of independent councilors, most counties are controlled by coalitions composed of the
same parties that cooperate at the national level.
This tendency is particularly interesting against the background of what Malikova
(1995) describes as the “unclear political orientation of campaigns at the town and vil-
lage or county level.” She claims that attempts to explain local politics in Central and
Eastern Europe by a left-right differentiation lead only to confusion. “In the municipal
elections the orientation prevailed more toward the solution of the real problems of towns
and villages. Candidates tried hard to convince voters of their professional competency,”
250
F A C E S O F L O C A L D E M O C R A C Y
concludes Malikova (1995, 17). The question of why local alliances, which are primarily
concerned with solving local issues, follow the same pattern of party cooperation as the
party secretariats on the national level thus remains open.
As pointed out earlier, Chandler discusses the same phenomenon (local councils
being controlled by party majorities), but he presents it in a rather localist light while
describing pluralist theories: citizens can pressure their representatives by threatening
not to elect them again. Chandler and Malikova both presuppose that local elections
are decided on the basis of local political performance, local campaigns, and local issues.
Stoker, on the other hand, claims that local elections are determined by national issues.
Newton’s research (in Stoker, 1991, 52) on local elections in Birmingham between 1945
and 1965 shows that local factors have a relatively insignificant impact on local election
results. Stoker concludes by saying that a determined localist could argue that national
party allegiances are structured in part by the performance of the parties at the local
level; however, he implies that such consideration can be neglected.
The broadly accepted journalistic approach seems to follow Stoker’s rather than
Chandler’s conception. Recent local elections in Spain were interpreted as a victory
of Prime Minister Aznar because his party managed to keep power in most counties.
The implication is that the people in Andalusia, for example, were actually voting for
Aznar and not for the local representatives that they thought were most fit to deal with
Andalusia’s affairs. Similar stories are often heard throughout Europe and seem to sup-
port Stoker’s conclusions.
Magnusson and Sancton (1983) list some further arguments against the involve-
ment of political parties at the local level, which have a long history and include the
following:
• Most local issues are “administrative” rather than “political” in character;
• There is no point in having local issues entangled with acrimonious political
party debates that have no inherent connection to them;
• The presence of parties would result in favoritism in the awarding of contracts
and the provision of services.
2.4 Supporting Arguments for Political Parties in Local Government
Apart from the above criticisms of the dark side of political parties in local government,
Stoker (1991, 49) argues (quoting the “Widdicombe Report”) that party politics in local
government are both inevitable and desirable because they offer the organizational basis
through which citizens can achieve self-government and the services they want without
direct participation. Political parties, according to him, also enable straightforward ac-
countability. Magnusson and Sancton (1983) add the further argument that political
251
P O L I T I C A L P A R T I E S
parties bring a certain continuity to local politics, stimulate interest in it, and provide
a good training ground for party activists.
Goldsmith and Rose (2000) claim that, especially in larger constituencies, there
is not much difference between local and national politicians. The authors argue that
both are in search of power and prestige. This claim can be taken as an extension of the
point made by Magnusson and Sancton, that political parties bring continuity to local
politics as well as people who are interested in furthering their political careers.
Another proponent of having classical political parties involved at the local level
is Martin Saiz (1999). He claims that local political parties should be understood as
“Janus-faced,” or double-faced, in that they are components of national organizations,
on the one hand, and specific actors in community politics, on the other. This claim
would also be supported by Coulson (1995), who focuses on the establishment of local
democracy in Eastern Europe. According to Coulson, the development of local agents
is a minimum condition for the emergence of local autonomy, and the natural groups
of such agents are local governments or the regional branches of political parties. Chap-
man and Malikova (1995) strengthen this view by saying that at least on the local level
voters are more interested in personalities than in parties. Writing about Slovakia in the
mid-nineties, they argue that “unstable groups have formed around personalities rather
than on the basis of platforms or socio-economic cleavages” (1995, 65).
This theoretical section has addressed the role of political parties in local govern-
ance and attempted to examine its critics as well as its defenders. Critics of political
parties in local government argue that political parties shift the attention far from local
issues and cause local elections to be decided on the basis of the national policies of
their respective parties; that they “politicize” local administrative issues; and that their
involvement may result in favoritism when it comes to contracts and provision of
services. The defenders argue that political parties provide the necessary organizational
framework of self-government; they allow for straightforward accountability as well
as continuity in local politics; and they also create opportunities for the develop-
ment of local politicians. The main link between the criticism of political parties in local
government and Chandler’s elite theories would be the danger of favoritism, while the
clearest link between the defense of political parties and Chandler’s theory of pluralism
is the accountability argument.
As this research will focus on identifying delegates and trustees among the coun-
cilors, we propose that it is possible to link these concepts (delegate and trustee) to the
theories (elite theories and pluralistic theories). Delegates can be seen as councilors
presented in the elite theories. They give more consideration to their party or other
group of special consideration, they have to be constantly accountable to the party
or other group of special consideration, and they tend to vote in accordance with the
positions of those parties or groups. Trustees are more in line with pluralistic theories.
They see themselves as the people’s representatives, who have a mandate to follow their
252
F A C E S O F L O C A L D E M O C R A C Y
own opinion on what is the best for the constituency. That is why they tend to be more
independent from the party.
2.5 What Goes on Inside Local Governments?
Political parties are, however, not the sole agents of local governance. In attempting to
understand the real functioning of local governments, Stoker stresses the importance
of examining the internal politics of local authorities. He tries to inquire “what goes on
inside towns, boroughs, and county halls...” (1991, 89). As a way of getting at this ques-
tion he presents the following six models of how local governments might operate:
1. The “joint elite” of senior officers and councilors. What happens according to this
model is that the party chairs make the group accept decisions made by them-
selves and leading civil servants. However, Stoker claims that in Britain, lately,
the opposite is more common: the political group instructs the civil officers
what to do. This model was probably in some sense applicable in Central and
Eastern Europe in the early ‘90s, when the newly elected representatives relied
on the experience of the pre-1989 officials.
2. The ruling party group and party caucuses. This model is particularly important
when the party is set on implementing its manifesto. The inner structure of
decision-making within a political group can vary from the domination of an
inner circle of senior members perhaps influenced by various interest groups,
to giving the right to vote to all local party members, even to those who are
not councilors. The main point is that the decision of the party is binding for
all the councilors nominated by the respective party.
3. Councilors as ward representatives. This category seems to represent an ideal type
of the councilor-as-trustee. The councilors enhance local loyalties; they may have
a history of activism in the community or at least in some single-issue cases;
they have good contact with the voters and know how to handle local issues;
moreover, they reintroduce an area dimension into policymaking. Stoker claims
that, given some favorable circumstances, the ward councilors can be effective
in pursuing their goals. However, he admits that the ward representatives are
usually not involved in the policymaking process and thus cannot influence
the major decisions affecting their wards. It can be argued that potential efforts
of majority party councilors to represent the interests of their wards end up
unfulfilled because of the pressure to follow the party line. At the same time,
the demands of minority party councilors can easily be neglected.
4. Interdepartmental conflicts. This model studies the intraorganizational politics of
local authorities and is interested, for example, in the issue of professionalization
of local government services.
253
P O L I T I C A L P A R T I E S
5. Intradepartmental relations. The real influence in local government in this model
is not based on a formal authority or hierarchy but rather on ideas, innovation,
and solutions. That is why even junior officials can be actual motors of policy-
making.
6. Interparty deals. Not many counties are ruled by only one party. The same kind of
deal-making that takes place at the national level of politics can be found here.
As this research is concerned with the influence of political parties on local govern-
ment and not on the role of civil servants or other agents, it will examine two scenarios
based on this typology. The first one proposes that all political party members and
those who were nominated by a political party can be identified as delegates. From this
perspective only independent candidates can be identified as trustees. This assumption
is based on Stoker’s second model (the ruling party group and party caucuses). In this
model it is the political party that formulates the policy, and when it makes its decision
the party requires everyone to vote in accordance with it.
The second scenario considers the situation of a ward representative who is at the
same time a member of a political party and a political group within the municipal
council. In this case it is possible to be a political party member and to perceive oneself
as a trustee who is aware of the interests of the constituents in the ward and makes inde-
pendent decisions in their interest. This ward representative, it can be claimed, would be
more embedded in the municipality and would have a history of civic engagement.
2.6 Tensions between Local and National Governments
Malikova (1995) claims that, on the most general level, a fundamental difference between
local and central politics is the nature of the power that is available to local and national
politicians. She argues that to attain political authority local elites are not required to
have the same political capabilities as professional politicians who work in central gov-
ernment. “The specific professional ability of local politicians must include in-depth
knowledge of local problems and the ability to work out local policies that will attract
citizens to cooperative decision making about public affairs” (1995, 7–8). The power
of local elites is characterized by the uniqueness of local problems. Local authorities
are confronted with the citizens’ immediate problems and they have the advantage of
having personal influence on the formation of local public opinion. Local representa-
tives thus have a natural tendency towards independence in dealing with local issues.
However, critics of localism point to the illusory nature of the claim that local power is
independent from the center. They assert that local political power is always subordinate
to the central government. That is why they consider the calls for local autonomy and
independence to be based on political illusion.
254
F A C E S O F L O C A L D E M O C R A C Y
Elander and Gustafsson (1991) as well as Vajdova (1995) argue that tensions be-
tween central and local government were present in Central and Eastern Europe in the
early 1990s because of the legacy of the Soviet model of local government. As was said
earlier, the Soviet model was based on party control of local councils which were not
self-governing bodies but executive units of state administration. The tension between
central and local government was in some cases related to the pressure from below to
promote the emerging local self-government system on the one side and the national
policy of implementing national democracy and a market-oriented economy on the
other. In other countries, however, self-government was implemented as part of the
national policy without any popular demand for such an arrangement.
The period of transition was characterized by political decisions aimed at the
establishment “of a renewed governance function of municipalities” (Malikova, 1995).
The law established autonomous local units as legal bodies with independent budgets,
property and sources of income. However, as Elander and Gustafsson (1991) point
out, in some countries there is still a struggle between the center and the local govern-
ment due to the latter’s financial dependence on the center, caused by the fact that the
multidimensionality of local budgets (in which the center is not the only determinant)
is not yet fully operating. Sopoci (1995) offers a specific example of this general strug-
gle between central and local government during the transition period in Slovakia. He
describes the formation of the Association of Towns and Villages of Slovakia (ZMOS)
and a later clash between them and the center. “In fact, the representatives of the state
and the deputies of Slovak towns and communities turned out to be bearers of polar-
opposite interests and proponents of diametrically differing conceptions of how to build
public administration in Slovakia—one of them highly center-oriented, and the other
committed to decentralization and the devolution of power” (1995, 27). With this
example in mind, it can be expected that local politicians, both delegates and trustees,
will prefer to represent local rather than national interests.
These tensions seem to have become a thing of the past, and the “national world
of local government” (Rhodes 1991, 9) is now operating in most Central and Eastern
European countries. According to this concept local government represents an institu-
tionalization of local interests and constitutes an arena for negotiations with the central
state, while from the perspective of the central state it plays an integrative role in the
sense of involving citizens.
3. LOCAL GOVERNMENT IN BULGARIA, ESTONIA, AND HUNGARY
This research is not concerned with the general state of local governance in Central and
Eastern Europe, but focuses on the role of political parties in local government. Moreover,
it addresses a very specific issue related to their role—do they tend to turn their members
255
P O L I T I C A L P A R T I E S
into party trustees? As our analysis is based on data from the three selected countries, it
can be expected that the results will differ among the countries. The aim of this section is
to point out some important structural differences in the roles of the political parties in
those countries that might explain the different results. Some studies (Baldersheim 1996,
Bennett 1997) claim that political parties in local governance in Central and Eastern
Europe are crystallized and clearly differentiated, since they relatively consistently and
effectively represent the interests of distinct groups of citizens. We can assume that due
to the territorial as well as historical specificities of Bulgaria, Estonia, and Hungary, their
political parties and also political cultures will function according to different patterns.
For this reason the research will not focus on differences between individual parties but
will instead attempt to find general tendencies within the countries.
Bennett (1997) presents an interesting historical argument according to which some
differences among the post-communist countries can be explained on the basis of their pre-
1989 situation. He claims that countries with more liberal Communist Party regimes (such
as Hungary) had already developed an increased level of local autonomy in the 1980s, unlike
countries with a more conservative Communist Party rule (such as Bulgaria or the Czech
Republic). This would mean that Hungary has a longer tradition of decentralization and local
governance. At the same time, the new political parties were introduced only after 1989, so
it is hard to argue that Hungary has a longer history of free public engagement.
Some authors (Kandeva 2001, Ieda 2000) characterize the Bulgarian local govern-
ment as highly politicized. The central government plays a rather important role in local
politics in that country because of the role of national parties and of governors who
are appointed by the Council of Ministers. The local election system combines pro-
portional and majority systems—proportional for councilors and majority for mayors.
As mentioned earlier, the national parties are dominant in local governments and they
tend to form the same coalitions that operate at the national level. According to Ieda
(2000), in the 1999 elections and in the previous one the coalitions were the United
Democratic Forces and the Democratic Left.
Ieda (2000) also claims that in Hungary, unlike in Bulgaria, the national political par-
ties have little influence in the local politics of the villages because most of the councilors
are independent of political parties. He states that up to 82.9% of local council members
in Hungarian villages were independent in the early 1990s. This can be supported by
the findings of Soós and Kálmán (2002), which show that the role of political parties
in Hungary depends on the size of the municipality. Soós and Kálmán argue that local
party branches are more active in cities, while their organization in smaller communities
is weak. “Parties in smaller municipalities tend to be brand names and frameworks for
electoral campaigns rather than forums for political debate and interest aggregation”
(Soós and Kálmán 2002). The autonomy of the local political party branches depends
more on the organizational history of each party than on their political program and
orientation. According to Horváth (2000), in Hungary there is a tradition of public
256
F A C E S O F L O C A L D E M O C R A C Y
participation in the decision-making process. Direct methods include local referendum,
public initiative, and public hearing. Citizens may also participate in local decision-
making through membership in committees of the representative bodies.
Local political party branches play an important role in choosing the candidates
in Estonia, and the candidates must comply with the political program of the party.
Minorities also play an important role, especially in the cities. Horváth (2000) claims
that although the Local Self-government Foundation Act states that forms of direct
democracy can include meetings and referendums, these arrangements have not been
extensively used. Moreover, on the few occasions when they were used in issues related
to territorial division, only a very small number of citizens took part in them.
In the three countries, the political culture and the legislation concerning local gov-
ernance are generally quite similar. But there are three areas of differences related to the
role of political parties in local governance. First, the number of independent candidates
seems to be high in Hungary and low in Bulgaria, with Estonia falling in the middle in
this respect. Second, it appears that the central government has a greater influence in
Bulgaria than in the remaining two countries. Third, the level of public participation
in Hungary is probably higher than in both Estonia and Bulgaria.
4. METHODOLOGY
The analysis section will focus on the relationship between the concept of delegates and
trustees on the one hand and the declared preference for national versus local interests
on the other. We also examine whether party members can be identified as delegates
and independent councilors as trustees. The descriptive statistics already show that there
are major differences in key variables among the countries under study. These include
party membership of the councilors (274, MEMBPART), frequency of explaining their
position to their fellow party members (162, ACCPARTY), relevance ascribed to various
groups of special consideration (169, RPRPARTY), embeddedness in the municipal-
ity (293, TIMEMUNI), and ascribed preference of local versus national interests (98,
LOCALISM). These basic differences among the three countries will be interpreted on
the basis of the relevant literature mentioned in the theoretical section. Following these
descriptions, the analysis will focus on answering three main research questions:
1. Is it possible to identify councilors who are political party members and/or who
were nominated by a political party as delegates and independent candidates as
trustees?
2. What are the distinct markers of those local politicians who are characterized
as trustees or delegates?
257
P O L I T I C A L P A R T I E S
3. Are the councilors who declare their preference for national rather than local
interests political party members? Is it possible to explain a preference for national
over local interests on the basis of the concept of delegates and trustees?
Question 1
The “Indicators Project” identifies delegates as councilors who vote in accordance with
the position of their groups of special consideration. Trustees, on the other hand, vote
according to their own opinion (175, TRUSTEE). This research question examines
whether it is possible to identify councilors who are political party members (274,
MEMBPART), and/or who were nominated by a political party (206,207, NOMPARTI)
as delegates. Apart from correlations between these variables, multivariate analysis will
be involved and the following variables will be given special attention:
• Special consideration: citizens (166, RPRVOTER)
• Special consideration: municipal area (168, RPRAREA)
• Special consideration: party (169, RPRPARTY)
• Special consideration: certain occupational groups (170, RPROCCGR)
• Special consideration: all inhabitants (168, RPRALL)
• Special consideration: ethnic groups (171, RPRETH)
• Special consideration: central government (172, RPRGOV)
• Frequency of explanation: party members (162, ACCPARTY)
• Frequency of explanation: own constituency (165, ACCCONST)
• Vote with majority (281, MAJMIN)
Question 2
This research question undertakes to explain “what causes a trustee to be a trustee” and
“what causes a delegate to be a delegate.” This part of the research proposes that trustees
will have a verifiable history of civic engagement (measured on the basis of declared
organization or participation in demonstrations and petitions) and of embeddedness in
the municipality. The delegates, on the other hand, are expected to be less involved in
civic projects and less embedded in the municipality. At this stage we will also examine
whether NGO membership or nomination by an NGO to public office have an influ-
ence on how the councilor votes.
Question 3
This primarily examines the relation between political party membership (274, MEM-
BPART) and position on the scale measuring the ascribed priority of national versus
local goals (98, LOCALISM). The latter variable will also be tested with the concept of
delegate/trustee (175, TRUSTEE). The analyses will also examine interfering variables
and the relevance of the following variables:
• Central government as a group of special consideration (172, RPRGOV)
• The level of trust in the central government (138, PTRGOV)
258
F A C E S O F L O C A L D E M O C R A C Y
4.1 Working Hypotheses
Question 1
H1: Political partly members (274, MEMBPART) will vote as delegates (175, TRUS-
TEE) while independent candidates will behave as trustees.
This hypothesis proposes that political party members and those who were nomi-
nated by a political party can be identified as delegates. From this perspective, only
independent candidates can be identified as trustees. This assumption is based on Stoker’s
second model (the ruling party group and party caucuses). It is the political party that
formulates the policy, and when it makes its decision the party requires everyone to
vote in accordance with it.
Question 2
H2: Trustees (175, TRUSTEE) and independent candidates (274, MEMBPART) have a
proven history of civic engagement, measured on the basis of the following variables:
• They are more likely to have a membership in an NGO (244, NGOMEMB)
• They will more often participate in demonstrations (283, ACTDEMO)
• They will more often sign petitions (284, ACTPETI)
• They will more often organize these (285, ACTORGA)
This hypothesis is based on Stoker’s model of ward representatives, characterized
as councilors who are aware of the interests of their wards and make independent deci-
sions in their interests.
Question 3
H3: Trustees (175, TRUSTEE) and independent candidates (274, MEMBPART) will
ascribe priority to solving local problems (98, LOCALISM).
This hypothesis is based on the earlier discussion of Malikova’s text in section 2.3
on tensions between local and national governments.
5. ANALYSIS
5.1 Political Parties and Descriptive Statistics
The data show an important difference in the frequency of councilors holding a political
party membership among the three countries in our study. There is also a major differ-
ence in the number of councilors who were nominated by a political party in the last
elections, which leads us to consider that the role of political parties in local governance
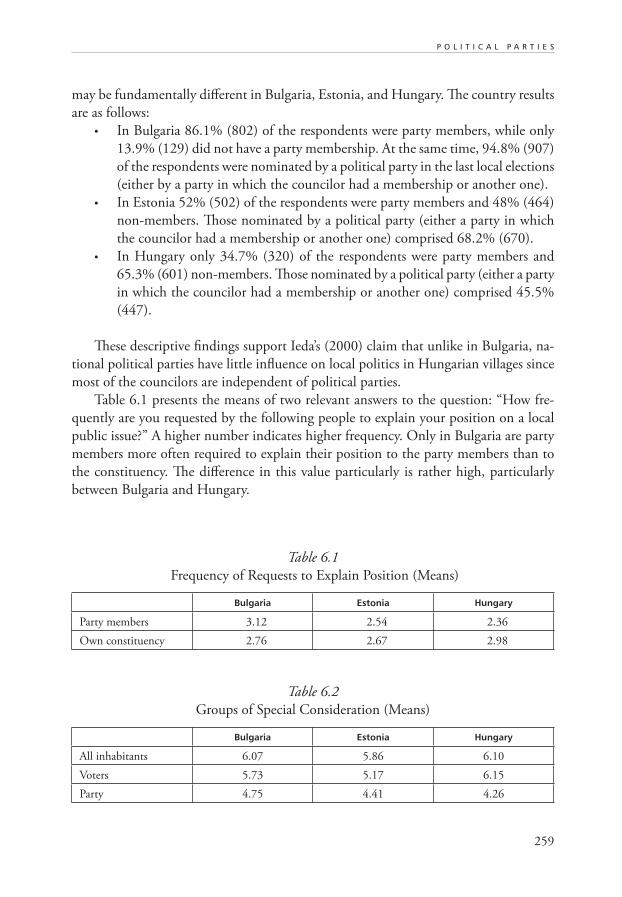
259
P O L I T I C A L P A R T I E S
may be fundamentally different in Bulgaria, Estonia, and Hungary. The country results
are as follows:
• In Bulgaria 86.1% (802) of the respondents were party members, while only
13.9% (129) did not have a party membership. At the same time, 94.8% (907)
of the respondents were nominated by a political party in the last local elections
(either by a party in which the councilor had a membership or another one).
• In Estonia 52% (502) of the respondents were party members and 48% (464)
non-members. Those nominated by a political party (either a party in which
the councilor had a membership or another one) comprised 68.2% (670).
• In Hungary only 34.7% (320) of the respondents were party members and
65.3% (601) non-members. Those nominated by a political party (either a party
in which the councilor had a membership or another one) comprised 45.5%
(447).
These descriptive findings support Ieda’s (2000) claim that unlike in Bulgaria, na-
tional political parties have little influence on local politics in Hungarian villages since
most of the councilors are independent of political parties.
Table 6.1 presents the means of two relevant answers to the question: “How fre-
quently are you requested by the following people to explain your position on a local
public issue?” A higher number indicates higher frequency. Only in Bulgaria are party
members more often required to explain their position to the party members than to
the constituency. The difference in this value particularly is rather high, particularly
between Bulgaria and Hungary.
Table 6.1
Frequency of Requests to Explain Position (Means)
Bulgaria Estonia Hungary
Party members 3.12 2.54 2.36
Own constituency 2.76 2.67 2.98
Table 6.2
Groups of Special Consideration (Means)
Bulgaria Estonia Hungary
All inhabitants 6.07 5.86 6.10
Voters 5.73 5.17 6.15
Party 4.75 4.41 4.26
260
F A C E S O F L O C A L D E M O C R A C Y
Table 6.2 shows the means of declared special consideration given by councilors
to different groups of people. It is interesting to note that the political party has in
general a much lower value than all inhabitants of the municipality as well as voters.
The value is lowest in Hungary and highest in Bulgaria. It is also worth noticing that
voters are seen as a more important group of special consideration than all inhabitants
only in Hungary.
For the purpose of identifying delegates and trustees, the respondents were asked
the following question: “Sometimes there may be a conflict between what you yourself
believe is a correct decision for your municipality and the opinion among groups of
people for whom you have special consideration. In such instances, do you usually fol-
low your own opinion or the opinion of the groups of people?” The question measured
their declared independence, as they had to say if they usually follow their own opinion,
the opinion of the groups of people, or if it differs depending on the situation. The
results are as follows:
• In Bulgaria 23.3% of respondents answered that they vote according to their
own opinion, 13.3% follow the opinion of the groups of people, and for 63.4%
it depends on the situation.
• In Estonia 17.6% said they vote according to their own opinion, 9.1% usually
follow the opinion of the groups of people, and 73.3% claim that it depends
on the situation.
• In Hungary 18.2% declared that vote according to their own opinion, 10.4%
follow the opinion of the groups of people, and 71.4% said that it depends on
the situation.
These data indicate that a higher number of councilors claims to follow their own
opinion in Bulgaria than in the two other countries, but also a higher number claims
to follow the opinion of the groups of people. Respondents in Hungary and Estonia
tend to decide on the basis of a particular situation more often. The data also show
remarkably similar percentages between Hungary and Estonia.
When it comes to the issue of embeddedness in the municipality, the lower mean
value shows a longer period of time that the respondents lived in the locality. The means
are 1.31 for Bulgaria, 1.17 for Estonia, and 1.44 for Hungary. This would lead to the
conclusion that councilors in Hungary live for a shorter time in their municipality than
in the other two countries, but the data generally indicate very high levels of embed-
dedness. This means that most of the councilors live either their entire lives or for a very
long period of time in the municipalities they represent.
Another important variable (LOCALISM) measures the declared position on a
seven-point scale between the following statements: “Achieving national goals must
always take priority over solving local problems” versus “Solving local problems must
always take priority over achieving national goals.” The cumulative percentages indicat-
261
P O L I T I C A L P A R T I E S
ing preference of national goals to local problems show a significant difference among
the respective countries. In Bulgaria 48.2% of respondents declare national goals to be
the priority, compared to 19.1% in Estonia and 13.3% in Hungary. These data strongly
resonate with the theoretical claim by Kandeva (2001) and Ieda (2000) that there is
a higher influence of the central government in Bulgaria than in the remaining two
countries. It seems that in Bulgaria there is not only stronger influence of the central
government on the local one but the local representatives also acknowledge the priority
of the national goals.
5.2 Can Political Party Members Be Identified as Delegates?
This section will present the answer to the first working hypothesis separately for each
country. After this overview we will learn if it is possible to identify political party mem-
bers as delegates and independent candidates as trustees on the basis of the available
data. Cramer’s V is usually used as the correlation coefficient between an ordinal and
a nominal variable, while Pearson’s coefficient is used between two ordinal variables.
Asresid (adjusted residual) is indicated in cases where it is higher than 1.5 and there
is not a high enough correlation or the correlation is not significant. Unless otherwise
indicated, the significance of the correlation is 99%.
Bulgaria
Political party members in Bulgaria give special consideration to their party as they are
more often asked by their party to give explanations, but it cannot be said that they vote
according to the opinion of the party or other groups of people rather that according
to their own view. It is not possible to identify political party members as delegates.
At the same time, it is not possible to identify independent candidates as trustees. This
situation can be partly explained by the fact that almost all councilors in Bulgaria were
nominated to their function by a political party. More detailed analysis shows that:
• Members of political parties in Bulgaria are more often asked to explain their
position to fellow party members (Cramer’s V=0.451). In the case of those who
were nominated by the party as members, Cramer’s V=0.396. In the case of
those who were nominated by another party, Cramer’s V=0.326.
• Members of political parties in Bulgaria list their political party as a more im-
portant group of special consideration (Cramer’s V=0.285). In the case of those
who were nominated by a party as members Cramer’s V=0.282. In the case of
those who were nominated by another party Cramer’s V=0.205.
• Members of political parties in Bulgaria more often do not follow the opinions
of groups of special consideration. There is not a significant correlation, but the
asresid=1.5. (In the case of those who were nominated by a party as members
other party, asresid=2.4.)
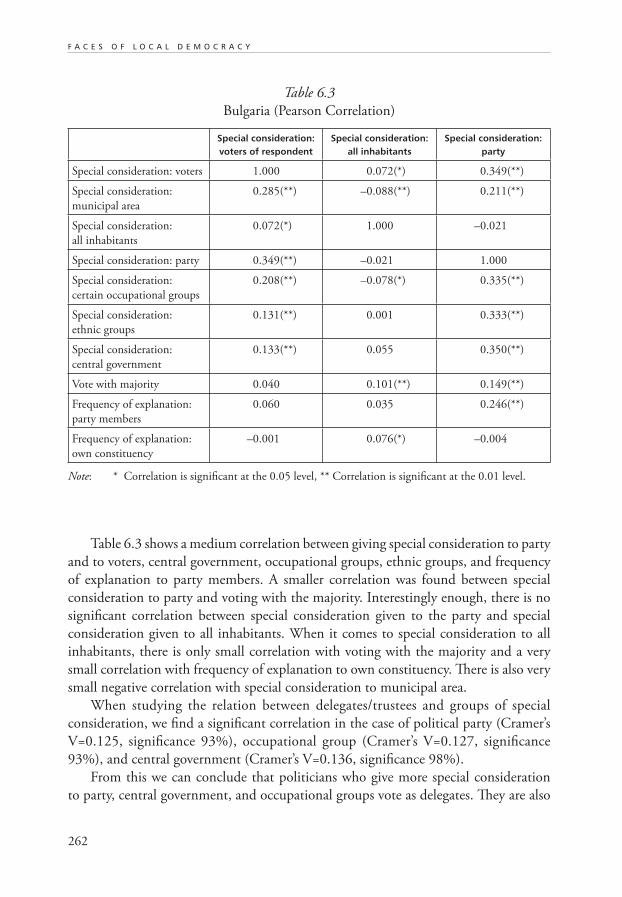
262
F A C E S O F L O C A L D E M O C R A C Y
Table 6.3 shows a medium correlation between giving special consideration to party
and to voters, central government, occupational groups, ethnic groups, and frequency
of explanation to party members. A smaller correlation was found between special
consideration to party and voting with the majority. Interestingly enough, there is no
significant correlation between special consideration given to the party and special
consideration given to all inhabitants. When it comes to special consideration to all
inhabitants, there is only small correlation with voting with the majority and a very
small correlation with frequency of explanation to own constituency. There is also very
small negative correlation with special consideration to municipal area.
When studying the relation between delegates/trustees and groups of special
consideration, we find a significant correlation in the case of political party (Cramer’s
V=0.125, significance 93%), occupational group (Cramer’s V=0.127, significance
93%), and central government (Cramer’s V=0.136, significance 98%).
From this we can conclude that politicians who give more special consideration
to party, central government, and occupational groups vote as delegates. They are also
Table 6.3
Bulgaria (Pearson Correlation)
Special consideration: voters of respondent
Special consideration: all inhabitants
Special consideration: party
Special consideration: voters 1.000 0.072(*) 0.349(**)
Special consideration:
municipal area
0.285(**) –0.088(**) 0.211(**)
Special consideration:
all inhabitants
0.072(*) 1.000 –0.021
Special consideration: party 0.349(**) –0.021 1.000
Special consideration:
certain occupational groups
0.208(**) –0.078(*) 0.335(**)
Special consideration:
ethnic groups
0.131(**) 0.001 0.333(**)
Special consideration:
central government
0.133(**) 0.055 0.350(**)
Vote with majority 0.040 0.101(**) 0.149(**)
Frequency of explanation:
party members
0.060 0.035 0.246(**)
Frequency of explanation:
own constituency
–0.001 0.076(*) –0.004
Note: * Correlation is significant at the 0.05 level, ** Correlation is significant at the 0.01 level.
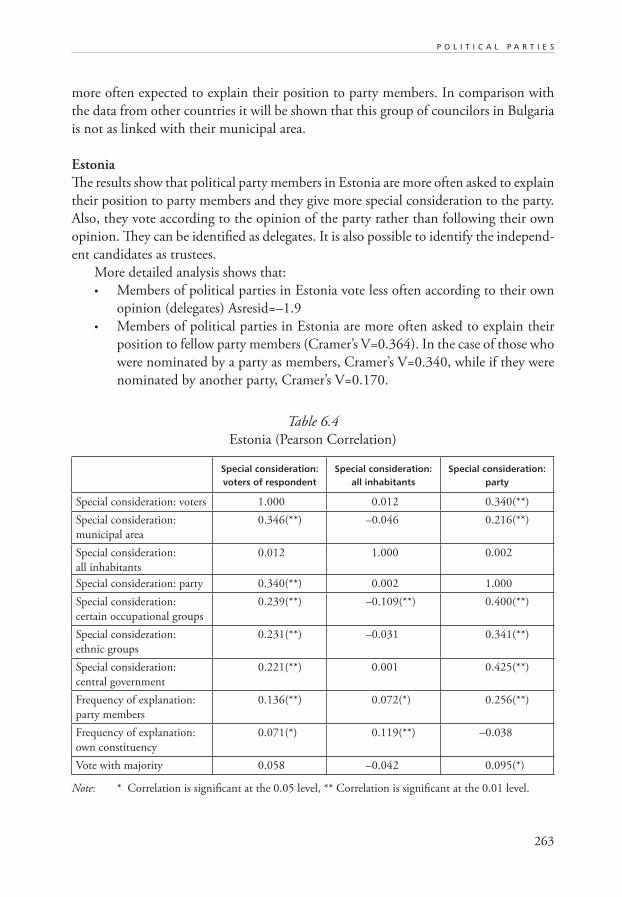
263
P O L I T I C A L P A R T I E S
more often expected to explain their position to party members. In comparison with
the data from other countries it will be shown that this group of councilors in Bulgaria
is not as linked with their municipal area.
Estonia
The results show that political party members in Estonia are more often asked to explain
their position to party members and they give more special consideration to the party.
Also, they vote according to the opinion of the party rather than following their own
opinion. They can be identified as delegates. It is also possible to identify the independ-
ent candidates as trustees.
More detailed analysis shows that:
• Members of political parties in Estonia vote less often according to their own
opinion (delegates) Asresid=–1.9
• Members of political parties in Estonia are more often asked to explain their
position to fellow party members (Cramer’s V=0.364). In the case of those who
were nominated by a party as members, Cramer’s V=0.340, while if they were
nominated by another party, Cramer’s V=0.170.
Table 6.4
Estonia (Pearson Correlation)
Special consideration: voters of respondent
Special consideration: all inhabitants
Special consideration: party
Special consideration: voters 1.000 0.012 0.340(**)
Special consideration:
municipal area
0.346(**) –0.046 0.216(**)
Special consideration:
all inhabitants
0.012 1.000 0.002
Special consideration: party 0.340(**) 0.002 1.000
Special consideration:
certain occupational groups
0.239(**) –0.109(**) 0.400(**)
Special consideration:
ethnic groups
0.231(**) –0.031 0.341(**)
Special consideration:
central government
0.221(**) 0.001 0.425(**)
Frequency of explanation:
party members
0.136(**) 0.072(*) 0.256(**)
Frequency of explanation:
own constituency
0.071(*) 0.119(**) –0.038
Vote with majority 0.058 –0.042 0.095(*)
Note: * Correlation is significant at the 0.05 level, ** Correlation is significant at the 0.01 level.

264
F A C E S O F L O C A L D E M O C R A C Y
• Members of political parties in Estonia list their political party as a more im-
portant group of special consideration (Cramer’s V=0.236).
Table 6.4 demonstrates a rather strong correlation between special consideration to
party and special consideration to central government and occupational groups. It also
shows a medium correlation between special consideration to party and consideration to
ethnic groups, voters, and municipal area as well as frequency of explaining their position
to party members. In the case of special consideration to all inhabitants there is a small
correlation with the frequency of explaining their position to their own constituency
and a small negative correlation with special consideration to occupational groups.
Table 6.4 indicates that politicians who give more special consideration to their party
also give more consideration to the central government and to occupational groups.
They also give more consideration to the ethnic groups, voters, and municipal areas.
Also, they are more often expected to explain their position to party members. Coun-
cilors who give more special consideration to all inhabitants are more often expected
to explain their position to their constituency and they give less special consideration
to occupational groups. The comparison with the other countries shows that there is
a stronger link between councilors who give special consideration to their party and
to central government as well as occupational groups. However, there is no significant
correlation of these variables with the delegate/trustee dichotomy.
Hungary
The results show that political party members in Hungary are more often expected to
explain their position to the party (particularly if they were nominated by the party as
members), and they give special consideration to the party as well as to their voters,
but they give less consideration to all the inhabitants of the municipality. Political party
members also tend to vote more often according to the opinion of the party or another
group of people rather than according to their own opinion. They can be identified as
delegates. We can also say that the independent candidates tend to give more special
consideration to all inhabitants and vote more often according to their own opinion.
They can be identified as trustees.
More detailed analysis shows that:
• Members of political parties in Hungary are more often asked to explain their
position to fellow party members (Cramer’s V=0.632). In the case of those who
were nominated by their political party as members, Cramer’s V=0.705, while
if they were nominated by another party, Cramer’s V=0.243.
• Members of political parties in Hungary list their political party as a more im-
portant group of special consideration (Cramer’s V=0.46). In the case of those
who were nominated by a party as members, Cramer’s V=0.501, while if they
were nominated by another party, Cramer’s V=0.191.
265
P O L I T I C A L P A R T I E S
• Members of political parties in Hungary list all inhabitants of the municipality
as a less important group of special consideration (Cramer’s V=0.231). In the
case of those who were nominated by a party as members, Cramer’s V=0.255.
• Members of political parties in Hungary more often follow the opinion of their
groups of special consideration (Cramer’s V=0.108; significance of 95%).
• Political party members give more consideration to the voters. Asresid of party
members giving very little consideration to the voters is –2.2, while it is 2.2
for the non-members. This result is rather surprising, but it can be argued that
the political party members have a closer connection with their voters because
they view them as supporters of the party.
• Councilors who were nominated by an NGO as its members tend to vote
according to the opinion of their group of special consideration. The respec-
tive asresid=2.6. This can be explained by the fact that as representatives of an
NGO they are expected to be its delegates. It is also possible that some politi-
cal groups have the status of an NGO but at the same time play the role of a
political party.
Table 6.5 shows that, unlike in the previous two cases, special consideration to voters
does not have the strongest correlation with special consideration to party, but it does
correlate with special consideration to municipal area. However, there is not a correla-
tion with “special consideration to all inhabitants.” The variable “special consideration
to party” strongly correlates with the frequency of explanation to party members. There
is also a medium correlation between special consideration to party and special consid-
eration to occupational groups, municipal area, and voters. A smaller correlation was
found between special consideration to party and special consideration to central govern-
ment, minority self-government, and regional government. There is a negative correla-
tion between special consideration to party and special consideration to all inhabitants.
The variable “special consideration to all inhabitants” has little correlation with “special
consideration to ethnic groups,” central government, regional government, and minority
self-government. However, there are similar levels of correlation between those variables
and special consideration to party. There is also a small negative correlation between spe-
cial consideration to all inhabitants and frequency of explanation to party members.
Table 6.5 shows that politicians who give more special consideration to the party
also give more consideration to occupational groups, to municipal areas, and to their
voters. They also give more consideration to the central government and minority self-
government. On the other hand, they give less consideration to all inhabitants. The
comparison with the other countries shows that the councilors who give more special
consideration to the party in Hungary are more concerned about the municipal area
and the occupational groups. Those who give more consideration to all inhabitants are
less often asked to explain their position to party members.
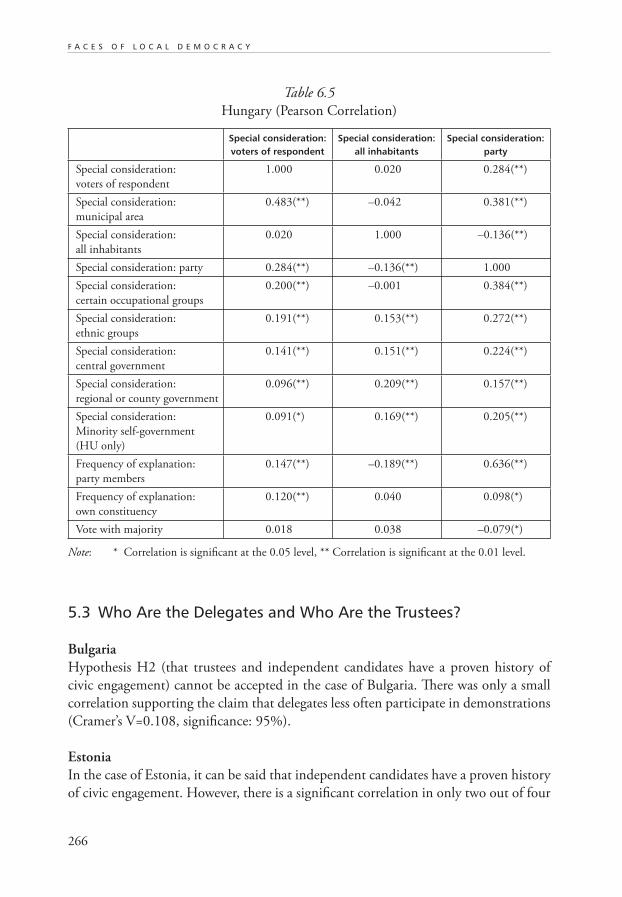
266
F A C E S O F L O C A L D E M O C R A C Y
Table 6.5
Hungary (Pearson Correlation)
Special consideration: voters of respondent
Special consideration: all inhabitants
Special consideration: party
Special consideration:
voters of respondent
1.000 0.020 0.284(**)
Special consideration:
municipal area
0.483(**) –0.042 0.381(**)
Special consideration:
all inhabitants
0.020 1.000 –0.136(**)
Special consideration: party 0.284(**) –0.136(**) 1.000
Special consideration:
certain occupational groups
0.200(**) –0.001 0.384(**)
Special consideration:
ethnic groups
0.191(**) 0.153(**) 0.272(**)
Special consideration:
central government
0.141(**) 0.151(**) 0.224(**)
Special consideration:
regional or county government
0.096(**) 0.209(**) 0.157(**)
Special consideration:
Minority self-government
(HU only)
0.091(*) 0.169(**) 0.205(**)
Frequency of explanation:
party members
0.147(**) –0.189(**) 0.636(**)
Frequency of explanation:
own constituency
0.120(**) 0.040 0.098(*)
Vote with majority 0.018 0.038 –0.079(*)
Note: * Correlation is significant at the 0.05 level, ** Correlation is significant at the 0.01 level.
5.3 Who Are the Delegates and Who Are the Trustees?
Bulgaria
Hypothesis H2 (that trustees and independent candidates have a proven history of
civic engagement) cannot be accepted in the case of Bulgaria. There was only a small
correlation supporting the claim that delegates less often participate in demonstrations
(Cramer’s V=0.108, significance: 95%).
Estonia
In the case of Estonia, it can be said that independent candidates have a proven history
of civic engagement. However, there is a significant correlation in only two out of four
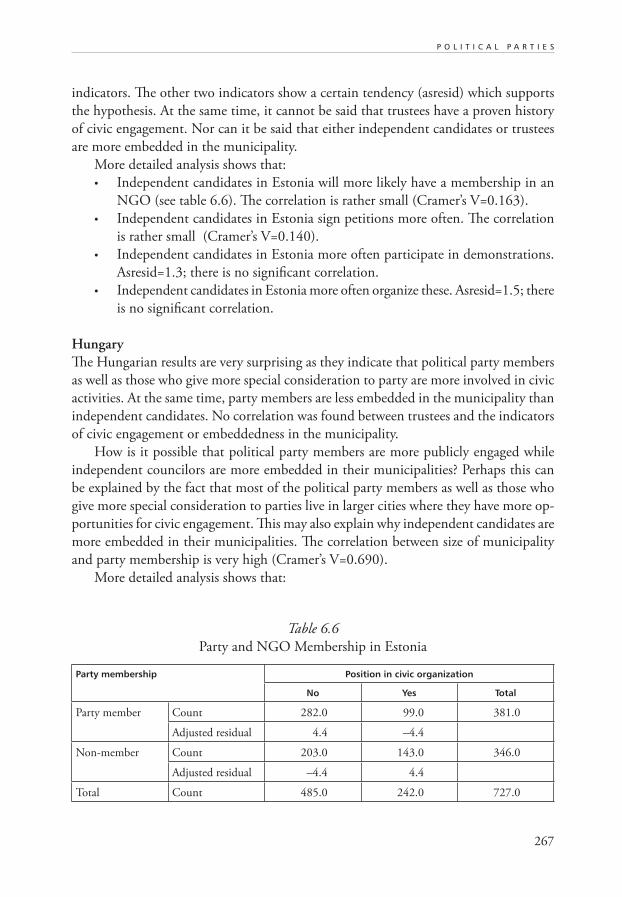
267
P O L I T I C A L P A R T I E S
indicators. The other two indicators show a certain tendency (asresid) which supports
the hypothesis. At the same time, it cannot be said that trustees have a proven history
of civic engagement. Nor can it be said that either independent candidates or trustees
are more embedded in the municipality.
More detailed analysis shows that:
• Independent candidates in Estonia will more likely have a membership in an
NGO (see table 6.6). The correlation is rather small (Cramer’s V=0.163).
• Independent candidates in Estonia sign petitions more often. The correlation
is rather small (Cramer’s V=0.140).
• Independent candidates in Estonia more often participate in demonstrations.
Asresid=1.3; there is no significant correlation.
• Independent candidates in Estonia more often organize these. Asresid=1.5; there
is no significant correlation.
Hungary
The Hungarian results are very surprising as they indicate that political party members
as well as those who give more special consideration to party are more involved in civic
activities. At the same time, party members are less embedded in the municipality than
independent candidates. No correlation was found between trustees and the indicators
of civic engagement or embeddedness in the municipality.
How is it possible that political party members are more publicly engaged while
independent councilors are more embedded in their municipalities? Perhaps this can
be explained by the fact that most of the political party members as well as those who
give more special consideration to parties live in larger cities where they have more op-
portunities for civic engagement. This may also explain why independent candidates are
more embedded in their municipalities. The correlation between size of municipality
and party membership is very high (Cramer’s V=0.690).
More detailed analysis shows that:
Table 6.6
Party and NGO Membership in Estonia
Party membership
Position in civic organization
No Yes Total
Party member
Count 282.0 99.0 381.0
Adjusted residual 4.4 –4.4
Non-member
Count 203.0 143.0 346.0
Adjusted residual –4.4 4.4
Total Count 485.0 242.0 727.0
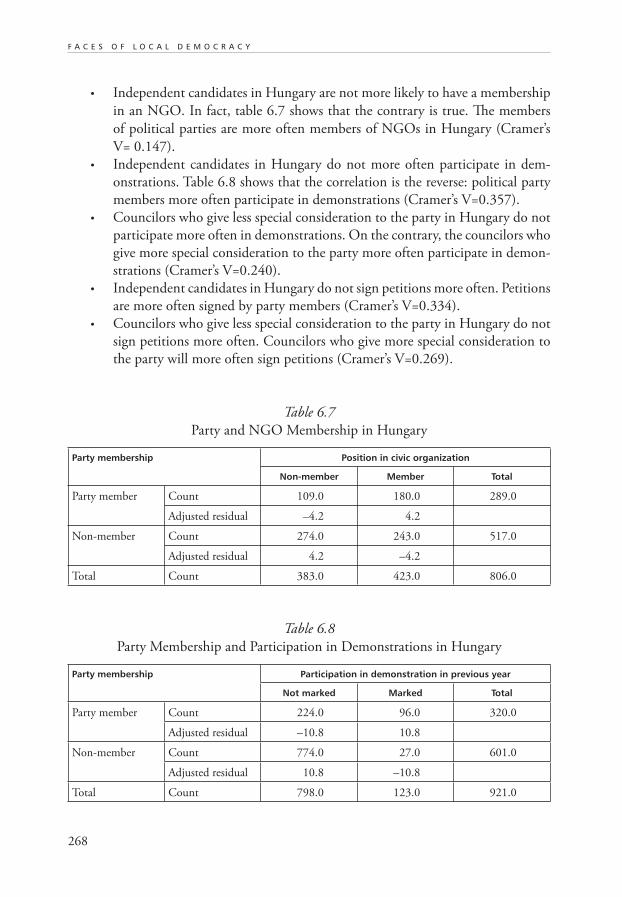
268
F A C E S O F L O C A L D E M O C R A C Y
• Independent candidates in Hungary are not more likely to have a membership
in an NGO. In fact, table 6.7 shows that the contrary is true. The members
of political parties are more often members of NGOs in Hungary (Cramer’s
V= 0.147).
• Independent candidates in Hungary do not more often participate in dem-
onstrations. Table 6.8 shows that the correlation is the reverse: political party
members more often participate in demonstrations (Cramer’s V=0.357).
• Councilors who give less special consideration to the party in Hungary do not
participate more often in demonstrations. On the contrary, the councilors who
give more special consideration to the party more often participate in demon-
strations (Cramer’s V=0.240).
• Independent candidates in Hungary do not sign petitions more often. Petitions
are more often signed by party members (Cramer’s V=0.334).
• Councilors who give less special consideration to the party in Hungary do not
sign petitions more often. Councilors who give more special consideration to
the party will more often sign petitions (Cramer’s V=0.269).
Table 6.7
Party and NGO Membership in Hungary
Party membership
Position in civic organization
Non-member Member Total
Party member
Count 109.0 180.0 289.0
Adjusted residual –4.2 4.2
Non-member
Count 274.0 243.0 517.0
Adjusted residual 4.2 –4.2
Total Count 383.0 423.0 806.0
Table 6.8
Party Membership and Participation in Demonstrations in Hungary
Party membership
Participation in demonstration in previous year
Not marked Marked Total
Party member
Count 224.0 96.0 320.0
Adjusted residual –10.8 10.8
Non-member
Count 774.0 27.0 601.0
Adjusted residual 10.8 –10.8
Total Count 798.0 123.0 921.0
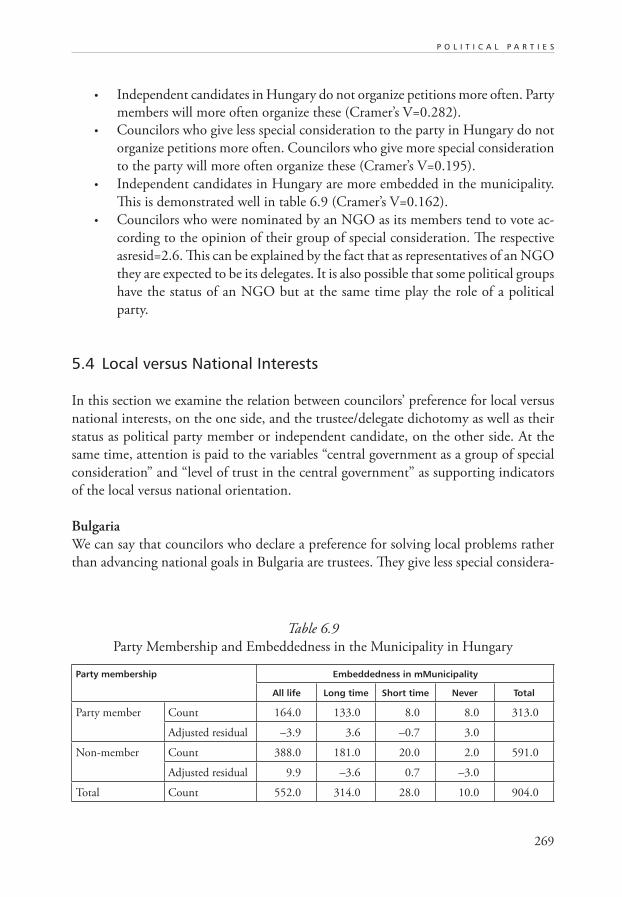
269
P O L I T I C A L P A R T I E S
Table 6.9
Party Membership and Embeddedness in the Municipality in Hungary
Party membership
Embeddedness in mMunicipality
All life Long time Short time Never Total
Party member
Count 164.0 133.0 8.0 8.0 313.0
Adjusted residual –3.9 3.6 –0.7 3.0
Non-member
Count 388.0 181.0 20.0 2.0 591.0
Adjusted residual 9.9 –3.6 0.7 –3.0
Total Count 552.0 314.0 28.0 10.0 904.0
• Independent candidates in Hungary do not organize petitions more often. Party
members will more often organize these (Cramer’s V=0.282).
• Councilors who give less special consideration to the party in Hungary do not
organize petitions more often. Councilors who give more special consideration
to the party will more often organize these (Cramer’s V=0.195).
• Independent candidates in Hungary are more embedded in the municipality.
This is demonstrated well in table 6.9 (Cramer’s V=0.162).
• Councilors who were nominated by an NGO as its members tend to vote ac-
cording to the opinion of their group of special consideration. The respective
asresid=2.6. This can be explained by the fact that as representatives of an NGO
they are expected to be its delegates. It is also possible that some political groups
have the status of an NGO but at the same time play the role of a political
party.
5.4 Local versus National Interests
In this section we examine the relation between councilors’ preference for local versus
national interests, on the one side, and the trustee/delegate dichotomy as well as their
status as political party member or independent candidate, on the other side. At the
same time, attention is paid to the variables “central government as a group of special
consideration” and “level of trust in the central government” as supporting indicators
of the local versus national orientation.
Bulgaria
We can say that councilors who declare a preference for solving local problems rather
than advancing national goals in Bulgaria are trustees. They give less special considera-
270
F A C E S O F L O C A L D E M O C R A C Y
tion to the party and they do not aspire to a future political career. On the other hand,
there is no correlation between political party membership and any of the indicators
of local/national interests. However, when party membership is used as a controlling
variable, there is a significant correlation between delegate/trustee and national/local
goals only in the case of party members (Cramer’s V=0.161).
More detailed analysis shows that:
• Bulgarian data only show a correlation between variables “trust to central gov-
ernment” and “central government as a group of special consideration” (Pearson
correlation=0.272). “Ascribed priority to achieving national goals” versus “solving
local problems” did not correlate with these.
• The councilors who ascribe priority to solving local problems over national
goals in Bulgaria tend to vote more often according to their own view (trustees).
(Cramer’s V=0.146).
• The councilors who give special consideration to central government in Bulgaria
(delegates) will less often vote according to their own view (Cramer’s V=0.136).
• The councilors who give special consideration to central government in Bulgaria
will more often give special consideration to the party (Somers’ D=0.281).
• The councilors who give special consideration to central government in Bulgaria
tend to aspire to a political career on the national level. The respective asresids
=1.6 versus –2.0.
Estonia
Councilors who declare a preference for solving local problems rather than national
goals in Estonia can be considered trustees, as they give less special consideration to the
party and they do not aspire to a future political career on the national level. On the
other hand, there is no correlation between political party membership and any of the
indicators of local/national interests.
• The Estonian data only show a correlation between the variables “trust in cen-
tral government” and “central government as a group of special consideration”
(Pearson correlation=0.182). Ascribing priority to achieving national goals versus
solving local problems did not correlate with these.
• The councilors who ascribe priority to solving local problems over advancing
national goals in Estonia tend to vote more often according to their own view
(trustees). Asresid=2.4
• The councilors who give special consideration to central government in Estonia
will more often give special consideration to the party (Somers’ D=0.331).
• The councilors who give special consideration to central government in Estonia
will less often vote according to their own view (delegates). Asresid=3.1.
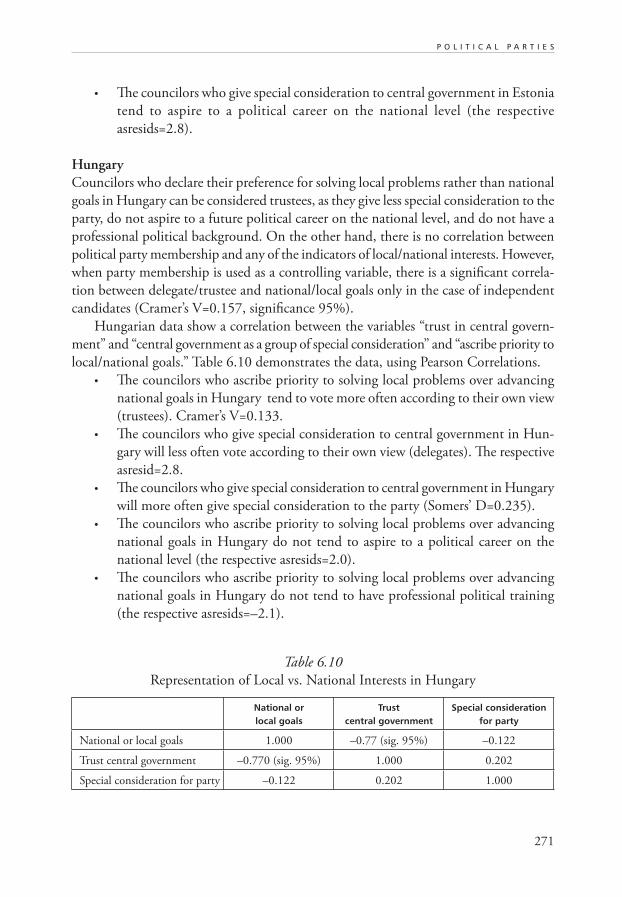
271
P O L I T I C A L P A R T I E S
• The councilors who give special consideration to central government in Estonia
tend to aspire to a political career on the national level (the respective
asresids=2.8).
Hungary
Councilors who declare their preference for solving local problems rather than national
goals in Hungary can be considered trustees, as they give less special consideration to the
party, do not aspire to a future political career on the national level, and do not have a
professional political background. On the other hand, there is no correlation between
political party membership and any of the indicators of local/national interests. However,
when party membership is used as a controlling variable, there is a significant correla-
tion between delegate/trustee and national/local goals only in the case of independent
candidates (Cramer’s V=0.157, significance 95%).
Hungarian data show a correlation between the variables “trust in central govern-
ment” and “central government as a group of special consideration” and “ascribe priority to
local/national goals.” Table 6.10 demonstrates the data, using Pearson Correlations.
• The councilors who ascribe priority to solving local problems over advancing
national goals in Hungary tend to vote more often according to their own view
(trustees). Cramer’s V=0.133.
• The councilors who give special consideration to central government in Hun-
gary will less often vote according to their own view (delegates). The respective
asresid=2.8.
• The councilors who give special consideration to central government in Hungary
will more often give special consideration to the party (Somers’ D=0.235).
• The councilors who ascribe priority to solving local problems over advancing
national goals in Hungary do not tend to aspire to a political career on the
national level (the respective asresids=2.0).
• The councilors who ascribe priority to solving local problems over advancing
national goals in Hungary do not tend to have professional political training
(the respective asresids=–2.1).
Table 6.10
Representation of Local vs. National Interests in Hungary
National or local goals
Trust central government
Special consideration for party
National or local goals 1.000 –0.77 (sig. 95%) –0.122
Trust central government –0.770 (sig. 95%) 1.000 0.202
Special consideration for party –0.122 0.202 1.000
272
F A C E S O F L O C A L D E M O C R A C Y
6. CONCLUSIONS
In this chapter we have attempted to examine the role of political parties in three Central
and Eastern European countries and to propose a possible theoretical generalization of
the results. The primary objective was to identify delegates and trustees among local
politicians. The first step of the first research question focused on testing whether it is
possible to identify political party members as trustees and independent candidates as
delegates. The second research question tried to answer the question: “What are the
distinct indicators of local politicians who can be characterized as delegates or trustees?”
The third research question searched for links between the concept of delegates and
trustees and their declared representation of national versus local interests.
In our earlier theoretical discussion the task was to find a definition suitable for
identifying delegates and trustees. Delegates, we said, can be seen as councilors who
give more consideration to their political party than to their constituents, who tend to
vote in accordance with the position of the party, and have to be constantly account-
able to it. Trustees see themselves as representatives of the people and tend to be more
independent of the political party, voting on the basis of their own opinion of what is
the best for the community.
Section 3 of this chapter highlighted relevant differences in the local governments
of the three countries. Namely, a higher number of independent councilors in Hungary,
a greater influence of the central government on local issues in Bulgaria, and a higher
level of public participation in Hungary. These claims were based on pertinent literature
and are, in fact, supported by the data of the “Indicator Project.” The description of the
data shows that almost 95% of the Bulgarian councilors were nominated to their posi-
tion by a political party, 68% in Estonia, and only 46% in Hungary. The description
also shows that only the councilors in Bulgaria are more often required to explain their
position to their party than to their constituency.
The most relevant contribution of the research is that it reveals a correlation between
the concept of delegates and trustees, on the one hand, and councilors’ declaration that
they represent national or local interests, on the other. The correlation was present in
the case of all three countries. We found that councilors who declared a preference for
solving local problems rather than pursuing national goals voted more often accord-
ing to their own opinion (trustees), gave less special consideration to the party, had no
aspiration for a future political career on the national level, and in the case of Hungary,
did not have professional political training. At the same time, there was no correlation
between preference for national versus local goals and political party membership. This
result suggests that the dividing line between councilors who are more oriented to local
or national goals is more related to the concept of delegates or trustees rather than to
party membership. The data for Bulgaria and Hungary show that party membership
has an influence on the relation between the other variables; this link should be studied
in more detail in the future.
273
P O L I T I C A L P A R T I E S
The research also found a correlation between political party membership and the
concept of delegates in Hungary and Estonia. The Bulgarian data did not sustain this
link, probably because almost all councilors in Bulgaria were nominated to their func-
tion by a political party. At the same time, there was link in Bulgaria between being a
delegate and giving special consideration to the party, occupational group, and central
government. This is a tendency that supports the working hypothesis.
In our effort to identify what characterizes delegates and trustees in terms of civic
engagement, embeddedness in the municipality, professional political training, and
plans for the future, no significant links appeared. However, the data do indicate that
independent candidates in Estonia are more involved in civic activities. In Hungary,
surprisingly, the political party members are more engaged in civic activities. This can
be explained by the fact that most Hungarian political party members live in larger
constituencies, which offer them more opportunities for civic engagement.
The theoretical contribution of the research can be discerned at three levels. First, it
has confirmed the empirical observations about each country-case that were reviewed
in the relevant literature. Second, a link between the concept of delegates and trustees
and the focus on councilors’ representation of national or local issues was demonstrated.
Finally, the research has contributed to verifying the validity of these definitions in the
particular comparison of the three Central and Eastern European countries in our study.
REFERENCES
Baldersheim, H., M. Illner, and A. Offerdal (eds.). 1996. Local Democracy and the
Processes of Transformation in East-Central Europe. Oxford: Westview Press.
Bennett, R.J. 1997. Local Government in Post-Socialist Cities. Budapest: Local Govern-
ment and Public Service Reform Initiative, Open Society Institute–Budapest.
Burns J., J.W. Peltason, and T. Cronin. 1989. Government by the People. Englewood
Cliffs, NJ: Prentice Hall.
Chandler, J. (ed.). 1993. Local Government in Liberal Democracies: An Introductory
Survey. London: Routledge.
Chandler, J. 1998. Mistni sprava v liberalnich demokraciich. Uvodni nacrt. Brno: Doplnek
Coulson, A. (ed.). 1995. Local Government in Eastern Europe. Establishing Democracy
at the Crossroads. Aldershot: Edward Elgar.
Elander, I. and M. Gustafsson (eds.). 1991. The Re-emergence of Local Self-government
in Central Europe: the First Experience. Sweden: University of Orebro.
Goldsmith, R. 2000. Constituency, Size and Electoral Politics: A Comparison of Patterns at Local
Elections in Norway and the UK. IPSA, XVIII World Congress. Quebec, August 2000.
274
F A C E S O F L O C A L D E M O C R A C Y
Horváth, T. 2000. Decentralization: Experiments and Reforms. Budapest: Local Govern-
ment and Public Service Reform Initiative, Open Society Institute–Budapest.
Humes, S. 1991. Local Governance and National Power. A World-wide Comparison of Tradi-
tion and Change in Local Government. Hemel Hempstead: Harvester Wheatsheaf.
Ieda, O. (ed.). 2000. The Emerging Local Governments in Eastern Europe and Russia.
Hiroshima: Keisuisha.
Kandeva E. (ed.). 2001. Stabilization of Local Governments. Budapest: LGI.
Kuroda, Y. 1974. Ecology and local politics. A citizen movement in Japan. In: Local
Politics, Development, and Participation: A Cross-national Study of Interrelationships.
University of Pittsburgh. 115–126.
Magnusson, W. and A. Sancton. 1983. City Politics in Canada. Toronto: University of
Toronto Press.
Malikova, L. 1995. Political Reflections on the Transformation of Power in Local Govern-
ment. In: Conference Proceedings of Localities and Politics in the Transformation
Process: The Slovak and Czech Experiences. Bratislava. 7–19.
Olson, M. 1995. The Devolution of Power in Post-communist Societies. IRIS Pub. No.:
wp179.
Saiz, M. 1999. Local Parties in Political and Organizational Perspective. Boulder: West-
view Press.
Soós, G. 2001. Indicators of Local Democratic Government Project: Concepts and Hy-
potheses. Budapest: Local Government and Public Service Reform Initiative, Open
Society Institute–Budapest.
Soós, G., G. Tóka, and G. Wright (eds.). 2002. The State of Local Democracy in Central
Europe. Budapest: Local Government and Public Service Reform Initiative, Open
Society Institute–Budapest.
Sopoci, J. 1995. Local Self-government in Slovakia: the First Years. In: Conference Pro-
ceedings of Localities and Politics in the Transformation Process: The Slovak and
Czech Experiences. Bratislava. 26–32.
Stoker, G. 1991. The Politics of Local Government. London: Macmillan.
Vajdova, Z. 1995. Power Structure at the Local Level. In: Conference Proceedings of
Localities and Politics in the Transformation Process: The Slovak and Czech Experi-
ences. Bratislava. 20–25.
Wiatr, J. 1974. Local Decision-making, Public Participation and Social-economic Deve-
lopment: a Proposal for Cross-national Study. In: Local politics, development, and
participation: A cross-national study of interrelationships. University of Pittsburgh.
259–269.
275
Institutional Balance in Local Government:
Council, Mayor, and City Manager
in Local Policymaking1
Georg Sootla, Kristina Grau
ABSTRACT
This chapter provides an analysis of variations in the horizontal institutional configura-
tion of local governance in Hungary, Estonia and Latvia. Specifically, we analyze the
variation in the distribution of authority between institutions and in the decision-making
behaviour of the local councils.
According to our results, Latvia clearly follows the committee model of local
governance, which puts policymaking authority in the hands of the council and its
commissions, and which is conducive to the establishment of close contacts with civil
society. In Estonia, the institutional configuration of local authorities is rather close to
the cabinet model of local governance, in which policymaking authority is distributed
between the majority coalition and a strong political executive. This configuration leaves
little room for initiatives from individual politicians in policy formation or in contact
with citizens. Hungary belongs to the mayoral model of local governance, in which the
council’s significant authority is balanced by the rather separate administrative author-
ity of a local manager (the notary). The division of policymaking authority between
them depends largely on whether the directly elected mayor commands a majority in
the council. In the case of majority support, the distribution of policymaking authority
becomes similar to the committee system.
The main source of variation was the extent to which politics is institutionalized
in the three countries. The cabinet model in Estonia was characterized by extremely
intensive partisan affiliations and the formation of factions and coalitions. In Hungary,
the institutionalization of politics has been almost nonexistent in smaller and medium-
sized communities. The specifics of the electoral system were also a determining factor in
this. The committee system, characterized by a very weak executive core, favors regular
review of costs and the efficiency of administration and service delivery, whereas the
relatively independent administration in Hungary is rather resistant to the review of
administrative costs.
277
Institutional Balance in Local Government:
Council, Mayor, and City Manager
in Local Policymaking
Georg Sootla, Kristina Grau
1. CONCEPTUAL AND HISTORICAL BACKGROUND
More than ten years have passed since the major reform of local government in Hungary,
Estonia, and Latvia. These reforms were focused on the democratization of local gov-
ernance after fifty years’ experience of a “totally administered” society. The magic word
“decentralization” sums up all the reform rhetoric and practice of that time (Horváth
2000, Kimbell 1999). Research on local government in CEE countries in the 1990s
similarly focussed on intergovernmental relations: on the analysis of devices that would
guarantee autonomy from interventions by central authorities, and of self-government
at the local level.
Moreover, this focus on theorizing about local government fits with the European
academic tradition of recent decades. Models of local government in this tradition
primarily describe different ways of balancing central and local relations, starting with
Leemans’ seminal book (1970). This is mainly because a broad interpretation of the
concept of local government has been accepted in the European (institutional) tradi-
tion. Since then various models have been suggested by different scholars. Along with
the fused, split, and dual systems proposed by Leemans, there has been a variety of
other interpretations emphasizing different dimensions of intergovernmental relations.
Kjellberg (1993) and his followers focused on the analysis of autonomous versus integra-
tive trends in central local relations (Amna, Montin 2000). Wright (1995) developed
a typology in which the agency model was the specifically identified outcome of Brit-
ish local government reforms under the Thatcher government. Recently, John (2001)
reasserted the legacy of Page and Goldsmith’s North-South typology (Page, Goldsmith
1987) which combines three basic variables—functions, discretion, and access—in
analyzing intergovernmental dynamics.
Hence, the analysis of local government reforms and its outcomes has a rather favo-
rable theoretical context. Nevertheless, there does not appear to have been much progress
in analyzing local government institutional developments from the standpoint of the
278
F A C E S O F L O C A L D E M O C R A C Y
central-local balance that Leemans and Smith (1993), in particular, have considered the
cornerstone of local governance and democracy. To some extent the theoretical weakness
in the analysis of intergovernmental relations was caused by the specific interpretation
of the principle of subsidiarity, either from a libertarian perspective (Vanberg 1997) or
from a rhetorical perspective that serves certain political interests (Sanglot, Blichner
1996).
But the main reason was rather trivial. The majority of the analysis completed by
western scholars merely reviewed the emerging democratic institutions of governance
and did not aim for a more profound analysis. Presumably, this was mainly because of
language barriers. For a long period the majority of domestic analysts did not have suf-
ficient academic capacity and remained rather descriptive, or they saw their main task as
commenting on legal texts. More successful was the analysis of the concrete dimensions
of local government, e.g., local finances (especially Hőgye 2002).
The Indicators of Local Democracy Project—on which our data analysis will
rely—was one of the first attempts at a quantitative comparative analysis of local gov-
ernance carried out at the Toqueville Research Center (Soós et al. 2002). However,
here too we could not see a calculated strategy of testing certain theoretical models or
hypotheses: the need for first-hand factual data about the state of local democracy was
still very urgent.
Another, narrower approach to “models” of local government originates in the US
Model City Charter (Frederickson 2001, Svara 2001). Representatives of this tradition
also analyze balance as a core mechanism in the institutionalization of democracy. But
they focus on the horizontal balance of core local government institutions: council,
mayor, and city manager. This analysis discusses the practical strengths and weaknesses
of various configurations of interaction among those actors and institutions in diverse
local government landscapes in the US (Hansell 2000). But some other authors have
developed a rather sophisticated theoretical analysis of these diverse situations (Svara
1990, Mouritzen, Svara 2002) as well as profound international comparisons (Mouritzen,
Svara 2002). European and especially CEE analysts have largely dropped this dimension
of theoretical modelling from their focus. In Europe, the analysis of local government
regimes has attracted more attention (John 2002). We are deeply convinced that this
is one of main reasons why key problems of local development—citizens’ involvement,
democratic control, and corruption—have not received enough serious theoretical and
practical attention in CEE countries. Why not?
The majority of new democracies in CEE chose the autonomous model of local
government. By1993 Kjellberg and his colleagues (Kjellberg 1993, Kjelleberg et al.
1994, Sootla 1995, Kjellberg et al. 1996) had already warned that a configuration of
split hierarchies that had developed in many CEE countries (Estonia, Hungary, the
Czech Republic, and temporarily in Latvia) would create considerable problems not
only in balancing central-local relations but also in the internal dynamics of governance.
279
I N S T I T U T I O N A L B A L A N C E
An implicit controversy between democratic values and the capacity of local authori-
ties appropriate to this model soon started to hinder the development of channels of
responsiveness for meeting citizens’ needs and the establishment of enough effective
mechanisms of democratic control at the local level (see also Bennett 1996).
Autonomous models of local government are founded on wide local democracy and
democratic representation (Kjellberg 1993). Autonomy provides much freedom to act
with discretion at the local level, but there is no effective mechanism of external control
over autonomous actors, i.e., local government institutions. If external mechanisms of
control (administrative intervention) emerge, the logic of autonomous local government
will be considerably distorted. Without internal devices of democratic control—party
competition, transparency, feedback, and input from the citizenry—the local authority
may develop into an oligarchy that can be brought under control only through strict
centralization. For this reason, horizontal checks and balances between LG institutions
and actors are the cornerstone of smooth democratic governance in the framework of
autonomous models. Hence, we find ourselves taking a more narrow approach to the
theory of local government models, since this will serve the immediate needs of local
governments in CEE countries.
The main aim and purpose of this study is to analyze the institutional checks and
balances in diverse legal and cultural institutional environments. We assume that institu-
tional actors have different roles in diverse models and, therefore, that the policymaking
process and style varies in Latvia, Hungary, and Estonia.
In the conclusion of his analysis of the Model Charter, Frederickson (2001) ob-
serves that “the formal legal description of a given city as either council-manager or
mayor-council is less accurate than the particular structural variation that the citizens
of a given community have chosen to adopt in order to make their government reflect
their preferences and values.” He also cites Adrian (1998), who has suggested that “the
distinction between cities on the basis of their legal platforms is less and less meaning-
ful.” Let us take these remarks as a tentative general hypothesis and research strategy,
since such purely theoretical models cannot easily be verified through empirical analysis.
Also, in the course of institutionalization—understood in the context of normative
institutionalism (Powell, Dimaggio 1991)—of democratic mechanisms and values such
as representation and participation, legal definitions would lose their constitutive impact.
The actual shape of democratic institutions reflects the dynamic attitudes, capacities,
and actions of local actors.
Hence, we define our research strategy. After describing the empirical research and
methods used, we provide a brief analysis of possible formal models developed in Hun-
gary, Estonia, and Latvia. Then we analyze how the main local government institutions
are balanced within various dimensions. In the final section we make suggestions for
further analysis.
280
F A C E S O F L O C A L D E M O C R A C Y
2. THE LEGAL CONTEXT FOR INSTITUTIONAL BALANCE AT THE LOCAL LEVEL IN HUNGARY, ESTONIA, AND LATVIA
We would like to concretize somewhat the typology offered by American authors and to
distinguish between the council, mayor, and manager forms, in which different models
of organization of the executive serve as the basis for comparison. This is important
because the council-manager (mayoral) configuration can entail three rather different
ways of organizing the key actors in the policymaking process: committee, cabinet,
and mayor.
2.1 The Committee Model
A textbook version of the committee system is apparent in the UK (Smith 1993, Stoker
1991). In this system emphasis is on collegial policymaking at council committees and on
the avoidance of the concentration of meaningful power in any single actor. In addition,
committees exert considerable power in supervising the implementation of council deci-
sions by independent agencies. Councilors in this kind of local government have a very
intensive and extensive workload (Rao 1999). It is intensive because the decision-making
process is entirely deliberative and must be recorded in writing, and extensive because
many routine tasks and also policy advice (preparation of drafts for decision) that are
often delegated to the executive, are done in this case by council and its committees.
Also, to steer LG agencies and organizations, boards are established where councilors
participate as actors. The main idea in this model is to ensure as much representation
or input as possible from the community via its representatives and as much control as
possible over the policymaking process by those representatives. This model does not
promote strong leadership as is expected in the US. Rather, the mayor’s role is at best
primus inter alia, but more frequently that of representative and mediator. The mayor’s
office itself has only a small separate administration, as administrative tasks are delegated
to the independent agencies. The mayor’s office serves mainly to manage certain support-
ing functions, e.g., personnel management or purely bureaucratic-technical functions
such as handling documentation. The city manager is a weak figure because his role is
merely to steer the work of agencies.
We expect that the committee model reduces the role of partisan representation,
because working in committees and side-by-side with professional staff advisers would
gradually socialize councilors to take a more professional approach to their work. In
this framework, an adversarial situation that is normal when party competition forms
the basis of the policymaking process could not emerge.
Latvia has clearly modelled its organization on this kind of political-administrative
split (Vanags, Vilka 2001, Vilka et al. 2002). This is obvious even at the level of termi-
281
I N S T I T U T I O N A L B A L A N C E
nology, where the word “mayor” is not used in legislation, but “chairperson” instead. In
the Latvian Local Government Act, the representative body is called the “territorial local
government council,” which indicates identification of government and council.
According to the Local Government Act the most powerful actor in the Latvian
local community is the council, which has extensive competence up to and including
the nomination of judges (Section 21). Legislative initiatives can be brought forward
by councilors, committees, or the chairperson and by the initiator of an extraordinary
meeting. In other words, the head of the administration does not have the right to
make proposals for decision at council (Section 33). The failure to reach quorum is
such a serious event in Latvian local life that Cabinet must be informed if this occurs.
There is no separate executive office in Latvia at the municipal level. The mayor’s office
is also a unit of council, because in communities with fewer than 5,000 habitants the
chairperson also occupies the post of chief executive officer.
Council committees have the right to “monitor the work of the local government
institutions and undertakings,” which is usually the role of the executive (see also Rao
1991). In Latvia, the heads of public organizations who become councilors cannot
be members of committees that monitor the work of their own organization (Section
58). This indicates that such committees have significant power of scrutiny and direct
supervision, besides their role as dominant policymaker. Latvian councils can also form
boards of directors, commissions, or working groups for “the performance of specific
functions or for administration of the administrative territory” (Section 61). This is a
much different mandate than the mandate of supervisory boards that are largely used
in democratic local communities.
According to Latvian law the executive director is appointed to steer the work
of LG independent agencies and organizations. The scope of the director’s powers is
defined in the provisions of the law (Section 69). Executive directors can only propose
the candidate of the head of organizations of the local administration, who is appointed
by council. (For instance, in Estonia this is exclusively within the authority of the head
of the local executive, not council.)The executive director has a small administrative
office, but this structural unit is not prescribed by law. As only 8% of local government
units have a population above 5,000 (Vilks 2002), these two institutions in Latvia are
mostly merged into one.
Specific to the Latvian configuration of LG are the unusually extensive rights of
intervention by central government and even ministers who can, for instance, call
extraordinary sessions and initiate legislation at the local council. This is radically differ-
ent from UK practice (Smith 1993). In the Latvian case the need for direct intervention
would be caused by the need for a fast solution to (possible) conflicts between central
government and local communities, particularly where the Russian-speaking popula-
tion forms the majority.
282
F A C E S O F L O C A L D E M O C R A C Y
2.2 The Mayoral Model
The model of the mayor as chief executive has many variations in real life, depending
on whether the mayor is assisted by a career official (city manager) and whether the
mayor is appointed by council or directly elected. When the mayor is appointed by
council and does not have the support of a majority of council, the model approaches
the committee model. The similarity is especially strong if the local government does not
have a city manager or the role of the latter is very weak. The mayor’s role in this case
would be reduced to chairing council meetings and supervising independent executive
agencies and organizations (see also Hansell 1999, 2000).
At the other end of the continuum, the mayor is directly elected and has the full
support of council as the leader of the majority party. The mayor is assisted by the city
manager who is completely dependent on the mayor’s mercy, because council does not
have independent policymaking powers to balance the mayor-manager tandem. That
is, the mayor as the formal chief administrator has complete control over the council in
developing local policy. The only variables that could hinder the authority of this mayor
are a weak party and coalition discipline at council. This model is already close to the
mayor-council model that is usually applied in fused (not autonomous or dual) systems
of local governance. But in our case Hungary has some traits of the fused system.
In our opinion, Hungary belongs to this classical council-manager, mayoral system.
Council has the power and capacity to be involved in policymaking at the preparatory
stages and can play a substantive role in the supervision and steering of local finances and
property. A directly elected mayor is first of all the head of council, and then the head
of the mayor’s office. Both the mayor’s office and its manager (notary) emanate—ac-
cording to law—from the will of council. All other powers of LG institutional actors are
delegated by council. Obviously, the direct election of mayors after the 1994 revisions
to the LG Act was intended to balance somewhat those powers and to avoid the over-
politicization of administration. A similar model was used in Estonia and was abolished
for the same reasons (Sootla 1995.)
However, the above description of the status of council reflects the formal, legal
definition. In reality, the mayor’s office is a rather important and separate part of the
administrative machinery because it is managed by an independent notary. This makes
the mayor and notary important autonomous actors in preparing policy decisions.
Council cannot directly steer the departments of the mayor’s office, but can ask the
mayor to intervene if council members suspect that the office or its departments are not
responsive enough to council’s policy positions. The manager would actually play a very
important if not central role vis-à-vis the mayor, especially in the case of cohabitation.2
Firstly, council only approves the results of an open competition that is the basis for
selection of the manager. This makes it rather difficult to fire the manager. The man-
ager is formally the employer of civil servants who are employed at council. Last but
283
I N S T I T U T I O N A L B A L A N C E
not least, the city manager is responsible for the implementation of state tasks assigned
to the local authorities. Thus, city managers are also representatives of the state at the
local level. This shows the presence of elements of a fused local government system in
Hungary. All this would make the city manager rather powerful in balancing council’s
policy agenda and especially in supervising the administration and independent agencies
that are formally the responsibilities of council.
A recent study of local budgeting demonstrated how the cohabitation period creates
a council where committees play an exclusively dominant role in relation to the mayor
and the mayor’s office. On the other hand, in the absence of cohabitation the notary plays
a much more important role in the preparation of the budget (Hőgye et al. 2002).
2.3 The Cabinet Model
The cabinet model delegates extensive policymaking authority to the politically ap-
pointed and controlled mayor, who is usually the leader of a major political party and
coalition. The mayor appoints a collegial executive body that is similar to ministerial
(as in France or Belgium) or government cabinets, depending on where the members of
cabinet come from. Council has mainly a legislative role and acts as principle representa-
tive of the community as the owner of public property. All transactions involving the
community’s assets, removable property, and financial obligations must be decided only
by the council. Besides policymaking, cabinet has full discretion in making decisions
concerning administrative affairs. The main policy proposals come from cabinet. In
the framework of the cabinet model, the institutions of local governance—council and
government—can be effective and responsive to community needs only if their activi-
ties rely on a balanced spectrum of parties. The parties exert political control over the
executive and at the same time ensure the passage of the mayor’s proposals in council.
But the active role of the mayor and cabinet in preparing policy does not necessarily
mean that council’s committees are marginal in the policy process. Besides assisting
council in its legislative role, council committees play a significant role in supervising
the administration, especially concerning their costs and efficiency.
Thus, Estonia has developed a classical cabinet model with a balance between the
representative and executive sides. Presumably, the various modifications of the cabinet
system are caused by the different interrelations between government and administra-
tion. One strategy is to delegate as many functions as possible to independent or private
actors (management perspective). In this case, the cabinet is more policy oriented and
less prone to taking on managerial functions. The other strategy, adopted in Nordic
countries, is to involve local civil society actors in managing the rather integrated and
complex local government (governance perspective) through collegial bodies. Estonia
has chosen the first scenario. For instance, in 2002 only 5.64% of all local government
revenues came from economic activities.
284
F A C E S O F L O C A L D E M O C R A C Y
In Estonia mayors as well as members of the cabinet must not come from council.
They can be community leaders, businessmen, and even key civil servants who are not
elected as members of council but are proposed by the coalition and appointed by the
council. This is not permitted in Latvia and in Hungary. On the one hand, a powerful
mayor should not have a direct mandate from citizens but only the support of majority
coalition members. This can increase the undemocratic impact of interest groups and
corporatist networks. On the other hand, the appointment of the mayor and especially
members of cabinet not from the council enables the strengthening of the professional
dimension of the executive and avoids its overpoliticization.
The council has a relatively limited competence, although—as in all countries—only
the council has a direct mandate of governance from citizens. The scope of its actual
competence in Estonia is similar to the obligatory competence of the council in Hungary.
That is, the Estonian council’s actual competence is restricted to a minimum, i.e., as
legislator and representative of owners’ (community property) rights. The cabinet man-
ages and shapes local policy, which the council then debates and approves or does not
approve. Thus, council acts in the policy process primarily as a supplementary political
check (or control) and legitimizer of decisions elaborated by the government. Even in
the appointment of cabinet, the council could approve or disapprove the mayor’s choice.
All other appointments are at the discretion of the mayor.
Our analysis of budgeting practices revealed quite extensive cooperation and a clear
division of roles between government and council. The main actor in the budgeting
process was of course the government. But government, which is interested in the smooth
adoption of its budget, involved key actors from council in the budget preparation
process, including the establishment of expenditure “ceilings” and the harmonization
of details. Cooperation between governing institutions and civil society is also visible
in other areas. Chairs of other committees and especially members of commissions (the
latter must not be members of council) are often leaders of civil society or of a public
organization in the same area that is strictly prohibited in Latvia.
However, council members have the power to exert political control over the mayor
and cabinet. Hence, partisan politics is crucial for balancing those two institutions in
this form of governance. In 1997–98 the commission for public administration reform
suggested introducing the position of city manager. But in the cabinet system this is
not necessary because of the strong balance between the roles of mayor and council.
Party factions could be separate and powerful actors in multiparty governments, which
would make the council more independent vis-à-vis the mayor.
We turn now from the description of the models, legal provisions, and actual practices
of local governance in the three countries, to the data that informs our study.
285
I N S T I T U T I O N A L B A L A N C E
3. DATA AND RESEARCH METHODS
The data was created within the framework of the “Indicators of Local Democracy”
project that was developed and coordinated by the Toqueville Research Center in
Budapest. Surveys were carried out in Hungary and Latvia in the spring of 2001 and
in Estonia in the fall of 2002 and early winter 2003. There were two different surveys.
One was the Local Government Survey (LGS) which polled top officials from local
administrations in an effort to identify, through more or less neutral respondents, the
main parameters of the functioning of local government and local democracy. The other
was the Local Representatives Survey (LRS) in which the work of council and values
of local council members were expressed. As the project was carefully managed and
coordinated from the Toqueville Research Center, the research was almost identical in
all seven countries that participated. Here we describe the research process and methods
that were employed in Estonia.
The sampling for the local councilors’ survey was established according to population
size. If a municipality was sampled, all the local councilors of that municipality were
included in the study. The sample included 120 municipalities out of 241 (n=1,878),
and the survey was conducted by mail. The response rate in Estonia was 56.5%. In
Hungary the sample included 3,192 respondents, with a response rate of 29%. This
survey was not done in Latvia.
For the chief administrative officers’ survey, at least two top officials were selected
from each of the 241 municipalities (that is, the number of LG units) in the sampling
frame. In Hungary and Latvia the survey was conducted by interview and in Estonia
by mail. The LGS questionnaires were sent to the respondents by post and returned in
the same way to the research group. In Hungary the sample was 704 persons and 646
were polled. In Latvia the sample was 280 and 241 were polled. In Estonia the survey
included 355 persons. The response rate overall was 76.4%. Table 7.1 shows the sent
and returned questionnaires as they were distributed across the regions.
The standard format of the LRS and LGS questionnaires was used with minor ad-
aptations for the specifics of the Estonian LG system. Some changes were made because
of the extremely small size of Estonia and Estonian municipalities, but these minor
amendments do not harm the comparability of the data. The Estonian version of the
questionnaire has been translated back into English and checked for correctness at the
T–RC. The LRS questionnaire contains 68 items and the LGS one 95.
The survey data are analyzed against a number of background variables, the most
common of which is the size of municipality.
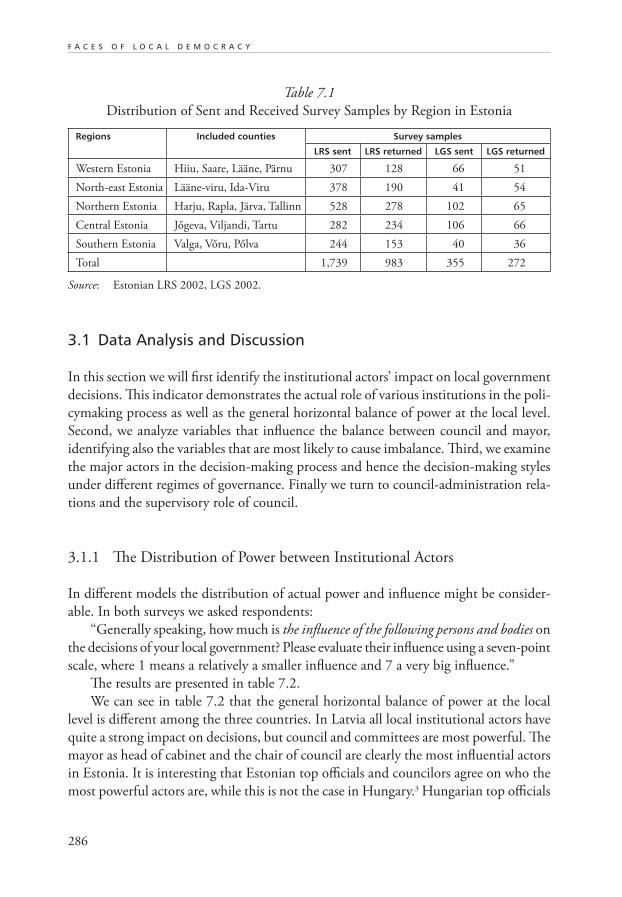
286
F A C E S O F L O C A L D E M O C R A C Y
3.1 Data Analysis and Discussion
In this section we will first identify the institutional actors’ impact on local government
decisions. This indicator demonstrates the actual role of various institutions in the poli-
cymaking process as well as the general horizontal balance of power at the local level.
Second, we analyze variables that influence the balance between council and mayor,
identifying also the variables that are most likely to cause imbalance. Third, we examine
the major actors in the decision-making process and hence the decision-making styles
under different regimes of governance. Finally we turn to council-administration rela-
tions and the supervisory role of council.
3.1.1 The Distribution of Power between Institutional Actors
In different models the distribution of actual power and influence might be consider-
able. In both surveys we asked respondents:
“Generally speaking, how much is the influence of the following persons and bodies on
the decisions of your local government? Please evaluate their influence using a seven-point
scale, where 1 means a relatively a smaller influence and 7 a very big influence.”
The results are presented in table 7.2.
We can see in table 7.2 that the general horizontal balance of power at the local
level is different among the three countries. In Latvia all local institutional actors have
quite a strong impact on decisions, but council and committees are most powerful. The
mayor as head of cabinet and the chair of council are clearly the most influential actors
in Estonia. It is interesting that Estonian top officials and councilors agree on who the
most powerful actors are, while this is not the case in Hungary.3 Hungarian top officials
Table 7.1
Distribution of Sent and Received Survey Samples by Region in Estonia
Regions Included counties Survey samples
LRS sent LRS returned LGS sent LGS returned
Western Estonia Hiiu, Saare, Lääne, Pärnu 307 128 66 51
North-east Estonia Lääne-viru, Ida-Viru 378 190 41 54
Northern Estonia Harju, Rapla, Järva, Tallinn 528 278 102 65
Central Estonia Jőgeva, Viljandi, Tartu 282 234 106 66
Southern Estonia Valga, Vőru, Pőlva 244 153 40 36
Total 1,739 983 355 272
Source: Estonian LRS 2002, LGS 2002.
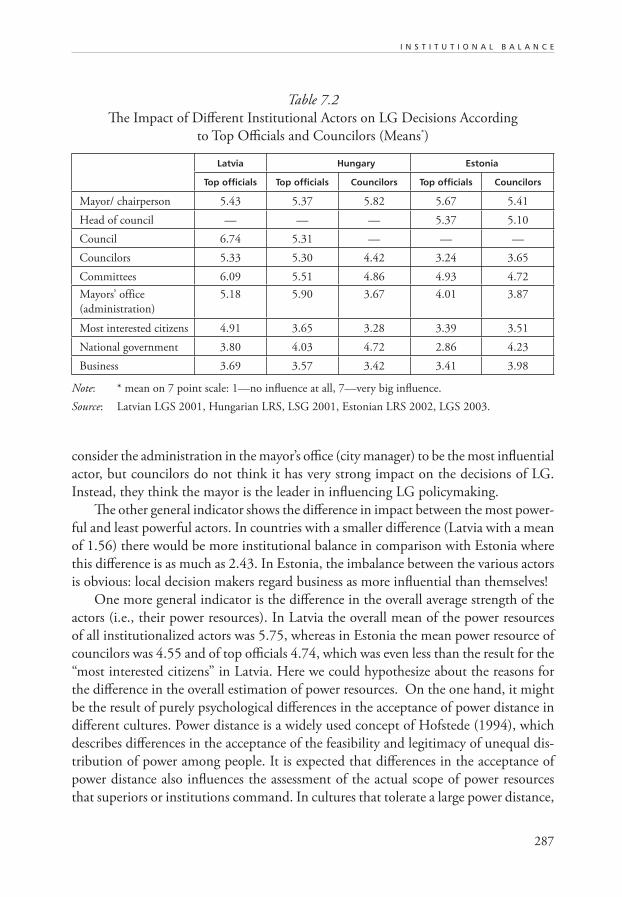
287
I N S T I T U T I O N A L B A L A N C E
consider the administration in the mayor’s office (city manager) to be the most influential
actor, but councilors do not think it has very strong impact on the decisions of LG.
Instead, they think the mayor is the leader in influencing LG policymaking.
The other general indicator shows the difference in impact between the most power-
ful and least powerful actors. In countries with a smaller difference (Latvia with a mean
of 1.56) there would be more institutional balance in comparison with Estonia where
this difference is as much as 2.43. In Estonia, the imbalance between the various actors
is obvious: local decision makers regard business as more influential than themselves!
One more general indicator is the difference in the overall average strength of the
actors (i.e., their power resources). In Latvia the overall mean of the power resources
of all institutionalized actors was 5.75, whereas in Estonia the mean power resource of
councilors was 4.55 and of top officials 4.74, which was even less than the result for the
“most interested citizens” in Latvia. Here we could hypothesize about the reasons for
the difference in the overall estimation of power resources. On the one hand, it might
be the result of purely psychological differences in the acceptance of power distance in
different cultures. Power distance is a widely used concept of Hofstede (1994), which
describes differences in the acceptance of the feasibility and legitimacy of unequal dis-
tribution of power among people. It is expected that differences in the acceptance of
power distance also influences the assessment of the actual scope of power resources
that superiors or institutions command. In cultures that tolerate a large power distance,
Table 7.2
The Impact of Different Institutional Actors on LG Decisions According
to Top Officials and Councilors (Means*)
Latvia Hungary Estonia
Top officials Top officials Councilors Top officials Councilors
Mayor/ chairperson 5.43 5.37 5.82 5.67 5.41
Head of council — — — 5.37 5.10
Council 6.74 5.31 — — —
Councilors 5.33 5.30 4.42 3.24 3.65
Committees 6.09 5.51 4.86 4.93 4.72
Mayors’ office
(administration)
5.18 5.90 3.67 4.01 3.87
Most interested citizens 4.91 3.65 3.28 3.39 3.51
National government 3.80 4.03 4.72 2.86 4.23
Business 3.69 3.57 3.42 3.41 3.98
Note: * mean on 7 point scale: 1—no influence at all, 7—very big influence.
Source: Latvian LGS 2001, Hungarian LRS, LSG 2001, Estonian LRS 2002, LGS 2003.
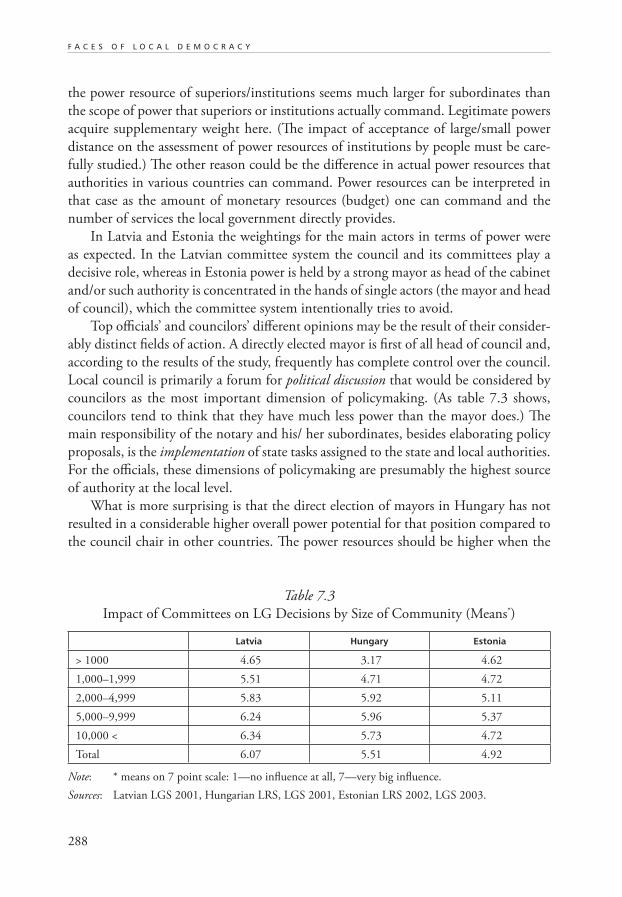
288
F A C E S O F L O C A L D E M O C R A C Y
the power resource of superiors/institutions seems much larger for subordinates than
the scope of power that superiors or institutions actually command. Legitimate powers
acquire supplementary weight here. (The impact of acceptance of large/small power
distance on the assessment of power resources of institutions by people must be care-
fully studied.) The other reason could be the difference in actual power resources that
authorities in various countries can command. Power resources can be interpreted in
that case as the amount of monetary resources (budget) one can command and the
number of services the local government directly provides.
In Latvia and Estonia the weightings for the main actors in terms of power were
as expected. In the Latvian committee system the council and its committees play a
decisive role, whereas in Estonia power is held by a strong mayor as head of the cabinet
and/or such authority is concentrated in the hands of single actors (the mayor and head
of council), which the committee system intentionally tries to avoid.
Top officials’ and councilors’ different opinions may be the result of their consider-
ably distinct fields of action. A directly elected mayor is first of all head of council and,
according to the results of the study, frequently has complete control over the council.
Local council is primarily a forum for political discussion that would be considered by
councilors as the most important dimension of policymaking. (As table 7.3 shows,
councilors tend to think that they have much less power than the mayor does.) The
main responsibility of the notary and his/ her subordinates, besides elaborating policy
proposals, is the implementation of state tasks assigned to the state and local authorities.
For the officials, these dimensions of policymaking are presumably the highest source
of authority at the local level.
What is more surprising is that the direct election of mayors in Hungary has not
resulted in a considerable higher overall power potential for that position compared to
the council chair in other countries. The power resources should be higher when the
Table 7.3
Impact of Committees on LG Decisions by Size of Community (Means*)
Latvia Hungary Estonia
> 1000 4.65 3.17 4.62
1,000–1,999 5.51 4.71 4.72
2,000–4,999 5.83 5.92 5.11
5,000–9,999 6.24 5.96 5.37
10,000 < 6.34 5.73 4.72
Total 6.07 5.51 4.92
Note: * means on 7 point scale: 1—no influence at all, 7—very big influence.
Sources: Latvian LGS 2001, Hungarian LRS, LGS 2001, Estonian LRS 2002, LGS 2003.
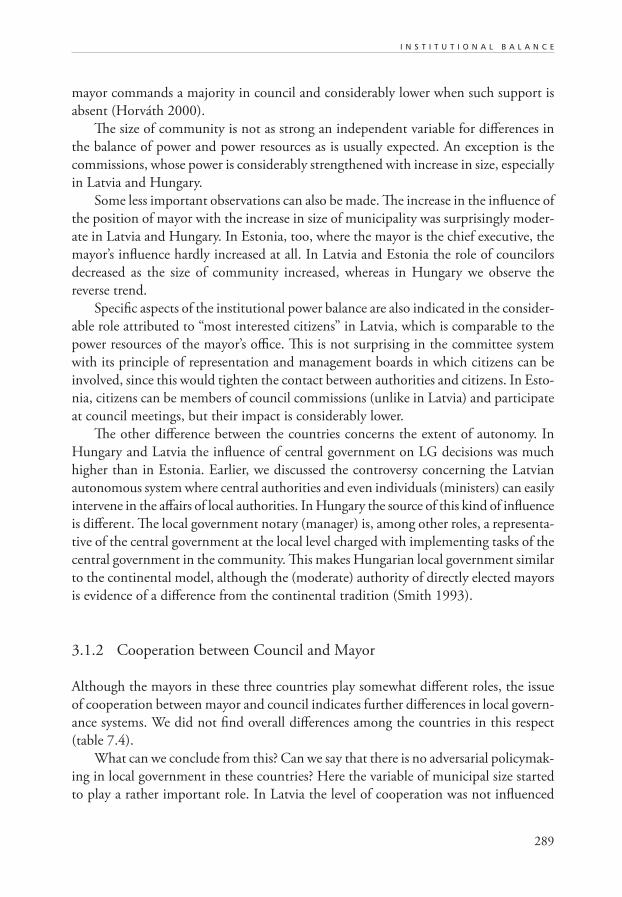
289
I N S T I T U T I O N A L B A L A N C E
mayor commands a majority in council and considerably lower when such support is
absent (Horváth 2000).
The size of community is not as strong an independent variable for differences in
the balance of power and power resources as is usually expected. An exception is the
commissions, whose power is considerably strengthened with increase in size, especially
in Latvia and Hungary.
Some less important observations can also be made. The increase in the influence of
the position of mayor with the increase in size of municipality was surprisingly moder-
ate in Latvia and Hungary. In Estonia, too, where the mayor is the chief executive, the
mayor’s influence hardly increased at all. In Latvia and Estonia the role of councilors
decreased as the size of community increased, whereas in Hungary we observe the
reverse trend.
Specific aspects of the institutional power balance are also indicated in the consider-
able role attributed to “most interested citizens” in Latvia, which is comparable to the
power resources of the mayor’s office. This is not surprising in the committee system
with its principle of representation and management boards in which citizens can be
involved, since this would tighten the contact between authorities and citizens. In Esto-
nia, citizens can be members of council commissions (unlike in Latvia) and participate
at council meetings, but their impact is considerably lower.
The other difference between the countries concerns the extent of autonomy. In
Hungary and Latvia the influence of central government on LG decisions was much
higher than in Estonia. Earlier, we discussed the controversy concerning the Latvian
autonomous system where central authorities and even individuals (ministers) can easily
intervene in the affairs of local authorities. In Hungary the source of this kind of influence
is different. The local government notary (manager) is, among other roles, a representa-
tive of the central government at the local level charged with implementing tasks of the
central government in the community. This makes Hungarian local government similar
to the continental model, although the (moderate) authority of directly elected mayors
is evidence of a difference from the continental tradition (Smith 1993).
3.1.2 Cooperation between Council and Mayor
Although the mayors in these three countries play somewhat different roles, the issue
of cooperation between mayor and council indicates further differences in local govern-
ance systems. We did not find overall differences among the countries in this respect
(table 7.4).
What can we conclude from this? Can we say that there is no adversarial policymak-
ing in local government in these countries? Here the variable of municipal size started
to play a rather important role. In Latvia the level of cooperation was not influenced
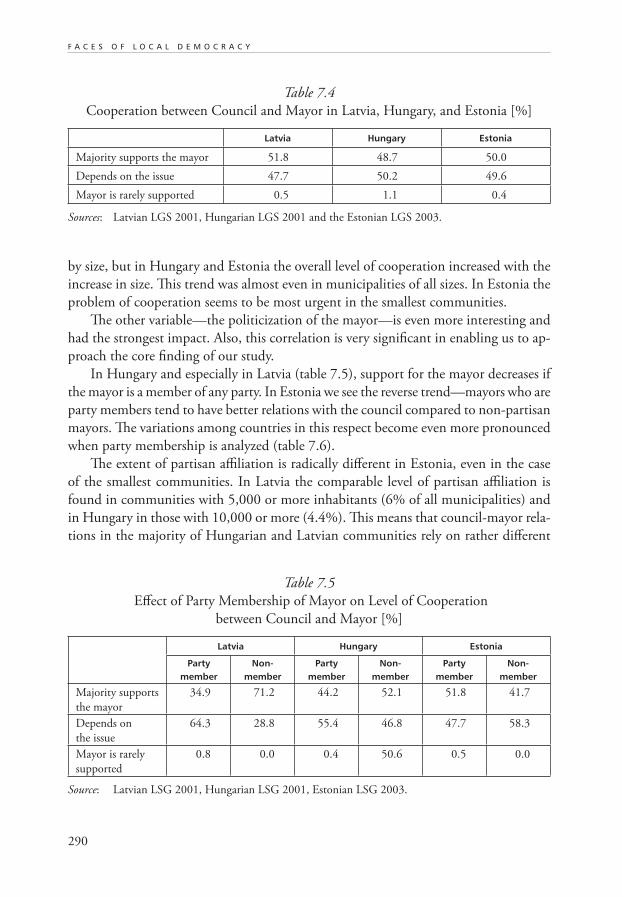
290
F A C E S O F L O C A L D E M O C R A C Y
by size, but in Hungary and Estonia the overall level of cooperation increased with the
increase in size. This trend was almost even in municipalities of all sizes. In Estonia the
problem of cooperation seems to be most urgent in the smallest communities.
The other variable—the politicization of the mayor—is even more interesting and
had the strongest impact. Also, this correlation is very significant in enabling us to ap-
proach the core finding of our study.
In Hungary and especially in Latvia (table 7.5), support for the mayor decreases if
the mayor is a member of any party. In Estonia we see the reverse trend—mayors who are
party members tend to have better relations with the council compared to non-partisan
mayors. The variations among countries in this respect become even more pronounced
when party membership is analyzed (table 7.6).
The extent of partisan affiliation is radically different in Estonia, even in the case
of the smallest communities. In Latvia the comparable level of partisan affiliation is
found in communities with 5,000 or more inhabitants (6% of all municipalities) and
in Hungary in those with 10,000 or more (4.4%). This means that council-mayor rela-
tions in the majority of Hungarian and Latvian communities rely on rather different
Table 7.4
Cooperation between Council and Mayor in Latvia, Hungary, and Estonia [%]
Latvia Hungary Estonia
Majority supports the mayor 51.8 48.7 50.0
Depends on the issue 47.7 50.2 49.6
Mayor is rarely supported 0.5 1.1 0.4
Sources: Latvian LGS 2001, Hungarian LGS 2001 and the Estonian LGS 2003.
Table 7.5
Effect of Party Membership of Mayor on Level of Cooperation
between Council and Mayor [%]
Latvia Hungary Estonia
Party member
Non-member
Party member
Non-member
Party member
Non- member
Majority supports
the mayor
34.9 71.2 44.2 52.1 51.8 41.7
Depends on
the issue
64.3 28.8 55.4 46.8 47.7 58.3
Mayor is rarely
supported
0.8 0.0 0.4 50.6 0.5 0.0
Source: Latvian LSG 2001, Hungarian LSG 2001, Estonian LSG 2003.
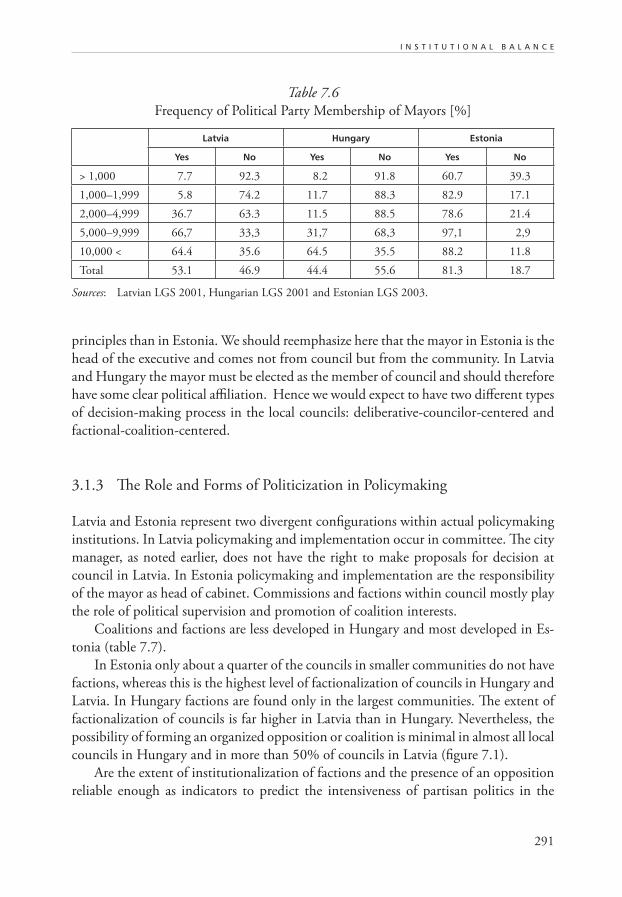
291
I N S T I T U T I O N A L B A L A N C E
Table 7.6
Frequency of Political Party Membership of Mayors [%]
Latvia Hungary Estonia
Yes No Yes No Yes No
> 1,000 7.7 92.3 8.2 91.8 60.7 39.3
1,000–1,999 5.8 74.2 11.7 88.3 82.9 17.1
2,000–4,999 36.7 63.3 11.5 88.5 78.6 21.4
5,000–9,999 66,7 33,3 31,7 68,3 97,1 2,9
10,000 < 64.4 35.6 64.5 35.5 88.2 11.8
Total 53.1 46.9 44.4 55.6 81.3 18.7
Sources: Latvian LGS 2001, Hungarian LGS 2001 and Estonian LGS 2003.
principles than in Estonia. We should reemphasize here that the mayor in Estonia is the
head of the executive and comes not from council but from the community. In Latvia
and Hungary the mayor must be elected as the member of council and should therefore
have some clear political affiliation. Hence we would expect to have two different types
of decision-making process in the local councils: deliberative-councilor-centered and
factional-coalition-centered.
3.1.3 The Role and Forms of Politicization in Policymaking
Latvia and Estonia represent two divergent configurations within actual policymaking
institutions. In Latvia policymaking and implementation occur in committee. The city
manager, as noted earlier, does not have the right to make proposals for decision at
council in Latvia. In Estonia policymaking and implementation are the responsibility
of the mayor as head of cabinet. Commissions and factions within council mostly play
the role of political supervision and promotion of coalition interests.
Coalitions and factions are less developed in Hungary and most developed in Es-
tonia (table 7.7).
In Estonia only about a quarter of the councils in smaller communities do not have
factions, whereas this is the highest level of factionalization of councils in Hungary and
Latvia. In Hungary factions are found only in the largest communities. The extent of
factionalization of councils is far higher in Latvia than in Hungary. Nevertheless, the
possibility of forming an organized opposition or coalition is minimal in almost all local
councils in Hungary and in more than 50% of councils in Latvia (figure 7.1).
Are the extent of institutionalization of factions and the presence of an opposition
reliable enough as indicators to predict the intensiveness of partisan politics in the
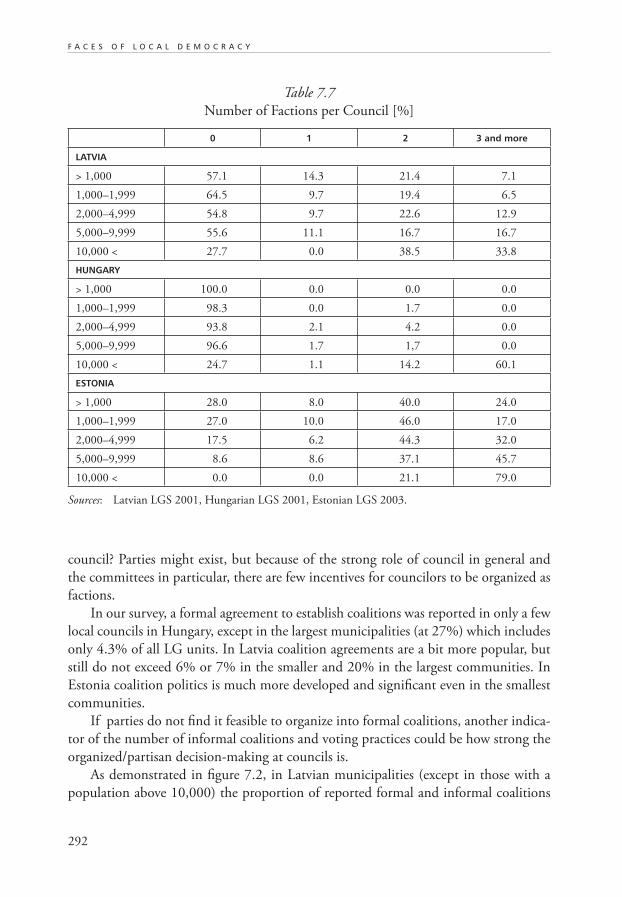
292
F A C E S O F L O C A L D E M O C R A C Y
council? Parties might exist, but because of the strong role of council in general and
the committees in particular, there are few incentives for councilors to be organized as
factions.
In our survey, a formal agreement to establish coalitions was reported in only a few
local councils in Hungary, except in the largest municipalities (at 27%) which includes
only 4.3% of all LG units. In Latvia coalition agreements are a bit more popular, but
still do not exceed 6% or 7% in the smaller and 20% in the largest communities. In
Estonia coalition politics is much more developed and significant even in the smallest
communities.
If parties do not find it feasible to organize into formal coalitions, another indica-
tor of the number of informal coalitions and voting practices could be how strong the
organized/partisan decision-making at councils is.
As demonstrated in figure 7.2, in Latvian municipalities (except in those with a
population above 10,000) the proportion of reported formal and informal coalitions
Table 7.7
Number of Factions per Council [%]
0 1 2 3 and more
LATVIA
> 1,000 57.1 14.3 21.4 7.1
1,000–1,999 64.5 9.7 19.4 6.5
2,000–4,999 54.8 9.7 22.6 12.9
5,000–9,999 55.6 11.1 16.7 16.7
10,000 < 27.7 0.0 38.5 33.8
HUNGARY
> 1,000 100.0 0.0 0.0 0.0
1,000–1,999 98.3 0.0 1.7 0.0
2,000–4,999 93.8 2.1 4.2 0.0
5,000–9,999 96.6 1.7 1,7 0.0
10,000 < 24.7 1.1 14.2 60.1
ESTONIA
> 1,000 28.0 8.0 40.0 24.0
1,000–1,999 27.0 10.0 46.0 17.0
2,000–4,999 17.5 6.2 44.3 32.0
5,000–9,999 8.6 8.6 37.1 45.7
10,000 < 0.0 0.0 21.1 79.0
Sources: Latvian LGS 2001, Hungarian LGS 2001, Estonian LGS 2003.
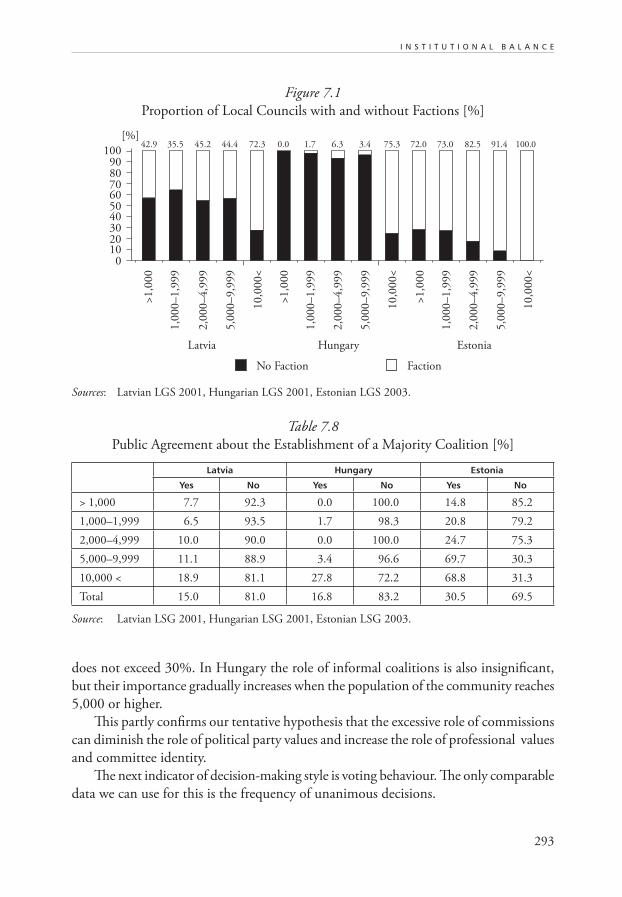
293
I N S T I T U T I O N A L B A L A N C E
Table 7.8
Public Agreement about the Establishment of a Majority Coalition [%]
Latvia Hungary Estonia
Yes No Yes No Yes No
> 1,000 7.7 92.3 0.0 100.0 14.8 85.2
1,000–1,999 6.5 93.5 1.7 98.3 20.8 79.2
2,000–4,999 10.0 90.0 0.0 100.0 24.7 75.3
5,000–9,999 11.1 88.9 3.4 96.6 69.7 30.3
10,000 < 18.9 81.1 27.8 72.2 68.8 31.3
Total 15.0 81.0 16.8 83.2 30.5 69.5
Source: Latvian LSG 2001, Hungarian LSG 2001, Estonian LSG 2003.
Figure 7.1
Proportion of Local Councils with and without Factions [%]
Sources: Latvian LGS 2001, Hungarian LGS 2001, Estonian LGS 2003.
10203040
0
5060
>1,0
00
708090
100
1,0
00–1,9
99
2,0
00–4,9
99
5,0
00–9,9
99
10,0
00<
>1,0
00
1,0
00–1,9
99
2,0
00–4,9
99
5,0
00–9,9
99
10,0
00<
>1,0
00
1,0
00–1,9
99
2,0
00–4,9
99
5,0
00–9,9
99
10,0
00<
Latvia Hungary Estonia
[%]42.9 35.5 45.2 44.4 72.3 0.0 1.7 6.3 3.4 75.3 72.0 73.0 82.5 91.4 100.0
No Faction Faction
does not exceed 30%. In Hungary the role of informal coalitions is also insignificant,
but their importance gradually increases when the population of the community reaches
5,000 or higher.
This partly confirms our tentative hypothesis that the excessive role of commissions
can diminish the role of political party values and increase the role of professional values
and committee identity.
The next indicator of decision-making style is voting behaviour. The only comparable
data we can use for this is the frequency of unanimous decisions.
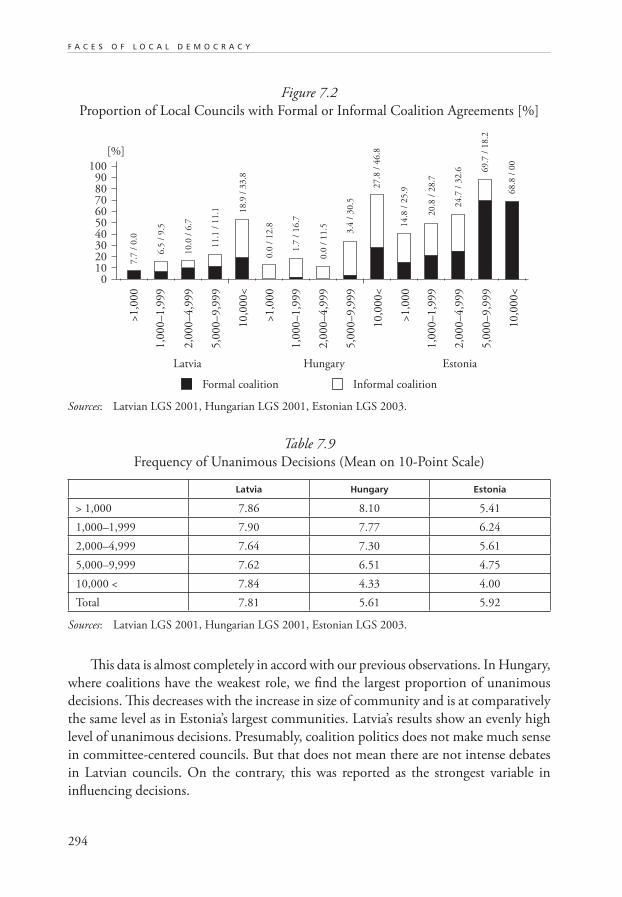
294
F A C E S O F L O C A L D E M O C R A C Y
Table 7.9
Frequency of Unanimous Decisions (Mean on 10-Point Scale)
Latvia Hungary Estonia
> 1,000 7.86 8.10 5.41
1,000–1,999 7.90 7.77 6.24
2,000–4,999 7.64 7.30 5.61
5,000–9,999 7.62 6.51 4.75
10,000 < 7.84 4.33 4.00
Total 7.81 5.61 5.92
Sources: Latvian LGS 2001, Hungarian LGS 2001, Estonian LGS 2003.
Figure 7.2
Proportion of Local Councils with Formal or Informal Coalition Agreements [%]
10203040
0
5060
>1,0
00
708090
1001,0
00–1,9
99
2,0
00–4,9
99
5,0
00–9,9
99
10,0
00<
>1,0
00
1,0
00–1,9
99
2,0
00–4,9
99
5,0
00–9,9
99
10,0
00<
>1,0
00
1,0
00–1,9
99
2,0
00–4,9
99
5,0
00–9,9
99
10,0
00<
Latvia Hungary Estonia
[%]
7.7
/ 0
.0
6.5
/ 9
.5
10.0
/ 6
.7
11.1
/ 1
1.1 1
8.9
/ 3
3.8
0.0
/ 1
2.8
1.7
/ 1
6.7
0.0
/ 1
1.5 3.4
/ 3
0.5
27.8
/ 4
6.8
14.8
/ 2
5.9
20.8
/ 2
8.7
24.7
/ 3
2.6 6
9.7
/ 1
8.2
68.8
/ 0
0
Formal coalition Informal coalition
This data is almost completely in accord with our previous observations. In Hungary,
where coalitions have the weakest role, we find the largest proportion of unanimous
decisions. This decreases with the increase in size of community and is at comparatively
the same level as in Estonia’s largest communities. Latvia’s results show an evenly high
level of unanimous decisions. Presumably, coalition politics does not make much sense
in committee-centered councils. But that does not mean there are not intense debates
in Latvian councils. On the contrary, this was reported as the strongest variable in
influencing decisions.
Sources: Latvian LGS 2001, Hungarian LGS 2001, Estonian LGS 2003.
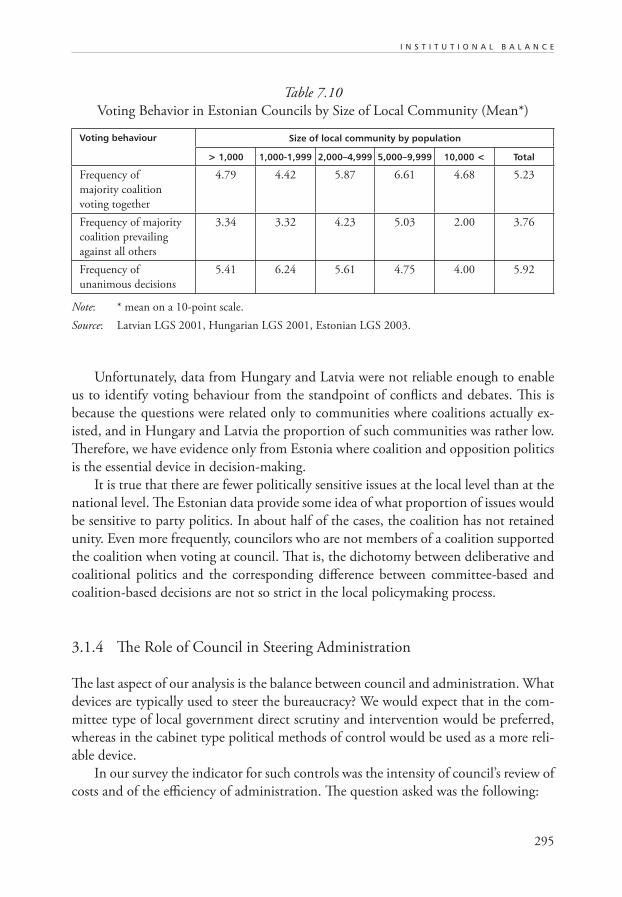
295
I N S T I T U T I O N A L B A L A N C E
Unfortunately, data from Hungary and Latvia were not reliable enough to enable
us to identify voting behaviour from the standpoint of conflicts and debates. This is
because the questions were related only to communities where coalitions actually ex-
isted, and in Hungary and Latvia the proportion of such communities was rather low.
Therefore, we have evidence only from Estonia where coalition and opposition politics
is the essential device in decision-making.
It is true that there are fewer politically sensitive issues at the local level than at the
national level. The Estonian data provide some idea of what proportion of issues would
be sensitive to party politics. In about half of the cases, the coalition has not retained
unity. Even more frequently, councilors who are not members of a coalition supported
the coalition when voting at council. That is, the dichotomy between deliberative and
coalitional politics and the corresponding difference between committee-based and
coalition-based decisions are not so strict in the local policymaking process.
3.1.4 The Role of Council in Steering Administration
The last aspect of our analysis is the balance between council and administration. What
devices are typically used to steer the bureaucracy? We would expect that in the com-
mittee type of local government direct scrutiny and intervention would be preferred,
whereas in the cabinet type political methods of control would be used as a more reli-
able device.
In our survey the indicator for such controls was the intensity of council’s review of
costs and of the efficiency of administration. The question asked was the following:
Table 7.10
Voting Behavior in Estonian Councils by Size of Local Community (Mean*)
Voting behaviour Size of local community by population
> 1,000 1,000-1,999 2,000–4,999 5,000–9,999 10,000 < Total
Frequency of
majority coalition
voting together
4.79 4.42 5.87 6.61 4.68 5.23
Frequency of majority
coalition prevailing
against all others
3.34 3.32 4.23 5.03 2.00 3.76
Frequency of
unanimous decisions
5.41 6.24 5.61 4.75 4.00 5.92
Note: * mean on a 10-point scale.
Source: Latvian LGS 2001, Hungarian LGS 2001, Estonian LGS 2003.
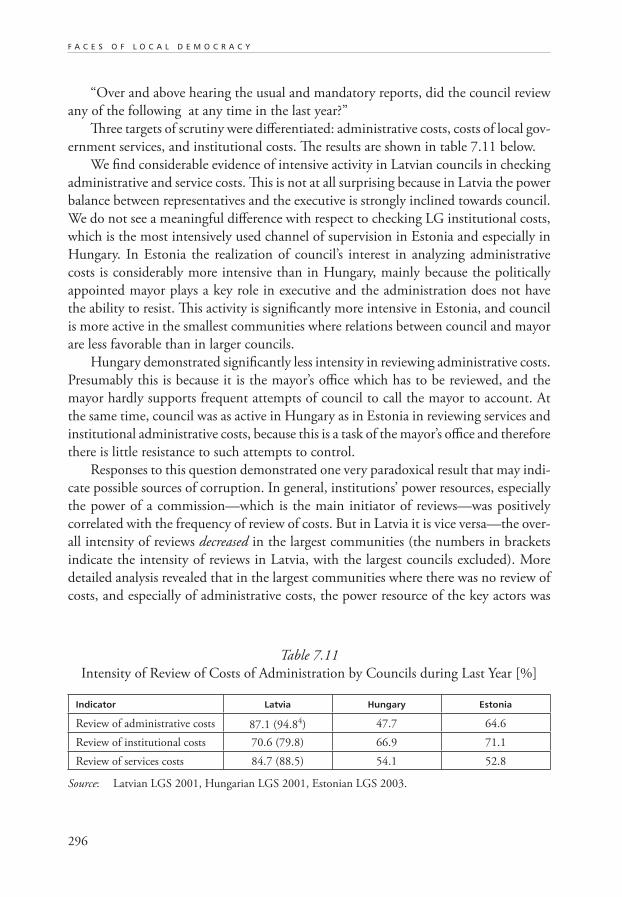
296
F A C E S O F L O C A L D E M O C R A C Y
“Over and above hearing the usual and mandatory reports, did the council review
any of the following at any time in the last year?”
Three targets of scrutiny were differentiated: administrative costs, costs of local gov-
ernment services, and institutional costs. The results are shown in table 7.11 below.
We find considerable evidence of intensive activity in Latvian councils in checking
administrative and service costs. This is not at all surprising because in Latvia the power
balance between representatives and the executive is strongly inclined towards council.
We do not see a meaningful difference with respect to checking LG institutional costs,
which is the most intensively used channel of supervision in Estonia and especially in
Hungary. In Estonia the realization of council’s interest in analyzing administrative
costs is considerably more intensive than in Hungary, mainly because the politically
appointed mayor plays a key role in executive and the administration does not have
the ability to resist. This activity is significantly more intensive in Estonia, and council
is more active in the smallest communities where relations between council and mayor
are less favorable than in larger councils.
Hungary demonstrated significantly less intensity in reviewing administrative costs.
Presumably this is because it is the mayor’s office which has to be reviewed, and the
mayor hardly supports frequent attempts of council to call the mayor to account. At
the same time, council was as active in Hungary as in Estonia in reviewing services and
institutional administrative costs, because this is a task of the mayor’s office and therefore
there is little resistance to such attempts to control.
Responses to this question demonstrated one very paradoxical result that may indi-
cate possible sources of corruption. In general, institutions’ power resources, especially
the power of a commission—which is the main initiator of reviews—was positively
correlated with the frequency of review of costs. But in Latvia it is vice versa—the over-
all intensity of reviews decreased in the largest communities (the numbers in brackets
indicate the intensity of reviews in Latvia, with the largest councils excluded). More
detailed analysis revealed that in the largest communities where there was no review of
costs, and especially of administrative costs, the power resource of the key actors was
Table 7.11
Intensity of Review of Costs of Administration by Councils during Last Year [%]
Indicator Latvia Hungary Estonia
Review of administrative costs 87.1 (94.84) 47.7 64.6
Review of institutional costs 70.6 (79.8) 66.9 71.1
Review of services costs 84.7 (88.5) 54.1 52.8
Source: Latvian LGS 2001, Hungarian LGS 2001, Estonian LGS 2003.
297
I N S T I T U T I O N A L B A L A N C E
higher than that of the key actors in communities which did carry out the review. Hence,
in some communities where there is extensive concentration of power in the hands of
council and its institutions, the power resource could also be used to hinder the control
of administration. We observed a similar statistical trend in Estonia, but in the smallest
communities in which the decision-making style was significantly more deliberative than
in larger communities where factions and coalition-based decision-making prevails.
4. CONCLUSION
It is a rather risky enterprise to seek quantitative evidence for the existence of different
theoretical models of local government in different countries. Even if the main variable
accounting for differences among the countries is the legal frameworks, we find that on
concrete issues there is also considerable variation among local governments within one
country, which indicates that rather different patterns of actual behaviour and attitudes
do exist in the same legal framework.
We observed clear differences between Estonia and Latvia in institutional configu-
rations, the distribution of authority and patterns of behaviour, which have obviously
developed in rather different legal contexts in those two countries. In Estonia the strong
role of the executive and in Latvia the strong role of council is emphasized. That is,
consistent committee and cabinet systems produce internally more homogeneous local
governance in comparison with the council-mayor system. In Hungary, such differences
are caused not only by political variables but also by differences in the legal context at
elections in both smaller and large communities. However, such different perceptions of
the roles of institutional actors in local governance by officials and councilors in Hun-
gary indicated the dispersion of policymaking authority between the main institutions.
Whether this flexibility of institutional and role configurations can contribute to the
effectiveness of local democracy is a research question for further analysis.
NOTES
1 This chapter is the revised version of a paper presented at the 8th IRSPM Symposium, Budapest, March
30–April 2, 2004. The article was written in the framework of the project.
2 This concept—derived from French government practice—means that a directly elected mayor cannot
command a majority at the council which is elected separately and according to other rules.
2 Local Representative Study was not done in Latvia and so we can not compare Latvian top officials’
and councilors’ opinions.
3 Indicator of frequency in largest communities.
298
F A C E S O F L O C A L D E M O C R A C Y
REFERENCES
Act No. LXIV on the Election of Local Municipal Government Representatives and
Mayors. 1990. Hungary.
Act No. LXV on Local Governments. 1990. Hungary.
Adrian, C.R. 1998. Forms of city government in American history. Municipal Yearbook
1998. Washington, DC: ICMA.
Amna, E. and S. Montin (eds.). 2001. Towards a New Concept of Local Self-government?
Bergen: Fagbokforlaget.
Bennett, R. 1997. Local Government in Post-socialist Cities. LGI Discussion paper No.
2. Budapest: Local Government and Public Service Reform Initiative, Open Society
Institute–Budapest.
Blichner, L.C. and L. Sangolt. 1994. The concept of subsidiarity and the debate on
European cooperation: Pitfalls and possibilities. Governance 7 (3):284–306.
Coulson, A. (ed.). 1995. Local Government in Eastern Europe. Establishing Democracy
at the Grassroots. Hents, UK: Edward Elgar Publishing Ltd.
Frederickson, G, C. Wood, and B. Logan. 2001. How American city governments have
changed: The evolution of the model city charter. National Civic Review 90 (1):
3–18. (EBSCO)
Hansell, B. 1999. Revisiting the reform of the reform. Public Management 81:27–28.
———. 2000. Evolution and change characterize council-manager government. Public
Management 82 (8):17–21. (EBSCO)
Hofstede, G. 1994. Cultures and Organisations: Software of the Mind. London:
McGraw-Hill.
Horváth, T. M. 2000. Decentralization: Experiments and Reforms. Budapest: Local Govern-
ment and Public Service Reform Initiative, Open Society Institute–Budapest.
Hőgye, M. et al. 2002. Local government budgeting: Hungary. In: M. Hőgye (ed.).
Local Government Budgeting. Budapest: Local Government and Public Service
Reform Initiative, Open Society Institute–Budapest.
John, P. 2001. Local Governance in Western Europe. London: Sage.
Kimball, J.D. (ed.). 1999. The Transfer of Power: Decentralization in Central and Eastern
Europe. Budapest: Local Government and Public Service Reform Initiative, Open
Society Institute–Budapest.
299
I N S T I T U T I O N A L B A L A N C E
Kjellberg, F. 1993. Between autonomy and integration: The revision of the Norwegian
Local Government Act 1987–1992. Paper presented to the International Seminar
Process of Institutionalisation at the Local Level, June 9–12, Oslo.
Kjellberg, F., J. Reschova, and G. Sootla. 1994. The role of local autonomy in demo-
cratic and democratising societies. The new local government acts in the Czech
Republic, Estonia and Norway. Paper presented at the XVI IPSA World Congress,
August 21–25, Berlin.
Law on Local Government. Latvia.
Leemans, A.F. 1970. Changing Patterns of Local Government. The Hague: IULA.
Local Government Organization Act (Estonia).
Mouritzen, P. and J. Svara. 2002. Leadership at the Apex. Politicians and Administrators
in Western Local Governments. Pittsburgh, PA: University of Pittsburgh Press.
Page, E. and M. Goldsmith. 1987. Central and Local Government Relations. Beverly
Hills: Sage.
Powell, W. and P. DiMaggio (eds.). 1991. The New Institutionalism in Organizational
Analysis. Chicago, IL: University of Chicago Press.
Rao, N. 1999. Representing the people? Testing assumptions about local government
reform. Public Administration 77(2):235–256.
Soós. G. et al. (eds.). 2002. The State of Local Democracy in Central Europe. Budapest:
Local Government and Public Service Reform Initiative, Open Society Institute–
Budapest.
Sootla G. et al. 2002. Local government budgeting: Estonia. In: M. Hőgye (ed.).
Local Government Budgeting. Budapest: Local Government and Public Service Reform
Initiative, Open Society Institute–Budapest.
Sootla, G. 1995. The reform of local government in Estonia: Contradictions of the
development of autonomous model. In: J. Jabes and M. Vintar (eds.). Public
Administration in Transition. Bratislava: NISPAcee.
Stoker, G. 1991. The Politics of Local Government. London: Macmillan.
Svara, J. 1990. Official Leadership in the City. Patterns of Conflict and Cooperation.
Oxford, UK: Oxford University Press.
Svara, J. 2001. Do we still need model charters? The meaning and relevance of reform
in the twenty-first century. National Civic Review 90 (1) (EBSCO).
Vanberg, V. 1997. Subsidiarity, responsive government and individual liberty. In:
B. Steuenberg and F. Van Vught (eds.). Political Institutions and Public Policy. Dor-
drecht: Kluwer Academic Publishers.
300
F A C E S O F L O C A L D E M O C R A C Y
Vanags, E. and I. Vilka. 2000. Local government in Latvia. In: T. Horváth, ed. Decen-
tralization: Experiments and Reforms. Budapest: Local Government and Public Service
Reform Initiative, Open Society Institute–Budapest.
Vilka, I., M. Pukis, and E. Vanags. 2002. County report—Latvia. In: G. Soós, G. Tóka,
and G. Wright (eds.). The State of Local Democracy in Central Europe. Budapest:
Local Government and Public Service Reform Initiative, Open Society Institute–
Budapest.
Wright, G. 1995. The division of central local government functions. In: J. Jabes, and
M. Vintar (eds.). Public Administration in Transition. Bratislava: NISPAcee.
301
Index
Accountability 6, 129, 210, 220, 226, 228, 230,
233, 241, 247, 250, 251
Activism 83, 94–99, 116, 220, 226, 230, 252
Administration 3, 21, 57, 61, 82, 148, 190, 211,
213, 214, 217, 232, 234, 245, 249, 254,
275, 280–287, 295–297
Age 7, 48, 49, 88, 89, 97, 106, 109, 110,
114–116, 118, 216, 217, 230, 232
Anti-communist 30, 55
Budget revenues 182, 194
Cabinet model 275, 283
Candidates 19, 28, 32, 33, 83, 100, 143, 214,
243, 246–249, 253, 256, 258, 261, 263,
264, 266–269, 271–273, 281
CEE 2–5, 7, 16, 20, 21, 25, 43–47, 53, 56, 57,
69, 71, 73, 81, 82, 85–87, 92, 100, 116,
144, 277, 278, 279
Chief administrative officers (CAOs) 127, 135,
138, 139, 144, 145, 148, 150, 151, 154,
160, 167, 175–177, 191
Christian Democratic/Christian Democracy 47,
65, 71, 104
Citizens’ effectiveness 176
Civic Committees 32, 33
Civic engagement 9, 211, 220, 222, 223, 228,
230, 232, 233, 246, 253, 257, 258, 266,
267, 273
Civil society 5, 6, 8, 123, 128, 131, 136, 144,
145, 147, 149, 151, 166, 173, 175, 181,
185, 188, 189, 195, 196, 209, 211, 219,
275, 283, 284
Collectivist 63
Committee model 275, 280, 282
Communist, communism 23, 33, 50, 53–55, 57,
61, 63, 65, 72, 73, 85, 89, 109, 207, 209,
211, 212, 223, 255
Compensation 92, 94
Constitution 185, 213–215
Constituents 9, 130, 213, 219, 233, 253, 272
Contracting out 57, 58, 65
Cooperation 43, 96, 128, 219, 220, 250, 284,
289, 290
Council 7, 8, 9, 20, 21, 26, 28, 33, 37, 38,
40–46, 69, 70, 148, 177, 178, 213–215,
246, 249, 253, 255, 275, 278–292, 295–297
Decentralization 3, 6, 8, 10, 81, 82, 190, 246,
254, 255, 277
Delegates 245, 246, 251, 257, 264, 269–271,
273
Democratic performance 8, 123, 125, 130–134,
136, 137, 140–151, 152, 160, 164, 165
Democratic values 7, 79, 88, 105, 106, 114–116,
118, 279
Elections (see also local elections) 2, 4, 6, 7, 9, 15,
20, 22, 26, 28, 32–34, 37, 40, 41, 43, 45,
47, 69, 72, 82, 84, 85, 136, 214, 222, 232,
248–251, 255, 258, 259, 297
Education 7, 23, 48–50, 65, 68, 88, 89, 114,
115, 118, 130, 134, 137, 142, 143, 150,
166, 172, 216, 223, 230, 232
Egalitarianism 13, 22, 56, 57, 60, 61, 63, 71
Electoral system 13, 28, 33–35, 38, 41, 42, 72,
275
Elitism 13, 22
EU 2, 19, 20, 23, 24, 45, 46, 63, 70, 85, 87
EU (European) integration 1, 3, 23, 57, 61, 63
Expenditure rigidity 8, 177, 178, 193, 195, 198
Factions 6, 44, 45, 153, 275, 284, 291, 292, 297
Family tradition 212, 226, 232
Female councilors 7, 48
302
F A C E S O F L O C A L D E M O C R A C Y
Female representatives 81, 84, 85, 87, 89, 91–93,
97, 98, 100, 102–105, 216
Fragmentation index 44, 45, 46
Freedom House 85, 213, 215, 216, 234, 235
Gender Empowerment Measure 86
Gender gap 7, 79, 81, 83, 87, 90, 92, 94–104,
106–114, 116, 119
Gender–related Development Index 85
Governance 1–3, 5, 6, 9–11, 20, 82, 85, 125,
130, 152, 160, 209, 211, 219, 220,
245, 247, 251, 252, 254–256, 258, 275,
277–279, 282–284, 286, 289, 297
Government ownership 110, 113
Human Development Index 85, 86, 213, 216
Ideological 1, 7, 10, 18, 23, 46, 48, 53, 55, 58,
66, 68, 71, 79, 83, 84, 101, 102, 104, 106,
108, 112, 117, 212
Incentives 3, 4, 8, 139, 169, 171, 172, 177, 198,
211, 218, 292
Indicators of Local Democratic Governance
Project (ILDGP) 23, 125, 131, 137, 138,
148, 149, 169, 173, 207, 210, 216
Influence of parties 34–42
Institutions 2–4, 7, 11, 84, 96, 114, 115, 118,
159, 160, 193, 219, 221, 226, 227, 275,
278, 279, 281, 283, 284, 286–288, 291,
296, 297
Law on Local Self–government and Public
Administration 214
Left–right scale 108, 217
Local councilor 5, 6, 7, 9, 13, 15, 17, 18, 22–24,
33, 40, 50, 66, 70, 73, 81, 92, 116, 150,
207, 210, 216, 218, 248, 285
Local decision-making 13, 15, 18, 34, 37, 40,
172, 176, 178, 179, 184, 185, 187, 188,
191, 192, 210, 249
Local elections 6, 22, 28, 32, 33, 69, 136, 250,
251, 259
Local Government Survey (LGS) 5, 55, 137, 145,
148, 154, 159, 165, 167, 173, 175, 176,
181, 186, 197, 198, 285
Local Representative Survey (LRS) 5, 23, 81, 135,
136, 148, 154, 164, 167, 207, 210, 216, 285
Localism 247, 253, 256–258, 260
Locally elected representatives 88
Market 56, 58, 60, 63, 65, 71, 73, 126, 145, 149,
152, 254
Market individualism 13, 22, 56–58, 60–66, 71
Mayoral model 275, 282
Mayors 6, 7, 13, 16, 18–21, 23, 24, 26, 28, 30,
31, 33, 34, 37, 38, 40, 41, 42, 43, 46, 69,
70, 72, 73, 88, 152, 217, 218, 248, 255,
282, 284, 288–290
Media
influence on democratic performance 123,
125
ownership structure 7, 8, 123, 125, 126,
127, 130, 132, 136, 138, 140, 141,
144–146, 148–150, 152, 159, 165
Minorities 48, 56, 105, 224, 249, 256
Modernism 23, 50, 53, 63, 65, 73
Municipality size 8, 171–175, 178, 182–185,
187, 190, 192, 195, 197, 198
National/local interests 9, 247, 256, 257, 272
NGOs 5, 8, 133, 134, 136, 137, 146, 147, 150,
151, 154, 159, 166, 268
Nomination method 7, 41, 42, 43, 70
Optimism 7, 89, 90, 116
Parliament 47, 83, 217, 221
Participatory approach, model 207, 228, 230,
233, 248, 249
Partisanship 24, 43, 69
Party affiliation 46
Party membership 9, 16–19, 24–26, 28, 30, 32,
40, 42, 43, 46, 50, 54, 55, 70, 72, 95, 96,
100–103, 115, 243, 248, 256, 257, 258,
259, 267, 270–273, 290
Party system 3, 33, 44, 46, 47, 55, 62, 70, 71
Paternalism 13, 22, 56, 57, 61
Performance indices 131, 139, 159, 160, 164
303
I N D E X
Petition writing 185, 188, 189, 196
Policymaking 2, 3, 10, 81, 128, 178, 220, 252,
253, 275, 279, 280, 282, 283, 286–289,
291, 295, 297
Political culture 5–7, 10, 13, 18, 19, 22, 23, 38,
41, 42, 46, 48, 55, 62, 65, 70, 71, 72, 222,
226, 245, 255, 256
Political efficacy (Citizens’ effectiveness
to influence local matters) 176, 179, 191
Political fragmentation 7, 13, 21, 22, 43, 44, 46,
70
Political ideology 101, 103
Political leadership 79, 81
Political parties 1, 3, 6, 7, 10, 15–19, 21, 22,
24, 30, 32–34, 37, 38, 40, 42, 46–50, 53,
54, 69, 72, 116, 133, 134, 136, 137, 142,
149, 150, 159, 166, 176, 217, 221, 226,
227, 243, 245, 247–256, 258, 259, 261,
263–265, 268, 272
Political spectrum 53, 55, 58, 65
Population size 26, 41, 137, 141, 160, 171, 178,
183, 190, 194, 195, 285
Populism 3, 56, 57, 61, 63, 71
Post-communist/Post-socialist 11, 13, 30, 32, 33,
47, 48, 50, 53–55, 58, 60–63, 68, 70, 71,
82, 84, 85, 126, 209, 246, 255
Postindustrial 83, 95
Postmaterialism 7, 106, 114, 115, 118, 224
Power 1, 3, 4, 15, 18, 21, 62, 63, 86, 88, 129,
132, 153, 214, 215, 248–251, 253, 254,
280–282, 284, 286–289, 296, 297
Privatization 58, 116, 126
Professionalization 83, 252
Pro Patria 30, 47, 48, 61, 65
Proportional representation 19
Protest activism 95
Protests 94, 97, 99
Public policy 82, 130
Representation 6, 9, 81, 82, 84, 85, 87, 100, 119,
134, 207, 209, 210, 232, 243, 246, 247,
272, 273, 279, 280, 289
Res Publica 30, 47, 48, 65
Role of the state 56, 79, 106, 107, 116, 119, 211
Self-government 127, 215, 246, 250, 251, 254,
256, 265, 277
Social capital 9, 96, 97, 116, 207, 209, 210–212,
219–222, 228, 233, 234
Social individualism 13, 22, 56, 57, 60, 63, 65
Social Democratic, Social Democracy 23, 30, 32,
53, 71, 73, 106, 119
State intervention 57
Tocqueville Research Center (T–RC) 1, 5, 6, 12,
119, 169, 173, 234, 278, 285
Transfers 8, 177, 178, 181–183, 186, 187, 190,
193–195, 198
Trust 3, 7, 9, 88, 96, 97, 99, 114, 115, 118, 125,
173, 209, 211, 219–222, 228, 230, 233,
234, 257, 269–271
Trustees 9, 10, 243, 245–247, 251, 253–258,
260–264, 266, 267, 269–273
Turnout 45, 95, 144, 175
Unemployment 133, 136, 137, 142, 144, 150,
166, 214
United Nations Development Program 213, 216
Urban councilors 49
Values 5, 16, 18, 22, 46, 48, 53–58, 62, 63, 65,
68, 71, 73, 81–83, 88, 96, 100, 114, 115,
126, 131, 207, 210, 211, 212, 216, 223,
224, 226, 249, 279, 285, 293
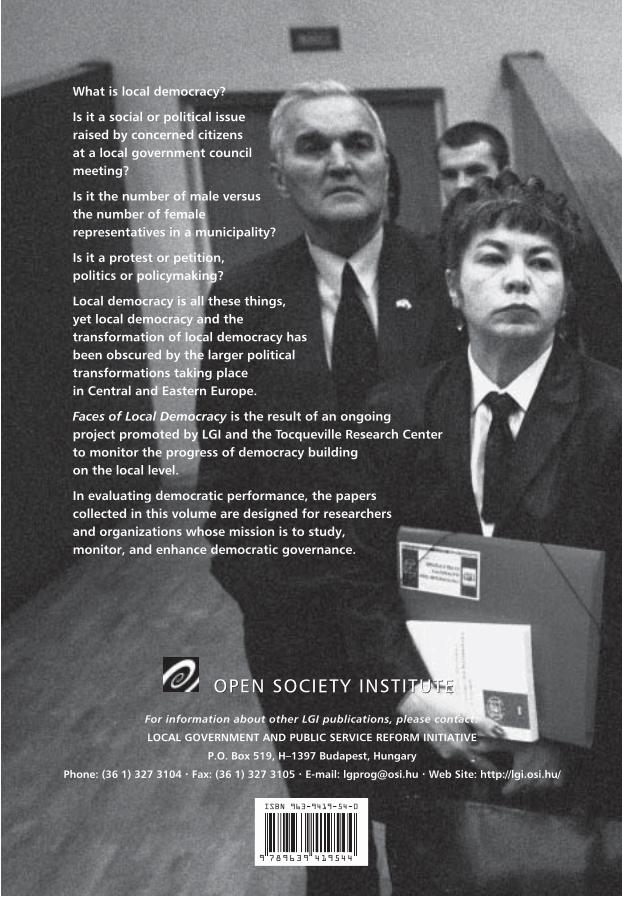
For information about other LGI publications, please contact:
LOCAL GOVERNMENT AND PUBLIC SERVICE REFORM INI TIA TIVE
P.O. Box 519, H–1397 Budapest, Hungary
Phone: (36 1) 327 3104 • Fax: (36 1) 327 3105 • E-mail: [email protected] • Web Site: http://lgi.osi.hu/
419544789639
ISBN 963-9419-54-0
9
OPEN SOCIETY INSTITUTEOPEN SOCIETY INSTITUTE
What is local democracy?
Is it a social or political issue raised by concerned citizens at a local government council meeting?
Is it the number of male versus the number of female representatives in a municipality?
Is it a protest or petition, politics or policymaking?
Local democracy is all these things, yet local democracy and the transformation of local democracy has been obscured by the larger political transformations taking place in Central and Eastern Europe.
Faces of Local Democracy is the result of an ongoing project promoted by LGI and the Tocqueville Research Center to monitor the progress of democracy building on the local level.
In evaluating democratic performance, the papers collected in this volume are designed for researchers and organizations whose mission is to study, monitor, and enhance democratic governance.
Related Documents