I Facebook Usage among Restaurants in Oslo A comparative Study of Global Chains of Restaurants and Local Popular Restaurants in Oslo Krati Modi Master’s Thesis in Nordic Media Institute of Media and Communication UNIVERSITY OF OSLO Spring 2017

Welcome message from author
This document is posted to help you gain knowledge. Please leave a comment to let me know what you think about it! Share it to your friends and learn new things together.
Transcript
I
Facebook Usage among Restaurants in Oslo
A comparative Study of Global Chains of
Restaurants and Local Popular Restaurants in Oslo
Krati Modi
Master’s Thesis in Nordic Media Institute of Media and Communication
UNIVERSITY OF OSLO
Spring 2017

II
III
Facebook Usage Among the restaurants in
Oslo
A comparative analysis between Global Restaurant Chains
and Popular Local restaurants in Oslo
IV
© Author: Krati Modi
2017
Facebook Usage Among Restaurants in Oslo
Krati Modi
http://www.duo.uio.no/
Print: Reprosentralen, University of Oslo
V
Abstract
Social media, today, has become a great platform for the marketers to showcase their
company’s products or services. With more than 1 billion daily users, Facebook has become
the first choice for businesses, both big and small, to utilize its user base for their marketing
purposes. Facebook has opened its platform for businesses to create their ‘Pages’and
converse with their customers one-to-one in an informal and friendly environment. The pages
are the face of the company on Facebook. It is the representation of the company among the
billion plus Facebook users. The marketers also agree to the importance of having a
facebook presence.
The food service industry, which communicates face-to-face with its customers on a daily
basis, has not been able to stay untouched by the world of online social networks. It has
made itself available to its customers through these facebook pages, to interact with the
existing cutomers and attract new ones. Facebook is a democratizing platform which provides
same opportunities to both the global restaurant chains like TGI Fridays and locally popular
restaurants. Oslo is the city where this study was undertaken and therefore, it was chosen as
the place for choosing the variables from.
When same features and tools are provided to both the types of restaurants, what was
intriguing is to know, how do both these types of restaurants use it? How do they design their
pages or what do they post on their post to attract and build a ‘fan’ base on the page? This is
what the following study intends to investigate. A combination of three qualitative methods,
namely, content analysis, interviews and case study methods were planned to be employed
for this study. The case study method was shelved as the restaurant chosen as its subject
denied to participate.
There is a great difference in the use of facebook by both the categories of restaurants.
Though the literature, facts and figures for the best practices are available to all the
retsaurants, the actual use and its effects are found to be different on the global restaurant
chains and the popular local restaurants.
VI
Preface
The completion of this Master’s thesis marks the end of an immensely learning experience of
my life. With this thesis, I have learnt a lot about the subject and also myself. It has been an
opportunity to stretch my boundaries and walk that extra mile to learn new things.
I am most grateful to my husband Saurabh and my boys Rig and Nivaan. You all have been
my pillars of strength and source of inspiration to work better every day. My family and
friends here in Oslo and back home in India, I would like to thank you all for always
encouraging me to continue.
My heartfelt gratitude to my thesis advisor Anders Fagerjord, thank you so much for all the
insightful inputs and kind words of appreciation. This work would not have been what it is
without your guidance
Last but not the least, I would like to thank all the people who in some way or the other have
contributed in this study. All my classmates and friends at IMK, thank you for the memorable
time here, it has been a very enriching time with you all.
Krati Modi.
Oslo, June 1, 2017
VII
Table of Contents
Title
Abstract
Preface
Chapter 1: Introduction 1
1.1: The world of marketing
1.2: Why restaurants?
1.3: Facebook
1.4: Research question
1.5: Facebook more than a Social networking site (SNS)
1.6: Use of ICTs and Social media by enterprises in Norway
Chapter 2: Literature Review 9
2.1: Define Marketing
2.1.1: Online Marketing
2.2: Social Media
2.2.1: Defining Social Media and Social Networking
2.3: WOM/eWOM
2.4: SNSs used by the Restaurant businesses in Oslo
2.5: Facebook and Businesses
VIII
Chapter 3: Methods 19
3.1: Qualitative Content Analysis
3.2: Qualitative Interview
3.3: Case study
3.4: Selecting samples
3.5: Data Collection
3.6: Engagement on Facebook page
3.7: Reliability of the Content Analysis
3.8: Translation
Chapter 4: Analysis and discussion 31
4.1: Description of the Samples
4.2: Analysis of Page design
4.3: Analysis of the Code book
4.4: Analysis of the engagement
4.4 Analysis of the Qualitative interviews
4.4.1: Starbucks
4.4.2: Mc Donald’s
4.4.3: Dinner Restaurant and Bar
4.4.4: Alex Sushi
4.4.5: Hos Thea Restaurant
IX
4.5: Findings
4.6: Limitations
Chapter 5: Conclusion 66
5.1: Concluding the hypotheses
5.2: Final takeaways and scope for future studies
References 74
X
List of Tables, Graphs and Images.
Table1: Restaurants and number of posts 26
Table 2: Categorization of the Codes 28
Table 3: Codes and corresponding frequency restaurant wise 41
Table 4: Restaurants and average engagement category wise 51
Graph 1: Distribution of Posts per Month per Restaurant 37
Image 1: Example of a Facebook page, Starbucks Norway’s page 5
Image 2: Pie diagram depicting percentage distribution of total posts per Restaurant 33
Image 3: Example of an ‘Advertisement’ post 44
Image 4: Example of a ‘Hashtag’ post 45
Image 5: Example of an ‘Event’ post 46
Image 6: Example of ‘Offer’ post 47
Image 7: Example of a ‘New introduction’ post 48
Image 8: Example of a ‘Contest’ post 49
Image 9: Example of a ‘Special Occasion’ post 50

1
Chapter 1: Introduction
1.1 The world of marketing
Ever since someone had something to sell there has been the concept of marketing. The
Oxford dictionary has defined marketing as “the act or business of promoting and selling
product or services” (English Oxford living Dictionaries, 2017). Printed ads in magazines,
posters, billboards, radio ads, marketing over telephones, television advertisements, SMS ads,
have been the modes of marketing before the internet revolution came in. The marketing then
was mostly outbound marketing that makes the consumer aware about a product or service.
Marketing has been important to businesses as it presents their product or service to the
consumers. It is important to sell the right product or service to the right group of consumers.
Therefore, there is the concept of market research which helps in finding out the target
audience for the product to be sold. It helps in determining the right audience, the mode and
the time for marketing their product or services to them.
As the internet revolution that has stepped in almost every aspect of our lives, marketing is
not limited to the traditional modes of communication. As a matter of fact, there is a whole
new gamut of platforms for marketing a product or service besides the traditional means of
radio, television and telephone. These include e-mail marketing, blogs, micro-blogs like
Twitter, websites, search platforms, social media, social networking sites like Facebook,
LinkedIn, Instagram etc. These web technologies have empowered everyone to create and
share their own content in the form of blogs on Blogging sites like Blogger, tweets on Twitter,
and videos on YouTube etc. The added advantage, as Zarrella points out, is that it is easily
accessible to all without any charge. The content can be viewed globally and there is no need
to pay the publishers or distributors anything to embed your messages in their content, as was
in the case of magazines, newspapers, television or radio (Zarrella, 2010).
The web of social media has become a routine and important means for people to connect and
stay in touch with each other. These platforms are being used by millions of people all around
the globe. The popularity of social media in everyday life can be measured by the number of
people using it and how frequently do they use it. People and businesses are using social
media all across the globe to connect and communicate. This phenomenon, according to
VanMeter et al., has attracted the interest of academics and practitioners in marketing to
understand the potentials and challenges of this new medium of communication (VanMeter,
Grisaffe, & Chonko, 2015)
2
Social media in the present day has emerged as a prominent form of media. It has been widely
used by people for a variety of purposes, for example: Connecting with friends and family,
making new friends, to know and connect with different organizations, to connect with their
favourite celebrities, to connect with their favourite brands and so on.
Social media is serving different purposes for different people but one purpose that it fulfils
for all is networking. All people or organizations that use social media have one thing in
common and that is, that they all want to form and maintain a network. These networks can be
of friends, family, co-workers, customers, beneficiaries, etc. The network I am interested in
exploring is that of restaurants and their customers.
Service based industries like hotels, airlines, restaurants etc., which interact with their
customers on a daily basis are also using the social media platforms. These platforms are
giving them ways to attain feedback, inform their customers about their promotions and
offers, present value added services like table booking, order take aways etc., to their
customers and most importantly to attract more customers to their establishments both local
and tourists. In fact, there are many social platforms which are exclusively dedicated to the
food and service industry, for example Trip Advisor, Yelp, Zomato etc. The customers who
have been to these can post their review on the basis of their experience and a potential
customer can use these reviews to plan their visits.
1.2: Why restaurants?
Eating out have always been an activity attributed to social interactions. People eat out when
meeting friends and family, partying, celebrating occasions, relaxing, dating etc. Restaurants,
cafes, fast food joints, street food kiosks, etc. are some of the places where people eat out. But
how do they find or select these places to dine? Walking down the street and spotting a place,
word of mouth from an acquaintance, advertisement in a magazine or newspaper were the
ways by which people selected the place where they would like to dine. But, with the
introduction of the internet and the vast possibilities of it influencing our behaviour and
choices, the way we select a place to dine has changed completely. Even after spotting a
place, or hearing a recommendation from an acquaintance or seeing an advertisement on the
media channels we are not convinced. We turn to the social media channels to see how,
completely random strangers, who might or might not share your taste, have commented
about the place, its food and service, and then decide that one should go or not. The
TripAdvisor page of Oslo reveals that there are 88, 848 reviews for 1,410 restaurants in Oslo
3
(Oslo, Norway). This method of picking a place to eat out intrigued me to research further
into this idea.
People are referring to these sites on day to day basis and even while planning a vacation.
They generally look for two kinds of restaurants one is global established chains of
restaurants, this is as a safe option ‘that if not anything else’ they can go to these places where
they know the taste, quality and standards. And, the other are the local popular restaurants,
which serve according to the local taste, maybe a new cuisine. These restaurants might serve a
cuisine from another part of the world but, it could be modified or adjusted according to the
palette of the customer. For example: Many Thai or Indian restaurants around the world offer
to adjust the hotness of the food on the basis of customer’s demands. This is the exploratory
or adventurous option. They choose this option based on other people’s reviews or
recommendations on the social media platforms.
Eating out at a food outlet is an activity that can be talked about only after the person
experiences it. The food preparation, the ambience, the service can be talked or written about
only once it is personally experienced. And today more than ever people are talking about
these experiences and sharing their feedback about any particular food outlet to the world via
social media. While there are some social media platforms like trip advisor, Zomato, Yelp,
Four Square etc. that are exclusively meant for giving feedback and ratings to the places one
visits, stays or dines at. There are other Social media platforms like Facebook, Twitter,
Instagram, Snapchat, Flickr etc. where one can also talk about their experience of dining out
at a particular place. That is personal opinion. Research has shown that people’s choice of
picking a particular restaurant to dine at is very much influenced by the reviews given by their
peers or acquaintances. These are regraded genuine, non-biased and highly credible (Richards
& Tiwari, 2014).
Now that the food establishments are also present on these social media platforms it is easier
for people on these platforms to find, review and communicate with them. Restaurants are
using these social media platforms to advertise themselves by posting pictures of people
having good time at their place, the food they serve etc. Also, they use these platforms to post
special offers, promotions, contests and information etc. to attract more customers. I myself
have regularly been searching and reviewing places to eat on sites like TripAdvisor and
Facebook. It is easier to trust a place with a sizeable number of people advocating for it.
4
It would be interesting to learn more about how they interact and attract customers through
this spectrum of social media at their disposal. Also, I am interested in finding out if there is a
planned strategy behind these posts by the restaurants and what interested me more is that
how a restaurant can influence an individual’s choice to visit the establishment. Because I
myself have used these platforms regularly. It is also a personal curiosity to know that when I
choose to dine at a restaurant after looking at it on Facebook, do I make an informed
independent decision or give-in to the attractive content they post on these social media
outlets. And that is why I decided to look into their websites, pages on Social networking sites
and its public content to investigate what they post and how they use the Facebook for
business.
1.3: Facebook
Facebook, founded in 2004, is a brainchild of Mark Zuckerberg. The platform is the most
used social media site in the world with 1.28 billion plus daily active users on an average
(Company info Facebook, 2017). Initially, it had a ‘marketplace’ for classified advertisements
to buy and sell stuff that you want within your networks, and the feature runs till date but in
some selected countries. In 2009, realising its potential as an advertising and marketing
platform, the Facebook provided the option of targeting the audience for the commercial
entities on their website (Toner, 2013). In 2011, it introduced the concept of sponsored stories
for desktop, wherein, the news feed of a person will contain posts from the pages they like. In
2012, it introduced ads on the mobile application, but these stories were made to look like
posts not to interfere with the user experience on Facebook (Toner, 2013). Over the years, it
has and are, improving and broadening their services and reach by improvising according to
the demands and needs of its users and collaborators providing insights and statistics on user
pattern.
In Norway, there are 3.2 million users of Facebook (2016), this is also the highest number of
people on any social media website in Norway (Norwegian media Barometer, 2016). The
website is accessed by million people on a daily basis. Today, the use of Facebook is not just
to connect with people you know but it is also a platform to connect with brands and
businesses you like. Facebook became available to businesses from 2007 (Hof, 2007), and
now the businesses can create fan pages and connect directly with their customers in a much
closer and informal way. More than 60 million business pages are active on Facebook

5
(Facebook Pages). It is the place where both the customers and the businesses are. The image
below is how a Facebook page looks like for business enterprises.
Image 1: Example of a Facebook Page: Facebook page of Starbucks Norway
1.4: Research Question
The research question central to this master’s thesis is: How do restaurants in Oslo, both
global chains and popular local restaurants, use social networking platforms, specifically
Facebook Pages?
The question above is further divided into a set of sub questions that can help in determining
the answer to the main research question. These are:
What is social media marketing?
6
Which social media platforms are available to restaurants for marketing, and which are
the platforms most used by the restaurants in Oslo
What are the features offered by Facebook which can be used by the restaurant?
What is the content of the Facebook pages of the restaurants? Is there a difference in
the content of the global chains of restaurants and the popular local restaurants?
What is the importance and strategy of the restaurants behind running a page on
These questions would help in giving an all- round perspective of the ‘How’ a Facebook page
is used by the restaurant establishments. The sub questions of the main Research question
shall help in breaking down the analysis for a better understanding. And, also to keep the
research focussed on the subject matter.
As regards the research question there are a few hypotheses that I propose to test with this
study. Testing these hypotheses shall help in further understanding the use of social
networking sites as a marketing platform.
Hypothesis 1: Social media marketing is an important type of marketing today.
Hypothesis 2: Marketing on Social networking sites is an important part of the marketing
policy of all kinds of restaurants in Oslo.
Hypothesis 3: All restaurants selected for this study have a page on Facebook and are working
towards using it to its best potential and to benefit from it.
1.5: Facebook more than a Social networking site:
Initially, Facebook rejected the idea of monetizing its platform. Instead, it focussed on
improving and adding upon the features it offered to its users and also strengthening their user
base (Funk, 2013). But today, as a listed company it has opened the site also as a platform for
marketing and brand building offering a plethora of options to choose from. By marketing it is
not meant just advertising to keep up the sales, but with marketing here I mean to make
efforts to build a lasting relationship with your customers and an ongoing engagement through
valuable content that’s not about making the sale (Newberry , 2016). In general, the Facebook
value proposition, these days, for businesses is-
Build your Facebook page in the site: free of charge
7
Build your fan base: Paid
Engage with your fan base: Paid
Engage your existing customers when they are on Facebook: Paid (Funk, 2013).
A Facebook page is a feature introduced by Facebook in 2007 (Weaver, 2012), allowing
companies to make their business’s profile on Facebook and connect with customers through
status updates, advertising new promotions, ask questions, take feedback, update about
people’s check-ins, post vacancies, etc.
Tom Funk in his book “Advanced Social Media Marketing” has explained a number of
services and tools provided by Facebook. These can be customised according to the
requirements and goals of the businesses. The most popular of these tools are:
1. Marketplace ads
2. External URL ads
3. Facebook Object ads
4. Page Post ads
5. Sponsored Stories
6. Promoted Posts
7. Facebook Offers
8. Facebook Sponsored Search Results
9. Facebook Exchange remarketing ads
10. Custom Audiences
11. Action spec targeting
12. Facebook Premium ads (Funk, 2013).
These are mostly paid features, for which the establishment has to pay Facebook an amount to
use. The cost is not very high so that even the smaller organisations can use these. Also, the
cost can be managed by the moderator on the basis of what is working for them and what is
not.
8
But, these are not the only tools at the businesses’ disposal, they can produce their own
content and post them on their pages for free, which can be attractive and engaging for the
fans of the page. These can be images, GIFs, videos. There is also an option to boost a post by
paying for it and reach more people and gather more engagement.
Facts point that in 2011, 50% of the social media users followed a company or brand page on
social media, companies are eager to tap this huge potential to reach out to their loyal
customers and make new ones by investing in social media marketing (Leeflang, Verhoef,
Dahlstrom, & Freundt, 2014) .
1.6: Use of ICTs and Social media by Enterprises in Norway
Norway is counted among the most developed countries of the world with a Gross domestic
product (GDP) per capita as high as 600, 596 Norwegian kroner as per the Statistics Norway
(Home page, 2017). The country has been named as the happiest country in the world
according to the World Happiness report 2017 (Helliwell, Layard, & Sachs, 2017). The social
security and economic progress of the country has been the reason for this merit.
The 87% of the Norwegian population has access to internet and are frequent users of ICTs
(Norwegian media Barometer, 2016). The time, an average person here, spends on the internet
is 127 minutes a day in 2015. And, 70% of this time is spent on Facebook (Norwegian media
Barometer, 2016).
The use of ICTs is high even in the business sector. In Norway, 67% of the enterprises,
employing 10 employees or more, are reported to be using the social networking sites like
Facebook and LinkedIn in the year 2016 (ICT usage in enterprises 2016, 2016). Thus, it can
be concluded that Facebook is the most popular website accessed by the people, for both
personal and business purposes, in Norway.
9
Chapter 2: Previous research
2.1: Define marketing
Marketing can be broadly understood as the communication channel linking a product or
service to the targeted customers (or patrons). The process of marketing is not about selling a
product; rather, it focuses on identifying customer needs and defining how the product or the
service meets those needs (Lee D. , 2013). This need to identify user needs lies at the heart of
the concept of marketing research. Just putting out something at your community and hoping
that something “sticks” is far less effective than taking the time to develop targeted marketing
plans that matches user needs and available resources and services. Marketing strategies can
provide us the tools to meet this challenge in a better way (Lee D. , 2013). This is the
definition of marketing that I shall stick to in this study.
2.1.1: Online Marketing
The Internet and the World Wide Web have had a transformational impact on all functions of
the Brands and Corporation. The marketing function has, arguably, seen the greatest change.
Companies now routinely use these information technologies to build brands, facilitate and
track consumer communities, share pertinent information, distribute messages, provide
customer service, build promotional campaigns, and, in general, gain a competitive edge in
the marketplace. Companies are even using online marketing techniques to bolster offline
business component (Krishnamurthy, 2006).
But, some researchers are of the opinion that, if brands have entered the online sphere that
does not mean a new theory is required to understand this phenomenon (Vernuccio, 2014). “A
brand is a brand regardless of its environment. What is different is the way the brand’s
essence is executed…To thrive with brands on the internet a looser form of brand control is
needed, welcoming the active participation of consumers” (De Chernatony, 2001) (Vernuccio,
2014). This clearly points out that the earlier approach of brands for marketing and image
building was based on a strongly controlled approach in which customers were passive
recipient of value. But in the online world, the customers through interaction and engagement
with the brand play a great role in co-building a good brand image (Vernuccio, 2014).
S. Krishnamurthy in his paper in Business Horizons, has provided managers with a
comprehensive, actionable, and practical methodology (E-MARKPLAN) to plan, enact, and
analyse e-marketing activities. Five case studies are used to illustrate the diversity of e-
10
marketing actions. The E-MARKPLAN methodology is versatile, and is not limited to
companies which have e-commerce operations (Krishnamurthy, 2006).
An important tool for businesses today is Online marketing communication or OMC which
marks a business’ innovativeness which stands for experimenting with new styles of reaching
the customer (Goldsmith, 2001), interactiveness implies that the marketing content is
engaging for the target audience and they are interested in engaging with the company
(Johnston, 2001), perceptions here means appreciation and keenness to pay for the
company’s product or service (Calisir, 2003), and success of the campaign and in turn
business for the company (Rowley, 2001) (Gaur, Saransomrurtai, & Herjanto, 2015).
Online marketing which is also referred to as internet marketing is the process of promoting a
brand, service or product on the internet combining the technical and creative aspects of the
World Wide Web; it includes website development, blog marketing, email marketing and
article marketing (Cartwright) (Oyza & Edwin, 2016).
Jensen and Jepsen in their article “Online marketing communications: Need for a new
typology of IMC?” (Jensen & Jepsen, 2007), have identified five distinctive characteristics
that distinguish OMC from traditional offline marketing communications: (1) freedom from
temporal and spatial restrictions, (2) many-to-many communication, (3) interactivity, (4)
hyper-textually, and (5) personalization. To the authors, OMC consists of four major
components: (a) online advertising, (b) online marketing public relations (online MPR), (c)
online sales promotion, and (d) online relationship communications. The first three
components are similar to their offline counterparts except that they are applied to the online
context. The fourth component, namely online relationship communications, is basically the
combination of offline direct marketing and personal selling (Gaur, Saransomrurtai, &
Herjanto, 2015). Social media marketing is a component of online marketing (Oyza & Edwin,
2016).
2.2: Social Media
The social media is the blessing of internet to people. It has evolved in the recent years as the
media outlet where people spend a significant amount of time a day. Today, the time spent by
an individual in front of the television or listening to radio is dropping rapidly whereas their
time spent browsing through the various social media platforms is constantly on the rise. In
Norway alone, there has been an 87% increase in the proportion of time spent on the internet
in 2015 (Norwegian Media barometer, 2015, 2016). The time spent on the internet is 127
11
minutes a day by a person living in Norway, between the age of 9-44 years. Youngsters in the
age group of 18-24 years spend even higher duration of time, 3 hours 33 minutes a day, on the
internet. 70% of the time people spend on the internet is spent on Facebook (Norwegian
Media barometer, 2015, 2016). On the other hand, the average TV viewing time has gone
down in 2015 to 107 minutes from 132 minutes a day in 2014, in Norway (Norwegian Media
barometer, 2015, 2016).
When such a significant part of a person’s day is spent online on the Social networking sites,
especially Facebook, it is definitely a place where the businesses should also be to connect
and communicate with their customers. It can also be a great place to advertise not only about
themselves but also about vacancies, in-house activities, events etc.
2.2.1: Defining Social Media and Social networking
Social media can be understood as “a group of Internet based applications that build on the
ideological ad technological foundations of Web 2.0, and that follow the creation and
exchange of user-generated content (UGC)” (Kaplan & Haenlein, 2010). But, the question
that arises with this definition is that, what are the ‘ideological and technological foundations’
of the web 2.0? There was the concept of publishing content online even before the Web 2.0
for example: personal webpages, Encyclopaedia Britannica Online. (Kaplan & Haenlein,
2010)
The web 2.0, a name coined for a conference, actually became the name that represents the
World Wide Web today (O'Reilly, 2007). It has been defined as “a set of economic, social,
and technology trends that collectively form the basis for the next generation of the Internet—
a more mature, distinctive medium characterized by user participation, openness, and network
effects” (Executive Summary, 2007).
The ideological foundations of web 2.0 are ‘co-creation’, where content and applications are
being made and continuously modified by all users in a participatory and collaborative
manner, instead of a few persons creating and publishing them for everyone to use (Kaplan &
Haenlein, 2010). This is when combined with technological drivers like fast spreading
broadband services and hardware capacity, economic drivers like wide availability of tools
for creating UGC and social drivers, that is a generation with fairly good technical
knowledge to collaborate, create and connect online. This is how the UGC today is different
than what it was perceived to be 30 years ago (Kaplan & Haenlein, 2010).
12
But, social networking is not same as social media. Social networking is one of the
opportunities Social media has presented to its users. Kaplan and Haenlein explained Social
networking sites as “the applications that enable its users to connect by creating personal
information profiles, inviting friends and colleagues to have access to those profiles and,
sending e-mails and instant messages between each other”. The personal profiles on the social
networking sites can include pictures, videos, audios and blogs (Kaplan & Haenlein, 2010).
Boyd and Ellison defined social networking sites or SNS as web-based services that allow
individuals to create a personalized profile, share, and connect their profile with others within
the bounded system (Boyd & Ellison, 2007). Such a profile provides a perfect platform to
fulfil an individual need of socializing, entertaining, status seeking, and more importantly to
satisfy one’s curiosity (Haridakis & Hanson, 2009). Liu argued that a profile on SNS also
conveys the owner’s likes and dislikes. In other words, such profile provides information of
prestige, authenticity, personality, and differences of the users (Liu, 2007). Thus, scholars
suggest that a profile on SNS can be seen as a personal biography (Miller & Jensen, 2007)
and as reflection of self-image (Takahashi, 2010) (Gaur, Saransomrurtai, & Herjanto, 2015).
This feature helps the brands and businesses, who connect with their customers through SNSs,
to understand their tastes and preferences in a better way. And the highly interactive web 2.0
has made companies to rethink their marketing strategies as the consumers have become
social media savvy people, who not only research for products and services online but also
“engage with the companies they buy from as well as other consumers who may have
valuable insights” (Garretson, 2008).
New web technologies have made it easy for anyone to create- and, most importantly-
distribute their own content. A Facebook post, blog post, tweet or YouTube video can be
produced and viewed by millions of people around the globe for free. Advertisers don’t have
to pay publishers or distributors huge sums of money to embed their messages, like for
Newspapers or Television; instead they can make their own engaging content that can attract
and engage with the Fans (Zarrella, 2010). And, at times, even the fans of a brand can create
content that can spread exponentially and become viral, blowing away the competitors
(Zarrella, 2010).
2.3: WOM/eWOM
This is another important aspect of marketing which has been termed as “word of mouth”.
Word-of-mouth marketing (WOMM) is the “intentional influencing of consumer-to-consumer
communications by professional marketing techniques” (Kozinets, Valck, Wojnicki, &
13
Wilner, 2010). The driving force behind the word-of-mouth communication, from a
marketer’s perspective is ‘trust’, which can be among friends, colleagues, etc. which might
affect the purchase decisions of an individual (Evans, 2010). When the WOM is from a
consumer himself than it is believed to be trustworthy.
But, what if the source of WOM is a marketer or the business establishment itself, as in this
research’s case the restaurants’ themselves are the source of the WOM on the social
networking sites. Dave Evans points that in such a case ‘transparency’ is very important,
where it is out rightly disclosed that you are a firm, this is your product and you are here to
sell it (Evans, 2010). There are examples of companies that succeeded because they were a
combination of great product and WOM like Starbucks, Amazon, Hotmail and Red Bull.
In case of amazon, which started advertising about itself from the very start, it was noticed
that the returns were not justifying the advertising expenditure. Therefore in 2003, they
dropped the advertising expenditure and started offering free delivery on a total purchase of
25 dollars or more. This strategy worked wonders for them, they offered a simple service
instead of a high budget advertising campaign to attract people to use their website. The offer
resulted in WOM spreading like wild fire and everyone knew that “shipping was free” at the
Amazon, and the comparative analysis of going to a store to buy things versus ordering them
online and getting them delivered at home for no extra cost made Amazon an obvious choice
for shopping (Evans, 2010).
Initially, WOM was defined as face-to-face communication about products, or companies
between people who were not commercial entities (Arndt, 1967). Similarly, in 2001,
Harrison-Walker defined WOM as “informal, person-to-person communication between a
perceived non-commercial communicator and a receiver regarding a brand, a product and
organization (Harrison-Walker, 2001) (Jeong & Jang, 2011). Face to face personal
communication was the basis for the above two definitions even being nearly 4 decades apart.
But the rapid information and technology communications like social networking and
blogging, the concept of WOMM has taken a new form and has now come to be known as
‘electronic word of mouth marketing’ or e-WOMM. eWOMM can be defined as “…any
positive or negative statement made by potential, actual, or former customers about a product
or company, which is made available to a multitude of people and institutions via the
Internet” (Thurau, Gwinner, Walsh, & Gremler, 2004) (Minazzi, 2014). eWOM
communication can take place in various settings. Consumers can post their opinions,
comments and reviews of products on weblogs (e.g. xanga.com), discussion forums (e.g.
14
zapak.com), review websites (e.g. Tripadvisor.com, Epinions.com), e-bulletin board systems,
newsgroup, social networking sites (e.g. facebook.com) (Cheung & Thadani, 2010)
Consumers can find a chance to talk about the product information which has effects on their
purchase decisions with their friends by social media (Kozinets, Valck, Wojnicki, & Wilner,
2010). Social media users create their own contents related to their opinions which can be
posted, commented upon or liked. In fact, they even can form their own community which
consists of the people who have similar ideas about the same product or services (Erkan &
Evans).
The article by Jeong and Jang tries to find the reasons that make customers to disseminate
positive electronic word of mouth (eWOM) about a restaurant. They concluded that customers
are motivated to articulate positive eWOM about the restaurants that provide superior quality
of food, service and ambience to the customer. In an effort to help the restaurant for satisfying
the customer with good food and service quality, the customer spreads eWOM (Jeong & Jang,
2011).
2.4: Social Networking sites used by the Restaurant businesses in Oslo
With 1410 restaurants listed on the Trip advisor website (Trip Advisor website, 2017), Oslo
has a flourishing restaurant industry. There are restaurants serving cuisines from all corners of
the world, from Italian, Indian, Japanese, Mexican, Thai and so on. There are both global
chains of restaurants and popular local restaurants.
With fast and efficient internet connectivity, there is an increase in general time spent on the
internet. The restaurants also, as other businesses are going online by registering presence on
various social networking sites. These sites provide an opportunity to both the people and the
restaurants to connect with each other. The latter shares the news from their establishments
and the former can express their satisfaction or dissatisfaction about their experiences of
dining out. This study is focussed on how the restaurants use Social networking sites,
therefore I shall look into the sites the restaurants are already on and those which they can use
for making connections with their customers. The social networking platforms used by the
restaurants in Oslo are: Facebook, Twitter, YouTube, LinkedIn, Instagram, Four square and
Yelp.
2.5: Facebook and Businesses
Facebook is the most popular social networking site in the world. (Freeman, et al., 2014)
According the statistics presented by Facebook itself, there are a total of 1.04 billion daily

15
active users on an average as of December 2015, globally. (newsroom.fb.com, 2016). Though
most content on the Facebook is personal or posted by individual users, but since November
2007, the site has embraced companies and brands developing their own pages (Freeman, et
al., 2014). A Facebook Page allow real organizations, businesses, celebrities and brands to
communicate broadly with people who like them. Pages may only be created and managed by
official representatives also known as moderators. (Help Centre, 2016).
The reach and usage of Facebook has made it an effective medium to find and share
information. And this popularity has also attracted many researches based on various aspects
of Facebook usage. The interest of this particular research is on the use of Facebook by
restaurants. To my surprise there have not been much detailed research on how restaurants use
Facebook. There are a few studies focussing on how restaurants should use Facebook. But the
use of Social media platforms for marketing purposes has attracted a fair amount of curiosity
from the intelligentsia and one can find a number of studies and research papers on online
marketing, its challenges and best practices.
There have been researches about how people connect with Facebook pages of different
brands and organizations. Steve Smith in his article “Conceptualising and evaluating
experiences with brands on Facebook” published in the International Journal of Market
Research has presented a quantitative analysis of how the Facebook users’ experience with
pages by brands can be conceptualized and evaluated. He has developed 2 ‘metrics’ to
categorize the experience of users with brand pages on Facebook:
“first, a ‘value of experience’ metric based on the likelihood of people who
claim to have positive experiences with brands’ Facebook pages to say they
are likely to do a social media action, a purchase funnel action and advocacy
action; second, a ‘value of a fan’ metric, which measures the likelihood of
people who report they are likely to do a social media action to also say they
are likely to do a purchase funnel action and advocacy action” (Smith,
2013).
Mathupayas Thongmak in his research on “Engaging Facebook Users in Brand Pages:
Different Posts of Marketing-Mix Information” has explored the posting quantity and posting
types most likely create brand engagement on Facebook brand-fan pages. Using content
analysis, the study explores five posting types: product, price, place, promotion, and others, by
analysing 1,577 posts from 183 brand-fan pages. Findings of this research suggest that high
posting amount could increase brand popularity. Thus, a brand-fan page’s content provider
16
should add more price information, promotional information, other informational content, and
emotional content on posted messages. (Thongmak, 2015)
On the other hand, the study by Lee, Hosanagar and Nair “The Eff ect of Social Media
Marketing Content on Consumer Engagement: Evidence from Facebook” content coded
100,000 unique Facebook posts by 800 companies through a combination of Amazon
Mechanical Turk and state-of-the-art Natural Language Processing algorithms. The research
was a large-scale field study in which the fan engagement was based on the number of “likes”
and “comments” a post received (Lee, Hosanagar, & Nair, 2014). The study concluded that
emotional and philanthropic content which they described as Persuasive content affects the
fan engagement positively, while content with the mention of price, availability or product
features, which they termed as informative content, reduces engagement. But, if the
informative content is combined with persuasive content it is a good strategy to attract and
engage with the users (Lee, Hosanagar, & Nair, 2014).
A research that focuses on the use of Facebook for marketing and brand awareness was
published in the Journal of Promotion Management, titled “Social Media, Social me: A
content analysis of Beauty companies’ use of Facebook in marketing and branding” by Bin
Shen and Kimberly Bissell. The study focusses on how Facebook was used as a medium by 6
leading beauty brands, namely, Estée Lauder, MAC cosmetics, Clinique, Maybelline, L’Oréal
and Cover Girl, to engage and interact with customers. It looked into which tools available via
Facebook were used for the above purposes and also which proved to be more useful for
engaging and connecting with their Facebook fans. In addition to this, the study also
compared the Facebook usage of these high-end beauty product brands to that of their
department store counterparts. The study suggested that though all the beauty brands used
Facebook, their usage pattern differed, which depended upon the company’s marketing
strategy. But, it was found that all used Facebook for promotions, advertising, collecting user
feedback and reviews and generating e-WOMM (Shen & Bissell, 2013).
There have also been research focussing on marketing patterns on Facebook of various
energy dense and nutrient poor (EDNP) “junk” food and beverage brands by Freeman et al.
which was published in American Journal of Public Health in December 2014. This was a
content analysis based research to look into the marketing techniques used by 27 most popular
food and beverage brand Facebook pages in Australia.
“Study findings show that ENDP food and beverage marketing is prolific
and seamlessly integrated within online social networks. Adolescents and
17
young adults are engaging with ENDP brands on a nearly- daily basis.
Facebook users willingly spread marketing messages on behalf of food and
beverage corporations with seemingly little incentive or reward required”.
(Freeman, et al., 2014)
Some interest has also been shown by the academics in analysing the Facebook pages of food
and beverage companies. These have tried to put together guidelines for service based
establishments on how to use their Facebook pages effectively for marketing purposes and
attracting and engaging with customers. “Spreading Social Media Messages on Facebook: An
Analysis of Restaurant Business-to-Consumer Communications” by Linchi Kwok and Bei Yu
published in the Cornell Hospitality Quarterly has presented two distinct research questions,
firstly, “What social media messages do hospitality companies share with consumers on
Facebook? And secondly, what types of social media messages are endorsed (and thus
propagated) by Facebook users”? (Yu & Kwok, 2012).
They studied the type of messages, posted by 10 restaurant chains and 2 independent
operators, received the most number of ‘Likes’ and comments on Facebook. The study
divided social media messages into 2 types: 1. Sales and marketing type and 2.
Conversational type, and concluded that conversational type of messages received more
engagement from the Facebook users than the sales and marketing types. When the same
messages were divided into 4 categories of 1. Status 2. Link 3. Video 4. Photo, the photo and
status category were more liked and commented upon than the remaining two categories.
Next, when the messages about information from the restaurants were more popular than
those containing marketing terms (Kwok & Yu, 2013) They analysed the content of the
Facebook pages of 12 restaurants chosen because of their huge number of fans on the website.
These included quick serving global chain of restaurants, casual dining and independent
restaurants in the region. Thus, it concludes by suggesting that as a practice restaurants should
engage more in conversational messages and status or photo updates than in direct sales and
promotion of their brands or posting links or videos (Kwok & Yu, 2013).
Similarly, the research article ‘The use of Social Networking Sites in the Restaurant industry:
Best practices’ points out that these SNSs are a good and inexpensive platform for advertising
and branding the restaurant establishments. But, on the utility of the social Networking Sites.
The survey there is no consistency in its use by the restaurants and even the managers have a
differing opinion conducted as part of this research gave insights into how the restaurants use
SNSs. Concluding from the findings of the study, a list of how to make the most of using
18
SNSs, has been made. It includes: finding employees, obtaining feedback on new menu items,
promote new publications or items, use employees as brand ambassadors, spread ideas and
best practices throughout the restaurant system, maintain a direct dialogue with customers and
reach potential new customers, boost excitement and traffic by sharing information, update
the community and your customers on a variety of projects (DiPietro, Crews, Gustafson, &
Strick, 2012).
A research that closely relates to this study is “Facebook usage by Local Restaurants: A
Large-scale survey” by Erik Hekman and Marieke Welledonker-Kuijer has taken into account
the Facebook activity of a total of 10,446 restaurants in Amsterdam, Houston, London and
New York. Doing so gave broad insights in their Facebook usage and the communication
patterns between them and their customers (Hekman & Kuijer, 2012). The survey pointed out
that Facebook usage by restaurants is quite common, but only a few restaurants actually
interact with their users. They also pointed out a need for further content analysis of the posts
by restaurants on their pages. (Hekman & Kuijer, 2012)
The studies done so far have touched various aspects of using Social media and social
networking by businesses. These have also tried to present what kind of messages,
disseminated via the social networking sites, are well received and engaged upon by the
consumers. But, what actually the restaurants are doing with their presence on the online
social networking sites is less talked about. After all the studies that have been done and the
researched material available, have the restaurants been able to use the SNSs, specifically
Facebook, well to their advantage. This study is an attempt to fill this gap in the research
field. In the following sections, I shall discuss the methods used to undertake this research
followed by an analysis of the data collected. Next I shall discuss the findings of this study
and also compare it to the findings of the previous related studies. I shall also reflect upon the
shortcomings of this study in this section. As part of the conclusion section, there shall be a
discussion on whether the hypotheses, formulated in the beginning of this study, stand true or
false.
19
Chapter 3: Methods
This study was undertaken to analyse the content of the Facebook pages of the selected global
chain of restaurants and the local popular restaurants in Oslo, the similarities and the
differences in usage of Facebook as a medium of connecting with Facebook users. After
considering a variety of available research methods like the survey method which has been
used in a few of the previous similar researches too, discourse analysis method etc., in social
science research, both qualitative and quantitative, qualitative approach was considered more
suitable to undertake this study. It is because, the qualitative methods are known to provide
better in-depth understanding of a social phenomenon, than the quantitative methods like a
questionnaire administered survey (Gill, Stewart, Treasure, & Chadwick, 2008). It was
decided to use the following three qualitative research methods in order to collect and analyse
the Facebook usage of global chain of restaurants and local restaurants in Oslo. These
research methods are: Qualitative content analysis, Qualitative interviews and a case study.
3.1: Qualitative Content Analysis
Qualitative content analysis was considered the best suitable method for conducting this
research because here the database was in the form of texts, pictures, videos etc. as posted on
Facebook by the selected restaurants on their respective official Facebook page. The goal of
content analysis is “to provide knowledge and understanding of the phenomenon under study”
(Downe-Wamboldt, 1992) (Hseih & Shannon, 2005). “Qualitative content analysis is defined
as a research method for the subjective interpretation of the content of text data through the
systematic classification process of coding and identifying themes or patterns” (Hseih &
Shannon, 2005). Weber has defined it as a method to make “valid inferences from the text”
(Weber, 1990) (Prior, 2014). Neuendorf has given a comprehensive approach to use Content
analysis. The method can be used to analyse films and Television content, which implies the
study of still and moving images (Neuendorf, 2002). This extends the use of Content analysis
to study still images, advertisements and billboards (Prior, 2014). The posts and pages to be
studied in this study are advertisements, images both still and moving, and text, which
therefore makes this method a good choice for the intended study.
The content analysis approach used in this study was termed as Conventional Content analysis
by Hseih and Shannon in their research paper “Three approaches to Qualitative Content
analysis” (Hseih & Shannon, 2005). There is not enough existing theory or previous research
material available on this subject, therefore, no pre-conceived categories for coding the
20
Facebook messages were available. The code categories were defined by taking an overview
of the Facebook posts on the pages of the selected variables. Code labels were derived from
the type of posts.
The codes were further categorised into 3 broad categories, namely, promotional,
conversational and mix categories, on the basis of insights from the previous researches,
topics of which intersected with the subject of this study.
3.2: Qualitative Interviews
The next method chosen for this study is qualitative elite interviews with persons responsible
for posting and communicating on the selected Facebook pages, also known as Facebook
page administrators or moderators. Qualitative interviews can be defined as “The interview is
a conversational practice where knowledge is produced through the interaction between an
interviewer and an interviewee” (Brinkmann, 2014). It helps in obtaining knowledge on the
life world of the interviewee to gain a better understanding of the phenomena under
investigation, to which he/she is related (Brinkmann, 2014) (Kvale & Brinkmann, 2008).
It is the exploratory feature of the qualitative interviews that prompted the selection of this
method. When used in an exploratory manner, qualitative interviews help in finding out the
subjective interpretations of a social phenomenon (Introduction to Qualitative interviews,
2017). The interviews were planned to be conducted as semi-structured open-ended questions,
with a small list of guidelines about what is needed to be asked (Gill, Stewart, Treasure, &
Chadwick, 2008). This approach was considered important to give an insight about the
organisation’s strategy and goals for using the Facebook. This would also help in comparing
the findings from the content analysis and the views of the organisation.
During the course of the study, it was found that most of the persons contacted for the
interviews were unable to spare time for a face to face interview or even over the telephone
interview. Therefore, interview via email was found to be the most suitable way out for both
the parties.
The e-mail interviews are an option to interview people for whom it is difficult or impossible
to participate in a face-to-face interview, like working professionals, critically ill patients
(Lehu, 2004) (Meho, 2006). Standardised, open-ended approach was used for these email
interviews. Same or similar open-ended questions were asked via email in these interviews.
This approach facilitates faster interviews (Valenzuela & Shrivastava, 2017), multiple
21
interviews at the same time (Meho, 2006) and an opportunity for the interviewee to answer
the questions in the environments they feel comfortable in and also answer it at a time suitable
to them (Meho, 2006). These are found to be analysed and compared easily (Valenzuela &
Shrivastava, 2017).
Philly Desai has explained that the e-mail interviews have been considered at par and a valid
method widely among researchers. These yielded same results for same topics. No instances
have pointed out that the respondents tend to change their replies or make up things that are
untrue or express in a better way in an online interview than the face to face interviews. The
method has been found to provide reasonably consistent data when different online groups
were studied for the same subject, proving its reliability and validity as a method of data
collection. It is effective when the attitudes, experience and behavioural data is to be collected
(Desai, 2002). In the case of this study these interviews were used to know about the attitude
of the companies towards the utility and effectiveness of their Facebook page. Also, the
interviews intended to find the experience of using Facebook page for Marketing by the
restaurants in Oslo. Therefore, it can be concluded that the e-mail interviews were a good
choice of method for this study, and the data collected through these interviews is as valid as
if face-to-face interviews would have been conducted.
3.3: Case Study
The last method chosen is a case study of a popular local restaurant Hos Thea. The restaurant
is rated as the best restaurant in Oslo on the trip advisor website. It was considered for a case
study as it there is no official Facebook page for this restaurant. It is a peculiar case from
among the chosen variables for this study. Therefore, it’ll make a good representative of the
establishments who choose to stay away from the social networking platforms like Facebook.
And focussing on an individual representative of a group, organization or phenomena is
typical of case study method (Hancock & Algozzine, 2011)
This case study shall comprise of a qualitative interview with the person making policy
decisions for the restaurant. I shall also present data from the restaurant’s TripAdvisor page,
where it is ranked as the best restaurant in Oslo. These 2 methods to study this case shall give
me, first, the view of the restaurant, on why it is not on Facebook. And, second, the analysis
of the ratings and reviews of the TripAdvisor listing of the restaurant shall give a fair idea
about the potential Facebook can be for this establishment.
22
In this age of communication technology when every organisation is trying to market
themselves to the world by using all possible resources, especially ones that are free of cost,
this establishment chose to stay away from such marketing. It would be interesting to explore
how a popular restaurant in a metropolitan city like Oslo maintains to be exclusive and
untouched by social networking through Facebook.
The idea of using the above-mentioned methods is to gather relevant information for the
study. The analysis and conclusion thus reached shall encompass the insights gathered from
studying the same thing from different viewpoints, through different methods, to reach a valid
conclusion.
3.4: Selecting samples
The various units of analysis selected for this study were picked through a set procedure. The
research question was to find out the differences and similarities in the usage of Facebook by
local popular restaurants and global chain of restaurants and thus, required a selection of the
most popular local restaurant establishments and the global chain of restaurants, which are
quiet few, in Oslo, therefore it was not a very difficult choice to make. For the purpose of this
study the following chain of restaurants were chosen: 1. Mc Donald’s, 2. Thank God It’s
Friday (TGIF), 3. Domino’s Pizza, 4. Starbucks Coffee, 5. Hard Rock Café. These are the
most popular global restaurant chains in Oslo based on the number of people who ‘like’ their
Facebook page.
The units to be compared with the above-mentioned restaurants are the local popular
restaurants. The popularity was gauged on the basis of reviews and rankings on the website
‘TripAdvisor’. After going through the all 829 reviewed restaurants out of the total 927
listings in Oslo. Then I narrowed my search to restaurants with not less than 250 reviews each
on the website. With this criterion, I narrowed my search to 16 restaurants. These 16
restaurants serve diverse cuisines from around the world, ranging from Indian, Norwegian,
Chinese, Japanese, and Thai etc.
Next, the criterion was narrowed to those among the top 20, with this demarcation I got 7
results of which 2 were restaurants serving Chinese cuisine and 2 serving Italian cuisine. The
other 3 served European, Indian and Japanese cuisine respectively. As there were 2
restaurants of each Chinese and Italian cuisine I took one of each, the ones which ranked
higher in the trip advisor rating. So, with this selection and the 3 other restaurants the 5
23
popular restaurants in Oslo for this study were chosen. These restaurants are: 1. Hos Thea, 2.
Ruffino Restorante Italiano, 3. Mother India, 4. Alex Sushi, 5. Dinner Bar and Restaurant.
3.5: Data collection
The first method for data collection employed was that of content analysis of the Facebook
posts on the pages of each of the above-mentioned sample restaurants. Facebook page is a
feature launched by Facebook in 2007, wherein any commercial entity can make their page on
the website for free. Fig. 1 shows what exactly a Facebook page looks like. These pages are
used for status updates, photo updates, for advertising, running contests, providing
information, asking questions, seeking feedback etc. from the people connected to them by
liking and following their page (Lee, Hosanagar, & Nair, 2014).
The period of analysis was a full year, from January 1, 2015 to December 31, 2015. After
taking an overview of what the restaurants posted on their Fb page, a content analysis coding
tool was developed categorizing all type of messages the restaurants posted. For example: if
the post was about a new introduction or about an ongoing promotion at the restaurant or
some Facebook specific contest for their Facebook fans and so on. Initially, there were 15
categories but when the actual process of coding took place 6 more categories were added to
the coding tool as there were some posts that could not fit in the initially specified categories.
Code book categories
The categories in the code book are as follows:
• 3 = Offer/Promotion: If the post is regarding an offer or ongoing promotion at
the restaurant. Posts contain prices, words like ‘offer’, ‘limited period offer’ etc.
• 4 = If the post is about the introduction of a new item on the menu or a whole
new menu. Posts contain words like ‘new’, ‘season special’ etc.
• 5 = If the post is about a promotion in the restaurant for the weekend. Posts
contain words like ‘weekend special’.
• 6 = If the post is about a contest running on the Facebook page of the
restaurant.
• 7 = If the post contains a hashtag ‘#’
• 8 = If the post is about a celebration taking place in the restaurant
24
• 9 = If the post is about a special occasion the restaurant is interested in. posts
contain mention of a festival or event associated with the date for example ‘valentine’s
day’
• 10 = If the post is just an advertisement about the restaurant. This includes both
pictorial and video advertisements. Posts contain product pictures, product prices.
• 11 = If the post is an information about an activity that is or has been organised
at the restaurant, for example parties, new restaurant openings, etc.
• 12 = If the cover photo of the fan page has been updated.
• 13 = If the post is a video, posted on the fan page by the restaurant.
• 14 = If the post is about the restaurant being covered in other media platform,
for example a newspaper report, employee interview, restaurant review in a review
website, etc. This post also includes a link to the above media coverage.
• 15 = If the post is regarding a job opening in the restaurant.
• 16 = If the restaurant has created and shared an event through the Facebook’s
‘Create an event’ application.
• 17 = If the post is about the achievement or recognition received by the
restaurant or by its employees.
• 18 = If the post is an apology from the restaurant to its patrons for a technical
malfunction, for example: a booking system failure, a technical error in the mobile
application etc.
• 19 = If the post is a greeting in general or for a special occasion.
• 20 = If the post is about the introduction of a new mobile application, web page
or booking service by a particular restaurant.
• 21 = If the post is about a special activity or news for the customer club
members of the restaurant
• 22 = Miscellaneous posts, which could not be categorised in any of the other
categories
25
• 23 = If the post is about the restaurant asking for feedback or the restaurant is
talking about a feedback they received.
The metrics measured in this study are the “likes”, “comments” and “shares” a post received
on the Facebook page. These specific metrics were used as they are widely considered the
marketing goal in the social media settings and also as this data was readily available (Lee,
Hosanagar, & Nair, 2014). For the posts under the coding field ‘video post’, the total number
of views was no considered, as these videos start playing automatically even if anyone scrolls
down through the page and it is counted as a ‘view’ even when someone does not hit the
‘play’ button at all. Instead the number of likes, comments and shares for these posts were
taken into account, which depict fan activity on the page.
The fields in the code book included the date of the post, language of the post, type of post
with reference to the analysis coding tool, number of likes received, number of comments
received and number of times it was shared. Each post posted in between the range of period
of analysis by the 9 restaurants, with official Facebook page, was coded. Hos Thea restaurant
did not have an official Facebook page and thus, it made a separate case study which I shall
discuss in the later paragraphs.
3.6: Engagement on a Facebook post
The content put out by the restaurants on their official Facebook pages is known as ‘Posts’ in
Facebook’s terminology. Every Facebook post is there to start a B2C or business to consumer
dialogue. Customers can participate by liking the post by clicking the ‘Like’ button,
commenting on the post in the comments section under the post or sharing the post by
clicking the share button under the post. Each of the above actions generate a story, that is
available on the wall each of the Facebook friends of the person who performed this action or
in this case, engaged with the fan page of the restaurants (Cvijikj & Michahelles, 2013). It is a
kind of eWOM communication going out to the friends of a follower of a fan page. The
engagement levels a post receives has become the benchmark of appearing in the newsfeed of
the Fans of a page, according to the changes in the newsfeed algorithm of Facebook (Brennan,
2014). So more the engagement, more likely the post is to appear in the newsfeed of the Fans.
Consequently, the stories generated as a result of a fans’ engagement over moderator posts,
put in motion the spread of the marketing message, leading towards the goal of viral
marketing. (Cvijikj & Michahelles, 2013)
26
The Like, Comment and share actions on the Facebook posts are counted as ‘Engagement’ by
a fan of the page. The engagement on posts is a crucial demonstrator of activity on an
establishment’s brand page. The higher the engagement on a post the better it is considered in
the marketing terms. This also helps in understanding which kind of posts worked for a
particular restaurant and what did not work. The engagement also pointed how much the
followers of a brand page are willing to interact with the brand on Facebook.
Though, finding out what type of messages work better than the others for the brand pages is
not the scope of this study. But, recognising which post was well received by the fans of a
page and which posts did not attract the fans much is relevant to this study, as it helps the
moderators, in future, to determine the content of a post. And that is why the number of
engagements received by each post was given importance. Researchers like Kwok and Yu and
Thongmak have pointed out what kind of posts receive more engagement than others. The
level of engagement a category of post receives, helps the page moderators in further
designing an engaging post for the page.
To find out if this was actually the case with the restaurants selected for this study, the
engagement on the posts was also measured on the basis of the following categories:
promotional, conversational and mix type of posts, on the brand pages of the selected
restaurants. This was done to find out if the conclusion made by Kwok and Yu in their
research paper, that, the brand pages should post more of conversational messages than
directly promoting their brands on their Facebook pages (Kwok & Yu, 2013).
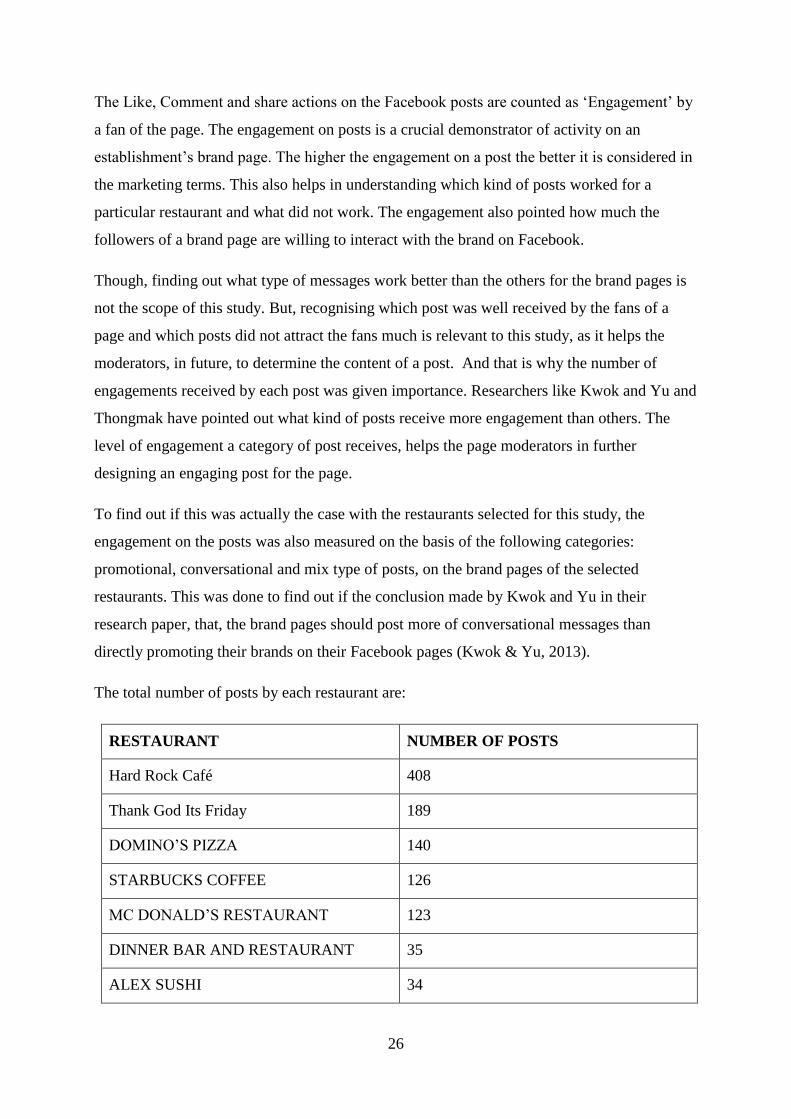
The total number of posts by each restaurant are:
RESTAURANT NUMBER OF POSTS
Hard Rock Café 408
Thank God Its Friday 189
DOMINO’S PIZZA 140
STARBUCKS COFFEE 126
MC DONALD’S RESTAURANT 123
DINNER BAR AND RESTAURANT 35
ALEX SUSHI 34
27
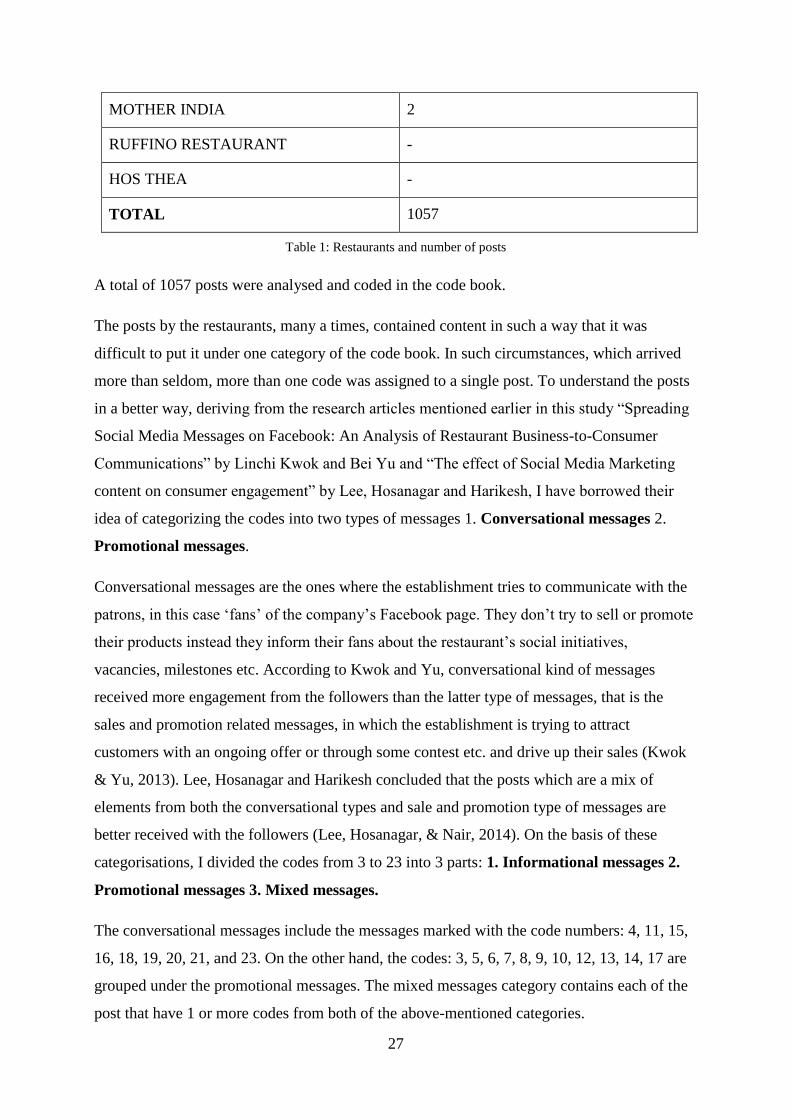
MOTHER INDIA 2
RUFFINO RESTAURANT -
HOS THEA -
TOTAL 1057
Table 1: Restaurants and number of posts
A total of 1057 posts were analysed and coded in the code book.
The posts by the restaurants, many a times, contained content in such a way that it was
difficult to put it under one category of the code book. In such circumstances, which arrived
more than seldom, more than one code was assigned to a single post. To understand the posts
in a better way, deriving from the research articles mentioned earlier in this study “Spreading
Social Media Messages on Facebook: An Analysis of Restaurant Business-to-Consumer
Communications” by Linchi Kwok and Bei Yu and “The effect of Social Media Marketing
content on consumer engagement” by Lee, Hosanagar and Harikesh, I have borrowed their
idea of categorizing the codes into two types of messages 1. Conversational messages 2.
Promotional messages.
Conversational messages are the ones where the establishment tries to communicate with the
patrons, in this case ‘fans’ of the company’s Facebook page. They don’t try to sell or promote
their products instead they inform their fans about the restaurant’s social initiatives,
vacancies, milestones etc. According to Kwok and Yu, conversational kind of messages
received more engagement from the followers than the latter type of messages, that is the
sales and promotion related messages, in which the establishment is trying to attract
customers with an ongoing offer or through some contest etc. and drive up their sales (Kwok
& Yu, 2013). Lee, Hosanagar and Harikesh concluded that the posts which are a mix of
elements from both the conversational types and sale and promotion type of messages are
better received with the followers (Lee, Hosanagar, & Nair, 2014). On the basis of these
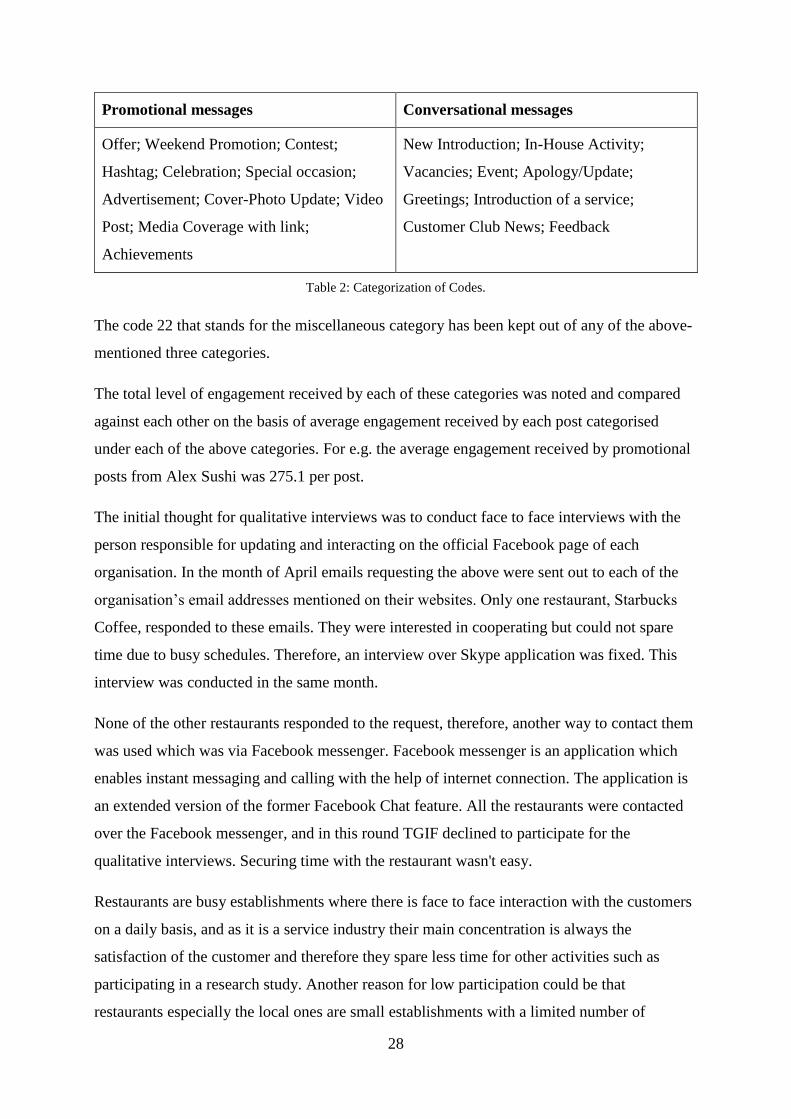
categorisations, I divided the codes from 3 to 23 into 3 parts: 1. Informational messages 2.
Promotional messages 3. Mixed messages.
The conversational messages include the messages marked with the code numbers: 4, 11, 15,
16, 18, 19, 20, 21, and 23. On the other hand, the codes: 3, 5, 6, 7, 8, 9, 10, 12, 13, 14, 17 are
grouped under the promotional messages. The mixed messages category contains each of the
post that have 1 or more codes from both of the above-mentioned categories.
28
Promotional messages Conversational messages
Offer; Weekend Promotion; Contest;
Hashtag; Celebration; Special occasion;
Advertisement; Cover-Photo Update; Video
Post; Media Coverage with link;
Achievements
New Introduction; In-House Activity;
Vacancies; Event; Apology/Update;
Greetings; Introduction of a service;
Customer Club News; Feedback
Table 2: Categorization of Codes.
The code 22 that stands for the miscellaneous category has been kept out of any of the above-
mentioned three categories.
The total level of engagement received by each of these categories was noted and compared
against each other on the basis of average engagement received by each post categorised
under each of the above categories. For e.g. the average engagement received by promotional
posts from Alex Sushi was 275.1 per post.
The initial thought for qualitative interviews was to conduct face to face interviews with the
person responsible for updating and interacting on the official Facebook page of each
organisation. In the month of April emails requesting the above were sent out to each of the
organisation’s email addresses mentioned on their websites. Only one restaurant, Starbucks
Coffee, responded to these emails. They were interested in cooperating but could not spare
time due to busy schedules. Therefore, an interview over Skype application was fixed. This
interview was conducted in the same month.
None of the other restaurants responded to the request, therefore, another way to contact them
was used which was via Facebook messenger. Facebook messenger is an application which
enables instant messaging and calling with the help of internet connection. The application is
an extended version of the former Facebook Chat feature. All the restaurants were contacted
over the Facebook messenger, and in this round TGIF declined to participate for the
qualitative interviews. Securing time with the restaurant wasn't easy.
Restaurants are busy establishments where there is face to face interaction with the customers
on a daily basis, and as it is a service industry their main concentration is always the
satisfaction of the customer and therefore they spare less time for other activities such as
participating in a research study. Another reason for low participation could be that
restaurants especially the local ones are small establishments with a limited number of
29
employees each having a specific chore to perform and as the restaurants taken for this study
are popular restaurants attracting customers in good numbers, which makes it difficult for
them to spare time for activities other than serving their customers.
In September, another attempt to get in touch with the restaurants was made, this time via
telephone. All the restaurants were contacted via the contact number given on their websites.
Mc Donald’s restaurant asked to send the questions via email and. Hos Thea declined to
participate in the study due to the fear of being misquoted as they had been faced with such a
problem earlier. Hard rock cafe declined as it was a busy time for them, instead, asked to
email the request and then decide what and how it can be entertained. Alex sushi also asked to
e-mail the questions. Rest of the restaurants were still unresponsive. Finally, Alex sushi,
Dinner restaurant and Bar, Mc Donald’s restaurant, Starbucks participated in the study.
Owner of Hos Thea restaurant was kind enough to permit me to write our conversation with a
condition of not distorting the quotes and writing them as it was.
The case study proposed for this study could not be done because the restaurant on which it
was based, Hos Thea restaurant, declined to participate in the study. Therefor the inferences
were drawn on the basis of dataset made by the content analysis of the facebook pages and by
the qualitative interviews done with the moderators of the Facebook page of each of the
restaurants
3.7: Reliability of the Content analysis
The reliability of the content analysis method chosen for this study is very crucial for deriving
valid results. If the data collected is not tested or is not reliable than the validity of the study is
jeopardised. Neuendorf emphasised on the importance of measuring the reliability of the
content analysis data stating “given that a goal of content analysis is to identify and record
relatively objective (or at least intersubjective) characteristics of messages, reliability is
paramount. Without the establishment of reliability, content analysis measures are useless."
(Neuendorf, 2002)
To test the data collected, through the qualitative content analysis, in this study is consistent, a
person unrelated to this study was asked to test it. The reliability test was done after finishing
the coding. Only the codes and their corresponding explanation in the code book was shared
with the person testing it, none of the data fields were shared. He was asked to pick 20
random posts from the pages of the variables of this study, without telling me, and to code
30
them according to the code book fields. He was also asked to fill in all the corresponding
fields in the code book namely: ‘Date’, ‘Language’, ‘Likes’, ‘Shares’ and ‘Comments’. This
was to test if any of the codes or corresponding fields were wrongly filled.
Out of the total 20 random posts, 17 results were found to be absolutely replicable. The
remaining 3 posts did not match each other, one for the code and two for the number of
comments. This difference in the number of comments was later corrected.
3.8: Translation
The posts on Facebook by most of the selected samples for study, were in Norwegian. I being
a non-native Norwegian speaker, was first faced with the challenge if I shall be able to
understand the posts in this language. But, I attended a 90-hour course followed by a written
and oral exam, in Norwegian for beginner’s level in the spring of 2015. This was before I
started collecting the data for this thesis. The course gave me a good working knowledge of
reading, writing and understanding the basic Norwegian Bokmål language. During the course
of this study I also passed the Beginner level oral test for Norwegian fluency.
I first selected 7 random posts from the Facebook pages of the restaurants and translated them
into English. Then a native Norwegian speaker was asked to translate the same posts. My
translation was not showed or discussed with her before she did the translation. After she did
the translation, both our translations were matched and were found to match satisfactorily in
terms of words, sentences and the overall understanding of the post.
Google translate and online Norwegian to English dictionaries like ordnett.no, were at times
consulted to find meanings to unfamiliar words and phrases.
The next chapter is Analysis and Discussion. Here I have first presented an analysis
restaurant-wise. First is the Facebook page design analysis, followed by it is the data
presented by the content analysis in the form of language used in posts, pattern of posting
according to date and time of the year. This is followed by the total and average engagement
received by each restaurant and the 3 categories in which the posts were divided. This
analysis is then discussed in detail and inferences are made on its basis.
The above chapter shall follow the conclusive chapter of this thesis, wherein, I shall discuss if
the hypotheses formulated in the beginning of this thesis stand true or false.
31
Chapter 4: Analysis and Discussion:
The research in question was to find differences and similarities in the use of Facebook by
global chains of restaurants and local popular restaurants in the city of Oslo. A code book was
prepared for all the posts on the official Facebook pages of all the selected restaurants during
the time period of January 1, 2015 to December 31, 2015.
Before starting with the content analysis of Facebook pages of selected restaurants, an
overview of the websites of each of these restaurants was undertaken. Number of social media
platforms used by each restaurant, link to these social platforms from the website and ‘contact
us’ field were analysed. The overview revealed that all the selected global chains of
restaurants had links to their SNS pages on their website’s homepage. Facebook, Instagram
and twitter were the most commonly used SNSs.
Among the popular local restaurants, Ruffino restaurant, Alex sushi did not have any links to
their Facebook pages on their websites. Mother India restaurant did have links to their ratings
and reviews in different local newspapers but, there were no links to their SNS pages.
Restaurant Hos Thea’s website did not have any links to any of the social media platforms as
it is not present on any of these platforms. Dinner Restaurant and bar was the only one that
has link to their Facebook and TripAdvisor page.
All the global chains of restaurants use multiple social media platforms besides Facebook like
twitter, Instagram, trip advisor, etc. whereas popular local restaurants used less number of
social media platforms.
4.1: Description of the Samples
Before discussing the page design I would like to give a brief introduction of all the 10
restaurants selected as the units of sample for this research, for a better understanding of the
samples selected for this study.
• Mc Donald’s Restaurant: Norway’s largest restaurant chain with 73 restaurants
spread across the country. In Oslo, they have 14 restaurants. It is fast food restaurant majorly
serving burgers, potato fries, soft drinks and desserts.
• Thank God, it’s Friday: An American bar and grill themed restaurant chain with 7
restaurants around the country of which 4 are in Oslo. It serves both alcoholic and non-
alcoholic drinks and the food is mostly American barbeque inspired.
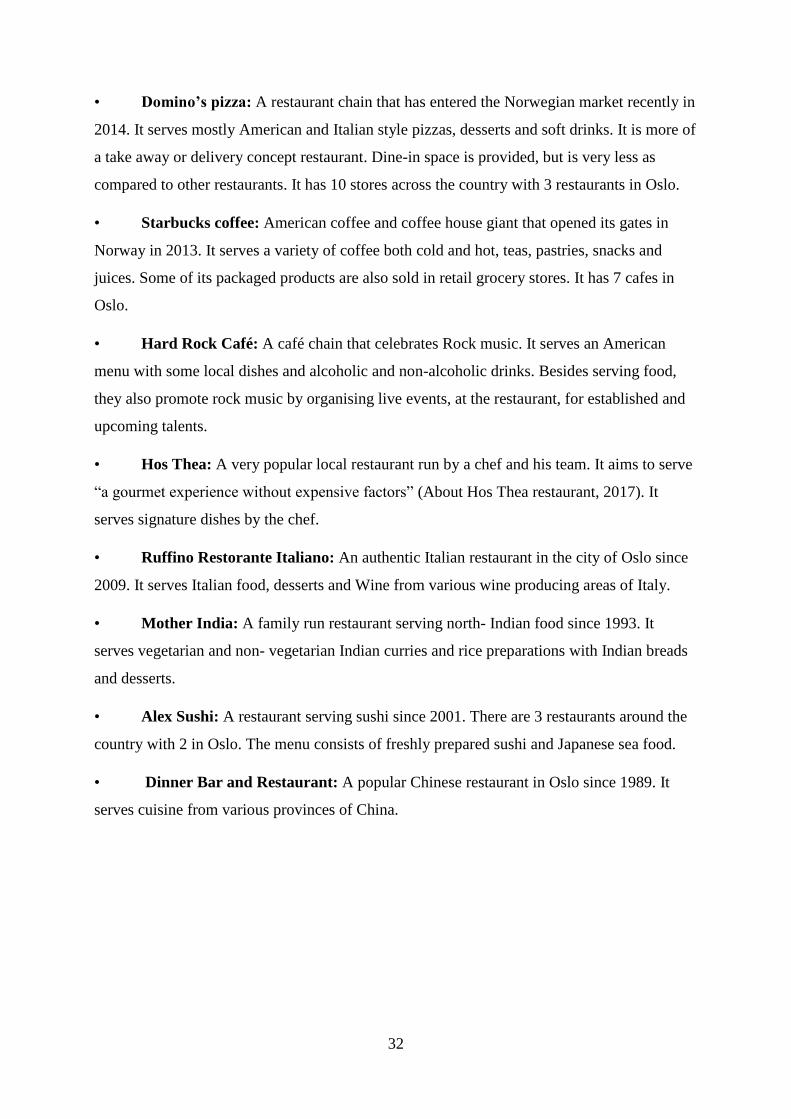
32
• Domino’s pizza: A restaurant chain that has entered the Norwegian market recently in
2014. It serves mostly American and Italian style pizzas, desserts and soft drinks. It is more of
a take away or delivery concept restaurant. Dine-in space is provided, but is very less as
compared to other restaurants. It has 10 stores across the country with 3 restaurants in Oslo.
• Starbucks coffee: American coffee and coffee house giant that opened its gates in
Norway in 2013. It serves a variety of coffee both cold and hot, teas, pastries, snacks and
juices. Some of its packaged products are also sold in retail grocery stores. It has 7 cafes in
Oslo.
• Hard Rock Café: A café chain that celebrates Rock music. It serves an American
menu with some local dishes and alcoholic and non-alcoholic drinks. Besides serving food,
they also promote rock music by organising live events, at the restaurant, for established and
upcoming talents.
• Hos Thea: A very popular local restaurant run by a chef and his team. It aims to serve
“a gourmet experience without expensive factors” (About Hos Thea restaurant, 2017). It
serves signature dishes by the chef.
• Ruffino Restorante Italiano: An authentic Italian restaurant in the city of Oslo since
2009. It serves Italian food, desserts and Wine from various wine producing areas of Italy.
• Mother India: A family run restaurant serving north- Indian food since 1993. It
serves vegetarian and non- vegetarian Indian curries and rice preparations with Indian breads
and desserts.
• Alex Sushi: A restaurant serving sushi since 2001. There are 3 restaurants around the
country with 2 in Oslo. The menu consists of freshly prepared sushi and Japanese sea food.
• Dinner Bar and Restaurant: A popular Chinese restaurant in Oslo since 1989. It
serves cuisine from various provinces of China.
33
Image 2: Diagram depicting percentage distribution of the total posts per Restaurant
In the above figure, each of the restaurants’ share, in the form of percentage, from among the
total number of posts analysed, is depicted. HRC’s posts comprise of the major share of the
total analysed posts. Lowest share is of Mother India, which is less than 1% of the total. the
other 0% is for Ruffino restaurant that did not post anything during the study’s time period.
In the following paragraphs, I shall analyse first the design of the Facebook pages of the
restaurants and then the inferences from the dataset made by coding the content analysis
4.2: Analysis of the page design: before even starting with the content analysis of the posts
by each of the restaurants an analysis of the page’s design was done for all the chosen
variables for this study. A facebook page comprises of a cover photo, a profile picture, a
‘Call-to-action’ button, a link to the messenger application of Facebook, an about section that
could contain the basic information about the restaurant and a set of quick links.
The ‘Call-to-action’ button was used differently by the restaurants. Mc Donald’s used this
button to connect to a social initiative they are connected with. While HRC, TGIF and Dinner
restaurant and Bar connected it to their table reservation system, Starbucks and Domino’s
linked it to their online shopping system by naming it ’Shop Now’. 3 of the local popular
restaurants had the ‘call-to-action’ button named ‘Call Now’ and a pop-up appeared with the
establishment’s contact number appearing in it. These restaurants were Mother India, Alex
Sushi and Ruffino Restaurant. This is good practice if you know that most of the page’s fans
access the page from their mobile phone devices, as then it takes them directly to the ‘Call’
function of the device. But, this is not the best practice as this button is to facilitate an action.
39%
18%
13%
12%
12%
3%
3% 0%0%
Posts
HRC
TGIF
Domino's
Starbucks
Mc Donald's
Dinner
Alex Sushi
Mother India
34
And, if the customer lands on their Facebook page on a desktop, in this case they would need
another device like a telephone or mobile phone to complete this action.
The button next to the ‘Call-to-action’ is the ‘Messenger’ link. ‘Messenger’ is a Facebook
application for instant messaging. This application allows the Facebook user to send and
receive a message from anyone using Facebook or the application itself on their mobile
devices. This can be used by everyone, be it individuals or Page owners, or business
establishments on Facebook. This function can be enabled or disabled as per the wishes and
policy of the page owners. All the restaurants were found to be using the ‘Messenger’
application. Ginny Mineo in her article emphasises the importance of using the ‘messenger’
application as a way for the restaurant’s fans to connect with it instantly. But, it is advised to
be used only if the establishments have the time and resources to read and respond to the
messages in time (Mineo, 2015).
Facebook can also measure the responsiveness of a page, or as in the study’s case, a
restaurant, towards these instant messages. This responsiveness is mentioned in the ‘About’
section of the page. A page can choose to display their responsiveness rate on the page. it is
stated as ‘very responsive’, ‘replies within an hour’, ‘replies instantly’, ‘replies within a day’.
Restaurants can also choose to show a green dot on the messenger tab to let its fans or page
visitor know that they are online. This encourages a user to connect instantly with a
restaurant, and ask if they have any queries. This feature helps the restaurant in providing fast
redressal of queries from their customers and, makes them appear more approachable. Thus,
providing good customer service, which can result in a positive feedback and WOM
communication from the customer.
All the global chains of restaurants displayed their responsiveness to instant messages, on
their Facebook pages. Domino’s pizza and Mc Donald’s were marked ‘Very responsive’
while the others less responsive, HRC was least responsive among this category with the tag
‘replies within few hours’.
Among the local popular restaurants, Mother India restaurant was the only restaurant that had
displayed its responsiveness on the page. It was marked as ‘Very responsive’. None of the
other restaurants in this category had their responsive score on the ‘Home’ section of the
page.
35
There is a small box under the call to cation button named as ‘Community’. This is where
one can find the fans and followers of a page and also the number of people who have visited
the place, in this study’s case the restaurants. These numbers are important to determine the
number of people that receive post updates from the restaurant in their news feed. The number
of people who have visited this restaurant, can suggest the popularity of the restaurant to a
prospective diner.
When a person likes a page, he/she automatically becomes a follower of the page. But,
Facebook provides the users with an option to either ‘follow’ or ‘unfollow’ a page they ‘like’
so that they see or don’t see the updates, respectively, from the page regularly (Gravesandy).
There is a difference in the number of people who ‘like’ or ‘follow’ a page. Number of
followers are the people who can see the updates from the page regularly without liking a
page. The ‘followers’ of a page can engage with the restaurants. This option was given by
Facebook to its users to see a person or page’s public content without befriending /liking their
profile/ page (Gravesandy).
The demographics of the Fans and followers of a page are provided to the page owners by
Facebook. This is of great importance to the restaurants, as it helps them in knowing who
their fans are and also helps in targeting the audience for a post or advertisement on
Facebook. Like and follows are important figures for the page’s moderator. From a user’s
perspective, the number of fans and followers of a page lets him/her know the popularity of a
restaurant. It is also shown in this section if any of the Facebook ‘friends’ of a user have
visited or liked this page. This can encourage the user to do either of the two or both the
actions.
The number of Likes and Follows on the Facebook pages of global restaurant chains was
much higher than the popular local restaurants. One of the reasons of this could be that the
global chains of restaurants had fans from all over Norway, as most of them have restaurants
in other location besides Oslo. But, HRC was one exception as there is only one HRC in the
whole of Norway and that is in Oslo. The page likes for HRC were 27765 (Hard Rock Cafe
Oslo, 2017), while the 4 local popular restaurants had a combined fan base of 29883 on
Facebook. There is a need for the popular local restaurants to be more regular in posting on
their Facebook page, as it is evident from their average engagement figures that people are
willing to connect with them on Facebook.
36
Among the global chains of restaurants, the Facebook page of Mc Donald’s Norge is liked by
203,061 people and there are 198,338 people who follow the page making the restaurant with
largest number of likes and followers. Lowest on this count was Domino’s Pizza Norge’s
page with only 11, 849 page likes and 11, 652 page follows. The restaurant with overall
lowest score of likes and follows was the popular local restaurant: Ruffino Restaurant. The
page has received 1000 likes and is being followed by 987 people on Facebook.
There is a section of quick links on the left most corner of the page that contains a set of
quick links to the information the restaurant shares on their Facebook page. These quick links
can also be linked to other social media platforms where the restaurant is present. The quick
links can be the links to many other features that Facebook offers a business page, for
example: Events, polls, reviews, sign up to customer club etc. These links attract the user or
Fan to engage further with the restaurant on its page, after they land on its fan page. It is also
a method of answering all the possible queries for a user, about a restaurant, at one place.
He/she might not have to go to other social platforms or websites to find out more about the
restaurant, for example: the reviews about the restaurant, or Instagram posts from the
restaurant, any upcoming event at the restaurant and so on. It is both engaging and time
saving for the customer.
All the restaurants used the basic set of quick links which comprised of ‘Home’, ‘About’,
‘Posts’, ‘Photos’, ‘Likes’. But the global chains of restaurants were found to be using many
more quick links than the local popular restaurants. Link to the restaurant’s Instagram account
was one of the links that 4 of the global chains of restaurants, except Mc Donald’s, used on
their page. ‘Events’ quick link was used by 5 of the 9 restaurants on Facebook, of which only
one was a local restaurant rest all were global restaurant chains.
The description in the about section of the Facebook page acts as a keyword to help find a
page on Facebook. All the local popular restaurants used this feature and the mentioned it
according to the type of cuisine they served. For example: Mother India restaurant mentioned
itself as ‘Indian Restaurant’. On the other, the global restaurant chains described themselves
vaguely for example: Mc Donald’s described itself as a ‘Food and Drink company’. This kind
of description could be because these restaurants are already popular globally, so much so,
that they are a brand. Therefore, these are mostly searched by the brand’s names and not the
food they serve
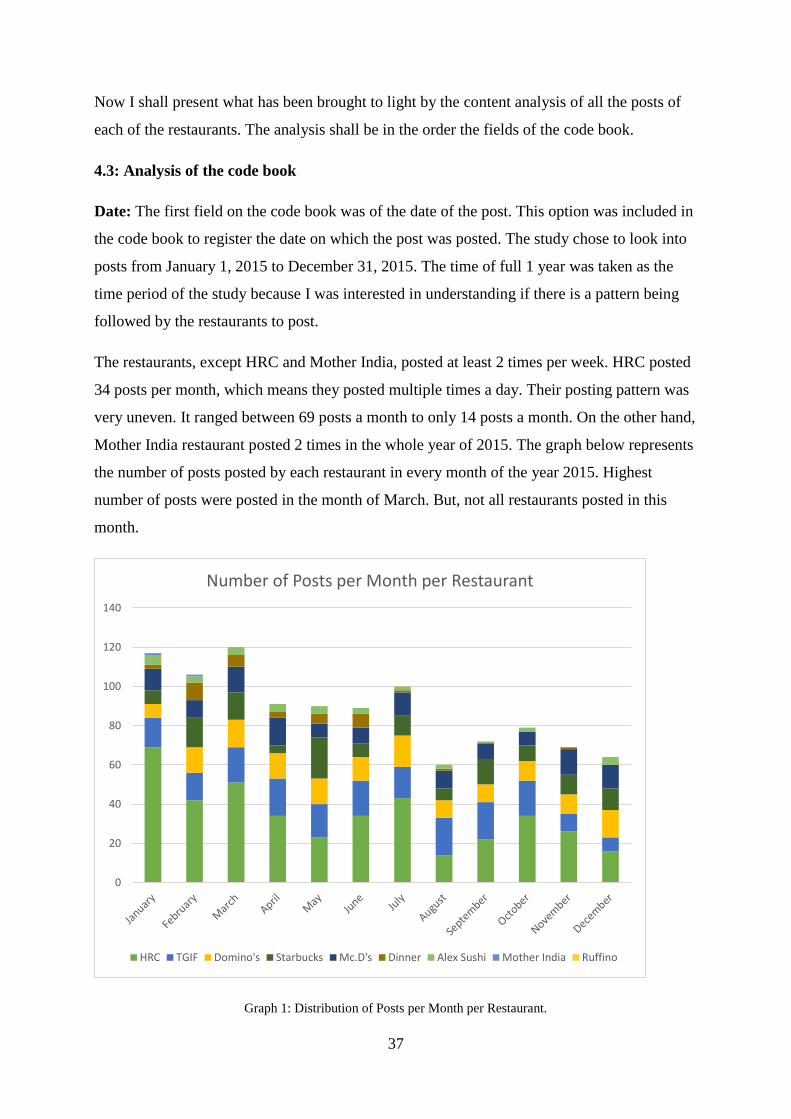
37
Now I shall present what has been brought to light by the content analysis of all the posts of
each of the restaurants. The analysis shall be in the order the fields of the code book.
4.3: Analysis of the code book
Date: The first field on the code book was of the date of the post. This option was included in
the code book to register the date on which the post was posted. The study chose to look into
posts from January 1, 2015 to December 31, 2015. The time of full 1 year was taken as the
time period of the study because I was interested in understanding if there is a pattern being
followed by the restaurants to post.
The restaurants, except HRC and Mother India, posted at least 2 times per week. HRC posted
34 posts per month, which means they posted multiple times a day. Their posting pattern was
very uneven. It ranged between 69 posts a month to only 14 posts a month. On the other hand,
Mother India restaurant posted 2 times in the whole year of 2015. The graph below represents
the number of posts posted by each restaurant in every month of the year 2015. Highest
number of posts were posted in the month of March. But, not all restaurants posted in this
month.
Graph 1: Distribution of Posts per Month per Restaurant.
0
20
40
60
80
100
120
140
Number of Posts per Month per Restaurant
HRC TGIF Domino's Starbucks Mc.D's Dinner Alex Sushi Mother India Ruffino
38
None of the restaurants followed a regular posting schedule, which implies posting on
particular days a week, every week. In fact, there was not even consistency with number of
posts per week. But in general, number of posts per week was higher among the global chains
of restaurants as compared to popular local restaurants. The social marketers do not have a
benchmark set for ‘how many posts’ should be posted per week or month. But, it has been
pointed out by Sophia Dagnon, a social media consultant, that the demographics of your fans
and followers, type of business, type of posts and the number of followers should be taken
into account while deciding on the best suited number for posting on Facebook page (Dagnon,
2017).
The global chains of restaurants posted every month, but the other category of restaurants did
not. A peculiar thing noticed in the analysis was that, in the month of December, the number
of posts went down for all the restaurants. Some did not post at all during December while
others posted infrequently. Similarly, for the months of July and August, which is the time of
school, college and university vacations, the number of posts came down. This drop in the
posting activity of restaurants could be due to many people going out of Oslo for vacations
and celebrating Christmas with family. Therefore, less number of active Fans online. This
inactivity among users is more to do with change in the time of their activity, change in
schedules to be online on Facebook, rather than lack of connectivity of Facebook.
People go to eat out with family and friends on special occasions both personal like birthdays
and anniversaries and festive occasions like the national day etc. The dates were also
important in investigating what is the strategy of the establishment to post near and on special
dates like: public holidays, school/college/university vacations, special occasions and
festivals. These would give an insight on how the restaurants used Facebook maybe to attract
its fans, on the days when they celebrate and tend to go out to eat.
If we see month wise, January is the starting of a new year, all the 8 active restaurants posted
in good numbers in January. HRC posted 69 posts in January, which was the highest by any
of the restaurants. As discussed earlier, HRC was one restaurant that posted several times a
day. February was the month in which special occasions like Valentine’s Day and Mother’s
Day are celebrated in Norway. Every restaurant posted in the weeks preceding Valentine’s
Day, which falls on February 14th, about reserving a table at their restaurant, either directly or
indirectly. Domino’s pizza adopted a different strategy and posted a contest on the February
14 instead of greetings.
39
Again, in the month of April, the festival of Easter is celebrated. In 2015, Good Friday and
Easter were in the first week of April. All the restaurants, except Mother India, posted
greetings for the occasion, some posted it even a week before the festival. In May, Norway’s
national day is an important occasion for the locals to celebrate, surprisingly, not all the
restaurants, posted a greeting on this day. It was more surprising because none of the popular
local restaurants greeted their fans on this day.
Next big season for celebrations is December, with Santa Lucia, Christmas and New Year’s
Eve. 2 of 5 the global restaurants did wish on Santa Lucia day, while none of the local popular
restaurants posted on that day. Christmas and New Year’s greetings were shared by all the
global chains of restaurants, only Alex sushi from the popular local restaurants posted a
greeting for Christmas.
Engaging with the customers on these special days is not necessary but more customary. It is
a general curtsey. The reason the restaurants did not post could be: busy work day at the
restaurants with a large number of guests to serve. Another reason, especially for the local
popular restaurants, could be that most of these are owned by individual persons or families.
During these days of the year even the staff and owners are on vacations. Therefore, the need
to post at these times was felt unnecessary or it might confuse its customers that they are
open.
Importance of language: Language plays an important role in reaching the people well. The
language of the post is very crucial in making the post readable and understandable for the
people it is designed for. If the people do not understand the context or meaning of the post
clearly then they would not be able to engage with the post. The pages of the restaurants were
mainly targeted towards the people living in Norway. The languages used in posting on
Facebook by the selected restaurants was English and Norwegian Bokmål. Norwegian is the
official language in Norway and is widely used. English is also popularly spoken and
understood language especially among the millennials.
The analysis of the page design of the restaurants revealed that none of the restaurants used
completely English or Norwegian on the page. There was a mix of both the languages, as
some fields were marked in Norwegian and some in English. Even the quick links included
Norwegian terms like ‘Meningsmål’, ‘Bursdagsklubb’, ‘nyhetsbrev’, ‘kundeklubb’ etc. it
should be mentioned here that none of the popular local restaurants used Norwegian terms in
40
quick links. On the other hand, all the above mentioned and many more, quick link labels in
Norwegian were used by the global chains of restaurants.
7 out of the selected 9 restaurants on Facebook, used Norwegian as the main language to post
content on their pages. 2 restaurants namely, HRC and Dinner restaurant and Bar posted
predominantly in English in the selected time period of this study.
The next field comprised of the codes assigned to each post. The code book contained 21
codes ranging from 3 to 23. The process of building the code book and the description of what
these codes stand for, is given in the methods section of this thesis. The posts were analysed
on the basis of the content, theme and the message it conveyed. The table below gives an
overview about the codes and its frequency in each restaurant’s posts.
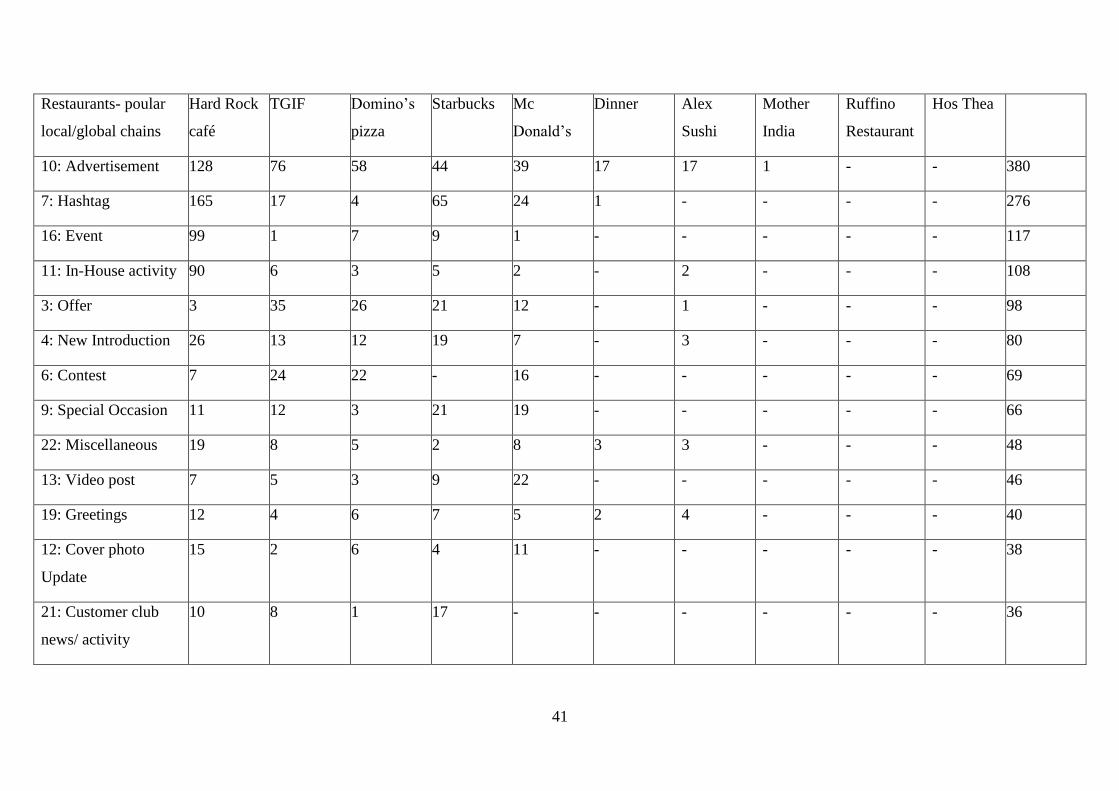
41
Restaurants- poular
local/global chains
Hard Rock
café
TGIF Domino’s
pizza
Starbucks Mc
Donald’s
Dinner Alex
Sushi
Mother
India
Ruffino
Restaurant
Hos Thea
10: Advertisement 128 76 58 44 39 17 17 1 - - 380
7: Hashtag 165 17 4 65 24 1 - - - - 276
16: Event 99 1 7 9 1 - - - - - 117
11: In-House activity 90 6 3 5 2 - 2 - - - 108
3: Offer 3 35 26 21 12 - 1 - - - 98
4: New Introduction 26 13 12 19 7 - 3 - - - 80
6: Contest 7 24 22 - 16 - - - - - 69
9: Special Occasion 11 12 3 21 19 - - - - - 66
22: Miscellaneous 19 8 5 2 8 3 3 - - - 48
13: Video post 7 5 3 9 22 - - - - - 46
19: Greetings 12 4 6 7 5 2 4 - - - 40
12: Cover photo
Update
15 2 6 4 11 - - - - - 38
21: Customer club
news/ activity
10 8 1 17 - - - - - - 36
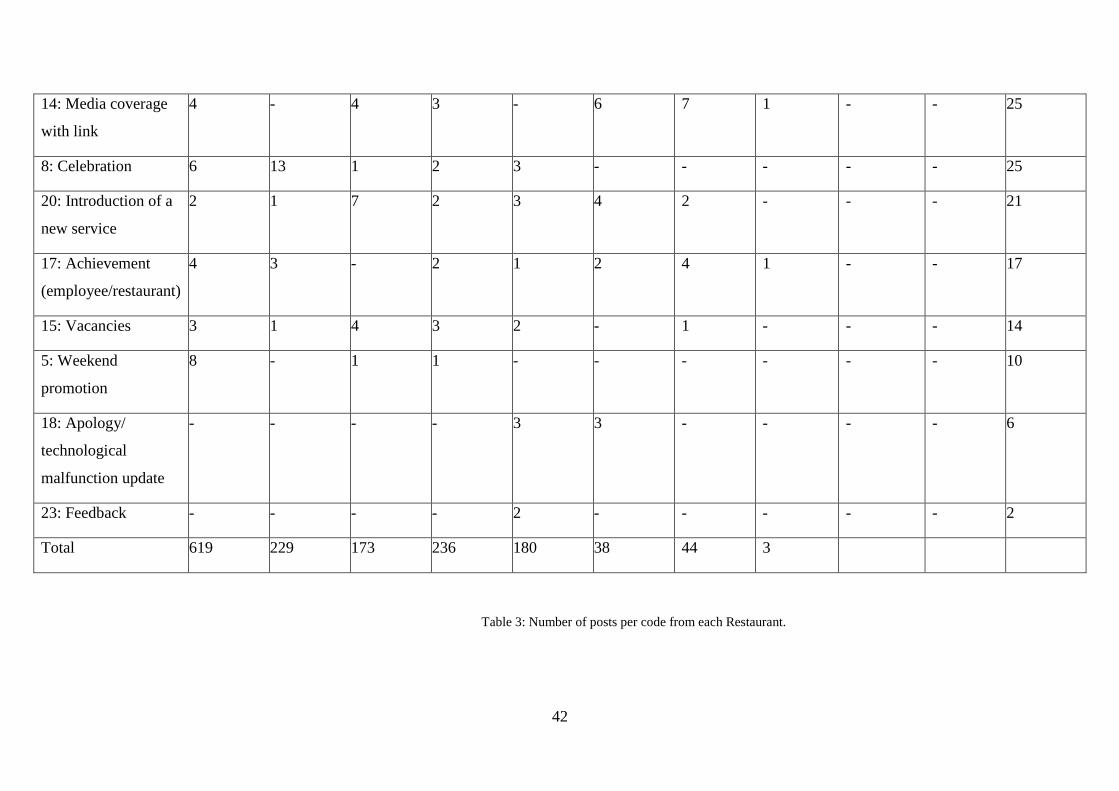
42
14: Media coverage
with link
4 - 4 3 - 6 7 1 - - 25
8: Celebration 6 13 1 2 3 - - - - - 25
20: Introduction of a
new service
2 1 7 2 3 4 2 - - - 21
17: Achievement
(employee/restaurant)
4 3 - 2 1 2 4 1 - - 17
15: Vacancies 3 1 4 3 2 - 1 - - - 14
5: Weekend
promotion
8 - 1 1 - - - - - - 10
18: Apology/
technological
malfunction update
- - - - 3 3 - - - - 6
23: Feedback - - - - 2 - - - - - 2
Total 619 229 173 236 180 38 44 3
Table 3: Number of posts per code from each Restaurant.
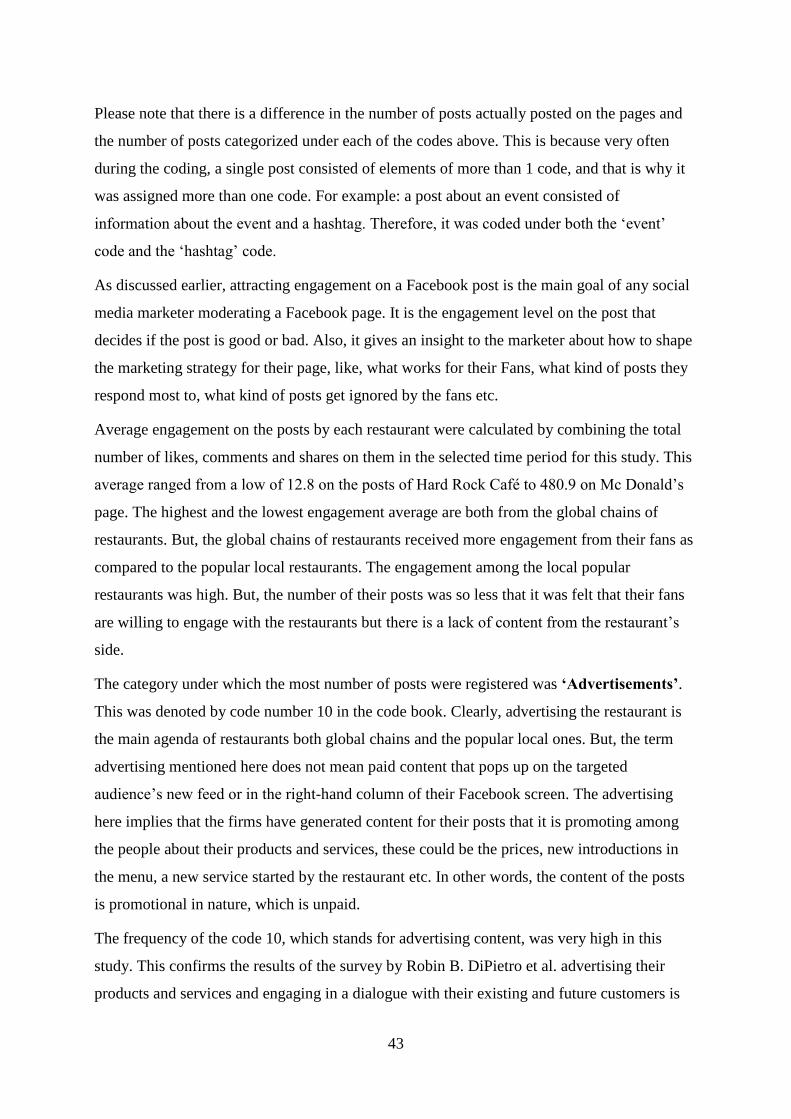
43
Please note that there is a difference in the number of posts actually posted on the pages and
the number of posts categorized under each of the codes above. This is because very often
during the coding, a single post consisted of elements of more than 1 code, and that is why it
was assigned more than one code. For example: a post about an event consisted of
information about the event and a hashtag. Therefore, it was coded under both the ‘event’
code and the ‘hashtag’ code.
As discussed earlier, attracting engagement on a Facebook post is the main goal of any social
media marketer moderating a Facebook page. It is the engagement level on the post that
decides if the post is good or bad. Also, it gives an insight to the marketer about how to shape
the marketing strategy for their page, like, what works for their Fans, what kind of posts they
respond most to, what kind of posts get ignored by the fans etc.
Average engagement on the posts by each restaurant were calculated by combining the total
number of likes, comments and shares on them in the selected time period for this study. This
average ranged from a low of 12.8 on the posts of Hard Rock Café to 480.9 on Mc Donald’s
page. The highest and the lowest engagement average are both from the global chains of
restaurants. But, the global chains of restaurants received more engagement from their fans as
compared to the popular local restaurants. The engagement among the local popular
restaurants was high. But, the number of their posts was so less that it was felt that their fans
are willing to engage with the restaurants but there is a lack of content from the restaurant’s
side.
The category under which the most number of posts were registered was ‘Advertisements’.
This was denoted by code number 10 in the code book. Clearly, advertising the restaurant is
the main agenda of restaurants both global chains and the popular local ones. But, the term
advertising mentioned here does not mean paid content that pops up on the targeted
audience’s new feed or in the right-hand column of their Facebook screen. The advertising
here implies that the firms have generated content for their posts that it is promoting among
the people about their products and services, these could be the prices, new introductions in
the menu, a new service started by the restaurant etc. In other words, the content of the posts
is promotional in nature, which is unpaid.
The frequency of the code 10, which stands for advertising content, was very high in this
study. This confirms the results of the survey by Robin B. DiPietro et al. advertising their
products and services and engaging in a dialogue with their existing and future customers is
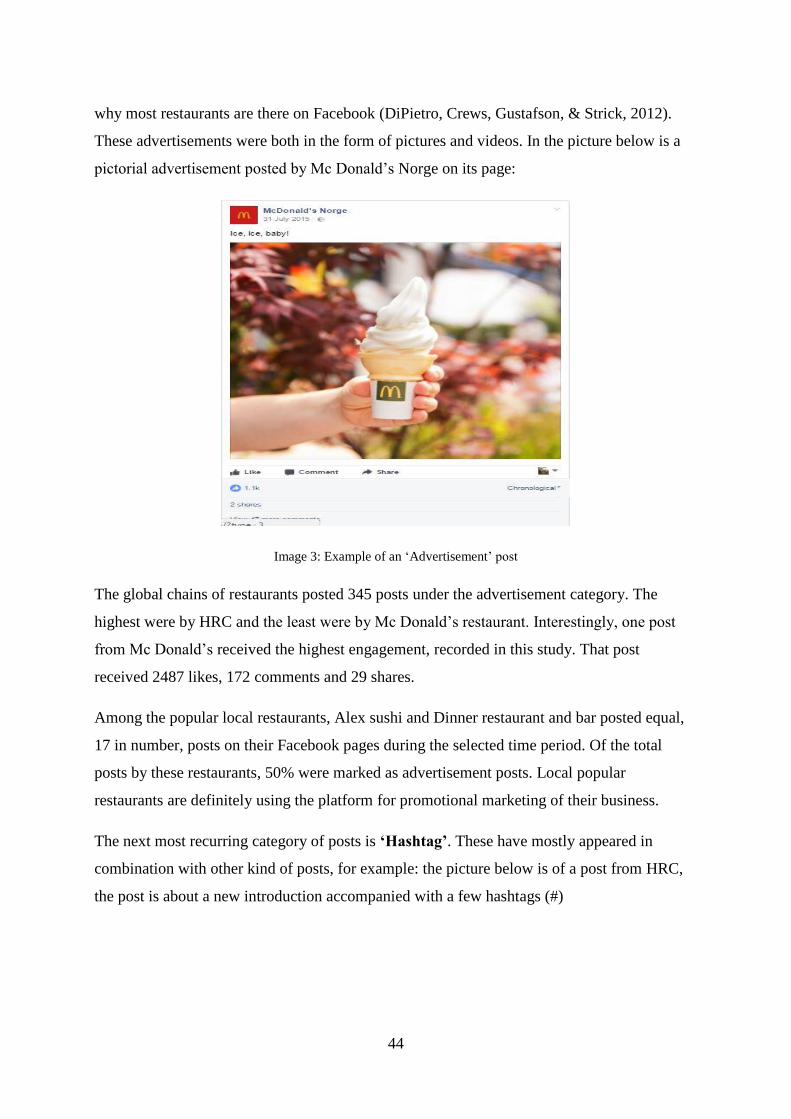
44
why most restaurants are there on Facebook (DiPietro, Crews, Gustafson, & Strick, 2012).
These advertisements were both in the form of pictures and videos. In the picture below is a
pictorial advertisement posted by Mc Donald’s Norge on its page:
Image 3: Example of an ‘Advertisement’ post
The global chains of restaurants posted 345 posts under the advertisement category. The
highest were by HRC and the least were by Mc Donald’s restaurant. Interestingly, one post
from Mc Donald’s received the highest engagement, recorded in this study. That post
received 2487 likes, 172 comments and 29 shares.
Among the popular local restaurants, Alex sushi and Dinner restaurant and bar posted equal,
17 in number, posts on their Facebook pages during the selected time period. Of the total
posts by these restaurants, 50% were marked as advertisement posts. Local popular
restaurants are definitely using the platform for promotional marketing of their business.
The next most recurring category of posts is ‘Hashtag’. These have mostly appeared in
combination with other kind of posts, for example: the picture below is of a post from HRC,
the post is about a new introduction accompanied with a few hashtags (#)
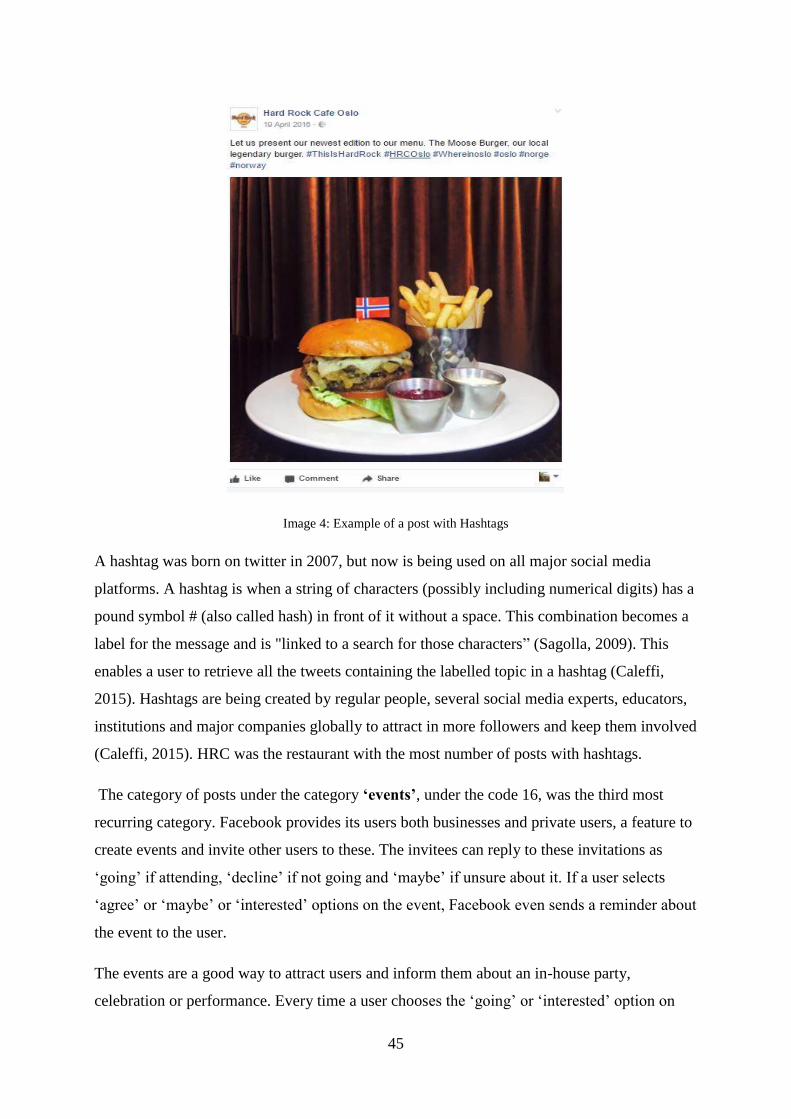
45
Image 4: Example of a post with Hashtags
A hashtag was born on twitter in 2007, but now is being used on all major social media
platforms. A hashtag is when a string of characters (possibly including numerical digits) has a
pound symbol # (also called hash) in front of it without a space. This combination becomes a
label for the message and is "linked to a search for those characters” (Sagolla, 2009). This
enables a user to retrieve all the tweets containing the labelled topic in a hashtag (Caleffi,
2015). Hashtags are being created by regular people, several social media experts, educators,
institutions and major companies globally to attract in more followers and keep them involved
(Caleffi, 2015). HRC was the restaurant with the most number of posts with hashtags.
The category of posts under the category ‘events’, under the code 16, was the third most
recurring category. Facebook provides its users both businesses and private users, a feature to
create events and invite other users to these. The invitees can reply to these invitations as
‘going’ if attending, ‘decline’ if not going and ‘maybe’ if unsure about it. If a user selects
‘agree’ or ‘maybe’ or ‘interested’ options on the event, Facebook even sends a reminder about
the event to the user.
The events are a good way to attract users and inform them about an in-house party,
celebration or performance. Every time a user chooses the ‘going’ or ‘interested’ option on
46
the posted events, it is posted on the newsfeed of all his/her Facebook friends as a story. This
helps in spreading the word about the event and the place where it is hosted. The events can
also be linked with the home of the Facebook page via a quick link.
All the ‘event’ posts were posted by the global chains of restaurants. HRC posted the
maximum number of Events. The reason for this could be that besides being a café it is also a
place for rock music enthusiasts and provides itself as a platform for bands to showcase their
performances. It was noted that many times it posted multiple times about the same event.
Though not a match to the number by HRC, Starbucks posted the second highest number of
‘event’ posts. These events were primarily about opening of a new outlet in Norway. The
picture below is of what a Facebook ‘event’ post looks like. This picture is from HRC Oslo’s
Facebook Page.
Image 5: Example of an ‘Event’ post.
In-house activity was the next category, denoted by number 11, with more than 100 posts
coded under it. Posts in this category were about an activity that happened in the restaurants’
premises. HRC posted the highest number of posts under this category. As discussed above,
HRC hosts a lot of concerts and performances by Rock music bands and posts about them,
which is the reason why it has so many posts under this and the ‘event’ category.
Posts assigned the ‘offers’ code were registered 98 times. TGIF posted the largest number of
‘offer’ kind of posts, 36 in number. Domino’s pizza also had a sizeable amount of ‘Offer’
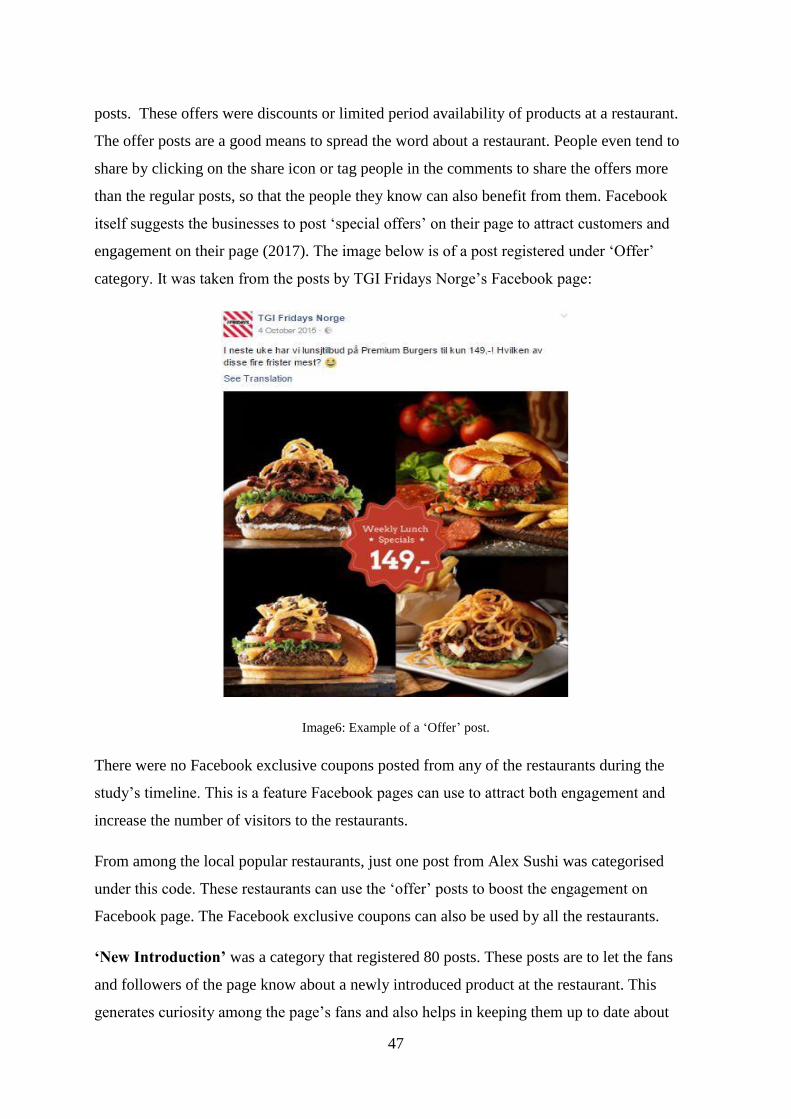
47
posts. These offers were discounts or limited period availability of products at a restaurant.
The offer posts are a good means to spread the word about a restaurant. People even tend to
share by clicking on the share icon or tag people in the comments to share the offers more
than the regular posts, so that the people they know can also benefit from them. Facebook
itself suggests the businesses to post ‘special offers’ on their page to attract customers and
engagement on their page (2017). The image below is of a post registered under ‘Offer’
category. It was taken from the posts by TGI Fridays Norge’s Facebook page:
Image6: Example of a ‘Offer’ post.
There were no Facebook exclusive coupons posted from any of the restaurants during the
study’s timeline. This is a feature Facebook pages can use to attract both engagement and
increase the number of visitors to the restaurants.
From among the local popular restaurants, just one post from Alex Sushi was categorised
under this code. These restaurants can use the ‘offer’ posts to boost the engagement on
Facebook page. The Facebook exclusive coupons can also be used by all the restaurants.
‘New Introduction’ was a category that registered 80 posts. These posts are to let the fans
and followers of the page know about a newly introduced product at the restaurant. This
generates curiosity among the page’s fans and also helps in keeping them up to date about
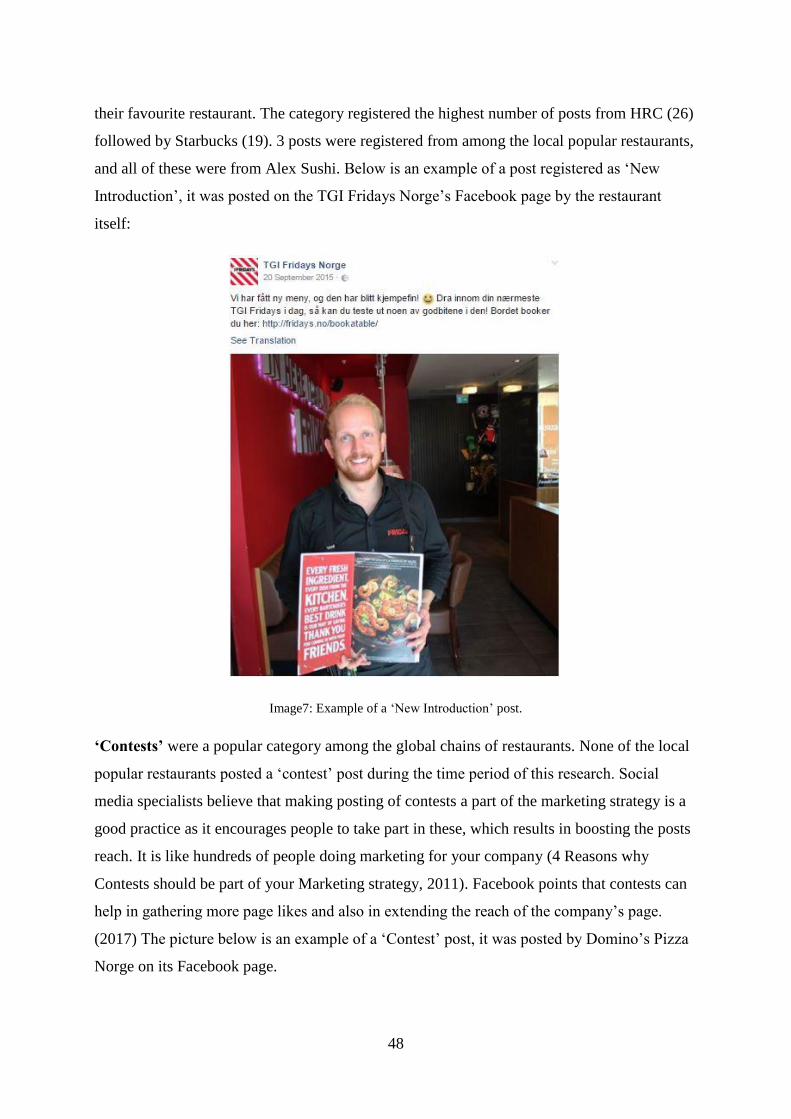
48
their favourite restaurant. The category registered the highest number of posts from HRC (26)
followed by Starbucks (19). 3 posts were registered from among the local popular restaurants,
and all of these were from Alex Sushi. Below is an example of a post registered as ‘New
Introduction’, it was posted on the TGI Fridays Norge’s Facebook page by the restaurant
itself:
Image7: Example of a ‘New Introduction’ post.
‘Contests’ were a popular category among the global chains of restaurants. None of the local
popular restaurants posted a ‘contest’ post during the time period of this research. Social
media specialists believe that making posting of contests a part of the marketing strategy is a
good practice as it encourages people to take part in these, which results in boosting the posts
reach. It is like hundreds of people doing marketing for your company (4 Reasons why
Contests should be part of your Marketing strategy, 2011). Facebook points that contests can
help in gathering more page likes and also in extending the reach of the company’s page.
(2017) The picture below is an example of a ‘Contest’ post, it was posted by Domino’s Pizza
Norge on its Facebook page.
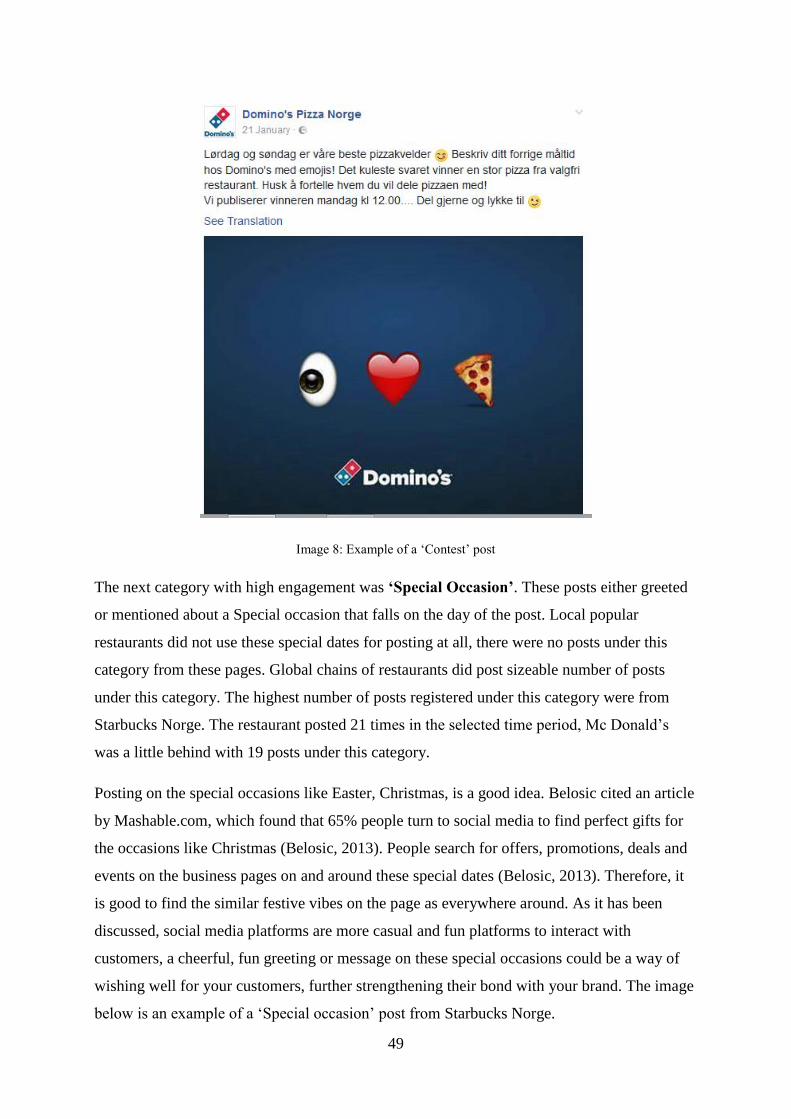
49
Image 8: Example of a ‘Contest’ post
The next category with high engagement was ‘Special Occasion’. These posts either greeted
or mentioned about a Special occasion that falls on the day of the post. Local popular
restaurants did not use these special dates for posting at all, there were no posts under this
category from these pages. Global chains of restaurants did post sizeable number of posts
under this category. The highest number of posts registered under this category were from
Starbucks Norge. The restaurant posted 21 times in the selected time period, Mc Donald’s
was a little behind with 19 posts under this category.
Posting on the special occasions like Easter, Christmas, is a good idea. Belosic cited an article
by Mashable.com, which found that 65% people turn to social media to find perfect gifts for
the occasions like Christmas (Belosic, 2013). People search for offers, promotions, deals and
events on the business pages on and around these special dates (Belosic, 2013). Therefore, it
is good to find the similar festive vibes on the page as everywhere around. As it has been
discussed, social media platforms are more casual and fun platforms to interact with
customers, a cheerful, fun greeting or message on these special occasions could be a way of
wishing well for your customers, further strengthening their bond with your brand. The image
below is an example of a ‘Special occasion’ post from Starbucks Norge.
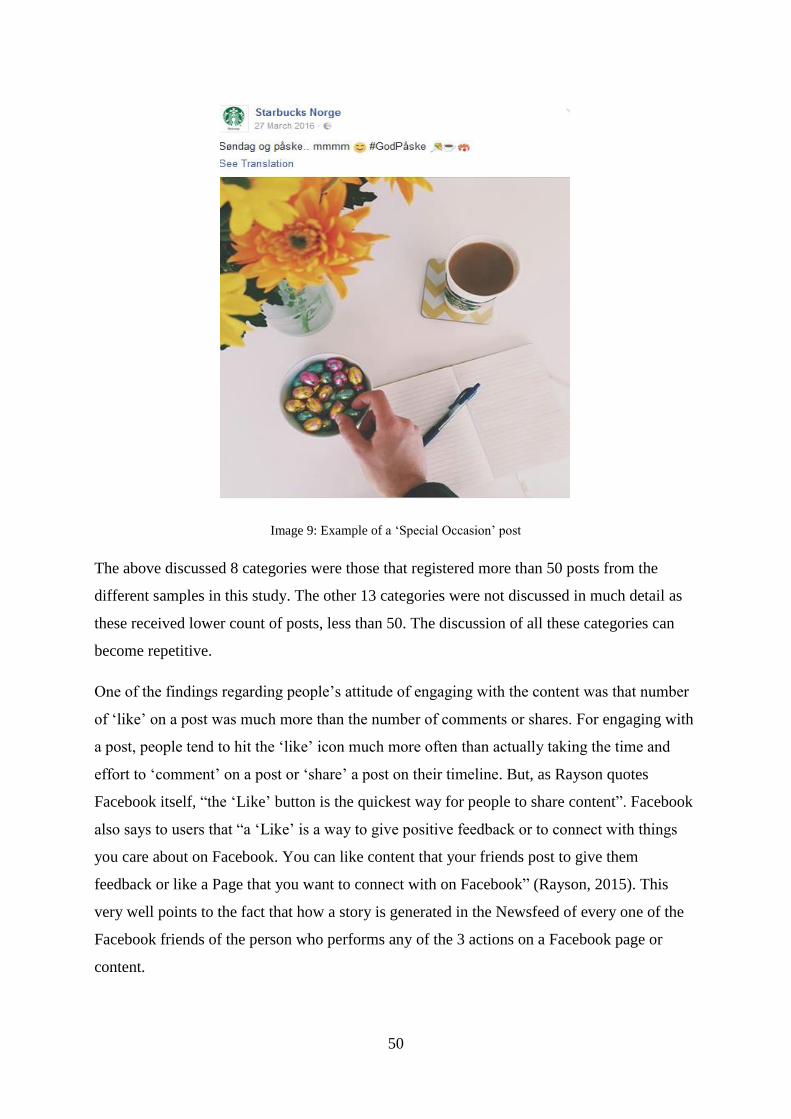
50
Image 9: Example of a ‘Special Occasion’ post
The above discussed 8 categories were those that registered more than 50 posts from the
different samples in this study. The other 13 categories were not discussed in much detail as
these received lower count of posts, less than 50. The discussion of all these categories can
become repetitive.
One of the findings regarding people’s attitude of engaging with the content was that number
of ‘like’ on a post was much more than the number of comments or shares. For engaging with
a post, people tend to hit the ‘like’ icon much more often than actually taking the time and
effort to ‘comment’ on a post or ‘share’ a post on their timeline. But, as Rayson quotes
Facebook itself, “the ‘Like’ button is the quickest way for people to share content”. Facebook
also says to users that “a ‘Like’ is a way to give positive feedback or to connect with things
you care about on Facebook. You can like content that your friends post to give them
feedback or like a Page that you want to connect with on Facebook” (Rayson, 2015). This
very well points to the fact that how a story is generated in the Newsfeed of every one of the
Facebook friends of the person who performs any of the 3 actions on a Facebook page or
content.

51
There are studies that have made similar observations that people tend to hit the ‘Like’ icon
more than the ‘Comment’ or ‘share’ icons. Steve Rayson in his article points to a study by
Marketo and Brian Carter study that suggests that people are 8 times more likely to ‘like’ than
comment or share on Facebook content (Rayson, 2015).
Similarly, the number of shares received by all the posts, in this study, was very low, to which
Rayson agrees in his article. However, he points that ‘likes’ are a way out for a busy person to
share much more content than they usually would (Rayson, 2015).
Analysis of Engagement:
Another scheme of segregating the posts was devised after taking inspiration from the
researches presented by Kwok and Yu and Lee, Hosanagar and Harikesh. Kwok and Yu
concluded that conversational posts from brands, which starts a dialogue between the
customer and the business, receive more engagement from the fans of a page (Kwok & Yu,
2013).
Lee et al., on the other hand, concluded that posts with a mix of promotional, where there is a
mention of product price, sales etc., and conversational content attracted more engagement
from the fans and followers of a page (Lee, Hosanagar, & Nair, 2014). Taking ideas from
both these studies, a method of classifying the codes in this study was devised. This
classification is talked about in detail in the Methods section of this thesis. All the posts were
categorised into promotional and conversational posts.
Here I shall present the results of this analysis. The total and average engagement received by
each category for every selected restaurant was calculated. These values shall later be
compared for global chains of restaurants and popular local restaurants. These figures are
presented in the table below:
Restaurants Promotional posts Conversational
posts
Mix post Total
Count Average Count Average Count Average Count Average
HRC 147 16.5 135 8.9 107 9.4 408 12.8
TGI
Fridays
150 85.6 22 48.6 12 112.1 189 136.5
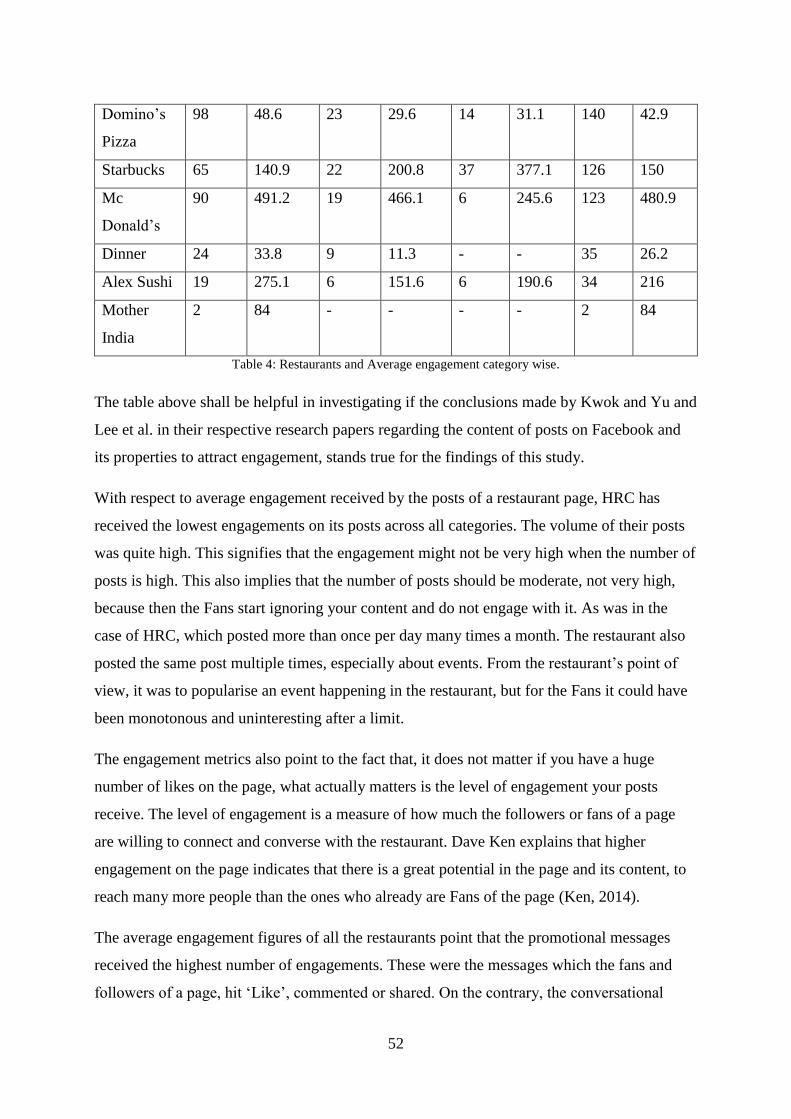
52
Domino’s
Pizza
98 48.6 23 29.6 14 31.1 140 42.9
Starbucks 65 140.9 22 200.8 37 377.1 126 150
Mc
Donald’s
90 491.2 19 466.1 6 245.6 123 480.9
Dinner 24 33.8 9 11.3 - - 35 26.2
Alex Sushi 19 275.1 6 151.6 6 190.6 34 216
Mother
India
2 84 - - - - 2 84
Table 4: Restaurants and Average engagement category wise.
The table above shall be helpful in investigating if the conclusions made by Kwok and Yu and
Lee et al. in their respective research papers regarding the content of posts on Facebook and
its properties to attract engagement, stands true for the findings of this study.
With respect to average engagement received by the posts of a restaurant page, HRC has
received the lowest engagements on its posts across all categories. The volume of their posts
was quite high. This signifies that the engagement might not be very high when the number of
posts is high. This also implies that the number of posts should be moderate, not very high,
because then the Fans start ignoring your content and do not engage with it. As was in the
case of HRC, which posted more than once per day many times a month. The restaurant also
posted the same post multiple times, especially about events. From the restaurant’s point of
view, it was to popularise an event happening in the restaurant, but for the Fans it could have
been monotonous and uninteresting after a limit.
The engagement metrics also point to the fact that, it does not matter if you have a huge
number of likes on the page, what actually matters is the level of engagement your posts
receive. The level of engagement is a measure of how much the followers or fans of a page
are willing to connect and converse with the restaurant. Dave Ken explains that higher
engagement on the page indicates that there is a great potential in the page and its content, to
reach many more people than the ones who already are Fans of the page (Ken, 2014).
The average engagement figures of all the restaurants point that the promotional messages
received the highest number of engagements. These were the messages which the fans and
followers of a page, hit ‘Like’, commented or shared. On the contrary, the conversational
53
messages were neither much in number and were also poorly received. The average
engagement on conversational posts was always, but once, lower than the total average
engagement on the posts.
Starbucks Coffee is one selected variable in this study that received much more engagement
on the conversational and mix category of posts than the promotional posts. In fact, the
number of posts under the mix category was higher than the conversational category. The
average engagement received by Starbucks was 150 for each of its 126 posts. The number of
posts under mixed category was also higher than all the other restaurants except HRC.
Starbucks was the only restaurant that, if compared on the basis of average engagement
received by the 3 categories of the posts, confirms the theory put forward by Lee et al. The
conclusion of their study was that if persuasive content, like posts with emotional content, are
combined with informational content, like posts containing mention of prices, receive high
engagement (Lee, Hosanagar, & Nair, 2014). Starbucks Coffee’s average engagement figures
point the same that when promotional and conversational content is combined it tends to
receive high engagement from the followers and fans of the page. All the other restaurants
had very low number of conversational and mix category of posts. Starbucks Coffee also
stands true for the conclusions made in the study ‘Spreading social media messages on
Facebook: An analysis of restaurant Business-to-Consumer communication’ by Kwok and
Yu. It concluded that the conversational posts are more engaged upon by the Facebook users
than the sales and promotion related posts (Kwok & Yu, 2013).
Promotional posts comprised of the major chunk of the posts posted by the restaurant on their
Facebook page, and were also the ones that received the highest engagements. This stands
contrary to what Kwok and Yu claimed from their study. In the study by Kwok and Yu, the
promotional messages comprised of the major part, about2/3rd, of the total messages analysed.
They concluded that the conversational messages were more endorsed by the people as
compared to the promotional messages.
The dataset prepared after the content analysis revealed another contradictory phenomena, the
previous researches and the restaurants themselves in the interviews have stated that they use
their Facebook pages to receive feedback from the customers. But, the least number of posts
registered in this study were under the code ‘Feedback’. There were only 2 posts that
54
explicitly asked for feedback from the customers, and both these were from Mc Donald’s
restaurant.
In the section below I have presented a summary of the Qualitative interviews conducted with
the moderators of the respective Facebook pages of the restaurants.
4.4: Qualitative interviews
The next level of this research required me to conduct the qualitative interviews with the
person specific in charge of maintaining the Facebook page, also known as the moderator, of
the respective business establishments. These interviews were included in the research to
understand the establishment’s views on the use of Facebook for their business and their
strategy to post on their Facebook pages. The interviews were conducted not face to face but
via different modes of communication due to time constraints. One interview was conducted
over Skype application. One was conducted over mobile phone and other 3 were answered via
email.
As mentioned in the challenges and limitations of this research this was a task that was out of
my control, to secure time for the interviews from the individuals concerned from each of the
selected restaurants. Regular efforts were made repeatedly during the course of the research to
contact them through different means like emails, Facebook messenger, and telephone calls.
But I was successful in receiving a response from 5 establishments out of the selected 10
which made the response rate 50%. This is a problem faced by many of the researchers who
have conducted research on the restaurant businesses.
4.4.1: Qualitative interview with Starbucks:
This interview was conducted over the Skype application, as per the convenience of the
interviewee. It was an informal interview and I wrote down all the answers as we talked. The
company’s Facebook page was started the same time as the first outlet in the city opened in
May 2013. But, there were already about 20 imposter or unofficial pages running on
Facebook using the brand’s name.
The company agrees to social media being an important tool for businesses and tries to be
where the people are. Facebook being the largest platform for social networking, has to be a
part of their policy. They have been using it to connect with the customers and know them
better with regards to their tastes and preferences. Company also uses it to receive feedback
55
from their fans. The interviewee himself was the moderator of the company’s page and it was
maintained by the internal staff of the company.
The major chunk of their Facebook posts is a representation of the company itself and its
products. Posts are also about what the latest happenings are in-house, at their outlets. There
are strategies in place for planning and targeting the posts. The official Facebook page of the
company is serving them the purpose for which it was made. They do not use it for paid
advertising instead believe in strengthening their fan base organically and maintaining them.
Being a global brand, there is a regular exchange of information and ideas inside the company
globally. Experiences and best practices are shared among colleagues from all around the
world. Social media is also a part of the employees every day, for example: in the form of
Skype conferences.
The company plans to get better at posting content on the page. They also plan to claim the
unofficial pages and combine all the pages from their different outlets as one so that the
customer is not confused about the brand.
4.4.2: Qualitative interview with Mc Donald’s Norway:
This interview was done via email as that was suitable to the informant. The interviewee was
contacted via the customer service centre who forwarded my request to the person in charge
of maintaining the Facebook page of Mc Donald’s Norway. The answers were precise but
insightful.
The Mc Donald Norge’s official Facebook page was started in the year 2008. It was
interesting to know that there were no plans or permission from the company’s bosses to
indulge in Facebooking. But, the interviewee saw a good potential in making a Facebook page
and wanted to test this new platform. The page was set up and they never had to apologise for
this action.
The interviewee has been the person in-charge of the page. For past 1 ½ year the page in
being managed with the help of their advertising agency DDB. The customer service
department also helps in content creation and answering customer queries.
The company seldom use the page for advertising (paid) purposes. Its policy is to post not
more than 2 posts per week. The content should be informative and entertaining and attract
engagement. There are separate pages for the different outlets all around the city, but, these
are mostly used to inform about local offers and activities.
56
There is internal collaboration in the company globally, with sharing of best practices,
insights and ideas for managing the page. They even work with Facebook Inc. itself on
national and global level.
The company agrees to the page serving its purpose but it was pointed out that both the
purpose of the page and people have evolved and changed, since the time it was set up. They
look forward to learn ways to engage and use the page better and become the best page on
Facebook.
4.4.3: Qualitative Interview with Dinner Restaurant and Bar
This interview was conducted via email as per the convenience of the interviewee. I had sent
the set of questions via email to the interviewee, and she emailed me back the answers written
next to each question. The answers were very exact and short. As there was no chance for a
face to face interview there was little chance to ask supplementary questions or to ask the
interviewee to elaborate upon her answers.
The informant wasn’t sure when their page on Facebook actually started, and the company
was following the trend of setting up a Facebook page for marketing purposes. The page was
maintained by the employees in the administrative department of the establishment.
The company’s strategy was to post as and when they feel the need to post. It does not see any
advantage or disadvantage of a local popular restaurant being on Facebook as the restaurant is
full with customers almost every day. Its plan is to use the page as they are currently using it,
because it is fulfilling the purpose for which it was set up.
4.4.4: Qualitative interview with Alex Sushi.
This qualitative interview was conducted via email, again as per the convenience of the
interviewee. I had emailed the set of questions to the interviewee and she emailed me back
with the answers. The answers in this interview were well formed and insightful, but at places
I still feel a few supplementary questions could have been asked, based on the replies of the
interviewee, to gather detailed information.
The official Facebook page of Alex Sushi was set up 3-4 years ago and the interviewee was
the moderator of this page.
The page started off as a way to test it as a new marketing platform. Presently it is being used
as an outlet to share information from the restaurant, market events at the restaurant, share its
57
reviews and achievements and also receive feedback from the customers. There are plans to
hire a marketing firm to manage the restaurant’s page in future.
There is no particular posting schedule that the restaurant follows and uses it more on an ad
hoc basis for the purposes mentioned earlier.
The employees use Facebook group chats internally in the organisation on a regular basis for
communication among them. The establishment is satisfied with the effectiveness and utility
of its page on Facebook.
4.4.5: Qualitative interview with Hos Thea.
The restaurant was contacted to participate in the interview but declined to participate due to
some reasons, but the owner of the restaurant was kind enough to talk and answer a few
queries. He gave the permission to include the conversation in the thesis if quoted as it is. I
had written down the conversation simultaneously while talking to him. As per the permission
of the interviewee I shall present the full conversation here and not a summary as done for the
earlier interviews.
Q. I would like to know the reason your restaurant is not present on any of the Social
networking sites despite being the most popular restaurant in Oslo, according to the Trip
Advisor website.
A. Thank you for your kind words, but we don’t advertise much, we believe in the
appreciation of our patrons and the word of mouth.
Trip advisor is customer’s territory, I think it does not reflect much about the quality of the
restaurants. But, again I do respect their (the customers’) decision, after all they are the ones
whom we also depend upon.
We just try to do the best work we can and rely on the feedback and word of mouth from our
customers. Thank you.
The Trip advisor’s ‘Restaurants in Oslo’ page has Hos Thea as the number one restaurant in
the city out of 1134 restaurants listed on the website. The restaurant received 926 reviews on
their listing there. 81% of the reviewers have rated the restaurant as ‘excellent’ with a score of
5/5. There are 338 pictures posted by the reviewers on the listing (Hos Thea , 2017).
There is an unofficial page of Hos Thea on Facebook too. The page has received 626 likes.
2,853 visits have been registered on this unofficial page (Hos Thea Restaurant Unofficial
page, 2017). A visit is generated when any person posts a location update on their personal
58
timeline. So, whenever a person visits Hos Thea and updates their location as them being at
the restaurant, on Facebook, it is registered as a visit. This is updated as a story on the news
feed of each of their friends on Facebook. Friends of the visitor can like comment or share
this story. This creates a series of eWOM. People have also posted pictures from their visit at
the restaurant and tagged people with whom they have visited. This activity of tagging people
generates a story even for the friends of the ‘tagged’ person. This way the story reaches even
more people as the audience of the post increases manifolds and so are the recipients of the
eWOM from the person visiting the restaurant.
The level of activity on the page in the form of reviews, check-ins and the number of fans,
points towards a good potential to have a Facebook page for this establishment. People are
already willing to converse and show their endorsement for the restaurant. They are sparing
time to make location updates, tag the people they are dining with and also writing reviews on
this page.
If the restaurant decides to launch an official Facebook page and use it to post content, both to
promote their products and services and converse with their patrons, it can receive a very
good level of engagement. Being a local popular restaurant and the best on the TripAdvisor
website can boost their fan base and also work in their favour to attract both local and tourist
customers.
The owner of the restaurant mentioned that they believe in doing their best in what they do, is
definitely correct. But, as the previously done researches suggest that the customers are
willing to make connections and spread Word-of-mouth for these establishments and brands
even via the SNSs with nearly no motive for a reward or appreciation (Freeman, et al., 2014).
Therefore, there is no harm in trying to make this connection.
4.5: Findings
The main findings of this research are as under:
1. Facebook is a platform for promoting and information sharing. Facebook founded by
mark Zuckerberg, as a medium to find and connect with classmates at the Harvard
University. But the concept and the website were so appealing to the millennials that it
spread across US and then the world at a very fast pace. Today it is the largest social
media platform in the world with more than 1 billion active users daily. This makes
Facebook the platform with huge potential for even the companies to be on.
59
There are success stories from humble establishments, which prove the fact that, if used
judiciously, Facebook is a tool that can benefit both socially and economically. Which
implies that this is a good medium to raise awareness about your service or product
through WOM and also get the people to buy it which increases revenues. For example:
Beirut Diwan, a local popular restaurant in Beirut, used Facebook as its number one
marketing channel. Boosting delivery sales was the foremost goal. The marketing
campaign, which started in 2014, was based on the belief to post regularly relevant and
engaging content on their page. It posted about their menu, pictures of take away meals
and used features like ‘Boost post’ and ‘audience targeting’, facilitated by Facebook to
businesses. It boosted the restaurant’s delivery sales by 15% and take away orders by
28% (Success stories: Diwan Beirut).
The content analysis reveals that the Facebook is fore mostly used for advertising and
spreading the word. By advertising here does not mean the use of the ‘Facebook adverts’,
the paid feature of Facebook for businesses. It helps the business establishments with
making advertisements for their products and helps in reaching them a particular targeted
audience. Instead, advertisement category in this research includes all the posts by the
establishments on their Facebook page that were about information regarding their
products and services. The frequency of advertisements, denoted by code 10, clearly
denotes the point that major chunk of all the posts were advertisements. A total of 380
posts were coded as advertisements of which 345 posts were by the global chains of
restaurants and only 35 posts were from the local popular restaurants.
The advertisements can further be categorised as picture and video advertisements.
Mc Donald’s was one restaurant that had shared advertisement videos. These were the
same ads of the company as were running on other visual mediums like television,
YouTube channels etc. These advertisements emphasised on the marketing strategy of
Mc Donald’s Norway depicting how they have locally sourced most of the raw material,
for their products. The likes and comments on the video posts were given importance
over the count of views on these videos, as views are counted even if the viewer just
scrolled past the video and did not watch the advertisement deliberately.
The pictorial advertisements were majorly pictures accompanied by a short descriptive
text. Pictorial advertisements were used by both the categories of restaurants. But the
global chains used it much more often than the popular local restaurants. Pictorial
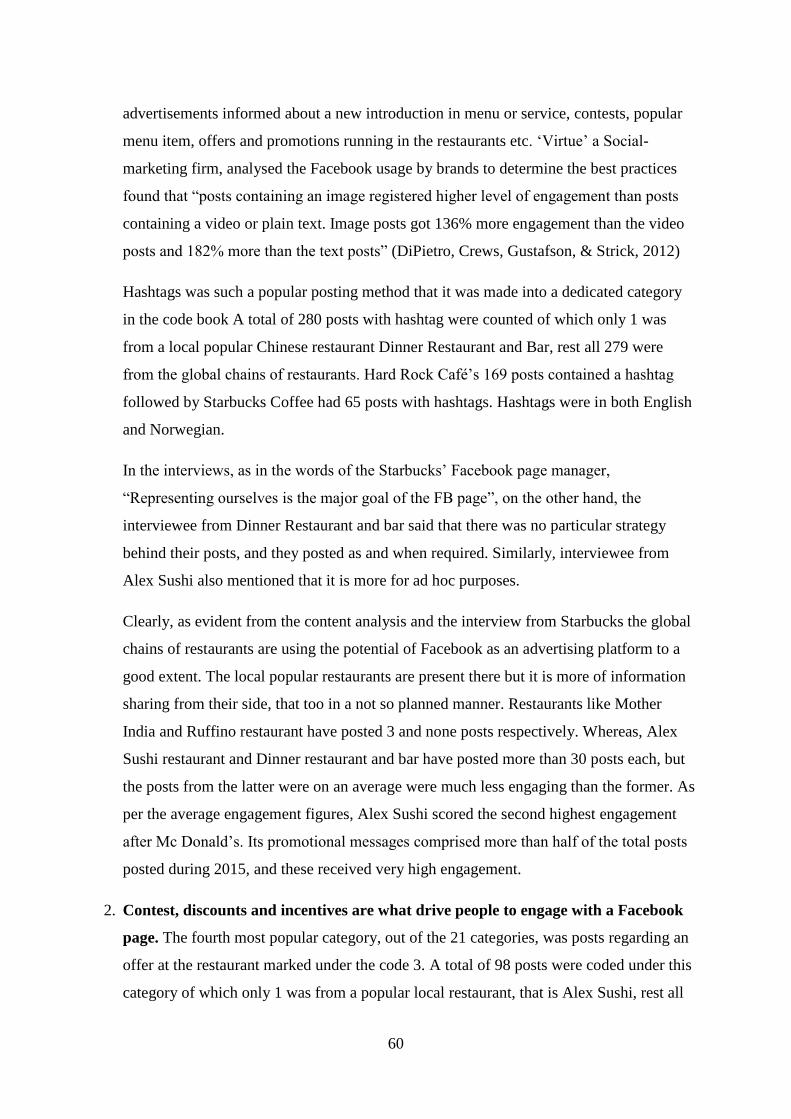
60
advertisements informed about a new introduction in menu or service, contests, popular
menu item, offers and promotions running in the restaurants etc. ‘Virtue’ a Social-
marketing firm, analysed the Facebook usage by brands to determine the best practices
found that “posts containing an image registered higher level of engagement than posts
containing a video or plain text. Image posts got 136% more engagement than the video
posts and 182% more than the text posts” (DiPietro, Crews, Gustafson, & Strick, 2012)
Hashtags was such a popular posting method that it was made into a dedicated category
in the code book A total of 280 posts with hashtag were counted of which only 1 was
from a local popular Chinese restaurant Dinner Restaurant and Bar, rest all 279 were
from the global chains of restaurants. Hard Rock Café’s 169 posts contained a hashtag
followed by Starbucks Coffee had 65 posts with hashtags. Hashtags were in both English
and Norwegian.
In the interviews, as in the words of the Starbucks’ Facebook page manager,
“Representing ourselves is the major goal of the FB page”, on the other hand, the
interviewee from Dinner Restaurant and bar said that there was no particular strategy
behind their posts, and they posted as and when required. Similarly, interviewee from
Alex Sushi also mentioned that it is more for ad hoc purposes.
Clearly, as evident from the content analysis and the interview from Starbucks the global
chains of restaurants are using the potential of Facebook as an advertising platform to a
good extent. The local popular restaurants are present there but it is more of information
sharing from their side, that too in a not so planned manner. Restaurants like Mother
India and Ruffino restaurant have posted 3 and none posts respectively. Whereas, Alex
Sushi restaurant and Dinner restaurant and bar have posted more than 30 posts each, but
the posts from the latter were on an average were much less engaging than the former. As
per the average engagement figures, Alex Sushi scored the second highest engagement
after Mc Donald’s. Its promotional messages comprised more than half of the total posts
posted during 2015, and these received very high engagement.
2. Contest, discounts and incentives are what drive people to engage with a Facebook
page. The fourth most popular category, out of the 21 categories, was posts regarding an
offer at the restaurant marked under the code 3. A total of 98 posts were coded under this
category of which only 1 was from a popular local restaurant, that is Alex Sushi, rest all
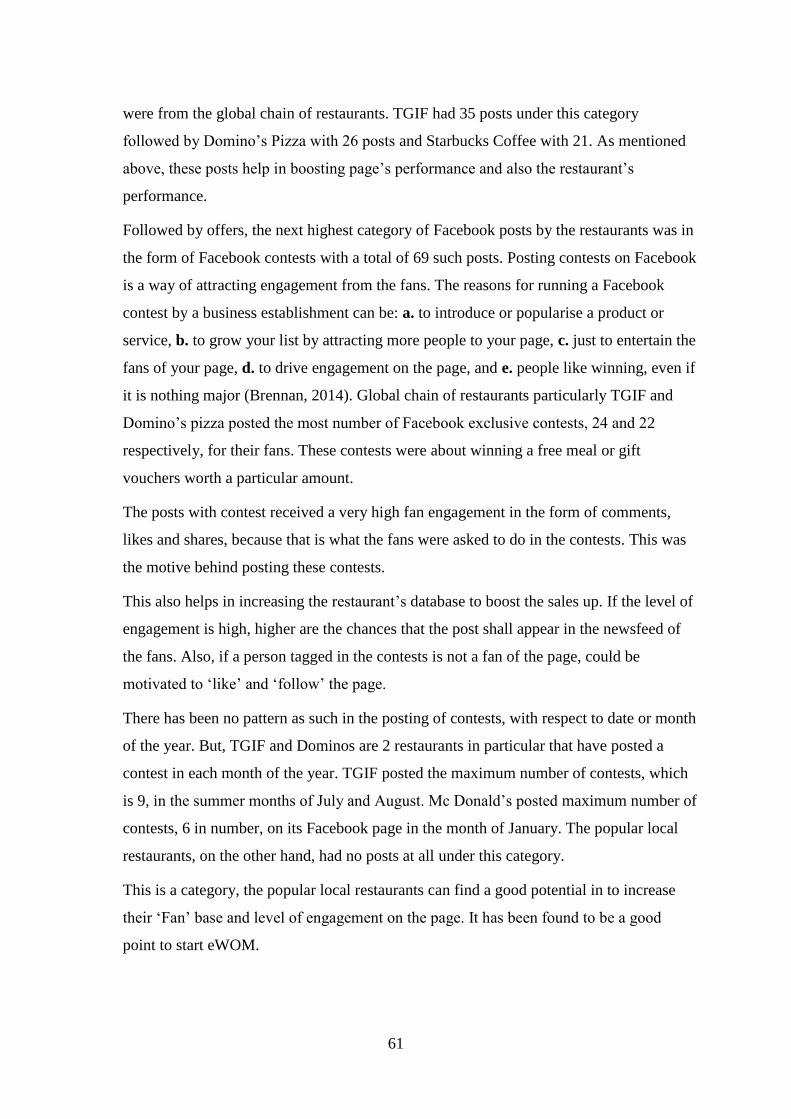
61
were from the global chain of restaurants. TGIF had 35 posts under this category
followed by Domino’s Pizza with 26 posts and Starbucks Coffee with 21. As mentioned
above, these posts help in boosting page’s performance and also the restaurant’s
performance.
Followed by offers, the next highest category of Facebook posts by the restaurants was in
the form of Facebook contests with a total of 69 such posts. Posting contests on Facebook
is a way of attracting engagement from the fans. The reasons for running a Facebook
contest by a business establishment can be: a. to introduce or popularise a product or
service, b. to grow your list by attracting more people to your page, c. just to entertain the
fans of your page, d. to drive engagement on the page, and e. people like winning, even if
it is nothing major (Brennan, 2014). Global chain of restaurants particularly TGIF and
Domino’s pizza posted the most number of Facebook exclusive contests, 24 and 22
respectively, for their fans. These contests were about winning a free meal or gift
vouchers worth a particular amount.
The posts with contest received a very high fan engagement in the form of comments,
likes and shares, because that is what the fans were asked to do in the contests. This was
the motive behind posting these contests.
This also helps in increasing the restaurant’s database to boost the sales up. If the level of
engagement is high, higher are the chances that the post shall appear in the newsfeed of
the fans. Also, if a person tagged in the contests is not a fan of the page, could be
motivated to ‘like’ and ‘follow’ the page.
There has been no pattern as such in the posting of contests, with respect to date or month
of the year. But, TGIF and Dominos are 2 restaurants in particular that have posted a
contest in each month of the year. TGIF posted the maximum number of contests, which
is 9, in the summer months of July and August. Mc Donald’s posted maximum number of
contests, 6 in number, on its Facebook page in the month of January. The popular local
restaurants, on the other hand, had no posts at all under this category.
This is a category, the popular local restaurants can find a good potential in to increase
their ‘Fan’ base and level of engagement on the page. It has been found to be a good
point to start eWOM.
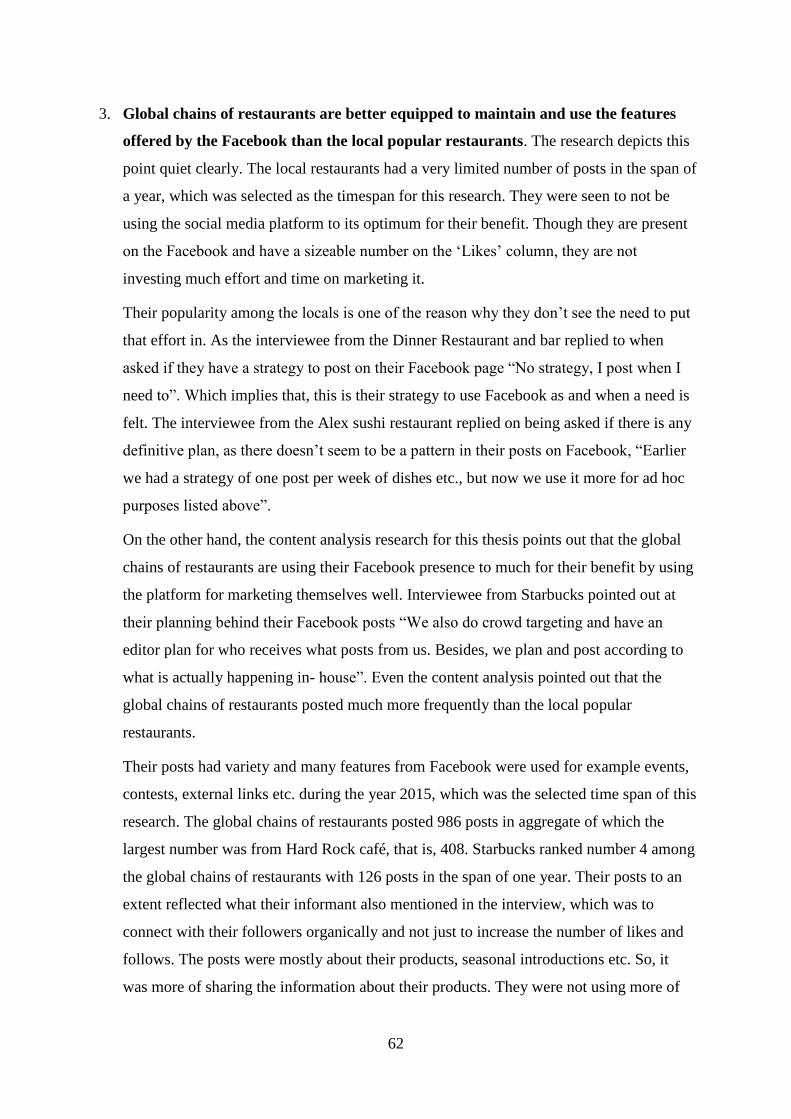
62
3. Global chains of restaurants are better equipped to maintain and use the features
offered by the Facebook than the local popular restaurants. The research depicts this
point quiet clearly. The local restaurants had a very limited number of posts in the span of
a year, which was selected as the timespan for this research. They were seen to not be
using the social media platform to its optimum for their benefit. Though they are present
on the Facebook and have a sizeable number on the ‘Likes’ column, they are not
investing much effort and time on marketing it.
Their popularity among the locals is one of the reason why they don’t see the need to put
that effort in. As the interviewee from the Dinner Restaurant and bar replied to when
asked if they have a strategy to post on their Facebook page “No strategy, I post when I
need to”. Which implies that, this is their strategy to use Facebook as and when a need is
felt. The interviewee from the Alex sushi restaurant replied on being asked if there is any
definitive plan, as there doesn’t seem to be a pattern in their posts on Facebook, “Earlier
we had a strategy of one post per week of dishes etc., but now we use it more for ad hoc
purposes listed above”.
On the other hand, the content analysis research for this thesis points out that the global
chains of restaurants are using their Facebook presence to much for their benefit by using
the platform for marketing themselves well. Interviewee from Starbucks pointed out at
their planning behind their Facebook posts “We also do crowd targeting and have an
editor plan for who receives what posts from us. Besides, we plan and post according to
what is actually happening in- house”. Even the content analysis pointed out that the
global chains of restaurants posted much more frequently than the local popular
restaurants.
Their posts had variety and many features from Facebook were used for example events,
contests, external links etc. during the year 2015, which was the selected time span of this
research. The global chains of restaurants posted 986 posts in aggregate of which the
largest number was from Hard Rock café, that is, 408. Starbucks ranked number 4 among
the global chains of restaurants with 126 posts in the span of one year. Their posts to an
extent reflected what their informant also mentioned in the interview, which was to
connect with their followers organically and not just to increase the number of likes and
follows. The posts were mostly about their products, seasonal introductions etc. So, it
was more of sharing the information about their products. They were not using more of

63
Facebook Ads feature but were advertising their products via their posts on their
Facebook page.
Similarly, Mc Donald’s restaurant that had 123 posts in the selected time period, also had
a variety in their posts and the interviewee from the restaurant also pointed out that they
have a policy regarding, how much they post. They also have support from their
marketing agency and customer support staff to create content for their page.
Language is also considered an important part of the post. In Norway, the official
language is Norwegian and it is widely spoken and understood around the country.
Norwegian was the dominant language used for posting by the restaurants, making the
post relevant for the local population as well as the domestic tourists. There were bi-
lingual posts too with some text in English and some in Norwegian, which still conveyed
the message clearly. But 1 variable from global chains of restaurants, namely, HRC and 1
from the popular local restaurants, Dinner restaurant and bar, were 2 such variables that
seldom posted in Norwegian and used English as the preferred language in their posts.
Why they did so was not in the purview of this thesis and therefore, was not further
investigated into. But, what I can suggest as a reason for posting in English for HRC is
that, its fans might mostly be English speaking or understanding Rock music enthusiasts.
Also, another possibility could be that due to it being a part of a popular global chain of
restaurants, it is frequented by tourists and locals alike. Therefore, English is considered a
better option to communicate via the posts.
4. Facebook pages are an important part of the marketing strategy of the global chains
of restaurants, but not of popular local restaurants. The content analysis, of the
official pages of the selected restaurants, for this study indicate that the global chains of
restaurants have better infrastructure and planning going into what they post on their
Facebook page rather than the local popular restaurants. There is a good volume of
content on the pages of global chains of restaurants. Of the total number of posts
investigated in this study over 93% of the posts were from the official Facebook pages of
the global chains of restaurants against the super low of less than 7% of the posts from the
local popular restaurants in Oslo. Out of the 5 local popular restaurants 1 is not even there
on Facebook and 1 did not post anything for the full year of 2015.
Even with regards to the average engagement received by a post, the global chains of
restaurants in general were way ahead of the popular local ones, for instance, Mc
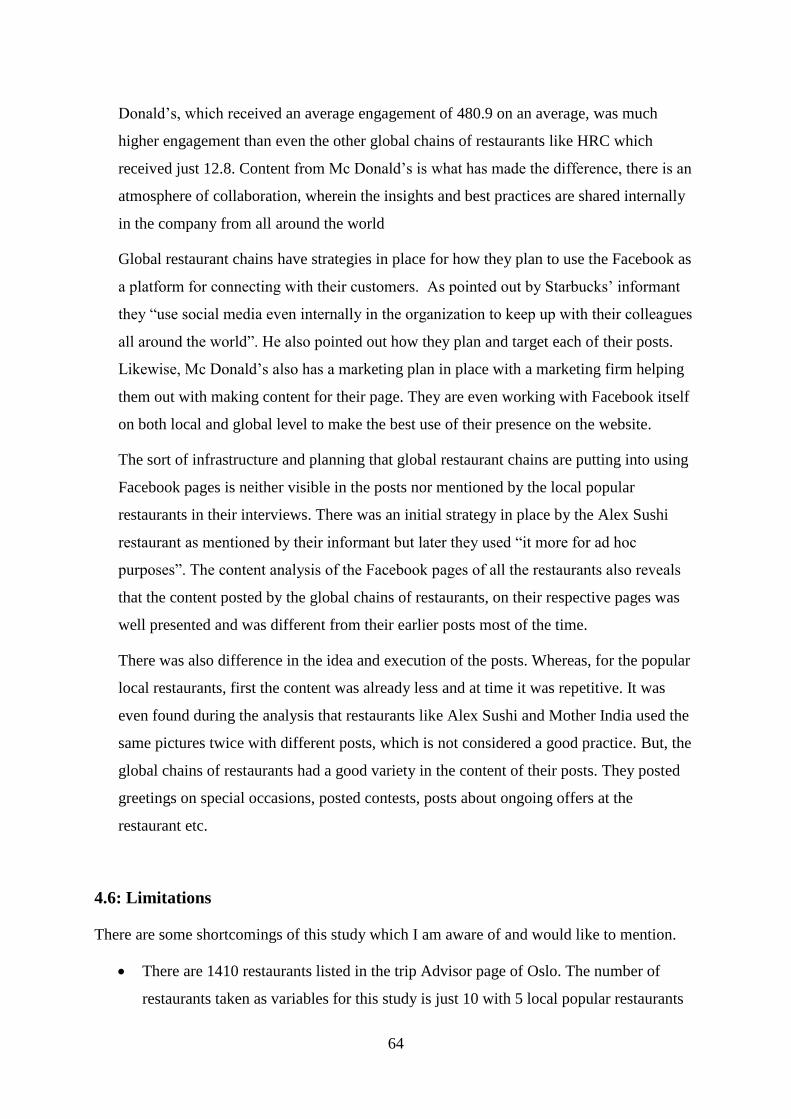
64
Donald’s, which received an average engagement of 480.9 on an average, was much
higher engagement than even the other global chains of restaurants like HRC which
received just 12.8. Content from Mc Donald’s is what has made the difference, there is an
atmosphere of collaboration, wherein the insights and best practices are shared internally
in the company from all around the world
Global restaurant chains have strategies in place for how they plan to use the Facebook as
a platform for connecting with their customers. As pointed out by Starbucks’ informant
they “use social media even internally in the organization to keep up with their colleagues
all around the world”. He also pointed out how they plan and target each of their posts.
Likewise, Mc Donald’s also has a marketing plan in place with a marketing firm helping
them out with making content for their page. They are even working with Facebook itself
on both local and global level to make the best use of their presence on the website.
The sort of infrastructure and planning that global restaurant chains are putting into using
Facebook pages is neither visible in the posts nor mentioned by the local popular
restaurants in their interviews. There was an initial strategy in place by the Alex Sushi
restaurant as mentioned by their informant but later they used “it more for ad hoc
purposes”. The content analysis of the Facebook pages of all the restaurants also reveals
that the content posted by the global chains of restaurants, on their respective pages was
well presented and was different from their earlier posts most of the time.
There was also difference in the idea and execution of the posts. Whereas, for the popular
local restaurants, first the content was already less and at time it was repetitive. It was
even found during the analysis that restaurants like Alex Sushi and Mother India used the
same pictures twice with different posts, which is not considered a good practice. But, the
global chains of restaurants had a good variety in the content of their posts. They posted
greetings on special occasions, posted contests, posts about ongoing offers at the
restaurant etc.
4.6: Limitations
There are some shortcomings of this study which I am aware of and would like to mention.
There are 1410 restaurants listed in the trip Advisor page of Oslo. The number of
restaurants taken as variables for this study is just 10 with 5 local popular restaurants
65
and 5 global chains of restaurants. This is small number that might not represent the
total number of local restaurants well. Also, there are other very popular local
restaurants even those with multiple Michelin star recognition, but they were not
included in the study as they did not meet the criteria set for variable selection.
The number of global chains of restaurants in Oslo is quite limited, the 5 restaurants
that were chosen as variables for this study can be seen as a good representation of all
the global chains of restaurants that operate in the Oslo region.
The qualitative interview had to be done mostly via e-mail due to which the
opportunity to ask to elaborate on answers or focus on any particular finding by asking
supplement questions instantly, was not possible.
The restaurant that was considered for a case study declined to participate in the
interview for the Case Study. And as they did not have a Facebook page it was not
possible to do any kind of content analysis for them.
The study takes into account only the Facebook posts of the selected restaurants and
not any of other social networking sites on which the selected restaurants might be
present. There is a chance for future research into this aspect of the use of social
networking sites by the restaurants other than Facebook.
Content analysis: In this study, the Facebook posts of all the restaurants were coded
according to their content, the reliability of the study was acceptable. But there is
always a scope to use another method to understand how restaurants use Social media
and social networking sites, from another perspective. I strongly favour the view by
Kwok and Yu, that there is scope, in future, to adopt other theories and methods to
understand this complex phenomenon (Kwok & Yu, 2013).
The study was concerned only about what the restaurant’s post. Therefore, the
messages and interaction of the consumers with the company or with other consumers
was not taken into consideration as it was not in the scope of this study. In the
comments section of the Facebook posts there were spams, unrelated comments, etc.
in any given post but these were also not sorted from related posts instead the total
number of comments on each post was registered in the code book This is an area
where further research can be done to understand the engagement pattern of the
consumer on a fan page.
66
This study does not take into consideration the performance of a post on the sales and
traffic to the restaurant, also termed as ‘return on investment’ (RoI) (Kwok & Yu,
2013). It is possible that a seemingly not so engaging post on Facebook drew a lot of
restaurant visits or good sales for a restaurant. The number of ‘likes’, ‘comments’ and
‘shares’ were the only metrics that were used to gauge customer’s engagement on the
page.
As pointed out by Kwok and Yu in their study ‘Spreading social media messages on
the Facebook’ Facebook and other social media platforms are continuously evolving.
They are frequently improving and updating their interface and services making them
a moving target (Kwok & Yu, 2013). Which means it was changing even during the
time the study was undertaken.
Also with time the restaurants are acquiring skills and knowledge about using the
social networking sites to their maximum benefit. The study period was chosen to be
January 1, 2015 to December 31, 2015, because the data for that period was fully
available. It could be that the restaurants have improved on how to use their Facebook
pages from 2015 till now, yet the study is relevant for the restaurant businesses. Also
like Kwok and Yu also suggested, there is a scope for a longitudinal study to
understand how the companies develop and change their social media strategies over
the time (Kwok & Yu, 2013).
With the above-mentioned limitations, the study is still relevant as it sheds light on the
difference in use of the same Social media platform, Facebook, by different types of
Restaurant businesses in Oslo. It brings out the marketing strategies employed by these
businesses and how these strategies differ depending upon the size of the business. It also
sheds light on how the features offered by Facebook to businesses, are being used by these
restaurants. Erik Hekman and Marieke Welledonker-Kuijer in their study about Facebook
usage among local restaurants in Amsterdam, London, Houston, and New York pointed out
the need for content analysis of Facebook posts by restaurants on their Facebook pages for
future study (Hekman & Kuijer, 2012). This research work is an attempt to build upon the
previous researches and dig deeper into the area of Facebook use by restaurant businesses, by
analysing not just the Facebook posts but also how each restaurant has designed its Facebook
page and asking the moderators of the page about its utility, how they use it and what they
plan for its future?
67
Chapter 5: Conclusion
The study revealed that the global chains of restaurants are more serious towards using their
Facebook pages as a medium to connect and engage with their customers. As mentioned in
previous researches there is no clear consensus in the findings of different studies regarding
what works best as the content of the posts, informative or persuasive. The study here found
that the content that was grouped as the promotional messages received more engagement in
terms of “likes”, “shares” and “comments” from the followers or as Facebook terms them as
“Fans” of a brand page.
The local popular restaurants have a divided opinion on the usefulness of Facebook pages for
their businesses. As mentioned in the study by DiPeitro et al. the local popular restaurants are
also not utilizing their Facebook page’s full potential. As is visible from their Facebook
pages, they are not using all the features provided by Facebook, as the global chains of
restaurants are using, for e.g. the way the restaurants used the quick link tabs on the left most
corner of the Facebook page. This could be due to lack of knowledge or time on the part of
the local popular restaurant as it has been pointed out by one of the informants that their
restaurant is almost full every evening so they don’t care much of maintaining the Facebook
page well.
5.1: Conclusion of the hypotheses
Now I shall discuss the hypotheses that I formulated in the beginning of this study to see if
they stand true or false.
Hypothesis 1, was that Social media marketing is an important type of marketing today.
With increasing interest among the academics and marketers in the study of social media and
its utility and challenges in marketing, social media marketing has surely become a popular
line of study. The number of people using social media for networking and for searching
products and services has increased significantly in the past 5 years. Therefore, many scholars
like Garretson, Dan Zarrella and Evans have suggested in various studies that the business
enterprises must market their products via social media as a large number of their potential
customers are using these platforms every single day.
Social media marketing has proved beneficial not just for global conglomerates but also
humble local businesses, as the world of Social networking is easily accessible to everyone
68
via the internet. And the better part is it can be done organically which is for free. And when
you have some funds to use for marketing it is even not that costly to market your product or
service on these Social networking sites.
The findings of the study point that there are clear differences in the use of Social networking
sites, specifically Facebook, on which this study is based, among the global and local
businesses. But, the study agrees with what the researches and studies done earlier suggest,
that this is a medium that has the power to help a business reach millions of people around the
globe.
97% of the business establishments are using some or the other form of social media to
market themselves, its efficient use is unclear to 2/3 of the marketers. Only 1/3 of the
marketing managers were found to be satisfied with their use of the Social media effectively.
Rest feel there is disconnect between what they are doing with the social media and what
ought to be done. (VanMeter, Grisaffe, & Chonko, 2015) It is developing every day and some
knowledge and practical learning can make your page reach the right people in no time.
Marketers believe that Social media has the potential to generate customer generated word-of-
mouth (WOM) communication and spread it across a large community of individuals who are
connected via their social networks on the SNSs. (VanMeter, Grisaffe, & Chonko, 2015)
Hypothesis 2: The Social media marketing via Facebook pages is an important part of
the marketing policy of all kinds of restaurants in Oslo. This is a hypothesis that forms the
crux of this study. It was believed, at the start of this study, that Facebook with such vast
reach and following, is the place for the marketers today to be. They can connect with their
customers and attract locals and tourists to their establishments. This hypothesis points to the
major finding of this study, which is that the global chains of restaurants surely give good
importance to their Facebook pages to connect with their fans. They post in good numbers
and have a plan for their Facebook page’s content and look. They even reply to people’s
comments on their posts, which engages the ‘Fan’ of their page with the restaurant. This is
also considered a good practice in Social media marketing. There is an overall high average of
engagement on the pages of the global restaurant chains. Still, restaurants like HRC need to
be more proactive in communicating with the customers than treating the page as another
platform to advertise and popularise their events and food. Because the volume of their posts
69
is 41.3% of the total posts by the global chains of restaurants but the engagement they
received on an average was much lower than rest of the restaurants from this category.
Local popular restaurants present another story, much different from the former category of
restaurants. These say that they rely more on the quality of their food and service to speak for
them and also spreading the word of mouth through their satisfied customers. Though there
are restaurants like Alex sushi who are experimenting with ways to use their Facebook page
in a more efficient way, as stated in the interview, with plans of using a marketing firm to run
their Facebook page. These are steps in the direction of making it an important part of the
firm’s marketing policy. But, with more than 90% of the population in Oslo using social
networking sites and with many success stories of small businesses benefitting from their
presence on Facebook, local popular restaurants surely have a potentially strong tool in their
hands in the form of Facebook pages.
Also, as stated in the limitations that the social media is a moving subject and its channels are
evolving and improving. But, so are the marketing plans of the restaurant management and
owners. Therefore, it is a good time to start planning seriously about a social media marketing
policy so that they do not lag behind when the rest of the world is a pro at it.
Hypothesis 3: All restaurants selected for this study have a page on Facebook and are
working towards using it to its best potential and to benefit from it.
The restaurants selected for this study were taken from 2 broad categories of restaurants, one
is global restaurant chains and the other is popular local restaurants. All of these selected
restaurants had a functional website of their own. But, all of these restaurants did not have an
official Facebook page of their own. ‘Hos Thea’ the most popular restaurant in Oslo
according to the ‘Restaurants in Oslo’ page on the Trip Advisor website (Trip Advisor
website, 2017), does not have a page on Facebook. Rest all the other selected restaurants have
an official Facebook page.
The global restaurant chains have definitely been using their page for a lot of promotion and
conversation with their Fans on the page. On the other hand, the popular local restaurants are
there on Facebook, but their activity on it is quite limited. This was concluded after taking
into account the total number of posts posted by each of the selected restaurants. The volume
70
of posts by all global chains of restaurants against the popular local ones was much higher.
The local popular restaurants posted less than once a week on an average, while the global
chains of restaurants, on an average, posted 2 times per week (except HRC). It is surprising
because, the local popular restaurants understand the people of the city better, and can post
content that is more relevant and relatable to the local population. They have the power to
create powerful experiences for the local community that they are part of (Walter, 2014).
There are researches for example: research paper by Robert DiPietro et al. that point that
though there is a great potential in Facebook as a marketing platform, but, being a relatively
newer channel, restaurant owners and marketers are unsure how to use to its maximum
potential.
The qualitative interviews with the moderators of the Facebook for the respective restaurants
shed light on their plans for the pages. Most restaurants were positive about using the
Facebook page. They did share that there is a plan in place for what they post and when they
post on the restaurant’s Fan pages. As regards the future of their Facebook page’s policy, they
also had plans to learn and explore new ways of using their existing pages on Facebook to the
best interest of the establishments. For example: Alex Sushi had plans to collaborate with a
marketing firm to use their Facebook presence more effectively.
Dinner restaurant and Bar was one exception. No posting strategy was its strategy, as it was
mentioned, that they had no plans in particular, about the future of their Facebook page, and
shall post according to their needs. Though, the content on the page of the restaurant was
found to be engaging by the followers, it needs to post more often and in a planned manner.
The most successful companies on the social networks have nailed it only by scaling up the
relative content on their Facebook pages and in turn attracting customer engagement by
conversing with them on the page (Walter, 2014). This has resulted in the spread of positive
eWOM for the restaurant and in turn more and more people ‘Like’ the page.
Marketing in today’s world is a not what it used to be a decade ago, where the consumer was
a passive receiver of the marketing content from companies. Instead, today’s marketers must
capture the attention of the consumer through their content and then keep them engaged by
conversing with them (Hanna, Rohm, & Crittenden, 2011). The social networking sites,
specifically Facebook, are platforms that provides the marketers to do just that. It gives the
marketers the option to put out their marketing messages via the business pages and attract
71
their customers and then encourage them to converse and engage with your page that can
create the ripple effect of eWOM and attract more customers for the restaurant.
Mc Donald’s restaurant was one of the variable that has been successful in using their
Facebook page to a good extent. The company have incorporated various applications and
information to its page and has tried to give the customer as much information as possible at
one place. It also boasts the largest number of fans and followers and has been engaging well
with its patrons. The average engagement received by all the 3 categories of posts was also
the highest for this restaurant. The team that manages the page has strategies and design of
posts in place to post content on their Facebook page.
5.2: Final Takeaway and scope for future studies:
Online social networks or SNSs, as they are popularly known, are a powerful medium today
to spread the word and make the people talk about a company or product. These networks
have the reach of millions across the globe, transcending the boundaries of place, time and
even language. There are thousands of stories that point towards the fact that if used in a
sensible manner the SNSs can empower a humble business enterprise to compete with the
biggest brands.
To conclude I would like to show my agreement with what DiPeitro et al. had pointed, that
the hospitality establishments like restaurants and hotels agree to the importance and utility of
Facebook as a medium to engage with existing customers and attract more customers. But,
there is still ambiguity on how these SNSs can be and should be used to the best interest of
their establishments (DiPietro, Crews, Gustafson, & Strick, 2012).
With social media marketing’s importance rising, it is expected to share 21.4% of the total
marketing budgets by 2019 (Soat, 2014) (VanMeter, Grisaffe, & Chonko, 2015). But, there is
a need for the marketers to clear their doubts and vision regarding social media marketing.
Stenlzner in his research report has found that a very high percentage, 97% people use social
media to market their company. Of these 54% named Facebook as their first choice for
marketing among the social media channels. But, according to him 63% of the marketers are
still unclear about the effects of social media on their company’s ROI or Return of
Investments (Stelzner, 2014) (VanMeter, Grisaffe, & Chonko, 2015). There is a need to learn
and practice the skill to engage with the customer and also to keep them engaged on your
72
posts, because in the end, that is the goal of every establishment’s presence on the social
networks.
The global chains of restaurants have learnt the way of using Facebook for business purposes.
However, Facebook is developing itself, and is launching new features and applications to
facilitate its users. These restaurants need to be up to date with the knowledge and usage of
the above. Popular local restaurants, on the other hand, need to be active in not just posting
content but also in engaging with its customers. The level of engagement on their posts on
Facebook, point that the followers are willing to converse with these restaurants. They need to
post more often and also bring variety in their content and use the available Facebook features
and applications to their maximum benefit. Especially the page design feature, which is
unpaid and can make a whole lot of difference in user experience on the company’s Facebook
page, because, this can be the ‘first impression’ of the restaurant for a potential customer.
The world of marketing is being revolutionised by the Social media, and if these restaurants
do not focus their attention on these sites, they might lag behind. There are many examples of
local humble establishments benefitting from their Facebook marketing campaigns, proving
that it is not a platform where only the global conglomerates with infrastructure and
collaborations can excel. Instead, it is the content and responsiveness of the businesses that
makes people follow and stay engaged with them on Facebook.
The study above has not taken into account the comments posted under each of the posts. It
can shed light onto how people react to particular posts from the restaurants, which can help
these establishments to plan engaging content for their posts. There is a lot of spam content
also posted in the comments. This type of content shows incorrect level of engagement,
therefore needs to be investigated further, so that methods can be devised to check and
identify such comments and exclude them when calculating the actual level of engagement.
This study can be helpful for the restaurants who already have a page on Facebook but are
unsure about the content to post on it, how often to post, and how to engage with their fans
and followers? It can also be helpful for those who plan to include Facebook page as part of
their marketing plans. Because through the findings of this study they can learn about ‘How’
can a popular Facebook page be designed, how often should a company post and what kind of
content attracts most engagement and which type of posts can be avoided.
73
As the previous researches have focussed more on the content and the engagement received
on the posts and not the design of the page, this study is an attempt to fill that gap. It provides
a holistic account of what works better on the Facebook page with regards to both content and
design, as these features are provided by Facebook to all businesses alike.
74
References
4 Reasons why Contests should be part of your Marketing strategy. (2011, July 21). Retrieved
from Mashable website: http://mashable.com/2011/07/21/contest-marketing/
About Hos Thea restaurant. (2017, May 13). Retrieved from Hos Thea restaurant website:
http://www.hosthea.no/en/about/
Arndt, J. (1967). Role of product- related conversations in the diffusion of a new product .
Journal of Marketing research, 291-295.
Belosic, J. (2013, October 31). 5 ways to prepare your Facebook page for the Holidays.
Retrieved from Social Media Examiner website:
http://www.socialmediaexaminer.com/prepare-your-facebook-page-for-the-holidays/
Boyd, D. M., & Ellison, N. B. (2007). Social Network Sites: Definition, History, and
Scholarship. Journal of Computer Mediated communication, 210- 230.
Brennan, J. (2014, July 14). How to Use Facebook Contests for More Engagement and Sales
(Andrea Vahl). Retrieved from Agora Pulse website:
https://www.agorapulse.com/blog/facebook-contests-for-more-engagement-and-sales-
andrea-vahl
Brinkmann, S. (2014). Interview. In T. T. (Editor), Encyclopedia of Critical Psychology (pp.
1008-1010). New York: Springer New York.
Caleffi, P. -M. (2015). The 'hashtag': a new word or a new rule? SKASE Journal of
Theoretical Linguistics., 46(24).
Calisir, F. (2003). Web advertising vs other media: young consumers’ view. Internet Resarch,
356- 363.
Cartwright, R. J. (n.d.). Internet marketing vs. Social media marketing. Retrieved from RJ's
Internet Marketing Services: http://www.rjsinternetmarketing.com/internet-marketing-
vs-social-media-marketing/
Cheung, C. M., & Thadani, D. R. (2010). The Effectiveness of Electronic Word-of-Mouth
Communication: A Literature Analysis., (pp. 329- 345). Bled.
Company info Facebook. (2017, March). Retrieved from Facebook newsroom:
https://newsroom.fb.com/company-info/
Cvijikj, I. P., & Michahelles, F. (2013). Online engagement factors on Facebook brand pages.
Social Network Analysis and Mining, 843-861.
75
Dagnon, S. (2017, January 4). How often should I post to my Facebook page? Retrieved from
Agora pulse website: https://www.agorapulse.com/blog/post-to-facebook-frequency
De Chernatony, L. (2001). Succeeding with the brands on the internet. Journal of Brand
Management, 186-195.
Desai, P. (2002). Qualitative Research and the internet. In P. Desai, Methods Beyond
Interviewing in Qualitative Market Research (pp. 99-115). Sage Publications.
DiPietro, R. B., Crews, T. B., Gustafson, C., & Strick, S. (2012). The use of Social
Networking Sites in the Restaurant Industry: Best practices. Journal of Foodservice
Business Research, 265-284.
Downe-Wamboldt, B. (1992). Content Analysis: Methods, applicationsand issues. Health
Care for Women International, 313-321.
English Oxford living Dictionaries. (2017, January 28). Retrieved from Oxford Dictionaries
website: https://en.oxforddictionaries.com/definition/marketing
Erkan, I., & Evans, C. (n.d.). The impacts of electronic word of mouth in Social media On
consumers'purchasing intentions. London, United Kingdom.
Evans, D. (2010). Social Media marketing: an Hour a day. Indianapolis: Wiley Publishing
Inc.
Executive Summary. (2007). In J. Musser , & T. O'Reilly, Web 2.0: Principles and Best
practices (p. 5). Sebastopol: O'Reilly Media.
Facebook Pages. (n.d.). Retrieved from Facebook for business:
https://www.facebook.com/business/products/pages/
Freeman, B., Kelly, B., Baur, L., Chapman, K., Chapman, S., Gill, T., & King, L. (2014).
Digital Junk: Food and Beverage Marketing on Facebook. American Journal of Public
Health, 58-64.
Funk, T. (2013). Facebook Advertising. In T. Funk, Advanced Social media Marketing (pp.
75-101). Apress.
Garretson, R. (2008). Future tense: The Global CMO. Economist Intelligence Unit.
Gaur, S., Saransomrurtai, C., & Herjanto, H. (2015). Top Global Firms’ Use of Brand Profile
Pages on SNS for Marketing Communication. Journal of Internet Commerce , 316-
340.
Gill, P., Stewart, K., Treasure, E., & Chadwick, B. (2008). Methods of data collection in
qualitative research: interviews and focus groups. British Dental Journal, 291-295.
Goldsmith, R. E. (2001). Using the Domain Specific Innovativeness Scale to identify
innovative Internet consumers. Internet Research, 149- 158.
76
Gravesandy, S. (n.d.). Difference between a Like and Follow on Facebook. Retrieved from
Katie Wagner Social Media: http://katiewagnersocialmedia.com/the-difference-
between-a-like-and-follow-on-facebook/
Hancock, D. R., & Algozzine, B. (2011). Doing Case Study Reearch: A practical guide for
beginning researchers. New York: Teachers College Press.
Hanna, R., Rohm, A., & Crittenden, V. L. (2011). We're all connected: The power of social
media ecosystem. Business Horizons, 265-273.
Hard Rock Cafe Oslo. (2017, April 22). Retrieved from Hard Rock Cafe Website:
http://www.hardrock.com/cafes/oslo/
Haridakis, P., & Hanson, G. (2009). Social Interaction and Co-Viewing With YouTube:
Blending Mass Communication Reception and Social Connection. Journal of
Broadcasting & Electronic Media, 317- 335.
Harrison-Walker, L. (2001). the measurement of word-of-mouth communication and
investigationof service quality and customer commitmentas potential antecedents.
Journal of Service research, 60-75.
Hekman, E., & Kuijer, M. W. (2012). Facebook Usage by Local Restaurants: A Large Scale
Survey.
Helliwell, J., Layard, R., & Sachs, J. (2017). World Happiness Report 2017. Retrieved from
World Happiness Report : http://worldhappiness.report/ed/2017/
Home page. (2017, May 12). Retrieved from Statistics Norway Web site:
https://www.ssb.no/en/
Hos Thea . (2017, May 17). Retrieved from TripAdvisor website:
https://www.tripadvisor.com/Restaurant_Review-g190479-d1045646-Reviews-
Hos_Thea-
Oslo_Eastern_Norway.html#photos;geo=190479&detail=1045646&ff=222551620&al
bumViewMode=hero&aggregationId=&albumid=103&baseMediaId=222551620&thu
mbnailMinWidth=50&cnt=30&offset=-
Hos Thea Restaurant Unofficial page. (2017, May 17). Retrieved from Facebook.com:
https://www.facebook.com/pages/Hos-Thea/176243545731109
How to Create posts on your Facebookp page. (2017, May 25). Retrieved from Facebook
Business: https://www.facebook.com/business/learn/facebook-page-create-posts
Hseih, H.-F., & Shannon, S. E. (2005). Three Approaches to Qualitative Content analysis.
Qualitative Health Research, 1277-1288.
ICT usage in enterprises 2016. (2016, August 31). Retrieved from Statistics Norway:
https://www.ssb.no/en/teknologi-og-innovasjon/statistikker/iktbrukn
77
Introduction to Qualitative interviews. (2017, May 15). Retrieved from UK Data Service:
https://www.ukdataservice.ac.uk/teaching-resources/interview/qualitative
Jensen, M. B., & Jepsen, A. L. (2007). Online marketing communications: Need for a new
typology of IMC? Journal of Website Promotion, 19-35.
Jeong, E., & Jang, S. (. (2011). Restaurant experiences triggering positive electronic word-of-
mouth (eWOM) motivations. International Journal of Hospitality Management, 356-
366.
Johnston, K. M. (2001). Why e‐business must evolve beyond market orientation: applying
human interaction models to computer‐mediated corporate communications. Internet
Research, 213- 225.
Kaplan, A. M., & Haenlein, M. (2010). Users of the world unite! The challenges and the
opportunities of Social media. Business Horizons, 59-68.
Ken, D. (2014, March 15). Why Engagement Rate is More Important than Likes on Your
Facebook. Retrieved from Social Media Today:
http://www.socialmediatoday.com/content/why-engagement-rate-more-important-
likes-your-facebook
Kozinets, R., Valck, K. d., Wojnicki, A., & Wilner, S. J. (2010). Networked Narratives:
Understanding Word-of-Mouth Marketing in Online Communities. Journal of
Marketing, 71- 89.
Krishnamurthy, S. (2006). Introducing E-MARKPLAN: A practical methodology to plan e-
marketing activities. Business Horizons, 51- 60.
Kvale, S., & Brinkmann, S. (2008). InterViews: Learning the craft of qualitative research
inteviewing. Thousand Oaks: Sage Publications.
Kwok, L., & Yu, B. (2013). Spreading Social media messageson Facebook: An analysis of
Restaurant business-to-consumer communications. Cornell Hospitality Quaterly, 84-
94.
Lee, D. (2013). What is Marketing? Public Services Quarterly, 169- 171.
Lee, D., Hosanagar, K., & Nair, H. S. (2014, October). The Effect of Social Media Marketing
Content on Consumer Engagement: Evidence from Facebook. Retrieved from
https://mackinstitute.wharton.upenn.edu/wp-
content/uploads/2015/01/FP0170_Hosanagar-Kartik.pdf
Leeflang, P. S., Verhoef, P. C., Dahlstrom, P., & Freundt, T. (2014). Challenges adn solutions
for marketing in a digital era. European Management Journal, 1-12.
78
Lehu, J.-M. (2004). Back to life! Why brands grow old and sometimes die and what managers
then do: an exploratory qualitative research put into the French context. Journal of
Marketing Communications, 133-152.
Liu, H. (2007). Social Network Profiles as Taste Performances. Journal of Computer
Mediated communication, 252- 275.
Meho, L. I. (2006). E-mail interviewing in qualitative research: A methodological discussion.
Journal of the American Society for Information Science and Technology, 1284-1295.
Miller, S. E., & Jensen, L. A. (2007, September). Connecting and Communicating With
Students on Facebook. Computers in Libraries, pp. 18- 22.
Minazzi, R. (2014). The digitization of word- of- mouth. In R. Minazzi, Social Media
Marketing in Tourism and Hospitality (pp. 21-45). Springer International Publishing.
Mineo, G. (2015, July| 9). 19 Essential Tips for an Engaging Facebook Business Page.
Retrieved from Hubspot website: https://blog.hubspot.com/marketing/how-to-create-
facebook-business-page-ht#sm.00000sdeptx1jrep2v5mczz7ko8vx
Neuendorf, K. (2002). The Content Analysis Guidebook. Thousand Oaks, CA.: Sage
Publications.
Newberry , C. (2016, October 13). Facebook Marketing: The complete guide. Retrieved from
Hootsuite website : https://blog.hootsuite.com/facebook-marketing-tips/
newsroom.fb.com. (2016, march 30). Retrieved from fb.com:
http://newsroom.fb.com/company-info/
Norwegian media Barometer. (2016, April 14). Retrieved from Statistics Norway:
http://www.ssb.no/en/kultur-og-fritid/statistikker/medie/aar/2016-04-14#content
Norwegian Media barometer, 2015. (2016, April 14). Retrieved from Statistics Norway:
http://www.ssb.no/en/kultur-og-fritid/statistikker/medie/aar/2016-04-14
Olso, Norway. (n.d.). Retrieved from TripAdvisor website:
https://www.tripadvisor.com/Tourism-g190479-Oslo_Eastern_Norway-
Vacations.html
O'Reilly, T. (2007). Introduction. In J. Musser, & T. O'Reilly, Web 2.0: Principles and Best
practices (pp. -). Sebastopol: O'Reilly Media.
Oyza, I., & Edwin, A. M. (2016). Effectiveness of Social Media Networks as a Strategic Tool
for Organizational Marketing Management. Journal of internet banking and
commerce.
Prior, L. (2014). Content Analysis. In P. Leavy, The Oxford Handbook of Qualitative
Research (pp. 359-379). Oxford University Press.
79
Rayson, S. (2015, July 23). Facebook Interactions: Why Shares, Likes and Comments All
Count. Retrieved from Buzzsumo website: http://buzzsumo.com/blog/facebook-
interactions-why-shares-likes-and-comments-all-count/
Restaurants In Oslo. (2017, April 28). Retrieved from Trip Advisor Website:
https://www.tripadvisor.com/Restaurants-g190479-Oslo_Eastern_Norway.html
Richards, T. J., & Tiwari, A. (2014). Social networks and Restaurant Choice. Agricultural
and Applied Economics Association>2014 AAEA/EAAE/CAES Joint Symposium:
Social Networks, Social Media and the Economics of Food, May 29-30, 2014,
Montreal, Canada, (pp. 1-31). Montreal.
Rowley, J. (2001). Remodelling marketing communications in an Internet environment.
Internet Reasearch, 203- 212.
Sagolla, D. (2009). 140 characters: A style guide for the short form. Hoboken: John Wiley &
Son.
Soat, M. (2014, September 9). Marketers Farge ahead on Social Media spending despite
uncertainities, Research shows. Retrieved from American Marketing Association
website: https://www.ama.org/publications/eNewsletters/Marketing-News-
Weekly/Pages/cmo-survey.aspx
Stelzner, M. A. (2014, May). How Marketers are using Social Media to grow their
Businesses. Retrieved from Social Media Examinar:
https://www.socialmediaexaminer.com/SocialMediaMarketingIndustryReport2014.pd
f
Success stories: Diwan Beirut. (n.d.). Retrieved from Facebook business web site:
https://www.facebook.com/business/success/diwan-beirut
Takahashi, T. (2010). MySpace or Mixi? Japanese engagement with SNS (social networking
sites) in the global age. New Media and Society, 453- 475.
Thongmak, M. (2015). Engaging Facebook users in Brand Pages: Different Posts of
marketing- mix Information. Business Information Systems (pp. 299- 308). Poznań:
Springer International Publishing.
Thurau, T. H., Gwinner, K. P., Walsh, G., & Gremler, D. D. (2004). Electronic word-of-
mouth via consumer-opinion platforms: What motivates consumers to articulate
themselves on the Internet? Journal of Interactive Marketing, 38- 52.
Toner, L. (2013, September 26). The History of Facebook Advertising [SlideShare]. Retrieved
from Hubspot website: https://blog.hubspot.com/marketing/history-facebook-adtips-
slideshare#sm.0001tswrtoofndfwxzm2bmc32h7fk
Trip Advisor website. (2017, May 7). Retrieved from Restaurants in Oslo :
https://www.tripadvisor.com/Restaurants-g190479-Oslo_Eastern_Norway.html
80
Valenzuela, D., & Shrivastava, P. (2017, may 15). Interview as a method for Qualitative
Research.
VanMeter, R. A., Grisaffe, D. B., & Chonko, L. B. (2015). Of "Likes" and "Pins": The effects
of Consumers' attachment to Social media. Journal of Interactive Marketing, 70-88.
Vernuccio, M. (2014). Communicating corporate brands through Social media: An
exploratory study. International Journal of Business communication, 211-233.
Walter, E. (2014, December 1). Top 25 Restaurants in Social Media and What Small
Businesses Can Learn from Bigger Chains. Retrieved from Inc. website:
https://www.inc.com/ekaterina-walter/top-25-restaurants-in-social-media-and-what-
smbs-can-learn-from-bigger-chains.html
Weaver, J. (2012, March 30). The Evolution of Facebook for brands. Retrieved from
Mashable.com: http://mashable.com/2012/03/30/facebook-for-
brands/#mQkaA6b20OqC
Weber, R. (1990). Bsic Content Analysis. Newbury park, CA: Sage Publications.
Zarrella, D. (2010). The Social Media marketing book. Sebastopol: O'Reilly.
Related Documents


![[The Health Information System in Sudan] - DUO - Universitetet i Oslo](https://static.cupdf.com/doc/110x72/62074a7e49d709492c2ff163/the-health-information-system-in-sudan-duo-universitetet-i-oslo.jpg)