Fabrication of nano TiO 2 @graphene composite: Reusable photocatalyst for hydrogen production, degradation of organic and inorganic pollutants Yuvaraj Haldorai a , Arunkumar Rengaraj b , Cheol Hwan Kwak b , Yun Suk Huh b, *, Young-Kyu Han a, ** a Department of Energy and Materials Engineering, Dongguk University – Seoul, Seoul, Republic of Korea b Department of Biological Engineering, Biohybrid Systems Research Center (BSRC), Inha University, Incheon 402-751, Republic of Korea A R T I C L E I N F O Article history: Received 26 August 2014 Received in revised form 29 September 2014 Accepted 30 September 2014 Available online xxx Keywords: Graphene oxide Titanium dioxide Nanocomposite Photocatalyst Hydrogen production Photo reduction A B S T R A C T Titanium dioxide (TiO 2 ) nanoparticles decorated reduced graphene oxide (RGO) composites were fabricated via an in-situ sol–gel route. TEM analysis revealed that the TiO 2 nanoparticles of a size less than 8 nm were coated onto the RGO surface. The TiO 2 nanoparticles on the RGO surface were spherical and well dispersed. The nanocomposite exhibited enhanced photocatalytic activity for hydrogen (H 2 ) production with a rate of 203 mmol/h, which was higher than that of TiO 2 (35 mmol/h) and P25 (51 mmol/ h). This is because the TiO 2 nanoparticles on the RGO sheets can capture light energy and facilitate excited electron transfer for H 2 production via the RGO, which acts as an efficient electron mediator. The nanocomposite also showed efficient photocatalytic degradation of methylene blue and photo-reductive conversion of Cr(VI) with a rate of 2.2 and 1.7 times higher than that of P25, respectively. These degradation results indicated that the photocatalytic performance of the nanocomposite was greatly enhanced by the improved adsorption performance and separation efficiency of the photo-generated carriers. The nanocomposite maintained a higher level of activity even after four recycles. ã 2014 Elsevier B.V. All rights reserved. 1. Introduction In recent years, a significant number of studies have involved the search for clean energy sources [1,2]. There is an evident need for an alternative energy source that can at least partially and progressively replace fossil fuels in the near future. Though it is not devoid of complications, hydrogen (H 2 ) is beginning to be seen as the most viable and advantageous option of the various clean energy sources available as an energy vector. Due to its low economic cost, there has been growing interest in the production of H 2 from water by photocatalysis (photo-splitting) through the use of semiconductors. Among the diversity of semiconductors, titanium dioxide (TiO 2 ) has been intensively investigated as a photocatalyst for the production of H 2 because of its outstanding properties, including chemical stability, non-toxicity, and abundant in resources [3]. However, the photocatalytic performance of TiO 2 is significantly reduced due to its wide band gap (3.2 eV) and a rapid recombina- tion of conduction band electrons and valence band holes [4,5]. To overcome the above drawbacks, various doping approaches including metals or nonmetals [6–10], semiconductors [11–13], and carbon materials [14–16] have been reported. Particularly, TiO 2 /graphene composites have attracted an increasing interest due to their potential applications in energy and environmental research areas [17–22]. This is because graphene can act as an excellent electron-acceptor/transport material to effectively facil- itate the migration of photo-induced electrons and suppress the charge recombination in electron-transfer processes due to the electronic interaction between TiO 2 and graphene, which enhances the photocatalytic performance of TiO 2 . Several approaches have been reported in the literature for the preparation of graphene/TiO 2 nanocomposites. For example, one- step hydrothermal method was employed to prepare graphene/ TiO 2 nanocomposites for efficient photocatalytic applications [23– 26]. Zhou et al. [27] prepared graphene/TiO 2 composite by a one- pot solvothermal reaction and demonstrated the excellent photo- catalytic activity for the degradation of methylene blue. Zhang et al. [28] synthesized graphene/TiO 2 composites via a * Corresponding author. Fax: +82 32 872 4046. ** Corresponding author. Fax: +82 2 2268 8550. E-mail addresses: [email protected], [email protected] (Y.S. Huh), [email protected] (Y.-K. Han). http://dx.doi.org/10.1016/j.synthmet.2014.09.034 0379-6779/ ã 2014 Elsevier B.V. All rights reserved. Synthetic Metals 198 (2014) 10–18 Contents lists available at ScienceDirect Synthetic Metals journal homepage: www.else vie r.com/locat e/synme t

Welcome message from author
This document is posted to help you gain knowledge. Please leave a comment to let me know what you think about it! Share it to your friends and learn new things together.
Transcript
Synthetic Metals 198 (2014) 10–18
Fabrication of nano TiO2@graphene composite: Reusable photocatalystfor hydrogen production, degradation of organic and inorganicpollutants
Yuvaraj Haldorai a, Arunkumar Rengaraj b, Cheol Hwan Kwak b, Yun Suk Huh b,*,Young-Kyu Han a,**aDepartment of Energy and Materials Engineering, Dongguk University – Seoul, Seoul, Republic of KoreabDepartment of Biological Engineering, Biohybrid Systems Research Center (BSRC), Inha University, Incheon 402-751, Republic of Korea
A R T I C L E I N F O
Article history:Received 26 August 2014Received in revised form 29 September 2014Accepted 30 September 2014Available online xxx
Keywords:Graphene oxideTitanium dioxideNanocompositePhotocatalystHydrogen productionPhoto reduction
A B S T R A C T
Titanium dioxide (TiO2) nanoparticles decorated reduced graphene oxide (RGO) composites werefabricated via an in-situ sol–gel route. TEM analysis revealed that the TiO2 nanoparticles of a size less than8 nm were coated onto the RGO surface. The TiO2 nanoparticles on the RGO surface were spherical andwell dispersed. The nanocomposite exhibited enhanced photocatalytic activity for hydrogen (H2)production with a rate of 203 mmol/h, which was higher than that of TiO2 (35 mmol/h) and P25 (51 mmol/h). This is because the TiO2 nanoparticles on the RGO sheets can capture light energy and facilitate excitedelectron transfer for H2 production via the RGO, which acts as an efficient electron mediator. Thenanocomposite also showed efficient photocatalytic degradation of methylene blue and photo-reductiveconversion of Cr(VI) with a rate of 2.2 and 1.7 times higher than that of P25, respectively. Thesedegradation results indicated that the photocatalytic performance of the nanocomposite was greatlyenhanced by the improved adsorption performance and separation efficiency of the photo-generatedcarriers. The nanocomposite maintained a higher level of activity even after four recycles.
ã 2014 Elsevier B.V. All rights reserved.
Contents lists available at ScienceDirect
Synthetic Metals
journal homepage: www.else vie r .com/ locat e/synme t
1. Introduction
In recent years, a significant number of studies have involvedthe search for clean energy sources [1,2]. There is an evident needfor an alternative energy source that can at least partially andprogressively replace fossil fuels in the near future. Though it is notdevoid of complications, hydrogen (H2) is beginning to be seen asthe most viable and advantageous option of the various cleanenergy sources available as an energy vector. Due to its loweconomic cost, there has been growing interest in the productionof H2 from water by photocatalysis (photo-splitting) through theuse of semiconductors.
Among the diversity of semiconductors, titanium dioxide (TiO2)has been intensively investigated as a photocatalyst for theproduction of H2 because of its outstanding properties, includingchemical stability, non-toxicity, and abundant in resources [3].
* Corresponding author. Fax: +82 32 872 4046.** Corresponding author. Fax: +82 2 2268 8550.
E-mail addresses: [email protected], [email protected](Y.S. Huh), [email protected] (Y.-K. Han).
http://dx.doi.org/10.1016/j.synthmet.2014.09.0340379-6779/ã 2014 Elsevier B.V. All rights reserved.
However, the photocatalytic performance of TiO2 is significantlyreduced due to its wide band gap (3.2 eV) and a rapid recombina-tion of conduction band electrons and valence band holes [4,5]. Toovercome the above drawbacks, various doping approachesincluding metals or nonmetals [6–10], semiconductors [11–13],and carbon materials [14–16] have been reported. Particularly,TiO2/graphene composites have attracted an increasing interestdue to their potential applications in energy and environmentalresearch areas [17–22]. This is because graphene can act as anexcellent electron-acceptor/transport material to effectively facil-itate the migration of photo-induced electrons and suppress thecharge recombination in electron-transfer processes due to theelectronic interaction between TiO2 and graphene, which enhancesthe photocatalytic performance of TiO2.
Several approaches have been reported in the literature for thepreparation of graphene/TiO2 nanocomposites. For example, one-step hydrothermal method was employed to prepare graphene/TiO2 nanocomposites for efficient photocatalytic applications [23–26]. Zhou et al. [27] prepared graphene/TiO2 composite by a one-pot solvothermal reaction and demonstrated the excellent photo-catalytic activity for the degradation of methylene blue. Zhanget al. [28] synthesized graphene/TiO2 composites via a
Y. Haldorai et al. / Synthetic Metals 198 (2014) 10–18 11
sol–gel technique for photocatalytic H2 evolution. Xiang et al. [16]prepared graphene/TiO2 nanocomposite by a microwave-assistedhydrothermal method for H2 production. Other synthetic techni-ques such as UV-assisted photo-reduction and chemical reductionwere also employed to prepare graphene/TiO2 composites forphotocatalytic H2 production [29]. Recently, Gao and Sun [30]reported efficient H2 production activity of sulfonated grapheneoxide/TiO2 composites synthesized via mixing of sulfonatedgraphene and TiO2 under ultrasonication.
We have noted that most of the recently reported composites[23–34] were prepared either by surfactant-assisted growth or byphysical mixing of pre-synthesized TiO2 particles with graphene orwith graphene oxide (GO) followed by the reduction of GO to RGO.Reports of in-situ nucleation growth of TiO2 particles onto the RGOsurface were scarce in the literature [30]. In the present work, TiO2/RGO nanocomposites were prepared by in-situ assembly of TiO2
nanoparticles onto the GO nanosheets, followed by thermalreduction. The GO was used as the starting material because thefunctional groups present in GO allow for intercalation ofmolecules in the interlayer space of GO. These functional groupscould further behave as nucleating centers for the growth of TiO2
nanoparticles. The as-synthesized nanocomposite was confirmedto be a highly efficient photocatalyst for H2 production. Thephotocatalytic reduction of Cr(VI) and photocatalytic degradationof MB dye were also studied.
2. Experimental
2.1. Materials
Graphite, sodium nitrate (NaNO3), potassium permanganate(KMnO4), hydrogen peroxide (H2O2), Titanium(IV) isobutoxide, MBdye, Titanium(IV) oxide (Degussa P25), sodium sulfide (Na2S),sodium sulfite (Na2SO3), and potassium dichromate (K2Cr2O7)were purchased from Aldrich and were used as received. All otherorganic reagents were of analytical grade and were used asreceived.
2.2. Synthesis of GO
GO was prepared from natural graphite using a modifiedversion of the Hummer’s method [35]. In a typical experiment,graphite (1.5 g), NaNO3 (1.5 g), and H2SO4 (70 mL) were mixed andstirred in an ice bath, after which 9 g of KMnO4 was slowly added.The reaction mixture was maintained at 40 �C and stirred for 1 h.Water (100 mL) was then added and the temperature wasincreased to 90 �C and maintained for 30 min. Finally, 300 mL ofwater was slowly added, followed by the slow addition of 10 mL of30% H2O2. The reaction mixture was then filtered and washed with0.1 M HCl and water. The GO precipitate was dispersed in a water/methanol (1:5 v/v) mixture, and was purified through triplicatecentrifugation steps at 10 000 rpm for 30 min. The purified samplewas then dispersed in deionized water and centrifuged at2500 rpm to obtain a highly exfoliated GO.
2.3. Synthesis of RGO/TiO2 nanocomposite
In a typical experiment, 0.1 g of GO was ultrasonically dispersedin 250 mL of ethanol for 3 h. The mixture was then transferred to astirring plate, after which 5 mL of titanium butoxide was added andthe mixture was stirred for approximately 30 min. 5 mL ofdeionized water was then added and allowed to mix for another30 min. The entire mixture was then refluxed for 6 h, during whichtime the titanium dioxide (TiO2) precursors were deposited ontothe surface of the GO. After cooling, the products were filtered,washed and annealed under nitrogen protection at 400 �C for 4 h to
produce the RGO/TiO2 nanocomposite. The weight ratio of RGO toTiO2 in composite was found to be 1:19 (i.e., 5 wt% of RGO in thecomposite).
2.4. Photocatalytic H2 production
The photocatalytic H2 production experiment was performed ina 200 mL double walled quartz flask with a water inlet and outlet tomaintain the temperature of the photoreactor. The photocatalyticreaction was carried out at room temperature and atmosphericpressure. In a typical experiment, 100 mg of sample was dispersedin 100 mL of an aqueous solution containing Na2S (0.1 mol/L) andNa2SO3 (0.05 mol/L) as the sacrificial reagents. The solutioncontaining the photocatalyst was sonicated for 30 min, degassedfor 30 min, and irradiated with UV-light (365 nm, 3 W) whilestirring, in order to ensure a uniform exposure of the suspensionthroughout the process. The experiment was performed under anN2 atmosphere in order to avoid the photo-corrosion of TiO2. Theamount of H2 produced was analyzed by gas chromatography(Agilent Technologies: 6890N) using a thermal conductivitydetector (TCD), molecular sieve 5A, and N2 carrier gas.
2.5. Photocatalytic degradation of MB dye
The photocatalytic activity of the as-synthesized RGO/TiO2
nanocomposite was tested for the degradation of MB under UV-light irradiation at a wavelength of 365 nm. The photocatalyticactivity of the nanocomposite was measured by observing thephotodecomposition of MB with a concentration of 10 mg/L. Forphotodecomposition, 10 mg of nanocomposite was suspended in50 mL of MB dye solution. Prior to irradiation, the suspension wasmagnetically stirred in the dark for 60 min in order to establish theadsorption/desorption equilibrium of the dye. A 10 mL sample waswithdrawn for every 10 min. Prior to analysis, the suspension wascentrifuged to remove any suspended solid catalyst particles. Theresidual concentration of the dye was measured using a UV–visspectrophotometer.
2.6. Photocatalytic reduction of Cr(VI)
The photocatalytic activity of the nanocomposite was evaluatedby measuring the photocatalytic reduction of Cr(VI) under theillumination of UV. In the photocatalytic reduction experiment, acylindrical pyrex flask (100 mL) was used as the photoreactorvessel. UV lamp with 365 nm irradiation was employed as the lightsource. The nanocomposite (10 mg) was suspended in 50 mL of10 mg/L Cr(VI) solution and magnetically stirred for 60 min in darkto keep the reactive system uniform and to ensure the adsorption/desorption equilibrium. Then, the mixed suspension was exposedto UV-irradiation. The solution was sampled in 15 min intervals.The photoreduction efficiency was monitored by measuring theabsorbance of the solution samples with a UV–vis spectropho-tometer at room temperature.
2.7. Characterization
Raman spectroscopy was performed on a HR800 UV Ramanmicroscope (Horiba Jobin–Yvon, France) XRD (RIGAKU, DMAX2500) was performed using Cu Ka radiation. Ultraviolet visiblereflectance spectroscopy (Thermo Spectronic, Genesys 10UV) wasperformed at a wavelength range, of 200–800 nm. TEM (JEOL, JEM-2010F) was performed at an accelerating voltage of 200 kV andequipped with an energy-dispersive X-ray spectrometer (EDX).Samples for TEM observation were prepared by depositing anethanolic dispersion on a 200 mesh copper grid followed by air-dying. The selected-area electron diffraction (SAED) image was
12 Y. Haldorai et al. / Synthetic Metals 198 (2014) 10–18
recorded by high resolution TEM (HRTEM). XPS (Thermo Scientific,K-Alpha) was performed using an Al X-ray source. Peak deconvo-lution of the XPS data was performed using Gaussian componentsafter a Shirley background subtraction.
3. Results and discussion
The addition of RGO toTiO2 is an effective method for improvingthe photocatalytic performance of TiO2. Despite tremendousefforts, developing facile methods for synthesis of RGO/TiO2
nanocomposites still remains a great challenge. This studypresents an in-situ sol–gel route for the fabrication of RGO/TiO2
composite, based on the initial formation of strong-couplingbetween GO–TiO2 and the subsequent thermal reduction of GO toRGO. The functional groups present in the GO are considered toprovide active sites for the growth of TiO2 nanoparticles.
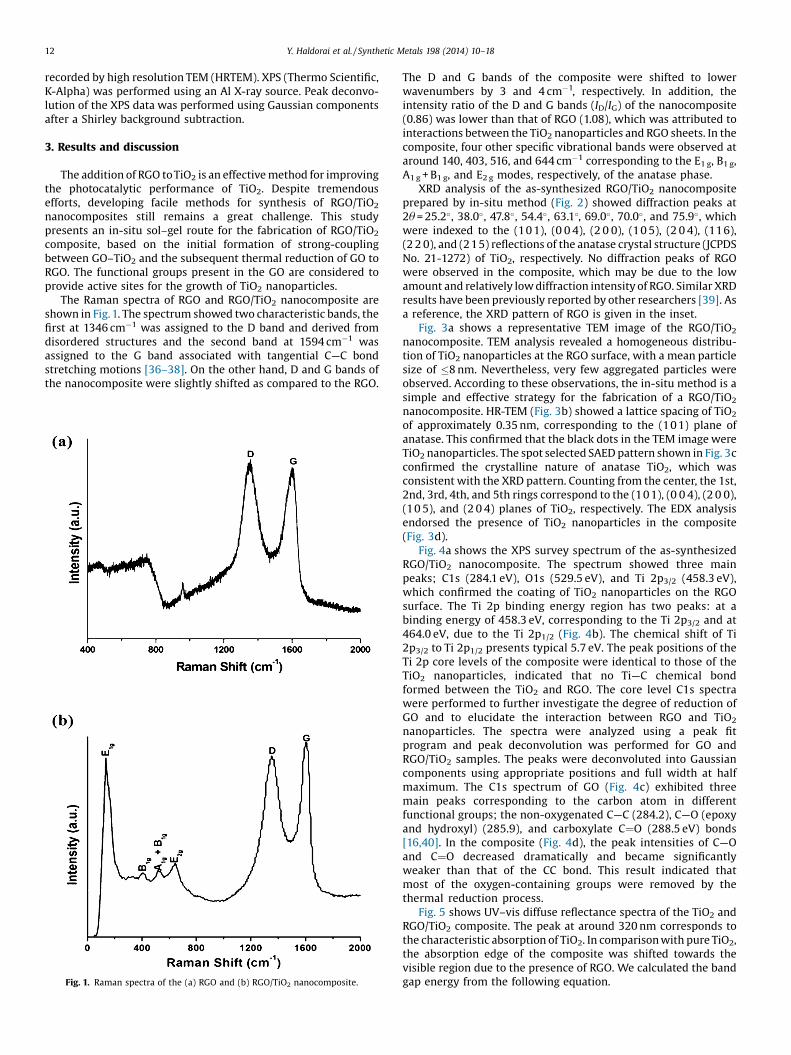
The Raman spectra of RGO and RGO/TiO2 nanocomposite areshown in Fig.1. The spectrum showed two characteristic bands, thefirst at 1346 cm�1 was assigned to the D band and derived fromdisordered structures and the second band at 1594 cm�1 wasassigned to the G band associated with tangential C—C bondstretching motions [36–38]. On the other hand, D and G bands ofthe nanocomposite were slightly shifted as compared to the RGO.
Fig. 1. Raman spectra of the (a) RGO and (b) RGO/TiO2 nanocomposite.
The D and G bands of the composite were shifted to lowerwavenumbers by 3 and 4 cm�1, respectively. In addition, theintensity ratio of the D and G bands (ID/IG) of the nanocomposite(0.86) was lower than that of RGO (1.08), which was attributed tointeractions between the TiO2 nanoparticles and RGO sheets. In thecomposite, four other specific vibrational bands were observed ataround 140, 403, 516, and 644 cm�1 corresponding to the E1 g, B1 g,A1 g + B1 g, and E2 g modes, respectively, of the anatase phase.
XRD analysis of the as-synthesized RGO/TiO2 nanocompositeprepared by in-situ method (Fig. 2) showed diffraction peaks at2u = 25.2�, 38.0�, 47.8�, 54.4�, 63.1�, 69.0�, 70.0�, and 75.9�, whichwere indexed to the (10 1), (0 0 4), (2 0 0), (10 5), (2 0 4), (116),(2 2 0), and (215) reflections of the anatase crystal structure (JCPDSNo. 21-1272) of TiO2, respectively. No diffraction peaks of RGOwere observed in the composite, which may be due to the lowamount and relatively low diffraction intensity of RGO. Similar XRDresults have been previously reported by other researchers [39]. Asa reference, the XRD pattern of RGO is given in the inset.
Fig. 3a shows a representative TEM image of the RGO/TiO2
nanocomposite. TEM analysis revealed a homogeneous distribu-tion of TiO2 nanoparticles at the RGO surface, with a mean particlesize of �8 nm. Nevertheless, very few aggregated particles wereobserved. According to these observations, the in-situ method is asimple and effective strategy for the fabrication of a RGO/TiO2
nanocomposite. HR-TEM (Fig. 3b) showed a lattice spacing of TiO2
of approximately 0.35 nm, corresponding to the (10 1) plane ofanatase. This confirmed that the black dots in the TEM image wereTiO2 nanoparticles. The spot selected SAED pattern shown in Fig. 3cconfirmed the crystalline nature of anatase TiO2, which wasconsistent with the XRD pattern. Counting from the center, the 1st,2nd, 3rd, 4th, and 5th rings correspond to the (10 1), (0 0 4), (2 0 0),(10 5), and (2 0 4) planes of TiO2, respectively. The EDX analysisendorsed the presence of TiO2 nanoparticles in the composite(Fig. 3d).
Fig. 4a shows the XPS survey spectrum of the as-synthesizedRGO/TiO2 nanocomposite. The spectrum showed three mainpeaks; C1s (284.1 eV), O1s (529.5 eV), and Ti 2p3/2 (458.3 eV),which confirmed the coating of TiO2 nanoparticles on the RGOsurface. The Ti 2p binding energy region has two peaks: at abinding energy of 458.3 eV, corresponding to the Ti 2p3/2 and at464.0 eV, due to the Ti 2p1/2 (Fig. 4b). The chemical shift of Ti2p3/2 to Ti 2p1/2 presents typical 5.7 eV. The peak positions of theTi 2p core levels of the composite were identical to those of theTiO2 nanoparticles, indicated that no Ti—C chemical bondformed between the TiO2 and RGO. The core level C1s spectrawere performed to further investigate the degree of reduction ofGO and to elucidate the interaction between RGO and TiO2
nanoparticles. The spectra were analyzed using a peak fitprogram and peak deconvolution was performed for GO andRGO/TiO2 samples. The peaks were deconvoluted into Gaussiancomponents using appropriate positions and full width at halfmaximum. The C1s spectrum of GO (Fig. 4c) exhibited threemain peaks corresponding to the carbon atom in differentfunctional groups; the non-oxygenated C—C (284.2), C—O (epoxyand hydroxyl) (285.9), and carboxylate C¼O (288.5 eV) bonds[16,40]. In the composite (Fig. 4d), the peak intensities of C—Oand C¼O decreased dramatically and became significantlyweaker than that of the CC bond. This result indicated thatmost of the oxygen-containing groups were removed by thethermal reduction process.
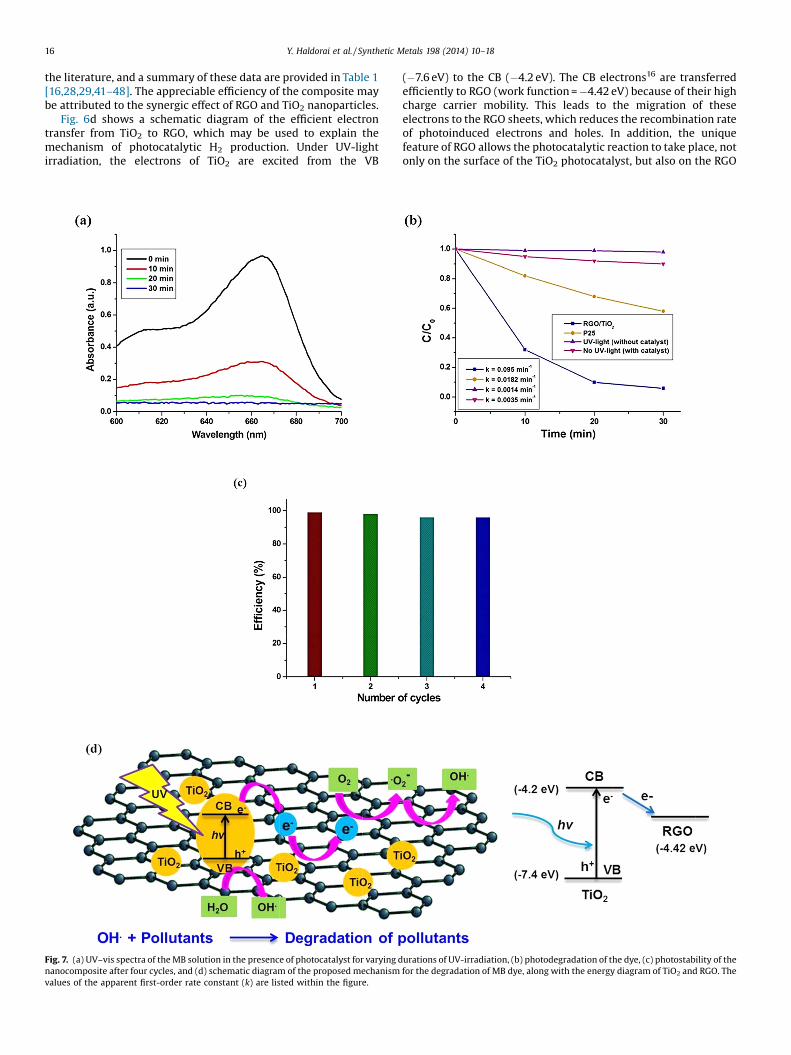
Fig. 5 shows UV–vis diffuse reflectance spectra of the TiO2 andRGO/TiO2 composite. The peak at around 320 nm corresponds tothe characteristic absorption of TiO2. In comparison with pure TiO2,the absorption edge of the composite was shifted towards thevisible region due to the presence of RGO. We calculated the bandgap energy from the following equation.
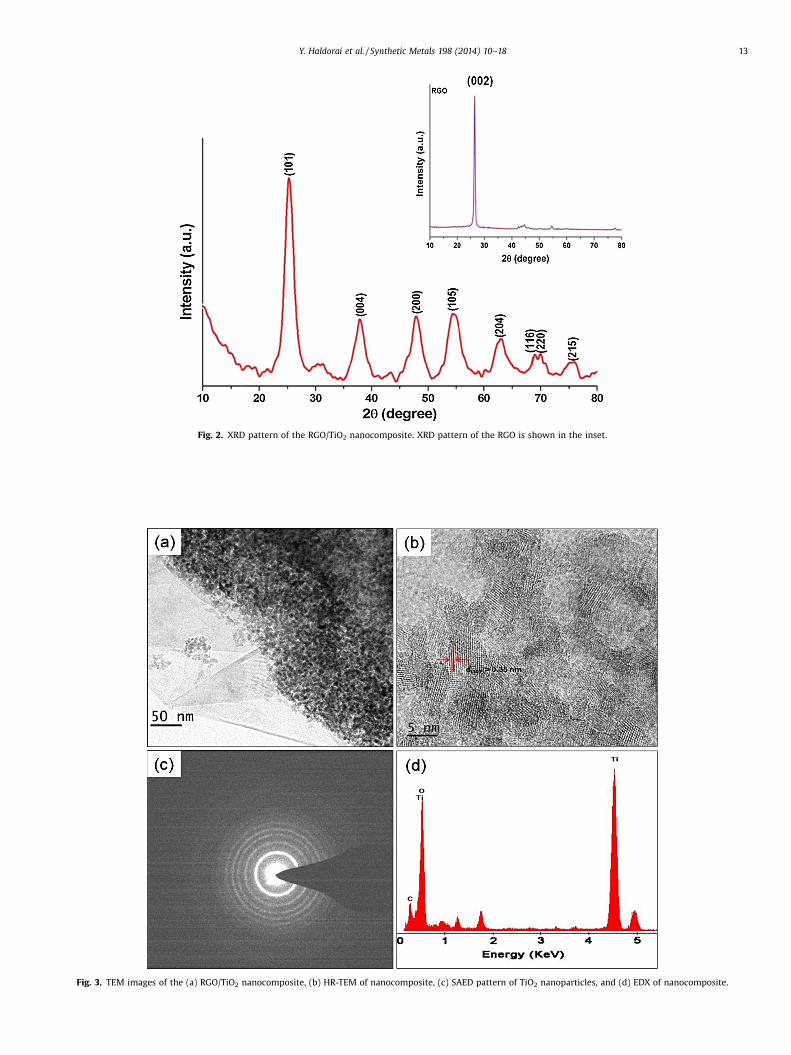
Fig. 2. XRD pattern of the RGO/TiO2 nanocomposite. XRD pattern of the RGO is shown in the inset.
Fig. 3. TEM images of the (a) RGO/TiO2 nanocomposite, (b) HR-TEM of nanocomposite, (c) SAED pattern of TiO2 nanoparticles, and (d) EDX of nanocomposite.
Y. Haldorai et al. / Synthetic Metals 198 (2014) 10–18 13
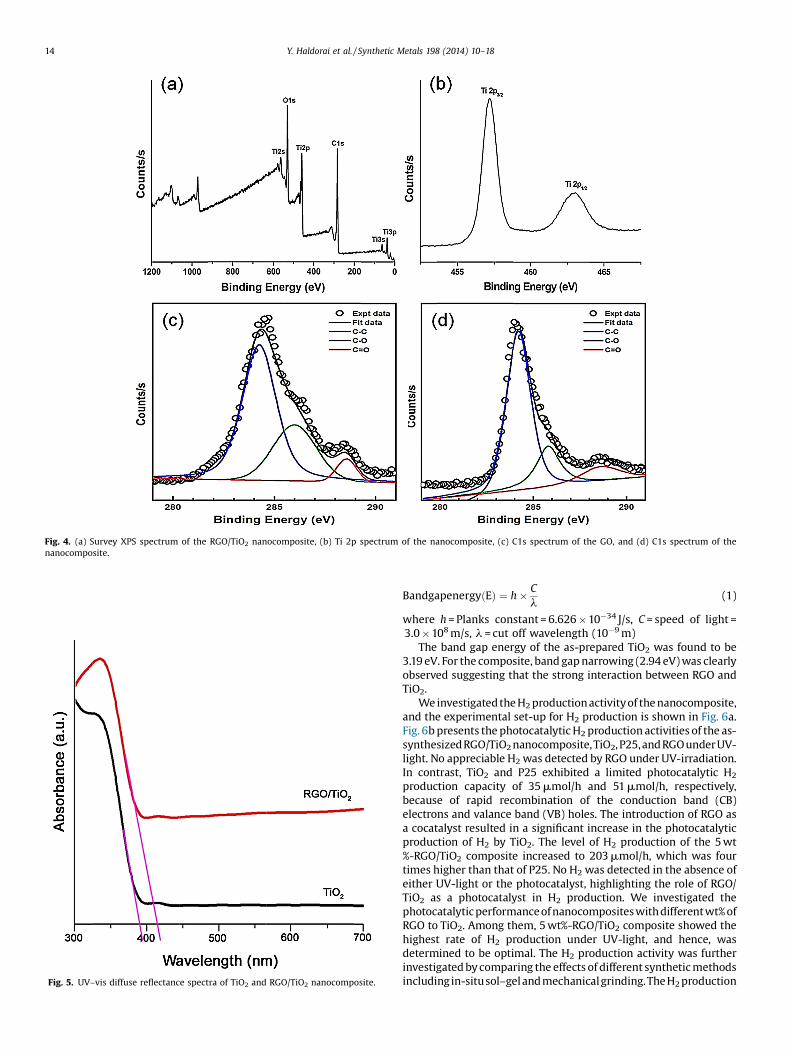
Fig. 4. (a) Survey XPS spectrum of the RGO/TiO2 nanocomposite, (b) Ti 2p spectrum of the nanocomposite, (c) C1s spectrum of the GO, and (d) C1s spectrum of thenanocomposite.
Fig. 5. UV–vis diffuse reflectance spectra of TiO2 and RGO/TiO2 nanocomposite.
14 Y. Haldorai et al. / Synthetic Metals 198 (2014) 10–18
BandgapenergyðEÞ ¼ h � Cl
(1)
where h = Planks constant = 6.626 � 10�34 J/s, C = speed of light =3.0 � 108m/s, l = cut off wavelength (10�9m)
The band gap energy of the as-prepared TiO2 was found to be3.19 eV. For the composite, band gap narrowing (2.94 eV) was clearlyobserved suggesting that the strong interaction between RGO andTiO2.
We investigated the H2production activity of the nanocomposite,and the experimental set-up for H2 production is shown in Fig. 6a.Fig. 6b presents the photocatalytic H2production activities of the as-synthesizedRGO/TiO2nanocomposite,TiO2, P25,and RGOunderUV-light. No appreciable H2was detected by RGO under UV-irradiation.In contrast, TiO2 and P25 exhibited a limited photocatalytic H2
production capacity of 35 mmol/h and 51 mmol/h, respectively,because of rapid recombination of the conduction band (CB)electrons and valance band (VB) holes. The introduction of RGO asa cocatalyst resulted in a significant increase in the photocatalyticproduction of H2 by TiO2. The level of H2 production of the 5 wt%-RGO/TiO2 composite increased to 203 mmol/h, which was fourtimes higher than that of P25. No H2 was detected in the absence ofeither UV-light or the photocatalyst, highlighting the role of RGO/TiO2 as a photocatalyst in H2 production. We investigated thephotocatalyticperformanceofnanocompositeswithdifferentwt% ofRGO to TiO2. Among them, 5 wt%-RGO/TiO2 composite showed thehighest rate of H2 production under UV-light, and hence, wasdetermined to be optimal. The H2 production activity was furtherinvestigated by comparing the effects of different synthetic methodsincludingin-situsol–gelandmechanicalgrinding.TheH2production
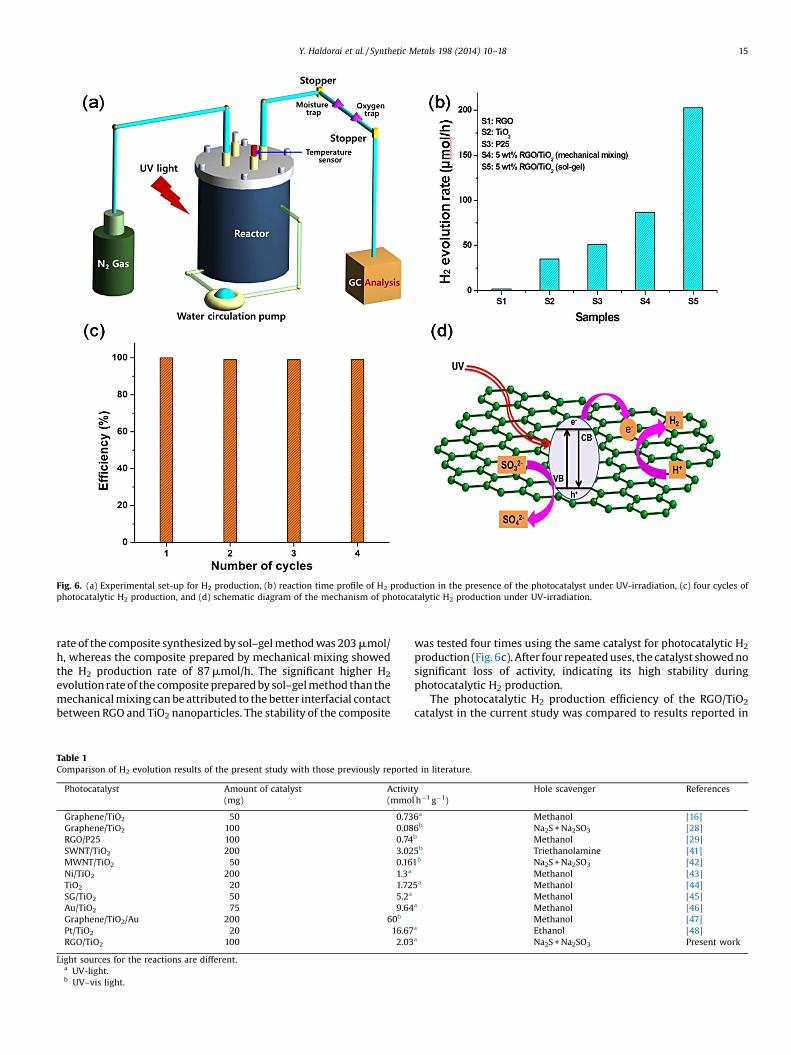
Fig. 6. (a) Experimental set-up for H2 production, (b) reaction time profile of H2 production in the presence of the photocatalyst under UV-irradiation, (c) four cycles ofphotocatalytic H2 production, and (d) schematic diagram of the mechanism of photocatalytic H2 production under UV-irradiation.
Y. Haldorai et al. / Synthetic Metals 198 (2014) 10–18 15
rate of the composite synthesized by sol–gel method was 203 mmol/h, whereas the composite prepared by mechanical mixing showedthe H2 production rate of 87 mmol/h. The significant higher H2
evolution rate of the composite prepared by sol–gel method than themechanical mixing can be attributed to the better interfacial contactbetween RGO and TiO2 nanoparticles. The stability of the composite
Table 1Comparison of H2 evolution results of the present study with those previously reporte
Photocatalyst Amount of catalyst(mg)
Activit(mmo
Graphene/TiO2 50 0.73Graphene/TiO2 100 0.08RGO/P25 100 0.74SWNT/TiO2 200 3.02MWNT/TiO2 50 0.16Ni/TiO2 200 1.3a
TiO2 20 1.72SG/TiO2 50 5.2a
Au/TiO2 75 9.64Graphene/TiO2/Au 200 60b
Pt/TiO2 20 16.67RGO/TiO2 100 2.03
Light sources for the reactions are different.a UV-light.b UV–vis light.
was tested four times using the same catalyst for photocatalytic H2
production (Fig. 6c). After four repeated uses, the catalyst showed nosignificant loss of activity, indicating its high stability duringphotocatalytic H2 production.
The photocatalytic H2 production efficiency of the RGO/TiO2
catalyst in the current study was compared to results reported in
d in literature.
yl h�1 g�1)
Hole scavenger References
6a Methanol [16]6b Na2S + Na2SO3 [28]b Methanol [29]5b Triethanolamine [41]1b Na2S + Na2SO3 [42]
Methanol [43]5a Methanol [44]
Methanol [45]a Methanol [46]
Methanol [47]a Ethanol [48]a Na2S + Na2SO3 Present work
16 Y. Haldorai et al. / Synthetic Metals 198 (2014) 10–18
the literature, and a summary of these data are provided in Table 1[16,28,29,41–48]. The appreciable efficiency of the composite maybe attributed to the synergic effect of RGO and TiO2 nanoparticles.
Fig. 6d shows a schematic diagram of the efficient electrontransfer from TiO2 to RGO, which may be used to explain themechanism of photocatalytic H2 production. Under UV-lightirradiation, the electrons of TiO2 are excited from the VB
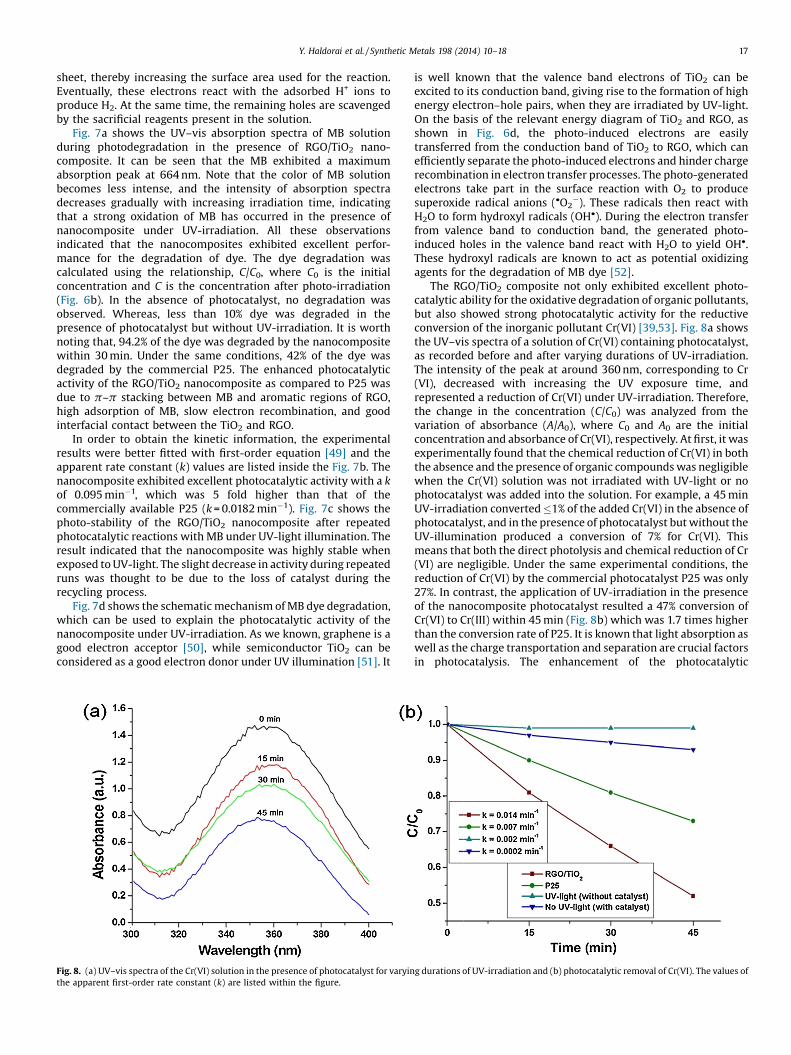
Fig. 7. (a) UV–vis spectra of the MB solution in the presence of photocatalyst for varying dnanocomposite after four cycles, and (d) schematic diagram of the proposed mechanismvalues of the apparent first-order rate constant (k) are listed within the figure.
(�7.6 eV) to the CB (�4.2 eV). The CB electrons16 are transferredefficiently to RGO (work function = �4.42 eV) because of their highcharge carrier mobility. This leads to the migration of theseelectrons to the RGO sheets, which reduces the recombination rateof photoinduced electrons and holes. In addition, the uniquefeature of RGO allows the photocatalytic reaction to take place, notonly on the surface of the TiO2 photocatalyst, but also on the RGO
urations of UV-irradiation, (b) photodegradation of the dye, (c) photostability of the for the degradation of MB dye, along with the energy diagram of TiO2 and RGO. The
Y. Haldorai et al. / Synthetic Metals 198 (2014) 10–18 17
sheet, thereby increasing the surface area used for the reaction.Eventually, these electrons react with the adsorbed H+ ions toproduce H2. At the same time, the remaining holes are scavengedby the sacrificial reagents present in the solution.
Fig. 7a shows the UV–vis absorption spectra of MB solutionduring photodegradation in the presence of RGO/TiO2 nano-composite. It can be seen that the MB exhibited a maximumabsorption peak at 664 nm. Note that the color of MB solutionbecomes less intense, and the intensity of absorption spectradecreases gradually with increasing irradiation time, indicatingthat a strong oxidation of MB has occurred in the presence ofnanocomposite under UV-irradiation. All these observationsindicated that the nanocomposites exhibited excellent perfor-mance for the degradation of dye. The dye degradation wascalculated using the relationship, C/C0, where C0 is the initialconcentration and C is the concentration after photo-irradiation(Fig. 6b). In the absence of photocatalyst, no degradation wasobserved. Whereas, less than 10% dye was degraded in thepresence of photocatalyst but without UV-irradiation. It is worthnoting that, 94.2% of the dye was degraded by the nanocompositewithin 30 min. Under the same conditions, 42% of the dye wasdegraded by the commercial P25. The enhanced photocatalyticactivity of the RGO/TiO2 nanocomposite as compared to P25 wasdue to p–p stacking between MB and aromatic regions of RGO,high adsorption of MB, slow electron recombination, and goodinterfacial contact between the TiO2 and RGO.
In order to obtain the kinetic information, the experimentalresults were better fitted with first-order equation [49] and theapparent rate constant (k) values are listed inside the Fig. 7b. Thenanocomposite exhibited excellent photocatalytic activity with a kof 0.095 min�1, which was 5 fold higher than that of thecommercially available P25 (k = 0.0182 min�1). Fig. 7c shows thephoto-stability of the RGO/TiO2 nanocomposite after repeatedphotocatalytic reactions with MB under UV-light illumination. Theresult indicated that the nanocomposite was highly stable whenexposed to UV-light. The slight decrease in activity during repeatedruns was thought to be due to the loss of catalyst during therecycling process.
Fig. 7d shows the schematic mechanism of MB dye degradation,which can be used to explain the photocatalytic activity of thenanocomposite under UV-irradiation. As we known, graphene is agood electron acceptor [50], while semiconductor TiO2 can beconsidered as a good electron donor under UV illumination [51]. It
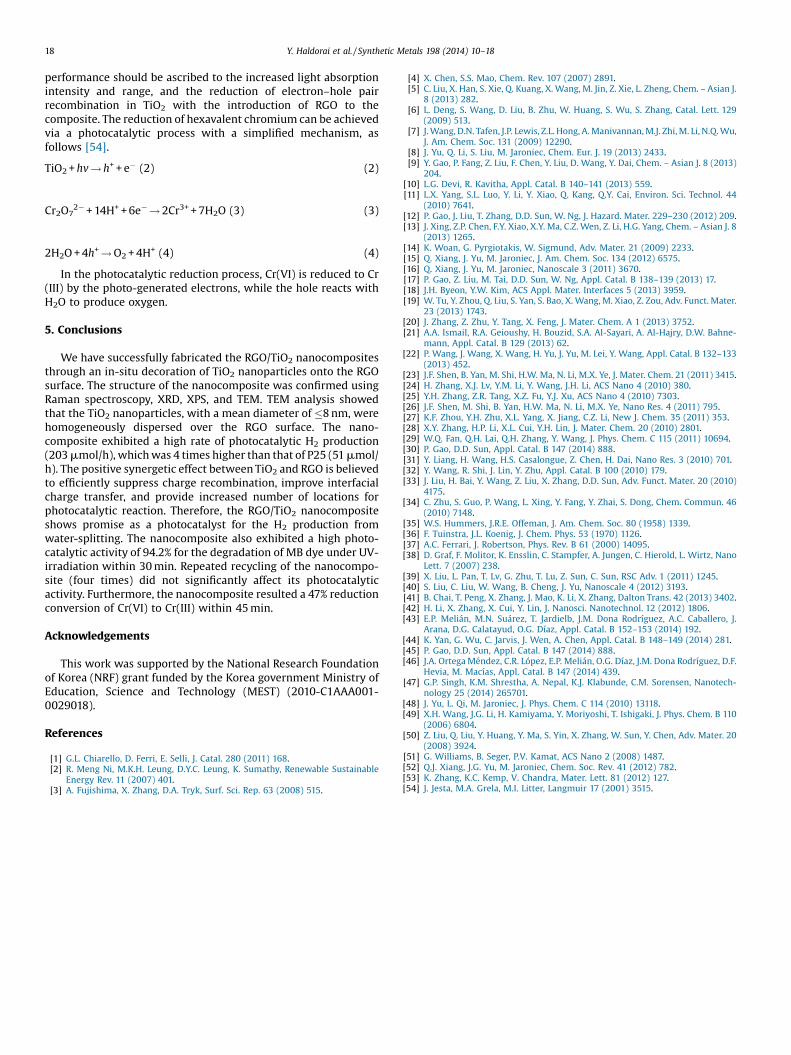
Fig. 8. (a) UV–vis spectra of the Cr(VI) solution in the presence of photocatalyst for varyinthe apparent first-order rate constant (k) are listed within the figure.
is well known that the valence band electrons of TiO2 can beexcited to its conduction band, giving rise to the formation of highenergy electron–hole pairs, when they are irradiated by UV-light.On the basis of the relevant energy diagram of TiO2 and RGO, asshown in Fig. 6d, the photo-induced electrons are easilytransferred from the conduction band of TiO2 to RGO, which canefficiently separate the photo-induced electrons and hinder chargerecombination in electron transfer processes. The photo-generatedelectrons take part in the surface reaction with O2 to producesuperoxide radical anions (�O2
�). These radicals then react withH2O to form hydroxyl radicals (OH�). During the electron transferfrom valence band to conduction band, the generated photo-induced holes in the valence band react with H2O to yield OH�.These hydroxyl radicals are known to act as potential oxidizingagents for the degradation of MB dye [52].
The RGO/TiO2 composite not only exhibited excellent photo-catalytic ability for the oxidative degradation of organic pollutants,but also showed strong photocatalytic activity for the reductiveconversion of the inorganic pollutant Cr(VI) [39,53]. Fig. 8a showsthe UV–vis spectra of a solution of Cr(VI) containing photocatalyst,as recorded before and after varying durations of UV-irradiation.The intensity of the peak at around 360 nm, corresponding to Cr(VI), decreased with increasing the UV exposure time, andrepresented a reduction of Cr(VI) under UV-irradiation. Therefore,the change in the concentration (C/C0) was analyzed from thevariation of absorbance (A/A0), where C0 and A0 are the initialconcentration and absorbance of Cr(VI), respectively. At first, it wasexperimentally found that the chemical reduction of Cr(VI) in boththe absence and the presence of organic compounds was negligiblewhen the Cr(VI) solution was not irradiated with UV-light or nophotocatalyst was added into the solution. For example, a 45 minUV-irradiation converted �1% of the added Cr(VI) in the absence ofphotocatalyst, and in the presence of photocatalyst but without theUV-illumination produced a conversion of 7% for Cr(VI). Thismeans that both the direct photolysis and chemical reduction of Cr(VI) are negligible. Under the same experimental conditions, thereduction of Cr(VI) by the commercial photocatalyst P25 was only27%. In contrast, the application of UV-irradiation in the presenceof the nanocomposite photocatalyst resulted a 47% conversion ofCr(VI) to Cr(III) within 45 min (Fig. 8b) which was 1.7 times higherthan the conversion rate of P25. It is known that light absorption aswell as the charge transportation and separation are crucial factorsin photocatalysis. The enhancement of the photocatalytic
g durations of UV-irradiation and (b) photocatalytic removal of Cr(VI). The values of
18 Y. Haldorai et al. / Synthetic Metals 198 (2014) 10–18
performance should be ascribed to the increased light absorptionintensity and range, and the reduction of electron–hole pairrecombination in TiO2 with the introduction of RGO to thecomposite. The reduction of hexavalent chromium can be achievedvia a photocatalytic process with a simplified mechanism, asfollows [54].
TiO2 + hv ! h+ + e� (2) (2)
Cr2O72� + 14H+ + 6e�! 2Cr3+ + 7H2O (3) (3)
2H2O + 4h+! O2+ 4H+ (4) (4)
In the photocatalytic reduction process, Cr(VI) is reduced to Cr(III) by the photo-generated electrons, while the hole reacts withH2O to produce oxygen.
5. Conclusions
We have successfully fabricated the RGO/TiO2 nanocompositesthrough an in-situ decoration of TiO2 nanoparticles onto the RGOsurface. The structure of the nanocomposite was confirmed usingRaman spectroscopy, XRD, XPS, and TEM. TEM analysis showedthat the TiO2 nanoparticles, with a mean diameter of �8 nm, werehomogeneously dispersed over the RGO surface. The nano-composite exhibited a high rate of photocatalytic H2 production(203 mmol/h), which was 4 times higher than that of P25 (51 mmol/h). The positive synergetic effect between TiO2 and RGO is believedto efficiently suppress charge recombination, improve interfacialcharge transfer, and provide increased number of locations forphotocatalytic reaction. Therefore, the RGO/TiO2 nanocompositeshows promise as a photocatalyst for the H2 production fromwater-splitting. The nanocomposite also exhibited a high photo-catalytic activity of 94.2% for the degradation of MB dye under UV-irradiation within 30 min. Repeated recycling of the nanocompo-site (four times) did not significantly affect its photocatalyticactivity. Furthermore, the nanocomposite resulted a 47% reductionconversion of Cr(VI) to Cr(III) within 45 min.
Acknowledgements
This work was supported by the National Research Foundationof Korea (NRF) grant funded by the Korea government Ministry ofEducation, Science and Technology (MEST) (2010-C1AAA001-0029018).
References
[1] G.L. Chiarello, D. Ferri, E. Selli, J. Catal. 280 (2011) 168.[2] R. Meng Ni, M.K.H. Leung, D.Y.C. Leung, K. Sumathy, Renewable Sustainable
Energy Rev. 11 (2007) 401.[3] A. Fujishima, X. Zhang, D.A. Tryk, Surf. Sci. Rep. 63 (2008) 515.
[4] X. Chen, S.S. Mao, Chem. Rev. 107 (2007) 2891.[5] C. Liu, X. Han, S. Xie, Q. Kuang, X. Wang, M. Jin, Z. Xie, L. Zheng, Chem. – Asian J.
8 (2013) 282.[6] L. Deng, S. Wang, D. Liu, B. Zhu, W. Huang, S. Wu, S. Zhang, Catal. Lett. 129
(2009) 513.[7] J. Wang, D.N. Tafen, J.P. Lewis, Z.L. Hong, A. Manivannan, M.J. Zhi, M. Li, N.Q. Wu,
J. Am. Chem. Soc. 131 (2009) 12290.[8] J. Yu, Q. Li, S. Liu, M. Jaroniec, Chem. Eur. J. 19 (2013) 2433.[9] Y. Gao, P. Fang, Z. Liu, F. Chen, Y. Liu, D. Wang, Y. Dai, Chem. – Asian J. 8 (2013)
204.[10] L.G. Devi, R. Kavitha, Appl. Catal. B 140–141 (2013) 559.[11] L.X. Yang, S.L. Luo, Y. Li, Y. Xiao, Q. Kang, Q.Y. Cai, Environ. Sci. Technol. 44
(2010) 7641.[12] P. Gao, J. Liu, T. Zhang, D.D. Sun, W. Ng, J. Hazard. Mater. 229–230 (2012) 209.[13] J. Xing, Z.P. Chen, F.Y. Xiao, X.Y. Ma, C.Z. Wen, Z. Li, H.G. Yang, Chem. – Asian J. 8
(2013) 1265.[14] K. Woan, G. Pyrgiotakis, W. Sigmund, Adv. Mater. 21 (2009) 2233.[15] Q. Xiang, J. Yu, M. Jaroniec, J. Am. Chem. Soc. 134 (2012) 6575.[16] Q. Xiang, J. Yu, M. Jaroniec, Nanoscale 3 (2011) 3670.[17] P. Gao, Z. Liu, M. Tai, D.D. Sun, W. Ng, Appl. Catal. B 138–139 (2013) 17.[18] J.H. Byeon, Y.W. Kim, ACS Appl. Mater. Interfaces 5 (2013) 3959.[19] W. Tu, Y. Zhou, Q. Liu, S. Yan, S. Bao, X. Wang, M. Xiao, Z. Zou, Adv. Funct. Mater.
23 (2013) 1743.[20] J. Zhang, Z. Zhu, Y. Tang, X. Feng, J. Mater. Chem. A 1 (2013) 3752.[21] A.A. Ismail, R.A. Geioushy, H. Bouzid, S.A. Al-Sayari, A. Al-Hajry, D.W. Bahne-
mann, Appl. Catal. B 129 (2013) 62.[22] P. Wang, J. Wang, X. Wang, H. Yu, J. Yu, M. Lei, Y. Wang, Appl. Catal. B 132–133
(2013) 452.[23] J.F. Shen, B. Yan, M. Shi, H.W. Ma, N. Li, M.X. Ye, J. Mater. Chem. 21 (2011) 3415.[24] H. Zhang, X.J. Lv, Y.M. Li, Y. Wang, J.H. Li, ACS Nano 4 (2010) 380.[25] Y.H. Zhang, Z.R. Tang, X.Z. Fu, Y.J. Xu, ACS Nano 4 (2010) 7303.[26] J.F. Shen, M. Shi, B. Yan, H.W. Ma, N. Li, M.X. Ye, Nano Res. 4 (2011) 795.[27] K.F. Zhou, Y.H. Zhu, X.L. Yang, X. Jiang, C.Z. Li, New J. Chem. 35 (2011) 353.[28] X.Y. Zhang, H.P. Li, X.L. Cui, Y.H. Lin, J. Mater. Chem. 20 (2010) 2801.[29] W.Q. Fan, Q.H. Lai, Q.H. Zhang, Y. Wang, J. Phys. Chem. C 115 (2011) 10694.[30] P. Gao, D.D. Sun, Appl. Catal. B 147 (2014) 888.[31] Y. Liang, H. Wang, H.S. Casalongue, Z. Chen, H. Dai, Nano Res. 3 (2010) 701.[32] Y. Wang, R. Shi, J. Lin, Y. Zhu, Appl. Catal. B 100 (2010) 179.[33] J. Liu, H. Bai, Y. Wang, Z. Liu, X. Zhang, D.D. Sun, Adv. Funct. Mater. 20 (2010)
4175.[34] C. Zhu, S. Guo, P. Wang, L. Xing, Y. Fang, Y. Zhai, S. Dong, Chem. Commun. 46
(2010) 7148.[35] W.S. Hummers, J.R.E. Offeman, J. Am. Chem. Soc. 80 (1958) 1339.[36] F. Tuinstra, J.L. Koenig, J. Chem. Phys. 53 (1970) 1126.[37] A.C. Ferrari, J. Robertson, Phys. Rev. B 61 (2000) 14095.[38] D. Graf, F. Molitor, K. Ensslin, C. Stampfer, A. Jungen, C. Hierold, L. Wirtz, Nano
Lett. 7 (2007) 238.[39] X. Liu, L. Pan, T. Lv, G. Zhu, T. Lu, Z. Sun, C. Sun, RSC Adv. 1 (2011) 1245.[40] S. Liu, C. Liu, W. Wang, B. Cheng, J. Yu, Nanoscale 4 (2012) 3193.[41] B. Chai, T. Peng, X. Zhang, J. Mao, K. Li, X. Zhang, Dalton Trans. 42 (2013) 3402.[42] H. Li, X. Zhang, X. Cui, Y. Lin, J. Nanosci. Nanotechnol. 12 (2012) 1806.[43] E.P. Melián, M.N. Suárez, T. Jardielb, J.M. Dona Rodríguez, A.C. Caballero, J.
Arana, D.G. Calatayud, O.G. Díaz, Appl. Catal. B 152–153 (2014) 192.[44] K. Yan, G. Wu, C. Jarvis, J. Wen, A. Chen, Appl. Catal. B 148–149 (2014) 281.[45] P. Gao, D.D. Sun, Appl. Catal. B 147 (2014) 888.[46] J.A. Ortega Méndez, C.R. López, E.P. Melián, O.G. Díaz, J.M. Dona Rodríguez, D.F.
Hevia, M. Macías, Appl. Catal. B 147 (2014) 439.[47] G.P. Singh, K.M. Shrestha, A. Nepal, K.J. Klabunde, C.M. Sorensen, Nanotech-
nology 25 (2014) 265701.[48] J. Yu, L. Qi, M. Jaroniec, J. Phys. Chem. C 114 (2010) 13118.[49] X.H. Wang, J.G. Li, H. Kamiyama, Y. Moriyoshi, T. Ishigaki, J. Phys. Chem. B 110
(2006) 6804.[50] Z. Liu, Q. Liu, Y. Huang, Y. Ma, S. Yin, X. Zhang, W. Sun, Y. Chen, Adv. Mater. 20
(2008) 3924.[51] G. Williams, B. Seger, P.V. Kamat, ACS Nano 2 (2008) 1487.[52] Q.J. Xiang, J.G. Yu, M. Jaroniec, Chem. Soc. Rev. 41 (2012) 782.[53] K. Zhang, K.C. Kemp, V. Chandra, Mater. Lett. 81 (2012) 127.[54] J. Jesta, M.A. Grela, M.I. Litter, Langmuir 17 (2001) 3515.
Related Documents