Imperial College Master Fabrication of foam glass with ordered and controlled cells by rapid heating Final Thesis Song, Xiaoguang

Welcome message from author
This document is posted to help you gain knowledge. Please leave a comment to let me know what you think about it! Share it to your friends and learn new things together.
Transcript
Imperial College
Master
Fabrication of foam glass
with ordered and
controlled cells by rapid
heating Final Thesis
Song, Xiaoguang

Abstract
Contents 1. Introduction ..................................................................................................................................... 4
2. Updated Literature Review ............................................................................................................. 5
2.1 Theory of foaming glass in the experiment .................................................................................. 5
2.2 Classification of porous material density ...................................................................................... 6
2.3 Classification of pore structure and size ....................................................................................... 6
2.4 Foaming glass technique ............................................................................................................... 7
2.41 Templating technique .............................................................................................................. 8
2.42 foaming agent technique ......................................................................................................... 8
2.43 Hollow spherical technique ..................................................................................................... 8
2.44 Impregnation of gas ................................................................................................................ 9
2.45 Chemical leaching technique .................................................................................................. 9
3. Experimental Method .................................................................................................................... 10
3.1 Experimental method and procedure .......................................................................................... 10
3.2 Sample preparations .................................................................................................................... 11
3.21 Ball milling ........................................................................................................................... 11
3.22 Sieve shaking ........................................................................................................................ 11
3.23 Making small and large particle powder ............................................................................... 12
3.24 Slip casting ............................................................................................................................ 12
3.25 Moisture control .................................................................................................................... 12
3.26 Sintering ................................................................................................................................ 12
3.27 Grinding ................................................................................................................................ 13
3.3 Characterisation technique .......................................................................................................... 14
3.31 Measuring particle size ......................................................................................................... 14
3.32 Density measurement ............................................................................................................ 14
3.33 Optical microscopy ............................................................................................................... 14
3.34 Scanning electron microscopy .............................................................................................. 14
3.35 Strength test .......................................................................................................................... 14
3.36 Water adsorption measurement ............................................................................................. 14
4. Results and Discussion ................................................................................................................. 15
4.1 Heating time control ................................................................................................................... 15
4.11 Sample bulk densities within different heating time ............................................................. 15
4.12 Pore volume fraction ............................................................................................................. 17
4.13 Water adsorption ................................................................................................................... 18
4.14 Pore distribution of the samples experienced different heating time .................................... 21
4.15 Pore size and wall thickness of the samples .......................................................................... 22
4.16 Pore structures of the samples ............................................................................................... 24
4.17 Strength test .......................................................................................................................... 26
4.18 Selection of heating time ....................................................................................................... 27
4.2 Glass powder particle size control .............................................................................................. 28
4.21 Particle size distribution ........................................................................................................ 28
4.22 Sample bulk densities for different particle size samples ..................................................... 29
4.23 Selection of particle size ....................................................................................................... 31
4.3 Moisture control .......................................................................................................................... 32
4.31 Sample bulk densities for different moisture samples .......................................................... 32
4.32 Mass change between wet and dry samples .......................................................................... 33
4.33 Selection of moisture ............................................................................................................ 33
4.4 Heating temperature control........................................................................................................ 34
4.41 Sample external appearance .................................................................................................. 34
4.42 Sample bulk densities for different heating temperature ...................................................... 35
4.43 Selection of heating temperature ........................................................................................... 36
4.5 Summary and analysis the determination of density value ......................................................... 37
4.51 Maximum density ................................................................................................................. 37
4.52 Constant density .................................................................................................................... 37
4.6 Comparing the results with literature results .............................................................................. 39
5. Conclusion .................................................................................................................................... 41
6. Future work ................................................................................................................................... 41
7. Reference ...................................................................................................................................... 41
8. Appendix ....................................................................................................................................... 41

1. Introduction “The glass manufacturing industry provides products that are critical to a wide range of
industries from such low-tech items as glass containers and decorations to such high-tech
items as fiber optics and optoelectronic devices” [1]. The US glass industry also needs a large
amount of source demand for the production. According to a Gas Research Institute report
(1995), the US glass industry has used a large amount of natural gas which is about 5.5
billions of cubic metres per year. And about 90% of that has been used for glass melting and
the rest is used for downstream processing [1]. Hence, the glass industry is quite an important
field in the world.
As the large amount production of glass industry, recycling becomes another important
process of the industry. However, plastic recycling is still a relatively new and developing
field of recycling. The post-consumer items made from PET and HDPE resins have found
reliable markets within the US and in ASIA" [2]. Application for the recycled glass also
increases rapidly. However, the combustion method is not quite following the developing
step of glass recycling because of the combustion-generated pollutant emissions. The
physical-chemical process can avoid that problem and be applied more than combustion
method. And foam glass is the best representation of the process.
In general, foam glass have numerous good properties which are low density, light weight,
low thermal conductivity, high permeability, high surface area, high thermal shock resistance,
high specific strength and high resistance to chemical corrosion [3]. As foam glass has been
manufactured for a number of years mainly in the USA and Europe as a lightweight high
strength insulating material, foam glass is applied as building construction with greatly
reducing energy consumption [2]. Foam glass as a building construction material is in
competition with insulating polymeric and fibre materials because they are also insulate
materials. However, foam glass has advantages over polymeric and fibre materials which are
inherent strength, flammability, thermal stability, and high chemical durability. These
advantages make foam glass has better fire resistance than polymeric and fibre materials [2].
Also, in civil engineering, foam glass is also used in cementitious system due to the
lightweight and high strength advantages.
As there are many techniques existing for producing porous glass For example, templating,
hollow spherical method which all can produce porous glass with ordered pore size and
structure, and the pore size can be controlled in quite a large range. However, those
techniques have complicated and expensive manufacturing process. Hence, the objective of
the experiment is to find an easy and cheap method to produce porous glass. And the method
is to fabricate foam glass by rapid heating. Glass specimen foams due to the increase of glass
viscosity and expanding as the expansion of the trapped air in glass during the sintering
process. Within the experiment, change the variations of the specimen and the heating
conditions to produce foam glasses with different specifications. Basically, there are four
variations have been studied which are glass particle size, sample moisture, sintering
temperature and sintering time. Finally, select the finest foam glass and test if the physical
and mechanical properties of the products satisfy the general application requirement.
2. Updated Literature Review
2.1 Theory of foaming glass in the experiment
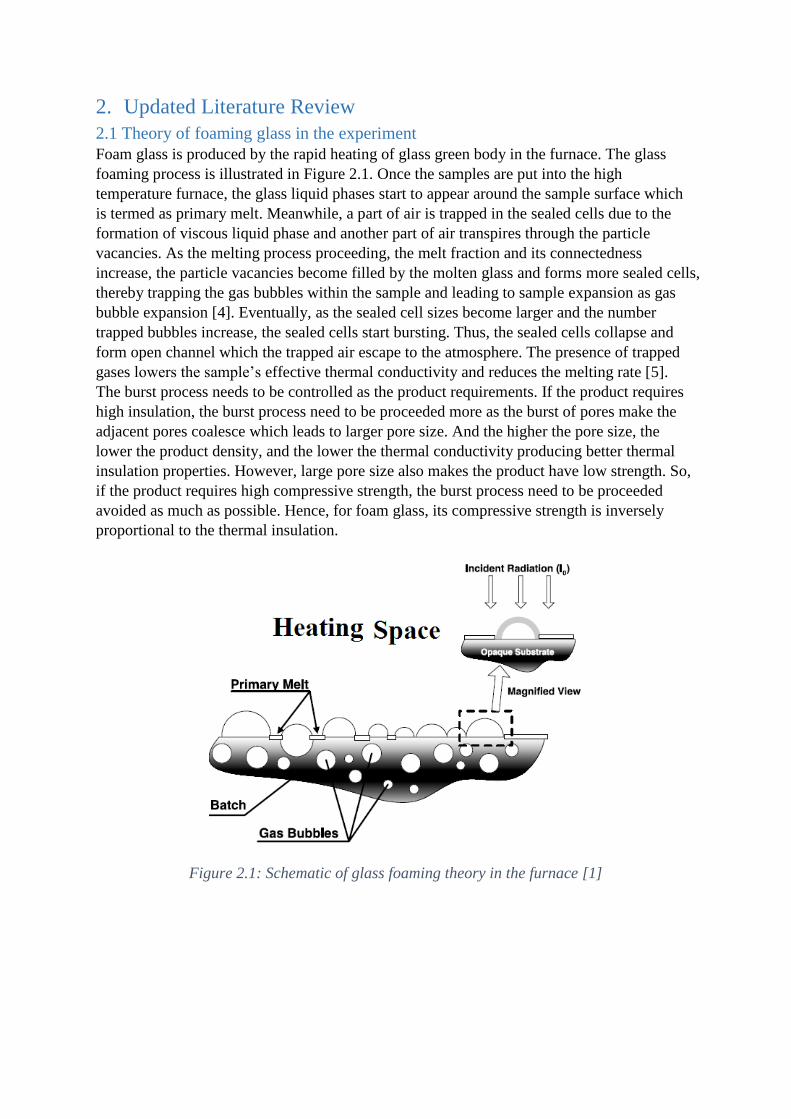
Foam glass is produced by the rapid heating of glass green body in the furnace. The glass
foaming process is illustrated in Figure 2.1. Once the samples are put into the high
temperature furnace, the glass liquid phases start to appear around the sample surface which
is termed as primary melt. Meanwhile, a part of air is trapped in the sealed cells due to the
formation of viscous liquid phase and another part of air transpires through the particle
vacancies. As the melting process proceeding, the melt fraction and its connectedness
increase, the particle vacancies become filled by the molten glass and forms more sealed cells,
thereby trapping the gas bubbles within the sample and leading to sample expansion as gas
bubble expansion [4]. Eventually, as the sealed cell sizes become larger and the number
trapped bubbles increase, the sealed cells start bursting. Thus, the sealed cells collapse and
form open channel which the trapped air escape to the atmosphere. The presence of trapped
gases lowers the sample’s effective thermal conductivity and reduces the melting rate [5].
The burst process needs to be controlled as the product requirements. If the product requires
high insulation, the burst process need to be proceeded more as the burst of pores make the
adjacent pores coalesce which leads to larger pore size. And the higher the pore size, the
lower the product density, and the lower the thermal conductivity producing better thermal
insulation properties. However, large pore size also makes the product have low strength. So,
if the product requires high compressive strength, the burst process need to be proceeded
avoided as much as possible. Hence, for foam glass, its compressive strength is inversely
proportional to the thermal insulation.
Figure 2.1: Schematic of glass foaming theory in the furnace [1]
2.2 Classification of porous material density
The density of the porous materials is classified as true density, apparent density and bulk
density. True density is the mass of materials per unit real volume, where the real volume is
the solid material volume excluding the volume of any open and closed pores and inter-
particle voids. Apparent density is the mass of materials per unit external volume, where
external volume includes all open and close pores and inaccessible voids [2]. Bulk density is
the mass of materials per total volume, where the total volume includes pores and inter-
particle voids. In addition, surface area is the detectable area of solid surface per unit mass of
the porous material.
2.3 Classification of pore structure and size
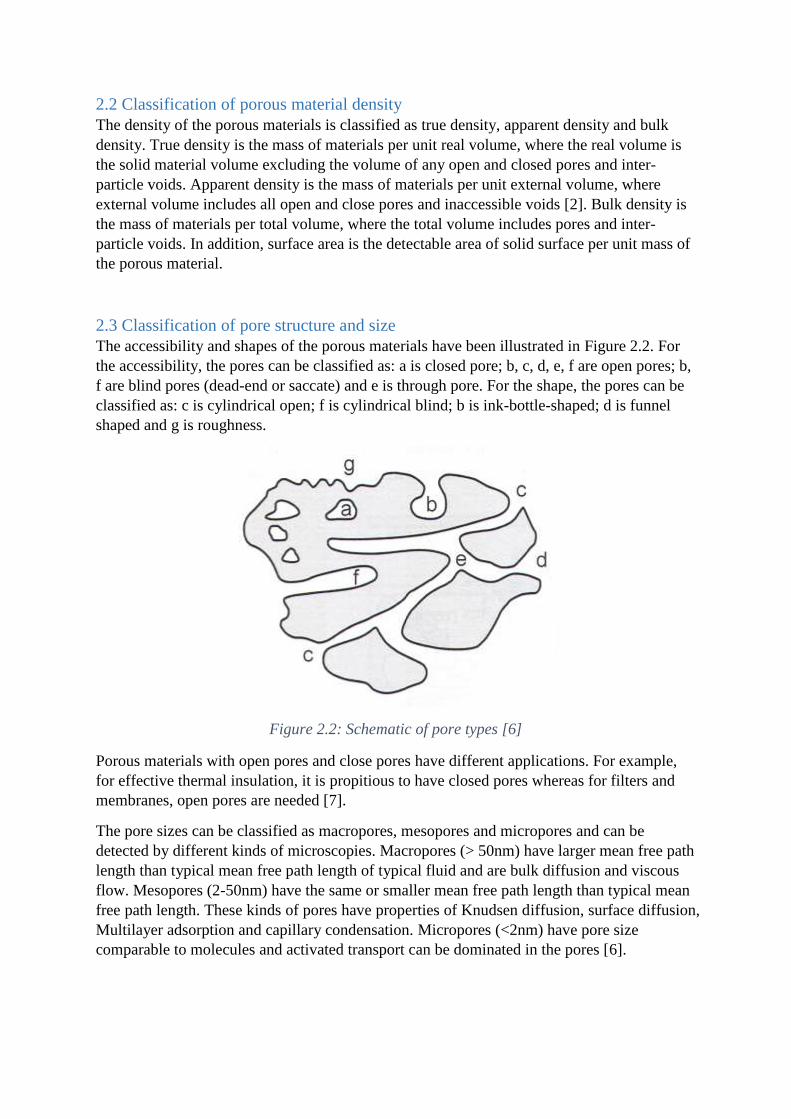
The accessibility and shapes of the porous materials have been illustrated in Figure 2.2. For
the accessibility, the pores can be classified as: a is closed pore; b, c, d, e, f are open pores; b,
f are blind pores (dead-end or saccate) and e is through pore. For the shape, the pores can be
classified as: c is cylindrical open; f is cylindrical blind; b is ink-bottle-shaped; d is funnel
shaped and g is roughness.
Figure 2.2: Schematic of pore types [6]
Porous materials with open pores and close pores have different applications. For example,
for effective thermal insulation, it is propitious to have closed pores whereas for filters and
membranes, open pores are needed [7].
The pore sizes can be classified as macropores, mesopores and micropores and can be
detected by different kinds of microscopies. Macropores (> 50nm) have larger mean free path
length than typical mean free path length of typical fluid and are bulk diffusion and viscous
flow. Mesopores (2-50nm) have the same or smaller mean free path length than typical mean
free path length. These kinds of pores have properties of Knudsen diffusion, surface diffusion,
Multilayer adsorption and capillary condensation. Micropores (<2nm) have pore size
comparable to molecules and activated transport can be dominated in the pores [6].
2.4 Foaming glass technique
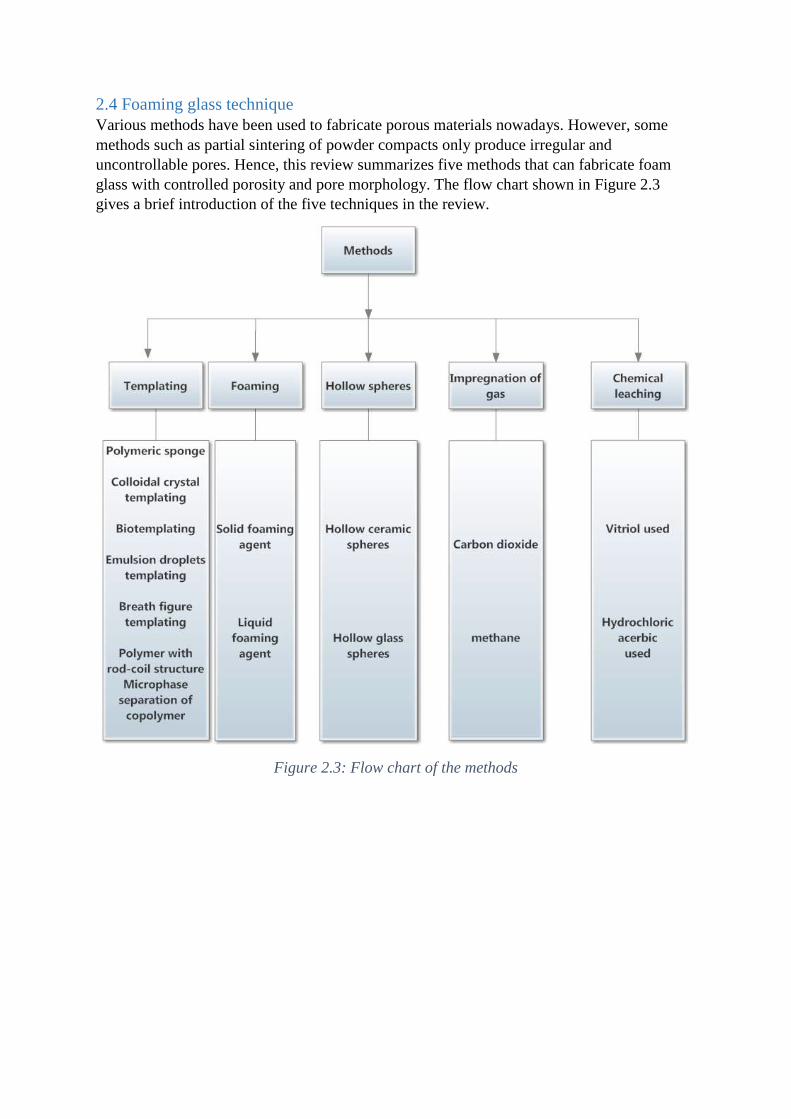
Various methods have been used to fabricate porous materials nowadays. However, some
methods such as partial sintering of powder compacts only produce irregular and
uncontrollable pores. Hence, this review summarizes five methods that can fabricate foam
glass with controlled porosity and pore morphology. The flow chart shown in Figure 2.3
gives a brief introduction of the five techniques in the review.
Figure 2.3: Flow chart of the methods
2.41 Templating technique
Templating method is based on self-assembly of materials and can produce both two-
dimensional porous materials in the surface of films for 2D cases and three-dimensional
porous materials in the internal structure for 3D cases [8]. The method prepares porous
materials with controlled porosity and pore size via slurry impregnation of templates. Well-
dispersed suspensions of template and ceramic particles can attract each other due to the
opposite charged particles and self-assemble core-shell structures. Then, the flocculated
particles are closely packed and solidified to form the open porous structure with a number of
strategies such as vacuum filtration, salt precipitation. Finally, the templates are removed
from the composite materials by calcination (thermal decomposition) or solvent extraction
(chemical dissolution) or other technique [9, 10, 11]. Calcination is the most widely-used way
to remove the templates because most of the templates can be burned out directly. Hence, the
open porous structured materials with ordered arrays of pores will be fabricated.
The advantage of templating method is that pore size and structure can be determined by the
template size. The larger the template size, the larger the pore size. Hence, the products can
have a large range by different size template impregnation. It can fabricate porous glass with
micropores, however, the template is too expensive. The disadvantage is that there is one
more procedure needed to remove the template. This makes templating method more
expansive when applying in industrial production.
2.42 foaming agent technique
Foaming agent method is nearly the same with the experimental method. The basic theory is
the sealed cells expansion due to the gas expansion during the sintering process. The only
difference is the gas is not from the air but from the added foaming agents reaction or
decomposition during the sintering process. There are two groups of foaming agents which
are solid and liquid. Solid foaming agents are difficult to obtain fine and controlled pores
because of agglomerate strongly of foaming agent [12]. However, liquid foaming agents do
not have such problems, this they have been always used for the foaming process to create
fine, ordered and size controlled porous materials [13]. The advantages of foaming method
are the low cost, large volume expansion possible but the problem is that it has trouble with
scaling up dimension [14].
2.43 Hollow spherical technique
The basic theory is to prepare structures that are built up by hollow spheres with a fixed
diameter and connected together by packing the spheres in a mould via hot pressing in
graphite die at constant temperature and pressure [15]. The advantage of the method is that it
allows production of ceramic-glass foams with sufficient strength and nearly perfect pore
morphologies and sizes [16] , also, quite lightweight materials can be obtained. The technique
is rather flexible and ensures a good reproducibility of mechanical properties of the foam due
to the regularity of its structure that can decide the geometrical features and properties of the
porous materials. [17]. However, the technique can just obtain porous materials with limited
number of pores due to the limited range of hollow cores on the organic or polymer.
2.44 Impregnation of gas
The process of the method is to saturate powder compacts via adding gas as a blowing agent
under a rapid pressure drop. Thermodynamic instability can be induced during the rapid
change of the pressure and thermodynamic instability act as a driving force to nucleate and
grow a large number of bubbles. The nucleated cells continue to grow at temperature above
softening temperature, consequently, foaming the porous materials. The pore size and pore
density strongly depends on the saturated pressure. Large saturated pressure can make open
pores with relative smaller pore size while small saturated pressure can make close pores with
relative bigger pore size [18]. The advantage of the method is that it can produce open pores
and close pores separately by changing the saturated pressure. The drawback is the time
consuming.
2.45 Chemical leaching technique
Chemical leaching method is to add chemical solution to remove the undesired phase after
the specimen was crystallized and phase was separated by heating. The chemical solution
should have great catalytic activity for the specific substance in the materials. For example, a
volume-crystallized dense glass-ceramic composed of CuTi2 (PO4)3 and Cu3 (PO4)2 with a
CuO layer due to the oxidation by air. The chemical leaching can be used by adding vitriol to
react with the composition and get Cu3 (PO4)2 and CuO out of the composition and leave the
specimen with CuTi2 (PO4)3 only. Finally, separate the specimen with the by-productions and
liquid, dry the production up.
The result of phase separation will determine the porosity and the pore morphology. Leaching
solution and leaching time will influence the strength of the porous materials directly [19].
The advantage of the method is that it can got porous materials from another exist porous
materials by chemical leaching. The disadvantage is to exclude the disposal of liquid effluent
and the by-products.

3. Experimental Method This chapter states the experimental method and procedure, sample preparation and
characterisation techniques. All the measured data has been stated in Appendix.
3.1 Experimental method and procedure
Three sets of experiments have been carried out to study the fabrication of finest foam glass
and the physical and mechanical properties of the finest foam glass. Basically, there are four
variations which can determine the quality of foam glass, they are glass powder particle size,
moisture, sintering temperature and sintering time. Hence, the experiment has sintered the
specimens with all the different conditions to produce the finest foam glass. The experiment
focused on the finest samples to study their physical and mechanical properties.
The three sets of experiments have been stated in table in Table 3.1.The first set of
experiment was to sinter the green body with different particle size but the same moisture at
800℃ for different heating time. The second set of experiment was to sinter the green body
with different moisture but the same particle size at 800℃ for different heating time. The
third set of experiment was to sinter the green body with the same particle size and moisture
for different sintering temperature and time. The variations of the four conditions have been
listed in Table 3.2. Mixed particle dry samples with different heating time at 800℃ were
selected as reference. In water adsorption measurement, pore size and wall thickness, pore
structure and strength test experiment, we all used those samples.
Experiment
sequence
Sintering time Sintering
temperature
Glass powder
particle size
Moisture
1 C U C U
2 C U U C
3 C C U U
Table 3.1: Condition change setup for the three experiments (C represent that condition was
changed in the experiment and U represent that condition was unchanged in the experiment.)
Conditions Variations
Sintering time (minutes) 1, 2, 3, 4, 6, 8, 10, 20, 30
Sintering temperature (℃ ) 650, 800, 950, 1100
Glass powder particle size (µm) 0.01-40, 0.01- 320, 0.01- 954
Moisture (%) 0, 100
Table 3.2: Variations of the conditions

3.2 Sample preparations
This section states the process of the glass green body fabrication and the sintering process of
the green body to produce foam glass samples.
3.21 Ball milling
The raw material is the recycled glass aggregate with the glass fragment of several
millimetres in size. Mixed about the same amount of glass aggregate with aluminium oxide
milling cylinders and placed in the vibratory mill [20]. Aluminium oxide milling cylinders
worked as milling media. The raw materials and the milling media crushed into each other
and mixed particle size powder produced by chipping off the large particles during the
process of vibratory mill. As the raw material was shaking for longer time, the more fine
powder could be obtained. In the experiment, milled the raw material for one week and the
mixed powder including both fine powder and coarse powder have been got after one week.
3.22 Sieve shaking
To classify the mixed milled powder, a set of sieves with different openings have been
applied in the experiment. The automatic sieve shaker was shown in Figure 3.1. There were
three openings which have placed on the shaker. The sieve was placed with largest opening at
the top, increasingly smaller openings were placed underneath it [20]. Hence, the mixed
powder could be split into different ranges powder. The finest powder reached the bottom
while the coarse powder was left on the top sieves. The top sieve has 600µm openings, the
middle sieve has 400µm openings and the bottom sieve has 200µm openings. There was a
plate under the bottom sieve to collect the finest powder. And the mixture had been split in a
range of sizes with >600µm, 600-400µm and <200µm. In the experiment, put the ordered
sieves on the top of collection pan and poured the mixed milled powder into the top sieve.
Strapped sieves with the shaker and shake the material for about 2 hours. Put the different
fractions into different containers and wrote the details of particle size on the containers.
Figure 3.1: Automatic sieve shaker
3.23 Making small and large particle powder
Powder with particle size over 200µm is difficult for slip casting due to the large vacancy
between the particles. Hence, it is necessary to split the fine powder with different ranges. In
the experiment, powder has been divided into three sets which are small particle powder,
mixed particle powder and large particle powder. Powder with 0.01-200µm particle size
which made after the sieve shaking has been selected as the mixed particles. Small and large
particle powder was made by precipitation of the mixed powder in water. First, found a long
thin transparent cylinder and filled about 90% volume of the cylinder with water. Put about
20g mixed powder into the cylinder quickly. Once there was no obvious particle precipitation
in the cylinder, poured upper layer slurry into a beaker from the cylinder. Next, poured lower
layer slurry with large precipitation into another beaker from the cylinder. As the large
particles precipitated quite quickly and went down to the lower layer of the slurry whereas
the small particles existed in the upper slurry layer, the glass particles have been split into
large and small particles. Finally, put the two beakers into the dry over which is always 110℃
constant. Dry the slurry for about one night until the evaporation of slurry completed. During
the drying process, the slip casting process occurred actually, thus, the glass particles have
packed close together and formed irregular shaped glass sample. Took the beaker out from
the oven and took the glass out from the beaker with spoon. To make new powder, broke
glass by and spoon stirring hand shaking. Hence, small particle powder and large particle
powder was produced.
3.24 Slip casting
Put a plaster board in the oven for a long time before slip casting. Once started to do slip
casting, made reasonable glass slurry with a ratio of 5g glass powder and 2g water and shake
the slurry to make it homogeneous. Took the plaster board out and placed the moulds onto
the plaster board. Poured the slurry into the rectangular mould quickly and make sure to pour
in enough. When they have sufficient dried, they would shrink just enough to loose from the
mould and plaster board. Then, remove the sample gently from the mould. Put the plaster
board back to the oven to re-use.
3.25 Moisture control
As we have obtained the glass green body after slip casting, make the two sets of samples in
two different moistures. One set is low moisture which is about zero percent water content
and another is high moisture which is about one hundred percent water content. Put the one
set samples in the oven for 24 hours. Those samples became low moisture samples. Then,
prepared a box and filled 60% volume of the box with water. Put a steel block in the water
but the block is higher than water surface. Put the samples on the block and sealed the box.
Let the samples stay in the box for 24 hours. Those samples have high moisture. Took the
samples out and measured the dimensions (length, width and height) as well as the mass to
calculate the green body density.
3.26 Sintering
Sinter the samples that were prepared in different conditions for different heating time with
the variation in Table 3.1and Table 3.2. In the experiment, put the green body samples in an
aluminium holder first and put the holder into the furnace that has reached the setup
temperatures by tongs. Took the holders out, put it on a steel block and inside a steel cauldron
to avoid the danger of high temperature. Took the samples out from the holder after the
holder has cooled down and put them into different plastic bags.

3.27 Grinding
Took the samples out from the bags and grinded them manually with the grinding machine.
Made the samples’ geometry in rectangular or cubic. Made the edge length of the samples
with close 7mm as much as possible. Grinded the samples with cooling water opening to
wash away the powder on the samples as grinding. Put the samples in the oven to dry up the
samples completely after grinding. The drying time was about 3 hours. Put the sample into
the plastic bags again after drying and the samples have been made up completely.
3.3 Characterisation technique
3.31 Measuring particle size
Mastersizer has been used for the measurement of glass powder particle size. As the powder
has been classified into three sets, measured the three sets powder by making the glass slurry
and poured the slurry droplet by droplet into the mastersizer machine. The machine measured
the particles by laser for five times. Hence, the average particle size range of the three sets
powder could be obtained.
3.32 Density measurement
As the samples has been shaped into rectangular or cubic, measured the dimensions of the
samples by electron calliper and mass of samples by the balance. Calculated the bulk
densities via volume divided by mass. Recorded the value of measured data.
3.33 Optical microscopy
Put the samples under optical microscopy lens and focused the samples to appear clear image
on the screen. Captured the image by the camera and saved the picture. Then, calculated the
pore sizes in the picture by Matlab programme. Measured the pore wall thickness by imagej.
Therefore, the pore size and pre wall thickness distribution of the sample was calculated in
Excel.
3.34 Scanning electron microscopy
Coated the sample with gold because the glass sample is insulator which cannot be used in
SEM. Found the pore structure and the appearance inside the pores by SEM.
3.35 Strength test
ZwickiLine machine was used for the strength test. Put the samples on the bottom flat surface
and compressed the samples by the machine. The standard strain of the sample and the
compression force on the sample could be demonstrated by TestXpert II software. Finally,
plotted the stress and strain graph by the data obtained from TestXpert II in Excel.
3.36 Water adsorption measurement
To test the water adsorption ability of the samples, samples had to be submerged into water
for 24 hours. However, some sample densities were smaller than water, so it was necessary to
find a method to force the samples submerging into water. In the experiment, measured the
absolute dry samples mass first. Found a glass cylinder pan and filled to the full of the pan
with water. Put all the measured dry samples into water in order. Put the plastic box that have
ever been used for preparing the high moisture samples on the top of pan to force the samples
into water. As the plastic box was filled with water, it had enough weight which was bigger
than the water buoyancy to the samples. Let the samples immersed in water for 24 hours.
Then, take the samples out from the pan and measured the samples mass one by one as soon
as possible. The difference between the mass of dry sample and submerged sample for each
sample is their adsorbed water mass.
4. Results and Discussion Foam glass manufacture is mainly dependent on four conditions which are glass powder
particle size, moisture, heating temperature and heating time as described in section 2.1. To
find the most suitable environment for producing the finest foam glass, it is necessary to find
the impact on the sample properties of each condition and hence, the samples have been
analysed for each variation for different heating time in the following and kept other
conditions constant to avoid their effects. To achieve that, the results of samples which
produced at the same conditions but at different heating time have been written first. Then,
make those results as references and compare them with other samples which are produced
with different conditions at each separated heating time. Finally, compare the samples’
physical and mechanical properties to find the best producing environment of the finest foam
glass in the chapter. The experiment focuses on the bulk densities of the samples. Hence, the
sample densities in the following represent the bulk density. The explicit details about the
calculations and data are presented in Appendix.
4.1 Heating time control
Mixed particle size and 0% moisture samples have been prepared for heating at 800℃ with
different heating time. These type samples can be regarded as reference and compared with
the samples in other conditions. Also, the effect of the heating time on the sample properties
when heating at 800℃ can be evaluated.
4.11 Sample bulk densities within different heating time
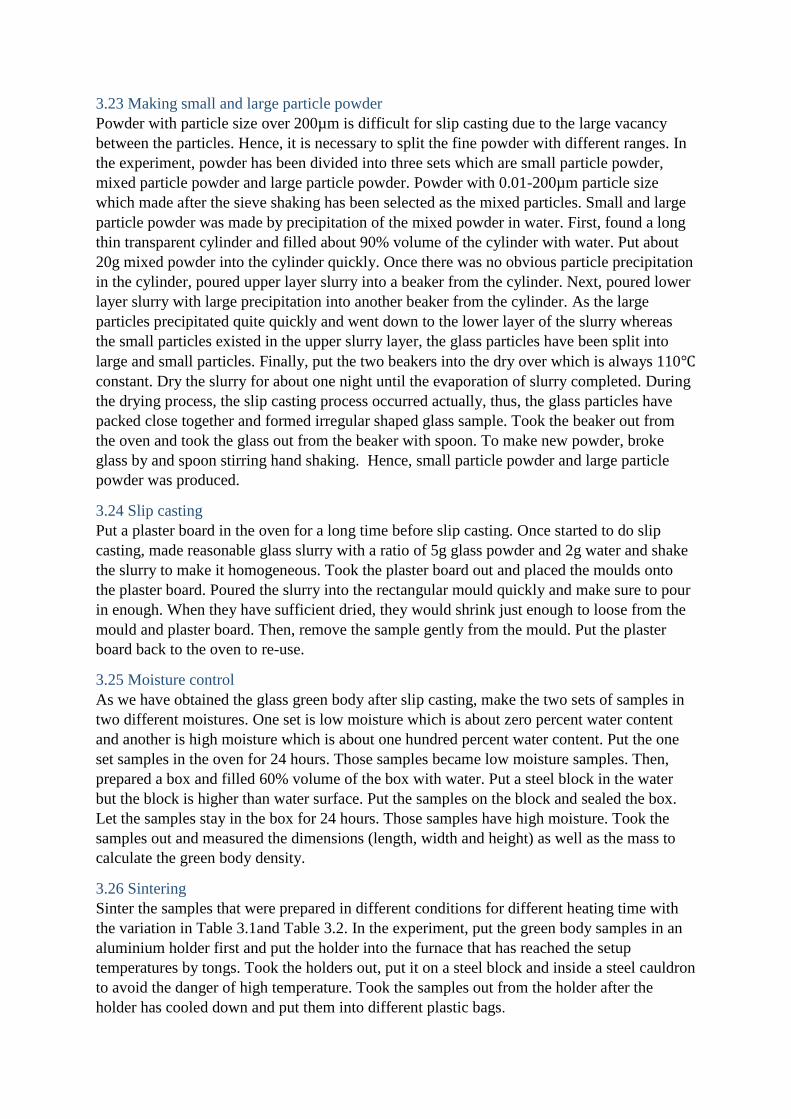
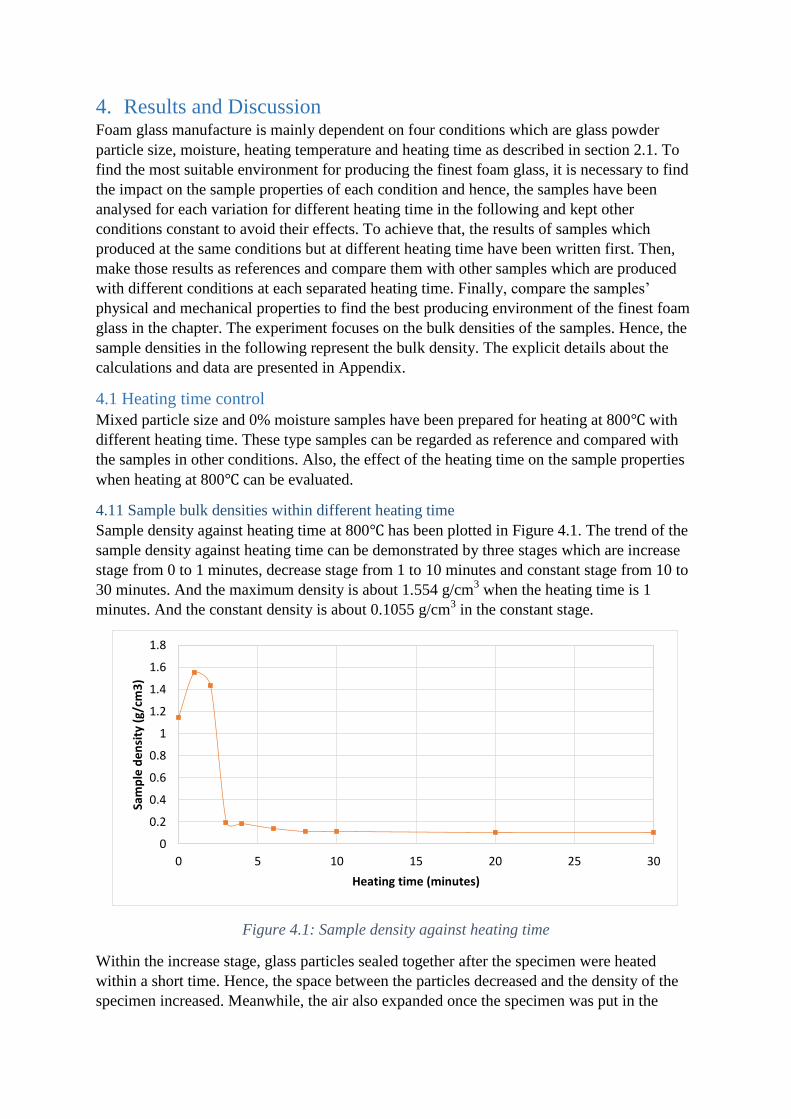
Sample density against heating time at 800℃ has been plotted in Figure 4.1. The trend of the
sample density against heating time can be demonstrated by three stages which are increase
stage from 0 to 1 minutes, decrease stage from 1 to 10 minutes and constant stage from 10 to
30 minutes. And the maximum density is about 1.554 g/cm3 when the heating time is 1
minutes. And the constant density is about 0.1055 g/cm3 in the constant stage.
Figure 4.1: Sample density against heating time
Within the increase stage, glass particles sealed together after the specimen were heated
within a short time. Hence, the space between the particles decreased and the density of the
specimen increased. Meanwhile, the air also expanded once the specimen was put in the
0
0.2
0.4
0.6
0.8
1
1.2
1.4
1.6
1.8
0 5 10 15 20 25 30
Sam
ple
de
nsi
ty (
g/cm
3)
Heating time (minutes)

furnace, but part of air was still trapped in the closed space due to the particle sealing. Ideally,
the specimen reached the maximum density when the glass particle sealed quite well and
sealed cells just prepared to expand. Then, the specimen expanded as the trapped air
expanded. The density of the specimen started to decrease due to the increase of the volume.
After the decrease stage, the specimen density reached a constant value no matter how long
the specimen was heated. There were two possibilities that made the density keep constant.
One is that there may have little small holes on the surface of the sealed glass cells and the
holes grew as the glass expansion driven by surface tension forces. The trapped air was
released from the holes on the surface and the specimen did not expand until the trapped air
has released completely. At that moment, the volume of the specimen was always kept
constant; therefore, the density was also kept constant. Another possible reason is that the as
the gas expanded in the sealed space, according to ideal gas law PV= nRT, the inner pressure
increased due to the unchanged gas volume and increased temperature after the specimens
was put in. At the same time, all the sealed particle cells was expanding and the adjacent
sealed cells might collide each other and overlapped slightly. Finally, the sealed cells burst
due to the increase of both internal and external pressure. Sealed cells stopped the expansion
after the burst. Thus, the sample volume and density always kept constant after the burst.
There are very small differences of the density values for the samples in the constant region.
This is because the surface pores’ wall on the samples have collapsed and the geometry of the
sample were not exact rectangular as the surface was not quite flat after grinding.
4.12 Pore volume fraction
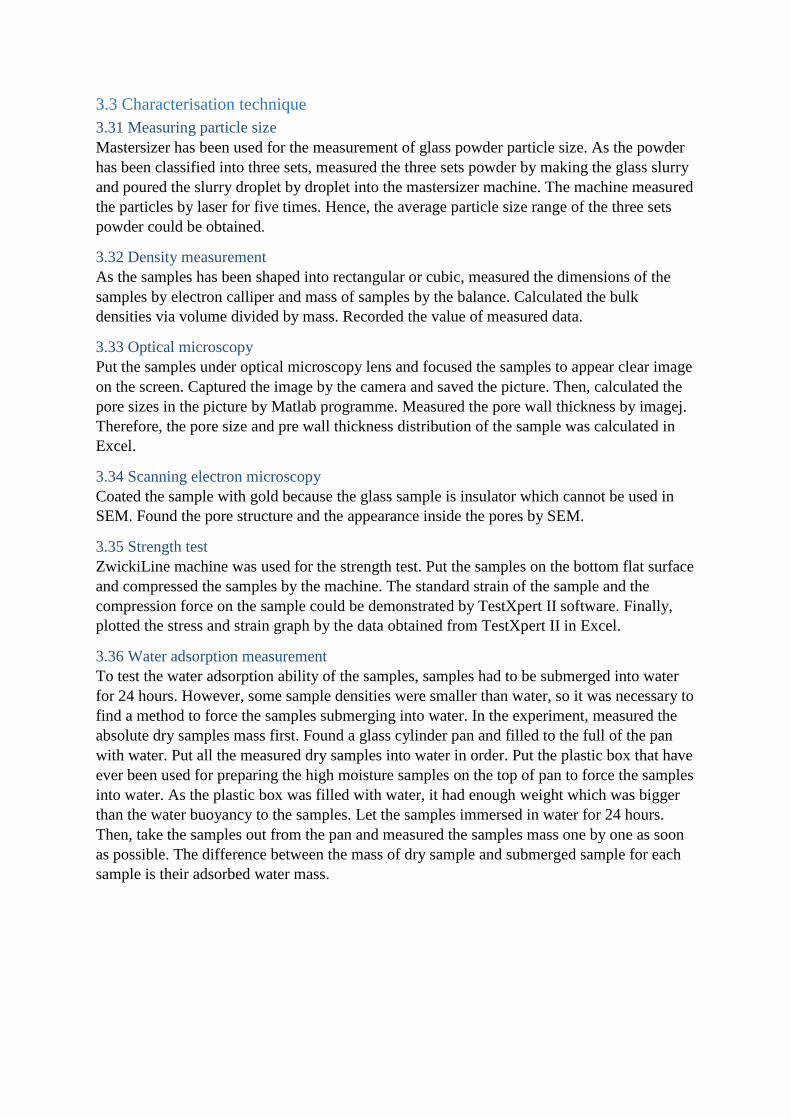
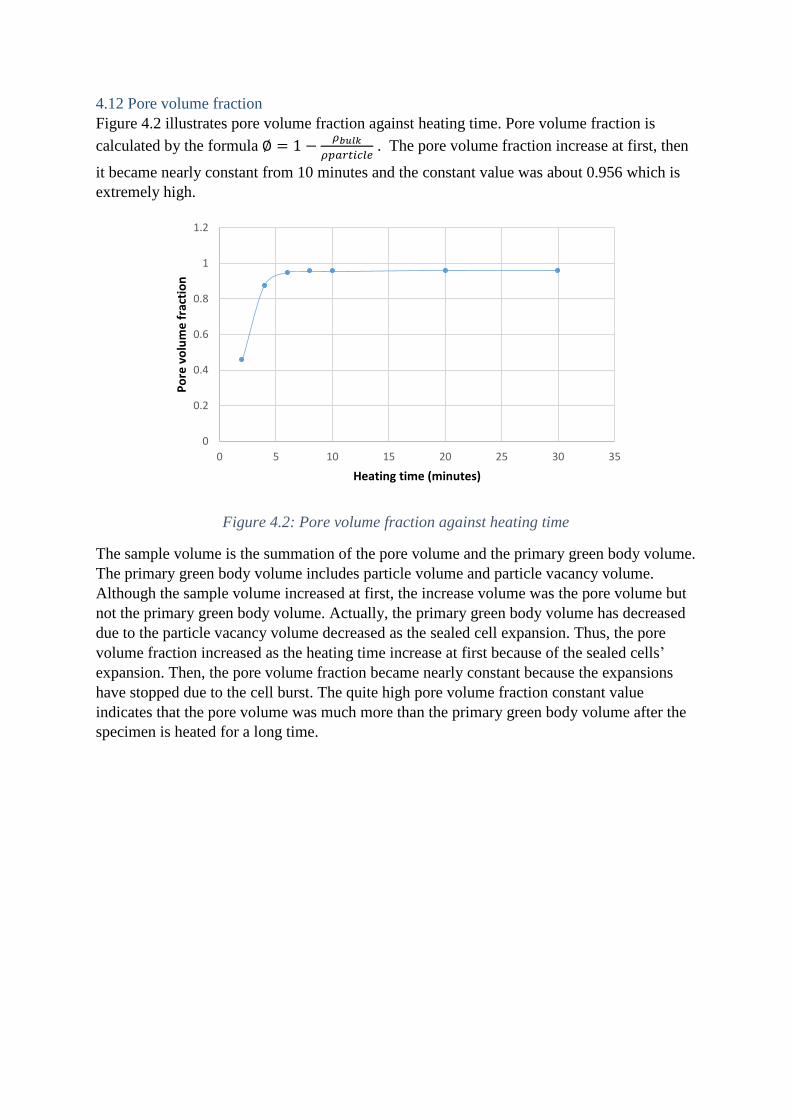
Figure 4.2 illustrates pore volume fraction against heating time. Pore volume fraction is
calculated by the formula ∅ = 1 −𝜌𝑏𝑢𝑙𝑘
𝜌𝑝𝑎𝑟𝑡𝑖𝑐𝑙𝑒 . The pore volume fraction increase at first, then
it became nearly constant from 10 minutes and the constant value was about 0.956 which is
extremely high.
Figure 4.2: Pore volume fraction against heating time
The sample volume is the summation of the pore volume and the primary green body volume.
The primary green body volume includes particle volume and particle vacancy volume.
Although the sample volume increased at first, the increase volume was the pore volume but
not the primary green body volume. Actually, the primary green body volume has decreased
due to the particle vacancy volume decreased as the sealed cell expansion. Thus, the pore
volume fraction increased as the heating time increase at first because of the sealed cells’
expansion. Then, the pore volume fraction became nearly constant because the expansions
have stopped due to the cell burst. The quite high pore volume fraction constant value
indicates that the pore volume was much more than the primary green body volume after the
specimen is heated for a long time.
0
0.2
0.4
0.6
0.8
1
1.2
0 5 10 15 20 25 30 35
Po
re v
olu
me
fra
ctio
n
Heating time (minutes)

4.13 Water adsorption
Figure 4.3 is the plotting of water adsorption volume and pore volume against heating time.
Water adsorption volume is the volume of water adsorbed by the samples after the samples
submerged into water completely for one day. Pore volume increases rapidly to the maximum
value and becomes constant with the value around the maximum pore volume. Pore volume
equals to pore volume fraction multiply bulk volume, so, it has similar trend with pore
volume fraction against heating time except the strange increase at 8 minutes. The volume of
water adsorption decreased from 2 to 8 minutes and increased from 8 to 10 minutes. Then,
the volume of water adsorption increased again from 10 to 30 minutes. Overall, water
adsorption volume had quite small differences for samples with different heating time. The
largest difference within all the samples was about 0.107cm3.
Figure 4.3: water adsorption volume and sample true volume against heating time
There is no obvious trend for water adsorption against heating time in Figure 4.3. This is
because of the volume difference of the green body specimens. The green body is shaped as
rectangular and hence, the surface area to volume ratio increases as the increase of specimen
volume. The volume of water adsorption decreases once the surface area to volume ratio
increases because there will be more water adheres to the surface but not adsorbed inside.
Therefore, water adsorption volume fraction and pore volume fraction have been plotted in
Figure 4.4. The trend of the pore volume fraction against heating time is exact opposite to
water adsorption volume fraction. Pore volume fraction increase as the increase of heating
time at first and it becomes constant as the heating time increase then. Water adsorption
volume fraction decrease as the increase of heating time at first and it becomes constant as
the heating time increase then.
For the 2 minute heated sample, pore volume fraction is smaller than water adsorption
volume fraction. As the heating time increase, the increase trend of pore volume fraction and
the decrease trend of water adsorption volume fraction are quite similar until reaching the
constant values. It indicates water adsorption ability becomes weak as pore volume fraction
increase. Meanwhile, the increase value of pore volume and decrease value of water
adsorption volume are quite similar.
0.125
0.25
0.5
1
2
4
8
0 5 10 15 20 25 30 35
Vo
lum
e (
cm3)
Heating time (minutes)
Water adsorption volume
Pore volume
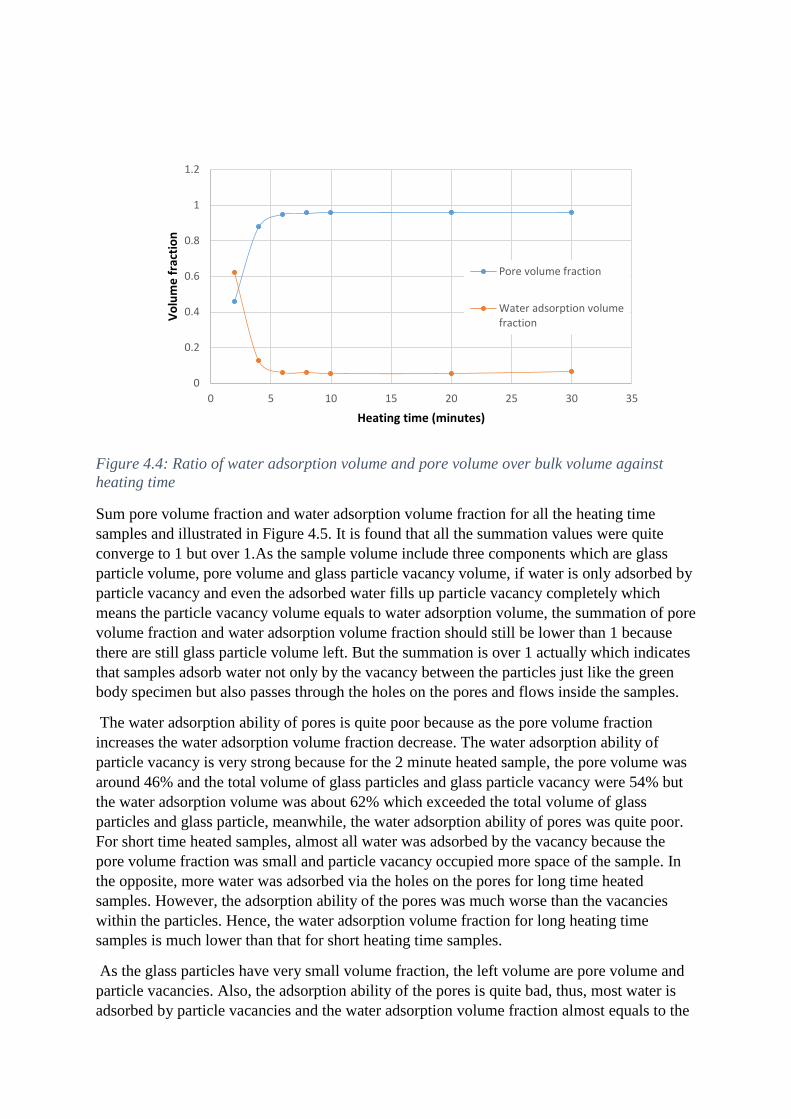
Figure 4.4: Ratio of water adsorption volume and pore volume over bulk volume against
heating time
Sum pore volume fraction and water adsorption volume fraction for all the heating time
samples and illustrated in Figure 4.5. It is found that all the summation values were quite
converge to 1 but over 1.As the sample volume include three components which are glass
particle volume, pore volume and glass particle vacancy volume, if water is only adsorbed by
particle vacancy and even the adsorbed water fills up particle vacancy completely which
means the particle vacancy volume equals to water adsorption volume, the summation of pore
volume fraction and water adsorption volume fraction should still be lower than 1 because
there are still glass particle volume left. But the summation is over 1 actually which indicates
that samples adsorb water not only by the vacancy between the particles just like the green
body specimen but also passes through the holes on the pores and flows inside the samples.
The water adsorption ability of pores is quite poor because as the pore volume fraction
increases the water adsorption volume fraction decrease. The water adsorption ability of
particle vacancy is very strong because for the 2 minute heated sample, the pore volume was
around 46% and the total volume of glass particles and glass particle vacancy were 54% but
the water adsorption volume was about 62% which exceeded the total volume of glass
particles and glass particle, meanwhile, the water adsorption ability of pores was quite poor.
For short time heated samples, almost all water was adsorbed by the vacancy because the
pore volume fraction was small and particle vacancy occupied more space of the sample. In
the opposite, more water was adsorbed via the holes on the pores for long time heated
samples. However, the adsorption ability of the pores was much worse than the vacancies
within the particles. Hence, the water adsorption volume fraction for long heating time
samples is much lower than that for short heating time samples.
As the glass particles have very small volume fraction, the left volume are pore volume and
particle vacancies. Also, the adsorption ability of the pores is quite bad, thus, most water is
adsorbed by particle vacancies and the water adsorption volume fraction almost equals to the
0
0.2
0.4
0.6
0.8
1
1.2
0 5 10 15 20 25 30 35
Vo
lum
e f
ract
ion
Heating time (minutes)
Pore volume fraction
Water adsorption volumefraction
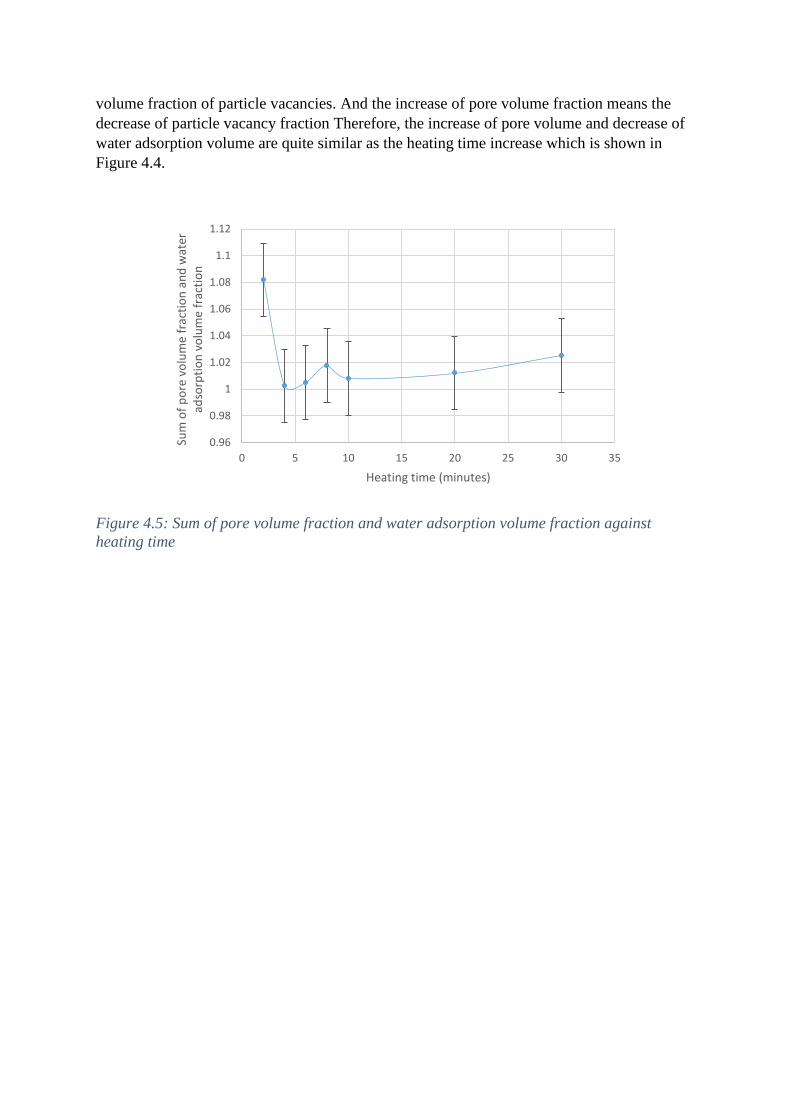
volume fraction of particle vacancies. And the increase of pore volume fraction means the
decrease of particle vacancy fraction Therefore, the increase of pore volume and decrease of
water adsorption volume are quite similar as the heating time increase which is shown in
Figure 4.4.
Figure 4.5: Sum of pore volume fraction and water adsorption volume fraction against
heating time
0.96
0.98
1
1.02
1.04
1.06
1.08
1.1
1.12
0 5 10 15 20 25 30 35
Sum
of
po
re v
olu
me
frac
tio
n a
nd
wat
er
adso
rpti
on
vo
lum
e fr
acti
on
Heating time (minutes)

4.14 Pore distribution of the samples experienced different heating time
Figure 4.6 shows the flat surface of the samples by optical microscopy. From Figure 4.6a to
4.6g are samples heated for 2, 4, 6, 8, 10, 20, 30 minutes obtained by 2.5x magnification lens.
Figure 4.6h and 4.6i are samples heated for 2 and 4 minutes obtained by 10x magnification
lens. From Figure 4.6, pores’ geometry is similar with dodecahedron. Pore size increased at
first 8 minutes. There was no obvious change on pore size after 8 minutes. The pore volume
fraction before 4 minutes was less than that after 4 minutes. Therefore, the pore size
distribution and pore volume fraction have been calculated in detail in the following section.
a b c
d e f
g h i
Figure 4.6: Sintered sample surface under optical microscopy
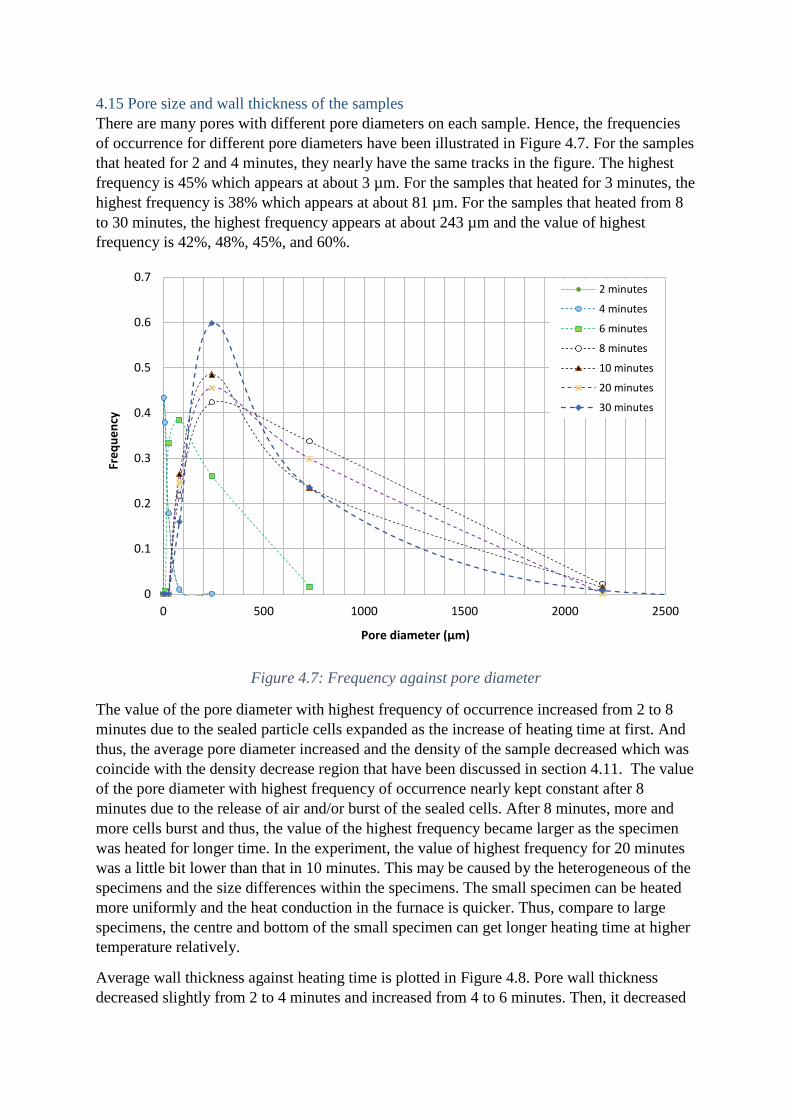
4.15 Pore size and wall thickness of the samples
There are many pores with different pore diameters on each sample. Hence, the frequencies
of occurrence for different pore diameters have been illustrated in Figure 4.7. For the samples
that heated for 2 and 4 minutes, they nearly have the same tracks in the figure. The highest
frequency is 45% which appears at about 3 µm. For the samples that heated for 3 minutes, the
highest frequency is 38% which appears at about 81 µm. For the samples that heated from 8
to 30 minutes, the highest frequency appears at about 243 µm and the value of highest
frequency is 42%, 48%, 45%, and 60%.
Figure 4.7: Frequency against pore diameter
The value of the pore diameter with highest frequency of occurrence increased from 2 to 8
minutes due to the sealed particle cells expanded as the increase of heating time at first. And
thus, the average pore diameter increased and the density of the sample decreased which was
coincide with the density decrease region that have been discussed in section 4.11. The value
of the pore diameter with highest frequency of occurrence nearly kept constant after 8
minutes due to the release of air and/or burst of the sealed cells. After 8 minutes, more and
more cells burst and thus, the value of the highest frequency became larger as the specimen
was heated for longer time. In the experiment, the value of highest frequency for 20 minutes
was a little bit lower than that in 10 minutes. This may be caused by the heterogeneous of the
specimens and the size differences within the specimens. The small specimen can be heated
more uniformly and the heat conduction in the furnace is quicker. Thus, compare to large
specimens, the centre and bottom of the small specimen can get longer heating time at higher
temperature relatively.
Average wall thickness against heating time is plotted in Figure 4.8. Pore wall thickness
decreased slightly from 2 to 4 minutes and increased from 4 to 6 minutes. Then, it decreased
0
0.1
0.2
0.3
0.4
0.5
0.6
0.7
0 500 1000 1500 2000 2500
Fre
qu
en
cy
Pore diameter (µm)
2 minutes
4 minutes
6 minutes
8 minutes
10 minutes
20 minutes
30 minutes
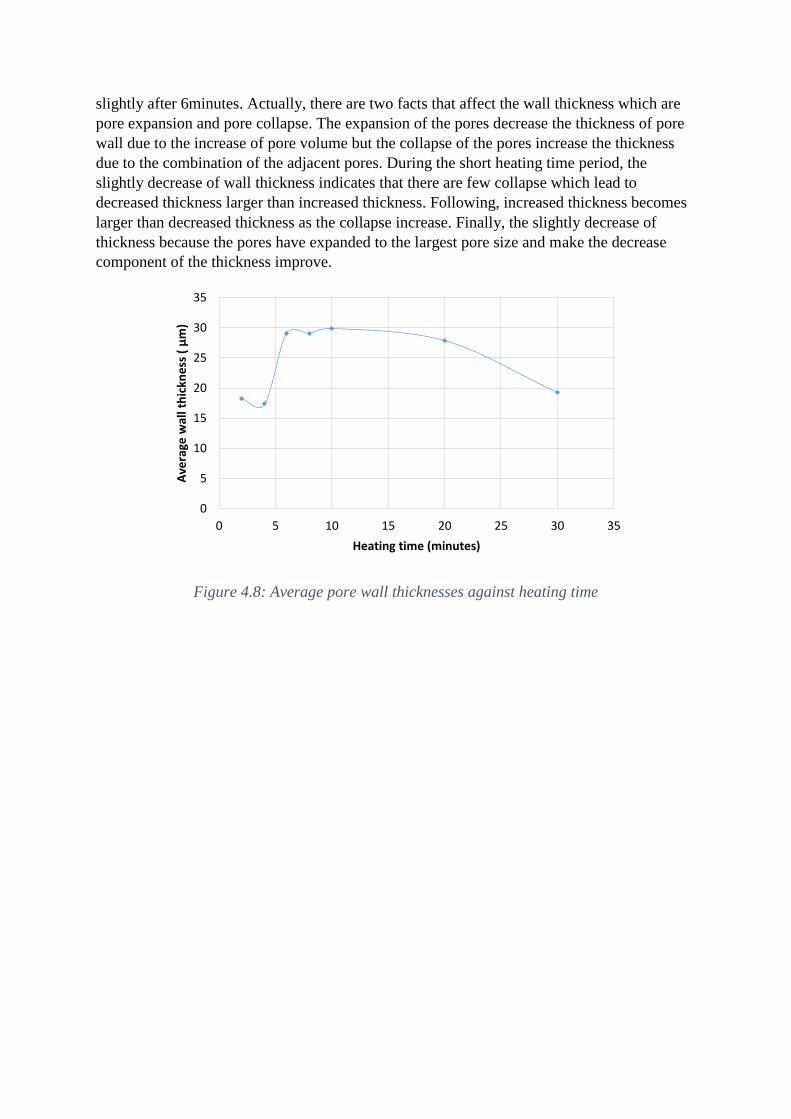
slightly after 6minutes. Actually, there are two facts that affect the wall thickness which are
pore expansion and pore collapse. The expansion of the pores decrease the thickness of pore
wall due to the increase of pore volume but the collapse of the pores increase the thickness
due to the combination of the adjacent pores. During the short heating time period, the
slightly decrease of wall thickness indicates that there are few collapse which lead to
decreased thickness larger than increased thickness. Following, increased thickness becomes
larger than decreased thickness as the collapse increase. Finally, the slightly decrease of
thickness because the pores have expanded to the largest pore size and make the decrease
component of the thickness improve.
Figure 4.8: Average pore wall thicknesses against heating time
0
5
10
15
20
25
30
35
0 5 10 15 20 25 30 35
Ave
rage
wal
l th
ickn
ess
( µ
m)
Heating time (minutes)
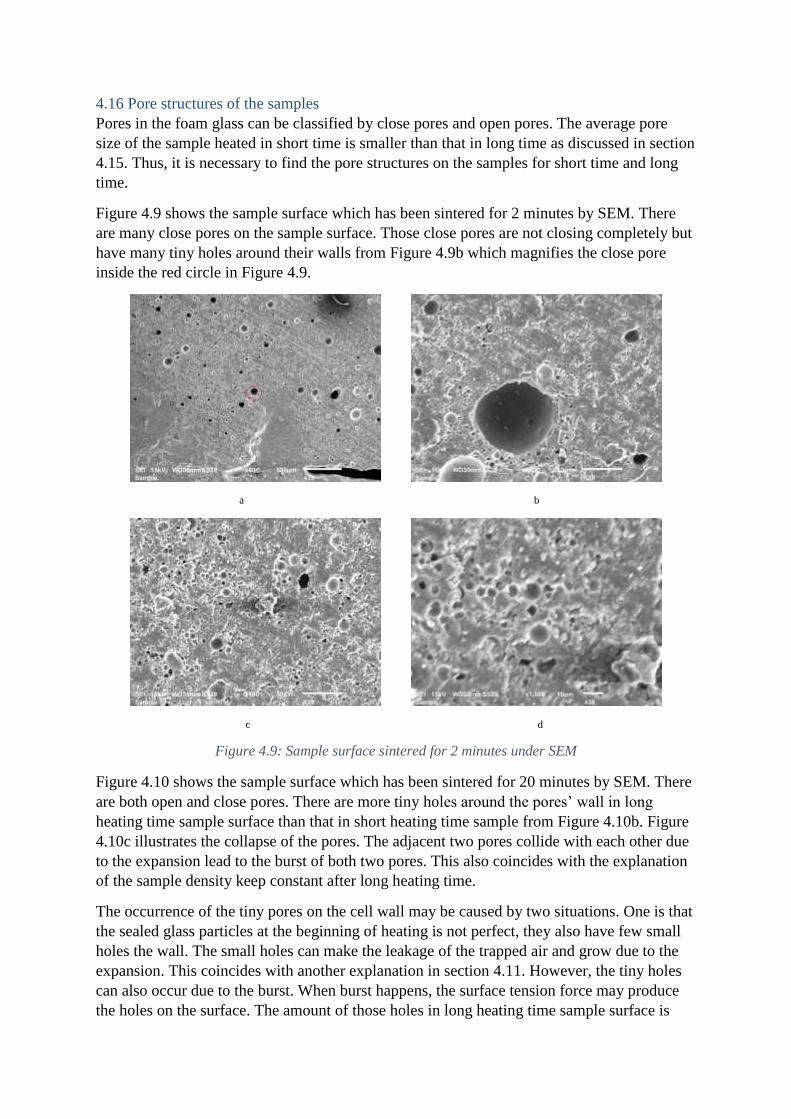
4.16 Pore structures of the samples
Pores in the foam glass can be classified by close pores and open pores. The average pore
size of the sample heated in short time is smaller than that in long time as discussed in section
4.15. Thus, it is necessary to find the pore structures on the samples for short time and long
time.
Figure 4.9 shows the sample surface which has been sintered for 2 minutes by SEM. There
are many close pores on the sample surface. Those close pores are not closing completely but
have many tiny holes around their walls from Figure 4.9b which magnifies the close pore
inside the red circle in Figure 4.9.
a b
c d
Figure 4.9: Sample surface sintered for 2 minutes under SEM
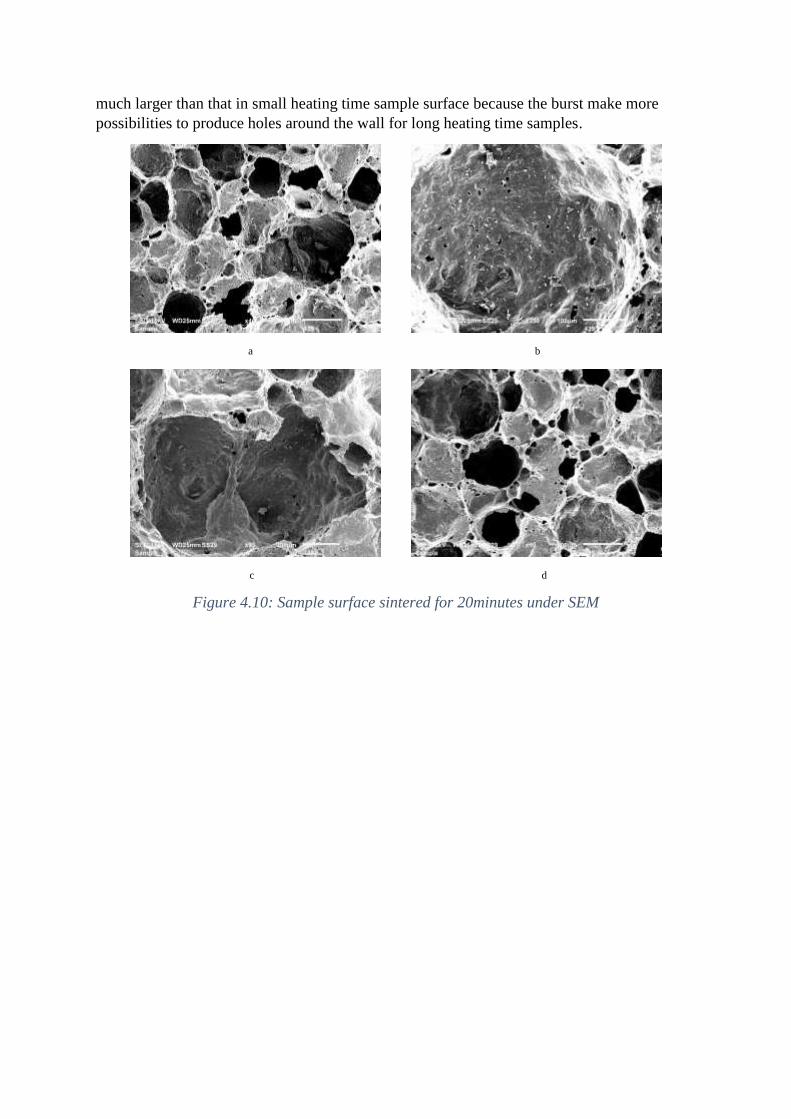
Figure 4.10 shows the sample surface which has been sintered for 20 minutes by SEM. There
are both open and close pores. There are more tiny holes around the pores’ wall in long
heating time sample surface than that in short heating time sample from Figure 4.10b. Figure
4.10c illustrates the collapse of the pores. The adjacent two pores collide with each other due
to the expansion lead to the burst of both two pores. This also coincides with the explanation
of the sample density keep constant after long heating time.
The occurrence of the tiny pores on the cell wall may be caused by two situations. One is that
the sealed glass particles at the beginning of heating is not perfect, they also have few small
holes the wall. The small holes can make the leakage of the trapped air and grow due to the
expansion. This coincides with another explanation in section 4.11. However, the tiny holes
can also occur due to the burst. When burst happens, the surface tension force may produce
the holes on the surface. The amount of those holes in long heating time sample surface is
much larger than that in small heating time sample surface because the burst make more
possibilities to produce holes around the wall for long heating time samples.
a b
c d
Figure 4.10: Sample surface sintered for 20minutes under SEM
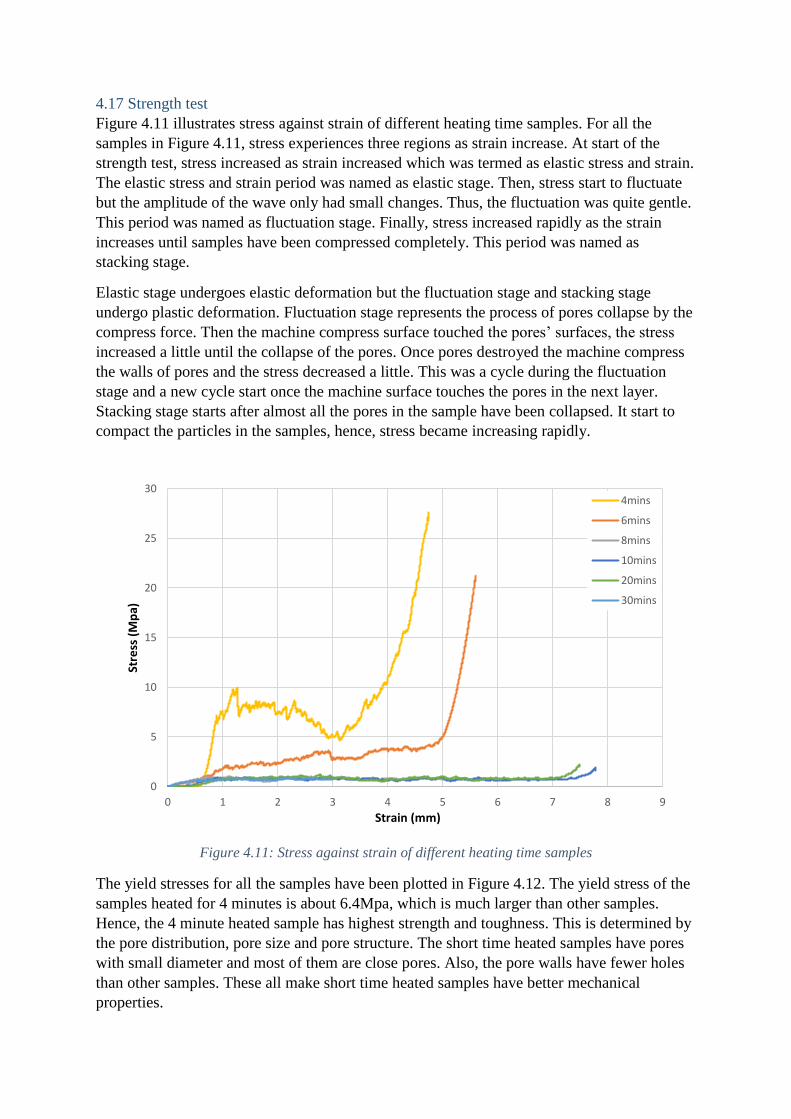
4.17 Strength test
Figure 4.11 illustrates stress against strain of different heating time samples. For all the
samples in Figure 4.11, stress experiences three regions as strain increase. At start of the
strength test, stress increased as strain increased which was termed as elastic stress and strain.
The elastic stress and strain period was named as elastic stage. Then, stress start to fluctuate
but the amplitude of the wave only had small changes. Thus, the fluctuation was quite gentle.
This period was named as fluctuation stage. Finally, stress increased rapidly as the strain
increases until samples have been compressed completely. This period was named as
stacking stage.
Elastic stage undergoes elastic deformation but the fluctuation stage and stacking stage
undergo plastic deformation. Fluctuation stage represents the process of pores collapse by the
compress force. Then the machine compress surface touched the pores’ surfaces, the stress
increased a little until the collapse of the pores. Once pores destroyed the machine compress
the walls of pores and the stress decreased a little. This was a cycle during the fluctuation
stage and a new cycle start once the machine surface touches the pores in the next layer.
Stacking stage starts after almost all the pores in the sample have been collapsed. It start to
compact the particles in the samples, hence, stress became increasing rapidly.
Figure 4.11: Stress against strain of different heating time samples
The yield stresses for all the samples have been plotted in Figure 4.12. The yield stress of the
samples heated for 4 minutes is about 6.4Mpa, which is much larger than other samples.
Hence, the 4 minute heated sample has highest strength and toughness. This is determined by
the pore distribution, pore size and pore structure. The short time heated samples have pores
with small diameter and most of them are close pores. Also, the pore walls have fewer holes
than other samples. These all make short time heated samples have better mechanical
properties.
0
5
10
15
20
25
30
0 1 2 3 4 5 6 7 8 9
Stre
ss (
Mp
a)
Strain (mm)
4mins
6mins
8mins
10mins
20mins
30mins
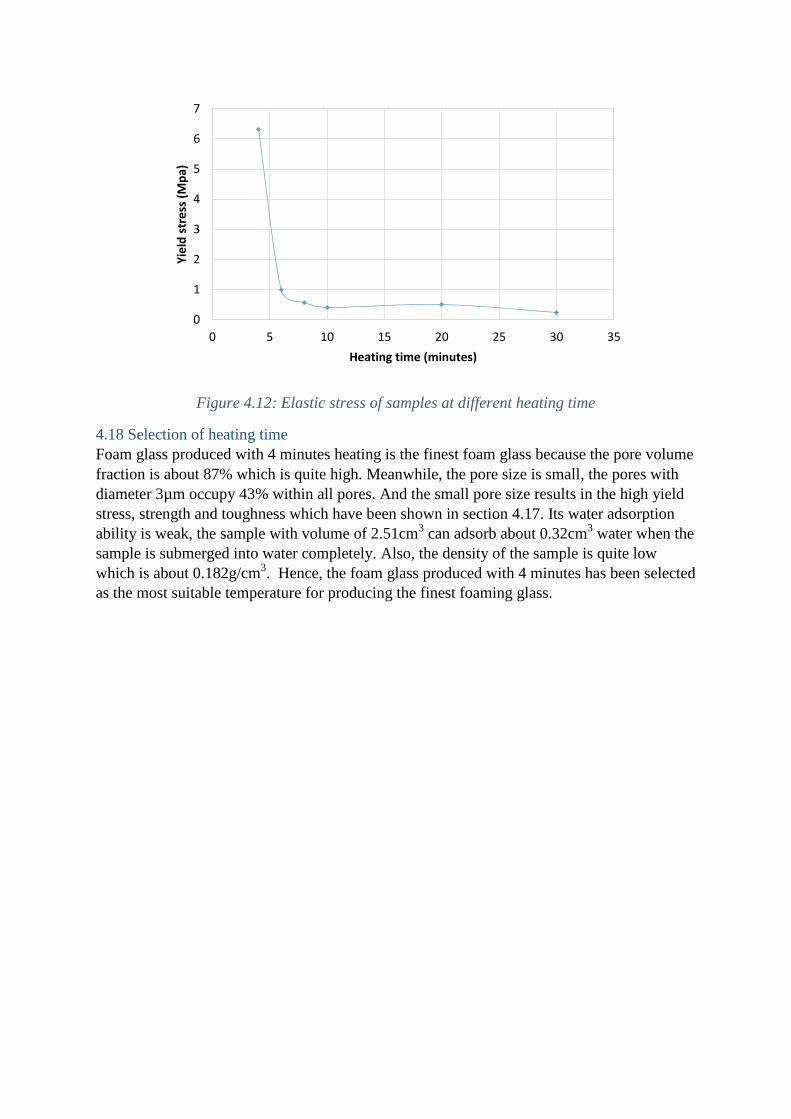
Figure 4.12: Elastic stress of samples at different heating time
4.18 Selection of heating time
Foam glass produced with 4 minutes heating is the finest foam glass because the pore volume
fraction is about 87% which is quite high. Meanwhile, the pore size is small, the pores with
diameter 3µm occupy 43% within all pores. And the small pore size results in the high yield
stress, strength and toughness which have been shown in section 4.17. Its water adsorption
ability is weak, the sample with volume of 2.51cm3 can adsorb about 0.32cm
3 water when the
sample is submerged into water completely. Also, the density of the sample is quite low
which is about 0.182g/cm3. Hence, the foam glass produced with 4 minutes has been selected
as the most suitable temperature for producing the finest foaming glass.
0
1
2
3
4
5
6
7
0 5 10 15 20 25 30 35
Yie
ld s
tre
ss (
Mp
a)
Heating time (minutes)
4.2 Glass powder particle size control
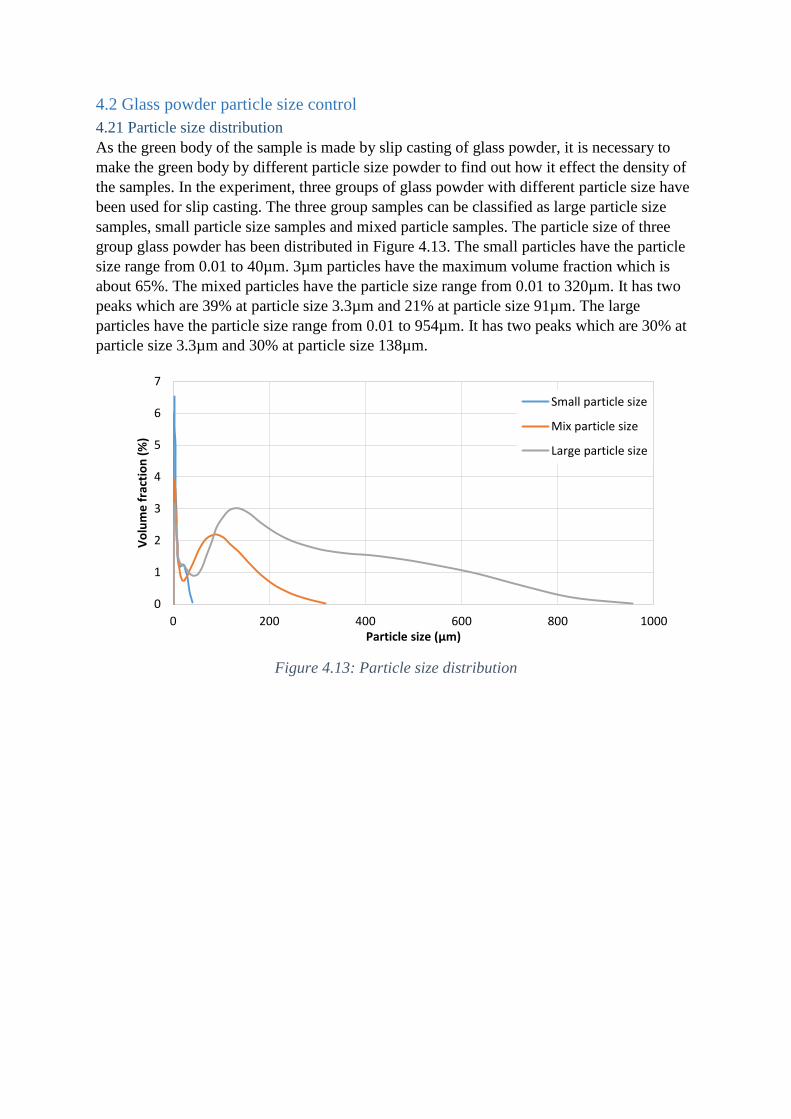
4.21 Particle size distribution
As the green body of the sample is made by slip casting of glass powder, it is necessary to
make the green body by different particle size powder to find out how it effect the density of
the samples. In the experiment, three groups of glass powder with different particle size have
been used for slip casting. The three group samples can be classified as large particle size
samples, small particle size samples and mixed particle samples. The particle size of three
group glass powder has been distributed in Figure 4.13. The small particles have the particle
size range from 0.01 to 40µm. 3µm particles have the maximum volume fraction which is
about 65%. The mixed particles have the particle size range from 0.01 to 320µm. It has two
peaks which are 39% at particle size 3.3µm and 21% at particle size 91µm. The large
particles have the particle size range from 0.01 to 954µm. It has two peaks which are 30% at
particle size 3.3µm and 30% at particle size 138µm.
Figure 4.13: Particle size distribution
0
1
2
3
4
5
6
7
0 200 400 600 800 1000
Vo
lum
e f
ract
ion
(%
)
Particle size (µm)
Small particle size
Mix particle size
Large particle size
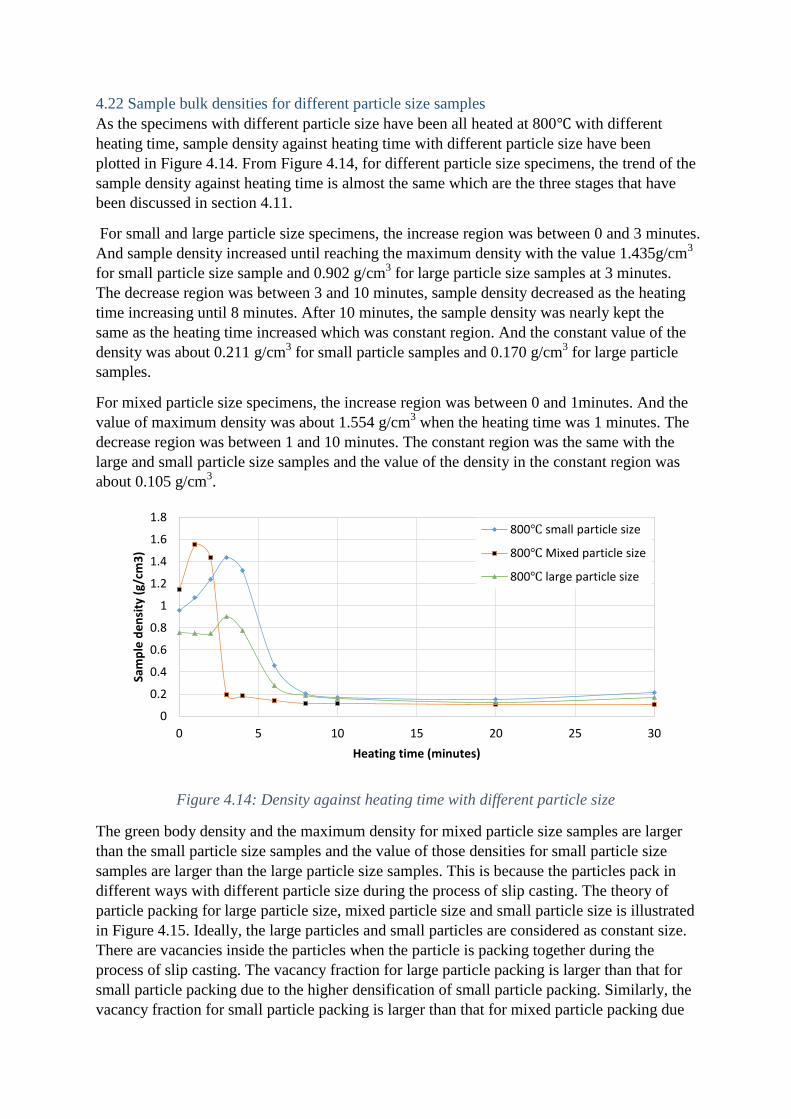
4.22 Sample bulk densities for different particle size samples
As the specimens with different particle size have been all heated at 800℃ with different
heating time, sample density against heating time with different particle size have been
plotted in Figure 4.14. From Figure 4.14, for different particle size specimens, the trend of the
sample density against heating time is almost the same which are the three stages that have
been discussed in section 4.11.
For small and large particle size specimens, the increase region was between 0 and 3 minutes.
And sample density increased until reaching the maximum density with the value 1.435g/cm3
for small particle size sample and 0.902 g/cm3 for large particle size samples at 3 minutes.
The decrease region was between 3 and 10 minutes, sample density decreased as the heating
time increasing until 8 minutes. After 10 minutes, the sample density was nearly kept the
same as the heating time increased which was constant region. And the constant value of the
density was about 0.211 g/cm3 for small particle samples and 0.170 g/cm
3 for large particle
samples.
For mixed particle size specimens, the increase region was between 0 and 1minutes. And the
value of maximum density was about 1.554 g/cm3 when the heating time was 1 minutes. The
decrease region was between 1 and 10 minutes. The constant region was the same with the
large and small particle size samples and the value of the density in the constant region was
about 0.105 g/cm3.
Figure 4.14: Density against heating time with different particle size
The green body density and the maximum density for mixed particle size samples are larger
than the small particle size samples and the value of those densities for small particle size
samples are larger than the large particle size samples. This is because the particles pack in
different ways with different particle size during the process of slip casting. The theory of
particle packing for large particle size, mixed particle size and small particle size is illustrated
in Figure 4.15. Ideally, the large particles and small particles are considered as constant size.
There are vacancies inside the particles when the particle is packing together during the
process of slip casting. The vacancy fraction for large particle packing is larger than that for
small particle packing due to the higher densification of small particle packing. Similarly, the
vacancy fraction for small particle packing is larger than that for mixed particle packing due
0
0.2
0.4
0.6
0.8
1
1.2
1.4
1.6
1.8
0 5 10 15 20 25 30
Sam
ple
de
nsi
ty (
g/cm
3)
Heating time (minutes)
800℃ small particle size
800℃ Mixed particle size
800℃ large particle size
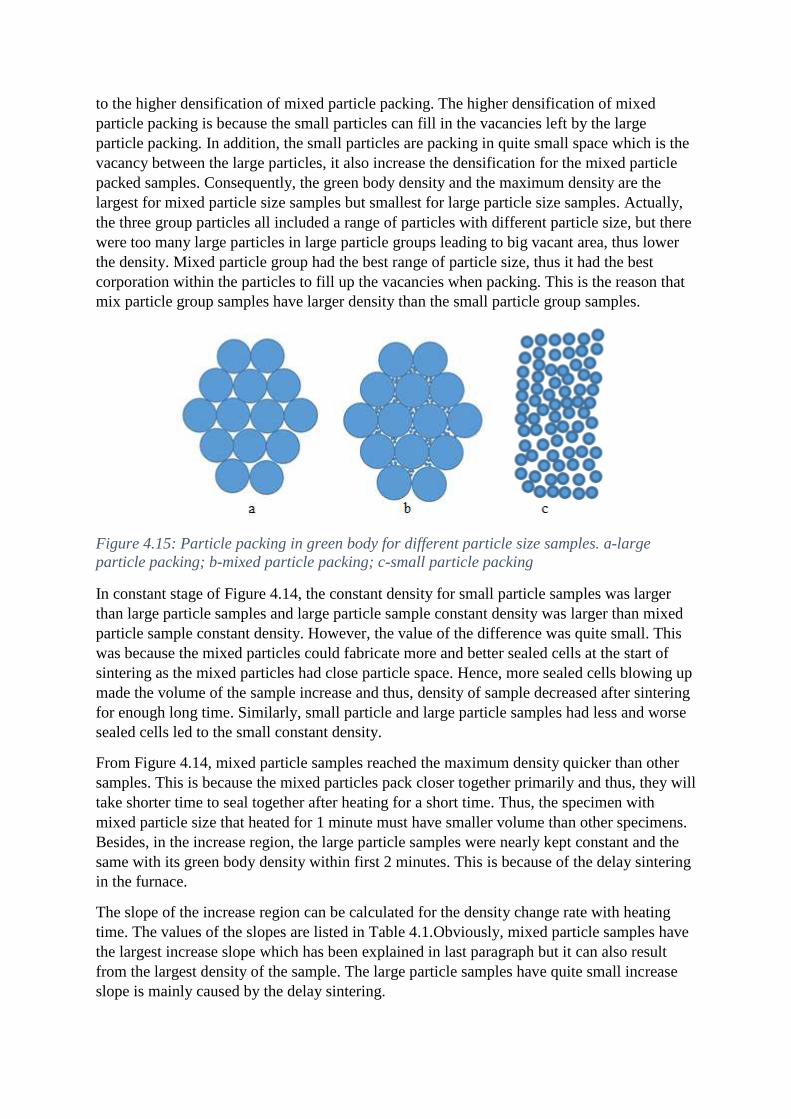
to the higher densification of mixed particle packing. The higher densification of mixed
particle packing is because the small particles can fill in the vacancies left by the large
particle packing. In addition, the small particles are packing in quite small space which is the
vacancy between the large particles, it also increase the densification for the mixed particle
packed samples. Consequently, the green body density and the maximum density are the
largest for mixed particle size samples but smallest for large particle size samples. Actually,
the three group particles all included a range of particles with different particle size, but there
were too many large particles in large particle groups leading to big vacant area, thus lower
the density. Mixed particle group had the best range of particle size, thus it had the best
corporation within the particles to fill up the vacancies when packing. This is the reason that
mix particle group samples have larger density than the small particle group samples.
Figure 4.15: Particle packing in green body for different particle size samples. a-large
particle packing; b-mixed particle packing; c-small particle packing
In constant stage of Figure 4.14, the constant density for small particle samples was larger
than large particle samples and large particle sample constant density was larger than mixed
particle sample constant density. However, the value of the difference was quite small. This
was because the mixed particles could fabricate more and better sealed cells at the start of
sintering as the mixed particles had close particle space. Hence, more sealed cells blowing up
made the volume of the sample increase and thus, density of sample decreased after sintering
for enough long time. Similarly, small particle and large particle samples had less and worse
sealed cells led to the small constant density.
From Figure 4.14, mixed particle samples reached the maximum density quicker than other
samples. This is because the mixed particles pack closer together primarily and thus, they will
take shorter time to seal together after heating for a short time. Thus, the specimen with
mixed particle size that heated for 1 minute must have smaller volume than other specimens.
Besides, in the increase region, the large particle samples were nearly kept constant and the
same with its green body density within first 2 minutes. This is because of the delay sintering
in the furnace.
The slope of the increase region can be calculated for the density change rate with heating
time. The values of the slopes are listed in Table 4.1.Obviously, mixed particle samples have
the largest increase slope which has been explained in last paragraph but it can also result
from the largest density of the sample. The large particle samples have quite small increase
slope is mainly caused by the delay sintering.

Samples Increase slope (𝐠/𝐜𝐦𝟑
𝒎𝒊𝒏𝒔)
Small particle
samples
0.158531
Mixed particle
samples
0.409344
Large particle
samples
0.049064
Table 4.1: Increase and decrease slopes
To demonstrate how the sample densities change with particle size, sample density against
particle size during the same heating time at 800℃ has been plotted in Figure 4.16. In the
horizontal axis, the value 0, 1, 2 represent small particle size, mixed particle size and large
particle size separately. When heating time was below 3 minutes, mixed particle size sample
density was the largest and large particle size density was the smallest. When heating time
was between 3 and 6 minutes, small particle size sample density was the largest and mixed
particle size density was the smallest. When heating time was after 6 minutes, all the samples
had nearly the same density.
Figure 4.16: Density against particle size during the same heating time
4.23 Selection of particle size
The fine foam glass produced with mixed particle sample has lower density than the sample
with small particles and large particles. Therefore, the sample has the lowest weight when
making the same size fine foam glass. Mixed particle fine foam glass is chosen in advance for
large scale production. Hence, mixed particle size has been selected as the most suitable glass
powder size for producing finest foaming glass.
0
0.2
0.4
0.6
0.8
1
1.2
1.4
1.6
1.8
0 1 2 3 4
Sam
ple
de
nsi
ty (
g/cm
3)
Particle size
Green body
Heating for 1 minutes
Heating for 2 minutes
Heating for 3 minutes
Heating for4 minutes
Heating for 6 minutes
Heating for 8 minutes
Heating for 10 minutes
Heating for 20 minutes
Heating for 30 minutes
4.3 Moisture control
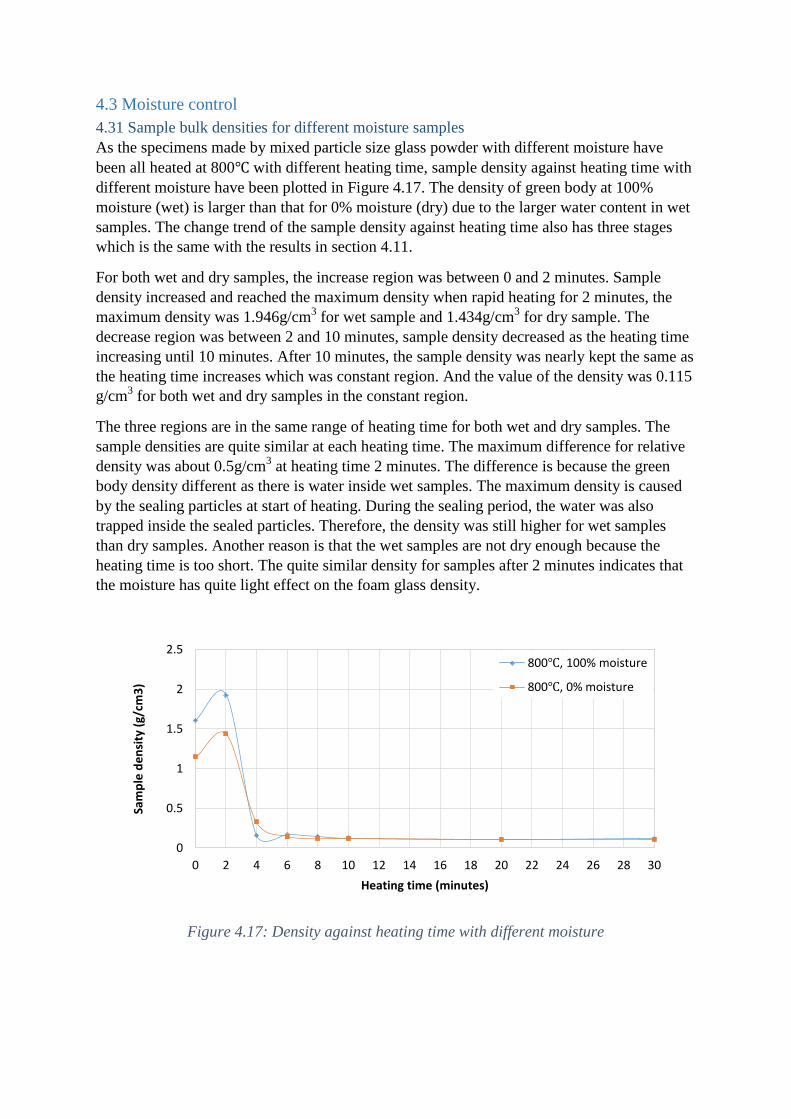
4.31 Sample bulk densities for different moisture samples
As the specimens made by mixed particle size glass powder with different moisture have
been all heated at 800℃ with different heating time, sample density against heating time with
different moisture have been plotted in Figure 4.17. The density of green body at 100%
moisture (wet) is larger than that for 0% moisture (dry) due to the larger water content in wet
samples. The change trend of the sample density against heating time also has three stages
which is the same with the results in section 4.11.
For both wet and dry samples, the increase region was between 0 and 2 minutes. Sample
density increased and reached the maximum density when rapid heating for 2 minutes, the
maximum density was 1.946g/cm3 for wet sample and 1.434g/cm
3 for dry sample. The
decrease region was between 2 and 10 minutes, sample density decreased as the heating time
increasing until 10 minutes. After 10 minutes, the sample density was nearly kept the same as
the heating time increases which was constant region. And the value of the density was 0.115
g/cm3 for both wet and dry samples in the constant region.
The three regions are in the same range of heating time for both wet and dry samples. The
sample densities are quite similar at each heating time. The maximum difference for relative
density was about 0.5g/cm3 at heating time 2 minutes. The difference is because the green
body density different as there is water inside wet samples. The maximum density is caused
by the sealing particles at start of heating. During the sealing period, the water was also
trapped inside the sealed particles. Therefore, the density was still higher for wet samples
than dry samples. Another reason is that the wet samples are not dry enough because the
heating time is too short. The quite similar density for samples after 2 minutes indicates that
the moisture has quite light effect on the foam glass density.
Figure 4.17: Density against heating time with different moisture
0
0.5
1
1.5
2
2.5
0 2 4 6 8 10 12 14 16 18 20 22 24 26 28 30
Sam
ple
de
nsi
ty (
g/cm
3)
Heating time (minutes)
800℃, 100% moisture
800℃, 0% moisture
The slope of the increase region and decrease region can be calculated for the density change
rate with heating time. The values of the slopes are listed in Table 4.2. The wet and dry
samples have nearly the same value of density increase rate and decrease rate.
Samples Increase slope (𝐠/𝐜𝐦𝟑
𝒎𝒊𝒏𝒔) Decrease slope (
𝐠/𝐜𝐦𝟑
𝒎𝒊𝒏𝒔)
Wet samples 0.159381 -0.44043
Dry samples 0.144513
-0.32379
Table 4.2: Increase and decrease slopes
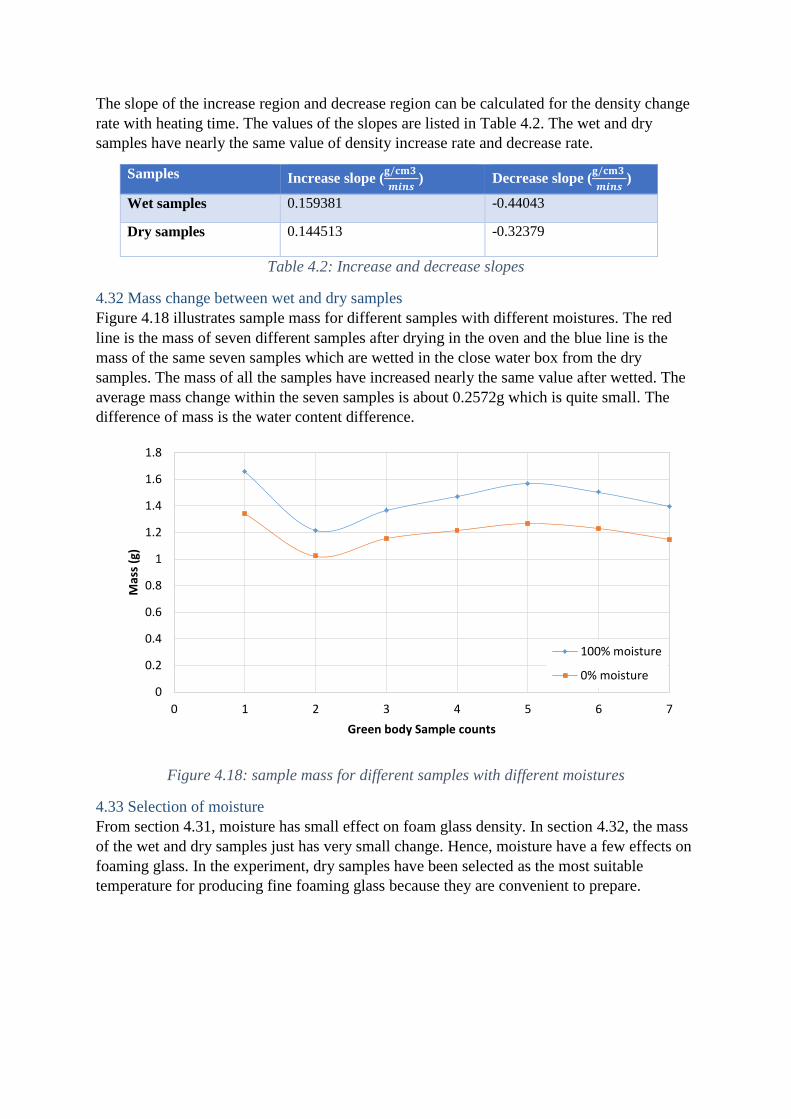
4.32 Mass change between wet and dry samples
Figure 4.18 illustrates sample mass for different samples with different moistures. The red
line is the mass of seven different samples after drying in the oven and the blue line is the
mass of the same seven samples which are wetted in the close water box from the dry
samples. The mass of all the samples have increased nearly the same value after wetted. The
average mass change within the seven samples is about 0.2572g which is quite small. The
difference of mass is the water content difference.
Figure 4.18: sample mass for different samples with different moistures
4.33 Selection of moisture
From section 4.31, moisture has small effect on foam glass density. In section 4.32, the mass
of the wet and dry samples just has very small change. Hence, moisture have a few effects on
foaming glass. In the experiment, dry samples have been selected as the most suitable
temperature for producing fine foaming glass because they are convenient to prepare.
0
0.2
0.4
0.6
0.8
1
1.2
1.4
1.6
1.8
0 1 2 3 4 5 6 7
Mas
s (g
)
Green body Sample counts
100% moisture
0% moisture
4.4 Heating temperature control
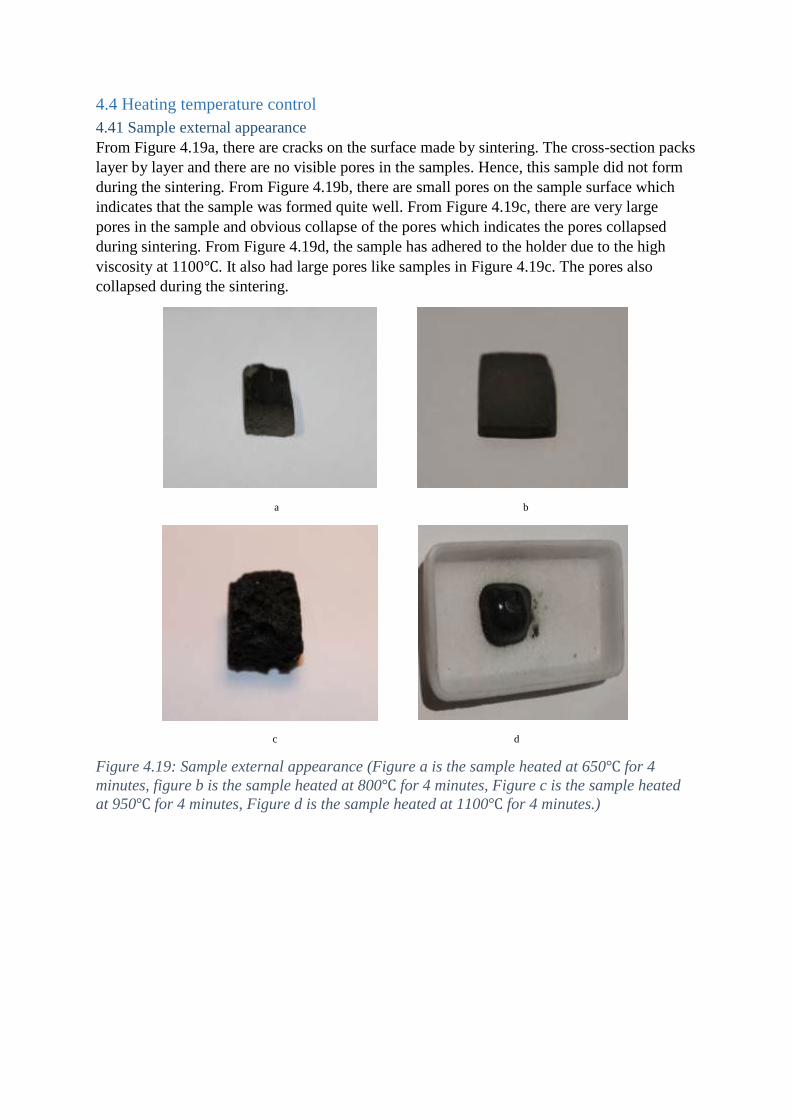
4.41 Sample external appearance
From Figure 4.19a, there are cracks on the surface made by sintering. The cross-section packs
layer by layer and there are no visible pores in the samples. Hence, this sample did not form
during the sintering. From Figure 4.19b, there are small pores on the sample surface which
indicates that the sample was formed quite well. From Figure 4.19c, there are very large
pores in the sample and obvious collapse of the pores which indicates the pores collapsed
during sintering. From Figure 4.19d, the sample has adhered to the holder due to the high
viscosity at 1100℃. It also had large pores like samples in Figure 4.19c. The pores also
collapsed during the sintering.
a b
c d
Figure 4.19: Sample external appearance (Figure a is the sample heated at 650℃ for 4
minutes, figure b is the sample heated at 800℃ for 4 minutes, Figure c is the sample heated
at 950℃ for 4 minutes, Figure d is the sample heated at 1100℃ for 4 minutes.)
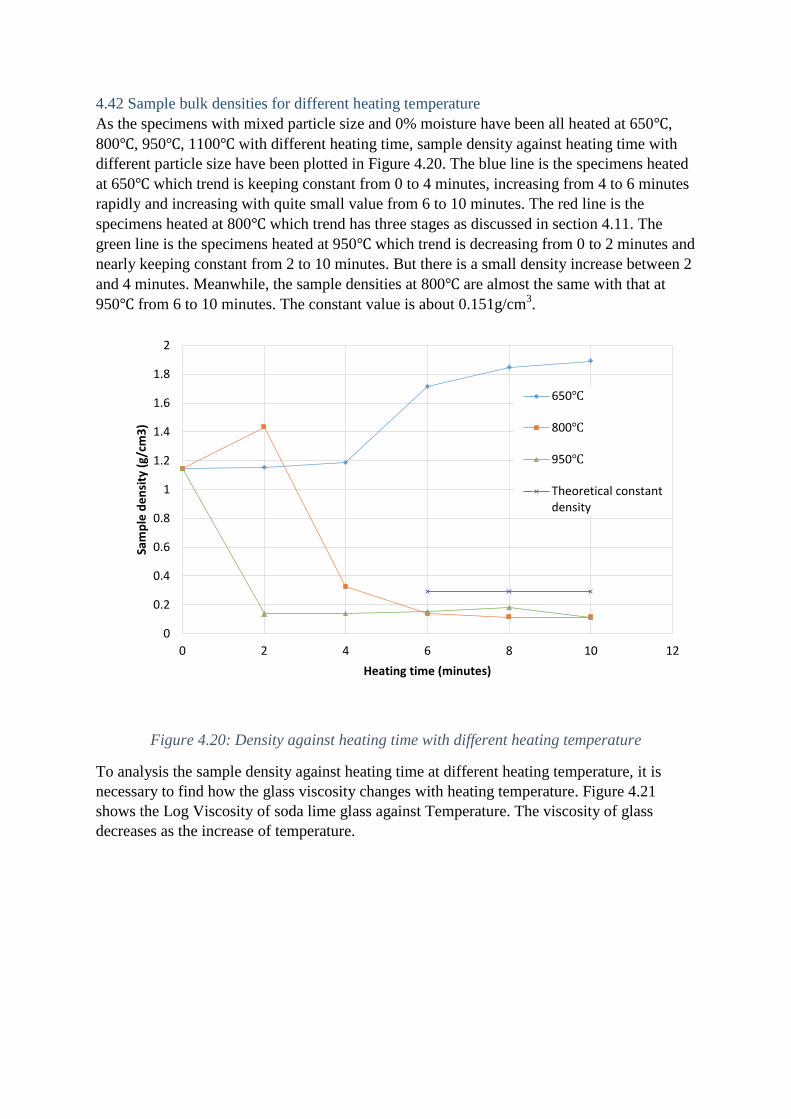
4.42 Sample bulk densities for different heating temperature
As the specimens with mixed particle size and 0% moisture have been all heated at 650℃,
800℃, 950℃, 1100℃ with different heating time, sample density against heating time with
different particle size have been plotted in Figure 4.20. The blue line is the specimens heated
at 650℃ which trend is keeping constant from 0 to 4 minutes, increasing from 4 to 6 minutes
rapidly and increasing with quite small value from 6 to 10 minutes. The red line is the
specimens heated at 800℃ which trend has three stages as discussed in section 4.11. The
green line is the specimens heated at 950℃ which trend is decreasing from 0 to 2 minutes and
nearly keeping constant from 2 to 10 minutes. But there is a small density increase between 2
and 4 minutes. Meanwhile, the sample densities at 800℃ are almost the same with that at
950℃ from 6 to 10 minutes. The constant value is about 0.151g/cm3.
Figure 4.20: Density against heating time with different heating temperature
To analysis the sample density against heating time at different heating temperature, it is
necessary to find how the glass viscosity changes with heating temperature. Figure 4.21
shows the Log Viscosity of soda lime glass against Temperature. The viscosity of glass
decreases as the increase of temperature.
0
0.2
0.4
0.6
0.8
1
1.2
1.4
1.6
1.8
2
0 2 4 6 8 10 12
Sam
ple
de
nsi
ty (
g/cm
3)
Heating time (minutes)
650℃
800℃
950℃
Theoretical constantdensity
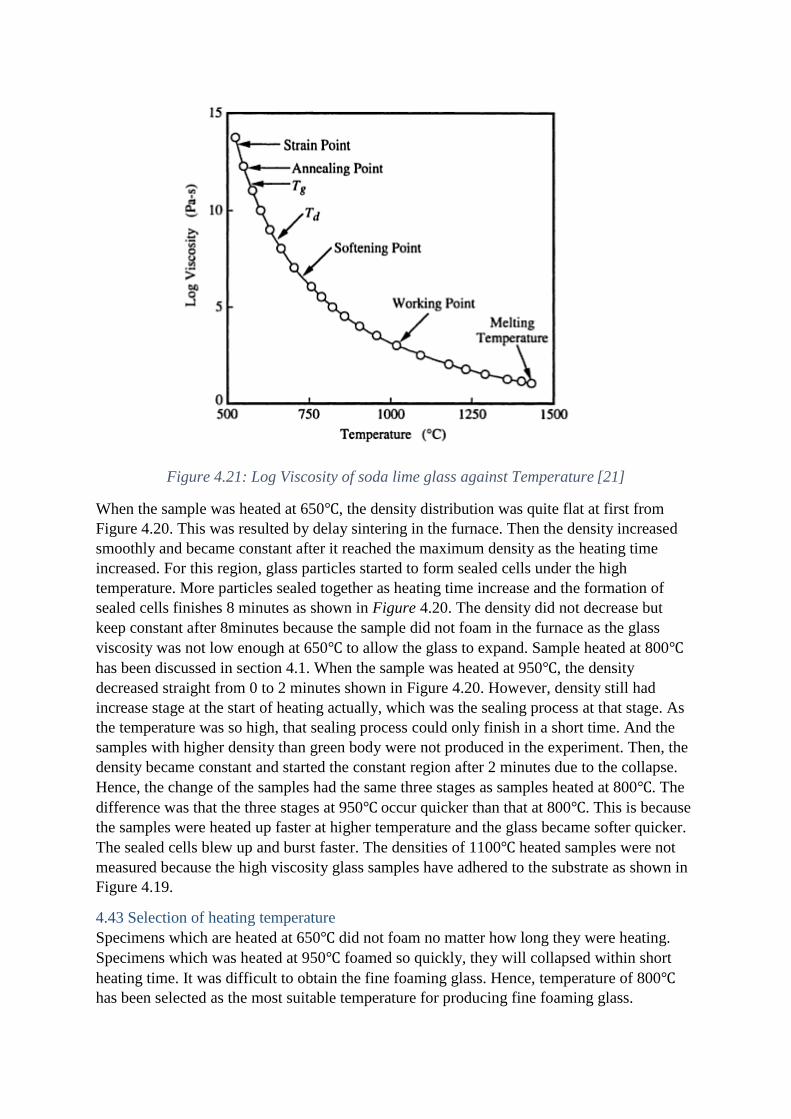
Figure 4.21: Log Viscosity of soda lime glass against Temperature [21]
When the sample was heated at 650℃, the density distribution was quite flat at first from
Figure 4.20. This was resulted by delay sintering in the furnace. Then the density increased
smoothly and became constant after it reached the maximum density as the heating time
increased. For this region, glass particles started to form sealed cells under the high
temperature. More particles sealed together as heating time increase and the formation of
sealed cells finishes 8 minutes as shown in Figure 4.20. The density did not decrease but
keep constant after 8minutes because the sample did not foam in the furnace as the glass
viscosity was not low enough at 650℃ to allow the glass to expand. Sample heated at 800℃
has been discussed in section 4.1. When the sample was heated at 950℃, the density
decreased straight from 0 to 2 minutes shown in Figure 4.20. However, density still had
increase stage at the start of heating actually, which was the sealing process at that stage. As
the temperature was so high, that sealing process could only finish in a short time. And the
samples with higher density than green body were not produced in the experiment. Then, the
density became constant and started the constant region after 2 minutes due to the collapse.
Hence, the change of the samples had the same three stages as samples heated at 800℃. The
difference was that the three stages at 950℃ occur quicker than that at 800℃. This is because
the samples were heated up faster at higher temperature and the glass became softer quicker.
The sealed cells blew up and burst faster. The densities of 1100℃ heated samples were not
measured because the high viscosity glass samples have adhered to the substrate as shown in
Figure 4.19.
4.43 Selection of heating temperature
Specimens which are heated at 650℃ did not foam no matter how long they were heating.
Specimens which was heated at 950℃ foamed so quickly, they will collapsed within short
heating time. It was difficult to obtain the fine foaming glass. Hence, temperature of 800℃
has been selected as the most suitable temperature for producing fine foaming glass.
4.5 Summary and analysis the determination of density value
Density analysed in this chapter focus on the samples that have foamed successfully. Only
the foamed glass has the trend include three stages discussed in section 4.11.
4.51 Maximum density
The maximum density occurred when the particle sealed together to form sealed cells and
that stage usually appears at very short heating time. The maximum density is determined by
the green body density. Maximum density increases with the green body density. And green
body density is determined by glass powder particle size and moisture. Mixed particle
powder (0.01-330𝜇m) and high moisture lead to high green body density. Large particle
powder (0.01-954 𝜇m) and low moisture lead to low green body. The reason has been
explained in section 4.22 and section 4.31. Temperature does not influence the maximum
value a lot but it will make the sealing process quicker which means samples will reach
maximum density with short heating time. This is because the samples are heated up faster at
higher temperature and the glass become softer quicker. The sealing process becomes faster.
The particle size will also influence the speed of sealing process. The mixed particle samples
reached the maximum density faster than other samples as shown in Figure 4.14. This is
because the mixed particles pack closer together and thus, they will take shorter time to seal
together.
4.52 Constant density
The maximum density occurs when the blown up cells have burst completely and that stage
appears at long heating time. The value of the constant density is influenced by the particle
size. Mixed particle specimen lead to lower density due to more and better sealed cells have
fabricated at the start of heating.
For the same particle samples, they have nearly the same constant densities which have been
listed in Table 4.3. They are the experimental constant densities. However, constant densities
can also be obtained by calculations which can be termed as theoretical constant densities.
From Figure 4.6 in section 4.14, the geometry of the pores is similar with dodecahedron.
Therefore dodecahedron can replace the pores to calculate the theoretical constant density.
The geometry of dodecahedron is show in Figure 4.22. Figure 4.22a is one sealed cell and
Figure 4.22b is the flowed up cell which is going to burst immediately. The density of sealed
cell is the theoretical maximum sample density and the density of flowed up cell is the
theoretical constant density. The rate of theoretical constant density over theoretical
maximum density is 0.204 after the calculation in the appendix. Hence, the theoretical
constant density equals to 0.293g/cm3 which have been plotted in Figure 4.20. The theoretical
constant density is very close to the experimental constant density. The difference is because
of the imperfection of the pore geometry of the sample during the experiment.

a b
Figure 4.22: Geometry of dodecahedron [22]
Variations High moisture
samples
(100%)
Low
moisture
samples
(0%)
High
temperature
samples (950℃)
Low
temperature
samples (800℃)
Experimental
constant
densities (g/cm3)
0.1152 0.1054 0.1104 0.1156
Theoretical
constant
densities (g/cm3)
0.293 0.293 0.293 0.293
Table 4.3: Constant densities with different variations
From Figure 4.14 and Figure 4.17, particle size and moisture do not influence the time for
reaching the constant value because the constant stages start at 10 minutes for all particle size
and moisture samples. However, higher heating temperature make the sample density reach
the constant region faster because the samples are heated up faster at higher temperature and
the glass become softer quicker. The sealed cells blow up and burst faster.
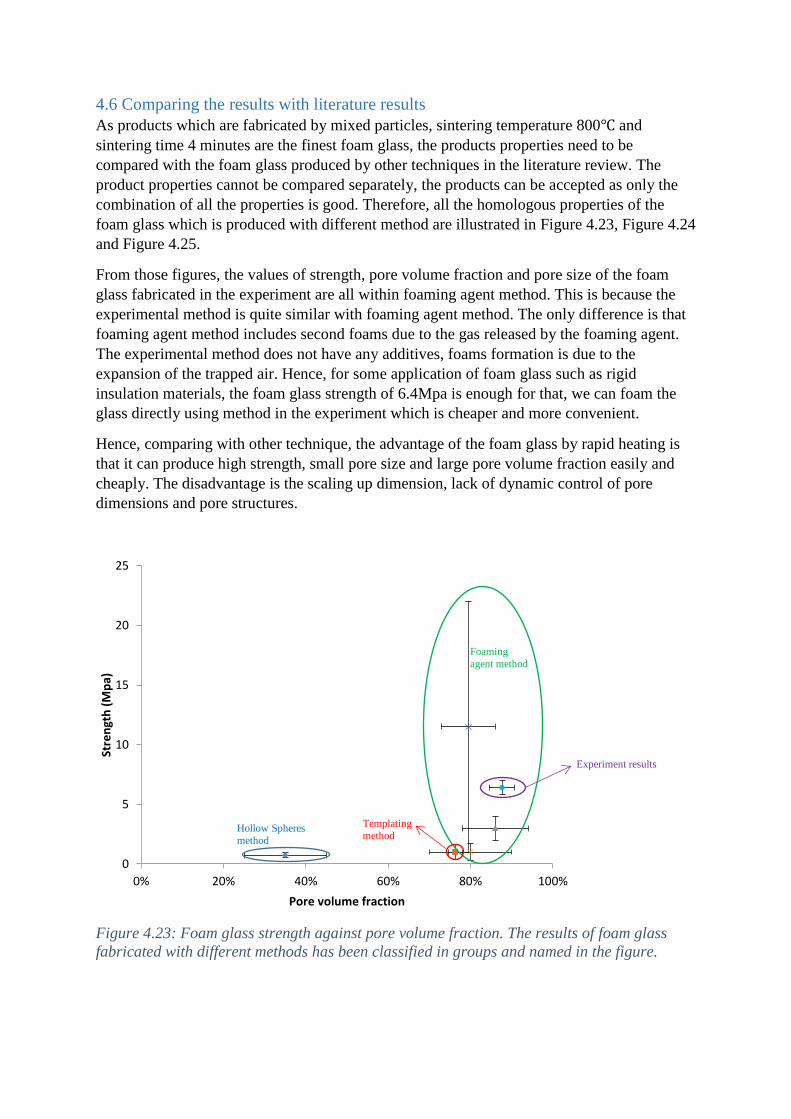
4.6 Comparing the results with literature results
As products which are fabricated by mixed particles, sintering temperature 800℃ and
sintering time 4 minutes are the finest foam glass, the products properties need to be
compared with the foam glass produced by other techniques in the literature review. The
product properties cannot be compared separately, the products can be accepted as only the
combination of all the properties is good. Therefore, all the homologous properties of the
foam glass which is produced with different method are illustrated in Figure 4.23, Figure 4.24
and Figure 4.25.
From those figures, the values of strength, pore volume fraction and pore size of the foam
glass fabricated in the experiment are all within foaming agent method. This is because the
experimental method is quite similar with foaming agent method. The only difference is that
foaming agent method includes second foams due to the gas released by the foaming agent.
The experimental method does not have any additives, foams formation is due to the
expansion of the trapped air. Hence, for some application of foam glass such as rigid
insulation materials, the foam glass strength of 6.4Mpa is enough for that, we can foam the
glass directly using method in the experiment which is cheaper and more convenient.
Hence, comparing with other technique, the advantage of the foam glass by rapid heating is
that it can produce high strength, small pore size and large pore volume fraction easily and
cheaply. The disadvantage is the scaling up dimension, lack of dynamic control of pore
dimensions and pore structures.
Figure 4.23: Foam glass strength against pore volume fraction. The results of foam glass
fabricated with different methods has been classified in groups and named in the figure.
0
5
10
15
20
25
0% 20% 40% 60% 80% 100%
Stre
ngt
h (
Mp
a)
Pore volume fraction
Hollow Spheres
method
Foaming
agent method
Templating
method
Experiment results
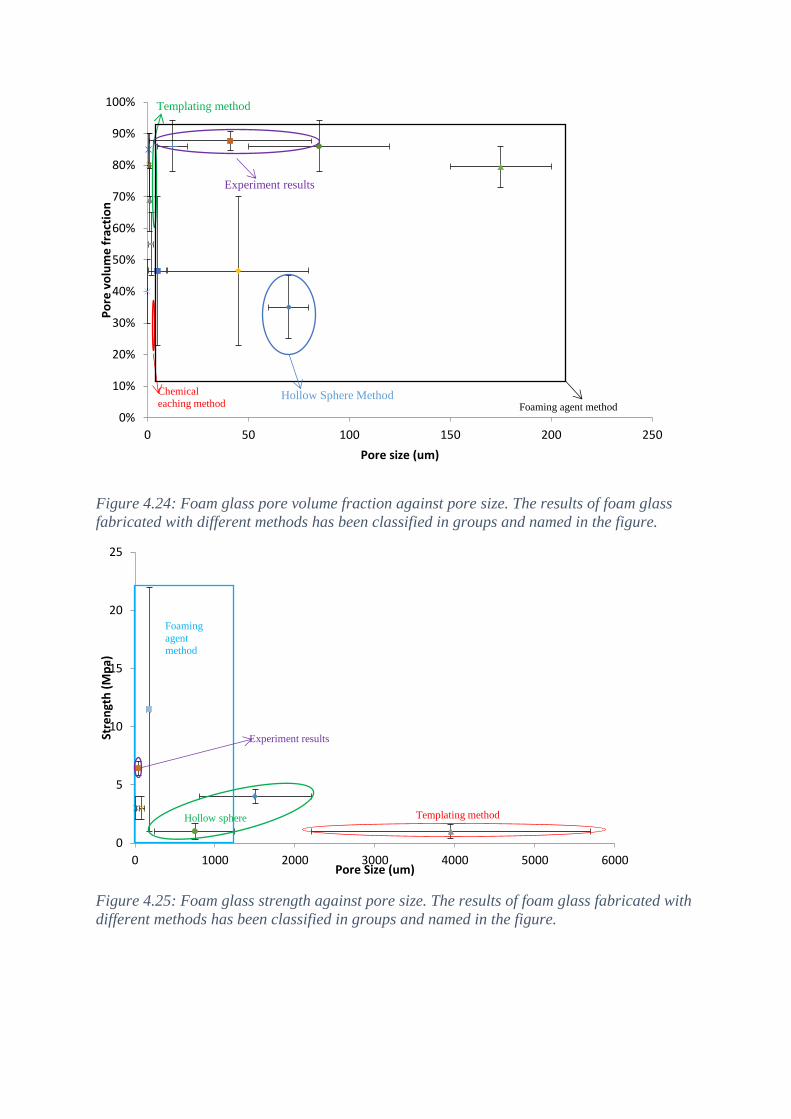
Figure 4.24: Foam glass pore volume fraction against pore size. The results of foam glass
fabricated with different methods has been classified in groups and named in the figure.
Figure 4.25: Foam glass strength against pore size. The results of foam glass fabricated with
different methods has been classified in groups and named in the figure.
0%
10%
20%
30%
40%
50%
60%
70%
80%
90%
100%
0 50 100 150 200 250
Po
re v
olu
me
fra
ctio
n
Pore size (um)
Templating method
Chemical
eaching method Hollow Sphere Method
Foaming agent method
Experiment results
0
5
10
15
20
25
0 1000 2000 3000 4000 5000 6000
Stre
ngt
h (
Mp
a)
Pore Size (um)
Foaming
agent
method
Hollow sphere Templating method
Experiment results

5. Conclusion
6. Future work
7. Reference
8. Appendix
Related Documents