Departamento de Mineralogía y Petrología Facultad de Ciencia y Tecnología UPV/EHU DESARROLLO DE PIGMENTOS CERÁMICOS MULTIFUNCIONALES ORIENTADOS A LA MEJORA DE LA EFICIENCIA ENERGÉTICA EN EDIFICACIÓN MEMORIA presentada por Estíbaliz Aranzabe Basterrechea Para optar al grado de Doctora por la UPV/EHU Leioa, Diciembre 2016 (cc)2016 ESTIBALIZ ARANZABE BASTERRECHEA (cc by 4.0)

Welcome message from author
This document is posted to help you gain knowledge. Please leave a comment to let me know what you think about it! Share it to your friends and learn new things together.
Transcript
Departamento de Mineralogía y Petrología
Facultad de Ciencia y Tecnología
UPV/EHU
DESARROLLO DE PIGMENTOS CERÁMICOS
MULTIFUNCIONALES ORIENTADOS A LA MEJORA DE
LA EFICIENCIA ENERGÉTICA EN EDIFICACIÓN
MEMORIA presentada por Estíbaliz Aranzabe Basterrechea
Para optar al grado de Doctora por la UPV/EHU
Leioa, Diciembre 2016
(cc)2016 ESTIBALIZ ARANZABE BASTERRECHEA (cc by 4.0)
Desarrollo de Pigmentos Cerámicos Multifuncionales
Orientados a la Mejora de la Eficiencia Energética en
Edificación
Tesis Doctoral
Estíbaliz Aranzabe Basterrechea
Directoras
Dra. María Isabel Arriortua Marcaida- Dra. Ana Aranzabe García
(UPV/EHU) IK4-TEKNIKER

A mis padres,
A Arrate.

│i
Agradecimientos
Llevo tiempo imaginando cómo completar esta hoja en blanco y ahora la encuentro tan
vacía como a mí misma. Vacía porque una dimensión me impide abrazar a tres personas
que sé que hoy estarán más felices que nadie. Tres personas que me vieron empezar este
trabajo pero que no han podido verlo finalizado. Permitidme, los que tanto me habéis
ayudado, que les reserve a ellos la primera fila de mis agradecimientos.
A mis padres. Sin palabras. Por darme todas las herramientas para construir mi
felicidad. Por preocuparos y ocuparos de mi educación personal y profesional. Aita,
seguiré admirando tu inteligencia casi infinita y tu honestidad. Ama, gracias por la
dedicación absoluta que tuviste con nosotros y por querernos sin límites. Os imagino
agarrados de la mano, como siempre, y orgullosos de lo que construisteis.
A Arrate. Dicen que los cuentos de princesas siempre tienen un final feliz. Tal vez ese
fue el problema; tú nunca fuiste princesa…pero tampoco quisiste serlo. Inesperado y
cruel. Así lo definiste la última vez y así lo sigo sintiendo. Me quedo con tu
generosidad, nuestras risas y nuestros llantos en esos catorce años en los que
compartimos tanto. Esta tesis me duele porque la empecé contigo y por ti, y porque la
tuya quedó inacabada. Sé que hoy estarás sonriendo, como siempre lo hiciste, incluso en
los momentos de miedo y de dolor.
Comienzo ahora, la larga lista de justos y merecidos agradecimientos a todos los que me
habéis apoyado en esta locura.
A mis Directoras de Tesis (Maribel, Ana). Gracias.
Maribel, mil gracias por acogerme y por empujarme día a día. Gracias por anteponer lo
personal a lo profesional (por iniciar nuestras conversaciones siempre preguntando por
mi familia). Mi más sincera admiración por la ilusión e implicación que contagias.
Ana, mi prima, mi amiga. Gracias por enseñarme, por aconsejarme, por animarme…
siempre en el momento y con las palabras adecuadas. Admiro tu capacidad ilimitada.
Contigo al fin del mundo. Gracias por todo el valor que has aportado a este trabajo.
A Aitor Larrañaga. Gracias por casi todo. Por tu dedicación, tu interés, y lo más
importante… por tu tiempo…. gracias por cada segundo que me has regalado sin
esperar nada a cambio. Gracias también por esos ánimos cuando más los he necesitado.
Te estaré eternamente agradecida.
Gracias a la gente del Departamento de Mineralogía y Petrología de la UPV/EHU.
Gracias por hacerme siempre un hueco y estar siempre dispuestos a ayudar. Karmele,
mil gracias por estar siempre dispuesta a ayudarme. Gracias también a los compañeros
de los Servicios Generales de Investigación (SGIker) de la UPV/EHU.
Millones de gracias a la Unidad de Química de Superficies de Tekniker. A los que están
y a los que estuvieron en algún momento. De todos ellos he aprendido. Gracias por el
│ii
apoyo constante. Me siento orgullosa de lo que hemos construido estos años y orgullosa
de todas las personas que lo han construido.
Amaia, Miren. Gracias por vuestra implicación en Nanopigmy. Sin vosotras, imposible.
Gracias por darme cobertura durante mi baja maternal y por darme la seguridad de que
todo estaba en buenas manos.
Gracias también a Marta y a Miren por tirar del carro en mi ausencia, por todo el trabajo
y esfuerzo que habéis dedicado y dedicáis a la unidad.
Agradezco también a los miembros del Tribunal el haber aceptado juzgar este trabajo de
investigación.
A mis compañeros de Club (Jose, Eneko, Ana, Marta, Oscar, Charlie, Jon). Mis
favoritos… con los que comparto momentos únicos (comidas, cañitas, conversaciones,
desvaríos y discusiones varias). Charlie, no recuerdo un momento importante (bueno o
malo) en el que no hayas estado apoyándome.
A Tekniker. A las muchísimas personas que me han animado con este trabajo en algún
momento y casi siempre sin saberlo (Ane, Mercedes, Virginia, Lucía, Borja, Raquel,
Cristobal, Javi, Iban, Josean y un largo etcétera). Gracias también por las miles de
facilidades que me habéis dado para que hoy mi tesis sea una realidad.
A todos los que habéis participado en mi formación y me dejasteis huella: Javi Galarreta
en EGB (en mi querido Ibaigane), José Luis Negro y Pedro en BUP (La Salle). Gracias
también a Mentxu y Mikel por enseñarme a creer en las personas.
Gracias a mis amigos. A esos que me quieren incondicionalmente, y que sé que lo
seguirán haciendo pase lo que pase. Gracias especiales a mis chicas: Elena, Pili, María.
Gracias por todos los momentos buenos que me dais y por los que me daréis.
A mi familia. A mis hermanos Iratxe y Javier. Hemos pasado un par de años malos,
terribles… pero seguimos y seguiremos juntos. Os quiero. Gracias también a mis
sobrinos a los que adoro y a mi tía Maite que siempre está ahí en los momentos
importantes.
A mi marido, Pedro. Tú iniciaste todo esto y siento que juntos todo es alcanzable. Te
quiero hasta enfadado. Gracias por darme una vida plena y feliz, con muchas sumas y
pocas restas. Por último, gracias a mis hijos (Naia y Unai) por enseñarme a relativizarlo
todo y ver la vida con un optimismo pleno.


│iii
Resumen
El sector de la edificación y en concreto la climatización de edificios es un sector
prioritario a la hora de implementar mejoras de eficiencia energética. Así lo demuestra
la estrategia energética de la Unión Europea (objetivo 20-20-20) y la Estrategia
Energética de Euskadi 2020 que establecen claras líneas de actuación entre las cuales se
encuentra la reducción del consumo de energía en los edificios y en el hogar.
La rehabilitación de edificios se presenta como una de las claves para la
consecución de dichos objetivos y el desarrollo de materiales avanzados se convierte en
una solución potencial para la reducción de dicho consumo tanto en calefacción como
en aire acondicionado.
Desde el punto de vista de la industria química, existen varias soluciones relativas a
materiales avanzados con gran potencial para ser empleados en rehabilitación de
edificios, siendo la incorporación de materiales cambio de fase (PCM) y el empleo de
recubrimientos “fríos”, dos estrategias prioritarias.
La fabricación e incorporación de este tipo de “aditivos activos” en materiales
constructivos, presenta limitaciones relacionadas con la complejidad del proceso de
fabricación e incorporación, el coste y la mono-funcionalidad de los mismos.
Los materiales están en continua evolución, requiriéndose cada vez más
funcionalidades “extra”, generalmente alcanzables a través de la incorporación de
diferentes aditivos. La implementación de varias funcionalidades pasa, por tanto, por la
adición de varios “aditivos activos” aumentado, de este modo, la complejidad del
procesado final de los materiales.
Se presenta por ello la necesidad del desarrollo de nuevos aditivos multifuncionales
de bajo coste, que mejoren la eficiencia energética, y que su fabricación e incorporación
en los materiales finales, no conlleve procesos complejos.
En este contexto, surge la oportunidad de superar técnico-económicamente a los
pigmentos de altas prestaciones existentes, desarrollando una nueva generación de
pigmentos que provea a los materiales de las multifuncionalidades deseadas a través de
la modificación de un pigmento de bajo coste. De este modo, se lograría un nuevo tipo
de pigmento no existente en el mercado, que combine la capacidad de almacenamiento
térmico y la alta reflexión en el infrarrojo cercano, capaz de transferir dichas
funcionalidades al material en el que se dispersa, a un bajo coste y sin necesidad de
cambiar el proceso productivo del material final.

│v
Índice
1. Introducción. 1
1.1. Consumo energético. 4
1.2. Consumo energético en edificación. 6
1.3. Estrategias para la eficiencia energética en edificación. 10
1.4. Aplicación de materiales cambio de fase en construcción. 14
1.5. Empleo de recubrimientos fríos en edificación. 25
1.6. Pigmentos de altas prestaciones. 27
1.7. Proyecto Nanopigmy.
28
2. Motivación y objetivos del trabajo.
29
3. Visión global de los hallazgos.
35
4. Sección 1: Desarrollo de pigmentos con capacidad de almacenamiento
térmico.
41
4.1. More than color: pigments with thermal storage capacity; processing and
degradation behavior (Advances in Materials Physics and Chemistry 5, 171-
184 (2015)).
47
4.2. Easily scalable production process for a pigment having thermal storage
capacity (American Journal of Chemistry and Applications 2(4), 98-105
(2015)).
67
4.3. Ultramarine blue pigment with thermal storage for buildings (10th
Conference on Advanced Building Skins, Oral Contribution, Bern,
Switzerland (2015)).
81
5. Sección 2: Desarrollo de pigmentos altamente reflejantes en el infrarrojo
cercano.
95
5.1. Preparation and characterization of high NIR reflective pigments based in
ultramarine blue (Energy and Buildings 126, 170-176 (2016)).
99
5.2. Validación del pigmento con alta reflexión en el NIR a nivel de laboratorio-
Nota técnica Tekniker.
115
6. Sección 3: Desarrollo de pigmentos multifuncionales. 121
6.1. Designing multifunctional pigments for an improved energy efficiency in
buildings (Energy and Buildings- under Referees).
125
7. Resumen global de los hallazgos.
139
8. Conclusiones y perspectivas de futuro.
143
9. Bibliografía.
147
10. Técnicas instrumentales.
165
11. Anexo I: Publicaciones
12. Anexo II: Curriculum Vitae
185


1. INTRODUCCIÓN
1.1. Consumo energético.
1.2. Consumo energético en edificación.
1.3. Estrategias para la eficiencia energética en edificación.
1.4. Aplicación de materiales cambio de fase en construcción.
1.5. Empleo de recubrimientos fríos en edificación.
1.6. Pigmentos de altas prestaciones.
1.7. Proyecto Nanopigmy.

Introducción │3
_____________________________________________________________________________
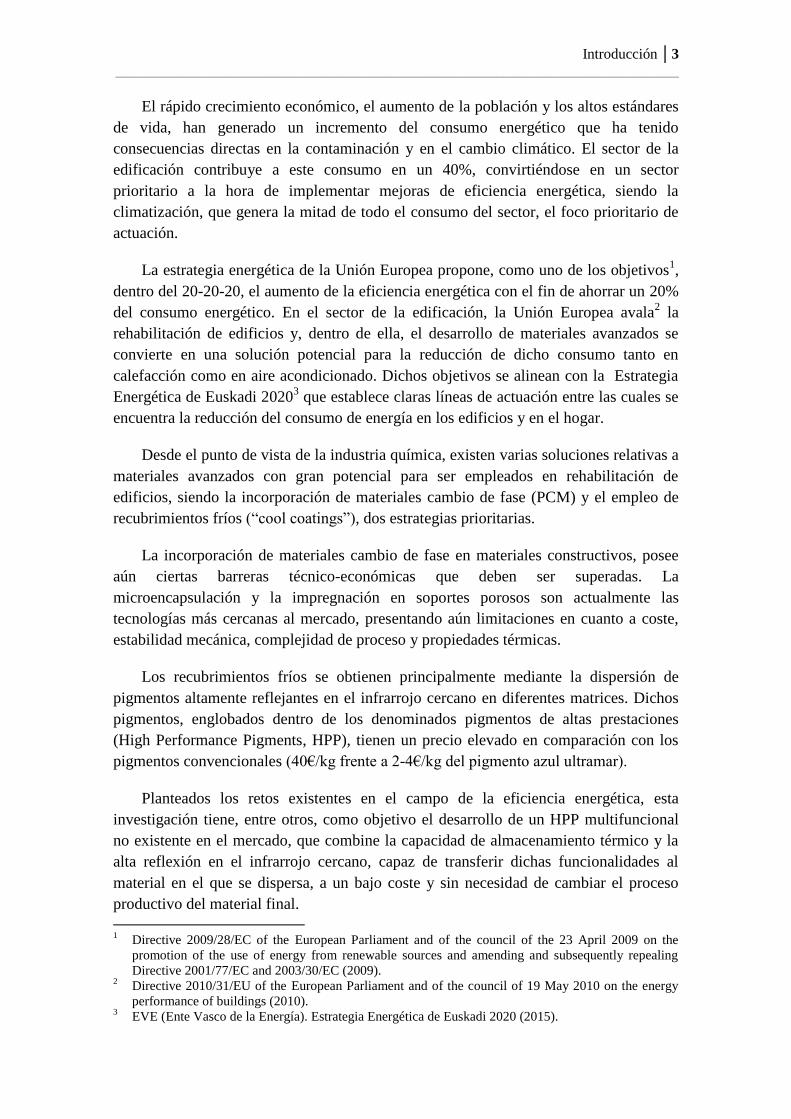
El rápido crecimiento económico, el aumento de la población y los altos estándares
de vida, han generado un incremento del consumo energético que ha tenido
consecuencias directas en la contaminación y en el cambio climático. El sector de la
edificación contribuye a este consumo en un 40%, convirtiéndose en un sector
prioritario a la hora de implementar mejoras de eficiencia energética, siendo la
climatización, que genera la mitad de todo el consumo del sector, el foco prioritario de
actuación.
La estrategia energética de la Unión Europea propone, como uno de los objetivos1,
dentro del 20-20-20, el aumento de la eficiencia energética con el fin de ahorrar un 20%
del consumo energético. En el sector de la edificación, la Unión Europea avala2 la
rehabilitación de edificios y, dentro de ella, el desarrollo de materiales avanzados se
convierte en una solución potencial para la reducción de dicho consumo tanto en
calefacción como en aire acondicionado. Dichos objetivos se alinean con la Estrategia
Energética de Euskadi 20203 que establece claras líneas de actuación entre las cuales se
encuentra la reducción del consumo de energía en los edificios y en el hogar.
Desde el punto de vista de la industria química, existen varias soluciones relativas a
materiales avanzados con gran potencial para ser empleados en rehabilitación de
edificios, siendo la incorporación de materiales cambio de fase (PCM) y el empleo de
recubrimientos fríos (“cool coatings”), dos estrategias prioritarias.
La incorporación de materiales cambio de fase en materiales constructivos, posee
aún ciertas barreras técnico-económicas que deben ser superadas. La
microencapsulación y la impregnación en soportes porosos son actualmente las
tecnologías más cercanas al mercado, presentando aún limitaciones en cuanto a coste,
estabilidad mecánica, complejidad de proceso y propiedades térmicas.
Los recubrimientos fríos se obtienen principalmente mediante la dispersión de
pigmentos altamente reflejantes en el infrarrojo cercano en diferentes matrices. Dichos
pigmentos, englobados dentro de los denominados pigmentos de altas prestaciones
(High Performance Pigments, HPP), tienen un precio elevado en comparación con los
pigmentos convencionales (40€/kg frente a 2-4€/kg del pigmento azul ultramar).
Planteados los retos existentes en el campo de la eficiencia energética, esta
investigación tiene, entre otros, como objetivo el desarrollo de un HPP multifuncional
no existente en el mercado, que combine la capacidad de almacenamiento térmico y la
alta reflexión en el infrarrojo cercano, capaz de transferir dichas funcionalidades al
material en el que se dispersa, a un bajo coste y sin necesidad de cambiar el proceso
productivo del material final.
1 Directive 2009/28/EC of the European Parliament and of the council of the 23 April 2009 on the
promotion of the use of energy from renewable sources and amending and subsequently repealing
Directive 2001/77/EC and 2003/30/EC (2009). 2 Directive 2010/31/EU of the European Parliament and of the council of 19 May 2010 on the energy
performance of buildings (2010). 3 EVE (Ente Vasco de la Energía). Estrategia Energética de Euskadi 2020 (2015).
Introducción │4
_____________________________________________________________________________
Dicha investigación, no solo está alineada con las ya mencionadas Estrategias
Energéticas Europea y Vasca, sino que además, nace del interés de los grupos de
investigación que han tomado parte en la misma.
IK4-Tekniker establece la Ingeniería de Superficies como una línea de
especialización clave que da servicio a diferentes ámbitos de aplicación prioritarios
como son Energía e Infraestructuras.
El Departamento de Mineralogía y Petrología de la UPV/EHU, tiene como objetivo
profundizar en el conocimiento de las relaciones entre estructura y las propiedades de
los materiales. En este sentido el trabajo con el pigmento ultramar con estructura similar
a la sodalita (silicato de fórmula Na8(AlSiO4)6Cl2 y grupo espacial P 3m), encaja con el
estudio de las estrategias de diseño de materiales que dicho grupo desarrolla.
1.1. Consumo energético
En el año 2014 el consumo energético mundial se elevó a 13.541Mtep4, habiéndose
duplicado en los últimos 40 años. Este incremento producido en los últimos tiempos, es
consecuencia directa del crecimiento socioeconómico y del aumento de la población
mundial que alcanzará los 9.150 millones en el año 2050.
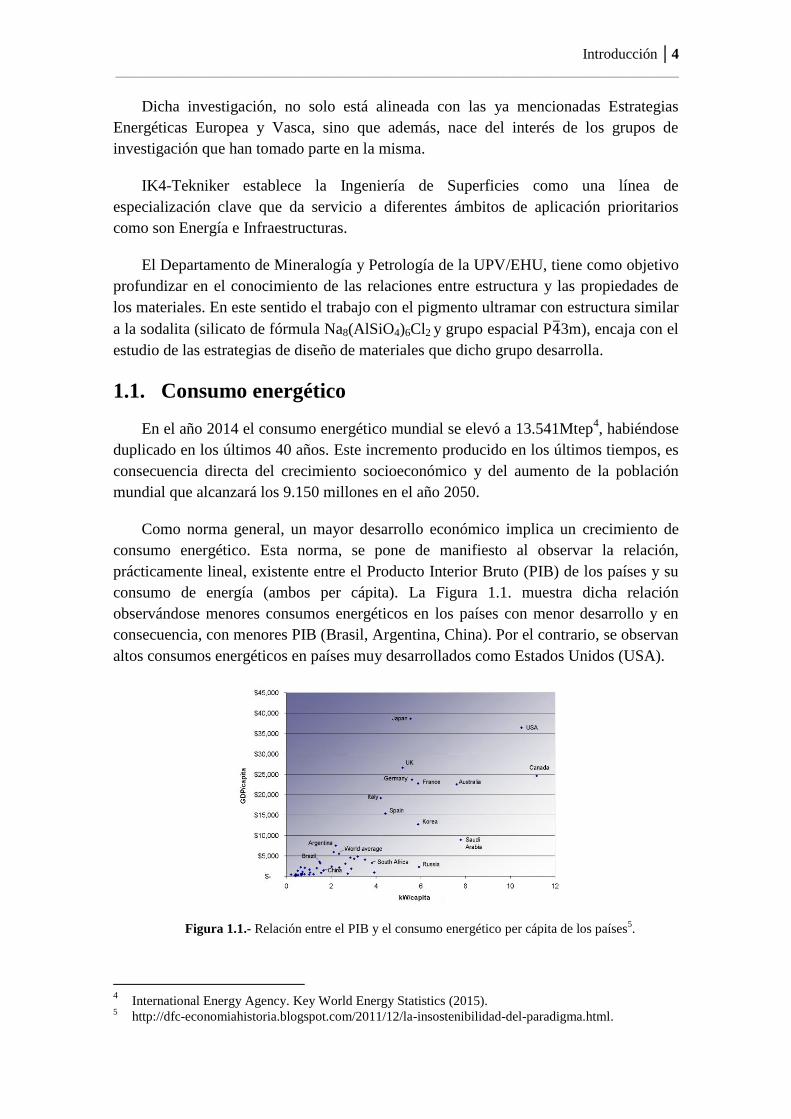
Como norma general, un mayor desarrollo económico implica un crecimiento de
consumo energético. Esta norma, se pone de manifiesto al observar la relación,
prácticamente lineal, existente entre el Producto Interior Bruto (PIB) de los países y su
consumo de energía (ambos per cápita). La Figura 1.1. muestra dicha relación
observándose menores consumos energéticos en los países con menor desarrollo y en
consecuencia, con menores PIB (Brasil, Argentina, China). Por el contrario, se observan
altos consumos energéticos en países muy desarrollados como Estados Unidos (USA).
Figura 1.1.- Relación entre el PIB y el consumo energético per cápita de los países5.
4 International Energy Agency. Key World Energy Statistics (2015).
5 http://dfc-economiahistoria.blogspot.com/2011/12/la-insostenibilidad-del-paradigma.html.
Introducción │5
_____________________________________________________________________________
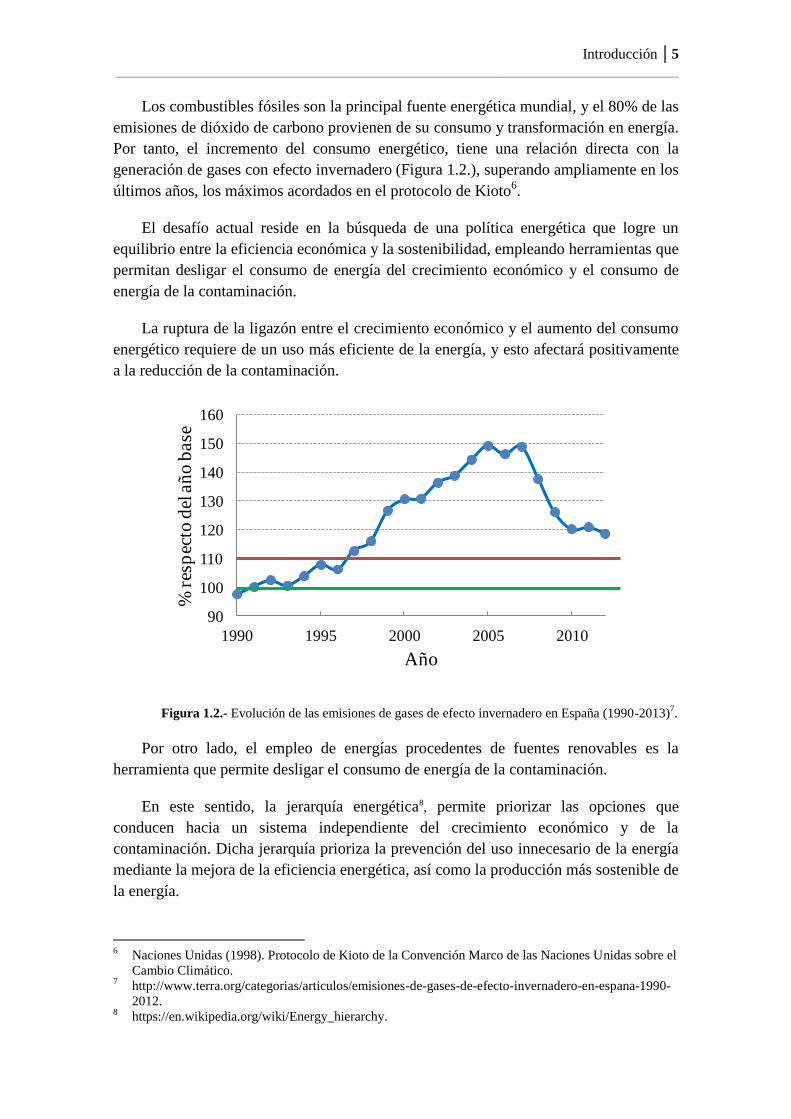
Los combustibles fósiles son la principal fuente energética mundial, y el 80% de las
emisiones de dióxido de carbono provienen de su consumo y transformación en energía.
Por tanto, el incremento del consumo energético, tiene una relación directa con la
generación de gases con efecto invernadero (Figura 1.2.), superando ampliamente en los
últimos años, los máximos acordados en el protocolo de Kioto6.
El desafío actual reside en la búsqueda de una política energética que logre un
equilibrio entre la eficiencia económica y la sostenibilidad, empleando herramientas que
permitan desligar el consumo de energía del crecimiento económico y el consumo de
energía de la contaminación.
La ruptura de la ligazón entre el crecimiento económico y el aumento del consumo
energético requiere de un uso más eficiente de la energía, y esto afectará positivamente
a la reducción de la contaminación.
Figura 1.2.- Evolución de las emisiones de gases de efecto invernadero en España (1990-2013)7.
Por otro lado, el empleo de energías procedentes de fuentes renovables es la
herramienta que permite desligar el consumo de energía de la contaminación.
En este sentido, la jerarquía energética8, permite priorizar las opciones que
conducen hacia un sistema independiente del crecimiento económico y de la
contaminación. Dicha jerarquía prioriza la prevención del uso innecesario de la energía
mediante la mejora de la eficiencia energética, así como la producción más sostenible de
la energía.
6 Naciones Unidas (1998). Protocolo de Kioto de la Convención Marco de las Naciones Unidas sobre el
Cambio Climático. 7 http://www.terra.org/categorias/articulos/emisiones-de-gases-de-efecto-invernadero-en-espana-1990-
2012. 8 https://en.wikipedia.org/wiki/Energy_hierarchy.
90
100
110
120
130
140
150
160
1990 1995 2000 2005 2010
% r
esp
ecto
del
añ
o b
ase
Año
Introducción │6
_____________________________________________________________________________
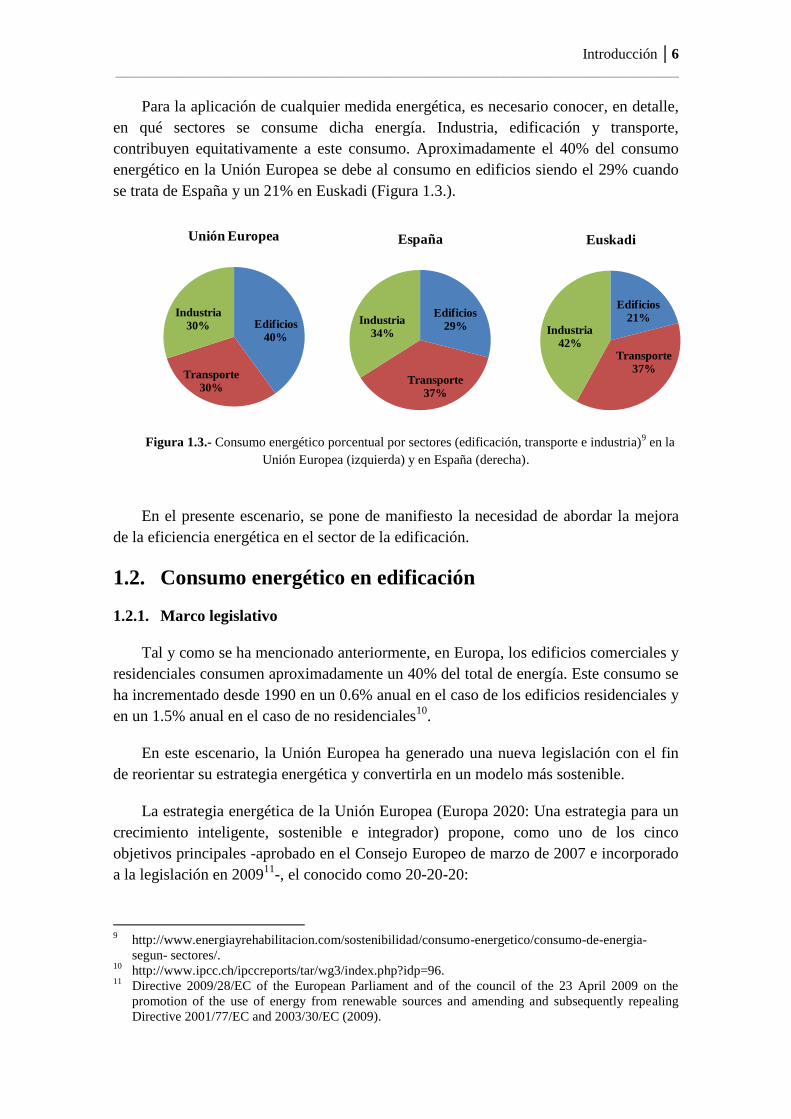
Para la aplicación de cualquier medida energética, es necesario conocer, en detalle,
en qué sectores se consume dicha energía. Industria, edificación y transporte,
contribuyen equitativamente a este consumo. Aproximadamente el 40% del consumo
energético en la Unión Europea se debe al consumo en edificios siendo el 29% cuando
se trata de España y un 21% en Euskadi (Figura 1.3.).
Figura 1.3.- Consumo energético porcentual por sectores (edificación, transporte e industria)9 en la
Unión Europea (izquierda) y en España (derecha).
En el presente escenario, se pone de manifiesto la necesidad de abordar la mejora
de la eficiencia energética en el sector de la edificación.
1.2. Consumo energético en edificación
1.2.1. Marco legislativo
Tal y como se ha mencionado anteriormente, en Europa, los edificios comerciales y
residenciales consumen aproximadamente un 40% del total de energía. Este consumo se
ha incrementado desde 1990 en un 0.6% anual en el caso de los edificios residenciales y
en un 1.5% anual en el caso de no residenciales10
.
En este escenario, la Unión Europea ha generado una nueva legislación con el fin
de reorientar su estrategia energética y convertirla en un modelo más sostenible.
La estrategia energética de la Unión Europea (Europa 2020: Una estrategia para un
crecimiento inteligente, sostenible e integrador) propone, como uno de los cinco
objetivos principales -aprobado en el Consejo Europeo de marzo de 2007 e incorporado
a la legislación en 200911
-, el conocido como 20-20-20:
9 http://www.energiayrehabilitacion.com/sostenibilidad/consumo-energetico/consumo-de-energia-
segun- sectores/. 10
http://www.ipcc.ch/ipccreports/tar/wg3/index.php?idp=96. 11
Directive 2009/28/EC of the European Parliament and of the council of the 23 April 2009 on the
promotion of the use of energy from renewable sources and amending and subsequently repealing
Directive 2001/77/EC and 2003/30/EC (2009).
Edificios
29%
Transporte
37%
Industria
34%
España
Edificios
40%
Transporte
30%
Industria
30%
Unión Europea
Edificios
21%
Transporte
37%
Industria
42%
Euskadi
Edificios
29%
Transporte
37%
Industria
34%
España
Edificios
40%
Transporte
30%
Industria
30%
Unión Europea
Edificios
21%
Transporte
37%
Industria
42%
Euskadi
Edificios
29%
Transporte
37%
Industria
34%
España
Edificios
40%
Transporte
30%
Industria
30%
Unión Europea
Edificios
21%
Transporte
37%
Industria
42%
Euskadi
Introducción │7
_____________________________________________________________________________
Reducción de las emisiones de gases de efecto invernadero en un 20% respecto
de 1990 con el compromiso, bajo acuerdo internacional, de elevar el objetivo
hasta el 30%.
Alcanzar el 20% de fuentes renovables en el consumo energético de la Unión
Europea en 2020 y un 10% en el sector del transporte.
Aumentar la eficiencia energética con el fin de ahorrar un 20% del consumo
energético de la UE respecto de las proyecciones para el año 2020.
En relación con la eficiencia energética, en una comunicación de julio de 201412
, la
Comisión Europea indica que con las medidas establecidas y la tendencia actual, la
Unión Europea logrará unos ahorros de energía del 18-19% en 2020. Sin embargo,
indica que si todos los Estados Miembros ponen en marcha de manera correcta la
legislación vigente, no es posible lograr el 20% sin medidas adicionales.
Esta reorientación de la estrategia energética europea unida a otras directivas
enfocadas al fomento de la eficiencia energética en edificios13,14
ponen de manifiesto el
compromiso institucional existente en cuanto a la sostenibilidad energética15
.
Como respuesta a las directrices fijadas por Europa, y con objeto de lograr el
cumplimiento de los objetivos europeos, la política energética española se ha
consolidado, entre otras, a través de diversos planes: Plan de Acción 2011-2020 de la
Estrategia de Ahorro y Eficiencia Energética en España (E4), Plan de Energía
Renovables 2011-2020 o la Planificación Energética Indicativa 2012-2020 (según lo
dispuesto en la Ley 2/2011, de 4 de marzo, de Economía Sostenible).
En marzo de 2014, la Comisión Europea publicó una Comunicación que hacía
balance de la Estrategia Europa 2020 cuatro años después de lanzarse: “Balance de la
estrategia Europa 2020”. Dicha comunicación concluía que los avances en el logro de
los objetivos de la Estrategia Europa 2020 habían sido desiguales y habían estado
marcados por la crisis económica europea, que ha limitado los avances hacia la
consecución de los demás objetivos, con la excepción de su efecto en la reducción de las
emisiones de gases de efecto invernadero.
En el ámbito regional, el Plan de Ciencia y Tecnología e Innovación (PCTI)
Euskadi 202016
, se alinea con la puesta en marcha de la Estrategia Europa 2020. El
propósito último del PCTI Euskadi 2020 es mejorar el bienestar, favorecer el
crecimiento económico sostenible y el empleo en la sociedad vasca mediante el 12
Energy Efficiency Communication 2014. Comisión Europea, 23 julio 2014.
http://ec.europa.eu/energy/efficiency/events/2014_energy_efficiency_communication_en.htm. 13
Directive 2012/27/EU of the European Parliament and of the Council of 25 October 2012 on energy
efficiency, amending Directives 2009/125/EC and 2010/30/EU and repealing Directives 2004/8/EC
and 2006/32/EC Text with EEA relevance. 14
Directive 2010/31/EU of the European Parliament and of the Council of 19 May 2010 on the energy
performance of buildings. 15
Aste, N., Caputo, P., Buzzetti, M. & Fattore, M. Energy efficiency in buildings: What drives the
investments? The case of Lombardy Region. Sust. Cities Soc. 20, 27–37 (2016). 16
Gobierno Vasco. PCTI Euskadi 2020: una estrategia de especialización inteligente (2014).
Introducción │8
_____________________________________________________________________________
desarrollo de una política de investigación e innovación basada en la especialización
inteligente y en la mejora de la eficiencia del Sistema de Ciencia, Tecnología e
Innovación.
En consonancia con la Estrategia Europa 2020, este nuevo planteamiento está
orientado a incrementar la colaboración entre los diferentes agentes a lo largo de toda la
cadena de investigación e innovación, posibilitando reducir el tiempo que transcurre
entre la concepción de una idea y su introducción en el mercado.
Las estrategias de investigación e innovación para la especialización inteligente
(RIS3- Research and Innovation Smart Specialisation Strategy) forman parte de las
distintas estrategias globales impulsadas por la UE y pretenden concentrar sus recursos
e inversiones en áreas donde existen claras sinergias con las capacidades productivas
existentes y potenciales de la región. La especialización inteligente implica por ello,
identificar las características y activos exclusivos de cada región, subrayar sus ventajas
competitivas y reunir a los participantes en torno a una visión de futuro compartida. El
objetivo central de todo el proceso RIS3 es apoyar la transformación productiva con
objeto de generar empleo y bienestar a medio y largo plazo.
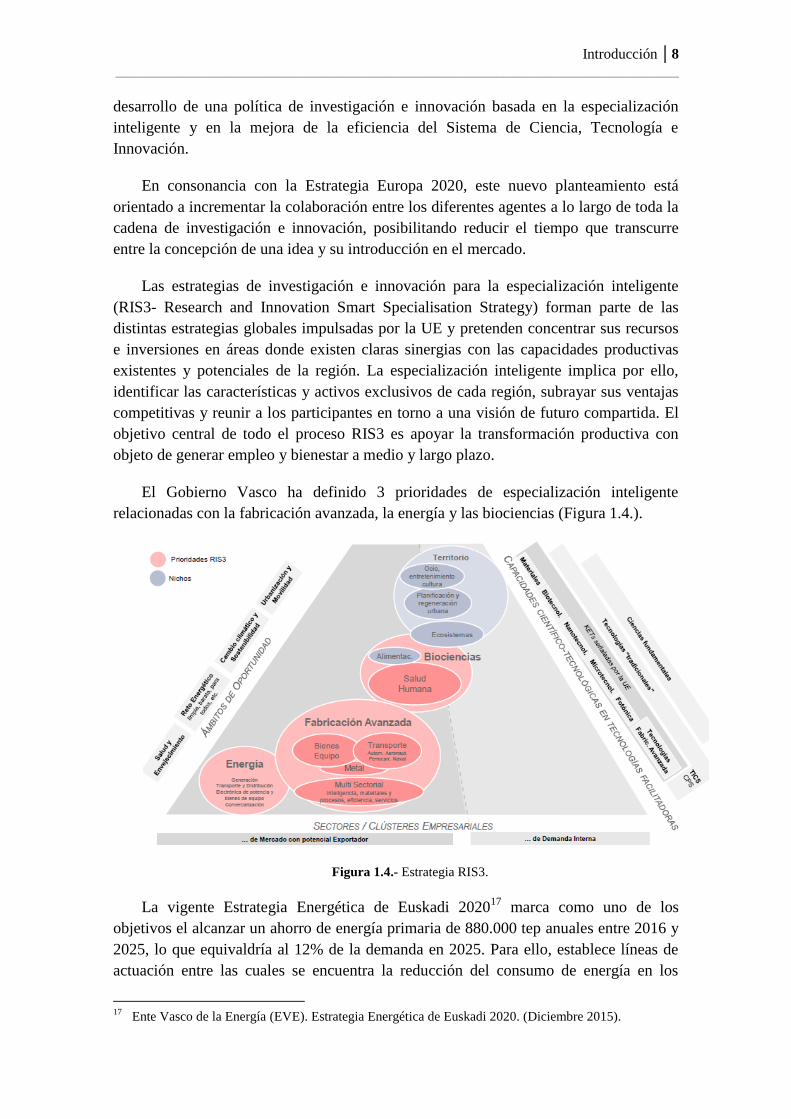
El Gobierno Vasco ha definido 3 prioridades de especialización inteligente
relacionadas con la fabricación avanzada, la energía y las biociencias (Figura 1.4.).
Figura 1.4.- Estrategia RIS3.
La vigente Estrategia Energética de Euskadi 202017
marca como uno de los
objetivos el alcanzar un ahorro de energía primaria de 880.000 tep anuales entre 2016 y
2025, lo que equivaldría al 12% de la demanda en 2025. Para ello, establece líneas de
actuación entre las cuales se encuentra la reducción del consumo de energía en los
17
Ente Vasco de la Energía (EVE). Estrategia Energética de Euskadi 2020. (Diciembre 2015).
Introducción │9
_____________________________________________________________________________
edificios y en el hogar. La promoción del uso de energías renovables18
y la priorización
de la eficiencia energética y reducción de consumo son las claves para alcanzar los
objetivos planteados.
1.2.2. Consumo energético en edificación por usos
Abordar cualquier estrategia que permita avanzar en la eficiencia energética, hace
necesario comprender los diferentes factores que afectan al consumo energético en
edificación:
Localización del edificio: el clima afecta al consumo en iluminación, calefacción
y aire acondicionado.
Tipología del edificio: en el caso de los edificios residenciales, existen casas
unifamiliares o pisos con consumos muy diferentes.
Edad del edificio: la edad del edificio está totalmente relacionada con el nivel de
energía empleada. El 40% de los edificios de Europa tienen más de 50 años.
La edad del edificio será un factor decisivo para abordar una rehabilitación del
mismo o no, mientras que la localización y tipología del edificio podrán ser factores que
descarten estrategias concretas por no ser las idóneas para determinadas casuísticas.
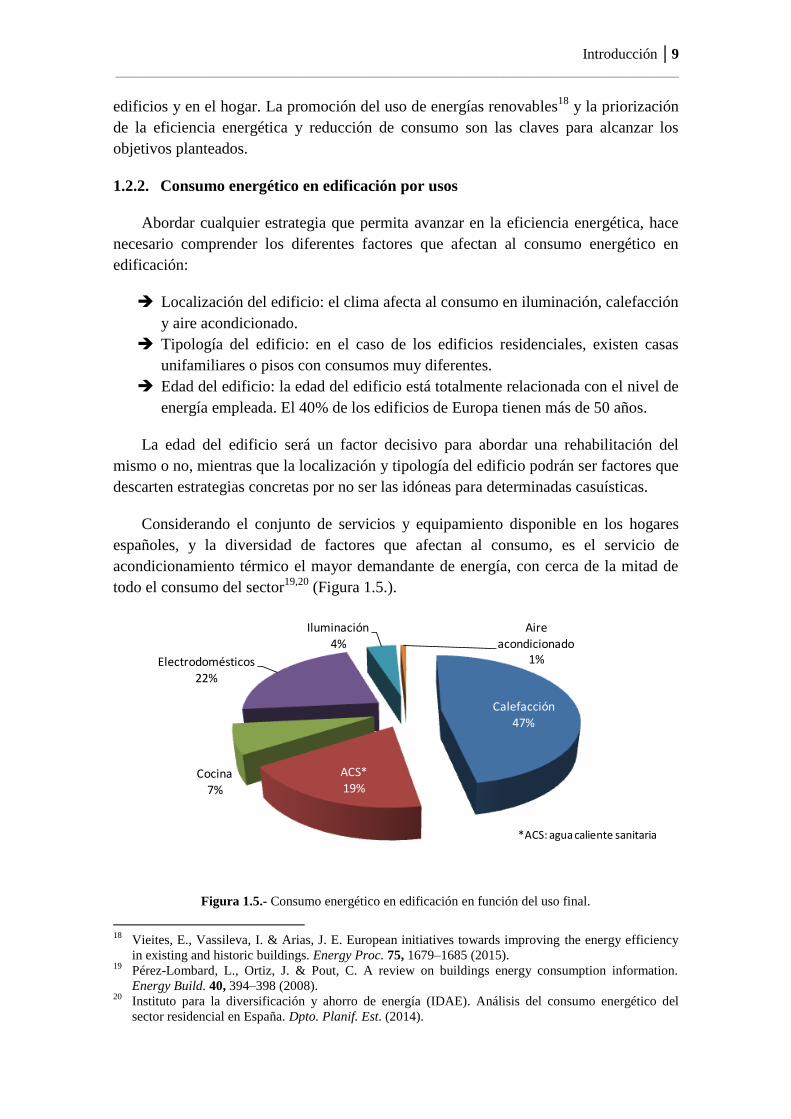
Considerando el conjunto de servicios y equipamiento disponible en los hogares
españoles, y la diversidad de factores que afectan al consumo, es el servicio de
acondicionamiento térmico el mayor demandante de energía, con cerca de la mitad de
todo el consumo del sector19,20
(Figura 1.5.).
Figura 1.5.- Consumo energético en edificación en función del uso final.
18
Vieites, E., Vassileva, I. & Arias, J. E. European initiatives towards improving the energy efficiency
in existing and historic buildings. Energy Proc. 75, 1679–1685 (2015). 19
Pérez-Lombard, L., Ortiz, J. & Pout, C. A review on buildings energy consumption information.
Energy Build. 40, 394–398 (2008). 20
Instituto para la diversificación y ahorro de energía (IDAE). Análisis del consumo energético del
sector residencial en España. Dpto. Planif. Est. (2014).
Calefacción
47%
ACS*
19%Cocina
7%
Electrodomésticos22%
Iluminación4%
Aire acondicionado
1%
*ACS: agua caliente sanitaria
Introducción │10
_____________________________________________________________________________
Existe, por tanto, una necesidad clara de mejora de la eficiencia energética en
términos de acondicionamiento térmico de edificios, teniendo como objetivo último la
reducción de consumo energético en calefacción y aire acondicionado.
1.3. Estrategias para la eficiencia energética en edificación
Teniendo en cuenta que el 40% de los edificios europeos tiene más de 50 años, se
considera que la mejora de la eficiencia energética en edificación podría reducir los
consumos en un 5-6%, disminuyendo con ello las emisiones de CO2 en un 5%.
La Directiva de Eficiencia Energética tiene como objetivo la creación de un marco
común de medidas para el fomento de la eficiencia energética que permitan asegurar
que los países de la Unión Europea conseguirán el 20% de ahorro energético ya
comprometido con anterioridad en la Directiva “Triple 20”. Además, esta directiva
obliga a los estados miembros a una renovación de, al menos, el 3% de los edificios
públicos de más de quinientos metros cuadrados. Por tanto, la rehabilitación de los
edificios existentes es una prioridad Europea y el desarrollo de materiales apropiados
debe contribuir al cumplimiento de estos objetivos.
Los materiales, siempre han sido claves en el desarrollo de la historia y en cualquier
cambio relevante de la humanidad. Cualquier desarrollo de un nuevo material siempre
ha estado ligado a la búsqueda del bienestar humano orientado a la mejora de la salud,
la comunicación, la sostenibilidad o el suministro de energía. En el momento actual nos
encontramos ante el desafío de contribuir a la sostenibilidad a través del desarrollo de
nuevos materiales que puedan ser aplicados en la rehabilitación de edificios.
Desde el punto de vista de la industria química, existen tres soluciones principales
relativas a materiales avanzados, con gran potencial para ser empleados en
rehabilitación de edificios21
con el objetivo final de reducir el consumo energético en
calefacción y aire acondicionado:
Materiales cambio de fase
Recubrimientos de exterior altamente reflejantes
Nuevos materiales aislantes
A continuación se detalla el modo de funcionamiento de dichas soluciones.
1.3.1. Materiales cambio de fase
El almacenamiento por calor latente o Latent Heat Storage (LHS), está basado en la
absorción o liberación de calor cuando un material sufre un cambio de fase. Así, el calor
latente, se define como la cantidad de calor que necesita una sustancia para pasar de
21
Bax, L., Cruxent, J. & Komornicki, J. Advanced materials for energy efficient buildings. Key to
innovation integrated solution. Innovative chemistry for energy efficiency of buildings in smart cities.
Cefic. Eur. Chem. Ind. Coun. (2013).

Introducción │11
_____________________________________________________________________________
estado sólido a líquido, de líquido a gas, de sólido a gas, o de sólido a sólido, mientras
su temperatura se mantiene constante.
Este tipo de almacenamiento, es particularmente atractivo debido a su habilidad de
proporcionar gran densidad de energía de almacenamiento y a su capacidad de
almacenarla a temperatura constante. En este sentido, en las últimas tres décadas22
, las
investigaciones se están centrando en el uso de materiales de cambio de fase (más
conocidos como Phase Change Materials (PCM)), para el almacenamiento térmico ya
que son capaces de almacenar energía térmica mientras mantienen constante su
temperatura23-25
.
La capacidad de almacenamiento térmico de un PCM viene determinada por la
energía de cambio de fase (calor de transición de estado). Los materiales seleccionados
para una aplicación concreta, deben exhibir un alto calor de transición, alta densidad,
apropiada temperatura de transición, baja toxicidad y una apropiada relación de
coste/eficiencia26
. Los cambios de fase se pueden producir entre sólido-sólido, sólido-
líquido, sólido-gas, líquido-gas y viceversa27
. En las transiciones sólido-sólido, el
almacenamiento de calor se genera mediante el cambio entre las diferentes fases
cristalinas del material. Aunque esta transición conlleva una menor cantidad de calor
latente, los cambios en el volumen del material son menores que en el resto de
transiciones. Este cambio mínimo de volumen al producirse la transición, ofrece
ventajas de almacenamiento que no ofrecen los demás debido a que los contenedores o
encapsulamientos necesarios son menos exigentes.
Las transiciones sólido-gas y líquido-gas presentan los mayores calores latentes
entre las posible transiciones de estado, pero los cambios de volúmenes que sufren
durante el proceso son muy elevados y dificultan su uso en sistemas de almacenamiento
térmico. Por el contrario, aunque las transiciones sólido-líquido presentan entalpías algo
menores que las transiciones a estado gaseoso, sus cambios de volumen se mantienen en
un nivel aceptable (~10%).
Se concluye por tanto que el empleo de transiciones sólido-líquido en sistemas de
almacenamiento térmico es técnicamente más ventajoso a la vez que proporciona una
densidad de almacenamiento de energía relativamente elevada.
22
Hawes, D. W., Banu, D. & Feldman, D. Latent heat storage in concrete. Sol. Energy Mater. 19, 335–
348 (1989). 23
Oró, E., De Gracia, A., Castell, A., Farid, M. & Cabeza, L. Review on phase change materials (PCMs)
for cold thermal energy storage applications. App. Energy 99, 513–33 (2012). 24
Mondal, S. Phase change materials for smart textiles–An overview. App.Therm. Eng. 28, 1536–1550
(2008). 25
Raoux, S. & Ibm, T. J. Phase change memory (PCM) materials and devices. Adv. Non-Vol. Mem. Sto.
Tech. 1, 161–199 (2014). 26
Zhou, D., Zhao, C. Y. & Tian, Y. Review on thermal energy storage with phase change materials
(PCMs) in building applications. App. Energy 92, 593–605 (2012). 27
Bruno, F., Belusko, M., Liu, M. & Tay, N. H. S. Using solid-liquid phase change materials (PCMs) in
thermal energy storage systems. Adv. Therm. Energy Stor. Sys. 4, 201–246 (2015).

Introducción │12
_____________________________________________________________________________
En los últimos años, los PCM se han incorporado en los materiales de construcción
para aumentar la eficiencia energética de los edificios residenciales. Estos materiales se
utilizan en combinación con el calor radiante y la energía solar para ampliar la
eficiencia de la calefacción y la refrigeración. Así, los PCM se incorporan en paredes,
yesos, aislamientos, tableros de fibras, tejas, azulejos, baldosas, techos, etc.
1.3.2. Recubrimientos de exterior altamente reflejantes (“cool coatings”)
La Figura 1.6. muestra el espectro electromagnético de la radiación solar en el que
se aprecia que la irradiancia solar contiene aproximadamente un 5% de radiación
Ultravioleta (UV), un 43% de radiación visible (VIS) y un 52% correspondiente al
Infrarrojo cercano (NIR).
Figura 1.6.- Espectro solar28
. Intensidad espectral en los diferentes intervalos del espectro
electromagnético.
El intervalo ultravioleta del espectro solar consiste en la radiación que tiene lugar
entre las longitudes de onda de 300 nm y 380 nm. Esta región es la causante de ciertos
daños en determinadas superficies. El intervalo visible es la región situada entre 380 nm
y 780 nm que corresponde a la región en la que el ojo humano es capaz de detectar
diferentes colores. Por último la región del espectro situada entre 780 nm y 2500 nm es
la correspondiente al infrarrojo cercano (NIR: near infrared), no detectable por el ojo
humano pero que contiene más de la mitad de la energía solar que llega a la tierra.
Al incidir la radiación solar sobre una superficie, parte de la radiación es reflejada y
otra parte es absorbida. La radiación que se absorbe genera calor y éste se transporta por
conducción térmica a través del material. El empleo de colores oscuros, favorece la
28
http://www.intechopen.com/books/biofuels-economy-environment-and-sustainability/the-possibility-
of-future-biofuels-production-using-waste-carbon-dioxide-and-solar-energy.
Introducción │13
_____________________________________________________________________________
absorción de la radiación en el intervalo visible del espectro, generando, de este modo,
un calentamiento de la superficie29.
Generalmente, una superficie empleada en edificación (como puede ser un tejado o
una fachada) posee unos requerimientos estéticos que hacen que la elección del color y
su absorción en el intervalo del espectro visible, no sean modificables.
Los llamados recubrimientos fríos o “cool coatings”, son superficies con alta
reflectividad en el infrarrojo cercano (780- 2500 nm) capaces de reducir el
calentamiento de los materiales en los que se aplica. Esta propiedad hace que los “cool
coatings” sean muy eficientes en tejados de edificios que acumulan gran cantidad de
radiación solar al ser superficies horizontales o con poca inclinación.
Los tejados fabricados con este tipo de recubrimientos, maximizan su reflectividad
en el espectro visible si son blancos. Sin embargo, la estética y el diseño en la
edificación, ha generado la necesidad de investigar en “cool coatings” coloreados. Estos
materiales, tienen una respuesta en el espectro visible que hace posible obtener una
superficie del color deseado, pero presentan una alta reflectividad en el intervalo
espectral del infrarrojo cercano. Para el logro de este tipo de materiales se trabaja
actualmente en el desarrollo de pigmentos fríos o “cool pigments”, que son capaces de
dotar a cualquier material de esta propiedad de alta reflectividad en el NIR.
1.3.3. Nuevos materiales aislantes
El aislamiento térmico es la piedra angular de la edificación sostenible. El
aislamiento de fachadas, cubiertas y suelos reduce las pérdidas de energía debidas a la
diferencia de temperatura entre recintos con independencia de cómo se ha generado el
frío o el calor. Los materiales de aislamiento pueden emplearse en diferentes
configuraciones de rehabilitación de fachadas: aislamiento de fachadas por el exterior,
aislamiento de fachadas por el interior o relleno de cámaras de aire30
. Un parque de casi
6 millones de edificios existentes fue construido antes de 198031
(con aplicación de la
NBE-CT7932
). El código Técnico de la Edificación y su Documento Básico de Ahorro
de Energía33
derogaron esta normativa estableciendo procedimientos que aseguran la
satisfacción de las exigencias básicas relativas al ahorro de energía, haciendo un uso
racional de la misma para el consumo habitual en los edificios.
La renovación térmica del 1% de los edificios construidos antes de 1980 supondría
anualmente el ahorro de 1 millón de toneladas de CO2.
29
http://www.colourcoil.com/radiativeproperties.html. 30
Instituto para la Diversificación y Ahorro de la Energía (IDAE). Guía técnica para la rehabilitación de
la envolvente térmica de los edificios. Soluciones con aislamiento de poliuretano (2007). 31
Instituto Nacional de Estadística (INE). Censo de Edificios (2011). 32
Real Decreto 2429/79, de 6 de Julio. Norma Básica de la Edificación NBE-CT79 sobre Condiciones
Térmicas en los edificios (1979). 33
Real Decreto 314/2006, de 17 de marzo, por el que se aprueba el Código Técnico de la Edificación
(2006).
Introducción │14
_____________________________________________________________________________
El desarrollo de materiales avanzados para la mejora del aislamiento está generando
un gran interés en el mundo científico e industrial.
Zhu et al.34
han trabajado recientemente en el desarrollo de espumas de vidrio
cerámico a partir de residuos sólidos obteniendo un material con muy buenas
propiedades de conductividad térmica (0.36 W/mK) y de resistencia a compresión
(>5MPa).
Otro ejemplo son los desarrollos de Celik et al.35
que fabricaron paneles de cemento
con aditivos como perlita o piedra pómez para reducir su densidad y su conductividad
térmica, mejorando de este modo, sus propiedades aislantes.
Los desarrollos realizados en investigaciones recientes van orientados, por tanto, a
la obtención de materiales con un valor de conductividad térmica extremadamente bajo
y con un peso y espesor reducido36-41
. Ejemplos de estos materiales son los paneles de
vacío, paneles rellenos de gases o los aerogeles. El coste de estos sistemas, unido a su
pobre resistencia mecánica han hecho que su introducción en el mercado haya sido
limitada.
La eficiencia energética en términos de acondicionamiento térmico de edificios
puede verse, por ello, mejorada, mediante el desarrollo de materiales adecuados, siendo
las soluciones preferenciales los materiales que muestran capacidad de almacenamiento
térmico (PCM) y los que presentan una alta reflectividad en el intervalo del espectro del
infrarrojo cercano (recubrimientos fríos).
1.4. Aplicación de materiales cambio de fase en construcción
La incorporación de materiales cambio de fase (PCM) en el sector de la
construcción, se presenta como una tecnología de interés para el almacenamiento
térmico y la mejora de la eficiencia energética global de los edificios.
34
Zhu, M., Ji, R., Li, Z., Wang, H., Liu, L. & Zhang, Z. Preparation of glass ceramic foams for thermal
insulation applications from coal fly ash and waste glass. Constr. Build. Mater. 112, 398–405 (2016). 35
Celik, S., Family, R. & Menguc, M. P. Analysis of perlite and pumice based building insulation
materials. J. Build. Eng. 6, 105–111 (2016). 36
Petter Jelle, B. Start-Up Creation. Elsevier, 119-181 (2016). 37
Biswas, K., Shrestha, S. S., Bhandari, M. S. & Desjarlais, A. O. Insulation materials for commercial
buildings in North America: An assessment of lifetime energy and environmental impacts. Energy
Build. 112, 256–269 (2016). 38
Chabriac, P. A., Gourdon, E., Gle, P., Fabbri, A. & Lenormand, H. Agricultural by-products for
building insulation: Acoustical characterization and modeling to predict micro-structural parameters.
Constr. Build. Mater. 112, 158–167 (2016). 39
Sierra-Pérez, J., Boschmonart-Rives, J., Dias, A. C. & Gabarrell, X. Environmental implications of
the use of agglomerated cork as thermal insulation in buildings. J. Clean. Prod. 126, 97–107 (2016). 40
Schiavoni, S., D׳Alessandro, F., Bianchi, F. & Asdrubali, F. Insulation materials for the building
sector: A review and comparative analysis. Renew. Sustain. Energy Rev. 62, 988–1011 (2016). 41
Abdul Mujeebu, M., Ashraf, N. & Alsuwayigh, A. H. Effect of nano vacuum insulation panel and
nanogel glazing on the energy performance of office building. App. Energy 173, 141–151 (2016).
Introducción │15
_____________________________________________________________________________
Teniendo en cuenta que en la construcción moderna existen conceptos clave como
la inercia térmica o la ligereza de los materiales, los PCM permiten aumentar la inercia
térmica de materiales constructivos (como yeso o espumas aislantes) sin aumentos de
masa ni de volumen42
.
1.4.1. Conceptos de almacenamiento térmico: sistemas activos y sistemas pasivos
Los conceptos de almacenamiento térmico aplicados al sector de la construcción
pueden clasificarse en sistemas activos y sistemas pasivos en función de la manera en la
que se transfiere el calor al medio de almacenamiento43,44
.
En los sistemas activos, el medio de transferencia térmica contribuye, en buena
parte, al almacenamiento. Se emplean para almacenar calor a baja o media temperatura
(entre 40ºC y 90ºC generalmente) y el medio de transferencia comúnmente empleado es
el agua.
En el caso de los sistemas pasivos, el medio de transferencia térmica no contribuye,
de manera significativa, al almacenamiento (aire generalmente) y el calor se almacena
en un intervalo de baja temperatura (entre 20ºC y 60ºC). Los sistemas pasivos de
almacenamiento térmico, son capaces de aprovechar el calor con el fin de mantener las
condiciones de confort del edificio minimizando, de este modo, los sistemas de
calefacción y aire acondicionado mediante la reducción de las fluctuaciones de
temperatura. Son sistemas que no consumen energía al no emplear dispositivos
mecánicos y/o eléctricos.
El concepto general del funcionamiento de diferentes sistemas pasivos de
almacenamiento térmico mediante el empleo de PCM es el siguiente45
: el calor durante
el día funde el material cambio de fase absorbiendo, de este modo, el calor en el propio
material. Al descender la temperatura, el material libera ese calor almacenado volviendo
a su estado sólido.
1.4.2. Materiales cambio de fase: clasificación
La selección del material de cambio de fase adecuado para la aplicación debe
basarse fundamentalmente en criterios térmicos. El material cambio de fase debe tener
una temperatura de fusión/cristalización adecuada y equivalente a la temperatura que se
considere confort. Así mismo, es importante emplear materiales con altos valores de
entalpía de fusión/cristalización para asegurar una alta capacidad de almacenamiento
por unidad de masa.
42
Gálvez, A. Materiales para almacenamiento energético y estructuras compuestas en cerramientos eco-
eficientes. Jornada técnica sobre materiales de construcción y eficiencia energética. Madrid (2014). 43
Konstantinidou, C.V. Integration of thermal energy storage in buildings. The University of Texas at
Austin (2010). 44
International Energy Agency (IEA). State of the Art Review: Applying energy storage in building of
the future. Subtask A&B Report. Annex 23 (2013). 45
Goitandia, A. M. Materiales con cambio de fase (PCMs) soportados en matrices inorgánicas:
preparación, estudio y aplicación. Tesis Doctoral. Universidad del País Vasco (2015).
Introducción │16
_____________________________________________________________________________
No obstante, el coste y la accesibilidad del material deben evaluarse para una futura
explotación comercial del sistema. Por otro lado, los PCM deben ser compatibles con
los materiales de construcción o con el encapsulado y no deben ser tóxicos.
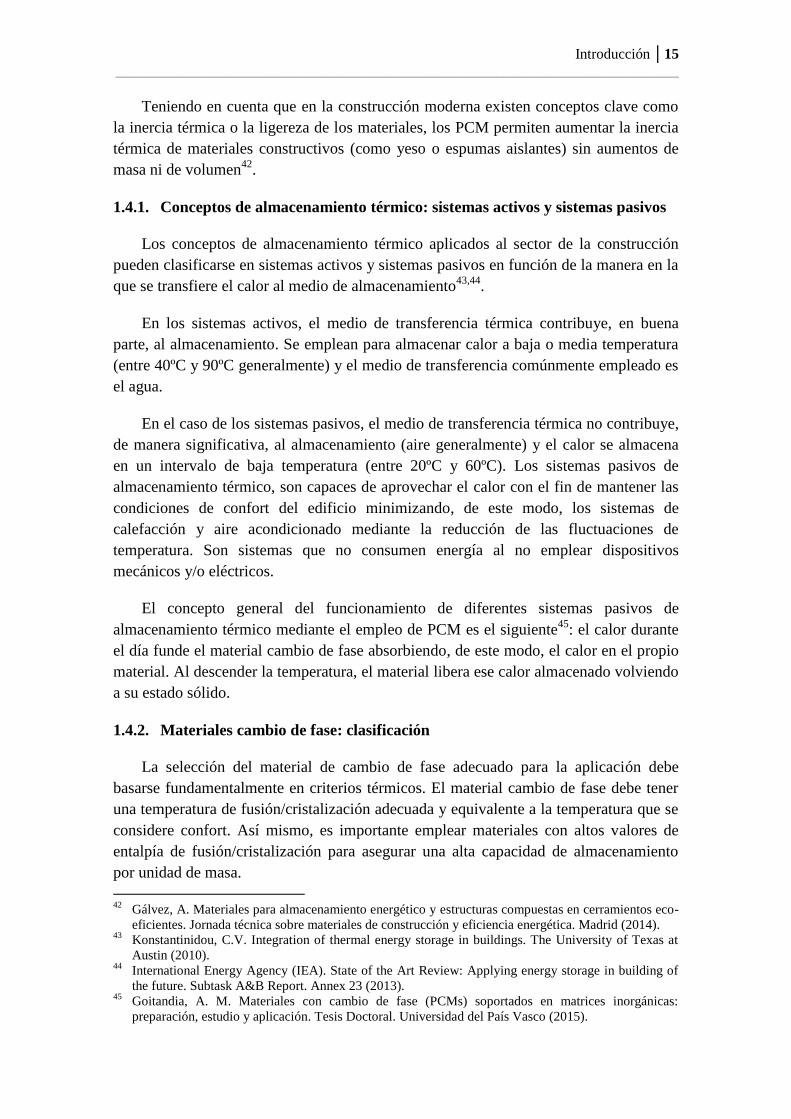
La Figura 1.7. muestra la relación entre la temperatura y las entalpías de fusión de
las diferentes familias de materiales. Se observa que los PCM con potencial de ser
empleados en edificación (temperatura de fusión en torno a 20ºC), son las parafinas,
ácidos grasos, sales hidratadas y mezclas eutécticas, fundamentalmente.
Figura 1.7.- Temperatura de fusión y entalpías de diferentes materiales46
.
Existen diferentes clasificaciones de PCMs siendo las más empleadas las realizadas
en función de:
(a) Temperatura de operación: materiales de baja (5-25ºC), media (60-350ºC) y alta
temperatura (>350ºC).
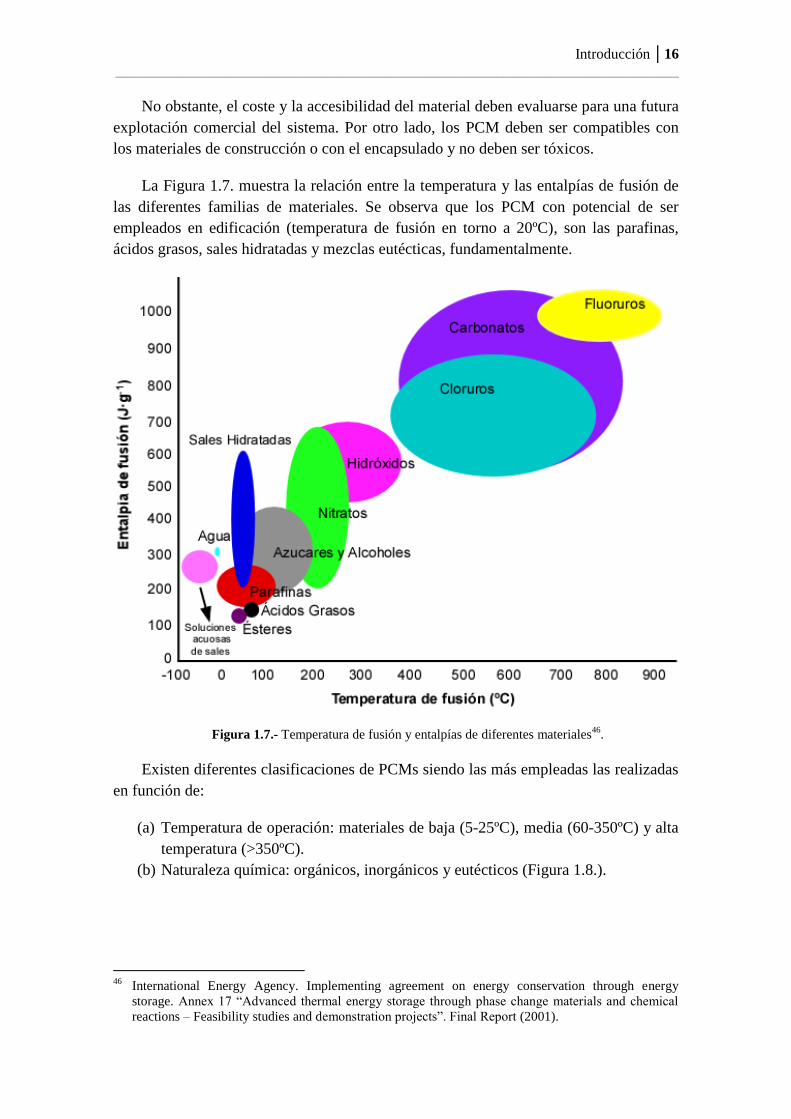
(b) Naturaleza química: orgánicos, inorgánicos y eutécticos (Figura 1.8.).
46
International Energy Agency. Implementing agreement on energy conservation through energy
storage. Annex 17 “Advanced thermal energy storage through phase change materials and chemical
reactions – Feasibility studies and demonstration projects”. Final Report (2001).
Introducción │17
_____________________________________________________________________________
Figura 1.8.- Clasificación de PCM en función de su naturaleza química.
La clasificación en función de su naturaleza química es la más referenciada en
bibliografía47-50
.
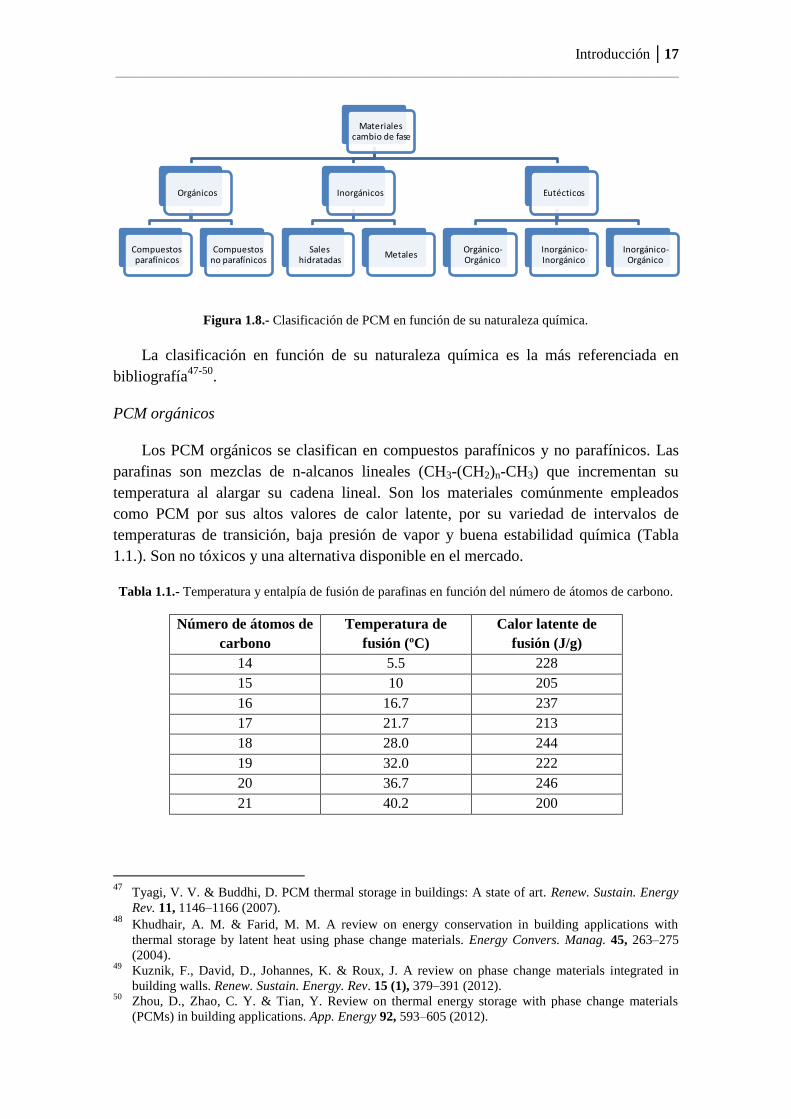
PCM orgánicos
Los PCM orgánicos se clasifican en compuestos parafínicos y no parafínicos. Las
parafinas son mezclas de n-alcanos lineales (CH3-(CH2)n-CH3) que incrementan su
temperatura al alargar su cadena lineal. Son los materiales comúnmente empleados
como PCM por sus altos valores de calor latente, por su variedad de intervalos de
temperaturas de transición, baja presión de vapor y buena estabilidad química (Tabla
1.1.). Son no tóxicos y una alternativa disponible en el mercado.
Tabla 1.1.- Temperatura y entalpía de fusión de parafinas en función del número de átomos de carbono.
Número de átomos de
carbono
Temperatura de
fusión (ºC)
Calor latente de
fusión (J/g)
14 5.5 228
15 10 205
16 16.7 237
17 21.7 213
18 28.0 244
19 32.0 222
20 36.7 246
21 40.2 200
47
Tyagi, V. V. & Buddhi, D. PCM thermal storage in buildings: A state of art. Renew. Sustain. Energy
Rev. 11, 1146–1166 (2007). 48
Khudhair, A. M. & Farid, M. M. A review on energy conservation in building applications with
thermal storage by latent heat using phase change materials. Energy Convers. Manag. 45, 263–275
(2004). 49
Kuznik, F., David, D., Johannes, K. & Roux, J. A review on phase change materials integrated in
building walls. Renew. Sustain. Energy. Rev. 15 (1), 379–391 (2012). 50
Zhou, D., Zhao, C. Y. & Tian, Y. Review on thermal energy storage with phase change materials
(PCMs) in building applications. App. Energy 92, 593–605 (2012).
Materiales cambio de fase
Orgánicos
Compuestos parafínicos
Compuestos no parafínicos
Inorgánicos
Sales hidratadas
Metales
Eutécticos
Orgánico-Orgánico
Inorgánico-Inorgánico
Inorgánico-Orgánico
Introducción │18
_____________________________________________________________________________
No obstante, presentan ciertas propiedades no deseables como son su baja
conductividad térmica y el ser moderadamente inflamables.
Los PCM no parafínicos, engloban ésteres, ácidos grasos, acoholes y glicoles51,52
.
Las propiedades más destacadas de este tipo de materiales son: gran calor latente de
fusión, baja toxicidad, y estabilidad hasta altas temperaturas. Por otro lado, en relación a
los aspectos desfavorables, ha de mencionarse que también muestran inflamabilidad y
baja conductividad térmica. La mayor limitación de los ácidos carboxílicos es su coste,
ya que es dos o tres veces superior al de las parafinas.
PCM inorgánicos
Los materiales inorgánicos se clasifican en dos grupos principalmente, sales
hidratadas y metales53,54
.
Existe un amplia gama de sales hidratadas con fórmula AxBy·nH2O cuyo proceso de
deshidratación-rehidratación reversible es termodinámicamente comparable al proceso
de fusión-cristalización que presentan los cambios de estado líquido-sólido. La
transformación de sólido a líquido sucede cuando una sal hidratada pierde parte o la
totalidad de sus moléculas de agua de cristalización, quedando disuelta por las mismas
moléculas de agua dentro de un intervalo de temperatura. Superada una temperatura,
todas las moléculas de agua se volatilizan para dar lugar a un sólido anhidro.
Las sales hidratadas son uno de los grupos más importantes dentro de los PCM y se
han estudiado extensamente en sistemas de almacenamiento térmico. Sus propiedades
más atractivas son: gran calor latente de fusión por unidad de volumen (Tabla 1.2.),
gran conductividad térmica (casi el doble que en el caso de las parafinas) y pequeños
cambios de volumen durante las transiciones de fase. No son materiales muy corrosivos,
son compatibles con recipientes plásticos y no son tóxicos. El mayor problema de
trabajar con sales hidratadas es que, en la mayoría de los casos, los n-moles que
contiene la sal no son suficientes para disolver toda la sal y, por tanto, la solución
resultante está sobresaturada, dando lugar a una fusión incongruente. Debido a este
fenómeno sucede un proceso irreversible de fusión-cristalización que a lo largo de los
ciclos afectará, de manera notable, en el rendimiento del PCM.
51
Abhat, A. Development of a modular heat exchanger with an integrated latent heat storage. Report
BMFT FBT 81-050. Germany. Ministry of Science and Technology Bonn (1981). 52
Buddhi, D. & Sawhney, R. L. Proceedings on thermal energy storage and energy conversion (1994). 53
Charlsson, B., Stymme, H. & Wattermark, G. An incongruent heat of fusion system CaCl2·6H2O
made congruent through modification of chemical composition of the system. Sol. Energy 23, 333–
350 (1979). 54
Sharma, A., Tyagi, V. V., Chen, C. R. & Buddhi, D. Review on thermal energy storage with phase
change materials and applications. Renew. Sustain. Energy Rev. 13, 318–345 (2009).

Introducción │19
_____________________________________________________________________________
Tabla 1.2.- Temperatura y entalpía de fusión de sales empleadas como PCM inorgánicos.
Material Temperatura de
fusión (ºC)
Calor latente de
fusión (J/g)
FeBr3·6H2O 21.0 109
Mg(NO3)·10H2O 47.0 142
MgCl2·6H2O 117.0 167
En el grupo de los compuestos metálicos, destacan algunos metales con bajo punto
de fusión y algunas aleaciones eutécticas. Son materiales apreciados debido a su gran
cantidad de calor latente desprendido por unidad de volumen. Algunas de las
características más destacadas de estos materiales son: bajo calor de fusión por unidad
de peso, alto calor de fusión por unidad de volumen, alta conductividad térmica, y
presiones de vapor relativamente bajas.
PCM eutécticos
Los PCM eutécticos son compuestos con una composición de dos o más
componentes, cada uno de los cuales, funde y cristaliza, congruentemente, formando
una mezcla de componentes cristalinos durante la fase de cristalización. El punto
eutéctico se corresponde con un punto de cero grados de libertad en el diagrama de
fases, es decir, ocurre a una temperatura y composición determinadas.
Las parafinas se presentan como los PCM idóneos para su incorporación en
materiales constructivos. En el presente estudio, se trabaja con un material
parafínico (hexadecano) cuyo punto de fusión (en torno a 21ºC), es cercano a la
temperatura considerada “confort”.
1.4.3. Incorporación de PCM en materiales constructivos
En los sistemas pasivos, los PCM se incorporan directamente en los materiales y
sistemas constructivos con el fin de incrementar su capacidad de almacenamiento
térmico. Existen diferentes métodos de incorporación de los PCM en los materiales
constructivos, siendo los más empleados los siguientes: (i) incorporación directa, (ii)
inmersión, (iii) encapsulación e (iv) impregnación en soportes porosos.
Incorporación directa
La incorporación directa consiste en mezclar directamente el PCM (en fase líquida
o en fase sólida en forma de polvo) con el material de construcción (fundamentalmente
yeso u hormigón) durante su proceso de producción55
.
55
Oliver, A. Integración de materiales de cambio de fase en placas de yeso reforzadas con fibras de
polipropileno. Aplicación a sistemas de refrigeración y calefacción pasivos para almacenamiento de
calor latente en edificios. Tesis Doctoral. E.T.S. Arquitectura, Universidad Politécnica de Madrid
(2009).
Introducción │20
_____________________________________________________________________________
Cellat et al.56
estudiaron el efecto de incorporar diferentes cantidades de
butilestearato en hormigón hasta un máximo de un 10%, concluyendo que la fuerza de
compresión del hormigón disminuía al aumentar la cantidad de PCM adicionada, siendo
la dosis máxima recomendada de PCM de un 5%.
Este método de incorporación de PCM, presenta ciertas limitaciones técnicas como
la exudación que puede presentar el PCM cuando se lleva a cabo su proceso de fusión
tal y como se ha referenciado en diferentes trabajos de investigación57-60
.
En 1991, Feldman et al.59
incorporaron un 21-22% de butilestearato en un panel de
yeso durante su proceso de producción facilitada por la adición de agentes dispersantes.
Obtuvieron un panel con propiedades físico mecánicas similares a las del panel estándar
pero con diez veces más de capacidad de almacenamiento térmico. Este desarrollo
experimental mostró que este método de adición de PCM es un concepto aplicable a
gran escala.
Li et al.61
investigaron la exudación que se producía al adicionar parafina al
hormigón, relacionándolo con el ratio agua/hormigón empleado.
Así mismo, es importante verificar que las propiedades mecánicas del material se
conservan tras la adición de los PCM, ya que pueden producirse reducciones en la
resistencia a la compresión de los mismos62
, especialmente si la cantidad del PCM es
superior al 20% en peso54
en el caso del yeso o superior al 5% en el caso del hormigón.
Inmersión
Este método de incorporación de PCM consiste en la inmersión de los materiales
constructivos porosos63
(como yeso, espuma de poliuretano o ladrillos) en el material
cambio de fase en estado líquido, de manera que el PCM se absorba por capilaridad. La
56
Cellat, K., Beyhan, B., Kazanci, B., Konuklu, Y. & Paksoy, H. Direct incorporation of butyl stearate
as phase change material into concrete for energy saving in buildings. J. Clean Energy Tech. 5, 1, 64–
68 (2017). 57
De Gracia, A. & Cabeza, L. F. Phase change materials and thermal energy storage for buildings.
Energy Build. 103, 414–419 (2015). 58
Hawes, D. W., Banu, D. & Feldman, D. Latent heat storage in concrete. Sol. Energy Mater. 19, 335–
348 (1989). 59
Feldman, D., Banu, D., Hawes, D. & Ghanbari, E. Obtaining an energy storing building material by
direct incorporation of an organic phase change material in gypsum wallboard. Sol. Energy Mater. 22,
231–242 (1991). 60
Cui, Y., Xie, J., Liu, J. & Pan, S. Review of phase change materials integrated in building walls for
energy saving. Procedia Eng. 121, 763–770 (2015). 61
Li, H., Chen, H., Li, X. & Sanjayan, J. G. Development of thermal energy storage composites and
prevention of PCM leakage. App. Energy. 135, 225–233 (2014). 62
Karaipekli, A. & Sarı, A. Development and thermal performance of pumice/organic PCM/gypsum
composite plasters for thermal energy storage in buildings. Sol. Energy Mater. Sol. Cells 149, 19–28
(2016). 63
Zhou, D., Zhao, C. Y. & Tian, Y. Review on thermal energy storage with phase change materials
(PCMs) in building applications. App. Energy 92, 593–605 (2012).
Introducción │21
_____________________________________________________________________________
estructura porosa de los materiales realiza la función de transportar el calor a los poros
en los que se encuentra el material cambio de fase.
En 1989 Kedl and Stovall64
, presentaron el concepto de un panel de yeso
impregnado con octadecano para la aplicación de almacenamiento térmico. Dicho
proceso fue escalado desde muestras pequeñas hasta paneles de tamaño real
demostrando que el proceso de inmersión podía lograr mayores capacidades de
almacenamiento que la adición de pellets rellenos de PCM durante el proceso de
fabricación del panel.
Posteriormente, Shapiro65,66
estudió la incorporación en yeso de otros PCM basados
en metil-ésteres y en mezclas de ácidos grasos, obteniendo resultados prometedores en
cuanto a capacidad de almacenamiento.
Fue también en el año 1989 cuando Hawes et al.67
introdujeron la técnica de
inmersión de PCMs en el hormigón. Concluyeron que la eficiencia y el tiempo de
inmersión requerido por el PCM para rellenar los poros del hormigón dependía,
fundamentalmente, de la capacidad de absorción del hormigón, del PCM empleado y de
la temperatura del PCM. Posteriormente, Lee et al.68
observaron que el empleo de
parafinas para la técnica de inmersión en hormigón producía fugas en algunas tipologías
de mismo.
Al igual que en el caso de la incorporación directa, se han constatado problemas de
exudaciones a largo plazo y la eventual interacción con algunos componentes del
edificio, provocando una reducción de la durabilidad de los elementos constructivos69,70
.
Encapsulación
Debido a los problemas de exudación y durabilidad que presentan las soluciones
expuestas anteriormente, la encapsulación de los PCM se presenta como una potencial
alternativa para su inclusión en los materiales constructivos. Mediante la encapsulación,
el PCM queda confinado en el interior de una matriz que previene de la exudación y con
64
Kedl, R. J. & Stovall, T. K. Activities in support of the wax-impregnated wallboard concept. U.S.
Department of Energy: thermal energy storage researches activity review. New Orleans, Louisiana,
USA (1989). 65
Shapiro, M. Development of the enthalpy storage materials, mixture of methyl stearate and methyl
palmitate. Florida Solar Energy Center (1989). 66
Shapiro, M. Development of the enthalpy storage materials, mixture of capric acid and lauric acid
with fire retardants. Florida Solar Energy Center (1989). 67
Hawes, D.W., Banu, D. & Feldman, D. Latent heat storage in concrete. Sol. Energy Mater. 19, 3–5,
335–348 (1989). 68
Lee, T., Hawes, D.W., Banu, D. & Feldman, D. Control aspects of latent heat storage and recovery in
concrete. Sol. Energy Mater. Sol. Cells 62, 217–237 (2000). 69
Soares, N., Costa, J. J., Gaspar, A. R. & Santos, P. Review of passive PCM latent heat thermal energy
storage systems towards buildings’ energy efficiency. Energy Build. 59, 82–103 (2013). 70
Memon, S. A. Phase change materials integrated in building walls: A state of the art review. Renew.
Sustain. Energy Rev. 31, 870–906 (2014).
Introducción │22
_____________________________________________________________________________
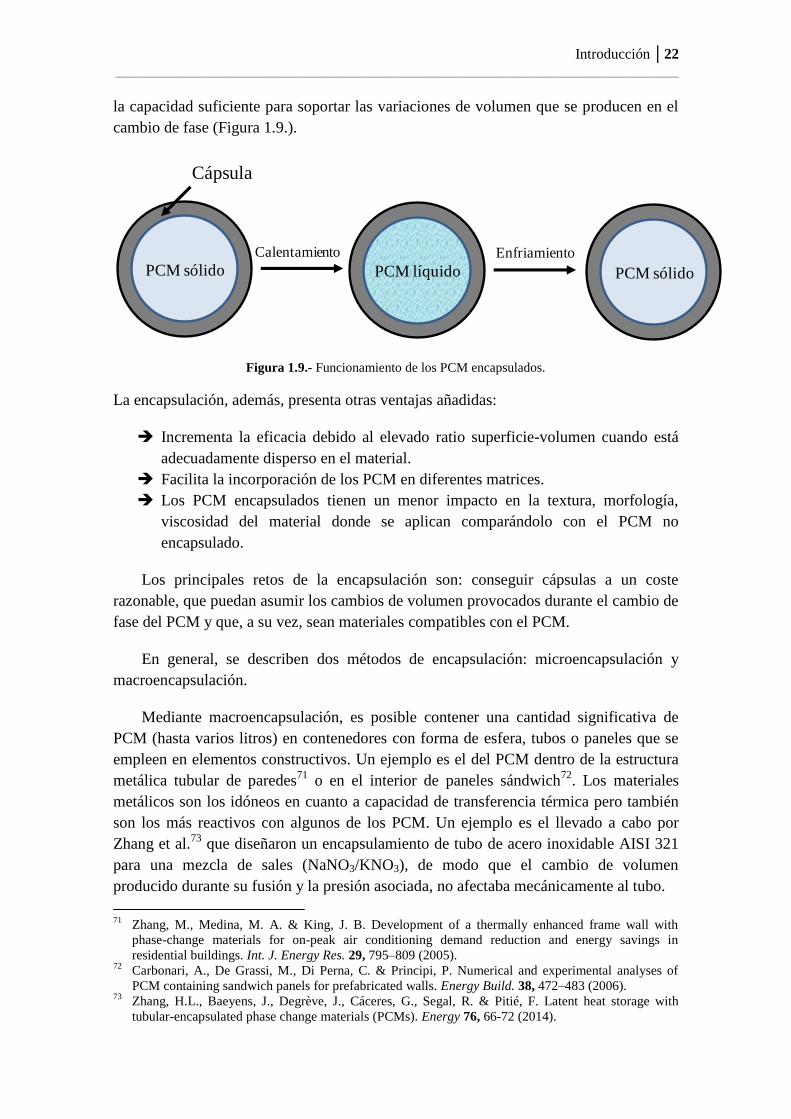
la capacidad suficiente para soportar las variaciones de volumen que se producen en el
cambio de fase (Figura 1.9.).
Figura 1.9.- Funcionamiento de los PCM encapsulados.
La encapsulación, además, presenta otras ventajas añadidas:
Incrementa la eficacia debido al elevado ratio superficie-volumen cuando está
adecuadamente disperso en el material.
Facilita la incorporación de los PCM en diferentes matrices.
Los PCM encapsulados tienen un menor impacto en la textura, morfología,
viscosidad del material donde se aplican comparándolo con el PCM no
encapsulado.
Los principales retos de la encapsulación son: conseguir cápsulas a un coste
razonable, que puedan asumir los cambios de volumen provocados durante el cambio de
fase del PCM y que, a su vez, sean materiales compatibles con el PCM.
En general, se describen dos métodos de encapsulación: microencapsulación y
macroencapsulación.
Mediante macroencapsulación, es posible contener una cantidad significativa de
PCM (hasta varios litros) en contenedores con forma de esfera, tubos o paneles que se
empleen en elementos constructivos. Un ejemplo es el del PCM dentro de la estructura
metálica tubular de paredes71
o en el interior de paneles sándwich72
. Los materiales
metálicos son los idóneos en cuanto a capacidad de transferencia térmica pero también
son los más reactivos con algunos de los PCM. Un ejemplo es el llevado a cabo por
Zhang et al.73
que diseñaron un encapsulamiento de tubo de acero inoxidable AISI 321
para una mezcla de sales (NaNO3/KNO3), de modo que el cambio de volumen
producido durante su fusión y la presión asociada, no afectaba mecánicamente al tubo.
71
Zhang, M., Medina, M. A. & King, J. B. Development of a thermally enhanced frame wall with
phase-change materials for on-peak air conditioning demand reduction and energy savings in
residential buildings. Int. J. Energy Res. 29, 795–809 (2005). 72
Carbonari, A., De Grassi, M., Di Perna, C. & Principi, P. Numerical and experimental analyses of
PCM containing sandwich panels for prefabricated walls. Energy Build. 38, 472–483 (2006). 73
Zhang, H.L., Baeyens, J., Degrève, J., Cáceres, G., Segal, R. & Pitié, F. Latent heat storage with
tubular-encapsulated phase change materials (PCMs). Energy 76, 66-72 (2014).
PCM sólido
Calentamiento
PCM líquido PCM sólido
Cápsula
Enfriamiento
Introducción │23
_____________________________________________________________________________
Se considera que este tipo de técnica puede causar un impacto negativo en algunos
componentes por el deterioro que puede provocar en la estructura del edificio.
La microencapsulación hace posible integrar el PCM dentro de una cápsula
compatible con los materiales constructivos sin afectar negativamente a su
durabilidad74
. Así mismo, ofrece una mayor velocidad de transferencia térmica ya que
proporciona una mayor área superficial por volumen. Existen PCM microencapsulados
de naturaleza orgánica e inorgánica.
Sari et al.75
prepararon cápsulas de polimetilmetacrilato (PMMA) que contenían un
43% en peso de n-octacosano en su interior, obteniendo una distribución del tamaño de
partícula homogénea controlada con una estructura química estable que no se
modificaba con los ciclos térmicos. Existen varios productos comerciales de la
compañía química BASF (Badische Anilin- und Soda-Fabrik), como por ejemplo la
marca Micronal76
que contiene PCM parafínicos con diferentes intervalos de fusión y
que pueden ser añadidos a diferentes materiales constructivos.
En general, la mayor desventaja de las cápsulas de naturaleza orgánica es su
inflamabilidad y su baja conductividad térmica que podrían mejorar mediante el empleo
de cápsulas de naturaleza inorgánica77
.
Una de las últimas innovaciones, se centra en el desarrollo de micro/nanocápsulas
de sílice rellenas de PCM, sintetizadas vía sol-gel, combinado con emulsiones de aceite
en agua (Oil in Water emulsion, O/W)78
. Así, las microcápsulas de sílice poseen formas
y tamaños apropiados para poder introducir los PCM en cualquier tipo de sistema dado
que permiten formar una matriz homogénea y, en consecuencia, evitan el uso de
estructuras secundarias y/o fugas del PCM.
Zhang et al.79
mostraron la microencapsulación de n-octadecano mediante esta
tecnología estudiando el efecto de diferentes ratios de n-octadecano/tetraetilortosilicato
(TEOS) y de diferentes pH y obteniendo morfologías esféricas de tamaños entre 7 y
16µm.
74
Salunkhe, P. B. & Shembekar, P. S. A review on effect of phase change material encapsulation on the
thermal performance of a system. Renew. Sustain. Energy Rev. 16, 5603–5616 (2012). 75
Sarı, A., Alkan, C., Karaipekli, A. & Uzun, O. Microencapsulated n-octacosane as phase change
material for thermal energy storage. Sol. Energy 83, 1757–1763 (2009). 76
http://www.micronal.de/portal/basf/ien/dt.jsp?setCursor=1_290823. 77
Fang, G., Chen, Z. & Li, H. Synthesis and properties of microencapsulated paraffin composites with
SiO2 shell as thermal energy storage materials. Chem. Eng. J. 163, 154–159 (2010). 78
Giro-Paloma, J., Martínez, M., Cabeza, L. & Fernández, I. Types, methods, techniques, and
applications for microencapsulated phase change materials (MPCM): A review. Renew. Sustain.
Energy Rev. 53, 1059–1075 (2016). 79
Zhang, H., Wang, X. & Wu, D. Silica encapsulation of n-octadecane via sol–gel process: A novel
microencapsulated phase-change material with enhanced thermal conductivity and performance. J.
Coll. Inter. Sci. 343, 246–255 (2010).
Introducción │24
_____________________________________________________________________________
Liang et al.80
han investigado la nanoencapsulación de n-octadecano con la misma
técnica de hidrólisis interfacial y policondensación en miniemulsión. Estudiaron la
obtención de diferentes morfologías y tamaños (entre 160 y 560nm) mediante la
modificación de los ratios agua/etanol en la miniemulsión. Así mismo, analizaron el
efecto del tamaño en los cambios de fusión del material.
Destaca así mismo, el trabajo realizado por Goitandia81
en el que se llevó a cabo el
encapsulado de hexadecano, optimizando tanto el proceso de emulsificación de los
PCM (O/W) como el proceso sol-gel de crecimiento de una coraza de sílice sin
desestabilizar las gotas de PCM. Posteriormente, se incorporaron las cápsulas a una
espuma rígida de poliuretano analizando las peculiaridades del proceso de espumado.
Su incorporación, demostró que modificaba ligeramente la estructura celular original de
las espumas de poliuretano, obteniéndose espumas con celdas de menor tamaño que
contribuían a mejorar las propiedades mecánicas de las nuevas espumas presentando
esfuerzos de compresión un 30 % superiores al de la espuma convencional.
La mayor desventaja del empleo de microcápsulas de PCM reside en su coste de
fabricación y en que sufren sobre-enfriamiento y segregación de fases durante su
transición82
, haciendo que el PCM se mantenga líquido por debajo de su punto de
cristalización. Esto se debe a que las geometrías microscópicas se comportan de manera
diferente a las macroscópicas83
.
Impregnación en soportes porosos
Otra alternativa para incorporar los PCM en componentes constructivos está basada
en la infiltración en soportes porosos84-86
, que posteriormente se dispersan en los
materiales constructivos. Este método se diferencia del método de inmersión
anteriormente explicado, en que dicha inmersión se realizaba directamente en los
materiales constructivos (como el yeso) y, en este caso, el material poroso que se
impregna es generalmente micrométrico y, posteriormente, se dispersa en el material
80
Liang, S., Li, Q., Zhu, Y., Chen, K., Tian, C., Wang, J. & Bai, R. Nanoencapsulation of n-octadecane
phase change material with silica shell through interfacial hydrolysis and polycondensation in
miniemulsion. Energy 93, 1684–1692 (2015). 81
Goitandia, A. M. Materiales con cambio de fase (PCMs) soportados en matrices inorgánicas:
preparación, estudio y aplicación. Tesis Doctoral. Universidad del País Vasco (2015). 82
Tyagi, V.V., Kaushik, S.C., Tyagi, S.K. & Akiyama, T. Development of phase change materials based
microencapsulated technology for buildings: A review. Renew. Sustain. Energy Rev. 15, 2, 1373–1391
(2011). 83
Huang, L., Günther, E., Doetsch, C. & Mehling, H. Subcooling in PCM emulsions—Part 1:
Experimental. Thermoch. Acta 509, 93–99 (2010). 84
Sarı, A. & Karaipekli, A. Preparation, thermal properties and thermal reliability of palmitic
acid/expanded graphite composite as form-stable PCM for thermal energy storage. Sol. Energy Mater.
Sol. Cells 93, 571–576 (2009). 85
Goitandia, A. M., Beobide, G., Aranzabe, E. & Aranzabe, A. Development of content-stable phase
change composites by infiltration into inorganic porous supports. Sol. Energy Mater. Sol. Cells 134,
318–328 (2015). 86
Zalba, B., Marín, J., Cabeza, L. F. & Mehling, H. Review on thermal energy storage with phase
change: materials, heat transfer analysis and applications. App. Therm. Eng. 23, 251–283 (2003).
Introducción │25
_____________________________________________________________________________
constructivo. Existen dos métodos de infiltración87
: la impregnación capilar, que se
lleva a cabo a presión atmosférica, y la impregnación a vacío que ha demostrado ser
más eficiente en algunos sistemas.
Diversos investigadores han trabajado con materiales macroporosos como soportes,
siendo el grafito, la diatomita y la perlita los más estudiados. Jeong et al.88
trabajaron en
el desarrollo de composites de PCM/diatomita empleando hexadecano y octadecano
como PCM y obteniendo hasta un 50% de PCM en el composite final mediante un
proceso de impregnación a vacío. Posteriormente, Konuklu et al.89
estudiaron la
fabricación de un composite mediante impregnación directa al considerarse un proceso
simple y de aplicación industrial. Mediante esta tecnología lograron fabricar
composites con hasta un 32% de PCM.
Más recientemente, algunos autores han trabajado con composites basados en
soportes mesoporosos. Concretamente, Goitandia et al.81
estudiaron sólidos con
diferente tamaño de poro cubriendo desde microporos hasta macroporos y optimizaron
los procesos de impregnación a vacío para los diferentes sólidos (bentonita, zeolita,
tierras diatomeas y grafito expandido). Concluyeron que el PCM exudaba de los
materials macroporosos pero no sucedía lo mismo en el caso de los materiales
mesoporosos con canales nanométricos.
1.5. Empleo de recubrimientos fríos en edificación
La obtención de materiales coloreados con buen comportamiento frente a la
radiación solar, hace necesario el empleo de pigmentos con alta reflectividad en el
infrarrojo cercano (“cool pigments”) que al ser añadidos a una formulación de
recubrimiento o pintura, les aporte el color y el efecto térmico deseados. Existen varios
desarrollos de pigmentos que consisten en óxidos de metales de transición y de tierras
raras que muestran dos desventajas principales: el precio y su baja disponibilidad.
Muchos de estos pigmentos contienen, además, en su formulación metales tóxicos por
lo que su consumo está siendo limitado90
.
87
Nomura, T., Okinaka, N. & Akiyama, T. Impregnation of porous material with phase change material
for thermal energy storage. Mater. Chem. Phys. 115, 846–850 (2009). 88
Jeong, S., Jeon, J., Lee, J. & Kim, S. Optimal preparation of PCM/diatomite composites for enhancing
thermal properties. Int. J. Heat. Mass. Trans. 62, 711–717 (2013). 89
Konuklu, Y., Ersoy, O. & Gokce, O. Easy and industrially applicable impregnation process for
preparation of diatomite-based phase change material nanocomposites for thermal energy storage.
App.Therm. Eng. 91, 759–766 (2015). 90
Raj, A. K. V., Prabhakar Rao, P., Sameera, S. & Divya, S. Pigments based on terbium-doped yttrium
cerate with high NIR reflectance for cool roof and surface coating applications. Dye. Pigment. 122,
116–125 (2015).
Introducción │26
_____________________________________________________________________________
Existen diferentes estudios centrados en la obtención de “cool pigments” en los que
se utilizan diferentes estrategias: (i) nanopigmentos91
, (ii) pigmentos dopados y (iii)
sustitución por otros metales.
Las nanopartículas tienen un alto ratio superficie/volumen y por tanto una mayor
área superficial para reflejar la radiación solar que les incide. Sin embargo, dependiendo
de la geometría de la partícula, ésta puede generar scattering de luz generando un
fenómeno de absorción y obteniendo, por ello, el efecto contrario al deseado.
Soumya et al.92
fabricaron nanopigmentos de ZnO dopados con aluminio de un
tamaño aproximado de 260nm y los dispersaron posteriormente en PMMA
(polimetilmetacrilato) para la fabricación de recubrimientos. Se obtuvo una reducción
del calor en la superficie de vidrio pintada con un 0.7% del pigmento fabricado.
Existen algunos desarrollos de nanohilos de Na2V6O6·xH2O que aportan una mejora
sustancial en su capacidad de reflejar la radiación93
, siendo su reflectancia espectral de
entre 62% y 76% en el intervalo de 700 a 1000nm o el caso de los pigmentos de color
verde basados en Y2BaCuO594
que aportaban un 61% de reflectancia en la longitud de
onda de 1100nm.
En relación a los pigmentos dopados, Zou et al. 95
trabajaron con estructuras de
rutilo dopado con algunos metales que son capaces de aportarles el color deseado.
Existen otros desarrollos como el pigmento amarillo de BiVO4 dopado con tántalo96
que
exhibe una reflectancia de hasta un 86.6%.
Se referencian otros grupos de investigación centrados en la sustitución de los
metales tóxicos por otros con menor impacto. Un ejemplo es el desarrollo de pigmentos
en base itrio (YFexMn1-xO3)97,98
dopado con hierro que también presentan alta
reflectancia.
91
Song, J., Qin, J., Qu, J., Song, Z., Zhang, W., Xue, X., Shi, Y. & Zhang, T. The effects of particle size
distribution on the optical properties of titanium dioxide rutile pigments and their applications in cool
non-white coatings. Sol. Energy Mater. Sol. Cells 130, 42–50 (2014). 92
Soumya, S., Mohamed, A.P., Mohan, K. & Ananthakumar, S. Enhanced near-infrared reflectance and
functional characteristics of Al-doped ZnO nano-pigments embedded PMMA coatings. Sol. Energy
Mater. Sol. Cells 143, 335–346 (2015). 93
Han, A., Zhou, Y., Ye, M., Feng, S., Du, H. & Yang, R. Near-infrared reflectance and thermal
performance of Na2V6O16·xH2O nanoribbon as a novel cool brown pigment. Dye. Pigment. 123, 242–
247 (2015). 94
Jose, S., Prakash, A., Laha, S., Natarajan, S. & Reddy, M. L. Green colored nano-pigments derived
from Y2BaCuO5: NIR reflective. Dye. Pigment. 107, 118–126 (2014). 95
Zou, J., Zhang, P., Liu, C. & Peng, Y. Highly dispersed (Cr, Sb)-co-doped rutile pigments of cool
color with high near-infrared reflectance. Dye. Pigment. 109, 113–119 (2014). 96
Kumari, L. S., Rao, P. P., Radhakrishnan, A. N. P., James, V., Sameera, S. & Koshy, P. Brilliant
yellow color and enhanced NIR reflectance of monoclinic BiVO4 through distortion in VO43-
tetrahedral. Sol. Energy Mater. Sol. Cells 112, 134–143 (2013). 97
Jose, S., Jayaprakash, A., Laha, S., Natarajan, S., Nishanth, K. G. & Reddy, M. L. P. YIn0.9Mn0.1O3–
ZnO nano-pigment exhibiting intense blue color with impressive solar reflectance. Dye. Pigment. 124,
120–129 (2016).

Introducción │27
_____________________________________________________________________________
En el caso del color azul, los pigmentos basados en cobalto se presentan como los
más importantes dentro del mercado de los “cool pigments”. Sin embargo, el cobalto es
escaso y tiene un precio elevado99
y el desarrollo de una alternativa a este pigmento se
muestra como una oportunidad de mercado de alto interés.
1.6. Pigmentos de altas prestaciones
Los pigmentos de altas prestaciones (High Performance Pigments o HPP) son
pigmentos100
que confieren características especiales al producto en el que están
dispersos. Son pigmentos que muestran un comportamiento superior con el calor, luz,
humedad o resistencia química en la aplicación final. En general, los HPP son
excelentes en comportamiento, duraderos en la aplicación y deben proporcionar un
valor añadido al usuario final a pesar de tener un precio elevado.
En general, el término HPP se aplica a pigmentos orgánicos, ya que existe una
limitación importante en cuanto a la química disponible para los HPP inorgánicos y en
las últimas décadas se han desarrollado muy pocos productos nuevos101
.
Algunos autores consideran los “cool pigments” como una subfamilia de los HPP101
y han logrado cuantificar el beneficio en relación a la substitución de un pigmento
convencional por un “cool pigment” siendo de 15€ por kilo y año.
Los pigmentos comerciales inorgánicos existentes dentro de los cool pigments,
forman parte de la familia de los CICP (Complex Inorganic Colored Pigments) siendo
óxidos con estructuras similares al rutilo, hematites o espinela y que incluyen metales
de transición que les aportan el color (V, Cr, Mn, Fe, Co, Ni, Cu).
El precio de los HPP es significativamente superior al de los pigmentos clásicos y
existen muy pocos fabricantes de este tipo de producto.
98
Han, A., Ye, M., Zhao, M., Liao, J. & Wu, T. Crystal structure, chromatic and near-infrared reflective
properties of iron doped YMnO3 compounds as colored cool pigments. Dye. Pigment. 99, 527–530
(2013). 99
Bao, W., Ma, F., Zhang, Y., Hao, X., Deng, Z., Zou, X. & Gao, W. Synthesis and characterization of
Fe3+
doped Co0.5Mg0.5Al2O4 inorganic pigments with high near-infrared reflectance. Powder Technol.
292, 7–13 (2016). 100
http://www.inkworldmagazine.com/issues/2003-08/view_features/high-performance-pigments-
105024#sthash.mCv8xiVM.dpuf. 101
Faulkner, E. B. & Schwartz, R. J. High Performance Pigments, 2nd Edition. ISBN: 978-3-527-31405-
8 (2009).

Introducción │28
_____________________________________________________________________________
1.7. Proyecto Nanopigmy
Planteados los retos existentes en el campo de la eficiencia energética, IK4-
Tekniker trabajó en el desarrollo de HPP multifuncionales no existentes en el mercado,
en el marco del proyecto Nanopigmy (More than color: Applying nanotechnologies for
the multifunctional ceramic pigments development (FP7- Grant Agreement: 280393))
financiado por la Unión Europea bajo el contexto del Séptimo Programa Marco
(antecesor del actualmente vigente Horizon 2020).
El consorcio estuvo compuesto por socios de diferentes países que cubrían la
cadena de valor de los desarrollos: Nubiola (fabricante de pigmentos), Pinova
(fabricante de pinturas), PMB (fabricante de masterbatches), Acciona (usuario final del
sector de la construcción), CRF (usuario final de sector de automoción), BSRIA
(responsable de llevar a cabo el estudio de ciclo de vida y costes de los productos
desarrollados).
Dicho proyecto se desarrolló en los años (2012-2015) y fue coordinado
científicamente por Estíbaliz Aranzabe (IK4-Tekniker) que opta al grado de doctor
mediante el presente trabajo.
El objetivo global del proyecto era la fabricación de pigmentos multifuncionales
cerámicos que pudieran aportar a materiales (pinturas, cementos, plásticos)
pertenecientes al sector automoción y construcción, las funcionalidades requeridas, sin
necesidad de cambiar los procesos productivos de dichos materiales.
Dicho proyecto finalizó en 2015 generando varias formulaciones de pigmento que
actualmente se encuentran bajo secreto industrial. El impacto específico del pigmento
investigado en esta tesis se traduce en la reducción de consumo energético, la reducción
de la huella de carbono y la fabricación de productos de alto valor añadido que permiten
situar a Europa en clara posición de liderazgo en lo que a la fabricación de pigmentos se
refiere.


2. MOTIVACIÓN Y OBJETIVOS DEL TRABAJO

Motivación y objetivos del trabajo │31
_____________________________________________________________________________
2.1. Motivación
El rápido crecimiento económico, el aumento de población y los altos estándares de
vida, han generado un aumento de consumo de energía y, principalmente, de la energía
procedente de los combustibles fósiles. La combustión, extracción, elaboración y
transporte de estos combustibles fósiles tienen una consecuencia directa en la
contaminación y en el cambio climático.
Este escenario ha llevado a reconsiderar la ecuación energética aplicada en nuestra
sociedad buscando convertir nuestro sistema energético actual en un sistema más
sostenible. En este sentido, la jerarquía energética se considera una de las claves de esta
reorientación. Esta clasificación permite priorizar las opciones energéticas que
conducen hacia un sistema energético más sostenible dentro de las cuales, destacan el
ahorro y la eficiencia energética, en consonancia con lo que propone el nuevo concepto
de economía circular1. Producir, usar y tirar es la vieja ecuación de la economía "lineal".
Entramos en la era de la economía "circular", donde reducir, reusar y reciclar son los
principales componentes de esta nueva ecuación. En términos energéticos, el ahorro y la
eficiencia se definen como las claves dentro de este nuevo modelo de economía
sostenible.
Teniendo en cuenta que los edificios son los responsables de 40% del consumo
energético a nivel europeo y que aproximadamente el 70% de este consumo tiene como
fin último el acondicionamiento de espacios, se plantea como estratégico y prioritario
aplicar la mejora de la eficiencia energética en edificios y centrarla en la climatización
de los mismos, logrando, de este modo, una rehabilitación energética.
Para cumplir dicho objetivo, el material constructivo es clave y así mismo, lo son,
las tecnologías y procesos que se emplean para su fabricación. Actualmente, existen dos
estrategias empleadas, de manera prioritaria, para la mejora de la eficiencia energética
en edificación. Ambas consisten en la dispersión de “aditivos activos” en los materiales
constructivos finales (yeso, cemento, pintura, polímeros) siendo ambas estrategias
compatibles entre sí:
El empleo de materiales cambio de fase (PCM) que almacenan y liberan calor a
demanda actuando, de este modo, como “amortiguadores” de los cambios de
temperatura exterior. Este tipo de solución proporciona un efecto a nivel masa
(bulk) que aumenta su capacidad de almacenamiento con la cantidad de material
añadido y que se activa con los cambios de temperatura.
La utilización de pigmentos fríos (“cool”) para la obtención de materiales fríos,
que reflejan parte del calor emitido por la radiación solar para evitar el excesivo
1 Communication from the commission to the European Parliament, the council, the European
economic and social committee and the committee of the regions closing the loop - an EU Action plan
for the circular economy. COM/2015/0614 final (2015).
Motivación y objetivos del trabajo │32
_____________________________________________________________________________
calentamiento de los edificios. Estos materiales proporcionan un efecto a nivel
superficial que se activa con la radiación solar.
La fabricación e incorporación de este tipo de “aditivos activos” en materiales
constructivos, presenta limitaciones relacionadas con la complejidad del proceso de
fabricación e incorporación, el coste y la mono funcionalidad de los mismos.
Los materiales están en continua evolución, requiriéndose cada vez más
funcionalidades “extra”, generalmente alcanzables a través de la adición de diferentes
aditivos. La incorporación de varias funcionalidades pasa, por tanto, por la adición de
varios “aditivos activos” aumentado, de este modo, la complejidad del procesado final
de los materiales.
Se presenta por ello la necesidad del desarrollo de nuevos aditivos multifuncionales
de bajo coste, que mejoren la eficiencia energética, y que su fabricación e incorporación
en los materiales finales, no conlleve procesos complejos.
A continuación se detallan las limitaciones asociadas a las dos estrategias
mencionadas:
Materiales cambio de fase
Una de las aplicaciones más importantes donde los PCM están encontrando
mercado es el almacenamiento térmico en edificación, pero su incorporación en
diferentes materiales constructivos (yeso, cemento, pintura, polímero), puede causar
derrames y fugas de PCM durante su proceso de fusión.
Los últimos esfuerzos de investigación orientados a resolver esta problemática,
señalan a la microencapsulación de los PCM como potencial alternativa a los materiales
actuales. Sin embargo, esta tecnología, tiene aún ciertas barreras que superar: es una
tecnología cara, en algunos casos las cápsulas se rompen por los cambios de volumen
que generan los cambios de fase y la conductividad térmica a través de la cápsula es
baja. Algunos autores2-4
, han presentado los materiales porosos (que actúan como meros
soportes no activos), como una alternativa a la microencapsulación ya que poseen una
conductividad térmica mejorada, son capaces de absorber los cambios de volumen que
suceden en estos materiales durante su cambio de fase y reducen el coste de fabricación.
No obstante, la dispersión de PCM soportados en materiales porosos, requiere cambios
en el proceso productivo del material final (yeso, cemento, pintura, polímero) afectando
al coste de fabricación de los mismos. Así mismo, dichos materiales porosos no son
2 Sarı, A. & Karaipekli, A. Preparation, thermal properties and thermal reliability of palmitic
acid/expanded graphite composite as form-stable PCM for thermal energy storage. Sol. Energy Mater.
Sol. Cells 93, 571–576 (2009). 3 Goitandia, A. M., Beobide, G., Aranzabe, E. & Aranzabe, A. Development of content-stable phase
change composites by infiltration into inorganic porous supports. Sol. Energy Mater. Sol. Cells 134,
318–328 (2015). 4 Zalba, B., Marín, J., Cabeza, L. F. & Mehling, H. Review on thermal energy storage with phase
change: materials, heat transfer analysis and applications. App. Therm. Eng. 23, 251–283 (2003).
Motivación y objetivos del trabajo │33
_____________________________________________________________________________
funcionales, actúan como meros soportes y en caso de requerir el material final
funcionalidades añadidas, éstas deberán ser otorgadas por medio de la adición de otro
tipo de aditivos.
Materiales o recubrimientos fríos (“cool”)
Recientemente, se ha incrementado el uso de pigmentos funcionales (englobados
dentro de los denominados High Performance Pigments o HPP). La simplificación de su
aplicación reside en que el fabricante del material constructivo final, tan solo cambia un
pigmento por otro, sin necesidad de cambiar sus procesos productivos (como ocurre en
el caso de la adición de los materiales cambio de fase encapsulados o soportados en
materiales porosos). En este sentido, existe una tipología de pigmentos denominados
“cool pigments” con propiedades como la alta reflexión en el espectro solar, cuyo precio
es aún muy elevado en comparación con los pigmentos cerámicos actuales (40€/kg
frente a 2-4€/kg del pigmento cerámico azul ultramar) debido a sus complejos procesos
de fabricación. En este caso, los pigmentos proporcionan color y una funcionalidad de
superficie fría pero, si se requirieran funcionalidades añadidas, éstas deberán ser
otorgadas por medio de la adición de otro tipo de aditivos.
En este contexto, y tomando como base la simpleza de aplicación de los HPP en los
que el fabricante del material constructivo final, tan solo cambia un pigmento por otro,
sin necesidad de cambiar sus procesos productivos, surge la oportunidad de superar
técnico-económicamente a los HPP, desarrollando una nueva generación de pigmentos
que provea a los materiales de las multifuncionalidades deseadas a través de la
modificación de un pigmento de bajo coste. De este modo, se logra un nuevo tipo de
pigmento no existente en el mercado, que combina la capacidad de almacenamiento
térmico y la alta reflexión en el infrarrojo cercano, capaz de transferir dichas
funcionalidades al material en el que se dispersa, a un bajo coste y sin necesidad de
cambiar el proceso productivo del material final.
Motivación y objetivos del trabajo │34
_____________________________________________________________________________
2.2. Objetivos
En este trabajo de investigación, se desarrolla una alternativa a los materiales
existentes en el mercado orientados a la mejora de la eficiencia energética en edificios,
superando las problemáticas que presentan actualmente. Para ello, la investigación se
centra en el desarrollo de un nuevo HPP multifuncional, con capacidad de
almacenamiento térmico y alta reflectancia en el infrarrojo cercano, basado en un
pigmento de bajo coste como es el azul ultramar. De este modo, ambas funcionalidades
son transferidas al material a través de la doble funcionalidad del pigmento, que ya de
por sí posee, además, la función de dar color al material final. Por tanto, se logra la
simplificación en la fabricación del material constructivo final, al producirse mediante
el cambio un pigmento por otro, sin necesidad de cambiar sus procesos productivos.
Este desarrollo permite, así mismo, aumentar el espectro de empleo del pigmento a
otros sectores.
Los objetivos específicos son los siguientes:
Fabricar un pigmento con capacidad de almacenamiento térmico a través de la
modificación del pigmento cerámico azul ultramar, generando un tipo de
pigmento funcional no existente en el mercado.
Fabricar un pigmento con una alta reflexión en el espectro solar a partir de un
pigmento de bajo coste (azul ultramar) generando, de este modo, un pigmento de
un coste un 30% menor a los actuales denominados cool pigments.
Fabricar un pigmento con las dos funcionalidades descritas, en un único
pigmento (de base azul ultramar) generando, de este modo, un pigmento
multifuncional (actualmente no existente en el mercado), de un coste menor a
los actuales denominados High Performance Pigments (HPPs), de unas
prestaciones superiores y de un espectro de aplicación más amplio que los
pigmentos convencionales.
Escalar a nivel de planta piloto los desarrollos obtenidos.
Validar a escala de laboratorio los pigmentos funcionales desarrollados.
Validar a escala real al menos uno de los pigmentos funcionales desarrollados.
A través de la consecución de estos objetivos se ha logrado que este material
desarrollado (pigmento multifuncional) pueda ser aplicado en la rehabilitación
energética de edificios reduciendo, de este modo, el consumo energético por
climatización y teniendo una repercusión directa en la disminución de la contaminación.
Estos objetivos están, por tanto, alineados con las estrategias vasca y europeas de
aumento de la eficiencia energética y se enmarcan dentro del concepto de economía
circular en el que se prima reducir (reducción del consumo energético) y reusar
(rehabilitación de edificios).


3. VISIÓN GLOBAL DE LOS HALLAZGOS

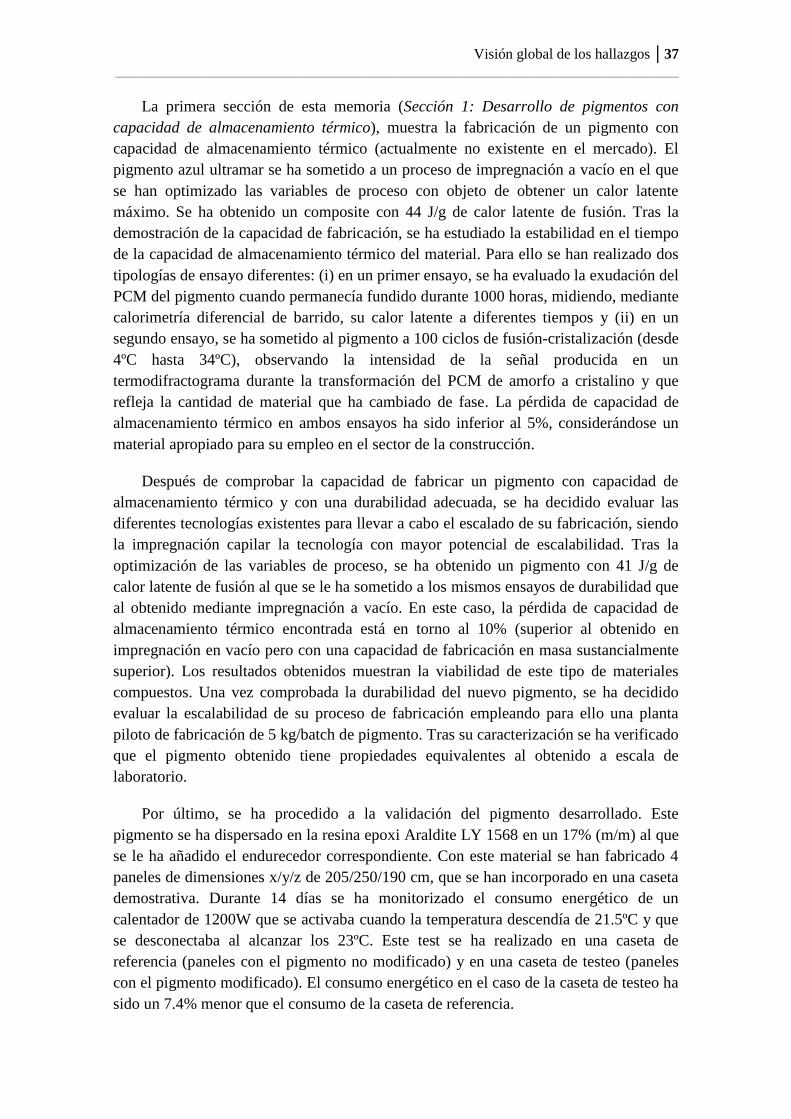
Visión global de los hallazgos │37
_____________________________________________________________________________
La primera sección de esta memoria (Sección 1: Desarrollo de pigmentos con
capacidad de almacenamiento térmico), muestra la fabricación de un pigmento con
capacidad de almacenamiento térmico (actualmente no existente en el mercado). El
pigmento azul ultramar se ha sometido a un proceso de impregnación a vacío en el que
se han optimizado las variables de proceso con objeto de obtener un calor latente
máximo. Se ha obtenido un composite con 44 J/g de calor latente de fusión. Tras la
demostración de la capacidad de fabricación, se ha estudiado la estabilidad en el tiempo
de la capacidad de almacenamiento térmico del material. Para ello se han realizado dos
tipologías de ensayo diferentes: (i) en un primer ensayo, se ha evaluado la exudación del
PCM del pigmento cuando permanecía fundido durante 1000 horas, midiendo, mediante
calorimetría diferencial de barrido, su calor latente a diferentes tiempos y (ii) en un
segundo ensayo, se ha sometido al pigmento a 100 ciclos de fusión-cristalización (desde
4ºC hasta 34ºC), observando la intensidad de la señal producida en un
termodifractograma durante la transformación del PCM de amorfo a cristalino y que
refleja la cantidad de material que ha cambiado de fase. La pérdida de capacidad de
almacenamiento térmico en ambos ensayos ha sido inferior al 5%, considerándose un
material apropiado para su empleo en el sector de la construcción.
Después de comprobar la capacidad de fabricar un pigmento con capacidad de
almacenamiento térmico y con una durabilidad adecuada, se ha decidido evaluar las
diferentes tecnologías existentes para llevar a cabo el escalado de su fabricación, siendo
la impregnación capilar la tecnología con mayor potencial de escalabilidad. Tras la
optimización de las variables de proceso, se ha obtenido un pigmento con 41 J/g de
calor latente de fusión al que se le ha sometido a los mismos ensayos de durabilidad que
al obtenido mediante impregnación a vacío. En este caso, la pérdida de capacidad de
almacenamiento térmico encontrada está en torno al 10% (superior al obtenido en
impregnación en vacío pero con una capacidad de fabricación en masa sustancialmente
superior). Los resultados obtenidos muestran la viabilidad de este tipo de materiales
compuestos. Una vez comprobada la durabilidad del nuevo pigmento, se ha decidido
evaluar la escalabilidad de su proceso de fabricación empleando para ello una planta
piloto de fabricación de 5 kg/batch de pigmento. Tras su caracterización se ha verificado
que el pigmento obtenido tiene propiedades equivalentes al obtenido a escala de
laboratorio.
Por último, se ha procedido a la validación del pigmento desarrollado. Este
pigmento se ha dispersado en la resina epoxi Araldite LY 1568 en un 17% (m/m) al que
se le ha añadido el endurecedor correspondiente. Con este material se han fabricado 4
paneles de dimensiones x/y/z de 205/250/190 cm, que se han incorporado en una caseta
demostrativa. Durante 14 días se ha monitorizado el consumo energético de un
calentador de 1200W que se activaba cuando la temperatura descendía de 21.5ºC y que
se desconectaba al alcanzar los 23ºC. Este test se ha realizado en una caseta de
referencia (paneles con el pigmento no modificado) y en una caseta de testeo (paneles
con el pigmento modificado). El consumo energético en el caso de la caseta de testeo ha
sido un 7.4% menor que el consumo de la caseta de referencia.
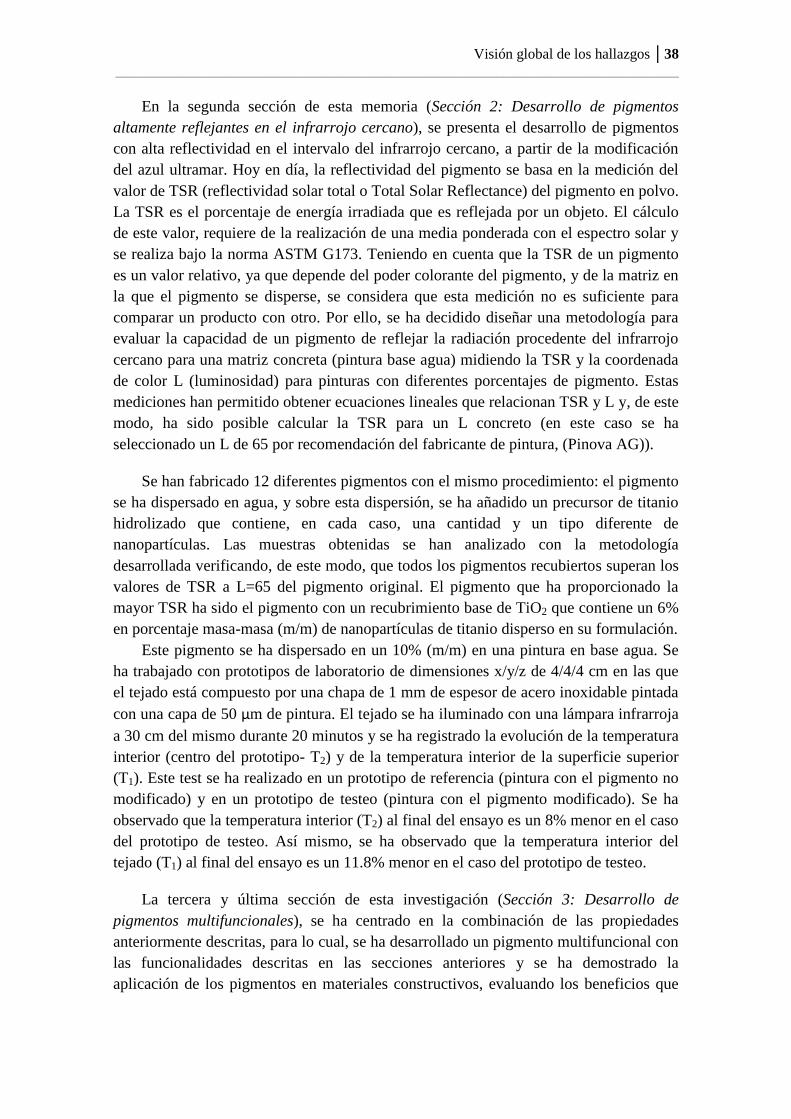
Visión global de los hallazgos │38
_____________________________________________________________________________
En la segunda sección de esta memoria (Sección 2: Desarrollo de pigmentos
altamente reflejantes en el infrarrojo cercano), se presenta el desarrollo de pigmentos
con alta reflectividad en el intervalo del infrarrojo cercano, a partir de la modificación
del azul ultramar. Hoy en día, la reflectividad del pigmento se basa en la medición del
valor de TSR (reflectividad solar total o Total Solar Reflectance) del pigmento en polvo.
La TSR es el porcentaje de energía irradiada que es reflejada por un objeto. El cálculo
de este valor, requiere de la realización de una media ponderada con el espectro solar y
se realiza bajo la norma ASTM G173. Teniendo en cuenta que la TSR de un pigmento
es un valor relativo, ya que depende del poder colorante del pigmento, y de la matriz en
la que el pigmento se disperse, se considera que esta medición no es suficiente para
comparar un producto con otro. Por ello, se ha decidido diseñar una metodología para
evaluar la capacidad de un pigmento de reflejar la radiación procedente del infrarrojo
cercano para una matriz concreta (pintura base agua) midiendo la TSR y la coordenada
de color L (luminosidad) para pinturas con diferentes porcentajes de pigmento. Estas
mediciones han permitido obtener ecuaciones lineales que relacionan TSR y L y, de este
modo, ha sido posible calcular la TSR para un L concreto (en este caso se ha
seleccionado un L de 65 por recomendación del fabricante de pintura, (Pinova AG)).
Se han fabricado 12 diferentes pigmentos con el mismo procedimiento: el pigmento
se ha dispersado en agua, y sobre esta dispersión, se ha añadido un precursor de titanio
hidrolizado que contiene, en cada caso, una cantidad y un tipo diferente de
nanopartículas. Las muestras obtenidas se han analizado con la metodología
desarrollada verificando, de este modo, que todos los pigmentos recubiertos superan los
valores de TSR a L=65 del pigmento original. El pigmento que ha proporcionado la
mayor TSR ha sido el pigmento con un recubrimiento base de TiO2 que contiene un 6%
en porcentaje masa-masa (m/m) de nanopartículas de titanio disperso en su formulación.
Este pigmento se ha dispersado en un 10% (m/m) en una pintura en base agua. Se
ha trabajado con prototipos de laboratorio de dimensiones x/y/z de 4/4/4 cm en las que
el tejado está compuesto por una chapa de 1 mm de espesor de acero inoxidable pintada
con una capa de 50 µm de pintura. El tejado se ha iluminado con una lámpara infrarroja
a 30 cm del mismo durante 20 minutos y se ha registrado la evolución de la temperatura
interior (centro del prototipo- T2) y de la temperatura interior de la superficie superior
(T1). Este test se ha realizado en un prototipo de referencia (pintura con el pigmento no
modificado) y en un prototipo de testeo (pintura con el pigmento modificado). Se ha
observado que la temperatura interior (T2) al final del ensayo es un 8% menor en el caso
del prototipo de testeo. Así mismo, se ha observado que la temperatura interior del
tejado (T1) al final del ensayo es un 11.8% menor en el caso del prototipo de testeo.
La tercera y última sección de esta investigación (Sección 3: Desarrollo de
pigmentos multifuncionales), se ha centrado en la combinación de las propiedades
anteriormente descritas, para lo cual, se ha desarrollado un pigmento multifuncional con
las funcionalidades descritas en las secciones anteriores y se ha demostrado la
aplicación de los pigmentos en materiales constructivos, evaluando los beneficios que
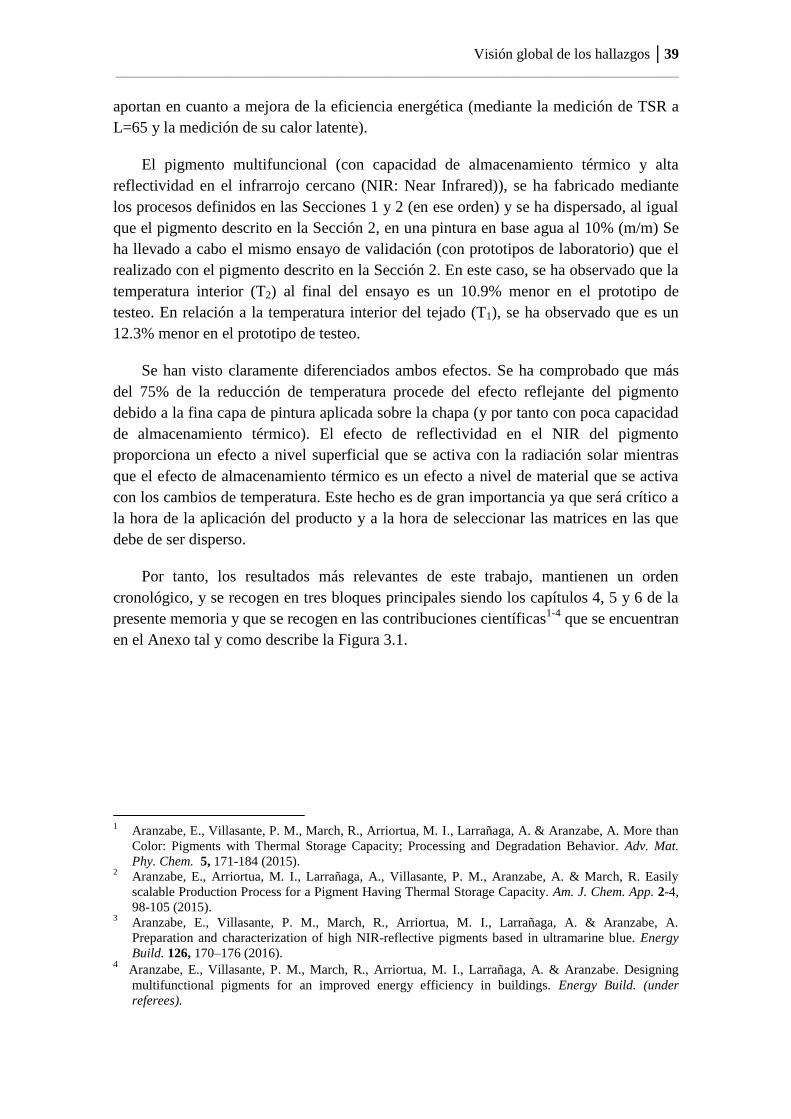
Visión global de los hallazgos │39
_____________________________________________________________________________
aportan en cuanto a mejora de la eficiencia energética (mediante la medición de TSR a
L=65 y la medición de su calor latente).
El pigmento multifuncional (con capacidad de almacenamiento térmico y alta
reflectividad en el infrarrojo cercano (NIR: Near Infrared)), se ha fabricado mediante
los procesos definidos en las Secciones 1 y 2 (en ese orden) y se ha dispersado, al igual
que el pigmento descrito en la Sección 2, en una pintura en base agua al 10% (m/m) Se
ha llevado a cabo el mismo ensayo de validación (con prototipos de laboratorio) que el
realizado con el pigmento descrito en la Sección 2. En este caso, se ha observado que la
temperatura interior (T2) al final del ensayo es un 10.9% menor en el prototipo de
testeo. En relación a la temperatura interior del tejado (T1), se ha observado que es un
12.3% menor en el prototipo de testeo.
Se han visto claramente diferenciados ambos efectos. Se ha comprobado que más
del 75% de la reducción de temperatura procede del efecto reflejante del pigmento
debido a la fina capa de pintura aplicada sobre la chapa (y por tanto con poca capacidad
de almacenamiento térmico). El efecto de reflectividad en el NIR del pigmento
proporciona un efecto a nivel superficial que se activa con la radiación solar mientras
que el efecto de almacenamiento térmico es un efecto a nivel de material que se activa
con los cambios de temperatura. Este hecho es de gran importancia ya que será crítico a
la hora de la aplicación del producto y a la hora de seleccionar las matrices en las que
debe de ser disperso.
Por tanto, los resultados más relevantes de este trabajo, mantienen un orden
cronológico, y se recogen en tres bloques principales siendo los capítulos 4, 5 y 6 de la
presente memoria y que se recogen en las contribuciones científicas1-4
que se encuentran
en el Anexo tal y como describe la Figura 3.1.
1 Aranzabe, E., Villasante, P. M., March, R., Arriortua, M. I., Larrañaga, A. & Aranzabe, A. More than
Color: Pigments with Thermal Storage Capacity; Processing and Degradation Behavior. Adv. Mat.
Phy. Chem. 5, 171-184 (2015). 2 Aranzabe, E., Arriortua, M. I., Larrañaga, A., Villasante, P. M., Aranzabe, A. & March, R. Easily
scalable Production Process for a Pigment Having Thermal Storage Capacity. Am. J. Chem. App. 2-4,
98-105 (2015). 3 Aranzabe, E., Villasante, P. M., March, R., Arriortua, M. I., Larrañaga, A. & Aranzabe, A.
Preparation and characterization of high NIR-reflective pigments based in ultramarine blue. Energy
Build. 126, 170–176 (2016). 4 Aranzabe, E., Villasante, P. M., March, R., Arriortua, M. I., Larrañaga, A. & Aranzabe. Designing
multifunctional pigments for an improved energy efficiency in buildings. Energy Build. (under
referees).
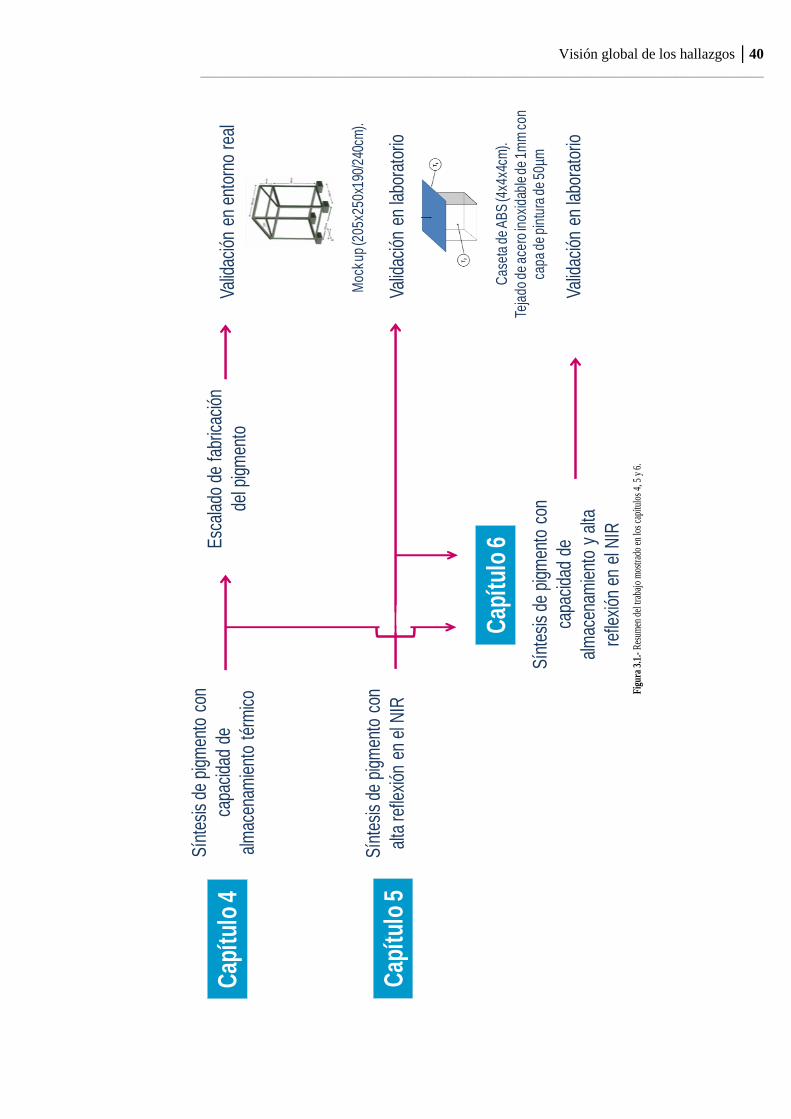
Visión global de los hallazgos │40
_____________________________________________________________________________
Fig
ura
3.1.
- Res
umen
del
trab
ajo
mos
trad
o en
los
capí
tulo
s 4,
5 y
6.
Cap
ítul
o 4
Cap
ítul
o 5
Sín
tesi
s de
pig
men
to c
on
capa
cida
d de
alm
acen
amie
nto
térm
ico
Esc
alad
o de
fab
ricac
ión
del p
igm
ento
Valid
ació
n en
ent
orno
rea
l
Sín
tesi
s de
pig
men
to c
on
alta
refle
xión
en
el N
IRVa
lidac
ión
en la
bora
torio
Cap
ítul
o 6
Sín
tesi
s de
pig
men
to c
on
capa
cida
d de
alm
acen
amie
nto
y al
ta
refle
xión
en
el N
IR
Valid
ació
n en
labo
rato
rio
Cas
eta
de A
BS
(4x4
x4cm
).
Teja
dode
ace
roin
oxid
able
de 1
mm
con
ca
pade
pin
tura
de 5
0µm
Moc
k up
(205
x250
x190
/240
cm).


4. Sección 1: DESARROLLO DE PIGMENTOS CON
CAPACIDAD DE ALMACENAMIENTO TÉRMICO
4.1. More than color: Pigments with thermal storage capacity;
processing and degradation behavior (Advances in
Materials Physics and Chemistry 5, 171-184 (2015)).
4.2. Easily scalable production process for a pigment having
thermal storage capacity (American Journal of Chemistry
and Applications 2(4), 98-105 (2015)).
4.3. Ultramarine blue pigment with thermal storage for
buildings (10th
Conference on Advanced Building Skins,
Oral Contribution, Bern, Switzerland (2015)).

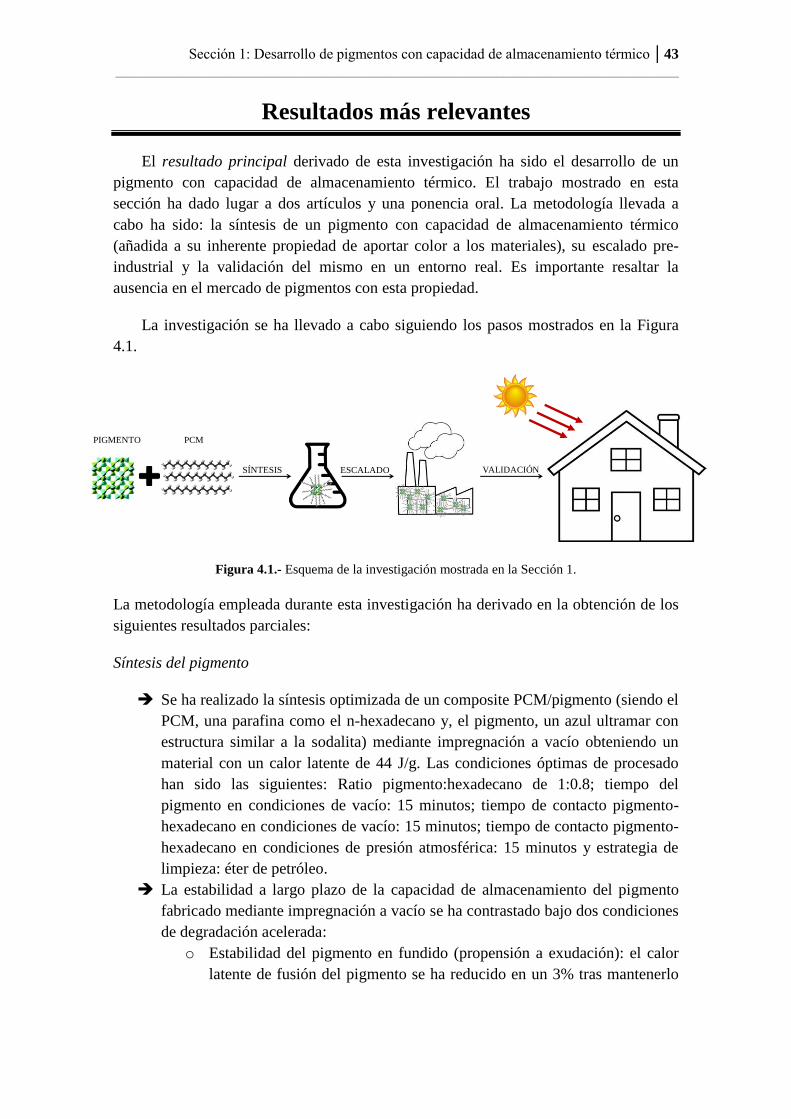
Sección 1: Desarrollo de pigmentos con capacidad de almacenamiento térmico │43
_____________________________________________________________________________
Resultados más relevantes
El resultado principal derivado de esta investigación ha sido el desarrollo de un
pigmento con capacidad de almacenamiento térmico. El trabajo mostrado en esta
sección ha dado lugar a dos artículos y una ponencia oral. La metodología llevada a
cabo ha sido: la síntesis de un pigmento con capacidad de almacenamiento térmico
(añadida a su inherente propiedad de aportar color a los materiales), su escalado pre-
industrial y la validación del mismo en un entorno real. Es importante resaltar la
ausencia en el mercado de pigmentos con esta propiedad.
La investigación se ha llevado a cabo siguiendo los pasos mostrados en la Figura
4.1.
Figura 4.1.- Esquema de la investigación mostrada en la Sección 1.
La metodología empleada durante esta investigación ha derivado en la obtención de los
siguientes resultados parciales:
Síntesis del pigmento
Se ha realizado la síntesis optimizada de un composite PCM/pigmento (siendo el
PCM, una parafina como el n-hexadecano y, el pigmento, un azul ultramar con
estructura similar a la sodalita) mediante impregnación a vacío obteniendo un
material con un calor latente de 44 J/g. Las condiciones óptimas de procesado
han sido las siguientes: Ratio pigmento:hexadecano de 1:0.8; tiempo del
pigmento en condiciones de vacío: 15 minutos; tiempo de contacto pigmento-
hexadecano en condiciones de vacío: 15 minutos; tiempo de contacto pigmento-
hexadecano en condiciones de presión atmosférica: 15 minutos y estrategia de
limpieza: éter de petróleo.
La estabilidad a largo plazo de la capacidad de almacenamiento del pigmento
fabricado mediante impregnación a vacío se ha contrastado bajo dos condiciones
de degradación acelerada:
o Estabilidad del pigmento en fundido (propensión a exudación): el calor
latente de fusión del pigmento se ha reducido en un 3% tras mantenerlo
PIGMENTO PCM
ESCALADOSÍNTESIS VALIDACIÓN
Sección 1: Desarrollo de pigmentos con capacidad de almacenamiento térmico │44
_____________________________________________________________________________
en estado fundido durante 1000 horas a 30ºC (simulando 41 días de
temperaturas superiores a 30ºC).
o Estabilidad del pigmento frente a ciclos de fusión-cristalización:
mediante termodifracción se ha analizado el pigmento durante 100 ciclos
de carga-descarga (desde 4ºC hasta 34ºC). La señal del
termodifractograma correspondiente a la transformación del PCM de
amorfo (líquido) a cristalino (sólido), y en consecuencia la capacidad de
almacenamiento del pigmento, se ve reducida en un 5%.
Una vez obtenido el producto, se ha planteado el escalado de su fabricación,
presentándose el proceso de impregnación capilar como el proceso idóneo. Tras
la optimización de las variables de proceso se ha obtenido un pigmento con una
entalpía de 41 J/g (comparable a la alcanzada en el proceso a nivel de
laboratorio). Las condiciones óptimas de procesado han sido las siguientes:
Ratio pigmento: hexadecano de 1:1.5; tiempo de procesado: 10 minutos;
temperatura de procesado: 25ºC y estrategia de limpieza: éter de petróleo.
La estabilidad del composite PCM/pigmento fabricado mediante impregnación
capilar se ha validado bajo las mismas condiciones que el pigmento fabricado
mediante impregnación a vacío, concluyendo que la estabilidad del pigmento
frente a ciclado es ligeramente inferior a la alcanzada mediante el proceso de
vacío (reducciones de aproximadamente un 10% de la capacidad de
almacenamiento térmico frente al 5% obtenido mediante el proceso a vacío).
Tras evaluar la capacidad de almacenamiento entre el pigmento obtenido
mediante impregnación capilar y el logrado mediante impregnación a vacío
(ΔH= 41 J/g frente a ΔH= 44 J/g) y su estabilidad en 100 ciclos (reducción de un
10% de capacidad de almacenamiento frente a una reducción del 5%) se ha
seleccionado el proceso de impregnación capilar como el idóneo para la
fabricación de este tipo de pigmentos.
Fabricación pre-industrial del pigmento
Una vez comprobada la estabilidad y la capacidad de fabricación del composite
PCM/pigmento mediante impregnación capilar se ha decidido escalar la fabricación a
una cantidad de 5 kg de pigmento/lote con objeto de evaluar si las características del
pigmento obtenido han sido o no, semejantes a las obtenidas a escala de laboratorio
(20 g). Para esta actividad, se ha trabajado con 5 kg de pigmento y el mismo proceso en
dos lotes diferentes. Se han fabricado 6 kg de pigmento, modificado en cada caso,
teniendo propiedades similares a las obtenidas a escala de laboratorio (42 J/g).
Validación del pigmento
Una vez realizada la fabricación del pigmento a escala piloto, se ha procedido a la
demostración de la aplicación del pigmento desarrollado en un material constructivo y
la evaluación de su efecto.
Sección 1: Desarrollo de pigmentos con capacidad de almacenamiento térmico │45
_____________________________________________________________________________
Para ello, se ha dispersado el pigmento desarrollado en la resina epoxi Araldite LY
1568 en un 17 % en peso y se le ha añadido el endurecedor correspondiente. Con este
material se han fabricado 4 paneles de dimensiones x/y/z de 205/250/190 cm, que se
han incorporado en una caseta demostrativa. Se ha monitorizado el consumo energético
de un calentador que durante 14 días ha mantenido la temperatura de la caseta
demostrativa entre 21.5ºC y 23ºC (se encendía si la temperatura descendía de 21.5ºC y
se apagaba al alcanzar los 23ºC). Este test se ha realizado en una caseta de referencia y
en una caseta de testeo (paneles con el pigmento modificado). El consumo energético en
el caso de la caseta de referencia ha sido un 7.4 % mayor que el de la caseta de testeo.

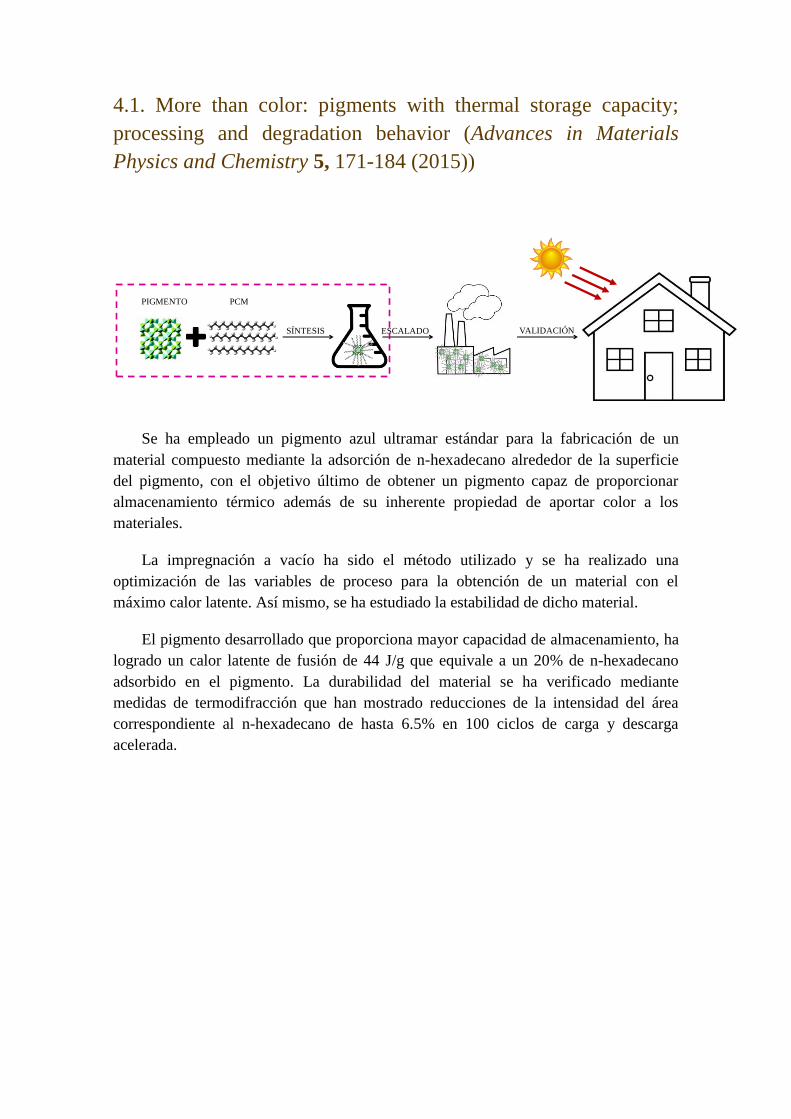
4.1. More than color: pigments with thermal storage capacity;
processing and degradation behavior (Advances in Materials
Physics and Chemistry 5, 171-184 (2015))
Se ha empleado un pigmento azul ultramar estándar para la fabricación de un
material compuesto mediante la adsorción de n-hexadecano alrededor de la superficie
del pigmento, con el objetivo último de obtener un pigmento capaz de proporcionar
almacenamiento térmico además de su inherente propiedad de aportar color a los
materiales.
La impregnación a vacío ha sido el método utilizado y se ha realizado una
optimización de las variables de proceso para la obtención de un material con el
máximo calor latente. Así mismo, se ha estudiado la estabilidad de dicho material.
El pigmento desarrollado que proporciona mayor capacidad de almacenamiento, ha
logrado un calor latente de fusión de 44 J/g que equivale a un 20% de n-hexadecano
adsorbido en el pigmento. La durabilidad del material se ha verificado mediante
medidas de termodifracción que han mostrado reducciones de la intensidad del área
correspondiente al n-hexadecano de hasta 6.5% en 100 ciclos de carga y descarga
acelerada.
PIGMENTO PCM
ESCALADOSÍNTESIS VALIDACIÓN

Sección 1: Desarrollo de pigmentos con capacidad de almacenamiento térmico │49
_____________________________________________________________________________
4.1. More than color: pigments with thermal storage
capacity; processing and degradation behavior
Advances in Materials Physics and Chemistry 5, 171-184 (2015)
Abstract
A standard ultramarine pigment was used to produce phase change material
composites, by adsorbing n-hexadecane paraffin around the pigment surface with the
aim of obtaining a pigment providing thermal storage capacity apart from color.
Vacuum impregnation method was employed optimizing the process variables to
maximize the latent heat of the hexadecane/pigment composite. In addition to the
process optimization, the stability of the composite having the maximum latent heat was
investigated.
The hexadecane/pigment composite providing the highest latent heat has a Latent
heat of fusion of 44 J/g (around a 20%wt. hexadecane adsorbed in the pigment).
Durability of the material was tested by thermo-diffractometric measurements. The
results indicate slow reduction of the area intensity up to 6.5% after the 100 cycles.
Keywords: Ultramarine Blue, Hexadecane, Phase Change Material, Thermal Storage.
Highlights
A phase change composite adsorbing n-hexadecane around ultramarine pigment
has been developed.
Degradation of the thermal storage capability was evaluated obtaining a 3% of
degradation after the 1000 hours at 30ºC.
The composite durability was tested for 100 cooling/heating cycles by thermo-
diffraction.
The expected real life time for this composite material could be more than 10
years.
Sección 1: Desarrollo de pigmentos con capacidad de almacenamiento térmico │50
_____________________________________________________________________________
4.1.1. Introduction
Phase change materials (PCM) have the ability to store a large amount of latent heat
within the temperature range associated with a phase change as they have a high
enthalpy of fusion in a small volume1.
PCM integrated building components could have a high potential because of their
ability to reduce energy consumption for space conditioning and reduce peak loads
while improving occupant comfort2. Among all the PCM applications, the PCM
integration in wallboards, roof & ceiling, and windows has been deeply studied, due to
its relatively easy implementation and more effective heat exchange area3.
Materials used as PCMs can be divided into different subcategories based on their
chemical composition: organic compounds, inorganic compounds and eutectic mixtures.
However, among these materials, paraffin is believed to be the most promising phase
change material because is stable, non-toxic and not corrosive, it has a large latent heat
and low cost4-8
.
The thermal energy of paraffin is transferred when the material changes from a
solid to a liquid or a liquid to a solid, being necessary to contain it to prevent leakages.
The most promising methods reported for the incorporation of PCMs in the construction
materials are: direct incorporation, immersion and encapsulation. Some researchers
pointed out that the direct incorporation and the immersion methods could cause a
leakage problem which is not good for long-term use9.
Depending on the capsule size, the encapsulated PCMs are classified in macro or
micro-encapsulated, and there are a wide variety of encapsulating methods and systems
obtaining different sizes, geometries and materials10,11
. With macro-encapsulated PCMs,
1 Sharma, A., Tyagi, V. V., Chen, C. R. & Buddhi, D. Review on thermal energy storage with phase
change materials and applications. Renew. Sustain. Energy Rev. 13, 318–345 (2009). 2 Faraji, M., Alami, M. E. & Najam, M. Thermal Control of Building using latent heat storage south
wall. J. Math. Comput. Sci. 10, 212-227 (2014). 3 Geetha, N. B. & Velraj, R. Passive cooling methods for energy efficient buildings with and without
thermal energy storage – A review. Energ Educ Sci Tech-A. 29, 913-946 (2012). 4 Chena, Y., Shih, Y. & Yu, Y. Stearyl Alcohol Modified Expanded Graphite / Paraffin Phase Change
Composite. Int. J. Appl. Sci. Eng. 11, 227-233(2013). 5 Li, X., Sanjayan, J. G. & Wilson, J. L. Fabrication and stability of form-stable diatomite/paraffin
phase change material composites. Energy Build. 76, 284–294 (2014). 6 Xu, B. & Li, Z. Paraffin/diatomite composite phase change material incorporated cement-based
composite for thermal energy storage. App. Energy 105, 229–237 (2013). 7 Sotomayor, M. E., Krupa, I., Várez, A. & Levenfeld, B. Thermal and mechanical characterization of
injection moulded high density polyethylene/paraffin wax blends as phase change materials. Renew.
Energy 68, 140–145 (2014). 8 Sun, Z., Zhang, Y., Zheng, S., Park, Y. & Frost, R. L. Preparation and thermal energy storage
properties of paraffin/calcined diatomite composites as form-stable phase change materials.
Thermoch. Acta 558, 16–21 (2013). 9 Zhou, D., Zhao, C. Y. & Tian, Y. Review on thermal energy storage with phase change materials
(PCMs) in building applications. App. Energy 92, 593–605 (2012). 10
Rodriguez-Ubinas, E., Ruiz-Valero, L., Vega, S. & Neila, J. Applications of Phase Change Material in
highly energy-efficient houses. Energy Build. 50, 49–62 (2012).
Sección 1: Desarrollo de pigmentos con capacidad de almacenamiento térmico │51
_____________________________________________________________________________
the leakage problem can be avoided but it has the disadvantage of poor thermal
conductivity and the complicated integration to the building materials. Micro-
encapsulated PCMs have been used in thermal energy storage of buildings being much
easier to incorporate the microencapsulated PCMs into construction materials12,13
.
However, this material has two main drawbacks: it is a non-economical technique and
there is low thermal conductivity through the capsule13
.
In contrast, a porous material/phase change composite is attractive since it need not
be encapsulated, provides no corrosion and enables quick heat transfer14
. Then support
of PCMs into porous materials is a promising alternative method for the encapsulation
of PCMs15-17
but there is still a real need of development concerning PCM containment
method to be economically available5. However, the storage materials and containers
have insufficient long term stability and this has limited the use of latent heat stores.
This poor stability is mainly due to the poor stability of the materials properties due to
thermal cycling.
Ultramarine blue pigment (UB) is an ancient inorganic pigment manufactured by
the burning of sodium sulfate, quartz, and sulfur round 800ºC, which produces a sodium
aluminum silicate sulfide structure (Na8Al6Si6O24S2) similar to Sodalite18
. Taking into
account that ultramarine blue are a family of low-cost mineral pigments with high
pigmentary properties and commonly used in construction sector (concrete, paints,
polymers), the aim of this study is to develop a form-stable phase change material
composites based on ultramarine blue as the supporting matrix and n-hexadecane as the
PCM. Vacuum impregnation method has been proposed for obtaining a pigment with
thermal storage capabilities. The main advantage of the use of this hexadecane/pigment
composite is that manufacturing processes of building components would not be altered
as the pigment gives itself the pursued thermal storage capability apart from giving the
color to the component.
11
Jamekhorshid, A., Sadrameli, S. M. & Farid, M. A review of microencapsulation methods of phase
change materials (PCMs) as a thermal energy storage (TES) medium. Renew. Sustain. Energy Rev. 31,
531–542 (2014). 12
Ma, Y., Sun, S., Li, J. & Tang, G. Preparation and thermal reliabilities of microencapsulated phase
change materials with binary cores and acrylate-based polymer shells. Thermoch. Acta 588, 38–46
(2014). 13
He, F., Wang, X. & Wu, D. New approach for sol–gel synthesis of microencapsulated n-octadecane
phase change material with silica wall using sodium silicate precursor. Energy 67, 223–233 (2014). 14
Nomura, T., Okinaka, N. & Akiyama, T. Impregnation of porous material with phase change material
for thermal energy storage. Mater. Chem. Phys. 115, 846–850 (2009). 15
Oya, T., Nomura, T., Tsubota, M., Okinaka, N. & Akiyama, T. Thermal conductivity enhancement of
erythritol as PCM by using graphite and nickel particles. App. Therm. Eng. 61, 825–828 (2013). 16
Py, X., Olives, R. & Mauran, S. Paraffin/porous-graphite-matrix composite as a high and constant
power thermal storage material. Int. J. Heat Mass Trans. 44, 2727–2737 (2001). 17
Memon, S. A., Lo, T. Y., Barbhuiya, S. A. & Xu, W. Development of form-stable composite phase
change material by incorporation of dodecyl alcohol into ground granulated blast furnace slag. Energy
Build. 62, 360–367 (2013). 18
Giraldo, C., Tobón, J. I. & Restrepo Baena, O. J. Ultramarine blue pigment: A non-conventional
pozzolan. Constr. Build. Mater. 36, 305–310 (2012).
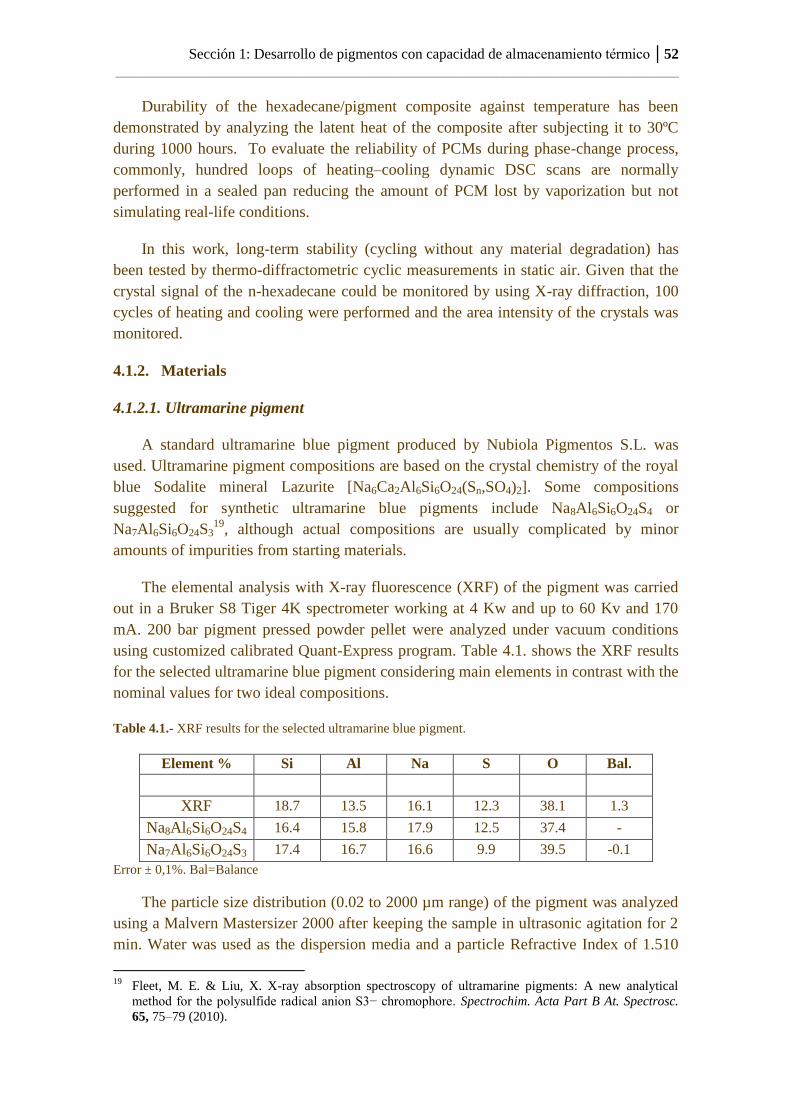
Sección 1: Desarrollo de pigmentos con capacidad de almacenamiento térmico │52
_____________________________________________________________________________
Durability of the hexadecane/pigment composite against temperature has been
demonstrated by analyzing the latent heat of the composite after subjecting it to 30ºC
during 1000 hours. To evaluate the reliability of PCMs during phase-change process,
commonly, hundred loops of heating–cooling dynamic DSC scans are normally
performed in a sealed pan reducing the amount of PCM lost by vaporization but not
simulating real-life conditions.
In this work, long-term stability (cycling without any material degradation) has
been tested by thermo-diffractometric cyclic measurements in static air. Given that the
crystal signal of the n-hexadecane could be monitored by using X-ray diffraction, 100
cycles of heating and cooling were performed and the area intensity of the crystals was
monitored.
4.1.2. Materials
4.1.2.1. Ultramarine pigment
A standard ultramarine blue pigment produced by Nubiola Pigmentos S.L. was
used. Ultramarine pigment compositions are based on the crystal chemistry of the royal
blue Sodalite mineral Lazurite [Na6Ca2Al6Si6O24(Sn,SO4)2]. Some compositions
suggested for synthetic ultramarine blue pigments include Na8Al6Si6O24S4 or
Na7Al6Si6O24S319
, although actual compositions are usually complicated by minor
amounts of impurities from starting materials.
The elemental analysis with X-ray fluorescence (XRF) of the pigment was carried
out in a Bruker S8 Tiger 4K spectrometer working at 4 Kw and up to 60 Kv and 170
mA. 200 bar pigment pressed powder pellet were analyzed under vacuum conditions
using customized calibrated Quant-Express program. Table 4.1. shows the XRF results
for the selected ultramarine blue pigment considering main elements in contrast with the
nominal values for two ideal compositions.
Table 4.1.- XRF results for the selected ultramarine blue pigment.
Element % Si Al Na S O Bal.
XRF 18.7 13.5 16.1 12.3 38.1 1.3
Na8Al6Si6O24S4 16.4 15.8 17.9 12.5 37.4 -
Na7Al6Si6O24S3 17.4 16.7 16.6 9.9 39.5 -0.1
Error ± 0,1%. Bal=Balance
The particle size distribution (0.02 to 2000 µm range) of the pigment was analyzed
using a Malvern Mastersizer 2000 after keeping the sample in ultrasonic agitation for 2
min. Water was used as the dispersion media and a particle Refractive Index of 1.510
19
Fleet, M. E. & Liu, X. X-ray absorption spectroscopy of ultramarine pigments: A new analytical
method for the polysulfide radical anion S3− chromophore. Spectrochim. Acta Part B At. Spectrosc.
65, 75–79 (2010).

Sección 1: Desarrollo de pigmentos con capacidad de almacenamiento térmico │53
_____________________________________________________________________________
was considered for the measurement. The sample and background measurement times
were fixed in 10 seconds and 5 cycles of measurement were done using a delay time
between measurements of 5 seconds. For the results calculation, a general purpose
model was selected. Figure 4.2. shows the particle volume distribution and cumulative
volume of the sample. The volume distribution shows the particles in a given size range
by percentage of the total sample volume, while the cumulative volume curve tracks the
total volume of all size ranges as they approach 100%. A stable and mono-modal
distribution was obtained for this system being the main particle size d50 of 1.2 µm.
Figure 4.2.- Particle size distribution of the standard ultramarine blue pigment in water.
The scanning electron microscope (SEM) micrograph was recorded with Hitachi S-
4800 equipment using Secondary Electron Detector at 3 kV accelerating voltage and 8
mm working distance (Figure 4.3.). It indicates rather irregular shape of the pigment
particles. The size of the particles is mostly in range ~1-2 μm in good agreement with
the particle size distribution results.
Figure 4.3.- SEM micrographs of standard ultramarine blue pigment.
The crystal structure of the pigment was analyzed by X-ray diffraction (XRD). The
X-ray powder diffraction patterns were collected by using a PHILIPS X’PERT PRO
0
2
4
6
8
10
12
0
20
40
60
80
100
0,01 0,1 1 10 100 1000 10000
Acc
um
ula
ted
vo
lum
e %
Size (µm)
Cumulative volume (%)
Volume %
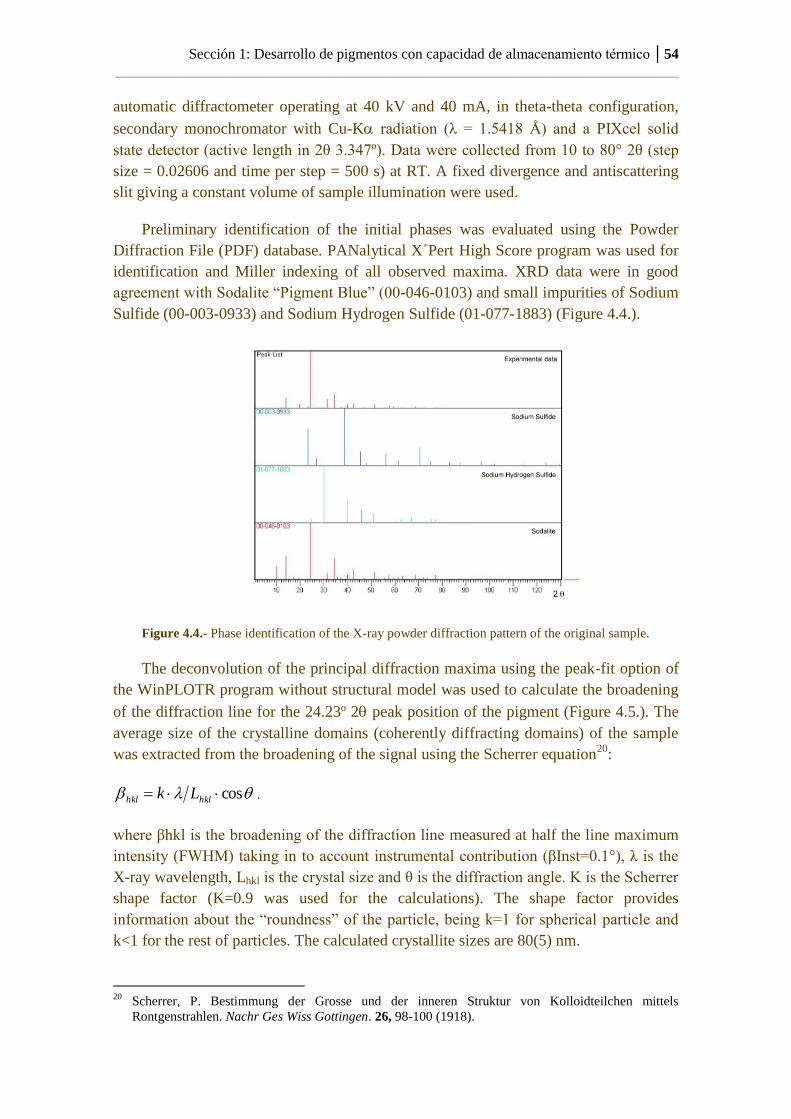
Sección 1: Desarrollo de pigmentos con capacidad de almacenamiento térmico │54
_____________________________________________________________________________
automatic diffractometer operating at 40 kV and 40 mA, in theta-theta configuration,
secondary monochromator with Cu-K radiation (λ = 1.5418 Å) and a PIXcel solid
state detector (active length in 2θ 3.347º). Data were collected from 10 to 80° 2θ (step
size = 0.02606 and time per step = 500 s) at RT. A fixed divergence and antiscattering
slit giving a constant volume of sample illumination were used.
Preliminary identification of the initial phases was evaluated using the Powder
Diffraction File (PDF) database. PANalytical X´Pert High Score program was used for
identification and Miller indexing of all observed maxima. XRD data were in good
agreement with Sodalite “Pigment Blue” (00-046-0103) and small impurities of Sodium
Sulfide (00-003-0933) and Sodium Hydrogen Sulfide (01-077-1883) (Figure 4.4.).
Figure 4.4.- Phase identification of the X-ray powder diffraction pattern of the original sample.
The deconvolution of the principal diffraction maxima using the peak-fit option of
the WinPLOTR program without structural model was used to calculate the broadening
of the diffraction line for the 24.23º 2 peak position of the pigment (Figure 4.5.). The
average size of the crystalline domains (coherently diffracting domains) of the sample
was extracted from the broadening of the signal using the Scherrer equation20
:
cos hklhkl Lk .
where βhkl is the broadening of the diffraction line measured at half the line maximum
intensity (FWHM) taking in to account instrumental contribution (βInst=0.1°), λ is the
X-ray wavelength, Lhkl is the crystal size and θ is the diffraction angle. K is the Scherrer
shape factor (K=0.9 was used for the calculations). The shape factor provides
information about the “roundness” of the particle, being k=1 for spherical particle and
k<1 for the rest of particles. The calculated crystallite sizes are 80(5) nm.
20
Scherrer, P. Bestimmung der Grosse und der inneren Struktur von Kolloidteilchen mittels
Rontgenstrahlen. Nachr Ges Wiss Gottingen. 26, 98-100 (1918).
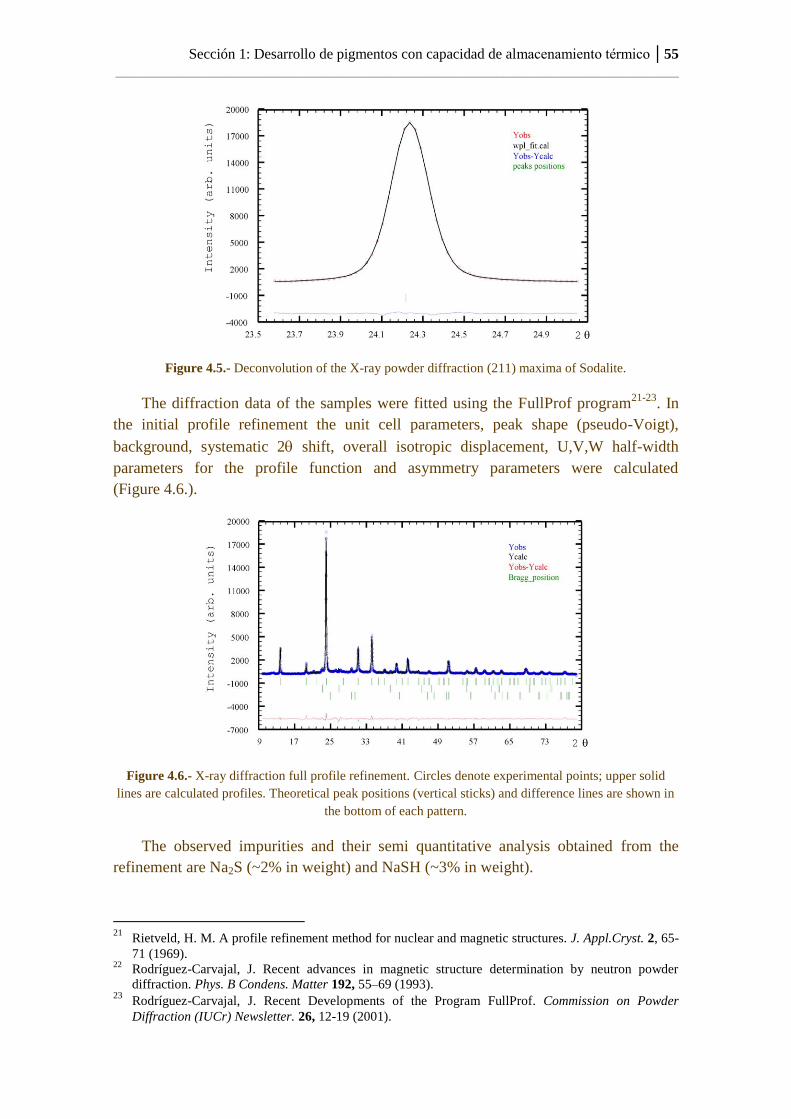
Sección 1: Desarrollo de pigmentos con capacidad de almacenamiento térmico │55
_____________________________________________________________________________
Figure 4.5.- Deconvolution of the X-ray powder diffraction (211) maxima of Sodalite.
The diffraction data of the samples were fitted using the FullProf program21-23
. In
the initial profile refinement the unit cell parameters, peak shape (pseudo-Voigt),
background, systematic 2 shift, overall isotropic displacement, U,V,W half-width
parameters for the profile function and asymmetry parameters were calculated
(Figure 4.6.).
Figure 4.6.- X-ray diffraction full profile refinement. Circles denote experimental points; upper solid
lines are calculated profiles. Theoretical peak positions (vertical sticks) and difference lines are shown in
the bottom of each pattern.
The observed impurities and their semi quantitative analysis obtained from the
refinement are Na2S (~2% in weight) and NaSH (~3% in weight).
21
Rietveld, H. M. A profile refinement method for nuclear and magnetic structures. J. Appl.Cryst. 2, 65-
71 (1969). 22
Rodríguez-Carvajal, J. Recent advances in magnetic structure determination by neutron powder
diffraction. Phys. B Condens. Matter 192, 55–69 (1993). 23
Rodríguez-Carvajal, J. Recent Developments of the Program FullProf. Commission on Powder
Diffraction (IUCr) Newsletter. 26, 12-19 (2001).
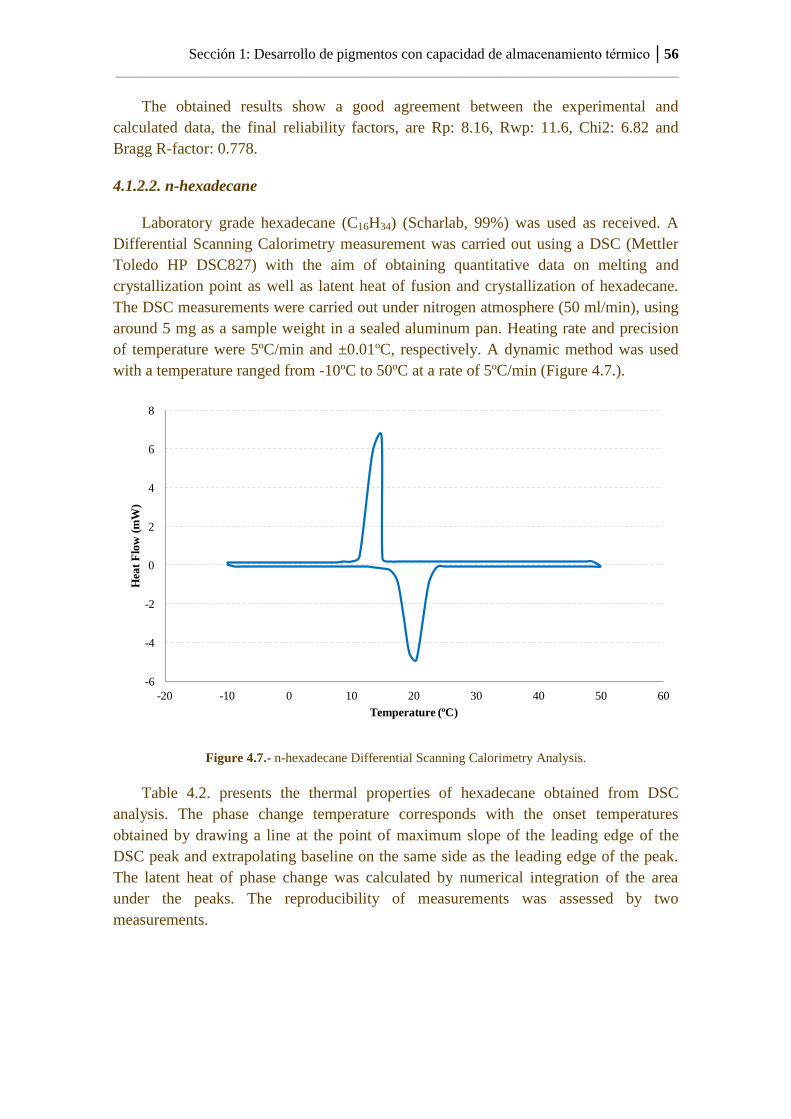
Sección 1: Desarrollo de pigmentos con capacidad de almacenamiento térmico │56
_____________________________________________________________________________
The obtained results show a good agreement between the experimental and
calculated data, the final reliability factors, are Rp: 8.16, Rwp: 11.6, Chi2: 6.82 and
Bragg R-factor: 0.778.
4.1.2.2. n-hexadecane
Laboratory grade hexadecane (C16H34) (Scharlab, 99%) was used as received. A
Differential Scanning Calorimetry measurement was carried out using a DSC (Mettler
Toledo HP DSC827) with the aim of obtaining quantitative data on melting and
crystallization point as well as latent heat of fusion and crystallization of hexadecane.
The DSC measurements were carried out under nitrogen atmosphere (50 ml/min), using
around 5 mg as a sample weight in a sealed aluminum pan. Heating rate and precision
of temperature were 5ºC/min and ±0.01ºC, respectively. A dynamic method was used
with a temperature ranged from -10ºC to 50ºC at a rate of 5ºC/min (Figure 4.7.).
Figure 4.7.- n-hexadecane Differential Scanning Calorimetry Analysis.
Table 4.2. presents the thermal properties of hexadecane obtained from DSC
analysis. The phase change temperature corresponds with the onset temperatures
obtained by drawing a line at the point of maximum slope of the leading edge of the
DSC peak and extrapolating baseline on the same side as the leading edge of the peak.
The latent heat of phase change was calculated by numerical integration of the area
under the peaks. The reproducibility of measurements was assessed by two
measurements.
-6
-4
-2
0
2
4
6
8
-20 -10 0 10 20 30 40 50 60
Hea
t F
low
(m
W)
Temperature (ºC)
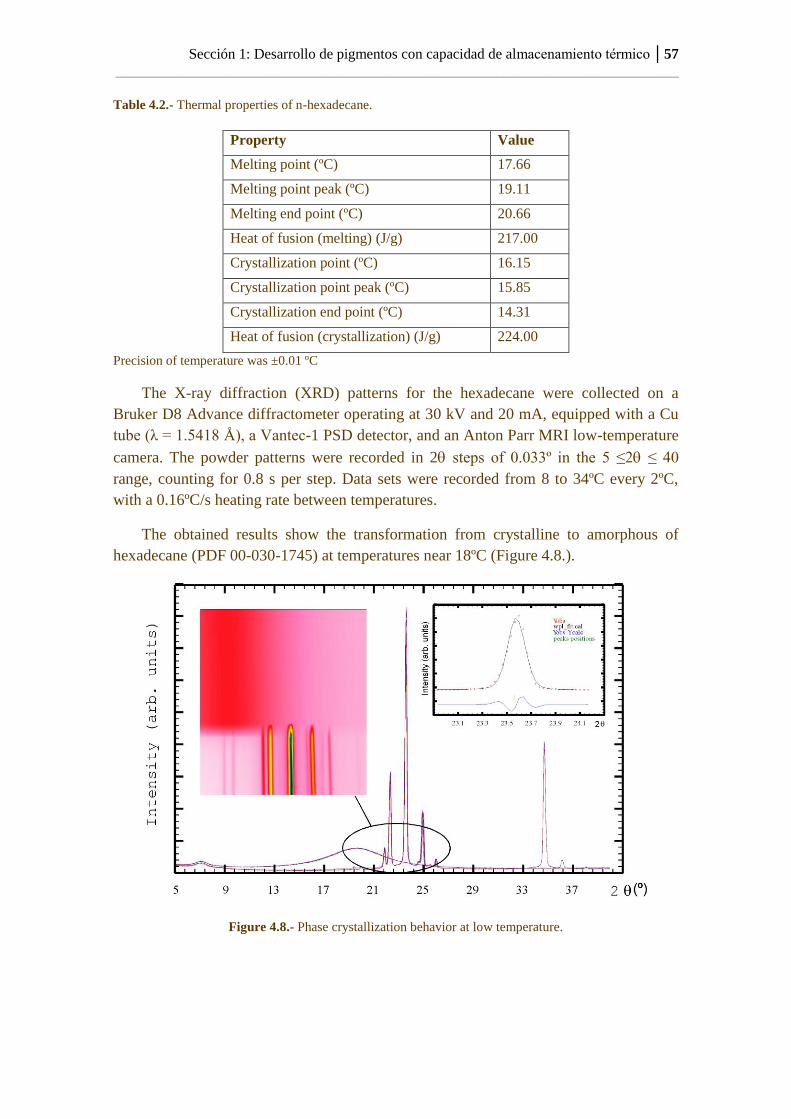
Sección 1: Desarrollo de pigmentos con capacidad de almacenamiento térmico │57
_____________________________________________________________________________
Table 4.2.- Thermal properties of n-hexadecane.
Property Value
Melting point (ºC) 17.66
Melting point peak (ºC) 19.11
Melting end point (ºC) 20.66
Heat of fusion (melting) (J/g) 217.00
Crystallization point (ºC) 16.15
Crystallization point peak (ºC) 15.85
Crystallization end point (ºC) 14.31
Heat of fusion (crystallization) (J/g) 224.00
Precision of temperature was ±0.01 ºC
The X-ray diffraction (XRD) patterns for the hexadecane were collected on a
Bruker D8 Advance diffractometer operating at 30 kV and 20 mA, equipped with a Cu
tube (λ = 1.5418 Å), a Vantec-1 PSD detector, and an Anton Parr MRI low-temperature
camera. The powder patterns were recorded in 2 steps of 0.033º in the 5 ≤2 ≤ 40
range, counting for 0.8 s per step. Data sets were recorded from 8 to 34ºC every 2ºC,
with a 0.16ºC/s heating rate between temperatures.
The obtained results show the transformation from crystalline to amorphous of
hexadecane (PDF 00-030-1745) at temperatures near 18ºC (Figure 4.8.).
Figure 4.8.- Phase crystallization behavior at low temperature.

Sección 1: Desarrollo de pigmentos con capacidad de almacenamiento térmico │58
_____________________________________________________________________________
The average size of the coherently diffracting domain extracted from the
broadening of the (013) signal using the Scherrer equation was around 230 nm.
4.1.3. Fabrication of the pigment with thermal storage capability
Vacuum impregnation method was employed for the fabrication of the form-stable
phase change materials for thermal energy storage.
4.1.3.1. Processing
Hexadecane/pigment composite was fabricated by using vacuum impregnation
method. The pigment was placed inside a flask connected to a vacuum pump, a vacuum
meter and a funnel containing the liquid hexadecane. After having the pigment under 40
mbar of pressure during a certain time in order to evacuate existing air from the pigment
pores, the liquid hexadecane was added. After having the mixture pigment-hexadecane
under vacuum, the vacuum pump was turned off to force the liquid hexadecane to be
adsorbed around the ceramic pigment surface (see process in Figure 4.9.).
Figure 4.9.- Vacuum impregnation process description.
Different experiments were planned to optimize five different process variables
with the aim of obtaining a composite with the maximum latent heat:
(a) ratio pigment:hexadecane,
b) cleaning strategies,
c) the time having the pigment under vacuum,
d) the time having the mixture pigment-hexadecane under vacuum,
e) the time having the pigment-hexadecane mixture at atmospheric pressure
All the samples were analyzed by DSC (with the same method used previously for
the raw hexadecane). From the obtained results, the quantitative data on melting and
crystallization point as well as latent heat of fusion and crystallization of the
hexadecane/pigment composites was extracted. Two aliquots of the processed samples
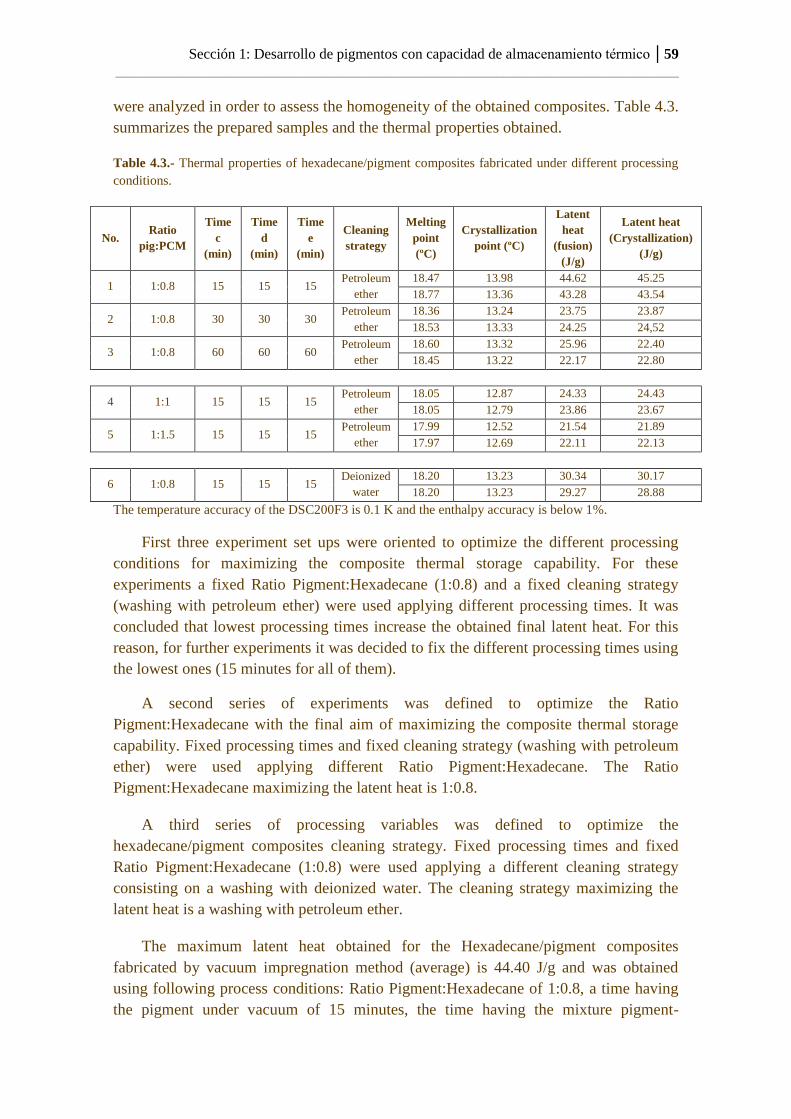
Sección 1: Desarrollo de pigmentos con capacidad de almacenamiento térmico │59
_____________________________________________________________________________
were analyzed in order to assess the homogeneity of the obtained composites. Table 4.3.
summarizes the prepared samples and the thermal properties obtained.
Table 4.3.- Thermal properties of hexadecane/pigment composites fabricated under different processing
conditions.
No. Ratio
pig:PCM
Time
c
(min)
Time
d
(min)
Time
e
(min)
Cleaning
strategy
Melting
point
(ºC)
Crystallization
point (ºC)
Latent
heat
(fusion)
(J/g)
Latent heat
(Crystallization)
(J/g)
1 1:0.8 15 15 15 Petroleum
ether
18.47 13.98 44.62 45.25
18.77 13.36 43.28 43.54
2 1:0.8 30 30 30 Petroleum
ether
18.36 13.24 23.75 23.87
18.53 13.33 24.25 24,52
3 1:0.8 60 60 60 Petroleum
ether
18.60 13.32 25.96 22.40
18.45 13.22 22.17 22.80
4 1:1 15 15 15 Petroleum
ether
18.05 12.87 24.33 24.43
18.05 12.79 23.86 23.67
5 1:1.5 15 15 15 Petroleum
ether
17.99 12.52 21.54 21.89
17.97 12.69 22.11 22.13
6 1:0.8 15 15 15 Deionized
water
18.20 13.23 30.34 30.17
18.20 13.23 29.27 28.88
The temperature accuracy of the DSC200F3 is 0.1 K and the enthalpy accuracy is below 1%.
First three experiment set ups were oriented to optimize the different processing
conditions for maximizing the composite thermal storage capability. For these
experiments a fixed Ratio Pigment:Hexadecane (1:0.8) and a fixed cleaning strategy
(washing with petroleum ether) were used applying different processing times. It was
concluded that lowest processing times increase the obtained final latent heat. For this
reason, for further experiments it was decided to fix the different processing times using
the lowest ones (15 minutes for all of them).
A second series of experiments was defined to optimize the Ratio
Pigment:Hexadecane with the final aim of maximizing the composite thermal storage
capability. Fixed processing times and fixed cleaning strategy (washing with petroleum
ether) were used applying different Ratio Pigment:Hexadecane. The Ratio
Pigment:Hexadecane maximizing the latent heat is 1:0.8.
A third series of processing variables was defined to optimize the
hexadecane/pigment composites cleaning strategy. Fixed processing times and fixed
Ratio Pigment:Hexadecane (1:0.8) were used applying a different cleaning strategy
consisting on a washing with deionized water. The cleaning strategy maximizing the
latent heat is a washing with petroleum ether.
The maximum latent heat obtained for the Hexadecane/pigment composites
fabricated by vacuum impregnation method (average) is 44.40 J/g and was obtained
using following process conditions: Ratio Pigment:Hexadecane of 1:0.8, a time having
the pigment under vacuum of 15 minutes, the time having the mixture pigment-
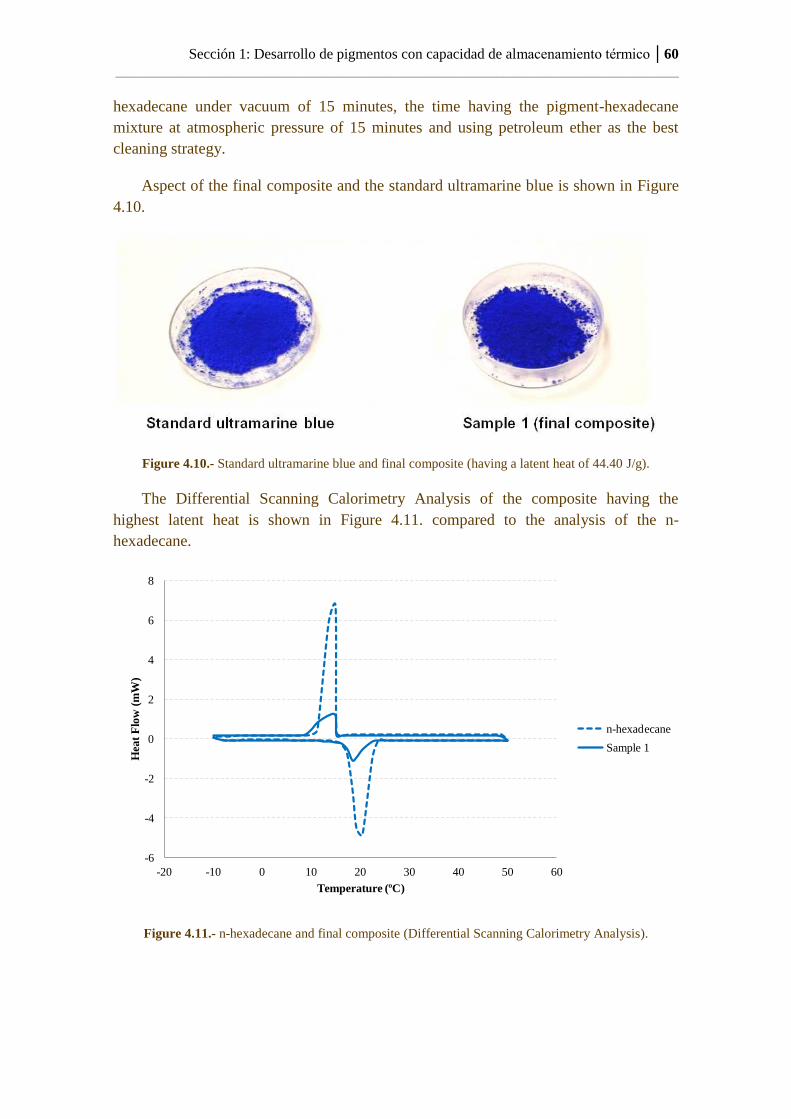
Sección 1: Desarrollo de pigmentos con capacidad de almacenamiento térmico │60
_____________________________________________________________________________
hexadecane under vacuum of 15 minutes, the time having the pigment-hexadecane
mixture at atmospheric pressure of 15 minutes and using petroleum ether as the best
cleaning strategy.
Aspect of the final composite and the standard ultramarine blue is shown in Figure
4.10.
Figure 4.10.- Standard ultramarine blue and final composite (having a latent heat of 44.40 J/g).
The Differential Scanning Calorimetry Analysis of the composite having the
highest latent heat is shown in Figure 4.11. compared to the analysis of the n-
hexadecane.
Figure 4.11.- n-hexadecane and final composite (Differential Scanning Calorimetry Analysis).
-6
-4
-2
0
2
4
6
8
-20 -10 0 10 20 30 40 50 60
Hea
t F
low
(m
W)
Temperature (ºC)
n-hexadecane
Sample 1
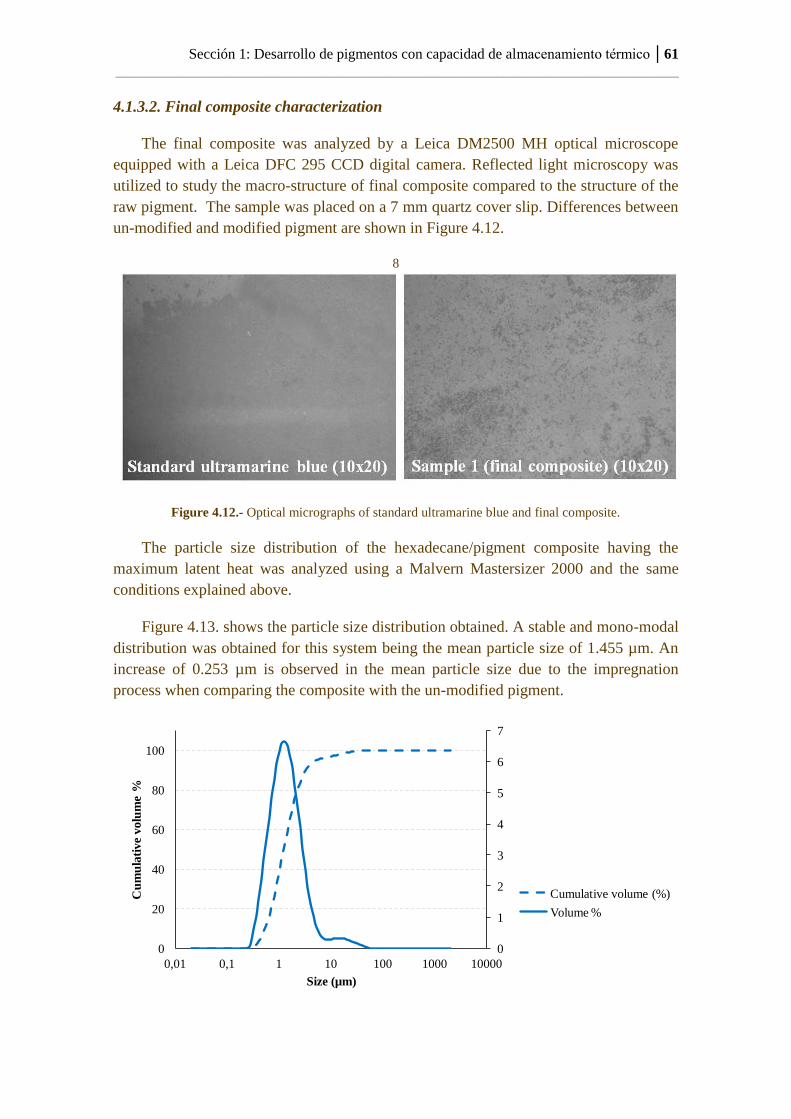
Sección 1: Desarrollo de pigmentos con capacidad de almacenamiento térmico │61
_____________________________________________________________________________
4.1.3.2. Final composite characterization
The final composite was analyzed by a Leica DM2500 MH optical microscope
equipped with a Leica DFC 295 CCD digital camera. Reflected light microscopy was
utilized to study the macro-structure of final composite compared to the structure of the
raw pigment. The sample was placed on a 7 mm quartz cover slip. Differences between
un-modified and modified pigment are shown in Figure 4.12.
8
Figure 4.12.- Optical micrographs of standard ultramarine blue and final composite.
The particle size distribution of the hexadecane/pigment composite having the
maximum latent heat was analyzed using a Malvern Mastersizer 2000 and the same
conditions explained above.
Figure 4.13. shows the particle size distribution obtained. A stable and mono-modal
distribution was obtained for this system being the mean particle size of 1.455 µm. An
increase of 0.253 µm is observed in the mean particle size due to the impregnation
process when comparing the composite with the un-modified pigment.
0
1
2
3
4
5
6
7
0
20
40
60
80
100
0,01 0,1 1 10 100 1000 10000
Cu
mu
lati
ve
vo
lum
e %
Size (µm)
Cumulative volume (%)
Volume %
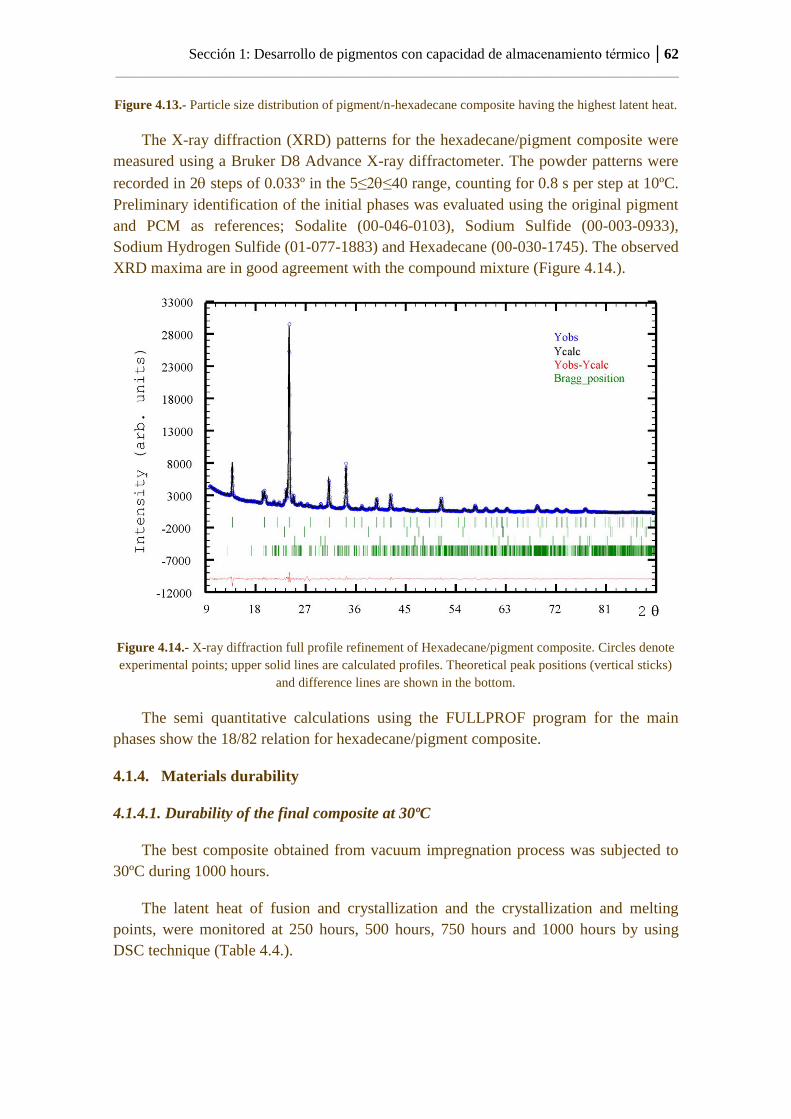
Sección 1: Desarrollo de pigmentos con capacidad de almacenamiento térmico │62
_____________________________________________________________________________
Figure 4.13.- Particle size distribution of pigment/n-hexadecane composite having the highest latent heat.
The X-ray diffraction (XRD) patterns for the hexadecane/pigment composite were
measured using a Bruker D8 Advance X-ray diffractometer. The powder patterns were
recorded in 2 steps of 0.033º in the 5≤2≤40 range, counting for 0.8 s per step at 10ºC.
Preliminary identification of the initial phases was evaluated using the original pigment
and PCM as references; Sodalite (00-046-0103), Sodium Sulfide (00-003-0933),
Sodium Hydrogen Sulfide (01-077-1883) and Hexadecane (00-030-1745). The observed
XRD maxima are in good agreement with the compound mixture (Figure 4.14.).
Figure 4.14.- X-ray diffraction full profile refinement of Hexadecane/pigment composite. Circles denote
experimental points; upper solid lines are calculated profiles. Theoretical peak positions (vertical sticks)
and difference lines are shown in the bottom.
The semi quantitative calculations using the FULLPROF program for the main
phases show the 18/82 relation for hexadecane/pigment composite.
4.1.4. Materials durability
4.1.4.1. Durability of the final composite at 30ºC
The best composite obtained from vacuum impregnation process was subjected to
30ºC during 1000 hours.
The latent heat of fusion and crystallization and the crystallization and melting
points, were monitored at 250 hours, 500 hours, 750 hours and 1000 hours by using
DSC technique (Table 4.4.).
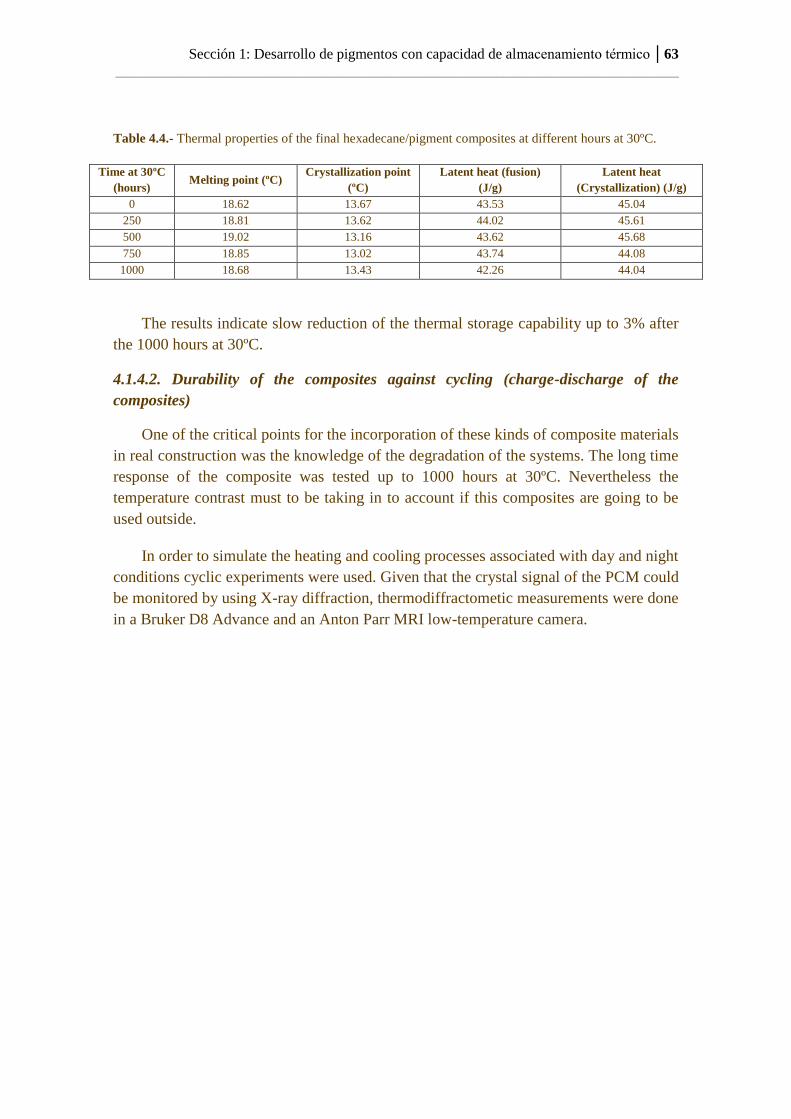
Sección 1: Desarrollo de pigmentos con capacidad de almacenamiento térmico │63
_____________________________________________________________________________
Table 4.4.- Thermal properties of the final hexadecane/pigment composites at different hours at 30ºC.
Time at 30ºC
(hours) Melting point (ºC)
Crystallization point
(ºC)
Latent heat (fusion)
(J/g)
Latent heat
(Crystallization) (J/g)
0 18.62 13.67 43.53 45.04
250 18.81 13.62 44.02 45.61
500 19.02 13.16 43.62 45.68
750 18.85 13.02 43.74 44.08
1000 18.68 13.43 42.26 44.04
The results indicate slow reduction of the thermal storage capability up to 3% after
the 1000 hours at 30ºC.
4.1.4.2. Durability of the composites against cycling (charge-discharge of the
composites)
One of the critical points for the incorporation of these kinds of composite materials
in real construction was the knowledge of the degradation of the systems. The long time
response of the composite was tested up to 1000 hours at 30ºC. Nevertheless the
temperature contrast must to be taking in to account if this composites are going to be
used outside.
In order to simulate the heating and cooling processes associated with day and night
conditions cyclic experiments were used. Given that the crystal signal of the PCM could
be monitored by using X-ray diffraction, thermodiffractometic measurements were done
in a Bruker D8 Advance and an Anton Parr MRI low-temperature camera.
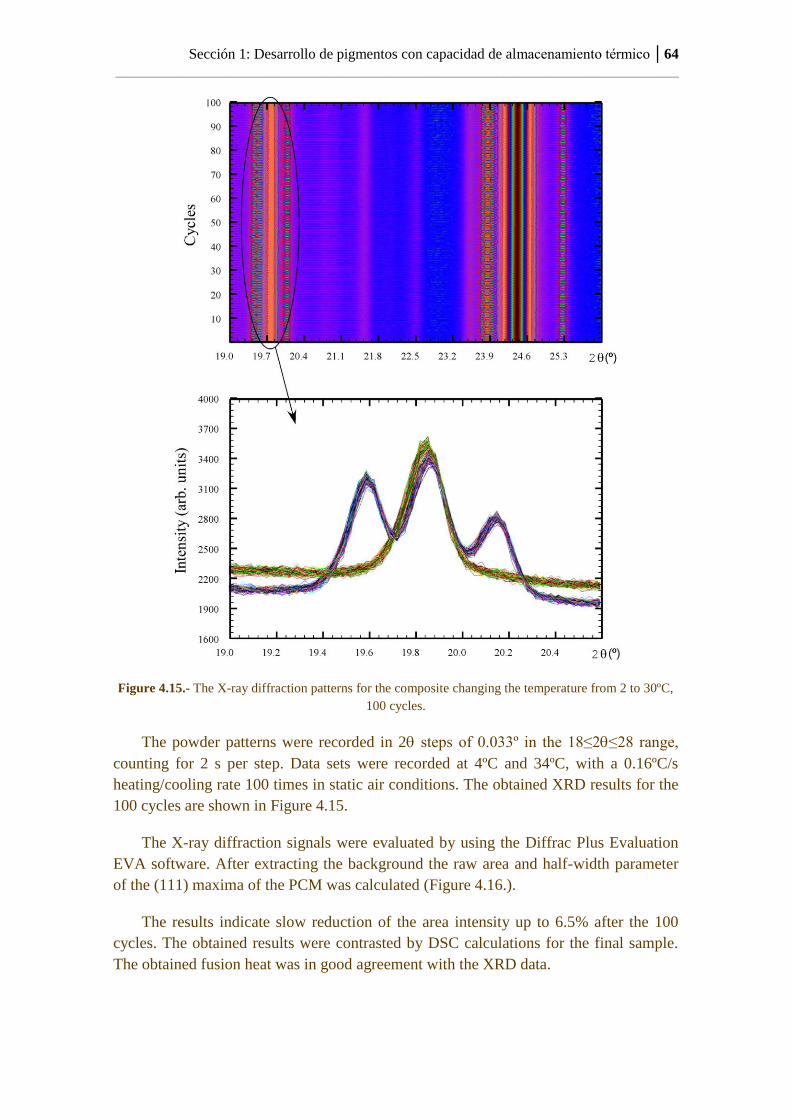
Sección 1: Desarrollo de pigmentos con capacidad de almacenamiento térmico │64
_____________________________________________________________________________
Figure 4.15.- The X-ray diffraction patterns for the composite changing the temperature from 2 to 30ºC,
100 cycles.
The powder patterns were recorded in 2 steps of 0.033º in the 18≤2≤28 range,
counting for 2 s per step. Data sets were recorded at 4ºC and 34ºC, with a 0.16ºC/s
heating/cooling rate 100 times in static air conditions. The obtained XRD results for the
100 cycles are shown in Figure 4.15.
The X-ray diffraction signals were evaluated by using the Diffrac Plus Evaluation
EVA software. After extracting the background the raw area and half-width parameter
of the (111) maxima of the PCM was calculated (Figure 4.16.).
The results indicate slow reduction of the area intensity up to 6.5% after the 100
cycles. The obtained results were contrasted by DSC calculations for the final sample.
The obtained fusion heat was in good agreement with the XRD data.
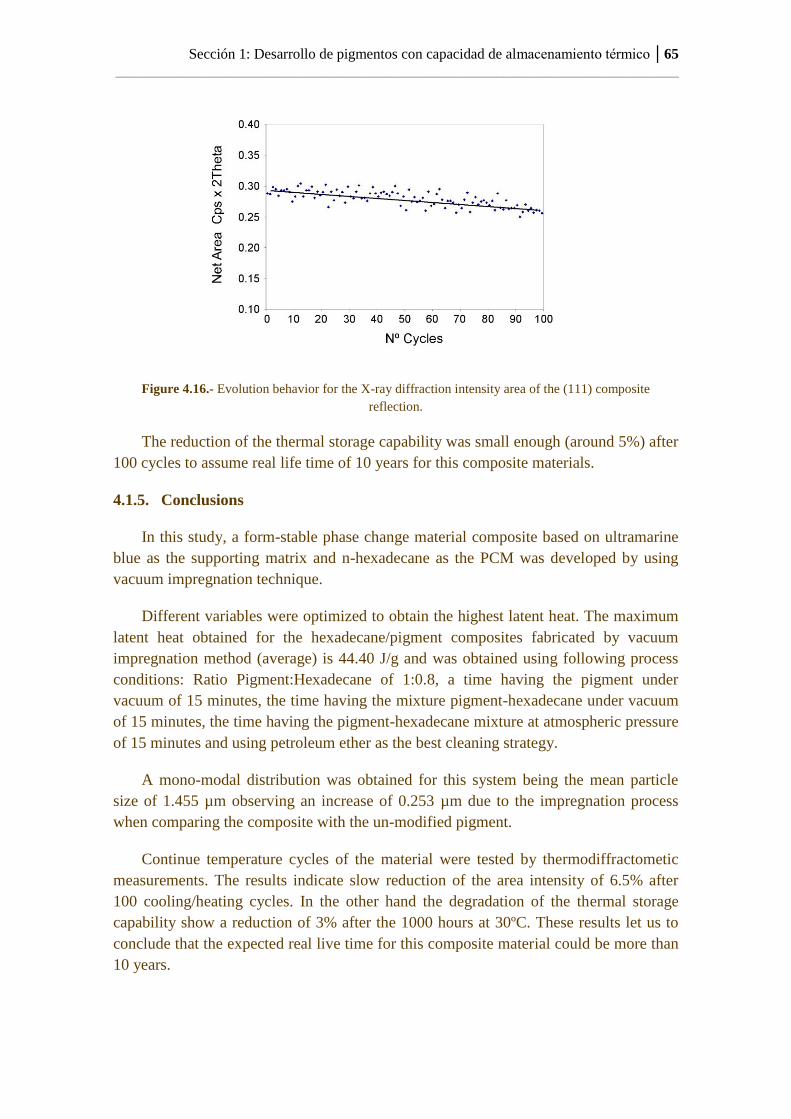
Sección 1: Desarrollo de pigmentos con capacidad de almacenamiento térmico │65
_____________________________________________________________________________
Figure 4.16.- Evolution behavior for the X-ray diffraction intensity area of the (111) composite
reflection.
The reduction of the thermal storage capability was small enough (around 5%) after
100 cycles to assume real life time of 10 years for this composite materials.
4.1.5. Conclusions
In this study, a form-stable phase change material composite based on ultramarine
blue as the supporting matrix and n-hexadecane as the PCM was developed by using
vacuum impregnation technique.
Different variables were optimized to obtain the highest latent heat. The maximum
latent heat obtained for the hexadecane/pigment composites fabricated by vacuum
impregnation method (average) is 44.40 J/g and was obtained using following process
conditions: Ratio Pigment:Hexadecane of 1:0.8, a time having the pigment under
vacuum of 15 minutes, the time having the mixture pigment-hexadecane under vacuum
of 15 minutes, the time having the pigment-hexadecane mixture at atmospheric pressure
of 15 minutes and using petroleum ether as the best cleaning strategy.
A mono-modal distribution was obtained for this system being the mean particle
size of 1.455 µm observing an increase of 0.253 µm due to the impregnation process
when comparing the composite with the un-modified pigment.
Continue temperature cycles of the material were tested by thermodiffractometic
measurements. The results indicate slow reduction of the area intensity of 6.5% after
100 cooling/heating cycles. In the other hand the degradation of the thermal storage
capability show a reduction of 3% after the 1000 hours at 30ºC. These results let us to
conclude that the expected real live time for this composite material could be more than
10 years.

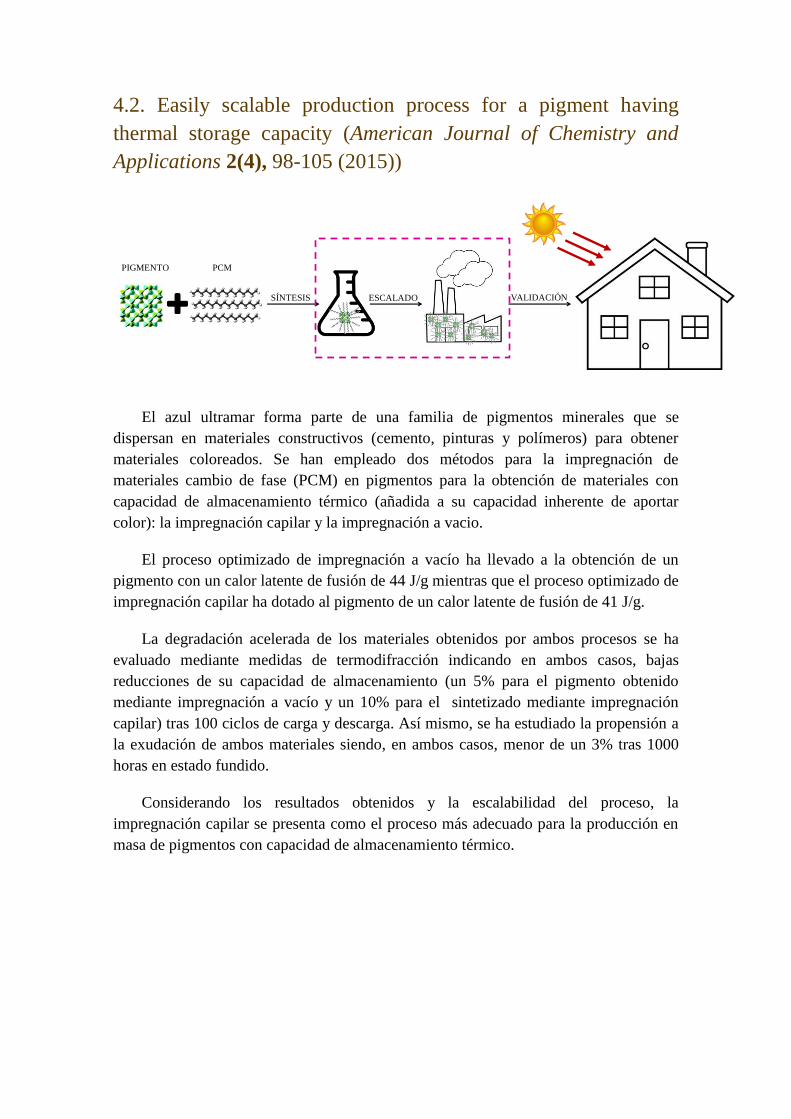
4.2. Easily scalable production process for a pigment having
thermal storage capacity (American Journal of Chemistry and
Applications 2(4), 98-105 (2015))
El azul ultramar forma parte de una familia de pigmentos minerales que se
dispersan en materiales constructivos (cemento, pinturas y polímeros) para obtener
materiales coloreados. Se han empleado dos métodos para la impregnación de
materiales cambio de fase (PCM) en pigmentos para la obtención de materiales con
capacidad de almacenamiento térmico (añadida a su capacidad inherente de aportar
color): la impregnación capilar y la impregnación a vacio.
El proceso optimizado de impregnación a vacío ha llevado a la obtención de un
pigmento con un calor latente de fusión de 44 J/g mientras que el proceso optimizado de
impregnación capilar ha dotado al pigmento de un calor latente de fusión de 41 J/g.
La degradación acelerada de los materiales obtenidos por ambos procesos se ha
evaluado mediante medidas de termodifracción indicando en ambos casos, bajas
reducciones de su capacidad de almacenamiento (un 5% para el pigmento obtenido
mediante impregnación a vacío y un 10% para el sintetizado mediante impregnación
capilar) tras 100 ciclos de carga y descarga. Así mismo, se ha estudiado la propensión a
la exudación de ambos materiales siendo, en ambos casos, menor de un 3% tras 1000
horas en estado fundido.
Considerando los resultados obtenidos y la escalabilidad del proceso, la
impregnación capilar se presenta como el proceso más adecuado para la producción en
masa de pigmentos con capacidad de almacenamiento térmico.
PIGMENTO PCM
ESCALADOSÍNTESIS VALIDACIÓN


Sección 1: Desarrollo de pigmentos con capacidad de almacenamiento térmico │69
_____________________________________________________________________________
4.2. Easily scalable production process for a pigment having
thermal storage capacity
American Journal of Chemistry and Applications 2(4), 98-105 (2015)
Abstract
Ultramarine blue are a family of mineral pigments that are commonly dispersed in
construction materials (concrete, paints, and polymers) to obtain colored materials. Two
different methods for encapsulating phase change materials (PCM) in pigments have
been studied to obtain PCM/pigment composites with thermal storage capacity:
capillary and vacuum impregnation methods. The aim is to obtain a pigment providing
thermal storage capacity to construction materials (apart from color) by an easily
scalable process.
The optimized vacuum impregnation process provides an hexadecane/pigment
composite having a latent heat of fusion of 44 J/g (around a 20%wt. hexadecane
adsorbed in the pigment) while the optimized capillary impregnation process allows the
fabrication of a pigment with a latent heat of fusion of 41 J/g (around a 18%wt.
hexadecane). Durability of both materials has been tested by thermodiffractometric
measurements indicating in both cases, slow reductions of the area intensity of the XRD
signals (up to 5% and 10% after 100 cycles). The long term degradation behavior at
room temperature was tested by DSC showing a reduction of a 3% of the thermal
storage capability after 1000 hours.
Considering the degradation and scalability issues, capillary impregnation seems to
be the most suitable process for the mass production of pigments having high thermal
storage capacity.
Keywords: Ultramarine Blue, Hexadecane, Phase Change Material, Thermal Storage.
Highlights
A phase change composite adsorbing n-hexadecane around ultramarine pigment
has been developed by capillary impregnation method.
The obtained pigment has a latent heat of fusion of 41 J/g.
The pigment was manufactured at pre-industrial scale.
Degradation of the thermal storage capability was evaluated.
Sección 1: Desarrollo de pigmentos con capacidad de almacenamiento térmico │70
_____________________________________________________________________________
4.2.1. Introduction
Phase Change Materials (PCMs) are ideal products for thermal management
solutions as they store and release thermal energy within the temperature of the melting
and freezing processes24
. During the phase change, the temperature remains constant
leading to an intelligent temperature management, so that PCM can be integrated in
different building components with the aim of reducing energy consumption for space
conditioning. Among phase change materials, paraffin is believed to be the most
promising one because it can store large amount of latent heat being stable, non-toxic
and not corrosive25- 27
.
The incorporation of these PCMs in construction materials requires a previous
encapsulation, as the thermal energy of paraffin is stored and released when the material
changes its phase (from solid to liquid and from liquid to solid, respectively) and this
fact can lead to leakages28
. The encapsulated PCMs are classified in macro or micro-
encapsulated, and there are a wide variety of encapsulating methods and systems
obtaining different sizes, geometries and materials29,30
. Support of PCMs into porous
materials is a promising alternative method for the encapsulation of PCMs but there is
still a real need of development concerning PCM containment method to be
economically available31
. Also, long term stability of encapsulated materials subjected
to thermal cycling must be assessed 32-34
.
Ultramarine blue are a family of low-cost mineral pigments with high pigmentary
properties that are commonly dispersed in construction materials (concrete, paints,
polymers) to obtain colored materials.
24
Chena, Y., Shih, Y. & Yu, Y. Stearyl Alcohol Modified Expanded Graphite / Paraffin Phase Change
Composite. Int. J. Appl. Sci. Eng. 11, 227–233(2013). 25
Xu, B. & Li, Z. Paraffin/diatomite composite phase change material incorporated cement-based
composite for thermal energy storage. App. Energy 105, 229–237 (2013). 26
Sharma, A., Tyagi, V. V., Chen, C. R. & Buddhi, D. Review on thermal energy storage with phase
change materials and applications. Renew. Sustain. Energy Rev. 13, 318–345 (2009). 27
Sotomayor, M. E., Krupa, I., Várez, A. & Levenfeld, B. Thermal and mechanical characterization of
injection moulded high density polyethylene/paraffin wax blends as phase change materials. Renew.
Energy 68, 140–145 (2014). 28
Faraji, M., Alami, M. E. & Najam, M. Thermal Control of Building using latent heat storage south
wall. J. Math. Comput. Sci. 10, 212–227 (2014). 29
Rodriguez-Ubinas, E., Ruiz-Valero, L., Vega, S. & Neila, J. Applications of Phase Change Material in
highly energy-efficient houses. Energy Build. 50, 49–62 (2012). 30
Jamekhorshid, A., Sadrameli, S. M. & Farid, M. A review of microencapsulation methods of phase
change materials (PCMs) as a thermal energy storage (TES) medium. Renew. Sustain. Energy Rev. 31,
531–542 (2014). 31
Li, X., Sanjayan, J. G. & Wilson, J. L. Fabrication and stability of form-stable diatomite/paraffin
phase change material composites. Energy Build. 76, 284–294 (2014). 32
Py, X., Olives, R. & Mauran, S. Paraffin/porous-graphite-matrix composite as a high and constant
power thermal storage material. Int. J. Heat Mass Trans. 44, 2727–2737 (2001). 33
Memon, S. A., Lo, T. Y., Barbhuiya, S. A. & Xu, W. Development of form-stable composite phase
change material by incorporation of dodecyl alcohol into ground granulated blast furnace slag. Energy
Build. 62, 360–367 (2013). 34
Oya, T., Nomura, T., Tsubota, M., Okinaka, N. & Akiyama, T. Thermal conductivity enhancement of
erythritol as PCM by using graphite and nickel particles. App. Therm. Eng. 61, 825–828 (2013).
Sección 1: Desarrollo de pigmentos con capacidad de almacenamiento térmico │71
_____________________________________________________________________________
The aim of this study is to determine the best impregnation method to develop
phase change material composites based on ultramarine blue (using the pigment as the
PCM container). Vacuum and capillary impregnation methods are compared for
obtaining a pigment with thermal storage capabilities. The main advantage of this new
product (hexadecane/pigment composite) is that manufacturing processes of building
components would not be altered as the thermal storage capability is provided by the
modified pigment (a product commonly added to construction materials).
As scalability of the PCM encapsulation processes is questioned, vacuum
impregnation and capillary processes have been studied optimizing the main process
variables to maximize the latent heat of the hexadecane/pigment composite. In addition
to the process optimization, the stability of the composite having the maximum latent
heat was investigated.
4.2.2. Characterization techniques
The compositional analysis of the pigments were carried out by X-ray Fluorescence
(XRF) using a Bruker S8 Tiger 4K spectrometer working at 4 Kw and up to 60 Kv and
170 mA. Pressed powder pigment pellets (200 bar) were analyzed under vacuum
conditions using customized calibrated Quant-Express program.
The crystal structures of the compounds were studied by X-ray Diffraction (XRD)
technique. The X-ray powder diffraction patterns were collected using a PHILIPS
X’PERT PRO automatic diffractometer (40 kV 40 mA) in theta-theta configuration,
secondary monochromator with Cu-K radiation (λ = 1.5418 Å) and a PIXcel solid
state detector (active length in 2θ 3.347º). XRD data were collected from 10 to 80° 2θ
(step size = 0.02606 and time per step = 500 s) at RT. A fixed divergence and
antiscattering slit giving a constant volume of sample illumination were used. Phase
identification of the initial compound was evaluated using the Powder Diffraction File
(PDF) database. PANalytical X´Pert High Score program was used for indexing of all
the observed maxima.
The Scanning Electron Microscopy (SEM) micrographs were recorded with Hitachi
S-4800 equipment using Secondary Electron Detector at 3 kV accelerating voltage and
8 mm working distance. Different batches of pigment were analyzed showing
reproducible results in terms of morphology and microstructure.
The particle size distribution (0.02 to 2000 µm range) of the compounds were
analyzed using Laser Dispersion by Malvern Mastersizer 2000. Water was used as the
dispersion media and the samples were subjected to ultrasonic stirring during 2 min.
Fourier Transform Infrared Spectroscopy was used to analyze the chemical groups
associated to hexadecane using a Perkin Elmer Spectrum One from 450 to 4000 cm-1
with an spectral resolution of 4 cm-1
.
Sección 1: Desarrollo de pigmentos con capacidad de almacenamiento térmico │72
_____________________________________________________________________________
The thermal behavior of n-hexadecane was tested using Thermo Gravimetrical
Analysis (TGA) and Differential Scanning Calorimetry measurement. The TGA was
done in a Q600-0802-SDT of TA Instruments using a heating rate of 10ºC·min-1
from
25ºC to 350ºC and a nitrogen flow of 100 ml/min. The Differential Scanning
Calorimetry measurement were carried out using a DSC (Mettler Toledo HP DSC827)
under nitrogen atmosphere (50 ml/min), using around 5 mg as a sample weight in a
sealed aluminum pan. Heating rate and precision of temperature were 5ºC/min and
±0.01ºC, respectively. A dynamic method was used with a temperature ranged from -
10ºC to 50ºC at a rate of 5ºC/min.
The X-ray Thermo diffraction measurements for the hexadecane/pigment
composites were collected on a Bruker D8 Advance diffractometer operating at 30 kV
and 20 mA, equipped with a Cu tube (λ = 1.5418 Å), a Vantec-1 PSD detector, and an
Anton Parr MRI low-temperature camera. Data sets were recorded in 2 steps of 0.033º
in the 18 ≤2 ≤ 28 range, counting for 2 s per step. Data sets were recorded at 4ºC and
34ºC, with a 0.16ºC/s heating/cooling rate 100 times in static air conditions. From the
obtained XRD signals, area intensity values were evaluated by using the Diffrac Plus
Evaluation EVA software.
4.2.3. Experimental
4.2.3.1. Materials
Ultramarine pigment (Nubiola Pigmentos S.L.)
The X-ray fluorescence (XRF) analysis showed contents of 18.7% on Silice, 13.5%
on Aluminium, 16.1% on Sodium and 38.1% on oxygen as the main elements. The
obtained results are in good agreement with the crystal structure studied by X-ray
diffraction (XRD) were Sodalite “Pigment Blue” (00-046-0103) and small impurities of
Sodium Sulfide (00-003-0933) and Sodium Hydrogen Sulfide (01-077-1883) can be
detected. The size of the coherently diffracting domains (crystallite size) of the samples
were extracted from the broadening of the signal using the Scherrer equation35
:
cos hklhkl Lk . where βhkl is the broadening of the diffraction line measured at
half of the line maximum intensity (FWHM) (βInst=0.1°), λ is the X-ray wavelength, Lhkl
is the crystal size and θ is the diffraction angle. K is the Scherrer shape factor (K=0.9
was used for the calculations). The calculated crystallite sizes are around 80(5) nm.
The scanning electron microscope (SEM) micrograph showed particle sizes less
than ~1 μm (Figure 4.17.a). In the other hand, stable and mono-modal distribution of
grains were obtained by laser dispersion being the main particle size d50 of 1.2 µm
(Figure 4.17.b). These results indicate mostly no particle agglomeration in the samples.
35
Scherrer, P. Bestimmung der Grosse und der inneren Struktur von Kolloidteilchen mittels
Rontgenstrahlen. Nachr Ges Wiss Gottingen. 26, 98-100 (1918).
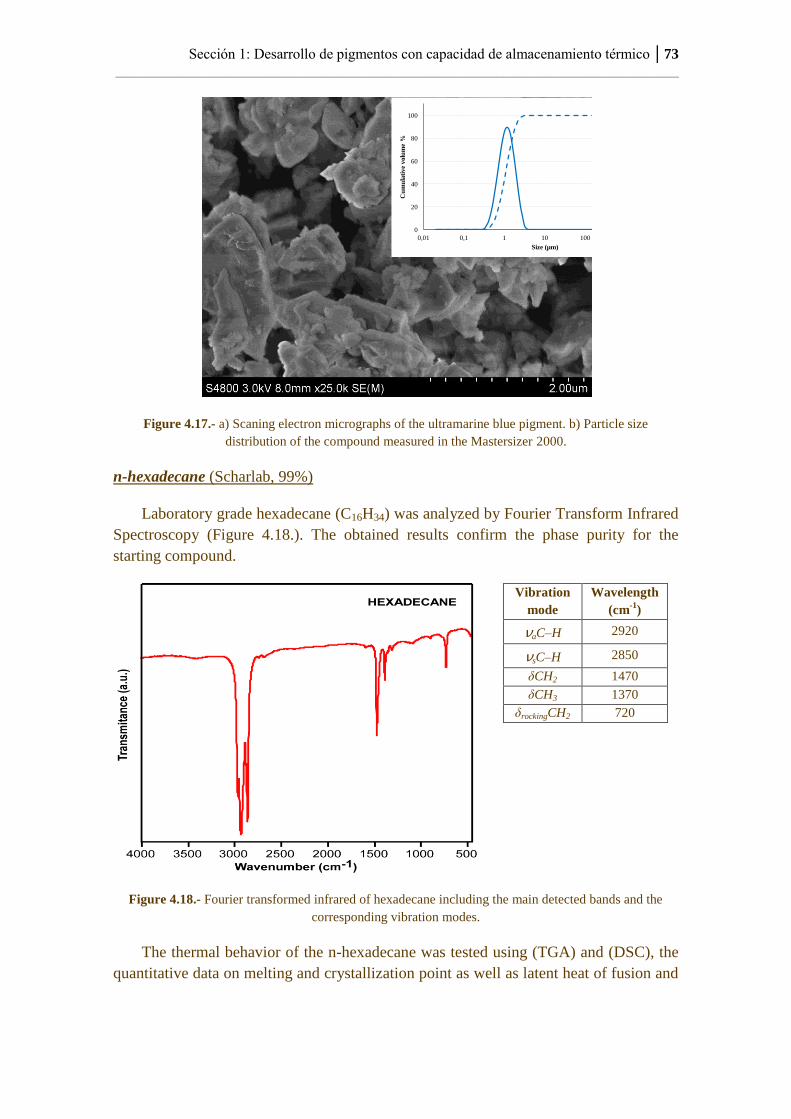
Sección 1: Desarrollo de pigmentos con capacidad de almacenamiento térmico │73
_____________________________________________________________________________
Figure 4.17.- a) Scaning electron micrographs of the ultramarine blue pigment. b) Particle size
distribution of the compound measured in the Mastersizer 2000.
n-hexadecane (Scharlab, 99%)
Laboratory grade hexadecane (C16H34) was analyzed by Fourier Transform Infrared
Spectroscopy (Figure 4.18.). The obtained results confirm the phase purity for the
starting compound.
Vibration
mode
Wavelength
(cm-1
)
ʋaC–H 2920
ʋsC–H 2850
δCH2 1470
δCH3 1370
δrockingCH2 720
Figure 4.18.- Fourier transformed infrared of hexadecane including the main detected bands and the
corresponding vibration modes.
The thermal behavior of the n-hexadecane was tested using (TGA) and (DSC), the
quantitative data on melting and crystallization point as well as latent heat of fusion and
0
2
4
6
8
10
12
0
20
40
60
80
100
0,01 0,1 1 10 100 1000 10000
Cu
mu
lati
ve
vo
lum
e %
Size (µm)
Cumulative volume (%)
Volume %
Volu
me
(%)
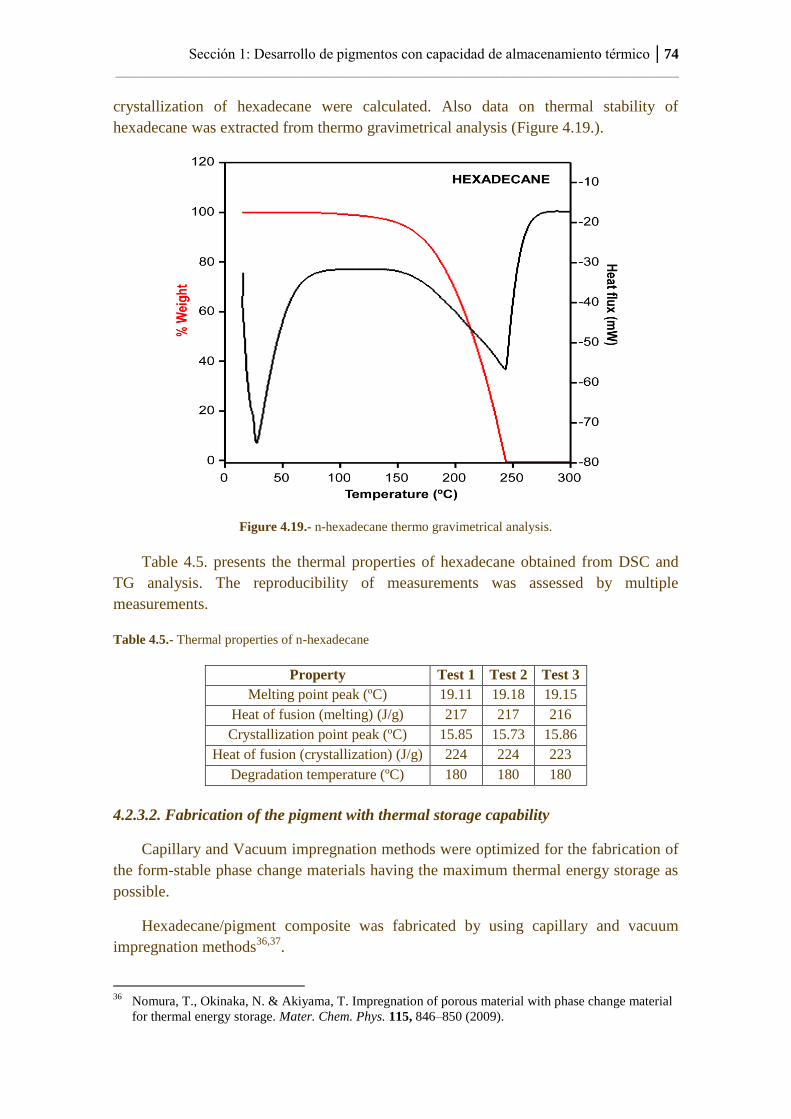
Sección 1: Desarrollo de pigmentos con capacidad de almacenamiento térmico │74
_____________________________________________________________________________
crystallization of hexadecane were calculated. Also data on thermal stability of
hexadecane was extracted from thermo gravimetrical analysis (Figure 4.19.).
Figure 4.19.- n-hexadecane thermo gravimetrical analysis.
Table 4.5. presents the thermal properties of hexadecane obtained from DSC and
TG analysis. The reproducibility of measurements was assessed by multiple
measurements.
Table 4.5.- Thermal properties of n-hexadecane
Property Test 1 Test 2 Test 3
Melting point peak (ºC) 19.11 19.18 19.15
Heat of fusion (melting) (J/g) 217 217 216
Crystallization point peak (ºC) 15.85 15.73 15.86
Heat of fusion (crystallization) (J/g) 224 224 223
Degradation temperature (ºC) 180 180 180
4.2.3.2. Fabrication of the pigment with thermal storage capability
Capillary and Vacuum impregnation methods were optimized for the fabrication of
the form-stable phase change materials having the maximum thermal energy storage as
possible.
Hexadecane/pigment composite was fabricated by using capillary and vacuum
impregnation methods36,37
.
36
Nomura, T., Okinaka, N. & Akiyama, T. Impregnation of porous material with phase change material
for thermal energy storage. Mater. Chem. Phys. 115, 846–850 (2009).
Sección 1: Desarrollo de pigmentos con capacidad de almacenamiento térmico │75
_____________________________________________________________________________
For the capillary method, the pigment and the liquid hexadecane were mixed under
stirring during a certain time at a specific temperature. Then, a cleaning process was
applied to the samples. Different experiments were planned to optimize the different
variables in order to obtain a composite having a maximum latent heat: (a) ratio
pigment:hexadecane, b) cleaning strategies, c) the time having the mixture pigment-
hexadecane and e) the temperature at which the mixture pigment-hexadecane is done.
After the process, the pigment was dried at 60ºC during 24 hours.
In the case of vacuum impregnation method, the pigment was placed inside a flask
connected to a vacuum pump and after having the pigment under 40 mbar of pressure
during a certain time, the liquid hexadecane was added. After having the mixture under
vacuum, sample was put under atmospheric pressure conditions forcing then the liquid
hexadecane to be adsorbed on the pigment surface. As well as in the first processing,
different experiments were planned to optimize the variables involved: (a) ratio
pigment:hexadecane, b) cleaning strategies, c) time 1 (time having the pigment under
vacuum), d) time 2 (time having the mixture pigment-hexadecane under vacuum), e)
time 3 (time having the pigment-hexadecane mixture at atmospheric pressure). After the
process, the pigment was dried as in the first case (60ºC, 24 h).
For both methods the cleaning strategy was to wash 20 g of pigment with 100 ml of
the selected solvents (in some cases deionized water and in other case petroleum ether
having a boiling range of 35ºC to 60ºC). Then, the pigment was dried at atmospheric
pressure.
All the obtained samples were analyzed by DSC (with the same conditions used
previously for the raw hexadecane compound) to measure the latent heat of fusion,
latent heat of crystallization, melting temperature and crystallization temperature. Table
4.6. summarizes the prepared samples and the obtained thermal properties.
37
Liu, R., Zhang, F., Su, W., Zhao, H. & Wang, C. Impregnation of porous mullite with Na2SO4 phase
change material for thermal energy storage. Sol. Energy Mater. Sol. Cells. 134, 268–274 (2015).
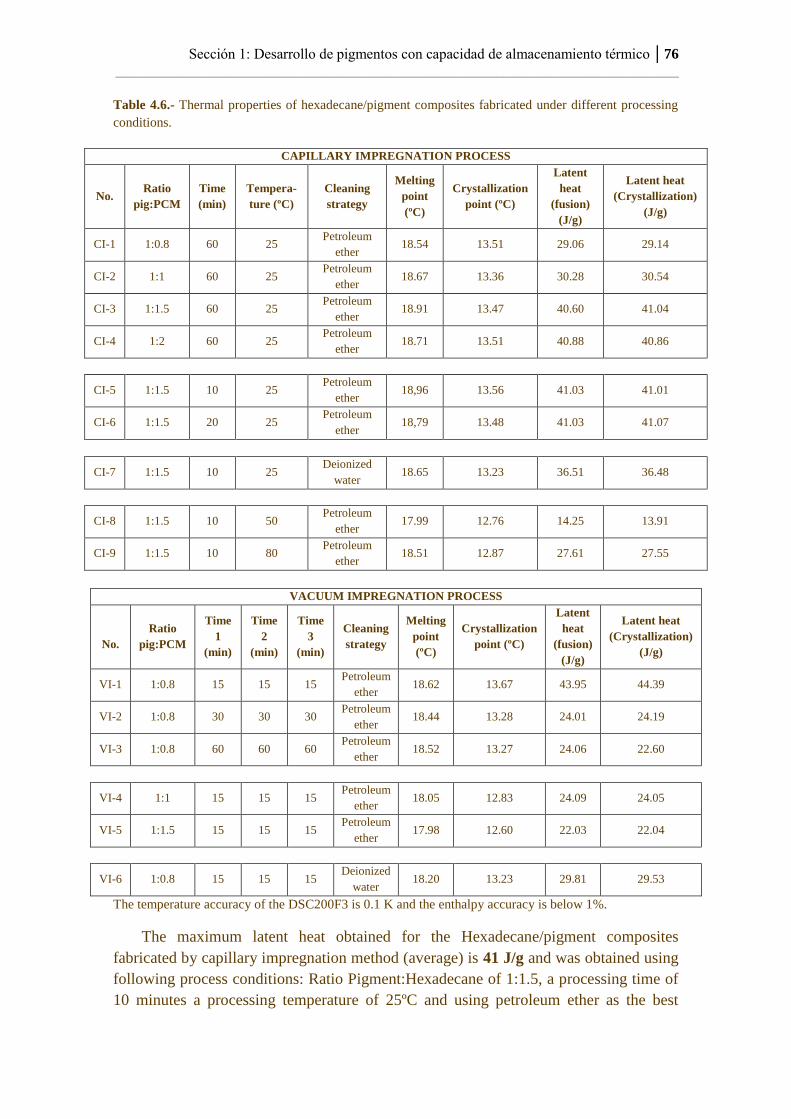
Sección 1: Desarrollo de pigmentos con capacidad de almacenamiento térmico │76
_____________________________________________________________________________
Table 4.6.- Thermal properties of hexadecane/pigment composites fabricated under different processing
conditions.
CAPILLARY IMPREGNATION PROCESS
No. Ratio
pig:PCM
Time
(min)
Tempera-
ture (ºC)
Cleaning
strategy
Melting
point
(ºC)
Crystallization
point (ºC)
Latent
heat
(fusion)
(J/g)
Latent heat
(Crystallization)
(J/g)
CI-1 1:0.8 60 25 Petroleum
ether 18.54 13.51 29.06 29.14
CI-2 1:1 60 25 Petroleum
ether 18.67 13.36 30.28 30.54
CI-3 1:1.5 60 25 Petroleum
ether 18.91 13.47 40.60 41.04
CI-4 1:2 60 25 Petroleum
ether 18.71 13.51 40.88 40.86
CI-5 1:1.5 10 25 Petroleum
ether 18,96 13.56 41.03 41.01
CI-6 1:1.5 20 25 Petroleum
ether 18,79 13.48 41.03 41.07
CI-7 1:1.5 10 25 Deionized
water 18.65 13.23 36.51 36.48
CI-8 1:1.5 10 50 Petroleum
ether 17.99 12.76 14.25 13.91
CI-9 1:1.5 10 80 Petroleum
ether 18.51 12.87 27.61 27.55
VACUUM IMPREGNATION PROCESS
No. Ratio
pig:PCM
Time
1
(min)
Time
2
(min)
Time
3
(min)
Cleaning
strategy
Melting
point
(ºC)
Crystallization
point (ºC)
Latent
heat
(fusion)
(J/g)
Latent heat
(Crystallization)
(J/g)
VI-1 1:0.8 15 15 15 Petroleum
ether 18.62 13.67 43.95 44.39
VI-2 1:0.8 30 30 30 Petroleum
ether 18.44 13.28 24.01 24.19
VI-3 1:0.8 60 60 60 Petroleum
ether 18.52 13.27 24.06 22.60
VI-4 1:1 15 15 15 Petroleum
ether 18.05 12.83 24.09 24.05
VI-5 1:1.5 15 15 15 Petroleum
ether 17.98 12.60 22.03 22.04
VI-6 1:0.8 15 15 15 Deionized
water 18.20 13.23 29.81 29.53
The temperature accuracy of the DSC200F3 is 0.1 K and the enthalpy accuracy is below 1%.
The maximum latent heat obtained for the Hexadecane/pigment composites
fabricated by capillary impregnation method (average) is 41 J/g and was obtained using
following process conditions: Ratio Pigment:Hexadecane of 1:1.5, a processing time of
10 minutes a processing temperature of 25ºC and using petroleum ether as the best
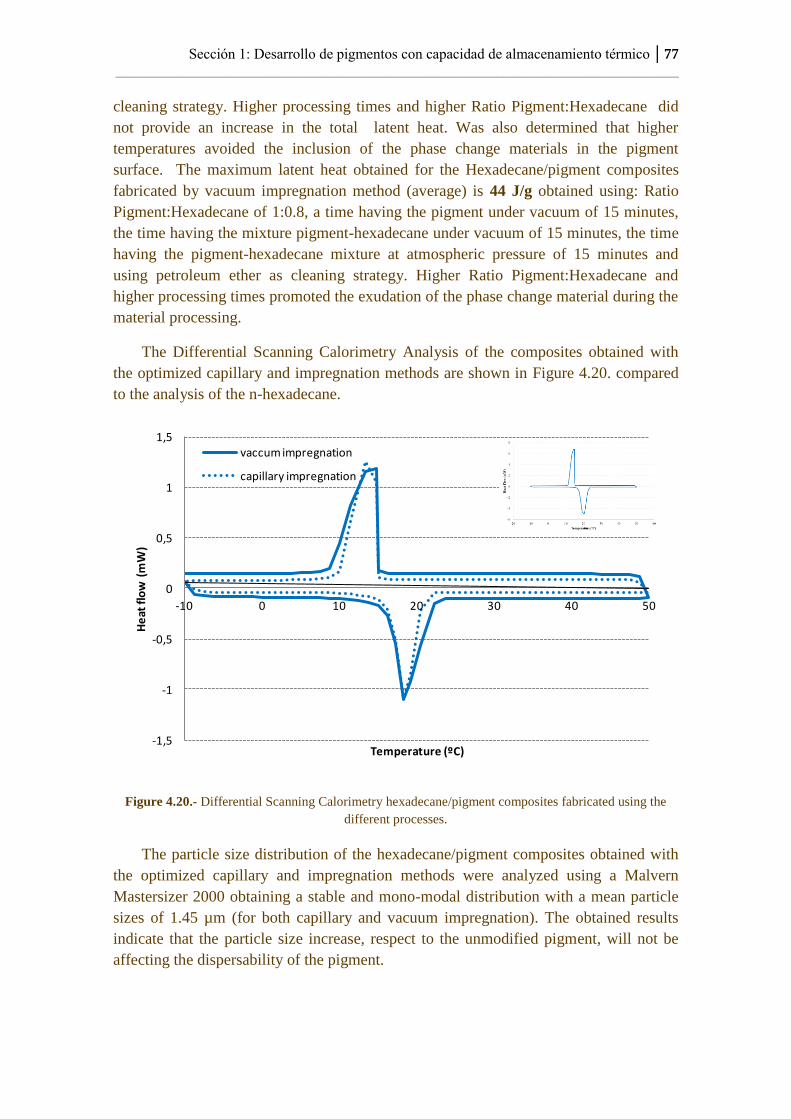
Sección 1: Desarrollo de pigmentos con capacidad de almacenamiento térmico │77
_____________________________________________________________________________
cleaning strategy. Higher processing times and higher Ratio Pigment:Hexadecane did
not provide an increase in the total latent heat. Was also determined that higher
temperatures avoided the inclusion of the phase change materials in the pigment
surface. The maximum latent heat obtained for the Hexadecane/pigment composites
fabricated by vacuum impregnation method (average) is 44 J/g obtained using: Ratio
Pigment:Hexadecane of 1:0.8, a time having the pigment under vacuum of 15 minutes,
the time having the mixture pigment-hexadecane under vacuum of 15 minutes, the time
having the pigment-hexadecane mixture at atmospheric pressure of 15 minutes and
using petroleum ether as cleaning strategy. Higher Ratio Pigment:Hexadecane and
higher processing times promoted the exudation of the phase change material during the
material processing.
The Differential Scanning Calorimetry Analysis of the composites obtained with
the optimized capillary and impregnation methods are shown in Figure 4.20. compared
to the analysis of the n-hexadecane.
Figure 4.20.- Differential Scanning Calorimetry hexadecane/pigment composites fabricated using the
different processes.
The particle size distribution of the hexadecane/pigment composites obtained with
the optimized capillary and impregnation methods were analyzed using a Malvern
Mastersizer 2000 obtaining a stable and mono-modal distribution with a mean particle
sizes of 1.45 µm (for both capillary and vacuum impregnation). The obtained results
indicate that the particle size increase, respect to the unmodified pigment, will not be
affecting the dispersability of the pigment.
-1,5
-1
-0,5
0
0,5
1
1,5
-10 0 10 20 30 40 50
He
at fl
ow
(m
W)
Temperature (ºC)
vaccum impregnation
capillary impregnation
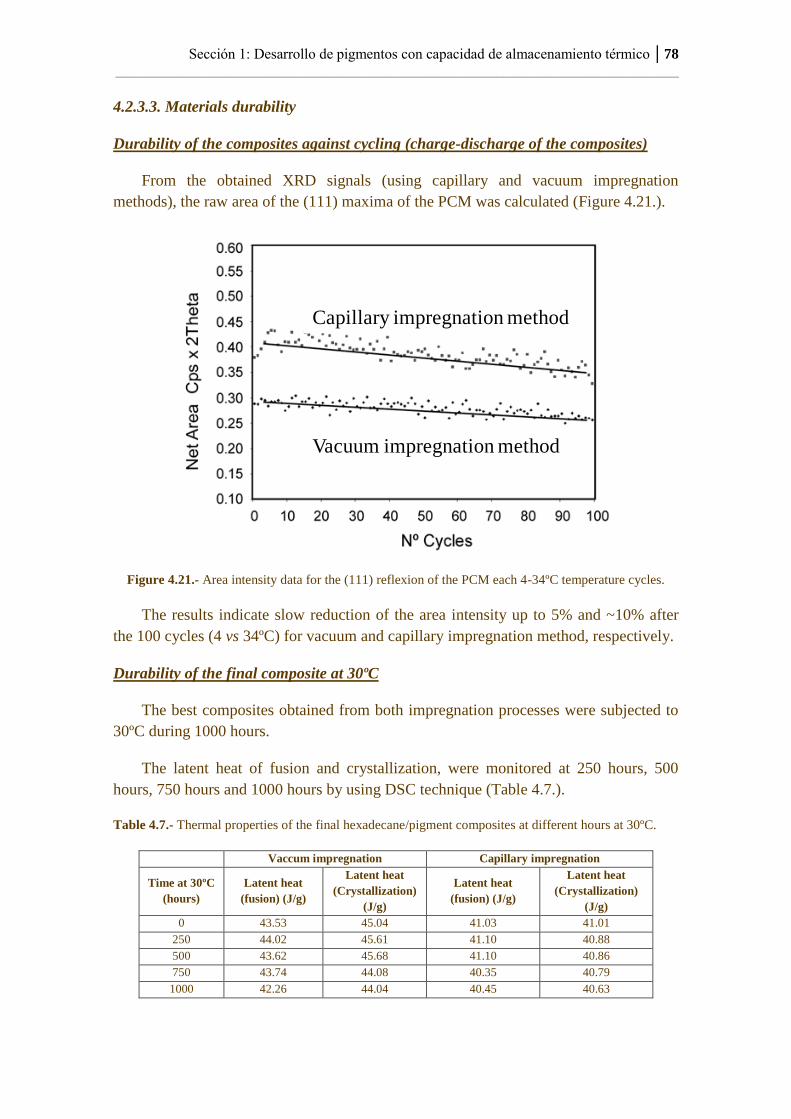
Sección 1: Desarrollo de pigmentos con capacidad de almacenamiento térmico │78
_____________________________________________________________________________
4.2.3.3. Materials durability
Durability of the composites against cycling (charge-discharge of the composites)
From the obtained XRD signals (using capillary and vacuum impregnation
methods), the raw area of the (111) maxima of the PCM was calculated (Figure 4.21.).
Figure 4.21.- Area intensity data for the (111) reflexion of the PCM each 4-34ºC temperature cycles.
The results indicate slow reduction of the area intensity up to 5% and ~10% after
the 100 cycles (4 vs 34ºC) for vacuum and capillary impregnation method, respectively.
Durability of the final composite at 30ºC
The best composites obtained from both impregnation processes were subjected to
30ºC during 1000 hours.
The latent heat of fusion and crystallization, were monitored at 250 hours, 500
hours, 750 hours and 1000 hours by using DSC technique (Table 4.7.).
Table 4.7.- Thermal properties of the final hexadecane/pigment composites at different hours at 30ºC.
Vaccum impregnation Capillary impregnation
Time at 30ºC
(hours) Latent heat
(fusion) (J/g)
Latent heat
(Crystallization)
(J/g)
Latent heat
(fusion) (J/g)
Latent heat
(Crystallization)
(J/g)
0 43.53 45.04 41.03 41.01
250 44.02 45.61 41.10 40.88
500 43.62 45.68 41.10 40.86
750 43.74 44.08 40.35 40.79
1000 42.26 44.04 40.45 40.63
Capillary impregnation method
Vacuum impregnation method
Sección 1: Desarrollo de pigmentos con capacidad de almacenamiento térmico │79
_____________________________________________________________________________
The results indicate slow reduction of the thermal storage capability in both systems
up to 3% after the 1000 hours at 30ºC.
Taking into account the similar latent heat provided by both systems and the similar
durability of these materials, capillary impregnation is presented as a promising process
for the mass production of pigments having thermal storage capacity.
4.2.4. Mass production of pigment having thermal storage capacity
5 kg of raw ultramarine pigment were put in contact with 7.5 kg of hexadecane at
ambient pressure and ambient temperature in a Plasmec turbomixer at Nubiola facilities.
The mixture was kept under stirring during 10 minutes. After this time, the pigment was
taken out of the reactor, was cleaned up using petroleum ether and was dried at 60ºC
during 24 hours.
Two batches of 6 kg were obtained and a sample of each batch was analyzed in
terms of thermal capacity (by differential scanning calorimetry) (Table 4.8.). The
different batches had a similar thermal storage capacity.
Table 4.8.- Thermal properties for different batches.
Property Batch 1 Batch 2
Melting point peak (ºC) 18.98 19.01
Heat of fusion (melting) (J/g) 42.30 42.60
Crystallization point peak (ºC) 13.58 13.62
Heat of fusion (crystallization) (J/g) 42.10 42.40
The particle size distribution of the hexadecane/pigment composites obtained were
analyzed using a Malvern Mastersizer 2000 obtaining a stable and mono-modal
distribution with a mean particle sizes of 1.44 µm (for both batches).
Taking into account the mass balance of the process, about 6.5 kg of hexadecane
are lost during the cleaning process. This data is in a good agreement with the
percentage of hexadecane adsorbed on the pigment (18.5%wt.). That means that less
than 1 kg of the hexadecane is adsorbed on the pigment surface. A recovery strategy
must be designed to optimize the balance of the process.
4.2.5. Conclusions
In this study, a phase change material composite based on ultramarine blue as the
supporting matrix and n-hexadecane as the PCM was developed by using two different
impregnation techniques.
The optimized vacuum impregnation process provides a slightly higher latent heat
of fusion (44 J/g) than the optimized capillary impregnation process (41 J/g).
Sección 1: Desarrollo de pigmentos con capacidad de almacenamiento térmico │80
_____________________________________________________________________________
Both materials present a reduction of their storage capability between 5% and 10%
against 100 cycles of heating/cooling and slow reduction (up to 3%) after 1000 hours at
30ºC.
According to these results, capillary impregnation is presented as a promising
process for the mass production of pigments having thermal storage capacity as costs
associated to this process are lower than those for the vacuum impregnation.
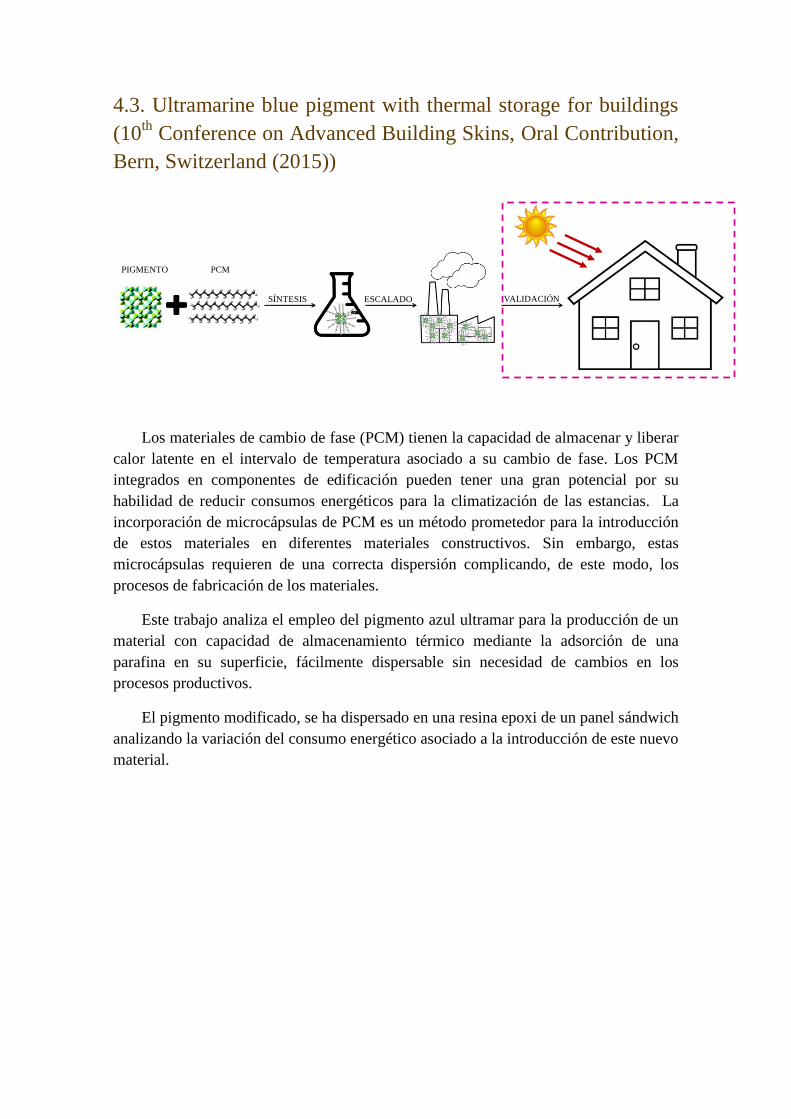
4.3. Ultramarine blue pigment with thermal storage for buildings
(10th
Conference on Advanced Building Skins, Oral Contribution,
Bern, Switzerland (2015))
Los materiales de cambio de fase (PCM) tienen la capacidad de almacenar y liberar
calor latente en el intervalo de temperatura asociado a su cambio de fase. Los PCM
integrados en componentes de edificación pueden tener una gran potencial por su
habilidad de reducir consumos energéticos para la climatización de las estancias. La
incorporación de microcápsulas de PCM es un método prometedor para la introducción
de estos materiales en diferentes materiales constructivos. Sin embargo, estas
microcápsulas requieren de una correcta dispersión complicando, de este modo, los
procesos de fabricación de los materiales.
Este trabajo analiza el empleo del pigmento azul ultramar para la producción de un
material con capacidad de almacenamiento térmico mediante la adsorción de una
parafina en su superficie, fácilmente dispersable sin necesidad de cambios en los
procesos productivos.
El pigmento modificado, se ha dispersado en una resina epoxi de un panel sándwich
analizando la variación del consumo energético asociado a la introducción de este nuevo
material.
PIGMENTO PCM
ESCALADOSÍNTESIS VALIDACIÓN


Sección 1: Desarrollo de pigmentos con capacidad de almacenamiento térmico │83
_____________________________________________________________________________
4.3. Ultramarine blue pigment with thermal storage for
buildings
10th
Conference on Advanced Building Skins, Oral Contribution. Bern, Switzerland
(2015)
Abstract
Phase change materials (PCM) have the ability to store and release latent heat
within the temperature range associated with a phase change. PCM integrated building
components could have a high potential because of their ability to reduce energy
consumption for space conditioning. Incorporation of micro-capsules containing PCM
is a promising method for the introduction of these materials in building components.
However, these micro-capsules must be conveniently dispersed making more complex
the manufacturing processes for the construction materials.
The paper analyses the use of a standard ultramarine pigment for the production of
a composite having thermal storage capability by adsorbing n-hexadecane paraffin
around the pigment surface. These type of pigments are conventionally used in
construction sector once have been dispersed in different building components. The
main advantage of the use of n-hexadecane/pigment composite is that processes for
building components manufacturing as the thermal storage capability is provided by the
modified pigment. Impregnation method has been employed optimizing the process
variables to maximize the latent heat of the final material obtaining a 20%wt.
hexadecane adsorbed in the pigment. Long-term stability has been tested by
thermodiffractometic cyclic measurements. 100 cycles of heating and cooling were
performed and the area intensity of the crystals was monitored by using X-ray
diffraction. Final modified pigment was dispersed in the epoxy resin of a sandwich
panel analyzing the energy consumption of this material in a mock-up.
Keywords: Pigment, Hexadecane, Phase Change Material, Thermal Storage
Highlights
A phase change composite adsorbing n-hexadecane around ultramarine pigment
has been developed by capillary impregnation method.
The pigment was dispersed at 17%wt. in an epoxy resin and a sandwich panel
having an epoxy laminate was manufactured.
The addition of the pigment into the epoxy matrix didn’t affect the mechanical
properties of the sandwich panel.
An energy consumption test was done obtaining a 7.4% reduction on energy
consumption.
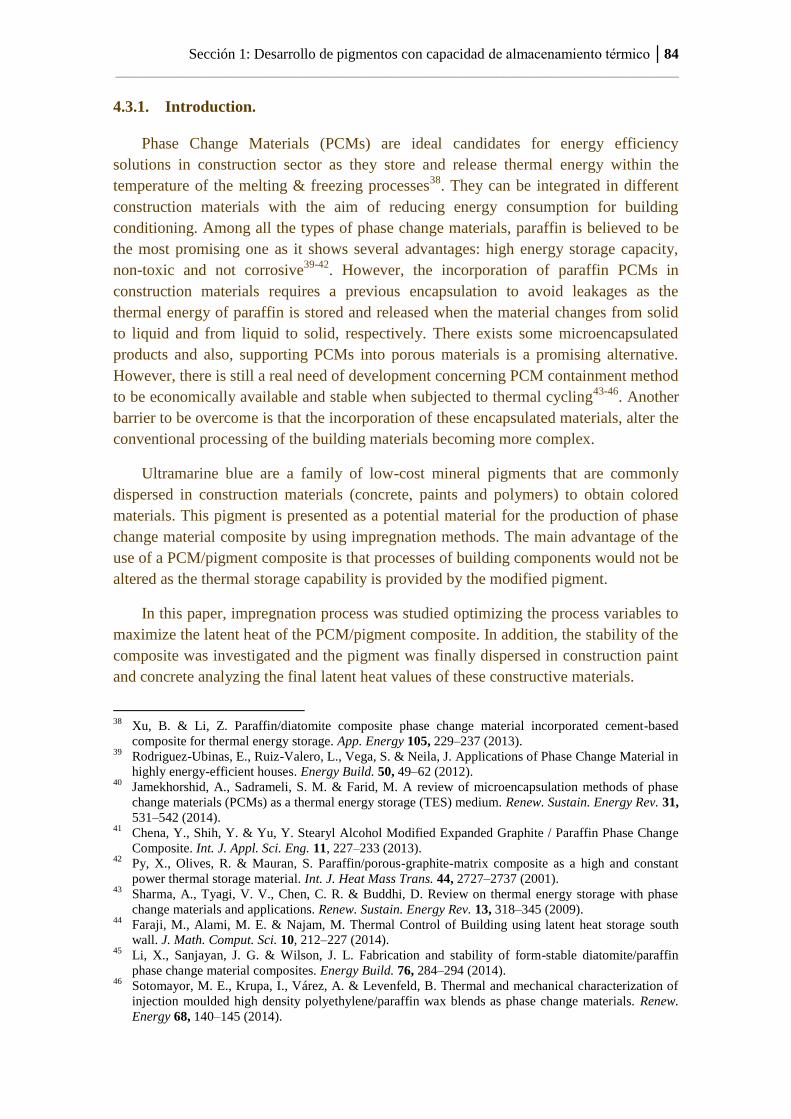
Sección 1: Desarrollo de pigmentos con capacidad de almacenamiento térmico │84
_____________________________________________________________________________
4.3.1. Introduction.
Phase Change Materials (PCMs) are ideal candidates for energy efficiency
solutions in construction sector as they store and release thermal energy within the
temperature of the melting & freezing processes38
. They can be integrated in different
construction materials with the aim of reducing energy consumption for building
conditioning. Among all the types of phase change materials, paraffin is believed to be
the most promising one as it shows several advantages: high energy storage capacity,
non-toxic and not corrosive39-42
. However, the incorporation of paraffin PCMs in
construction materials requires a previous encapsulation to avoid leakages as the
thermal energy of paraffin is stored and released when the material changes from solid
to liquid and from liquid to solid, respectively. There exists some microencapsulated
products and also, supporting PCMs into porous materials is a promising alternative.
However, there is still a real need of development concerning PCM containment method
to be economically available and stable when subjected to thermal cycling43-46
. Another
barrier to be overcome is that the incorporation of these encapsulated materials, alter the
conventional processing of the building materials becoming more complex.
Ultramarine blue are a family of low-cost mineral pigments that are commonly
dispersed in construction materials (concrete, paints and polymers) to obtain colored
materials. This pigment is presented as a potential material for the production of phase
change material composite by using impregnation methods. The main advantage of the
use of a PCM/pigment composite is that processes of building components would not be
altered as the thermal storage capability is provided by the modified pigment.
In this paper, impregnation process was studied optimizing the process variables to
maximize the latent heat of the PCM/pigment composite. In addition, the stability of the
composite was investigated and the pigment was finally dispersed in construction paint
and concrete analyzing the final latent heat values of these constructive materials.
38
Xu, B. & Li, Z. Paraffin/diatomite composite phase change material incorporated cement-based
composite for thermal energy storage. App. Energy 105, 229–237 (2013). 39
Rodriguez-Ubinas, E., Ruiz-Valero, L., Vega, S. & Neila, J. Applications of Phase Change Material in
highly energy-efficient houses. Energy Build. 50, 49–62 (2012). 40
Jamekhorshid, A., Sadrameli, S. M. & Farid, M. A review of microencapsulation methods of phase
change materials (PCMs) as a thermal energy storage (TES) medium. Renew. Sustain. Energy Rev. 31,
531–542 (2014). 41
Chena, Y., Shih, Y. & Yu, Y. Stearyl Alcohol Modified Expanded Graphite / Paraffin Phase Change
Composite. Int. J. Appl. Sci. Eng. 11, 227–233 (2013). 42
Py, X., Olives, R. & Mauran, S. Paraffin/porous-graphite-matrix composite as a high and constant
power thermal storage material. Int. J. Heat Mass Trans. 44, 2727–2737 (2001). 43
Sharma, A., Tyagi, V. V., Chen, C. R. & Buddhi, D. Review on thermal energy storage with phase
change materials and applications. Renew. Sustain. Energy Rev. 13, 318–345 (2009). 44
Faraji, M., Alami, M. E. & Najam, M. Thermal Control of Building using latent heat storage south
wall. J. Math. Comput. Sci. 10, 212–227 (2014). 45
Li, X., Sanjayan, J. G. & Wilson, J. L. Fabrication and stability of form-stable diatomite/paraffin
phase change material composites. Energy Build. 76, 284–294 (2014). 46
Sotomayor, M. E., Krupa, I., Várez, A. & Levenfeld, B. Thermal and mechanical characterization of
injection moulded high density polyethylene/paraffin wax blends as phase change materials. Renew.
Energy 68, 140–145 (2014).
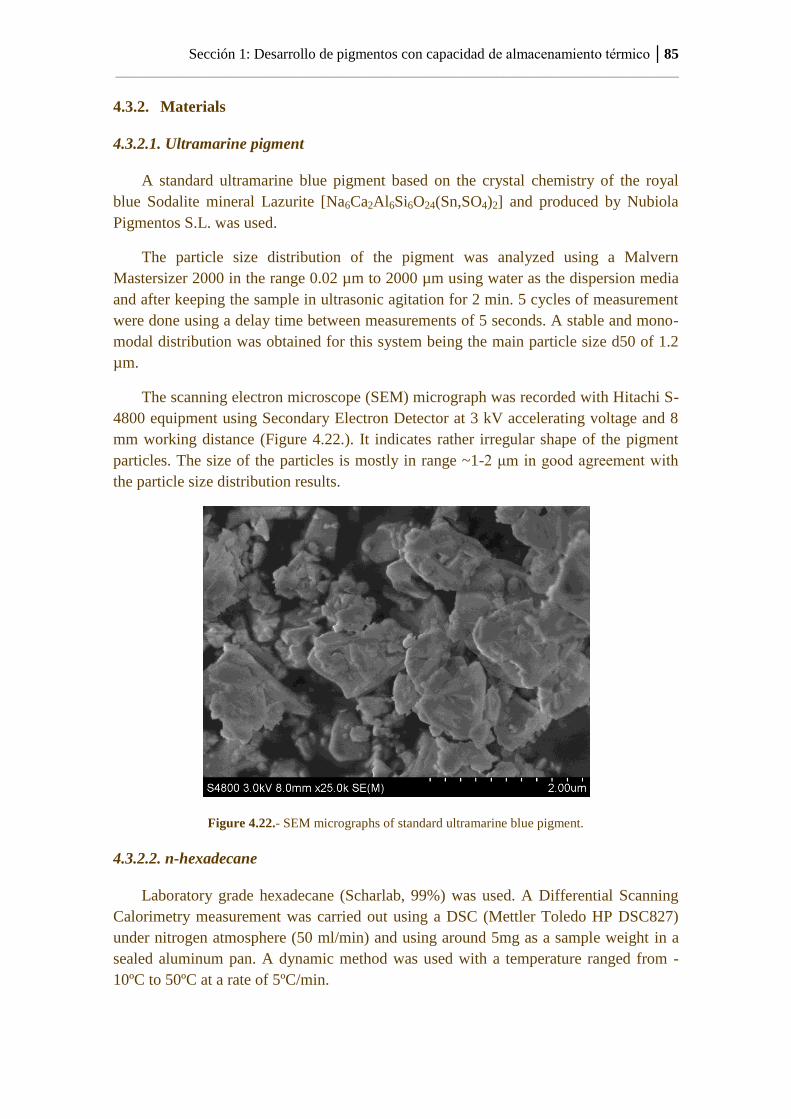
Sección 1: Desarrollo de pigmentos con capacidad de almacenamiento térmico │85
_____________________________________________________________________________
4.3.2. Materials
4.3.2.1. Ultramarine pigment
A standard ultramarine blue pigment based on the crystal chemistry of the royal
blue Sodalite mineral Lazurite [Na6Ca2Al6Si6O24(Sn,SO4)2] and produced by Nubiola
Pigmentos S.L. was used.
The particle size distribution of the pigment was analyzed using a Malvern
Mastersizer 2000 in the range 0.02 µm to 2000 µm using water as the dispersion media
and after keeping the sample in ultrasonic agitation for 2 min. 5 cycles of measurement
were done using a delay time between measurements of 5 seconds. A stable and mono-
modal distribution was obtained for this system being the main particle size d50 of 1.2
µm.
The scanning electron microscope (SEM) micrograph was recorded with Hitachi S-
4800 equipment using Secondary Electron Detector at 3 kV accelerating voltage and 8
mm working distance (Figure 4.22.). It indicates rather irregular shape of the pigment
particles. The size of the particles is mostly in range ~1-2 μm in good agreement with
the particle size distribution results.
Figure 4.22.- SEM micrographs of standard ultramarine blue pigment.
4.3.2.2. n-hexadecane
Laboratory grade hexadecane (Scharlab, 99%) was used. A Differential Scanning
Calorimetry measurement was carried out using a DSC (Mettler Toledo HP DSC827)
under nitrogen atmosphere (50 ml/min) and using around 5mg as a sample weight in a
sealed aluminum pan. A dynamic method was used with a temperature ranged from -
10ºC to 50ºC at a rate of 5ºC/min.
Sección 1: Desarrollo de pigmentos con capacidad de almacenamiento térmico │86
_____________________________________________________________________________
The latent heat of phase change was calculated by numerical integration of the area
under the peaks obtaining a heat of fusion (melting) of 217 J/g and a heat of fusion of
crystallization of 224 J/g. The melting point peak was detected at 19.11ºC and the
crystallization point peak at 15.85ºC.
The X-ray diffraction (XRD) patterns for the hexadecane were collected on a
Bruker D8 Advance diffractometer operating at 30 kV and 20 mA, equipped with a Cu
tube (λ = 1.5418 Å), a Vantec-1 PSD detector, and an Anton Parr MRI low-temperature
camera. The powder patterns were recorded in 2θ steps of 0.033º in the 5 ≤2θ ≤ 40
range, counting for 0.8 s per step. Data sets were recorded from 8 to 34ºC every 2 ºC,
with a 0.16 ºC s-1 heating rate between temperatures.
The obtained results show the transformation from crystalline to amorphous of
hexadecane (PDF 00-030-1745) at temperatures near 18ºC (Figure 4.23.).
Figure 4.23.- Phase crystallization behaviour from 8 to 34ºC.
4.3.3. Fabrication of the pigment with thermal storage capability
Capillary impregnation method was optimized for the fabrication of the
pigment/PCM composite with the aim of obtaining a composite having the maximum
thermal energy storage as possible. The pigment and the liquid hexadecane were mixed
under stirring during a certain time at a specific temperature. Then, a cleaning process
was applied to the samples. Different experiments were planned to optimize the
different variables in order to obtain a composite having a maximum latent heat: (a)
ratio pigment:hexadecane, b) cleaning strategies, c) the time having the mixture
pigment-hexadecane and e) the temperature at which the mixture pigment-hexadecane is
done. After the process, the pigment was dried at 60ºC during 24 hours.
(A3)(A3)
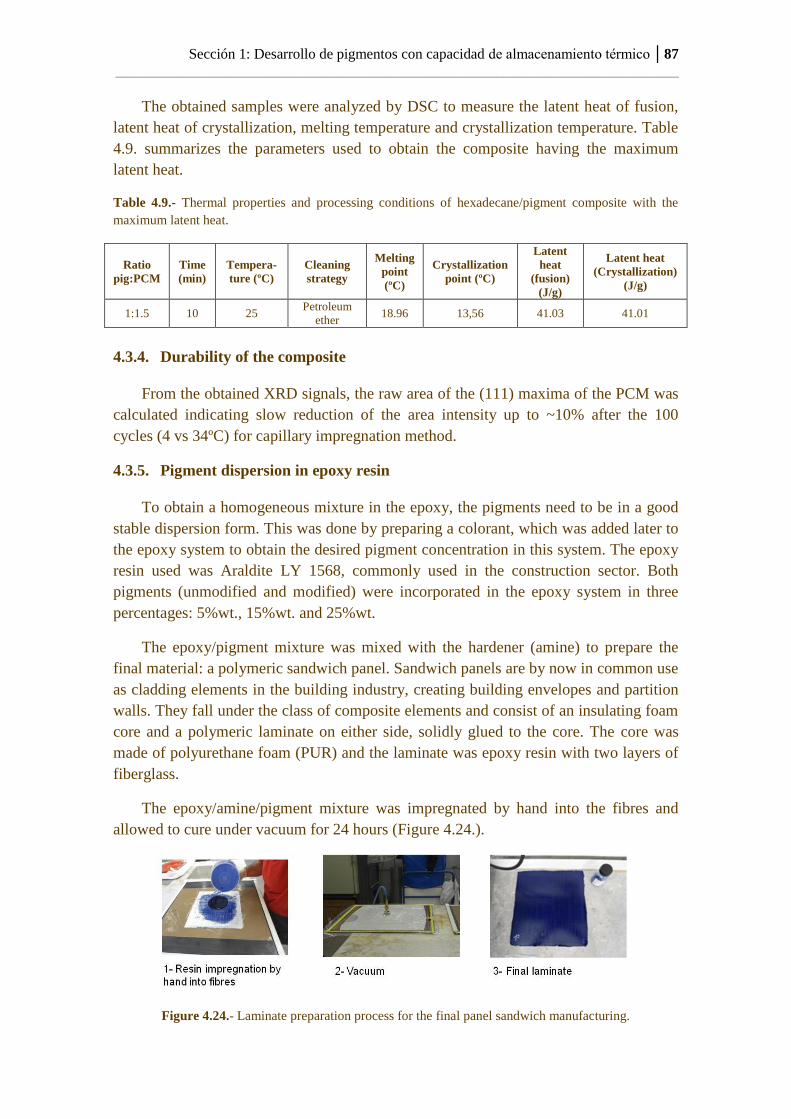
Sección 1: Desarrollo de pigmentos con capacidad de almacenamiento térmico │87
_____________________________________________________________________________
The obtained samples were analyzed by DSC to measure the latent heat of fusion,
latent heat of crystallization, melting temperature and crystallization temperature. Table
4.9. summarizes the parameters used to obtain the composite having the maximum
latent heat.
Table 4.9.- Thermal properties and processing conditions of hexadecane/pigment composite with the
maximum latent heat.
Ratio
pig:PCM
Time
(min)
Tempera-
ture (ºC)
Cleaning
strategy
Melting
point
(ºC)
Crystallization
point (ºC)
Latent
heat
(fusion)
(J/g)
Latent heat
(Crystallization)
(J/g)
1:1.5 10 25 Petroleum
ether 18.96 13,56 41.03 41.01
4.3.4. Durability of the composite
From the obtained XRD signals, the raw area of the (111) maxima of the PCM was
calculated indicating slow reduction of the area intensity up to ~10% after the 100
cycles (4 vs 34ºC) for capillary impregnation method.
4.3.5. Pigment dispersion in epoxy resin
To obtain a homogeneous mixture in the epoxy, the pigments need to be in a good
stable dispersion form. This was done by preparing a colorant, which was added later to
the epoxy system to obtain the desired pigment concentration in this system. The epoxy
resin used was Araldite LY 1568, commonly used in the construction sector. Both
pigments (unmodified and modified) were incorporated in the epoxy system in three
percentages: 5%wt., 15%wt. and 25%wt.
The epoxy/pigment mixture was mixed with the hardener (amine) to prepare the
final material: a polymeric sandwich panel. Sandwich panels are by now in common use
as cladding elements in the building industry, creating building envelopes and partition
walls. They fall under the class of composite elements and consist of an insulating foam
core and a polymeric laminate on either side, solidly glued to the core. The core was
made of polyurethane foam (PUR) and the laminate was epoxy resin with two layers of
fiberglass.
The epoxy/amine/pigment mixture was impregnated by hand into the fibres and
allowed to cure under vacuum for 24 hours (Figure 4.24.).
Figure 4.24.- Laminate preparation process for the final panel sandwich manufacturing.
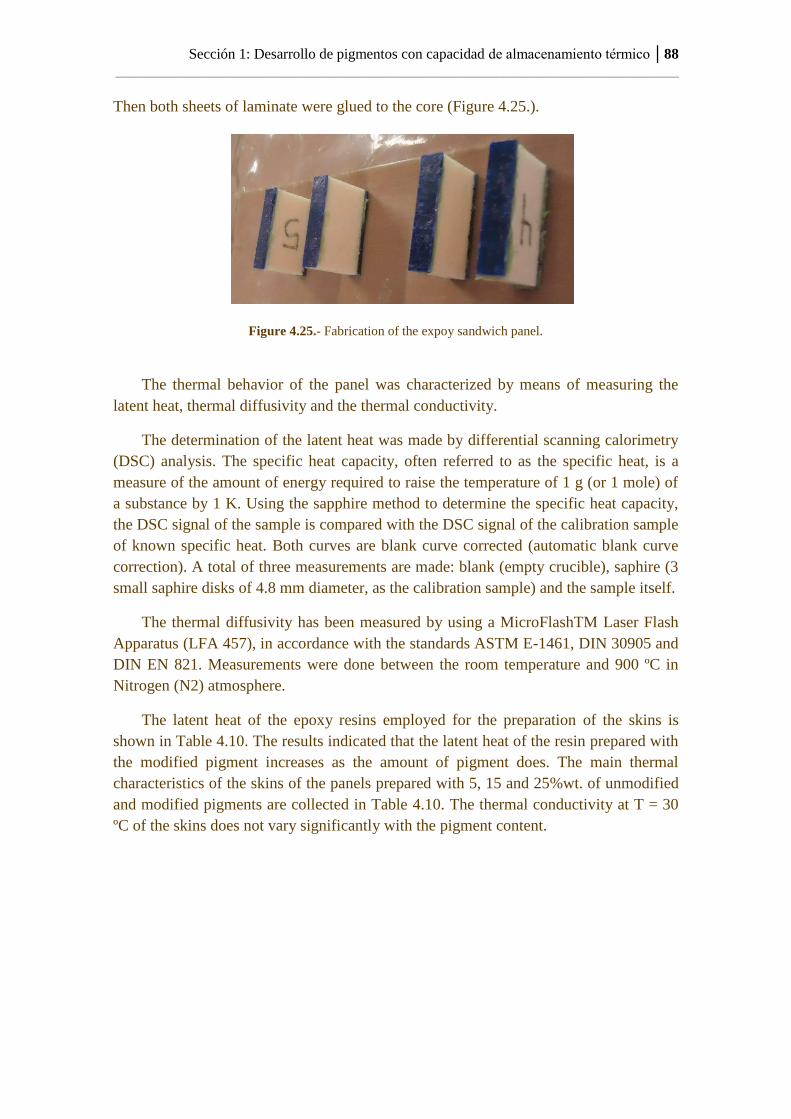
Sección 1: Desarrollo de pigmentos con capacidad de almacenamiento térmico │88
_____________________________________________________________________________
Then both sheets of laminate were glued to the core (Figure 4.25.).
Figure 4.25.- Fabrication of the expoy sandwich panel.
The thermal behavior of the panel was characterized by means of measuring the
latent heat, thermal diffusivity and the thermal conductivity.
The determination of the latent heat was made by differential scanning calorimetry
(DSC) analysis. The specific heat capacity, often referred to as the specific heat, is a
measure of the amount of energy required to raise the temperature of 1 g (or 1 mole) of
a substance by 1 K. Using the sapphire method to determine the specific heat capacity,
the DSC signal of the sample is compared with the DSC signal of the calibration sample
of known specific heat. Both curves are blank curve corrected (automatic blank curve
correction). A total of three measurements are made: blank (empty crucible), saphire (3
small saphire disks of 4.8 mm diameter, as the calibration sample) and the sample itself.
The thermal diffusivity has been measured by using a MicroFlashTM Laser Flash
Apparatus (LFA 457), in accordance with the standards ASTM E-1461, DIN 30905 and
DIN EN 821. Measurements were done between the room temperature and 900 ºC in
Nitrogen (N2) atmosphere.
The latent heat of the epoxy resins employed for the preparation of the skins is
shown in Table 4.10. The results indicated that the latent heat of the resin prepared with
the modified pigment increases as the amount of pigment does. The main thermal
characteristics of the skins of the panels prepared with 5, 15 and 25%wt. of unmodified
and modified pigments are collected in Table 4.10. The thermal conductivity at T = 30
ºC of the skins does not vary significantly with the pigment content.
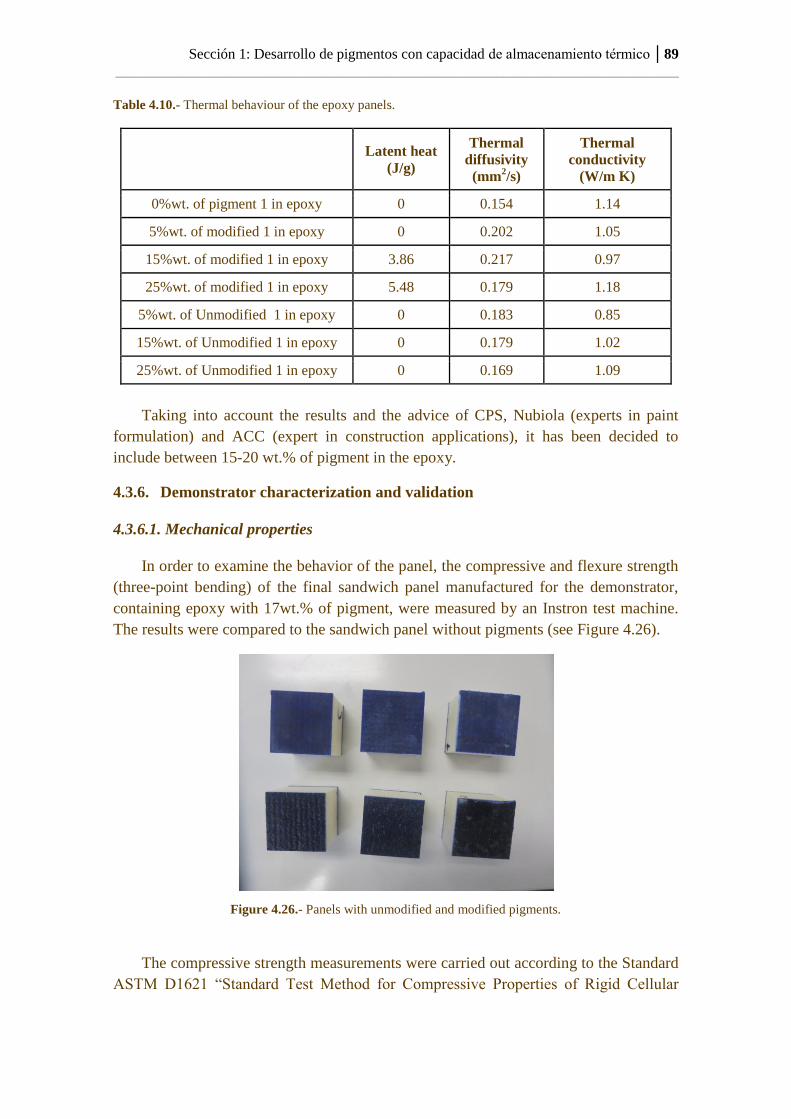
Sección 1: Desarrollo de pigmentos con capacidad de almacenamiento térmico │89
_____________________________________________________________________________
Table 4.10.- Thermal behaviour of the epoxy panels.
Latent heat
(J/g)
Thermal
diffusivity
(mm2/s)
Thermal
conductivity
(W/m K)
0%wt. of pigment 1 in epoxy 0 0.154 1.14
5%wt. of modified 1 in epoxy 0 0.202 1.05
15%wt. of modified 1 in epoxy 3.86 0.217 0.97
25%wt. of modified 1 in epoxy 5.48 0.179 1.18
5%wt. of Unmodified 1 in epoxy 0 0.183 0.85
15%wt. of Unmodified 1 in epoxy 0 0.179 1.02
25%wt. of Unmodified 1 in epoxy 0 0.169 1.09
Taking into account the results and the advice of CPS, Nubiola (experts in paint
formulation) and ACC (expert in construction applications), it has been decided to
include between 15-20 wt.% of pigment in the epoxy.
4.3.6. Demonstrator characterization and validation
4.3.6.1. Mechanical properties
In order to examine the behavior of the panel, the compressive and flexure strength
(three-point bending) of the final sandwich panel manufactured for the demonstrator,
containing epoxy with 17wt.% of pigment, were measured by an Instron test machine.
The results were compared to the sandwich panel without pigments (see Figure 4.26).
Figure 4.26.- Panels with unmodified and modified pigments.
The compressive strength measurements were carried out according to the Standard
ASTM D1621 “Standard Test Method for Compressive Properties of Rigid Cellular
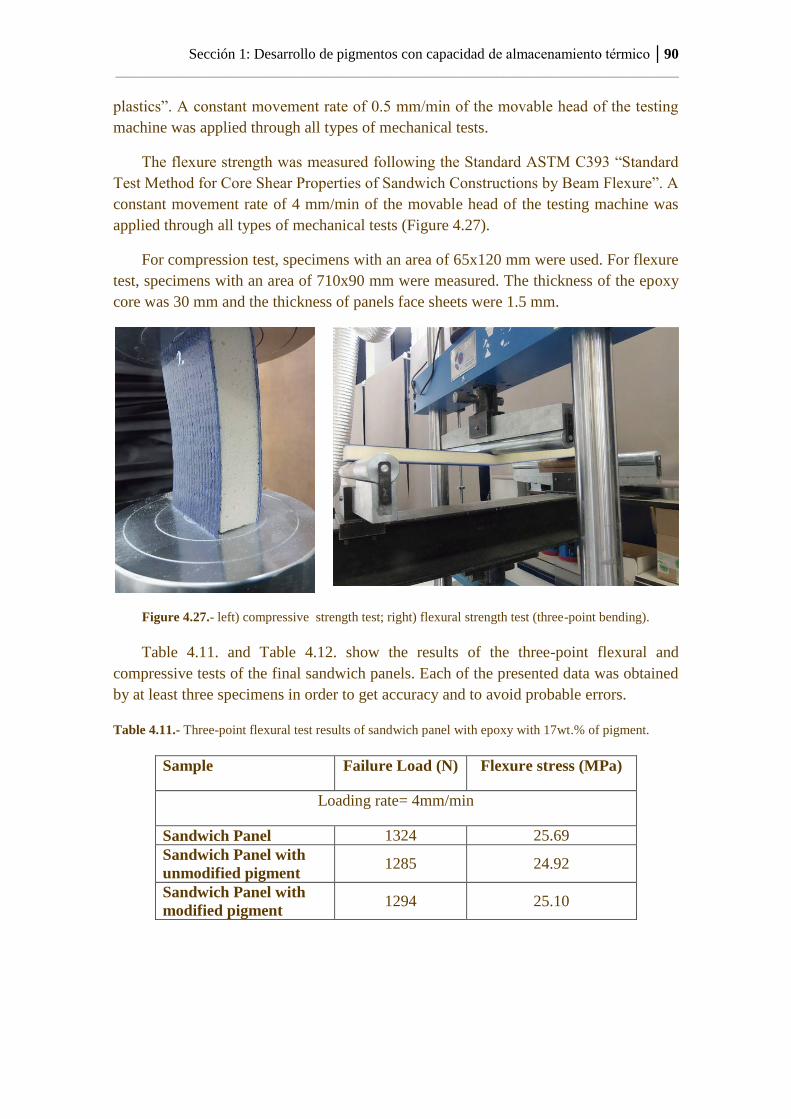
Sección 1: Desarrollo de pigmentos con capacidad de almacenamiento térmico │90
_____________________________________________________________________________
plastics”. A constant movement rate of 0.5 mm/min of the movable head of the testing
machine was applied through all types of mechanical tests.
The flexure strength was measured following the Standard ASTM C393 “Standard
Test Method for Core Shear Properties of Sandwich Constructions by Beam Flexure”. A
constant movement rate of 4 mm/min of the movable head of the testing machine was
applied through all types of mechanical tests (Figure 4.27).
For compression test, specimens with an area of 65x120 mm were used. For flexure
test, specimens with an area of 710x90 mm were measured. The thickness of the epoxy
core was 30 mm and the thickness of panels face sheets were 1.5 mm.
Figure 4.27.- left) compressive strength test; right) flexural strength test (three-point bending).
Table 4.11. and Table 4.12. show the results of the three-point flexural and
compressive tests of the final sandwich panels. Each of the presented data was obtained
by at least three specimens in order to get accuracy and to avoid probable errors.
Table 4.11.- Three-point flexural test results of sandwich panel with epoxy with 17wt.% of pigment.
Sample Failure Load (N) Flexure stress (MPa)
Loading rate= 4mm/min
Sandwich Panel 1324 25.69
Sandwich Panel with
unmodified pigment 1285 24.92
Sandwich Panel with
modified pigment 1294 25.10
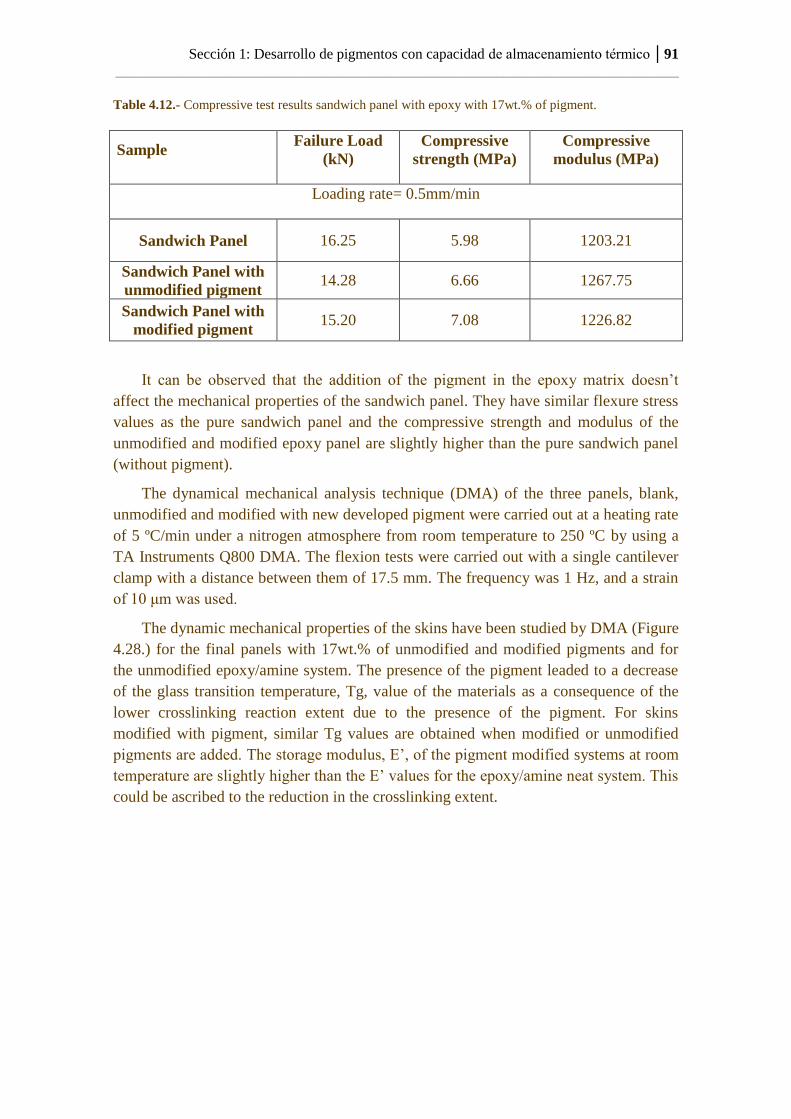
Sección 1: Desarrollo de pigmentos con capacidad de almacenamiento térmico │91
_____________________________________________________________________________
Table 4.12.- Compressive test results sandwich panel with epoxy with 17wt.% of pigment.
Sample Failure Load
(kN)
Compressive
strength (MPa)
Compressive
modulus (MPa)
Loading rate= 0.5mm/min
Sandwich Panel 16.25 5.98 1203.21
Sandwich Panel with
unmodified pigment 14.28 6.66 1267.75
Sandwich Panel with
modified pigment 15.20 7.08 1226.82
It can be observed that the addition of the pigment in the epoxy matrix doesn’t
affect the mechanical properties of the sandwich panel. They have similar flexure stress
values as the pure sandwich panel and the compressive strength and modulus of the
unmodified and modified epoxy panel are slightly higher than the pure sandwich panel
(without pigment).
The dynamical mechanical analysis technique (DMA) of the three panels, blank,
unmodified and modified with new developed pigment were carried out at a heating rate
of 5 ºC/min under a nitrogen atmosphere from room temperature to 250 ºC by using a
TA Instruments Q800 DMA. The flexion tests were carried out with a single cantilever
clamp with a distance between them of 17.5 mm. The frequency was 1 Hz, and a strain
of 10 μm was used.
The dynamic mechanical properties of the skins have been studied by DMA (Figure
4.28.) for the final panels with 17wt.% of unmodified and modified pigments and for
the unmodified epoxy/amine system. The presence of the pigment leaded to a decrease
of the glass transition temperature, Tg, value of the materials as a consequence of the
lower crosslinking reaction extent due to the presence of the pigment. For skins
modified with pigment, similar Tg values are obtained when modified or unmodified
pigments are added. The storage modulus, E’, of the pigment modified systems at room
temperature are slightly higher than the E’ values for the epoxy/amine neat system. This
could be ascribed to the reduction in the crosslinking extent.
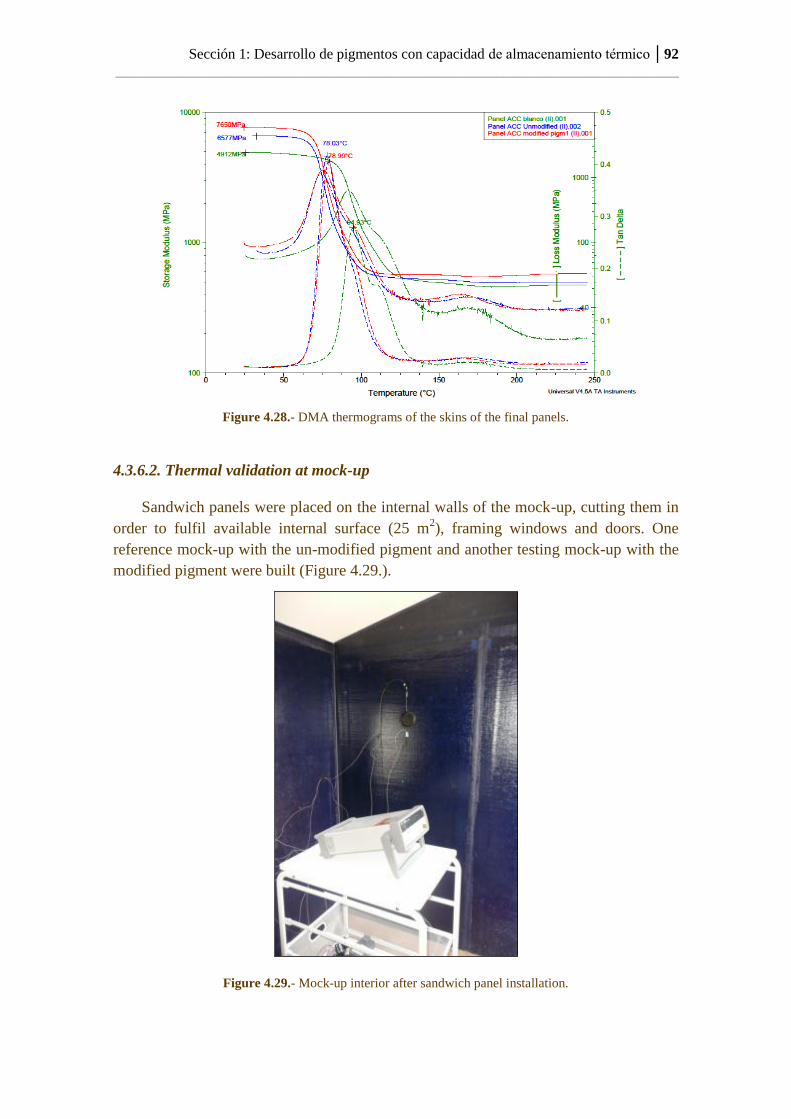
Sección 1: Desarrollo de pigmentos con capacidad de almacenamiento térmico │92
_____________________________________________________________________________
Figure 4.28.- DMA thermograms of the skins of the final panels.
4.3.6.2. Thermal validation at mock-up
Sandwich panels were placed on the internal walls of the mock-up, cutting them in
order to fulfil available internal surface (25 m2), framing windows and doors. One
reference mock-up with the un-modified pigment and another testing mock-up with the
modified pigment were built (Figure 4.29.).
Figure 4.29.- Mock-up interior after sandwich panel installation.
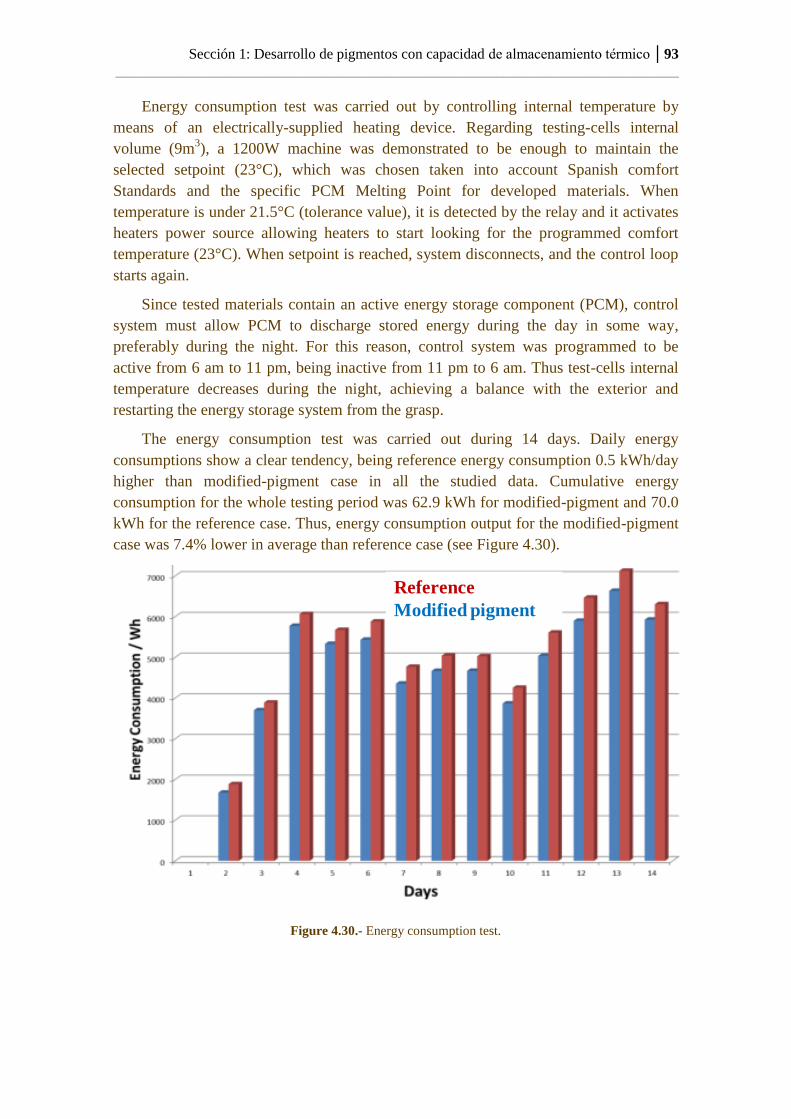
Sección 1: Desarrollo de pigmentos con capacidad de almacenamiento térmico │93
_____________________________________________________________________________
Energy consumption test was carried out by controlling internal temperature by
means of an electrically-supplied heating device. Regarding testing-cells internal
volume (9m3), a 1200W machine was demonstrated to be enough to maintain the
selected setpoint (23°C), which was chosen taken into account Spanish comfort
Standards and the specific PCM Melting Point for developed materials. When
temperature is under 21.5°C (tolerance value), it is detected by the relay and it activates
heaters power source allowing heaters to start looking for the programmed comfort
temperature (23°C). When setpoint is reached, system disconnects, and the control loop
starts again.
Since tested materials contain an active energy storage component (PCM), control
system must allow PCM to discharge stored energy during the day in some way,
preferably during the night. For this reason, control system was programmed to be
active from 6 am to 11 pm, being inactive from 11 pm to 6 am. Thus test-cells internal
temperature decreases during the night, achieving a balance with the exterior and
restarting the energy storage system from the grasp.
The energy consumption test was carried out during 14 days. Daily energy
consumptions show a clear tendency, being reference energy consumption 0.5 kWh/day
higher than modified-pigment case in all the studied data. Cumulative energy
consumption for the whole testing period was 62.9 kWh for modified-pigment and 70.0
kWh for the reference case. Thus, energy consumption output for the modified-pigment
case was 7.4% lower in average than reference case (see Figure 4.30).
Figure 4.30.- Energy consumption test.
Reference
Modified pigment
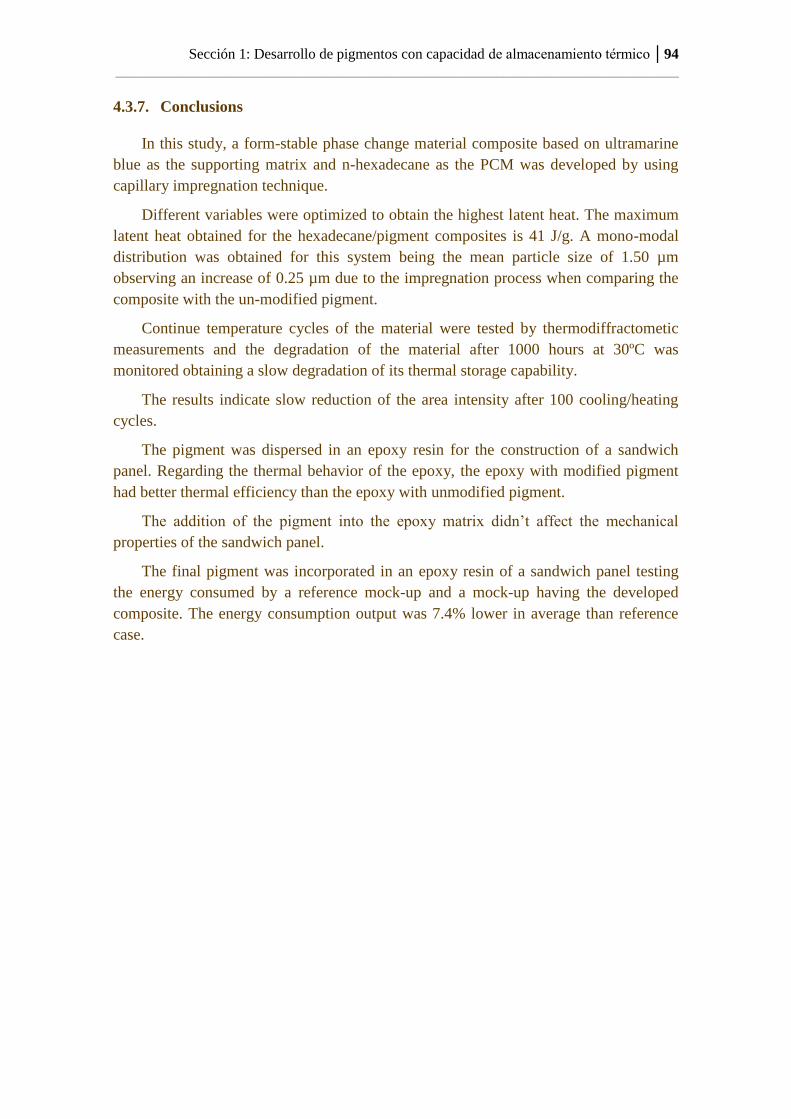
Sección 1: Desarrollo de pigmentos con capacidad de almacenamiento térmico │94
_____________________________________________________________________________
4.3.7. Conclusions
In this study, a form-stable phase change material composite based on ultramarine
blue as the supporting matrix and n-hexadecane as the PCM was developed by using
capillary impregnation technique.
Different variables were optimized to obtain the highest latent heat. The maximum
latent heat obtained for the hexadecane/pigment composites is 41 J/g. A mono-modal
distribution was obtained for this system being the mean particle size of 1.50 µm
observing an increase of 0.25 µm due to the impregnation process when comparing the
composite with the un-modified pigment.
Continue temperature cycles of the material were tested by thermodiffractometic
measurements and the degradation of the material after 1000 hours at 30ºC was
monitored obtaining a slow degradation of its thermal storage capability.
The results indicate slow reduction of the area intensity after 100 cooling/heating
cycles.
The pigment was dispersed in an epoxy resin for the construction of a sandwich
panel. Regarding the thermal behavior of the epoxy, the epoxy with modified pigment
had better thermal efficiency than the epoxy with unmodified pigment.
The addition of the pigment into the epoxy matrix didn’t affect the mechanical
properties of the sandwich panel.
The final pigment was incorporated in an epoxy resin of a sandwich panel testing
the energy consumed by a reference mock-up and a mock-up having the developed
composite. The energy consumption output was 7.4% lower in average than reference
case.


5. Sección 2: DESARROLLO DE PIGMENTOS
ALTAMENTE REFLEJANTES EN EL INFRARROJO
CERCANO
5.1. Preparation and characterization of high NIR reflective
pigments based in ultramarine blue (Energy and
Buildings 126, 170-176 (2016)).
5.2. Validación del pigmento con alta reflexión en el NIR a
nivel de laboratorio- Nota técnica Tekniker.

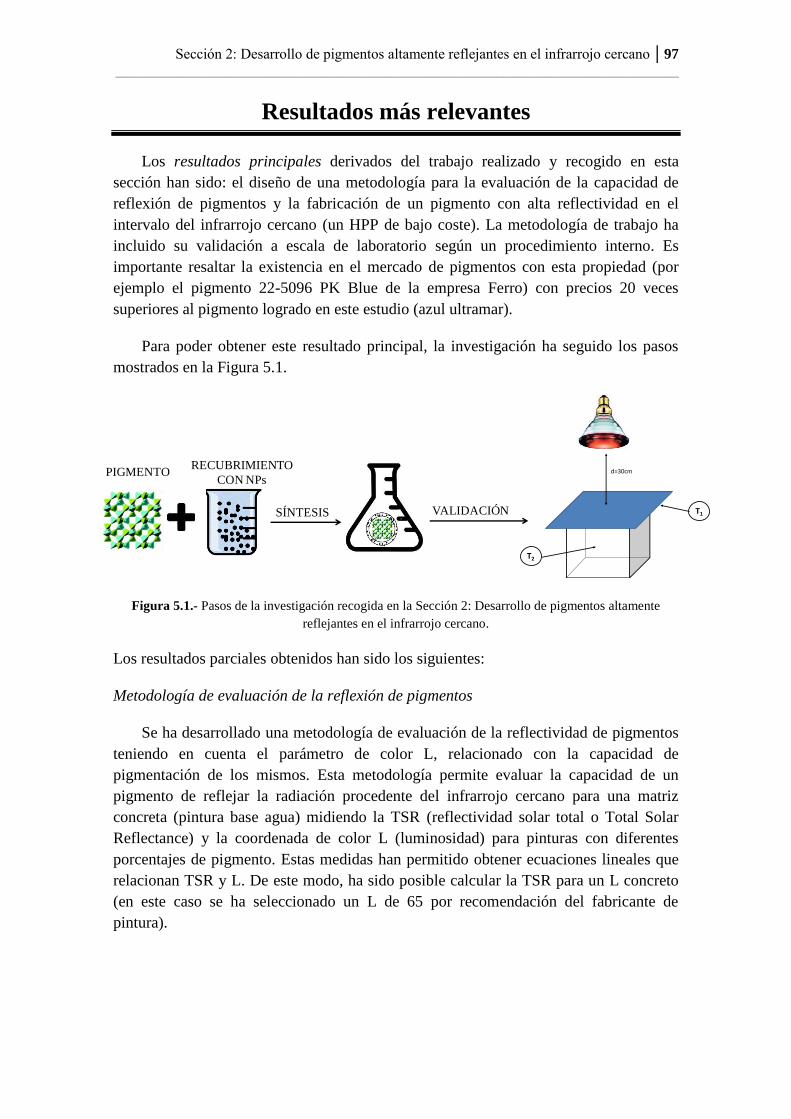
Sección 2: Desarrollo de pigmentos altamente reflejantes en el infrarrojo cercano │97
_____________________________________________________________________________
Resultados más relevantes
Los resultados principales derivados del trabajo realizado y recogido en esta
sección han sido: el diseño de una metodología para la evaluación de la capacidad de
reflexión de pigmentos y la fabricación de un pigmento con alta reflectividad en el
intervalo del infrarrojo cercano (un HPP de bajo coste). La metodología de trabajo ha
incluido su validación a escala de laboratorio según un procedimiento interno. Es
importante resaltar la existencia en el mercado de pigmentos con esta propiedad (por
ejemplo el pigmento 22-5096 PK Blue de la empresa Ferro) con precios 20 veces
superiores al pigmento logrado en este estudio (azul ultramar).
Para poder obtener este resultado principal, la investigación ha seguido los pasos
mostrados en la Figura 5.1.
Figura 5.1.- Pasos de la investigación recogida en la Sección 2: Desarrollo de pigmentos altamente
reflejantes en el infrarrojo cercano.
Los resultados parciales obtenidos han sido los siguientes:
Metodología de evaluación de la reflexión de pigmentos
Se ha desarrollado una metodología de evaluación de la reflectividad de pigmentos
teniendo en cuenta el parámetro de color L, relacionado con la capacidad de
pigmentación de los mismos. Esta metodología permite evaluar la capacidad de un
pigmento de reflejar la radiación procedente del infrarrojo cercano para una matriz
concreta (pintura base agua) midiendo la TSR (reflectividad solar total o Total Solar
Reflectance) y la coordenada de color L (luminosidad) para pinturas con diferentes
porcentajes de pigmento. Estas medidas han permitido obtener ecuaciones lineales que
relacionan TSR y L. De este modo, ha sido posible calcular la TSR para un L concreto
(en este caso se ha seleccionado un L de 65 por recomendación del fabricante de
pintura).
PIGMENTORECUBRIMIENTO
CON NPs
SÍNTESIS VALIDACIÓN
d=30cm
T1
T2
Sección 2: Desarrollo de pigmentos altamente reflejantes en el infrarrojo cercano │98
_____________________________________________________________________________
Síntesis de pigmentos con alta reflexión en el NIR
Se han aplicado doce recubrimientos base de TiO2 diferentes (que contenían
diferentes tipologías y concentraciones de nanopartículas) obteniendo, de este modo,
doce pigmentos recubiertos que, en todos los casos, han superado los valores de TSR a
L=65 del pigmento original.
El pigmento que ha proporcionado la mayor TSR, ha sido el pigmento modificado
con un recubrimiento base de TiO2 que contenía un 6% (m/m) de nanopartículas de
titanio disperso en la formulación.
Validación del pigmento con propiedades óptimas a escala de laboratorio
Se ha dispersado el pigmento que presentaba mayor reflectividad en el infrarrojo en
una pintura en base agua al 10% (m/m).
Se ha pintado una chapa de 1 mm de espesor de acero inoxidable con 50 µm de
pintura (en seco) que se ha colocado como tejado de una caseta de dimensiones x/y/z de
4/4/4 cm.
Se ha iluminado el tejado de la caseta con una lámpara infrarroja a 30 cm del tejado
durante 20 minutos y se ha registrado la evolución de la temperatura interior (centro de
la caseta- T2) y temperatura interior del tejado (T1). Este test se ha realizado en una
caseta de referencia (pintura con el pigmento no modificado) y en una caseta de
validación (pintura con el pigmento modificado).
Se ha observado que la temperatura interior de la caseta (T2) al final del ensayo es
un 8% menor en el caso de la caseta de testeo. Así mismo, se ha constatado que la
temperatura interior del tejado (T1) al final del ensayo era un 11.8% menor en el caso de
la caseta de testeo.
Esta validación se ha realizado según un procedimiento interno de Tekniker
incluido dentro de su sistema de calidad y certificado por AENOR (Asociación
Española de Normalización y Certificación) bajo la norma ISO 9001:2008 con fecha del
20 de Julio de 2016 y con validez hasta el 22 de Mayo de 2018 (número de registro ES-
0543/1998).
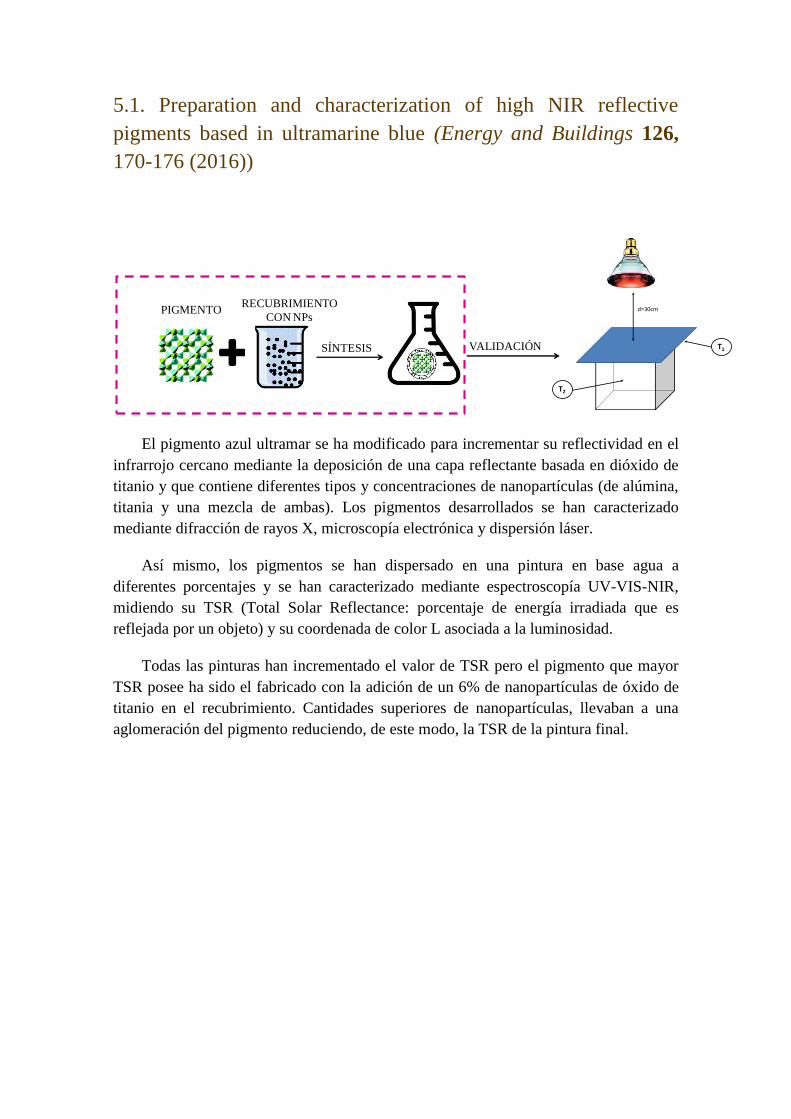
5.1. Preparation and characterization of high NIR reflective
pigments based in ultramarine blue (Energy and Buildings 126,
170-176 (2016))
El pigmento azul ultramar se ha modificado para incrementar su reflectividad en el
infrarrojo cercano mediante la deposición de una capa reflectante basada en dióxido de
titanio y que contiene diferentes tipos y concentraciones de nanopartículas (de alúmina,
titania y una mezcla de ambas). Los pigmentos desarrollados se han caracterizado
mediante difracción de rayos X, microscopía electrónica y dispersión láser.
Así mismo, los pigmentos se han dispersado en una pintura en base agua a
diferentes porcentajes y se han caracterizado mediante espectroscopía UV-VIS-NIR,
midiendo su TSR (Total Solar Reflectance: porcentaje de energía irradiada que es
reflejada por un objeto) y su coordenada de color L asociada a la luminosidad.
Todas las pinturas han incrementado el valor de TSR pero el pigmento que mayor
TSR posee ha sido el fabricado con la adición de un 6% de nanopartículas de óxido de
titanio en el recubrimiento. Cantidades superiores de nanopartículas, llevaban a una
aglomeración del pigmento reduciendo, de este modo, la TSR de la pintura final.
PIGMENTORECUBRIMIENTO
CON NPs
SÍNTESIS VALIDACIÓN
d=30cm
T1
T2

Sección 2: Desarrollo de pigmentos altamente reflejantes en el infrarrojo cercano │101
_____________________________________________________________________________
5.1. Preparation and characterization of high NIR reflective
pigments based in ultramarine blue
Energy and Buildings 126, 170-176 (2016)
Abstract
Ultramarine blue pigment (UB) has been modified to increase its near infrared
reflectance by depositing a reflecting film based on TiO2 containing different types and
concentration of nanoparticles (alumina, titania and a mixture of them). The developed
pigments were characterized by X-ray diffraction (XRD), field emission scanning
electron microscopy and laser dispersion.
These pigments have been dispersed in a conventional waterborne paint at different
percentages and characterized by UV-VIS-NIR spectrophotometry (measuring Total
Solar Reflectance and CIE L*a*b*). All the obtained paints increased the TSR when
adding nanoparticles but the maximum value was obtained for an addition of 6%wt. of
titania nanoparticles. Higher contents of nanoparticles led to agglomeration reducing the
reflectance in the final paint.
Keywords: Ultramarine Blue, Total Solar Reflectance, Lightness, cool
Highlights
Ultramarine blue pigment has been coated with different reflecting films based
on TiO2 and containing different types and concentration of nanoparticles.
The prepared pigments have been dispersed in a conventional waterborne paint
at different percentages and Total solar Reflectance and lightness were
measured.
The linear equation relating L (lightness) and TSR for each material has been
calculated and the TSR has been compared for a standard L value of 65.
All the obtained paints increased the TSR when adding nanoparticles but the
maximum value was obtained for an addition of 6%wt. of titania nanoparticles.
Sección 2: Desarrollo de pigmentos altamente reflejantes en el infrarrojo cercano │102
_____________________________________________________________________________
5.1.1. Introduction
Buildings are responsible for more than 40 percent of global energy use and one
third of global greenhouse gas (GHG) emissions. This fact has made energy efficiency
and savings strategies a priority for energy policies at world level1,2
.
Especially important has been the intensification of energy consumption in Heating,
ventilation and air conditioning (HVAC) systems accounting for around 40% of total
building consumption3,4
and being the largest energy end use both in the residential and
non-residential sector.
The EPBD (European Directive o the Energy Performance of Buildings)5 was
adopted with the objective of “promote the improvement of the energy performance of
buildings within the community taking into account outdoor climatic and local
conditions, as well as indoor climate requirements and cost-effectiveness”. Building
sector has the greatest potential to deliver quick, deep and cost effective reductions in
GHG emissions6,7
.
The majority of the building stock in Europe is pre-1990 and 40-50% is pre-1960.
In order to address the huge challenge of affordable building refurbishment, different
solutions are being explored with the aim of obtaining substantial energy savings at an
acceptable investment8,9
.
Solutions from the chemical and materials science can bring significant energy
savings for building applications being the high reflectance outdoor coatings one of the
most promising ones10
. These coatings reflect sunlight radiation in the infrared part of
the spectrum. Since nearly half of the solar radiation consists of near-infrared (NIR)
1 Transition to Sustainable Buildings Strategies and Opportunities to 2050. International Energy
Agency (IEA). ISBN: 978-92-64-20241-2 (2012). 2 Li, C., Hong, T. & Yan, D. An insight into actual energy use and its drivers in high-performance
buildings. App. Energy 131, 394–410 (2014). 3 Nejat, P., Jomehzadeh, F., Taheri, M. M., Gohari, M. & Abd. Majid, M. Z. A global review of energy
consumption, CO2 emissions and policy in the residential sector (with an overview of the top ten CO2
emitting countries). Renew. Sustain. Energy Rev. 43, 843–862 (2015). 4 Pérez-Lombard, L., Ortiz, J. & Pout, C. A review on buildings energy consumption information.
Energy Build. 40, 394–398 (2008). 5 Directive 2010/31/EU of the European Parliament and of the Council of 19 May 2010 on the energy
performance of buildings. Official Journal of the European Union. L153/13 (2010). 6 D׳Agostino, D. Assessment of the progress towards the establishment of definitions of Nearly Zero
Energy Buildings (nZEBs) in European Member States. J. Build. Eng. 1, 20–32 (2015). 7 Common carbon metric for Measuring Energy Use & Reporting Greenhouse Gas Emissions from
Building Operations. Sustainable Buildings and Climate Initiative (2010). 8 Zhao, F., Lee, S. H. & Augenbroe, G. Reconstructing building stock to replicate energy consumption
data. Energy Build. 117, 301–312 (2015). 9 Ruparathna, R., Hewage, K. & Sadiq, R. Improving the energy efficiency of the existing building
stock: A critical review of commercial and institutional buildings. Renew. Sustain. Energy Rev. 53,
1032–1045 (2016). 10
Bax, L., Cruxent, J. & Komornicki, J. Advanced Materials for Energy Efficient Buildings. Key to
Innovation Integrated Solution. Innovative Chemistry for Energy Efficiency of Buildings in Smart
Cities. Cefic. Eur. Chem. Ind. Coun. (2013).
Sección 2: Desarrollo de pigmentos altamente reflejantes en el infrarrojo cercano │103
_____________________________________________________________________________
radiation (700-2500 nm) which is a direct consequence of heat, the use of NIR reflective
materials aids to preserve lower exterior surface temperatures of buildings11,12
. The
amount of heat conducted to the interior decreases being possible to save up to 15% of
air conditioning energy consumption depending on the climate region. Costs of
applying these coatings are affordable and offer reasonable payback times10
.
These high reflectance coatings mainly refer to paints containing cool pigments.
Although white pigments such as titanium dioxide (TiO2) have a high solar reflectance,
they cannot always satisfy the consumer's demand as they are white. One strategy for
non-white cool pigment production is the use of complex inorganic colored pigments
(CICPs). One barrier for the use of these pigments is their toxicity character as most of
them contain toxic metal elements (Co, Cd, Pb, Cr) restricted by the environmental
regulations 13,14
.
Ultramarine blue pigment (UB) is an inorganic pigment having a sodium aluminum
silicate sulfide structure (Na8Al6Si6O24S2) similar to Sodalite. Ultramarine blue are a
family of low-cost mineral pigments (cost 3 to 5 times lower than a CICP) and with
high pigmentary properties commonly used in construction sector.
The aim of this study is to develop a cool pigment based on ultramarine blue. The
strategy to modify this conventional pigment into a high reflecting pigment is to coat
the pigment with a coating containing nanoparticles with a crystal structure of rutile or
corundum (structures used for the CICP development).
Dispersed nanoparticles in the pigment coating will provoke multiple scattering
effects achieving high reflection between 700-2500 nm. The suitable nanoparticles and
the amount of particles in the coating are one of the most important parameter that must
be optimized to achieve the fixed goal. Alumina (having a size of 13 nm) and titania
(having a size of 21 nm) nanoparticles were selected due to their high diffraction index
and strong light scattering.
11
Zhao, X., Zhang, Y., Huang, Y., Gong, H. & Zhao, J. Synthesis and characterization of neodymium
doped yttrium molybdate high NIR reflective nano pigments. Dye. Pigment. 116, 119–123 (2015). 12
Jose, S., Prakash, A., Laha, S., Natarajan, S. & Reddy, M. L. Green colored nano-pigments derived
from Y2BaCuO5: NIR reflective coatings. Dye. Pigment. 107, 118–126 (2014). 13
Hedayati, H. R., Sabbagh Alvani, A. A., Sameie, H., Salimi, R., Moosakhani, S., Tabatabaee, F. &
Amiri Zarandi, A. Synthesis and characterization of Co1−xZnxCr2−yAlyO4 as a near-infrared reflective
color tunable nano-pigment. Dye. Pigment. 113, 588–595 (2015). 14
Han, A., Ye, M., Liu, L., Feng, W. & Zhao, M. Estimating thermal performance of cool coatings
colored with high near-infrared reflective inorganic pigments: Iron doped La2Mo2O7 compounds.
Energy Build. 84, 698–703 (2014).
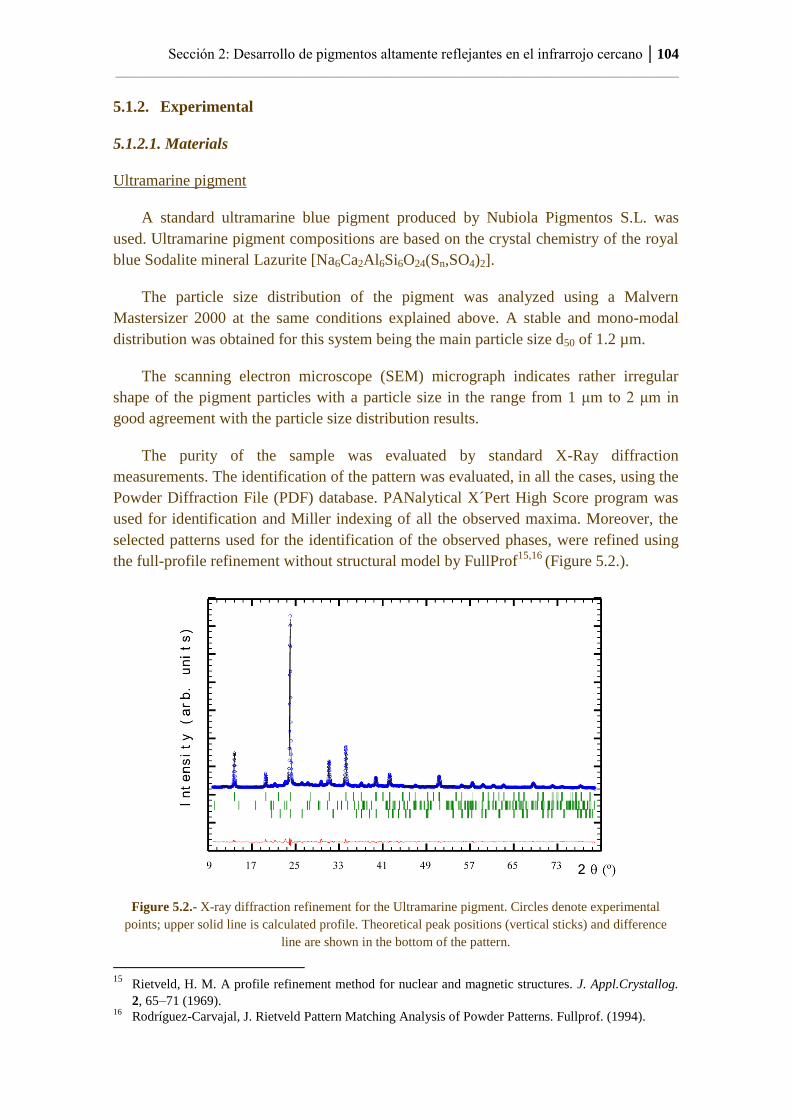
Sección 2: Desarrollo de pigmentos altamente reflejantes en el infrarrojo cercano │104
_____________________________________________________________________________
5.1.2. Experimental
5.1.2.1. Materials
Ultramarine pigment
A standard ultramarine blue pigment produced by Nubiola Pigmentos S.L. was
used. Ultramarine pigment compositions are based on the crystal chemistry of the royal
blue Sodalite mineral Lazurite [Na6Ca2Al6Si6O24(Sn,SO4)2].
The particle size distribution of the pigment was analyzed using a Malvern
Mastersizer 2000 at the same conditions explained above. A stable and mono-modal
distribution was obtained for this system being the main particle size d50 of 1.2 µm.
The scanning electron microscope (SEM) micrograph indicates rather irregular
shape of the pigment particles with a particle size in the range from 1 μm to 2 μm in
good agreement with the particle size distribution results.
The purity of the sample was evaluated by standard X-Ray diffraction
measurements. The identification of the pattern was evaluated, in all the cases, using the
Powder Diffraction File (PDF) database. PANalytical X´Pert High Score program was
used for identification and Miller indexing of all the observed maxima. Moreover, the
selected patterns used for the identification of the observed phases, were refined using
the full-profile refinement without structural model by FullProf15,16
(Figure 5.2.).
Figure 5.2.- X-ray diffraction refinement for the Ultramarine pigment. Circles denote experimental
points; upper solid line is calculated profile. Theoretical peak positions (vertical sticks) and difference
line are shown in the bottom of the pattern.
15
Rietveld, H. M. A profile refinement method for nuclear and magnetic structures. J. Appl.Crystallog.
2, 65–71 (1969). 16
Rodríguez-Carvajal, J. Rietveld Pattern Matching Analysis of Powder Patterns. Fullprof. (1994).
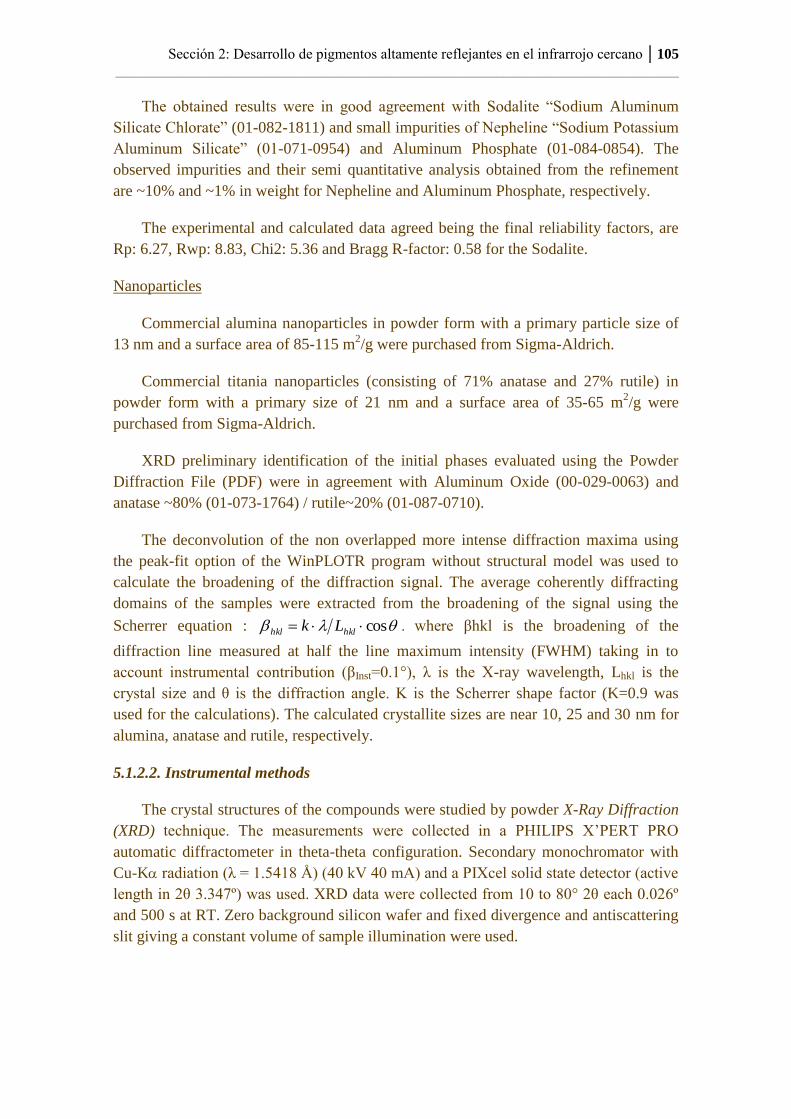
Sección 2: Desarrollo de pigmentos altamente reflejantes en el infrarrojo cercano │105
_____________________________________________________________________________
The obtained results were in good agreement with Sodalite “Sodium Aluminum
Silicate Chlorate” (01-082-1811) and small impurities of Nepheline “Sodium Potassium
Aluminum Silicate” (01-071-0954) and Aluminum Phosphate (01-084-0854). The
observed impurities and their semi quantitative analysis obtained from the refinement
are ~10% and ~1% in weight for Nepheline and Aluminum Phosphate, respectively.
The experimental and calculated data agreed being the final reliability factors, are
Rp: 6.27, Rwp: 8.83, Chi2: 5.36 and Bragg R-factor: 0.58 for the Sodalite.
Nanoparticles
Commercial alumina nanoparticles in powder form with a primary particle size of
13 nm and a surface area of 85-115 m2/g were purchased from Sigma-Aldrich.
Commercial titania nanoparticles (consisting of 71% anatase and 27% rutile) in
powder form with a primary size of 21 nm and a surface area of 35-65 m2/g were
purchased from Sigma-Aldrich.
XRD preliminary identification of the initial phases evaluated using the Powder
Diffraction File (PDF) were in agreement with Aluminum Oxide (00-029-0063) and
anatase ~80% (01-073-1764) / rutile~20% (01-087-0710).
The deconvolution of the non overlapped more intense diffraction maxima using
the peak-fit option of the WinPLOTR program without structural model was used to
calculate the broadening of the diffraction signal. The average coherently diffracting
domains of the samples were extracted from the broadening of the signal using the
Scherrer equation : cos hklhkl Lk . where βhkl is the broadening of the
diffraction line measured at half the line maximum intensity (FWHM) taking in to
account instrumental contribution (βInst=0.1°), λ is the X-ray wavelength, Lhkl is the
crystal size and θ is the diffraction angle. K is the Scherrer shape factor (K=0.9 was
used for the calculations). The calculated crystallite sizes are near 10, 25 and 30 nm for
alumina, anatase and rutile, respectively.
5.1.2.2. Instrumental methods
The crystal structures of the compounds were studied by powder X-Ray Diffraction
(XRD) technique. The measurements were collected in a PHILIPS X’PERT PRO
automatic diffractometer in theta-theta configuration. Secondary monochromator with
Cu-K radiation (λ = 1.5418 Å) (40 kV 40 mA) and a PIXcel solid state detector (active
length in 2θ 3.347º) was used. XRD data were collected from 10 to 80° 2θ each 0.026º
and 500 s at RT. Zero background silicon wafer and fixed divergence and antiscattering
slit giving a constant volume of sample illumination were used.
Sección 2: Desarrollo de pigmentos altamente reflejantes en el infrarrojo cercano │106
_____________________________________________________________________________
The Scanning Electron Microscopy (SEM) micrographs were recorded with Hitachi
S-4800 equipment using Secondary Electron Detector at 3 kV accelerating voltage and
8 mm working distance.
The particle size distribution (0.02 to 2000 µm range) of the samples was analyzed
using Laser Dispersion by Malvern Mastersizer 2000 after keeping the sample in
ultrasonic agitation for 2 min. Water was used as the dispersion media and a particle
Refractive Index of 1.510 was considered for the measurement and 5 cycles of
measurement were done.
Concerning the reflection capability of the pigments in the Near Infrared, two
parameters (Total Solar Reflectance and Lightness) were measured in a paint containing
different percentages of pigments.
Total Solar Reflectance (TSR) is the percentage of irradiated energy that is
reflected by an object. The total solar reflectance calculation requires taking the raw
reflectance data and applying solar weighting factors for each wavelength collected.
TSR of the obtained samples was measured according to ASTM G173 in a Perkin
Elmer Lambda 950 UV/Vis/NIR System in the wavelength range from 300 to 2500 nm.
The TSR of two materials can be compared only if their tinting strength (L) is the
same, so was decided to establish the relation between L (lightness) and TSR for each
material as the lightness (CIELAB lightness L*) is related to the tinting strength. L was
measured in a Perkin Elmer Lambda 950 UV/Vis/NIR System in the wavelength from
380 nm to 780 nm.
5.1.3. Results
5.1.3.1. Modification of the ultramarine pigment with the aim of improving its
reflecting capability in the NIR
Reflecting film based on TiO2 matrix containing different types and concentration
of nanoparticles (alumina, titania and a mixture of them) were deposited around the
reference pigment surface. For this issue, the pigment was put in dispersion in water at
50 g/l. Separately a solution of titanium (IV) n-butoxide containing different types and
concentration of nanoparticles was hydrolyzed and added drop by drop to the pigment
dispersion (Figure 5.3.) obtaining a coated pigment. The coating around the pigment
surface was based on a titanium dioxide matrix containing different types of
nanoparticles (alumina, titania and a mixture of them).
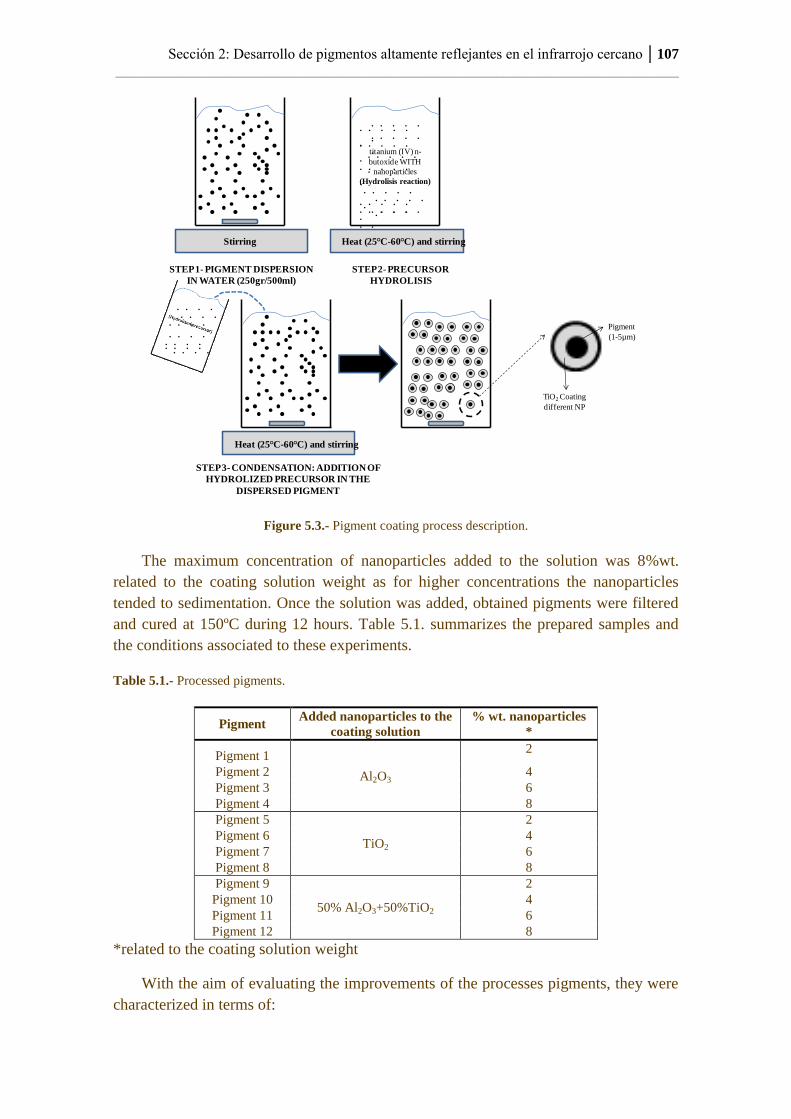
Sección 2: Desarrollo de pigmentos altamente reflejantes en el infrarrojo cercano │107
_____________________________________________________________________________
Figure 5.3.- Pigment coating process description.
The maximum concentration of nanoparticles added to the solution was 8%wt.
related to the coating solution weight as for higher concentrations the nanoparticles
tended to sedimentation. Once the solution was added, obtained pigments were filtered
and cured at 150ºC during 12 hours. Table 5.1. summarizes the prepared samples and
the conditions associated to these experiments.
Table 5.1.- Processed pigments.
Pigment Added nanoparticles to the
coating solution
% wt. nanoparticles
*
Pigment 1
Al2O3
2
Pigment 2 4
Pigment 3 6
Pigment 4 8
Pigment 5
TiO2
2
Pigment 6 4
Pigment 7 6
Pigment 8 8
Pigment 9
50% Al2O3+50%TiO2
2
Pigment 10 4
Pigment 11 6
Pigment 12 8
*related to the coating solution weight
With the aim of evaluating the improvements of the processes pigments, they were
characterized in terms of:
Stirring
STEP 1- PIGMENT DISPERSION
IN WATER (250gr/500ml)
Heat (25 C-60 C) and stirring
titanium (IV) n-
butoxide WITH
nanoparticles
(Hydrolisis reaction)
STEP 2- PRECURSOR
HYDROLISIS
STEP 3- CONDENSATION: ADDITION OF
HYDROLIZED PRECURSOR IN THE
DISPERSED PIGMENT
Heat (25 C-60 C) and stirring
Pigment
(1-5µm)
TiO2 Coating
different NP
. . . . .
.
. . . . .
.
. . . . .
.
. . . . .
.
. . . . .
.
. . . . .
. . . . . .
.
. . . . .
.
. . . . .
.
. . . . .
.
. . . . .
.
. . . . . . . . . . . .
. . . .
. . . . . . . .
. . . .
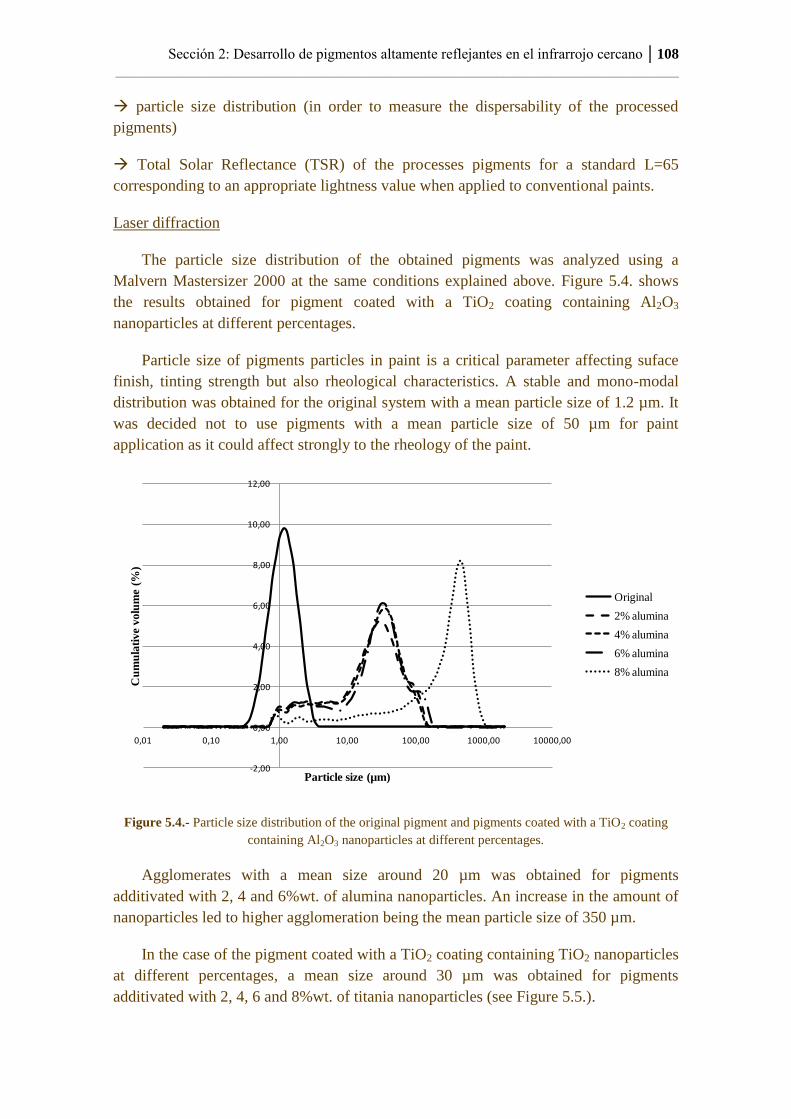
Sección 2: Desarrollo de pigmentos altamente reflejantes en el infrarrojo cercano │108
_____________________________________________________________________________
particle size distribution (in order to measure the dispersability of the processed
pigments)
Total Solar Reflectance (TSR) of the processes pigments for a standard L=65
corresponding to an appropriate lightness value when applied to conventional paints.
Laser diffraction
The particle size distribution of the obtained pigments was analyzed using a
Malvern Mastersizer 2000 at the same conditions explained above. Figure 5.4. shows
the results obtained for pigment coated with a TiO2 coating containing Al2O3
nanoparticles at different percentages.
Particle size of pigments particles in paint is a critical parameter affecting suface
finish, tinting strength but also rheological characteristics. A stable and mono-modal
distribution was obtained for the original system with a mean particle size of 1.2 µm. It
was decided not to use pigments with a mean particle size of 50 µm for paint
application as it could affect strongly to the rheology of the paint.
Figure 5.4.- Particle size distribution of the original pigment and pigments coated with a TiO2 coating
containing Al2O3 nanoparticles at different percentages.
Agglomerates with a mean size around 20 µm was obtained for pigments
additivated with 2, 4 and 6%wt. of alumina nanoparticles. An increase in the amount of
nanoparticles led to higher agglomeration being the mean particle size of 350 µm.
In the case of the pigment coated with a TiO2 coating containing TiO2 nanoparticles
at different percentages, a mean size around 30 µm was obtained for pigments
additivated with 2, 4, 6 and 8%wt. of titania nanoparticles (see Figure 5.5.).
-2,00
0,00
2,00
4,00
6,00
8,00
10,00
12,00
0,01 0,10 1,00 10,00 100,00 1000,00 10000,00
Cu
mu
lati
ve
vo
lum
e (%
)
Particle size (µm)
Original
2% alumina
4% alumina
6% alumina
8% alumina
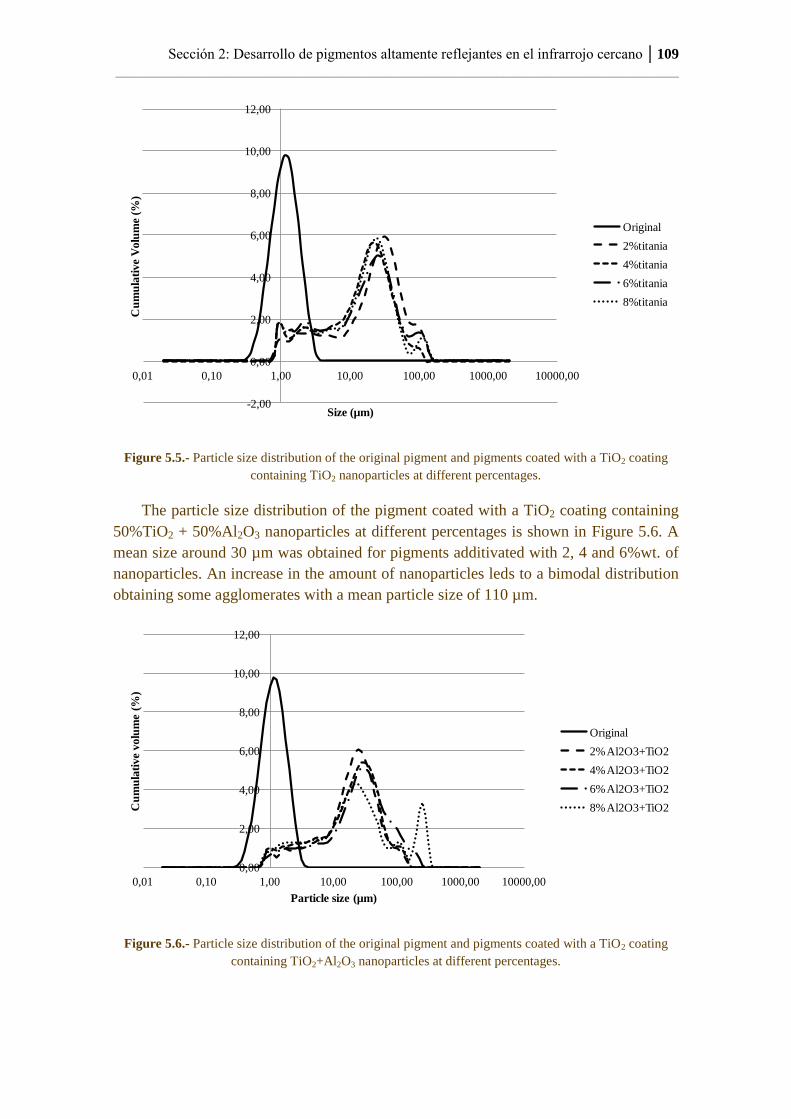
Sección 2: Desarrollo de pigmentos altamente reflejantes en el infrarrojo cercano │109
_____________________________________________________________________________
Figure 5.5.- Particle size distribution of the original pigment and pigments coated with a TiO2 coating
containing TiO2 nanoparticles at different percentages.
The particle size distribution of the pigment coated with a TiO2 coating containing
50%TiO2 + 50%Al2O3 nanoparticles at different percentages is shown in Figure 5.6. A
mean size around 30 µm was obtained for pigments additivated with 2, 4 and 6%wt. of
nanoparticles. An increase in the amount of nanoparticles leds to a bimodal distribution
obtaining some agglomerates with a mean particle size of 110 µm.
Figure 5.6.- Particle size distribution of the original pigment and pigments coated with a TiO2 coating
containing TiO2+Al2O3 nanoparticles at different percentages.
-2,00
0,00
2,00
4,00
6,00
8,00
10,00
12,00
0,01 0,10 1,00 10,00 100,00 1000,00 10000,00
Cu
mu
lati
ve
Volu
me
(%)
Size (µm)
Original
2%titania
4%titania
6%titania
8%titania
0,00
2,00
4,00
6,00
8,00
10,00
12,00
0,01 0,10 1,00 10,00 100,00 1000,00 10000,00
Cu
mu
lati
ve
volu
me
(%)
Particle size (µm)
Original
2% Al2O3+TiO2
4% Al2O3+TiO2
6% Al2O3+TiO2
8% Al2O3+TiO2
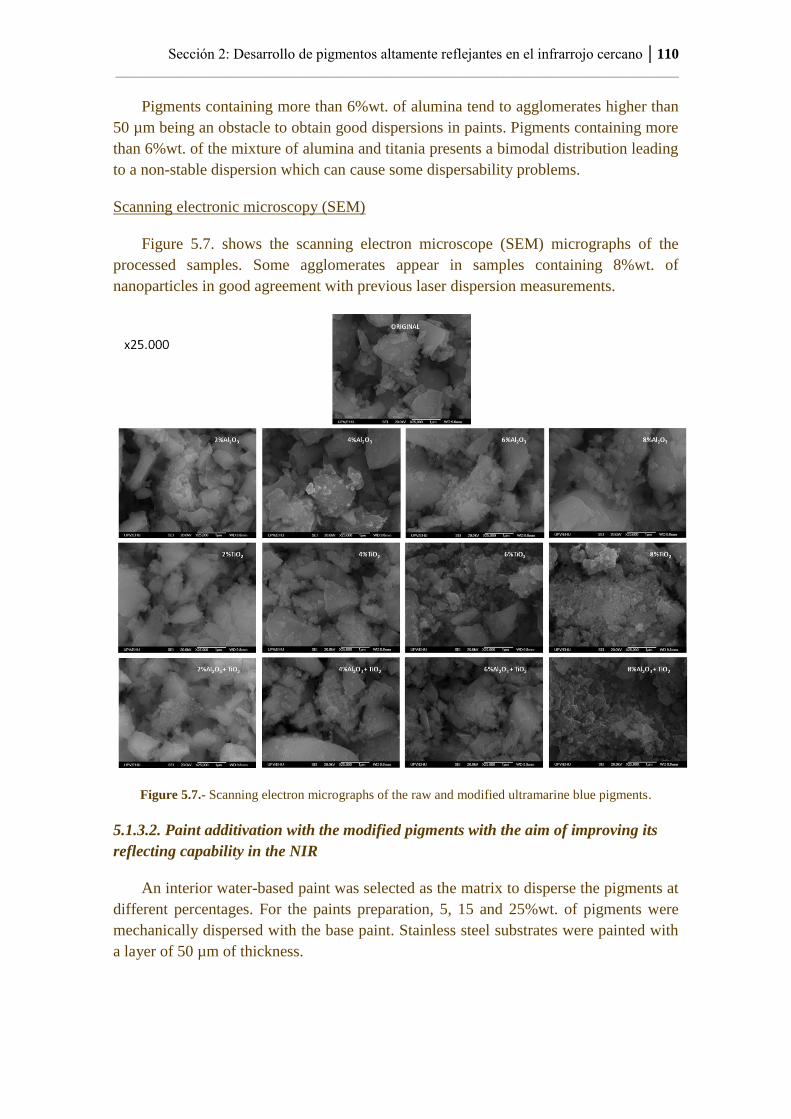
Sección 2: Desarrollo de pigmentos altamente reflejantes en el infrarrojo cercano │110
_____________________________________________________________________________
Pigments containing more than 6%wt. of alumina tend to agglomerates higher than
50 µm being an obstacle to obtain good dispersions in paints. Pigments containing more
than 6%wt. of the mixture of alumina and titania presents a bimodal distribution leading
to a non-stable dispersion which can cause some dispersability problems.
Scanning electronic microscopy (SEM)
Figure 5.7. shows the scanning electron microscope (SEM) micrographs of the
processed samples. Some agglomerates appear in samples containing 8%wt. of
nanoparticles in good agreement with previous laser dispersion measurements.
Figure 5.7.- Scanning electron micrographs of the raw and modified ultramarine blue pigments.
5.1.3.2. Paint additivation with the modified pigments with the aim of improving its
reflecting capability in the NIR
An interior water-based paint was selected as the matrix to disperse the pigments at
different percentages. For the paints preparation, 5, 15 and 25%wt. of pigments were
mechanically dispersed with the base paint. Stainless steel substrates were painted with
a layer of 50 µm of thickness.
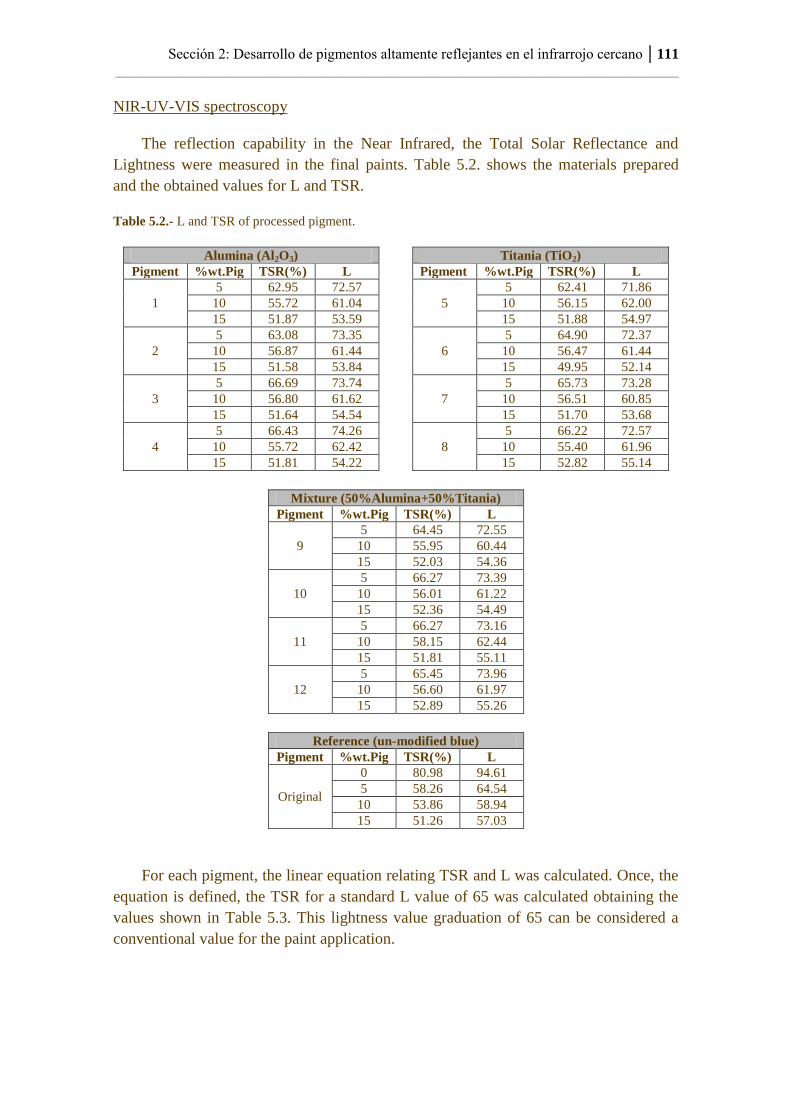
Sección 2: Desarrollo de pigmentos altamente reflejantes en el infrarrojo cercano │111
_____________________________________________________________________________
NIR-UV-VIS spectroscopy
The reflection capability in the Near Infrared, the Total Solar Reflectance and
Lightness were measured in the final paints. Table 5.2. shows the materials prepared
and the obtained values for L and TSR.
Table 5.2.- L and TSR of processed pigment.
Alumina (Al2O3) Titania (TiO2)
Pigment %wt.Pig TSR(%) L Pigment %wt.Pig TSR(%) L
1
5 62.95 72.57
5
5 62.41 71.86
10 55.72 61.04 10 56.15 62.00
15 51.87 53.59 15 51.88 54.97
2
5 63.08 73.35
6
5 64.90 72.37
10 56.87 61.44 10 56.47 61.44
15 51.58 53.84 15 49.95 52.14
3
5 66.69 73.74
7
5 65.73 73.28
10 56.80 61.62 10 56.51 60.85
15 51.64 54.54 15 51.70 53.68
4
5 66.43 74.26
8
5 66.22 72.57
10 55.72 62.42 10 55.40 61.96
15 51.81 54.22 15 52.82 55.14
Mixture (50%Alumina+50%Titania)
Pigment %wt.Pig TSR(%) L
9
5 64.45 72.55
10 55.95 60.44
15 52.03 54.36
10
5 66.27 73.39
10 56.01 61.22
15 52.36 54.49
11
5 66.27 73.16
10 58.15 62.44
15 51.81 55.11
12
5 65.45 73.96
10 56.60 61.97
15 52.89 55.26
Reference (un-modified blue)
Pigment %wt.Pig TSR(%) L
Original
0 80.98 94.61
5 58.26 64.54
10 53.86 58.94
15 51.26 57.03
For each pigment, the linear equation relating TSR and L was calculated. Once, the
equation is defined, the TSR for a standard L value of 65 was calculated obtaining the
values shown in Table 5.3. This lightness value graduation of 65 can be considered a
conventional value for the paint application.
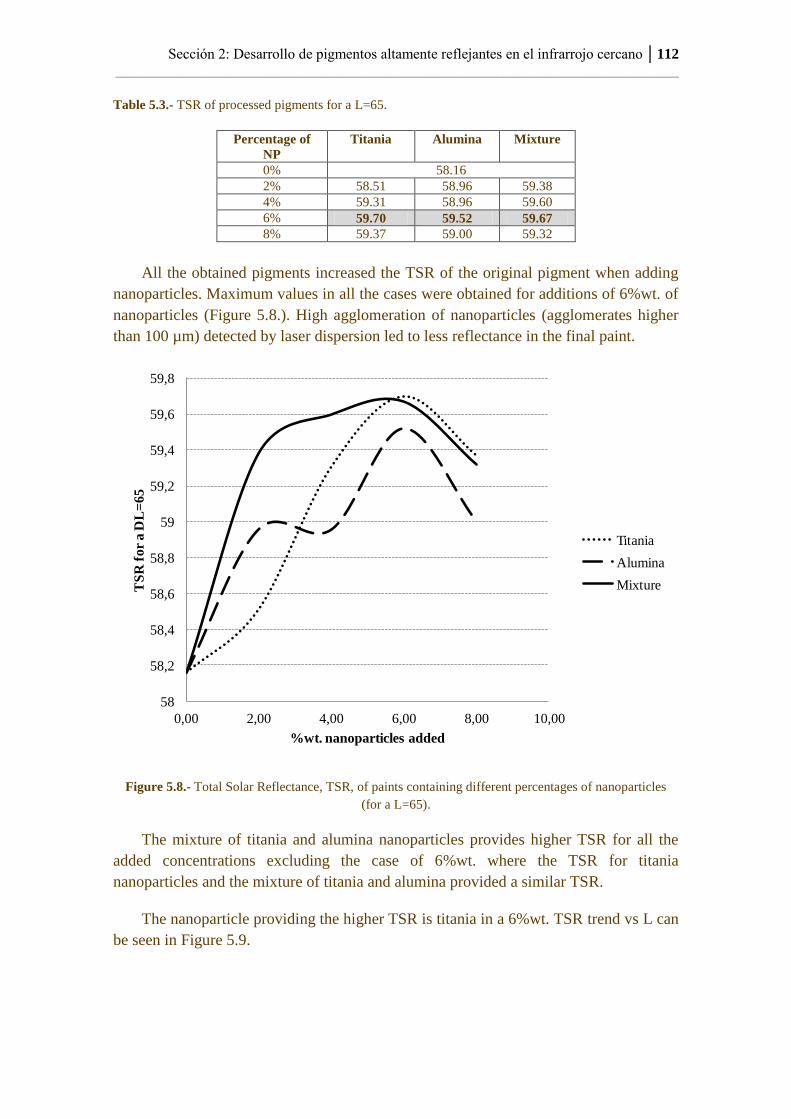
Sección 2: Desarrollo de pigmentos altamente reflejantes en el infrarrojo cercano │112
_____________________________________________________________________________
Table 5.3.- TSR of processed pigments for a L=65.
Percentage of
NP
Titania Alumina Mixture
0% 58.16
2% 58.51 58.96 59.38
4% 59.31 58.96 59.60
6% 59.70 59.52 59.67
8% 59.37 59.00 59.32
All the obtained pigments increased the TSR of the original pigment when adding
nanoparticles. Maximum values in all the cases were obtained for additions of 6%wt. of
nanoparticles (Figure 5.8.). High agglomeration of nanoparticles (agglomerates higher
than 100 µm) detected by laser dispersion led to less reflectance in the final paint.
Figure 5.8.- Total Solar Reflectance, TSR, of paints containing different percentages of nanoparticles
(for a L=65).
The mixture of titania and alumina nanoparticles provides higher TSR for all the
added concentrations excluding the case of 6%wt. where the TSR for titania
nanoparticles and the mixture of titania and alumina provided a similar TSR.
The nanoparticle providing the higher TSR is titania in a 6%wt. TSR trend vs L can
be seen in Figure 5.9.
58
58,2
58,4
58,6
58,8
59
59,2
59,4
59,6
59,8
0,00 2,00 4,00 6,00 8,00 10,00
TS
R f
or
a D
L=
65
%wt. nanoparticles added
Titania
Alumina
Mixture
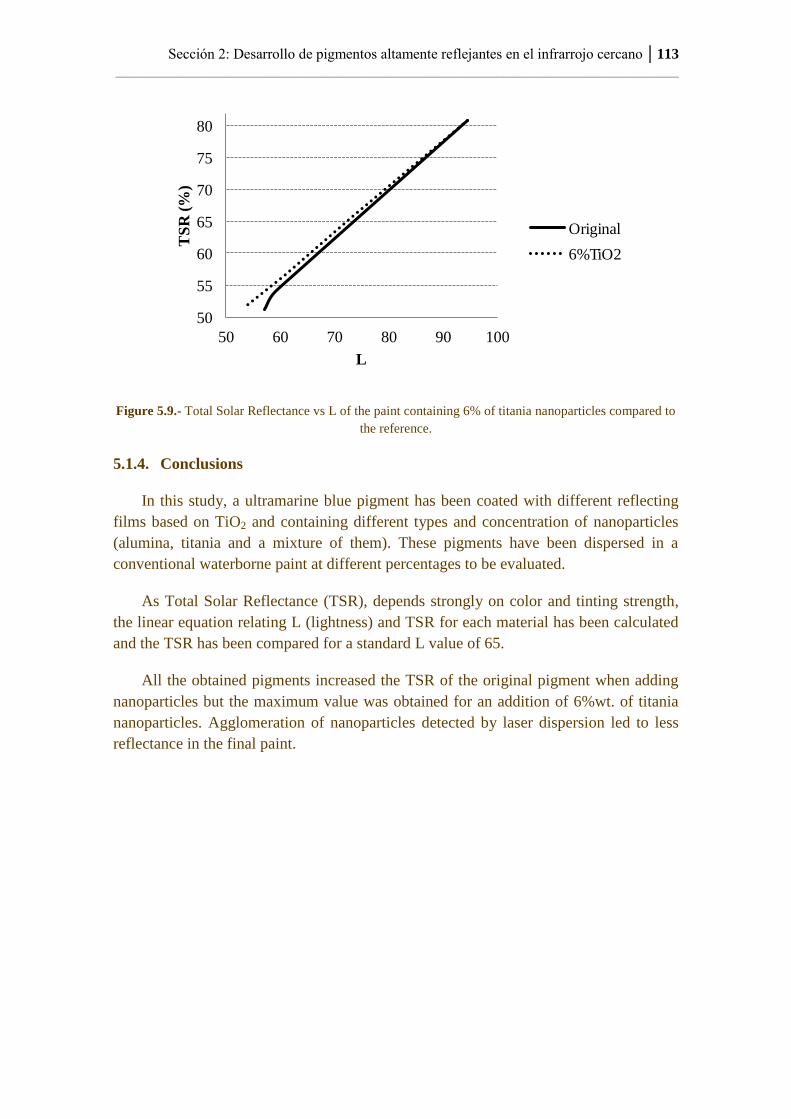
Sección 2: Desarrollo de pigmentos altamente reflejantes en el infrarrojo cercano │113
_____________________________________________________________________________
Figure 5.9.- Total Solar Reflectance vs L of the paint containing 6% of titania nanoparticles compared to
the reference.
5.1.4. Conclusions
In this study, a ultramarine blue pigment has been coated with different reflecting
films based on TiO2 and containing different types and concentration of nanoparticles
(alumina, titania and a mixture of them). These pigments have been dispersed in a
conventional waterborne paint at different percentages to be evaluated.
As Total Solar Reflectance (TSR), depends strongly on color and tinting strength,
the linear equation relating L (lightness) and TSR for each material has been calculated
and the TSR has been compared for a standard L value of 65.
All the obtained pigments increased the TSR of the original pigment when adding
nanoparticles but the maximum value was obtained for an addition of 6%wt. of titania
nanoparticles. Agglomeration of nanoparticles detected by laser dispersion led to less
reflectance in the final paint.
50
55
60
65
70
75
80
50 60 70 80 90 100
TS
R (
%)
L
Original
6%TiO2

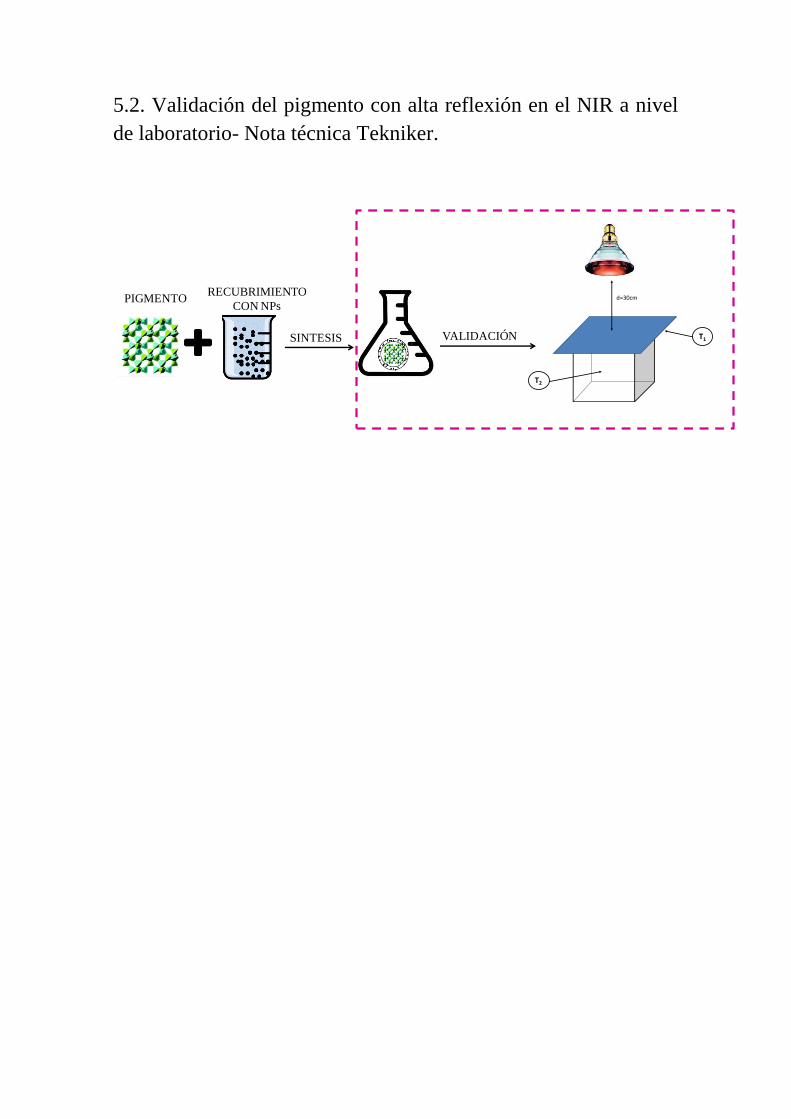
5.2. Validación del pigmento con alta reflexión en el NIR a nivel
de laboratorio- Nota técnica Tekniker.
PIGMENTORECUBRIMIENTO
CON NPs
SINTESIS VALIDACIÓN
d=30cm
T1
T2

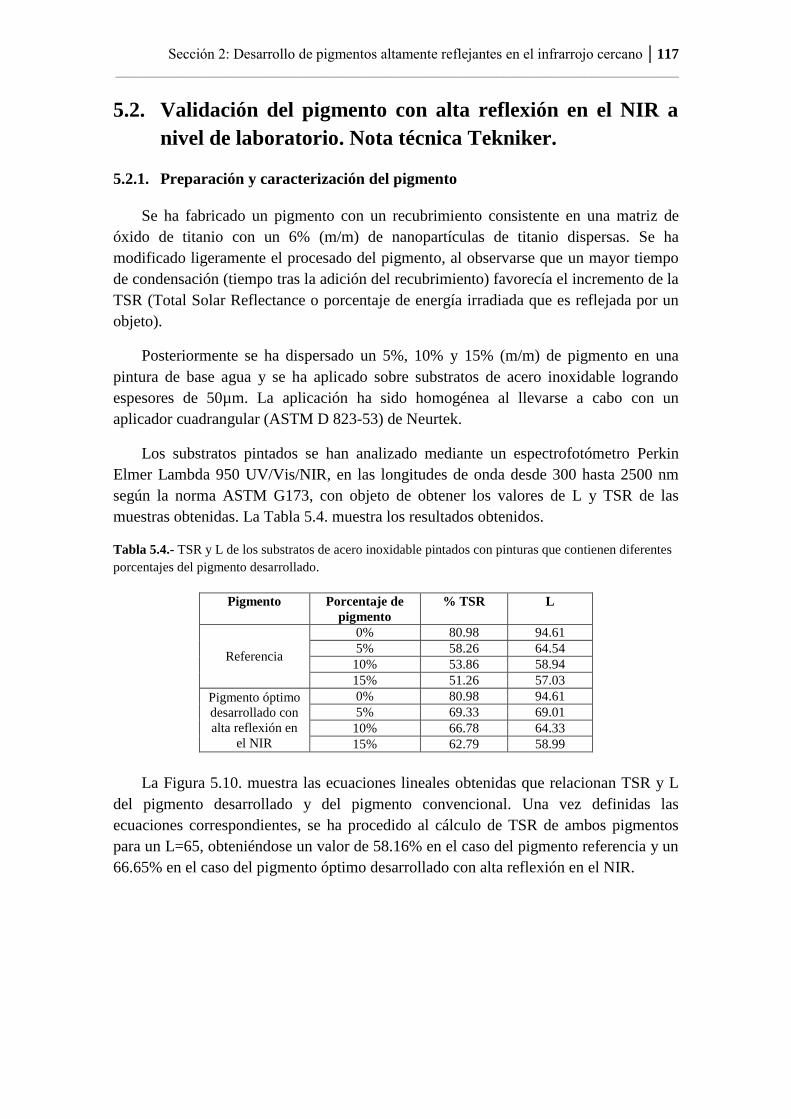
Sección 2: Desarrollo de pigmentos altamente reflejantes en el infrarrojo cercano │117
_____________________________________________________________________________
5.2. Validación del pigmento con alta reflexión en el NIR a
nivel de laboratorio. Nota técnica Tekniker.
5.2.1. Preparación y caracterización del pigmento
Se ha fabricado un pigmento con un recubrimiento consistente en una matriz de
óxido de titanio con un 6% (m/m) de nanopartículas de titanio dispersas. Se ha
modificado ligeramente el procesado del pigmento, al observarse que un mayor tiempo
de condensación (tiempo tras la adición del recubrimiento) favorecía el incremento de la
TSR (Total Solar Reflectance o porcentaje de energía irradiada que es reflejada por un
objeto).
Posteriormente se ha dispersado un 5%, 10% y 15% (m/m) de pigmento en una
pintura de base agua y se ha aplicado sobre substratos de acero inoxidable logrando
espesores de 50µm. La aplicación ha sido homogénea al llevarse a cabo con un
aplicador cuadrangular (ASTM D 823-53) de Neurtek.
Los substratos pintados se han analizado mediante un espectrofotómetro Perkin
Elmer Lambda 950 UV/Vis/NIR, en las longitudes de onda desde 300 hasta 2500 nm
según la norma ASTM G173, con objeto de obtener los valores de L y TSR de las
muestras obtenidas. La Tabla 5.4. muestra los resultados obtenidos.
Tabla 5.4.- TSR y L de los substratos de acero inoxidable pintados con pinturas que contienen diferentes
porcentajes del pigmento desarrollado.
Pigmento Porcentaje de
pigmento
% TSR L
Referencia
0% 80.98 94.61
5% 58.26 64.54
10% 53.86 58.94
15% 51.26 57.03
Pigmento óptimo
desarrollado con
alta reflexión en
el NIR
0% 80.98 94.61
5% 69.33 69.01
10% 66.78 64.33
15% 62.79 58.99
La Figura 5.10. muestra las ecuaciones lineales obtenidas que relacionan TSR y L
del pigmento desarrollado y del pigmento convencional. Una vez definidas las
ecuaciones correspondientes, se ha procedido al cálculo de TSR de ambos pigmentos
para un L=65, obteniéndose un valor de 58.16% en el caso del pigmento referencia y un
66.65% en el caso del pigmento óptimo desarrollado con alta reflexión en el NIR.
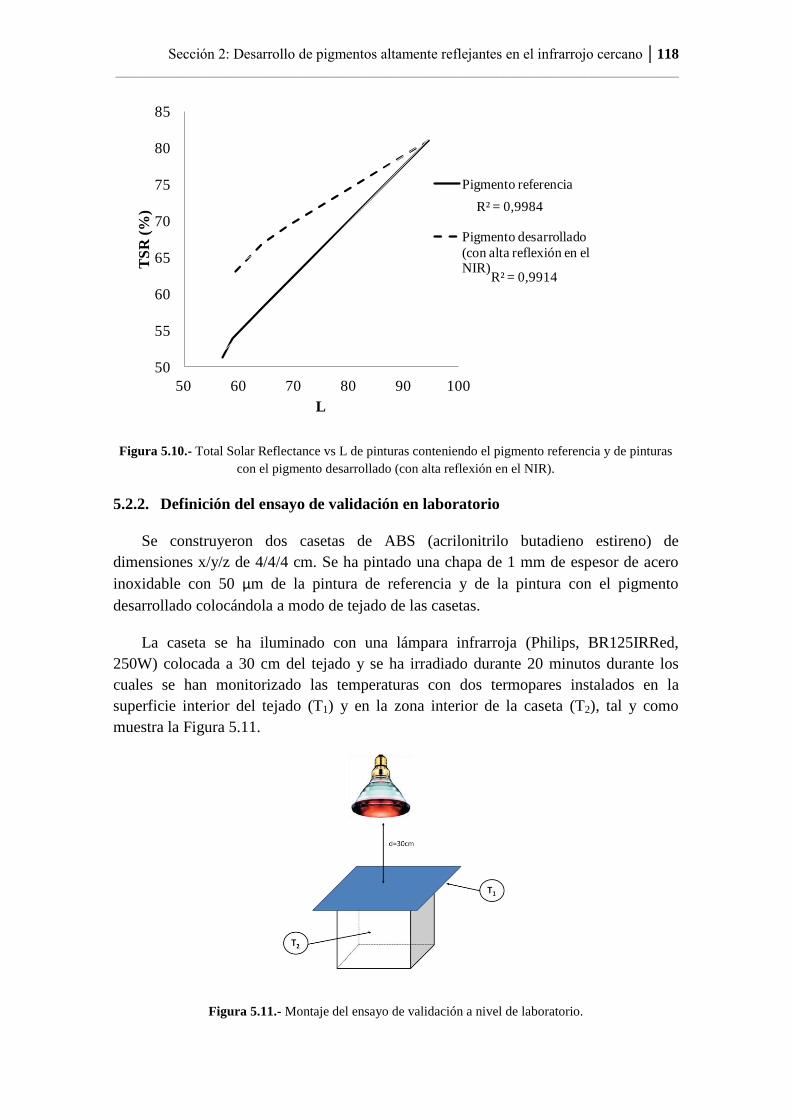
Sección 2: Desarrollo de pigmentos altamente reflejantes en el infrarrojo cercano │118
_____________________________________________________________________________
Figura 5.10.- Total Solar Reflectance vs L de pinturas conteniendo el pigmento referencia y de pinturas
con el pigmento desarrollado (con alta reflexión en el NIR).
5.2.2. Definición del ensayo de validación en laboratorio
Se construyeron dos casetas de ABS (acrilonitrilo butadieno estireno) de
dimensiones x/y/z de 4/4/4 cm. Se ha pintado una chapa de 1 mm de espesor de acero
inoxidable con 50 µm de la pintura de referencia y de la pintura con el pigmento
desarrollado colocándola a modo de tejado de las casetas.
La caseta se ha iluminado con una lámpara infrarroja (Philips, BR125IRRed,
250W) colocada a 30 cm del tejado y se ha irradiado durante 20 minutos durante los
cuales se han monitorizado las temperaturas con dos termopares instalados en la
superficie interior del tejado (T1) y en la zona interior de la caseta (T2), tal y como
muestra la Figura 5.11.
Figura 5.11.- Montaje del ensayo de validación a nivel de laboratorio.
R² = 0,9984
R² = 0,9914
50
55
60
65
70
75
80
85
50 60 70 80 90 100
TS
R (
%)
L
Pigmento referencia
Pigmento desarrollado
(con alta reflexión en el NIR)
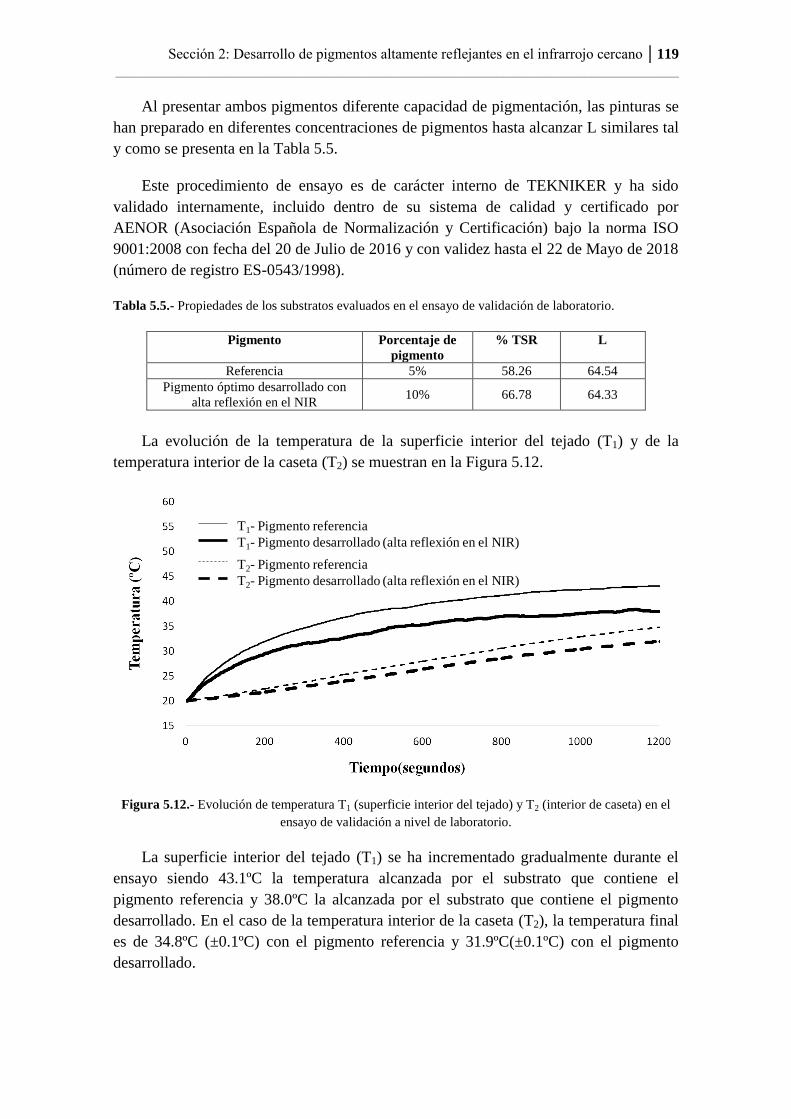
Sección 2: Desarrollo de pigmentos altamente reflejantes en el infrarrojo cercano │119
_____________________________________________________________________________
Al presentar ambos pigmentos diferente capacidad de pigmentación, las pinturas se
han preparado en diferentes concentraciones de pigmentos hasta alcanzar L similares tal
y como se presenta en la Tabla 5.5.
Este procedimiento de ensayo es de carácter interno de TEKNIKER y ha sido
validado internamente, incluido dentro de su sistema de calidad y certificado por
AENOR (Asociación Española de Normalización y Certificación) bajo la norma ISO
9001:2008 con fecha del 20 de Julio de 2016 y con validez hasta el 22 de Mayo de 2018
(número de registro ES-0543/1998).
Tabla 5.5.- Propiedades de los substratos evaluados en el ensayo de validación de laboratorio.
Pigmento Porcentaje de
pigmento
% TSR L
Referencia 5% 58.26 64.54
Pigmento óptimo desarrollado con
alta reflexión en el NIR 10% 66.78 64.33
La evolución de la temperatura de la superficie interior del tejado (T1) y de la
temperatura interior de la caseta (T2) se muestran en la Figura 5.12.
Figura 5.12.- Evolución de temperatura T1 (superficie interior del tejado) y T2 (interior de caseta) en el
ensayo de validación a nivel de laboratorio.
La superficie interior del tejado (T1) se ha incrementado gradualmente durante el
ensayo siendo 43.1ºC la temperatura alcanzada por el substrato que contiene el
pigmento referencia y 38.0ºC la alcanzada por el substrato que contiene el pigmento
desarrollado. En el caso de la temperatura interior de la caseta (T2), la temperatura final
es de 34.8ºC (±0.1ºC) con el pigmento referencia y 31.9ºC(±0.1ºC) con el pigmento
desarrollado.
T1- Pigmento referencia
T1- Pigmento desarrollado (alta reflexión en el NIR)
T2- Pigmento referencia
T2- Pigmento desarrollado (alta reflexión en el NIR)
Sección 2: Desarrollo de pigmentos altamente reflejantes en el infrarrojo cercano │120
_____________________________________________________________________________
5.2.3. Conclusiones
Se ha desarrollado un pigmento que incrementa en un 12.5% la TSR de una pintura
para un L (coordenada de color de luminosidad) de 65. La síntesis del pigmento ha
implicado la deposición de un recubrimiento en base a óxido de titanio alrededor de su
superficie y que contiene nanopartículas de titanio. La condensación del recubrimiento
ha resultado ser un paso crítico para la mejora de la capacidad de reflexión del
pigmento.
En el ensayo de validación a nivel de laboratorio, se ha encontrado que la
temperatura interior de la caseta (T2) al final del ensayo es un 8% menor en el caso de la
caseta de testeo. Así mismo se ha observado que la temperatura interior del tejado (T1),
al final del ensayo, ha sido un 11.8% menor en el caso de la caseta de testeo.


6. Sección 3: DESARROLLO DE PIGMENTOS
MULTIFUNCIONALES
6.1. Designing multifunctional pigments for an improved
energy efficiency in buildings (Energy and Buildings-
Under Referees)


Sección 3: Desarrollo de pigmentos multifuncionales │123
_____________________________________________________________________________
Resultados más relevantes
El resultado principal derivado de la investigación registrada en esta sección ha
sido la fabricación de un pigmento multifuncional con capacidad de almacenamiento y
alta reflexión en el infrarrojo y su validación a escala de laboratorio. Es importante
resaltar la no existencia en el mercado de pigmentos con ambas propiedades
combinadas.
La investigación ha seguido las etapas mostradas en la Figura 6.1.
Figura 6.1.- Desarrollo de pigmentos multifuncionales.
Síntesis de pigmentos con capacidad de almacenamiento térmico y alta reflexión en el
NIR
Se ha fabricado un pigmento con capacidad de almacenamiento térmico y alta
reflexión en el infrarrojo, obtenido mediante impregnación capilar y la aplicación
posterior de un recubrimiento. Así mismo, se ha calculado el valor de TSR de pinturas
conteniendo el pigmento multifuncional y el pigmento de referencia para valores de
L=65. Se ha obtenido un incremento del valor de TSR de un 11.5% en el caso del
pigmento multifuncional desarrollado. La capacidad de almacenamiento térmico del
pigmento multifuncional desarrollado, ha sido de 37 J/g.
Validación del pigmento con propiedades óptimas a escala de laboratorio
Se ha dispersado el pigmento multifuncional desarrollado en una pintura en base
agua al 10%wt.y se ha pintado una chapa de 1 mm de espesor de acero inoxidable con
50 µm de pintura (en seco) que se ha colocado como tejado de una caseta de
dimensiones x/y/z de 4/4/4 cm.
Se ha iluminado el tejado de la caseta con una lámpara infrarroja a 30 cm del tejado
durante 20 minutos y se ha registrado la evolución de la temperatura interior (centro de
la caseta- T2) y temperatura interior del tejado (T1). Este test se ha realizado en una
caseta de referencia (pintura con el pigmento no modificado) y en una caseta de testeo
(pintura con el pigmento multifuncional desarrollado).
PIGMENTO PCMRECUBRIMIENTO
CON NPs
SÍNTESIS VALIDACIÓN
d=30cm
T1
T2

Sección 3: Desarrollo de pigmentos multifuncionales │124
_____________________________________________________________________________
Se ha observado que la temperatura interior de la caseta (T2) al final del ensayo es
un 10.9% menor en el caso de la caseta de testeo. Así mismo, se ha observado que la
temperatura interior del tejado (T1) al final del ensayo era un 12.3% menor en el caso de
la caseta de testeo.
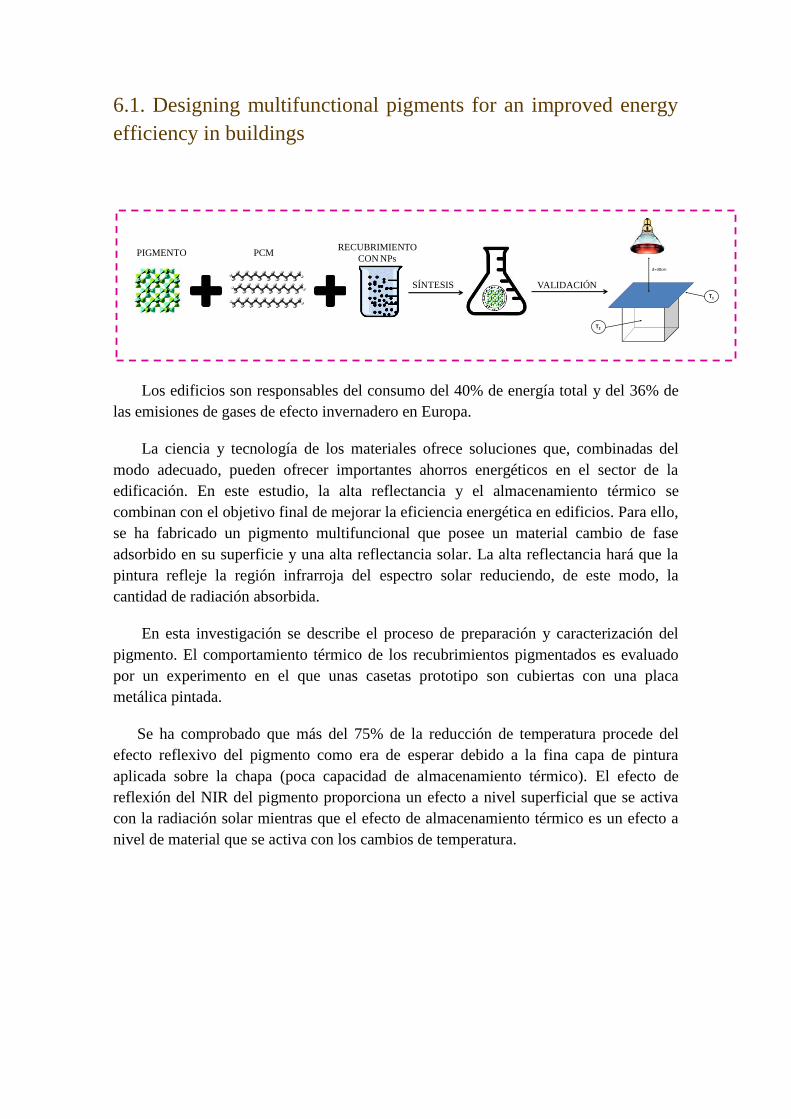
6.1. Designing multifunctional pigments for an improved energy
efficiency in buildings
Los edificios son responsables del consumo del 40% de energía total y del 36% de
las emisiones de gases de efecto invernadero en Europa.
La ciencia y tecnología de los materiales ofrece soluciones que, combinadas del
modo adecuado, pueden ofrecer importantes ahorros energéticos en el sector de la
edificación. En este estudio, la alta reflectancia y el almacenamiento térmico se
combinan con el objetivo final de mejorar la eficiencia energética en edificios. Para ello,
se ha fabricado un pigmento multifuncional que posee un material cambio de fase
adsorbido en su superficie y una alta reflectancia solar. La alta reflectancia hará que la
pintura refleje la región infrarroja del espectro solar reduciendo, de este modo, la
cantidad de radiación absorbida.
En esta investigación se describe el proceso de preparación y caracterización del
pigmento. El comportamiento térmico de los recubrimientos pigmentados es evaluado
por un experimento en el que unas casetas prototipo son cubiertas con una placa
metálica pintada.
Se ha comprobado que más del 75% de la reducción de temperatura procede del
efecto reflexivo del pigmento como era de esperar debido a la fina capa de pintura
aplicada sobre la chapa (poca capacidad de almacenamiento térmico). El efecto de
reflexión del NIR del pigmento proporciona un efecto a nivel superficial que se activa
con la radiación solar mientras que el efecto de almacenamiento térmico es un efecto a
nivel de material que se activa con los cambios de temperatura.
PIGMENTO PCMRECUBRIMIENTO
CON NPs
SÍNTESIS VALIDACIÓN
d=30cm
T1
T2

Sección 3: Desarrollo de pigmentos multifuncionales │127
_____________________________________________________________________________
6.1. Designing multifunctional pigments for an improved
energy efficiency in buildings
Under referees (Energy and Buildings)
Abstract
Buildings are responsible for 40% of the total energy use and 36% of total GHG
emissions within the EU. Materials science offers solutions that when are combined can
offer important energy savings in the building sector. In this study, high reflectance
coating and thermal storage capacity are combined with the aim of improving energy
efficiency in buildings. For this issue a multifunctional pigment having a phase change
material adsorbed on its surface and a high total solar reflectance has been
manufactured. The total solar reflectance of the pigment will make the paint to reflect
the sunlight radiation in the infrared part of the spectrum reducing the amount of
absorbed radiation. This high reflection provides a surface level effect as is a passive
stimulus-responsive solution that acts with sunlight radiation.
On the other hand, the thermal storage capability provides a bulk level effect as is
passive stimulus-responsive solution acting by temperature changes, making it possible
to use constructive materials as a thermal energy storage media.
The preparation process is described and the pigment is characterized conveniently.
The thermal performance of corresponding pigmented coatings was evaluated by an
experiment simulation in which different boxes were covered with the coating
containing the multifunctional pigment and traditional pigmented coating on their tops.
The indoor air temperature and the interior temperature of the substrate were measured
obtaining differences of 4-5◦C.
Keywords: Multifunctional, Pigment, Total Solar Reflectance, Coating, Energy
efficiency
Highlights
Ultramarine blue pigment has been coated with different reflecting films based
on TiO2 and containing different types and concentration of nanoparticles.
The prepared pigments have been dispersed in a waterborne paint at different
percentages and Total solar Reflectance and lightness were measured.
The linear equation relating L (lightness) and TSR for each material has been
calculated and the TSR has been compared for a standard L value of 65.
All the obtained paints increased the TSR when adding nanoparticles but the
maximum value was obtained for an addition of 6%wt. of titania nanoparticles.
Sección 3: Desarrollo de pigmentos multifuncionales │128
_____________________________________________________________________________
6.1.1. Introduction
Buildings are responsible for 40% of the total energy use1 and according to the
European Commission 80% of the population will be living in already existing
buildings by the year 20302. One measure that can contribute to improve energy
sustainability is to increase the energy efficiency in existing buildings3.
Materials industry can provide different solutions addressing building
refurbishment oriented to energy savings at an affordable cost4. In this sense, high
reflectance outdoor coatings and phase change materials are proposed as promising
technologies.
Phase Change Materials (PCMs) are products capable of storing and releasing
thermal energy within the temperature of the melting and freezing processes5. These
materials are being integrated in different building components -after encapsulation
process- with the aim of reducing energy consumption for space conditioning6. There is
a need of new or modified encapsulation methods economically available7. A previous
work presented a hexadecane/pigment composite as one promising alternative and a
scalable solution when capillary impregnation method is applied8,9
and that can be
integrated in commercial paints.
In the other hand, the cool material technology presents a cost effective passive
technique that can impact directly in the energy consumption of buildings10
. These
coatings reflect sunlight radiation in the infrared part of the spectrum (the half of the
1 Ramírez-Villegas, R., Eriksson, O. & Olofsson, T. Assessment of renovation measures for a dwelling
area – impacts on energy efficiency and building certification. Build. Environ. 97, 26–33 (2015). 2 European Commission, EUR 24283-energy-efficient Buildings PPP Multiannual Roadmap and
Longer Term Strategy, 2010, http://dx.doi.org/10.2777/10074. Luxembourg. 3 Tan, B., Yavuz, Y., Otay, E. N. & Çamlıbel, E. Optimal selection of energy efficiency measures for
energy sustainability of existing buildings. Comput. Oper. Res. 66, 258–271 (2015). 4 Bax, L., Cruxent, J. & Komornicki, J. Innovative Chemistry for Energy Efficiency of Buildings in
Smart Cities European Technology Platform for Sustainable Chemistry and SmartCities and
Communities (2013). 5 Chena, Y., Shih, Y.& Yu, Y. Stearyl Alcohol Modified Expanded Graphite / Paraffin Phase Change
Composite. Int. J. Appl. Sci. Eng. 11, 227–233 (2013). 6 Faraji, M., Alami, M. E. & Najam, M. Thermal Control of Building using latent heat storage south
wall. J. Math. Comput. Sci. 10, 212–227 (2014). 7 Li, X., Sanjayan, J. G. & Wilson, J. L. Fabrication and stability of form-stable diatomite/paraffin
phase change material composites. Energy Build. 76, 284–294 (2014). 8 Aranzabe, E., Villasante, P. M., March, R., Arriortua, M. I., Larrañaga, A. & Aranzabe, A. More than
Color: Pigments with Thermal Storage Capacity; Processing and Degradation Behavior. Adv. Mat.
Phy. Chem. 5, 171–184 (2015). 9 Aranzabe, E., Arriortua, M. I., Larrañaga, A., Villasante, P. M., Aranzabe, A. & March, R. Easily
scalable Production Process for a Pigment Having Thermal Storage Capacity. Am. J. Chem. App. 2-4,
98–105 (2015). 10
Mastrapostoli, E., Karlessi, T., Pantazaras, A., Kolokotsa, D., Gobakis, K. & Santamouris, M. On the
cooling potential of cool roofs in cold climates: Use of cool fluorocarbon coatings to enhance the
optical properties and the energy performance of industrial buildings. Energy Build. 69, 417–425
(2014).
Sección 3: Desarrollo de pigmentos multifuncionales │129
_____________________________________________________________________________
solar radiation)11,12
. The color effect of an industrial coating is achieved by adding the
desired pigment that selectively absorb specific wavelength in the visible region13
.
Nowadays, infrared reflective inorganic pigments are used as cool materials for building
roofs and walls14
but most of them contain hazardous elements (Cr, Cd, Ni, Pb…)15
.
The use of cool coatings helps in keeping lower exterior surface temperatures on the
roof reducing thus the energy consumption in regions where cooling needs are
predominant over heating energy requirements16,17
.
Combination of technologies can help to achieve a superior energy performance
within buildings18
. Both cool roof and PCM roof can help to decrease the cooling load
demand19
. A coating having high reflectivity can contribute to reduce the amount of
absorbed radiation, and the PCM approach can reduce the sensible heat.
Ultramarine blue pigment (UB) is an inorganic low-cost pigment with high
pigmentary properties that is commonly used in construction sector. The aim of this
study is to develop a cool pigment based on ultramarine blue and providing thermal
storage capacity. The strategy to modify this conventional pigment into a
Multifunctional pigment for energy saving is to impregnate the pigment with a phase
change material and coat it with a coating containing nanoparticles obtaining a pigment
with high Total Solar Reflectance. This multifunctional pigment is suitable to be
dispersed in different constructive materials (polymers, concrete, paint). The high
reflection provided by the pigment will give to the material surface level effect acting
with sunlight radiation. The thermal storage capability will give to the material a bulk
level effect acting by temperature changes. The combination of both effects will
contribute to energy savings in construction sector.
11
Zhao, X., Zhang, Y., Huang, Y., Gong, H. & Zhao, J. Synthesis and characterization of neodymium
doped yttrium molybdate high NIR reflective nano pigments. Dye. Pigment. 116, 119–123 (2015). 12
Jose, S., Prakash, A., Laha, S., Natarajan, S. & Reddy, M. L. Green colored nano-pigments derived
from Y2BaCuO5: NIR reflective coatings. Dye. Pigment. 107, 118–126 (2014). 13
Xue, X., Qin, J., Song, J., Qu, J., Shi, Y., Zhang, W., Song, Z., Jiang, L., Li, J., Guo, H. & Zhang, T.
The methods for creating energy efficient cool gray building coatings—Part I: Preparation from white
and black pigments. Sol. Energy Mater. Sol. Cells 130, 587–598 (2014). 14
Liu, L., Han, A., Ye, M. & Feng, W. The evaluation of thermal performance of cool coatings colored
with high near-infrared reflective nano-brown inorganic pigments: Magnesium doped ZnFe2O4
compounds. Sol. Energy 113, 48–56 (2015). 15
Han, A., Ye, M., Liu, L., Feng, W. & Zhao, M. Estimating thermal performance of cool coatings
colored with high near-infrared reflective inorganic pigments: Iron doped La2Mo2O7 compounds.
Energy Build. 84, 698–703 (2014). 16
Wang, J. L., Li, Y. Q., Byon, Y. J., Mei, S. G. & Zhang, G. L. Synthesis and characterization of
NiTiO3 yellow nano pigment with high solar radiation reflection efficiency. Powder Technol. 235,
303–306 (2013). 17
Revel, G. M., Martarelli, M., Emiliani, M., Gozalbo, A., Orts, M. J., Bengoechea, M. A., Delgado, L.
G., Gaki, A., Katsiapi, A., Taxiarchou, M., Arabatzis, I., Fasaki, I. & Hermanns, S. Cool products for
building envelope – Part I: Development and lab scale testing. Sol. Energy 105, 770–779 (2014). 18
Chua, K. J., Chou, S. K., Yang, W. M. & Yan, J. Achieving better energy-efficient air conditioning –
A review of technologies and strategies. App. Energy 104, 87–104 (2013). 19
Roman, K. K., O’Brien, T., Alvey, J. B. & Woo, O. Simulating the effects of cool roof and PCM
(phase change materials) based roof to mitigate UHI (urban heat island) in prominent US cities.
Energy 96, 103–117 (2016).

Sección 3: Desarrollo de pigmentos multifuncionales │130
_____________________________________________________________________________
6.1.2. Experimental
6.1.2.1. Materials and methods
A standard ultramarine blue pigment based on the crystal chemistry of the royal
blue Sodalite mineral Lazurite [Na6Ca2Al6Si6O24(Sn,SO4)2] produced by Nubiola
Pigmentos S.L. was used (Table 6.5 [UM]). Laboratory grade hexadecane (C16H34) from
Scharlab was used as the phase change material.
The Hexadecane/pigment composite was fabricated by capillary impregnation
method using following process conditions: Ratio Pigment:Hexadecane of 1:1.5; a
processing time of 10 minutes; a processing temperature of 25ºC and using petroleum
ether as the cleaning strategy. After the process, the pigment was dried in an oven at
60ºC during 24 hours. The Hexadecane/pigment composite was coated with a reflecting
film based on TiO2 matrix containing titania nanoparticles (consisting of 87% anatase
and 13% rutile with a primary size of 21 nm purchased from Sigma-Aldrich). With this
aim, the hexadecane/pigment composite was put in dispersion in water at 50g/l. An
hydrolyzed solution of titanium (IV) n-butoxide containing a 6%wt. of titania
nanoparticles (with a primary size of 21nm purchased from Sigma-Aldrich) was then
added drop by drop to this dispersion. Once the solution was added, obtained pigments
were filtered and cured at 60ºC during 12 hours (Table 6.1. [MF]). A last pigment
having only the reflecting film around the raw pigment was fabricated (Table 6.1.[F]) to
evaluate the contribution of the high TSR functionality separately.
Table 6.1.- Pigments dispersed in a water-based paint to be evaluated in terms of energy saving.
Pigment Description Functionality Effect
UM Un modified pigment None None
F Functional pigment High reflectance Surface level effect
MF Multifunctional
pigment
High reflectance + Thermal
storage (PCM)
Bulk level and surface level
effects
The preparation method of the colored coating on an opaque substrate (Stainless
steel) as a cool coat was the following: the pigment was mechanically dispersed at
different percentages (5, 10 and 15%wt.) in a water-based paint. Then Stainless steel
substrates were painted with a layer of 50µm of thickness. The paint was applied with a
Quadrangular Applicator (ASTM D 823-53) from Neurtek which is a paint spreader of
constant coat thickness. The thickness of the painted Stainless steel substrates
(theoretically 50 µm) was verified by a portable instrument for measuring coating
thickness (Dualscope® FMP100). The obtained results showed a high reproducibility of
the layers being the thickness for UM, F and MF, 49.8(1), 50.2(1) and 50.0(1) µm,
respectively.
6.1.2.2. Characterization techniques
Total Solar Reflectance (TSR) is the percentage of irradiated energy that is reflected
by an object. TSR of the painted substrates was measured in a Perkin Elmer Lambda
Sección 3: Desarrollo de pigmentos multifuncionales │131
_____________________________________________________________________________
950 UV/Vis/NIR System in the wavelength range from 300 to 2500 nm according to
ASTM G173and using poly-tetrafluoroethylene (PTFE) as the white standard.
The lightness (CIELAB lightness L *) of the painted substrates was measured in a
Perkin Elmer Lambda 950 UV/Vis/NIR System in the wavelength from 380nm to
780nm. The TSR of two materials can be compared if their tinting strength (L) is the
same, so a relation between L (lightness) and TSR for each material was established by
preparing paints with different percentages of pigment.
The thermal storage capability of the pigments was tested using Differential
Scanning Calorimetry measurement that was carried out using a DSC (Mettler Toledo
HP DSC827) under nitrogen atmosphere (50 ml/min), using around 5mg as a sample
weight in a sealed aluminum pan. A dynamic method with a temperature ranged from -
10ºC to 50ºC at a rate of 5ºC/min was used. Melting point, crystallization point and the
latent heat of fusion and crystallization of pigments were calculated.
The thermal performance of the pigments was evaluated by using painted stainless
steel substrates in a simulated experiment (with boxes) comparing UM, F and MF
behavior. The evaluated effect was mainly the one related to the surface (high
reflectance property) as to be capable of measuring the bulk effect; the pigment must be
dispersed in a bulk material to have enough thermal storage capability.
6.1.3. Results and discussion
6.1.3.1 Chromatic properties & NIR reflectance analysis
Total Solar Reflectance and Lightness were measured in paints containing different
percentages un-modified (UM), functional (F), multifunctional pigment (MF) and the
raw paint (Reference). An interior water-based paint was selected as the matrix and the
pigments were mechanically dispersed. Stainless steel substrates were painted with a
layer of 50µm of thickness. Table 6.2. below shows the materials prepared and the
obtained values for L and TSR.
Table 6.2.- L and TSR of painted substrates with a water-based paint containing different percentages of
UM, F and MF pigments.
Pigment %wt.Pigment TSR(%) L
Reference 0 80.98 94.61
UM
5 58.26 64.54
10 53.86 58.94
15 51.26 57.03
F
5 69.33 69.01
10 66.78 64.33
15 62.79 58.99
MF
5 70.52 69.56
10 67.87 64.12
15 63.97 59.49

Sección 3: Desarrollo de pigmentos multifuncionales │132
_____________________________________________________________________________
For each pigment, the linear equation relating TSR and L was calculated (see
Figure 6.2.).
Figure 6.2.- Total Solar Reflectance vs L of the paint containing the Unmodified pigment (UM)
compared to the one containing F and MF pigment.
Once, the equation is defined, the TSR for a standard L value of 65 was calculated
obtaining a 58.16% of TSR for the UM pigment, 66.65% for F pigment and 67.16% for
the MF pigment. The paint containing the multifunctional pigment provides a TSR a
15% higher than the one obtained with the paint containing the unmodified pigment for
a standard L of 65.
6.1.3.2. Thermal energy storage capability
The obtained sample (MF) was analyzed by DSC (with the conditions previously
detailed) to measure the latent fusion heat and crystallization as well as the melting and
crystallization point values. Table 6.3. summarizes the obtained thermal properties of
the MF pigment compared with the properties obtained for the raw phase change
material (hexadecane).
Table 6.3.- Thermal properties of hexadecane/pigment composites fabricated under different processing
conditions.
Melting
point (ºC)
Crystallization
point (ºC)
Latent heat
(fusion) (J/g)
Latent heat
(Crystallization) (J/g)
Hexadecane 19.11 15.85 217.00 224.00
UM --- --- --- ---
F --- --- --- ---
MF 18.61 13.41 37.18 37.21
50
55
60
65
70
75
80
85
50 60 70 80 90 100
TS
R (
%)
L
UM
F
MF
R2= 0,9984
R2= 0,9914
R2= 0,9850
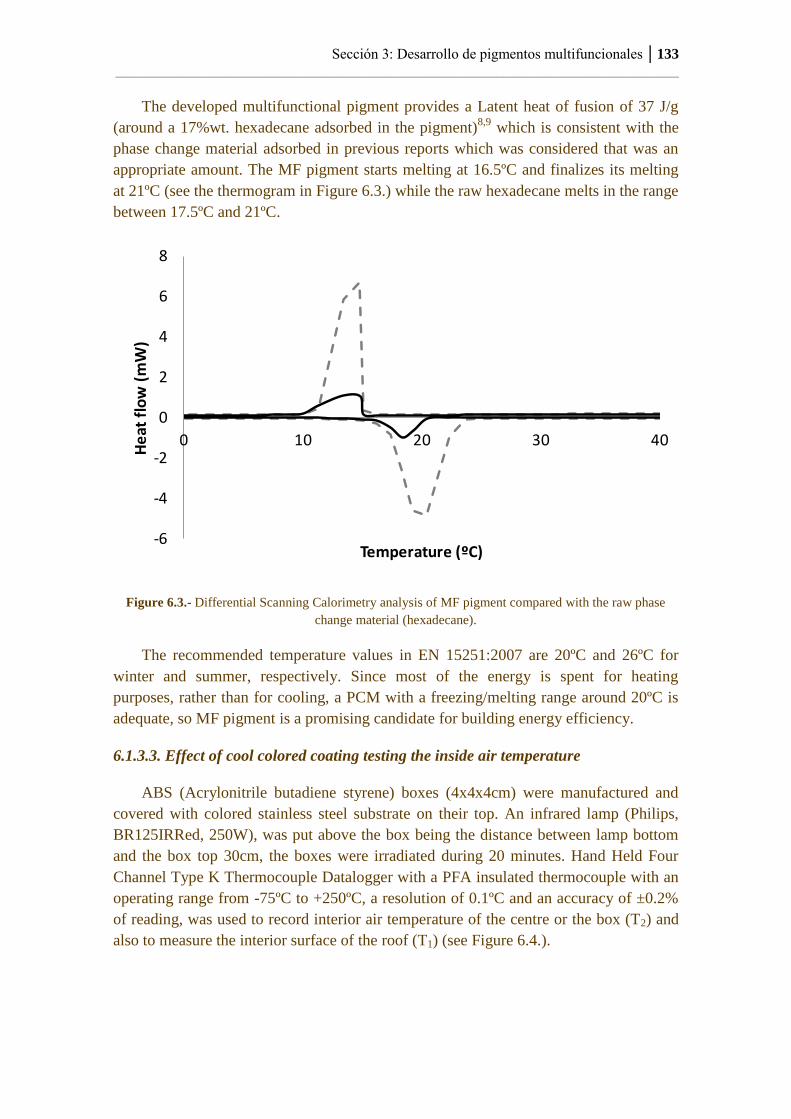
Sección 3: Desarrollo de pigmentos multifuncionales │133
_____________________________________________________________________________
The developed multifunctional pigment provides a Latent heat of fusion of 37 J/g
(around a 17%wt. hexadecane adsorbed in the pigment)8,9
which is consistent with the
phase change material adsorbed in previous reports which was considered that was an
appropriate amount. The MF pigment starts melting at 16.5ºC and finalizes its melting
at 21ºC (see the thermogram in Figure 6.3.) while the raw hexadecane melts in the range
between 17.5ºC and 21ºC.
Figure 6.3.- Differential Scanning Calorimetry analysis of MF pigment compared with the raw phase
change material (hexadecane).
The recommended temperature values in EN 15251:2007 are 20ºC and 26ºC for
winter and summer, respectively. Since most of the energy is spent for heating
purposes, rather than for cooling, a PCM with a freezing/melting range around 20ºC is
adequate, so MF pigment is a promising candidate for building energy efficiency.
6.1.3.3. Effect of cool colored coating testing the inside air temperature
ABS (Acrylonitrile butadiene styrene) boxes (4x4x4cm) were manufactured and
covered with colored stainless steel substrate on their top. An infrared lamp (Philips,
BR125IRRed, 250W), was put above the box being the distance between lamp bottom
and the box top 30cm, the boxes were irradiated during 20 minutes. Hand Held Four
Channel Type K Thermocouple Datalogger with a PFA insulated thermocouple with an
operating range from -75ºC to +250ºC, a resolution of 0.1ºC and an accuracy of ±0.2%
of reading, was used to record interior air temperature of the centre or the box (T2) and
also to measure the interior surface of the roof (T1) (see Figure 6.4.).
-6
-4
-2
0
2
4
6
8
0 10 20 30 40
He
at f
low
(m
W)
Temperature (ºC)
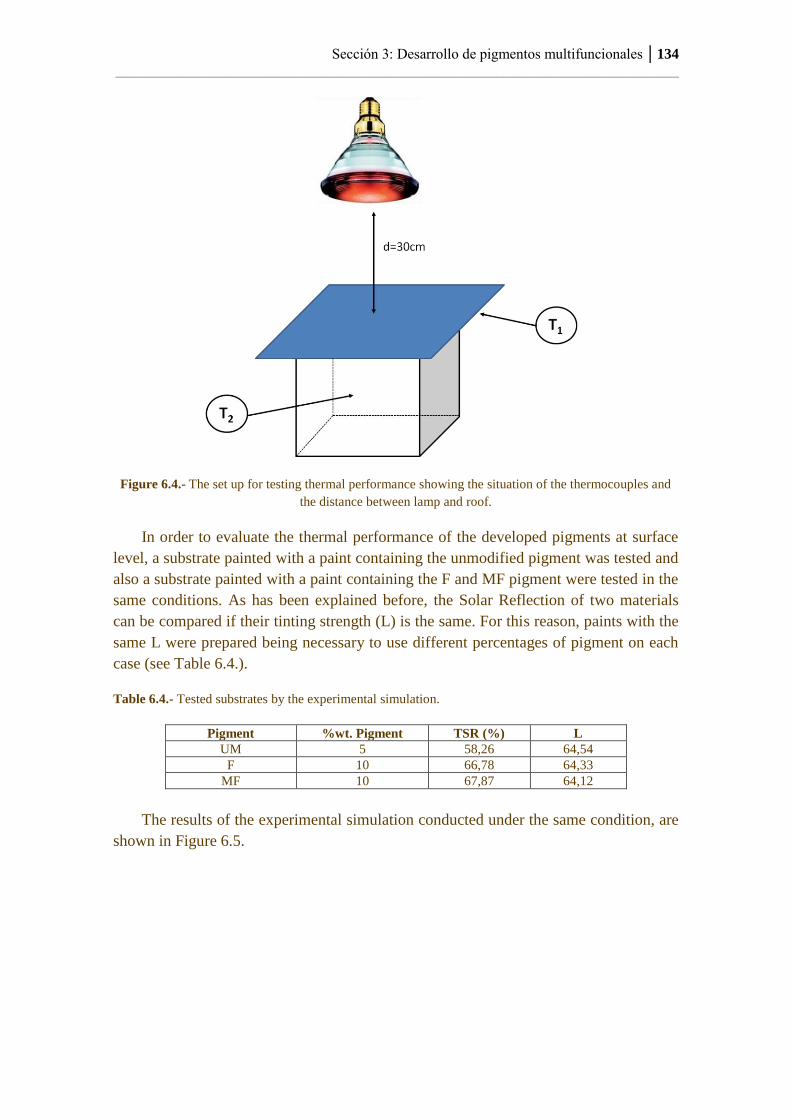
Sección 3: Desarrollo de pigmentos multifuncionales │134
_____________________________________________________________________________
Figure 6.4.- The set up for testing thermal performance showing the situation of the thermocouples and
the distance between lamp and roof.
In order to evaluate the thermal performance of the developed pigments at surface
level, a substrate painted with a paint containing the unmodified pigment was tested and
also a substrate painted with a paint containing the F and MF pigment were tested in the
same conditions. As has been explained before, the Solar Reflection of two materials
can be compared if their tinting strength (L) is the same. For this reason, paints with the
same L were prepared being necessary to use different percentages of pigment on each
case (see Table 6.4.).
Table 6.4.- Tested substrates by the experimental simulation.
Pigment %wt. Pigment TSR (%) L
UM 5 58,26 64,54
F 10 66,78 64,33
MF 10 67,87 64,12
The results of the experimental simulation conducted under the same condition, are
shown in Figure 6.5.
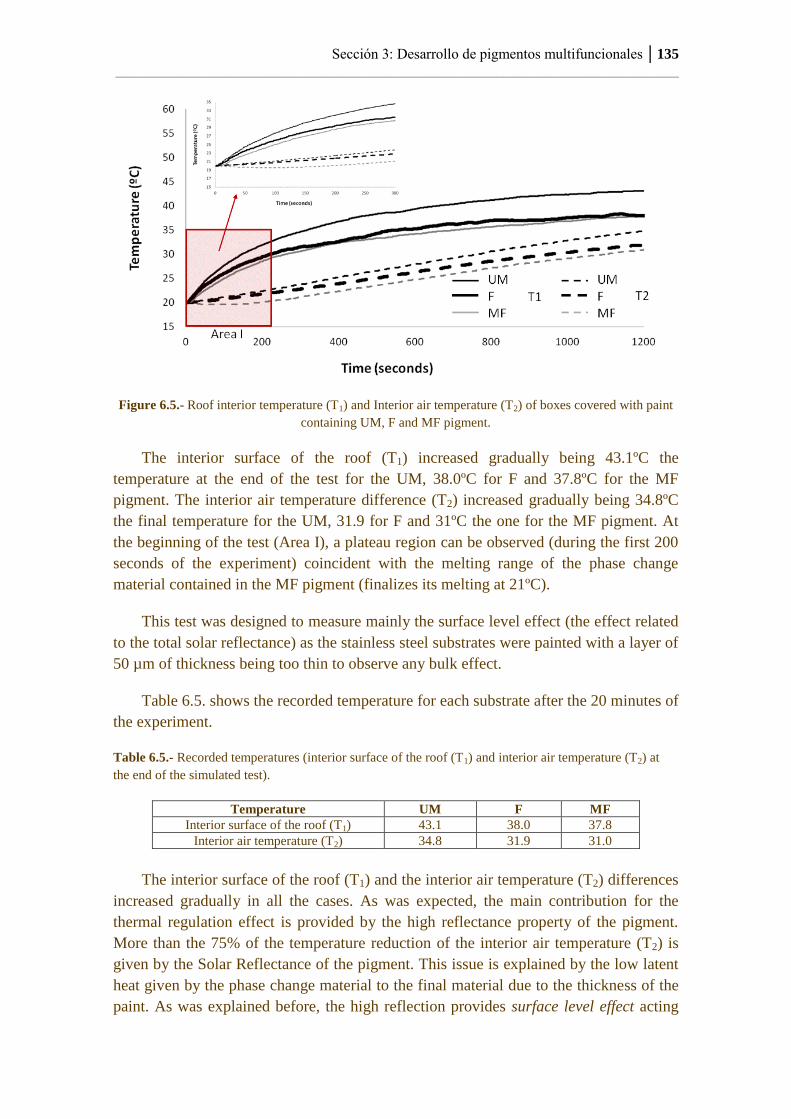
Sección 3: Desarrollo de pigmentos multifuncionales │135
_____________________________________________________________________________
Figure 6.5.- Roof interior temperature (T1) and Interior air temperature (T2) of boxes covered with paint
containing UM, F and MF pigment.
The interior surface of the roof (T1) increased gradually being 43.1ºC the
temperature at the end of the test for the UM, 38.0ºC for F and 37.8ºC for the MF
pigment. The interior air temperature difference (T2) increased gradually being 34.8ºC
the final temperature for the UM, 31.9 for F and 31ºC the one for the MF pigment. At
the beginning of the test (Area I), a plateau region can be observed (during the first 200
seconds of the experiment) coincident with the melting range of the phase change
material contained in the MF pigment (finalizes its melting at 21ºC).
This test was designed to measure mainly the surface level effect (the effect related
to the total solar reflectance) as the stainless steel substrates were painted with a layer of
50 µm of thickness being too thin to observe any bulk effect.
Table 6.5. shows the recorded temperature for each substrate after the 20 minutes of
the experiment.
Table 6.5.- Recorded temperatures (interior surface of the roof (T1) and interior air temperature (T2) at
the end of the simulated test).
Temperature UM F MF
Interior surface of the roof (T1) 43.1 38.0 37.8
Interior air temperature (T2) 34.8 31.9 31.0
The interior surface of the roof (T1) and the interior air temperature (T2) differences
increased gradually in all the cases. As was expected, the main contribution for the
thermal regulation effect is provided by the high reflectance property of the pigment.
More than the 75% of the temperature reduction of the interior air temperature (T2) is
given by the Solar Reflectance of the pigment. This issue is explained by the low latent
heat given by the phase change material to the final material due to the thickness of the
paint. As was explained before, the high reflection provides surface level effect acting
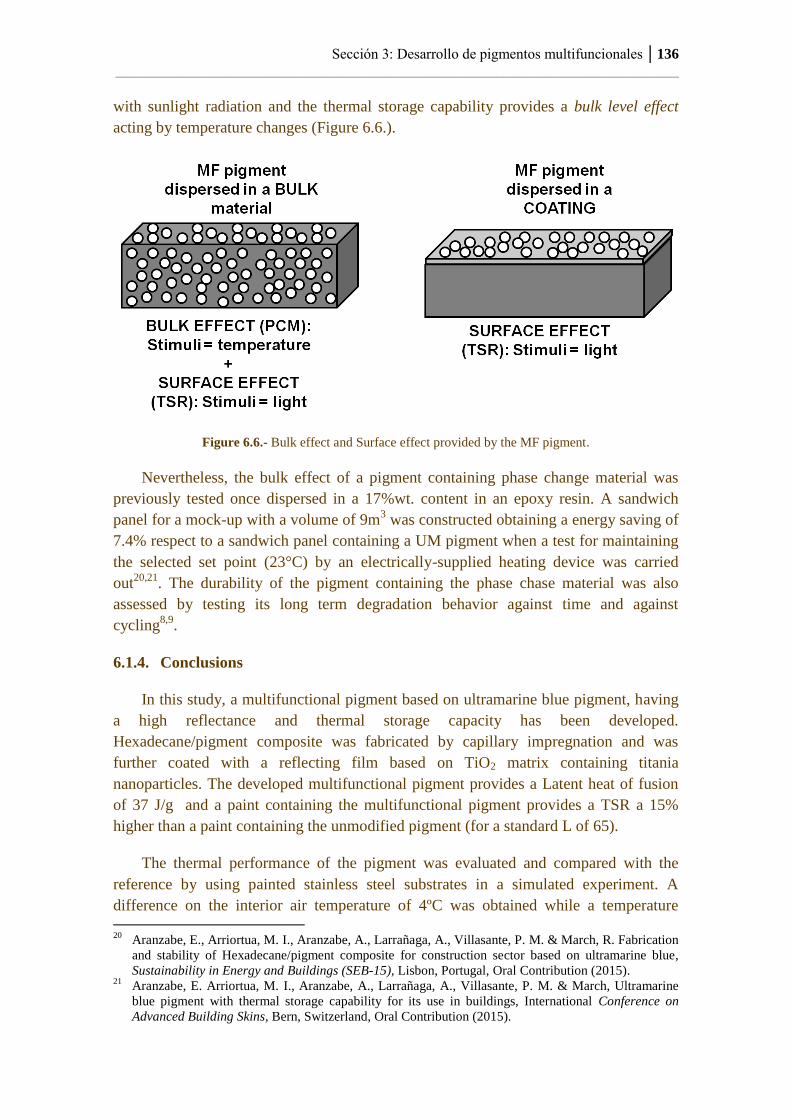
Sección 3: Desarrollo de pigmentos multifuncionales │136
_____________________________________________________________________________
with sunlight radiation and the thermal storage capability provides a bulk level effect
acting by temperature changes (Figure 6.6.).
Figure 6.6.- Bulk effect and Surface effect provided by the MF pigment.
Nevertheless, the bulk effect of a pigment containing phase change material was
previously tested once dispersed in a 17%wt. content in an epoxy resin. A sandwich
panel for a mock-up with a volume of 9m3 was constructed obtaining a energy saving of
7.4% respect to a sandwich panel containing a UM pigment when a test for maintaining
the selected set point (23°C) by an electrically-supplied heating device was carried
out20,21
. The durability of the pigment containing the phase chase material was also
assessed by testing its long term degradation behavior against time and against
cycling8,9
.
6.1.4. Conclusions
In this study, a multifunctional pigment based on ultramarine blue pigment, having
a high reflectance and thermal storage capacity has been developed.
Hexadecane/pigment composite was fabricated by capillary impregnation and was
further coated with a reflecting film based on TiO2 matrix containing titania
nanoparticles. The developed multifunctional pigment provides a Latent heat of fusion
of 37 J/g and a paint containing the multifunctional pigment provides a TSR a 15%
higher than a paint containing the unmodified pigment (for a standard L of 65).
The thermal performance of the pigment was evaluated and compared with the
reference by using painted stainless steel substrates in a simulated experiment. A
difference on the interior air temperature of 4ºC was obtained while a temperature 20
Aranzabe, E., Arriortua, M. I., Aranzabe, A., Larrañaga, A., Villasante, P. M. & March, R. Fabrication
and stability of Hexadecane/pigment composite for construction sector based on ultramarine blue,
Sustainability in Energy and Buildings (SEB-15), Lisbon, Portugal, Oral Contribution (2015). 21
Aranzabe, E. Arriortua, M. I., Aranzabe, A., Larrañaga, A., Villasante, P. M. & March, Ultramarine
blue pigment with thermal storage capability for its use in buildings, International Conference on
Advanced Building Skins, Bern, Switzerland, Oral Contribution (2015).

Sección 3: Desarrollo de pigmentos multifuncionales │137
_____________________________________________________________________________
difference of 5.3ºC was obtained for the interior surface of the roof. In the tested
conditions, more than the 75% of the interior air temperature reduction (T2) is
associated to the Solar Reflectance of the pigment.
Although the test was designed to measure the surface level effect (high reflection),
the contribution of each functionality (thermal storage and high reflection) to the
thermal regulation effect was previously proved8,9,20,21
.


7. RESUMEN GLOBAL DE LOS HALLAZGOS

Resumen global de los hallazgos │141
____________________________________________________________________________
A continuación se detallan los hallazgos logrados en el transcurso de este trabajo de
investigación:
Pigmento con capacidad de almacenamiento térmico
1. El proceso de impregnación a vacio empleando el pigmento azul ultramar como
soporte y hexadecano como PCM, ha permitido obtener un pigmento con
capacidad de almacenamiento térmico y con una durabilidad apropiada para su
empleo en materiales constructivos.
2. El proceso de impregnación capilar (sobre pigmento y empleando hexadecano
como PCM) permite obtener un pigmento con una capacidad de almacenamiento
térmico mediante un proceso escalable industrialmente, tal y como se ha
demostrado en la fabricación de 5kg/batch de pigmento en una planta piloto
diseñada para tal fin.
3. La incorporación del pigmento con capacidad de almacenamiento térmico en las
paredes de una caseta demostrativa, demuestra la mejora de la eficiencia térmica
en edificios.
Pigmento con alta reflexión en el NIR
4. La evaluación de la eficiencia de los pigmentos altamente reflejantes en el
infrarrojo cercano ha requerido del diseño de una metodología adecuada para
una matriz concreta (pintura base agua). La metodología tiene en cuenta la TSR
(Total Solar Reflectance) y la coordenada de color L (luminosidad) de los
sistemas preparados con diferentes porcentajes de pigmento.
5. La aplicación de un recubrimiento nanoparticulado sobre una dispersión de
pigmento permite aumentar la TSR (porcentaje de energía irradiada que es
reflejada por un objeto) del mismo y, por tanto, su capacidad de reflejar el calor.
6. La incorporación del pigmento con alta reflectividad en una pintura en base agua
como recubrimiento de un tejado metálico, favorece la eficiencia energética del
prototipo de caseta testado.
Pigmento multifuncional (con capacidad de almacenamiento térmico y alta reflexión en
el NIR)
7. El proceso de impregnación capilar (sobre pigmento, empleando hexadecano
como PCM) seguido de la aplicación de un recubrimiento nanoparticulado
permite la obtención de un recubrimiento multifuncional (con capacidad de
almacenamiento térmico y alta reflectancia en el NIR).
8. El pigmento multifuncional incorporado en una pintura en base agua como
recubrimiento de un tejado metálico, favorece la eficiencia energética del
prototipo de caseta testado. Así mismo, se ha comprobado que más del 75% de
la reducción de temperatura procede del efecto reflejante del pigmento debido a
la fina capa de pintura aplicada sobre la chapa. El efecto de reflectividad en el

Resumen global de los hallazgos │142
____________________________________________________________________________
NIR del pigmento proporciona un efecto a nivel superficial que se activa con la
radiación solar mientras que el efecto de almacenamiento térmico es un efecto a
nivel de material que se activa con los cambios de temperatura.


8. CONCLUSIONES Y PERSPECTIVAS DE FUTURO
8.1. Conclusiones.
8.2. Perspectivas de futuro.

Conclusiones y perspectivas de futuro │145
____________________________________________________________________________
8.1. Conclusiones
Las conclusiones más importantes a la que ha conducido el desarrollo y posterior
validación de pigmentos cerámicos multifuncionales orientados a la mejora de la
eficiencia energética en edificación, son las siguientes:
1. Se ha demostrado la capacidad de fabricar un pigmento con capacidad de
almacenamiento térmico y alta reflexión en el infrarrojo, que mejora la
eficiencia energética de los edificios una vez disperso en las matrices adecuadas.
Este pigmento es de bajo coste y presenta una multifuncionalidad no existente en
el mercado.
2. El proceso de impregnación desarrollado, permite adsorber un material cambio
de fase en la superficie del pigmento siendo, además, un proceso escalable
industrialmente tal y como se ha demostrado en la fabricación de 5kg/batch de
pigmento en una planta piloto diseñada para tal fin.
3. El diseño de una metodología adecuada permite evaluar la eficiencia de
pigmentos altamente reflejantes en el infrarrojo cercano. Dicha metodología
debe aplicarse a una matriz concreta y debe tener en cuenta la TSR (Total Solar
Reflectance) y la coordenada de color L (luminosidad) de los sistemas
preparados con diferentes porcentajes de pigmento.
4. El proceso de aplicación de un recubrimiento nanoparticulado sobre una
dispersión de pigmento permite aumentar la TSR (porcentaje de energía
irradiada que es reflejada por un objeto) del mismo y, por tanto, su capacidad de
reflejar el calor.

Conclusiones y perspectivas de futuro │146
____________________________________________________________________________
7.2. Perspectivas de futuro
A lo largo de este trabajo de investigación se han ido adquiriendo nuevas
competencias que hacen posible la continuidad del proyecto y que promueve nuevas
líneas de investigación en torno a la temática estudiada.
A continuación se detallan algunas de las ideas que han surgido durante este trabajo
y que forman parte de proyectos que actualmente se encuentran en curso:
- Desarrollo de pigmentos multifuncionales a partir de otros pigmentos con
estructuras diferentes al azul ultramar.
Se plantea el desarrollo de las funcionalidades adquiridas en otro tipo de soporte.
La estructura de azul ultramar, solo proporciona tres colores: rosa, violeta o azul.
La incorporación de funcionalidades en pigmentos de otros colores (o incluso en
el caso de un material de relleno no colorante), proporcionaría un abanico mayor
de aplicaciones.
- Desarrollo de pigmentos con otras funcionalidades para aplicaciones diferentes
al sector edificación.
En el contexto del proyecto europeo Nanopigmy1 se han estudiado otras
funcionalidades a través del desarrollo de recubrimientos sobre el pigmento.
Algunos ejemplos son: antibacteria, anticorrosivo, autolimpiable. El desarrollo
de estos pigmentos, partiendo de cualquier tipo de pigmento base, ampliaría
radicalmente la aplicabilidad de los mismos. Un ejemplo de aplicación diferente
estudiada en el marco del proyecto Nanopigmy es el sector automoción.
1 More than color: Applying nanotechnologies for the multifunctional ceramic pigments development
(FP7- Grant Agreement: 280393).


Bibliografía │149
_____________________________________________________________________________
Abhat, A. Development of a modular heat exchanger with an integrated latent heat
storage. Report no. BMFT FBT 81-050. Germany. Ministry of Science and Technology
Bonn (1981).
Abdul Mujeebu, M., Ashraf, N. & Alsuwayigh, A. H. Effect of nano vacuum insulation
panel and nanogel glazing on the energy performance of office building. App. Energy
173, 141–151 (2016).
Albinati, A. & Willis, B. T. M. The Rietveld Method in neutron and X-ray powder diffraction.
J. Appl. Cryst., 15, 361–374 (1982).
Aranzabe, E., Villasante, P. M., March, R., Arriortua, M. I., Larrañaga, A. & Aranzabe,
A. More than color: pigments with thermal storage capacity; processing and degradation
behavior. Adv. Mat. Phy. Chem. 5, 171-184 (2015).
Aranzabe, E., Arriortua, M. I., Larrañaga, A., Villasante, P. M., Aranzabe, A. & March,
R. Easily scalable production process for a pigment having thermal storage capacity.
Am. J. Chem. App. 2-4, 98-105 (2015).
Aranzabe, E., Villasante, P. M., March, R., Arriortua, M. I., Larrañaga, A. & Aranzabe,
A. Preparation and characterization of high NIR-reflective pigments based in
ultramarine blue. Energy Build. 126, 170–176 (2016).
Aranzabe, E., Arriortua, M. I., Aranzabe, A., Larrañaga, A., Villasante, P. M. & March,
R. Fabrication and stability of hexadecane/pigment composite for construction sector
based on ultramarine blue, Sustain. Energy Build. (SEB-15), Lisbon, Portugal. Oral
Contribution (2015).
Aranzabe, E. Arriortua, M. I., Aranzabe, A., Larrañaga, A., Villasante, P. M. & March,
R. Ultramarine blue pigment with thermal storage capability for its use in buildings,
International Conference on Advanced Building Skins, Bern, Switzerland. Oral
Contribution (2015).
Aste, N., Caputo, P., Buzzetti, M. & Fattore, M. Energy efficiency in buildings: What
drives the investments? The case of Lombardy Region. Sust. Cities Soc. 20, 27–37
(2016).
Bibliografía │150
_____________________________________________________________________________
ASTM D 1621–00. Standard Test Method for Compressive Properties Of Rigid Cellular
Plastics. This standard is copyrighted by ASTM International, 100 Barr Harbor Drive,
PO Box C700, West Conshohocken, PA 19428-2959.
Bao, W., Ma, F., Zhang, Y., Hao, X., Deng, Z., Zou, X. & Gao, W. Synthesis and
characterization of Fe3+
doped Co0.5Mg0.5Al2O4 inorganic pigments with high near-
infrared reflectance. Powder Technol. 292, 7–13 (2016).
Bax, L., Cruxent, J. & Komornicki, J., Advanced materials for energy efficient
buildings. Key to innovation integrated solution. Innovative chemistry for energy
efficiency of buildings in smart cities. Cefic. Eur. Chem. Ind. Coun. (2013).
Biswas, K., Shrestha, S. S., Bhandari, M. S. & Desjarlais, A. O. Insulation materials for
commercial buildings in North America: An assessment of lifetime energy and
environmental impacts. Energy Build. 112, 256–269 (2016).
Bruno, F., Belusko, M., Liu, M. & Tay, N. H. S. Using solid-liquid phase change
materials (PCMs) in thermal energy storage systems. Adv. Therm. Energy Stor. Sys. 4,
201–246 (2015).
Buddhi, D. & Sawhney, R. L. Proceedings on thermal energy storage and energy
conversion (1994).
Carbonari, A., De Grassi, M., Di Perna, C. & Principi, P. Numerical and experimental
analyses of PCM containing sandwich panels for prefabricated walls. Energy Build. 38,
472–483 (2006).
Carl Zeiss SMT-Nano Technology division. Instruction manual of Ultra Gemini-II de
Carl Zeiss SMT electronic microscopy (2010).
Celik, S., Family, R. & Menguc, M. P. Analysis of perlite and pumice based building
insulation materials. J. Build. Eng. 6, 105–111 (2016).
Cellat, K., Beyhan, B., Kazanci, B., Konuklu, Y. & Paksoy, H. Direct incorporation of
butyl stearate as phase change material into concrete for energy saving in buildings. J.
Clean Energy Tech. 5, 1, 64–68 (2017).
Bibliografía │151
_____________________________________________________________________________
Chabriac, P. A., Gourdon, E., Gle, P., Fabbri, A. & Lenormand, H. Agricultural by-
products for building insulation: Acoustical characterization and modeling to predict
micro-structural parameters. Constr. Build. Mater. 112, 158–167 (2016).
Charlsson, B., Stymme, H. & Wattermark, G. An incongruent heat of fusion system
CaCl2·6H2O made congruent through modification of chemical composition of the
system. Sol. Energy 23, 333–350 (1979).
Chena, Y., Shih, Y. & Yu, Y. Stearyl alcohol modified expanded graphite / paraffin
phase change composite. Int. J. Appl. Sci. Eng. 11, 227-233 (2013).
Chua, K. J., Chou, S. K., Yang, W. M. & Yan, J. Achieving better energy-efficient air
conditioning – A review of technologies and strategies. App. Energy 104, 87–104
(2013).
Common carbon metric for measuring energy use & reporting greenhouse gas emissions
from building operations. Sustain. Build. Clim. Ini. (2010).
Cooper, M. J. The Analysis of powder diffraction data. Acta Cryst., A38, 264–269
(1982).
Cui, Y., Xie, J., Liu, J. & Pan, S. Review of phase change materials integrated in
building walls for energy saving. Procedia Eng. 121, 763–770 (2015).
D׳Agostino, D. Assessment of the progress towards the establishment of definitions of
Nearly Zero Energy Buildings (nZEBs) in European Member States. J. Build. Eng. 1,
20–32 (2015).
De Gracia, A. & Cabeza, L. F. Phase change materials and thermal energy storage for
buildings. Energy Build. 103, 414–419 (2015).
Directive 2009/28/EC of the European Parliament and of the Council of the 23 April
2009 on the promotion of the use of energy from renewable sources and amending and
subsequently repealing Directives2001/77/EC and 2003/30/EC (2009).
Directive 2010/31/EU of the European Parliament and of the Council of 19 May 2010
on the energy performance of buildings. Official Journal of the European Union.
L153/13 (2010).
Bibliografía │152
_____________________________________________________________________________
Directive 2012/27/EU of the European Parliament and of the Council of 25 October
2012 on energy efficiency, amending Directives 2009/125/EC and 2010/30/EU and
repealing Directives 2004/8/EC and 2006/32/EC Text with EEA relevance (2012).
European Commission, EUR 24283-energy-efficient Buildings PPP Multiannual
Roadmap and Longer Term Strategy, 2010, http://dx.doi.org/10.2777/10074.
Luxembourg.
EVE (Ente Vasco de la Energía). Estrategia Energética de Euskadi 2020 (2015).
Faivre, C., Bellet, D. & Dolino, G. Phase transitions of fluids confined in porous silicon:
a differential calorimetry investigation. Euro. Phys. J. B 7, 19–36 (1999).
Fang, G., Chen, Z. & Li, H. Synthesis and properties of microencapsulated paraffin
composites with SiO2 shell as thermal energy storage materials. Chem. Eng. J. 163,
154–159 (2010).
Faraji, M., Alami, M. E. & Najam, M. Thermal Control of Building using latent heat
storage south wall. J. Math. Comput. Sci. 10, 212–227 (2014).
Faulkner, E. B. & Schwartz, R. J. High Performance Pigments, 2nd Edition. ISBN: 978-
3-527-31405-8 (2009).
Feldman, D., Banu, D., Hawes, D. & Ghanbari, E. Obtaining an energy storing building
material by direct incorporation of an organic phase change material in gypsum
wallboard. Sol. Energy Mater. 22, 231–242 (1991).
Fleet, M. E. & Liu, X. X-ray absorption spectroscopy of ultramarine pigments: A new
analytical method for the polysulfide radical anion S3− chromophore. Spectrochim.
Acta Part B At. Spectrosc. 65, 75–79 (2010).
Geetha, N. B. & Velraj, R. Passive cooling methods for energy efficient buildings with
and without thermal energy storage – A review. Energ Educ Sci Tech-A. 29, 913–946
(2012).
Giraldo, C., Tobón, J. I. & Restrepo Baena, O. J. Ultramarine blue pigment: A non-
conventional pozzolan. Constr. Build. Mater. 36, 305–310 (2012).
Bibliografía │153
_____________________________________________________________________________
Giro-Paloma, J., Martínez, M., Cabeza, L. & Fernández, I. Types, methods, techniques,
and applications for microencapsulated phase change materials (MPCM): A review.
Renew. Sustain. Energy Rev. 53, 1059–1075 (2016).
Gobierno Vasco. PCTI Euskadi 2020: una estrategia de especialización inteligente
(2014).
Goitandia, A. M., Materiales con cambio de fase (PCMs) soportados en matrices
inorgánicas: preparación, estudio y aplicación. Tesis Doctoral. Universidad del País
Vasco (2015).
Goitandia, A. M., Beobide, G., Aranzabe, E. & Aranzabe, A. Development of content-
stable phase change composites by infiltration into inorganic porous supports. Sol.
Energy Mater. Sol. Cells 134, 318–328 (2015).
Griffiths, P. R. & Haseth, J. A. Fourier Transform Infrared Spectrometry. Wiley. ISBN:
978-0-471-19404-0. (1986).
Han, A., Ye, M., Liu, L., Feng, W. & Zhao, M. Estimating thermal performance of cool
coatings colored with high near-infrared reflective inorganic pigments: Iron doped
La2Mo2O7 compounds. Energy Build. 84, 698–703 (2014).
Han, A., Ye, M., Zhao, M., Liao, J. & Wu, T. Crystal structure, chromatic and near-
infrared reflective properties of iron doped YMnO3 compounds as colored cool
pigments. Dye. Pigment. 99, 527–530 (2013).
Han, A., Zhou, Y., Ye, M., Feng, S., Du, H. & Yang, R. Near-infrared reflectance and
thermal performance of Na2V6O16·xH2O nanoribbon as a novel cool brown pigment.
Dye. Pigment. 123, 242–247 (2015).
Hawes, D. W., Banu, D. & Feldman, D. Latent heat storage in concrete. Sol. Energy
Mater. 19, 335–348 (1989).
He, F., Wang, X. & Wu, D. New approach for sol–gel synthesis of microencapsulated
n-octadecane phase change material with silica wall using sodium silicate precursor.
Energy 67, 223–233 (2014).
Bibliografía │154
_____________________________________________________________________________
Hedayati, H. R., Sabbagh Alvani, A. A., Sameie, H., Salimi, R., Moosakhani, S.,
Tabatabaee, F. & Amiri Zarandi, A. Synthesis and characterization of
Co1−xZnxCr2−yAlyO4 as a near-infrared reflective color tunable nano-pigment. Dye.
Pigment. 113, 588–595 (2015).
Huang, T. C., Parrish, W. Accurate and rapid reduction of experimental X-ray data.
Appl. Phys. Lett., 27, 123–124 (1975).
Huang, L., Günther, E., Doetsch, C. & Mehling, H. Subcooling in PCM emulsions—
Part 1: Experimental. Thermoch. Acta 509, 93–99 (2010).
Instituto Nacional de Estadística (INE). Censo de Edificios (2011).
Instituto para la Diversificación y Ahorro de la Energía (IDAE). Guía técnica para la
rehabilitación de la envolvente térmica de los edificios. Soluciones con aislamiento de
poliuretano (2007).
Instituto para la diversificación y ahorro de energía (IDAE). Análisis del consumo
energético del sector residencial en España. Dpto.Planif. Est. ISBN-13: 978-84-96680-
39-5 (2014).
International Energy Agency. Implementing Agreement on Energy Conservation
through Energy Storage. Annex 17 “Advanced Thermal Energy Storage through Phase
Change Materials and Chemical Reactions – Feasibility Studies and Demonstration
projects”. Final Report (2009).
International Energy Agency. Key World Energy Statistics (2015).
International Energy Agency (IEA). State of the Art Review: Applying Energy Storage
in Building of the Future. Subtask A&B Report. Annex 23 (2013).
ISO 13320:2009. Particle size analysis by Laser diffraction methods (2009).
Jamekhorshid, A., Sadrameli, S. M. & Farid, M. A review of microencapsulation
methods of phase change materials (PCMs) as a thermal energy storage (TES) medium.
Renew. Sustain. Energy Rev. 31, 531–542 (2014).
Jenkins, R. y Snyder, R.L. Introduction to X-Ray Powder Diffractometry. John Wiley &
Sons. ISBN: 978-0-471-51339-1 (1996).
Bibliografía │155
_____________________________________________________________________________
Jeong, S., Jeon, J., Lee, J. & Kim, S. Optimal preparation of PCM/diatomite composites
for enhancing thermal properties. Int. J. Heat. Mass. Trans. 62, 711–717 (2013).
Jose, S., Prakash, A., Laha, S., Natarajan, S. & Reddy, M. L. Green colored nano-
pigments derived from Y2BaCuO5: NIR reflective. Dye. Pigment. 107, 118–126 (2014).
Jose, S., Jayaprakash, A., Laha, S., Natarajan, S., Nishanth, K. G. & Reddy, M. L. P.
YIn0.9Mn0.1O3–ZnO nano-pigment exhibiting intense blue color with impressive solar
reflectance. Dye. Pigment. 124, 120–129 (2016).
Karaipekli, A. & Sarı, A. Development and thermal performance of pumice/organic
PCM/gypsum composite plasters for thermal energy storage in buildings. Sol. Energy
Mater. Sol. Cells 149, 19–28 (2016).
Kedl, R. J. & Stovall, T. K. Activities in support of the wax-impregnated wallboard
concept. U.S. Department of Energy: thermal energy storage researches activity review.
New Orleans, Louisiana, USA (1989).
Khudhair, A. M. & Farid, M. M. A review on energy conservation in building
applications with thermal storage by latent heat using phase change materials. Energy
Convers. Manag. 45, 263–275 (2004).
Konstantinidou, C. V. Integration of thermal energy storage in buildings. The
University of Texas at Austin. Master Thesis. (2010).
Konuklu, Y., Ersoy, O. & Gokce, O. Easy and industrially applicable impregnation
process for preparation of diatomite-based phase change material nanocomposites for
thermal energy storage. App.Therm. Eng. 91, 759–766 (2015).
Kumari, L. S., Rao, P. P., Radhakrishnan, A. N. P., James, V., Sameera, S. & Koshy, P.
Brilliant yellow color and enhanced NIR reflectance of monoclinic BiVO4 through
distortion in VO43-
tetrahedral. Sol. Energy Mater. Sol. Cells 112, 134–143 (2013).
Kuznik, F., David, D., Johannes, K. & Roux, J. A review on phase change materials
integrated in building walls. Renew. Sustain. Energy. Rev. 15 (1), 379–391 (2012).
Lee, T., Hawes, D. W., Banu, D. & Feldman, D. Control aspects of latent heat storage
and recovery in concrete. Sol. Energy Mater. Sol. Cells 62, 217–237 (2000).
Bibliografía │156
_____________________________________________________________________________
Li, H., Chen, H., Li, X. & Sanjayan, J. G. Development of thermal energy storage
composites and prevention of PCM leakage. App. Energy. 135, 225–233 (2014).
Li, C., Hong, T. & Yan, D. An insight into actual energy use and its drivers in high-
performance buildings. App. Energy 131, 394–410 (2014).
Li, X., Sanjayan, J. G. & Wilson, J. L. Fabrication and stability of form-stable
diatomite/paraffin phase change material composites. Energy Build. 76, 284–294
(2014).
Liang, S., Li, Q., Zhu, Y., Chen, K., Tian, C., Wang, J. & Bai, R. Nanoencapsulation of
n-octadecane phase change material with silica shell through interfacial hydrolysis and
polycondensation in miniemulsion. Energy 93, 1684–1692 (2015).
Liu, L., Han, A., Ye, M. & Feng, W. The evaluation of thermal performance of cool
coatings colored with high near-infrared reflective nano-brown inorganic pigments:
Magnesium doped ZnFe2O4 compounds. Sol. Energy 113, 48–56 (2015).
Liu, R., Zhang, F., Su, W., Zhao, H. & Wang, C. Impregnation of porous mullite with
Na2SO4 phase change material for thermal energy storage. Sol. Energy Mater. Sol.
Cells. 134, 268–274 (2015).
Ma, Y., Sun, S., Li, J. & Tang, G. Preparation and thermal reliabilities of
microencapsulated phase change materials with binary cores and acrylate-based
polymer shells. Thermoch. Acta 588, 38–46 (2014).
Mastrapostoli, E., Karlessi, T., Pantazaras, A., Kolokotsa, D., Gobakis, K. &
Santamouris, M. On the cooling potential of cool roofs in cold climates: Use of cool
fluorocarbon coatings to enhance the optical properties and the energy performance of
industrial buildings. Energy Build. 69, 417–425 (2014).
Memon, S. A. Phase change materials integrated in building walls: A state of the art
review. Renew. Sustain. Energy Rev. 31, 870–906 (2014).
Memon, S. A., Lo, T. Y., Barbhuiya, S. A. & Xu, W. Development of form-stable
composite phase change material by incorporation of dodecyl alcohol into ground
granulated blast furnace slag. Energy Build. 62, 360–367 (2013).
Bibliografía │157
_____________________________________________________________________________
Mettler Toledo. Instruction manual of DSC HP DSC827.
Mondal, S. Phase change materials for smart textiles–An overview. App.Therm. Eng.
28, 1536–1550 (2008).
Morishige, K. & Kawano, K. Freezing and melting of water in a single cylindrical pore:
the pore-size dependence of freezing and melting behavior. J. Chem. Phy. 110, 4867–
4872 (1999).
Naciones Unidas (1998). Protocolo de Kioto de la Convención Marco de las Naciones
Unidas sobre el Cambio Climático.
Nejat, P., Jomehzadeh, F., Taheri, M. M., Gohari, M. & Abd. Majid, M. Z. A global
review of energy consumption, CO2 emissions and policy in the residential sector (with
an overview of the top ten CO2 emitting countries). Renew. Sustain. Energy Rev. 43,
843–862 (2015).
Nomura, T., Okinaka, N. & Akiyama, T. Impregnation of porous material with phase
change material for thermal energy storage. Mater. Chem. Phys. 115, 846–850 (2009).
Oliver, A. Integración de materiales de cambio de fase en placas de yeso reforzadas con
fibras de polipropileno. Aplicación a sistemas de refrigeración y calefacción pasivos
para almacenamiento de calor latente en edificios. Tesis Doctoral. E.T.S. Arquitectura,
Universidad Politécnica de Madrid (2009).
Oró, E., De Gracia, A., Castell, A., Farid, M. & Cabeza, L. Review on phase change
materials (PCMs) for cold thermal energy storage applications. App. Energy 99, 513–33
(2012).
Oya, T., Nomura, T., Tsubota, M., Okinaka, N. & Akiyama, T. Thermal conductivity
enhancement of erythritol as PCM by using graphite and nickel particles. App. Therm.
Eng. 61, 825–828 (2013).
Pérez-Lombard, L., Ortiz, J. & Pout, C. A review on buildings energy consumption
information. Energy Build. 40, 394–398 (2008).
Petter Jelle, B. Start-Up Creation. Elsevier, 119–181 (2016).
Bibliografía │158
_____________________________________________________________________________
Py, X., Olives, R. & Mauran, S. Paraffin/porous-graphite-matrix composite as a high
and constant power thermal storage material. Int. J. Heat Mass Trans. 44, 2727–2737
(2001).
Ramírez-Villegas, R., Eriksson, O. & Olofsson, T. Assessment of renovation measures
for a dwelling area – impacts on energy efficiency and building certification. Build.
Environ. 97, 26–33 (2015).
Raoux, S. & Ibm, T. J. Phase change memory (PCM) materials and devices. Adv. Non-
Vol. Mem. Sto. Tech. 1, 161–199 (2014).
Raj, A. K. V., Prabhakar Rao, P., Sameera, S. & Divya, S. Pigments based on terbium-
doped yttrium cerate with high NIR reflectance for cool roof and surface coating
applications. Dye. Pigment. 122, 116–125 (2015).
Real Decreto 2429/79, de 6 de Julio. Norma Básica de la Edificación NBE-CT79 sobre
Condiciones Térmicas en los edificios (1979).
Real Decreto 314/2006, de 17 de marzo, por el que se aprueba el Código Técnico de la
Edificación (2006).
Revel, G. M., Martarelli, M., Emiliani, M., Gozalbo, A., Orts, M. J., Bengoechea, M.
A., Delgado, L. G., Gaki, A., Katsiapi, A., Taxiarchou, M., Arabatzis, I., Fasaki, I. &
Hermanns, S. Cool products for building envelope – Part I: Development and lab scale
testing. Sol. Energy 105, 770–779 (2014).
Rietveld, H. M. Line profiles of neutron powder-diffraction peaks for structure
refinement. Acta Cryst. 22(1), 151–152 (1967).
Rietveld, H. M. A profile refinement method for nuclear and magnetic structures. J.
Appl.Cryst. 2, 65–71 (1969).
Rodríguez-Carvajal, J. Recent advances in magnetic structure determination by neutron
powder diffraction. Phys. B Condens. Matter 192, 55–69 (1993).
Rodríguez-Carvajal, J. Rietveld Pattern Matching Analysis of Powder Patterns.
Fullprof. (1994).
Bibliografía │159
_____________________________________________________________________________
Rodríguez-Carvajal, J. Recent Developments of the Program FullProf. Commission on
Powder Diffraction (IUCr) Newsletter. 26, 12–19 (2001).
Rodriguez-Ubinas, E., Ruiz-Valero, L., Vega, S. & Neila, J. Applications of phase
change material in highly energy-efficient houses. Energy Build. 50, 49–62 (2012).
Roman, K. K., O’Brien, T., Alvey, J. B. & Woo, O. Simulating the effects of cool roof
and PCM (phase change materials) based roof to mitigate UHI (urban heat island) in
prominent US cities. Energy 96, 103–117 (2016).
Ruparathna, R., Hewage, K. & Sadiq, R. Improving the energy efficiency of the existing
building stock: A critical review of commercial and institutional buildings. Renew.
Sustain. Energy Rev. 53, 1032–1045 (2016).
Sakata M., Cooper M.J. An analysis of the Rietveld refinement method. J. Appl. Cryst.,
12, 554–563 (1979).
Salunkhe, P. B. & Shembekar, P. S. A review on effect of phase change material
encapsulation on the thermal performance of a system. Renew. Sustain. Energy Rev. 16,
5603–5616 (2012).
Sarı, A., Alkan, C., Karaipekli, A. & Uzun, O. Microencapsulated n-octacosane as
phase change material for thermal energy storage. Sol. Energy 83, 1757–1763 (2009).
Sarı, A. & Karaipekli, A. Preparation, thermal properties and thermal reliability of
palmitic acid/expanded graphite composite as form-stable PCM for thermal energy
storage. Sol. Energy Mater. Sol. Cells 93, 571–576 (2009).
Scherrer, P. Bestimmung der Grosse und der inneren Struktur von Kolloidteilchen
mittels Rontgenstrahlen. Nachr Ges Wiss Gottingen. 26, 98–100 (1918).
Schiavoni, S., D׳Alessandro, F., Bianchi, F. & Asdrubali, F. Insulation materials for the
building sector: A review and comparative analysis. Renew. Sustain. Energy Rev. 62,
988–1011 (2016).
Shapiro, M. Development of the enthalpy storage materials, mixture of methyl stearate
and methyl palmitate. Florida Solar Energy Center (1989).
Bibliografía │160
_____________________________________________________________________________
Shapiro, M. Development of the enthalpy storage materials, mixture of capric acid and
lauric acid with fire retardants. Florida Solar Energy Center (1989).
Sharma, A., Tyagi, V. V., Chen, C. R. & Buddhi, D. Review on thermal energy storage
with phase change materials and applications. Renew. Sustain. Energy Rev. 13, 318–345
(2009).
Sierra-Pérez, J., Boschmonart-Rives, J., Dias, A. C. & Gabarrell, X. Environmental
implications of the use of agglomerated cork as thermal insulation in buildings. J.
Clean. Prod. 126, 97–107 (2016).
Soares, N., Costa, J. J., Gaspar, A. R. & Santos, P. Review of passive PCM latent heat
thermal energy storage systems towards buildings’ energy efficiency. Energy Build. 59,
82–103 (2013).
Song, J., Qin, J., Qu, J., Song, Z., Zhang, W., Xue, X., Shi, Y. & Zhang, T. The effects
of particle size distribution on the optical properties of titanium dioxide rutile pigments
and their applications in cool non-white coatings. Sol. Energy Mater. Sol. Cells 130,
42–50 (2014).
Sotomayor, M. E., Krupa, I., Várez, A. & Levenfeld, B. Thermal and mechanical
characterization of injection moulded high density polyethylene/paraffin wax blends as
phase change materials. Renew. Energy 68, 140–145 (2014).
Soumya, S., Mohamed, A. P., Mohan, K. & Ananthakumar, S. Enhanced near-infrared
reflectance and functional characteristics of Al-doped ZnO nano-pigments embedded
PMMA coatings. Sol. Energy Mater. Sol. Cells 143, 335–346 (2015).
Stojanovic, Z. Determination of particle size distributions by laser diffraction. Review
paper. New Mat. 67, 11–20 (2012).
Stuart, B. Infrared spectroscopy; Fundamentals and applications. John Wiley and Sons,
LTD. West Sussex (2004).
Sun, Z., Zhang, Y., Zheng, S., Park, Y. & Frost, R. L. Preparation and thermal energy
storage properties of paraffin/calcined diatomite composites as form-stable phase
change materials. Thermoch. Acta 558, 16–21 (2013).
Bibliografía │161
_____________________________________________________________________________
Tan, B., Yavuz, Y., Otay, E. N. & Çamlıbel, E. Optimal selection of energy efficiency
measures for energy sustainability of existing buildings. Comput. Oper. Res. 66, 258–
271 (2015).
Transition to Sustainable Buildings Strategies and Opportunities to 2050. International
Energy Agency (IEA). ISBN: 978-92-64-20241-2 (2012).
Tyagi, V. V. & Buddhi, D. PCM thermal storage in buildings: A state of art. Renew.
Sustain. Energy Rev. 11, 1146–1166 (2007).
Tyagi, V. V., Kaushik, S. C., Tyagi, S. K. & Akiyama, T. Development of phase change
materials based microencapsulated technology for buildings: A review. Renew. Sustain.
Energy Rev. 15, 2, 1373–1391 (2011).
Van der Maas, J. H. Basic infrared spectroscopy. Heyden and Sons, LTD, Spectrum
House, London NW (1972).
Vieites, E., Vassileva, I. & Arias, J. E. European Initiatives Towards Improving the
Energy Efficiency in Existing and Historic Buildings. Energy Proc. 75, 1679–1685
(2015).
Wang, J. L., Li, Y. Q., Byon, Y. J., Mei, S. G. & Zhang, G. L. Synthesis and
characterization of NiTiO3 yellow nano pigment with high solar radiation reflection
efficiency. Powder Technol. 235, 303–306 (2013).
Wiles D.B. & Young R.A, A new computer program for Rietveld analysis of X-ray
powder diffraction patterns. J. Appl. Cryst., 14, 149–151 (1981).
Will, G., Parrish, W., Huang, T. C. Crystal-structure refinement by profile fitting and
least-squares analysis of powder diffractometer data. J. Appl. Cryst., 16, 611–622
(1983).
Xu, B. & Li, Z. Paraffin/diatomite composite phase change material incorporated
cement-based composite for thermal energy storage. App. Energy 105, 229–237 (2013).
Xue, X., Qin, J., Song, J., Qu, J., Shi, Y., Zhang, W., Song, Z., Jiang, L., Li, J., Guo, H.
& Zhang, T. The methods for creating energy efficient cool gray building coatings—
Bibliografía │162
_____________________________________________________________________________
Part I: Preparation from white and black pigments. Sol. Energy Mater. Sol. Cells 130,
587–598 (2014).
Young R. A., Mackie P. E. & Dreele, R. B. Application of the pattern-fitting structure-
refinement method of X-ray powder diffractometer patterns. J. Appl. Cryst., 10, 262–
269 (1977).
Young R.A. & Wiles D.B. Profile shape functions in Rietveld refinements. J. Appl.
Cryst., 15, 430–438 (1982).
Young R. A., Sakthivel A. Bimodal distributions of profile-broadening effects in
Rietveld refinement. J. Appl. Cryst., 21, 416–425 (1982).
Young, R. A. The Rietveld method. International Union of Crystalography-Oxford
Science Publications, Oxford (1995).
Zalba, B., Marín, J., Cabeza, L. F. & Mehling, H. Review on thermal energy storage
with phase change: materials, heat transfer analysis and applications. App. Therm. Eng.
23, 251–283 (2003).
Zhang, H. L., Baeyens, J., Degrève, J., Cáceres, G., Segal, R. & Pitié, F. Latent heat
storage with tubular-encapsulated phase change materials (PCMs). Energy 76, 66-72
(2014).
Zhang, M., Medina, M. A. & King, J. B. Development of a thermally enhanced frame
wall with phase-change materials for on-peak air conditioning demand reduction and
energy savings in residential buildings. Int. J. Energy Res. 29, 795–809 (2005).
Zhang, D., Tian, S. & Xiao. D. Experimental study on the phase change behavior of
phase change material confined in pores. Sol. Energy 81, 653–660 (2007).
Zhang, H., Wang, X. & Wu, D. Silica encapsulation of n-octadecane via sol–gel
process: A novel microencapsulated phase-change material with enhanced thermal
conductivity and performance. J. Coll. Inter. Sci. 343, 246–255 (2010).
Zhao, F., Lee, S. H. & Augenbroe, G. Reconstructing building stock to replicate energy
consumption data. Energy Build. 117, 301–312 (2015).
Bibliografía │163
_____________________________________________________________________________
Zhao, X., Zhang, Y., Huang, Y., Gong, H. & Zhao, J. Synthesis and characterization of
neodymium doped yttrium molybdate high NIR reflective nano pigments. Dye.
Pigment. 116, 119–123 (2015).
Zhou, D., Zhao, C. Y. & Tian, Y. Review on thermal energy storage with phase change
materials (PCMs) in building applications. App. Energy 92, 593–605 (2012).
Zhu, M., Ji, R., Li, Z., Wang, H., Liu, L. & Zhang, Z. Preparation of glass ceramic
foams for thermal insulation applications from coal fly ash and waste glass. Constr.
Build. Mater. 112, 398–405 (2016).
Zou, J., Zhang, P., Liu, C. & Peng, Y. Highly dispersed (Cr, Sb)-co-doped rutile
pigments of cool color with high near-infrared reflectance. Dye. Pigment. 109, 113–119
(2014).
Bibliografía │164
_____________________________________________________________________________
Links
http://www.colourcoil.com/radiativeproperties.html. Último acceso: Noviembre 2016.
http://datateca.unad.edu.co/contenidos/401539/exe2%20de%20agosto/leccion_42_instr
umentacion_en_espectroscopia.html. Último acceso: Septiembre 2016.
http://dfc-economiahistoria.blogspot.com/2011/12/la-insostenibilidad-del-
paradigma.html. Último acceso: Septiembre 2016.
http://www.energiayrehabilitacion.com/sostenibilidad/consumo-energetico/consumo-
de-energia-segun- sectores/. Último acceso: Septiembre 2016.
http://www.inkworldmagazine.com/issues/2003-08/view_features/high-performance-
pigments-105024#sthash.mCv8xiVM.dpuf. Último acceso: Noviembre 2016.
http://www.intechopen.com/books/biofuels-economy-environment-and-
sustainability/the-possibility-of-future-biofuels-production-using-waste-carbon-dioxide-
and-solar-energy. Último acceso: Octubre 2016.
http://www.ipcc.ch/ipccreports/tar/wg3/index.php?idp=96. Último acceso: Octubre
2016.
http://www.micronal.de/portal/basf/ien/dt.jsp?setCursor=1_290823. Último acceso:
Octubre 2016.
http://www.terra.org/categorias/articulos/emisiones-de-gases-de-efecto-invernadero-en-
espana-1990-2012. Último acceso: Octubre 2016.
https://en.wikipedia.org/wiki/Energy_hierarchy. Último acceso: Noviembre 2016.


10. TÉCNICAS INSTRUMENTALES

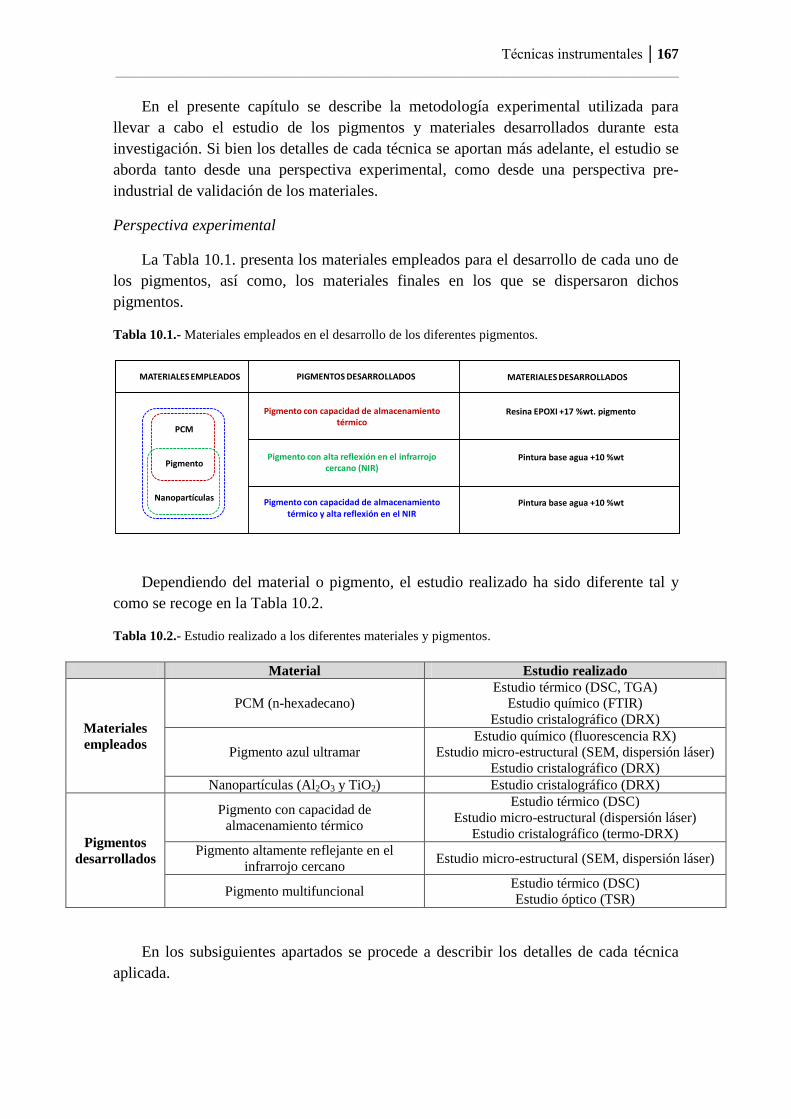
Técnicas instrumentales │167
_____________________________________________________________________________
En el presente capítulo se describe la metodología experimental utilizada para
llevar a cabo el estudio de los pigmentos y materiales desarrollados durante esta
investigación. Si bien los detalles de cada técnica se aportan más adelante, el estudio se
aborda tanto desde una perspectiva experimental, como desde una perspectiva pre-
industrial de validación de los materiales.
Perspectiva experimental
La Tabla 10.1. presenta los materiales empleados para el desarrollo de cada uno de
los pigmentos, así como, los materiales finales en los que se dispersaron dichos
pigmentos.
Tabla 10.1.- Materiales empleados en el desarrollo de los diferentes pigmentos.
Dependiendo del material o pigmento, el estudio realizado ha sido diferente tal y
como se recoge en la Tabla 10.2.
Tabla 10.2.- Estudio realizado a los diferentes materiales y pigmentos.
Material Estudio realizado
Materiales
empleados
PCM (n-hexadecano)
Estudio térmico (DSC, TGA)
Estudio químico (FTIR)
Estudio cristalográfico (DRX)
Pigmento azul ultramar
Estudio químico (fluorescencia RX)
Estudio micro-estructural (SEM, dispersión láser)
Estudio cristalográfico (DRX)
Nanopartículas (Al2O3 y TiO2) Estudio cristalográfico (DRX)
Pigmentos
desarrollados
Pigmento con capacidad de
almacenamiento térmico
Estudio térmico (DSC)
Estudio micro-estructural (dispersión láser)
Estudio cristalográfico (termo-DRX)
Pigmento altamente reflejante en el
infrarrojo cercano Estudio micro-estructural (SEM, dispersión láser)
Pigmento multifuncional Estudio térmico (DSC)
Estudio óptico (TSR)
En los subsiguientes apartados se procede a describir los detalles de cada técnica
aplicada.
PCM
Pigmento
Nanopartículas
Pigmento con capacidad de almacenamiento térmico
Pigmento con alta reflexión en el infrarrojo cercano (NIR)
Pigmento con capacidad de almacenamiento térmico y alta reflexión en el NIR
MATERIALES EMPLEADOS
Resina EPOXI +17 %wt. pigmento
Pintura base agua +10 %wt
Pintura base agua +10 %wt
PIGMENTOS DESARROLLADOS MATERIALES DESARROLLADOS

Técnicas instrumentales │168
_____________________________________________________________________________
10.1. Estudio químico
10.1.1. Espectroscopía de infrarrojo medio
La porción infrarroja del espectro electromagnético se divide en tres regiones; el
infrarrojo cercano, el infrarrojo medio y el lejano. El infrarrojo lejano (400–10 cm-1
) se
encuentra adyacente a la región de microondas, posee una baja energía y se emplea en
espectroscopía rotacional. El infrarrojo cercano (aprox. 14000–4000 cm-1
) excita
sobretonos o vibraciones armónicas, mientras que el infrarrojo medio (4000–400 cm-1
)
se emplea para estudiar las vibraciones fundamentales y la estructura rotacional
vibracional. Así, mediante la utilización del infrarrojo medio, es posible identificar los
grupos funcionales más importantes de los PCM.
Un espectrofotómetro infrarrojo mide la frecuencia de la luz infrarroja absorbida
por un compuesto. La Figura 10.1. muestra el esquema de funcionamiento de un
espectrofotómetro de infrarrojos1-3
.
(a) (b)
Figura 10.1.- (a) Esquema de un espectrofotómetro de infrarrojo4 y (b) equipo Perkin Elmer Spectrum
One.
El análisis de las muestras se ha realizado en un espectrómetro Perkin Elmer
Spectrum One en el intervalo de 450 a 4000 cm-1
, con una resolución de 4 cm-1
. El
procesado de datos se ha realizado mediante el software “Spectrum V2.00”.
La preparativa de muestra ha sido la siguiente: los materiales con cambio de fase
fundidos, se han soportado sobre pastillas de bromuro de potasio (KBr) preformadas.
1 Griffiths, P. R. & Haseth, J.A. Fourier Transform Infrared Spectrometry. Wiley (1986).
2 Stuart, B. Infrared spectroscopy; Fundamentals and applications. John Wiley and Sons, LTD. West
Sussex (2004). 3 Van der Maas, J. H. Basic infrared spectroscopy. Heyden and Sons, LTD, Spectrum House, London
NW (1972). 4 http://datateca.unad.edu/contenidos/401539//leccion_42_instrumentacion__espectroscopia.html.
Técnicas instrumentales │169
_____________________________________________________________________________
10.1.2. Fluorescencia Rayos X
La fluorescencia de rayos X se basa en la emisión que se produce en una muestra
cuando es irradiada con radiación X. El método más habitual utiliza tubos de rayos X
para excitar las muestras, que al absorber el haz primario emiten sus propios rayos X
característicos. Este método es uno de los más utilizados para la identificación
cualitativa de elementos con números atómicos superiores a 8. También se utiliza, a
menudo, para el análisis semicuantitativo y cuantitativo. Una de las ventajas
importantes de este método es que no es destructivo como la mayoría de las técnicas de
análisis elemental.
Un espectro de fluorescencia de rayos X (FRX) utiliza como fuente de radiación un
tubo de rayos X para provocar la emisión de rayos X secundarios de una muestra. La
radiación emitida por la muestra contiene las líneas de rayos X características de los
elementos que la componen. La dispersión de estos rayos X secundarios en un espectro
permite identificar los elementos presentes en la muestra. La intensidad de la línea
característica de rayos X está relacionada con la concentración del elemento que las
produce en la muestra analizada. Esto permite hacer análisis cuantitativos de la mayoría
de los elementos.
Para producir la emisión de rayos X de una muestra es preciso excitarla
previamente con radiación X primaria. En el proceso de excitación se crean huecos en
las capas más internas del átomo que pasan a ser ocupados por electrones de capas
superiores. Las transiciones electrónicas que se producen para ocupar las vacantes
creadas conllevan la emisión de rayos X secundarios.
La fuente de radiación primaria más común en FRX es un tubo de rayos X. Los
componentes principales de estos tubos son un filamento de wolframio y un ánodo o
anticátodo metálico introducidos en un tubo de vidrio a alto vacio. El filamento se
calienta mediante el paso de una corriente eléctrica, lo que produce una nube de
electrones. Estos son acelerados mediante un potencial negativo hacia el ánodo. La
rápida deceleración de estos electrones al interaccionar con los átomos del ánodo libera
energía en forma de rayos X, lo que produce un espectro continuo. El impacto de los
electrones puede también ionizar los átomos del ánodo expulsando electrones de las
capas más internas. Los electrones de capas más externas tienden a reemplazar las
vacantes creadas, emitiendo así rayos X con longitudes de onda características del
material del ánodo. El espectro de rayos X generado consiste en un continuo y un
conjunto de líneas características (Kα y Kβ). La radiación sale del tubo a través de una
ventana, que normalmente es de berilio.
Las medidas de fluorescencia de rayos X sobre el pigmento referencia se han
realizado en un equipo Bruker S8 Tiger 4K trabajando a 4 Kw y hasta 60 Kv y 170 mA.
Para la realización de la medida, se ha fabricado un pellet de pigmento prensado a 200
bar.
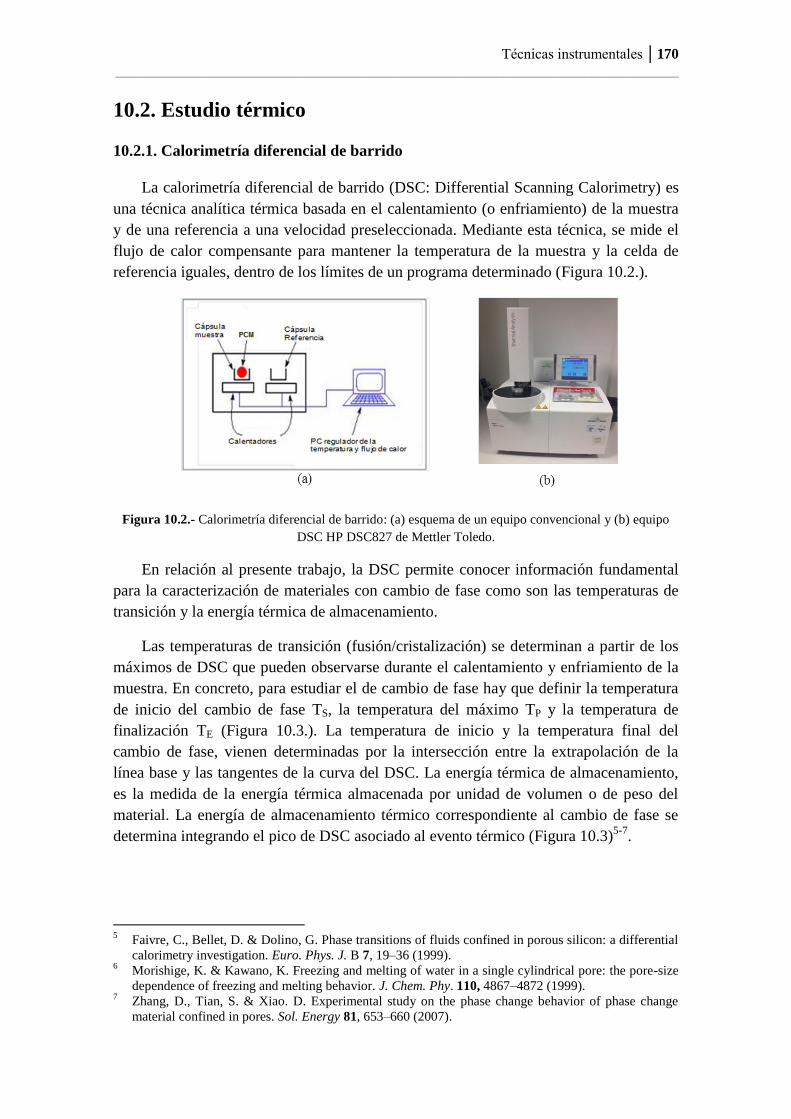
Técnicas instrumentales │170
_____________________________________________________________________________
10.2. Estudio térmico
10.2.1. Calorimetría diferencial de barrido
La calorimetría diferencial de barrido (DSC: Differential Scanning Calorimetry) es
una técnica analítica térmica basada en el calentamiento (o enfriamiento) de la muestra
y de una referencia a una velocidad preseleccionada. Mediante esta técnica, se mide el
flujo de calor compensante para mantener la temperatura de la muestra y la celda de
referencia iguales, dentro de los límites de un programa determinado (Figura 10.2.).
Figura 10.2.- Calorimetría diferencial de barrido: (a) esquema de un equipo convencional y (b) equipo
DSC HP DSC827 de Mettler Toledo.
En relación al presente trabajo, la DSC permite conocer información fundamental
para la caracterización de materiales con cambio de fase como son las temperaturas de
transición y la energía térmica de almacenamiento.
Las temperaturas de transición (fusión/cristalización) se determinan a partir de los
máximos de DSC que pueden observarse durante el calentamiento y enfriamiento de la
muestra. En concreto, para estudiar el de cambio de fase hay que definir la temperatura
de inicio del cambio de fase TS, la temperatura del máximo TP y la temperatura de
finalización TE (Figura 10.3.). La temperatura de inicio y la temperatura final del
cambio de fase, vienen determinadas por la intersección entre la extrapolación de la
línea base y las tangentes de la curva del DSC. La energía térmica de almacenamiento,
es la medida de la energía térmica almacenada por unidad de volumen o de peso del
material. La energía de almacenamiento térmico correspondiente al cambio de fase se
determina integrando el pico de DSC asociado al evento térmico (Figura 10.3)5-7
.
5 Faivre, C., Bellet, D. & Dolino, G. Phase transitions of fluids confined in porous silicon: a differential
calorimetry investigation. Euro. Phys. J. B 7, 19–36 (1999). 6 Morishige, K. & Kawano, K. Freezing and melting of water in a single cylindrical pore: the pore-size
dependence of freezing and melting behavior. J. Chem. Phy. 110, 4867–4872 (1999). 7 Zhang, D., Tian, S. & Xiao. D. Experimental study on the phase change behavior of phase change
material confined in pores. Sol. Energy 81, 653–660 (2007).
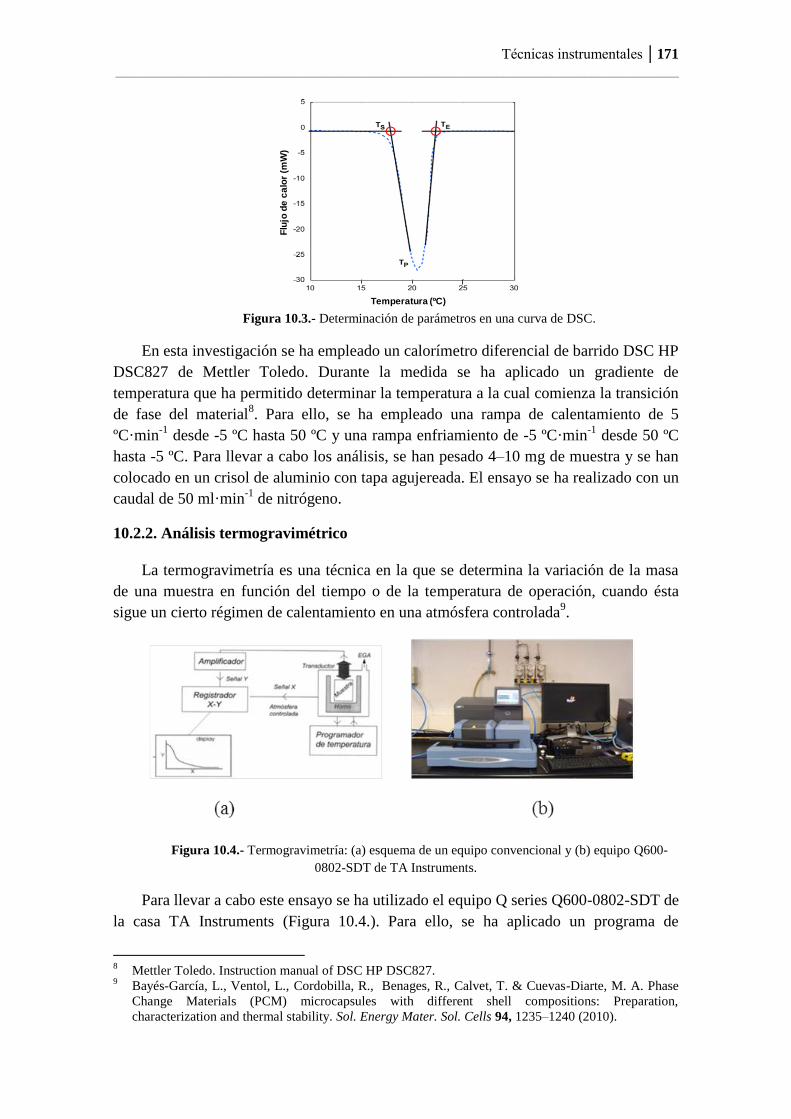
Técnicas instrumentales │171
_____________________________________________________________________________
Figura 10.3.- Determinación de parámetros en una curva de DSC.
En esta investigación se ha empleado un calorímetro diferencial de barrido DSC HP
DSC827 de Mettler Toledo. Durante la medida se ha aplicado un gradiente de
temperatura que ha permitido determinar la temperatura a la cual comienza la transición
de fase del material8. Para ello, se ha empleado una rampa de calentamiento de 5
ºC·min-1
desde -5 ºC hasta 50 ºC y una rampa enfriamiento de -5 ºC·min-1
desde 50 ºC
hasta -5 ºC. Para llevar a cabo los análisis, se han pesado 4–10 mg de muestra y se han
colocado en un crisol de aluminio con tapa agujereada. El ensayo se ha realizado con un
caudal de 50 ml·min-1
de nitrógeno.
10.2.2. Análisis termogravimétrico
La termogravimetría es una técnica en la que se determina la variación de la masa
de una muestra en función del tiempo o de la temperatura de operación, cuando ésta
sigue un cierto régimen de calentamiento en una atmósfera controlada9.
Figura 10.4.- Termogravimetría: (a) esquema de un equipo convencional y (b) equipo Q600-
0802-SDT de TA Instruments.
Para llevar a cabo este ensayo se ha utilizado el equipo Q series Q600-0802-SDT de
la casa TA Instruments (Figura 10.4.). Para ello, se ha aplicado un programa de
8 Mettler Toledo. Instruction manual of DSC HP DSC827.
9 Bayés-García, L., Ventol, L., Cordobilla, R., Benages, R., Calvet, T. & Cuevas-Diarte, M. A. Phase
Change Materials (PCM) microcapsules with different shell compositions: Preparation,
characterization and thermal stability. Sol. Energy Mater. Sol. Cells 94, 1235–1240 (2010).
Temperatura (ºC)
Flu
jo d
e c
alo
r (m
W)
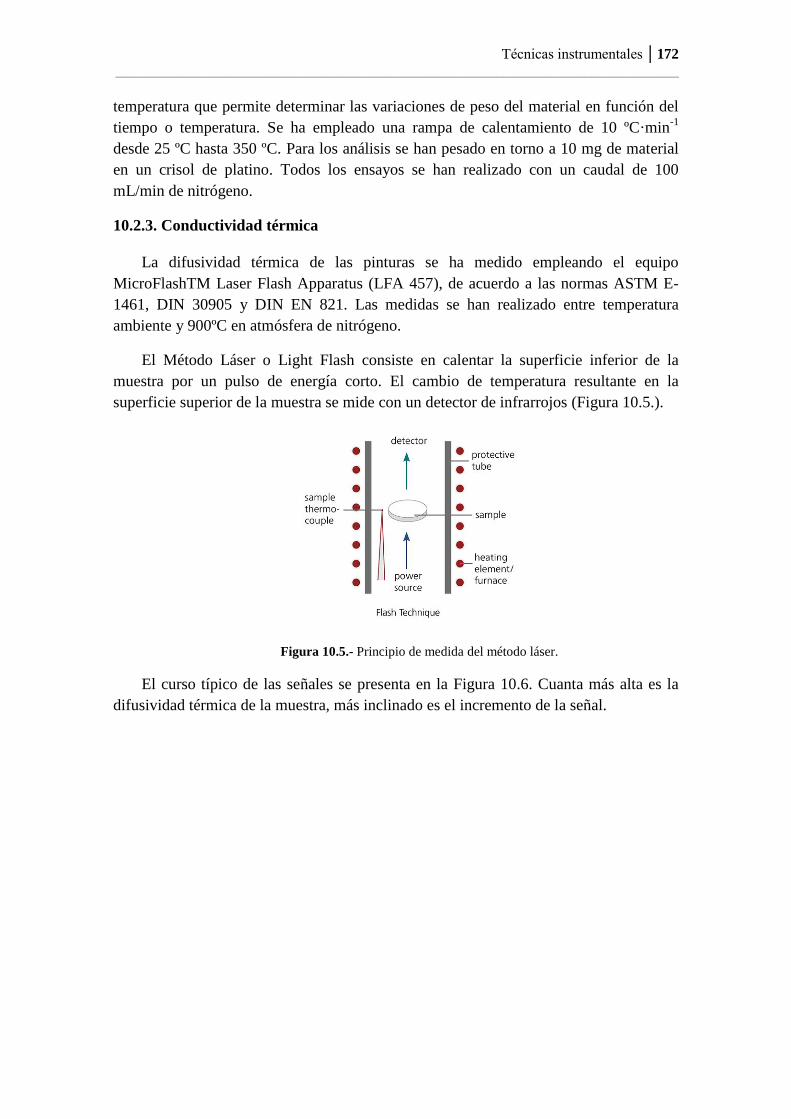
Técnicas instrumentales │172
_____________________________________________________________________________
temperatura que permite determinar las variaciones de peso del material en función del
tiempo o temperatura. Se ha empleado una rampa de calentamiento de 10 ºC·min-1
desde 25 ºC hasta 350 ºC. Para los análisis se han pesado en torno a 10 mg de material
en un crisol de platino. Todos los ensayos se han realizado con un caudal de 100
mL/min de nitrógeno.
10.2.3. Conductividad térmica
La difusividad térmica de las pinturas se ha medido empleando el equipo
MicroFlashTM Laser Flash Apparatus (LFA 457), de acuerdo a las normas ASTM E-
1461, DIN 30905 y DIN EN 821. Las medidas se han realizado entre temperatura
ambiente y 900ºC en atmósfera de nitrógeno.
El Método Láser o Light Flash consiste en calentar la superficie inferior de la
muestra por un pulso de energía corto. El cambio de temperatura resultante en la
superficie superior de la muestra se mide con un detector de infrarrojos (Figura 10.5.).
Figura 10.5.- Principio de medida del método láser.
El curso típico de las señales se presenta en la Figura 10.6. Cuanta más alta es la
difusividad térmica de la muestra, más inclinado es el incremento de la señal.
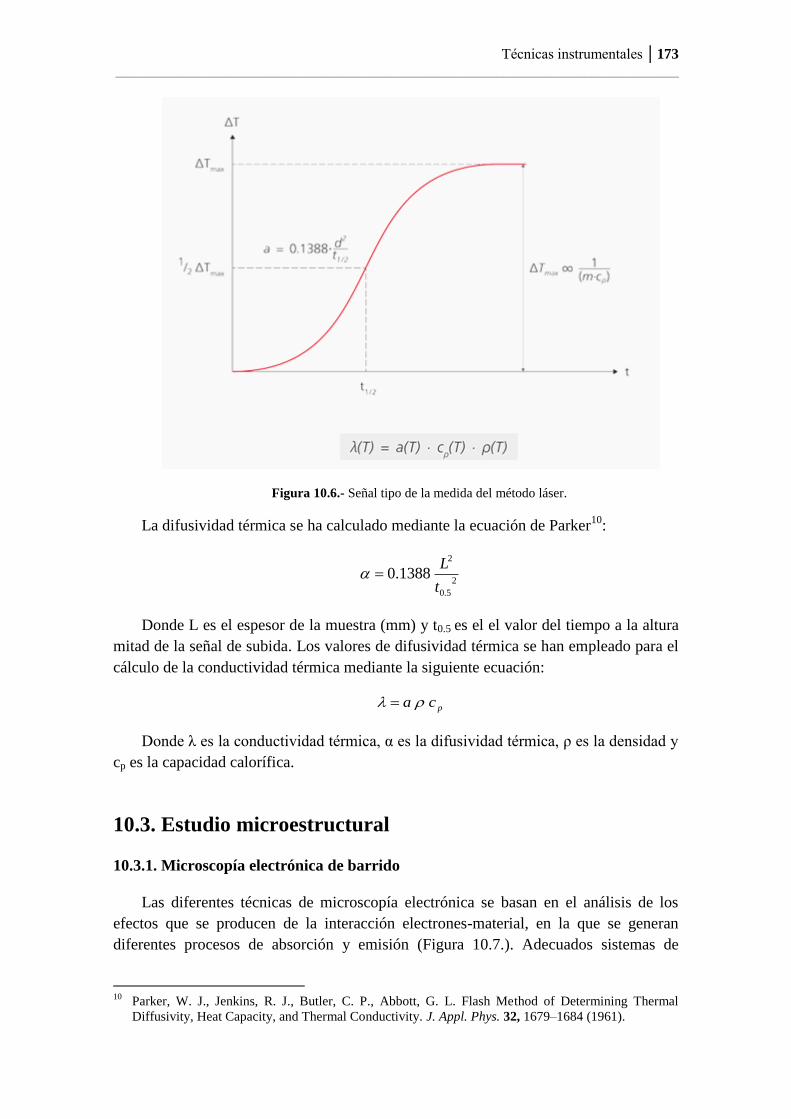
Técnicas instrumentales │173
_____________________________________________________________________________
Figura 10.6.- Señal tipo de la medida del método láser.
La difusividad térmica se ha calculado mediante la ecuación de Parker10
:
2
5.0
2
1388.0t
L
Donde L es el espesor de la muestra (mm) y t0.5 es el el valor del tiempo a la altura
mitad de la señal de subida. Los valores de difusividad térmica se han empleado para el
cálculo de la conductividad térmica mediante la siguiente ecuación:
pca
Donde λ es la conductividad térmica, α es la difusividad térmica, ρ es la densidad y
cp es la capacidad calorífica.
10.3. Estudio microestructural
10.3.1. Microscopía electrónica de barrido
Las diferentes técnicas de microscopía electrónica se basan en el análisis de los
efectos que se producen de la interacción electrones-material, en la que se generan
diferentes procesos de absorción y emisión (Figura 10.7.). Adecuados sistemas de
10
Parker, W. J., Jenkins, R. J., Butler, C. P., Abbott, G. L. Flash Method of Determining Thermal
Diffusivity, Heat Capacity, and Thermal Conductivity. J. Appl. Phys. 32, 1679–1684 (1961).
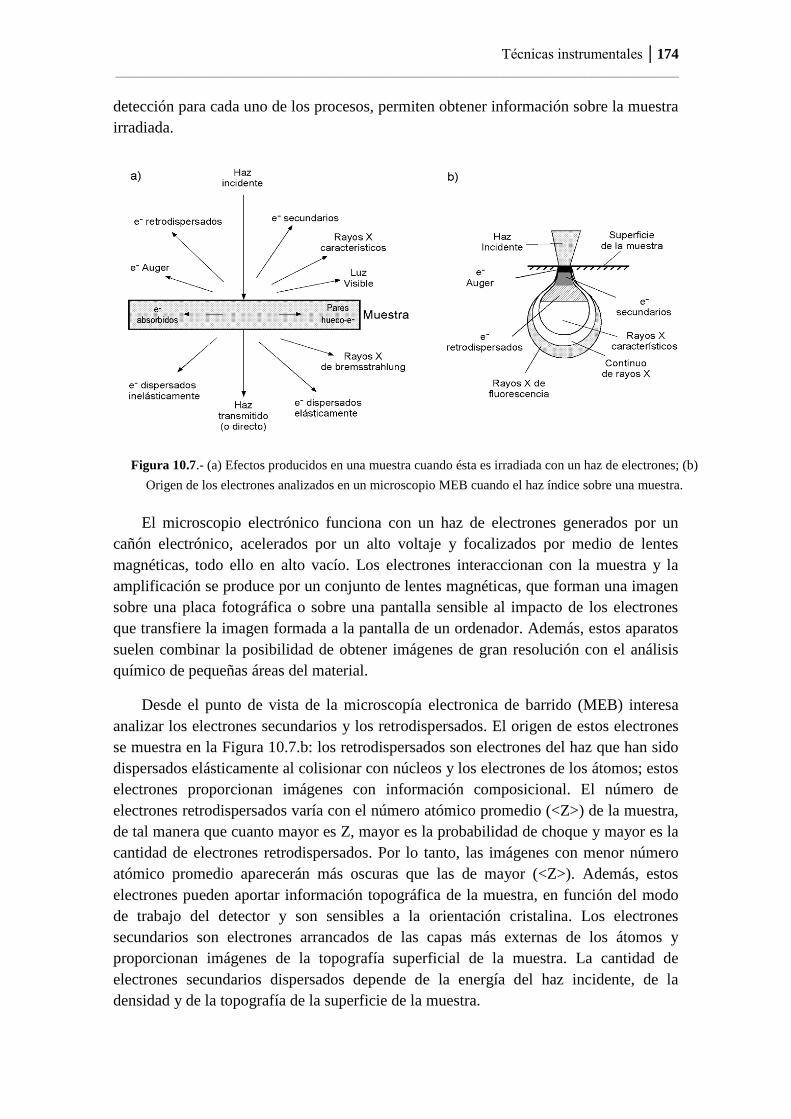
Técnicas instrumentales │174
_____________________________________________________________________________
detección para cada uno de los procesos, permiten obtener información sobre la muestra
irradiada.
Figura 10.7.- (a) Efectos producidos en una muestra cuando ésta es irradiada con un haz de electrones; (b)
Origen de los electrones analizados en un microscopio MEB cuando el haz índice sobre una muestra.
El microscopio electrónico funciona con un haz de electrones generados por un
cañón electrónico, acelerados por un alto voltaje y focalizados por medio de lentes
magnéticas, todo ello en alto vacío. Los electrones interaccionan con la muestra y la
amplificación se produce por un conjunto de lentes magnéticas, que forman una imagen
sobre una placa fotográfica o sobre una pantalla sensible al impacto de los electrones
que transfiere la imagen formada a la pantalla de un ordenador. Además, estos aparatos
suelen combinar la posibilidad de obtener imágenes de gran resolución con el análisis
químico de pequeñas áreas del material.
Desde el punto de vista de la microscopía electronica de barrido (MEB) interesa
analizar los electrones secundarios y los retrodispersados. El origen de estos electrones
se muestra en la Figura 10.7.b: los retrodispersados son electrones del haz que han sido
dispersados elásticamente al colisionar con núcleos y los electrones de los átomos; estos
electrones proporcionan imágenes con información composicional. El número de
electrones retrodispersados varía con el número atómico promedio (<Z>) de la muestra,
de tal manera que cuanto mayor es Z, mayor es la probabilidad de choque y mayor es la
cantidad de electrones retrodispersados. Por lo tanto, las imágenes con menor número
atómico promedio aparecerán más oscuras que las de mayor (<Z>). Además, estos
electrones pueden aportar información topográfica de la muestra, en función del modo
de trabajo del detector y son sensibles a la orientación cristalina. Los electrones
secundarios son electrones arrancados de las capas más externas de los átomos y
proporcionan imágenes de la topografía superficial de la muestra. La cantidad de
electrones secundarios dispersados depende de la energía del haz incidente, de la
densidad y de la topografía de la superficie de la muestra.
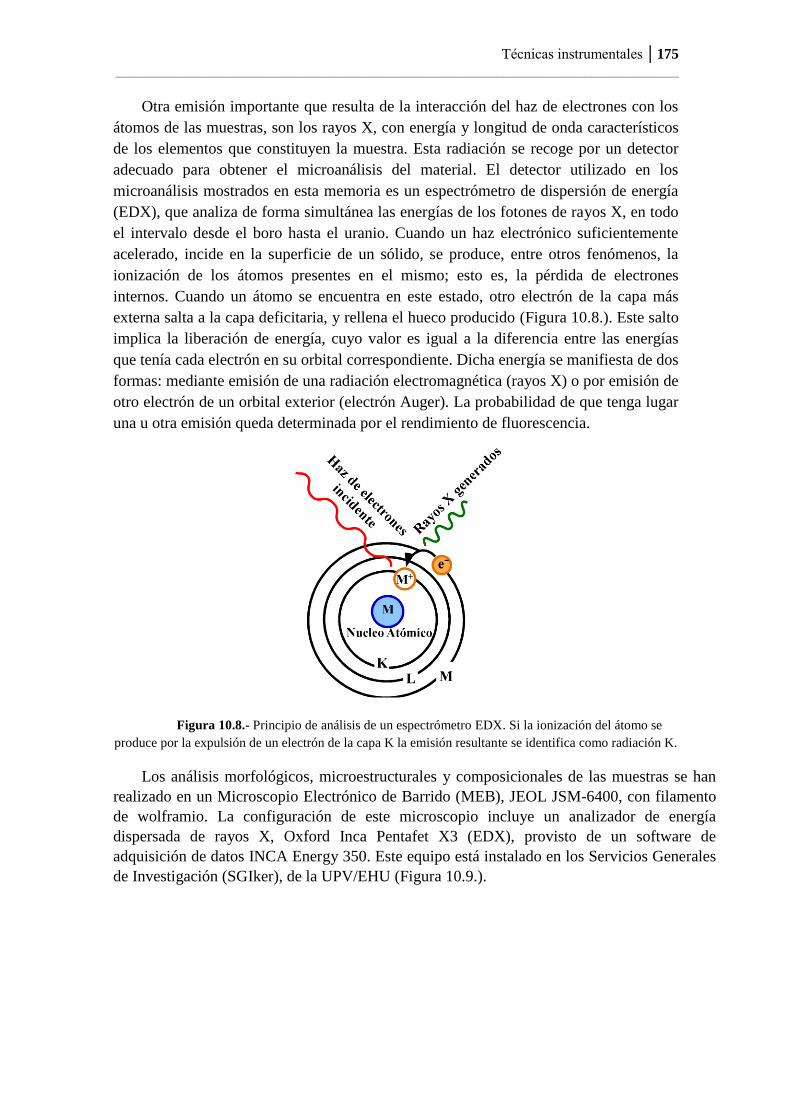
Técnicas instrumentales │175
_____________________________________________________________________________
Otra emisión importante que resulta de la interacción del haz de electrones con los
átomos de las muestras, son los rayos X, con energía y longitud de onda característicos
de los elementos que constituyen la muestra. Esta radiación se recoge por un detector
adecuado para obtener el microanálisis del material. El detector utilizado en los
microanálisis mostrados en esta memoria es un espectrómetro de dispersión de energía
(EDX), que analiza de forma simultánea las energías de los fotones de rayos X, en todo
el intervalo desde el boro hasta el uranio. Cuando un haz electrónico suficientemente
acelerado, incide en la superficie de un sólido, se produce, entre otros fenómenos, la
ionización de los átomos presentes en el mismo; esto es, la pérdida de electrones
internos. Cuando un átomo se encuentra en este estado, otro electrón de la capa más
externa salta a la capa deficitaria, y rellena el hueco producido (Figura 10.8.). Este salto
implica la liberación de energía, cuyo valor es igual a la diferencia entre las energías
que tenía cada electrón en su orbital correspondiente. Dicha energía se manifiesta de dos
formas: mediante emisión de una radiación electromagnética (rayos X) o por emisión de
otro electrón de un orbital exterior (electrón Auger). La probabilidad de que tenga lugar
una u otra emisión queda determinada por el rendimiento de fluorescencia.
Figura 10.8.- Principio de análisis de un espectrómetro EDX. Si la ionización del átomo se
produce por la expulsión de un electrón de la capa K la emisión resultante se identifica como radiación K.
Los análisis morfológicos, microestructurales y composicionales de las muestras se han
realizado en un Microscopio Electrónico de Barrido (MEB), JEOL JSM-6400, con filamento
de wolframio. La configuración de este microscopio incluye un analizador de energía
dispersada de rayos X, Oxford Inca Pentafet X3 (EDX), provisto de un software de
adquisición de datos INCA Energy 350. Este equipo está instalado en los Servicios Generales
de Investigación (SGIker), de la UPV/EHU (Figura 10.9.).
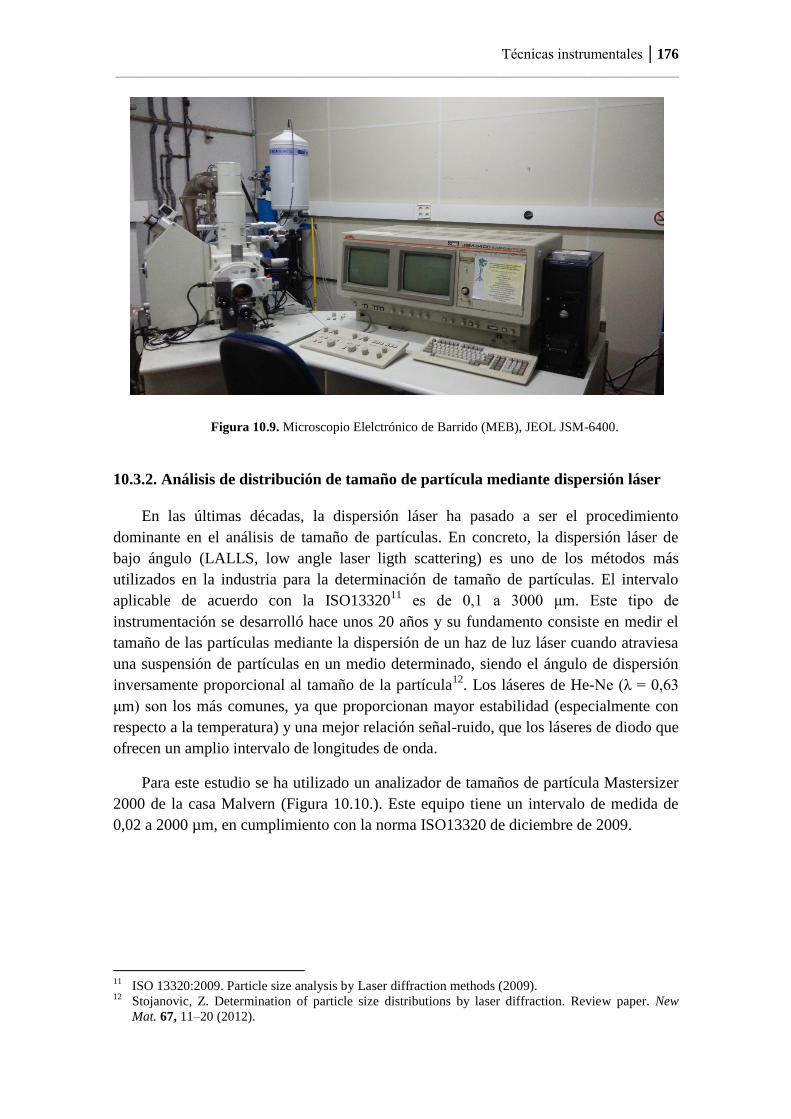
Técnicas instrumentales │176
_____________________________________________________________________________
Figura 10.9. Microscopio Elelctrónico de Barrido (MEB), JEOL JSM-6400.
10.3.2. Análisis de distribución de tamaño de partícula mediante dispersión láser
En las últimas décadas, la dispersión láser ha pasado a ser el procedimiento
dominante en el análisis de tamaño de partículas. En concreto, la dispersión láser de
bajo ángulo (LALLS, low angle laser ligth scattering) es uno de los métodos más
utilizados en la industria para la determinación de tamaño de partículas. El intervalo
aplicable de acuerdo con la ISO1332011
es de 0,1 a 3000 μm. Este tipo de
instrumentación se desarrolló hace unos 20 años y su fundamento consiste en medir el
tamaño de las partículas mediante la dispersión de un haz de luz láser cuando atraviesa
una suspensión de partículas en un medio determinado, siendo el ángulo de dispersión
inversamente proporcional al tamaño de la partícula12
. Los láseres de He-Ne (λ = 0,63
μm) son los más comunes, ya que proporcionan mayor estabilidad (especialmente con
respecto a la temperatura) y una mejor relación señal-ruido, que los láseres de diodo que
ofrecen un amplio intervalo de longitudes de onda.
Para este estudio se ha utilizado un analizador de tamaños de partícula Mastersizer
2000 de la casa Malvern (Figura 10.10.). Este equipo tiene un intervalo de medida de
0,02 a 2000 µm, en cumplimiento con la norma ISO13320 de diciembre de 2009.
11
ISO 13320:2009. Particle size analysis by Laser diffraction methods (2009). 12
Stojanovic, Z. Determination of particle size distributions by laser diffraction. Review paper. New
Mat. 67, 11–20 (2012).

Técnicas instrumentales │177
_____________________________________________________________________________
Figura 10.10.- (a) Esquema equipo difracción laser Mastersizer 2000 y (b) equipo Mastersizer
2000.
10.4. Estudio mécanico
La resistencia a la compresión de un material que falla debido a la rotura de una
fractura se puede definir, en límites bastante ajustados, como una propiedad
independiente. Sin embargo, la resistencia a la compresión de los materiales que no se
rompen en la compresión, como es el caso de las espumas de poliuretano, se define
como la cantidad de esfuerzo necesario para deformar el material una cantidad
arbitraria, siendo habitualmente este valor un 10 % de deformación respecto al valor de
espesor inicial de la probeta, según la norma ISO 844 y ASTM 162113
. Así, estas
normas se utilizan para investigar el comportamiento del plástico celular, determinando
la resistencia a la compresión, esfuerzo a la compresión en deformaciones pre-definidas,
el módulo de compresión, y otros aspectos de la relación tensión/deformación en
compresión bajo las condiciones definidas. La muestra de ensayo se posiciona entre los
dos platos paralelos, entonces se comprime a lo largo de su eje principal a una velocidad
constante de desplazamiento hasta que la muestra se ha deformado un 10 % respecto a
su altura original. Para llevar a cabo este ensayo de resistencia a la compresión se ha
utilizado el equipo Instron 3369 (ver Figura 10.11.), siguiendo la norma ASTM 1621, a
23 ± 2 ºC, una humedad relativa de 50 ± 5 %, un espesor de probeta 25 ± 0,5 mm y una
velocidad de compresión de 2,5 ± 0,25 mm·min-1
.
Figura 10.11-. (a, b) Fotografía exterior del equipo Instron 3369 y (c) uno de los accesorios del
equipo Instron 3369.
13
ASTM D 1621–2000. Standard Test Method for Compressive Properties Of Rigid Cellular Plastics.
This standard is copyrighted by ASTM International, 100 Barr Harbor Drive, PO Box C700, West
Conshohocken, PA 19428-2959.
Técnicas instrumentales │178
_____________________________________________________________________________
10.5. Estudio óptico
La cantidad de energía solar total que absorbe la capa superior determina la
acumulación de calor de una superficie revestida. La temperatura de la superficie
depende, en gran medida, de la duración de la exposición. Para lograr superficies
frescas, los pigmentos del revestimiento tienen que reflejar tanta energía como sea
posible. Esta capacidad de reflexión se expresa en el valor de reflectancia solar total
(TSR), siendo 100% una reflexión total y, cero, total absorción.
Los pigmentos con valores TSR elevados muestran una reflexión elevada. Los
revestimientos blancos tradicionales exhiben una reflectancia solar total de 75% o más,
la cual, por definición, absorberá 25% de la energía incidente. Un revestimiento negro a
base de pigmento negro carbón puede tener un TSR de tan solo 4% y, por lo tanto,
absorberá 96% de la energía solar incidente.
Las medidas de reflectancia solar, de acuerdo con la normas G173 y E903 ASTM,
deben utilizar una esfera de integración, un intervalo de medición de la longitud de onda
de entre 300 y 2500 nm, y un ángulo de incidencia de la luz sobre la muestra no mayor
de 15º. La reflectancia solar se obtiene multiplicando los coeficientes de peso de la
distribución espectral solar estándar y tomando un promedio pesado. La reflectancia
solar se determina individualmente en tres rangos de longitud de onda:
ultravioleta/visible (300-780 nm), infrarrojo cercano (780-2500 nm), y espectro total
completo (300-2500 nm). Las medidas se han realizado en un equipo Perkin Elmer
Lambda 950 UV/VIS/NIR.
10.6. Estudio cristalográfico
10.6.1. Difracción de rayos X en muestra policristalina
La difracción de rayos X se ha empleado fundamentalmente con el objetivo de
estudiar el cambio producido en la estructura cristalina a temperatura ambiente de los
compuestos sintetizados por efecto de la variación uno de los parámetros internos, x,
<rA> y σ2(rA), manteniendo los otros dos constantes. Esta técnica, además, sirve para el
estudio de cambios producidos en la estructura con el aumento de la temperatura y la
identificación de fases cristalinas tanto en su aspecto cualitativo como cuantitativo
debido a que todos los sólidos cristalinos tienen su difractograma característico (huella
dactilar).
Los rayos X son una radiación electromagnética con una longitud de onda, λ, del
mismo orden de magnitud (unos pocos Å) que los parámetros de celda de los cristales14
Cuando esta radiación incide sobre la nube electrónica de los átomos de una red
cristalina, éstos se convierten en emisores puntuales de esa misma radiación. La
radiación emitida por cada átomo se expande en forma de onda esférica e interfiere con
14
Jenkins, R. & Snyder, R.L. Introduction to X-Ray Powder Diffractometry. John Wiley & Sons (1996).

Técnicas instrumentales │179
_____________________________________________________________________________
la creada por los átomos del entorno. La interferencia resultante puede ser destructiva o
constructiva.
Las direcciones en las que la interferencia es constructiva coinciden con las que
debería llevar la radiación incidente si fuese reflejada por los diferentes planos atómicos
que componen la red cristalina. Este principio de reflexión queda recogido de forma
sencilla en la conocida Ley de Bragg:
λ = 2 dhkl senθ
donde θ es el ángulo de incidencia de la radiación y dhkl (Å) es la distancia entre
dos planos consecutivos definidos por un vector de componentes hkl.
Una de las más importantes ventajas de la difracción de rayos X respecto a otros
tipos de difracción es precisamente la alta resolución en dhkl cuando se mide un
difractograma de polvo en condiciones idóneas.
Sin embargo, esta técnica también presenta un inconveniente importante: la
magnitud de la interacción de los rayos X con los átomos es proporcional al número
atómico (Z) de los mismos. Esto significa que si una muestra se compone de átomos
muy próximos en la tabla periódica esta técnica no será capáz de distinguirlos debido a
la pequeña diferencia porcentual en número de electrones. Este efecto se repite cuando
en un compuesto se encuentran presentes simultáneamente átomos con Z grandes y
pequeños: en dicho caso la dispersión de los rayos X por éstos últimos queda
enmascarada por la de aquellos con números atómicos elevados. Asimismo, la
difracción de los rayos X también es dependiente del ángulo de dispersión θ, de tal
modo que cuanto mayor sea el valor de senθ/ λ menor es el poder de dispersión.
Los diagramas de difracción de rayos X, medidos a temperatura ambiente, se
registraron en el difractómetro Philips X'Pert del Servicio General de investigación
(SGIker) de Rayos X de la UPV/EHU. Este instrumento presenta una geometría tipo
Bragg-Brentano y está equipado con anticátodo de cobre. Las condiciones de medida
aplicadas en el generador fueron 40 kV y 40 mA.
10.6.2. El Método de Rietveld.
El método de Rietveld fue desarrollado a principio de los años sesenta para el
afinamiento de estructuras cristalinas a partir de datos de difracción de neutrones con
longitud de onda constante15,16
. Con posterioridad, su utilización se ha extendido a la
difracción de rayos X17-20
.
15
Rietveld H. M. Line profiles of neutron powder-diffraction peaks for structure refinement. Acta Cryst.,
22, 151–152 (1967). 16
Rietveld H. M. A profile refinement method for nuclear and magnetic structures.J. Appl. Cryst., 2, 65–
71 (1969). 17
Young R. A., Mackie P. E. & Dreele, R. B. Application of the pattern-fitting structure-refinement
method of X-ray powder diffractometer patterns. J. Appl. Cryst., 10, 262–269 (1977). 18
Wiles D.B. & Young R.A, A new computer program for Rietveld analysis of X-ray powder diffraction
patterns. J. Appl. Cryst., 14, 149–151 (1981).
Técnicas instrumentales │180
_____________________________________________________________________________
El método de Rietveld permite el afinamiento de estructuras cristalinas de
moderada complejidad ajustando, mediante mínimos cuadrados, el perfil completo del
diagrama de difracción a un perfil calculado para un modelo estructural (que depende de
los parámetros a afinar). No existe un paso intermedio para extraer los factores de
estructura de las reflexiones individuales a partir de las intensidades medidas para cada
posición 2 del difractograma.
El método de Rietveld se basa en la minimización de la función residuo:
= wi [ yi - yic ]2 (1) siendo:
N Número total de posiciones 2i.
wi Factor de pesada (peso estadístico de cada reflexión).
yi Número de cuentas observadas para cada ángulo 2i.
yic Número de cuentas calculado para cada ángulo 2i a partir de la
expresión:
yic = S Lk |Fk|2 W(2i-2k) Tk Pk + yib (2)
K Número de reflexiones que contribuyen a yi en una posición 2i.
S Factor de escala.
Lk Factores de Lorentz, polarización y multiplicidad de la reflexión k.
Fk Factor de estructura de la reflexión k.
W Función de perfil de la reflexión k.
Tk Factor de transmisión.
Pk Función de orientación preferente de la muestra.
yib Intensidad del fondo continuo en la posición 2i.
La minimización de la expresión (1) conduce al afinamiento de dos tipos de
parámetros: estructurales y de perfil, pudiéndose destacar:
• Parámetros estructurales:
- Coordenadas reducidas de cada átomo: x i, y i, z i.
- Factores de ocupación: n i.
- Parámetros de agitación térmica (isotrópicos o anisotrópicos).
• Parámetros de perfil:
- Factores de escala: S.
- Parámetros U, V, W, que determinan la evolución angular de la anchura a
media altura de la reflexión k, según la expresión: FWHM2 = U tg2 k + V
tg k + W
19
Young R.A. & Wiles D.B. Profile shape functions in Rietveld refinements. J. Appl. Cryst., 15, 430–
438 (1982). 20
Young R.A. The Rietveld Method. International Union of Crystallography, Oxford Science
Publications (1995).
Técnicas instrumentales │181
_____________________________________________________________________________
- Posición del cero del detector: 2o.
- Parámetros de celda: a, b, c, .
- Parámetros del fondo continuo: mi.
- Parámetro de asimetría: P.
- Parámetros de orientación preferente: G1, G2.
La bondad de los afinamientos se expresa mediante los siguientes factores de
acuerdo RP, RWP, RB, y RE, definidos por las siguientes expresiones15
:
Perfil RP = 100 |yi-yic| / |yi|
Perfil ponderado RWP = 100 [wi|yi-yic|2 / wi|yi|2] 1/2
Bragg RB = 100 |Ii-Iic| / |Ii|
Esperado RE = 100 [ (N-P+C) / wiyi2]1/2
siendo:
wi Factor de pesada (peso estadístico de cada reflexión).
yi Número de cuentas observadas para cada ángulo 2i.
yic Número de cuentas calculado para cada ángulo 2i a partir de la
expresión (2).
Ii Intensidad integrada para cada ángulo 2i.
Iic Intensidad integrada calculada para cada ángulo 2i.
(N-P+C) Número de grados de libertad.
En principio, en un afinamiento estructural preciso y correcto, los factores RWP y
RE deben tener valores próximos. No obstante, en la práctica RWP resulta ser mucho
menor que RE. El índice de bondad del ajuste, =( RWP / RE), que debiera ser
próximo a la unidad, está sujeto a errores sistemáticos, fundamentalmente derivados de
la representación deficiente de la función del perfil21
.
Por el contrario, el factor de acuerdo RB refleja la calidad del modelo estructural,
ya que está relacionado con el área de los máximos de difracción y no con su forma.
Pero es RWP el factor de acuerdo más representativo.
Unos valores adecuados de los factores de acuerdo son condición necesaria para
considerar un afinamiento como correcto. No obstante, este criterio debe acompañarse
con el examen de la diferencia entre el difractograma observado y el calculado, con el
fin de detectar posibles errores sistemáticos.
Previo al proceso normal de afinamiento utilizando el método de Rietveld, es
necesario conocer el modelo estructural aproximado de la fase a estudiar: parámetros de
celda, grupo espacial y coordenadas atómicas. Consideremos el caso del afinamiento de
21
Young R. A., Sakthivel A. Bimodal distributions of profile-broadening effects in Rietveld refinement.
J. Appl. Cryst., 21, 416–425 (1982).

Técnicas instrumentales │182
_____________________________________________________________________________
una fase isoestructural con otra ya conocida (modelo estructural a utilizar). A grandes
rasgos, las etapas que se pueden distinguir durante el afinamiento son las siguientes:
El primer paso a dar es el afinamiento del factor de escala como única variable.
El examen de los difractogramas calculado, observado y diferencia da una idea sobre la
validez del modelo estructural utilizado, así como de la posible existencia de impurezas
en la muestra estudiada.
El difractograma diferencia permite detectar posibles errores en el modelo
estructural (presencia de máximos y mínimos aislados), así como en los parámetros de
celda (máximos y mínimos solapados, con forma de "primera derivada").
El siguiente paso consiste en afinar progresivamente la posición del cero del
detector, los parámetros de celda, el fondo continuo (si fuera necesario), además del
factor de escala. En este estado del afinamiento, el difractograma diferencia muestra la
presencia de máximos y mínimos debidos a los errores asociados al modelo estructural,
desapareciendo las anomalías en forma de "primera derivada". Los valores de los
factores de acuerdo que se obtienen, normalmente, en esta etapa pueden ser del orden de
RWP30%, RB30% y RE10% .
El afinamiento de las posiciones atómicas, del factor de temperatura global, y
posteriormente de los factores de ocupación (si fuera necesario), junto con los
parámetros afinados en la etapa anterior, ocasiona la reducción de los valores de los
factores de acuerdo.
El difractograma diferencia muestra la desaparición de las anomalías en forma de
"primera derivada", pudiéndose apreciar otro tipo de anomalías, en forma de "segunda
derivada", ocasionadas por la incorrección de los parámetros que controlan la forma de
las reflexiones.
La variación de los parámetros U, V, y W, así como de la utilización de la
corrección de asimetría de las reflexiones y de orientación preferente, hacen desaparecer
estas anomalías en forma de "segunda derivada" en el difractograma diferencia. No
obstante, pueden aparecer todavía ligeras anomalías, ocasionadas por la desviación que
existe entre la forma real de las reflexiones y el comportamiento de la función de forma
utilizada (Gaussiana, Lorentziana, Pseudo-Voigt, etc.).
Por último, el afinamiento de los parámetros de temperatura anisotrópicos, no
suele ocasionar cambios estructurales significativos. La obtención de valores negativos
en algunos de estos parámetros, físicamente inconsistentes, indica que los datos
experimentales no son de suficiente calidad como para realizar este paso del
afinamiento. En este caso, el proceso de afinamiento estructural debe finalizar en la
etapa anterior.
La bondad del afinamiento final depende de varios factores, entre los que pueden
destacarse: la calidad del difractograma experimental (y de la muestra utilizada), el tipo
de radiación utilizada (neutrones, rayos X, radiación sincrotrón, etc), presencia de
impurezas, errores sistemáticos durante el proceso de afinamiento, etc.
Técnicas instrumentales │183
_____________________________________________________________________________
La crítica más extendida al método de Rietveld está basada en que se realiza un
afinamiento simultáneo de dos grupos de parámetros, estructurales y de perfil, que
dependen de dos aspectos diferentes de diagrama de difracción22,23
(intensidad y forma
de las reflexiones). Este hecho puede conducir a la obtención de parámetros
estructurales erróneos, si la calidad del afinamiento es diferente para los dos juegos de
parámetros.
La alternativa consiste en proceder en dos etapas24,25
. La primera de ellas consiste
en el afinamiento del perfil del diagrama de difracción sin introducir ningún modelo
estructural. En esta etapa sólo se fijan los parámetros de celda (previamente
determinados) y se propone un grupo espacial deducido a partir de los índices de Miller
de las reflexiones observadas. La segunda etapa incluye la utilización del modelo
estructural en el proceso de afinamiento.
A pesar de las limitaciones teóricas que se puedan plantear, la comparación entre
estudios estructurales, realizados sobre monocristal y utilizando el método de Rietveld,
muestran la validez de este último26
.
10.6.3. Termodifracción
Se ha realizado el estudio de la evolución de los difractogramas en función de la
temperatura (termodifractometría). Este método, entre otros, permite conocer la
evolución de la cristalinidad de las muestras con la temperatura, identificar las fases
cristalinas que la componen y caracterizar los procesos de cambio de fase que tienen
lugar, siendo una técnica complementaria al análisis térmico.
Los estudios termodifractométricos se han realizado en un difractómetro Bruker
D8 Advance equipado con una cámara de temperatura variable Anton Paar Physica
HTK 2000. Los difractogramas se han registrado en intervalos de 5º<2<40º cada 0.03º
en 2 theta con un tiempo por paso de 1 segundo, a intervalos de temperatura variable. El
equipo empleado se ubica en el Servicio de rayos X de los SGIker de la UPV/EHU,
Leioa.
22
Sakata M., Cooper M.J. An analysis of the Rietveld refinement method. J. Appl. Cryst., 12, 554–563
(1979). 23
Cooper, M. J. The Analysis of powder diffraction data. Acta Cryst., A38, 264–269 (1982). 24
Huang, T. C., Parrish, W. Accurate and rapid reduction of experimental X-ray data. Appl. Phys. Lett.,
27, 123–124 (1975). 25
Will, G., Parrish, W., Huang, T. C. Crystal-structure refinement by profile fitting and least-squares
analysis of powder diffractometer data. J. Appl. Cryst., 16, 611–622 (1983). 26
Albinati, A. & Willis, B. T. M. The Rietveld Method in neutron and x-ray powder diffraction. J. Appl.
Cryst., 15, 361–374 (1982).


ANEXO I: PUBLICACIONES

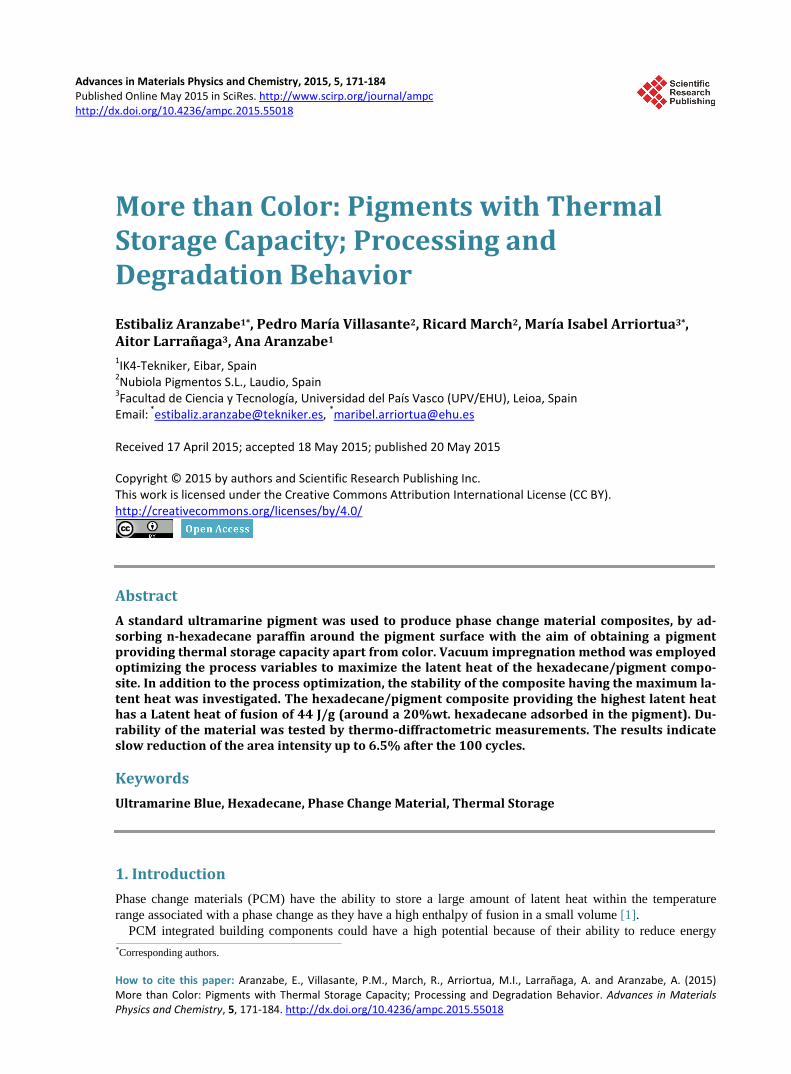
Advances in Materials Physics and Chemistry, 2015, 5, 171-184 Published Online May 2015 in SciRes. http://www.scirp.org/journal/ampc http://dx.doi.org/10.4236/ampc.2015.55018
How to cite this paper: Aranzabe, E., Villasante, P.M., March, R., Arriortua, M.I., Larrañaga, A. and Aranzabe, A. (2015) More than Color: Pigments with Thermal Storage Capacity; Processing and Degradation Behavior. Advances in Materials Physics and Chemistry, 5, 171-184. http://dx.doi.org/10.4236/ampc.2015.55018
More than Color: Pigments with Thermal Storage Capacity; Processing and Degradation Behavior Estibaliz Aranzabe1*, Pedro María Villasante2, Ricard March2, María Isabel Arriortua3*, Aitor Larrañaga3, Ana Aranzabe1 1IK4-Tekniker, Eibar, Spain 2Nubiola Pigmentos S.L., Laudio, Spain 3Facultad de Ciencia y Tecnología, Universidad del País Vasco (UPV/EHU), Leioa, Spain Email: *[email protected], *[email protected] Received 17 April 2015; accepted 18 May 2015; published 20 May 2015
Copyright © 2015 by authors and Scientific Research Publishing Inc. This work is licensed under the Creative Commons Attribution International License (CC BY). http://creativecommons.org/licenses/by/4.0/
Abstract A standard ultramarine pigment was used to produce phase change material composites, by ad-sorbing n-hexadecane paraffin around the pigment surface with the aim of obtaining a pigment providing thermal storage capacity apart from color. Vacuum impregnation method was employed optimizing the process variables to maximize the latent heat of the hexadecane/pigment compo-site. In addition to the process optimization, the stability of the composite having the maximum la- tent heat was investigated. The hexadecane/pigment composite providing the highest latent heat has a Latent heat of fusion of 44 J/g (around a 20%wt. hexadecane adsorbed in the pigment). Du-rability of the material was tested by thermo-diffractometric measurements. The results indicate slow reduction of the area intensity up to 6.5% after the 100 cycles.
Keywords Ultramarine Blue, Hexadecane, Phase Change Material, Thermal Storage
1. Introduction Phase change materials (PCM) have the ability to store a large amount of latent heat within the temperature range associated with a phase change as they have a high enthalpy of fusion in a small volume [1].
PCM integrated building components could have a high potential because of their ability to reduce energy
*Corresponding authors.
E. Aranzabe et al.
172
consumption for space conditioning and reduce peak loads while improving occupant comfort [2]. Among all the PCM applications, the PCM integration in wallboards, roof & ceiling, and windows has been deeply studied, due to its relatively easy implementation and more effective heat exchange area [3].
Materials used as PCMs can be divided into different subcategories based on their chemical composition: or-ganic compounds, inorganic compounds and eutectic mixtures. However, among these materials, paraffin is be-lieved to be the most promising phase change material because is stable, non-toxic and not corrosive; it has a large latent heat and low cost [4]-[8].
The thermal energy of paraffin is transferred when the material changes from a solid to a liquid or a liquid to a solid, being necessary to contain it to prevent leakages. The most promising methods reported for the incorpora-tion of PCMs in the construction materials are: direct incorporation, immersion and encapsulation. Some re-searchers pointed out that the direct incorporation and the immersion methods could cause a leakage problem which is not good for long-term use [9].
Depending on the capsule size, the encapsulated PCMs are classified in macro or micro-encapsulated, and there are a wide variety of encapsulating methods and systems obtaining different sizes, geometries and mate-rials [10] [11]. With macro-encapsulated PCMs, the leakage problem can be avoided but it has the disadvantage of poor thermal conductivity and the complicated integration to the building materials. Micro-encapsulated PCMs have been used in thermal energy storage of buildings being much easier to incorporate the microencap-sulated PCMs into construction materials [12] [13]. However, this material has two main drawbacks: it is a non- economical technique and there is low thermal conductivity through the capsule [13].
In contrast, a porous material/phase change composite is attractive since it need not be encapsulated, provides no corrosion and enables quick heat transfer [14]. Then support of PCMs into porous materials is a promising alternative method for the encapsulation of PCMs [15]-[17] but there is still a real need of development con-cerning PCM containment method to be economically available [5].
However, the storage materials and containers have insufficient long term stability and this has limited the use of latent heat stores. This poor stability is mainly due to the poor stability of the materials properties due to thermal cycling.
Ultramarine blue pigment (UB) is an ancient inorganic pigment manufactured by the burning of sodium sul-fate, quartz, and sulfur round 800˚C, which produces a sodium aluminum silicate sulfide structure (Na8Al6Si6O24S2) similar to Sodalite [18]. Taking into account that ultramarine blue are a family of low-cost mineral pigments with high pigmentary properties and commonly used in construction sector (concrete, paints, polymers), the aim of this study is to develop a form-stable phase change material composites based on ultramarine blue as the supporting matrix and n-hexadecane as the PCM. Vacuum impregnation method has been proposed for obtain-ing a pigment with thermal storage capabilities. The main advantage of the use of this hexadecane/pigment composite is that manufacturing processes of building components would not be altered as the pigment gives it-self the pursued thermal storage capability apart from giving the color to the component.
Durability of the hexadecane/pigment composite against temperature has been demonstrated by analyzing the latent heat of the composite after subjecting it to 30˚C during 1000 hours. To evaluate the reliability of PCMs during phase-change process, commonly, hundred loops of heating-cooling dynamic DSC scans are normally performed in a sealed pan reducing the amount of PCM lost by vaporization but not simulating real-life condi-tions.
In this work, long-term stability (cycling without any material degradation) has been tested by thermo-dif- fractometric cyclic measurements in static air. Given that the crystal signal of the n-hexadecane could be moni-tored by using X-ray diffraction, 100 cycles of heating and cooling were performed and the area intensity of the crystals was monitored.
2. Materials 2.1. Ultramarine Pigment A standard ultramarine blue pigment produced by Nubiola Pigmentos S.L. was used. Ultramarine pigment compositions are based on the crystal chemistry of the royal blue Sodalite mineral Lazurite [Na6Ca2Al6Si6O24(Sn,SO4)2].
Some compositions suggested for synthetic ultramarine blue pigments include Na8Al6Si6O24S4 or Na7Al6Si6O24S3 [19], although actual compositions are usually complicated by minor amounts of impurities
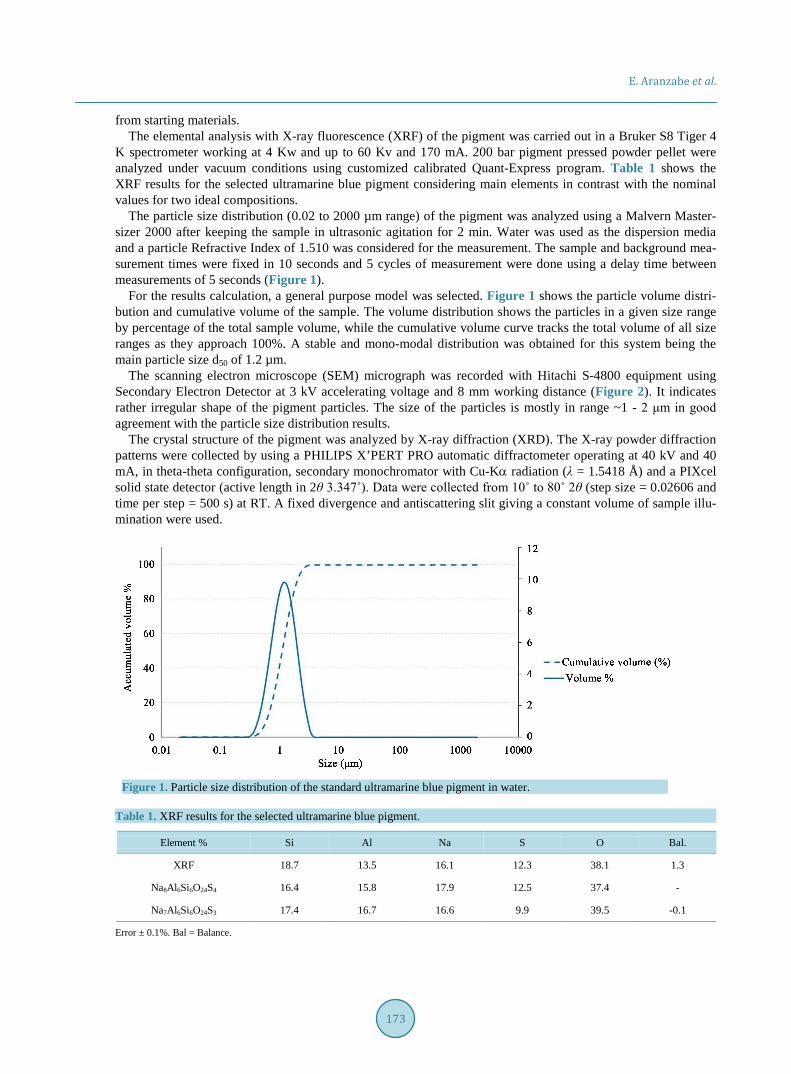
E. Aranzabe et al.
173
from starting materials. The elemental analysis with X-ray fluorescence (XRF) of the pigment was carried out in a Bruker S8 Tiger 4
K spectrometer working at 4 Kw and up to 60 Kv and 170 mA. 200 bar pigment pressed powder pellet were analyzed under vacuum conditions using customized calibrated Quant-Express program. Table 1 shows the XRF results for the selected ultramarine blue pigment considering main elements in contrast with the nominal values for two ideal compositions.
The particle size distribution (0.02 to 2000 µm range) of the pigment was analyzed using a Malvern Master-sizer 2000 after keeping the sample in ultrasonic agitation for 2 min. Water was used as the dispersion media and a particle Refractive Index of 1.510 was considered for the measurement. The sample and background mea-surement times were fixed in 10 seconds and 5 cycles of measurement were done using a delay time between measurements of 5 seconds (Figure 1).
For the results calculation, a general purpose model was selected. Figure 1 shows the particle volume distri-bution and cumulative volume of the sample. The volume distribution shows the particles in a given size range by percentage of the total sample volume, while the cumulative volume curve tracks the total volume of all size ranges as they approach 100%. A stable and mono-modal distribution was obtained for this system being the main particle size d50 of 1.2 µm.
The scanning electron microscope (SEM) micrograph was recorded with Hitachi S-4800 equipment using Secondary Electron Detector at 3 kV accelerating voltage and 8 mm working distance (Figure 2). It indicates rather irregular shape of the pigment particles. The size of the particles is mostly in range ~1 - 2 μm in good agreement with the particle size distribution results.
The crystal structure of the pigment was analyzed by X-ray diffraction (XRD). The X-ray powder diffraction patterns were collected by using a PHILIPS X’PERT PRO automatic diffractometer operating at 40 kV and 40 mA, in theta-theta configuration, secondary monochromator with Cu-Kα radiation (λ = 1.5418 Å) and a PIXcel solid state detector (active length in 2θ 3.347˚). Data were collected from 10˚ to 80˚ 2θ (step size = 0.02606 and time per step = 500 s) at RT. A fixed divergence and antiscattering slit giving a constant volume of sample illu-mination were used.
Figure 1. Particle size distribution of the standard ultramarine blue pigment in water.
Table 1. XRF results for the selected ultramarine blue pigment.
Element % Si Al Na S O Bal.
XRF 18.7 13.5 16.1 12.3 38.1 1.3
Na8Al6Si6O24S4 16.4 15.8 17.9 12.5 37.4 -
Na7Al6Si6O24S3 17.4 16.7 16.6 9.9 39.5 -0.1
Error ± 0.1%. Bal = Balance.
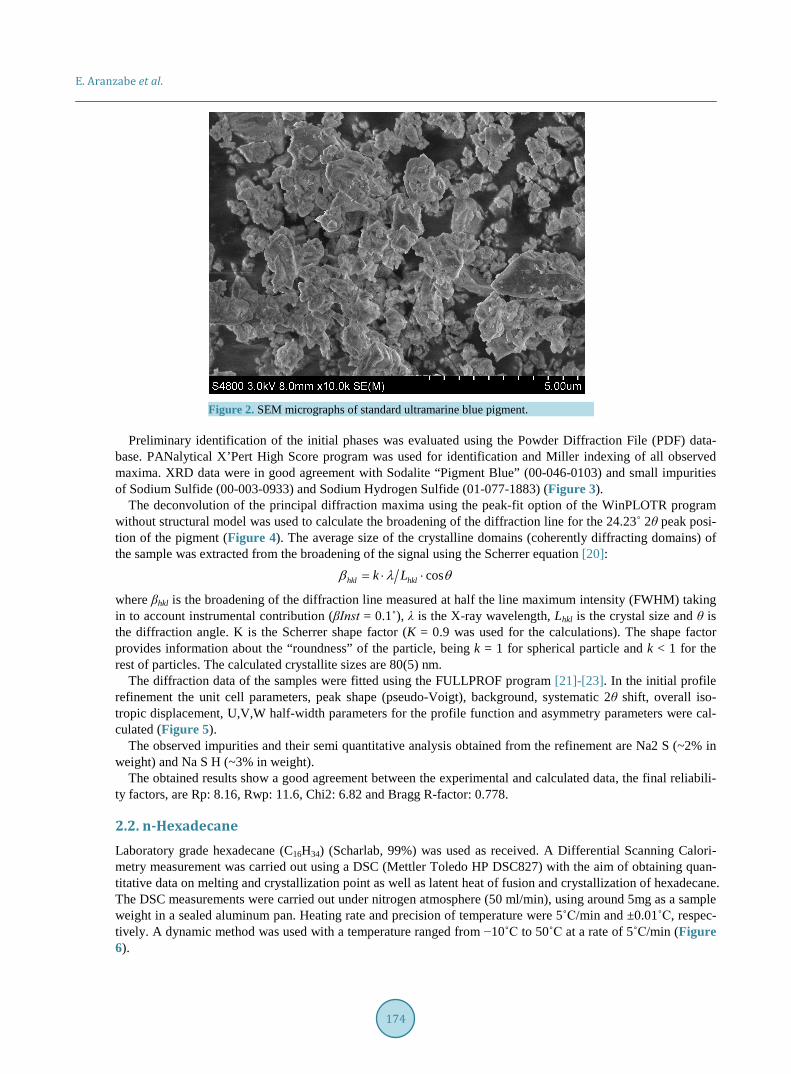
E. Aranzabe et al.
174
Figure 2. SEM micrographs of standard ultramarine blue pigment.
Preliminary identification of the initial phases was evaluated using the Powder Diffraction File (PDF) data-
base. PANalytical X’Pert High Score program was used for identification and Miller indexing of all observed maxima. XRD data were in good agreement with Sodalite “Pigment Blue” (00-046-0103) and small impurities of Sodium Sulfide (00-003-0933) and Sodium Hydrogen Sulfide (01-077-1883) (Figure 3).
The deconvolution of the principal diffraction maxima using the peak-fit option of the WinPLOTR program without structural model was used to calculate the broadening of the diffraction line for the 24.23˚ 2θ peak posi-tion of the pigment (Figure 4). The average size of the crystalline domains (coherently diffracting domains) of the sample was extracted from the broadening of the signal using the Scherrer equation [20]:
coshkl hklk Lβ λ θ= ⋅ ⋅
where βhkl is the broadening of the diffraction line measured at half the line maximum intensity (FWHM) taking in to account instrumental contribution (βInst = 0.1˚), λ is the X-ray wavelength, Lhkl is the crystal size and θ is the diffraction angle. K is the Scherrer shape factor (K = 0.9 was used for the calculations). The shape factor provides information about the “roundness” of the particle, being k = 1 for spherical particle and k < 1 for the rest of particles. The calculated crystallite sizes are 80(5) nm.
The diffraction data of the samples were fitted using the FULLPROF program [21]-[23]. In the initial profile refinement the unit cell parameters, peak shape (pseudo-Voigt), background, systematic 2θ shift, overall iso-tropic displacement, U,V,W half-width parameters for the profile function and asymmetry parameters were cal-culated (Figure 5).
The observed impurities and their semi quantitative analysis obtained from the refinement are Na2 S (~2% in weight) and Na S H (~3% in weight).
The obtained results show a good agreement between the experimental and calculated data, the final reliabili-ty factors, are Rp: 8.16, Rwp: 11.6, Chi2: 6.82 and Bragg R-factor: 0.778.
2.2. n-Hexadecane Laboratory grade hexadecane (C16H34) (Scharlab, 99%) was used as received. A Differential Scanning Calori-metry measurement was carried out using a DSC (Mettler Toledo HP DSC827) with the aim of obtaining quan-titative data on melting and crystallization point as well as latent heat of fusion and crystallization of hexadecane. The DSC measurements were carried out under nitrogen atmosphere (50 ml/min), using around 5mg as a sample weight in a sealed aluminum pan. Heating rate and precision of temperature were 5˚C/min and ±0.01˚C, respec-tively. A dynamic method was used with a temperature ranged from −10˚C to 50˚C at a rate of 5˚C/min (Figure 6).
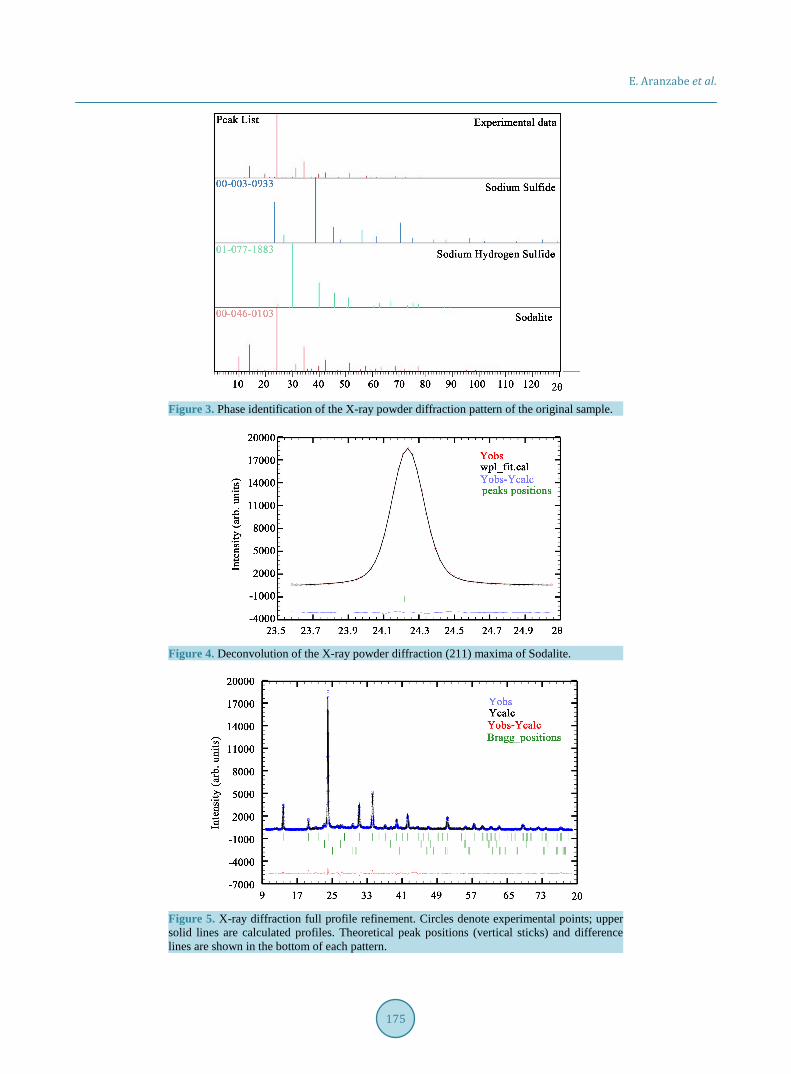
E. Aranzabe et al.
175
Figure 3. Phase identification of the X-ray powder diffraction pattern of the original sample.
Figure 4. Deconvolution of the X-ray powder diffraction (211) maxima of Sodalite.
Figure 5. X-ray diffraction full profile refinement. Circles denote experimental points; upper solid lines are calculated profiles. Theoretical peak positions (vertical sticks) and difference lines are shown in the bottom of each pattern.
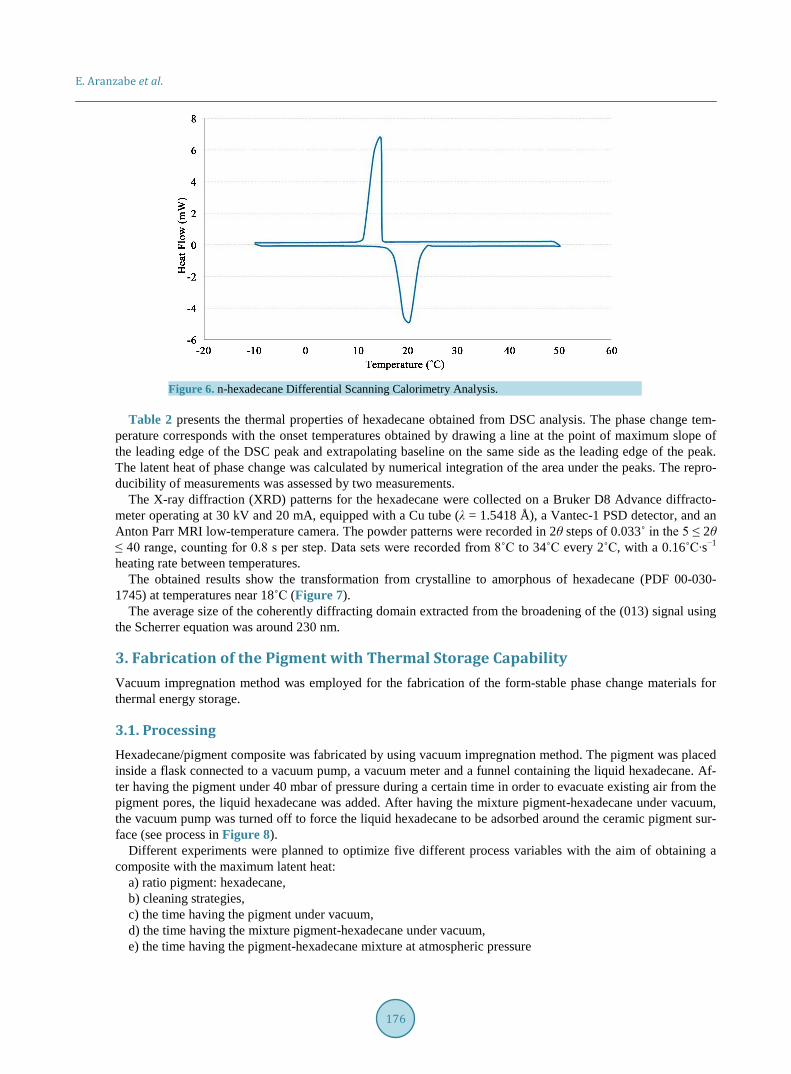
E. Aranzabe et al.
176
Figure 6. n-hexadecane Differential Scanning Calorimetry Analysis.
Table 2 presents the thermal properties of hexadecane obtained from DSC analysis. The phase change tem-
perature corresponds with the onset temperatures obtained by drawing a line at the point of maximum slope of the leading edge of the DSC peak and extrapolating baseline on the same side as the leading edge of the peak. The latent heat of phase change was calculated by numerical integration of the area under the peaks. The repro-ducibility of measurements was assessed by two measurements.
The X-ray diffraction (XRD) patterns for the hexadecane were collected on a Bruker D8 Advance diffracto-meter operating at 30 kV and 20 mA, equipped with a Cu tube (λ = 1.5418 Å), a Vantec-1 PSD detector, and an Anton Parr MRI low-temperature camera. The powder patterns were recorded in 2θ steps of 0.033˚ in the 5 ≤ 2θ ≤ 40 range, counting for 0.8 s per step. Data sets were recorded from 8˚C to 34˚C every 2˚C, with a 0.16˚C∙s−1 heating rate between temperatures.
The obtained results show the transformation from crystalline to amorphous of hexadecane (PDF 00-030- 1745) at temperatures near 18˚C (Figure 7).
The average size of the coherently diffracting domain extracted from the broadening of the (013) signal using the Scherrer equation was around 230 nm.
3. Fabrication of the Pigment with Thermal Storage Capability Vacuum impregnation method was employed for the fabrication of the form-stable phase change materials for thermal energy storage.
3.1. Processing Hexadecane/pigment composite was fabricated by using vacuum impregnation method. The pigment was placed inside a flask connected to a vacuum pump, a vacuum meter and a funnel containing the liquid hexadecane. Af-ter having the pigment under 40 mbar of pressure during a certain time in order to evacuate existing air from the pigment pores, the liquid hexadecane was added. After having the mixture pigment-hexadecane under vacuum, the vacuum pump was turned off to force the liquid hexadecane to be adsorbed around the ceramic pigment sur-face (see process in Figure 8).
Different experiments were planned to optimize five different process variables with the aim of obtaining a composite with the maximum latent heat:
a) ratio pigment: hexadecane, b) cleaning strategies, c) the time having the pigment under vacuum, d) the time having the mixture pigment-hexadecane under vacuum, e) the time having the pigment-hexadecane mixture at atmospheric pressure
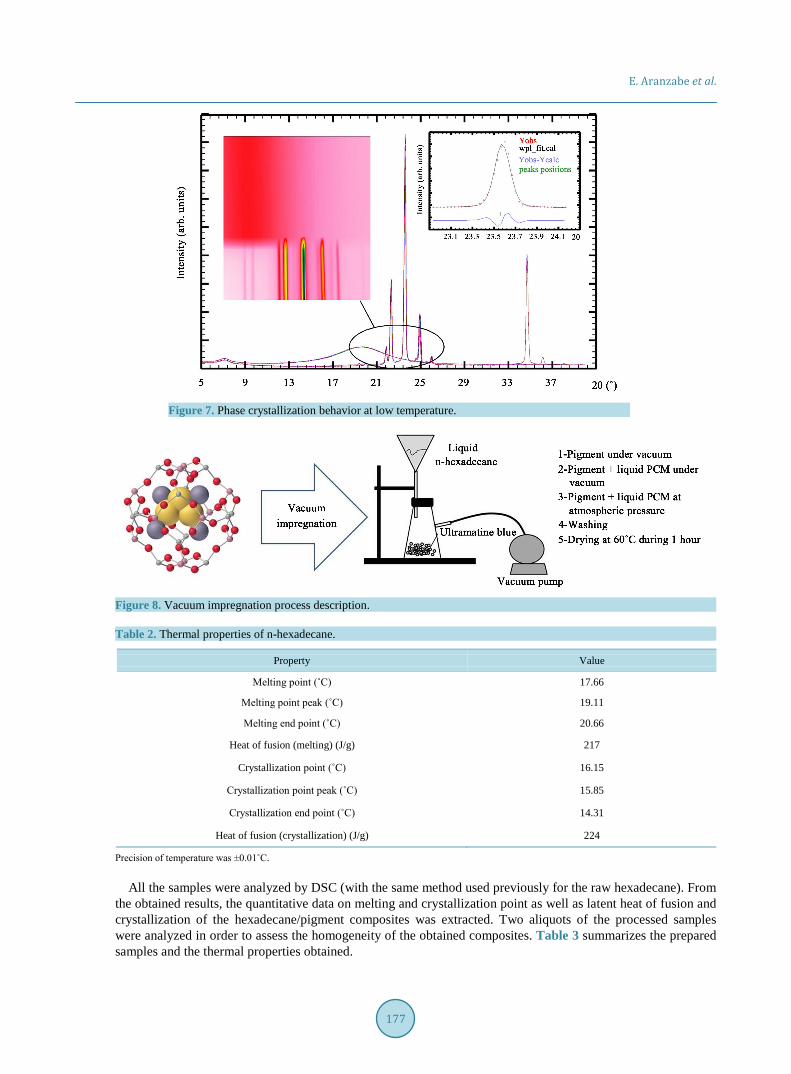
E. Aranzabe et al.
177
Figure 7. Phase crystallization behavior at low temperature.
Figure 8. Vacuum impregnation process description.
Table 2. Thermal properties of n-hexadecane.
Property Value
Melting point (˚C) 17.66
Melting point peak (˚C) 19.11
Melting end point (˚C) 20.66
Heat of fusion (melting) (J/g) 217
Crystallization point (˚C) 16.15
Crystallization point peak (˚C) 15.85
Crystallization end point (˚C) 14.31
Heat of fusion (crystallization) (J/g) 224
Precision of temperature was ±0.01˚C.
All the samples were analyzed by DSC (with the same method used previously for the raw hexadecane). From the obtained results, the quantitative data on melting and crystallization point as well as latent heat of fusion and crystallization of the hexadecane/pigment composites was extracted. Two aliquots of the processed samples were analyzed in order to assess the homogeneity of the obtained composites. Table 3 summarizes the prepared samples and the thermal properties obtained.
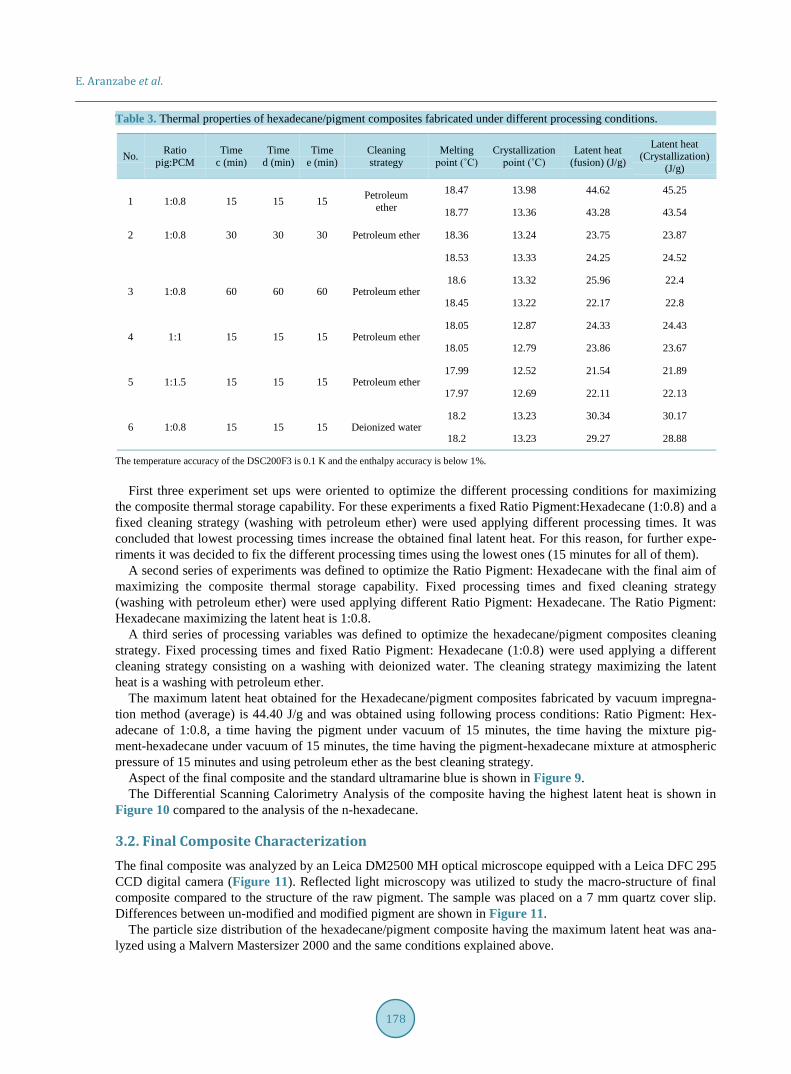
E. Aranzabe et al.
178
Table 3. Thermal properties of hexadecane/pigment composites fabricated under different processing conditions.
No. Ratio pig:PCM
Time c (min)
Time d (min)
Time e (min)
Cleaning strategy
Melting point (˚C)
Crystallization point (˚C)
Latent heat (fusion) (J/g)
Latent heat (Crystallization)
(J/g)
1 1:0.8 15 15 15 Petroleum ether
18.47 13.98 44.62 45.25
18.77 13.36 43.28 43.54
2 1:0.8 30 30 30 Petroleum ether 18.36 13.24 23.75 23.87
18.53 13.33 24.25 24.52
3 1:0.8 60 60 60 Petroleum ether 18.6 13.32 25.96 22.4
18.45 13.22 22.17 22.8
4 1:1 15 15 15 Petroleum ether 18.05 12.87 24.33 24.43
18.05 12.79 23.86 23.67
5 1:1.5 15 15 15 Petroleum ether 17.99 12.52 21.54 21.89
17.97 12.69 22.11 22.13
6 1:0.8 15 15 15 Deionized water 18.2 13.23 30.34 30.17
18.2 13.23 29.27 28.88
The temperature accuracy of the DSC200F3 is 0.1 K and the enthalpy accuracy is below 1%.
First three experiment set ups were oriented to optimize the different processing conditions for maximizing the composite thermal storage capability. For these experiments a fixed Ratio Pigment:Hexadecane (1:0.8) and a fixed cleaning strategy (washing with petroleum ether) were used applying different processing times. It was concluded that lowest processing times increase the obtained final latent heat. For this reason, for further expe-riments it was decided to fix the different processing times using the lowest ones (15 minutes for all of them).
A second series of experiments was defined to optimize the Ratio Pigment: Hexadecane with the final aim of maximizing the composite thermal storage capability. Fixed processing times and fixed cleaning strategy (washing with petroleum ether) were used applying different Ratio Pigment: Hexadecane. The Ratio Pigment: Hexadecane maximizing the latent heat is 1:0.8.
A third series of processing variables was defined to optimize the hexadecane/pigment composites cleaning strategy. Fixed processing times and fixed Ratio Pigment: Hexadecane (1:0.8) were used applying a different cleaning strategy consisting on a washing with deionized water. The cleaning strategy maximizing the latent heat is a washing with petroleum ether.
The maximum latent heat obtained for the Hexadecane/pigment composites fabricated by vacuum impregna-tion method (average) is 44.40 J/g and was obtained using following process conditions: Ratio Pigment: Hex-adecane of 1:0.8, a time having the pigment under vacuum of 15 minutes, the time having the mixture pig-ment-hexadecane under vacuum of 15 minutes, the time having the pigment-hexadecane mixture at atmospheric pressure of 15 minutes and using petroleum ether as the best cleaning strategy.
Aspect of the final composite and the standard ultramarine blue is shown in Figure 9. The Differential Scanning Calorimetry Analysis of the composite having the highest latent heat is shown in
Figure 10 compared to the analysis of the n-hexadecane.
3.2. Final Composite Characterization The final composite was analyzed by an Leica DM2500 MH optical microscope equipped with a Leica DFC 295 CCD digital camera (Figure 11). Reflected light microscopy was utilized to study the macro-structure of final composite compared to the structure of the raw pigment. The sample was placed on a 7 mm quartz cover slip. Differences between un-modified and modified pigment are shown in Figure 11.
The particle size distribution of the hexadecane/pigment composite having the maximum latent heat was ana-lyzed using a Malvern Mastersizer 2000 and the same conditions explained above.

E. Aranzabe et al.
179
Figure 9. Standard ultramarine blue and final composite (having a latent heat of 44.40 J/g).
Figure 10. n-hexadecane and final composite Differential Scanning Calorimetry Analysis.
Figure 11. Optical micrographs of standard ultramarine blue and final composite.
Figure 12 shows the particle size distribution obtained. A stable and mono-modal distribution was obtained
for this system being the mean particle size of 1.455 µm. An increase of 0.253 µm is observed in the mean par-ticle size due to the impregnation process when comparing the composite with the un-modified pigment.
The X-ray diffraction (XRD) patterns for the hexadecane/pigment composite were measured using a Bruker D8 Advance X-ray diffractometer. The powder patterns were recorded in 2θ steps of 0.033˚ in the 5 ≤ 2θ ≤ 40 range, counting for 0.8 s per step at 10˚C. Preliminary identification of the initial phases was evaluated using the original pigment and PCM as references; Sodalite (00-046-0103), Sodium Sulfide (00-003-0933), Sodium Hy-drogen Sulfide (01-077-1883) and Hexadecane (00-030-1745). The observed XRD maxima are in good agree-ment with the compound mixture (Figure 13).
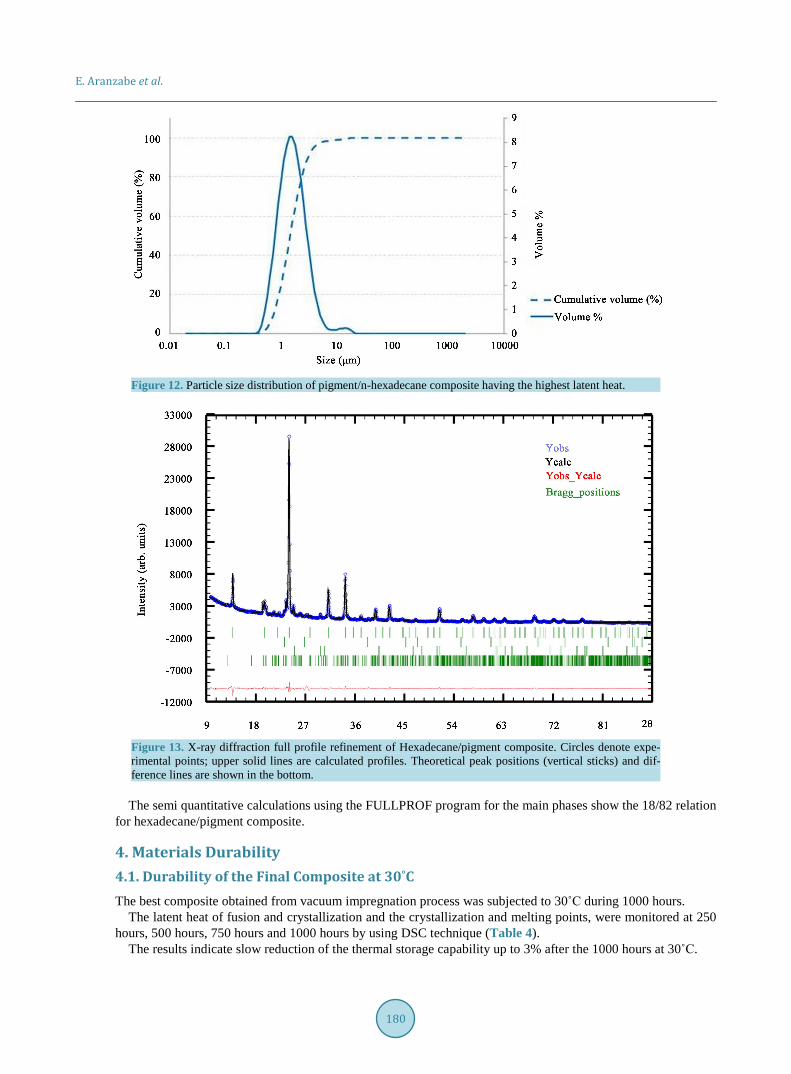
E. Aranzabe et al.
180
Figure 12. Particle size distribution of pigment/n-hexadecane composite having the highest latent heat.
Figure 13. X-ray diffraction full profile refinement of Hexadecane/pigment composite. Circles denote expe-rimental points; upper solid lines are calculated profiles. Theoretical peak positions (vertical sticks) and dif-ference lines are shown in the bottom.
The semi quantitative calculations using the FULLPROF program for the main phases show the 18/82 relation
for hexadecane/pigment composite.
4. Materials Durability 4.1. Durability of the Final Composite at 30˚C The best composite obtained from vacuum impregnation process was subjected to 30˚C during 1000 hours.
The latent heat of fusion and crystallization and the crystallization and melting points, were monitored at 250 hours, 500 hours, 750 hours and 1000 hours by using DSC technique (Table 4).
The results indicate slow reduction of the thermal storage capability up to 3% after the 1000 hours at 30˚C.
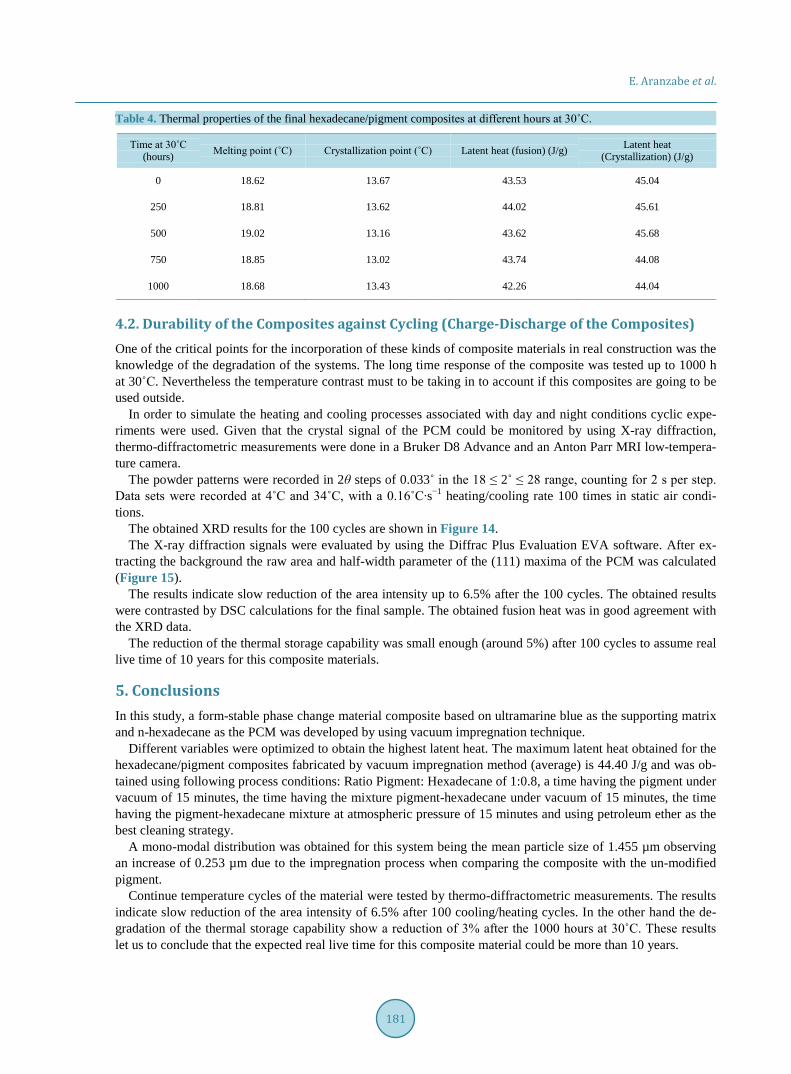
E. Aranzabe et al.
181
Table 4. Thermal properties of the final hexadecane/pigment composites at different hours at 30˚C.
Time at 30˚C (hours) Melting point (˚C) Crystallization point (˚C) Latent heat (fusion) (J/g) Latent heat
(Crystallization) (J/g)
0 18.62 13.67 43.53 45.04
250 18.81 13.62 44.02 45.61
500 19.02 13.16 43.62 45.68
750 18.85 13.02 43.74 44.08
1000 18.68 13.43 42.26 44.04
4.2. Durability of the Composites against Cycling (Charge-Discharge of the Composites) One of the critical points for the incorporation of these kinds of composite materials in real construction was the knowledge of the degradation of the systems. The long time response of the composite was tested up to 1000 h at 30˚C. Nevertheless the temperature contrast must to be taking in to account if this composites are going to be used outside.
In order to simulate the heating and cooling processes associated with day and night conditions cyclic expe-riments were used. Given that the crystal signal of the PCM could be monitored by using X-ray diffraction, thermo-diffractometric measurements were done in a Bruker D8 Advance and an Anton Parr MRI low-tempera- ture camera.
The powder patterns were recorded in 2θ steps of 0.033˚ in the 18 ≤ 2˚ ≤ 28 range, counting for 2 s per step. Data sets were recorded at 4˚C and 34˚C, with a 0.16˚C∙s−1 heating/cooling rate 100 times in static air condi-tions.
The obtained XRD results for the 100 cycles are shown in Figure 14. The X-ray diffraction signals were evaluated by using the Diffrac Plus Evaluation EVA software. After ex-
tracting the background the raw area and half-width parameter of the (111) maxima of the PCM was calculated (Figure 15).
The results indicate slow reduction of the area intensity up to 6.5% after the 100 cycles. The obtained results were contrasted by DSC calculations for the final sample. The obtained fusion heat was in good agreement with the XRD data.
The reduction of the thermal storage capability was small enough (around 5%) after 100 cycles to assume real live time of 10 years for this composite materials.
5. Conclusions In this study, a form-stable phase change material composite based on ultramarine blue as the supporting matrix and n-hexadecane as the PCM was developed by using vacuum impregnation technique.
Different variables were optimized to obtain the highest latent heat. The maximum latent heat obtained for the hexadecane/pigment composites fabricated by vacuum impregnation method (average) is 44.40 J/g and was ob-tained using following process conditions: Ratio Pigment: Hexadecane of 1:0.8, a time having the pigment under vacuum of 15 minutes, the time having the mixture pigment-hexadecane under vacuum of 15 minutes, the time having the pigment-hexadecane mixture at atmospheric pressure of 15 minutes and using petroleum ether as the best cleaning strategy.
A mono-modal distribution was obtained for this system being the mean particle size of 1.455 µm observing an increase of 0.253 µm due to the impregnation process when comparing the composite with the un-modified pigment.
Continue temperature cycles of the material were tested by thermo-diffractometric measurements. The results indicate slow reduction of the area intensity of 6.5% after 100 cooling/heating cycles. In the other hand the de-gradation of the thermal storage capability show a reduction of 3% after the 1000 hours at 30˚C. These results let us to conclude that the expected real live time for this composite material could be more than 10 years.
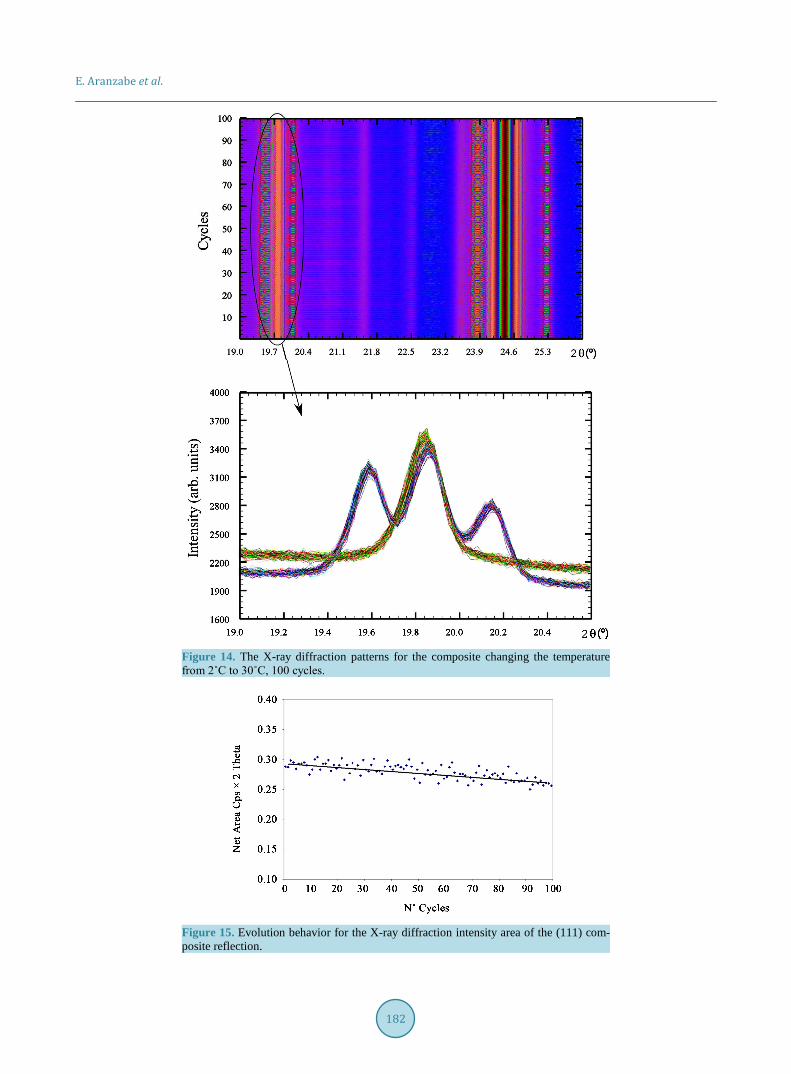
E. Aranzabe et al.
182
Figure 14. The X-ray diffraction patterns for the composite changing the temperature from 2˚C to 30˚C, 100 cycles.
Figure 15. Evolution behavior for the X-ray diffraction intensity area of the (111) com-posite reflection.
E. Aranzabe et al.
183
Acknowledgements This project has received founding from the European Union Seventh Framework Programme (FP7-NMP-2010- Small-5) under grant agreement n˚ 280393 and from the Dpto. Educación, Política Lingüística y Cultura of the Basque Goverment (IT-630-13), Ministerio de Ciencia e Innovación (MAT2013-42092-R) and Engineering and Physical Sciences Research Council (EP/I003932). SGIker technical support (UPV/EHU, MEC, GV/EJ, Euro-pean Social Fund) is gratefully acknowledged.
References [1] Sharma, A., Tyagi, V.V., Chen, C.R. and Buddhi, D. (2009) Review on Thermal Energy Storage with Phase Change
Materials and Applications. Renewable and Sustainable Energy Reviews, 13, 318-345. http://dx.doi.org/10.1016/j.rser.2007.10.005
[2] Faraji, M., Alami, M.E. and Najam, M. (2014) Thermal Control of Building Using Latent Heat Storage South Wall. Journal of Mathematics and Computer Science, 10, 212-227.
[3] Geetha, N.B. and Velraj, R. (2012) EEST Part A: Energy Science and Research, 29, 913-946. [4] Chena, Y., Shiha, Y. and Yub, Y. (2013) Stearyl Alcohol Modified Expanded Graphite/Paraffin Phase Change Com-
posite. International Journal of Applied Science and Engineering, 11, 227-233. [5] Li, X.Y., Sanjayan, J.G. and Wilson, J.L. (2014) Fabrication and Stability of Form-Stable Diatomite/Paraffin Phase
Change Material Composites. Energy and Buildings, 76, 284-294. http://dx.doi.org/10.1016/j.enbuild.2014.02.082 [6] Xu, B.W. and Li, Z.J. (2013) Paraffin/Diatomite Composite Phase Change Material Incorporated Cement-Based Com-
posite For Thermal Energy Storage. Applied Energy, 105, 229-237. http://dx.doi.org/10.1016/j.apenergy.2013.01.005 [7] Sotomayor, M.E., Krupa, I., Várez, A. and Levenfeld, B. (2014) Thermal and Mechanical Characterization of Injection
Moulded High Density Polyethylene/Paraffin Wax Blends as Phase Change Materials. Renewable Energy, 68, 140-145. http://dx.doi.org/10.1016/j.renene.2014.01.036
[8] Sun, Z.M., Zhang, Y.Z., Zheng, S.L., Park, Y. and Frost, R.L. (2013) Preparation and Thermal Energy Storage Proper-ties of Paraffin/Calcined Diatomite Composites as Form-Stable Phase Change Materials. Thermochimica Acta, 558, 16-21. http://dx.doi.org/10.1016/j.tca.2013.02.005
[9] Zhou, D., Zhao , C.Y. and Tian, Y. (2012) Review on Thermal Energy Storage with Phase Change Materials (PCMs) in Building Applications. Applied Energy, 92, 593-605. http://dx.doi.org/10.1016/j.apenergy.2011.08.025
[10] Rodriguez-Ubinas, E., Ruiz-Valero, L., Vega, S. and Neila, J. (2012) Applications of Phase Change Material in highly Energy-Efficient Houses. Energy and Buildings, 50, 49-62. http://dx.doi.org/10.1016/j.enbuild.2012.03.018
[11] Jamekhorshid, A., Sadrameli, S.M. and Farid, M. (2014) A Review of Microencapsulation Methods of Phase Change Materials (PCMs) as a Thermal Energy Storage (TES) Medium. Renewable and Sustainable Energy Reviews, 31, 531- 542. http://dx.doi.org/10.1016/j.rser.2013.12.033
[12] Ma, Y.H., Sun, S.D., Li, J.Y. and Tang, G.Y. (2014) Preparation and Thermal Reliabilities of Microencapsulated Phase Change Materials with Binary Cores and Acrylate-Based Polymer Shells. Thermochimica Acta, 588, 38-46. http://dx.doi.org/10.1016/j.tca.2014.04.023
[13] He, F., Wang, X.D. and Wu, D.Z. (2014) New Approach for Sol-Gel Synthesis of Microencapsulated N-Octadecane Phase Change Material with Silica Wall Using Sodium Silicate Precursor. Energy, 67, 223-233. http://dx.doi.org/10.1016/j.energy.2013.11.088
[14] Nomura, T., Okinaka, N. and Akiyama, T. (2009) Impregnation of Porous Material with Phase Change Material for Thermal Energy Storage. Materials Chemistry and Physics, 115, 846-850. http://dx.doi.org/10.1016/j.matchemphys.2009.02.045
[15] Oy, T., Nomura, T., Okinaka, N. and Akiyama, T. (2013) Thermal Conductivity Enhancement of Erythritol as PCM by Using Graphite and Nickel Particles. Applied Thermal Engineering, 61, 825-828. http://dx.doi.org/10.1016/j.applthermaleng.2012.05.033
[16] Py, X., Olives, R. and Mauran, S. (2001) Paraffin/Porous-Graphite-Matrix Composite as a High and Constant Power Thermal Storage Material. International Journal of Heat and Mass Transfer, 44, 2727-2737. http://dx.doi.org/10.1016/S0017-9310(00)00309-4
[17] Memon, S., Lo, T.Y., Barbhuiya, S.A. and Xua, W.T. (2013) Development of Form-Stable Composite Phase Change Material by Incorporation of Dodecyl Alcohol into Ground Granulated Blast Furnace Slag. Energy and Buildings, 62, 360-367. http://dx.doi.org/10.1016/j.enbuild.2013.03.026
[18] Giraldo, C., Tobón, J.I. and Restrepo Baena, O.J. (2012) Ultramarine Blue Pigment: A Non-Conventional Pozzolan. Construction and Building Materials, 36, 305-310. http://dx.doi.org/10.1016/j.conbuildmat.2012.04.011

E. Aranzabe et al.
184
[19] Fleet, M.E. and Liu, X. (2010) X-Ray Absorption Spectroscopy of Ultramarine Pigments: A New Analytical Method for the Polysulfide Radical Anion S3-Chromophore. Spectrochimica Acta Part B: Atomic Spectroscopy, 65, 75-79. http://dx.doi.org/10.1016/j.sab.2009.11.008
[20] Scherrer, P. (1918) Bestimmung, der Grosse und der inneren Struktur von Kolloidteilchen mittels Rontgenstrahlen. Nachrichten von der Gesellschaft der Wissenschaften zu Göttingen, 26, 98-100.
[21] Rietveld, H.M. (1969) A Profile Refinement Method for Nuclear and Magnetic Structures. Journal of Applied Crystal-lography, 2, 65-71. http://dx.doi.org/10.1107/S0021889869006558
[22] Rodríguez-Carvajal, J. (1993) Recent Advances in Magnetic Structure Determination by Neutron Powder Diffraction. Physica B: Condensed Matter, 192, 55-69. http://dx.doi.org/10.1016/0921-4526(93)90108-I
[23] Rodríguez-Carvajal, J. (2001) Recent Developments of the Program FULLPROF, in Commission on Powder Diffrac-tion (IUCr). Newsletter, 26, 12-19.


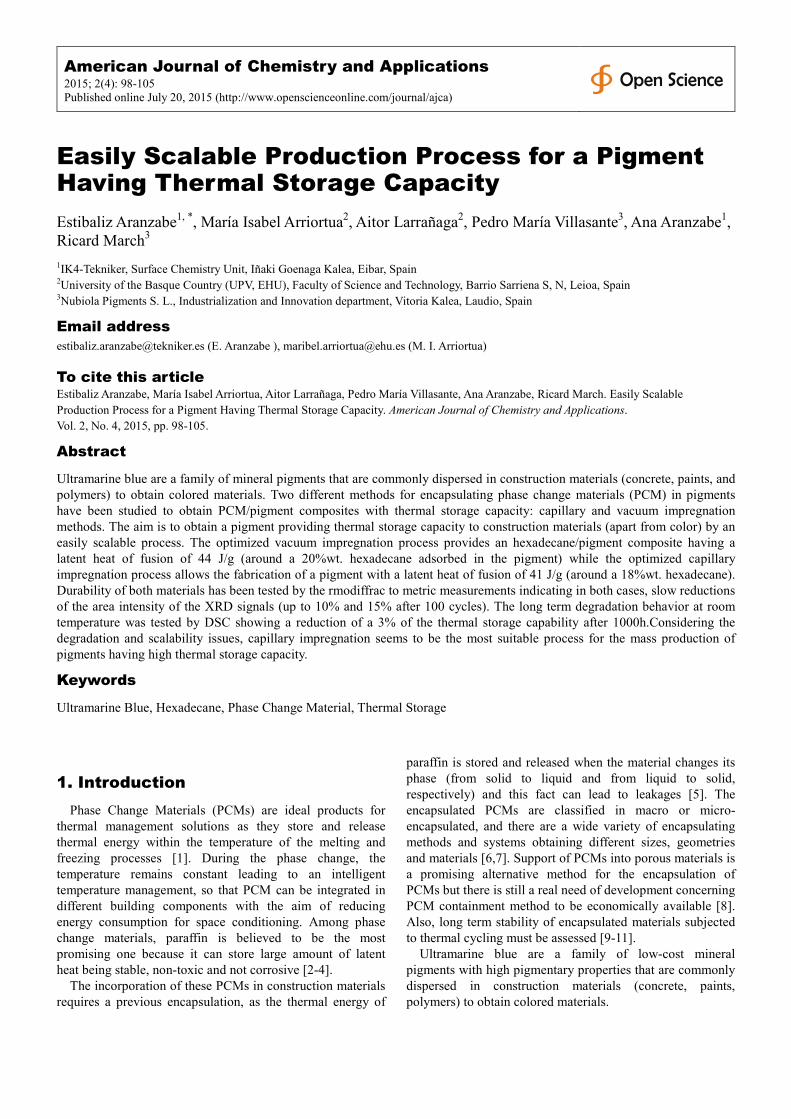
American Journal of Chemistry and Applications 2015; 2(4): 98-105 Published online July 20, 2015 (http://www.openscienceonline.com/journal/ajca)
Easily Scalable Production Process for a Pigment Having Thermal Storage Capacity
Estibaliz Aranzabe1, *, María Isabel Arriortua2, Aitor Larrañaga2, Pedro María Villasante3, Ana Aranzabe1, Ricard March3
1IK4-Tekniker, Surface Chemistry Unit, Iñaki Goenaga Kalea, Eibar, Spain 2University of the Basque Country (UPV, EHU), Faculty of Science and Technology, Barrio Sarriena S, N, Leioa, Spain 3Nubiola Pigments S. L., Industrialization and Innovation department, Vitoria Kalea, Laudio, Spain
Email address
[email protected] (E. Aranzabe ), [email protected] (M. I. Arriortua)
To cite this article Estibaliz Aranzabe, María Isabel Arriortua, Aitor Larrañaga, Pedro María Villasante, Ana Aranzabe, Ricard March. Easily Scalable
Production Process for a Pigment Having Thermal Storage Capacity. American Journal of Chemistry and Applications.
Vol. 2, No. 4, 2015, pp. 98-105.
Abstract
Ultramarine blue are a family of mineral pigments that are commonly dispersed in construction materials (concrete, paints, and polymers) to obtain colored materials. Two different methods for encapsulating phase change materials (PCM) in pigments have been studied to obtain PCM/pigment composites with thermal storage capacity: capillary and vacuum impregnation methods. The aim is to obtain a pigment providing thermal storage capacity to construction materials (apart from color) by an easily scalable process. The optimized vacuum impregnation process provides an hexadecane/pigment composite having a latent heat of fusion of 44 J/g (around a 20%wt. hexadecane adsorbed in the pigment) while the optimized capillary impregnation process allows the fabrication of a pigment with a latent heat of fusion of 41 J/g (around a 18%wt. hexadecane). Durability of both materials has been tested by the rmodiffrac to metric measurements indicating in both cases, slow reductions of the area intensity of the XRD signals (up to 10% and 15% after 100 cycles). The long term degradation behavior at room temperature was tested by DSC showing a reduction of a 3% of the thermal storage capability after 1000h.Considering the degradation and scalability issues, capillary impregnation seems to be the most suitable process for the mass production of pigments having high thermal storage capacity.
Keywords
Ultramarine Blue, Hexadecane, Phase Change Material, Thermal Storage
1. Introduction
Phase Change Materials (PCMs) are ideal products for thermal management solutions as they store and release thermal energy within the temperature of the melting and freezing processes [1]. During the phase change, the temperature remains constant leading to an intelligent temperature management, so that PCM can be integrated in different building components with the aim of reducing energy consumption for space conditioning. Among phase change materials, paraffin is believed to be the most promising one because it can store large amount of latent heat being stable, non-toxic and not corrosive [2-4].
The incorporation of these PCMs in construction materials requires a previous encapsulation, as the thermal energy of
paraffin is stored and released when the material changes its phase (from solid to liquid and from liquid to solid, respectively) and this fact can lead to leakages [5]. The encapsulated PCMs are classified in macro or micro-encapsulated, and there are a wide variety of encapsulating methods and systems obtaining different sizes, geometries and materials [6,7]. Support of PCMs into porous materials is a promising alternative method for the encapsulation of PCMs but there is still a real need of development concerning PCM containment method to be economically available [8]. Also, long term stability of encapsulated materials subjected to thermal cycling must be assessed [9-11].
Ultramarine blue are a family of low-cost mineral pigments with high pigmentary properties that are commonly dispersed in construction materials (concrete, paints, polymers) to obtain colored materials.
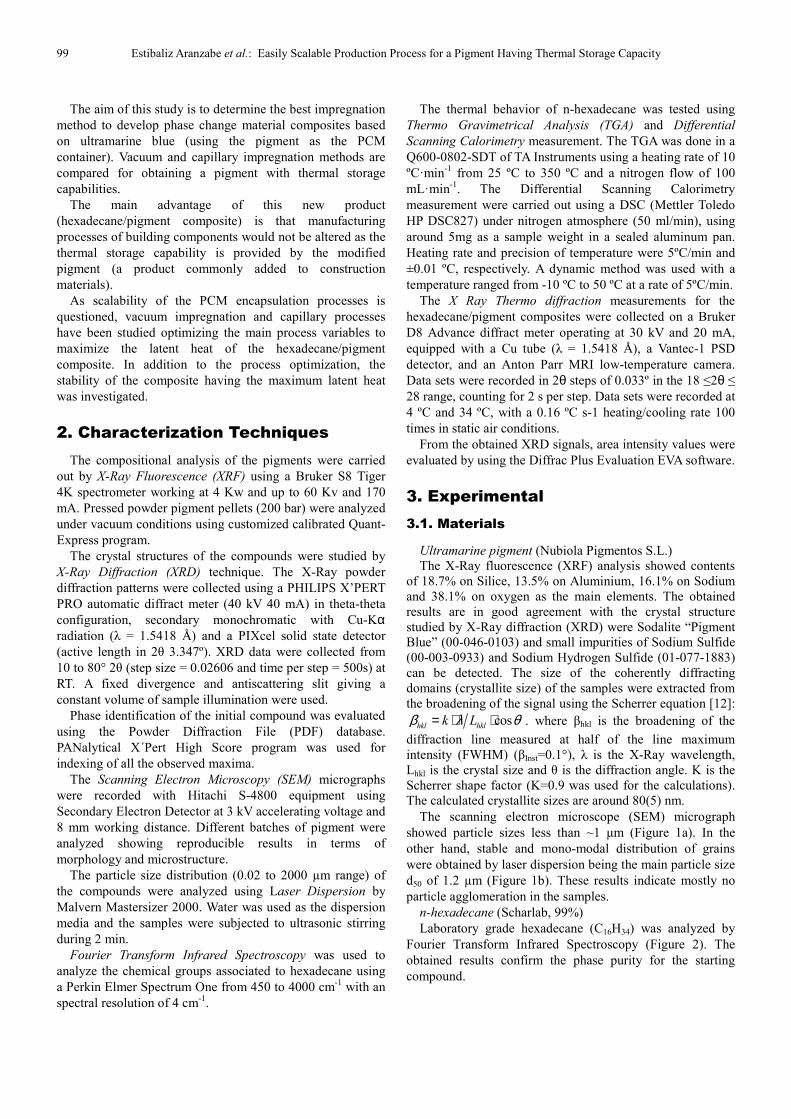
99 Estibaliz Aranzabe et al.: Easily Scalable Production Process for a Pigment Having Thermal Storage Capacity
The aim of this study is to determine the best impregnation method to develop phase change material composites based on ultramarine blue (using the pigment as the PCM container). Vacuum and capillary impregnation methods are compared for obtaining a pigment with thermal storage capabilities.
The main advantage of this new product (hexadecane/pigment composite) is that manufacturing processes of building components would not be altered as the thermal storage capability is provided by the modified pigment (a product commonly added to construction materials).
As scalability of the PCM encapsulation processes is questioned, vacuum impregnation and capillary processes have been studied optimizing the main process variables to maximize the latent heat of the hexadecane/pigment composite. In addition to the process optimization, the stability of the composite having the maximum latent heat was investigated.
2. Characterization Techniques
The compositional analysis of the pigments were carried out by X-Ray Fluorescence (XRF) using a Bruker S8 Tiger 4K spectrometer working at 4 Kw and up to 60 Kv and 170 mA. Pressed powder pigment pellets (200 bar) were analyzed under vacuum conditions using customized calibrated Quant-Express program.
The crystal structures of the compounds were studied by X-Ray Diffraction (XRD) technique. The X-Ray powder diffraction patterns were collected using a PHILIPS X’PERT PRO automatic diffract meter (40 kV 40 mA) in theta-theta configuration, secondary monochromatic with Cu-Kα radiation (λ = 1.5418 Å) and a PIXcel solid state detector (active length in 2θ 3.347º). XRD data were collected from 10 to 80° 2θ (step size = 0.02606 and time per step = 500s) at RT. A fixed divergence and antiscattering slit giving a constant volume of sample illumination were used.
Phase identification of the initial compound was evaluated using the Powder Diffraction File (PDF) database. PANalytical X´Pert High Score program was used for indexing of all the observed maxima.
The Scanning Electron Microscopy (SEM) micrographs were recorded with Hitachi S-4800 equipment using Secondary Electron Detector at 3 kV accelerating voltage and 8 mm working distance. Different batches of pigment were analyzed showing reproducible results in terms of morphology and microstructure.
The particle size distribution (0.02 to 2000 µm range) of the compounds were analyzed using Laser Dispersion by Malvern Mastersizer 2000. Water was used as the dispersion media and the samples were subjected to ultrasonic stirring during 2 min.
Fourier Transform Infrared Spectroscopy was used to analyze the chemical groups associated to hexadecane using a Perkin Elmer Spectrum One from 450 to 4000 cm-1 with an spectral resolution of 4 cm-1.
The thermal behavior of n-hexadecane was tested using Thermo Gravimetrical Analysis (TGA) and Differential
Scanning Calorimetry measurement. The TGA was done in a Q600-0802-SDT of TA Instruments using a heating rate of 10 ºC·min-1 from 25 ºC to 350 ºC and a nitrogen flow of 100 mL·min-1. The Differential Scanning Calorimetry measurement were carried out using a DSC (Mettler Toledo HP DSC827) under nitrogen atmosphere (50 ml/min), using around 5mg as a sample weight in a sealed aluminum pan. Heating rate and precision of temperature were 5ºC/min and ±0.01 ºC, respectively. A dynamic method was used with a temperature ranged from -10 ºC to 50 ºC at a rate of 5ºC/min.
The X Ray Thermo diffraction measurements for the hexadecane/pigment composites were collected on a Bruker D8 Advance diffract meter operating at 30 kV and 20 mA, equipped with a Cu tube (λ = 1.5418 Å), a Vantec-1 PSD detector, and an Anton Parr MRI low-temperature camera. Data sets were recorded in 2θ steps of 0.033º in the 18 ≤2θ ≤ 28 range, counting for 2 s per step. Data sets were recorded at 4 ºC and 34 ºC, with a 0.16 ºC s-1 heating/cooling rate 100 times in static air conditions.
From the obtained XRD signals, area intensity values were evaluated by using the Diffrac Plus Evaluation EVA software.
3. Experimental
3.1. Materials
Ultramarine pigment (Nubiola Pigmentos S.L.) The X-Ray fluorescence (XRF) analysis showed contents
of 18.7% on Silice, 13.5% on Aluminium, 16.1% on Sodium and 38.1% on oxygen as the main elements. The obtained results are in good agreement with the crystal structure studied by X-Ray diffraction (XRD) were Sodalite “Pigment Blue” (00-046-0103) and small impurities of Sodium Sulfide (00-003-0933) and Sodium Hydrogen Sulfide (01-077-1883) can be detected. The size of the coherently diffracting domains (crystallite size) of the samples were extracted from the broadening of the signal using the Scherrer equation [12]:
coshkl hklk Lβ λ θ= ⋅ ⋅ . where βhkl is the broadening of the
diffraction line measured at half of the line maximum intensity (FWHM) (βInst=0.1°), λ is the X-Ray wavelength, Lhkl is the crystal size and θ is the diffraction angle. K is the Scherrer shape factor (K=0.9 was used for the calculations). The calculated crystallite sizes are around 80(5) nm.
The scanning electron microscope (SEM) micrograph showed particle sizes less than ~1 µm (Figure 1a). In the other hand, stable and mono-modal distribution of grains were obtained by laser dispersion being the main particle size d50 of 1.2 µm (Figure 1b). These results indicate mostly no particle agglomeration in the samples.
n-hexadecane (Scharlab, 99%) Laboratory grade hexadecane (C16H34) was analyzed by
Fourier Transform Infrared Spectroscopy (Figure 2). The obtained results confirm the phase purity for the starting compound.
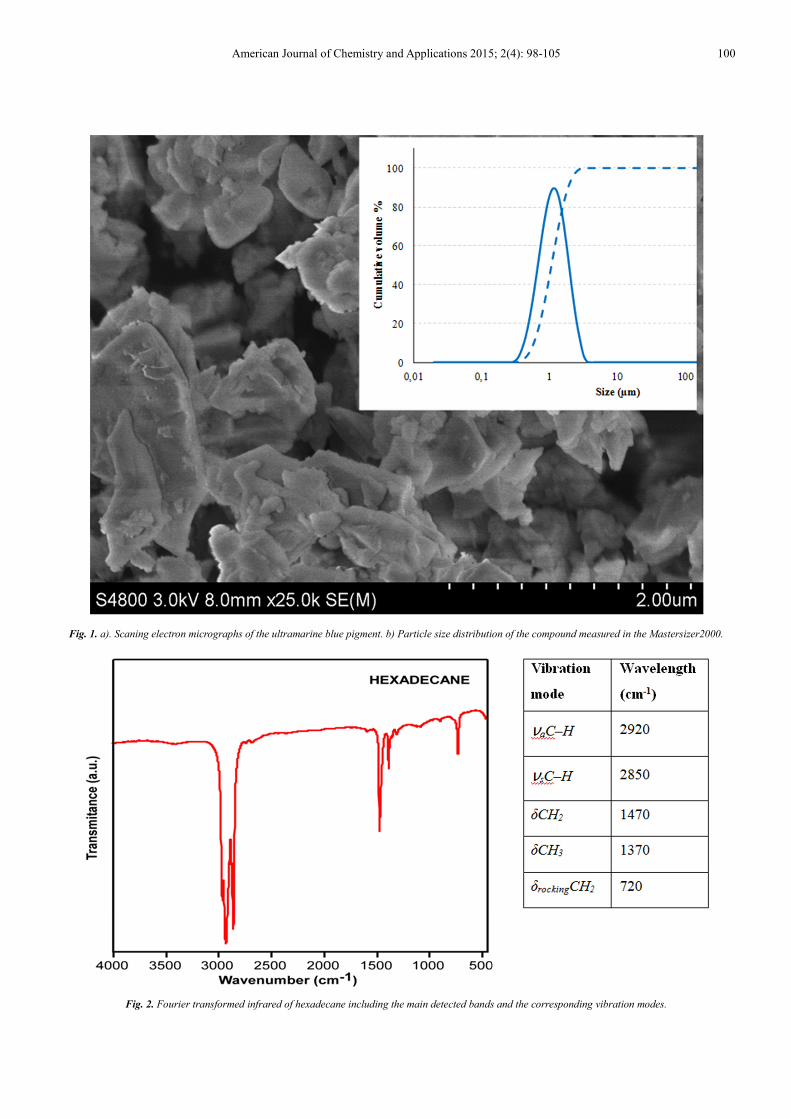
American Journal of Chemistry and Applications 2015; 2(4): 98-105 100
Fig. 1. a). Scaning electron micrographs of the ultramarine blue pigment. b) Particle size distribution of the compound measured in the Mastersizer2000.
Fig. 2. Fourier transformed infrared of hexadecane including the main detected bands and the corresponding vibration modes.
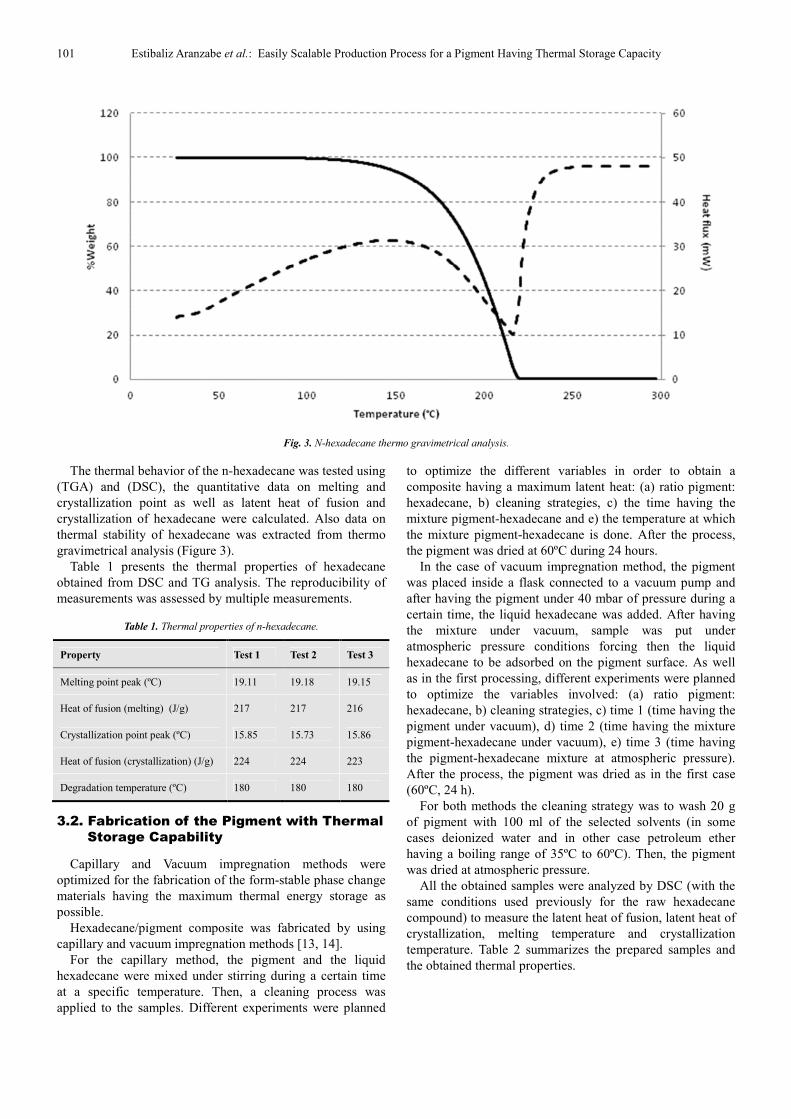
101 Estibaliz Aranzabe et al.: Easily Scalable Production Process for a Pigment Having Thermal Storage Capacity
Fig. 3. N-hexadecane thermo gravimetrical analysis.
The thermal behavior of the n-hexadecane was tested using (TGA) and (DSC), the quantitative data on melting and crystallization point as well as latent heat of fusion and crystallization of hexadecane were calculated. Also data on thermal stability of hexadecane was extracted from thermo gravimetrical analysis (Figure 3).
Table 1 presents the thermal properties of hexadecane obtained from DSC and TG analysis. The reproducibility of measurements was assessed by multiple measurements.
Table 1. Thermal properties of n-hexadecane.
Property Test 1 Test 2 Test 3
Melting point peak (ºC) 19.11 19.18 19.15
Heat of fusion (melting) (J/g) 217 217 216
Crystallization point peak (ºC) 15.85 15.73 15.86
Heat of fusion (crystallization) (J/g) 224 224 223
Degradation temperature (ºC) 180 180 180
3.2. Fabrication of the Pigment with Thermal
Storage Capability
Capillary and Vacuum impregnation methods were optimized for the fabrication of the form-stable phase change materials having the maximum thermal energy storage as possible.
Hexadecane/pigment composite was fabricated by using capillary and vacuum impregnation methods [13, 14].
For the capillary method, the pigment and the liquid hexadecane were mixed under stirring during a certain time at a specific temperature. Then, a cleaning process was applied to the samples. Different experiments were planned
to optimize the different variables in order to obtain a composite having a maximum latent heat: (a) ratio pigment: hexadecane, b) cleaning strategies, c) the time having the mixture pigment-hexadecane and e) the temperature at which the mixture pigment-hexadecane is done. After the process, the pigment was dried at 60ºC during 24 hours.
In the case of vacuum impregnation method, the pigment was placed inside a flask connected to a vacuum pump and after having the pigment under 40 mbar of pressure during a certain time, the liquid hexadecane was added. After having the mixture under vacuum, sample was put under atmospheric pressure conditions forcing then the liquid hexadecane to be adsorbed on the pigment surface. As well as in the first processing, different experiments were planned to optimize the variables involved: (a) ratio pigment: hexadecane, b) cleaning strategies, c) time 1 (time having the pigment under vacuum), d) time 2 (time having the mixture pigment-hexadecane under vacuum), e) time 3 (time having the pigment-hexadecane mixture at atmospheric pressure). After the process, the pigment was dried as in the first case (60ºC, 24 h).
For both methods the cleaning strategy was to wash 20 g of pigment with 100 ml of the selected solvents (in some cases deionized water and in other case petroleum ether having a boiling range of 35ºC to 60ºC). Then, the pigment was dried at atmospheric pressure.
All the obtained samples were analyzed by DSC (with the same conditions used previously for the raw hexadecane compound) to measure the latent heat of fusion, latent heat of crystallization, melting temperature and crystallization temperature. Table 2 summarizes the prepared samples and the obtained thermal properties.
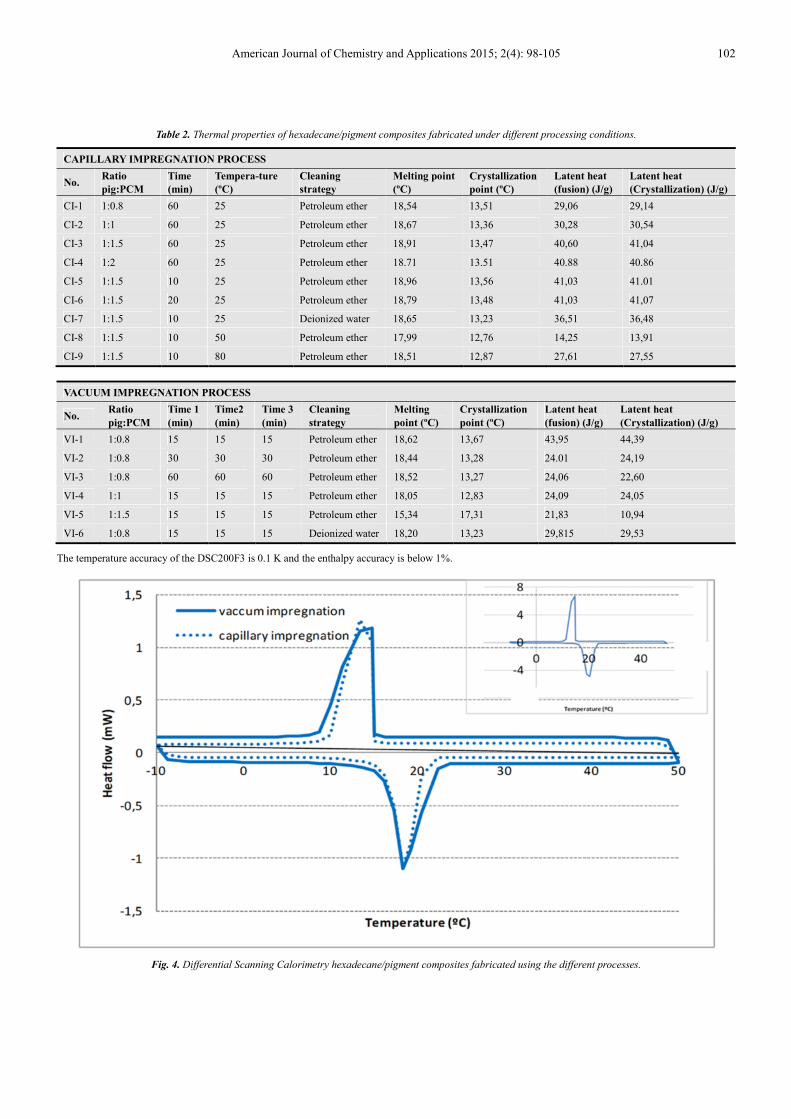
American Journal of Chemistry and Applications 2015; 2(4): 98-105 102
Table 2. Thermal properties of hexadecane/pigment composites fabricated under different processing conditions.
CAPILLARY IMPREGNATION PROCESS
No. Ratio
pig:PCM
Time
(min)
Tempera-ture
(ºC)
Cleaning
strategy
Melting point
(ºC)
Crystallization
point (ºC)
Latent heat
(fusion) (J/g)
Latent heat
(Crystallization) (J/g)
CI-1 1:0.8 60 25 Petroleum ether 18,54 13,51 29,06 29,14
CI-2 1:1 60 25 Petroleum ether 18,67 13,36 30,28 30,54
CI-3 1:1.5 60 25 Petroleum ether 18,91 13,47 40,60 41,04
CI-4 1:2 60 25 Petroleum ether 18.71 13.51 40.88 40.86
CI-5 1:1.5 10 25 Petroleum ether 18,96 13,56 41,03 41.01
CI-6 1:1.5 20 25 Petroleum ether 18,79 13,48 41,03 41,07
CI-7 1:1.5 10 25 Deionized water 18,65 13,23 36,51 36,48
CI-8 1:1.5 10 50 Petroleum ether 17,99 12,76 14,25 13,91
CI-9 1:1.5 10 80 Petroleum ether 18,51 12,87 27,61 27,55
VACUUM IMPREGNATION PROCESS
No. Ratio
pig:PCM
Time 1
(min)
Time2
(min)
Time 3
(min)
Cleaning
strategy
Melting
point (ºC)
Crystallization
point (ºC)
Latent heat
(fusion) (J/g)
Latent heat
(Crystallization) (J/g)
VI-1 1:0.8 15 15 15 Petroleum ether 18,62 13,67 43,95 44,39
VI-2 1:0.8 30 30 30 Petroleum ether 18,44 13,28 24.01 24,19
VI-3 1:0.8 60 60 60 Petroleum ether 18,52 13,27 24,06 22,60
VI-4 1:1 15 15 15 Petroleum ether 18,05 12,83 24,09 24,05
VI-5 1:1.5 15 15 15 Petroleum ether 15,34 17,31 21,83 10,94
VI-6 1:0.8 15 15 15 Deionized water 18,20 13,23 29,815 29,53
The temperature accuracy of the DSC200F3 is 0.1 K and the enthalpy accuracy is below 1%.
Fig. 4. Differential Scanning Calorimetry hexadecane/pigment composites fabricated using the different processes.
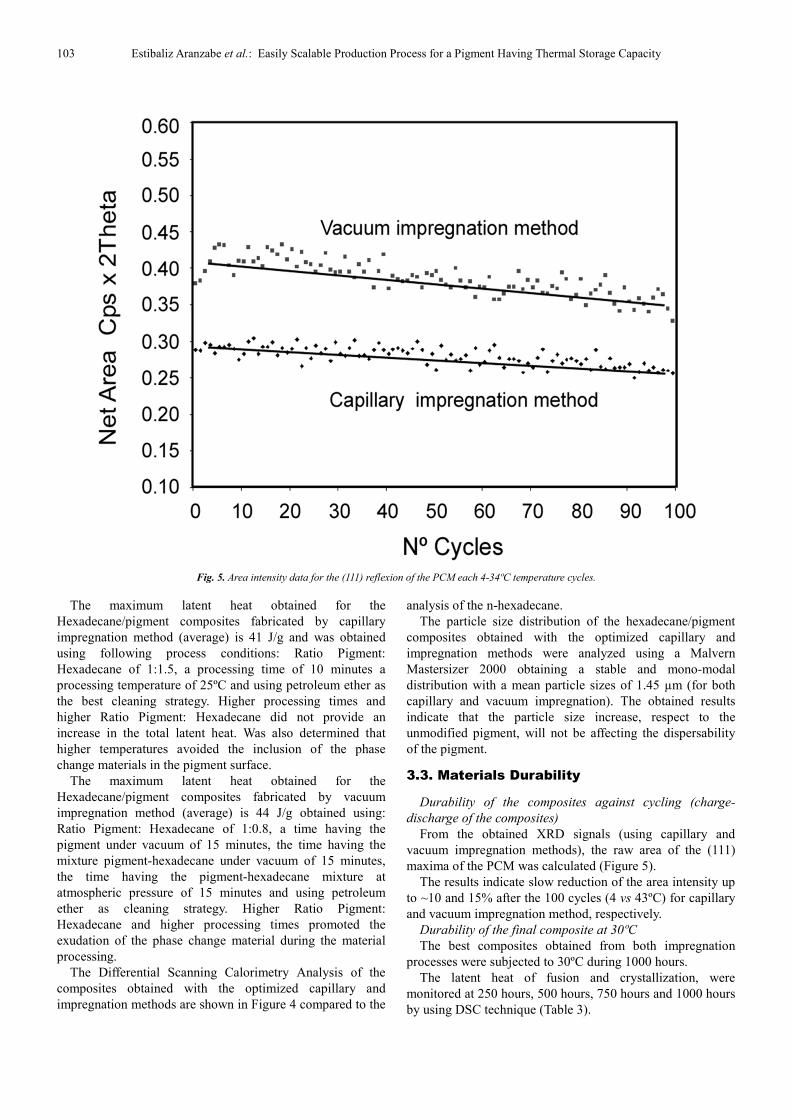
103 Estibaliz Aranzabe et al.: Easily Scalable Production Process for a Pigment Having Thermal Storage Capacity
Fig. 5. Area intensity data for the (111) reflexion of the PCM each 4-34ºC temperature cycles.
The maximum latent heat obtained for the Hexadecane/pigment composites fabricated by capillary impregnation method (average) is 41 J/g and was obtained using following process conditions: Ratio Pigment: Hexadecane of 1:1.5, a processing time of 10 minutes a processing temperature of 25ºC and using petroleum ether as the best cleaning strategy. Higher processing times and higher Ratio Pigment: Hexadecane did not provide an increase in the total latent heat. Was also determined that higher temperatures avoided the inclusion of the phase change materials in the pigment surface.
The maximum latent heat obtained for the Hexadecane/pigment composites fabricated by vacuum impregnation method (average) is 44 J/g obtained using: Ratio Pigment: Hexadecane of 1:0.8, a time having the pigment under vacuum of 15 minutes, the time having the mixture pigment-hexadecane under vacuum of 15 minutes, the time having the pigment-hexadecane mixture at atmospheric pressure of 15 minutes and using petroleum ether as cleaning strategy. Higher Ratio Pigment: Hexadecane and higher processing times promoted the exudation of the phase change material during the material processing.
The Differential Scanning Calorimetry Analysis of the composites obtained with the optimized capillary and impregnation methods are shown in Figure 4 compared to the
analysis of the n-hexadecane. The particle size distribution of the hexadecane/pigment
composites obtained with the optimized capillary and impregnation methods were analyzed using a Malvern Mastersizer 2000 obtaining a stable and mono-modal distribution with a mean particle sizes of 1.45 µm (for both capillary and vacuum impregnation). The obtained results indicate that the particle size increase, respect to the unmodified pigment, will not be affecting the dispersability of the pigment.
3.3. Materials Durability
Durability of the composites against cycling (charge-
discharge of the composites)
From the obtained XRD signals (using capillary and vacuum impregnation methods), the raw area of the (111) maxima of the PCM was calculated (Figure 5).
The results indicate slow reduction of the area intensity up to ~10 and 15% after the 100 cycles (4 vs 43ºC) for capillary and vacuum impregnation method, respectively.
Durability of the final composite at 30ºC
The best composites obtained from both impregnation processes were subjected to 30ºC during 1000 hours.
The latent heat of fusion and crystallization, were monitored at 250 hours, 500 hours, 750 hours and 1000 hours by using DSC technique (Table 3).
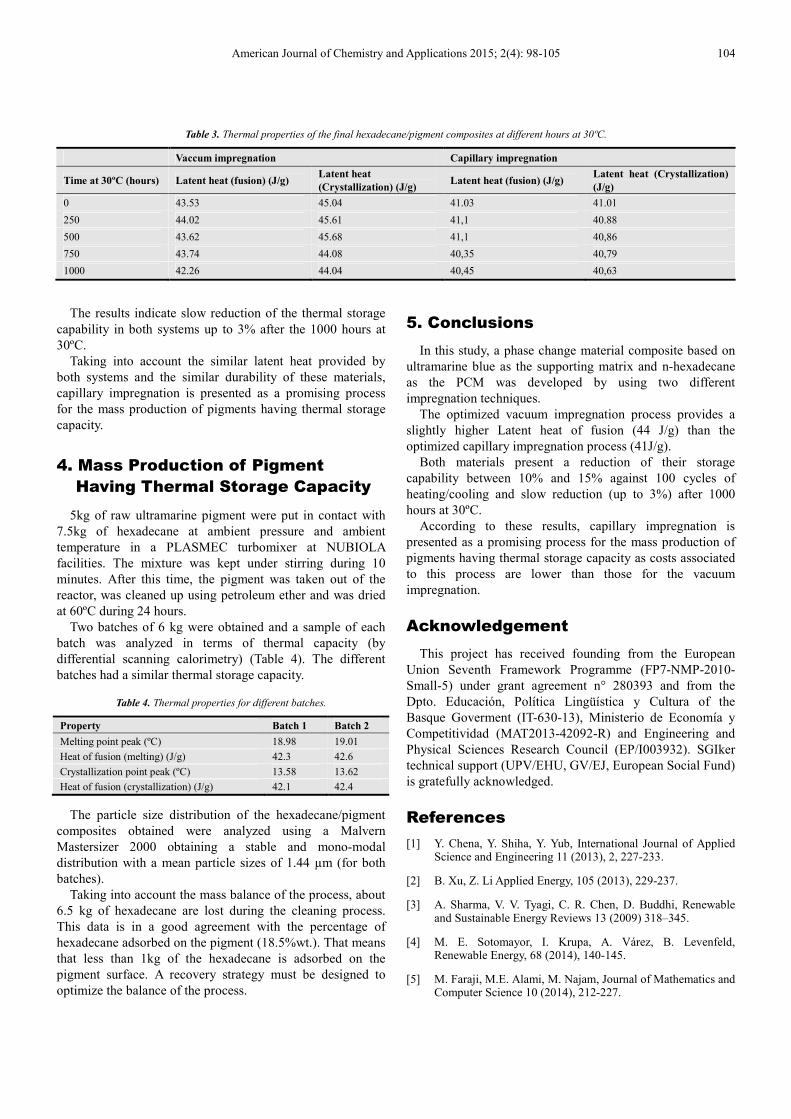
American Journal of Chemistry and Applications 2015; 2(4): 98-105 104
Table 3. Thermal properties of the final hexadecane/pigment composites at different hours at 30ºC.
Vaccum impregnation Capillary impregnation
Time at 30ºC (hours) Latent heat (fusion) (J/g) Latent heat
(Crystallization) (J/g) Latent heat (fusion) (J/g)
Latent heat (Crystallization)
(J/g)
0 43.53 45.04 41.03 41.01
250 44.02 45.61 41,1 40.88
500 43.62 45.68 41,1 40,86
750 43.74 44.08 40,35 40,79
1000 42.26 44.04 40,45 40,63
The results indicate slow reduction of the thermal storage capability in both systems up to 3% after the 1000 hours at 30ºC.
Taking into account the similar latent heat provided by both systems and the similar durability of these materials, capillary impregnation is presented as a promising process for the mass production of pigments having thermal storage capacity.
4. Mass Production of Pigment
Having Thermal Storage Capacity
5kg of raw ultramarine pigment were put in contact with 7.5kg of hexadecane at ambient pressure and ambient temperature in a PLASMEC turbomixer at NUBIOLA facilities. The mixture was kept under stirring during 10 minutes. After this time, the pigment was taken out of the reactor, was cleaned up using petroleum ether and was dried at 60ºC during 24 hours.
Two batches of 6 kg were obtained and a sample of each batch was analyzed in terms of thermal capacity (by differential scanning calorimetry) (Table 4). The different batches had a similar thermal storage capacity.
Table 4. Thermal properties for different batches.
Property Batch 1 Batch 2
Melting point peak (ºC) 18.98 19.01
Heat of fusion (melting) (J/g) 42.3 42.6
Crystallization point peak (ºC) 13.58 13.62
Heat of fusion (crystallization) (J/g) 42.1 42.4
The particle size distribution of the hexadecane/pigment composites obtained were analyzed using a Malvern Mastersizer 2000 obtaining a stable and mono-modal distribution with a mean particle sizes of 1.44 µm (for both batches).
Taking into account the mass balance of the process, about 6.5 kg of hexadecane are lost during the cleaning process. This data is in a good agreement with the percentage of hexadecane adsorbed on the pigment (18.5%wt.). That means that less than 1kg of the hexadecane is adsorbed on the pigment surface. A recovery strategy must be designed to optimize the balance of the process.
5. Conclusions
In this study, a phase change material composite based on ultramarine blue as the supporting matrix and n-hexadecane as the PCM was developed by using two different impregnation techniques.
The optimized vacuum impregnation process provides a slightly higher Latent heat of fusion (44 J/g) than the optimized capillary impregnation process (41J/g).
Both materials present a reduction of their storage capability between 10% and 15% against 100 cycles of heating/cooling and slow reduction (up to 3%) after 1000 hours at 30ºC.
According to these results, capillary impregnation is presented as a promising process for the mass production of pigments having thermal storage capacity as costs associated to this process are lower than those for the vacuum impregnation.
Acknowledgement
This project has received founding from the European Union Seventh Framework Programme (FP7-NMP-2010-Small-5) under grant agreement n° 280393 and from the Dpto. Educación, Política Lingüística y Cultura of the Basque Goverment (IT-630-13), Ministerio de Economía y Competitividad (MAT2013-42092-R) and Engineering and Physical Sciences Research Council (EP/I003932). SGIker technical support (UPV/EHU, GV/EJ, European Social Fund) is gratefully acknowledged.
References
[1] Y. Chena, Y. Shiha, Y. Yub, International Journal of Applied Science and Engineering 11 (2013), 2, 227-233.
[2] B. Xu, Z. Li Applied Energy, 105 (2013), 229-237.
[3] A. Sharma, V. V. Tyagi, C. R. Chen, D. Buddhi, Renewable and Sustainable Energy Reviews 13 (2009) 318–345.
[4] M. E. Sotomayor, I. Krupa, A. Várez, B. Levenfeld, Renewable Energy, 68 (2014), 140-145.
[5] M. Faraji, M.E. Alami, M. Najam, Journal of Mathematics and Computer Science 10 (2014), 212-227.

105 Estibaliz Aranzabe et al.: Easily Scalable Production Process for a Pigment Having Thermal Storage Capacity
[6] E. Rodriguez-Ubinas, L. Ruiz-Valero, S. Vega, J. Neila, Energy and Buildings 50 (2012) 49–62.
[7] A. Jamekhorshid, S.M. Sadrameli, M. Farid, Renewable and Sustainable Energy Reviews, 31 (2014) 531–542.
[8] X. Li, J. Sanjayan, J. Wilson, Energy and Buildings 76 (2014) 284–294.
[9] X. Py, R. Olives, S. Mauran, International Journal of Heat and Mass Transfer 44 (2001) 2727-2737.
[10] S. Memona, T. Loa, S.A. Barbhuiyab, W. Xua, Energy and Buildings 62 (2013) 360–367.
[11] T. Oya, T. Nomura, N. Okinaka, T. Akiyama, Applied Thermal Engineering 61 (2013) 825-828.
[12] P. Scherrer P. Bestimmung der Grosse und der inneren Struktur von Kolloidteilchen mittels Rontgenstrahlen. Nachr Ges Wiss Gottingen, 26, pp. 98-100, 1918.
[13] T. Nomura, N. Okinaka, T. Akiyama, Materials Chemistry and Physics, Vol. 115, 2-3, (2009) 846-850.
[14] R. Liu, F. Zhang, W. Su, H. Zhao, C. Wang, Solar energy materials and solar cells, Vol. 134 (2015) 268–274.


Pb
EJa
b
c
a
ARRAA
KUTLC
1
esp
cs[a
Bitceq
m
h0
Energy and Buildings 126 (2016) 170–176
Contents lists available at ScienceDirect
Energy and Buildings
j ourna l ho me pa g e: www.elsev ier .com/ locate /enbui ld
reparation and characterization of high NIR reflective pigmentsased in ultramarine blue
stibaliz Aranzabea,∗, Pedro María Villasantec, Ricard Marchc, María Isabel Arriortuab,∗,ulen Vadilloa, Aitor Larranagab, Ana Aranzabea
IK4-Tekniker, Surface Chemistry Unit, Calle Inaki Goenaga, 5, 20600 Eibar, Gipuzkoa, SpainUniversidad del País Vasco (UPV/EHU), Facultad de Ciencia y Tecnología, Barrio Sarriena S/N, 48940 Leioa, Bizkaia, SpainNubiola Pigmentos S.L., Vitoria Kalea, 19, 01400 Laudio, Araba, Spain
r t i c l e i n f o
rticle history:eceived 18 December 2015eceived in revised form 27 April 2016ccepted 6 May 2016vailable online 13 May 2016
eywords:ltramarine blue
a b s t r a c t
Buildings are responsible for at least 40% of energy use in most countries. High reflectance outdoorcoatings can bring significant energy savings for building applications. In this context, ultramarine bluepigment (UB) has been modified to increase its near infrared reflectance by depositing a reflecting filmbased on TiO2 containing different types and concentrations of nanoparticles (alumina, titania and amixture of them). The developed pigments were characterized by X-ray diffraction (XRD), field emissionscanning electron microscopy (FE-SEM) and laser dispersion.
For testing the performance of the modified pigments, they have been dispersed in a conventional
otal solar reflectanceightnessool coating
waterborne paint at different percentages and characterized by UV–Vis-NIR spectrophotometry (mea-suring Total Solar Reflectance and CIE L × a × b × ). All the obtained paints increased the TSR in 2.65%when adding nanoparticles but the maximum value was obtained for an addition of 6 wt.% of titaniananoparticles. Higher contents of nanoparticles led to agglomeration reducing the reflectance in the finalpaint.
© 2016 Elsevier B.V. All rights reserved.
. Introduction
Buildings are responsible for more than 40 percent of globalnergy use and one third of global greenhouse gas (GHG) emis-ions. This fact has made energy efficiency and savings strategies ariority for energy policies at world level [1,2].
Especially important has been the intensification of energyonsumption in Heating, ventilation and air conditioning (HVAC)ystems accounting for around 40% of total building consumption3,4] and being the largest energy end use both in the residentialnd non-residential sector.
The EPBD (European Directive o the Energy Performance ofuildings) [5] was adopted with the objective of “promote the
mprovement of the energy performance of buildings withinhe community taking into account outdoor climatic and local
onditions, as well as indoor climate requirements and cost-ffectiveness”. Building sector has the greatest potential to deliveruick, deep and cost effective reductions in GHG emissions [6,7].∗ Corresponding authors.E-mail addresses: [email protected] (E. Aranzabe),
[email protected] (M.I. Arriortua).
ttp://dx.doi.org/10.1016/j.enbuild.2016.05.011378-7788/© 2016 Elsevier B.V. All rights reserved.
The majority of the building stock in Europe is pre-1990 and40–50% is pre-1960. In order to address the huge challenge ofaffordable building refurbishment, different solutions are beingexplored with the aim of obtaining substantial energy savings atan acceptable investment [8,9].
Solutions from the chemical and materials science can bringsignificant energy savings for building applications being the highreflectance outdoor coatings one of the most promising ones [10].These coatings reflect sunlight radiation in the infrared part ofthe spectrum. Since nearly half of the solar radiation consistsof near-infrared (NIR) radiation (700–2500 nm) which is a directconsequence of heat, the use of NIR reflective materials aids topreserve lower exterior surface temperatures of buildings [11,12].The amount of heat conducted to the interior decreases being pos-sible to save up to 15% of air conditioning energy consumptiondepending on the climate region. Costs of applying these coatingsare affordable and offer reasonable payback times [10].
These high reflectance coatings mainly refer to paints containingcool pigments. Although white pigments such as titanium dioxide
(TiO2) have a high solar reflectance, they cannot always satisfy theconsumer’s demand as they are white. One strategy for non-whitecool pigment production is the use of complex inorganic coloredpigments (CICPs). One barrier for the use of these pigments is their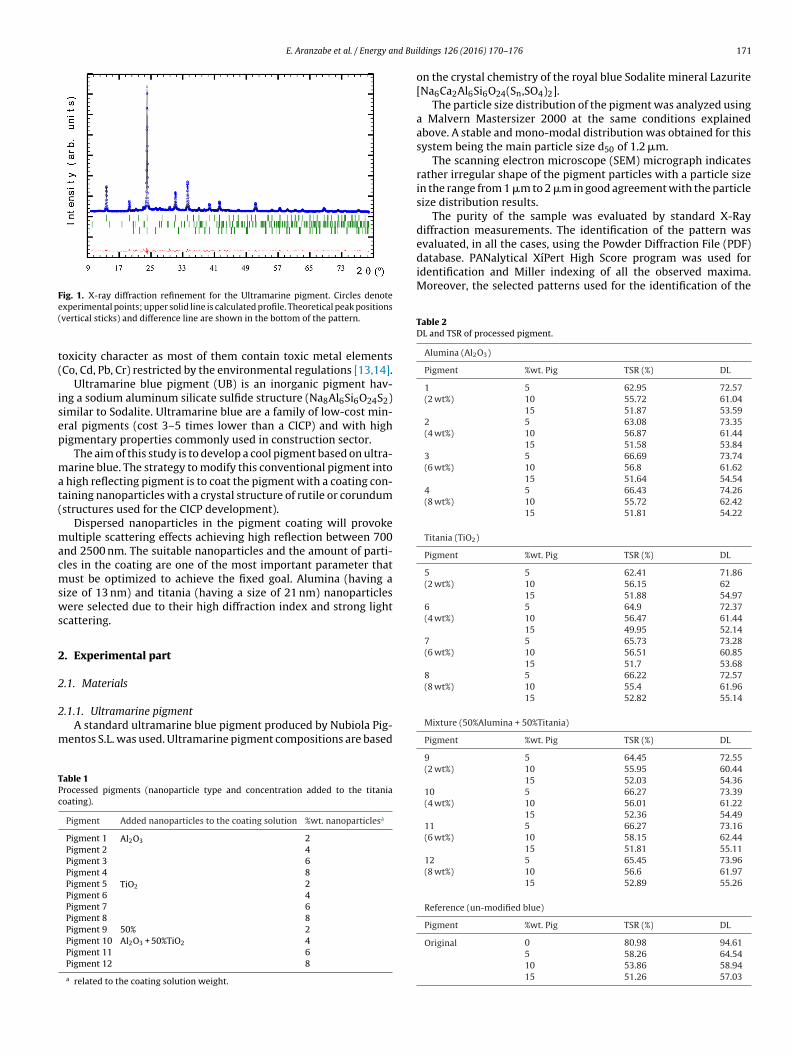
E. Aranzabe et al. / Energy and Bui
Fig. 1. X-ray diffraction refinement for the Ultramarine pigment. Circles denotee(
t(
isep
mat(
macmsws
2
2
2
m
TPc
evaluated, in all the cases, using the Powder Diffraction File (PDF)database. PANalytical XıPert High Score program was used foridentification and Miller indexing of all the observed maxima.Moreover, the selected patterns used for the identification of the
Table 2DL and TSR of processed pigment.
Alumina (Al2O3)
Pigment %wt. Pig TSR (%) DL
1(2 wt%)
5 62.95 72.5710 55.72 61.0415 51.87 53.59
2(4 wt%)
5 63.08 73.3510 56.87 61.4415 51.58 53.84
3(6 wt%)
5 66.69 73.7410 56.8 61.6215 51.64 54.54
4(8 wt%)
5 66.43 74.2610 55.72 62.4215 51.81 54.22
Titania (TiO2)
Pigment %wt. Pig TSR (%) DL
5(2 wt%)
5 62.41 71.8610 56.15 6215 51.88 54.97
6(4 wt%)
5 64.9 72.3710 56.47 61.4415 49.95 52.14
7(6 wt%)
5 65.73 73.2810 56.51 60.8515 51.7 53.68
8(8 wt%)
5 66.22 72.5710 55.4 61.9615 52.82 55.14
xperimental points; upper solid line is calculated profile. Theoretical peak positionsvertical sticks) and difference line are shown in the bottom of the pattern.
oxicity character as most of them contain toxic metal elementsCo, Cd, Pb, Cr) restricted by the environmental regulations [13,14].
Ultramarine blue pigment (UB) is an inorganic pigment hav-ng a sodium aluminum silicate sulfide structure (Na8Al6Si6O24S2)imilar to Sodalite. Ultramarine blue are a family of low-cost min-ral pigments (cost 3–5 times lower than a CICP) and with highigmentary properties commonly used in construction sector.
The aim of this study is to develop a cool pigment based on ultra-arine blue. The strategy to modify this conventional pigment into
high reflecting pigment is to coat the pigment with a coating con-aining nanoparticles with a crystal structure of rutile or corundumstructures used for the CICP development).
Dispersed nanoparticles in the pigment coating will provokeultiple scattering effects achieving high reflection between 700
nd 2500 nm. The suitable nanoparticles and the amount of parti-les in the coating are one of the most important parameter thatust be optimized to achieve the fixed goal. Alumina (having a
ize of 13 nm) and titania (having a size of 21 nm) nanoparticlesere selected due to their high diffraction index and strong light
cattering.
. Experimental part
.1. Materials
.1.1. Ultramarine pigmentA standard ultramarine blue pigment produced by Nubiola Pig-
entos S.L. was used. Ultramarine pigment compositions are based
able 1rocessed pigments (nanoparticle type and concentration added to the titaniaoating).
Pigment Added nanoparticles to the coating solution %wt. nanoparticlesa
Pigment 1 Al2O3 2Pigment 2 4Pigment 3 6Pigment 4 8Pigment 5 TiO2 2Pigment 6 4Pigment 7 6Pigment 8 8Pigment 9 50%
Al2O3 + 50%TiO2
2Pigment 10 4Pigment 11 6Pigment 12 8
a related to the coating solution weight.
ldings 126 (2016) 170–176 171
on the crystal chemistry of the royal blue Sodalite mineral Lazurite[Na6Ca2Al6Si6O24(Sn,SO4)2].
The particle size distribution of the pigment was analyzed usinga Malvern Mastersizer 2000 at the same conditions explainedabove. A stable and mono-modal distribution was obtained for thissystem being the main particle size d50 of 1.2 �m.
The scanning electron microscope (SEM) micrograph indicatesrather irregular shape of the pigment particles with a particle sizein the range from 1 �m to 2 �m in good agreement with the particlesize distribution results.
The purity of the sample was evaluated by standard X-Raydiffraction measurements. The identification of the pattern was
Mixture (50%Alumina + 50%Titania)
Pigment %wt. Pig TSR (%) DL
9(2 wt%)
5 64.45 72.5510 55.95 60.4415 52.03 54.36
10(4 wt%)
5 66.27 73.3910 56.01 61.2215 52.36 54.49
11(6 wt%)
5 66.27 73.1610 58.15 62.4415 51.81 55.11
12(8 wt%)
5 65.45 73.9610 56.6 61.9715 52.89 55.26
Reference (un-modified blue)
Pigment %wt. Pig TSR (%) DL
Original 0 80.98 94.615 58.26 64.5410 53.86 58.9415 51.26 57.03
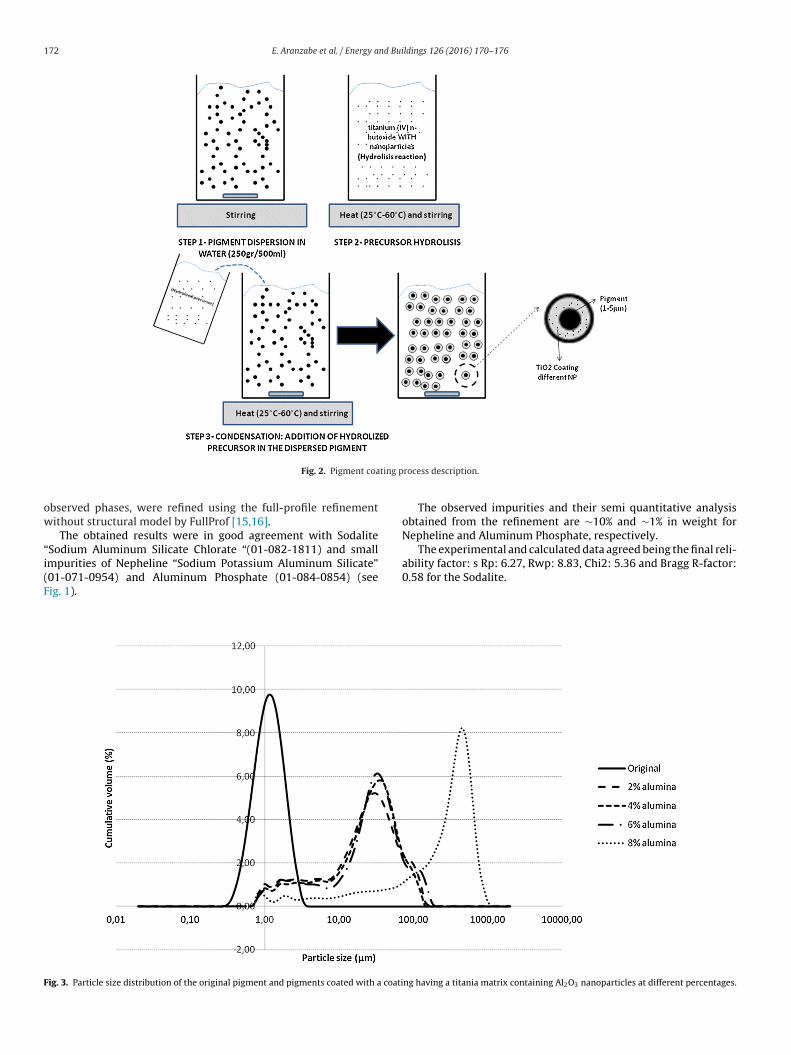
172 E. Aranzabe et al. / Energy and Buildings 126 (2016) 170–176
ting p
ow
“i(F
F
Fig. 2. Pigment coa
bserved phases, were refined using the full-profile refinementithout structural model by FullProf [15,16].
The obtained results were in good agreement with SodaliteSodium Aluminum Silicate Chlorate “(01-082-1811) and small
mpurities of Nepheline “Sodium Potassium Aluminum Silicate”01-071-0954) and Aluminum Phosphate (01-084-0854) (seeig. 1).ig. 3. Particle size distribution of the original pigment and pigments coated with a coati
rocess description.
The observed impurities and their semi quantitative analysisobtained from the refinement are ∼10% and ∼1% in weight forNepheline and Aluminum Phosphate, respectively.
The experimental and calculated data agreed being the final reli-
ability factor: s Rp: 6.27, Rwp: 8.83, Chi2: 5.36 and Bragg R-factor:0.58 for the Sodalite.ng having a titania matrix containing Al2O3 nanoparticles at different percentages.
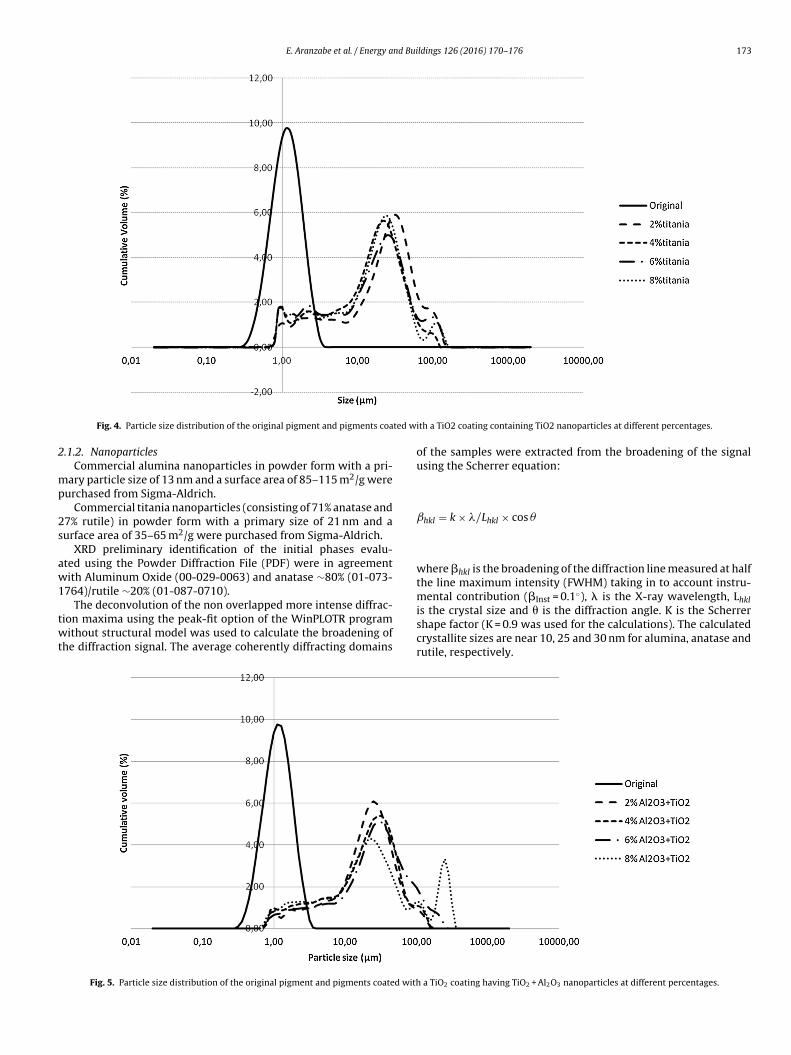
E. Aranzabe et al. / Energy and Buildings 126 (2016) 170–176 173
ted w
2
mp
2s
aw1
twt
Fig. 4. Particle size distribution of the original pigment and pigments coa
.1.2. NanoparticlesCommercial alumina nanoparticles in powder form with a pri-
ary particle size of 13 nm and a surface area of 85–115 m2/g wereurchased from Sigma-Aldrich.
Commercial titania nanoparticles (consisting of 71% anatase and7% rutile) in powder form with a primary size of 21 nm and aurface area of 35–65 m2/g were purchased from Sigma-Aldrich.
XRD preliminary identification of the initial phases evalu-ted using the Powder Diffraction File (PDF) were in agreementith Aluminum Oxide (00-029-0063) and anatase ∼80% (01-073-
764)/rutile ∼20% (01-087-0710).
The deconvolution of the non overlapped more intense diffrac-ion maxima using the peak-fit option of the WinPLOTR programithout structural model was used to calculate the broadening of
he diffraction signal. The average coherently diffracting domains
Fig. 5. Particle size distribution of the original pigment and pigments coated with
ith a TiO2 coating containing TiO2 nanoparticles at different percentages.
of the samples were extracted from the broadening of the signalusing the Scherrer equation:
ˇhkl = k × �/Lhkl × cos �
where �hkl is the broadening of the diffraction line measured at halfthe line maximum intensity (FWHM) taking in to account instru-mental contribution (�Inst = 0.1◦), � is the X-ray wavelength, Lhkl
is the crystal size and � is the diffraction angle. K is the Scherrershape factor (K = 0.9 was used for the calculations). The calculatedcrystallite sizes are near 10, 25 and 30 nm for alumina, anatase andrutile, respectively.a TiO2 coating having TiO2 + Al2O3 nanoparticles at different percentages.
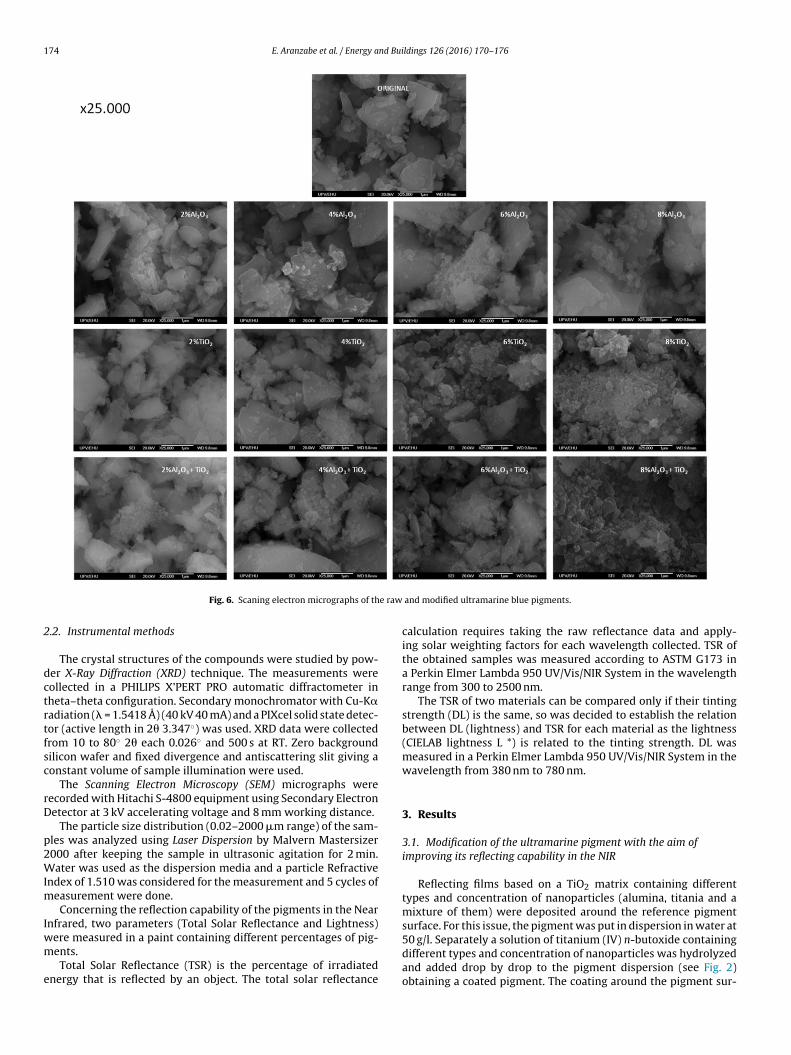
174 E. Aranzabe et al. / Energy and Buildings 126 (2016) 170–176
e raw
2
dctrtfsc
rD
p2WIm
Iwm
e
Fig. 6. Scaning electron micrographs of th
.2. Instrumental methods
The crystal structures of the compounds were studied by pow-er X-Ray Diffraction (XRD) technique. The measurements wereollected in a PHILIPS X’PERT PRO automatic diffractometer inheta–theta configuration. Secondary monochromator with Cu-K�adiation (� = 1.5418 Å) (40 kV 40 mA) and a PIXcel solid state detec-or (active length in 2� 3.347◦) was used. XRD data were collectedrom 10 to 80◦ 2� each 0.026◦ and 500 s at RT. Zero backgroundilicon wafer and fixed divergence and antiscattering slit giving aonstant volume of sample illumination were used.
The Scanning Electron Microscopy (SEM) micrographs wereecorded with Hitachi S-4800 equipment using Secondary Electronetector at 3 kV accelerating voltage and 8 mm working distance.
The particle size distribution (0.02–2000 �m range) of the sam-les was analyzed using Laser Dispersion by Malvern Mastersizer000 after keeping the sample in ultrasonic agitation for 2 min.ater was used as the dispersion media and a particle Refractive
ndex of 1.510 was considered for the measurement and 5 cycles ofeasurement were done.Concerning the reflection capability of the pigments in the Near
nfrared, two parameters (Total Solar Reflectance and Lightness)
ere measured in a paint containing different percentages of pig-ents.Total Solar Reflectance (TSR) is the percentage of irradiatednergy that is reflected by an object. The total solar reflectance
and modified ultramarine blue pigments.
calculation requires taking the raw reflectance data and apply-ing solar weighting factors for each wavelength collected. TSR ofthe obtained samples was measured according to ASTM G173 ina Perkin Elmer Lambda 950 UV/Vis/NIR System in the wavelengthrange from 300 to 2500 nm.
The TSR of two materials can be compared only if their tintingstrength (DL) is the same, so was decided to establish the relationbetween DL (lightness) and TSR for each material as the lightness(CIELAB lightness L *) is related to the tinting strength. DL wasmeasured in a Perkin Elmer Lambda 950 UV/Vis/NIR System in thewavelength from 380 nm to 780 nm.
3. Results
3.1. Modification of the ultramarine pigment with the aim ofimproving its reflecting capability in the NIR
Reflecting films based on a TiO2 matrix containing differenttypes and concentration of nanoparticles (alumina, titania and amixture of them) were deposited around the reference pigmentsurface. For this issue, the pigment was put in dispersion in water at
50 g/l. Separately a solution of titanium (IV) n-butoxide containingdifferent types and concentration of nanoparticles was hydrolyzedand added drop by drop to the pigment dispersion (see Fig. 2)obtaining a coated pigment. The coating around the pigment sur-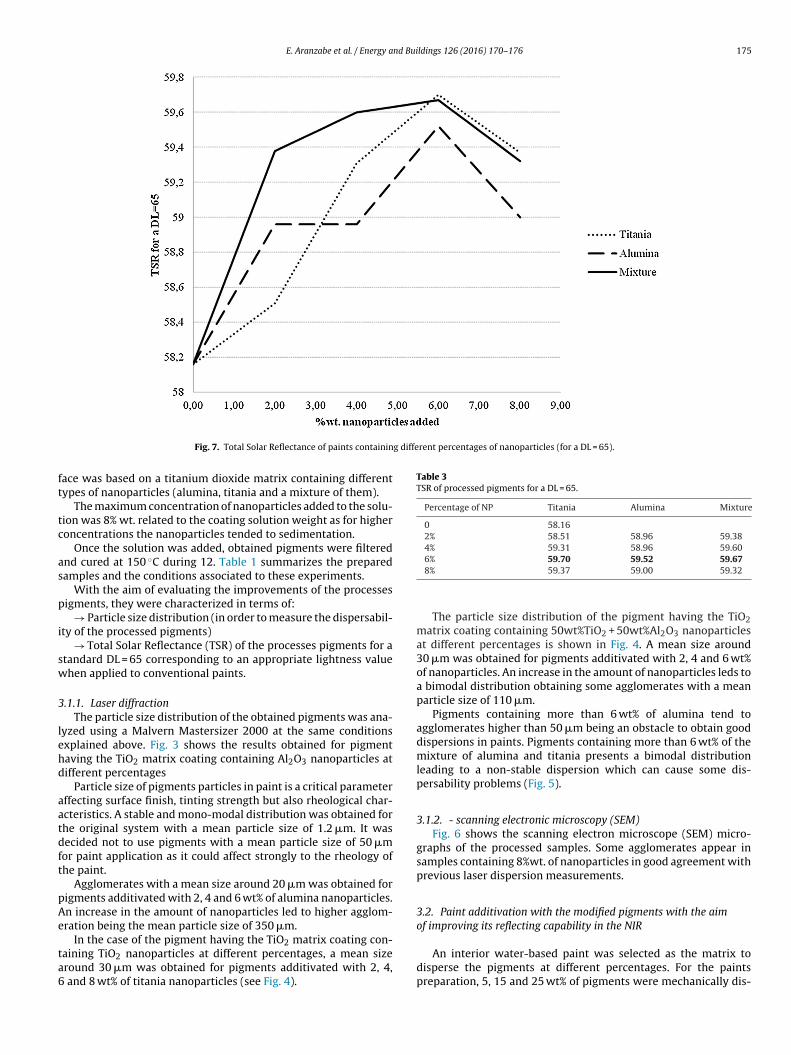
E. Aranzabe et al. / Energy and Buildings 126 (2016) 170–176 175
g different percentages of nanoparticles (for a DL = 65).
ft
tc
as
p
i
sw
3
lehd
aatdft
pAe
ta6
Table 3TSR of processed pigments for a DL = 65.
Percentage of NP Titania Alumina Mixture
0 58.162% 58.51 58.96 59.384% 59.31 58.96 59.60
Fig. 7. Total Solar Reflectance of paints containin
ace was based on a titanium dioxide matrix containing differentypes of nanoparticles (alumina, titania and a mixture of them).
The maximum concentration of nanoparticles added to the solu-ion was 8% wt. related to the coating solution weight as for higheroncentrations the nanoparticles tended to sedimentation.
Once the solution was added, obtained pigments were filterednd cured at 150 ◦C during 12. Table 1 summarizes the preparedamples and the conditions associated to these experiments.
With the aim of evaluating the improvements of the processesigments, they were characterized in terms of:
→ Particle size distribution (in order to measure the dispersabil-ty of the processed pigments)
→ Total Solar Reflectance (TSR) of the processes pigments for atandard DL = 65 corresponding to an appropriate lightness valuehen applied to conventional paints.
.1.1. Laser diffractionThe particle size distribution of the obtained pigments was ana-
yzed using a Malvern Mastersizer 2000 at the same conditionsxplained above. Fig. 3 shows the results obtained for pigmentaving the TiO2 matrix coating containing Al2O3 nanoparticles atifferent percentages
Particle size of pigments particles in paint is a critical parameterffecting surface finish, tinting strength but also rheological char-cteristics. A stable and mono-modal distribution was obtained forhe original system with a mean particle size of 1.2 �m. It wasecided not to use pigments with a mean particle size of 50 �mor paint application as it could affect strongly to the rheology ofhe paint.
Agglomerates with a mean size around 20 �m was obtained forigments additivated with 2, 4 and 6 wt% of alumina nanoparticles.n increase in the amount of nanoparticles led to higher agglom-ration being the mean particle size of 350 �m.
In the case of the pigment having the TiO2 matrix coating con-aining TiO2 nanoparticles at different percentages, a mean sizeround 30 �m was obtained for pigments additivated with 2, 4,
and 8 wt% of titania nanoparticles (see Fig. 4).
6% 59.70 59.52 59.678% 59.37 59.00 59.32
The particle size distribution of the pigment having the TiO2matrix coating containing 50wt%TiO2 + 50wt%Al2O3 nanoparticlesat different percentages is shown in Fig. 4. A mean size around30 �m was obtained for pigments additivated with 2, 4 and 6 wt%of nanoparticles. An increase in the amount of nanoparticles leds toa bimodal distribution obtaining some agglomerates with a meanparticle size of 110 �m.
Pigments containing more than 6 wt% of alumina tend toagglomerates higher than 50 �m being an obstacle to obtain gooddispersions in paints. Pigments containing more than 6 wt% of themixture of alumina and titania presents a bimodal distributionleading to a non-stable dispersion which can cause some dis-persability problems (Fig. 5).
3.1.2. - scanning electronic microscopy (SEM)Fig. 6 shows the scanning electron microscope (SEM) micro-
graphs of the processed samples. Some agglomerates appear insamples containing 8%wt. of nanoparticles in good agreement withprevious laser dispersion measurements.
3.2. Paint additivation with the modified pigments with the aimof improving its reflecting capability in the NIR
An interior water-based paint was selected as the matrix todisperse the pigments at different percentages. For the paintspreparation, 5, 15 and 25 wt% of pigments were mechanically dis-
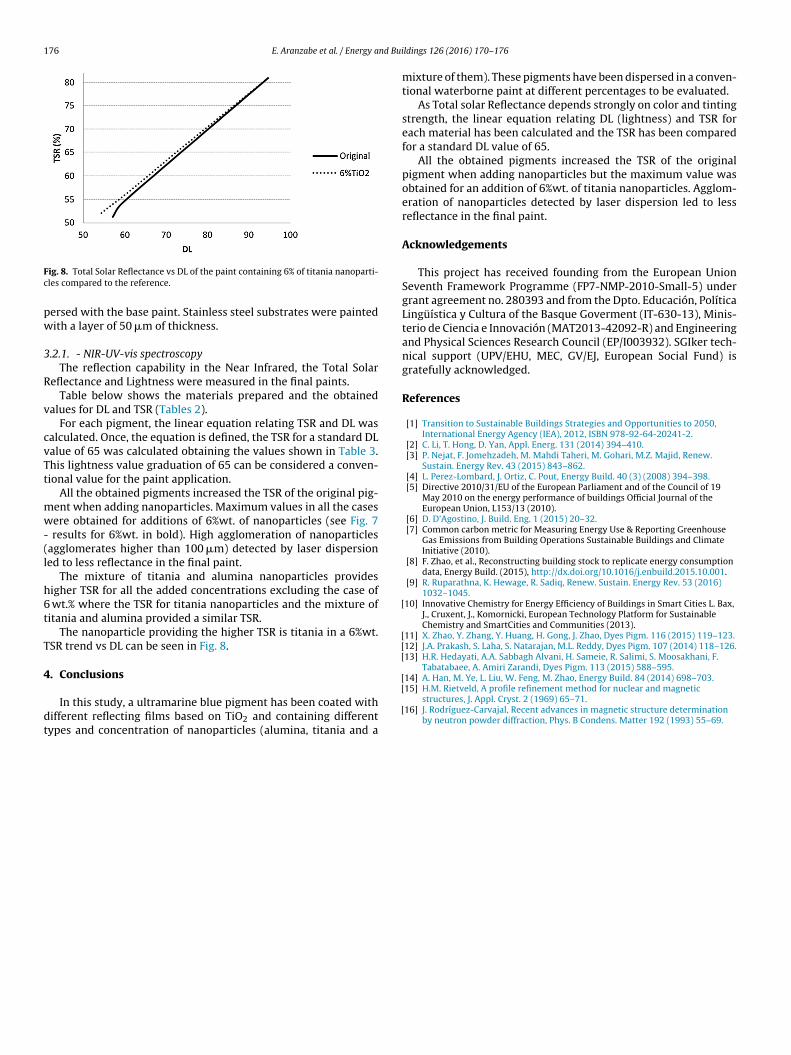
176 E. Aranzabe et al. / Energy and Bui
Fc
pw
3
R
v
cvTt
mw-(l
h6t
T
4
dt
[
[[[
[14] A. Han, M. Ye, L. Liu, W. Feng, M. Zhao, Energy Build. 84 (2014) 698–703.
ig. 8. Total Solar Reflectance vs DL of the paint containing 6% of titania nanoparti-les compared to the reference.
ersed with the base paint. Stainless steel substrates were paintedith a layer of 50 �m of thickness.
.2.1. - NIR-UV-vis spectroscopyThe reflection capability in the Near Infrared, the Total Solar
eflectance and Lightness were measured in the final paints.Table below shows the materials prepared and the obtained
alues for DL and TSR (Tables 2).For each pigment, the linear equation relating TSR and DL was
alculated. Once, the equation is defined, the TSR for a standard DLalue of 65 was calculated obtaining the values shown in Table 3.his lightness value graduation of 65 can be considered a conven-ional value for the paint application.
All the obtained pigments increased the TSR of the original pig-ent when adding nanoparticles. Maximum values in all the casesere obtained for additions of 6%wt. of nanoparticles (see Fig. 7
results for 6%wt. in bold). High agglomeration of nanoparticlesagglomerates higher than 100 �m) detected by laser dispersioned to less reflectance in the final paint.
The mixture of titania and alumina nanoparticles providesigher TSR for all the added concentrations excluding the case of
wt.% where the TSR for titania nanoparticles and the mixture ofitania and alumina provided a similar TSR.
The nanoparticle providing the higher TSR is titania in a 6%wt.SR trend vs DL can be seen in Fig. 8.
. Conclusions
In this study, a ultramarine blue pigment has been coated withifferent reflecting films based on TiO2 and containing differentypes and concentration of nanoparticles (alumina, titania and a
[
[
ldings 126 (2016) 170–176
mixture of them). These pigments have been dispersed in a conven-tional waterborne paint at different percentages to be evaluated.
As Total solar Reflectance depends strongly on color and tintingstrength, the linear equation relating DL (lightness) and TSR foreach material has been calculated and the TSR has been comparedfor a standard DL value of 65.
All the obtained pigments increased the TSR of the originalpigment when adding nanoparticles but the maximum value wasobtained for an addition of 6%wt. of titania nanoparticles. Agglom-eration of nanoparticles detected by laser dispersion led to lessreflectance in the final paint.
Acknowledgements
This project has received founding from the European UnionSeventh Framework Programme (FP7-NMP-2010-Small-5) undergrant agreement no. 280393 and from the Dpto. Educación, PolíticaLingüística y Cultura of the Basque Goverment (IT-630-13), Minis-terio de Ciencia e Innovación (MAT2013-42092-R) and Engineeringand Physical Sciences Research Council (EP/I003932). SGIker tech-nical support (UPV/EHU, MEC, GV/EJ, European Social Fund) isgratefully acknowledged.
References
[1] Transition to Sustainable Buildings Strategies and Opportunities to 2050,International Energy Agency (IEA), 2012, ISBN 978-92-64-20241-2.
[2] C. Li, T. Hong, D. Yan, Appl. Energ. 131 (2014) 394–410.[3] P. Nejat, F. Jomehzadeh, M. Mahdi Taheri, M. Gohari, M.Z. Majid, Renew.
Sustain. Energy Rev. 43 (2015) 843–862.[4] L. Perez-Lombard, J. Ortiz, C. Pout, Energy Build. 40 (3) (2008) 394–398.[5] Directive 2010/31/EU of the European Parliament and of the Council of 19
May 2010 on the energy performance of buildings Official Journal of theEuropean Union, L153/13 (2010).
[6] D. D’Agostino, J. Build. Eng. 1 (2015) 20–32.[7] Common carbon metric for Measuring Energy Use & Reporting Greenhouse
Gas Emissions from Building Operations Sustainable Buildings and ClimateInitiative (2010).
[8] F. Zhao, et al., Reconstructing building stock to replicate energy consumptiondata, Energy Build. (2015), http://dx.doi.org/10.1016/j.enbuild.2015.10.001.
[9] R. Ruparathna, K. Hewage, R. Sadiq, Renew. Sustain. Energy Rev. 53 (2016)1032–1045.
10] Innovative Chemistry for Energy Efficiency of Buildings in Smart Cities L. Bax,J., Cruxent, J., Komornicki, European Technology Platform for SustainableChemistry and SmartCities and Communities (2013).
11] X. Zhao, Y. Zhang, Y. Huang, H. Gong, J. Zhao, Dyes Pigm. 116 (2015) 119–123.12] J.A. Prakash, S. Laha, S. Natarajan, M.L. Reddy, Dyes Pigm. 107 (2014) 118–126.13] H.R. Hedayati, A.A. Sabbagh Alvani, H. Sameie, R. Salimi, S. Moosakhani, F.
Tabatabaee, A. Amiri Zarandi, Dyes Pigm. 113 (2015) 588–595.
15] H.M. Rietveld, A profile refinement method for nuclear and magneticstructures, J. Appl. Cryst. 2 (1969) 65–71.
16] J. Rodríguez-Carvajal, Recent advances in magnetic structure determinationby neutron powder diffraction, Phys. B Condens. Matter 192 (1993) 55–69.


Manuscript Details
Manuscript number ENB_2016_379
Title Designing multifunctional pigments for an improved energy efficiency inbuildings
Article type Full Length Article
Abstract
Materials science offers solutions that when are combined can offer important energy savings in the building sector. Inthis study, high reflectance coating and thermal storage capacity are combined with the aim of improving energyefficiency in buildings. For this issue a multifunctional pigment having a phase change material adsorbed on its surfaceand a high total solar reflectance has been manufactured. The total solar reflectance of the pigment will make the paintto reflect the sunlight radiation in the infrared part of the spectrum reducing the amount of absorbed radiation. Thishigh reflection provides a surface level effect as is a passive stimulus-responsive solution that acts with sunlightradiation. On the other hand, the thermal storage capability provides a bulk level effect as is passive stimulus-responsive solution acting by temperature changes, making it possible to use constructive materials as a thermalenergy storage media. The preparation process is described and the pigment is characterized conveniently. Thethermal performance of corresponding pigmented coatings was evaluated by an experiment simulation in whichdifferent boxes were covered with the coating containing the multifunctional pigment and traditional pigmented coatingon their tops. The indoor air temperature and the interior temperature of the substrate were measured obtainingdifferences of 4-5◦C.
Keywords Multifunctional Pigment; Total Solar Reflectance; Coating; Energy efficiency
Taxonomy Coatings, Pigment, Thermal Energy
Corresponding Author Estibaliz Aranzabe
Order of Authors Estibaliz Aranzabe, Maria Isabel Arriortua, Aitor Larrañaga, Ana Aranzabe,Pedro María Villasante, Ricardo March
Suggested reviewers Stanislaw Kowalack, Jose-Luis Valverde
Submission Files Included in this PDF
File Name [File Type]
Cover Letter.doc [Cover Letter]
Manuscript.docx [Manuscript File]
Figure1.jpg [Figure]
Figure2.jpg [Figure]
Figure3.jpg [Figure]
Figure4.jpg [Figure]
Figure5.jpg [Figure]
Tables.docx [Table]
highlights.docx [Highlights]
To view all the submission files, including those not included in the PDF, click on the manuscript title on your EVISEHomepage, then click 'Download zip file'.


ANEXO II: CURRICULUM VITAE

Parte A. DATOS PERSONALES
Nombre y apellidos Estíbaliz Aranzabe Basterrechea
DNI/NIE/pasaporte 14613646-K Edad 39
Núm. identificación del investigador Researcher ID
Código Orcid orcid.org/0000-0001-7611-8759
A.1. Situación profesional actual
Organismo IK4-TEKNIKER
Dpto./Centro Unidad de Química de Superficies
Dirección Iñaki Goenaga 5- 20600- Eibar
Teléfono 636984445 correo electrónico [email protected]
Categoría profesional Investigador Fecha inicio 01/07/2000
Espec. cód. UNESCO 332106, 331208, 331004, 230326
Palabras clave Química de materiales; Tecnologías de superficies; Tecnología
sol-gel; Almacenamiento térmico; Nanomateriales; Nanoaditivación
A.2. Formación académica (título, institución, fecha)
Licenciatura/Grado/Doctorado Universidad Año
Licenciada en Ciencias Químicas
Universidad del País Vasco/Euskal Herriko Unibertsitatea
1999
Parte B. RESUMEN LIBRE DEL CURRÍCULUM
Estíbaliz Aranzabe se licenció en Ciencias Químicas (especialidad industrial) por la Universidad del País Vasco en el año 1999. En el año 2000 se incorporó a IK4-TEKNIKER donde ha participado y coordinado proyectos de investigación en las áreas de fluidos y desarrollo de recubrimientos. En el año 2013 paso a ser líder de especialización de superficies del centro y desde el año 2014 dirige la Unidad de Química de Superficies del centro. En el año 2008 obtuvo el certificado de suficiencia investigadora y actualmente se encuentra realizando su trabajo de tesis titulado “Desarrollo de pigmentos cerámicos multifuncionales orientados a la mejora de la eficiencia energética en edificación” dentro del grupo Grupo de Cristalografía de Materiales de la Universidad del País Vasco (UPV/EHU) (defensa el 19 de Diciembre de 2016).
Parte C. MÉRITOS MÁS RELEVANTES (ordenados por tipología)
C.1. Publicaciones
1. E. Aranzabe, P.M. Villasante, R. March, M.I. Arriortua, J. Vadillo, A. Larrañaga & A. Aranzabe “Preparation and characterization of high NIR reflective pigments based in ultramarine blue”, Energy and Buildings (2016), 126, 170-176. 2. E. Aranzabe, P.M. Villasante, R. March, M.I. Arriortua, A. Larrañaga & A. Aranzabe “Easily scalable production process for a pigment having thermal storage capacity”, American Journal of Chemistry and Applications (2015), 2(4), 96-103. 3. A.M. Goitandia, G. Beobide, E. Aranzabe & A. Aranzabe “Development of content-stable phase change composites by infiltration into inorganic porous supports”, Solar Energy Materials and Solar Cells (2015), 134, 318-328. 4. E. Aranzabe, P.M. Villasante, R. March, M.I. Arriortua, A. Larrañaga & A. Aranzabe “More than Color: Pigments with Thermal Storage Capacity; Processing and Degradation Behavior”, Advances in Materials Physics and Chemistry (2015), 5, 171-184. 5. M Blanco, A Martinez, A Marcaide, E Aranzabe & A Aranzabe, “Heterogeneous Fenton Catalyst for the Efficient Removal of Azodyes in Water”, American Journal of Analytical Chemistry (2014), 6, 490-499.
Fecha del CVA 03/11/2016

6. A. Villar, E. Gorritxategi, E. Aranzabe, D. Otaduy & L. A. Fernández, “Low cost visible Near-infrared sensor for on-line monitoring of fat fatty acids content during the manufacturing process of the milk”, Food Chemistry (2012), 135, 2756-2780. 7. E. Aranzabe, A. Marcaide, M. Hernaiz & N. Uranga, “Environmental Management in Practice”, Chapter 19 (2011), In-Tech- ISBN 978-953-307-358-3. 8. E. Gorritxategi, A. Arnaiz, E. Aranzabe, A. Aranzabe, D. Otaduy & A. Villar, “Sensores inteligentes para la monitorización en tiempo real de maquinaria lubricada”, TBN- Ingeniería del mantenimiento, (2010), 1, 76-82. 9. E. Aranzabe, A. Marcaide, A. Arnaiz, E. Gorritxategi & M. Hernaiz, “New method proposed for the assessment of lubricant biodegradability during its use”, Journal of Near Infrared Spectroscopy (2008), 16(3), 291-296. 10. A. Aranzabe, E. Aranzabe, A. Marcaide, R. Ferret, J. Terradillos & J. Ameye, “Comparing different analytical techniques to monitor lubricating grease degradation” , NLGI Spokesman, (2006),7(6), 17-30. 11. A. Marcaide, A. Igartua, O. Areitioaurtena, G. Mendoza, M. Castilla, E. Aranzabe & R. Ferret, “¿Qué es un lubricante biodegradable?”, Ingeniería Química (2006), 432, (162-168). C.2. Proyectos administración
Proyectos Europeos 1. Título del proyecto: Erosion and ice resistant composite for severe operating conditions Entidad financiadora: UE (H2020) Entidades participantes: IK4-Tekniker, Maier, Gamesa… Duración: desde 2016 hasta 2020 Cuantía de la subvención (Tekniker): 536.975,00€
2. Título del proyecto: STAGE-STE: Scientific and Technological Alliance for Guaranteeing the European Excellence in Concentrating Solar Thermal Energy. Entidad financiadora: Comisión Europea, VII Programa Marco Entidades participantes: 40 socios que incluyen: todos los centros y entidades de investigación europeas relevantes en la tecnología CSP liderados por el CIEMAT Duración: desde 2014 hasta 2018 Cuantía de la subvención (Tekniker): 218.930,00 €
3. Título del proyecto: Shape-engineered TiO2 nanoparticles for metrology of functional properties: setting design rules from material synthesis to nanostructured devices. Entidad financiadora: UE. Grant agreement no: 604577 Entidades participantes: IK4-Tekniker, Avanzare, DTI, BAM… Duración: desde 2013 hasta 2017 Cuantía de la subvención (Tekniker): 415,280.00 €
4. Título del proyecto: EUROSUNMED- Research cooperation and knowledge creation in the area of renewable energy with Mediterranean partner countries Entidad financiadora: UE (FP7) Entidades participantes: IK4-Tekniker, Cener, Eurec, Mascir … Duración: desde 2013 hasta 2017 Cuantía de la subvención: 197.706 €
5. Título del proyecto: Red de cooperación y transferencia para la incorporación de nanopartículas en diversos sectores. Carboninspired 2.0 Entidad financiadora: UE. Interreg IV B SUDOE SOE4/P1/E793 Entidades participantes: IK4-Tekniker, CTAG, UA, Adera, Aimplas… Duración: desde 2013 hasta 2014 Cuantía de la subvención (Tekniker): 91.633,34€
6. Título del proyecto: Energy efficient heat exchangers for HVAC applications (EnE-HVAC). Entidad financiadora: UE (FP7) Entidades participantes: IK4-Tekniker, DTI (coordinador), DVI, LuVe, Vahterus, Exhausto. Duración: desde 2013 hasta 2016 Cuantía de la subvención (Tekniker): 565.966,50 €
7. Título del proyecto: NANOPIGMY: More than color: applying nanotechnologies for the multifunctional ceramic pigments development Entidad financiadora: UE (FP7-NMP- SME targeted) Entidades participantes: IK4-Tekniker, Nubiola, Pinova, Acciona, CRF, … Duración: desde 2012 hasta 2015 Cuantía de la subvención (Tekniker): 662.967,87 €
8. Título del proyecto: NANOPCM.- New nanotechnology based high performance insulation systems production and use. Towards a long eco-efficient life cycle Entidad financiadora: UE (FP7- E2B) Entidades participantes: IK4-Tekniker, Acciona, PCM… Duración: desde 2010 hasta 2013 Cuantía de la subvención (Tekniker): 420.697,00 €
Proyectos Nacionales y regionales
1. Título del proyecto: Desarrollo de Materiales Inteligentes, Materiales Funcionales y Materiales para Procesos Avanzados. Actimat, Actimat 2.0., Actimat 3.0. Entidad financiadora: Gobierno Vasco (ETORTEK) Entidades participantes: IK4-Tekniker, Tecnalia, Gaike-IK4, CTA, MTC, CEIT-IK4… Duración: desde 2013 hasta 2017 Cuantía de la subvención: 75.000,00 €/año.
2. Título del proyecto: ENERGIA- Almacenamiento térmico Entidad financiadora: Gobierno Vasco (ETORTEK) Entidades participantes: IK4-Tekniker, Tecnalia, CIC Energigune… Duración: desde 2010 hasta 2017 Cuantía de la subvención: 100.000,00 €/año
3. Título del proyecto: Desarrollo de materiales avanzados para la generación, almacenamiento y liberación eficiente de energía”. MAT2013-42092-R. Entidad financiadora: Ministerio de Economía y Competitividad. Entidades participantes: Departamento de Mineralogía y Petrología. Facultad de Ciencia y Tecnología, UPV/EHU. Duración: desde Enero 2014 hasta Diciembre 2016 Cuantía de la subvención: 248.571,43 €
4. Título del proyecto: Materiales para el flujo circular de la energía: redescristalográficas basadas en nodos metálicos. MAT2016-76739-R. Entidad financiadora: Ministerio de Economía y Competitividad. Entidades participantes: Departamento de Mineralogía y Petrología, Facultad de Ciencia y Tecnología, UPV/EHU. Duración: desde Enero 2017 hasta Diciembre 2020 Cuantía de la subvención: 125.000,00 €
5. Título del proyecto: Materiales Multifuncionales para el Almacenamiento y Transporte de Masa y Energía. IT630-13. Entidad financiadora: Gobierno Vasco (Grupos Consolidados). Entidades participantes: Departamento de Mineralogía y Petrología, Facultad de Ciencia y Tecnología, UPV/EHU. Duración: desde: Enero 2013 hasta: Diciembre 2018 Cuantía de la subvención: 423.598,00 €

C.3. Contratos(10 últimos)
1. Desarrollo de recubrimientos antireflejantes Duración: 2016-2017 Precio total: 40.000€ Empresa: Confidencial
2. Desarrollo y aplicación de recubrimientos anti-soiling Duración: 2012-2016 Precio total: 150.000€ Empresa: Confidencial
3. Desarrollo de nanorefrigerantes Duración: 2015-2018 Precio total: 150.000€/año Empresa: Confidencial
4. Estudio de procesos superficiales para estirado en frio Duración: 2016-2018 Precio total: 80.000€ Empresa: Confidencial
5. Nuevo dispositivo de filtrado doméstico Duración: 2014-2016 Precio total: 30.000€ Empresa: Confidencial
6. Desarrollo de soluciones multifuncionales Duración: 2015-2017 Precio total: 120.000€ Empresa: Confidencial
7. Desarrollo de Sistema de Inspección NIR para la detección de almendra amarga Duración: 2015-2017 Precio total: 145.000€ Empresa: Confidencial
8. Desarrollo de recubrimientos absortivos en tubos de acero al carbono y al cromo Duración: desde: 2001 hasta 2013 Precio total: 100.000€ Empresa: Tubos Reunidos
9. Desarrollo de fluidos caloportadores para plantas de solar térmica Duración: desde 2008 hasta 2012 Precio total: 130,000.00 € Empresa: Krafft
10. Desarrollo de lubricantes biodegradables para plantas de solar térmica Duración: desde 2008 hasta 2012 Precio total: 179,000.00 € Empresa/Administración Elesa
C.4. Patentes
1. Título: Dispositivo captador de luz con regulación de absortividad Inventores: Cristóbal Villasante, Marcelino Sánchez González, Ana Monreal Vidal, Itzal Del Hoyo Arce, Estibaliz Aranzabe Basterrechea, Íñigo Pagola Barrio N. de solicitud: P201431102 (2014). Entidad titular: Fundación Tekniker y Fundación CENER-Ciemat
2. Título: Fluidos térmicos mejorados Inventores: Marta Hernaiz, Nerea Uranga, Estibaliz Aranzabe, Arate Marcaide, Amaia Martinez N. de solicitud: PCT_ES2012_070414 (2014). Entidad titular: Fundación Tekniker

3. Título: Coated glass for solar reflectors Inventores: Estíbaliz Gómez, Estibaliz Aranzabe, Haizea Zarrabe, Josep Ubach N. de solicitud: EP15382228 (2016). Entidad titular: Rioglass solar y Fundación Tekniker
4. Título: Espejo para reflector solar y procedimiento de ensamblaje Inventores: Cristobal Villasante, Estibaliz Aranzabe, Marcelino Sánchez, Michael Burisch N. de solicitud: P201631313 (2016). Entidad titular: Fundación Tekniker y Fundación CENER-Ciemat
C.5. Otros: Experiencia en organización de actividades de I+D
Organización de congresos, jornadas… 1. Título: Congreso LUBMAT (Lubrication, Maintenance and Tribotechnology), Local
comitee member (2008- San Sebastián, 2012- Bilbao, 2016- Bilbao). 2. Título: Congreso ECNF 2016 (European conference on Nanofilms), Scientific
Committee member. Bilbao (2016). 3. Título: Workshop "El empleo de nanopartículas en la industria" enmarcada dentro del
proyecto CarbonInspired 2.0, Organización del evento. Eibar (2014).


Related Documents