Fabrication and characterization of porous 3D TCP- CMC-alginate fibrous constructs for implant applications A THESIS SUBMITTED IN PARTIAL FULFILLMENT OF THE REQUIREMENT FOR THE DEGREE OF Master of Technology in Biomedical Engineering by SHARANYA SANKAR 212BM1475 Under the Supervision of Dr. A. Thirugnanam Department of Biotechnology and Medical Engineering National Institute of Technology, Rourkela Rourkela, Odisha, 769 008, India May 2014

Welcome message from author
This document is posted to help you gain knowledge. Please leave a comment to let me know what you think about it! Share it to your friends and learn new things together.
Transcript
Fabrication and characterization of porous 3D TCP-
CMC-alginate fibrous constructs for implant
applications
A THESIS SUBMITTED IN PARTIAL FULFILLMENT
OF THE REQUIREMENT FOR THE DEGREE OF
Master of Technology
in
Biomedical Engineering
by
SHARANYA SANKAR
212BM1475
Under the Supervision of
Dr. A. Thirugnanam
Department of Biotechnology and Medical Engineering
National Institute of Technology, Rourkela
Rourkela, Odisha, 769 008, India
May 2014

I am deeply grateful to my supervisor, Prof. A. Thirugnanam, whose insights and
encouragements have contributed so much to this thesis. He not only provided me the
direction for my research but also had faith in me and gave me enough freedom to pursue my
own ideas. Last one year was a beautiful combination of debates, discussions, doubts,
agreements and disagreements with him which helped me a lot to develop my ideas regarding
many important issues in life, especially research in materials science. I am really grateful to Mr.
Mithun Das, CGCRI Kolkata for providing me the facility of Mercury Intrusion Porosimeter. I
would also like to thank Prof. S. K. Pratihar, Head, Department of Ceramic engineering, NIT
Rourkela for extending the facility of Universal Testing Machine. I would also like to thank Prof.
Nagendra Roy, Head, Civil Engineering Department, NIT Rourkela for letting me use analog
compression testing machine. I am thankful to my lab mate Mr. Krishna Kumar R who helped
me through intuitive discussions. Last but not the least, I would like to thank all my other lab
mates, people of other departments who have extended their facilities and instruments which
helped me in completing my project work.
Sharanya Sankar
Certificate …………………………………………………………………….i
List of abbreviations ………………………………………………………....ii
Glossary ……………………………………………………………………... iii
Abstract…………………………………………………………………….....iv
List of figures …………………………………………………………………v
List of tables …………………………………………………………………vii
1.1 Background ……………………………………………………………………………….1
1.2 Research goals……………………………………………………………………………11
1.3 Innovation………………………………………………………………………………..11
2.1 Overview…………………………………………………………………………………12
3.1 Syringe design…………………………………………………………………………...17
3.2 Preparation of composite suspension and scaffold fabrication………………………….17
3.3 Fiber characterization: SEM and MIP…………………………………………………..21
3.4 Measurement of scaffold porosity-liquid displacement method………………………..21
3.5 Mechanical properties…………………………………………………………………..21
3.6 Bioactivity studies in SBF……………………………………………………………...22
4.1 Characterization of scaffold………………….…………………………………………24
4.1.1. Scanning Electron Microscopy………………………………………………………26
4.1.2. Mercury Intrusion Porosimetry……………………………………………………...29
4.2 Porosity using liquid displacement method…………………………………………....31
4.3 Mechanical properties………………………………………………………………….33
4.4 SBF bioactivity studies………………………………………………………………...35
i
Department of Biotechnology and Medical Engineering
National Institute of Technology, Rourkela, Odisha-769008
CERTIFICATE
This is to certify that the project entitled “Fabrication and characterization of porous 3D
TCP-CMC-alginate fibrous constructs for implant applications” is a record of the bonafide
work done by Sharanya Sankar (212BM1475) under my supervision which is submitted for the
partial fulfillment of the requirements for the award of the degree of Master of Technology (M
Tech) in Biomedical Engineering at National Institute of Technology, Rourkela. To the best of
my knowledge, the matter embodied in the thesis has not been submitted to any other
University/Institute for award of any degree or diploma.
Rourkela Dr. A.Thirugnanam
Date: (Project supervisor)
ii
TCP: Tri-calcium phosphate
CMC: Carboxymethyl cellulose
IgG: Immunoglobulin G
Micro-CT: Micro computed tomography
SAL: Sterility assurance limit
PCL: Poly caprolactone
PLGA: Poly(lactic-co-glycolic acid)
PLLA: Poly-L-lactide
HA: Hydroxyapatite
MIP: Mercury intrusion porosimetry
SEM: Scanning Electron Microscopy
XRD: X-Ray diffraction
SBF: Simulated body fluid
PBS: Phosphate buffered saline
TRIS: Tris hydroxymethyl aminomethane
iii
Autograft: Patients own tissue or organ used for surgical reconstruction.
Allograft: The tissue or organ transplanted to the patient from a genetically non-identical donor
of same species.
Xenograft: The tissue or organ transplanted from one species to another.
Osteoconduction: Bone growth on surface or into pores
Osteoinduction: Undifferentiated cells stimulated to form bone forming lineage
Osteogenesis: Contact between living bone and implant without growth of fibrous tissue at bone
implant interface
Inflammation: Complex biological response to any foreign body
Biocompatibility: Ability of material to resist unwanted immunological reactions when
implanted in-vivo
Biodegradabilty: Ability of a material to disintegrate naturally
Stress shielding: Mismatch between the young’s modulus of bone and implant which leads to
uneven distribution of load
Bioactivity: Ability of a material to initiate biological reactions when implanted in body
Micropores: Pores ranging in the size less than 50µm
Macroporosity: Pores ranging in the size greater than 50 µm to few millimeters
Osteogenesis: Bone healing by cell groweh and differentiation
Gas foaming: Introducing pores by gas entrapment method
Composite: Material composed of two or more compounds
iv
Anisotropic: Variation in properties with respect to direction
Dispense: Force through an orifice by applying pressure
Pore size distribution: The wide range of pores sizes in a material
Compressive strength: Ability of a material to withstand load which tends to reduce its size
Surfactant: A substance which reduces surface tension between two liquids or a liquid and a
solid
Interconnected pores: Pores which are connected through inner channels
Vacuum: An enclosed space without matter
Angiogenesis: Process of formation of blood vessels
Power law: Correlation between stress and plastic strain
Bone remodeling: Formation of new bone tissue by replacing the old one.
Regression: Statistical method to derive a relationship between dependant and independent
variables
Permeability: Ability of a membrane to allow diffusion of materials
Vascularization: Process of formation of blood vessels
Biomineralization: Process by which bone like mineral phase is formed
Phase transformation: Change of material from one phase to another due to variation in
temperature
Strain hardening: Increase in strength of material by plastic deformation
Intrusion: Forceful entry of a fluid inside pores due to pressure
Extrusion: Forceful removal of fluid from pores by applying pressure
v
This study reports the fabrication of 3D constructs using Tri-calcium phosphate/carboxymethyl
cellulose composite with alginate. Microporous scaffold fibers were developed by incorporating
gas bubbles within fibers, stabilizing it with surfactants, and subsequently removing the gas by
vacuum treatment. The prepared paste was dispensed through a specially designed sieve plate by
applying pressure and extruded in a calcium chloride/acetic acid bath. Gas is evolved as a result
of reaction between sodium bicarbonate in paste and acetic acid in solution. The porosity of the
fiber is tuned using 0.9, 1.8 and 3.6 weight% sodium bicarbonate (NaHCO3). The processed
fibers were characterized using scanning electron microscopy (SEM) and mercury intrusion
porosimetry (MIP). The morphology of the scaffold was characterized using scanning electron
microscopy (SEM). From SEM results pore morphology was found to be better in scaffolds with
0.9 wt% NaHCO3 as it revealed an interconnected structure. Mercury intrusion porosimetry
results showed an increase in pore volume with increasing concentration of NaHCO3. A detailed
study on the mechanical properties of the constructs was carried out to evaluate the compressive
strength. In-vitro bioactivity studies were carried out in simulated body fluid (SBF) for 2/4
weeks. The study showed that the scaffold provides favorable substrate conditions to form bone
like mineral HA phase, which plays a significant role in osteointegration.
Keywords: Tri-calcium phosphate, composite, Microporous scaffold, mechanical strength,
simulated body fluid, bioactivity
vi
Figure 1: Broad classification of bone graft substitutes
Figure 2: Three most important properties possessed by an ideal bone graft substitute
Figure 3: Mechanism of apatite layer formation in ceramic on immersion in SBF
Figure 4: Bone integrating on a porous scaffold
Figure 5: (a) Hole patterns on the syringe head, (b) Schematic drawing of the processing set-up
for preparation of 3-D scaffolds
Figure 6: Schematic representation of preparation of composite suspension and scaffold
fabrication
Figure 7: Laboratory representation of preparation of composite suspension and scaffold
fabrication
Figure 8: Samples prepared for compression test (a) 0.9_TCA samples intriplicate (b) 1.8_TCA
samples in triplicate and (c) 3.6_TCA samples in triplicate
Figure 9: (a) Samples maintained in 37°C in SBF for 2 weeks and 4 weeks, (b) Dried samples
after immersion in SBF for 2 weeks and 4 weeks
Figure 10: SEM images of fibers at low magnification (a) 0.9_TCA fibers, (b) 1.8_TCA fibers
and (c) 3.6_TCA fibers
Figure 11: SEM images of scaffold (a) 0.9_TCA, (b) 1.8_TCA and (c) 3.6_TCA
Figure 12: Pore distribution plot for (a) 0.9_TCA, (b) 1.8_TCA, (c) 3.6_TCA
Figure 13: Graph showing porosity percentage as measured by liquid displacement method
Figure 14: Graph showing the compressive strength of 0.9_TCA, 1.8_TCA, 3.6_TCA samples
vii
Figure 15: Force vs extension curves obtained from compressive testing of (a) 0.9_TCA in
triplicate, (b) 1.8_TCA in triplicate and (c) 3.6_TCA in triplicate
Figure 16: SEM images of SBF immersed samples of 0.9_TCA (a) 2 weeks and (b) 4 weeks
Figure 17: XRD plots of 0.9_TCA (a) before immersion in SBF, (b) 2 weeks, SBF and (c) 4
weeks, SBF
viii
Table 1: Types of bone grafts and properties of bone graft
Table 2: Different types of biocompatibility tests
Table 3: Mechanical strength details of human bone
Table 4: Different types of techniques used to fabricate 3D porous scaffold
Table 5: Different gas based techniques used to fabricate porous scaffold
Table 6: Sample codes for three scaffold compositions
Table 7: Order and amount of reagents used for preparation of 1000 ml SBF
Table 8: Different calcium chloride concentrations and the corresponding cross-linking time of
scaffold fibers
Table 9: Optimized composition of paste (10ml) (0.9 %NaHCO3)
Table 10: Composition of paste (10ml) ( 0.9,1.8, 3.6 %NaHCO3)
Table 9: Average pore diameter and average pore volume obtained from mercury intrusion
porosimetry
Table 10: Volume porosity as obtained by liquid displacement method
Table 11: K and n values obtained from regression analysis
1
Repairing bone defects caused by fractures, trauma, surgery, congenital malformation, tumors
and infections is a major challenge faced by orthopaedic surgeons. Recent studies show that
around 800,000 people undergo bone graft surgery per year [1]. The various grafting
techniques used for bone reconstruction are autograft, allograft and xenograft [2]. Autografts
cause no immunological reactions and have high success rates. However, it involves a second
surgical procedure which is time taking and increases surgical complications. But, graft
rejection and disease transmission is a major concern with allograft tissue [3]. Various
sterilization techniques are used to render the allografts disease-free, but studies show that
sterilization might affect the material property of the grafts [4]. Xenografts, provide large
quantity of animal tissue for transplantation but poses a major risk of viral and bacterial
infections from other species [5]. The properties of bone grafts which assist in bone healing
are listed below (Table 1).
Table 1: Types and properties of bone grafts
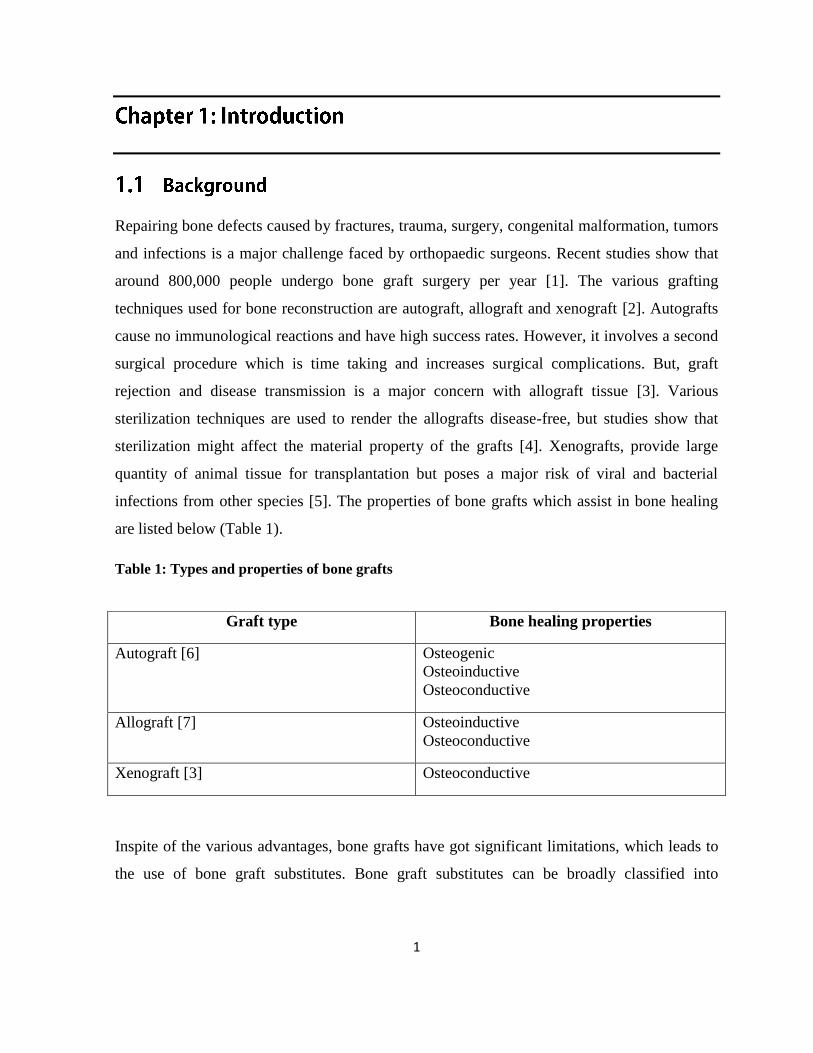
Inspite of the various advantages, bone grafts have got significant limitations, which leads to
the use of bone graft substitutes. Bone graft substitutes can be broadly classified into
Graft type Bone healing properties
Autograft [6] Osteogenic
Osteoinductive
Osteoconductive
Allograft [7] Osteoinductive
Osteoconductive
Xenograft [3] Osteoconductive
2
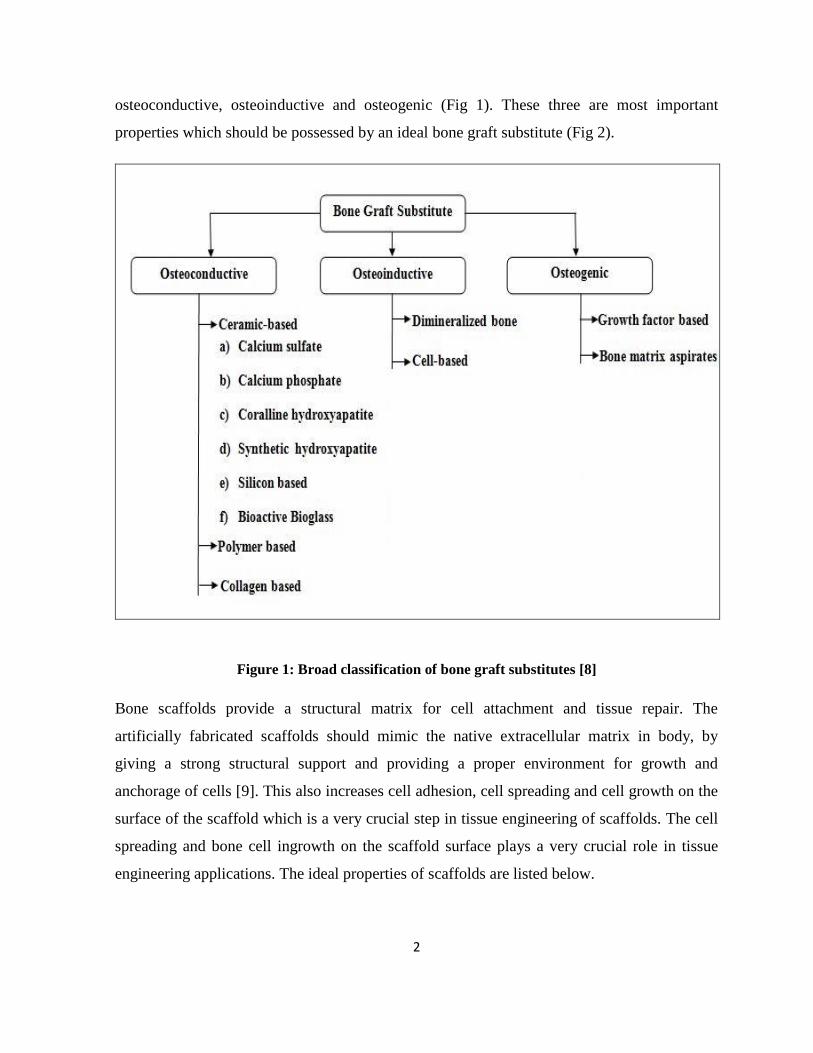
osteoconductive, osteoinductive and osteogenic (Fig 1). These three are most important
properties which should be possessed by an ideal bone graft substitute (Fig 2).
Figure 1: Broad classification of bone graft substitutes [8]
Bone scaffolds provide a structural matrix for cell attachment and tissue repair. The
artificially fabricated scaffolds should mimic the native extracellular matrix in body, by
giving a strong structural support and providing a proper environment for growth and
anchorage of cells [9]. This also increases cell adhesion, cell spreading and cell growth on the
surface of the scaffold which is a very crucial step in tissue engineering of scaffolds. The cell
spreading and bone cell ingrowth on the scaffold surface plays a very crucial role in tissue
engineering applications. The ideal properties of scaffolds are listed below.
3
OSTEOGENIC
OSTEOCONDUCTIVE OSTEOINDUCTIVE
Figure 2: Three most important properties possessed by an ideal bone graft substitute
1. Biocompatibility
The property of material by virtue of which it prevents unwanted immunological reactions
when implanted inside body is known as biocompatibility. Such a material does not release
any toxic or harmful product causing chronic inflammation or tissue necrosis [10]. When an
implant is introduced in body it involves a plethora of immunological reactions. Initially
blood reacts with implant surface and results in a temporary matrix which initiates blood clot
Thereafter, acute and chronic inflammation occurs in a sequential manner. Neutrophills and
polymorphonuclear leucocytes are released during acute inflammation whereas monocytes
and lymphocytes are released during chronic inflammation.
IDEAL SCAFFOLD
Osteoblasts Osteocytes
Scaffolds Factors
4
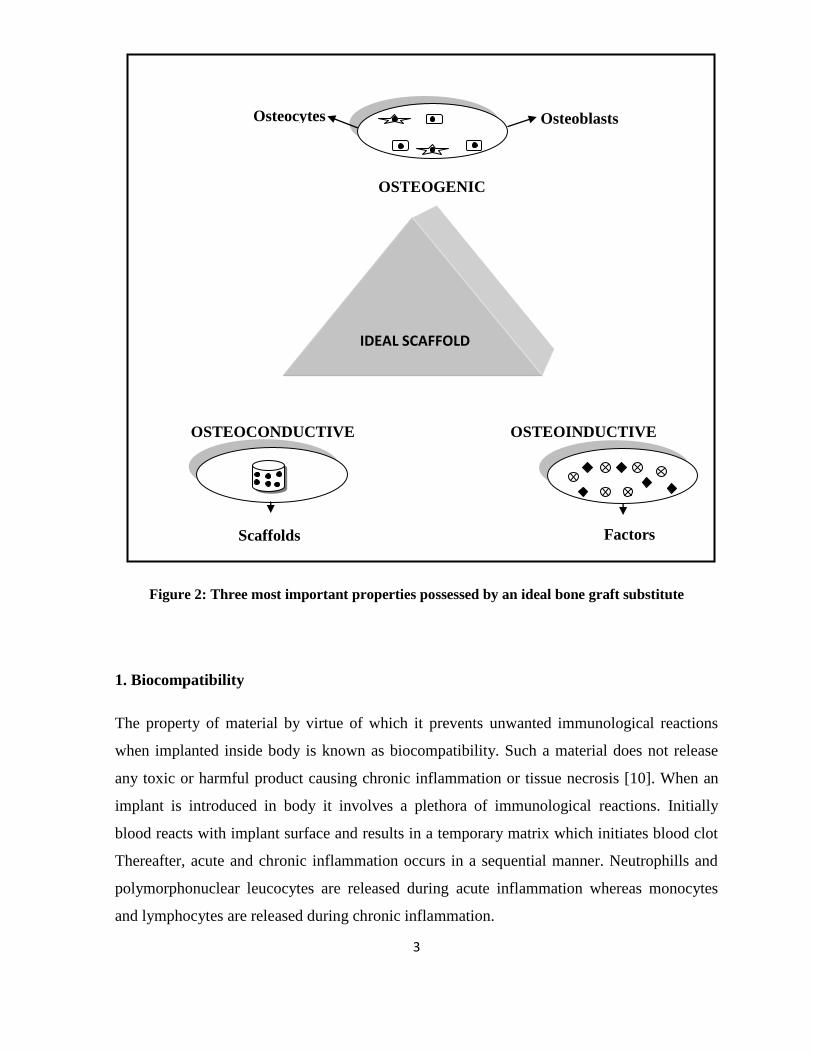
Table 2: Different types of biocompatibility tests[11]
The adsorbed proteins activate the complement system which is the first line of defense. It
triggers immune cell activation immediately after invasion of a foreign body. The foreign
In-vitro testing In-vivo testing
FDA Tests Cell culture Cell culture Blood
response
Others Tissue
compaibility
Implantation
Implantation Types of
Cells
Tests Coagulation Bacterial
adheshion
Subcutaneous Subcutis
Hemolysis Fibroblasts Replication Complement
tests
Protein
adsorption
Intramuscular Blood
Acute
systemic
Toxicity
Monocyte Proliferation Platelet
adhesion
and
activation
Calcification Intraperitoneal Bone
Pyrogenecity Macrophage Adhesion Fibrin
adhesion
and
activation
Mineralisation Cornea
Mutagenicity Endothelium Density Erythrocyrte Reproduction
Osteoblast Morphology SEM
observations
Heart
Urethelial
Cells
Phenotype Arteries
Gingival
Cells
Receptor
expression
Epithelial
Cells
Secretion
Molecules
Reproductive
Cells
mRNAexpression
5
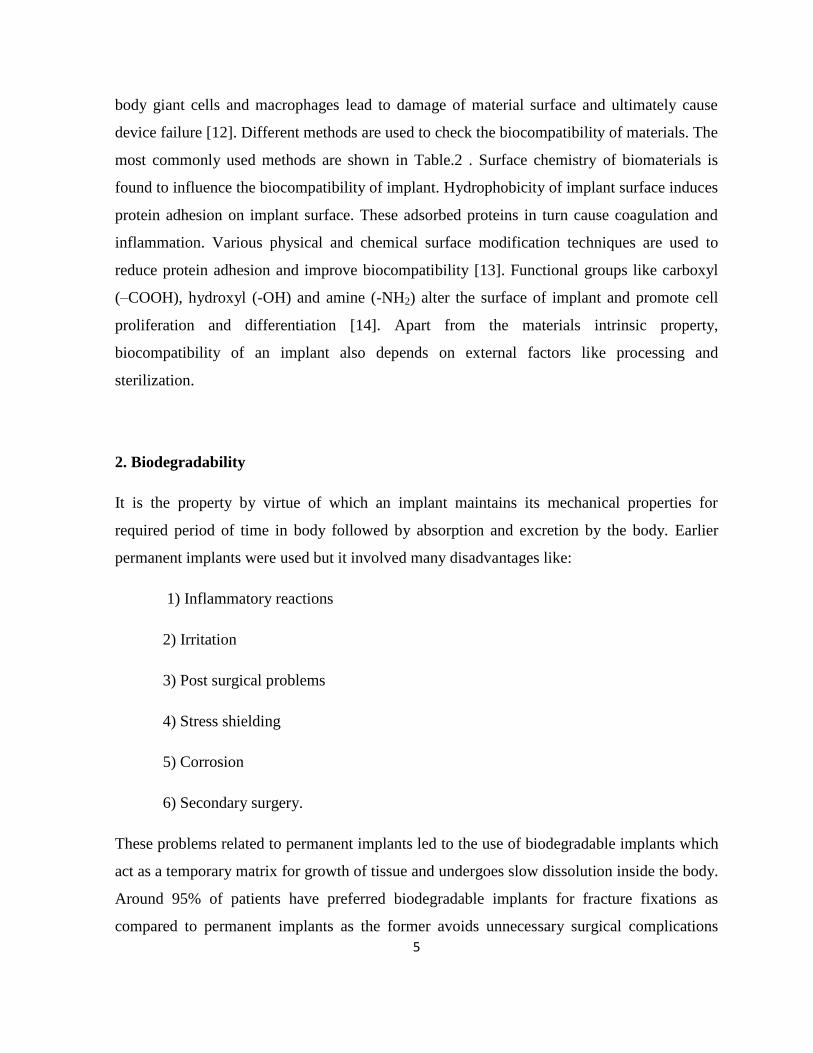
body giant cells and macrophages lead to damage of material surface and ultimately cause
device failure [12]. Different methods are used to check the biocompatibility of materials. The
most commonly used methods are shown in Table.2 . Surface chemistry of biomaterials is
found to influence the biocompatibility of implant. Hydrophobicity of implant surface induces
protein adhesion on implant surface. These adsorbed proteins in turn cause coagulation and
inflammation. Various physical and chemical surface modification techniques are used to
reduce protein adhesion and improve biocompatibility [13]. Functional groups like carboxyl
(–COOH), hydroxyl (-OH) and amine (-NH2) alter the surface of implant and promote cell
proliferation and differentiation [14]. Apart from the materials intrinsic property,
biocompatibility of an implant also depends on external factors like processing and
sterilization.
2. Biodegradability
It is the property by virtue of which an implant maintains its mechanical properties for
required period of time in body followed by absorption and excretion by the body. Earlier
permanent implants were used but it involved many disadvantages like:
1) Inflammatory reactions
2) Irritation
3) Post surgical problems
4) Stress shielding
5) Corrosion
6) Secondary surgery.
These problems related to permanent implants led to the use of biodegradable implants which
act as a temporary matrix for growth of tissue and undergoes slow dissolution inside the body.
Around 95% of patients have preferred biodegradable implants for fracture fixations as
compared to permanent implants as the former avoids unnecessary surgical complications
6
[15]. The rate of degradation of implant should match the tissue growth in order to maintain
the mechanical integrity in a controlled manner [16]. Biodegradable materials used in
orthopaedic applications can be broadly classified into natural and synthetic materials. Natural
materials include collagen, gelatin, polysaccharides (alginate, chitosan, agarose, hyaluronic
acid) and fibrin. Commonly used synthetic materials include Poly(a-Hydroxy Esters), Poly(e-
Caprolactone), Poly(Orthoesters), Poly(Anhydrides), Poly(Ethylene Glycol)-based materials,
Poly(Amino Acids) and fumarate-based polymers [17]. Biodegradable implants show two
types of events on introduction within body. One is the short-term or immediate foreign body
reaction and the second one is long-term event. Former one involves recruitment of mast
cells, histamine and proteins on the site of implantation. The later involves chronic
inflammation. Biodegradable implants should be biocompatible in order to exist in body for
long time without any unwanted immunological reaction [18].
3.Mechanical strength
An implant should be strong enough to withstand the weight of body as well as the muscle
force exerted by the skeletal structure [19]. These forces exerted on implant cause stress-strain
reactions on the bone-implant interface and lead to implant breakage and failure. When an
implant is attached to a bone the load which was totally carried by bone initially is now
distributed between the implant and bone [20]. As a result the bone is shielded from the stress
i.e the stress induced in bone is reduced. This phenomenon is known as stress shielding and
bone resorption occurs simultaneously [21]. Stiffer the implant more is the stress shielding
effect. According to Wolff’s law: “bone adapts to the different loads to which it is subjected”
i.e bone undergoes remodeling in order to adjust to the load applied on it [22-23]. So, the
primary goal in fabrication of an implant is that it should remain mechanically stable in long
run. The implant should be designed in such a way that the stress should be homogenously
distributed between the implant and bone thus, preventing bone atrophy and fracture.
Mechanical strength details of human bone are given in table below (Table 3).
7
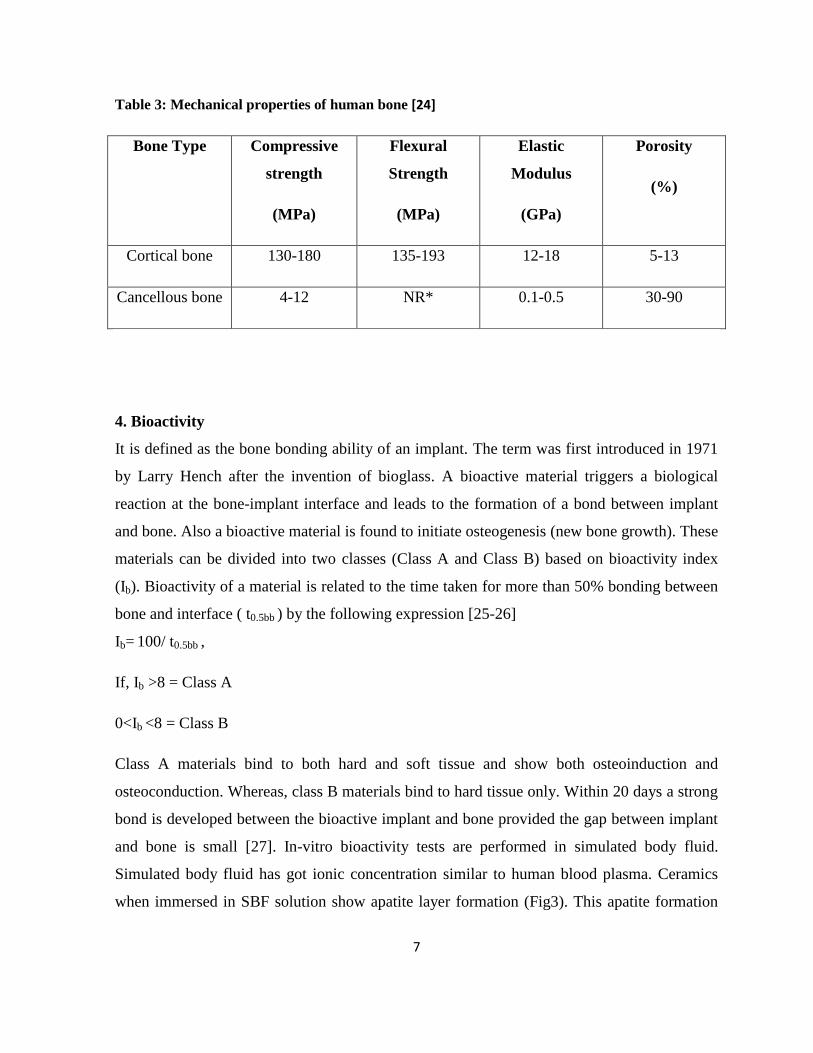
Table 3: Mechanical properties of human bone [24]
Bone Type Compressive
strength
(MPa)
Flexural
Strength
(MPa)
Elastic
Modulus
(GPa)
Porosity
(%)
Cortical bone 130-180 135-193 12-18 5-13
Cancellous bone 4-12 NR* 0.1-0.5 30-90
4. Bioactivity
It is defined as the bone bonding ability of an implant. The term was first introduced in 1971
by Larry Hench after the invention of bioglass. A bioactive material triggers a biological
reaction at the bone-implant interface and leads to the formation of a bond between implant
and bone. Also a bioactive material is found to initiate osteogenesis (new bone growth). These
materials can be divided into two classes (Class A and Class B) based on bioactivity index
(Ib). Bioactivity of a material is related to the time taken for more than 50% bonding between
bone and interface ( t0.5bb ) by the following expression [25-26]
Ib= 100/ t0.5bb ,
If, Ib >8 = Class A
0<Ib <8 = Class B
Class A materials bind to both hard and soft tissue and show both osteoinduction and
osteoconduction. Whereas, class B materials bind to hard tissue only. Within 20 days a strong
bond is developed between the bioactive implant and bone provided the gap between implant
and bone is small [27]. In-vitro bioactivity tests are performed in simulated body fluid.
Simulated body fluid has got ionic concentration similar to human blood plasma. Ceramics
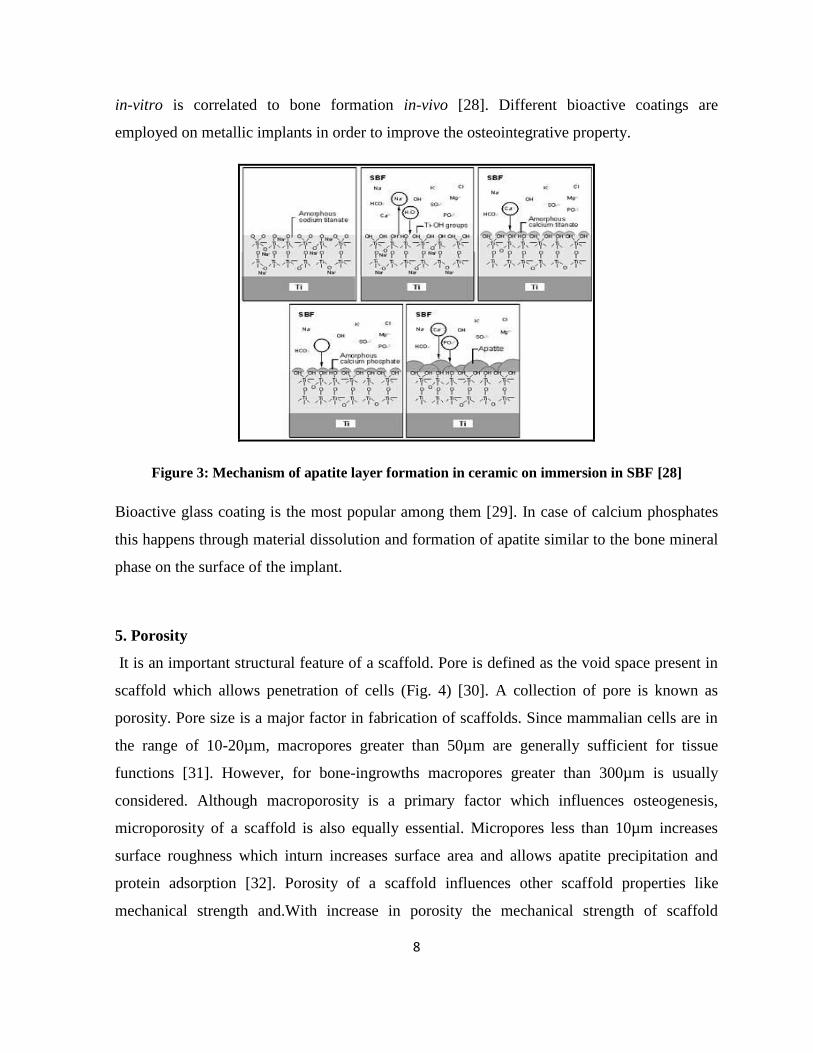
when immersed in SBF solution show apatite layer formation (Fig3). This apatite formation
8
in-vitro is correlated to bone formation in-vivo [28]. Different bioactive coatings are
employed on metallic implants in order to improve the osteointegrative property.
Figure 3: Mechanism of apatite layer formation in ceramic on immersion in SBF [28]
Bioactive glass coating is the most popular among them [29]. In case of calcium phosphates
this happens through material dissolution and formation of apatite similar to the bone mineral
phase on the surface of the implant.
5. Porosity
It is an important structural feature of a scaffold. Pore is defined as the void space present in
scaffold which allows penetration of cells (Fig. 4) [30]. A collection of pore is known as
porosity. Pore size is a major factor in fabrication of scaffolds. Since mammalian cells are in
the range of 10-20µm, macropores greater than 50µm are generally sufficient for tissue
functions [31]. However, for bone-ingrowths macropores greater than 300µm is usually
considered. Although macroporosity is a primary factor which influences osteogenesis,
microporosity of a scaffold is also equally essential. Micropores less than 10µm increases
surface roughness which inturn increases surface area and allows apatite precipitation and
protein adsorption [32]. Porosity of a scaffold influences other scaffold properties like
mechanical strength and.With increase in porosity the mechanical strength of scaffold
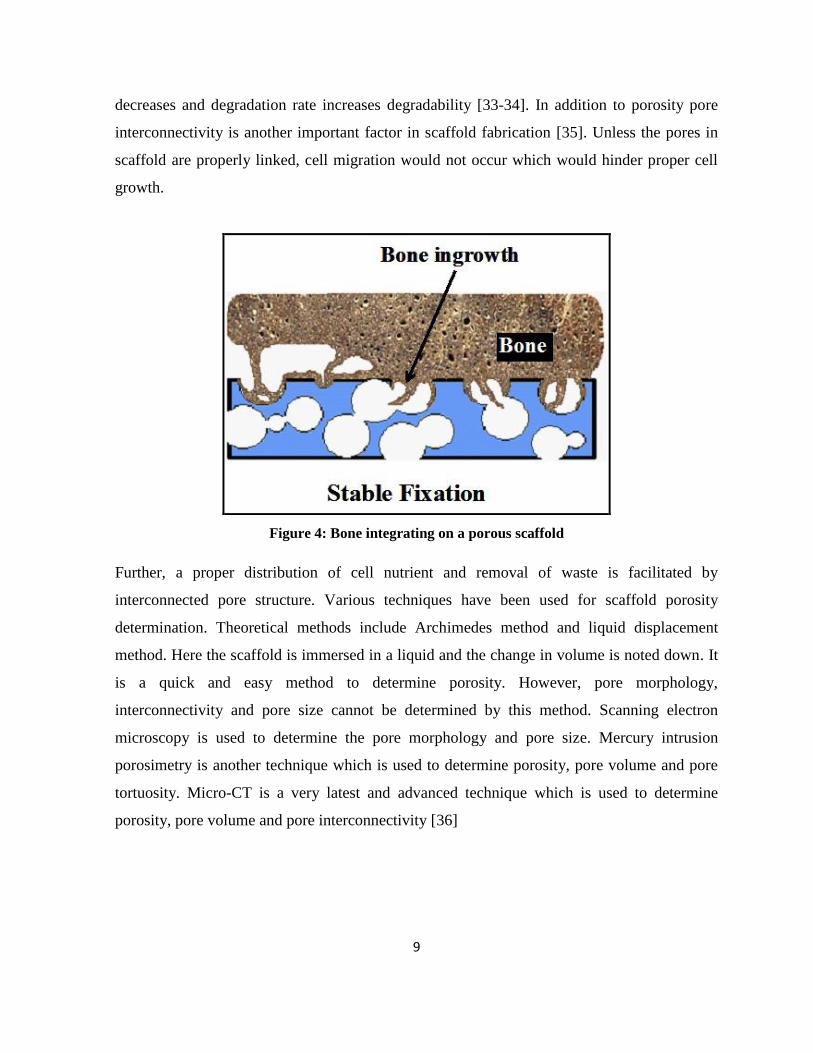
9
decreases and degradation rate increases degradability [33-34]. In addition to porosity pore
interconnectivity is another important factor in scaffold fabrication [35]. Unless the pores in
scaffold are properly linked, cell migration would not occur which would hinder proper cell
growth.
Figure 4: Bone integrating on a porous scaffold
Further, a proper distribution of cell nutrient and removal of waste is facilitated by
interconnected pore structure. Various techniques have been used for scaffold porosity
determination. Theoretical methods include Archimedes method and liquid displacement
method. Here the scaffold is immersed in a liquid and the change in volume is noted down. It
is a quick and easy method to determine porosity. However, pore morphology,
interconnectivity and pore size cannot be determined by this method. Scanning electron
microscopy is used to determine the pore morphology and pore size. Mercury intrusion
porosimetry is another technique which is used to determine porosity, pore volume and pore
tortuosity. Micro-CT is a very latest and advanced technique which is used to determine
porosity, pore volume and pore interconnectivity [36]
10
6. Sterilizability
Sterilization is the process that kills all types of microbes and living organisms present on the
surface of a material. An implant should be sterile so that it can be placed inside body without
any reaction from the host body. Disinfection will kill most of the vegetative microorganisms
but resistant bacterial spores are not affected by the treatment. The most commonly used
disinfectants such are alcohol, iodophors, quaternary ammonium and phenolic compounds are
not accepted as good sterilizing agents for surgical purposes. Sterility is determined by a limit
known as sterility assurance limit (SAL). It is defined as the probability that an implant
remains nonsterile after placing inside body. The accepted limit of SAL is 10-6
[37]. Various
techniques used for sterilization are as follows: steam sterilization, gamma irradiation,
ethylene oxide sterilization, hydrogen peroxide gas plasma treatment, peracetic acid
treatment, dry heat sterilizers, liquid chemicals, microwave and formaldehyde steam [38]
Steam sterilization is commonly used on heat resistant materials. Materials that are heat labile
use other alternative low-temperature sterilization techniques. So, depending on the material
type the most appropriate sterilization technique is chosen.
7. Manufacturability
The prepared scaffold should be made of such a material that it can be easily fabricated.
Generally scaffolds are tested in laboratory scale and the preparation and other methodologies
applied are done in pilot scale. So, the constituents used and the method of fabrication should
be simple and easy to fabricate even in large scale. As the main aim is to use the scaffold for
clinical purpose very complicated methods might be difficult to scale up. Sometimes the
result obtained in pilot scale does not match that in large scale. So, the material chosen
initially should be done in such a way that it is feasible when used in large scale use.
The industrial application is a must as it is the final goal of any product manufacture.
All the above mentioned properties should be present in an ideal scaffold for proper cell
growth, adhesion and for application in clinical applications and applications in industrial
level.
11
The goal of this research is to fabricate a three dimensional, mechanically stable porous tri-
calcium phosphate-carboxymethyl cellulose alginate scaffold by using a simple, cost-effective
set-up made from a reusable syringe. The purpose of fabrication of these scaffolds is to
provide oxygen and nutrients to flow through the open interconnected pores created by gas
entrapment in the fibers in order to promote osteoblasts. The mechanical properties of tri-
calcium phosphate scaffolds were increased by using carboxymethyl cellulose. An optimum
porosity was tried to obtain by using different concentrations of sodium bicarbonate in order
to tailor the porosity. The biological properties are based on the structure and mechanical
properties of scaffold.
Micropores are incorporated in the fibers by entrapment of gas. The gas is produced by
chemical reaction between acetic acid and sodium bicarbonate. The evolved gas is then forced
to come out by vacuum treatment. Thus open interconnected pores are formed. This basically
allows proper nutrient supply. Thus macroporosity in between fibers and microporosity in the
fibers is achieved in the fabricated scaffolds. Also a simple cost-effective set up was formed
for extrusion of paste in order to form fibers. A 10 ml syringe was designed in such a way
with a sieve plate and a hole pattern in the syringe head. This set-up was used manually by
application of pressure on the scaffold fiber. The height of the scaffold was adjusted by using
a known volume of paste.
12
Calcium phosphates have been used widely to fabricate bone graft substitutes. Tri-calcium
phosphates have been used in orthopedic applications as it is a rich source of calcium and
phosphorous. It is easily absorbed by body and shows high biocompatibility and bioactivity
[39]. These materials allow adhesion of growth factors and protein on their surface.
Promotion of osteoblast adhesion makes calcium phosphates osteoconductive and hence it is
widely used to repair bone defects and injury [40].
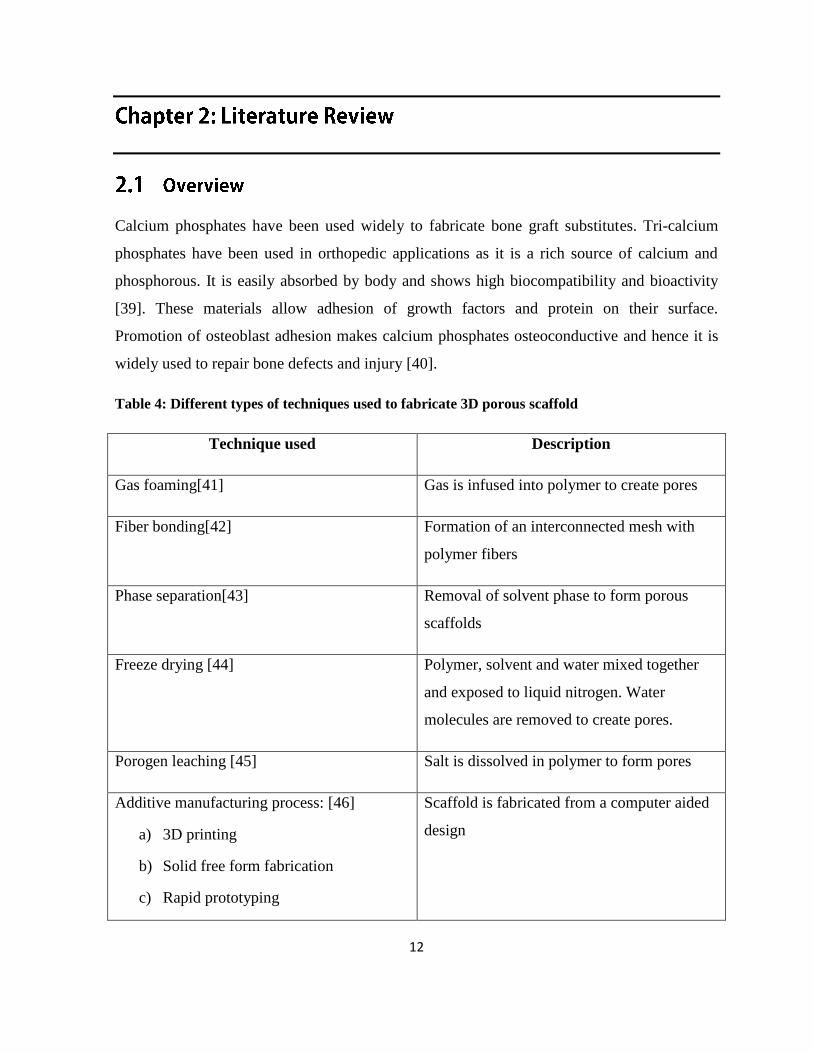
Table 4: Different types of techniques used to fabricate 3D porous scaffold
Technique used Description
Gas foaming[41] Gas is infused into polymer to create pores
Fiber bonding[42] Formation of an interconnected mesh with
polymer fibers
Phase separation[43] Removal of solvent phase to form porous
scaffolds
Freeze drying [44] Polymer, solvent and water mixed together
and exposed to liquid nitrogen. Water
molecules are removed to create pores.
Porogen leaching [45] Salt is dissolved in polymer to form pores
Additive manufacturing process: [46]
a) 3D printing
b) Solid free form fabrication
c) Rapid prototyping
Scaffold is fabricated from a computer aided
design
13
Similarity with inorganic phase of bone has led to the use of tri-calcium phosphates as
suitable candidate for fabrication of 3-D scaffolds [46]. Although there are various views
regarding the property that an ideal 3-D scaffold should posses, porous architecture has
always remained a primary need. Porosity initiates bone tissue ingrowth and assists in vivo
osteoblast growth and proliferation. Macroporosity initiates osteogenesis. But interconnection
between pores plays a vital role in bone vascularization and bone remodeling [47-48].
Microporosity (< 20µm) improves bone ingrowth by increasing protein adsorption on scaffold
surface [49]. The combination of macro, micro and interconnected porosity together helps in
providing nourishment for the formation of new bone. Microporous hydroxyapatite scaffolds
have shown four times more bone growth and bone contact with implant compared to normal
scaffolds post healing [50]. Different techniques are used to fabricate porous 3D scaffolds.
The common techniques used are listed in Table 4. Gas based techniques are used compared
to other techniques as it does not involve use of toxic solvents and allows proper dispersion of
gas bubbles throughout the polymer.
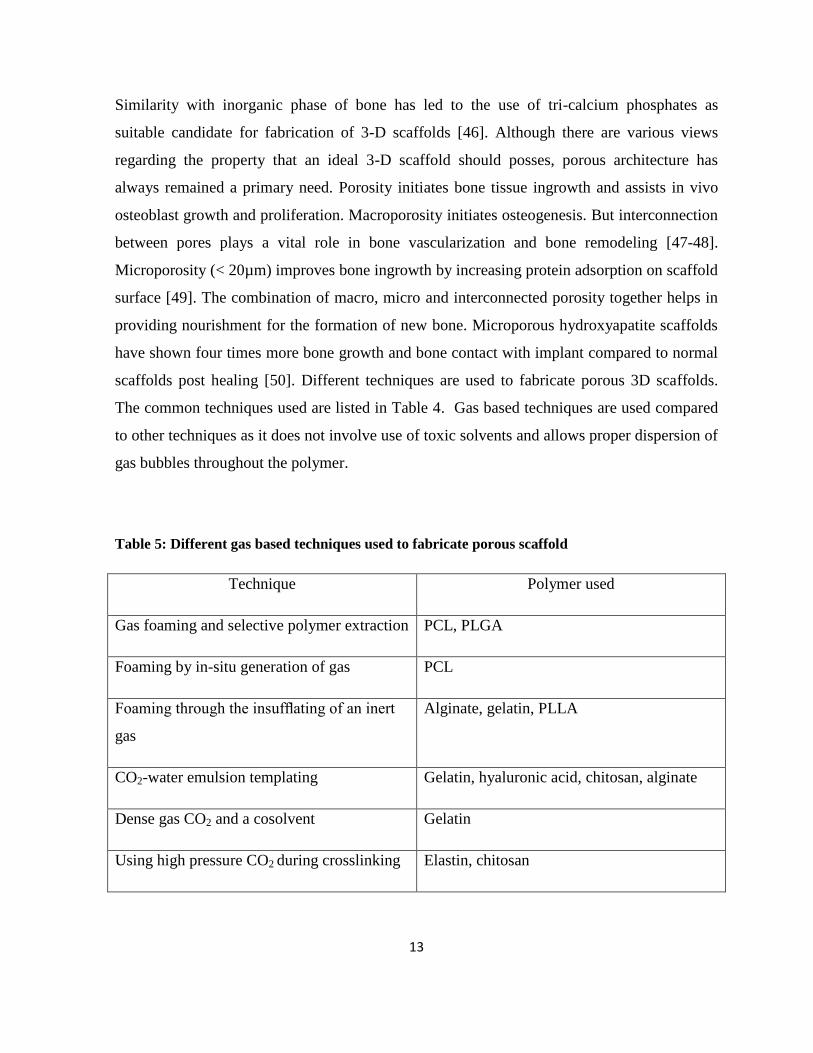
Table 5: Different gas based techniques used to fabricate porous scaffold
Technique Polymer used
Gas foaming and selective polymer extraction PCL, PLGA
Foaming by in-situ generation of gas PCL
Foaming through the insufflating of an inert
gas
Alginate, gelatin, PLLA
CO2-water emulsion templating Gelatin, hyaluronic acid, chitosan, alginate
Dense gas CO2 and a cosolvent Gelatin
Using high pressure CO2 during crosslinking Elastin, chitosan
14
Different gas based techniques used to fabricate porous scaffold are shown in Table 5 [51].
Also the porosity of scaffolds directly influences its mechanical property. Study shows that
mechanical strength increases with decrease in porosity [52]. However higher porosity and
pore size result in successful bone ingrowth into scaffolds but decreases the mechanical
strength [53]
Scaffolds that can be used in repairing load-bearing bone defects or other large defects, is the
current requirement. However, the particular mechanical need of the scaffolds studied in
repair of such defects, from the very start of implantation to total healing is still to be
understood. The materials and their respective mechanical properties are still to be clear. The
required properties such as strength and stiffness have been explained in the literature in many
ways and different ways have been taken in order to design specific mechanically stable
structures. A number of literatures have shown bone scaffold properties should be similar to
those of natural one [53]. In order to achieve a scaffold with optimum mechanical strength
the change in properties with respect to degradation should also be considered. The
degradation rates also play a very critical role as a processing parameter in scaffold
fabrication. Many studies took a totally different approach and optimized scaffold pore
structure such that the scaffold characteristics matched that of native bone. Calcium
phosphate is a perfect material for use in bone repair. They have strength similar to bone and
they exist in various forms which can be suitably used according to the clinical requirement.
The only problem faced in using this material is the load bearing application and the inherent
property of brittleness of the material. At present, the problem of breakage is being studied.
Although tri-calcium phosphates are used popularly in implant applications they show low
mechanical strength [54]. These exhibit natural brittleness and are not suitable for use in load
bearing sites. Various methods have been employed in order to increase the strength of
calcium phosphate scaffold. A second phase introduced in the ceramic matrix increases its
stability [55]. Introduction of polymers in tri-calcium phosphate (TCP) powder has also found
to increase mechanical property. PLGA, PMMA, polypropylene and polycaprolactone are
common polymers which have been used to fabricate TCP composite scaffolds [54]. At
present ceramic based polymeric scaffolds are being developed to provide proper matrix for
bone tissue engineering [56]. It has been seen that ceramic based grafts are not suitable for
15
soft tissue growth when compared to polymeric substitutes, so synthetic and natural polymers
are added to ceramics in order to improve its properties [57]. These composite scaffolds are
considered as the present choice for bone replacements as they mimic natural conditions and
allow cell prolifereation and differentiation in-vivo [58]. Carboxymethyl cellulose is a water
soluble cellulose derivative which has been used to increase the compressive strength of
materials [59-60]. It is a biodegradable biocompatible polymer which has the capability of
chelating with the calcium ions in the hydroxyapatite. This induces cross-linking and makes it
a suitable biopolymeric matrix. Nanocomposites of carboxymethyl cellulose (CMC) and HA
have been used to fabricate 3D load bearing bone grafts [61]. CMC has been used in
composite preparations due to its low cost compared to other naturally derived polymers and
its excellent biological properties. In bone tissue engineering, different materials have been
used in bone repair and replacement. These biomaterials are of several types like: metals,
ceramics, polymers, and composites. An ideal scaffold material which should be used in
tissue engineering should meet certain properties in order to match that of host tissue
environment. Good osteoinductive, osteoconductive properties, biodegradability and
biocompatibility is a basic requirement. Along with that in addition, porosity,
interconnectivity and microstructure is also considered for bone repair. It is very challenging
to find a porous structure with suitable pore size as well as mechanical properties. Various
fabrication techniques have been used in manufacture of ceramics in biomedical applications
However, none of the methods have completely satisfied the current necessity.
Studies show that hydroxyapatite (HA) and other calcium phosphate (CaP) ceramics help in
formation of bone-like apatite layer on the surface. The degradation of CaPs have a strong
correlation with bioactivity. The dissolution process is is linked to the precipitation of apatite
like precipitation on the surface of the implant which is similar to that of bone. The
degradation rate for CaPs is Comparatively slower as compared to polymers this helps in
maintaining a balance between degradation and bone growth. Different compositions of
calcium phosphates have been used with chemical compositions of Ca5(PO4)5OH and a
calcium to phosphate ratio of 1.67.
There are different types of scaffolds which have their own advantages and
disadvantages. The extracellular matrix in our body is composed of proteins like laminin,
16
collagen etc. These are fibrous in nature and allow cell adhesion and proliferation in-vivo. In
order to mimic the extracellular matrix scaffolds are fabricated in such a way that they
resemble the micron sized fibrils inside the body. Compared to the 2D scaffolds where the
cells only attach to the scaffold surface, fibrous scaffolds allow proper spreading and adhesion
of cells on to each of the fiber surface. This increases the surface area and in turn the diffusion
of nutrients and nutrient availability is also increased compared to the 2D scaffolds [62]. The
number of cells is also found to be higher in fibrous 3D scaffolds compared to others thus
initiating faster bone healing and remodeling. Anisotropic properties are exhibited by the
fibrous scaffolds thus allows proper cell orientation [63]. Studies show that the cell signaling
and other cellular functions as well as cell differentiation and proliferations differ in 3D
scaffolds compared to 2D ones. Also the arrangement of fibers and the microstructure plays a
very important role in cell and tissue engineering [64]. Polymers have been found to have
good degradation rate and they can be removed easily from body as metabolic waste after
complete degradation. PLGA and PCL have been used successfully in scaffold fabrication and
have found to show excellent degradability [65]. Polymeric scaffolds undergo degradation by
ester bond breakage [66].
In this study in order to fabricate a three dimensional mechanically stable porous
scaffolds which are suitable for bone tissue engineering, TCP-alginate CMC composite was
used and various tests were carried out to evaluate its properties. The scaffold fibres were
formed as a result of forced extrusion of TCP-CMC and alginate solution into a CaCl2-Acetic
acid mixture. The fibres thus obtained were compressed a known dimension and these
cylindrical scaffolds were vacuum treated. This resulted in release of CO2 and a porous
scaffold was formed. This resulted in release of CO2 and a porous scaffold was formed. Gas
entrapment in the scaffold resulted in micro porosity in fibers. Subsequently, the vacuum
treatment led to form an open interconnected porous network. Different ratios of alginate
solution and TCP-CMC powder were mixed together to study the extrusion of the paste
through the syringe.
17
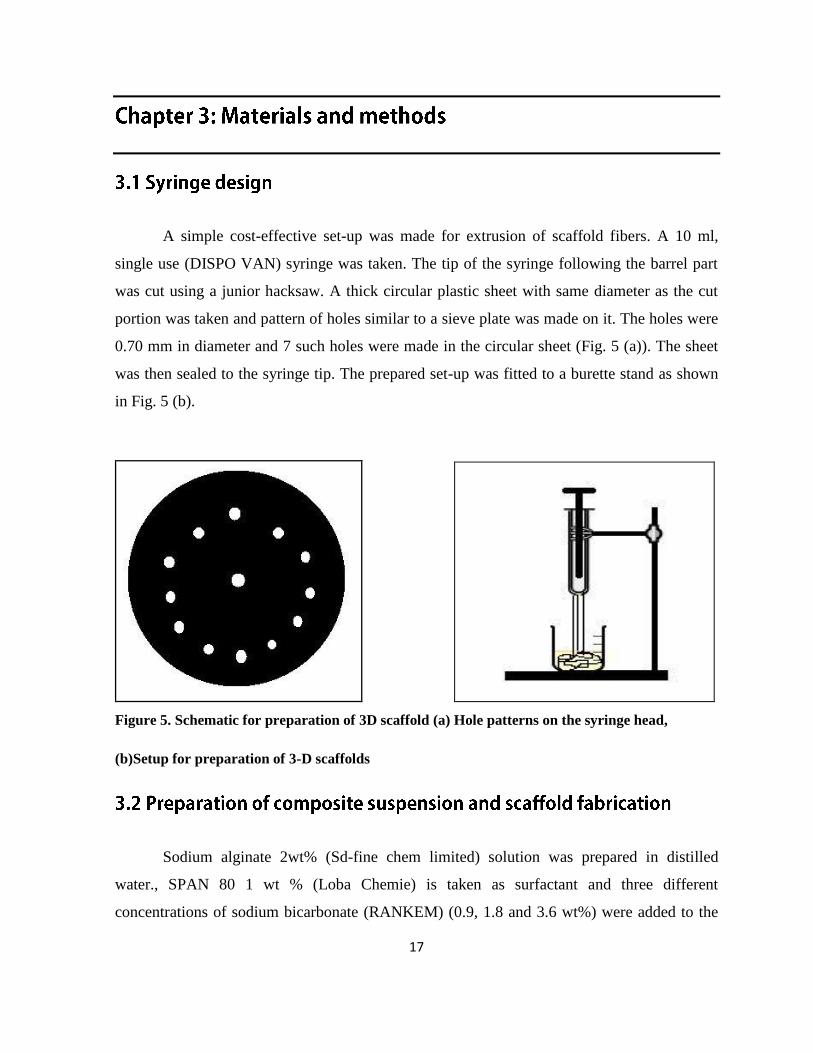
A simple cost-effective set-up was made for extrusion of scaffold fibers. A 10 ml,
single use (DISPO VAN) syringe was taken. The tip of the syringe following the barrel part
was cut using a junior hacksaw. A thick circular plastic sheet with same diameter as the cut
portion was taken and pattern of holes similar to a sieve plate was made on it. The holes were
0.70 mm in diameter and 7 such holes were made in the circular sheet (Fig. 5 (a)). The sheet
was then sealed to the syringe tip. The prepared set-up was fitted to a burette stand as shown
in Fig. 5 (b).
Figure 5. Schematic for preparation of 3D scaffold (a) Hole patterns on the syringe head,
(b)Setup for preparation of 3-D scaffolds
Sodium alginate 2wt% (Sd-fine chem limited) solution was prepared in distilled
water., SPAN 80 1 wt % (Loba Chemie) is taken as surfactant and three different
concentrations of sodium bicarbonate (RANKEM) (0.9, 1.8 and 3.6 wt%) were added to the
18
alginate solution and stirred for 30 minutes till the volume doubled itself. The sample codes
for three different compositions are listed in Table 6.
Table 6: Sample codes for three scaffold compositions
Sample code Alginate (wt%) SPAN 80(wt%) NaHCO3
(wt%)
TCP:CMC
0.9_TCA 2 1 0.9 1:1
1.8_TCA 2 1 1.8 1:1
3.6_TCA 2 1 3.6 1:1
This was followed by addition of appropriate amount of tri-Calcium orthophosphate,
Extra pure (TCP) and carboxymethyl cellulose sodium salt (CMC) (both from HIMEDIA) to
the prepared alginate solution. Different ratios of alginate solution and TCP-CMC powder
were formulated to study extrusion through the experimental set-up. The composition of 0.4
% by weight of alginate solution to TCP-CMC powder was found to be suitable as the
suspension could easily dispense through the holes of the syringe set-up.
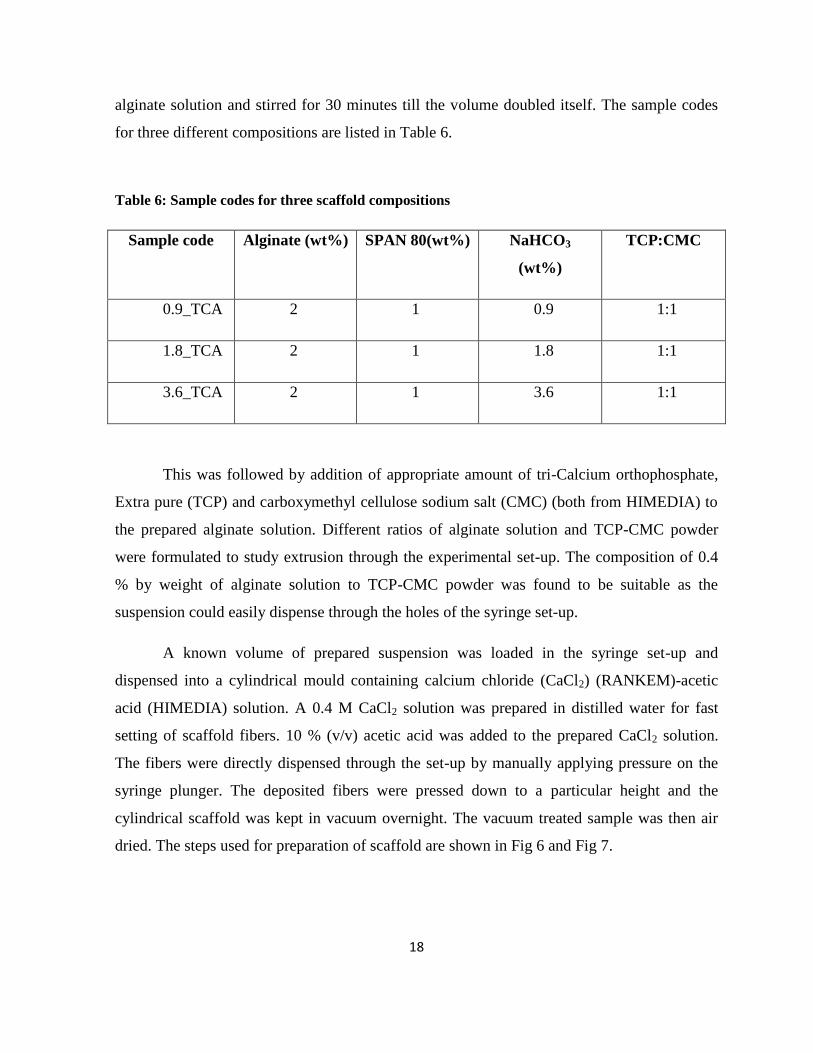
A known volume of prepared suspension was loaded in the syringe set-up and
dispensed into a cylindrical mould containing calcium chloride (CaCl2) (RANKEM)-acetic
acid (HIMEDIA) solution. A 0.4 M CaCl2 solution was prepared in distilled water for fast
setting of scaffold fibers. 10 % (v/v) acetic acid was added to the prepared CaCl2 solution.
The fibers were directly dispensed through the set-up by manually applying pressure on the
syringe plunger. The deposited fibers were pressed down to a particular height and the
cylindrical scaffold was kept in vacuum overnight. The vacuum treated sample was then air
dried. The steps used for preparation of scaffold are shown in Fig 6 and Fig 7.
19
Figure 6: Schematic representation for preparation of composite suspension and scaffold
fabrication
Sodium alginate
solution (2wt %)
Alginate solution with SPAN 80
and NaHCO3 (stirred for 30 mins)
Composite suspension (TCP and
CMC added to form a paste)
Paste dispensed in acetic
acid-CaCl2 bath
Manually pressed down
to desired height
Wet scaffold with closed interconnected pores
Plunger Syringe-set up
Vacuum chamber
Pump
Scaffold placed in vacuum chamber (24hr) Scaffold with open interconnected pores
20
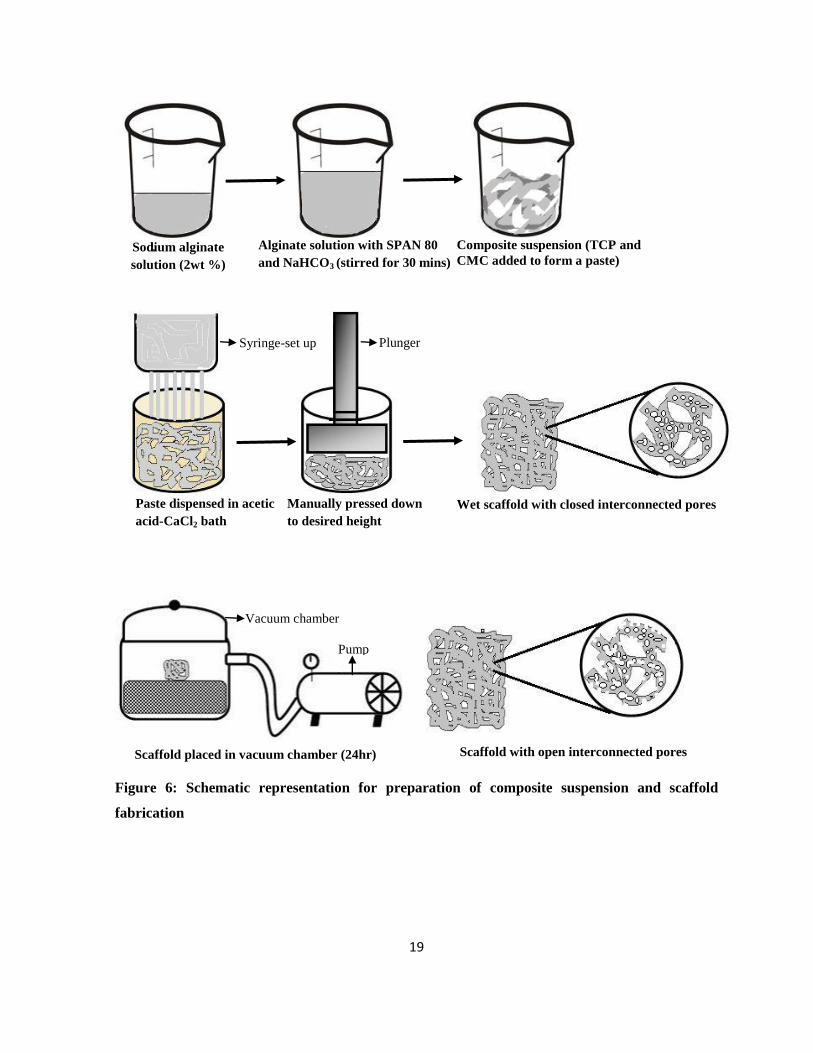
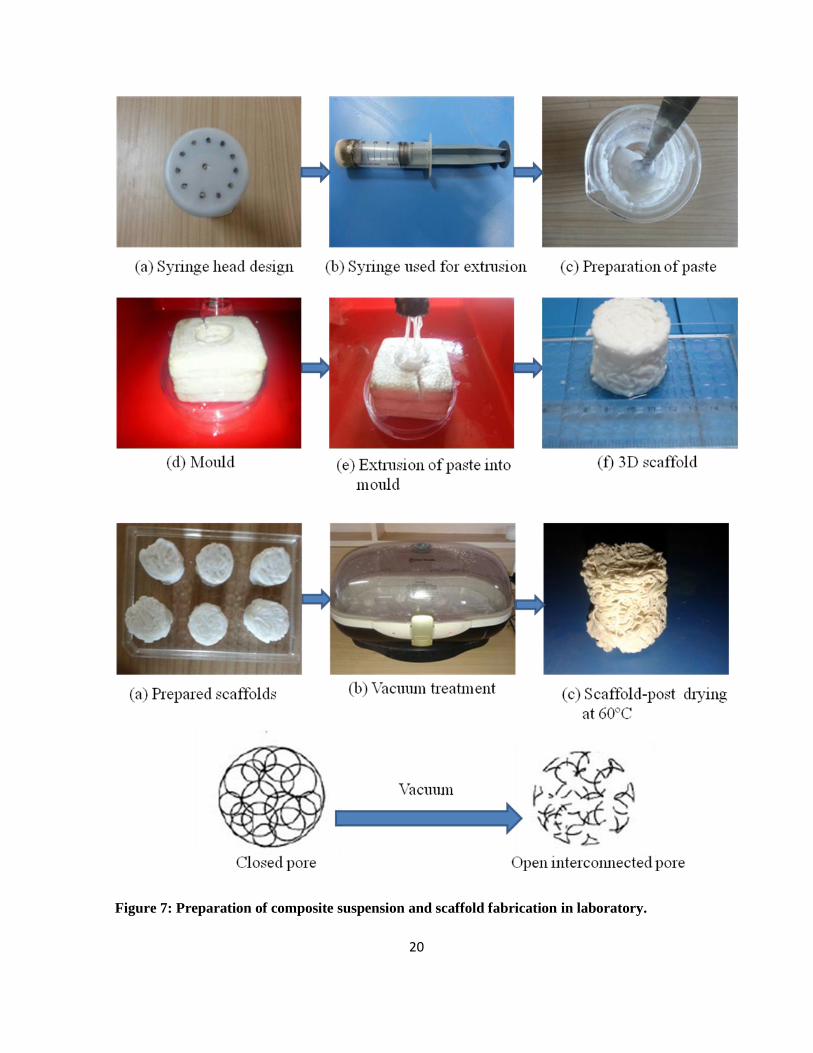
Figure 7: Preparation of composite suspension and scaffold fabrication in laboratory.
21
The morphology of scaffold fibers was analyzed using scanning electron microscopy
(SEM) (JEOL JSM-6480LV). The porosity of the scaffold fibers were quantified using
mercury intrusion porosimetry (MIP) (Quantachrome Corporation). The pressure was varied
from 0.5 to 29,000 psi. The contact angle between mercury and the sample surface was taken
as 140° and surface tension of mercury was taken as 480erg/cm2. Pore diameter, pore size
distribution and percentage of porosity were determined.
The scaffold consists of both macropores (formed between the fibers) and micropores
(formed in the fibers). The overall porosity was determined using the liquid displacement
method. Ethanol was used as the displacement liquid as it easily penetrates into the scaffold
pores and is a non-solvent of polymers. A dry sample of weight W was immersed in a known
volume of ethanol (Va). It was immersed in solution for 5-10 minutes and vacuum was
applied to force the ethanol into the pores of scaffold. The new volume of ethanol (Vb ,
volume of ethanol and ethanol-saturated scaffold) was recorded. The ethanol-saturated
scaffold was removed and the residual ethanol volume (Vc) was measured. The porosity of
scaffold was measured using the following equation (Eq.) [66]. Samples were tested in
duplicates and the average was taken and calculated.
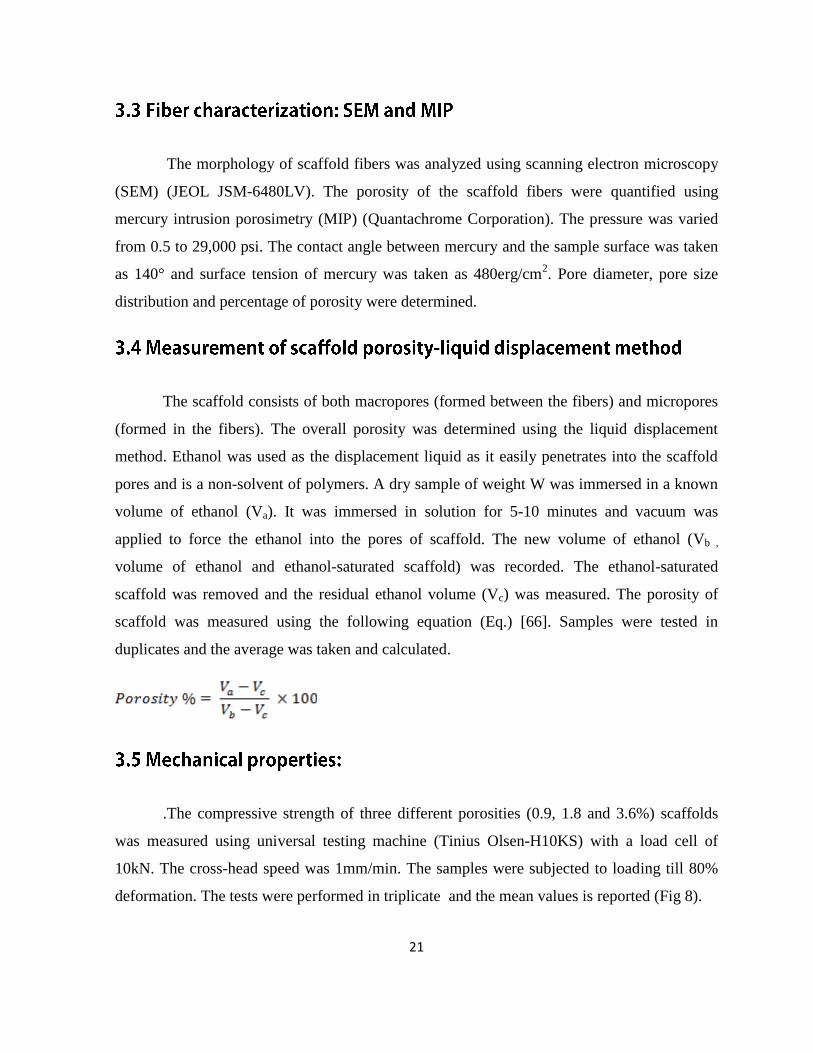
.The compressive strength of three different porosities (0.9, 1.8 and 3.6%) scaffolds
was measured using universal testing machine (Tinius Olsen-H10KS) with a load cell of
10kN. The cross-head speed was 1mm/min. The samples were subjected to loading till 80%
deformation. The tests were performed in triplicate and the mean values is reported (Fig 8).
22
Figure 8: Samples prepared for compression test (a) 0.9_TCA samples intriplicate (b) 1.8_TCA
samples in triplicate and (c) 3.6_TCA samples in triplicate
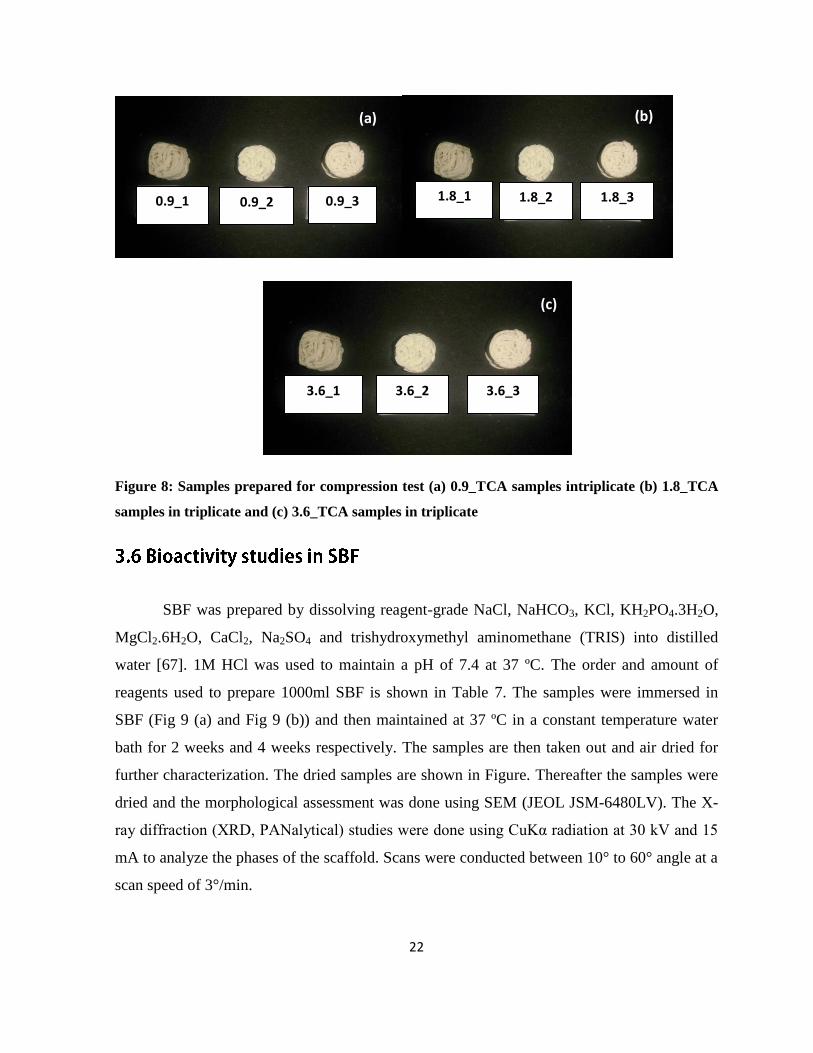
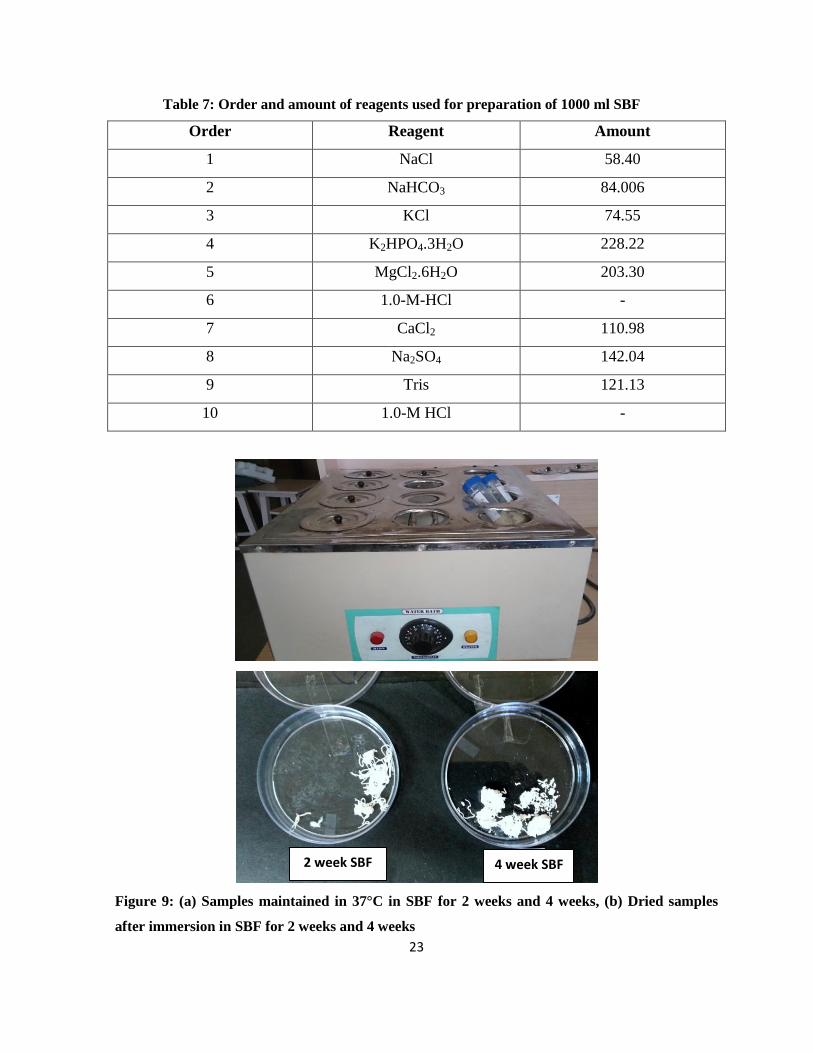
SBF was prepared by dissolving reagent-grade NaCl, NaHCO3, KCl, KH2PO4.3H2O,
MgCl2.6H2O, CaCl2, Na2SO4 and trishydroxymethyl aminomethane (TRIS) into distilled
water [67]. 1M HCl was used to maintain a pH of 7.4 at 37 ºC. The order and amount of
reagents used to prepare 1000ml SBF is shown in Table 7. The samples were immersed in
SBF (Fig 9 (a) and Fig 9 (b)) and then maintained at 37 ºC in a constant temperature water
bath for 2 weeks and 4 weeks respectively. The samples are then taken out and air dried for
further characterization. The dried samples are shown in Figure. Thereafter the samples were
dried and the morphological assessment was done using SEM (JEOL JSM-6480LV). The X-
ray diffraction (XRD, PANalytical) studies were done using CuKα radiation at 30 kV and 15
mA to analyze the phases of the scaffold. Scans were conducted between 10° to 60° angle at a
scan speed of 3°/min.
0.9_1 0.9_2 0.9_3 1.8_1 1.8_2 1.8_3
3.6_1 3.6_2 3.6_3
(a) (b)
(c)
23
Table 7: Order and amount of reagents used for preparation of 1000 ml SBF
Order Reagent Amount
1 NaCl 58.40
2 NaHCO3 84.006
3 KCl 74.55
4 K2HPO4.3H2O 228.22
5 MgCl2.6H2O 203.30
6 1.0-M-HCl -
7 CaCl2 110.98
8 Na2SO4 142.04
9 Tris 121.13
10 1.0-M HCl -
Figure 9: (a) Samples maintained in 37°C in SBF for 2 weeks and 4 weeks, (b) Dried samples
after immersion in SBF for 2 weeks and 4 weeks
2 week SBF 4 week SBF
24
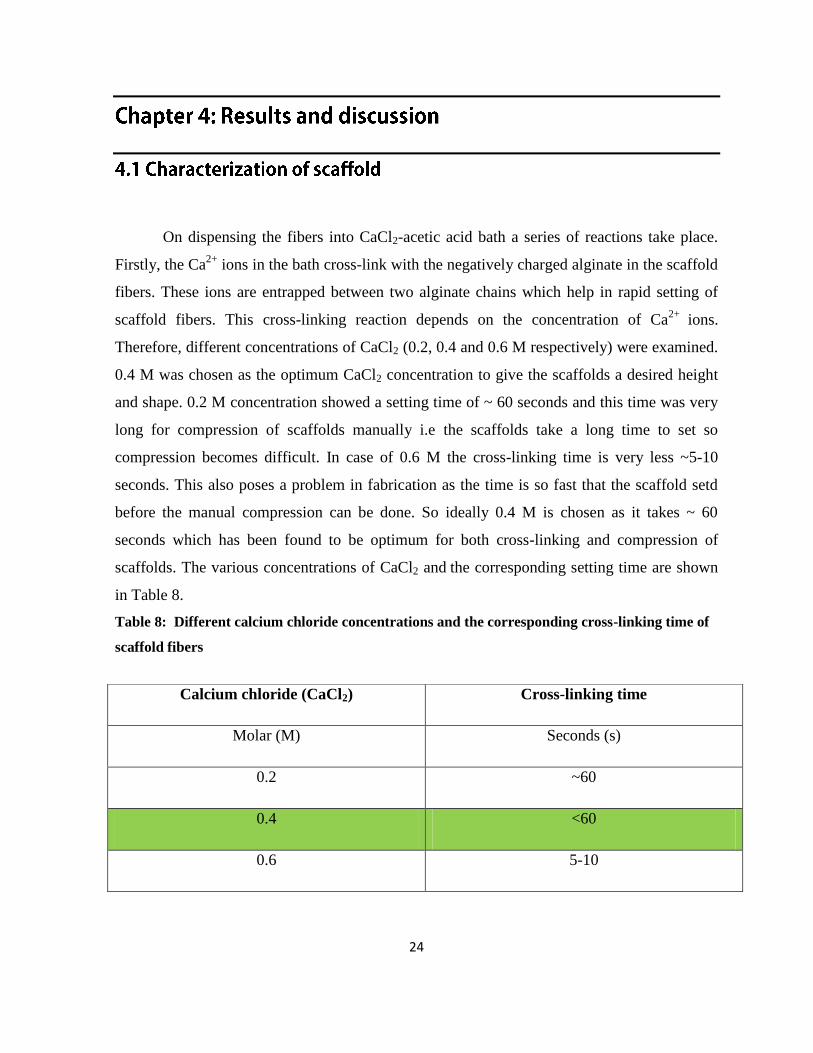
On dispensing the fibers into CaCl2-acetic acid bath a series of reactions take place.
Firstly, the Ca2+
ions in the bath cross-link with the negatively charged alginate in the scaffold
fibers. These ions are entrapped between two alginate chains which help in rapid setting of
scaffold fibers. This cross-linking reaction depends on the concentration of Ca2+
ions.
Therefore, different concentrations of CaCl2 (0.2, 0.4 and 0.6 M respectively) were examined.
0.4 M was chosen as the optimum CaCl2 concentration to give the scaffolds a desired height
and shape. 0.2 M concentration showed a setting time of ~ 60 seconds and this time was very
long for compression of scaffolds manually i.e the scaffolds take a long time to set so
compression becomes difficult. In case of 0.6 M the cross-linking time is very less ~5-10
seconds. This also poses a problem in fabrication as the time is so fast that the scaffold setd
before the manual compression can be done. So ideally 0.4 M is chosen as it takes ~ 60
seconds which has been found to be optimum for both cross-linking and compression of
scaffolds. The various concentrations of CaCl2 and the corresponding setting time are shown
in Table 8.
Table 8: Different calcium chloride concentrations and the corresponding cross-linking time of
scaffold fibers
Calcium chloride (CaCl2) Cross-linking time
Molar (M) Seconds (s)
0.2 ~60
0.4 <60
0.6 5-10
25
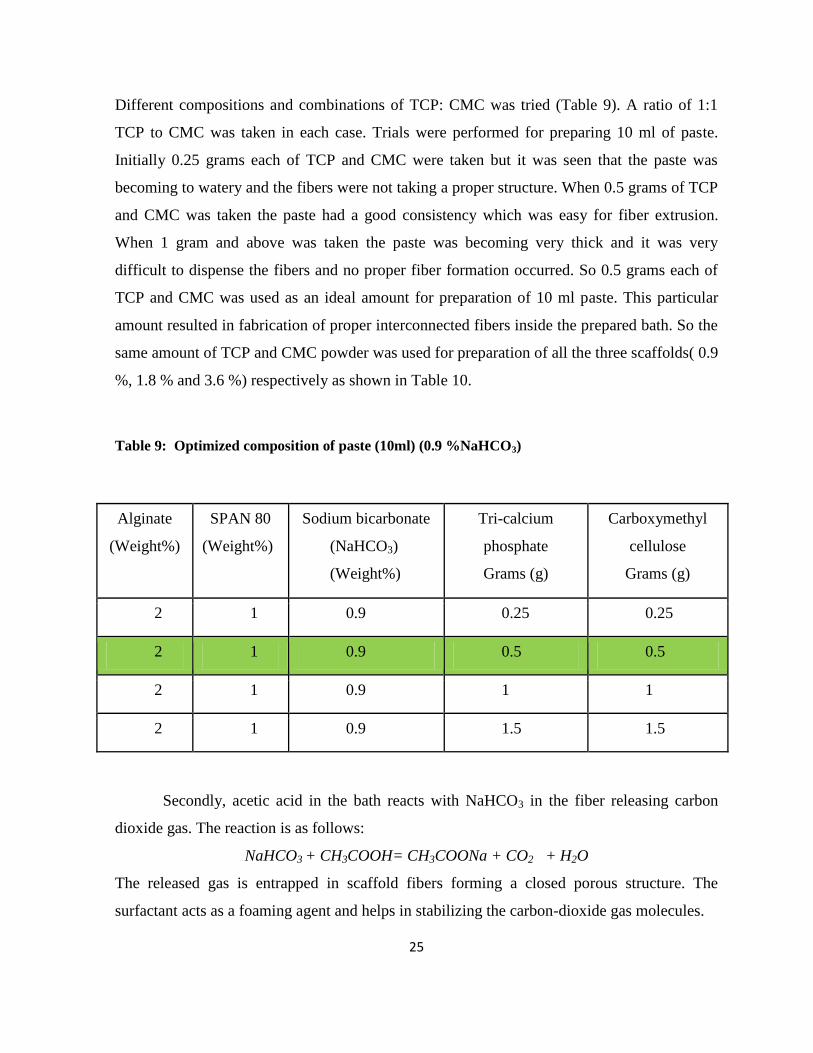
Different compositions and combinations of TCP: CMC was tried (Table 9). A ratio of 1:1
TCP to CMC was taken in each case. Trials were performed for preparing 10 ml of paste.
Initially 0.25 grams each of TCP and CMC were taken but it was seen that the paste was
becoming to watery and the fibers were not taking a proper structure. When 0.5 grams of TCP
and CMC was taken the paste had a good consistency which was easy for fiber extrusion.
When 1 gram and above was taken the paste was becoming very thick and it was very
difficult to dispense the fibers and no proper fiber formation occurred. So 0.5 grams each of
TCP and CMC was used as an ideal amount for preparation of 10 ml paste. This particular
amount resulted in fabrication of proper interconnected fibers inside the prepared bath. So the
same amount of TCP and CMC powder was used for preparation of all the three scaffolds( 0.9
%, 1.8 % and 3.6 %) respectively as shown in Table 10.
Table 9: Optimized composition of paste (10ml) (0.9 %NaHCO3)
Alginate
(Weight%)
SPAN 80
(Weight%)
Sodium bicarbonate
(NaHCO3)
(Weight%)
Tri-calcium
phosphate
Grams (g)
Carboxymethyl
cellulose
Grams (g)
2 1 0.9 0.25 0.25
2 1 0.9 0.5 0.5
2 1 0.9 1 1
2 1 0.9 1.5 1.5
Secondly, acetic acid in the bath reacts with NaHCO3 in the fiber releasing carbon
dioxide gas. The reaction is as follows:
NaHCO3 + CH3COOH= CH3COONa + CO2 + H2O
The released gas is entrapped in scaffold fibers forming a closed porous structure. The
surfactant acts as a foaming agent and helps in stabilizing the carbon-dioxide gas molecules.
26
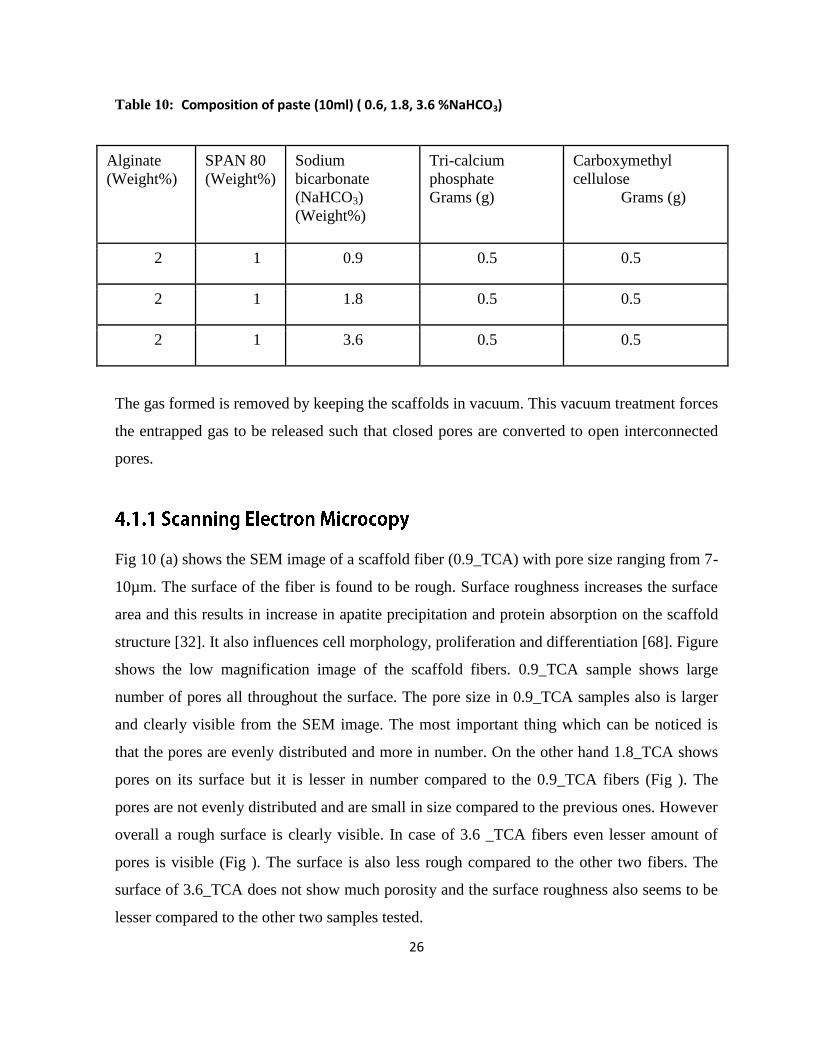
Table 10: Composition of paste (10ml) ( 0.6, 1.8, 3.6 %NaHCO3)
Alginate
(Weight%)
SPAN 80
(Weight%)
Sodium
bicarbonate
(NaHCO3)
(Weight%)
Tri-calcium
phosphate
Grams (g)
Carboxymethyl
cellulose
Grams (g)
2 1 0.9 0.5 0.5
2 1 1.8 0.5 0.5
2 1 3.6 0.5 0.5
The gas formed is removed by keeping the scaffolds in vacuum. This vacuum treatment forces
the entrapped gas to be released such that closed pores are converted to open interconnected
pores.
Fig 10 (a) shows the SEM image of a scaffold fiber (0.9_TCA) with pore size ranging from 7-
10µm. The surface of the fiber is found to be rough. Surface roughness increases the surface
area and this results in increase in apatite precipitation and protein absorption on the scaffold
structure [32]. It also influences cell morphology, proliferation and differentiation [68]. Figure
shows the low magnification image of the scaffold fibers. 0.9_TCA sample shows large
number of pores all throughout the surface. The pore size in 0.9_TCA samples also is larger
and clearly visible from the SEM image. The most important thing which can be noticed is
that the pores are evenly distributed and more in number. On the other hand 1.8_TCA shows
pores on its surface but it is lesser in number compared to the 0.9_TCA fibers (Fig ). The
pores are not evenly distributed and are small in size compared to the previous ones. However
overall a rough surface is clearly visible. In case of 3.6 _TCA fibers even lesser amount of
pores is visible (Fig ). The surface is also less rough compared to the other two fibers. The
surface of 3.6_TCA does not show much porosity and the surface roughness also seems to be
lesser compared to the other two samples tested.
27
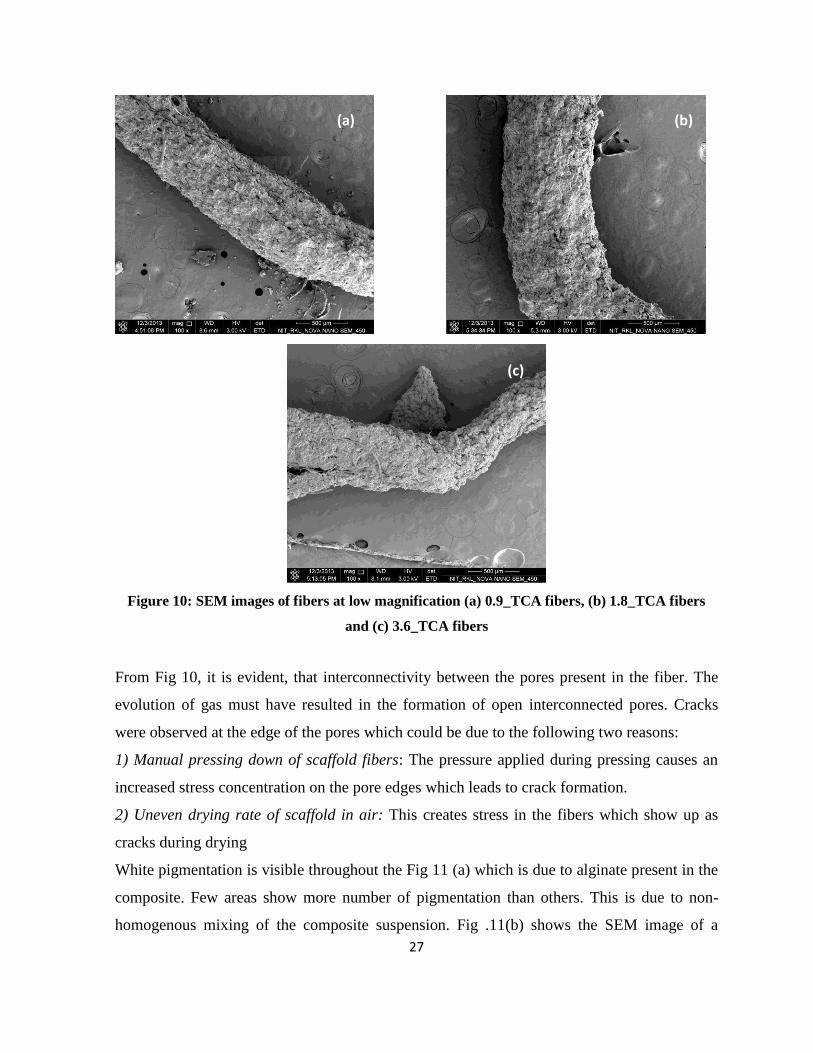
Figure 10: SEM images of fibers at low magnification (a) 0.9_TCA fibers, (b) 1.8_TCA fibers
and (c) 3.6_TCA fibers
From Fig 10, it is evident, that interconnectivity between the pores present in the fiber. The
evolution of gas must have resulted in the formation of open interconnected pores. Cracks
were observed at the edge of the pores which could be due to the following two reasons:
1) Manual pressing down of scaffold fibers: The pressure applied during pressing causes an
increased stress concentration on the pore edges which leads to crack formation.
2) Uneven drying rate of scaffold in air: This creates stress in the fibers which show up as
cracks during drying
White pigmentation is visible throughout the Fig 11 (a) which is due to alginate present in the
composite. Few areas show more number of pigmentation than others. This is due to non-
homogenous mixing of the composite suspension. Fig .11(b) shows the SEM image of a
(a) (b)
(c)
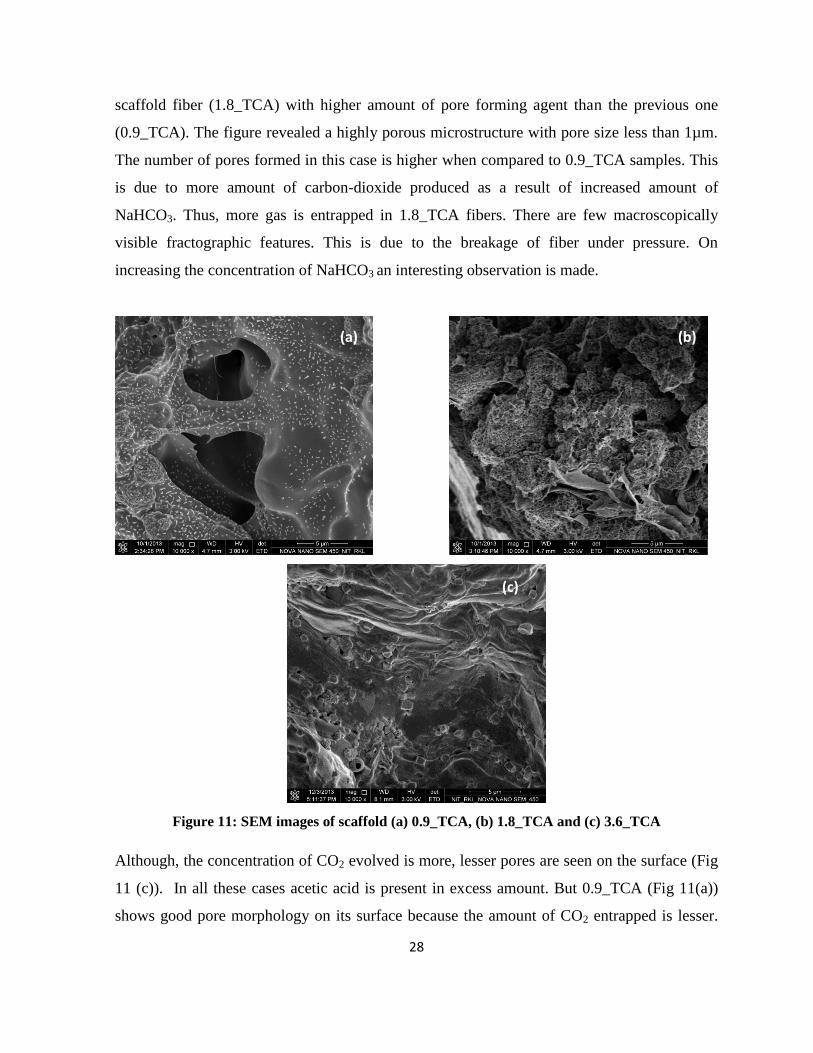
28
scaffold fiber (1.8_TCA) with higher amount of pore forming agent than the previous one
(0.9_TCA). The figure revealed a highly porous microstructure with pore size less than 1µm.
The number of pores formed in this case is higher when compared to 0.9_TCA samples. This
is due to more amount of carbon-dioxide produced as a result of increased amount of
NaHCO3. Thus, more gas is entrapped in 1.8_TCA fibers. There are few macroscopically
visible fractographic features. This is due to the breakage of fiber under pressure. On
increasing the concentration of NaHCO3 an interesting observation is made.
Figure 11: SEM images of scaffold (a) 0.9_TCA, (b) 1.8_TCA and (c) 3.6_TCA
Although, the concentration of CO2 evolved is more, lesser pores are seen on the surface (Fig
11 (c)). In all these cases acetic acid is present in excess amount. But 0.9_TCA (Fig 11(a))
shows good pore morphology on its surface because the amount of CO2 entrapped is lesser.
(a) (b)
(c)
29
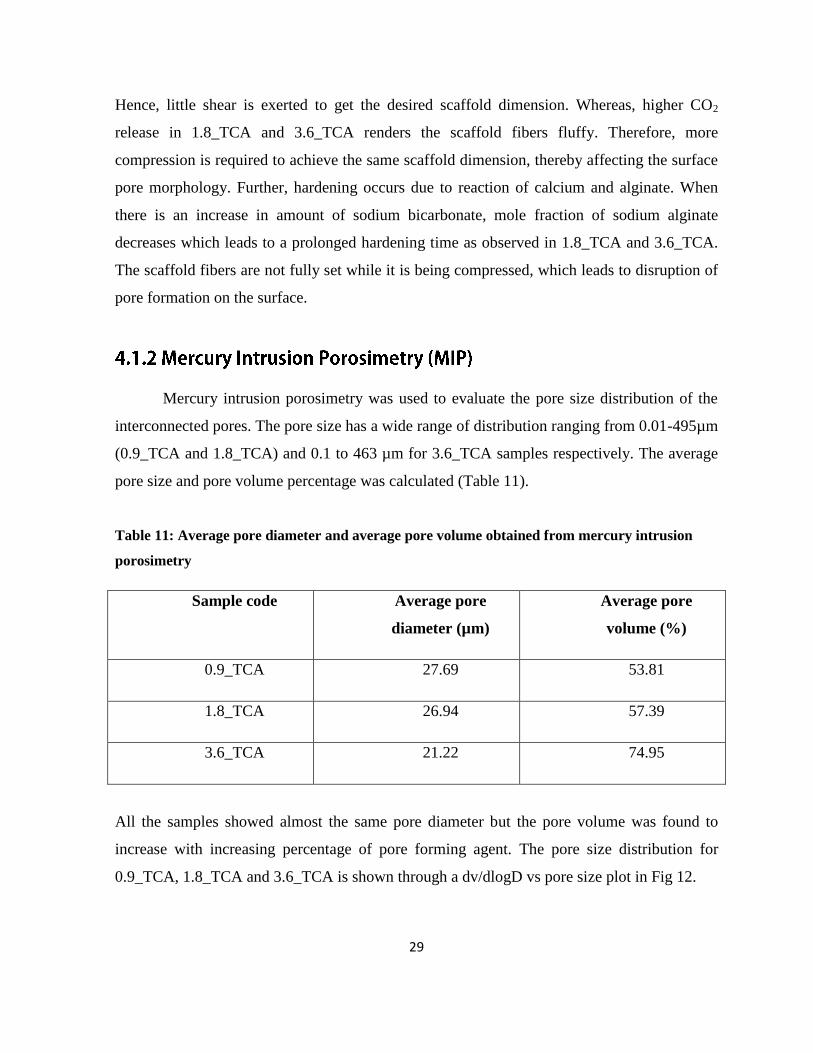
Hence, little shear is exerted to get the desired scaffold dimension. Whereas, higher CO2
release in 1.8_TCA and 3.6_TCA renders the scaffold fibers fluffy. Therefore, more
compression is required to achieve the same scaffold dimension, thereby affecting the surface
pore morphology. Further, hardening occurs due to reaction of calcium and alginate. When
there is an increase in amount of sodium bicarbonate, mole fraction of sodium alginate
decreases which leads to a prolonged hardening time as observed in 1.8_TCA and 3.6_TCA.
The scaffold fibers are not fully set while it is being compressed, which leads to disruption of
pore formation on the surface.
Mercury intrusion porosimetry was used to evaluate the pore size distribution of the
interconnected pores. The pore size has a wide range of distribution ranging from 0.01-495µm
(0.9_TCA and 1.8_TCA) and 0.1 to 463 µm for 3.6_TCA samples respectively. The average
pore size and pore volume percentage was calculated (Table 11).
Table 11: Average pore diameter and average pore volume obtained from mercury intrusion
porosimetry
Sample code Average pore
diameter (µm)
Average pore
volume (%)
0.9_TCA 27.69 53.81
1.8_TCA 26.94 57.39
3.6_TCA 21.22 74.95
All the samples showed almost the same pore diameter but the pore volume was found to
increase with increasing percentage of pore forming agent. The pore size distribution for
0.9_TCA, 1.8_TCA and 3.6_TCA is shown through a dv/dlogD vs pore size plot in Fig 12.
30
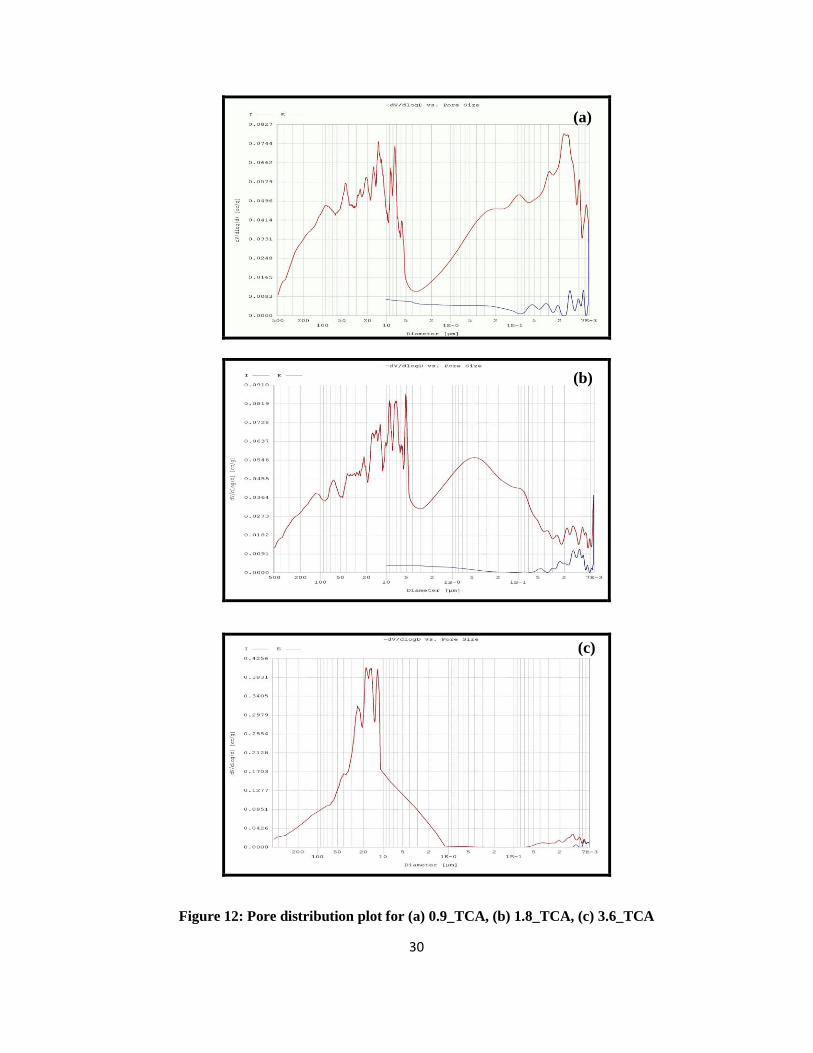
Figure 12: Pore distribution plot for (a) 0.9_TCA, (b) 1.8_TCA, (c) 3.6_TCA
(c)
(a)
(b)
31
In 0.9_TCA plot (Fig 12(a)) the first peak is found on the extreme left, corresponding to
intrusion in the range of 150-200 µm. When moved on to the right sharp peaks corresponding
to 5-70 µm are evident. Further moving to right peaks corresponding to smaller diameters
(.05-1µm) is visible. Peaks in the range of .007µm are observed at the extreme right. This is
the consequence of the surface pores and the interconnected pores present in the interior of
fibers. Fig 12(b) 1.8_TCA sample shows similar plot to the previous one but the number of
peaks in 5-20µm range are more compared to others and a broad peak is observed in the range
of 0.5-1µm. In Fig 12(c) 3.6_TCA plot highest peak is observed in the range of 0.5-200µm
but very small peaks are observed in lower diameter range.As the mercury intrudes further
from surface to the pores inside the fibers the diameter of pore reduces.
These MIP results in combination with the SEM micrographs suggest that micropores
with average pore size of ~28µm are formed and this plays a very crucial role in bone
formation. Microporosity initiates attachment of cells to scaffolds and allows bone ingrowth.
It increases the retention of growth factors and induces angiogenesis [69].
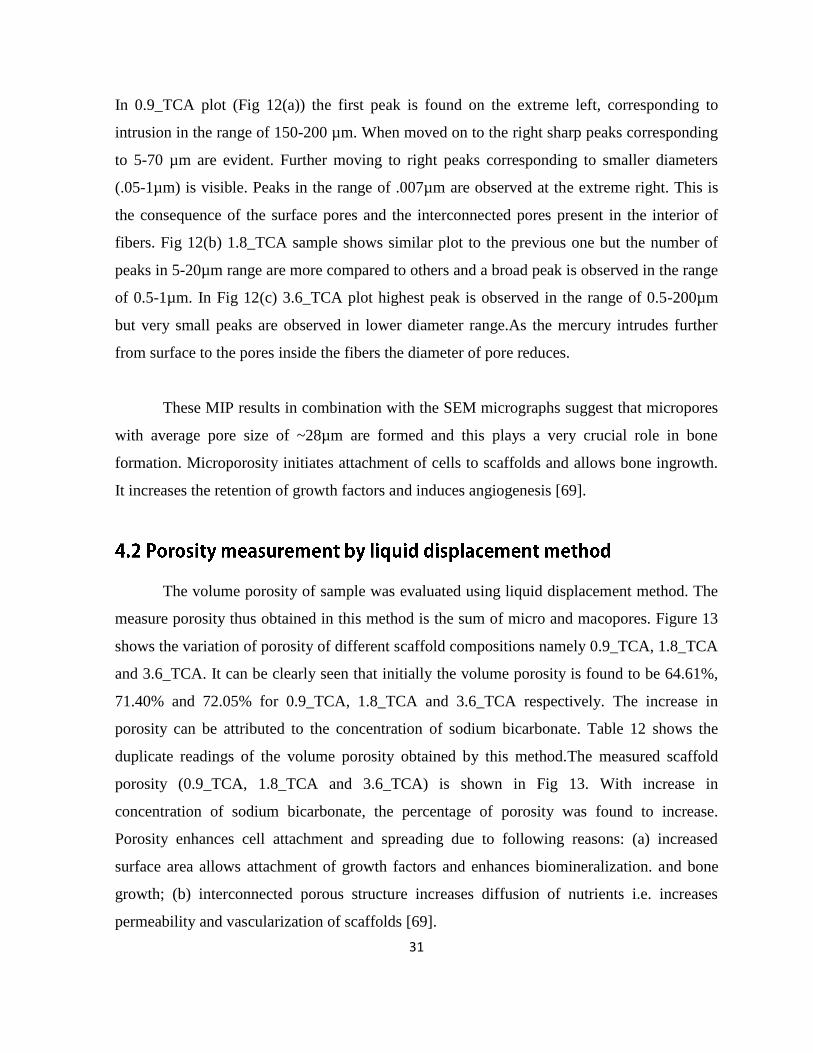
The volume porosity of sample was evaluated using liquid displacement method. The
measure porosity thus obtained in this method is the sum of micro and macopores. Figure 13
shows the variation of porosity of different scaffold compositions namely 0.9_TCA, 1.8_TCA
and 3.6_TCA. It can be clearly seen that initially the volume porosity is found to be 64.61%,
71.40% and 72.05% for 0.9_TCA, 1.8_TCA and 3.6_TCA respectively. The increase in
porosity can be attributed to the concentration of sodium bicarbonate. Table 12 shows the
duplicate readings of the volume porosity obtained by this method.The measured scaffold
porosity (0.9_TCA, 1.8_TCA and 3.6_TCA) is shown in Fig 13. With increase in
concentration of sodium bicarbonate, the percentage of porosity was found to increase.
Porosity enhances cell attachment and spreading due to following reasons: (a) increased
surface area allows attachment of growth factors and enhances biomineralization. and bone
growth; (b) interconnected porous structure increases diffusion of nutrients i.e. increases
permeability and vascularization of scaffolds [69].
32
Figure 13: Graph showing percentage of porosity for various samples as measured by liquid
displacement method
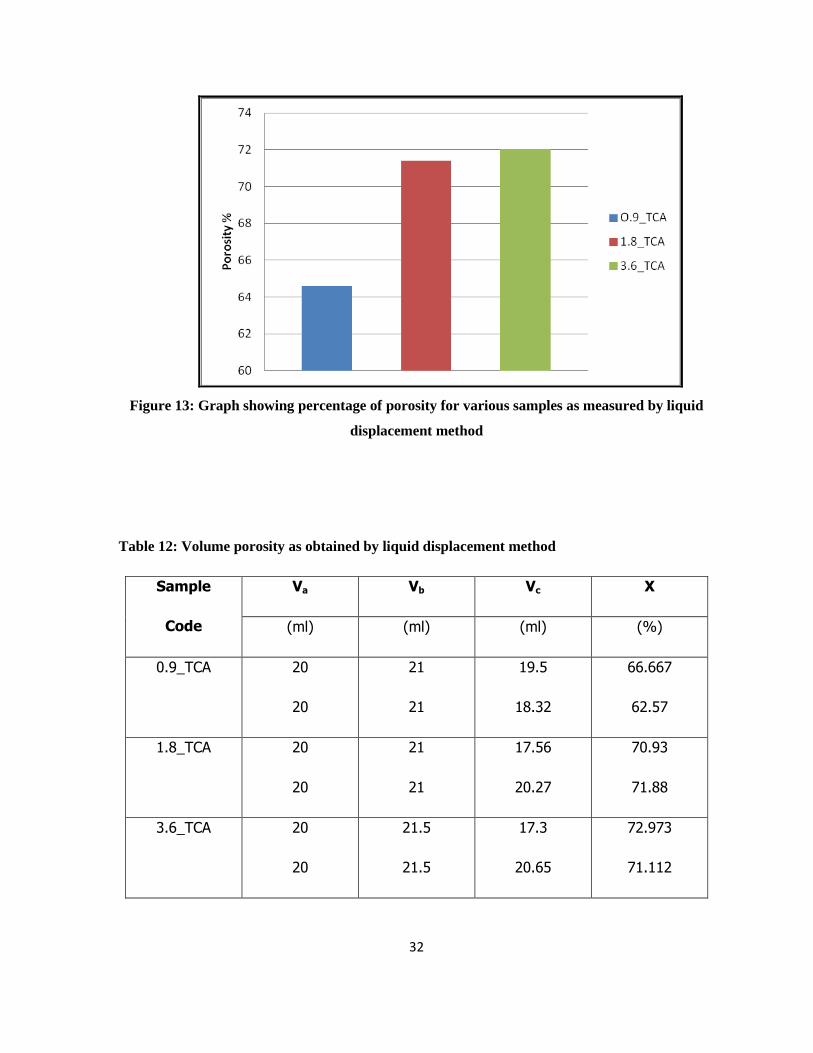
Table 12: Volume porosity as obtained by liquid displacement method
Sample
Code
Va Vb Vc X
(ml) (ml) (ml) (%)
0.9_TCA 20
20
21
21
19.5
18.32
66.667
62.57
1.8_TCA 20
20
21
21
17.56
20.27
70.93
71.88
3.6_TCA 20
20
21.5
21.5
17.3
20.65
72.973
71.112
33
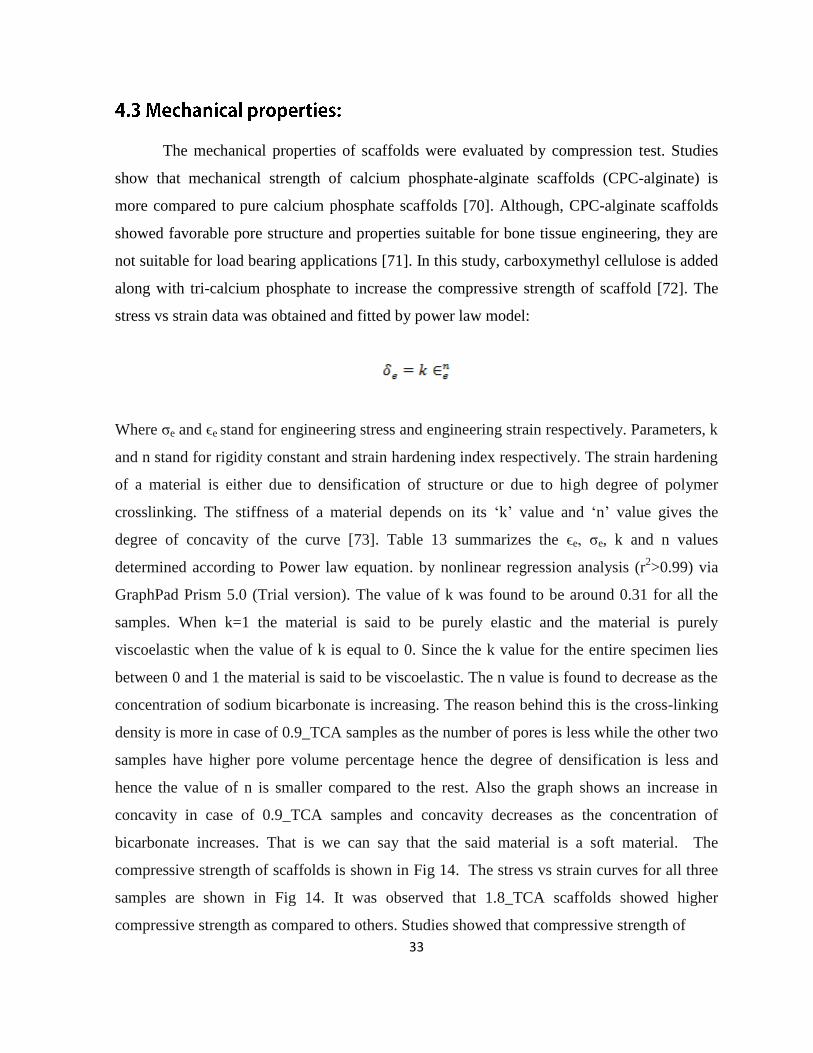
The mechanical properties of scaffolds were evaluated by compression test. Studies
show that mechanical strength of calcium phosphate-alginate scaffolds (CPC-alginate) is
more compared to pure calcium phosphate scaffolds [70]. Although, CPC-alginate scaffolds
showed favorable pore structure and properties suitable for bone tissue engineering, they are
not suitable for load bearing applications [71]. In this study, carboxymethyl cellulose is added
along with tri-calcium phosphate to increase the compressive strength of scaffold [72]. The
stress vs strain data was obtained and fitted by power law model:
Where σe and ϵe stand for engineering stress and engineering strain respectively. Parameters, k
and n stand for rigidity constant and strain hardening index respectively. The strain hardening
of a material is either due to densification of structure or due to high degree of polymer
crosslinking. The stiffness of a material depends on its ‘k’ value and ‘n’ value gives the
degree of concavity of the curve [73]. Table 13 summarizes the ϵe, σe, k and n values
determined according to Power law equation. by nonlinear regression analysis (r2>0.99) via
GraphPad Prism 5.0 (Trial version). The value of k was found to be around 0.31 for all the
samples. When k=1 the material is said to be purely elastic and the material is purely
viscoelastic when the value of k is equal to 0. Since the k value for the entire specimen lies
between 0 and 1 the material is said to be viscoelastic. The n value is found to decrease as the
concentration of sodium bicarbonate is increasing. The reason behind this is the cross-linking
density is more in case of 0.9_TCA samples as the number of pores is less while the other two
samples have higher pore volume percentage hence the degree of densification is less and
hence the value of n is smaller compared to the rest. Also the graph shows an increase in
concavity in case of 0.9_TCA samples and concavity decreases as the concentration of
bicarbonate increases. That is we can say that the said material is a soft material. The
compressive strength of scaffolds is shown in Fig 14. The stress vs strain curves for all three
samples are shown in Fig 14. It was observed that 1.8_TCA scaffolds showed higher
compressive strength as compared to others. Studies showed that compressive strength of
34
Table 13: K and n values obtained from regression analysis
Sample code Log K n
0.9_TCA 2.055±0.009 7.095±0.080
1.8_TCA 2.077±0.064 4.312±0.055
3.6_TCA 2.084±0.010 3.967±0.404
Figure 14: Graph showing the compressive strength of 0.9_TCA, 1.8_TCA, 3.6_TCA samples
fibrous scaffold depends on various parameters like fiber spacing, fiber diameter and layer
thickness. Increase in fiber spacing decreases compressive strength of scaffold. In the present
study the scaffolds were fabricated manually, so that the number of fibers per unit area is not
consistent in every batch. As a result varied compressive strength is obtained. Further,
bioactivity studies and swelling studies were carried out on 0.9_TCA as it had suitable pore
architecture among the various samples. This is because with increase in fiber spacing the
number of fibers per area decreases and hence the amount of loading area also reduces [74].
Hence on uniaxial loading different results are shown which could not be co-related.
However, if the number of fibers could be controlled the mechanical strength can be analyzed.
35
0 2 4 6 8 10
0
500
1000
1500
2000
2500
3000
3500
4000
4500
5000
5500
6000
6500
7000
7500
8000
8500
Fo
rce
Extension (mm)
0.9_1
0.9_2
0.9_3
0 2 4 6 8 10
0
500
1000
1500
2000
2500
3000
3500
Fo
rce
(N
)
Extension (mm)
3.6_1
3.6_2
3.6_3
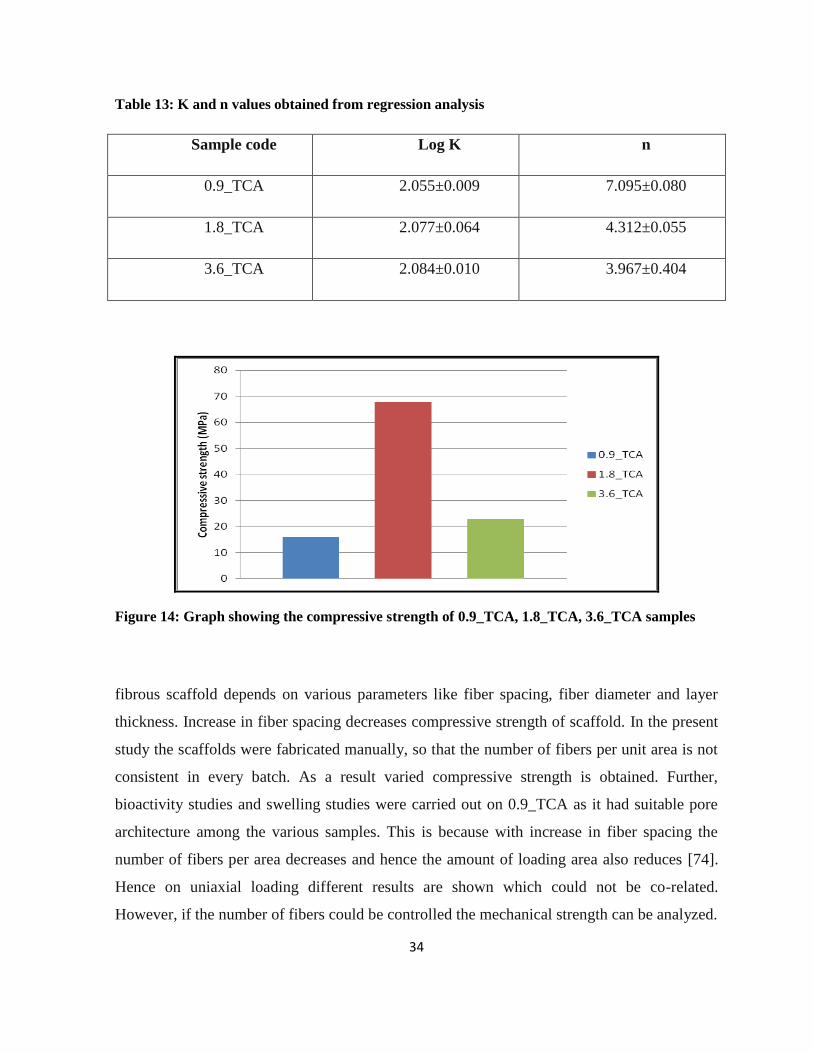
Figure 15: Force vs extension curves obtained from compressive testing of (a) 0.9_TCA in
triplicate, (b) 1.8_TCA in triplicate and (c) 3.6_TCA in triplicate
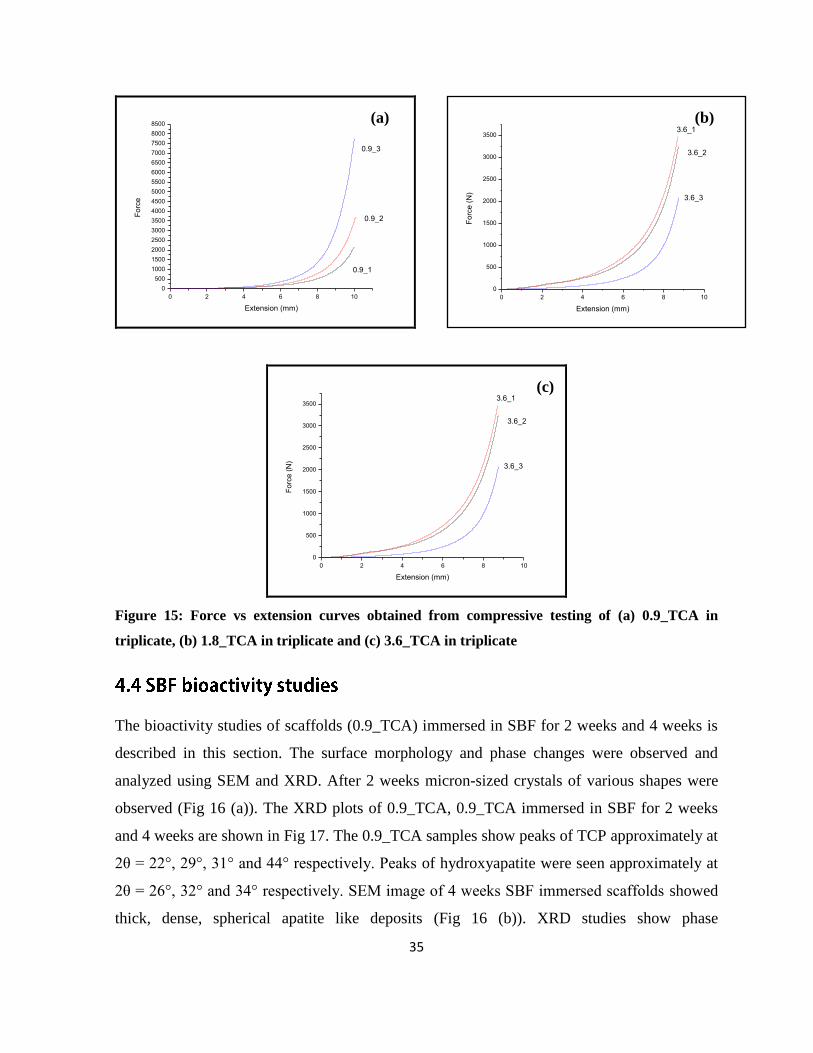
The bioactivity studies of scaffolds (0.9_TCA) immersed in SBF for 2 weeks and 4 weeks is
described in this section. The surface morphology and phase changes were observed and
analyzed using SEM and XRD. After 2 weeks micron-sized crystals of various shapes were
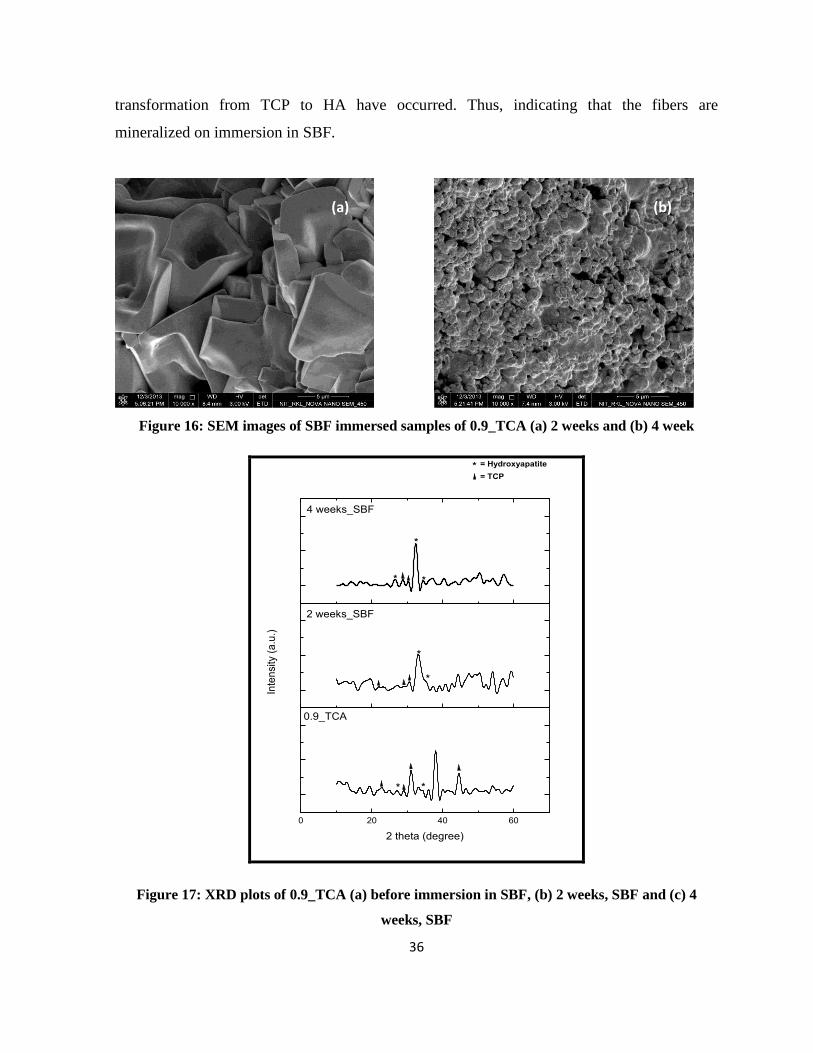
observed (Fig 16 (a)). The XRD plots of 0.9_TCA, 0.9_TCA immersed in SBF for 2 weeks
and 4 weeks are shown in Fig 17. The 0.9_TCA samples show peaks of TCP approximately at
2θ = 22°, 29°, 31° and 44° respectively. Peaks of hydroxyapatite were seen approximately at
2θ = 26°, 32° and 34° respectively. SEM image of 4 weeks SBF immersed scaffolds showed
thick, dense, spherical apatite like deposits (Fig 16 (b)). XRD studies show phase
(a) (b)
(c)
0 2 4 6 8 10
0
500
1000
1500
2000
2500
3000
3500
Fo
rce
(N
)
Extension (mm)
3.6_1
3.6_2
3.6_3
36
transformation from TCP to HA have occurred. Thus, indicating that the fibers are
mineralized on immersion in SBF.
Figure 16: SEM images of SBF immersed samples of 0.9_TCA (a) 2 weeks and (b) 4 week
0 20 40 60
2 theta (degree)
**
0.9_TCA
Inte
nsity
(a
.u.)
*
= Hydroxyapatite
= TCP
*
*
2 weeks_SBF
*
*
*
4 weeks_SBF
Figure 17: XRD plots of 0.9_TCA (a) before immersion in SBF, (b) 2 weeks, SBF and (c) 4
weeks, SBF
(a) (b)
37
In this particular study, a very simple and effective method was used to fabricate a three
dimensional porous scaffold which has reasonable mechanical strength.. The scaffold fibres
were formed as a result of forced extrusion of TCP-CMC and alginate solution into a CaCl2-
Acetic acid mixture. The fibres thus obtained were compressed a known dimension and these
cylindrical scaffolds were vacuum treated. This resulted in release of CO2 and a porous
scaffold was formed. Gas entrapment in the scaffold resulted in micro porosity in fibers.
Subsequently, the vacuum treatment led to form an open interconnected porous network.
Different ratios of alginate solution and TCP-CMC powder were mixed together to study the
extrusion of the paste through the syringe. But the most optimal composition was determined
to be 0.4 wt% .The surface of fibres were characterized using scanning electron microscopy.
A white pigmentation was seen in 0.9_TCA scaffold which is due to the presence of alginate
on its surface. Non- uniform mixing of the composite suspension caused more pigmentation
in few areas as compared to the rest of the surface of the scaffold fibres. With increase in the
amount of sodium hydrogen carbonate (0.9_TCA to 3.6_TCA) there was an increase in the
amount of CO2 produced thus leading to entrapment of more gas in the fibers. However,
0.9_TCA shows the best pore morphology on its surface when compared to the other
compositions it is due to the fact that increase in CO2 entrapment makes the scaffold fibers
fluffier and to get the desired scaffold dimension more compression is required. This affects
the pores on the surface. Further, with increase in the amount of sodium bicarbonate, the
concentration of sodium alginate decreases and this increases the hardening time considerably
as observed in 1.8_TCA and 3.6_TCA scaffolds. Mercury intrusion porosimetry revealed the
pore size distribution of the pores. The pore size ranged from 0.01-495 µm (0.9_TCA and
1.8_TCA) and 0.1-463 µm (3.6_TCA) respectively. The average pore diameter was found to
be ~27µm. The average pore size of ~27 µm suggests favourable attachment of cells to the
scaffold fibers which is very crucial in osteogenesis. These scaffolds have favorable 3-D
matrix for bone tissue engineering applications. The micro and macro porosity may help in
38
proper nutrient diffusion, cell attachment and growth. The volume porosity was obtained by
liquid displacement method. It was found to be 64.61%, 71.40% and 72.05% for 0.9_TCA,
1.8_TCA and 3.6_TCA respectively. With increase in bicarbonate concentration the overall
pore volume percentage was found to increase significantly. Addition of CMC to the scaffold
was done to increase the mechanical strength of the TCP composite. The mechanical
properties were studied using the compression test. It was seen that 1.8_TCA showed higher
compressive strength compared to the other compositions. The regression analysis was done
for stress vs strain curve. Rigidity constant was found to be 2.05, 2.07 and 2.084 for
0.9_TCA, 1.8_TCA and 3.6_TCA respectively. The strain hardening index was calculated to
be 7.05, 4.312 and 3.967 for all the three compositions. The mechanical tests showed varied
results due to inconsistency in scaffold fabrication as the number of fibers per unit area varied
in each batch. This drawback can be overcome if a well defined 3-D matrix is fabricated using
automated tools. The scaffolds showed good in-vitro bioactivity on immersion in SBF as the
formed phase was similar to bone mineral phase. In particular, peaks of TCP and
Hydroxyapatite were seen at 2θ= 22°, 29°, 31° and 44° and 2θ=.26°, 32° and 34° respectively.
Thus, indicating that phase transformation from TCP-HA has occurred and mineralization has
taken place on the fibers. These properties make these scaffolds an ideal material for tissue
engineering constructs. Further research in this direction will make TCP-CMC-alginate
scaffolds as an ideal material for stimulating bone regeneration and revolutionize the field of
bone tissue engineering.
39
1. Yang.P, Repair of bone defects using a new biomimetic construction fabricated by adipose-derived stem cells, collagen I, and porous beta-tricalcium phosphate scaffolds. Experimental Biology and Medicine, 2013. 238(12): p. 1331-1343.
2. Mumford. J. and A. Simpson, Management of bone defects: a review of available techniques. The Iowa orthopaedic journal, 1992. 12: p. 42.
3. Wall.D.R, Techniques and Principles for the Operating Room. ANZ Journal of Surgery, 2011. 81(9): p. 648-649.
4. Vang. P, Advantages and disadvantages between allograft versus autograft in anterior cruciate ligament replacement. 2006.
5. Trice. M.E., Xenograft risks: What you and your patients need to know. 2009, AAOS Now. 6. Keating.J. and M. McQueen, Substitutes for autologous bone graft in orthopaedic trauma.
JOURNAL OF BONE AND JOINT SURGERY-BRITISH VOLUME-, 2001. 83(1): p. 3-8. 7. Bostrom.M.P. and D.A. Seigerman, The clinical use of allografts, demineralized bone matrices,
synthetic bone graft substitutes and osteoinductive growth factors: a survey study. HSS Journal, 2005. 1(1): p. 9-18.
8. Albrektsson. T. and C. Johansson, Osteoinduction, osteoconduction and osseointegration. European Spine Journal, 2001. 10(2): p. S96-S101.
9. Chan.B. and K. Leong, Scaffolding in tissue engineering: general approaches and tissue-specific considerations. European Spine Journal, 2008. 17(4): p. 467-479.
10. Bauer.S, Engineering biocompatible implant surfaces: part I: materials and surfaces. Progress in Materials Science, 2013. 58(3): p. 261-326.
11. Marois.Y. and R. Guidoin, Biocompatibility of polyurethanes. Biomedical Applications of Polyurethanes, 2001: p. 77.
12. Anderson.J.M, A. Rodriguez, and D.T. Chang. Foreign body reaction to biomaterials. in Seminars in immunology. 2008: Elsevier.
13. Thevenot.P, W. Hu, and L. Tang, Surface chemistry influence implant biocompatibility. Current topics in medicinal chemistry, 2008. 8(4): p. 270.
14. Sokolov. A, The role of the complement system in determining the biocompatibility of candidate materials for medical implantable devices. 2012.
15. Hutmacher.D, J. Goh, and S. Teoh, An introduction to biodegradable materials for tissue engineering applications. Annals of the Academy of Medicine, Singapore, 2001. 30(2): p. 183-191.
16. O.Dea.R, The interplay between tissue growth and scaffold degradation in engineered tissue constructs. Journal of mathematical biology, 2013. 67(5): p. 1199-1225.
17. Park.H, J.S. Temenoff, and A.G. Mikos, Biodegradable orthopedic implants, in Engineering of Functional Skeletal Tissues. 2007, Springer. p. 55-68.
18. Amini. A.R, J.S. Wallace, and S.P. Nukavarapu, Short-term and long-term effects of orthopedic biodegradable implants. Journal of long-term effects of medical implants, 2011. 21(2).
19. Simon. J.P. and G. Fabry, An overview of implant materials. Acta Orthop Belg, 1991. 57(1): p. 1-5.
40
20. Poitout. D.G., Biomechanics and biomaterials in orthopedics. 2004: Springer. 21. Kavanagh.B.F, D.M. Ilstrup, and R. Fitzgerald, Revision total hip arthroplasty. The Journal of
Bone & Joint Surgery, 1985. 67(4): p. 517-526. 22. Lucas.G.L, F.W. Cooke, and E. Friis, A primer of biomechanics. 1999: Springer. 23. Lowet.G, Bone research in biomechanics. Vol. 40. 1997: IOS Press. 24. Zheng.W, Preparation and characterisation of tri-calcium phosphate scaffolds with tunnel-like
macro-pores for bone tissue engineering. 2011. 25. Ratner.B.D, Biomedical Engineering e-Mega Reference. 2009: Academic Press. 26. Boccaccini.A.R. and J. Gough, Tissue engineering using ceramics and polymers. 2007: Elsevier. 27. Heimke.G, Osseo-integrated implants. Vol. 2. 1990: CRC Press. 28. Eliaz.N, Degradation of Implant Materials. 2012: Springer. 29. Lopez-Esteban.S, Bioactive glass coatings for orthopedic metallic implants. Journal of the
European Ceramic Society, 2003. 23(15): p. 2921-2930. 30. Nouri.A, P.D. Hodgson, and C.e. Wen, Biomimetic porous titanium scaffolds for orthopedic
and dental applications. 2010. 31. Chu.P.K. and X. Liu, Biomaterials fabrication and processing handbook. 2008: CRC Press. 32. Karageorgiou, V. and D. Kaplan, Porosity of 3D biomaterial scaffolds and osteogenesis.
Biomaterials, 2005. 26(27): p. 5474-5491. 33. M.P.X. and J. Elisseeff, Scaffolding in tissue engineering. 2005: CRC press. 34. Kovacevic.V. and M. Hess, Advanced Polymeric Materials. Chemistry International, 2012.
34(5): p. 35. 35. Anseth.K. Nanotechnology in Tissue Engineering. in The 2005 Annual Meeting. 2005. 36. Yu. H. and N.A.A. Rahim, Imaging in Cellular and Tissue Engineering. 2013: CRC Press. 37. von Woedtke, T. and A. Kramer, The limits of sterility assurance. GMS Krankenhaushygiene
interdisziplinar, 2008. 3(3). 38. Davis. J.R, Handbook of materials for medical devices. 2003: ASM international. 39. Sulaiman.S.B, Tricalcium phosphate/hydroxyapatite (TCP-HA) bone scaffold as potential
candidate for the formation of tissue engineered bone. The Indian journal of medical research, 2013. 137(6): p. 1093.
40. Horowitz.R.A, Z. Mazor, and C. Foitzik, ß-Tricalcium Phosphate as Bone Substitute Material: Properties and Clinical Applications.
41. Mi.H.Y, X. Jing, and L.-S. Turng, Fabrication of porous synthetic polymer scaffolds for tissue engineering. Journal of Cellular Plastics, 2014: p. 0021955X14531002.
42. Park.J. and R.S. Lakes, Biomaterials: an introduction. 2007: Springer. 43. Hutmacher, D.W., Scaffolds in tissue engineering bone and cartilage. Biomaterials, 2000.
21(24): p. 2529-2543. 44. Sultana. N. and M. Wang, Fabrication of HA/PHBV composite scaffolds through the emulsion
freezing/freeze-drying process and characterisation of the scaffolds. Journal of Materials Science: Materials in Medicine, 2008. 19(7): p. 2555-2561.
45. Stoppato.M, Influence of scaffold pore size on collagen I development: A new in vitro evaluation perspective. Journal of Bioactive and Compatible Polymers, 2013. 28(1): p. 16-32.
46. Kretlow, J.D. and A.G. Mikos, Review: mineralization of synthetic polymer scaffolds for bone tissue engineering. Tissue engineering, 2007. 13(5): p. 927-938.
47. Mastrogiacomo. M, Role of scaffold internal structure on in vivo bone formation in macroporous calcium phosphate bioceramics. Biomaterials, 2006. 27(17): p. 3230-3237.
41
48. Gauthier.O, Macroporous biphasic calcium phosphate ceramics: influence of macropore diameter and macroporosity percentage on bone ingrowth. Biomaterials, 1998. 19(1-3): p. 133-139.
49. Woodard.J.R, The mechanical properties and osteoconductivity of hydroxyapatite bone scaffolds with multi-scale porosity. Biomaterials, 2007. 28(1): p. 45-54.
50. Malmström.J, Bone response to free form fabricated hydroxyapatite and zirconia scaffolds: a
histological study in the human maxilla. Clinical oral implants research, 2009. 20(4): p. 379-385.
51. Dehghani.F. and N. Annabi, Engineering porous scaffolds using gas-based techniques. Current opinion in biotechnology, 2011. 22(5): p. 661-666.
52. Tan.Q, Fabrication of porous scaffolds with a controllable microstructure and mechanical properties by porogen fusion technique. International journal of molecular sciences, 2011. 12(2): p. 890-904.
53. Ikeda.R, The effect of porosity and mechanical property of a synthetic polymer scaffold on repair of osteochondral defects. International orthopaedics, 2009. 33(3): p. 821-828.
54. Xue.W, A. Bandyopadhyay, and S. Bose, Polycaprolactone coated porous tricalcium phosphate scaffolds for controlled release of protein for tissue engineering. Journal of Biomedical Materials Research Part B: Applied Biomaterials, 2009. 91(2): p. 831-838.
55. Ramay. H.R. and M. Zhang, Biphasic calcium phosphate nanocomposite porous scaffolds for load-bearing bone tissue engineering. Biomaterials, 2004. 25(21): p. 5171-5180.
56. De Freitas, D.G, R.M. Osthues, and S.N. da Silva, Study of the Cytotoxicity of a Composite of Carboxymethylcellulose (CMC) and a BioCeramic (Biphasic Calcium Phosphate-BCP) Injection for Use in Articular Cartilage Repair. Key Engineering Materials, 2012. 493: p. 703-708.
57. Gloria. A, R. De Santis, and L. Ambrosio, Polymer-based composite scaffolds for tissue engineering. Journal of Applied Biomaterials & Biomechanics, 2010. 8(2).
58. Rezwan. K, Biodegradable and bioactive porous polymer/inorganic composite scaffolds for bone tissue engineering. Biomaterials, 2006. 27(18): p. 3413-3431.
59. Jiang. L, Preparation and properties of nano-hydroxyapatite/chitosan/carboxymethyl cellulose composite scaffold. Carbohydrate polymers, 2008. 74(3): p. 680-684.
60. Farooque. K, Effect of Carboxymethyl Cellulose on the Properties of Ordinary Portland Cement. Bangladesh Journal of Scientific and Industrial Research, 2010. 45(1): p. 1-8.
61. Garai.S. and A. Sinha, Biomimetic nanocomposites of carboxymethyl cellulose–hydroxyapatite: Novel three dimensional load bearing bone grafts. Colloids and Surfaces B: Biointerfaces, 2014. 115: p. 182-190.
62. Ng. R, Three-dimensional fibrous scaffolds with microstructures and nanotextures for tissue engineering. RSC Advances, 2012. 2(27): p. 10110-10124.
63. Sant. S. and A. Khademhosseini. Fabrication and characterization of tough elastomeric fibrous scaffolds for tissue engineering applications. in Engineering in Medicine and Biology Society (EMBC), 2010 Annual International Conference of the IEEE. 2010: IEEE.
64. Cheng. Q, Engineering the Microstructure of Electrospun Fibrous Scaffolds by Microtopography. Biomacromolecules, 2013. 14(5): p. 1349-1360.
65. Sung.H.J, The effect of scaffold degradation rate on three-dimensional cell growth and angiogenesis. Biomaterials, 2004. 25(26): p. 5735-5742.
66. Maquet.V, Porous poly (< i> α</i>-hydroxyacid)/Bioglass< sup>®</sup> composite scaffolds for bone tissue engineering. I: preparation and in vitro characterisation. Biomaterials, 2004. 25(18): p. 4185-4194.
42
67. Kokubo. T. and H. Takadama, How useful is SBF in predicting in vivo bone bioactivity? Biomaterials, 2006. 27(15): p. 2907-2915.
68. Chang. H.I. and Y. Wang, Cell responses to surface and architecture of tissue engineering scaffolds. Regenerative Medicine and Tissue Engineering—Cells and Biomaterials, InTech: Rijeka.Croatia, 2011: p. 569-588.
69. Hing. K, Microporosity enhances bioactivity of synthetic bone graft substitutes. Journal of Materials Science: Materials in Medicine, 2005. 16(5): p. 467-475.
70. Luo.Y, Well-ordered biphasic calcium phosphate–alginate scaffolds fabricated by multi-channel 3D plotting under mild conditions. Journal of Materials Chemistry B, 2013. 1(33): p. 4088-4098.
71. Lee.G.S, Direct deposited porous scaffolds of calcium phosphate cement with alginate for drug delivery and bone tissue engineering. Acta biomaterialia, 2011. 7(8): p. 3178-3186.
72. Aly.A.F, Scaffold Development and Characterization Using CAD System. American Journal of Biomedical Sciences, 2011. 3(4).
73. Mancini.M, M. Moresi, and R. Rancini, Mechanical properties of alginate gels: empirical characterisation. Journal of food engineering, 1999. 39(4): p. 369-378.
74. Li.J, The effect of scaffold architecture on properties of direct 3D fiber deposition of porous Ti6Al4V for orthopedic implants. Journal of Biomedical Materials Research Part A, 2010. 92(1): p. 33-42.
Related Documents