Fabrication and calibration of Oxazine-based optic fiber sensor for detection of ammonia in water Ahmed Hasnain Jalal, 1,2 Jinsong Yu, 1, * and A. G. Agwu Nnanna 1,3 1 Purdue Water Institute, Purdue University Calumet, Hammond, Indiana 46323, USA 2 Department of Electrical & Computer Engineering, Purdue University Calumet, Hammond, Indiana 46323, USA 3 Department of Mechanical Engineering, Purdue University Calumet, Hammond, Indiana 46323, USA *Corresponding author: [email protected] Received 2 September 2011; accepted 9 February 2012; posted 15 February 2012 (Doc. ID 153946); published 6 June 2012 This paper presented the fabrication and calibration of a clad-modified evanescent based plastic optical fiber (POF) sensor for the detection of ammonia in both stagnant and dynamic aqueous media. This optochemical sensor was based on Oxazine 170 perchlorate (sensing material) and polydimethylsiloxane (PDMS) (protective material) thin layers. A special chemical solution was developed for the etching removal of cladding and a methodology for trapping moisture was exercised. Experimental results on dissolved ammonia detection exhibited short response time (≤10 s), low detection limit (minimum detection limit 1.4 ppm), high sensitivity, and excellent reversibility (over 99%). © 2012 Optical Society of America OCIS codes: 040.0040, 060.0060, 220.0220, 310.0310, 280.0280. 1. Introduction Ammonia at elevated concentrations is poisonous to different organisms. For example, 22.8 ppm can be lethal to water organisms and exposure to ammonia as low as 35 ppm for over 15 min can be dangerous to human beings [ 1– 3]. Therefore, a continuous online ammonia monitoring system is highly desired, espe- cially for dynamic aqueous water delivery systems. While various technologies have been studied for the detection of ammonia, sensors such as electroche- mical gas sensors [ 4– 5], catalytic sensors [ 6– 7], che- miresistor sensors [ 8], the chemically modified field effect transistor (CHEMFET) sensors [ 9], and optical fiber sensors [ 10– 14] have attracted substantial at- tention for the monitoring of ammonia in gaseous phase as they provide easy and fast means of contin- uous detection. Among these sensors, clad-modified optical fiber sensors are of particular interest to the authors of this paper because the optical fiber sensors are compact, light in weight, easily multi- plexible, immune to electromagnetic interference (EMI), require no electric power at the sensing point, and relatively inexpensive [ 15, 16]. It has been al- most three decades since the first experiments on the use of optical fibers, especially glass optical fiber (GOF), or optical waveguides as sensing elements were conducted [ 17]. The optical fiber chemical sen- sor is based on the ability of micro or nanostructure materials to alter their optical responses (such as reflection or absorption) in the presence of a “recog- nition element” [ 3, 15– 18]. The majority of the optical fiber ammonia sensor research efforts have been focused on the employ- ment of GOF. To the best knowledge of the authors of this paper, very little work on the development of plastic optical fiber (POF) sensors for ammonia de- tection had been reported and the GOF sensors had primarily focused on the detection of ammonia in the gaseous phase (such as in air), only few had been deployed in aqueous media [ 3, 19]. However, in the authors’ opinion, POF is much more flexible and mechanically much stronger than the GOF, and 1559-128X/12/173768-08$15.00/0 © 2012 Optical Society of America 3768 APPLIED OPTICS / Vol. 51, No. 17 / 10 June 2012

Welcome message from author
This document is posted to help you gain knowledge. Please leave a comment to let me know what you think about it! Share it to your friends and learn new things together.
Transcript
Fabrication and calibration of Oxazine-based opticfiber sensor for detection of ammonia in water
Ahmed Hasnain Jalal,1,2 Jinsong Yu,1,* and A. G. Agwu Nnanna1,3
1Purdue Water Institute, Purdue University Calumet, Hammond, Indiana 46323, USA2Department of Electrical & Computer Engineering, Purdue University Calumet, Hammond, Indiana 46323, USA
3Department of Mechanical Engineering, Purdue University Calumet, Hammond, Indiana 46323, USA
*Corresponding author: [email protected]
Received 2 September 2011; accepted 9 February 2012;posted 15 February 2012 (Doc. ID 153946); published 6 June 2012
This paper presented the fabrication and calibration of a clad-modified evanescent based plastic opticalfiber (POF) sensor for the detection of ammonia in both stagnant and dynamic aqueous media. Thisoptochemical sensor was based on Oxazine 170 perchlorate (sensing material) and polydimethylsiloxane(PDMS) (protective material) thin layers. A special chemical solution was developed for the etchingremoval of cladding and a methodology for trapping moisture was exercised. Experimental resultson dissolved ammonia detection exhibited short response time (≤10 s), low detection limit (minimumdetection limit 1.4 ppm), high sensitivity, and excellent reversibility (over 99%). © 2012 Optical Societyof AmericaOCIS codes: 040.0040, 060.0060, 220.0220, 310.0310, 280.0280.
1. Introduction
Ammonia at elevated concentrations is poisonous todifferent organisms. For example, 22.8 ppm can belethal to water organisms and exposure to ammoniaas low as 35 ppm for over 15 min can be dangerous tohuman beings [1–3]. Therefore, a continuous onlineammonia monitoring system is highly desired, espe-cially for dynamic aqueous water delivery systems.
While various technologies have been studied forthe detection of ammonia, sensors such as electroche-mical gas sensors [4–5], catalytic sensors [6–7], che-miresistor sensors [8], the chemically modified fieldeffect transistor (CHEMFET) sensors [9], and opticalfiber sensors [10–14] have attracted substantial at-tention for the monitoring of ammonia in gaseousphase as they provide easy and fast means of contin-uous detection. Among these sensors, clad-modifiedoptical fiber sensors are of particular interest tothe authors of this paper because the optical fiber
sensors are compact, light in weight, easily multi-plexible, immune to electromagnetic interference(EMI), require no electric power at the sensing point,and relatively inexpensive [15,16]. It has been al-most three decades since the first experiments onthe use of optical fibers, especially glass optical fiber(GOF), or optical waveguides as sensing elementswere conducted [17]. The optical fiber chemical sen-sor is based on the ability of micro or nanostructurematerials to alter their optical responses (such asreflection or absorption) in the presence of a “recog-nition element” [3,15–18].
The majority of the optical fiber ammonia sensorresearch efforts have been focused on the employ-ment of GOF. To the best knowledge of the authorsof this paper, very little work on the developmentof plastic optical fiber (POF) sensors for ammonia de-tection had been reported and the GOF sensors hadprimarily focused on the detection of ammonia in thegaseous phase (such as in air), only few had beendeployed in aqueous media [3,19]. However, in theauthors’ opinion, POF is much more flexible andmechanically much stronger than the GOF, and
1559-128X/12/173768-08$15.00/0© 2012 Optical Society of America
3768 APPLIED OPTICS / Vol. 51, No. 17 / 10 June 2012
POF is amore suitable choice when applications suchas monitoring ammonia in the artificial water deliv-ery systems (which requires the usage of very longoptical fibers) are concerned. In addition, regardlessof the media, air or water, a cost-effective sensormust be able to exhibit high level of reversibility(the ability of a sensor to return to its initial condi-tions with little or no hysteresis upon the removalof the analyte). GOF sensors that have been devel-oped employing various sensing materials suchas polyaniline/polymethyl methacrylate (PMMA),Bromocresol Purple based silica solgel, polyanilinebased silica core, silica-solgel based Oxazine 170perchlorate/cellulose acetate, and BromothymolBlue∕TiO2 or tin oxide films for the detection ofammonia in air [10–14]. Not only was it observedthat these GOF sensors are difficult to fabricate[12,18,20], but also it should be noted that a commondrawback of these GOF sensors was that they oftenexhibit hysteresis (poor reversibility) [15]. On theother hand, optical sensors based on glass capillarytube coated by Oxazine 170 perchlorate had been re-ported to have shown good reversibility [17]. Anotheradvantage of Oxazine 170 perchlorate is that it usesonly 455–595 nm bandwidths, which would allowfor multiplexing. However, while various coatingmethods such as dip coating, spin coating, and spraycoating have been developed for silica based GOFsensors [3,14,15,17,21], to the best knowledge of theauthors of this paper, no open literature is availablereporting the successful deposition of Oxazine 170perchlorate on the core of POF.
Therefore, a clad-modified Oxazine 170 perchlo-rate based POF evanescent ammonia sensor wasdeveloped. In this paper, the fabrication processes(including cladding removal, Oxazine 170 perchlo-rate and polydimethylsiloxane (PDMS) deposition,and moisture trapping) for the development ofOxazine 170 perchlorate based clad-modified evanes-cent POF sensor and its calibration in terms ofammonia detection in both stagnant and dynamicaqueous media were reported. Specifically, a specialchemical solution composited of tetrahydrofuran(THF), methyl isobutyl ketone (MIBK), and deio-nized (DI) water at the ratio of 2∶1∶1 was developedfor the removal of cladding; a dip coating and ther-mal treatment method was developed for the deposi-tion of Oxazine 170 perchlorate; and a moisturetrapping methodology was employed to ensure thefunctionality of the Oxazine 170 perchlorate.
2. Experimental
A. Fabrication of Sensor
Plastic optical fiber (Fiber Instrument Sales, Inc.)consisted of PMMA (core) and fluorinated polymer(cladding) at the thicknesses of 960 μm (core) and40 μm (cladding) was used in this study. PMMAcore allows for easy optical transmission and fluori-nated polymer provides excellent optical insulation.
B. Cladding Removal
In open literature, hydrofluoric acid (HF), NaOH,acetone, etc. have commonly been used for declad-ding for GOF [15,18,19]. Also, found in open litera-ture acetone, gas flame, or laser have been usedfor decladding for POF [22–24]. Based on the consid-erations, such as HF is highly corrosive, and acetoneor gas flame often causes brittleness of the core andunevenness of the deposited sensing material film, aspecial chemical solution consisted of THF (FlukaAnalytical), MIBK (Sigma-Aldrich), and DI waterat the ratio of 2∶1∶1 had been developed for the re-moval of the cladding instead. Approximately 3–5 cmof the POF (total length of 55–65 cm) was decladded.Traditional wet etching for cladding removal is ofteninvolved with dipping the fiber in the chemical solu-tions for an extended period of time (about 40 minwith the chemical solution that was used in thisstudy). It was quite possible that the core might beetched partially. Therefore, a different approach wasapplied in this study where the fiber was dipped inthe chemical solution for 1 min and then the claddingto be removed was gently rubbed off with lint freelens tissues. The decladded fiber was then cleanedwith isopropyl alcohol and DI water several times toobtain a clean core.
Tominimize the optical transmission losses causedby the unevenness of the surface, a polishing kit(Thorlab) and a 70% isopropyl alcohol diluted withDI water were used to polish the etched and tipsurface of the fiber. The flatness of the tips of thefiber is of importance, because light needs to passthrough both ends of the fiber with minimal scatter-ing loss.
C. Oxazine 170 Perchlorate Deposition
In order to deposit the Oxazine 170 perchlorate onthe decladded core, a 0.0005 mole Oxazine 170 per-chlorate (C21H22ClN3O5) dye solution was preparedfor the layer by layer dip coating in combination withthermal treatment processing. To avoid the contam-ination of undissolved Oxazine 170 perchloratemicrometer or nanoparticles on fiber surface, super-natant of the dye solution was collected. The de-cladded part of the fiber was dipped into thesupernatant solution with its temperature raisedto 170°–180 °F , and the solution was kept at thiselevated temperature until the solution reduced itsvolume to half of the original value. Then the heatingwas stopped and the sensor was air cooled for 1 minand then dipped back into the same Oxazine solution(kept at room temperature instead) for 12 h. Throughsuch processes, a thin layer of Oxazine 170 perchlo-rate with the thickness of 20–25 μm was depositedon the core. In addition, the thermal treatment alsoinduced a permanent U-shape bending which wouldincrease the sensitivity [13].
D. Moisture Trapping and PDMS Layer Formation
Since Oxazine 170 perchlorate is water soluble,in order to prevent the formed Oxazine layer from
10 June 2012 / Vol. 51, No. 17 / APPLIED OPTICS 3769
dissolving into the aqueous testing media, a thinlayer of PDMS was deposited outside the Oxazine170 perchlorate layer. PDMS layer is a gas perme-able membrane which only allows gas to permeatethrough. A PDMS 184 silicone elastomer base withsilicone elastomer curing agent from Dow Corningwas used to prepare the PDMS polymer coating onthe Oxazine 170 perchlorate sensing layer.
On the other hand, the functionalities of Oxazine170 perchlorate as a sensing material for ammoniadetection rely on the chemical reactions as depictedby Eqs. (1)–(3):
NH3�vapor� �H2O↔NH�4 OH−; (1)
NH�4 OH− �H�Dye−↔NH�
4 Dye− �H2O; (2)
NH�4 Dye−↔H�Dye− �NH3�vapor�: (3)
The mechanisms shown in Eqs. (1)–(3) suggestedthat the presence of moisture is a necessity [17].Therefore, an additional moisture trapping processwas performed before the PDMS layer was formed.After the formation of Oxazine 170 perchloratesensing layer, the optical fiber was kept at room tem-perature for 2 h. Then the fiber was dipped into DIwater for 1 min and then air dried for 1 min. Duringthe air drying process, visible fine drops of waterwere removed with lint free lens tissues. Afterwards,the fiber was immediately dipped into 10∶1 PDMSand curing agent solution; and then hanged verti-cally at room temperature so that the extra PDMSwas removed by gravity. The curing of the PDMSlayer took about 2–3 days and the final PDMS layerhad a thickness of around 130–145 μm.
E. Sensor Calibration and Performance Evaluation
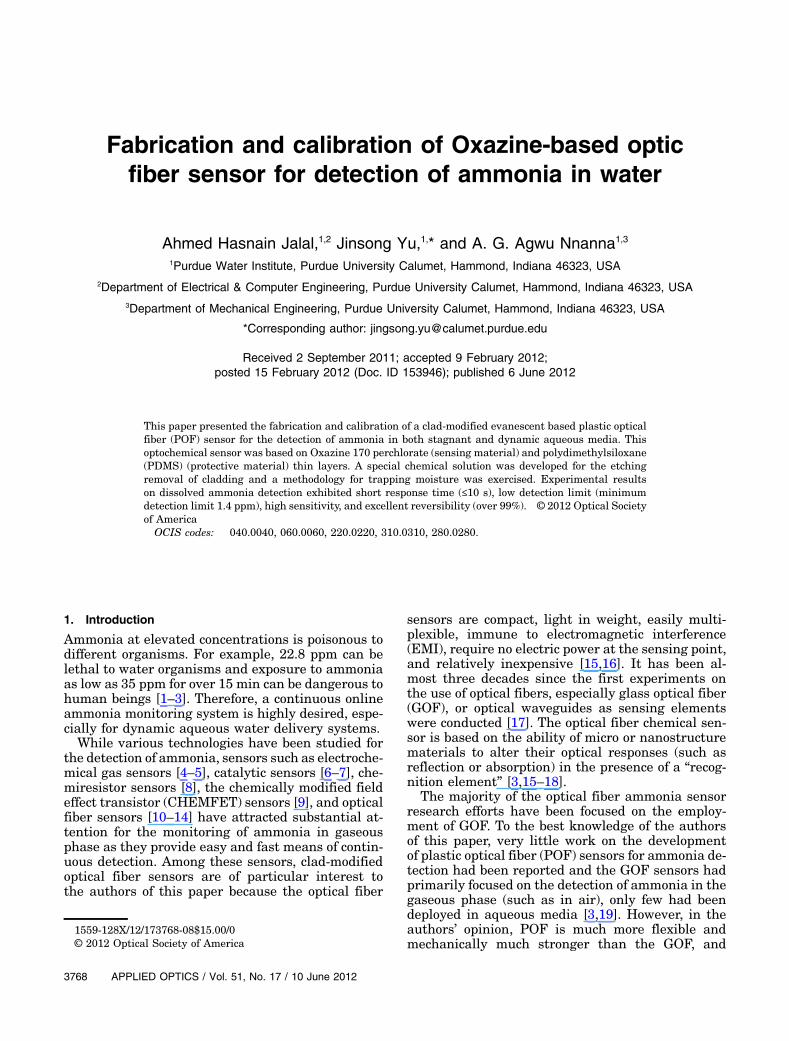
In order, to evaluate and characterize the perfor-mance of the fabricated sensor, experimental setupswere established for stagnant (a) and dynamic media(b) testing, as depicted in Fig. 1. They consisted oflight source, spectrometer, sensor, water distributionsystems, and contaminated water samples. The testchamber for the stagnant systemwas properly sealedwith no head-space hence volatilization of ammoniagas into head-space was negligible. Also, the testchamber was placed on a magnetic stirrer setup tofacilitate proper mixing and homogeneity of ammo-nia in the solution. The dynamic system consistedof a U-shaped piping network with an inlet portfor introduction of ammonia into the system, flowmeter for monitoring the volumetric flow rate, andthe sensor located perpendicular to the direction offluid flow, as shown in Fig. 1(b). The water distribu-tion system was fabricated from PVC material,which is representative of the type of piping materi-als used for residential and commercial building.
An LS-450 blue LED pulsed light source fromOcean Optics was used to produce either pulsedor continuous light output at 470 nm and 550 nmfor fluorescence measurements. The spectra weremeasured using a high-resolution spectrometer(HR4000CG-UV-NIR). The sensor was connected tothe light source and spectrometer using subminiatureversion A (SMA) connectors. The fiber and SMAconnectors were held in place using epoxy therebyminimizing intensity fluctuation and measurementerrors associated with unsteadiness of the fiber.The spectrometerwas connected to a personal compu-ter for automatic recording of the changes in opticalintensity. The optical intensity and absorbance, as afunction of wavelength in the presence and absenceof contaminants, were analyzed with Spectra Suitesoftware. The ammonia detection performances of
Fig. 1. (Color online) Schematic of experimental setup. (a) Stagnant and (b) dynamic water system.
3770 APPLIED OPTICS / Vol. 51, No. 17 / 10 June 2012
the sensor including dynamic range, sensitivity, re-versibility, response time, and flow rate for dynamicwater system were evaluated.
A 28% ammonium hydroxide solution (Sigma-Aldrich) and DI water (≥18 MΩ in resistance) wereused to prepare ammonia contaminated aqueoustesting media for the performance evaluation of thefabricated sensor. Ammonia was added to the systemat a location approximately 22 1∕2 cm away from thesensor hence sufficient mixing of ammonia with DIwater was allowed.
3. Results and Discussion
Three phenomena are taking place in the ammoniasensing: mass diffusion of ammonia vapor from aqu-eous solution through the PDMS layer, the chemicalreaction between ammonia vapor, entrapped water,and Oxazine 170 perchlorate, and finally intensitymodulation due to evanescent field. The mass trans-port of ammonia is driven by pressure differencebetween the solution and PDMS layer as well as thedifference in concentration. The sensor fabricated inthis study was tested in both stagnant and dynamicaqueous media.
A. Sensor Performances in Stagnant Water
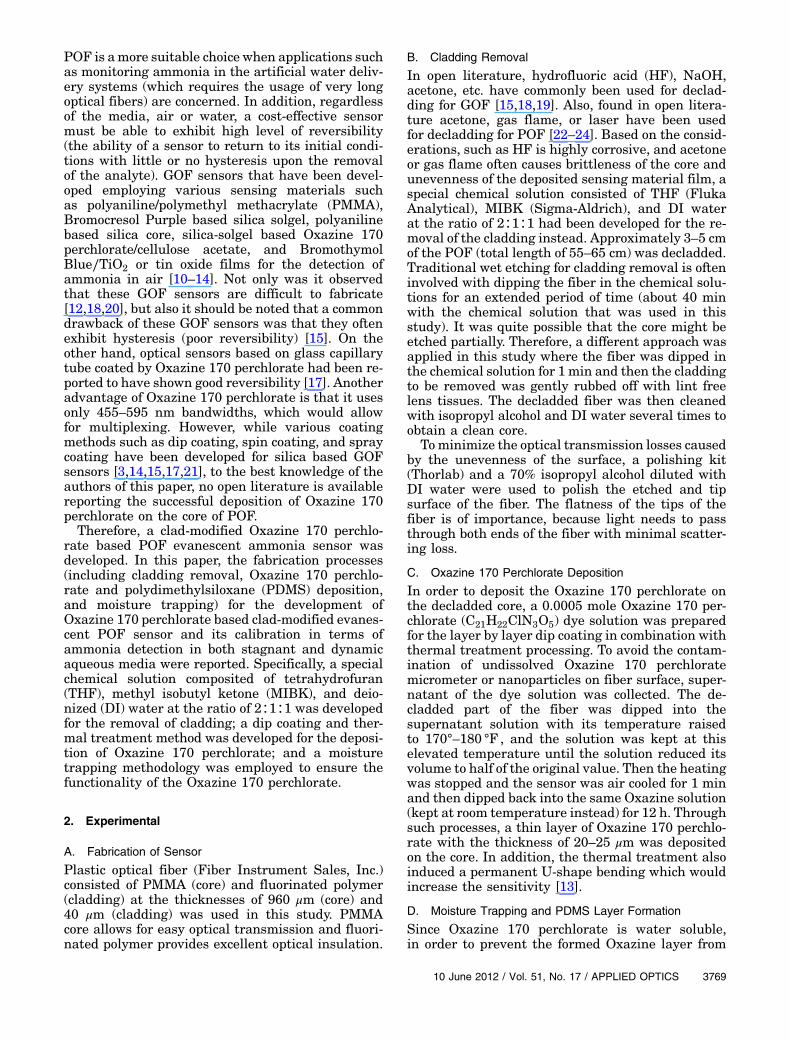
Figure 2 presents the typical diagram for intensityas a function of wavelength for various ammoniaconcentrations. The reference intensity is referredto as 0 ppm. FromFig. 2, it can be observed that thereis a distinct peak of intensity at the wavelength of476.74 nm (blue region). The intensity decreasedwith the increase in ammonia concentration, indicat-ing that the absorbance of the sensor increasedwith the increase in ammonia concentration asthe absorbance is related to intensity according toequation 4:
A � −log10
�II0
�; (4)
where I is the intensity of light at a specified wave-length λ that has passed through a sample (trans-mitted light intensity) and I0 is the intensity ofthe light before it enters the sample or incident lightintensity.
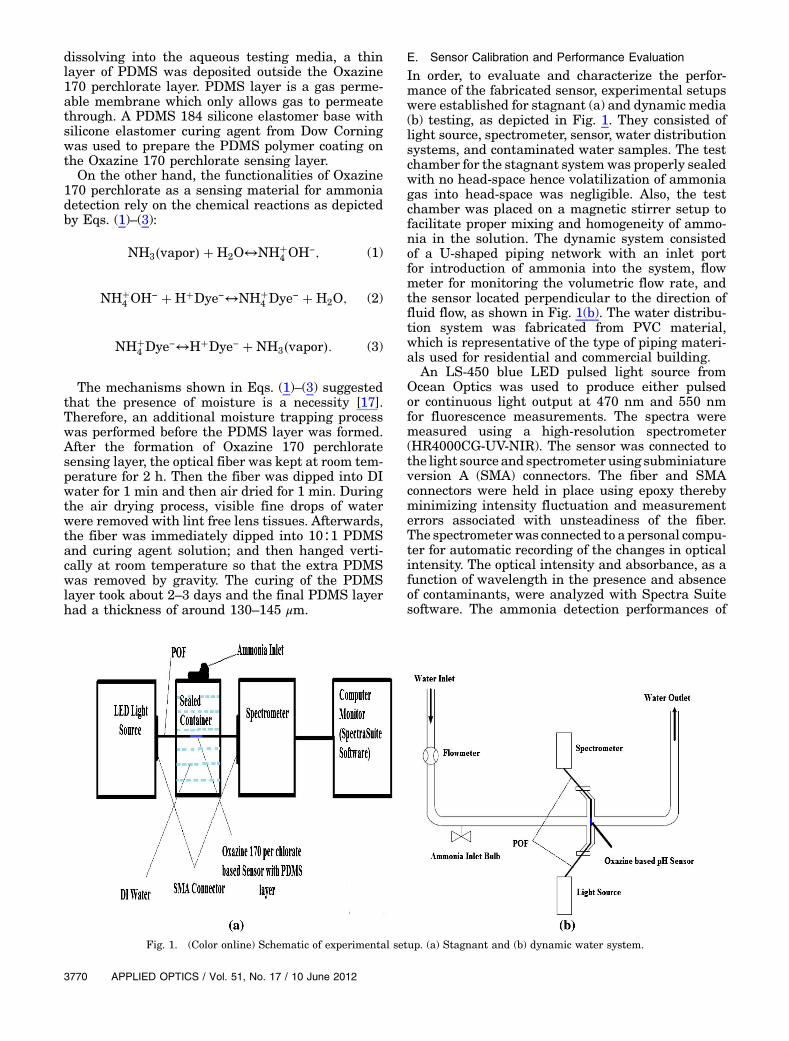
Figure 3 depicted the calculated absorbance ofthe sensor at various ammonia concentrationsbased on Eq. (4). NH3 concentrations ranged from0 to 112 ppm. Figure 3 revealed three absorbanceregimes: 0 ≤ C ≤ 14 ppm, 14 ≤ C ≤ 28 ppm, and 28 ≤
C ≤ 112 ppm. Two near linear absorbance responseregimes can be observed in Fig. 3 (0 ≤ C ≤ 14 ppmand 28 ≤ C ≤ 112 ppm), which is consistent withthe Beer–Lambert law A � εlC, where ε is the molarabsorptivity of the absorber, l is the path length, andC is the concentration of the reacting products of ab-sorbing material and contaminants. However, in themiddle range for ammonia concentration, 14 ≤ C ≤
28 ppm the change in absorbance with the increasein concentration is almost negligible. This could beattributed to negligible pressure and concentrationdifference across the PDMS layer in the concentra-tion range of 14 ≤ C ≤ 28 ppm.
From Fig. 3 it should also be noted that during theearly stage of the sensing process, a change in con-centration of 12.6 ppm (from 1.4 to 14 ppm) resultedin a change in absorbance of 4%; however as theconcentration increases, a change in concentration of42 ppm (from 28 to 70 ppm) resulted in only approxi-mately 3% change in absorbance. Further increase inconcentration by 42 ppm (70 to 112 ppm) only resultsin an even smaller change in absorbance, 2%. Thisphenomenon suggested that the sensor developedin this study would bemost sensitive at low ammoniaconcentrations.
Figure 4 illustrates absorbance as a function of timefor various concentrations at 476.74 nm wavelength.During this part of the testing the sensor was firstplaced in DI water. Then known volumes of concen-trated ammonia hydroxide solution were added intothe DI water sequentially with each addition beingspaced from another to allow for equilibration.
Fig. 2. (Color online) Intensity as a function of wavelength atdifferent ammonia concentrations.
Concentration,
Ab
sorb
ance
Fig. 3. (Color online) Absorbance at different ammoniaconcentrations.
10 June 2012 / Vol. 51, No. 17 / APPLIED OPTICS 3771
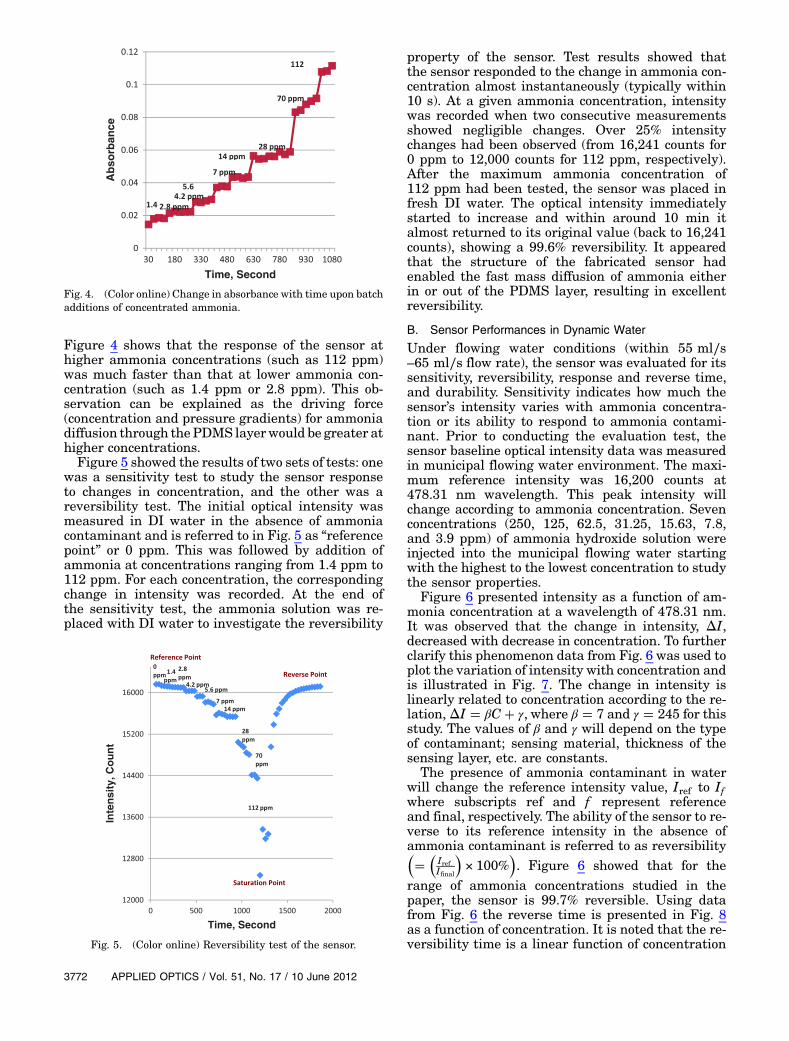
Figure 4 shows that the response of the sensor athigher ammonia concentrations (such as 112 ppm)was much faster than that at lower ammonia con-centration (such as 1.4 ppm or 2.8 ppm). This ob-servation can be explained as the driving force(concentration and pressure gradients) for ammoniadiffusion through thePDMS layerwould be greater athigher concentrations.
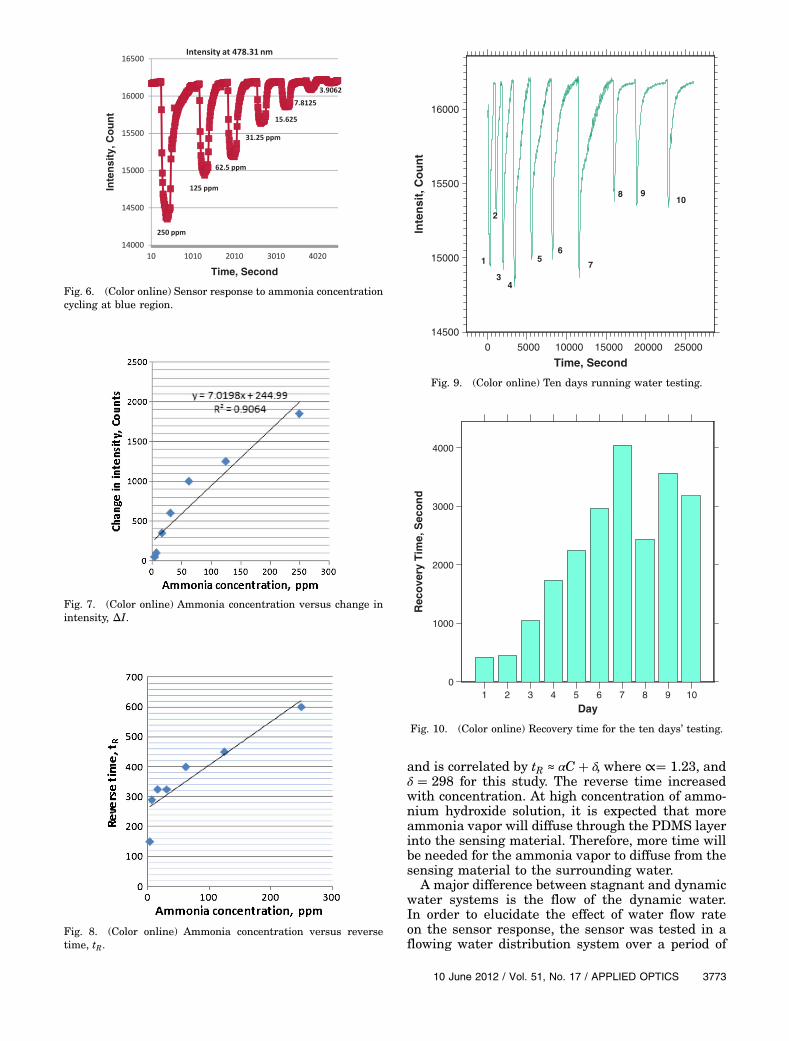
Figure 5 showed the results of two sets of tests: onewas a sensitivity test to study the sensor responseto changes in concentration, and the other was areversibility test. The initial optical intensity wasmeasured in DI water in the absence of ammoniacontaminant and is referred to in Fig. 5 as “referencepoint” or 0 ppm. This was followed by addition ofammonia at concentrations ranging from 1.4 ppm to112 ppm. For each concentration, the correspondingchange in intensity was recorded. At the end ofthe sensitivity test, the ammonia solution was re-placed with DI water to investigate the reversibility
property of the sensor. Test results showed thatthe sensor responded to the change in ammonia con-centration almost instantaneously (typically within10 s). At a given ammonia concentration, intensitywas recorded when two consecutive measurementsshowed negligible changes. Over 25% intensitychanges had been observed (from 16,241 counts for0 ppm to 12,000 counts for 112 ppm, respectively).After the maximum ammonia concentration of112 ppm had been tested, the sensor was placed infresh DI water. The optical intensity immediatelystarted to increase and within around 10 min italmost returned to its original value (back to 16,241counts), showing a 99.6% reversibility. It appearedthat the structure of the fabricated sensor hadenabled the fast mass diffusion of ammonia eitherin or out of the PDMS layer, resulting in excellentreversibility.
B. Sensor Performances in Dynamic Water
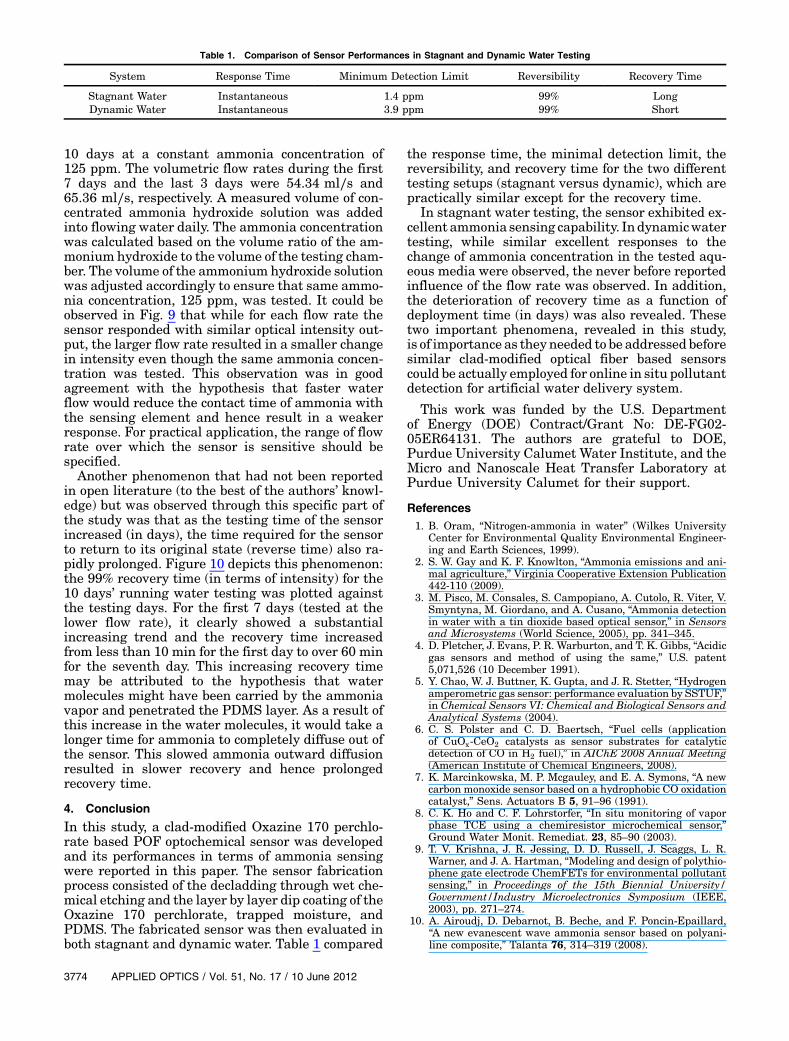
Under flowing water conditions (within 55 ml∕s–65 ml∕s flow rate), the sensor was evaluated for itssensitivity, reversibility, response and reverse time,and durability. Sensitivity indicates how much thesensor’s intensity varies with ammonia concentra-tion or its ability to respond to ammonia contami-nant. Prior to conducting the evaluation test, thesensor baseline optical intensity data was measuredin municipal flowing water environment. The maxi-mum reference intensity was 16,200 counts at478.31 nm wavelength. This peak intensity willchange according to ammonia concentration. Sevenconcentrations (250, 125, 62.5, 31.25, 15.63, 7.8,and 3.9 ppm) of ammonia hydroxide solution wereinjected into the municipal flowing water startingwith the highest to the lowest concentration to studythe sensor properties.
Figure 6 presented intensity as a function of am-monia concentration at a wavelength of 478.31 nm.It was observed that the change in intensity, ΔI,decreased with decrease in concentration. To furtherclarify this phenomenon data from Fig. 6 was used toplot the variation of intensity with concentration andis illustrated in Fig. 7. The change in intensity islinearly related to concentration according to the re-lation,ΔI � βC� γ, where β � 7 and γ � 245 for thisstudy. The values of β and γ will depend on the typeof contaminant; sensing material, thickness of thesensing layer, etc. are constants.
The presence of ammonia contaminant in waterwill change the reference intensity value, Iref to Ifwhere subscripts ref and f represent referenceand final, respectively. The ability of the sensor to re-verse to its reference intensity in the absence ofammonia contaminant is referred to as reversibility��
�Iref :Ifinal
�× 100%
�. Figure 6 showed that for the
range of ammonia concentrations studied in thepaper, the sensor is 99.7% reversible. Using datafrom Fig. 6 the reverse time is presented in Fig. 8as a function of concentration. It is noted that the re-versibility time is a linear function of concentration
Ab
sorb
ance
Time, Second
Fig. 4. (Color online) Change in absorbance with time upon batchadditions of concentrated ammonia.
Inte
nsi
ty, C
ou
nt
Time, Second
Fig. 5. (Color online) Reversibility test of the sensor.
3772 APPLIED OPTICS / Vol. 51, No. 17 / 10 June 2012
and is correlated by tR ≈ αC� δ, where ∝� 1.23, andδ � 298 for this study. The reverse time increasedwith concentration. At high concentration of ammo-nium hydroxide solution, it is expected that moreammonia vapor will diffuse through the PDMS layerinto the sensing material. Therefore, more time willbe needed for the ammonia vapor to diffuse from thesensing material to the surrounding water.
A major difference between stagnant and dynamicwater systems is the flow of the dynamic water.In order to elucidate the effect of water flow rateon the sensor response, the sensor was tested in aflowing water distribution system over a period of
Time, Second
Inte
nsi
ty, C
ou
nt
Fig. 6. (Color online) Sensor response to ammonia concentrationcycling at blue region.
Fig. 7. (Color online) Ammonia concentration versus change inintensity, ΔI.
Fig. 8. (Color online) Ammonia concentration versus reversetime, tR.
0 5000 10000 15000 20000 25000
Time, Second
14500
15000
15500
16000
Inte
nsi
t, C
ou
nt
2
34
56
7
8 910
1
Fig. 9. (Color online) Ten days running water testing.
1 2 3 4 5 6 7 8 9 10
Day
0
1000
2000
3000
4000
Rec
ove
ry T
ime,
Sec
on
d
Fig. 10. (Color online) Recovery time for the ten days’ testing.
10 June 2012 / Vol. 51, No. 17 / APPLIED OPTICS 3773
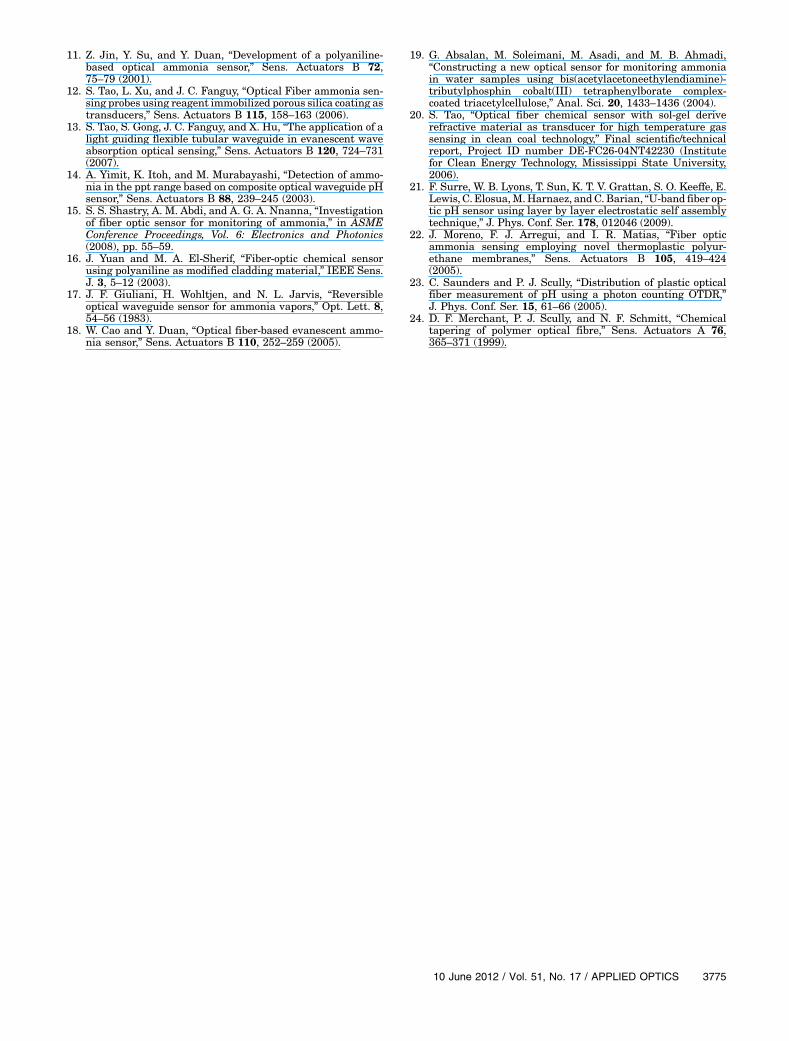
10 days at a constant ammonia concentration of125 ppm. The volumetric flow rates during the first7 days and the last 3 days were 54.34 ml∕s and65.36 ml∕s, respectively. A measured volume of con-centrated ammonia hydroxide solution was addedinto flowing water daily. The ammonia concentrationwas calculated based on the volume ratio of the am-monium hydroxide to the volume of the testing cham-ber. The volume of the ammonium hydroxide solutionwas adjusted accordingly to ensure that same ammo-nia concentration, 125 ppm, was tested. It could beobserved in Fig. 9 that while for each flow rate thesensor responded with similar optical intensity out-put, the larger flow rate resulted in a smaller changein intensity even though the same ammonia concen-tration was tested. This observation was in goodagreement with the hypothesis that faster waterflow would reduce the contact time of ammonia withthe sensing element and hence result in a weakerresponse. For practical application, the range of flowrate over which the sensor is sensitive should bespecified.
Another phenomenon that had not been reportedin open literature (to the best of the authors’ knowl-edge) but was observed through this specific part ofthe study was that as the testing time of the sensorincreased (in days), the time required for the sensorto return to its original state (reverse time) also ra-pidly prolonged. Figure 10 depicts this phenomenon:the 99% recovery time (in terms of intensity) for the10 days’ running water testing was plotted againstthe testing days. For the first 7 days (tested at thelower flow rate), it clearly showed a substantialincreasing trend and the recovery time increasedfrom less than 10 min for the first day to over 60 minfor the seventh day. This increasing recovery timemay be attributed to the hypothesis that watermolecules might have been carried by the ammoniavapor and penetrated the PDMS layer. As a result ofthis increase in the water molecules, it would take alonger time for ammonia to completely diffuse out ofthe sensor. This slowed ammonia outward diffusionresulted in slower recovery and hence prolongedrecovery time.
4. Conclusion
In this study, a clad-modified Oxazine 170 perchlo-rate based POF optochemical sensor was developedand its performances in terms of ammonia sensingwere reported in this paper. The sensor fabricationprocess consisted of the decladding through wet che-mical etching and the layer by layer dip coating of theOxazine 170 perchlorate, trapped moisture, andPDMS. The fabricated sensor was then evaluated inboth stagnant and dynamic water. Table 1 compared
the response time, the minimal detection limit, thereversibility, and recovery time for the two differenttesting setups (stagnant versus dynamic), which arepractically similar except for the recovery time.
In stagnant water testing, the sensor exhibited ex-cellent ammonia sensing capability. Indynamicwatertesting, while similar excellent responses to thechange of ammonia concentration in the tested aqu-eous media were observed, the never before reportedinfluence of the flow rate was observed. In addition,the deterioration of recovery time as a function ofdeployment time (in days) was also revealed. Thesetwo important phenomena, revealed in this study,is of importance as they needed to be addressed beforesimilar clad-modified optical fiber based sensorscould be actually employed for online in situ pollutantdetection for artificial water delivery system.
This work was funded by the U.S. Departmentof Energy (DOE) Contract/Grant No: DE-FG02-05ER64131. The authors are grateful to DOE,Purdue University Calumet Water Institute, and theMicro and Nanoscale Heat Transfer Laboratory atPurdue University Calumet for their support.
References1. B. Oram, “Nitrogen-ammonia in water” (Wilkes University
Center for Environmental Quality Environmental Engineer-ing and Earth Sciences, 1999).
2. S. W. Gay and K. F. Knowlton, “Ammonia emissions and ani-mal agriculture,” Virginia Cooperative Extension Publication442-110 (2009).
3. M. Pisco, M. Consales, S. Campopiano, A. Cutolo, R. Viter, V.Smyntyna, M. Giordano, and A. Cusano, “Ammonia detectionin water with a tin dioxide based optical sensor,” in Sensorsand Microsystems (World Science, 2005), pp. 341–345.
4. D. Pletcher, J. Evans, P. R. Warburton, and T. K. Gibbs, “Acidicgas sensors and method of using the same,” U.S. patent5,071,526 (10 December 1991).
5. Y. Chao, W. J. Buttner, K. Gupta, and J. R. Stetter, “Hydrogenamperometric gas sensor: performance evaluation by SSTUF,”in Chemical Sensors VI: Chemical and Biological Sensors andAnalytical Systems (2004).
6. C. S. Polster and C. D. Baertsch, “Fuel cells (applicationof CuOx-CeO2 catalysts as sensor substrates for catalyticdetection of CO in H2 fuel),” in AIChE 2008 Annual Meeting(American Institute of Chemical Engineers, 2008).
7. K. Marcinkowska, M. P. Mcgauley, and E. A. Symons, “A newcarbon monoxide sensor based on a hydrophobic CO oxidationcatalyst,” Sens. Actuators B 5, 91–96 (1991).
8. C. K. Ho and C. F. Lohrstorfer, “In situ monitoring of vaporphase TCE using a chemiresistor microchemical sensor,”Ground Water Monit. Remediat. 23, 85–90 (2003).
9. T. V. Krishna, J. R. Jessing, D. D. Russell, J. Scaggs, L. R.Warner, and J. A. Hartman, “Modeling and design of polythio-phene gate electrode ChemFETs for environmental pollutantsensing,” in Proceedings of the 15th Biennial University/Government/Industry Microelectronics Symposium (IEEE,2003), pp. 271–274.
10. A. Airoudj, D. Debarnot, B. Beche, and F. Poncin-Epaillard,“A new evanescent wave ammonia sensor based on polyani-line composite,” Talanta 76, 314–319 (2008).
Table 1. Comparison of Sensor Performances in Stagnant and Dynamic Water Testing
System Response Time Minimum Detection Limit Reversibility Recovery Time
Stagnant Water Instantaneous 1.4 ppm 99% LongDynamic Water Instantaneous 3.9 ppm 99% Short
3774 APPLIED OPTICS / Vol. 51, No. 17 / 10 June 2012
11. Z. Jin, Y. Su, and Y. Duan, “Development of a polyaniline-based optical ammonia sensor,” Sens. Actuators B 72,75–79 (2001).
12. S. Tao, L. Xu, and J. C. Fanguy, “Optical Fiber ammonia sen-sing probes using reagent immobilized porous silica coating astransducers,” Sens. Actuators B 115, 158–163 (2006).
13. S. Tao, S. Gong, J. C. Fanguy, and X. Hu, “The application of alight guiding flexible tubular waveguide in evanescent waveabsorption optical sensing,” Sens. Actuators B 120, 724–731(2007).
14. A. Yimit, K. Itoh, and M. Murabayashi, “Detection of ammo-nia in the ppt range based on composite optical waveguide pHsensor,” Sens. Actuators B 88, 239–245 (2003).
15. S. S. Shastry, A. M. Abdi, and A. G. A. Nnanna, “Investigationof fiber optic sensor for monitoring of ammonia,” in ASMEConference Proceedings, Vol. 6: Electronics and Photonics(2008), pp. 55–59.
16. J. Yuan and M. A. El-Sherif, “Fiber-optic chemical sensorusing polyaniline as modified cladding material,” IEEE Sens.J. 3, 5–12 (2003).
17. J. F. Giuliani, H. Wohltjen, and N. L. Jarvis, “Reversibleoptical waveguide sensor for ammonia vapors,” Opt. Lett. 8,54–56 (1983).
18. W. Cao and Y. Duan, “Optical fiber-based evanescent ammo-nia sensor,” Sens. Actuators B 110, 252–259 (2005).
19. G. Absalan, M. Soleimani, M. Asadi, and M. B. Ahmadi,“Constructing a new optical sensor for monitoring ammoniain water samples using bis(acetylacetoneethylendiamine)-tributylphosphin cobalt(III) tetraphenylborate complex-coated triacetylcellulose,” Anal. Sci. 20, 1433–1436 (2004).
20. S. Tao, “Optical fiber chemical sensor with sol-gel deriverefractive material as transducer for high temperature gassensing in clean coal technology,” Final scientific/technicalreport, Project ID number DE-FC26-04NT42230 (Institutefor Clean Energy Technology, Mississippi State University,2006).
21. F. Surre, W. B. Lyons, T. Sun, K. T. V. Grattan, S. O. Keeffe, E.Lewis, C. Elosua,M.Harnaez, andC. Barian, “U-band fiber op-tic pH sensor using layer by layer electrostatic self assemblytechnique,” J. Phys. Conf. Ser. 178, 012046 (2009).
22. J. Moreno, F. J. Arregui, and I. R. Matias, “Fiber opticammonia sensing employing novel thermoplastic polyur-ethane membranes,” Sens. Actuators B 105, 419–424(2005).
23. C. Saunders and P. J. Scully, “Distribution of plastic opticalfiber measurement of pH using a photon counting OTDR,”J. Phys. Conf. Ser. 15, 61–66 (2005).
24. D. F. Merchant, P. J. Scully, and N. F. Schmitt, “Chemicaltapering of polymer optical fibre,” Sens. Actuators A 76,365–371 (1999).
10 June 2012 / Vol. 51, No. 17 / APPLIED OPTICS 3775
Related Documents


![Comparative photodegradation study between spiro[indoline-oxazine] and spiro[indoline-pyran] derivatives in solution](https://static.cupdf.com/doc/110x72/577c80301a28abe054a79d42/comparative-photodegradation-study-between-spiroindoline-oxazine-and-spiroindoline-pyran.jpg)