ISSN: 2180 – 1843 e-ISSN: 2289-8131 Vol. 10 No. 1-13 121 Fabric Texture Analysis and Weave Pattern Recognition by Intelligent Processing S. Anila, K. Sheela Sobana Rani and B. Saranya Sri Ramakrishna Institute of Technology [email protected] Abstract— Coimbatore is a major city in the Indian state of Tamil Nadu located on the banks of the Noyyal River surrounded by the Western Ghats. It is one of the biggest centers of textile manufacturing in India. A fast-growing metropolitan area city, it is home to over 25,000 textile and manufacturing companies and has spawned many new centers of textiles around it. Textile fabric automation and manufacturing has been of great concern over the past decade. This is a remarkable task because of the accidental changes of fabric material properties. Due to the increasing demand of consumers for high-quality textile products, an automatic and objective evaluation of the fabric texture appearance is necessary with respect to geometric structure characteristics, surface, and mechanical properties. The precise measurement of the fabric texture parameters, such as weave structure and yarn counts find wide applications in the textile industry, virtual environments, e-commerce, and robotic telemanipulation. The weave pattern and the yarn count are analyzed and determined for computer simulated sample images and also for the scanned real fabric images. 2-D integral projections are used to identify the accurate structure of the woven fabric and to determine the yarn count. They are used for segmenting the crossed areas of yarns and also to detect the defects like crossed area due to the random distribution of yarns. Fuzzy C-Means Clustering (FCM) is applied to multiscale texture features based on the Grey Level Co-Occurrence Matrix (GLCM) to classify the different crossed-area states. Linear Discriminant Analysis (LDA) is used to improve the classifier performance. Index Terms—FCM; GLCM; LDA; Weft and Warp. I. INTRODUCTION The interlacing of the warp ends, and the weft picks referred to as weave. A weave repeat can be shown in the square or grid paper design. A weave replication is the least number of threads required to show all of the interlockings in the pattern. It is usually considered adequate to show one repeat only. Two sets of mutually perpendicular and interlaced yarns, warp and weft, results in the formation of wave repeat. Figure 1: The weft and the warp The long vertical yarns that are warped around the looms are the warps. The horizontal yarns that are woven through the warp yarns are the wefts and are shown in Figure 1. Texture analysis finds application in many areas like textile, industrial, agricultural, remote sensing, and biomedical surface inspection. Also, it finds application in the classification and segmentation of satellite images, segmentation of textured regions in document analysis, identification of defects in textile fabrics, disease identification in human organs, etc. The major problems in the real world textures are not uniform due to changes in orientation, size and other visual appearance. The texture is the replication of image patterns. It may be perceived as regular or irregular, coarse or fine, smooth or rough, directional or non-directional, etc. Generally, the fabric texture is made of the repetition arrangement of warp and weft. Textile fabric materials are used to prepare different categories and types of Fabric products in the textile industry. The various classification of textile fabric is Natural fabric and synthetic fabric. II. LITERATURE SURVEY FFT techniques were used in image processing to identify weave pattern, fabric count, yarn skewness and other structural characteristics of woven fabrics [1]. Fabrics with several weave patterns and yarn counts were tested using the FFT techniques. Many textile products appear to have periodic structures, which make themselves particularly suitable for the utility of the FT techniques. A system was developed to detect both weave patterns and yarn color designs [2]. The total quantity of yarn colors and their arrangements in the fabric are determined from reflected images. An HSV color model combines similar yarn colors. So, the system permits the weave pattern, either colored or solid, and the color design of fabric to be correctly recognized. When locating the crossed area of yarns faults may occur. A fully automatic method was proposed based on Fourier image-analysis techniques to solve crossed-points-detection problems [3]. A method was proposed using a convolution model and an additive model, in both the spatial and frequency domains and was combined to extract information about the fabric structure by image analysis. It was applicable to fabrics with square and non-square conventional weave repeat [4]. A technique was introduced using neural network and image processing technology for classifying woven fabric patterns [5]. Autocorrelation function was used to determine one weave repeat of the fabric. Challenge is in the selection of the set of training data used for the learning algorithm. brought to you by CORE View metadata, citation and similar papers at core.ac.uk provided by Universiti Teknikal Malaysia Melaka: UTeM Open Journal System

Welcome message from author
This document is posted to help you gain knowledge. Please leave a comment to let me know what you think about it! Share it to your friends and learn new things together.
Transcript

ISSN: 2180 – 1843 e-ISSN: 2289-8131 Vol. 10 No. 1-13 121
Fabric Texture Analysis and Weave Pattern
Recognition by Intelligent Processing
S. Anila, K. Sheela Sobana Rani and B. Saranya Sri Ramakrishna Institute of Technology
Abstract— Coimbatore is a major city in the Indian state of
Tamil Nadu located on the banks of the Noyyal River
surrounded by the Western Ghats. It is one of the biggest centers
of textile manufacturing in India. A fast-growing metropolitan
area city, it is home to over 25,000 textile and manufacturing
companies and has spawned many new centers of textiles around
it. Textile fabric automation and manufacturing has been of
great concern over the past decade. This is a remarkable task
because of the accidental changes of fabric material properties.
Due to the increasing demand of consumers for high-quality
textile products, an automatic and objective evaluation of the
fabric texture appearance is necessary with respect to geometric
structure characteristics, surface, and mechanical properties.
The precise measurement of the fabric texture parameters, such
as weave structure and yarn counts find wide applications in the
textile industry, virtual environments, e-commerce, and robotic
telemanipulation. The weave pattern and the yarn count are
analyzed and determined for computer simulated sample
images and also for the scanned real fabric images. 2-D integral
projections are used to identify the accurate structure of the
woven fabric and to determine the yarn count. They are used for
segmenting the crossed areas of yarns and also to detect the
defects like crossed area due to the random distribution of yarns.
Fuzzy C-Means Clustering (FCM) is applied to multiscale
texture features based on the Grey Level Co-Occurrence Matrix
(GLCM) to classify the different crossed-area states. Linear
Discriminant Analysis (LDA) is used to improve the classifier
performance.
Index Terms—FCM; GLCM; LDA; Weft and Warp.
I. INTRODUCTION
The interlacing of the warp ends, and the weft picks referred
to as weave. A weave repeat can be shown in the square or
grid paper design. A weave replication is the least number of
threads required to show all of the interlockings in the pattern.
It is usually considered adequate to show one repeat only.
Two sets of mutually perpendicular and interlaced yarns,
warp and weft, results in the formation of wave repeat.
Figure 1: The weft and the warp
The long vertical yarns that are warped around the looms
are the warps. The horizontal yarns that are woven through
the warp yarns are the wefts and are shown in Figure 1.
Texture analysis finds application in many areas like
textile, industrial, agricultural, remote sensing, and
biomedical surface inspection. Also, it finds application in the
classification and segmentation of satellite images,
segmentation of textured regions in document analysis,
identification of defects in textile fabrics, disease
identification in human organs, etc. The major problems in
the real world textures are not uniform due to changes in
orientation, size and other visual appearance. The texture is
the replication of image patterns. It may be perceived as
regular or irregular, coarse or fine, smooth or rough,
directional or non-directional, etc. Generally, the fabric
texture is made of the repetition arrangement of warp and
weft. Textile fabric materials are used to prepare different
categories and types of Fabric products in the textile industry.
The various classification of textile fabric is Natural fabric
and synthetic fabric.
II. LITERATURE SURVEY
FFT techniques were used in image processing to identify
weave pattern, fabric count, yarn skewness and other
structural characteristics of woven fabrics [1]. Fabrics with
several weave patterns and yarn counts were tested using the
FFT techniques. Many textile products appear to have
periodic structures, which make themselves particularly
suitable for the utility of the FT techniques.
A system was developed to detect both weave patterns and
yarn color designs [2]. The total quantity of yarn colors and
their arrangements in the fabric are determined from reflected
images. An HSV color model combines similar yarn colors.
So, the system permits the weave pattern, either colored or
solid, and the color design of fabric to be correctly
recognized. When locating the crossed area of yarns faults
may occur.
A fully automatic method was proposed based on Fourier
image-analysis techniques to solve crossed-points-detection
problems [3].
A method was proposed using a convolution model and an
additive model, in both the spatial and frequency domains and
was combined to extract information about the fabric
structure by image analysis. It was applicable to fabrics with
square and non-square conventional weave repeat [4].
A technique was introduced using neural network and
image processing technology for classifying woven fabric
patterns [5]. Autocorrelation function was used to determine
one weave repeat of the fabric. Challenge is in the selection
of the set of training data used for the learning algorithm.
brought to you by COREView metadata, citation and similar papers at core.ac.uk
provided by Universiti Teknikal Malaysia Melaka: UTeM Open Journal System

Journal of Telecommunication, Electronic and Computer Engineering
122 ISSN: 2180 – 1843 e-ISSN: 2289-8131 Vol. 10 No. 1-13
A robust recognition algorithm was proposed for fabric
weave pattern recognition [6]. Unsupervised decision rules
for recognizing warp and weft floats are developed using a
fuzzy c-means clustering method. Three basic weave patterns
were clearly identified. However, the presence of weft and
warp detection is not certain.
Investigations were made to solve the crossed-states
detection problem by analyzing the texture information in the
extracted crossed-points [7]. It was applied to the plain woven
fabric with and without skewness, and the crossed-states were
detected. This non-destructive method was useful in
analyzing fabric weave types.
A technique was proposed to recognize the fabric nature
and type of the main weaving texture [8]. The co-occurrence
matrix was applied to calculate the texture characteristics, and
the Learning Vector Quantization Networks (LVQN) was
used as a classifier to categorize the fabric nature and the type
of weaving texture. The classifier performance depends on
the lighting condition and also on the image scale.
An automatic method was used for woven textile structure
recognition in fiber-level [9]. Weft yarn and warp yarn
crossed-area segmentation were performed through a spatial
domain integral projection approach.
Classifier-based texture analysis was proposed for woven
fabric images for the recognition [10]. In the pattern
recognition phase, three methods were tested and compared:
Gabor wavelet, local binary pattern operators and Gray-Level
Co-Occurrence Matrices (GLCM). Classification is done
using Support Vector Machine. The fusion of the Gabor
wavelet and GLCM were done to improve the accuracy, but
GLCM has better running time.
A technique was proposed for weave pattern recognition
method for computer-simulated woven samples and real
woven fabric images [11]. To evaluate the accuracy of
FDFFT, standard roughness parameters from the 3-D fabric
surface were determined. FDFFT was concluded as a fast
parameter for fabric roughness measurement based on 3-D
surface data.
A review was provided about the identification of woven
fabrics developed in nearly 3 decades starting from the mid-
1980s until now [12]. The objective evaluation technology
based on image processing and artificial intelligence holds
the advantages of quick response, digital solution and
accuracy compared with the manual method based on human
eyes and experiences. Both the merits and demerits of
frequency domain analysis-based and spatial domain
analysis-based methods have been discussed.
Mahajan Archana B., et al. proposed a technique for textile
defect identification and classification based on computer
vision. Wavelet frames are used for feature extraction with
the design of neural network classifier. Then sub-image based
PCA method is applied for data classification. The defects are
classified using neural networks [13].
Azim, G.A. proposed a method based on texture analysis
and neural networks to distinguish the textile defects. Feature
extraction is done designed based on Gray Level Co-
occurrence Matrix (GLCM). A neural network is used as a
classifier to recognize the textile defects [14].
Dandan ZHU et al. proposed a new detection algorithm for
yarn-dyed fabric defect based on autocorrelation function and
GLCM. The autocorrelation function is used to determine the
pattern period of yarn-dyed fabric. GLCMs are computed
with the specified parameters to portray the original image.
Euclidean distances of GLCMs between being detected
images and the template image, which is selected from the
defect-free fabric, are computed, and then the threshold value
is given to realize the defect detection. Accurate detection of
common defects of yarn-dyed fabric, such as the wrong weft,
weft cracks, stretched warp, oil stain and holes could be
known [15].
Xuejuan Kang, et al. proposed an automatic approach to
classify the three woven fabrics: plain, twill and satin weave.
2-D wavelet transform is used to obtain low-frequency sub-
image in order to reduce the analysis of fabric images. GLCM
and Gabor wavelets are used to extract the texture features of
pre-processing fabric images. Probabilistic Neural Network
(PNN) is used to classify the three basic woven fabrics. The
experimental results show that the novel method can
automatically, efficiently classify woven fabrics and obtain
exact classification results (93.33%) [16].
III. PROPOSED WORK
The major geometric characteristics of woven fabrics are
weave pattern and yarn count. Weave pattern is the weave
that is periodically repeated throughout the entire fabric area.
Yarn count is the number of yarns per centimeter. The block
diagram of the proposed method is shown in Figure 2.
Different appearance of fabrics is due to the weave pattern
effects on twisting and trimming stiffness of the fabric. Fabric
quality is measured using yarn count which is a measure of
the quality of the woven fabric.
Figure 2: Block Diagram of Automatic Woven Structure Recognition
The proposed method is evaluated using two categories of
images. The first one belongs to the woven material images
simulated from the computer and the second one to the real
images extracted from different fabric images [17].
Computer simulated sample images are shown in Figure 3.
It could be observed by inspection that these images have
different weave types, fiber appearances, and yarn counts.
Simulated woven samples are generated by applying
programmable image processing filters.
Fabric Image
Image Pre-
Processing (Filtering,
Equalizing)
Autocorrelation Classification
(FCM)
Crossed area
detection
Feature
Extraction (LDA)
Weave
Pattern, Yarn Count
Crossed Area State
Recognition

Fabric Texture Analysis and Weave Pattern Recognition by Intelligent Processing
ISSN: 2180 – 1843 e-ISSN: 2289-8131 Vol. 10 No. 1-13 123
Figure 3: Computer-simulated images
The real fabric images scanned using HP scanner with a
resolution of 2400 dpi is shown in Figure 4. For real fabric
scan, it is necessary that the warp and the weft yarns are
arranged properly along the x- and y-directions to achieve the
best performance for the crossed-area detection. A frequency-
domain Butterworth low-pass filter is used for reducing the
noise.
Figure 4: Scanned real fabrics images
To detect the interlacing area where weft yarn and warp
yarn are crossed over each other, a spatial-domain integral
projection approach is applied. Interstices between yarns
display darkness. Thus, the pixels surrounding them have
relative lower grey levels. The local minima of the horizontal
and vertical integral projections can be located from the
positions of interstices among yarns. If I(x, y) is an M × N
gray scale image and the horizontal and vertical projection of
the entire image is defined, respectively, as H(y) and V (x)
given in Equations (1) and (2):
N
x
yxIyH1
),()( (1)
M
x
yxIxV1
),()( (2)
The warp separation lines and weft separation lines are
found by finding the local minima of horizontal and vertical
integral projections. The intersection of the warp separation
lines with weft separation lines are recognized as the crossed
areas.
The crossed areas of the weft and warp yarns are detected
by subdividing into small image cells, which convey the
crossed area detection. The state of a crossed area is analyzed
using the texture features of the fabric. GLCM based feature
extraction is used in the process. GLCM of an image shows
the statistic characteristics of gray level. The eight GLCM
texture features that are calculated are:
1) Contrast (CON)
2) Dissimilarity (DIS)
3) Homogeneity (HOM or inverse difference moment)
4) Angular second moment (ASM) or Energy
5) Entropy (ENT)
6) GLCM mean
7) Variance (VAR) and
8) Correlation (COR)
To reduce the recognition errors caused if any, eight
texture features with multiple distance d = 1, 2, 4, 6, 8, 10
pixels and four (0, 45, 90, and 135) angular directions are
calculated. For each detected crossed area, there are 8 ×6 ×4
= 192 texture features. A feature vector of the detected
crossed area is formed by the 192 values. For M × N image
segment I(x, y), gray levels, i and j, the non-normalized
GLCM Pijs are defined in Equation (3):
})(()^),({(),( 1
1 1
,0, jdydxIiyxIcdPN
x
M
y
ji
(3)
where: C{.} = 1, if the argument is true
C{.} = 0 otherwise
The and ∓ signs mean that each pixel pair is counted
twice: once forward and the next time backward. A feature
vector has 192 elements. The GLCM features are interrelated
by definition. Additionally, the diversity of the fabric samples
also makes the measured feature vectors become confusing.
The measured feature vector sets appear clouded and
redundant. Hence, the accuracy of the next classification may
be interrupted. Linear Discriminant Analysis of the feature
vector set is performed for dimensionality reduction and to
extract the features. LDA reduces the redundancy in the
feature vector sets and increases the signal. For example, in
MXN image there are m-crossed areas detected and every
detected crossed area is represented by a feature vector with
192 elements.
The feature data set for a material image is a 192 × m matrix
X. By using LDA, a new basis B is found that will reveal an
optimal representation Y of the original data set X. The row
vectors of B will become the linear components of X.B is a
linear transform that rotates and stretches X into Y, i.e., BX
= Y.
FCM is used to classify the two possible different crossed-
area states. To classify a set of texture feature vectors with k
dimensions into two clusters. The average horizontal and
vertical covariabilities of each classified cluster are
computed. A fuzzy-rule-based decision is made for each
cluster. The cluster with higher horizontal covariabilities and
lower vertical covariabilities is determined as Weft Float, and
the other cluster is Warp Float.
The weave pattern is detected as follows: A matrix C,
which represents the detected crossed-area states, is formed
with 0s and 1s. The fabric sample is assumed to have M warp
Journal of Telecommunication, Electronic and Computer Engineering
124 ISSN: 2180 – 1843 e-ISSN: 2289-8131 Vol. 10 No. 1-13
yarns and N weft yarns. There are M × N crossed areas
detected in the fabric sample, the size of C is M × N. Automatic measurement of Yarn Count is performed using
FFT. Fast Fourier transform (FFT) is applied to the entire
original fabric image, taking advantage of the horizontal and
vertical projections, i.e., H(y) and V (x). Consider H(y) and
V (x) as the weft profile and the warp profile, respectively.
Yarn counts are determined from the 2-D FFT of the profiles.
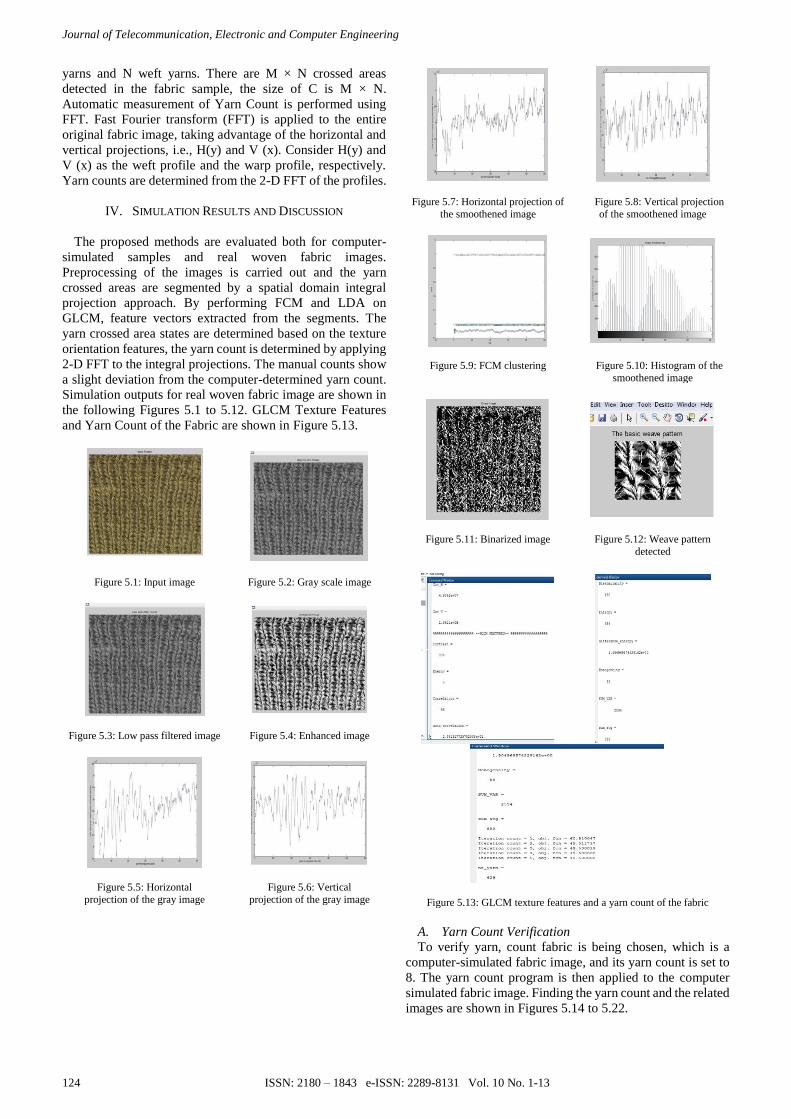
IV. SIMULATION RESULTS AND DISCUSSION
The proposed methods are evaluated both for computer-
simulated samples and real woven fabric images.
Preprocessing of the images is carried out and the yarn
crossed areas are segmented by a spatial domain integral
projection approach. By performing FCM and LDA on
GLCM, feature vectors extracted from the segments. The
yarn crossed area states are determined based on the texture
orientation features, the yarn count is determined by applying
2-D FFT to the integral projections. The manual counts show
a slight deviation from the computer-determined yarn count.
Simulation outputs for real woven fabric image are shown in
the following Figures 5.1 to 5.12. GLCM Texture Features
and Yarn Count of the Fabric are shown in Figure 5.13.
Figure 5.1: Input image Figure 5.2: Gray scale image
Figure 5.3: Low pass filtered image Figure 5.4: Enhanced image
Figure 5.5: Horizontal
projection of the gray image
Figure 5.6: Vertical
projection of the gray image
Figure 5.7: Horizontal projection of
the smoothened image
Figure 5.8: Vertical projection
of the smoothened image
Figure 5.9: FCM clustering Figure 5.10: Histogram of the
smoothened image
Figure 5.11: Binarized image Figure 5.12: Weave pattern
detected
Figure 5.13: GLCM texture features and a yarn count of the fabric
A. Yarn Count Verification
To verify yarn, count fabric is being chosen, which is a
computer-simulated fabric image, and its yarn count is set to
8. The yarn count program is then applied to the computer
simulated fabric image. Finding the yarn count and the related
images are shown in Figures 5.14 to 5.22.

Fabric Texture Analysis and Weave Pattern Recognition by Intelligent Processing
ISSN: 2180 – 1843 e-ISSN: 2289-8131 Vol. 10 No. 1-13 125
Figure 5.14: Input image Figure 5.15: Gray scale image
Figure 5.16: Enhanced image Figure 5.17: Horizontal projection
of the gray image
Figure 5.18: Vertical
projection of the gray image
Figure 5.19: Horizontal projection
of the smoothened image
Figure 5.20: Vertical projection of the smoothened
image
Figure 5.21: Binarized image
Figure 5.22: Yarn count of the fabric
V. CONCLUSION
The proposed method is used to detect weave type, yarn
counts and the defect in the weave pattern in fabric samples.
The technique is tested by using both the computer-simulated
woven samples and real woven fabric images. The test
samples with various yarn counts, appearance, and weave
types are chosen for testing. All weave patterns of the fabric
samples tested are successfully recognized, and computed
yarn counts are found to be consistent with the manual counts.
Hence it can be concluded that this recognition method allows
automatic recognition of basic weave pattern and precisely
measure the yarn count.
APPENDIX
Weave Pattern and Yarn Count for Computer Simulated Images and for Scanned Real Fabrics
1. GLCM Texture Features of Computer Simulated Images
S.N
o
Inp
ut
Ima
ge
CO
N
AS
M
CO
R
AU
TO
CO
R
DIS
EN
T
HO
M
Mea
n
VA
R
CO
V_
H
CO
V_
V
Ya
rn
Co
un
t
1.
536 2 49
2.285772
8539576
37e+01
169 399 52 254
0 900
6.22885
2073043
960e+0
8
1.43497
9424930
440e+07
769
2.
100 5 90
2.496145
7636566
34e+01
63 329 73 253
6 900
1.14551
0917127
852e+0
8
1.75431
7284606
984e+08
65
3.
59 6 94
2.523619
5652173
92e+01
42 308 81 253
9 900
1.23494
9257417
919e+0
6
6.57024
2166029
940e+08
16

Journal of Telecommunication, Electronic and Computer Engineering
126 ISSN: 2180 – 1843 e-ISSN: 2289-8131 Vol. 10 No. 1-13
S.N
o
Inp
ut
Ima
ge
CO
N
AS
M
CO
R
AU
TO
CO
R
DIS
EN
T
HO
M
Mea
n
VA
R
CO
V_
H
CO
V_
V
Ya
rn
Co
un
t
4.
128 4 88
2.517845
3177257
52e+01
72 334 72 256
8 904
1.28363
2591587
952e+0
8
1.14039
8385310
824e+08
10
5.
484 2 54
2.314562
7090301
00e+01
154 139 55 254
3 902
1.31823
9250414
580e+0
6
4.96871
1649582
358e+07
492
2. GLCM Texture Features of Scanned Real Fabrics
S.N
o
Inp
ut
Ima
ge
CO
N
AS
M
CO
R
AU
TO
CO
R
DIS
EN
T
HO
M
Mea
n
VA
R
CO
V_
H
CO
V_
V
Ya
rn
Co
un
t
1.
334 3 68
2.381317
7257525
08e+01
130 384 58 2534 899
4.9362
e+07
1111
1.3611
e+08 629
2.
121 4 88
2.484895
2062430
32e+01
70 335 72 2530 899
7.1985
42652
05075
3e+08
5.3780
321462
17028e
+07
83
3.
134 4 87
2.469839
7435897
44e+01
73 339 71 2531 896
1.1621
84561
96259
4e+09
1.5136
127154
57986e
+07
156
4.
52 6 95
2.524846
4325529
54e+01
41 301 81 2530 900
1.5120
70897
46907
1e+09
1.0548
319064
77017e
+08
511
5.
572 2 46
2.263041
8060200
67e+01
179 403 50 2535 899
2.8985
23886
28798
0e+07
1.0276
575874
26795e
+08
109
ACKNOWLEDGMENT
This work is an initiative from the Intelligent Signal
Processing Research Cluster (ISPRC) of our Institution. We
would like to thank the Management and the Principal of our
institution for providing all support to complete the research
work successfully.
REFERENCES
[1] B. G. Xu, “Identifying fabric structures with Fast Fourier Transform
techniques,” Textile Res. J., vol. 66, no. 8, pp. 496–506, Aug. 1996. [2] T. J. Kang, C. H. Kim, and K. W. Oh, “Automatic recognition of fabric
weave patterns by digital image analysis,” Textile Res. J., vol. 69, no.
2, pp. 77–83, Feb. 1999. [3] A. Lachkar, T. Gadi, R. Benslimane, and L. D’Orazio, “Textile woven
fabric recognition using Fourier image analysis techniques: Part I: A
fully automatic approach for crossed-points detection,” J. Textile Inst., vol. 94, no. 3/4, pp. 194–201, 2003.
[4] M. Rallo, J. Escofet, and M. S. Millan, “Weave-repeat identification by structural analysis of fabric images,” Appl. Opt., vol. 42, no. 17, pp.
3361–3372, Jun. 2003.
[5] B. S. Jeon, J. H. Bae, and M. W. Suh, “Automatic recognition of woven fabric patterns by an artificial neural network,” Textile Res. J., vol. 73,
no. 7, pp. 645–650, Jul. 2003.
[6] C. F. J. Kuo, C. Y. Shih, and J. Y. Lee, “Automatic recognition of fabric weave patterns by a fuzzy C-means clustering method,” Textile Res. J.,
vol. 74, no. 2, pp. 107–111, Feb. 2004.
[7] A. Lachkar, R. Benslimane, L. D’Orazio, and E. Martuscelli, “Textile woven fabric recognition using Fourier image analysis techniques: Part
II—Texture analysis for crossed-states detection,” J. Textile Inst., vol.
96, no. 3, pp. 179–183, Jun. 2005. [8] C. F. J. Kuo and C. C. Tsai, “Automatic recognition of fabric nature by
using the approach of texture analysis,” Textile Res. J., vol. 76, no.
5,pp. 375–382, May 2006. [9] X.Wang, N. D. Georganas, and E.M. Petriu, “Fiber-level structure
recognition of woven textile,” in Proc. IEEE Int. Workshop HAVE,
Lecco, Italy, Nov. 2009, pp. 117–122. [10] Yassine Ben Salem, Salem Nasri, “Automatic recognition of woven
fabrics based on texture and using SVM”, Springer-Verlag London,
November 2010, vol. 4, no. 4, pp. 429–434. [11] Xin Wang, Nicolas D. Georganas and Emil M. Petriu, “Fabric Texture
Analysis Using Computer Vision Techniques”, IEEE Transactions on
Instrumentation and Measurement, vol. 60, no. 1, January 2011, pp. 44-56.

Fabric Texture Analysis and Weave Pattern Recognition by Intelligent Processing
ISSN: 2180 – 1843 e-ISSN: 2289-8131 Vol. 10 No. 1-13 127
[12] Jie Zhang, Binjie Xin, Xiangji Wu , “A Review of Fabric
Identification Based on Image Analysis Technology”, Textiles and Light Industrial Science and Technology (TLIST), vol. 2 no. 3, July
2013.
[13] Mahajan Archana B., Ingale Sujit S., Rakesh S. Bhangale and Chetan D. Zope, “An Introduction to Textile Defect Identification and
Classification Using Wavelet Transform and Neural Networks”, Proc
of International Conference on Icmset-2014, 15th - 16th February, 2014.
[14] Azim, G.A.,“Identification of Textile Defects Based on GLCM and
Neural Networks”, Journal of Computer and Communications, vol.03 no.12, 2015, pp. 1-8.
[15] Dandan ZHU, Ruru PAN, Weidong GAO, Jie ZHANG, “Yarn-Dyed
Fabric Defect Detection based on Autocorrelation Function and GLCM”, AUTEX Research Journal, vol. 15, no 3, September 2015, pp.
226-232.
[16] Xuejuan Kang, Mengmeng Xu , Junfeng Jing, “Automatic Classication of Woven Fabric Structure Based on Computer Vision
Techniques “, Journal of Fiber Bioengineering and Informatics, vol. 8,
no.1,2015, pp. 69–79. [17] https://www.livehistoryindia.com/coverstory/2017/06/10/coimbatore-
built-on-cotton
Related Documents