Fabric evolution across a discontinuity between lower and upper crustal domains from field, microscopic, and anisotropy of magnetic susceptibility studies in central eastern Eritrea, NE Africa W. Ghebreab, 1 A. Kontny, 2 and R. O. Greiling 2 Received 5 July 2005; revised 12 January 2007; accepted 9 February 2007; published 23 June 2007. [1] In the Neoproterozoic East African Orogen (EAO) of Eritrea, lower to middle crustal high-grade metamorphic rocks are juxtaposed against low-grade upper crustal rocks along diffuse tectonic contact zones or discontinuities. In the central eastern part of Eritrea, such a tectonic zone is exposed as a low-angle shear zone separating two distinct high- and low-grade domains, the Ghedem and Bizen, respectively. Integrated field, microfabric, and anisotropy of magnetic susceptibility (AMS) studies show that this low-angle shear zone formed during late deformation, D 2 , with top-to-the-E/SE sense of motion. The hanging wall upper crustal volcanosedimentary schists are mainly paramagnetic and the footwall middle crustal mylonitized orthogneisses are mainly ferrimagnetic. Magnetic fabric studies revealed a good agreement between metamorphic/mylonitic and magnetic foliations (K min ) and helped to explain fabric development in the shear zone. The magnetic lineations (K max ) reflect stretching lineations where stretched mineral aggregates dominate fine-grained mylonitic matrices and intersection lineations where microstructural studies revealed two fabric elements. AMS directional plots indicate that the orientations of the magnetic lineation and of the pole to the magnetic foliation vary systematically across the shear zone. While K max axes form two broad maxima oriented approximately N–S and E–W, the K min axes change from subhorizontal, generally westward inclination in the west to moderate to steep inclination in the direction of tectonic movement to the east. Because there is a systematic change in inclination of K min for individual samples, all samples together form a fairly well defined cluster distribution. The distribution of K min in combination with the E–W scattered plot of the K max is in accordance with the E/SE flow of mylonites over exhumed Damas core complex in the late Neoproterozoic. During the Cenozoic, the Red Sea rift-related detachments exploited the late orogenic shear zone, indicating that the discontinuities between ductile middle and brittle upper crustal layers in the region are reactivated low-angle shear zones and possible sites of core complexes. Citation: Ghebreab, W., A. Kontny, and R. O. Greiling (2007), Fabric evolution across a discontinuity between lower and upper crustal domains from field, microscopic, and anisotropy of magnetic susceptibility studies in central eastern Eritrea, NE Africa, Tectonics, 26, TC3015, doi:10.1029/2005TC001881. 1. Introduction [2] Boundaries of lower crustal rocks against upper crustal rocks are widely exposed in the East African Orogen (Figure 1, inset) of Eritrea and neighboring countries (e.g., southern Ethiopia and Sudan). These boundary zones between the upper and lower crustal layers are mentioned in the literature of the region as terrane boundaries, or transition zones, or simply as tectonic contact zones [e.g., Stern, 1994; Ghebreab, 1999; Johnson and Woldehaimanot, 2003]. They are geometrically and tectonically complex, and their formation and evolution are still poorly under- stood. In central eastern Eritrea, one of these boundaries or more specifically the interface between the upper and lower crustal layers is well exposed as a major low-angle mylonite zone [e.g., Ghebreab, 1999; Beyth et al., 2003; Ghebreab et al., 2005] and also as a zone of metamorphic discontinuity across which the low-grade metamorphic rocks in the hanging wall abruptly changed to high-grade rocks in the footwall. This shear zone may be of general importance since it is located in the area between the amphibolite/ granulite facies lower crustal rocks, which are prevalent toward the south, and greenschist facies upper crustal low- grade rocks, which are characteristic of the Arabian-Nubian Shield toward north [Vail, 1985; Stern, 1994] (Figure 1). In this study, we use the anisotropy of magnetic susceptibility (AMS) in combination with field and microfabric inves- tigations in order to better characterize the tectonic fabrics and to understand the deformation mechanism of the shear zone between a lower to middle crustal high-grade domain (Ghedem) and an upper crustal low-grade domain (Bizen) in the East African Orogen (EAO) of Eritrea (Figures 2, 3a, and 3b). The AMS technique in combination with meso- structural and microstructural studies has been widely dis- TECTONICS, VOL. 26, TC3015, doi:10.1029/2005TC001881, 2007 Click Here for Full Articl e 1 Department of Earth Sciences, University of Asmara, Asmara, Eritrea. 2 Geologisch-Pala ¨ontologisches Institut, Ruprecht-Karls Universita ¨t Heidelberg, Heidelberg, Germany. Copyright 2007 by the American Geophysical Union. 0278-7407/07/2005TC001881$12.00 TC3015 1 of 19

Welcome message from author
This document is posted to help you gain knowledge. Please leave a comment to let me know what you think about it! Share it to your friends and learn new things together.
Transcript
Fabric evolution across a discontinuity between lower and upper
crustal domains from field, microscopic, and anisotropy of
magnetic susceptibility studies in central eastern Eritrea,
NE Africa
W. Ghebreab,1 A. Kontny,2 and R. O. Greiling2
Received 5 July 2005; revised 12 January 2007; accepted 9 February 2007; published 23 June 2007.
[1] In the Neoproterozoic East African Orogen(EAO) of Eritrea, lower to middle crustal high-grademetamorphic rocks are juxtaposed against low-gradeupper crustal rocks along diffuse tectonic contactzones or discontinuities. In the central eastern part ofEritrea, such a tectonic zone is exposed as a low-angleshear zone separating two distinct high- and low-gradedomains, the Ghedem and Bizen, respectively.Integrated field, microfabric, and anisotropy ofmagnetic susceptibility (AMS) studies show that thislow-angle shear zone formed during late deformation,D2, with top-to-the-E/SE sense of motion. Thehanging wall upper crustal volcanosedimentaryschists are mainly paramagnetic and the footwallmiddle crustal mylonitized orthogneisses are mainlyferrimagnetic. Magnetic fabric studies revealed a goodagreement between metamorphic/mylonitic andmagnetic foliations (Kmin) and helped to explainfabric development in the shear zone. The magneticlineations (Kmax) reflect stretching lineations wherestretched mineral aggregates dominate fine-grainedmylonitic matrices and intersection lineations wheremicrostructural studies revealed two fabric elements.AMS directional plots indicate that the orientations ofthe magnetic lineation and of the pole to the magneticfoliation vary systematically across the shear zone.While Kmax axes form two broad maxima orientedapproximately N–S and E–W, the Kmin axes changefrom subhorizontal, generally westward inclination inthe west to moderate to steep inclination in thedirection of tectonic movement to the east. Becausethere is a systematic change in inclination of Kmin forindividual samples, all samples together form a fairlywell defined cluster distribution. The distribution ofKmin in combination with the E–W scattered plotof the Kmax is in accordance with the E/SE flow ofmylonites over exhumed Damas core complex in the
late Neoproterozoic. During the Cenozoic, the Red Searift-related detachments exploited the late orogenicshear zone, indicating that the discontinuities betweenductile middle and brittle upper crustal layers in theregion are reactivated low-angle shear zones andpossible sites of core complexes. Citation: Ghebreab, W.,
A. Kontny, and R. O. Greiling (2007), Fabric evolution across a
discontinuity between lower and upper crustal domains from field,
microscopic, and anisotropy of magnetic susceptibility studies in
central eastern Eritrea, NE Africa, Tectonics, 26, TC3015,
doi:10.1029/2005TC001881.
1. Introduction
[2] Boundaries of lower crustal rocks against uppercrustal rocks are widely exposed in the East African Orogen(Figure 1, inset) of Eritrea and neighboring countries (e.g.,southern Ethiopia and Sudan). These boundary zonesbetween the upper and lower crustal layers are mentionedin the literature of the region as terrane boundaries, ortransition zones, or simply as tectonic contact zones [e.g.,Stern, 1994; Ghebreab, 1999; Johnson and Woldehaimanot,2003]. They are geometrically and tectonically complex,and their formation and evolution are still poorly under-stood. In central eastern Eritrea, one of these boundaries ormore specifically the interface between the upper and lowercrustal layers is well exposed as a major low-angle mylonitezone [e.g., Ghebreab, 1999; Beyth et al., 2003; Ghebreab etal., 2005] and also as a zone of metamorphic discontinuityacross which the low-grade metamorphic rocks in thehanging wall abruptly changed to high-grade rocks in thefootwall. This shear zone may be of general importancesince it is located in the area between the amphibolite/granulite facies lower crustal rocks, which are prevalenttoward the south, and greenschist facies upper crustal low-grade rocks, which are characteristic of the Arabian-NubianShield toward north [Vail, 1985; Stern, 1994] (Figure 1). Inthis study, we use the anisotropy of magnetic susceptibility(AMS) in combination with field and microfabric inves-tigations in order to better characterize the tectonic fabricsand to understand the deformation mechanism of the shearzone between a lower to middle crustal high-grade domain(Ghedem) and an upper crustal low-grade domain (Bizen) inthe East African Orogen (EAO) of Eritrea (Figures 2, 3a,and 3b). The AMS technique in combination with meso-structural and microstructural studies has been widely dis-
TECTONICS, VOL. 26, TC3015, doi:10.1029/2005TC001881, 2007ClickHere
for
FullArticle
1Department of Earth Sciences, University of Asmara, Asmara, Eritrea.2Geologisch-Palaontologisches Institut, Ruprecht-Karls Universitat
Heidelberg, Heidelberg, Germany.
Copyright 2007 by the American Geophysical Union.0278-7407/07/2005TC001881$12.00
TC3015 1 of 19
cussed and used to complement tectonic interpretations byseveral researchers [e.g., Borradaile, 1987; Tarling andHrouda, 1993; Borradaile and Henry, 1997; Hrouda andJezek, 1999; Borradaile and Jackson, 2004] and is a fastand well-established reliable method.
2. Geological Setting
[3] Convergence of continental landmasses like East andWest Gondwana in the Neoproterozoic resulted in the
disappearance of the Mozambique Ocean [Stern, 1994](Figure 1, inset). Continued convergence built the formermountain belts of the East African Orogen (EAO) bycoalescence of a number of intraoceanic island arcs betweenabout 700 and 800 Ma ago [e.g., Gass, 1981; Stern, 1994;Johnson and Woldehaimanot, 2003]. The orogenic phasesubsequently gave way to large-scale gravitational collapse[e.g., Dewey, 1988; Greiling et al., 1994] or lateral tectonicescape in the northern EAO [Burke and Sengor, 1986;Stern, 1994]. This resulted in the formation of about600 Ma old rift basins over large parts of NE Egypt, Oman,and the Persian Gulf [e.g., Stern, 1994]. The transition fromoverall lateral compression (orogenic plateau phase) tolarge-scale lateral extension (collapse phase) in Arabia andNE Africa at about 600 Ma was a significant change oflithospheric dynamics [Schandelmeier and Reynolds, 1997].This lithospheric process resulted in the exhumation of thelower crust high-grade rocks in Eritrea [e.g., Ghebreab,1999; Beyth et al., 2003] either as gneiss domes [e.g., Fritzet al., 1996; Greiling, 1997] or magmatic extensional corecomplexes [e.g., Blasband et al., 2000], depending on thecollapse boundary conditions as reported from the ArabianNubian Shield in the northern EAO. Exhumation of high-grade rocks induced by buoyancy and erosion was morepronounced in the southern part of the EAO (MozambiqueBelt) than in the north (Arabian-Nubian Shield) [Stern,1994]. However, high-grade middle-lower crustal rocksare also well exposed in the Arabian-Nubian Shield likein Eritrea (Figure 1).
2.1. Upper and Lower Crustal Domains in Eritrea
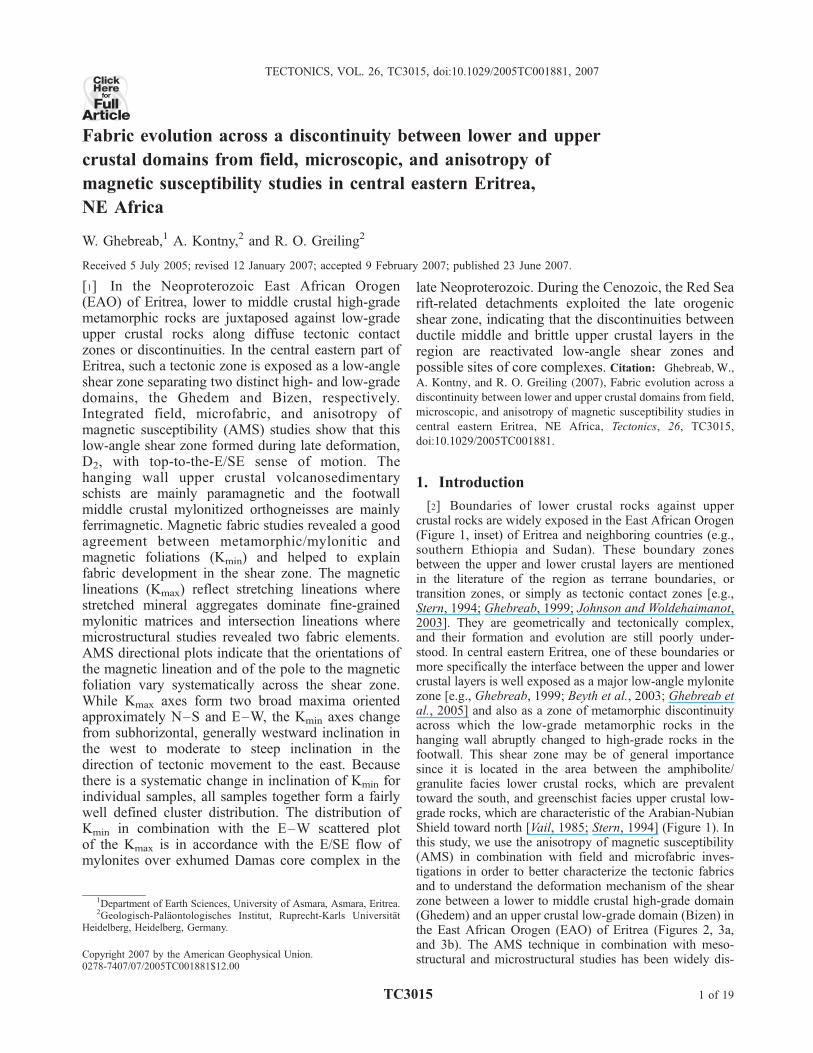
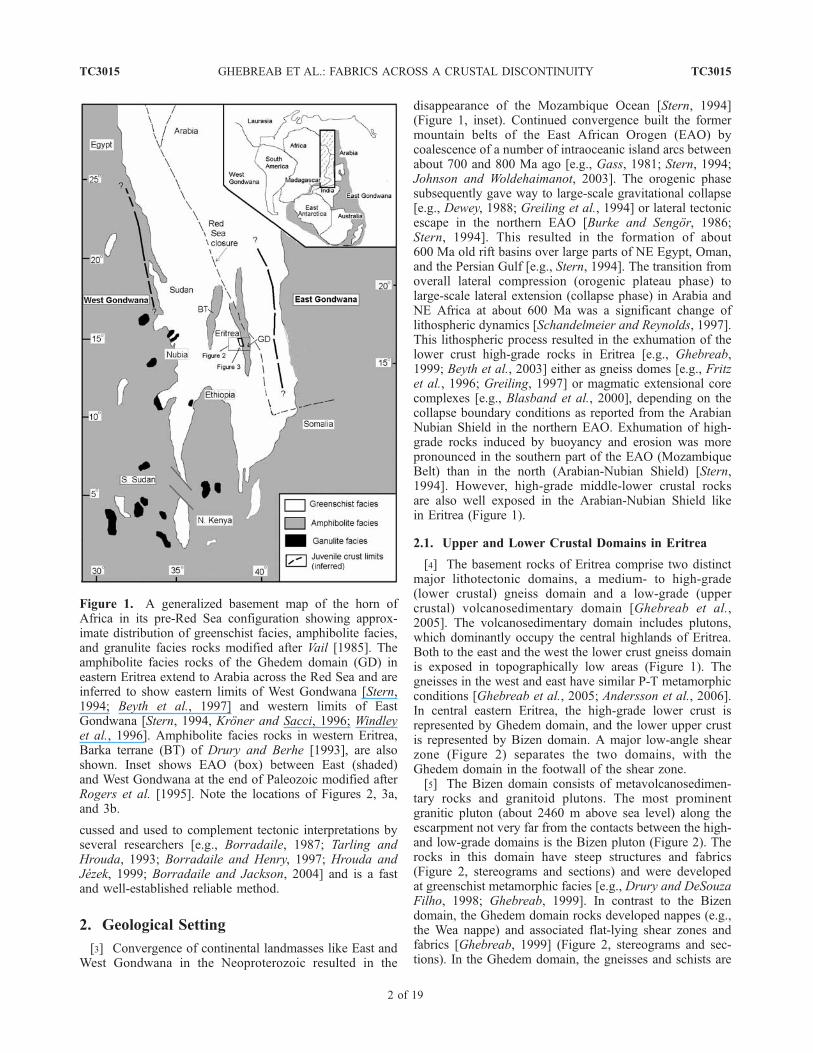
[4] The basement rocks of Eritrea comprise two distinctmajor lithotectonic domains, a medium- to high-grade(lower crustal) gneiss domain and a low-grade (uppercrustal) volcanosedimentary domain [Ghebreab et al.,2005]. The volcanosedimentary domain includes plutons,which dominantly occupy the central highlands of Eritrea.Both to the east and the west the lower crust gneiss domainis exposed in topographically low areas (Figure 1). Thegneisses in the west and east have similar P-T metamorphicconditions [Ghebreab et al., 2005; Andersson et al., 2006].In central eastern Eritrea, the high-grade lower crust isrepresented by Ghedem domain, and the lower upper crustis represented by Bizen domain. A major low-angle shearzone (Figure 2) separates the two domains, with theGhedem domain in the footwall of the shear zone.[5] The Bizen domain consists of metavolcanosedimen-
tary rocks and granitoid plutons. The most prominentgranitic pluton (about 2460 m above sea level) along theescarpment not very far from the contacts between the high-and low-grade domains is the Bizen pluton (Figure 2). Therocks in this domain have steep structures and fabrics(Figure 2, stereograms and sections) and were developedat greenschist metamorphic facies [e.g., Drury and DeSouzaFilho, 1998; Ghebreab, 1999]. In contrast to the Bizendomain, the Ghedem domain rocks developed nappes (e.g.,the Wea nappe) and associated flat-lying shear zones andfabrics [Ghebreab, 1999] (Figure 2, stereograms and sec-tions). In the Ghedem domain, the gneisses and schists are
Figure 1. A generalized basement map of the horn ofAfrica in its pre-Red Sea configuration showing approx-imate distribution of greenschist facies, amphibolite facies,and granulite facies rocks modified after Vail [1985]. Theamphibolite facies rocks of the Ghedem domain (GD) ineastern Eritrea extend to Arabia across the Red Sea and areinferred to show eastern limits of West Gondwana [Stern,1994; Beyth et al., 1997] and western limits of EastGondwana [Stern, 1994, Kroner and Sacci, 1996; Windleyet al., 1996]. Amphibolite facies rocks in western Eritrea,Barka terrane (BT) of Drury and Berhe [1993], are alsoshown. Inset shows EAO (box) between East (shaded)and West Gondwana at the end of Paleozoic modified afterRogers et al. [1995]. Note the locations of Figures 2, 3a,and 3b.
TC3015 GHEBREAB ET AL.: FABRICS ACROSS A CRUSTAL DISCONTINUITY
2 of 19
TC3015
locally migmatized and are characterized by amphibolitefacies metamorphic conditions. The Ghedem Mountain is acore complex of orthogneisses along with pegmatite andother related igneous sheet intrusions that are locally cappedand generally surrounded by amphibolite facies pelitic-semipelitic schists [Talbot and Ghebreab, 1997]. Toward
the west is the Damas core complex (Figure 3a), which isdelimited by a suite of generally westward dipping top-to-the-east ductile shear zones displaced by young normalfaults. Although it is not easy to figure out that the Damascore complex is part of the Ghedem domain, the presence ofilmeno-hematite solid solutions in the quartz-feldspar
Figure 2. Geological map of the Ghedem and Bizen domains of central eastern Eritrea. Northern part ofthe discontinuity (dark), which is characterized by mylonites, is shown in detail on Figure 3a.Stereograms show poles of composite foliation, a few fold axes, and lineations from different localities inlower hemisphere equal-area projections along schematic ENE-WSW transects. N is number of poles tocomposite foliation. Labeled numbers represent sample sites used for 40Ar-Ar39 dating, which is given inTable 1 [after Ghebreab et al., 2005]. Box in section A-A0 is shown on Figure 10c.
TC3015 GHEBREAB ET AL.: FABRICS ACROSS A CRUSTAL DISCONTINUITY
3 of 19
TC3015
mylonites and amphibolite facies mineral assemblages inparts of the hanging wall rocks (section 3.2) indicates that itis part of the Ghedem domain.
2.2. Deformation History
[6] Three major deformation events affected the rocks inthe Bizen and Ghedem domains [Ghebreab, 1999]. D1
deformation produced moderately to steeply west dippingthrusts and associated isoclinal inclined to upright F1 foldswith steep generally north-south trending penetrative S1axial planar foliation. D2 deformation resulted in F2 flat-lying folds with subhorizontal S2 axial planar foliation,which is often observed as brittle to semibrittle shear zonesand conjugate fractures in the upper crustal levels (e.g.,Figures 4a and 4b) or as D2 nappes along with extensionallow-angle ductile shear zones in lower crustal levels[Ghebreab, 1999; Ghebreab et al., 2005]. Microscopicstudies also revealed S-C fabric and C0-type shear bandcleavages and other related microstructures that developed
during late D2 deformation (Figure 5). The D1 thrusts due tocompression in the orogenic plateau phase were reactivatedduring the D2 phase of collapse [Ghebreab et al., 2005]. D3
deformation is characterized by generally N–S trendingsemibrittle strike-slip shear zones associated with onlylocally observed close to open F3 folds with S3 spacedaxial cleavage. The orientations of the foliations and line-ations (Figure 2, stereograms) vary from steep in the Bizendomain through relatively moderate to shallow across themajor shear zone at the Damas core complex to shallowerattitudes toward the Ghedem domain rocks in the east. InMount Ghedem, however, where Red Sea-related normalfaults significantly tilted blocks, the orientation of thefoliation is widely scattered. Cenozoic uplift and Red Sea-related extension along low-angle detachments among theNeoproterozoic mylonites and younger steep normal faultsare known from the study area [e.g., Drury et al., 1994;Talbot and Ghebreab, 1997].
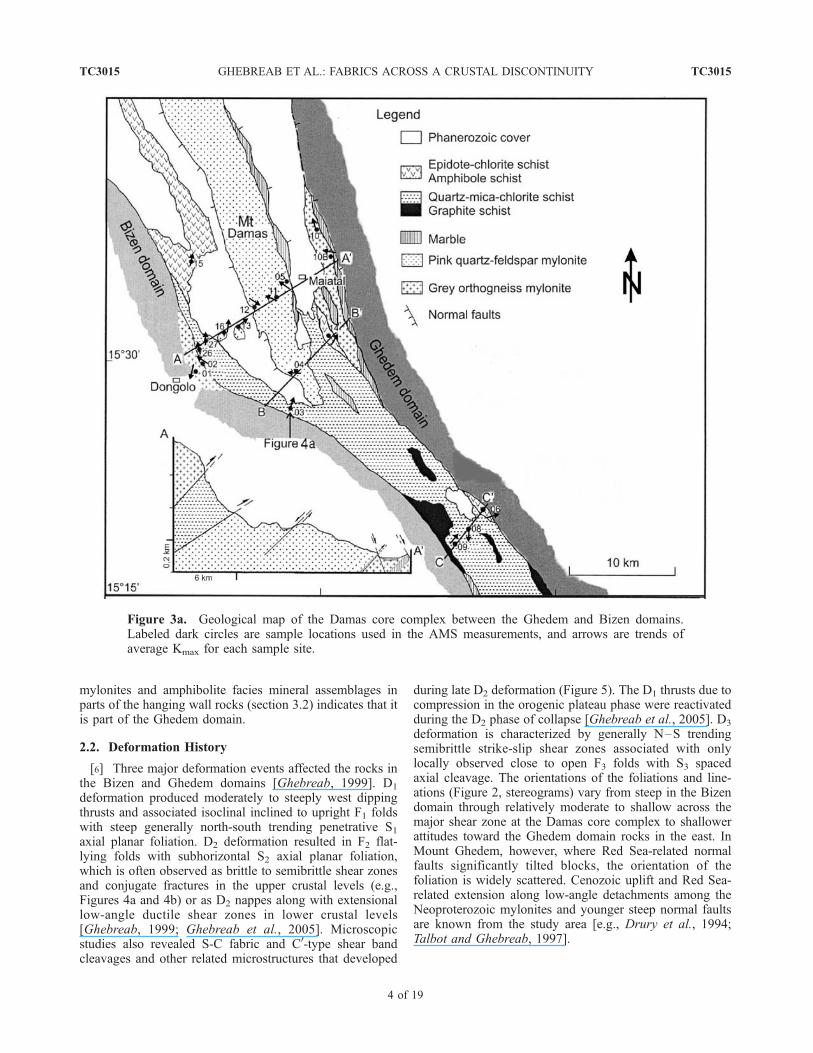
Figure 3a. Geological map of the Damas core complex between the Ghedem and Bizen domains.Labeled dark circles are sample locations used in the AMS measurements, and arrows are trends ofaverage Kmax for each sample site.
TC3015 GHEBREAB ET AL.: FABRICS ACROSS A CRUSTAL DISCONTINUITY
4 of 19
TC3015
2.3. Metamorphism and Thermochronology/Geochronology
[7] A major progressive syndeformational metamorphismwith a peak at temperatures of �650–700�C and pressuresof �12 kbar [Ghebreab, 1999; Beyth et al., 1997] (Figure 6)characterizes the lower crustal rocks of the Ghedem domain.Three phases of metamorphism M1, M2, and M3 weredistinguished from compositions of mineral equilibria andtextural relationships and have been defined as greenschistfacies, amphibolite facies, and retrogression, respectively[Ghebreab, 1999]. A counterclockwise P-T-t path relatesM1 metamorphism to early compression during D1 followedby nearly isothermal compression during late D1/early D2
and then nearly isothermal decompression during late D2/D3
[Ghebreab, 1999; Ghebreab et al., 2005].[8] The orthogneisses and metavolcanic rocks in both
domains experienced contrasting grades of metamorphism[Ghebreab, 1999] but have similar ages of formation that
range from about 750 to 850 Ma, and most of the lategranitoid rocks have ages of about 600 Ma. These ages wereobtained using 207Pb-206Pb and SIMS data on zoned zirconsof magmatic origin [Teklay et al., 2002; Andersson et al.,2006]. Conventional U-Pb geochronology of monaziteconcentrates obtained from phyllonites and quartz-feldsparmylonites from the Ghedem domain yielded 238U-206Pb ageof �593 ± 5 Ma. This has been attributed to the peak earlyM2 upper amphibolite facies metamorphism probably dur-ing terminal convergence between East and West Gond-wana [Ghebreab et al., 2005; Andersson et al., 2006]. The40Ar/39Ar cooling ages obtained on hornblende and musco-vite samples from the mylonites in the Ghedem domain(Table 1) have shown that during the early D2 between 593and 576 ± 5 Ma, the exhumation and cooling rates wereabout 1.4 mm/yr and 11�C/Ma, respectively. Similarly,during late D2 deformation, which occurred between 579and 567 ± 5 Ma, exhumation and cooling rates were about
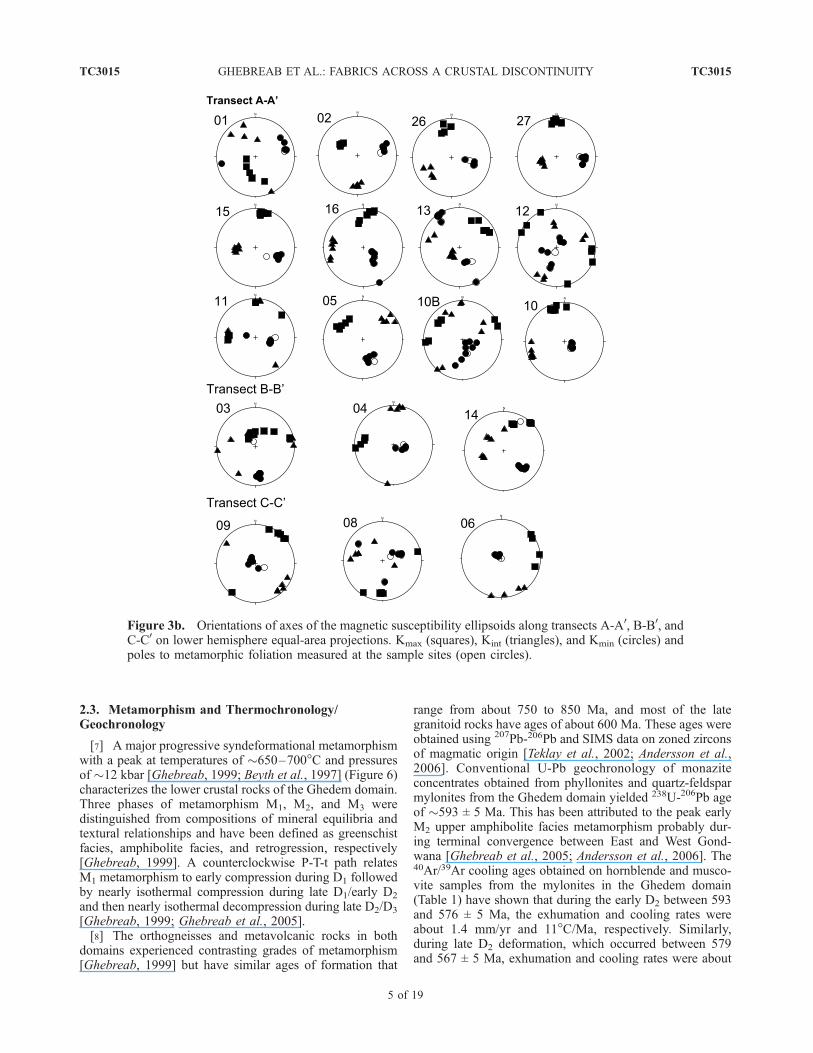
Figure 3b. Orientations of axes of the magnetic susceptibility ellipsoids along transects A-A0, B-B0, andC-C0 on lower hemisphere equal-area projections. Kmax (squares), Kint (triangles), and Kmin (circles) andpoles to metamorphic foliation measured at the sample sites (open circles).
TC3015 GHEBREAB ET AL.: FABRICS ACROSS A CRUSTAL DISCONTINUITY
5 of 19
TC3015
1.25 mm/yr and 10�C/Ma, respectively. The exhumationwas a continuous phenomenon but with varying rates duringits history [Ghebreab et al., 2005]. The U-Pb age of 565 ±7 Ma obtained on rutile grains from an amphibolite faciesphyllonite in the Ghedem domain [Andersson et al., 2006]correlates well with muscovite ages attributed to the late D2
cooling during exhumation [Ghebreab et al., 2005].[9] Field evidence, P-T conditions of metamorphism, and
40Ar/39Ar cooling ages (Table 1) have already shown thatthe lower crust (Ghedem domain) slowly rose in twosuccessive but with different exhumation rates. The lowercrust vertically rose upward from a depth of about 45–50 km during early D2 deformation and then flowedoutward during late D2. The upper crust (Bizen domain)
simultaneously collapsed vertically downward and spreadhorizontally outward [Ghebreab et al., 2005].
3. Discontinuity Between the Upper and
Lower Crustal Domains
3.1. Field Observations
[10] The discontinuity is a shear zone that juxtaposes theupper and lower structural units and therefore separates low-grade volcanosedimentary rocks from high-grade gneissesand schists (Figure 2). It was thus also a zone where thelow-grade and hence shallow metamorphic gradient in theupper crustal Bizen domain rocks probably jumped to steepgradient in the lower crust high-grade Ghedem domain
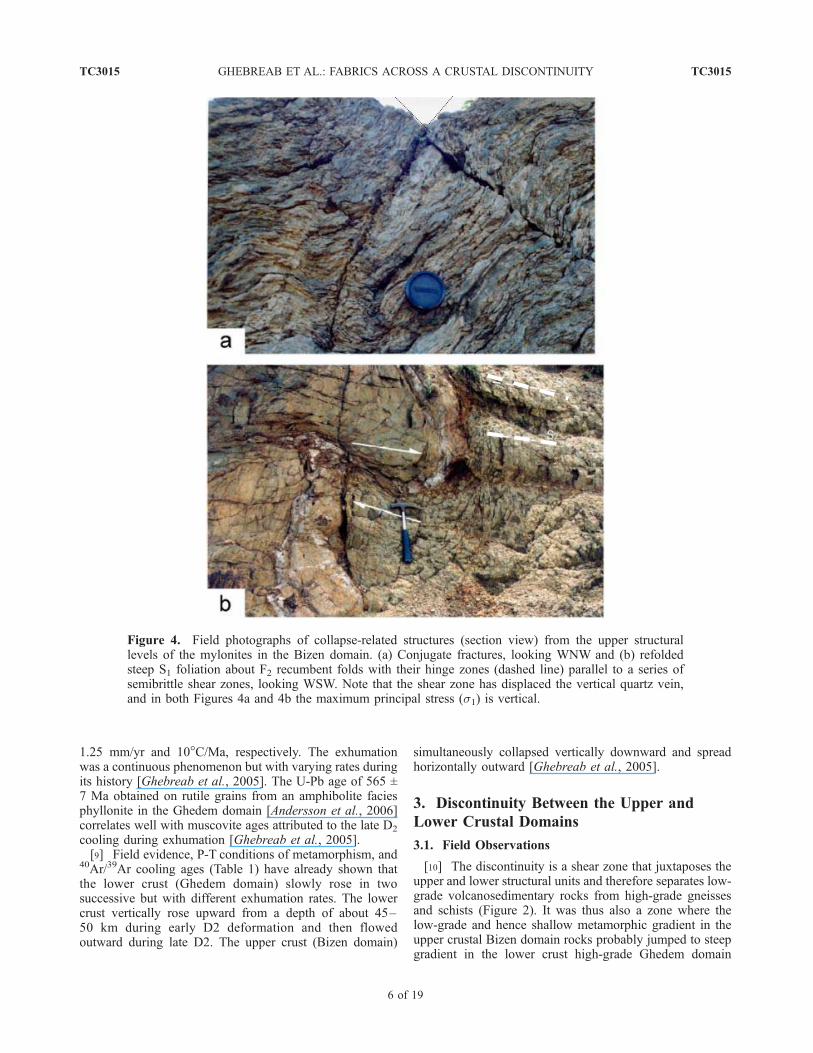
Figure 4. Field photographs of collapse-related structures (section view) from the upper structurallevels of the mylonites in the Bizen domain. (a) Conjugate fractures, looking WNW and (b) refoldedsteep S1 foliation about F2 recumbent folds with their hinge zones (dashed line) parallel to a series ofsemibrittle shear zones, looking WSW. Note that the shear zone has displaced the vertical quartz vein,and in both Figures 4a and 4b the maximum principal stress (s1) is vertical.
TC3015 GHEBREAB ET AL.: FABRICS ACROSS A CRUSTAL DISCONTINUITY
6 of 19
TC3015
rocks. The present study places focus where the shear zoneis exposed over the exhumed Damas core complex, whichconsists primarily of quartz-feldspar mylonites (Figure 3a).The shear zone is generally steeper in the west and becomesprogressively shallower to the east/southeast. It is charac-terized by dominantly top-to-the-east sense millimeter- tometer-scale low-angle to moderately westward dippinganastomosing shear zones. In the Damas complex, theintensity of deformation increases upward, and the ductile
regime temporally and spatially gives way to a brittleregime characterized by progressive overprinting of thehigh-grade fabric by a greenschist facies mylonitic fabricwith the local occurrences of centimeter-scale cataclasticzones.[11] Traces of high fluid-rock interaction, locally marked
by alteration zones with intense sericitization, epidotization,carbonatization, ferruginization, and malachite stains, arefrequent along parts of the shear zone, particularly where it
Figure 5
TC3015 GHEBREAB ET AL.: FABRICS ACROSS A CRUSTAL DISCONTINUITY
7 of 19
TC3015
was locally reactivated by strike-slip shear zones. Smallpockets of iron ore and discontinuous marble lenses, oftentalc bearing, occur as shear pods along strike. The mainrocks are mylonites of different compositions such as pinkand gray quartz-feldspar rocks; intermediate and maficvolcanic rocks, which now are epidote-chlorite and amphi-bole schists; small lenses of dolomitic marble; and pelitic-semipelitic schists, locally with staurolite-bearing graphiticmetapelites in the southern part of the shear zone. Meter-scale layers of amphibole schists locally alternate with thepelitic-semipelitic rocks (Figure 3a).
3.2. Microstructures and Petrography
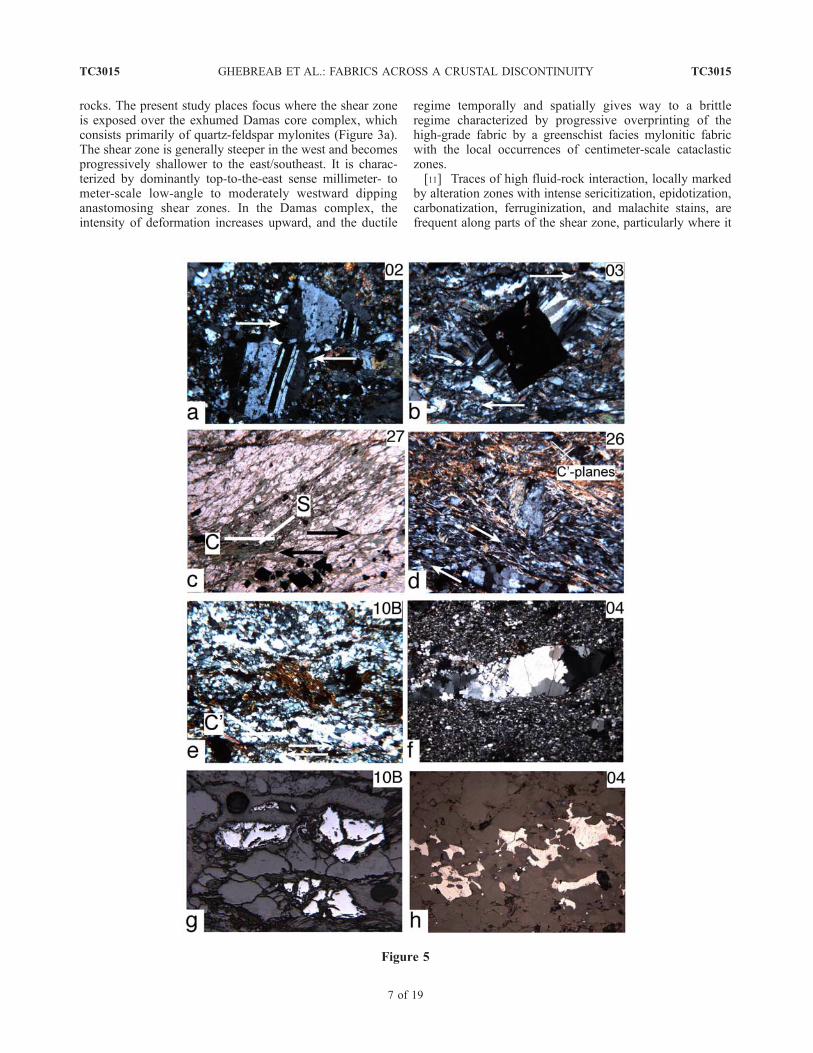
[12] Oriented thin sections prepared from samples cutparallel to the stretching lineations and normal to thefoliations (along the plane defined by Kmax and Kmin axesof the AMS ellipsoid) were studied in detail to evaluate thesense of shear. In both, the metavolcanosedimentary schistsin the immediate hanging wall and the pink and graycolored quartz-feldspar mylonites and orthogneiss in thefootwall, well-preserved shear criteria indicate dominanttop-to-E/SE sense of motion (Figures 5a–5f). These shearcriteria include microfaults in rigid plagioclase porphyro-
clasts with weak undulatory extinction in amphibole schist(Figure 5a), rotated plagioclase prophyroclasts and fiberfringes around pyrite crystals (Figure 5b), S-C fabric(Figure 5c), sigmoidal quartz aggregates (Figure 5d), C0-typeconjugate shear bands (Figure 5d), C0-type shear bandcleavage (Figure 5e), and mica fish. Dynamic recrystalliza-tion of quartz and feldspar, large porphyroclasts embedded ina fine-grained mylonitic groundmass (Figure 5f), anddeformation lamellae in feldspar are common, especially inthe mylonites. Alteration of alkali feldspars to sericite (whitemica) is conspicuous in many thin sections of the quartz-feldspar mylonites. Chloritization in biotite along its cleav-age and oxidation in fractured magnetite are well developed.Reflected light studies show amoeboidal ilmeno-hematitesolid solution (Figure 5h), which represents relics of amphib-olite facies mineral assemblage.[13] Magnetite and ilmenite occur as traces (<1% by
volume) often elongated as interstitials between feldsparsand micas along the mylonitic foliation, particularly in thequartz-feldspar mylonites. The Fe oxides are randomlydistributed but are elongated and aligned along the mylo-nitic foliation (e.g., Figure 5f), indicating their syndeforma-tional formation or recrystallization. Magnetite also occurs
Figure 5. Photomicrographs of structures from rocks of the low-angle shear zone indicating increasing deformationintensity from Figures 5a to 5f. Arrows indicate sense of motion looking N/NNE, and the labels on each thin sectioncorrespond to the labels on the rock samples, which are located on Figure 3a. (a) Paramagnetic amphibole schist withmicrofaults in plagioclase porphyroclast. (b) Albite-muscovite schist with strain fringes of quartz grown on pyrite anddynamically recrystallized quartz. (c) S-C fabric in ferrimagnetic amphibole schist with lozenge-shaped magnetite andelongated, stretched opaque aggregates of ilmenite and leucoxene. (d) Mica schist with s-type porphyroclast of sericitizedfeldspar and a conjugate set of C0 planes. (e) Gray orthogneiss mylonite with C0-type shear bands. (f) Quartz-feldsparmylonite with porphyroclasts of elongated quartz-opaque (magnetite) aggregates in a very fine grained quartz-feldsparmatrix. (g) Fractured magnetite (white) with oxidized rims in quartz-feldspar matrix. (h) Xenomorphic grains of hematite-ilmenite representing remnants of earlier amphibolite facies mineral assemblage. Width of view for Figures 5a, 5b, and 5d is2.6 mm, for Figures 5c, 5e, and 5f is 6.4 mm, and for Figures 5g and 5h is 1.6 mm.
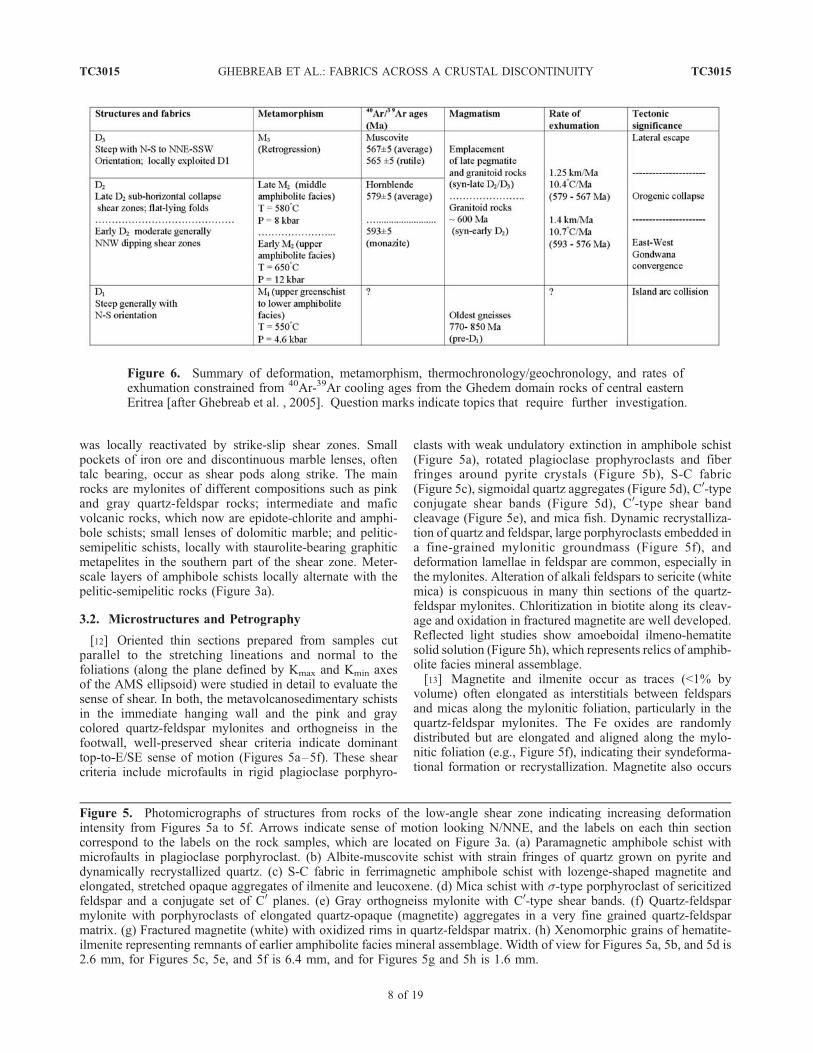
Figure 6. Summary of deformation, metamorphism, thermochronology/geochronology, and rates ofexhumation constrained from 40Ar-39Ar cooling ages from the Ghedem domain rocks of central easternEritrea [after Ghebreab et al. , 2005]. Question marks indicate topics that require further investigation.
TC3015 GHEBREAB ET AL.: FABRICS ACROSS A CRUSTAL DISCONTINUITY
8 of 19
TC3015
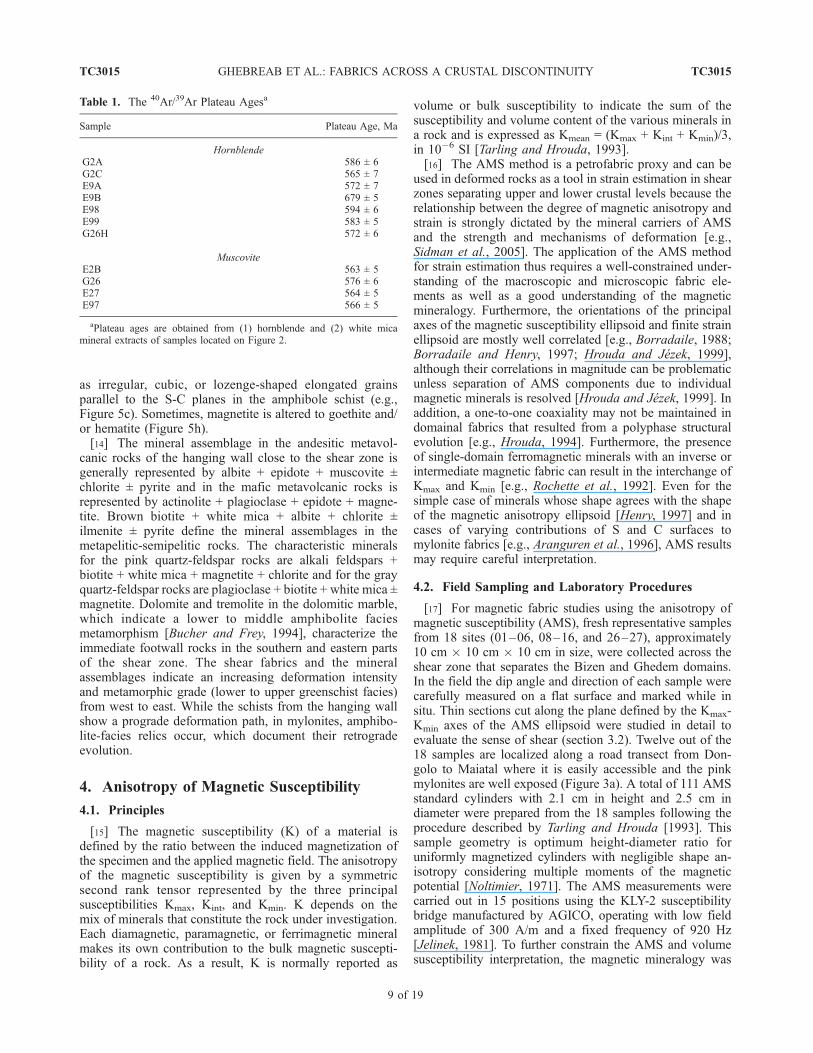
as irregular, cubic, or lozenge-shaped elongated grainsparallel to the S-C planes in the amphibole schist (e.g.,Figure 5c). Sometimes, magnetite is altered to goethite and/or hematite (Figure 5h).[14] The mineral assemblage in the andesitic metavol-
canic rocks of the hanging wall close to the shear zone isgenerally represented by albite + epidote + muscovite ±chlorite ± pyrite and in the mafic metavolcanic rocks isrepresented by actinolite + plagioclase + epidote + magne-tite. Brown biotite + white mica + albite + chlorite ±ilmenite ± pyrite define the mineral assemblages in themetapelitic-semipelitic rocks. The characteristic mineralsfor the pink quartz-feldspar rocks are alkali feldspars +biotite + white mica + magnetite + chlorite and for the grayquartz-feldspar rocks are plagioclase + biotite + white mica ±magnetite. Dolomite and tremolite in the dolomitic marble,which indicate a lower to middle amphibolite faciesmetamorphism [Bucher and Frey, 1994], characterize theimmediate footwall rocks in the southern and eastern partsof the shear zone. The shear fabrics and the mineralassemblages indicate an increasing deformation intensityand metamorphic grade (lower to upper greenschist facies)from west to east. While the schists from the hanging wallshow a prograde deformation path, in mylonites, amphibo-lite-facies relics occur, which document their retrogradeevolution.
4. Anisotropy of Magnetic Susceptibility
4.1. Principles
[15] The magnetic susceptibility (K) of a material isdefined by the ratio between the induced magnetization ofthe specimen and the applied magnetic field. The anisotropyof the magnetic susceptibility is given by a symmetricsecond rank tensor represented by the three principalsusceptibilities Kmax, Kint, and Kmin. K depends on themix of minerals that constitute the rock under investigation.Each diamagnetic, paramagnetic, or ferrimagnetic mineralmakes its own contribution to the bulk magnetic suscepti-bility of a rock. As a result, K is normally reported as
volume or bulk susceptibility to indicate the sum of thesusceptibility and volume content of the various minerals ina rock and is expressed as Kmean = (Kmax + Kint + Kmin)/3,in 10�6 SI [Tarling and Hrouda, 1993].[16] The AMS method is a petrofabric proxy and can be
used in deformed rocks as a tool in strain estimation in shearzones separating upper and lower crustal levels because therelationship between the degree of magnetic anisotropy andstrain is strongly dictated by the mineral carriers of AMSand the strength and mechanisms of deformation [e.g.,Sidman et al., 2005]. The application of the AMS methodfor strain estimation thus requires a well-constrained under-standing of the macroscopic and microscopic fabric ele-ments as well as a good understanding of the magneticmineralogy. Furthermore, the orientations of the principalaxes of the magnetic susceptibility ellipsoid and finite strainellipsoid are mostly well correlated [e.g., Borradaile, 1988;Borradaile and Henry, 1997; Hrouda and Jezek, 1999],although their correlations in magnitude can be problematicunless separation of AMS components due to individualmagnetic minerals is resolved [Hrouda and Jezek, 1999]. Inaddition, a one-to-one coaxiality may not be maintained indomainal fabrics that resulted from a polyphase structuralevolution [e.g., Hrouda, 1994]. Furthermore, the presenceof single-domain ferromagnetic minerals with an inverse orintermediate magnetic fabric can result in the interchange ofKmax and Kmin [e.g., Rochette et al., 1992]. Even for thesimple case of minerals whose shape agrees with the shapeof the magnetic anisotropy ellipsoid [Henry, 1997] and incases of varying contributions of S and C surfaces tomylonite fabrics [e.g., Aranguren et al., 1996], AMS resultsmay require careful interpretation.
4.2. Field Sampling and Laboratory Procedures
[17] For magnetic fabric studies using the anisotropy ofmagnetic susceptibility (AMS), fresh representative samplesfrom 18 sites (01–06, 08–16, and 26–27), approximately10 cm � 10 cm � 10 cm in size, were collected across theshear zone that separates the Bizen and Ghedem domains.In the field the dip angle and direction of each sample werecarefully measured on a flat surface and marked while insitu. Thin sections cut along the plane defined by the Kmax-Kmin axes of the AMS ellipsoid were studied in detail toevaluate the sense of shear (section 3.2). Twelve out of the18 samples are localized along a road transect from Don-golo to Maiatal where it is easily accessible and the pinkmylonites are well exposed (Figure 3a). A total of 111 AMSstandard cylinders with 2.1 cm in height and 2.5 cm indiameter were prepared from the 18 samples following theprocedure described by Tarling and Hrouda [1993]. Thissample geometry is optimum height-diameter ratio foruniformly magnetized cylinders with negligible shape an-isotropy considering multiple moments of the magneticpotential [Noltimier, 1971]. The AMS measurements werecarried out in 15 positions using the KLY-2 susceptibilitybridge manufactured by AGICO, operating with low fieldamplitude of 300 A/m and a fixed frequency of 920 Hz[Jelinek, 1981]. To further constrain the AMS and volumesusceptibility interpretation, the magnetic mineralogy was
Table 1. The 40Ar/39Ar Plateau Agesa
Sample Plateau Age, Ma
HornblendeG2A 586 ± 6G2C 565 ± 7E9A 572 ± 7E9B 679 ± 5E98 594 ± 6E99 583 ± 5G26H 572 ± 6
MuscoviteE2B 563 ± 5G26 576 ± 6E27 564 ± 5E97 566 ± 5
aPlateau ages are obtained from (1) hornblende and (2) white micamineral extracts of samples located on Figure 2.
TC3015 GHEBREAB ET AL.: FABRICS ACROSS A CRUSTAL DISCONTINUITY
9 of 19
TC3015
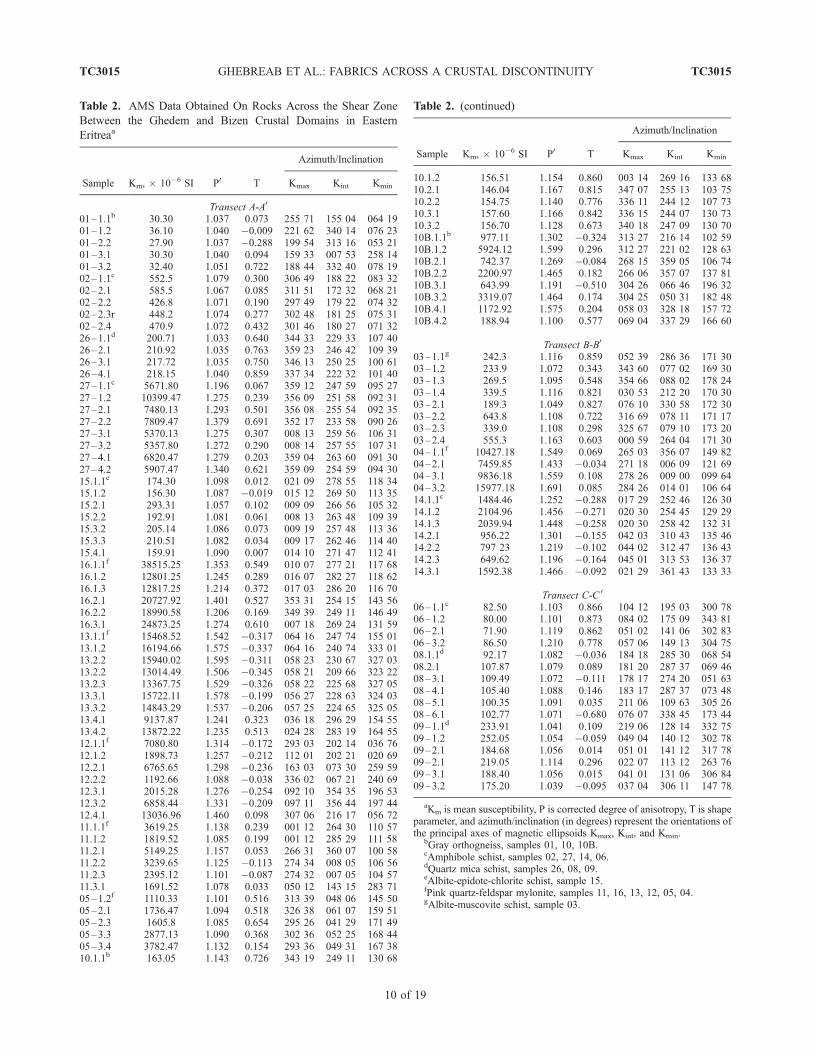
Table 2. AMS Data Obtained On Rocks Across the Shear Zone
Between the Ghedem and Bizen Crustal Domains in Eastern
Eritreaa
Sample Km, � 10�6 SI P0 T
Azimuth/Inclination
Kmax Kint Kmin
Transect A-A0
01–1.1b 30.30 1.037 0.073 255 71 155 04 064 1901–1.2 36.10 1.040 �0.009 221 62 340 14 076 2301–2.2 27.90 1.037 �0.288 199 54 313 16 053 2101–3.1 30.30 1.040 0.094 159 33 007 53 258 1401–3.2 32.40 1.051 0.722 188 44 332 40 078 1902–1.1c 552.5 1.079 0.300 306 49 188 22 083 3202–2.1 585.5 1.067 0.085 311 51 172 32 068 2102–2.2 426.8 1.071 0.190 297 49 179 22 074 3202–2.3r 448.2 1.074 0.277 302 48 181 25 075 3102–2.4 470.9 1.072 0.432 301 46 180 27 071 3226–1.1d 200.71 1.033 0.640 344 33 229 33 107 4026–2.1 210.92 1.035 0.763 359 23 246 42 109 3926–3.1 217.72 1.035 0.750 346 13 250 25 100 6126–4.1 218.15 1.040 0.859 337 34 222 32 101 4027–1.1c 5671.80 1.196 0.067 359 12 247 59 095 2727–1.2 10399.47 1.275 0.239 356 09 251 58 092 3127–2.1 7480.13 1.293 0.501 356 08 255 54 092 3527–2.2 7809.47 1.379 0.691 352 17 233 58 090 2627–3.1 5370.13 1.275 0.307 008 13 259 56 106 3127–3.2 5357.80 1.272 0.290 008 14 257 55 107 3127–4.1 6820.47 1.279 0.203 359 04 263 60 091 3027–4.2 5907.47 1.340 0.621 359 09 254 59 094 3015.1.1e 174.30 1.098 0.012 021 09 278 55 118 3415.1.2 156.30 1.087 �0.019 015 12 269 50 113 3515.2.1 293.31 1.057 0.102 009 09 266 56 105 3215.2.2 192.91 1.081 0.061 008 13 263 48 109 3915.3.2 205.14 1.086 0.073 009 19 257 48 113 3615.3.3 210.51 1.082 0.034 009 17 262 46 114 4015.4.1 159.91 1.090 0.007 014 10 271 47 112 4116.1.1f 38515.25 1.353 0.549 010 07 277 21 117 6816.1.2 12801.25 1.245 0.289 016 07 282 27 118 6216.1.3 12817.25 1.214 0.372 017 03 286 20 116 7016.2.1 20727.92 1.401 0.527 353 31 254 15 143 5616.2.2 18990.58 1.206 0.169 349 39 249 11 146 4916.3.1 24873.25 1.274 0.610 007 18 269 24 131 5913.1.1f 15468.52 1.542 �0.317 064 16 247 74 155 0113.1.2 16194.66 1.575 �0.337 064 16 240 74 333 0113.2.2 15940.02 1.595 �0.311 058 23 230 67 327 0313.2.2 13014.49 1.506 �0.345 058 21 209 66 323 2213.2.3 13367.75 1.529 �0.326 058 22 225 68 327 0513.3.1 15722.11 1.578 �0.199 056 27 228 63 324 0313.3.2 14843.29 1.537 �0.206 057 25 224 65 325 0513.4.1 9137.87 1.241 0.323 036 18 296 29 154 5513.4.2 13872.22 1.235 0.513 024 28 283 19 164 5512.1.1f 7080.80 1.314 �0.172 293 03 202 14 036 7612.1.2 1898.73 1.257 �0.212 112 01 202 21 020 6912.2.1 6765.65 1.298 �0.236 163 03 073 30 259 5912.2.2 1192.66 1.088 �0.038 336 02 067 21 240 6912.3.1 2015.28 1.276 �0.254 092 10 354 35 196 5312.3.2 6858.44 1.331 �0.209 097 11 356 44 197 4412.4.1 13036.96 1.460 0.098 307 06 216 17 056 7211.1.1f 3619.25 1.138 0.239 001 12 264 30 110 5711.1.2 1819.52 1.085 0.199 001 12 285 29 111 5811.2.1 5149.25 1.157 0.053 266 31 360 07 100 5811.2.2 3239.65 1.125 �0.113 274 34 008 05 106 5611.2.3 2395.12 1.101 �0.087 274 32 007 05 104 5711.3.1 1691.52 1.078 0.033 050 12 143 15 283 7105–1.2f 1110.33 1.101 0.516 313 39 048 06 145 5005–2.1 1736.47 1.094 0.518 326 38 061 07 159 5105–2.3 1605.8 1.085 0.654 295 26 041 29 171 4905–3.3 2877.13 1.090 0.368 302 36 052 25 168 4405–3.4 3782.47 1.132 0.154 293 36 049 31 167 3810.1.1b 163.05 1.143 0.726 343 19 249 11 130 68
Table 2. (continued)
Sample Km, � 10�6 SI P0 T
Azimuth/Inclination
Kmax Kint Kmin
10.1.2 156.51 1.154 0.860 003 14 269 16 133 6810.2.1 146.04 1.167 0.815 347 07 255 13 103 7510.2.2 154.75 1.140 0.776 336 11 244 12 107 7310.3.1 157.60 1.166 0.842 336 15 244 07 130 7310.3.2 156.70 1.128 0.673 340 18 247 09 130 7010B.1.1b 977.11 1.302 �0.324 313 27 216 14 102 5910B.1.2 5924.12 1.599 0.296 312 27 221 02 128 6310B.2.1 742.37 1.269 �0.084 268 15 359 05 106 7410B.2.2 2200.97 1.465 0.182 266 06 357 07 137 8110B.3.1 643.99 1.191 �0.510 304 26 066 46 196 3210B.3.2 3319.07 1.464 0.174 304 25 050 31 182 4810B.4.1 1172.92 1.575 0.204 058 03 328 18 157 7210B.4.2 188.94 1.100 0.577 069 04 337 29 166 60
Transect B-B0
03–1.1g 242.3 1.116 0.859 052 39 286 36 171 3003–1.2 233.9 1.072 0.343 343 60 077 02 169 3003–1.3 269.5 1.095 0.548 354 66 088 02 178 2403–1.4 339.5 1.116 0.821 030 53 212 20 170 3003–2.1 189.3 1.049 0.827 076 10 330 58 172 3003–2.2 643.8 1.108 0.722 316 69 078 11 171 1703–2.3 339.0 1.108 0.298 325 67 079 10 173 2003–2.4 555.3 1.163 0.603 000 59 264 04 171 3004–1.1f 10427.18 1.549 0.069 265 03 356 07 149 8204–2.1 7459.85 1.433 �0.034 271 18 006 09 121 6904–3.1 9836.18 1.559 0.108 278 26 009 00 099 6404–3.2 15977.18 1.691 0.085 284 26 014 01 106 6414.1.1c 1484.46 1.252 �0.288 017 29 252 46 126 3014.1.2 2104.96 1.456 �0.271 020 30 254 45 129 2914.1.3 2039.94 1.448 �0.258 020 30 258 42 132 3114.2.1 956.22 1.301 �0.155 042 03 310 43 135 4614.2.2 797 23 1.219 �0.102 044 02 312 47 136 4314.2.3 649.62 1.196 �0.164 045 01 313 53 136 3714.3.1 1592.38 1.466 �0.092 021 29 361 43 133 33
Transect C-C 0
06–1.1c 82.50 1.103 0.866 104 12 195 03 300 7806–1.2 80.00 1.101 0.873 084 02 175 09 343 8106–2.1 71.90 1.119 0.862 051 02 141 06 302 8306–3.2 86.50 1.210 0.778 057 06 149 13 304 7508.1.1d 92.17 1.082 �0.036 184 18 285 30 068 5408.2.1 107.87 1.079 0.089 181 20 287 37 069 4608–3.1 109.49 1.072 �0.111 178 17 274 20 051 6308–4.1 105.40 1.088 0.146 183 17 287 37 073 4808–5.1 100.35 1.091 0.035 211 06 109 63 305 2608–6.1 102.77 1.071 �0.680 076 07 338 45 173 4409–1.1d 233.91 1.041 0.109 219 06 128 14 332 7509–1.2 252.05 1.054 �0.059 049 04 140 12 302 7809–2.1 184.68 1.056 0.014 051 01 141 12 317 7809–2.1 219.05 1.114 0.296 022 07 113 12 263 7609–3.1 188.40 1.056 0.015 041 01 131 06 306 8409–3.2 175.20 1.039 �0.095 037 04 306 11 147 78
aKm is mean susceptibility, P is corrected degree of anisotropy, T is shapeparameter, and azimuth/inclination (in degrees) represent the orientations ofthe principal axes of magnetic ellipsoids Kmax, Kint, and Kmin.
bGray orthogneiss, samples 01, 10, 10B.cAmphibole schist, samples 02, 27, 14, 06.dQuartz mica schist, samples 26, 08, 09.eAlbite-epidote-chlorite schist, sample 15.fPink quartz-feldspar mylonite, samples 11, 16, 13, 12, 05, 04.gAlbite-muscovite schist, sample 03.
TC3015 GHEBREAB ET AL.: FABRICS ACROSS A CRUSTAL DISCONTINUITY
10 of 19
TC3015
obtained by measuring the magnetic susceptibility as afunction of temperature using a CS-2 apparatus adapted tothe susceptibility bridge [Hrouda, 1994]. The samples werecrushed to millimeter-sized particles, and a small fractionwas cooled with liquid nitrogen to �192�C and then heatedto room temperature. Afterward, the specimen was heatedup to 700�C and cooled to room temperature under an argonatmosphere.[18] To characterize the AMS ellipsoid, the shape factor
and degree of anisotropy were calculated from directionalmeasurements using the standard software for the KLY-2apparatus [Hrouda et al., 1990].[19] 1. The shape of the AMS ellipsoid is described by
the parameter T, which is expressed by
T ¼ 2 lnKint � ln Kmax � ln Kminð Þ= ln Kmax � ln Kminð Þ � 1½ :
T is >0 to + 1 for oblate, 0 for neutral and <0 to �1 forprolate geometry.[20] 2. The anisotropy of the ellipsoid is expressed by the
corrected degree of magnetic anisotropy, P0, which is givenby
P0 ¼ exp 2 lnKmax � ln Kmeanð Þ2h
þ 2 lnKint � ln Kmeanð Þ2
þ 2 lnKmax � ln Kmeanð Þ21=2:
Along with these parameters, geographic orientations forthe principal axes of the susceptibility ellipsoids aredetermined. The magnetic lineation refers to the directionof maximum susceptibility, Kmax, and the direction ofminimum susceptibility (Kmin) to the pole to the mag-netic foliation. The complete AMS data are given inTable 2.
5. Magnetic Mineralogy
5.1. Volume Susceptibility
[21] The rock types sampled from the study area acrossthe transects labeled as A-A0, B-B0, and C-C0 (Figure 3a)
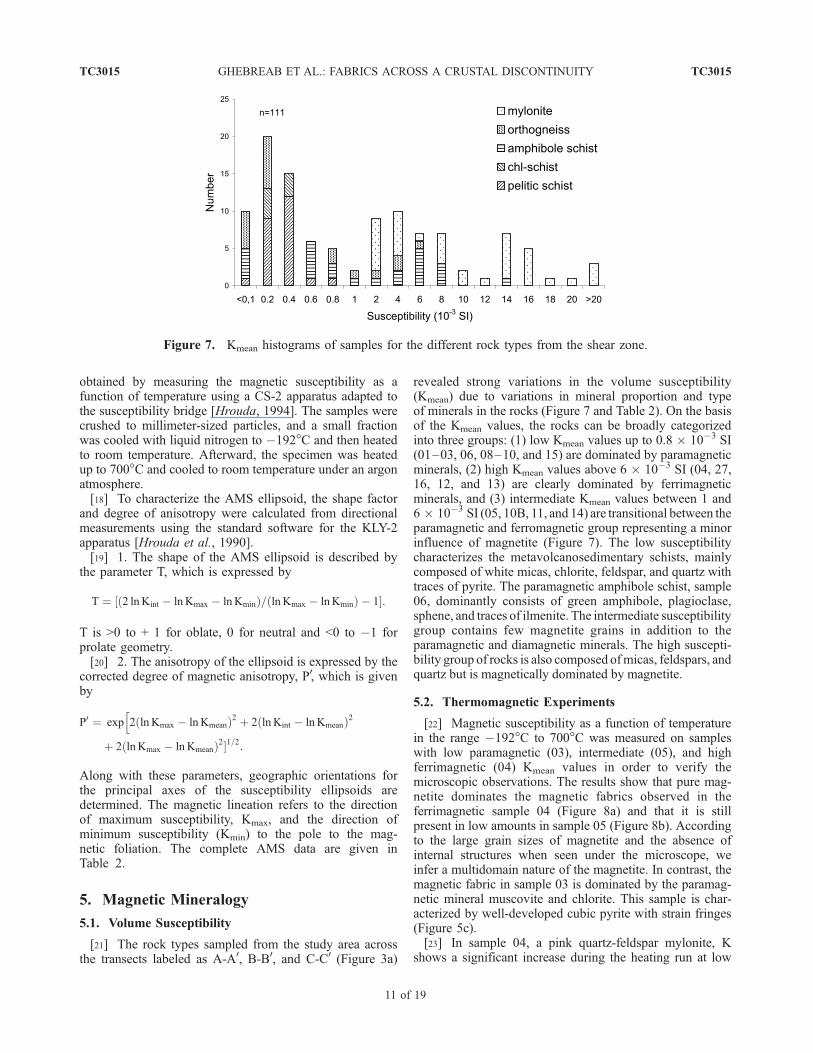
revealed strong variations in the volume susceptibility(Kmean) due to variations in mineral proportion and typeof minerals in the rocks (Figure 7 and Table 2). On the basisof the Kmean values, the rocks can be broadly categorizedinto three groups: (1) low Kmean values up to 0.8 � 10�3 SI(01–03, 06, 08–10, and 15) are dominated by paramagneticminerals, (2) high Kmean values above 6 � 10�3 SI (04, 27,16, 12, and 13) are clearly dominated by ferrimagneticminerals, and (3) intermediate Kmean values between 1 and6 � 10�3 SI (05, 10B, 11, and 14) are transitional between theparamagnetic and ferromagnetic group representing a minorinfluence of magnetite (Figure 7). The low susceptibilitycharacterizes the metavolcanosedimentary schists, mainlycomposed of white micas, chlorite, feldspar, and quartz withtraces of pyrite. The paramagnetic amphibole schist, sample06, dominantly consists of green amphibole, plagioclase,sphene, and traces of ilmenite. The intermediate susceptibilitygroup contains few magnetite grains in addition to theparamagnetic and diamagnetic minerals. The high suscepti-bility group of rocks is also composed ofmicas, feldspars, andquartz but is magnetically dominated by magnetite.
5.2. Thermomagnetic Experiments
[22] Magnetic susceptibility as a function of temperaturein the range �192�C to 700�C was measured on sampleswith low paramagnetic (03), intermediate (05), and highferrimagnetic (04) Kmean values in order to verify themicroscopic observations. The results show that pure mag-netite dominates the magnetic fabrics observed in theferrimagnetic sample 04 (Figure 8a) and that it is stillpresent in low amounts in sample 05 (Figure 8b). Accordingto the large grain sizes of magnetite and the absence ofinternal structures when seen under the microscope, weinfer a multidomain nature of the magnetite. In contrast, themagnetic fabric in sample 03 is dominated by the paramag-netic mineral muscovite and chlorite. This sample is char-acterized by well-developed cubic pyrite with strain fringes(Figure 5c).[23] In sample 04, a pink quartz-feldspar mylonite, K
shows a significant increase during the heating run at low
Figure 7. Kmean histograms of samples for the different rock types from the shear zone.
TC3015 GHEBREAB ET AL.: FABRICS ACROSS A CRUSTAL DISCONTINUITY
11 of 19
TC3015
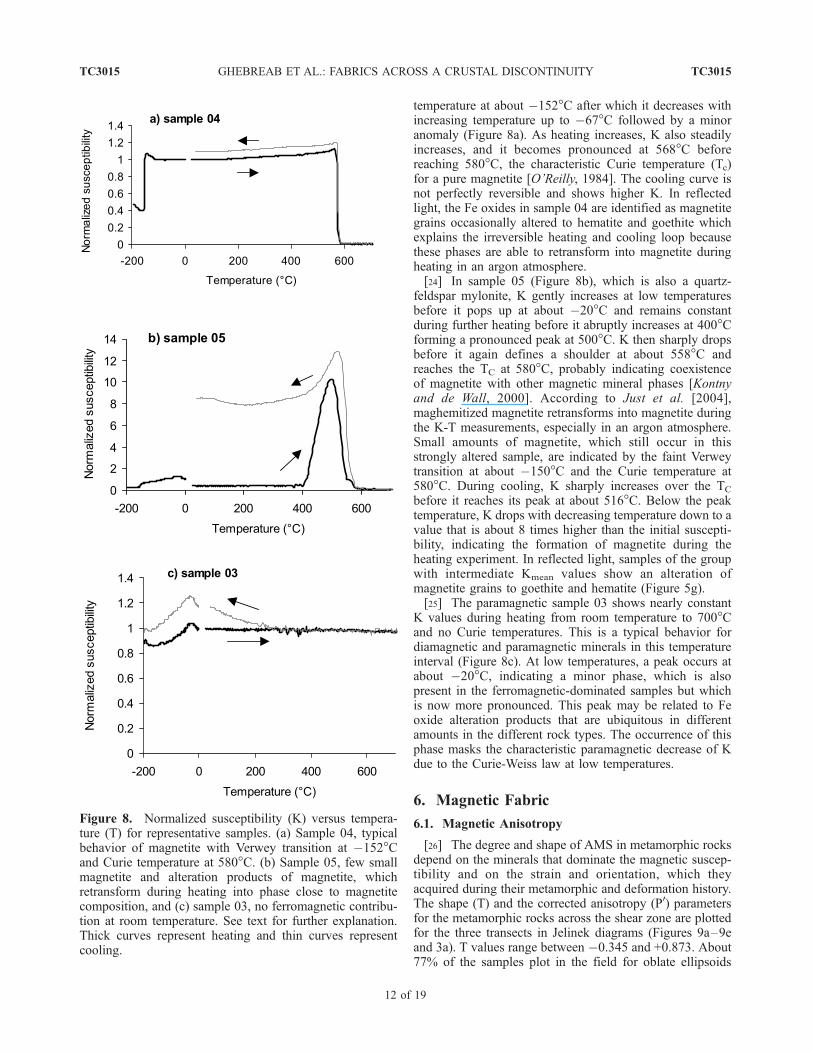
temperature at about �152�C after which it decreases withincreasing temperature up to �67�C followed by a minoranomaly (Figure 8a). As heating increases, K also steadilyincreases, and it becomes pronounced at 568�C beforereaching 580�C, the characteristic Curie temperature (Tc)for a pure magnetite [O’Reilly, 1984]. The cooling curve isnot perfectly reversible and shows higher K. In reflectedlight, the Fe oxides in sample 04 are identified as magnetitegrains occasionally altered to hematite and goethite whichexplains the irreversible heating and cooling loop becausethese phases are able to retransform into magnetite duringheating in an argon atmosphere.[24] In sample 05 (Figure 8b), which is also a quartz-
feldspar mylonite, K gently increases at low temperaturesbefore it pops up at about �20�C and remains constantduring further heating before it abruptly increases at 400�Cforming a pronounced peak at 500�C. K then sharply dropsbefore it again defines a shoulder at about 558�C andreaches the TC at 580�C, probably indicating coexistenceof magnetite with other magnetic mineral phases [Kontnyand de Wall, 2000]. According to Just et al. [2004],maghemitized magnetite retransforms into magnetite duringthe K-T measurements, especially in an argon atmosphere.Small amounts of magnetite, which still occur in thisstrongly altered sample, are indicated by the faint Verweytransition at about �150�C and the Curie temperature at580�C. During cooling, K sharply increases over the TC
before it reaches its peak at about 516�C. Below the peaktemperature, K drops with decreasing temperature down to avalue that is about 8 times higher than the initial suscepti-bility, indicating the formation of magnetite during theheating experiment. In reflected light, samples of the groupwith intermediate Kmean values show an alteration ofmagnetite grains to goethite and hematite (Figure 5g).[25] The paramagnetic sample 03 shows nearly constant
K values during heating from room temperature to 700�Cand no Curie temperatures. This is a typical behavior fordiamagnetic and paramagnetic minerals in this temperatureinterval (Figure 8c). At low temperatures, a peak occurs atabout �20�C, indicating a minor phase, which is alsopresent in the ferromagnetic-dominated samples but whichis now more pronounced. This peak may be related to Feoxide alteration products that are ubiquitous in differentamounts in the different rock types. The occurrence of thisphase masks the characteristic paramagnetic decrease of Kdue to the Curie-Weiss law at low temperatures.
6. Magnetic Fabric
6.1. Magnetic Anisotropy
[26] The degree and shape of AMS in metamorphic rocksdepend on the minerals that dominate the magnetic suscep-tibility and on the strain and orientation, which theyacquired during their metamorphic and deformation history.The shape (T) and the corrected anisotropy (P0) parametersfor the metamorphic rocks across the shear zone are plottedfor the three transects in Jelinek diagrams (Figures 9a–9eand 3a). T values range between �0.345 and +0.873. About77% of the samples plot in the field for oblate ellipsoids
Figure 8. Normalized susceptibility (K) versus tempera-ture (T) for representative samples. (a) Sample 04, typicalbehavior of magnetite with Verwey transition at �152�Cand Curie temperature at 580�C. (b) Sample 05, few smallmagnetite and alteration products of magnetite, whichretransform during heating into phase close to magnetitecomposition, and (c) sample 03, no ferromagnetic contribu-tion at room temperature. See text for further explanation.Thick curves represent heating and thin curves representcooling.
TC3015 GHEBREAB ET AL.: FABRICS ACROSS A CRUSTAL DISCONTINUITY
12 of 19
TC3015
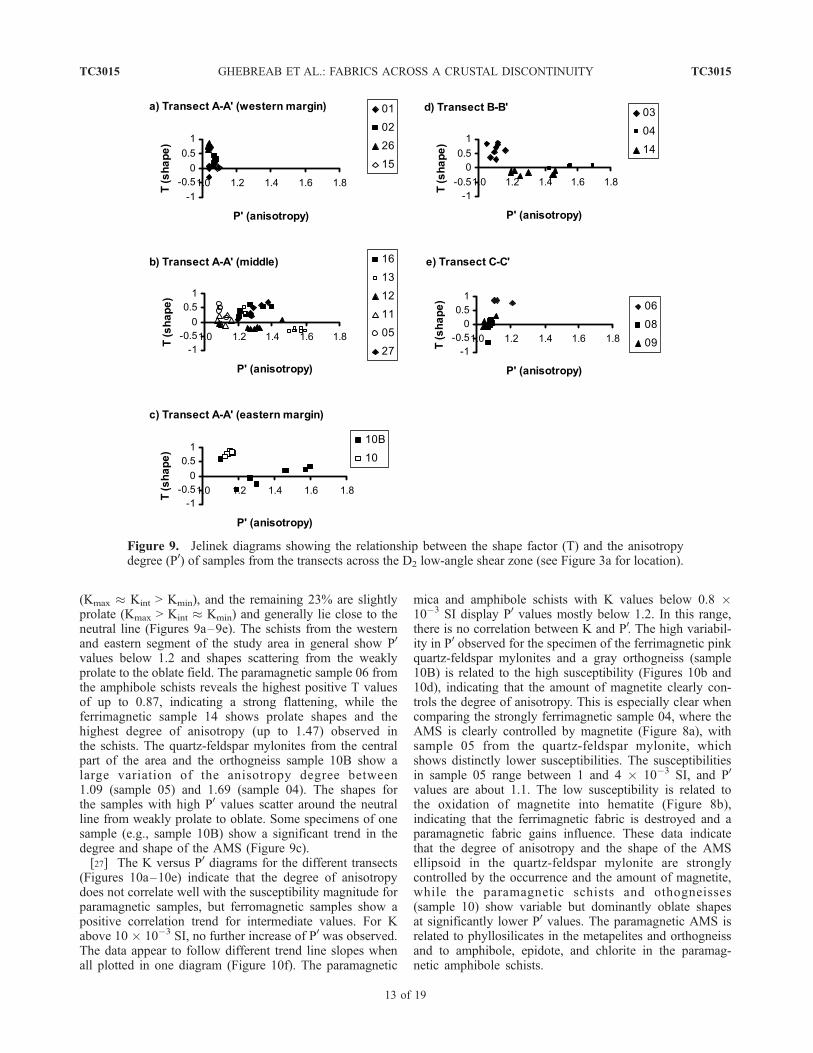
(Kmax � Kint > Kmin), and the remaining 23% are slightlyprolate (Kmax > Kint � Kmin) and generally lie close to theneutral line (Figures 9a–9e). The schists from the westernand eastern segment of the study area in general show P0
values below 1.2 and shapes scattering from the weaklyprolate to the oblate field. The paramagnetic sample 06 fromthe amphibole schists reveals the highest positive T valuesof up to 0.87, indicating a strong flattening, while theferrimagnetic sample 14 shows prolate shapes and thehighest degree of anisotropy (up to 1.47) observed inthe schists. The quartz-feldspar mylonites from the centralpart of the area and the orthogneiss sample 10B show alarge variation of the anisotropy degree between1.09 (sample 05) and 1.69 (sample 04). The shapes forthe samples with high P0 values scatter around the neutralline from weakly prolate to oblate. Some specimens of onesample (e.g., sample 10B) show a significant trend in thedegree and shape of the AMS (Figure 9c).[27] The K versus P0 diagrams for the different transects
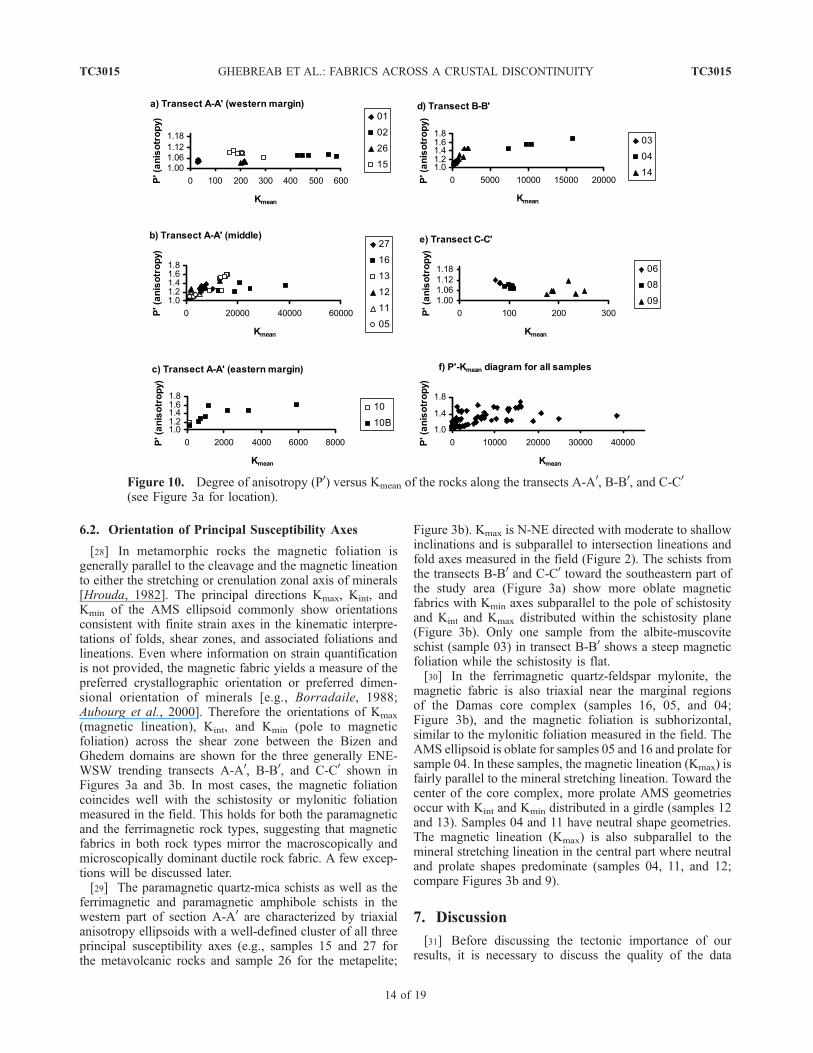
(Figures 10a–10e) indicate that the degree of anisotropydoes not correlate well with the susceptibility magnitude forparamagnetic samples, but ferromagnetic samples show apositive correlation trend for intermediate values. For Kabove 10 � 10�3 SI, no further increase of P0 was observed.The data appear to follow different trend line slopes whenall plotted in one diagram (Figure 10f). The paramagnetic
mica and amphibole schists with K values below 0.8 �10�3 SI display P0 values mostly below 1.2. In this range,there is no correlation between K and P0. The high variabil-ity in P0 observed for the specimen of the ferrimagnetic pinkquartz-feldspar mylonites and a gray orthogneiss (sample10B) is related to the high susceptibility (Figures 10b and10d), indicating that the amount of magnetite clearly con-trols the degree of anisotropy. This is especially clear whencomparing the strongly ferrimagnetic sample 04, where theAMS is clearly controlled by magnetite (Figure 8a), withsample 05 from the quartz-feldspar mylonite, whichshows distinctly lower susceptibilities. The susceptibilitiesin sample 05 range between 1 and 4 � 10�3 SI, and P0
values are about 1.1. The low susceptibility is related tothe oxidation of magnetite into hematite (Figure 8b),indicating that the ferrimagnetic fabric is destroyed and aparamagnetic fabric gains influence. These data indicatethat the degree of anisotropy and the shape of the AMSellipsoid in the quartz-feldspar mylonite are stronglycontrolled by the occurrence and the amount of magnetite,while the paramagnetic schists and othogneisses(sample 10) show variable but dominantly oblate shapesat significantly lower P0 values. The paramagnetic AMS isrelated to phyllosilicates in the metapelites and orthogneissand to amphibole, epidote, and chlorite in the paramag-netic amphibole schists.
Figure 9. Jelinek diagrams showing the relationship between the shape factor (T) and the anisotropydegree (P0) of samples from the transects across the D2 low-angle shear zone (see Figure 3a for location).
TC3015 GHEBREAB ET AL.: FABRICS ACROSS A CRUSTAL DISCONTINUITY
13 of 19
TC3015
6.2. Orientation of Principal Susceptibility Axes
[28] In metamorphic rocks the magnetic foliation isgenerally parallel to the cleavage and the magnetic lineationto either the stretching or crenulation zonal axis of minerals[Hrouda, 1982]. The principal directions Kmax, Kint, andKmin of the AMS ellipsoid commonly show orientationsconsistent with finite strain axes in the kinematic interpre-tations of folds, shear zones, and associated foliations andlineations. Even where information on strain quantificationis not provided, the magnetic fabric yields a measure of thepreferred crystallographic orientation or preferred dimen-sional orientation of minerals [e.g., Borradaile, 1988;Aubourg et al., 2000]. Therefore the orientations of Kmax
(magnetic lineation), Kint, and Kmin (pole to magneticfoliation) across the shear zone between the Bizen andGhedem domains are shown for the three generally ENE-WSW trending transects A-A0, B-B0, and C-C0 shown inFigures 3a and 3b. In most cases, the magnetic foliationcoincides well with the schistosity or mylonitic foliationmeasured in the field. This holds for both the paramagneticand the ferrimagnetic rock types, suggesting that magneticfabrics in both rock types mirror the macroscopically andmicroscopically dominant ductile rock fabric. A few excep-tions will be discussed later.[29] The paramagnetic quartz-mica schists as well as the
ferrimagnetic and paramagnetic amphibole schists in thewestern part of section A-A0 are characterized by triaxialanisotropy ellipsoids with a well-defined cluster of all threeprincipal susceptibility axes (e.g., samples 15 and 27 forthe metavolcanic rocks and sample 26 for the metapelite;
Figure 3b). Kmax is N-NE directed with moderate to shallowinclinations and is subparallel to intersection lineations andfold axes measured in the field (Figure 2). The schists fromthe transects B-B0 and C-C0 toward the southeastern part ofthe study area (Figure 3a) show more oblate magneticfabrics with Kmin axes subparallel to the pole of schistosityand Kint and Kmax distributed within the schistosity plane(Figure 3b). Only one sample from the albite-muscoviteschist (sample 03) in transect B-B0 shows a steep magneticfoliation while the schistosity is flat.[30] In the ferrimagnetic quartz-feldspar mylonite, the
magnetic fabric is also triaxial near the marginal regionsof the Damas core complex (samples 16, 05, and 04;Figure 3b), and the magnetic foliation is subhorizontal,similar to the mylonitic foliation measured in the field. TheAMS ellipsoid is oblate for samples 05 and 16 and prolate forsample 04. In these samples, the magnetic lineation (Kmax) isfairly parallel to the mineral stretching lineation. Toward thecenter of the core complex, more prolate AMS geometriesoccur with Kint and Kmin distributed in a girdle (samples 12and 13). Samples 04 and 11 have neutral shape geometries.The magnetic lineation (Kmax) is also subparallel to themineral stretching lineation in the central part where neutraland prolate shapes predominate (samples 04, 11, and 12;compare Figures 3b and 9).
7. Discussion
[31] Before discussing the tectonic importance of ourresults, it is necessary to discuss the quality of the data
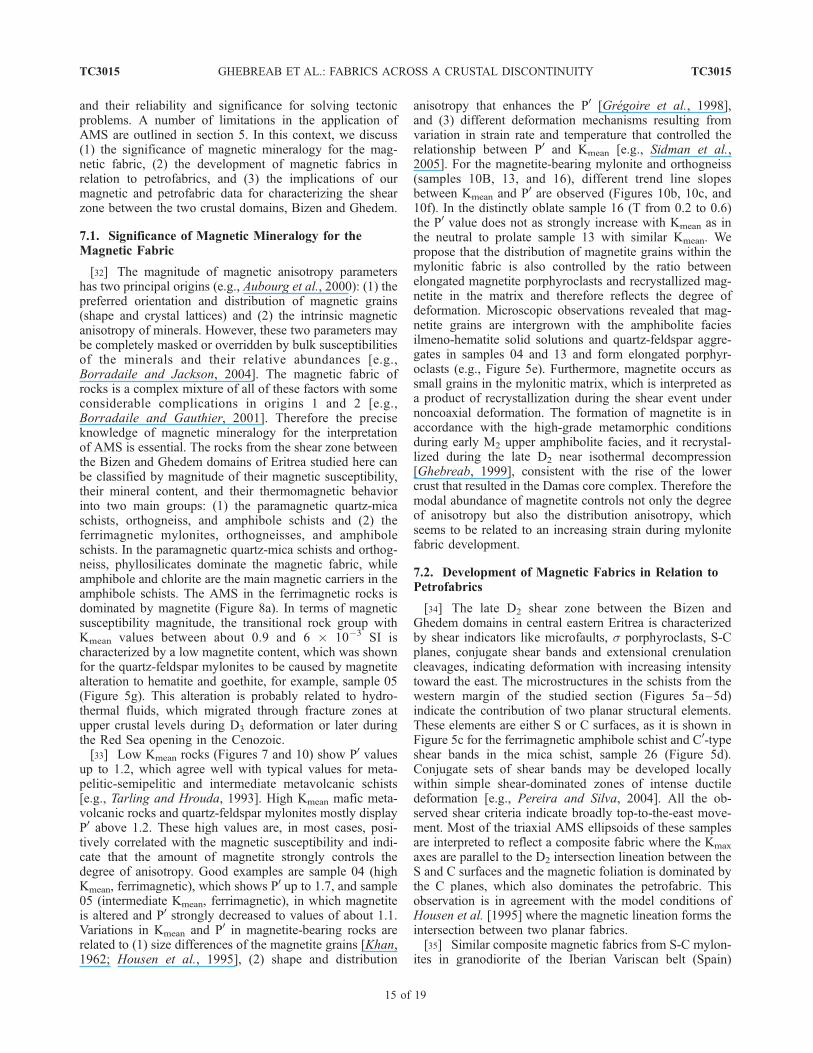
Figure 10. Degree of anisotropy (P0) versus Kmean of the rocks along the transects A-A0, B-B0, and C-C0
(see Figure 3a for location).
TC3015 GHEBREAB ET AL.: FABRICS ACROSS A CRUSTAL DISCONTINUITY
14 of 19
TC3015
and their reliability and significance for solving tectonicproblems. A number of limitations in the application ofAMS are outlined in section 5. In this context, we discuss(1) the significance of magnetic mineralogy for the mag-netic fabric, (2) the development of magnetic fabrics inrelation to petrofabrics, and (3) the implications of ourmagnetic and petrofabric data for characterizing the shearzone between the two crustal domains, Bizen and Ghedem.
7.1. Significance of Magnetic Mineralogy for theMagnetic Fabric
[32] The magnitude of magnetic anisotropy parametershas two principal origins (e.g., Aubourg et al., 2000): (1) thepreferred orientation and distribution of magnetic grains(shape and crystal lattices) and (2) the intrinsic magneticanisotropy of minerals. However, these two parameters maybe completely masked or overridden by bulk susceptibilitiesof the minerals and their relative abundances [e.g.,Borradaile and Jackson, 2004]. The magnetic fabric ofrocks is a complex mixture of all of these factors with someconsiderable complications in origins 1 and 2 [e.g.,Borradaile and Gauthier, 2001]. Therefore the preciseknowledge of magnetic mineralogy for the interpretationof AMS is essential. The rocks from the shear zone betweenthe Bizen and Ghedem domains of Eritrea studied here canbe classified by magnitude of their magnetic susceptibility,their mineral content, and their thermomagnetic behaviorinto two main groups: (1) the paramagnetic quartz-micaschists, orthogneiss, and amphibole schists and (2) theferrimagnetic mylonites, orthogneisses, and amphiboleschists. In the paramagnetic quartz-mica schists and orthog-neiss, phyllosilicates dominate the magnetic fabric, whileamphibole and chlorite are the main magnetic carriers in theamphibole schists. The AMS in the ferrimagnetic rocks isdominated by magnetite (Figure 8a). In terms of magneticsusceptibility magnitude, the transitional rock group withKmean values between about 0.9 and 6 � 10�3 SI ischaracterized by a low magnetite content, which was shownfor the quartz-feldspar mylonites to be caused by magnetitealteration to hematite and goethite, for example, sample 05(Figure 5g). This alteration is probably related to hydro-thermal fluids, which migrated through fracture zones atupper crustal levels during D3 deformation or later duringthe Red Sea opening in the Cenozoic.[33] Low Kmean rocks (Figures 7 and 10) show P0 values
up to 1.2, which agree well with typical values for meta-pelitic-semipelitic and intermediate metavolcanic schists[e.g., Tarling and Hrouda, 1993]. High Kmean mafic meta-volcanic rocks and quartz-feldspar mylonites mostly displayP0 above 1.2. These high values are, in most cases, posi-tively correlated with the magnetic susceptibility and indi-cate that the amount of magnetite strongly controls thedegree of anisotropy. Good examples are sample 04 (highKmean, ferrimagnetic), which shows P0 up to 1.7, and sample05 (intermediate Kmean, ferrimagnetic), in which magnetiteis altered and P0 strongly decreased to values of about 1.1.Variations in Kmean and P0 in magnetite-bearing rocks arerelated to (1) size differences of the magnetite grains [Khan,1962; Housen et al., 1995], (2) shape and distribution
anisotropy that enhances the P0 [Gregoire et al., 1998],and (3) different deformation mechanisms resulting fromvariation in strain rate and temperature that controlled therelationship between P0 and Kmean [e.g., Sidman et al.,2005]. For the magnetite-bearing mylonite and orthogneiss(samples 10B, 13, and 16), different trend line slopesbetween Kmean and P0 are observed (Figures 10b, 10c, and10f). In the distinctly oblate sample 16 (T from 0.2 to 0.6)the P0 value does not as strongly increase with Kmean as inthe neutral to prolate sample 13 with similar Kmean. Wepropose that the distribution of magnetite grains within themylonitic fabric is also controlled by the ratio betweenelongated magnetite porphyroclasts and recrystallized mag-netite in the matrix and therefore reflects the degree ofdeformation. Microscopic observations revealed that mag-netite grains are intergrown with the amphibolite faciesilmeno-hematite solid solutions and quartz-feldspar aggre-gates in samples 04 and 13 and form elongated porphyr-oclasts (e.g., Figure 5e). Furthermore, magnetite occurs assmall grains in the mylonitic matrix, which is interpreted asa product of recrystallization during the shear event undernoncoaxial deformation. The formation of magnetite is inaccordance with the high-grade metamorphic conditionsduring early M2 upper amphibolite facies, and it recrystal-lized during the late D2 near isothermal decompression[Ghebreab, 1999], consistent with the rise of the lowercrust that resulted in the Damas core complex. Therefore themodal abundance of magnetite controls not only the degreeof anisotropy but also the distribution anisotropy, whichseems to be related to an increasing strain during mylonitefabric development.
7.2. Development of Magnetic Fabrics in Relation toPetrofabrics
[34] The late D2 shear zone between the Bizen andGhedem domains in central eastern Eritrea is characterizedby shear indicators like microfaults, s porphyroclasts, S-Cplanes, conjugate shear bands and extensional crenulationcleavages, indicating deformation with increasing intensitytoward the east. The microstructures in the schists from thewestern margin of the studied section (Figures 5a–5d)indicate the contribution of two planar structural elements.These elements are either S or C surfaces, as it is shown inFigure 5c for the ferrimagnetic amphibole schist and C0-typeshear bands in the mica schist, sample 26 (Figure 5d).Conjugate sets of shear bands may be developed locallywithin simple shear-dominated zones of intense ductiledeformation [e.g., Pereira and Silva, 2004]. All the ob-served shear criteria indicate broadly top-to-the-east move-ment. Most of the triaxial AMS ellipsoids of these samplesare interpreted to reflect a composite fabric where the Kmax
axes are parallel to the D2 intersection lineation between theS and C surfaces and the magnetic foliation is dominated bythe C planes, which also dominates the petrofabric. Thisobservation is in agreement with the model conditions ofHousen et al. [1995] where the magnetic lineation forms theintersection between two planar fabrics.[35] Similar composite magnetic fabrics from S-C mylon-
ites in granodiorite of the Iberian Variscan belt (Spain)
TC3015 GHEBREAB ET AL.: FABRICS ACROSS A CRUSTAL DISCONTINUITY
15 of 19
TC3015
developed where the S domains are two times richer inbiotite than the C domains [Aranguren et al., 1996] and themagnetic foliation appeared to be oriented mostly betweenthe S and C planes. In the case of the Bizen domain schistsin our study, however, the magnetic foliation is mostlyparallel to the C planes. One exception is the albite-muscovite schist from the western part of transect B-B0
(sample 03), where the field foliation is flat but the magneticfoliation is still steep. While the flat field orientation isrelated to the C surfaces formed during D2, the steepmagnetic foliation probably reflects steeper S or C0 planes.Alternatively, the peak in K observed in this sample(Figure 8c) is probably due to the presence of accessoryFe oxide alteration products that grew incongruent to theorientation of the silicates. If distribution-orientation of thesilicates and the Fe oxides, which resulted from metamor-phic retrogression, is incongruent, anomalous fabrics occurthat are incompatible to the general trend of the tectonictransport [Borradaile and Gauthier, 2001]. In this sample,Kmax directions vary from north to east orientations.[36] The E–W orientation of the magnetic lineation in
some specimens (Figure 3b) is the result of a distributionanisotropy, which is controlled by elongated porphyroclastaggregates consisting of quartz and magnetite in a fine-grained recrystallized mylonitic matrix also containingrecrystallized magnetite. Our data suggest that in the west-ern edge of the core complex, excepting samples 01 and 02where stretching lineation was conspicuous in the field,most Kmax directions display intersection lineations andtherefore are not interpreted in terms of strain magnitude.In the central and eastern parts, however, Kmax directionsare dominantly parallel to the stretching lineation and can bedefinitely interpreted as a result of increasing deformationintensity.[37] In the east and south, the field and magnetic folia-
tions tend to be flat (Figure 3b; samples 10, 09, and 06)with partially strongly planar magnetic foliations (e.g.,sample 06) and NE to east oriented horizontal magneticlineations. These Kmax directions cannot be interpreted asintersection lineations but reflect a stretching lineation,which was acquired during late D2 nappe transport alonglow-angle ductile shear zones at upper greenschist-faciesconditions. The strong oblate AMS ellipsoid shape alongwith horizontal microscopic shear bands observed in theamphibole schist (sample 06) thus indicates a strongflattening to the southeast in the footwall of the shear zone,which is similar to the increase of flattening toward adetachment zone in deformed greenschist facies metasedi-ments of Tinos Island, Greece [Aubourg et al., 2000]. Thereis one case with anomalous kmax and kmin axis (sample 14from a paramagnetic to ferrimagnetic amphibolite in the eastof transect B-B0, which we interpret as inverse kmax – kmin
axis due to single-domain magnetite [Rochette et al., 1992].In this case, the long grain axis is parallel to kmin. Thissample shows a range of magnetic susceptibility values(650–2100 � 10�6 SI, see Table 2), and it is very likely thatvery tiny magnetite relics occur, which are responsible forthis behavior.
[38] The ferrimagnetic pink quartz-feldspar mylonitesof the Damas core complex show a comparable trend intheir magnetic fabric development as observed in theschists, but there, the D2 phase caused a more intense,flat-lying mylonitic foliation, indicating higher strain. Inthe SW–NE oriented transect A-A0, oblate magneticfabrics with NNE oriented magnetic lineations still showthe influence of the intersection fabric between S and C(sample 16) at the SW side of the section. Toward NE,the shapes become more prolate and neutral, which isinterpreted as an indication of increasing strain intensity.Because magnetite as a carrier of the magnetic fabric is asyndeformational phase related to D1 and D2, this ferri-magnetic mineral now amplifies the magnetic lineation,which corresponds to the stretching lineation. Large,elongated quartz-feldspar aggregates with magnetite por-phyroclasts in the mylonites form the stretching lineation(Figure 5f). This interpretation is confirmed when com-paring the strongly ferrimagnetic sample 04 with the lessferrimagnetic sample 05, for which thermomagneticexperiments revealed a strong alteration of magnetite.While the orientation of the principal AMS axes remainsabout constant as compared to the field foliation, theshape factor moves from neutral positions into the oblatefield, and the degree of anisotropy is strongly reducedfrom values of about 1.7 to 1.1 (Figure 10 and Table 2).These data suggest that the paramagnetic minerals in themylonites are strongly flattened, in accordance withmicroscopic observations. This interpretation is also con-firmed by sample 11, where specimens with prolate AMSshapes (and higher K values) have a well-defined E–Woriented kmax direction, but in samples with more oblateshapes (and slightly lower K values), kmax directions vary.In the strongly ferrimagnetic mylonites, the distribution ofmagnetite, especially within quartz-feldspar aggregates,seems to enhance the more neutral, simple shear-relatedfabric.[39] A systematic relationship between Kmean values and
shape of susceptibility ellipsoids is also observed in theorthogneiss sample 10B (Figure 10c). Prolate shapes arerelated to lower and oblate shapes to higher Kmean values,indicating the decreasing influence of magnetite. In thiscase, the ENE and east oriented magnetic lineations fromthe stronger ferrimagnetic specimens move into more NWoriented directions with decreasing influence of magnetite.This may be related to the reactivation of late D2 or the RedSea rift-related structures, which caused microfracturesunder brittle conditions and a significant alteration ofmagnetite (Figure 5h). The oxidation of magnetite, break-down of biotite to chlorite, and sericitization of feldsparsfurther indicate a retrogression of the greenschist faciesassemblage. Such mineral transformations can cause devia-tions between axes of subfabrics due to a late growth ofphyllosilicates at the expense of feldspar [Borradaile andDehls, 1993]. The destruction of the dominating ferrimag-netic subfabric caused a scattering of the magnetic lineationand seems to destroy the mostly well defined Kmax direc-tions. Sample 05 is located along the western margin of theRed Sea-related Maiatal half graben, and steeper dips of
TC3015 GHEBREAB ET AL.: FABRICS ACROSS A CRUSTAL DISCONTINUITY
16 of 19
TC3015
field and magnetic foliations are recorded in this samplethan in nearby samples (Figures 3a and 3b). This deviationis related to a block tilting by an ESE dipping Red Sea-related normal fault observed in the field. Strong oxidationof magnetite in this sample (Figure 8b) seems to be relatedto its location near the fault along which fluids werechanneled and altered the magnetite grains.[40] Beside these local features of late overprint, the
magnetic fabrics observed in this study are interpretedhere to reflect the ductile petrofabrics acquired during thelate D2 deformation when the middle-upper crustal shearzone developed. Furthermore, our observations indicatean increase in regional D2 strain intensity in the schistsfrom west to east as well as from NW to SE. The fabricelements reflect high strain values of noncoaxial flow,associated with strong strain softening resulting in fine-grained texture due to strong dynamic recrystallization inthe quartz-feldspar mylonite of the Damas complex.Although strain magnitude and magnetic anisotropy arefound not to correlate at least in nature [e.g., Borradaileand Henry, 1997; Borradaile and Jackson, 2004], mag-netic fabric analysis can be used to reconstruct shear zonepetrofabric development.
7.3. AMS Data and Their Implications forCharacterizing the Shear Zone
[41] This study showed that the distribution of strain inthe mylonites across the shear zone between the two crustaldomains is heterogeneous and fabric development in thedeformed rocks cannot be interpreted unequivocally fromAMS data alone, but the comparison of magnetic fabricwith petrofabric orientations led to reliable results.[42] In the mylonites from SW to NE in transect A-A0 a
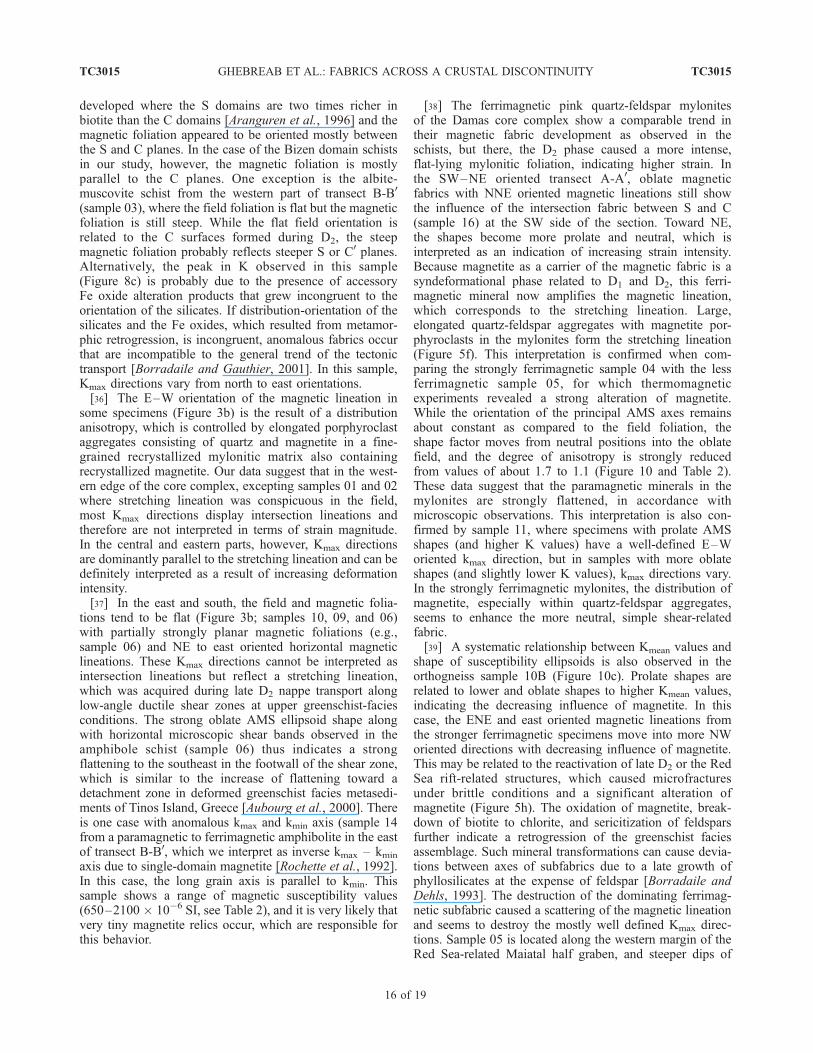
rotation of the Kmax axes (Figures 3a and 3b) from ±N–Strending S-C fabric-related intersection lineations to pro-nounced ±E–W oriented stretching lineations indicates anincrease in deformation intensity toward NE, which alsoproduced flattening of mylonitic foliation. This rotation isalso depicted in the stereoplot of all the Kmax directions(Figure 11a). All the Kmin directions plotted together showonly a fairly clustered distribution (Figure 11b) because ofthe systematic spatial change in inclination in individualsamples across the shear zone (Figure 3b). From west toeast/southeast of the shear zone, Kmin shows a distinctchange from inclined to flat-lying orientations. This distri-bution is clearly different from one along a girdle distribu-tion often attributed to a nappe deformation due to a
Figure 11. Lower hemisphere equal-area stereograms. (a) All magnetic lineations, Kmax. (b) All poles tomagnetic foliations, Kmin. Note the scatter of Kmax in two girdles oriented broadly E–W and N–S, andthe corresponding cluster of Kmin. Open symbols represent poles to foliation measured in field at thesample sites. (c) A schematic section across the D2 low-angle shear zone showing the over all direction offlow of the mylonites (thick arrows) over the Damas core complex overprinted by Red Sea extension-related normal faults. Summary of the axial orientations (Kmax, Kint, and Kmin) of susceptibility ellipsoidsis included. The curved arrow in the lower right summarizes the trajectory of flow, which is upward andthen eastward.
TC3015 GHEBREAB ET AL.: FABRICS ACROSS A CRUSTAL DISCONTINUITY
17 of 19
TC3015
combination of simple shear and lateral shortening asdescribed by Hrouda and Khan [1991]. The changes inorientation of Kmin and Kmax are here qualitatively corre-lated to strain variation [e.g., Borradaile, 1988; Hrouda andJezek, 1999] along with modifications of the fabric domi-nating elements across the shear zone and are interpreted toresult from the vertical upward rise and outward eastwardflow of the Damas soft middle crust, while the EAO in thisarea was collapsing during late D2 [Ghebreab et al., 2005].[43] Structural, metamorphic, and thermochronological/
geochronological data of the high-grade lower crustal Ghe-dem domain rocks have already indicated that cooling andexhumation of these rocks were largely contemporaneousand occurred during the late D2 deformation in late Neo-proterozoic time [Ghebreab, 1999; Ghebreab et al., 2005](Figure 6 and Table 1). The Damas core complex and/or theBizen pluton along with the mylonitized orthogneissesaround Dongolo (Figures 2, 3a, and 3b) were exhumedand cooled probably at slow rates similar to the rates of theGhedem domain lower crustal rocks (Figure 6), indicatingthat the rigid lid (upper crust) was not removed veryefficiently by domino-style extension to accommodate thestrain. The micromagnetic and magnetic fabric trajectoryacross the shear zone documented here (Figure 11c; see alsoFigure 2 cross section A-A0) in combination with previousthermochronological/geochronological studies thus mainlyreflects the late stages of lower crustal flow at the end of thePan-African orogeny in the late Neoproterozoic. However,later in the Cenozoic, the low-angle shear zone was reac-tivated and evolved into a top-to-the-east low-angle detach-ment over which domino-style normal faults soled out[Talbot and Ghebreab, 1997; Ghebreab and Talbot, 2000]when the Neoproterozoic crust extended in free boundaryconditions at temperatures well below 300�C [Ghebreab etal., 2005].[44] Our study in combination with earlier tectonometa-
morphic and thermochronological/geochronological inves-tigations also indicates that the evolution and location of thelate D2 low-angle shear zone are controlled by (1) the breakin metamorphic grade and in rheology induced by thepreexisting D1 thrusts and the original boundary betweenthe two crustal layers, (2) the rise of hot melts formed underthickened crust during compression, which subsequentlyresulted in intrusions such as the Bizen pluton, and(3) probably by the dynamics of asymmetric flow of themiddle-lower crust in the footwall to the east-southeastwhere there occurred free collapse that resulted from alarger amount of unroofing in the east than in the west.The Damas core complex is thus probably the westernmost
edge of the Ghedem metamorphic core complex. Thefeatures of the low-angle shear zones over core complexesor rising partial melts in or close to boundary areas, whichseparate two different crustal levels as it is describedfor central eastern Eritrea are probably similar to theextensional core complexes [e.g., Blasband et al., 2000]and large-scale gneiss domes [e.g., Fritz et al., 1996;Greiling, 1997] in the Arabian-Nubian Shield.
8. Conclusion
[45] The low-angle shear zone in central eastern Eritreadescribed in this study juxtaposes upper and lower structuralunits and therefore separates low-grade dominantly para-magnetic volcanosedimentary rocks from ferrimagnetichigh-grade mylonitized gneisses and schists. The metamor-phic/mylonitic foliation and magnetic foliation are in goodagreement, and we interpret our data to reflect systematicstrain variation from west to east across the shear zone. Themagnetic lineations, Kmax, in the central and eastern parts ofthe shear zone correlate quite well to stretching lineationconsistent to the direction of motion, which is east/south-eastward. In the western margin of the core complex,however, intersection lineation is dominant. The fabricevolution of the low-angle shear zone is related to theorogenic collapse during late D2, which was dominant inthe late Neoproterozoic and reactivated during the CenozoicRed Sea rifting. The contact zones or discontinuitiesbetween lower crustal high-grade and upper crustal low-grade domains in the southern and northern EAO andprobably elsewhere in similar orogenic belts are thereforesites where low-angle reactivated shear zones over exhumedcore complexes and associated strain distribution acrossthem can be studied in detail. The study also providesinsight into how such late orogenic collapse shear zonesevolved and their geometric and dynamic complexity canbe resolved using combined anisotropy of magnetic suscep-tibility, tectonometamorphic, and thermochronologic/geochronologic studies.
[46] Acknowledgments. The work is a result of cooperative research,funded through a Research Fellowship grant given to W. Ghebreab by theAlexander von Humboldt Foundation, Germany. S. A. Drury, G. Borradaile,and an anonymous reviewer are thanked for their constructive reviews. TheUniversity of Asmara supported fieldwork and sample shipment for AMSmeasurement from Eritrea to the Geological-Palaeontological Institute,Heidelberg University. We thank Carsten Vahle for his help in the magneticlaboratory at the GPI, Heidelberg.
TC3015 GHEBREAB ET AL.: FABRICS ACROSS A CRUSTAL DISCONTINUITY
18 of 19
TC3015
ReferencesAndersson, U.-B., W. Ghebreab, and M. Teklay (2006),
Crustal evolution and metamorphism in east centralEritrea, southeast Arabian-Nubian Shield, J. Afr.Earth Sci., 44, 45– 65.
Aranguren, A., J. Cuevas, and J. M. Tubia (1996),Composite magnetic fabrics from S-C mylonites,J. Struct. Geol., 18, 863–869.
Aubourg, C., R. Hebert, L. Jolivet, and G. Cartayrade(2000), The magnetic fabric of metasediments in adetachment shear zone: The example of TinosIsland (Greece), Tectonophysics, 321, 219–236.
Beyth, M., R. Stern, and A. Mathews (1997),Significance of high grade metasediments fromthe Neoproterozoic of Eritrea, Precambrian Res.,86, 45– 58.
Beyth, M., D. Avigad, H.-U. Wetzel, A. Matthews, andS. M. Berhe (2003), Crustal exhumation and indi-cations for Snowball Earth in the East African Oro-gen: North Ethiopia and east Eritrea, PrecambrianRes., 123, 187 –201.
Blasband, B., S. White, P. Brooijmans, H. De Brooder,and W. Visser (2000), Late Proterozoic extensional
collapse in the Arabian-Nubian Shield, J. Geol.Soc., London, 157, 615–628.
Borradaile, G. J. (1987), Anisotropy of magnetic sus-ceptibility: Rock composition versus strain, Tecto-nophysics, 138, 327–329.
Borradaile, G. J. (1988), Magnetic susceptibility, petro-fabrics and strain, Tectonophysics, 156, 1 –20.
Borradaile, G. J., and J. F. Dehls (1993), Regional ki-nematics inferred from magnetic subfabrics in Ar-chaean rocks of northern Ontario, Canada, J. Struct.Geol., 15, 887–894.
TC3015 GHEBREAB ET AL.: FABRICS ACROSS A CRUSTAL DISCONTINUITY
19 of 19
TC3015
Borradaile, G. J., and D. Gauthier (2001), AMS-detection of inverse fabrics without AARM inophiolite dikes,Geophys. Res. Lett., 28, 3517–3520.
Borradaile, G. J., and B. Henry (1997), Tectonic appli-cations of the magnetic susceptibility and its aniso-tropy, Earth Sci. Rev., 42, 49–93.
Borradaile, G. J., and M. Jackson (2004), Anisotropyof magnetic susceptibility (AMS): magnetic petro-fabrics of deformed rocks, in Magnetic Fabric:Methods and Applications, edited by F. Martin-Hernandez, C. Aubourg, and M. Jackson, Geol.
Soc. Spec. Publ., 238, 299–360.Bucher, K., and M. Frey (1994), Petrogenesis of Meta-
morphic Rocks, 318 pp., Springer, New York.Burke, K.. and C. Sengor (1986), Tectonic escape in the
evolution of the continental crust, in ReflectionSeismology: The Continental Crust, Geodyn.Ser., vol. 14, edited by M. Barazangi and L. Brown,pp. 41–53, AGU, Washington, D. C.
Dewey, J. F. (1988), Extensional collapse of orogens,Tectonics, 7, 1123–1139.
Drury, S. A., and S. M. Berhe (1993), Accretion tec-tonics in northern Eritrea revealed by remotelysensed imagery, Geol. Mag., 130, 177–190.
Drury, S. A., and C. R. DeSouza Filho (1998), Neopro-terozoic terrane assemblages in Eritrea: Review andprospects, J. Afr. Earth Sci., 27, 331–348.
Drury, S. A., S. P. Kelley, S. M. Berhe, R. E. Collier,and M. Abraha (1994), Structures related to RedSea evolution in northern Eritrea, Tectonics, 13,1371–1380.
Fritz, H., E. Wallbrecher, A. A. Kudeir, F. Abu El Ela,and R. D. Dallmeyer (1996), Formation of Neopro-terozoic metamorphic core complexes during obli-que convergence, Eastern Desert, Egypt, J. Afr.Earth Sci., 23, 311–327.
Gass, J. G. (1981), Pan-African (Upper Proterozoic)plate tectonic of the Arabian-Nubian Shield, in Pre-cambrian Plate Tectonics, Dev. Precambrian Geol.,vol. 4, edited by A. Kroner, pp. 387–403, Elsevier,New York.
Ghebreab, W. (1999), Tectono-metamorphic history ofNeoproterozoic rocks in eastern Eritrea, Precam-brian Res., 98, 83– 105.
Ghebreab, W., and C. J. Talbot (2000), Red Sea exten-sion influenced by Pan-African tectonic grain ineastern Ertirea, J. Struct. Geol., 22, 931–946.
Ghebreab, W., C. J. Talbot, and L. Page (2005), Timeconstraints on exhumation of the East African Oro-gen from field observations and Ar40/Ar39 coolingages of low-angle mylonites in Eritrea, Precam-brian Res., 139, 20– 41.
Gregoire, V., J. Darrozes, P. Gaillot, and A. Nedelec(1998), Magnetic grain fabric and distribution ani-sotropy vs. rock magnetic fabric: A three dimen-sional case study, J. Struct. Geol., 20, 937–944.
Greiling, R. O. (1997), Thrust tectonics in crystallinedomains: The origin of a gneiss dome, Proc. IndianAcad. Sci., 100, 209–220.
Greiling, R. O., M. M. Abdeen, A. A. Dardir, H. ElAkhal, M. F. El Ramly, G. M. Kamal El Din, A. A.Osman, A. A. Rashwan, A. H. N. Rice, and M. F.
Sadek (1994), A structural synthesis of the Proter-ozoic Arabian –Nubian Shield in Egypt, Geol.Rundsch., 83, 484–501.
Henry, B. (1997), The magnetic zone axis: A new ele-ment of magnetic fabric for the interpretation of themagnetic lineation, Tectonophysics, 271, 325–331.
Housen, B. A., B. A. Van Der Pluijm, and E. J. Essene(1995), Plastic behaviour of magnetite and highstrain obtained from magnetic grains in the ParrySound shear zone, Ontario, Greenville Province,J. Struct. Geol., 17, 265–278.
Hrouda, F. (1982), Magnetic anisotropy of rocks and itsapplication in geology and geophysics, Geophys.Surv., 5, 37–82.
Hrouda, F. (1994), A technique for the measurement ofthermal changes of magnetic susceptibility ofweakly magnetic rocks by the CS-2 apparatus andKLY-2 Kappabridge, Geophys. J. Int., 118, 604–612.
Hrouda, F., and J. Jezek (1999), Theoretical models forthe relationship between magnetic anisotropy andstrain: Effect of triaxial magnetic grains, Tectono-physics, 301, 183–190.
Hrouda, F., and S. Khan (1991), The magnetic fabricrelationship between sedimentary and basementnappes in the High Tatra Mountains, N. Slovakia,J. Struct. Geol., 13, 431–442.
Hrouda, F., V. Jelinek, and L. Hruskova (1990), Apackage of programs for statistical evaluation ofmagnetic data using IBM-PC computers, EosTrans. AGU, 71(43), 1289.
Jelinek, V. (1981), Characterization of the magneticfabric of rocks, Tectonophysics, 79, T63–T67.
Johnson, P. R., and B. Woldehaimanot (2003), Devel-opment of the Arabian-Nubian Shield: Perspectiveson the accretion and deformation in the northernEast African Orogen and the assembly of Gondwana,in Proterozoic East Gondwana: SupercontinentAssembly and Breakup, edited by M. Yoshida,B. F. Windley, and S. Dasgupta, Geol. Soc Spec.Publ., 206, 289–325.
Just, J., A. Kontny, H. deWall, A.M. Hirt. and F.Martın-Hernandez (2004), Development of magnetic fabricsduring hydrothermal alteration in the Soultz-sous-Forets granite from the EPS-1 drilling, Upper RhineGraben, inMagnetic Fabric—Methods and Applica-
tions, edited by F. Martın-Hernandez et al., Geol.Soc. Spec. Publ., 238, 509 –526.
Khan, M. A. (1962), The anisotropy of magnetic sus-ceptibility of some igneous and Metamorphic rocks,J. Geophys. Res., 67, 2873–2885.
Kontny, A., and H. de Wall (2000), Case studies on theuse of temperature-dependent susceptibility for thecharacteristic of magneto-mineralogical changesduring metamorphism, Phys. Chem. Earth, PartA, 25, 421–429.
Kroner, A., and F. P. Sacci (1996), Evolution of thenorthern Somali basement: New constraints fromzircon ages, J. Afr. Earth Sci., 22, 1 –15.
Noltimier, H. C. (1971), Magnetic rock cylinders withnegligible shape anisotropy, J. Geophys. Res., 76,4035–4037.
O’Reilly, W. (1984), Rock and Mineral Magnetism,220 pp., Elsevier, New York.
Pereira, M. F., and J. B. Silva (2004), Development oflocal orthorhombic fabrics within a simple-sheardominated sinistral transpression zone: TheArronche sheared gneisses (Iberian Massif,Portugal), in Flow Processes in Faults and Shear
Zones, edited by G. I. Alsop et al., Geol. Soc. Spec.Publ., 224, 215–227.
Rochette, B., M. Jackson, and C. Aubourg (1992),Rock magnetism and the interpretation of aniso-tropy of magnetic susceptibility, Rev. Geophys.,30, 209–226.
Rogers, J. W., J. S. Miller, and S. A. Climents (1995), APan-African zone linking East and West Gondwana,Mem. Geol. Soc. India, 34, 11– 23.
Schandelmeier, H., and P.-O. Reynolds (1997), LateNeoproterozoic (Vendian �570 Ma), in Paleogeo-
graphic-Paleotectonic Atlas of North-easternAfrica, Arabia and Adjacent Areas, edited byH. Schandelmeier and P.-O. Reynolds, pp. 5 – 13,Balkema, A. A., Brookfield, Vt.
Sidman, D., E. C. Ferre, C. Teyssier, and M. Jackson(2005), Magnetic fabric and microstructure of amylonite: Example from the Bitterroot Shear Zone,western Montana, in High-Strain Zones: Structureand Physical Properties, edited by D. Bruhn andL. Burlini, Geol. Soc. Spec. Publ., 245, 143–163.
Stern, R. J. (1994), Arc assembly and continental colli-sion in the Neoproterozoic East African Orogen:Implications for the consolidation of Gondwana-land, Annu. Rev. Earth Planet. Sci., 22, 319–351.
Talbot, C. J., and W. Ghebreab (1997), Red Sea detach-ment and basement core complexes in Eritrea,Geology, 25, 568–655.
Tarling, D. H., and F. Hrouda (1993), The MagneticAnisotropy of Rocks, 217 pp., CRC Press, BocaRaton, Fla.
Teklay, M., K. Berhe, U. Reinold, R. Armstrong,Y. Asmerom, and J. Watson (2002), Geochemistryand geochronology of Neoproterozoic low-Ktholeiite-boninite association in central Eritrea,Gondwana Res., 5, 597–611.
Vail, R. J. (1985), Pan-African (Late Precambrian) tec-tonic terranes and the reconstruction of the Arabian-Nubian Shield, Geology, 13, 839–842.
Windley, P. F., M. J. Whitehouse, and M. A. O.Ba-Bttat (1996), Early Precambrian gneiss terranesand Pan-African island arcs in Yemen: Crustal accre-tion of the eastern Arabian Shield, Geology, 24,131 –134.
���������W. Ghebreab, Department of Earth Sciences,
University of Asmara, P.O. Box 1220, Asmara, Eritrea.([email protected])
R. O. Greiling and A. Kontny, Ruprecht-KarlsUniversitat Heidelberg, Geologisch-PalaontologischesInstitut (GPI), Im Neuenheimer Feld 234, D-69120,Heidelberg, Germany. ([email protected];[email protected])
Related Documents