FINANCIAL FEASIBILITY OF UNIVERSALIZATION OF COMPREHENSIVE SOCIAL SECURITY PROGRAM IN INDIA A THESIS SUBMITTED IN FULFILLMENT OF THE REQUIREMENTS FOR THE DEGREE OF DOCTOR OF PHILOSOPHY IN ECONOMICS AT GOKHALE INSTITUTE OF POLITICS AND ECONOMICS By Manu Jain Under Guidance of Dr. Lalitagouri Kulkarni GOKHALE INSTITUTE OF POLITICS AND ECONOMICS 2018

Welcome message from author
This document is posted to help you gain knowledge. Please leave a comment to let me know what you think about it! Share it to your friends and learn new things together.
Transcript

F I N A N C I A L F E A S I B I L I T Y O F U N I V E R S A L I Z A T I O N
O F
C O M P R E H E N S I V E S O C I A L S E C U R I T Y P R O G R A M
I N
I N D I A
A THESIS
SUBMITTED IN FULFILLMENT
OF THE REQUIREMENTS FOR THE DEGREE
OF
DOCTOR OF PHILOSOPHY
IN ECONOMICS
AT
GOKHALE INSTITUTE OF POLITICS AND ECONOMICS
By
Manu Jain
Under Guidance of
Dr. Lalitagouri Kulkarni
GOKHALE INSTITUTE OF POLITICS AND ECONOMICS
2018

Financial Feasibility of Universalization
of
Comprehensive Social Security Program in India
Number of Volumes : Thesis (One)
Name of the Student : Mrs. Manu Jain
Name of the Principal Supervisor : Dr. Lalitagauri Kulkarni
Degree : Doctor of Philosophy in Economics
Name of University : Gokhale Institute of Politics and Economics
Year of Submission : 2016

DECLARATION BY THE CANDIDATE
I Manu Jain hereby declare that this thesis on the topic entitled, "Financial Feasibility
of Comprehensive Social Security Program of India" is submitted for the award
of Degree of Doctor of Philosophy in Economics to the Gokhale Institute of Politics and
Economics, Pune 411004.
It is an original contribution and has been completed during my tenure as a research
scholar at Gokhale Institute of Politics and Economics, Pune.
. This thesis has not been submitted by me elsewhere for the award of any degree or
diploma-part or full. The information gathered by me elsewhere for the thesis is
original, true and factual. Such material as has been obtained from other source has been
duly acknowledged in the thesis. I hereby request, to consider the thesis for the award
of the degree of ‘Doctor of Philosophy’.
Ms. Manu Jain
Certificate
(FORM ‘A’)
CERTIFIED that the work incorporated in this thesis entitled
"Financial Feasibility of Comprehensive Social Security Program in
India." submitted by Manu Jain was carried out by candidate
under my supervision. It is an original contribution and has not been
submitted elsewhere for the award of any other degree. Such material
as has been obtained from other source has been duly acknowledged in
this thesis. I recommend that the thesis should be considered for the
award of the degree of 'Doctor of Philosophy’.
Date:
Place: Pune Dr. Lalitagouri Kulkarni
(Research Guide)

Acknowledgement
As I read somewhere the PhD thesis is not a single person’s effort, rather it’s a team effort.
So, it is unfair rather incomplete, without expressing the gratitude towards the people who
contributed in different capacities to accomplish this life time experience.
First and foremost, I am grateful to my principal guide Dr. Lalitagouri Kulkarni, who has
been a constant support throughout the journey. She has provided the crucial guidance and
constant encouragement to complete this study, tirelessly working with me to make
changes and improve. Her guidance was not restricted to academic levels but also towards
developing a thinking and analyzing methodology and to look at the problems and test the
solutions from different angles.
I also express my gratitude to Prof Dr. Rajas Parchure for providing the overall direction
and vision, facilitating my research needs through various sources and timely advice and
suggestions.
I am also grateful to my co-guide Prof Dr. Anjali Radkar for the crucial inputs on data
discrepancy and feedback at different junctures.
I also thank Prof. Dr. V. V. N. Somayajulu for their encouragement and whose advice on
subject has been really enriching.
I am thankful to Prof. Dr. Jagadish Gokhale whose work in this field served as an
inspiration for me to start this endeavor. I also appreciate his guidance I received during
the meetings with him.
One place in the Institute where I continued visiting and adding to my knowledge is the
GIPE’s library (Dhananjay Rao Gadgil Library). I admire the diverse assortment and
historical collection of books and journal articles, which has expedited my overall learning.
I am grateful to the entire library staff for their perpetual support and cooperation. Special
thanks to Dr. N. Shewale, Librarian and to Mr. N. Choudhary. I also express my gratitude
towards Mr. D. Pardeshi, Mrs. R. Kulkarni, Mrs. D. Inamdar and the library assistants’ Mr.
Santosh, and Ms. Shilpa for their cooperation.

I also thank the library staff of National Insurance Academy (NIA), Pune where I used to
visit, looking for various data and references. I also express my gratitude towards Mrs.
Anuja Chandrachud, Mrs. Vidya Kher and Ms. Manisha Shinde of Ph.D. Section for their
constant support and encouragement. Their advice on different matters was inspiring.
I also thank the earlier Registrars at GIPE Dr. R. Nagarajan and later Dr. R. Bhatikar for
providing the entire needed infrastructure during Ph. D. I also thank Internal Ph. D.
Committee, participants and the faculty members of the Institute for their feedback at the
various six-monthly work-in-progress seminars.
I thank the entire IT staff at GIPE led by Mr. Pramod Joshi and his assistants Mr. Ganesh
Ghule for their support and help rendered in numerous instances. I am also grateful to all
the non-teaching staff at GIPE for all their cooperation and support throughout the course.
I am thankful to Ph.D. and GIPE colleagues Mr. Anil and Mr. Vijay for their support and
cooperation.
This thesis could not have been possible without the support and cooperation of my kids
Aditi and Aditya. I am grateful to them for everything, as there were days I could not be
with them at the time of grave difficulties. They have shown tremendous maturity and
managed things in my absence.
Lastly, I thank my husband for his constant encouragement and perseverance without
which this thesis would not be completed. His help in analyzing and coming up with
suggestions and solutions has been very valuable.
There were days when I needed support. Then my friends, family members, faculty at
GIPE, and colleagues encouraged me to tread on the path. I am sure; I have forgotten many
people who have helped me in different capacities including intellectual stimulation,
insightful excitements and time to time reinforcement for the completion of the long
cherished and much awaited thesis. Their contributions helped me to go into deeper of the
issue and change the degree of mental image and its levels of ideality to be accomplished.
Overall, I express my gratitude to all those who encouraged and helped me directly or
indirectly in this journey.

i
Table of Contents
DECLARATION
CERTIFICATE
ACKNOWLEDGEMENT
ABSTRACT
LIST OF TABLES
LIST OF CHARTS
LIST OF FIGURES
ABBREVIATIONS
Chapter 1 ............................................................................................................................. 1
Introduction ......................................................................................................................... 1
1.1 Overview .............................................................................................................. 1
1.2 Introduction ............................................................................................................... 1
1.3 Definitions of Social Security .............................................................................. 4
1.3.1 Bismarck’s definition of Social Security ...................................................... 4
1.3.2 Beveridge’s definition of Social Security ..................................................... 4
1.3.3 International Labor Organization (ILO)’s definition .................................... 5
1.3.4 Social Security as per Indian Constitution .................................................... 6
1.4 History of Social Security in India ....................................................................... 8
1.4.1 Social Security to the workers in the Organized Sector ............................. 14
1.4.2 Social Security to the workers in the Unorganized Sector ......................... 15
1.5 Objectives of the study ....................................................................................... 17
1.6 Significance of Study ......................................................................................... 17
1.7 Data Sources ....................................................................................................... 18
1.8 Research Methodology ....................................................................................... 18
1.9 Scope of the Study.............................................................................................. 19
1.10 Thesis Outline .................................................................................................... 19
Chapter 2 ........................................................................................................................... 21
Review of Literature ......................................................................................................... 21

ii
2.1 Introduction ........................................................................................................ 21
2.2 Universalization of Social Security: Concept and Definition ............................ 22
2.3 Scope and Target of social security.................................................................... 27
2.4 Who should provide the social security?............................................................ 31
2.5 Summary of critical evaluation of the current social security schemes in India 36
2.6 Summary of literature review ............................................................................. 37
Chapter 3 ........................................................................................................................... 39
Experiences on Existing Social Security Programmes of Selected Countries and India .. 39
3.1 Overview of Social Security Schemes of other countries .................................. 39
3.2 Overview of existing social security schemes in India ...................................... 47
3.2.1 Social Security schemes in Life Insurance in India .................................... 48
3.2.2 Social Security schemes in Health Insurance in India ................................ 59
3.2.3 Social Security schemes in Maternity Benefit ............................................ 75
3.2.4 Social Security schemes in Old Age Pension Benefit ................................ 89
Chapter 4 ......................................................................................................................... 104
Proposed Product Design for Comprehensive Social Security ....................................... 104
4.1 Life Insurance ................................................................................................... 104
4.1.1 Objective of new scheme .......................................................................... 104
4.1.2 Data used for calculation of costs ............................................................. 104
4.1.3 Assumptions .............................................................................................. 105
4.1.4 Methodology ............................................................................................. 105
4.1.5 Annual Premium Calculation .................................................................... 105
4.1.6 Detailed Results ........................................................................................ 107
4.1.7 Conclusions drawn from evaluation of existing schemes ......................... 108
4.1.8 Total Cost and Burden on the State Exchequer ........................................ 111
4.2 Health Insurance ............................................................................................... 111
4.2.1 Objective of the new scheme .................................................................... 111
4.2.2 Data used for calculation of costs ............................................................. 111
4.2.3 Assumptions .............................................................................................. 112
4.2.4 Methodology ............................................................................................. 112
4.2.5 Calculation of the Risk Premium .............................................................. 113
4.2.6 Analytical framework ............................................................................... 115

iii
4.2.7 Premium Calculation for providing Health Insurance to every individual of
the country ............................................................................................................... 116
4.2.8 Detailed Results ........................................................................................ 117
4.2.9 Total Cost and Burden on the State Exchequer ........................................ 120
4.3 Old Age Pension............................................................................................... 121
4.3.1 Objective of the new scheme .................................................................... 121
4.3.2 Data used for calculation of costs ............................................................. 121
4.3.3 Assumptions .............................................................................................. 121
4.3.4 Methodology ............................................................................................. 121
4.3.5 Detailed Results ........................................................................................ 123
4.3.6 Total Cost and Burden on the State Exchequer ........................................ 126
4.4 Maternity Benefit ............................................................................................. 126
4.4.1 Objective of the new scheme .................................................................... 126
4.4.2 Data used for calculation of costs ............................................................. 127
4.4.3 Methodology ............................................................................................. 128
4.4.4 Detailed Results ........................................................................................ 128
4.4.5 Total Cost and Burden on the State Exchequer ........................................ 129
Chapter 5 ......................................................................................................................... 130
Financial Feasibility and Sustainability of Universalization of Proposed Comprehensive
Social Security Programme............................................................................................. 130
5.1 Life Insurance Proposal .................................................................................... 130
5.1.1 Financial Feasibility .................................................................................. 133
5.1.2 Sustainability............................................................................................. 134
5.1.3 Universalization ........................................................................................ 137
5.2 Health Insurance ............................................................................................... 137
5.2.1 Financial Feasibility .................................................................................. 137
5.2.2 Sustainability............................................................................................. 139
5.2.3 Universalization ........................................................................................ 143
5.3 Old Age Pension............................................................................................... 144
5.3.1 Financial Feasibility .................................................................................. 144
5.3.2 Sustainability............................................................................................. 146
5.3.3 Universalization ........................................................................................ 148
5.4 Maternity Benefit ............................................................................................. 148
5.4.1 Financially Feasibility ............................................................................... 148

iv
5.4.2 Sustainability............................................................................................. 150
5.4.3 Universalization ........................................................................................ 153
5.5 Comprehensive Social Security ....................................................................... 153
Chapter 6 ......................................................................................................................... 162
Financial Feasibility and Sustainability of Universal Comprehensive Social Security in
India ................................................................................................................................ 162
6.1 Chapter wise Summary .................................................................................... 162
6.2 Findings of the Study ....................................................................................... 163
6.3 Limitations of the Study ................................................................................... 164
6.4 Scope for Further Research .............................................................................. 165
6.5 Concluding Remarks ........................................................................................ 165
References ....................................................................................................................... 168
Appendix ......................................................................................................................... 179
v
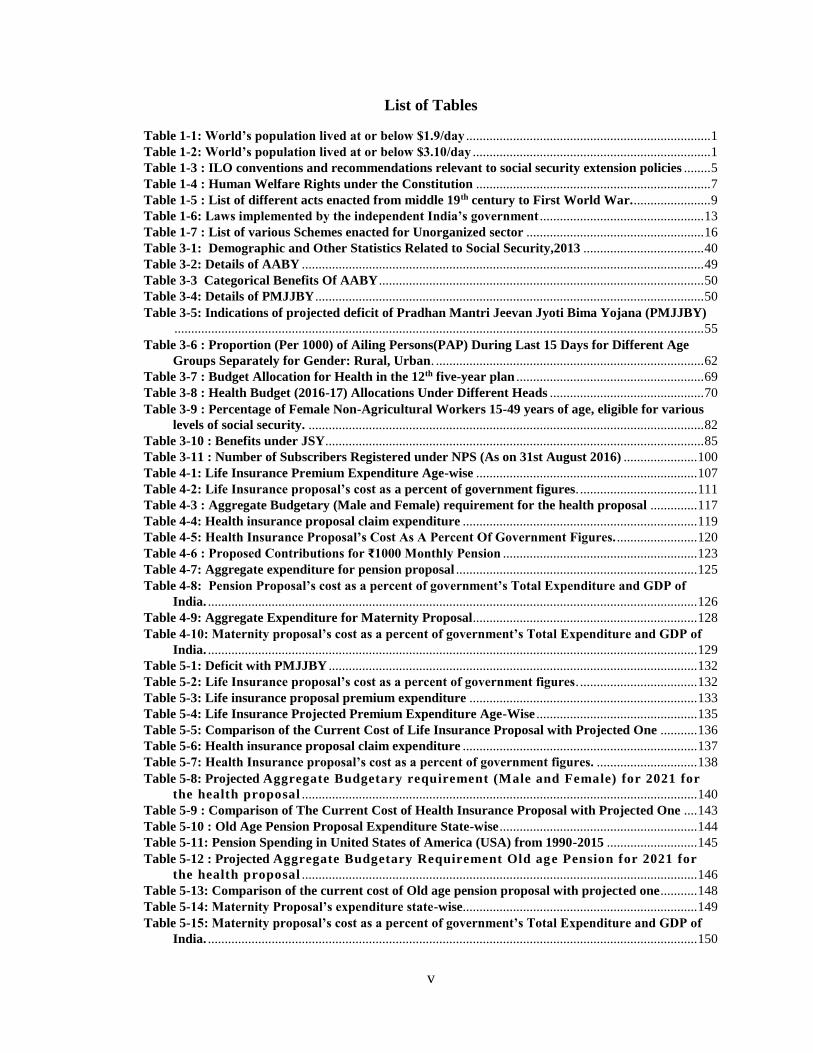
List of Tables
Table 1-1: World’s population lived at or below $1.9/day ......................................................................... 1 Table 1-2: World’s population lived at or below $3.10/day ....................................................................... 1 Table 1-3 : ILO conventions and recommendations relevant to social security extension policies ........ 5 Table 1-4 : Human Welfare Rights under the Constitution ...................................................................... 7 Table 1-5 : List of different acts enacted from middle 19th century to First World War. ....................... 9 Table 1-6: Laws implemented by the independent India’s government ................................................. 13 Table 1-7 : List of various Schemes enacted for Unorganized sector ..................................................... 16 Table 3-1: Demographic and Other Statistics Related to Social Security,2013 .................................... 40 Table 3-2: Details of AABY ........................................................................................................................ 49 Table 3-3 Categorical Benefits Of AABY ................................................................................................. 50 Table 3-4: Details of PMJJBY .................................................................................................................... 50 Table 3-5: Indications of projected deficit of Pradhan Mantri Jeevan Jyoti Bima Yojana (PMJJBY)
.............................................................................................................................................................. 55 Table 3-6 : Proportion (Per 1000) of Ailing Persons(PAP) During Last 15 Days for Different Age
Groups Separately for Gender: Rural, Urban. ................................................................................ 62 Table 3-7 : Budget Allocation for Health in the 12th five-year plan ........................................................ 69 Table 3-8 : Health Budget (2016-17) Allocations Under Different Heads .............................................. 70 Table 3-9 : Percentage of Female Non-Agricultural Workers 15-49 years of age, eligible for various
levels of social security. ...................................................................................................................... 82 Table 3-10 : Benefits under JSY ................................................................................................................. 85 Table 3-11 : Number of Subscribers Registered under NPS (As on 31st August 2016) ...................... 100 Table 4-1: Life Insurance Premium Expenditure Age-wise .................................................................. 107 Table 4-2: Life Insurance proposal’s cost as a percent of government figures. ................................... 111 Table 4-3 : Aggregate Budgetary (Male and Female) requirement for the health proposal .............. 117 Table 4-4: Health insurance proposal claim expenditure ...................................................................... 119 Table 4-5: Health Insurance Proposal’s Cost As A Percent Of Government Figures. ........................ 120 Table 4-6 : Proposed Contributions for ₹1000 Monthly Pension .......................................................... 123 Table 4-7: Aggregate expenditure for pension proposal ........................................................................ 125 Table 4-8: Pension Proposal’s cost as a percent of government’s Total Expenditure and GDP of
India. .................................................................................................................................................. 126 Table 4-9: Aggregate Expenditure for Maternity Proposal................................................................... 128 Table 4-10: Maternity proposal’s cost as a percent of government’s Total Expenditure and GDP of
India. .................................................................................................................................................. 129 Table 5-1: Deficit with PMJJBY .............................................................................................................. 132 Table 5-2: Life Insurance proposal’s cost as a percent of government figures. ................................... 132 Table 5-3: Life insurance proposal premium expenditure .................................................................... 133 Table 5-4: Life Insurance Projected Premium Expenditure Age-Wise ................................................ 135 Table 5-5: Comparison of the Current Cost of Life Insurance Proposal with Projected One ........... 136 Table 5-6: Health insurance proposal claim expenditure ...................................................................... 137 Table 5-7: Health Insurance proposal’s cost as a percent of government figures. .............................. 138 Table 5-8: Projected Aggregate Budgetary requirement (Male and Female) for 2021 for
the health proposal ...................................................................................................................... 140 Table 5-9 : Comparison of The Current Cost of Health Insurance Proposal with Projected One .... 143 Table 5-10 : Old Age Pension Proposal Expenditure State-wise ........................................................... 144 Table 5-11: Pension Spending in United States of America (USA) from 1990-2015 ........................... 145 Table 5-12 : Projected Aggregate Budgetary Requirement Old age Pension for 2021 for
the health proposal ...................................................................................................................... 146 Table 5-13: Comparison of the current cost of Old age pension proposal with projected one ........... 148 Table 5-14: Maternity Proposal’s expenditure state-wise...................................................................... 149 Table 5-15: Maternity proposal’s cost as a percent of government’s Total Expenditure and GDP of
India. .................................................................................................................................................. 150

vi
Table 5-16: Projected Aggregate Expenditure for Maternity Proposal for 2021 ................................ 151 Table 5-17 : Comparison of the current cost of Maternity benefit proposal with projected one ....... 152 Table 5-18: Comprehensive Social Security Proposal Expenditure as a percentage of Revenue
Expenditure ....................................................................................................................................... 154 Table 5-19: Comprehensive Social Security Proposal Expenditure as a percentage of Total(Capital +
Revenue) Expenditure with center’s share equal to the state’s share .......................................... 156 Table 5-20: Comprehensive Social Security Proposal Expenditure as a percentage of Total (Capital
Revenue) Expenditure, with center’s budget added in every state’s budget ............................... 157 Table 5-21: Comparison of Public social protection expenditure as percentage of GDP ................... 159 Table 5-22: Proposal cost as a percent of GDP of India (2015) ............................................................. 160 Table 5-23: Projected cost as a percent of projected GDP of India (2021) ........................................... 160 Table 5-24 : Age groups covered under the proposals ........................................................................... 161
List of Figures
Figure 3-1 : IMR (Infant Mortality Rate) Of India ........................................................................................ 77 Figure 3-2: Age-specific Work Participation Rate ........................................................................................ 80 Figure 3-3:Old age dependency ratio of India ............................................................................................... 91

vii
ABSTRACT
Government over the years in India, have strived towards fulfilling the basic needs
of a common man in India and taking care of their well-being. Well-being or welfare of
the citizens is a broad-range term which includes activities ranging from ensuring a healthy
life and have them a secure old-age by allowing them meeting their expenses at the time
they are helpless and not able to make the two ends meet by themselves. This is an
important requirement and becoming more important by-passing years.
The basic components of the preparing to face the unfortunate events in life
includes, access to medical care, means of living in old age, mitigating the risk due to the
death of bread earner in the family etc. The present and past governments in India have
been working towards that and lot of institutions and individuals (both government and
private) have been working relentlessly to achieve this objective which was once
considered a long-term, but it’s the need of the hour today. We have past sixty-seven years
of independence bearing a tag of developing nation – a promising market for world-class
organizations, home to most-of-the-best minds in business and technology. Still, it’s an
irony that we have miles to go to provide those basic needs of a person in India – a right to
lead a life in a reasonably healthy condition by way of helping him overcome some of the
basic uncertainties the life.
The need to Life Insurance, Health Insurance, Old age pension and Maternity
benefits has been identified as a need for India. We took up to understand, analyze the
existing assistance with respect to these, find out how they fare in terms of improving the
condition and come up with suggestions or proposals to make them effective. We have
come up with the detailed calculations which would concretize the proposals and also give
a clear picture in terms of the budgetary load which these schemes would have.

1
Chapter 1
Introduction
1.1 Overview
Social Security is among the primary focus areas for all the nations in the world. Protecting
the citizens from the predictable and unpredictable uncertainties is the prime motto of such
schemes. International agencies like World Health Organization (WHO), International
Labor Organization (ILO) and government ministries are working towards achieving this
common goal. We have taken up this study to evaluate the existing schemes mooted by the
Indian government and tried to analyze them based on the parameters suggested by
different studies conducted so far. We have also provided the suggestions and proposals
including the analytical framework for those, to fix the issues identified in the course.
1.2 Introduction
The size of the population of the world having the inability to face the unforeseen or even
predictable problems of the future can be seen via the tables presented below.
Table 1-1: World’s population lived at or below $1.9/day
1981 1.99 billion
1995 1.95 billion
2012 896 million Source: World Bank Report 2012.
Table 1-2: World’s population lived at or below $3.10/day
1990 2.9 billion
2012 2.1 billion Source: World Bank Report 2012.
As the Table 1-1 and 1-2 above shows that even though the population living under that
threshold has been declining over the years still, far too many people are living with far too
little.
When these people experiencing extreme poverty, faced with the challenges affecting their
economic security – they are further pushed below economically. These are the vulnerable

2
sections of society which can’t sustain the socio-economic shocks on their own and need
support to protect their livelihood and help them in the times of crises.
Everyone, as a member of society, has the right to have a secure life and is entitled to
realization, through national effort and international co-operation and in accordance with
the organization and resources of each State. Society in which a person lives should help
them to develop and to make the most of all the advantages (culture, work, social welfare)
which are offered to them in the country.
There is significant progress in the recent years in terms of making these weaker sections
of population immune to such economic crises, with the various initiatives by the
governments and agencies. Agencies like World Bank, United nations are working at
international level are striving, pushing and helping the countries to work in this direction
for example there were Millennium Development Goals defined and worked upon till 2015
and then the Sustainable Development Goals defined as the second stage of development
to be achieved by 2030.
The magnitude of problems is more severe for the developing and underdeveloped
countries because of the very nature of under-developed capital and insurance markets,
limited budgetary support and the dependency on traditional occupations under the
economy. The governments of developing countries find it difficult to support the schemes
of the magnitude that are sufficient to cover the whole population.
The schemes to support such cause come under an umbrella term called – Social Security.
Social security covers different schemes depending on the country, society, region of the
world and the target population. Social Security may also refer to the action programs of
government intended to promote the welfare of the population through assistance measures
guaranteeing access to sufficient resources for food and shelter and to promote health and
well-being for the population at large and potentially vulnerable segments such as children,
the elderly, the sick and the unemployed. Services providing social security are often
called social services.
Different countries have implemented it in some form or the other with similar or different
names. The eligibility conditions, contribution source and the benefits provided differs

3
from case to case. India like other countries worked and still working to alleviate poverty
and supporting the people in needy times by supporting them through various social
security schemes.
This study deals with the four main components of social security namely, Life, Health,
Old Age Pension and Maternity Benefit. This study analyzes the current schemes under
these domains, finds the areas of improvement and suggests the ways to overcome those
with specific analytical inputs.
The next section explains the concept of social security and delves more into the term to
get the context clearer.
BOX 1 Origin of the Term “Social Security”
Abraham Epstein, an American, recognized as introducing the phrase “social security” to USA and, to the
world. Abraham Epstein was a national leader in the social welfare movement in the first half of the
nineteenth century.
At the beginning of the 1930’s the term “economic security” was used by those who worked on the early
legislation; it was used by the US President Roosevelt in June 1934 when he formed the Committee on
Economic Security; and in his January 17.1935, message to Congress urging enactment of the Committee’s
recommendations, which were incorporated under the “Economic Security Act.”
Epstein acknowledged that his friend and colleague Emil Frankel was the person who coined the term
“security”: when they started something called American Association for Old Age Security in 1927.
Epstein, Frankel said, was in the process of “establishing a national organization to spread the gospel of old
age assistance throughout the United States, the proposed American Old Age Pension Association. They
agreed upon to use the name as: ‘security’. And then on the word ‘security’ was incorporated in all social
legislation in America and became a household word in the United States and spelt assurance to millions of
American citizens in meeting life’s untoward economic problems.
Epstein insisted on the term ‘social security’ because by that time he had a clear conception of the differences
which lay between the concepts of social insurance as worked out by Bismarck in Germany and the
conception of social protection as elaborated in England. He did not want to name it as ‘social insurance’
because this would give it a different meaning of the actuarial insurance concept in terms of compulsory
savings which do not justify governmental contributions. He did not want economic security because what
he hoped for was not only a form of security for the workers as such but also to promote the welfare of society
as he was convinced that no improvement in the conditions of labor can come except as the security of the
people is advanced.

4
The term social security caught the attention of numerous economists, policy makers and
other leaders of the world in the coming years. The next section of this chapter presents the
formal definitions of social security by the economists and policy makers of different
countries.
1.3 Definitions of Social Security
To understand the social security as per the formal definition conceptualized by the people
and organizations concerned below mentioned are the definitions collected.
1.3.1 Bismarck’s definition of Social Security
Germany became the first nation in the world to adopt an old-age social insurance program
in 1889, designed by Germany's Chancellor, Otto von Bismarck, who said: ". . . those who
are disabled from work by age and invalidity have a well-grounded claim to care from
the state."
The German system provided contributory retirement benefits and disability benefits as
well. The participation was mandatory, and contributions were taken from the employee,
the employer and the government. It was coupled with the workers' compensation program
established in 1884 and the health insurance enacted the year before. With this the Germans
adopted a comprehensive system of income security based on social insurance principles.
Unemployment insurance in 1927, completed the system.
1.3.2 Beveridge’s definition of Social Security
William Henry Beveridge, a British economist published a report in Dec’1942 mentioning
that the main reasons of economic problems were due to the interruption or loss of earning
power caused by unemployment, sickness, old age and death; the remainders were due to
failure to relate income or earning to the size of family. So, the approach of Beveridge
towards social security was based on the three principles:
2 There should be a universal child allowance whether the wage earner was in or out of
work to eliminate family poverty due to large families.

5
3 There should be a high level of employment, or at best full employment, maintained
by government policy; mass and long-term unemployment ought to be avoided.
4 There should be comprehensive health and rehabilitation services to avoid heavy
expenditure and maintain a healthier population.
1.3.3 International Labor Organization (ILO)’s definition
ILO being the international agency working towards the interests of the labor class,
workers and people with uncertain income security defines social security as below:
“Social security is the protection that a society provides to individuals and households to
ensure access to health care and to guarantee income security, particularly in cases of old
age, unemployment, sickness, invalidity, work injury, maternity or loss of a breadwinner.”
Social security protection is clearly defined in ILO conventions and United Nation’s
instruments as a basic human right. Broadly defined as a system of contribution-based
health, pension and unemployment protection, along with tax-financed social benefits,
social security has become a universal challenge in a globalizing world.
The subsequent table lists the various conventions adopted by ILO with respect to the
social security.
TABLE 1-3 : ILO conventions and recommendations relevant to social
security extension policies
ILO Convention Year (and
Number)
Social security was established as a basic human right in the ILO’s
Declaration of Philadelphia
1944
Income Security Recommendation
It says that income security scheme should relieve want and
prevent destitution by restoring, up to a reasonable level, income
which is lost by reason of inability to work (including old age) or
to obtain remunerative work or by reason of death of the
breadwinner.
1944 (No.67).
The Social Security (Minimum Standards) Convention
Identifies nine areas for social insurance-medical care as well as
benefits in case of sickness, unemployment, old age, employment
injury, family circumstances, maternity, invalidity and widowhood.
1952 (No.102)
The Equality of Treatment (Social Security) Convention 1962 (No. 118)

6
The Employment Injury Benefits Convention 1964 (No.121)
Invalidity, Old-Age and Survivors’ Benefits Convention 1967 (No. 128)
The Medical Care and Sickness Benefits Convention 1969 (No.130)
The Maintenance of Social Security Rights Convention 1982(No. 157)
The Employment Promotion and Protection against Unemployment
Convention
1988(No.168)
The Job Creation in Small and Medium-Sized Enterprises
Recommendation
1998(No. 189)
Maternity Protection Convention (Revised) 2000(No. 183)
Adopted the Resolution and Conclusions concerning Social
Security
2001
Source: (ILO social security and other labour standards.)
As is evident the organizations like ILO have been concerned about the social security for
a very long time. The next section covers what Indian constitution provides for social
security of the citizens.
1.3.4 Social Security as per Indian Constitution
Indian government and agencies included, have social security as their primary agenda
since many years. Ministry of Labor thinks that Social Security protects not just the
subscriber but also his/her entire family by giving benefits package in financial security
and health care. Social Security schemes are designed to guarantee at least long-term
sustenance to families when the earning member retires, dies or suffers a disability. Social
Security system acts as a facilitator - it helps people to plan their own future through
insurance and assistance. The success of Social Security schemes however requires the
active support and involvement of employees and employers and independent earners. As
an earning member, one is a source of Social Security protection for himself and his family.
Employer is responsible for providing adequate social security coverage to all workers.
Social security in a broader sense means the overall security for a person in the family,
work place and society. It should include the ways to ensure that all citizens meet their
basic needs (such as adequate nutrition, shelter, health care and clean water supply), as well
as be protected from contingencies (such as child birth, child care, illness, disability, death,

7
unemployment, widowhood and old age) to enable them to maintain an adequate standard
of living consistent with social norms.
The objective of social security is to ensure the right of every Indian to live a dignified life.
The recognition of social security as a human right represents a connection between needs-
based charities to rights base social justice. As a member of the United Nations, India has
signed the Universal Declaration of Human Rights (UDHR), the International Covenant on
the Economic, Social and Cultural Rights (ICESCR), the Convention on the Rights of the
Child (CRC) and the Convention on the Elimination of all forms of Discrimination against
Women (CEDAW). The right to social security has emerged as human right and India,
under international commitments and obligations, is bound to provide social security to all
citizens equally.
The Constitution of India also provides for the right of equality, the right to life and the
right of social protection. It also guarantees social security measures to workers of the
unorganized sector. The table below lists some of the respective articles from the
constitution of India and the aspects they cover.
TABLE 1-4 : HUMAN WELFARE RIGHTS UNDER THE CONSTITUTION
Rights provided by Constitution of India Corresponding Article
number
Rights to equality 14
Freedom of speech and association 15
Exploitation such as right against traffic in humans and
right against forced labor
23
Right against child labor 24
Right to livelihood 39(a, b and e)
Right to work, education and public assistance in case of
unemployment, old age, sickness and disablement and
other cases of undeserved want
41
8
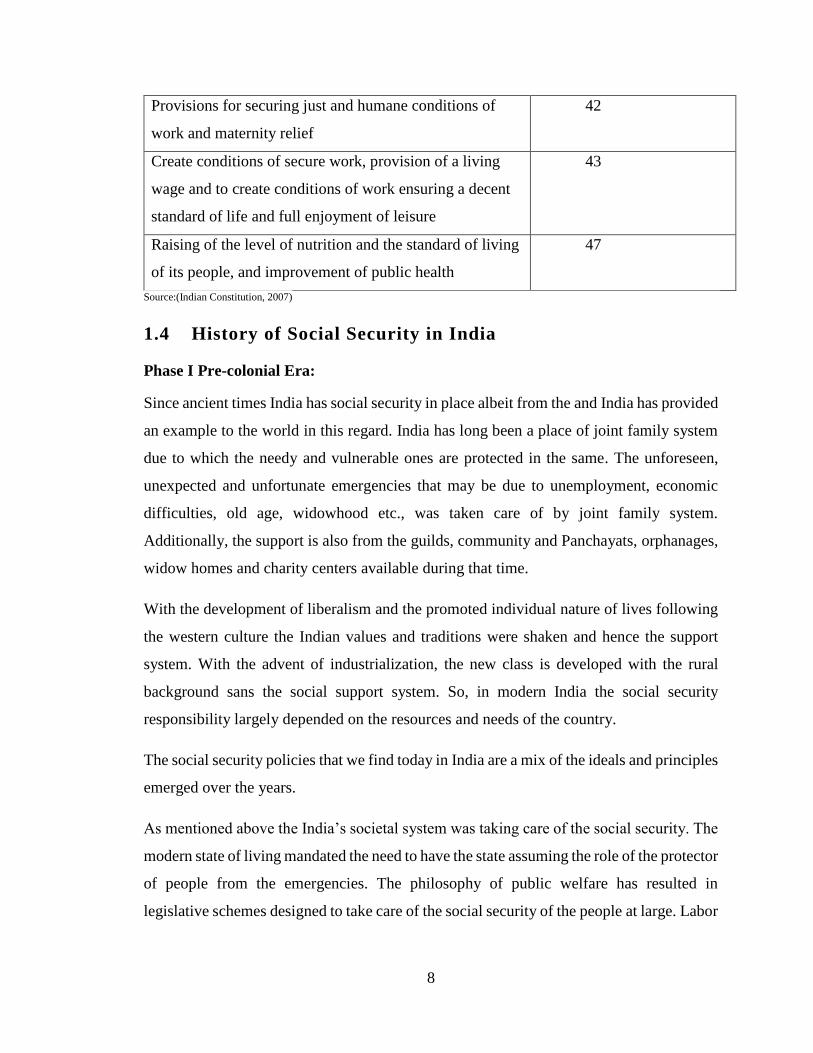
Provisions for securing just and humane conditions of
work and maternity relief
42
Create conditions of secure work, provision of a living
wage and to create conditions of work ensuring a decent
standard of life and full enjoyment of leisure
43
Raising of the level of nutrition and the standard of living
of its people, and improvement of public health
47
Source:(Indian Constitution, 2007)
1.4 History of Social Security in India
Phase I Pre-colonial Era:
Since ancient times India has social security in place albeit from the and India has provided
an example to the world in this regard. India has long been a place of joint family system
due to which the needy and vulnerable ones are protected in the same. The unforeseen,
unexpected and unfortunate emergencies that may be due to unemployment, economic
difficulties, old age, widowhood etc., was taken care of by joint family system.
Additionally, the support is also from the guilds, community and Panchayats, orphanages,
widow homes and charity centers available during that time.
With the development of liberalism and the promoted individual nature of lives following
the western culture the Indian values and traditions were shaken and hence the support
system. With the advent of industrialization, the new class is developed with the rural
background sans the social support system. So, in modern India the social security
responsibility largely depended on the resources and needs of the country.
The social security policies that we find today in India are a mix of the ideals and principles
emerged over the years.
As mentioned above the India’s societal system was taking care of the social security. The
modern state of living mandated the need to have the state assuming the role of the protector
of people from the emergencies. The philosophy of public welfare has resulted in
legislative schemes designed to take care of the social security of the people at large. Labor

9
law which had been once almost a part of private law became part of public law. (Mini,
2009)
Phase II Colonial Era: since Mid-19th Century to 1947
a) From the middle of 19th Century to the end of First World War, the Indian
industrial legislation was in the period of origin. It was through a slow and steady
process that the industrial law took root in India.
Below are the major milestones from the history of the legal initiatives taken in this
regard.
TABLE 1-5 : List of different acts enacted from middle 19 th century to First
World War.
Act
Year of
enactment Details
Apprentices Act 1850
To enable children, learn trades, crafts
and to seek employment by which
when they come to full age, they may
gain a livelihood.
Fatal Accidents Act 1855
To compensate for any losses due to
factory accidents.
Indian Merchant Shipping Act 1859
To regularize the jobs of seaman and
take care of their health.
Employers and Workmen
(Disputes) Act 1860
For faster redressal of the disputes
between employers and workers.
The Pensions' Act 1871
To consolidate and amend the law
relating to Pensions and Grants by
Government of money or land-
revenue.
Indian Factories Act 1881
To ensure the safety and better
working conditions of the labor.
Island Emigration Act 1892
To improve the conditions of
plantations labors.
Indian Mines Act 1901
To secure safe and healthy conditions
of miners.
Source: Compiled by researcher from various sources.
Apparently, all these early legislations were enacted with respect to the specific classes of
industries and did not extend to the entire working class or population for that matter. Most
of the measures adopted were related to railways, shipping, factories, and mines. The

10
advancement of both industries and industrial laws was un-holistic and inadequate. It didn’t
get the kind of focus it deserved from the government and agencies.
This might be the reason for industrial enactments passed during this period happened to
be limited. These were also scattered, non-universal with respect to their coverage, and
hence of minor importance, and hence didn’t address the problem to the complete extent
and provided a half-cooked solution to them.
During and after the First World War period, there had been significant change in the
attitude of state and society towards labor.
Post-World War I
ILO was established in 1919 which aimed at welfare of workers globally. India is a member
since its inception. ILO has adopted many conventions and recommendations casting
different types of liability on industry, Government and labor. Under the Montague-
Chelmsford Reforms in 1919, the central legislature was given definite legislative authority
to enact industrial laws.
Post-World War II
The Government of India Act, 1935 laid down the subjects on which Federal Legislature
could pass industrial laws. During this period, industrial legislation progressed and
underwent a significant change in its nature. These acts gave coverage to major field of
industrial workers, their rights and well-being. These laws are found to be liberal with
respect to their contents and coverage and having far reaching importance and results. This
pointed a change in governmental attitude towards encouragement of worker’s aspirations.
The acts passed during this period were not merely intended for regulating employment in
the industries but attempted to give better conditions of employment like shorter hours of
work, weekly holidays, safety of premises, and payment for overtime, rest period and paid
holidays. All these changes were made mainly due to the emergence of ILO.
Apart from that, after the First World War, India witnessed a rapid rise in nationalism and
the British Government also tried to accommodate and adjust some of the Indian demands.

11
The period of Second World War and after that saw the major changes and development
in the field of social security. The war created a shortage of man and materials that
necessitated increased production and that in turn required greater co-operation from labor.
To ensure this several concessions were made to the working class under Defense of India
Rules. The appointment of Dr. B. Ambedkar as labor member to the Viceroy’s Council
was a positive move in the government’s labor policy. In 1943, a committee called the
‘Standing Labor Committee’ was appointed by Government of India for formulating a
scheme for health insurance for individual workers. Another committee was appointed to
make survey on the position of health conditions and health organizations in existence. The
two ILO publications viz; ‘Approaches to social security-an International Survey’ and
‘Social Security-Principles and Problems Arising Out of War’ highlighted the tendency in
planning social security to bring under a single scheme for assuring maintenance in case of
inability to work and to extend this to all the employees, employed or self-employed, rural
or urban.
The publication of Beveridge Report (1942) in England also had a remarkable impact on
Indian scene. The Government of India made attempts to introduce sickness benefits in
India. About this, the (Employee State Insurance) E.S.I. Review Committee observed:
“Sickness is an important contributory cause of indebtedness with all that debt entails.
Under existing conditions at the time of greatest need the worker may find himself,
destitute of resources, unable to take proper measures to restore his health and in difficulties
regarding even in the means of subsistence.”
Recommendations of the ESI Review Committee (1966) were considered by Government
of India and again referred to provincial governments. In Bombay, the Textile Labor
Enquiry Committee formulated sickness insurance scheme and recommended in its report
that a compulsory and contributory insurance scheme in which the employer, the workers
and the state to contribute has to be put in motion at Bombay and Allahabad initially and
extended to other cotton textile centers in the province. Though the center forwarded such
schemes to states, none was implemented due to lack of interest of the provinces.
Government placed the matter in the First Labor Minister’s Conference held in New Delhi
in 1940 appointed a commission in 1943 under the Chairmanship of Professor B.R.

12
Adarkar. The scheme formulated by him envisaged to cover only perennial factories
belonging to textile engineering, mineral and metal groups of industries. Government of
India requested ILO to depute experts to examine Adarkar Report. ILO deputed M/s.
M.Stack and Rao for evaluating Adarkar Report and they suggested certain modifications
relating to classification of workers, contribution benefits, and the organization of medical
services and financial structure of the scheme.
Phase III Post Independence
In 1947, India became independent and an interim government was formed which caused
greater encouragement to worker’s legitimate ambitions and accelerated harmony in the
industrial relations. The interim government formulated a five-year program for the welfare
of the labor class. Some of the acts and initiatives by the government just after the
independence are as listed below.
On the comprehensive social security front, in 1957 a study group on social security, to
work out a comprehensive social security scheme, was appointed, but their
recommendations could not make any impact. In 1966, a Committee on Labour Welfare
and National Commission on Labour were appointed for examining the functioning of
various welfare schemes in operation in industrial establishments and to suggest
improvements. They submitted detailed reports in 1969. Apart from these legislative
efforts, Committees and Commissions, a key role is seen played by Planning Commission.
The above stated brief history showed that the right of workers including social security
was demanded to be included in the Indian Constitution as fundamental right. Social
security was specially included in List III to Schedule VII of the constitution and it was
made as the concurrent responsibility of the central and state governments.
Soon after the commencement of the Constitution, Five Year Plans were introduced in
India to focus on different issues in a pragmatic and planned manner to better the life of
the people. In 1954, India declared that it adopted a socialistic pattern of society and
reshaped the labor policy.
13
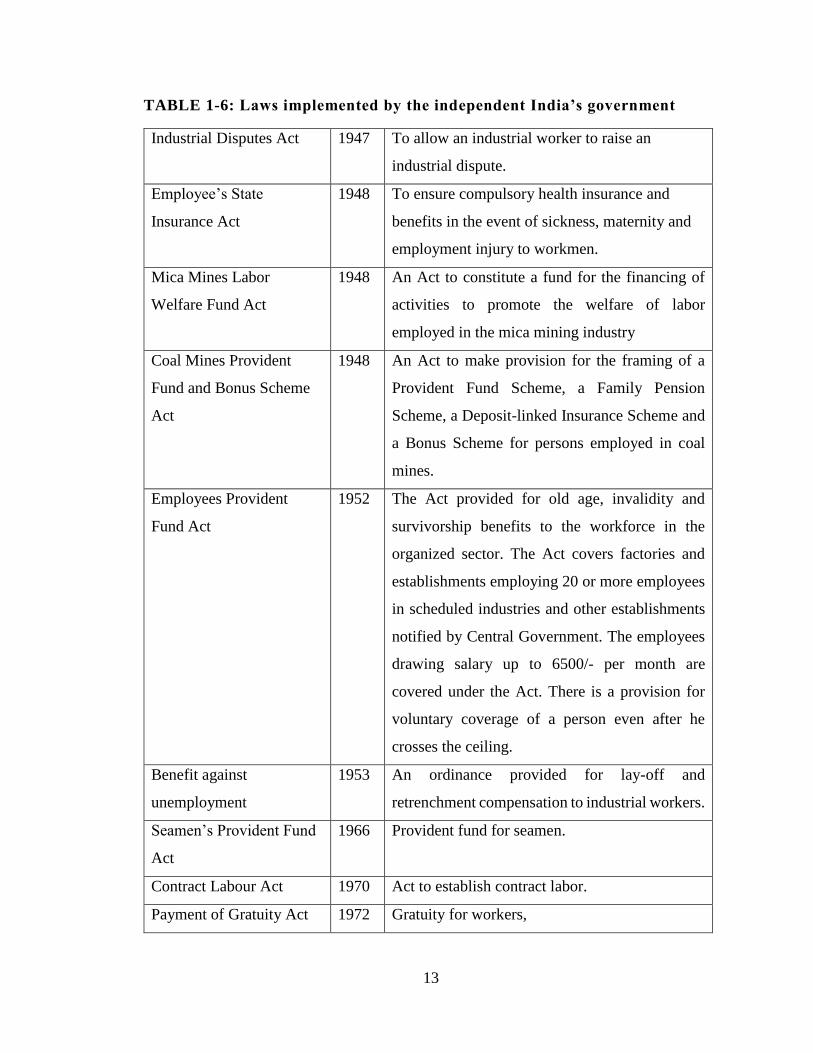
TABLE 1-6: Laws implemented by the independent India’s government
Industrial Disputes Act 1947 To allow an industrial worker to raise an
industrial dispute.
Employee’s State
Insurance Act
1948 To ensure compulsory health insurance and
benefits in the event of sickness, maternity and
employment injury to workmen.
Mica Mines Labor
Welfare Fund Act
1948 An Act to constitute a fund for the financing of
activities to promote the welfare of labor
employed in the mica mining industry
Coal Mines Provident
Fund and Bonus Scheme
Act
1948 An Act to make provision for the framing of a
Provident Fund Scheme, a Family Pension
Scheme, a Deposit-linked Insurance Scheme and
a Bonus Scheme for persons employed in coal
mines.
Employees Provident
Fund Act
1952 The Act provided for old age, invalidity and
survivorship benefits to the workforce in the
organized sector. The Act covers factories and
establishments employing 20 or more employees
in scheduled industries and other establishments
notified by Central Government. The employees
drawing salary up to 6500/- per month are
covered under the Act. There is a provision for
voluntary coverage of a person even after he
crosses the ceiling.
Benefit against
unemployment
1953 An ordinance provided for lay-off and
retrenchment compensation to industrial workers.
Seamen’s Provident Fund
Act
1966
Provident fund for seamen.
Contract Labour Act 1970 Act to establish contract labor.
Payment of Gratuity Act 1972 Gratuity for workers,

14
Building and Construction
Workers Act
1996 Regularizing construction workers.
Source: Compiled by researcher from various sources.
1.3.1 Social Security to the workers in the Organized Sector
In India currently only about 69 million out of a workforce of 460 million have access to
formal social security in the form of old-age income protection. This includes private
sector workers, civil servants, military personnel and employees of State Public Sector
Undertakings. Out of them majority of workers are members of the Employees’ Provident
Fund Organization (EPFO). As such the current publicly managed system in India is
entirely anchored by the EPFO. It may be noted that in the last 50 years, the EPFO has
been in existence, there has been no instance of any scam or a situation where the Fund has
been exposed to speculation and risk. Another important contribution of EPF is now
proposed to extend to the critical life benefit of providing shelter.
As mentioned above that the social security of the formal sector workers is provided
through the instrumentality of EPFO and Employees’ State Insurance Corporation (ESIC).
Social Security to the workers in the organized sector is provided through five Central Acts
namely: -
1. The Employees' Compensation Act, 1923 (WC Act), which requires payment of
compensation to the workman or his family in cases of employment related injuries
resulting in death or disability.
2. The Employees’ State Insurance Act, 1948 (ESI Act) which covers factories and
establishments with 10 or more employees and provides for comprehensive medical care
to the employees and their families as well as cash benefits during sickness and maternity,
and monthly payments in case of death or disablement.
3. The Employees’ Provident Funds & Miscellaneous Provisions Act, 1952 (EPF & MP Act)
which applies to specific scheduled factories and establishments employing 20 or more
employees and ensures terminal benefits to provident fund, superannuation pension, and
family pension in case of death during service. Separate laws exist for similar benefits for
the workers in the coal mines and tea plantations. The Maternity Benefit Act, 1961 (M.B.

15
Act), which provides for 12 weeks wages during maternity as well as paid leave in certain
other related contingencies.
4. The Payment of Gratuity Act, 1972 (P.G. Act), which provides 15 days wages for each
year of service to employees who have worked for five years or more in establishments
having a minimum of 10 workers.
The civil servants’ pension is covered under Central Civil Services (Pension) Rules 1972.
Separate Provident fund legislation exists for workers employed in Coal Mines and Tea
Plantations in the State of Assam and for seamen.
1.3.2 Social Security to the workers in the Unorganized Sector
Approximately 85% of India’s 460 million strong labor forces are categorized as
‘Unorganized sector’ workers. As the National Commission for Enterprises in the
Unorganized Sector (NCEUS)(Report on conditions of work and promotion of livelihoods
in the unorganized sector, 2007) argues, the unorganized sector workforce does not enjoy
three types of social protection –
employment security (no protection against arbitrary dismissal)
work security (no protection against accident and health risks at the workplace)
Social security (health benefits, pensions, and maternity benefits).
In the spirit of extending social security to the unorganized sector and keeping in mind long
term demographic trends which indicate a rapidly ageing population and a non-declining
unorganized sector workforce, the Government of India passed the Unorganized Workers’
Social Security Act (UWSSA) in 2008. The passage of the UWSSA also tied in with the
introduction of several publicly provided, social security schemes in the insurance and
pension sectors, the three predominant schemes being
Rashtriya Swasthya Bima Yojana (RSBY), a national health insurance scheme
largely for the below poverty line population;
Aam Aadmi Bima Yojana (AABY), a life insurance scheme;
National Pension Scheme(NPS), Pension Schem
16
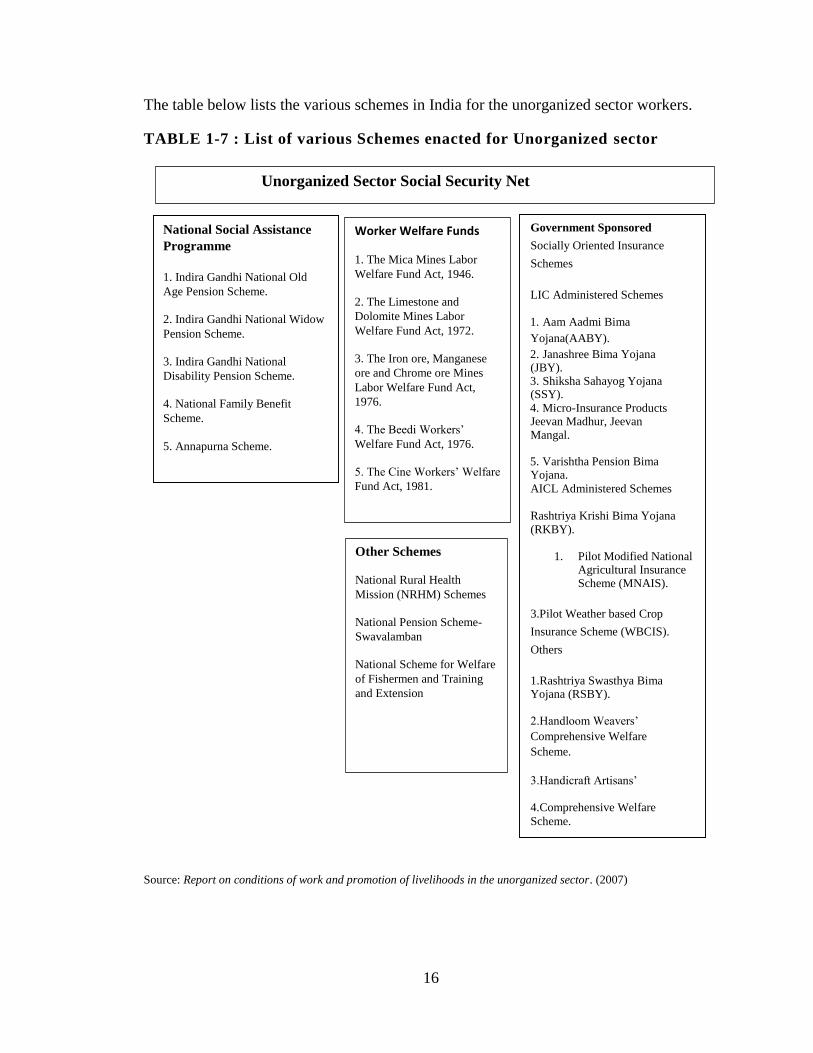
The table below lists the various schemes in India for the unorganized sector workers.
TABLE 1-7 : List of various Schemes enacted for Unorganized sector
Source: Report on conditions of work and promotion of livelihoods in the unorganized sector. (2007)
Unorganized Sector Social Security Net
National Social Assistance
Programme
1. Indira Gandhi National Old
Age Pension Scheme.
2. Indira Gandhi National Widow
Pension Scheme.
3. Indira Gandhi National
Disability Pension Scheme.
4. National Family Benefit
Scheme.
5. Annapurna Scheme.
Worker Welfare Funds
1. The Mica Mines Labor
Welfare Fund Act, 1946.
2. The Limestone and
Dolomite Mines Labor
Welfare Fund Act, 1972.
3. The Iron ore, Manganese
ore and Chrome ore Mines
Labor Welfare Fund Act,
1976.
4. The Beedi Workers’
Welfare Fund Act, 1976.
5. The Cine Workers’ Welfare
Fund Act, 1981.
Other Schemes
National Rural Health
Mission (NRHM) Schemes
National Pension Scheme-
Swavalamban
National Scheme for Welfare
of Fishermen and Training
and Extension
Government Sponsored
Socially Oriented Insurance
Schemes
LIC Administered Schemes
1. Aam Aadmi Bima
Yojana(AABY).
2. Janashree Bima Yojana (JBY). 3. Shiksha Sahayog Yojana (SSY).
4. Micro-Insurance Products Jeevan Madhur, Jeevan Mangal.
5. Varishtha Pension Bima Yojana.
AICL Administered Schemes
Rashtriya Krishi Bima Yojana
(RKBY).
1. Pilot Modified National Agricultural Insurance Scheme (MNAIS).
3.Pilot Weather based Crop
Insurance Scheme (WBCIS).
Others
1.Rashtriya Swasthya Bima Yojana (RSBY).
2.Handloom Weavers’
Comprehensive Welfare
Scheme.
3.Handicraft Artisans’
4.Comprehensive Welfare
Scheme.
17
While these schemes represent an important step forward in India’s ability to provide
adequate, reliable, and affordable social protection options for its vulnerable population,
they still suffer from considerable weaknesses.
1.5 Objectives of the study
Understand and analyze the existing most-relevant social security schemes in the areas
of Life Insurance, Health insurance, Old age pension and Maternity benefit.
Propose consolidation and universalization of the schemes where needed.
Alleviate implementation complexities and streamline the implementation of various
schemes
To come up with alternate proposals and also figure out the premium rates and
contributor of the premium.
With respect to the above-mentioned objectives estimate the Government’s financial
commitments and burden.
1.6 Significance of Study
Social security has different components in different forms adopted by different
civilizations, societies and countries based on geographical, demographical, the
socioeconomic conditions and temporal context. The main components that have been
more or less common were derived from the fact that most vulnerable population should
be protected from uncertainties. The vulnerable section of the society depending on age,
occupation and gender plays a major role in the criteria of the social security schemes. As
evident from section 1.4 that initially the idea was to provide protection to area specific
population or people involved in specific occupation. But that became the biggest weakness
in terms of universalization of social security schemes. Initially the scheme has been
targeted to occupation specific individuals and those serving in organized sector and that’s
probably because the government was not capable of providing protection to the whole
population using its own resources. The government of independent India in due course of
time went ahead in identifying the vulnerable group of society without restricting them
based on occupation for for example Maternity benefit as one of the schemes independent
of any criteria. Based on the initiatives taken by India in the past and the evidence collected

18
from social security schemes from different countries we have concluded to have four main
pillars to be included under social security umbrella for example Life Insurance, Health
Insurance, Old Age Pension and Maternity Benefit. These are the four major areas that are
found to be the most eligible for universalization. If these are universalized; major purpose
of social security would be served. So, we have included these as the scope of this study.
1.7 Data Sources
Study uses the secondary data, reported in various official statistics for evaluation, analysis
and analytical framework. Below are the sources of data used in different contexts in the
study:
This study uses the census 2011 population data published by the Office of the
Registrar General & Census Commissioner, India.
Death rates are taken from Indian Assured Lives Mortality (2006-08) Ultimate
published with the concurrence of IRDA vide its letter dated 20th February 2013.
Health Insurance claim probability and average claim amount has been taken from
Health Insurance (Non-Life) Data Analysis Report published by Insurance Information
Bureau of India(https://iib.gov.in/IIB)
For the calculation of old age pension benefit, the actuarial tables, published by the
Actuary Society of India, are used.
Government’s budget is taken from RBI publications.
1.8 Research Methodology
This study addresses the following points corresponding to the different category of
schemes currently going on:
Life Insurance: To cover the entire population, we propose to use the death rate age-
wise and come up with the premium with the granularity i.e. for individual age group.
To assess the budgetary load on the government, calculate the total cost of the benefit.
Health Insurance: To cover the entire population for health insurance we have
considered the age-wise distribution of the population, the claim probability for each

19
age and the average claim amount for each age and calculated the total budget to pay
the claims and the budgetary load on the government.
Old Age pension scheme: Universalization of the old age pension scheme of the
government by determining the contribution of the individual as well as of the
government for fixed pension benefit.
Maternity Benefit insurance: Calculate the total cost of paying the maternity benefit for
the child bearing female population.
1.9 Scope of the Study
This study considers the main four components of the social security that covers the most
critical vulnerabilities of the life of an individual:
Life Insurance
Health Insurance
Old Age Pension
Maternity Benefit
1.10 Thesis Outline
Chapter 1 gives an introduction and an overall picture of the study which includes the
summery of study, statement of research problem. We have also taken the opportunity to
introduce the term Social security with its evolution and chronological historical
background in the same chapter. Data source and research methodologies followed in the
study are also mentioned.
Chapter 2 reviews the literature related to the subject. In this chapter we have listed down
the excerpts from various sources which we have referred during the course of research.
These references have helped in various aspects of our research for example understanding
the components of social security, the scenario with respect to different countries and in
India
Chapter 3 reviews the experiences of existing social security programmes of selected five
countries and India. The review of relevant existing security schemes in India with respect
to Life Insurance, Health Insurance, Old Age Pension and Maternity Benefit and critically

20
evaluates the schemes and identifies the gaps thereof. These analyses of social security
schemes have some justification from the viewpoint of democracy.
In chapter 4 we have proposed new product design for comprehensive social security,
based on the critical evaluations in earlier chapter. We have calculated the cost of life
insurance benefit for the entire population. Health insurance, which is another the most
important component of proposed comprehensive social security. The cost is calculated
based on the claim probability and average claim amount for the whole population in India.
For Old age pension benefit, the financial cost of the program is calculated based on current
available benefit in the Atal Pension scheme. The overview of JSY (Janani Suraksha
Yojana) is explained for the maternity benefit and the expansion of current scheme to all
fertile female population up to two children.
Chapter 5 presents the conclusions drawn by comparing the budgetary load with the
country’s budget to understand the feasibility of the proposals. Individual cost is calculated
and also calculated the cost for providing the benefit to the entire population is presented
in this chapter. Questions of budget constraints are also addressed.
Chapter 6 provides the findings of the thesis, limitations of the approach and concluding
comments are provided in this section.

21
Chapter 2
Review of Literature
2.1 Introduction
Review of social security schemes of selected countries of the world.
Review existing social security schemes in India.
Reviews of relevant literature from authors, economists and researchers on social
security.
As mentioned above, in India, in keeping with its cultural traditions, family members and
relatives have always taken care of shared responsibility towards one another. This is often
the best relief for the special needs and care required by the elderly and those in poor health.
However, with increasing migration, urbanization and other demographic changes, there
have been a decrease in joint family units and increase in nuclear families. This is when
the need of a formal system of social security gained importance.
Social security schemes in India provide the benefits that are need based. They are intended
to prevent deprivation, assure the individual of a basic minimum income for himself and
his dependents and to protect the individual from any uncertainties. The state bears the
onus of developing an appropriate system for supporting the people especially the
workforce. It’s intended to help facing the challenges of modernization and the changes in
social and demographical changes in the society.
As the paper (Pillai, 2011) mentions that the social protection programmes in India can be
broadly categorized as
a. Improving living standards of the poor - programmatic framework,
b. Targeted social security programmes for the very poor,
c. Social security measures for unorganized/informal sector workers and
d. social security measures for organized/formal sector workers

22
This chapter provides a survey of extant literature on universalization of social security.
As mentioned earlier, the scope of the study confined to the four pillars of social security
viz. Life insurance, health insurance, maternity benefits and pensions.
The main aim of the thesis is to examine the feasibility and sustainability of
universalization of social security in India. The literature on social security encompasses a
vast area including public policy, public finance, actuarial science, economics and finance.
The “universalization “of social security and its financial feasibility is the subject matter
of discussion, for this study. Hence the literature review focuses on:
1) Theoretical and empirical literature on definition of universalization of social security,
desirability of universalization of social security
2) The recommendations of seminal reports on universalization of social security by
international bodies like ILO and committees in India.
The first section of this chapter presents the academic literature on universalization of
social security. The third section summarizes the findings of various committees on social
security as a public policy to alleviate poverty.
2.2 Universalization of Social Security: Concept and
Definition
The recent literature on social security reveals certain distinct trends. First, there is a broad
definition of 'all people', as the target group. The ILO in its definition of social security
defines the target group as "the members of society", ILO (2011). Dreze and Sen discuss
social security for "humanity”, Dreze and Sen (1991). It is generally acknowledged that
social security should cover all. The real thrust of most literature on social security is to
analyze present coverage and to prescribe the means to meet the need of workers in the
unorganized sector. These workers do not have steady employment, secure or sustainable
incomes and are not covered by social security protection. In recent years, however, there
has been an awakening of interest among policy- makers and academics on the one hand
and a demand from unorganized sector workers themselves on the other, for economic and
social security. The large gap between rich and poor, unorganized and organized workers,
and developed and developing countries has led to various types of attempts at providing
23
social and economic security aimed at bringing some protection to the unorganized sector
workers to narrow the gap.
This is an important issue because, both in Indian policy-making, and in the literature on
social security there is no unanimity on the target group. In fact, the literature seems to be
leaning away from the concept of social security for 'workers' or 'producers' and towards
the 'poor' or the 'deprived' as a category to be covered. The new schemes in India, too, are
moving away from the category of 'worker' as the beneficiary of the schemes and towards
the 'poor and needy'. The definition of the beneficiary is not an academic question since it
affects the benefits of the scheme, its financing, its management and its control.
The ILO (2000) has defined two broad groups according to the type of social security by
which they are covered:
social insurance -Social insurance covers workers of various categories;
social assistance -social assistance covers persons with various disabilities - old
age, sickness.
The two categories are of course not mutually exclusive as a worker may develop a
permanent or temporary disability; and a person with a disability may also be a worker.
In the present context of social security in a developing or poor country, Indira Hirway
(1995) makes roughly the same categorization of the target group - namely, "workers" and
non-workers such as "the old, disabled and destitute, who need social protection very
badly".
Dreze and Sen (1991) have a broader categorization of 'deprivation', the target group are
the 'deprived', whereas both Atkinson and Hill (1991) and Getubig and Schmidt (1992) see
the target group as the 'poor'. Getubig and Schmidt further break this down into various
categories, some of which are work categories and some which describe vulnerability, as
follows. Rural: Small-scale farmers, small-scale fishermen, landless laborer’s, women
headed households, and disadvantaged minority groups. Urban: Petty traders/street
vendors, micro- entrepreneurs, casual and daily wage workers (construction, carpenters,

24
artisans), home- based workers (in food processing; subcontracting), domestic servants,
and other small-scale self-employed.
There is, in the literature, an oscillation of all definitions of target groups between work
definitions and vulnerability definitions. The work definitions include categories such as
'unorganized sector workers', 'informal sector workers', or groups such as 'home-based
workers', 'casual workers', 'small farmers', etc.
The vulnerability definitions include categories such as 'the deprived 'the poor'.
‘Social Security, the Economy and Development’, edited by James Midgley and Kwong-
Leung Tang, (2008) reminds the importance of a sound social security system to the
economic security of vulnerable populations in both developed and less developed
countries. In this book, Tang and Midgley define social security broadly as “programmes
that provide for the maintenance of income when specific contingencies arise or otherwise
supplement the incomes of those who experience particular needs or demands on their
income” .He summarizes the arguments, put forward by(R M Titmus,1973), that social
security benefits should serve welfare and humanitarian goals, Although contemporary
neoliberal economic views: programs transfer resources from productive to unproductive
sectors, lowering market efficiency; provide disincentive to work; distort labor markets;
and eventually harm economic growth. Thus, instead of economic purposes, considered
social security is economically harmful.
Desirability of Universalization of Social security
The committee report (Mor & Ananth, 2007) says that the need of inclusive financial
growth and says that besides facilitating overall economic growth, finance can help
individuals smoothen their income, insure themselves against risks and broaden investment
opportunities. Empirical evidence shows that inclusive financial systems significantly raise
growth, alleviate poverty and expand economic opportunity. This paper goes on to lay out
several principles that should be kept in mind when designing such systems.
(Pryor, 1968) says that virtually all advocates of the narrow social control perspective
ignore the fact that most social security programs are universal among urban, industrial
societies. That is, programs that provide at least a minimum level of income support (via

25
disability insurance, old age pensions, rent subsidies, family allowances and health
insurance or service programs) are found in all capitalist, socialist, and communist forms
of modern society.
Social security for all Indians edited by Wouter van Ginneken;1998 says that “Extension
of formal social insurance is not the answer to the need of social security.
(Jaishanker Memorial Centre,1993; Patel,1993; Wadhawan,1989;) says that in addition,
Social assistance-Financed by Government revenue and targeted to the poor-will have to
be developed (Guhan 1993 and 1994), as well as social insurance schemes specially
designed for unorganized workers (for instance Gupta,1994b; Subrahmanya,1994a)”.
Since major part of Indian population was not covered by social security protection. On
the request of Ministry of Labor, the ILO undertook a UNDP (United Nation Development
Program) financed mission on ‘Social protection for the unorganized sector’ and produced
a report with extensive recommendations (ILO-South Asia Advisory Team,1996a).
In the article (Duggal, 2006) says that it is important to understand that a fragmented
approach to social security makes it non-sustainable and hence need a rethink and pursue
the option of categorizing the workforce under a common social security umbrella and also
include the nonworking population to achieve a comprehensive universal system of social
security.
In the paper (Norton, Conway, Foster, & Expenditure, 2001) defines the social security
and establishes reasons for the need of social security across the cross section of the society.
The problems covered under social security and the way they are covered. It has given
recommendations to provide effective coverage.
Employment-based social insurance schemes typically provide coverage against
unemployment, inability to work due to injury or ill health, and, ultimately, old age (in the
form of pensions). Workers in the informal sector are not effectively involved in statutory
social insurance schemes, for several reasons mentioned below:

26
Firstly, premiums are beyond the financial reach of most of the poor. The problem
is not only that total contribution requirements are too high, but that they do not
take account of the variable income patterns of the poor.
Most social insurance is based upon the principle of a ‘replacement wage’, with
benefits paid at a set proportion (perhaps 75%) of the income lost due to inability
to work. It is hard to define what the replacement wage should be for informal
sector workers, particularly casual labourers, given the great variability in wages
from one week or month to the next.
Informal sector employers are generally outside the web of routine state
surveillance and regulation.
The discussions on universalization are incomplete without the consideration of
unorganized sector or informal sector workers due to the increasing proportion of
unorganized sector employment. NSSO carried out a sample survey in 1999-2000 and its
results showed that out of total workforce of 397 million, only 28 million workers are
employed in the organized sector and remaining in the unorganized sector. It reveals that
over a decade, the employment in the organized sector has been almost stagnant or slightly
declined compared to the previous decades
The study (Gumber, 2002) says that workers in the informal sector do not get health care
benefits, paid leave for illness, maternity benefits, insurance, old age pension, and other
benefits though the informal sector constitutes around 90% of the workforce. It also
reviews the current schemes in India and the other countries. It shows that the people in
the informal sector are not covered by any type of social security protection, i.e. either by
a contribution-based insurance scheme or by any social assistance scheme.
(Kalyani, 2016) mentions that about 370 million workers constituting 92% of the total
workforce in a country were employed in the unorganized sector as per NSS Survey 1999-
2000. It plays a vital role in terms of providing employment opportunity to large segment
of the working force in the country and contributes to the national product significantly.
The contribution of the unorganized sector to the net domestic product and its share in the

27
total NDP at current prices has been over 60% and hence the claim to provide protection
to this section of the society cannot be ignored.
In the paper (Jhabvala, 1998) the author advocates the need of a social security system for
unorganized workers. It went on to suggest that every individual in the society (including
house maker women) has at some point of time, contributed to the society and hence can
be termed as a productive worker and hence to be covered in some form or other of social
security. It also suggests that the programs could be categorized under two categories
namely social security (for active workers) and social assistance (for persons with
disability). Hence this paper explores these possible mechanisms for social security
provisions: insurance, social security funds and state supported child care.
In this paper(Balamurugan, 2015) Reviewed the schemes for unorganized sector and
highlights the problem areas of the social security schemes such as:
Fragmented Ownership Structure and Lack of Coordination
Wide Disparities in the Coverage of Social Security Schemes
Low Levels of Product Innovation, Development and Learning
Problems with Identification of Beneficiaries
Multiple Window Architecture
The study concludes that the social security initiatives of the Centre, and State indicated
that the needs are much more than the supports provided. We must create a setup
where all the people could maintain an adequate standard of living consistent with social
norms.
2.3 Scope and Target of social security
As established above that there is a need to provide social security in an organized way and
more by way of universalization so that all the vulnerable sections of society are covered
without any scope of ambiguity. Social security encompasses various types of schemes in
different countries. And the definitions have also been changing and adopted by them.

28
In case of developed countries where social security is generally seen in terms of specific
public programmes involving social assistance, social insurance, and redistribution
(Atkinson 1989; Kotlikoff 1987). For developing countries, the fact that few programmes
of this type exist, and those that do often have low or poorly directed coverage (Midgley
1984; Puffert 1988), suggests that a definition along these lines would be too narrow.
Increases in social security may arise in ways which are not simply enacted or imposed by
government. A definition based on State programmes fails to consider household and
community contributions and their interactions with State provision and may miss the
important role of public pressure (Drèze and Sen 1989; Bardhan 1988; Lewis et al. 1988).
Even within the sphere of State action, there is no clear indication that social security in
developing countries should take the same form as it has taken in developed countries.
Given the greater problems of insecurity, limited administrative resources, and tightness of
budget constraints in developing countries, doubts have been expressed as to whether
conventional social security measures are operationally tenable or financially viable.
The ILO’s Conventions on social security adopted before the Second World War have been
revised and superseded by new and more comprehensive Conventions, providing a
distinction between the ‘social insurance era’ and the ‘social security era’ during and after
it (Otting 1993).
The ILO conventions on social security are the main reference for the content and
components of this right to social security. The ILO Convention No. 102, Social Security
(Minimum Standards) Convention of 1952, has played an important role in the extension
of social security. Convention No. 102 covers primarily covers the following:
Sickness benefit,
Old-age benefit,
Maternity benefit,
Survivors’ benefit.
Old age benefit or Pension benefit has been one of the major components recommended
and focused upon in many countries.(C.D.Daykin, 1996) mentions that there is currently
an enormous level of interest, in many countries around the world, in encouraging the
development of complementary pension schemes, or in putting in place a new framework

29
for such schemes. They are increasingly seen as being an important part of the solution of
problems facing social security schemes, which include the rapid ageing of populations,
over-generous benefit promises, and unduly low retirement ages and, in some cases,
restricted coverage, inefficient administration and problems of contribution collection.
Complementary pension schemes are also seen as having an important part to play in
economic development, in support of privatization programmes and as generators of capital
investment.
The paper by (Laaser, 1967) recommends that the Extension of social protection in health
is a key strategy to remove financial barriers to health services and to protect people from
the impoverishing effects of catastrophic health expenditures, thereby reducing poverty.
The healthcare financing system has a direct impact on the accessibility of care for people
in need. Poor access to health services rapidly leads to poverty and smaller future chances
for a decent standard of living.
Article 9 of the International Covenant on Economic, Social and Cultural Rights
(“International Covenant on Economic, Social and Cultural Rights,”). provides that the
right to social security encompasses the right to access and maintain benefits, whether in
cash or in kind, without discrimination in order to secure protection, from (a) lack of work-
related income caused by sickness, disability, maternity, employment injury,
unemployment, old age, or death of a family member; (b) unaffordable access to health
care; (c) insufficient family support, particularly for children and adult dependents.
Historically in India the schemes initiated, albeit in a segmented manner, covered factory
employees.(Cohen, 1953) indicates that the first major social security program in south-
east Asia came into operation in India on February 24, 1952. The program, which was
initiated on a limited basis, covered about 2.5 million factory employees. The Employees’
State Insurance Act, which established the program, provided for medical services,
continuing cash benefits due to employment injury or death, cash sickness benefits during
periods of wage loss, and cash maternity benefits. So, these four benefits have always been
the focus of the Indian government and hence the social security programs have always
been designed and implemented around the same.

30
While the social security model of developed nation can be followed by the developing
nations but the paper (Ehtisham Ahmad, 2015) says that not all of the policies used in
developed countries are relevant for developing countries. Thus, administrative constraints
and the effects on incentives to work dictate that unemployment insurance may be
inappropriate even in the more advanced developing countries with established formal
programs. The paper suggests that the schemes targeted towards sick and old people should
be given priority.
The size of the resource base is critical and for this reason it is essential to examine how
different social-security schemes interact with the tax system, other governmental
programmes, and informal support (Ahmad 1989). Despite numerous calls for formal and
informal social-security systems to reinforce each other (Midgley 1984), there is little
research on the relationship between the two (Cox and Jimenez 1989).
Targeting has recently come to be seen as a major mechanism by which costs can be
contained whilst still providing government assistance to those in need (World Bank 1986,
1988b), and a spate of mainly theoretical papers reflect the perceived importance of this
issue (for example, Besley and Kanbur 1988; Besley 1989; Glewwe 1989; Kanbur 1988;
Nichols and Zeckhauser 1982; Ravallion and Chao 1988). Irrespective of the measure
which a government chooses to adopt (Ahmad 1989; Weisbrod 1988), it is confronted by
a basic dilemma which arises when it tries to provide assistance. If, on the grounds of equity
with respect to some service, or on the grounds of rights, it tries to make the service
available to all people then the costs are likely to be very high and there will be several
‘non-deserving’ beneficiaries. On the other hand, if a stringent selection procedure is
imposed this will increase the probability that deserving individuals are excluded.
Targeting refers to procedures designed to concentrate provision on those individuals who
are deserving or needy. There are also important arguments for and against targeting which
are based on the need to gather political support for programmes. This can lead to
arguments for universal entitlement.
So, in totality it’s a focus-seeking area to include all the needy or otherwise deserving
population as the beneficiary to have a wider coverage of the social security schemes and
the issue of universalization is addressed.

31
2.4 Who should provide the social security?
After deliberating over the justification of the need of social security and establishing what
might be the components of it we also need to know who the provider of the social security
should be especially the contributor of the premiums or claims of the insurance schemes to
enable the social security.
In 2001 the International Labour Conference, composed of representatives of States,
employers, and workers, affirmed that social security is a basic human right and a
fundamental means for creating social cohesion.
Article 9 of the International Covenant on Economic, Social and Cultural Rights (the
Covenant) provides that, ‘The States Parties to the present Covenant recognize the right of
everyone to social security, including social insurance.’ The right to social security is of
central importance in guaranteeing human dignity for all persons when they are faced with
circumstances that deprive them of their capacity to fully realize their Covenant rights.
Contributory or insurance-based schemes such as social insurance, which is expressly
mentioned in article 9, generally involve compulsory contributions from beneficiaries,
employers and, sometimes, the State, in conjunction with the payment of benefits and
administrative expenses from a common fund; Non-contributory schemes such as
universal schemes (which provide the relevant benefit in principle to everyone who
experiences a particular risk or contingency) or targeted social assistance schemes (where
benefits are received by those in a situation of need). In almost all States parties, non-
contributory schemes will be required since it is unlikely that every person can be
adequately covered through an insurance-based system.
The composition from (Saul, Kinley, & Mowbray) says that the right to social security
requires, for its implementation, that a system, whether composed of a single scheme or
variety of schemes, is available and in place to ensure that benefits are provided for the
relevant social risks and contingencies. The system should be established under domestic
law, and public authorities must take responsibility for the effective administration or
supervision of the system to ensure the schemes are sustainable.

32
The chapter in the material (Ehtisham Ahmad, Jean Drèze, John Hills, 2014) book helps to
understand the term social security with respect to problems in developing countries. It
also recommends that the State should be involved in social security and provide reasons
for intervention of the government. It looks at issues concerning rights of individuals, and
State obligations in that respect, and at the concept of standard of living and the role of the
State in improving it.
Most developed countries have government-operated or - supported programmes to
provide all or most of the following: old-age pensions; unemployment benefit; family
income support; facilities for the infirm or disabled; education; and health services
(Atkinson 1989; Barr 1987). The mechanisms, eligibility, entitlements, coverage,
administration, and levels of benefits vary greatly, but nevertheless there is a considerable
degree of support for those who may suffer deprivation or adversity.
The papers (E Ahmad, Drèze, Hills, & Sen, 1991) (Ehtisham Ahmad, 1991) suggests that
to some extent, the social security programs as well as social insurance schemes may be
financed by contributions and by pooling risks across generations and groups. But
minimum noncontributory pensions targeted solely by age would need to be funded
through general revenues. There is an urgent need to provide an effective safety net for the
poorest in societies ranging from socialist countries undergoing reform to Sub-Saharan
African economies. This study examines social security systems in industrial countries and
explores their relevance to developing countries
The paper (Ozawa, 2015) discusses that social security is not a private insurance program
but a public mechanism to transfer income from the working population to groups of people
who are afflicted by risks identified under the law. It says that social security, as one type
of social insurance, has dual missions to accomplish: one to replace a part of earnings loss
due to social and economics hazards identified under the law, and the other to provide an
adequate floor of income.
The paper (Norton, Conway and Foster, 2001) relates to the role of the state and other
institutions in the provision of social security in developing countries. The financial

33
constraints faced by most developing countries imply that social security provision should
have both civil and public dimensions.
As mentioned by Cerda (Cerda, 2005) that in Financial crisis in social security programs
might be endogenous because social security affects fertility and human capital’s decisions
and thus, the aggregate growth rate of the economy. These effects lead to an endogenous
erosion of the financial basis of the Pay-as-you-go a.k.a. PAYG social security program so
that, as a consequence, the PAYG system is not sustainable and it requires continuous
increases in the social security tax rate.(Cerda, 2005).The main idea of the paper is that the
social security financial crisis, at least a part of it, is endogenous to the system. The paper
explains PAYG financial crises by extending previous results concerning the relation
between social security, fertility and growth - see Becker et al. (1990), Cigno (1992,1995),
Ehrlich and Zhong (1998), Nishimura and Zhang (1992), Veall (1986), Zhang (1995),
Zhang and Zhang (1995,1999) and Wigger (1999).
The article by (Ehtisham Ahmad, 1991) tries to evaluate the social security of the poor in
the developing world. This article provides deep insights about the issues which arise in
the developing nations while providing the social security to the poor. The author points
out that the main objective of social security to protect the poor and vulnerable during their
difficult situations and support them through community welfare or public action. The
author also points out that to implement the social security strategies used by industrial
countries in the developing world is not much relevant due to difference in the economies.
In case of developing countries according to author, Self-selecting employment schemes
can provide a basic safety net and also be designed to retain workers and add to productive
infrastructure. Formal programs to protect vulnerable groups, such as the sick and the aged,
are also likely to have positive long-term consequences, reducing uncertainty and lessening
the demand for larger family. These programs and schemes should be based on community
arrangements and financing could be done by the Local Level Government Bodies.
(Cox & Jimenez, 1992) studies the relationship between social security and private
transfers in developing countries by taking the case of Peru. Using the Peruvian Living
Standards Survey the study finds out that the social security system is less effective in terms
of delivering the benefits to the elderly crowd as private transfers from young to old were

34
20 percent higher without social security benefits. Finally, the author concludes that the
Peruvian Government needs to consider the private transfer effect while implementing the
policies for social security.
The study by (Gupta, 2011) discusses about the universalism of health care. Providing
health care, a service commonly to all has been discussed both at national as well as
international level and many debates are taking place regarding the same. The author
discusses approaches considered regarding how to provide these health care services. First
approach is promoting commercial sector for financing and provisioning for achieving
universal access to health care. Second approach discussed is through public financing and
private provisioning. The third approach refers to public spending and State provisioning.
All these above approaches are based on financing structures. The experience of several
middle and low-income countries with social insurance mechanisms for ensuring universal
access, such as in Brazil and Thailand, has demonstrated that it does not meet the objectives
of universal access. These countries have, therefore, moved to direct tax-based financing
of provisioning of services. The us experience of private insurance with targeted, publicly
funded social insurance and private provisioning shows how it drives up costs of care,
raises issues of moral hazard, does not lead to comprehensive care and is exclusionary. The
author also points out that though whatever efforts are taken to implement the universalism
access still they fall short against the requirement and suggests that more grounded and
contextually rooted approach to healthcare systems development will become possible
soon as all will engage in transparent public discussion on the issue.
The safety net programmes, which are designed with three main purposes, protection (ex
post), insurance (ex-ante) and poverty alleviation, offer help to households during a period
of crisis. The study by (Dev, Subbarao, Galab, & Ravi, 2007), evaluates the efficiency,
awareness, participation, targeting and distributive outcomes of these programmes, based
on household/village-level surveys conducted in Orissa, Madhya Pradesh and Karnataka.
In addition, the article pays special attention to the functioning of village-level institutions
and social capital. Besides giving an overview of the risks and shocks faced by households
in these states, the article shows that the current safety net programmes do not seriously
address the health risks. The main findings were that the success of the safety net

35
programmes depends upon its institutional implementation which includes the local
government bodies (PRIs). The household literacy level and cohesiveness among women
are also the factors which contribute to effectiveness of such programmes. Another major
finding was that there is a significant caste discrimination against SC/ST and minorities
due to poor governance and lack of awareness among the tribal. Risk patterns vary by
states, quartiles and social classes. The proportion of households that experience a health
risk is much higher among the poorest quartile than for other quartiles, higher among
scheduled castes and tribes than among other castes, and higher in Orissa than in other
states. The study limits to four programmes namely PDS, AAY, SGRY and FFW. The
policy implications suggested by the author were, immediate policy initiatives need to
focus on improving the productivity of existing programmes by encouraging PRI
institutions at the village level to promote awareness of programmes among poor
households and especially correct the observed serious exclusion. The outreach of
programmes to the poor must be tightened via improvements in approaches to targeting (so
as to avoid inclusion errors), launch new programmes to cover uncovered risks (especially
health risks). Most importantly the PRI institutions should be made accountable for better
functioning of safety net programmes with possible external oversight, and work towards
synergy between programmes and policies launched by the center and states to avoid
duplication of efforts.
The article by (Kothari, 2014), talks about how important the implementation of right to
social security is for developing countries. Lot of programs has been implemented in India
in providing social security. Providing social security in terms of basic facilities like food,
livelihood and education and other basic rights and not only in terms of income is the goal
currently. The author points out that huge effort needs to be taken to increase the coverage
of social security systems and reaching the needy and unreached.
(Tangcharoensathien et al., 2010) studied health financing reforms in seven countries in
Southeast Asia which were into expanding pooled health finance and take a step towards
universal coverage. The countries which are resource poor mostly rely on donor agencies
for providing health facilities. Fiscal space and mobilization of payroll contributions are
both important in accelerating universal coverage. The major lessons from this study are

36
there is a need to strengthen the primary health care as geographical access is a major
constraint. Financial risk protection such as user fee exemption for the poor, effective
identification of the poor and adequate subsidies to the poor can protect from financial
catastrophe. The poor are adequate protected through tax schemes and thus partially
subsidized schemes should be designed for the informal sector. Similarly the discussion
paper by (van Ginneken, 2003) reviews the four main social security programmes, i.e.
health insurance, pensions, unemployment protection and tax-based social benefits and
outlines some key elements of different strategies which can be implemented at national
and international level.
(Carrin & James, 2005) highlights the importance of the socioeconomic and political
context, particularly in relation to the level of income, structure of the economy,
distribution of the population, ability to administer and level of solidarity within the
country, but also stresses the important stewardship role government can play in facilitating
the transition to universal coverage via social health insurance. The author finds out that
several factors were judged crucial in facilitating this transition: the level of income, the
structure of the economy, the distribution of the population, the country’s ability to
administer Social Health Insurance, and the level of solidarity within a society. It is
essential that policymakers take these factors into account and try to use them as policy
levers. Improving administrative capacity and fostering a sufficient level of solidarity are
among those factors that can be impacted upon more directly via government stewardship.
Thus the article is concluded by mentioning that, while experience demonstrates that Social
Health Insurance development in a particular country to a large extent depends on that
country’s own specific socioeconomic and political context, experience also shows how
the transition to universal coverage is dependent on the government’s stewardship of the
health system.
2.5 Summary of critical evaluation of the current social
security schemes in India
Initiation of most of these schemes was done in an ad hoc and segmented manner based on
the initiatives taken by individual Ministries. Hence these were not implemented with a
holistic approach and has problems with identification of beneficiaries(Comprehensive

37
Social Security for the Indian Unorganized Sector ,The Ministry of Finance , Government
of India, 2013). Following is the summary of the findings and recommendations from
various sources:
1. It is important to understand that a fragmented approach to social security makes it
non-sustainable and hence need a rethink and pursue the option of categorizing the
workforce under a common social security umbrella and also include to the nonworking
population to achieve a comprehensive universal system of social security.(Duggal, 2006)
2. The coverage of beneficiaries under most of the insurance schemes appears to be
low(Choudhury & Srinivasan, 2011).
3. In life insurance schemes where claims ratio is relatively high, a significant portion
of the claims is in the form of scholarships, which is not the primary objective of the
insurance scheme(Choudhury & Srinivasan, 2011).
4. Bulk of the targeted population is not affiliated to any organized group through
which these insurance schemes are operated(Report on conditions of work and promotion
of livelihoods in the unorganized sector, 2007)
5. In case of health insurance, although both the Universal Health Insurance Scheme
(UHIS) and the Rashtriya Swasthya Bima Yojana provide insurance cover to the BPL
population against hospitalization expenses, the UHIS is likely to be less relevant in the
presence of RSBY as there is no requirement of premium contribution in RSBY unlike
UHIS.(Comprehensive Social Security for the Indian Unorganized Sector
Recommendations on Design and Implementation For submission to The Ministry of
Finance , Government of India, 2013)
6. There is a small overlap also for example in life insurance; it is potentially possible
that a rural landless household is covered under AABY as well as the life insurance
schemes for specific occupational groups and schemes implemented in different states.
(Sharma)
2.6 Summary of literature review
Based on the reviews, we have conducted or studied above, below are the takeaways
that can

38
serve as improvements needed in the current social security measures in India.
Need for consolidation or universalization of the schemes.
Inclusion of non-BPL.
Provider should be identified and justified, and state has an important role to play
in it.
Understand and workout the financial commitments and cost.
Target population definition should be unambiguous.
Comprehensive social security under this scheme should include life insurance,
health insurance, old age pension benefit and maternity benefit.
This chapter provided the definition of universalization in the literature, the desirability of
universalization in the extant literature and the recommendations of various committees.
The Literature review focuses on universalization from the perspective of public policy.
These references have helped in various aspects of our research for example understanding
the components of social security, benefits and gaps of such schemes in India and the
provisions of social security have some justification from the viewpoint of democracy.

39
Chapter 3
Experiences on Existing Social Security Programmes of
Selected Countries and India
In this chapter the relevant social security schemes of the selected countries as well as of
India are listed along with the features of those that help in studying the social security
scenario.
3.1 Overview of Social Security Schemes of other countries
The empowerment of the poor and their participation in the process of development appear
to have been of crucial importance in countries which have had some success in the
provision of social security (Drèze and Sen 1989; Caldwell 1986; Lewis et al. 1988).
All countries of the world have some or other types of social security programs. Some
programmes are several decades old while some are of recent enactments, which are
constantly undergoing change. The experience of other countries in designing and applying
social security measures provide a useful perspective on alternate solutions to the problem
common to all social security systems. In this section the social security programs of the
particular chosen countries, are listed with their salient features. The sample set represent
a good mix of developed and less developed countries. The rationale behind including the
particular countries in our study for the purpose of reviewing their social security system
and understanding the nuances of those to help us evaluating and benchmarking the Indian
social security schemes based on them, is as follows:
USA is an undisputed choice to be studied for social security for USA is the
modern and biggest economy of the world and also the biggest driver of several
economies of the world. It has been the front runner in protecting the citizen’s
rights and taking care of their welfare.
Germany, an industrial country with labor intensive automobile factories and
the native place of Otto von Bismarck, because of whom, Germany became the

40
first nation in the world to adopt an old-age social security program in 1889.So
the Germany is chose in this study’s evaluations.
Large Asian country China and successful cases of Brazil both of them being
part of the group called BRICS countries, the informal group India also belongs
to, because of some-what similar evolution of the economy, have been chosen
to be the part of the study. An early example of an insurance-like system was
China's Cooperative Medical System, which at its peak in the 1970s was
estimated to cover 90 per cent of the rural population using a combination of
compulsory prepayment by the residents, village contributions, and general
revenues (Keefe & Palacios, 2006).
Britain, obviously the one learned from its native William Henry Beveridge
who has formalized the need and criteria of social security, is chosen. This is so
we include the country that’s supposed to have an experience of implementing
social security for a long time and supposed to have a matured system in place.
The demography of these countries viz-a-viz India is presented next.
Table 3-1: Demographic and Other Statistics Related to Social Security,2013
Total
Population
(million)
Percentage 65
or older
Dependency
ratio
Life expectancy
at birth(years)
GDP per
capita
(US$)
Men Women
1354.1 8.2 39.1 72.5 75.9 3267
1214.5 4.9 55.6 63.7 66.9 1017
195.2 6.9 47.9 70.2 77.5 10,278
312.2 13.1 49 76.4 81.2 42,486
80.62 21.1 52 78.6 83.3 43,332
64.1 17.5 54 79.5 83.6 36,209 SOURCES: United Nations Population Division, Department of Economic and Social Affairs. World Population
Prospects: The 2008 Revision Population Database
To have a better understanding of the terms used in the tables, please refer to the section
named ‘Terminologies Explained’ in section#1 in the Appendix.

41
About the table above, the dependency ratio and percentage of population above sixty-five
years of age, is more in case of India that looks to be crushing the working population. Life
expectancy numbers for the other countries are inspiring. Though GDP per capita of these
countries are more than that of India’s and we are not going to deal with increasing that, in
this study, but we must find ways to address the social security issues that too for a
population of what India has now.
The social security programs of each of these countries are presented in the individual
tables that are added in the annexure. The tables include details with respect to each of the
welfare scheme, the criteria of the population covered, source of funds and the benefits
under the scheme.
Understanding China’s Social Security System
The social security system in China is based upon guidelines issued by the central
government, with the specifics managed at the local level. By the end of 2013, 1360 million
people were covered under Chinese social security (Social Security Individual Accounts in
China: Toward Sustainability in Individual Account Financing Tianlong Chen 1,* and John
A. Turner 2, 7 August 2014). China spends 3.7% of GPD on social security. (“Social
Security Deptt, ILO,” 2017.) (Security Administration, 2017)
The programs have two components for example Social insurance and mandatory
individual account and the benefits are as follows.
Pension
It operates by receiving contributions monthly from both the employee and the employer.
The portion contributed by the employee goes into a personal fund that the individual can
draw from, after the retirement, directly. In contrast, the contributions made by the
employer go into a social pool. Funds in this pool are distributed to all citizens that have
made contributions into the system during their working life. In this way even, citizens that
have used up the personal portion of their pension will have some income on which to
support themselves. In terms of the amount of contributions that need to be made each
month by both employee and employer, pension is generally the largest component of
42
social insurance. The salaried individual contributes 8% of gross earnings while self-
employed person pays 12%, the employer pays up to 20% of payroll and the government
provides subsidies as needed. The minimum pension (the combined social insurance and
mandatory individual account pension) is normally 40% to 60% of the average monthly
local wage during the previous year, depending on the region.
Medical insurance
Unlike in some countries where medical treatment is provided for free, in most cities in
China the patient is required to bear a certain percentage of the total hospital fee. The fund
receives contributions from salaried individuals (2% of gross earnings), self-employed
(about 10%), roll the employer pays 6% of the payroll while the government gives
concessions and subsidies.
The benefits are 60% to 100% (according to length of service) of the insured's last monthly
wage is paid for up to six months each year; thereafter, 40% to 60% until the employee
recovers or is assessed with a permanent disability. In addition, each month individuals
receive a small amount of money onto their medical insurance card. The funds can be used
to purchase medicine or other goods at pharmacies, or to pay small medical expenses at
hospitals.
Maternity Insurance
Contributions to maternity insurance are made by employers only. In the event that an
employee becomes pregnant, she will be entitled to receive a lump sum to defray some of
the costs of the childbirth. During the period of maternity leave from the company the
maternity fund will cover payment of salary.
It provides for paying 100% of the enterprise's average monthly wage for the previous year
is paid for up to 98 days for the birth of a child, including 15 days before the birth (an
additional 15 days for complicated deliveries), 42 days for an abortion or miscarriage that
takes place after at least four months of pregnancy, and 15 days for an abortion or
miscarriage that takes place after less than four months of pregnancy.

43
Additionally, the employers in all major cities are expected to make a contribution towards
unemployment insurance and most cities also require a contribution from the employee. In
the event an individual becomes unemployed they will be able to make a claim to receive
unemployment benefits. The benefits can be received for a maximum of 24 months.
The main threat to the China’s social security is, as nearly a third of the inhabitants of the
China will be over 60 years old by 2050, according to United Nations data so the
contributors are going to be far less than the ones who would avail of it.(“China’s Pension
Gap Is Growing as Aging Becomes Economic Risk - Bloomberg,” 2017)
Understanding UK’s Social Security System
(“Social security expenditure in Scotland and the UK Social security expenditure in the
United Kingdom, including Scotland,” 2014) Britain has been the nation that has been
modernized before any other country in the world; in fact, they are the ones who travelled
across the globe spreading the trade and business. Britain as mentioned earlier has been the
work place of Beveridge, who is the father of the social security.
Old age pension, disability, survivors, sickness and maternity benefits are the prime
components of the social security in UK. The schemes have different level of contributions
from the insured, employer and government as shown in the table in the annexure.
Total benefits and tax credits expenditure in the UK has increased more than 60 per cent
in real terms since 1996/97, from £130 billion to £209 billion in 2012/13. In 2012/13 social
security spending made up 31 per cent of government spending, equal to 13 per cent of
Gross Domestic Product (GDP).
In 2014 OECD reported this figure was £495 billion, equal to around 20% of the GDP
(Social spending is falling in some countries, but in many others it remains at historically
high levels, 2014) And this stands to be competitive in comparison to other countries in the
world (Spending, 2016). Out of this ‘The family and children category of social protection’
accounted for 10.4%, Pension accounted for 42.8% (highest of all) as reported by Office
of National statistics (2014)

44
There are some reports urging the need to re-haul the scheme to make them sustainable in
future especially with regard to the coverage the schemes provide. (“Social security system
fast becoming unfit for purpose, says study | Politics | The Guardian,” 2016.)
Understanding Germany’s Social Security System
The European nation Germany also has the social security system in place to provide
various benefits. It spends 25% of the GDP on social security.( OECD Spending, 2016)
and around 90% of population of Germany participates in social security. The German
version of the welfare state includes a national pension plan, public healthcare and nursing
care, unemployment benefits, work-related accident insurance, and welfare aid.
People with jobs must, contribute to four parts of the system, for health insurance, long-
range nursing care, pensions and unemployment. These payments will usually come to
about 40% of individual income, but the employer normally pays half of the cost.
Health Insurance
About 85% of the German population is insured under the GKV, Gesetzliche
Krankenversicheru, the German version of a national health system. The sickness benefit
is 70% of gross earnings (up to 90% of net earnings) is paid for up to 78 weeks in a three-
year period for the same illness. The employer pays 100% of the insured’s earnings for up
to the first six weeks.
Maternity benefit for female sickness fund members with an employment contract, is 100%
of average net earnings (up to €13 a day from the sickness fund with the remainder paid by
the employer) during the previous three months prior to maternity leave is paid six weeks
before and eight weeks after the expected date of birth (a total of 12 weeks for premature
or multiple births).
Pension Insurance
This statutory old age insurance fund ensures that employees can maintain an appropriate
standard of living when they retire. Payments are generally made from age 65, and the
45
maximum payout currently amounts to some 67% of average net income during the
insured's working life. (“Social Security and Employee Benefits in Germany,” 2017)
Unemployment insurance can be received by persons who have paid their premiums for at
least one year during the past five years.
The German social security system is facing problems due to the demographic change in
the population. An increasing number of old people require a large part of the funds for
pensions, healthcare, and nursing care while, the number of younger, contributors is
shrinking, questioning the sustainability of the scheme.(Social Security in Germany,
Internations Org)
Understanding Brazil’s Social Security System
The Social Welfare that exists today in Brazil was conceptualized in 1923.The fundamental
principal of the system is Universal coverage and assistance, by which all citizens have
access to social protection. Brazilian social security concept has two parts namely, Social
insurance, where the contributions are required from the insured; Social assistance, where
the government bears the total cost.(Overview Of Brazilian Social Welfare 2 Edition
,2013.) The expenditure on social security by Brazil stood at 14.3% in 2016.
The social security benefits in Brazil are categorized in the following parts:
Retirement:
It is the monthly payments for life, doled out to the insured due to age, contribution time,
work disability or work done in activities subject to harmful agents.
Pensions:
In this type of benefit, there is only one form, which is the pension for death, awarded to
the dependents of the insured for motives of death. The rights to this benefit go as follows:
husband/wife/ companion; non-emancipated child under 21 and handicapped child of any
age; father or mother; sibling under the age of 21 or handicapped of any age.

46
Aids:
Illness Aid: The benefit in the event when some form of physical or mental compromise
hinders the insured work for more than fifteen days.
Reclusion Aid: The benefit paid out to the dependents of the insured that has been taken to
prison, in the same conditions as pension for death.
Accident Aid: This benefit is a compensation that the insured receives when, after
consolidation of the lesions resulting from accident of any kind, including work related,
result in after effects that reduce the work capability of the insured.
Maternity Salary: All the women insured under the General Social Welfare Policy have the
right to maternity salary during the period of 120 days.
Family Salary: It is paid out monthly to the employee, except domestic servants, and to the
temporary worker, in proportion to the number of children up to the age of 14
The OECD report (OECD Economic Surveys: Brazil 2018, 2018) says that the pension
system in Brazil is financially unsustainable. An in-depth reform is necessary and
inevitable. The combined annual shortfall of the pension schemes is close to 4.5% of GDP,
contributing substantially to the general government budget deficit. In addition, the old-
age dependency ratio is increasing in Brazil. The population aged 65 and above will more
than triple within the next four decades, increasing from about 7.6% of the population in
2010 to 38% by 2050.
Understanding USA’s Social Security System
The Social Security System has been a large and visible part of the American financial
system since the 1930s. When President Franklin Roosevelt signed the law, it was designed
to be a financial security net for older Americans. The system was set up with workers
paying into it and beneficiaries getting retirement and other benefits. Since then, the
demographic base of the country has changed; the system has grown and become a visible
and controversial topic. With the current government deficit, maintaining the financial
integrity of the system has become an important political issue.

47
US spends 19.3% of GDP on Social Security (Society at a Glance 2016, 2016)
In 2018, about 63 million Americans will receive approximately one trillion dollars in
Social Security benefits. (“Fact sheet Social security US,” 2018)
Like other countries Social insurance is contributory while Social assistance (for
needy/helpless) doesn’t need any contribution from the insured and is borne solely by the
government. For social insurance, the salaried individual contributes 6.2% of his earning
and self-employed person contributes 12.4%. The employer contributes 6.2% of the payroll
and the government contributes a portion of the revenue from the earmarked taxes on social
security.
(Ageing and Employment Policies: United States 2018)The controversy over the financial
soundness of the system comes from the aging American population. Since the system is a
pay-as-you-go one, the contributions of current workers are used to pay the benefits to
those already retired and to accumulate for the benefit of those working. The difficulty
comes from the reduction in the number of contributors for each person receiving benefits.
Currently, there are only 3.3 contributors for each recipient and there will be only 2.2
contributing for each recipient in 2031.
Ultimately, to fund the retirements for today’s workers, contributions must increase,
benefits must decrease, the earnings on accumulations must increase or additional money
must come into the system. The big debate currently raging is whether and how the current
surplus being generated by income taxes should be used for this purpose. There are also
proposals that would enable individuals to have more control over how portions of their
funds would be invested.
3.2 Overview of existing social security schemes in India
As mentioned above, in India, in keeping with its cultural traditions, family members and
relatives have always taken care of shared responsibility towards one another. This is often
the best relief for the special needs and care required by the elderly and those in poor health.

48
However, with increasing migration, urbanization and other demographic changes there
have been a decrease in joint family units and increase in nuclear families. This is when
the need of a formal system of social security gained importance.
Social security schemes in India provide the benefits that are need based. They are intended
to prevent deprivation, assure the individual of a basic minimum income for himself and
his dependents and to protect the individual from any uncertainties. The state bears the
onus of developing an appropriate system for supporting the people especially the
workforce. It’s intended to help facing the challenges of modernization and the changes in
social and demographical changes in the society.
As the paper (Pillai, 2011) mentions that the social protection programmes in India can be
broadly categorized as
Improving living standards of the poor - programmatic framework,
Targeted social security programmes for the very poor,
Social security measures for unorganized/informal sector workers and
social security measures for organized/formal sector workers
3.2.1 Social Security schemes in Life Insurance in India
The Government of India has been aware of the social security needs of the people since
independence and has been striving to achieve the objective of the well-being of the people
of the country. "This section of society (the economically poor), is not much attracted to
the concept of insurance which has as its base the element of probability. The weaker
section looks forward to immediate benefits and do not rely on deferred ones" [GIC 1995].
There have been various schemes based on different criteria, started at various points of
time. Their motto is to achieve the objective which in some cases differs slightly in terms
of the target population, the benefits promised etc. The reason for this is primarily
attributed to the various lessons learned while following the path of social security by the
means of the schemes introduced and implemented.
Out of the various schemes, the most recent ones that are properly architected and well-
deliberated upon are Aam Aadmi Bima Yojana (AABY) and Pradhan Mantri Jeevan Jyoti
Bima Yojan (PMJJBY).

49
Aam Aadmi Bima Yojana (AABY)
In 2000, a scheme named Jan Shree Bima Yojana (JSBY) was started by
government of India to cover the specific sections of the society based on the
occupations they were into . Persons between 18 to 59 years of age and who are
below the poverty line or marginally above poverty line were eligible to participate
in the scheme. The premium for the scheme was ₹ 200/- per member, 50 %
premium under the scheme was contributed from the social security fund set up in
the year 1988-89 maintained by LIC. The balance 50% premium is borne by the
member and/ or nodal agency.
In 2007, the scheme AABY was started specifically for the rural landless laborers. The
head of the family or one earning member in the family of such a household is covered
under the scheme. The premium of ₹ 200/- per person per annum is shared equally by the
Central Government and the State Government. The member to be covered should be aged
between 18 and 59 years. A separate fund called "Aam Admi Bima Yojana Premium Fund"
was set up by Central Govt. to pay the Govt. contribution. The fund is maintained by LIC.
A free add-on benefit in the form of a scholarship to children is also available under the
Scheme. Later it was observed that this add-on benefit became the primary attraction of the
scheme and promoted its adoption in the relevant cases. In 2013 it was decided to merge
JSBY with AABY.
The scheme started with the intention to ensure the people especially the needy ones. Below
are the details related to contribution, eligibility and the benefits associated with it.
TABLE 3-2: Details of AABY
Source of contribution Amount of contribution Eligibility
The total annual premium
under the scheme is ₹ 200/-
per beneficiary of which 50%
is contributed from the Social
Security Fund created by the
Central Government and
maintained by LIC. The
balance 50% of the premium
is contributed by the State
Government / Nodal Agency
₹ 200/-
1. The members should
be aged between 18
years completed and 59
years nearer birthday.
2. The member should
normally be the head of
the family or the earning
member of the below
poverty line family
(BPL) or marginally

50
Source of contribution Amount of contribution Eligibility
/ Individual, as the case may
be.
above the poverty line
under identified
vocational group/rural
landless household. Source:(“Aam Aadmi Bima Yojana(AABY),” 2014)
The benefits under AABY fall under different categories depending on the type of mishap
the insured has undergone.
Table 3-3 Categorical Benefits Of AABY
Cause to claim the benefit Benefit
Natural Death 30000/-
On death, due to accident 75000/-
Permanent Total Disability, due to accident (Loss of 2 eyes or 2 limbs) 75000/-
Loss of one eye or one limb, in an accident 37500/- Source : (“Aam Aadmi Bima Yojana(AABY),” 2014) Scholarship benefits
Shiksha Sahayog Yojana (SSY)
Scholarship as a Free Add-on benefit will be provided to a maximum of two children of
the beneficiary studying between 9th to 12th Standard @ ₹ 100 per month for each child
payable half yearly – on 1st July and on 1st January, each year. (Press InformationBureau
AABY.)
Pradhan Mantri Jeevan Jyoti Bima Yojana (PMJJBY)
This is a flagship scheme of the present government launched recently to provide the life
insurance to every citizen of India by universalizing the life insurance and make it
affordable. We have tabulated the information related to it below.
TABLE 3-4: Details of PMJJBY
Source of
contribution Amount of contribution Eligibility
Insured
Person
₹ 330/- out of which
The savings bank account holder of
the participating banks aged between
18 years (completed) and 50 years
(age nearer birthday) and who have
given the consent to join the scheme
during the ‘enrollment period’ are
eligible to join the scheme.
Rs 289 would be charged as
annual insurance premium by
The assurance would be terminated in
the event of subscriber attaining an

51
LIC per member Rs 30 would
be charged for reimbursement
of expenses to
Agents/Corporate/Micro/BC
age of 55 years. As a matter of fact,
joining the scheme after the age of 50
years is not possible anyway.
Rs 11 would go against
Administrative Reimbursement
Expenses to the banks
participating in the scheme.
Source:(“Pradhan mantri jeevan jyoti bima yojana,” )
The benefit under Pradhan Mantri Jeevan Jyoti Bima Yojana (PMJJBY) is an assurance
of ₹ 2, 00,000/- on the death of the insured member is payable to the Nominee.
Common challenges faced by Social Security schemes in Life Insurance in India
There are different parameters that play differents role in the success and popularity of the
insurance schemes especially in the social security arena.
Financial Literacy and Ignorance about the Schemes: With a major part of population
uneducated and have the information inaccessible making them unaware, the schemes in
India are not very popular since the schemes are normally annual in nature and benefit with
occurrence of death are not frequently visible and difficult to foresee so workers do not
have much of an incentive to renew the policies and pay the premium.
An evaluation of the insurance scheme for khadi artisans highlights the resistance to
premium contribution by artisans and the persuasion required to convince them for the
outgo in their wages.(Choudhury & Srinivasan, 2011)
At times some secondary benefits play a major role in making the schemes popular among
the population relevant with such benefit. For for example the only incentive for workers
to join the Jan Shree Bima Yojana scheme despite a wage cut is when they anticipate death
in near future or have children studying in standard IX to XII and are assured of a
scholarship of ₹ 1200 per year per child. This is possibly reflected in the fact that, on an
average, more than a third of the claims under Janashree Bima Yojana are in the form of
scholarships alone, which was not the primary objective of the scheme. (Choudhury &
Srinivasan, 2011).
52
The population being targeted for the scheme is majorly in an unorganized kind of work to
earn their living. Someone who doesn't have a guaranteed a two-square meal a day can't be
expected to bear the premium.
In almost all schemes, organized groups like milk federations/unions, State Sheep and
Wool Development Boards/cooperative societies, service centers and NGOs working with
specific occupational groups are involved. Lack of belonging to any such groups adversely
affects the coverage of the scheme. In general, the extent of coverage in many schemes is
directly associated with the size of such organized groups in States. The relatively large
coverage of life insurance for the BPL population in Andhra Pradesh through Self-help
groups (SHGs) is an example of the expansion of coverage through an organized network.
Besides, in some schemes, only full-time workers are eligible (not part-time workers) and
this reduces the coverage. The report of the National Commission for Enterprises in the
Unorganized Sector (2007) highlighted that less than a third of the full-time handloom
weavers in the country in 1995-96 worked under cooperative societies or under master
weavers (structures through which the schemes for handloom weavers were implemented)
and the majority were self- employed. Similarly, less than a third of the persons engaged
in preparatory works in the handloom sector worked on a full-time basis.
Due to illiteracy there are problems in understanding the benefits of the scheme and the
operational requirements like premium requirements and submission of claims along with
required documents affects the success of the schemes.
Evaluation of Current Scheme
There are a couple of parameters to adjudge the efficiency and effectiveness of an insurance
scheme: universalization i.e. the extent of coverage across the population and across the
States, suitability to the major population at large, the claims ratio (claim to premium ratio).
The extent of coverage has direct implication for the level of public expenditure and the
distribution of coverage helps to deal with the budget requirement for spending on
insurance schemes. ‘Claims ratio’ provides reflects the utilization of premium expenditure.
As mentioned above that there are currently two social security schemes supported by the
government namely Aam Admi Bima Yojana (AABY) and Pradhan Mantri Jeevan Jyoti

53
Bima Yojana (PMJJBY). We have identified some of the gaps with them and listed them
below.
Evaluation of AAM ADMI BIMA YOJANA
Universalization (the breadth of coverage):
There are specific occupations covered under Jayashree Bima Yojana (JBY)(erstwhile
scheme merged with Aam Admi Bima Yojana (AABY) later) and Aam Admi Bima Yojana
(AABY) and the list may not be exhaustive and may need revision from time to time. This
leaves a scope of ambiguity.
Additionally, the number of rural landless households (population mainly covered under
Aam Admi Bima Yojana (AABY) in the country is much larger than National Sample
Survey Organization (NSSO) estimate (Choudhury & Srinivasan, 2011), which is quoted
by Government of India in this context. Studies have indicated that NSSO’s land and
livestock surveys underestimate the proportion of landless households in rural India
because of a methodological reason. As a result, in States like Andhra Pradesh where Aam
Admi Bima Yojana (AABY) is implemented in a major way, the number of rural landless
households covered under the scheme is double the National Sample Survey Organization
(NSSO) estimate of the total number of rural landless households in the State.
Fragmented coverage among the states:
In Aam Admi Bima Yojana (AABY) section#8 in the Appendix shows that the three states
account for 70% expenditure by the Government of India which indicates that there are
disparity and something missing with the other states.
The concentration of beneficiaries in specific States arises from two reasons:
1. Certain states have a larger concentration of the targeted groups. For example, in the
case of Life Insurance Scheme for Active fishermen, coastal States have a larger
concentration of the targeted group.
2. Certain states are more capable in reaping the benefits from these insurance schemes. In
life and health insurance schemes, the capacity and involvement of the State and

54
implementing agencies like cooperative societies, Non-Government Organization (NGO),
etc. is an important factor in determining the extent of coverage in selected States.
Importantly, in life insurance schemes, the share of scholarships in total claims is
remarkably high. While the scholarship clause was introduced in life insurance schemes as
an incentive for joining the scheme, a substantial proportion of claims is in the form of
scholarships alone. The share of scholarships in life insurance schemes varied from 24 per
cent to 57 per cent in 2007-08s (Choudhury & Srinivasan, 2011).In general, in 2007-08,
the share of scholarships in total claims of Jayashree Bima Yojana(JBY) (for all the
occupational groups together) is around 38 per cent. This fact requires attention since the
primary objective of life insurance schemes was to provide financial support to family
members of the poor and vulnerable sections of the society and scholarship benefit was
added only as an additional incentive to join the scheme.
Evaluation of Pradhan Mantri Jeevan Bima Yojana
Breadth of coverage
Pradhan Mantri Jeevan Jyoti Bima Yojana (PMJJBY) covers the population of 18 to 50
years of age group and doesn't cover the whole working age group. A scheme covering 18
to 59 years of age group could be a complete one.
Deficit between claims expected and premiums collected
As per the formula presented in the analytical framework section and the tables created
based on the same in the Appendix’s section#4 and section#5 in this work, it looks like
there is a deficit between the claim amounts expected (based on the death rate) and the sum
of premiums collected for the whole population.
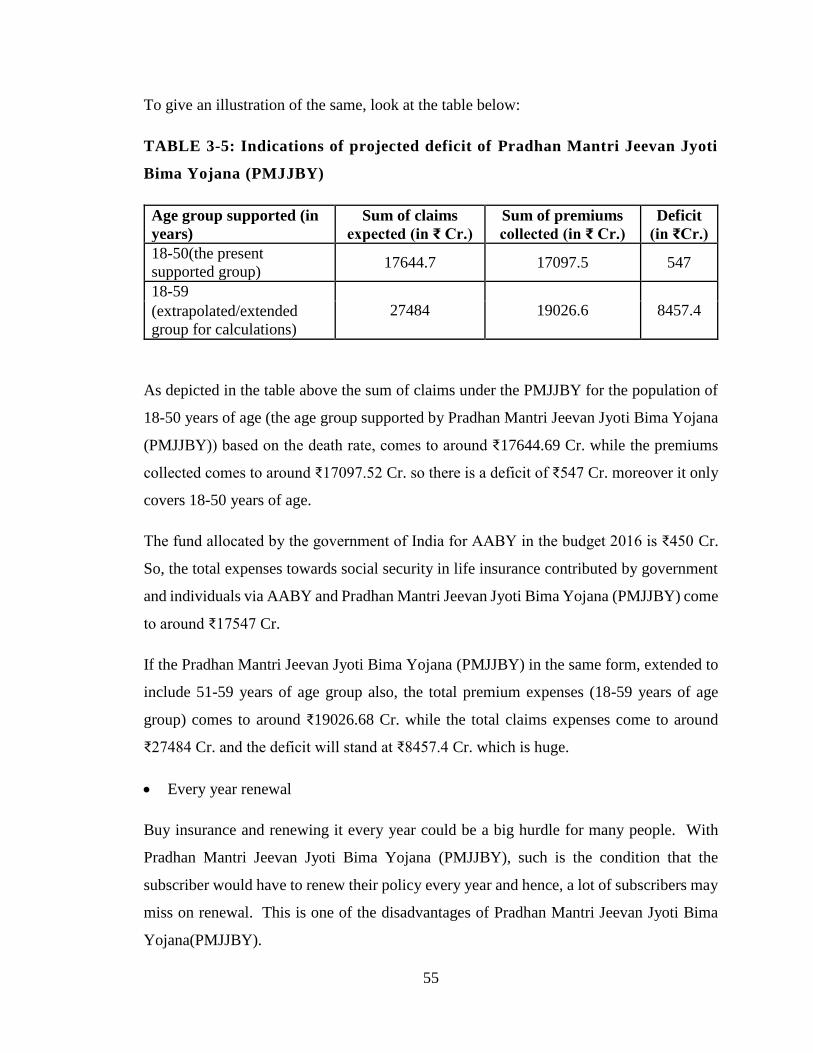
55
To give an illustration of the same, look at the table below:
TABLE 3-5: Indications of projected deficit of Pradhan Mantri Jeevan Jyoti
Bima Yojana (PMJJBY)
Age group supported (in
years)
Sum of claims
expected (in ₹ Cr.)
Sum of premiums
collected (in ₹ Cr.)
Deficit
(in ₹Cr.)
18-50(the present
supported group) 17644.7 17097.5 547
18-59
27484 19026.6 8457.4 (extrapolated/extended
group for calculations)
As depicted in the table above the sum of claims under the PMJJBY for the population of
18-50 years of age (the age group supported by Pradhan Mantri Jeevan Jyoti Bima Yojana
(PMJJBY)) based on the death rate, comes to around ₹17644.69 Cr. while the premiums
collected comes to around ₹17097.52 Cr. so there is a deficit of ₹547 Cr. moreover it only
covers 18-50 years of age.
The fund allocated by the government of India for AABY in the budget 2016 is ₹450 Cr.
So, the total expenses towards social security in life insurance contributed by government
and individuals via AABY and Pradhan Mantri Jeevan Jyoti Bima Yojana (PMJJBY) come
to around ₹17547 Cr.
If the Pradhan Mantri Jeevan Jyoti Bima Yojana (PMJJBY) in the same form, extended to
include 51-59 years of age group also, the total premium expenses (18-59 years of age
group) comes to around ₹19026.68 Cr. while the total claims expenses come to around
₹27484 Cr. and the deficit will stand at ₹8457.4 Cr. which is huge.
Every year renewal
Buy insurance and renewing it every year could be a big hurdle for many people. With
Pradhan Mantri Jeevan Jyoti Bima Yojana (PMJJBY), such is the condition that the
subscriber would have to renew their policy every year and hence, a lot of subscribers may
miss on renewal. This is one of the disadvantages of Pradhan Mantri Jeevan Jyoti Bima
Yojana(PMJJBY).

56
Low amount of insurance cover
With rising inflation, the value of money is decreasing every year. Two lakhs are not really
a remarkable amount even for poor living in rural areas. If two lakhs do not hold much
value as of now, imagine its value after 20-25 years. The government would have to
increase the value of insurance cover if it must make this a popular welfare scheme in the
long run.
Universalization
Keeping in consideration the low amount of insurance cover and the scheme’s attachment
to Jan Dhan Yojana, the scheme is not applicable to the entire population. Only those who
are living below the poverty line may get enrolled under the scheme, more so due to the
low insurance cover amount. Thus, this scheme is not relevant for a bigger population.
Scheme restricted to be linked to Jan Dhan Yojana
In continuation to the above point, linking the scheme to Jan Dhan Yojana would mean
that the scheme narrows down its domain of coverage. Only those people who are enrolled
under Pradhan Mantri Jan Dhan Yojana would be able to subscribe to Pradhan Mantri
Jeevan Jyoti Bima Yojana.
Since this is a scheme linked to Jan Dhan Yojana, the payment of premium is linked to the
Jan Dhan Account through ECS mode. No other mode of payment of premium narrows
down the channel through which subscriber can deposit premium amount. If at any point,
there is any problem with the saving account, the subscriber may not be able to pay their
premium on time.
Overall, the scheme has been initiated to serve special purpose of providing insurance
cover to those people who are not yet covered under any insurance scheme and we expect
that this scheme would go a longer way in providing financial security to the needy section
of society in times of their distress. Still, we need to wait and watch as to how this scheme
reaches the needy and how the scheme is executed by the insurance agencies.(Pradhan
Mantri Jeevan Jyoti Bima Yojana website.)

57
Conclusions drawn from evaluation of existing schemes
Until recently, the initiation of most of these schemes was being done in a segmented
manner based on the initiatives taken by individual Ministries. Identification of population
groups for insurance schemes was primarily based on occupation. Almost all life insurance
schemes and health insurance schemes with varying financial support from the
Government of India have been initiated for specific occupational groups. Although earlier
attempts have been made to provide life and health insurance for the BPL population, these
schemes have been rather ineffective in terms of coverage.
An analysis of the extent of expenditure on insurance schemes by the Government of India
indicates that the total budget expenditure on Aam Admi Bima Yojana (AABY) by
Government of India in 2016-17 is about ₹450 crore which is minuscule as a percent of
total expenditure. For most schemes, financial support was primarily in the form of
premium contribution. For life insurance schemes, support was also provided through an
indirect premium contribution by way of subsidization from the social security fund placed
with Life Insurance Corporation(LIC). Indirect support to life insurance schemes through
contributions from social security fund was only about ₹340 Cr. in 2014-15 and did not
add significantly to the expenditure by the Government of India. See the table in the
section#6 in the Appendix.
The coverage of beneficiaries under most of the insurance schemes appears to be low. In a
number of schemes, the share of beneficiaries covered in the targeted population is not
much. This fact points to the low reach of these insurance schemes in the targeted
population. Also, in many schemes, a few States account for the bulk of the beneficiaries.
The share of the top three States in total beneficiaries is significantly higher than the share
of the target group in those States for many of the schemes. The time taken for the
settlement of claims is also relatively high in many schemes. The bulk of the delay in
settlement of claims is often in the process of submission of relevant documents, and not
after the submission of claims. In some schemes, the claim to premium ratio is also low. In
life insurance schemes where claims ratio is relatively high, a significant portion of the
claims is in the form of scholarships, which is not the primary objective of the insurance
scheme.

58
The performance of the schemes is affected by several factors Bulk of the targeted
population is not affiliated with any organized group through which these insurance
schemes are operated. This adversely affects the coverage. Also, illiteracy and lack of basic
schooling lead to problems in carrying out the operational modalities of the schemes in
terms of premium requirements and submission of claims with the relevant documents.
Also, in life insurance schemes, as the benefits obtained in the event of occurrence of deaths
or disability is not frequently visible, there is a lack of incentive to contribute premium
annually. The only incentive for the workers to join the scheme is when death is anticipated,
or workers have children studying in standard IX to XII and are assured of a scholarship
of ₹ 1200 per annum.
In general, it may be helpful to consolidate the individual life insurance schemes for
different occupational groups (and groups like the rural landless households) and provide
a universal common life insurance scheme for the entire population.
Consolidating the schemes for the entire population is likely to be advantageous in two
ways. First, it increases pooling of individuals and diversifies the risk associated with the
insurance schemes. Secondly, the costs associated with identifying individual members in
each of the targeted groups separately are likely to be reduced substantially. It may also be
important to note that the Government of India has identified 45 occupational groups as
‘weak and vulnerable’ and whose workers are mostly either below or marginally above the
poverty line (to be considered for insurance support). The inclusion of non-BPL workers
belonging to these occupational groups further, may not only help in increasing pooling
and diversification of the risk associated with these schemes, but also to ensure that the
workers belonging to these occupational groups who are marginally above the poverty line
do not fall below the poverty line in the event of unforeseen adverse circumstances. Also,
implementing the common scheme through a single agency like a single Ministry of
Government of India or a public trust as in the case of Aarogyasri in Andhra Pradesh will
reduce the administrative and operational costs associated with these individual schemes.
The common insurance scheme may also be universal in nature and not voluntary as is the
case in most of the schemes currently. This will reduce the adverse selection problems
associated with the voluntary nature of these schemes. Besides, a universal scheme is also

59
likely to generate more awareness about the scheme and make the benefits of the scheme
more visible. The need for such universal life insurance schemes for the population has
been felt at the policy level for long and is reflected in the fact that the National Family
Benefit Scheme (now transferred to the State Governments) was introduced as in early as
1995 to provide compensation to Below Poverty Line(BPL) families on death of the
primary earning member. Several State Governments are already implementing life
insurance schemes for the Below Poverty Line(BPL) population of their State. Recently,
the Insurance Regulatory and Development Agency(IRDA) has also suggested the
formulation of a comprehensive life and health insurance scheme for the Below Poverty
Line(BPL) population. The need for such a universal life and health insurance scheme for
unorganized workers
(about a third of whom are Below Poverty Line(BPL)) in India has also been argued by
other studies (Mehrotra 2008). There are also other implementation issues that need to be
investigated in the context of life insurance schemes. Experience from Aam Aadmi Bima
Yojana(AABY) in Andhra Pradesh, indicate that the coverage of rural landless households
under the scheme far exceeds the total number of rural landless households declared by the
Central Government (based on figures from the National Sample Survey
Organization(NSSO). With earlier studies indicating that the number of landless
households reported by the National Sample Survey is significantly lower than the actual
number of landless households, the stated commitment of Government of India of covering
1.5 crore rural landless households may need to be reconsidered.
3.2.2 Social Security schemes in Health Insurance in India
The whole world has been focusing on making the population disease- free and providing
the health service to every needy and continuously striving towards that.
The idea of universal healthcare had its origins at the Alma Ata Conference in 1978, where
Health for All was agreed upon by all of the 13,411 participants from different countries.
The conference broadly defined health with a strong focus on universal primary healthcare
(PHC) and equity. India too is a signatory to the Alma Ata Declaration which affirmed that
health, which is a state of complete physical, mental and social well-being, and not merely

60
the absence of disease or infirmity, is a fundamental human right and that the attainment
of the highest possible level of health is a most important world-wide social goal whose
realization requires the action of many other social and economic sectors in addition to the
health sector. The Alma Ata declaration is considered to be an intellectual and moral leap
forward for humankind.(Kurian, 2014)
The UN report (Transforming our world : The 2030 agenda for sustainable development)
on the launch of Sustainable Development Goals says:
To promote physical and mental health and well-being, and to extend life expectancy for
all, we must achieve universal health coverage and access to quality health care. No one
must be left behind. We commit to accelerating the progress made to date in reducing
newborn, child, and maternal mortality by ending all such preventable deaths before 2030.
We are committed to ensuring universal access to sexual and reproductive health-care
services, including for family planning, information, and education. We will equally
accelerate the pace of progress made in fighting malaria, HIV/AIDS, tuberculosis,
hepatitis, Ebola and other communicable diseases and epidemics, including by addressing
growing anti-microbial resistance and the problem of unattended diseases affecting
developing countries. We are committed to the prevention and treatment of non-
communicable diseases, including behavioral, developmental and neurological disorders,
which constitute a major challenge for sustainable development.
Similarly, the Ministry of Health and Family Welfare of India has the following as part of
their vision statements.
a. Ensuring availability of quality healthcare on equitable, accessible and
affordable basis across regions and communities with special focus on under-
served population and marginalized groups.
b. Establishing comprehensive primary healthcare delivery system and well-
functioning linkages with secondary and tertiary care health delivery system.
c. Reducing Infant Mortality Rate.
d. Reducing the incidence of communicable diseases and putting in place a
strategy to reduce the burden of non-communicable diseases.

61
e. Focusing on population stabilization in the country.
f. Developing the training capacity for providing human resources for health
(medical, paramedical and managerial) with adequate skill mix at all levels.
g. Regulating health service delivery and promote rational use of pharmaceuticals
in the country.
So, the focus on the health of the population is a matter or extreme attention both nationally
as well as internationally. In the forthcoming sections, we will examine the health status of
India as well as the area issues and policies and schemes that currently exist to address the
problems.
Health status of India
To take care of the health of citizens of the country and making the health services
accessible to each one of them, there have been various initiatives taken, policies made,
executed and accomplished. There are some areas where we have made significant progress
while we lag behind in some.
While health status of a community or a country for that matter can be assessed in the
absolute terms but given the living conditions exists in the world at large, it's normally the
relative status vis-a-vis other countries in the world which help to infer the scope of
improvement with respect to the ones that are performing better.
Most countries have enjoyed large gains in life expectancy over the past decades, thanks
to improvements in living conditions, public health interventions and progress in medical
care. Life expectancy at birth in India has increased by almost 25 years since 1960 to reach
66.3 years in 2012. Nonetheless, it still remains 14 years lower than the Organisation for
Economic Co-operation and Development (OECD) average (80.2 years). (The
Organisation for Economic Co-operation and Development (OECD))
The infant mortality rate in India has been reduced by half over the past two decades,
coming down from 88.2 deaths per 1000 live births in 1990 to 43.8 deaths in 2012. Still, it
remains more than ten times higher than the Organisation for Economic Co-operation and
Development (OECD) average (4.0 deaths per 1000 births).

62
The percentage of low birth weight infants in India is also much higher than in Organisation
for Economic Co-operation and Development (OECD) countries: 27.6% of newborns in
India in 2011 were defined as having a low birth weight (weighing less than 2 500 grams)
compared with 6.8% on average in Organisation for Economic Co-operation and
Development (OECD) countries. While genetic factors play a role, the proportion of low
birth weight infants is generally higher in lower-income families in India as is the case also
in other countries. This indicates that it's related to the affordability of health care for the
lower income families.
The availability of health facilities in India is comparatively much lower (about 1:1000 bed
per population ratio) than the developed nations, about 7:1000 (WHS, 2009).
The data on morbidity in India is not available, however, the National Sample Survey
Office (NSSO) data on proportion of Ailing Persons per 1000, reflects the extent of need
for health care in India for various age groups.
PAP or Proportion (per 1000) of ailing persons (PAP) is one of the parameters to assess
the health of the people in India is the number of people fall sick in a period under
observation. Table 4-1 below shows the PAP during 15 days for various age groups.
TABLE 3-6 : Proportion (Per 1000) of Ailing Persons(PAP) During Last 15
Days for Different Age Groups Separately for Gender: Rural, Urban.
Age -group Rural Urban
Male Female Persons Male Female Persons
0-4 119 86 103 111 117 114
9-May 65 50 58 87 71 80
14-Oct 43 47 45 57 53 56
15-29 35 57 46 38 59 48
30-44 60 94 77 71 126 98
45-59 109 163 135 173 239 206
60-69 247 270 259 331 379 355
70+ 327 286 306 376 371 373
all 80 99 89 101 135 118 Source: NSSO 71th round report (Government of India Ministry of Statistics and Programme Implementation National
Sample Survey Office, 2015)

63
The table above shows the data of the people with respect to their age reporting
ailments giving the age-wise cross-section of ailing people. The Proportion (per
1000) of ailing persons (PAPs) were found to be high for children and much higher
for the higher age groups and low for the younger age groups.
The data suggests that the PAP increases with age and highest for the age group of
70 plus. So, the vulnerable age groups need to be taken care of.
The data also shows that for younger age groups, the PAP is higher in rural areas
than that in the urban areas in India however, this trend reverts for the older age
groups from age 45 years and above and we observe higher PAP in urban areas as
compared to the rural areas.
The 71th round National Sample Survey Office (NSSO) survey 2015(Government of
India ministry of statistics and programme implementation national sample survey
office, 2015) also reveals following trends:
The inclination towards allopathy treatment is prevalent (around 90% in both the
sectors) and which in most cases is the costly treatment.
Secondly the private doctors are the most important single source of treatment in
both the sectors (Rural & Urban). More than 70% (72 per cent in the rural areas and
79 per cent in the urban areas) spells of ailment were treated in the private sector
(consisting of private doctors, nursing homes, private hospitals, charitable
institutions, etc. (Government of India, ministry of statistics and program
implementation, National Sample Survey Office, 2015). But the cost of treatment
is generally more in case of private doctors.
The un-treated spell was higher in rural (both for male and female) than in urban
areas. So the rural areas probably need reinforced focus.
So, the cost of treatment becomes a major hurdle in making the health services accessible
to all especially the population in the rural area. The issues of health need deliberations and
focus of authorities in India otherwise the situation will not improve and hamper the growth
India envisages to achieve, and her ambition to join the league of developed nations, since
one of the criteria of developed nation is the Human Development Index (HDI) score which
64
is a composite index that measures progress in the three basic dimensions that is health,
knowledge and income(Human Development Index,United Nations Development
Programme, 2014).
There is an absolute assessment of the health of India mandates the need to have a plan to
address the issue. The first thing comes to the mind is the financial aspect of the plan. So,
in the subsequent sections, we will understand how much the money is required for the
treatments and where does it come from – when someone suffers from a disease in India.
Cost of treatment in India
It is seen that expenditure on medicines consists of about three-fourths of total out-of-
pocket spending. Financial reasons prevented around a quarter of the population from
accessing health services. It was estimated that 35% of hospitalizations caused the
respective families to be pushed into poverty. In real terms, it meant health payments
pushed 60 million people below the poverty line, per year. To put this into perspective, it
is equivalent to the total population of the United Kingdom (Kurian,2014).
As per the report of NSSO 2015, (Government Of India Ministry Of Statistics And
Programme Implementation National Sample Survey Office, 2015)
Average medical expenditure per hospitalization case: Higher amount was spent
for treatment per hospitalized case by people in the private hospitals (₹25850) than
in the public hospitals (₹6120). The highest expenditure was recorded for the
treatment of Cancer (₹56712) followed by that for Cardio-vascular diseases
(₹31647).
Average medical expenditure per non-hospitalization case was ₹509 in rural India
and ₹639 in urban India.
As much as 86% of rural population and 82% of the urban population were still not
covered under any scheme of health expenditure support. The government,
however, was able to bring about 12% urban and 13% rural populations under
health protection coverage through Rastriya Swasthya BimaYojana (RSBY) or
similar plan. Only 12% households of the 5th quintile class (Usual Monthly Per
Capita Consumer Expenditure) of the urban area had some arrangement of medical
65
insurance from a private provider. Hence the coverage seems less in the government
supported health insurance scheme.
Health Spending – Who is financing health care?
Total expenditure of health represents government expenditure on health, private
expenditure on health, including externally funded expenditure on health. Sub-components
of government expenditure on health (“social security expenditure”) and private
expenditure on health (“out-of-pocket expenditure” and “private prepaid plans”) are also
included.
The public expenditure on health has not only been recognized in fighting with major
diseases like HIV/AIDS, tuberculosis, malaria, meeting the Millennium Development
Goals (MDGs) targets, reducing poverty but also important for the industrial and economic
development of a country (Hooda, 2013). It is argued that public health expenditure is one
of the important components for the provisioning of health facilities which further result in
better health outcomes.
As we saw based on the initially presented Health status of India viz-a-viz World, the report
card is not that great. To understand the reasoning behind the unsatisfactory nature of health
outcomes, one needs to know whether India spends a sizeable amount of public funds in
health and whether the funds allocated properly. We also must compare the India's level of
health spending with the international level of health spending and does the level of health
spending is adequate to meet the required provision of basic health services in the country
and the population our country has?
It is established that the countries with high level of public spending in health have secured
better health outcomes compared to the countries with low level of spending in
health(Mills, Amoako, & Kato, 2002). Thus, the size of the public fund in health sector
matters for better health outcomes. Beside the level of spending, health outcomes are most
affected by allocation pattern of public funds in the health sector (Hooda, 2013).
As a general observation, the developed countries spend a high amount on health both as a
percent of GDP and out of their total budget compared to the developing countries. The
variation in public health spending ranging from 2.8 per cent to 17 per cent of GDP and

66
the general government expenditure on health as a percentage of the total expenditure on
health varies from 4.3 per cent to 20 per cent out of total government expenditure.
We have compiled some statistics and presented them graphically to depict the health
spending in India and compared that with some other representative countries. Refer the
charts below and the conclusions deduced from them are listed below the charts.
Source: (World Health Statistics 2015, 2015)
Source: (World Health Statistics 2015, 2015)
Source: (World Health Statistics 2015, 2015)
Source: (World Health Statistics 2015, 2015)
0
20
40
60
80
100
120
US
Fra
nce
Can
ada
Ger
man
y
UK
Th
alia
nd
Au
stra
lia
Bra
zil
Ind
ones
ia
Chin
a
Mal
asia
Nep
al
Sri
lan
ka
Pak
ista
n
Ind
ia
Mex
ico
Ban
gal
ades
h
Out-of-pocket expenditure as %
of private expenditure on health
Year 2000
Out-of-pocket expenditure as %
of private expenditure on health
Year 2012
0
5
10
15
20
US
Fra
nce
Ger
man
y
Can
ada
Bra
zil
UK
Au
stra
lia
Mex
ico
Nep
al
Chin
a
Th
alia
nd
Mal
asia
Ind
ia
Ban
gal
ades
h
Sri
lan
ka
Ind
ones
ia
Pak
ista
n
Total expenditure on health as %
of gross domestic product Year
2000
Total expenditure on health as %
of gross domestic product Year
2012
0
20
40
60
80
100
UK Th
…
Fra
…
Ge…
Ca…
Au
…
Chin
a
Ma…
Me…
Br…
US
Ind
…
Nep
al Sri
…
Pa…
Ba…
Ind
ia
Private expenditure on health
as % of total expenditure on
health Year 2000
Private expenditure on health
as % of total expenditure on
health Year 2012

67
Source: (World Health Statistics 2015, 2015)
India is in the lower order of rank with less than 5% of the total Expenditure on
health as a% of GDP
The general government expenditure on health as a percentage of total expenditure
of health is very low in India at 30.5% of total health expenditure. Other developing
countries in Asia like Pakistan, Nepal, Srilanka and Bangladesh surpass India in the
same despite
having low per capita income.
The private spending on health in India as a percent of the total spending on health
(69.5%) is more in India compared to the countries being compared with.
Out of pocket expenditure in India as a percent of private expenditure on health
(87.2%) is also among the maximum in India. Per Capita Total Health Expenditure
Per capita total expenditure on health ($196) and per capita government expenditure
on health ($60) – in both cases India fares among the lowest.
To summarize, except in Per capita government expenditure on health (PPP int. $) there is
a degradation of India's standing, in all the following areas, vis-à-vis other countries in
consideration from the year 2000 to the year 2012:
Total health expenditure as a percent of GDP is lowest at 4%.
General government expenditure on health as % of total expenditure on health.
Within total health spending, India has the lowest percentage of government (both
central and state) health spending, at 31%.
0
20
40
60
80
100
General government expenditure
on health as % of total
expenditure on health Year 2000
General government expenditure
on health as % of total
expenditure on health Year
2012

68
Private expenditure on health as % of total expenditure on health. This means
there are countries which have improved in this from the year 2000 to 2012 by
decreasing the private expenditure as compared to the total expenditure.
General government expenditure on health as % of total government expenditure.
Out-of-pocket expenditure as % of private expenditure on health.
Per capita total expenditure on health (PPP int. $).
Health expenditures are known to account for a significant proportion of a poor household
‘s income. According to a High-Level Expert Group (HLEG), total health spending in India
in 2011 was R.s. 2,500 per capita. Out of pocket spending(OOPS) accounts for 5.73% of
household consumption (Selvaraj and Karan,2012).
This probably forces the less privileged to seek unregulated private healthcare with
significant adverse impact on out-of-pocket (OOP) expenditure. This not only pushes the
non-poor into poverty but also affect the final outcomes. It is worth to mention that the
health outcomes (like, infant mortality rate) recorded better in most of the countries where
public spending on health is high. This clearly indicates that the efforts in this direction
have to be increased with a holistic approach in mind since the health situation in India has
not progressed with the comparable pace if we consider the progress made by the other
countries under consideration.
Review of Government Health Schemes and Budget
Health, however, is an important component for economic development but India
announced its first National Health Policy in 1983, three and a half decades after its
independence. In this policy, India committed to achieving ‘Health for All by the year but
the prescribed numbers of physical and human infrastructure in the health sector has not
been achieved.
The second National Health Policy of India announced in 2002 which committed to
increasing the public spending in health from existing 0.9 per cent to 2 per cent of GDP
and from 5.5 per cent to 8 per cent of the budget by 2010. The spending in 2010 recorded,
about 1.09 percent of GDP and 6.85 percent of the total budget, less than the commitments.

69
Similarly, the National Rural Health Mission (NRHM) (2005) of India has committed to
spending 2.3 percent of GDP by 2012, the end of the 11th Five Year Plan. The targets of
National Rural Health Mission (NRHM) spending have not been achieved. The health
spending was recorded around 1.2 per cent of GDP at the end of 11th Plan. After adding
the expenditure on complementary (the water supply and sanitation) services it hovered
around 1.6 percent of GDP, which is again less than the committed level of health spending.
These experiences show the government's failure in serving and providing the adequate
health services to the population. India, despite its low health outcomes, no major lesson
has been learned from the past. The results show that even the Primary Health Care
approach never been implemented effectively; the goals for ‘Health for All by 2000ʹ were
not met and the spending commitments have not been fulfilled. This reflects that
governments (both center and states) have given less priority to the health sector in India.
In the proposal, the Universal Health Coverage, 2012 proposed to increase government
(central and state combined) spending in health from the then level of 1.2 per cent of GDP
to at least 2.5 percent by the end of the 12th Plan and to at least 3 percent of GDP by
2022.(Hooda, 2013) .
Health Budget in 12th five-year plan
To keep the promise of an enhanced public health system for the country, as envisaged in
the 12th five-year plan (2012-17), the government will have to increase the allocation for
health in the coming budgets to a very high amount. The table below shows the Year-wise
budget allocation on health (Planning Commission, 2012) Rema Nagarajan.
TABLE 3-7 : Budget Allocation for Health in the 12TH FIVE-YEAR PLAN
Year Budget Allocation on Health (in ₹ Cr.)
2012 34488
2013 37330
2014 35163
2015 33152
2016 22950 Source: Compiled from the individual years’ budgets
The first year of the 12th plan, 2012-13, had only about ₹34488 Cr. allocated. This left
more than Rupees 2.66 lakh Cr. to be allocated in the remaining four years starting with
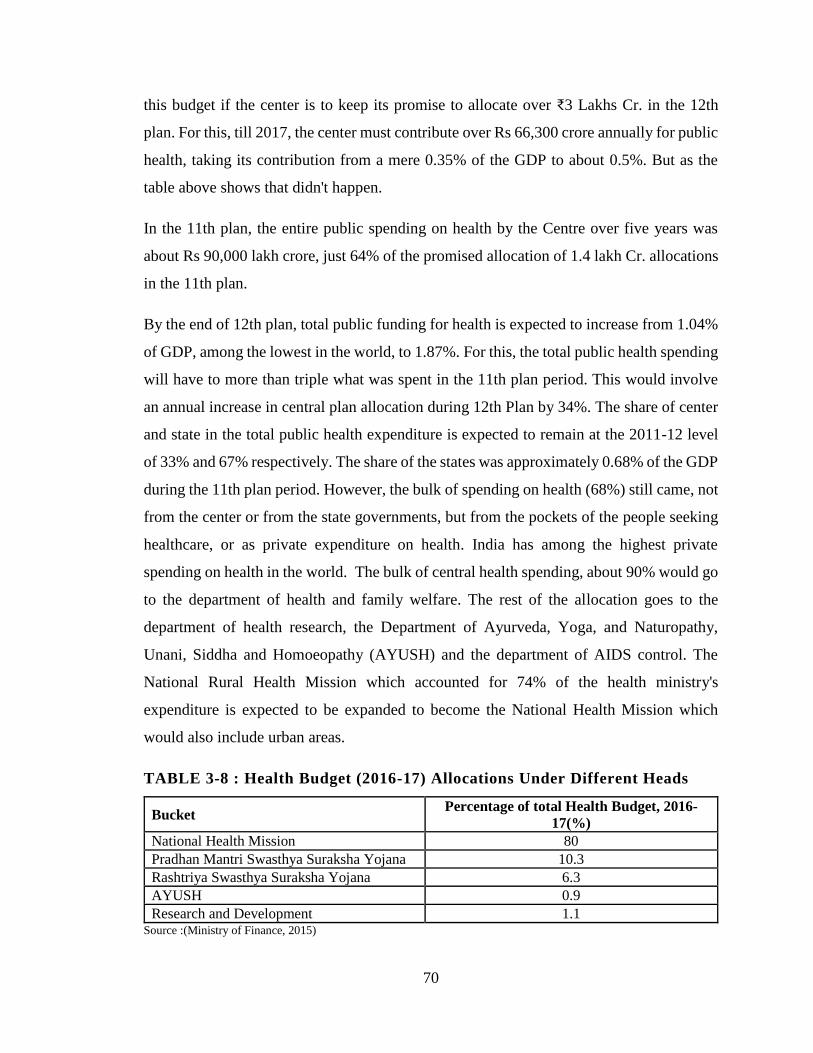
70
this budget if the center is to keep its promise to allocate over ₹3 Lakhs Cr. in the 12th
plan. For this, till 2017, the center must contribute over Rs 66,300 crore annually for public
health, taking its contribution from a mere 0.35% of the GDP to about 0.5%. But as the
table above shows that didn't happen.
In the 11th plan, the entire public spending on health by the Centre over five years was
about Rs 90,000 lakh crore, just 64% of the promised allocation of 1.4 lakh Cr. allocations
in the 11th plan.
By the end of 12th plan, total public funding for health is expected to increase from 1.04%
of GDP, among the lowest in the world, to 1.87%. For this, the total public health spending
will have to more than triple what was spent in the 11th plan period. This would involve
an annual increase in central plan allocation during 12th Plan by 34%. The share of center
and state in the total public health expenditure is expected to remain at the 2011-12 level
of 33% and 67% respectively. The share of the states was approximately 0.68% of the GDP
during the 11th plan period. However, the bulk of spending on health (68%) still came, not
from the center or from the state governments, but from the pockets of the people seeking
healthcare, or as private expenditure on health. India has among the highest private
spending on health in the world. The bulk of central health spending, about 90% would go
to the department of health and family welfare. The rest of the allocation goes to the
department of health research, the Department of Ayurveda, Yoga, and Naturopathy,
Unani, Siddha and Homoeopathy (AYUSH) and the department of AIDS control. The
National Rural Health Mission which accounted for 74% of the health ministry's
expenditure is expected to be expanded to become the National Health Mission which
would also include urban areas.
TABLE 3-8 : Health Budget (2016-17) Allocations Under Different Heads
Bucket Percentage of total Health Budget, 2016-
17(%)
National Health Mission 80
Pradhan Mantri Swasthya Suraksha Yojana 10.3
Rashtriya Swasthya Suraksha Yojana 6.3
AYUSH 0.9
Research and Development 1.1 Source :(Ministry of Finance, 2015)

71
The enhanced allocation is meant for substantial expansion and strengthening of the public-
sector healthcare system across the country so that people, especially the poor, would not
be so dependent on the private sector for healthcare, where the cost is so high that it
impoverishes millions seeking healthcare every year.
At present, India's health care system consists of a mix of public and private sector
providers of health services. Networks of health care facilities at the primary, secondary
and tertiary level, run mainly by State Governments, provide free or very low-cost medical
services. There is also an extensive private health care sector, covering the entire spectrum
from individual doctors and their clinics to general hospitals and super-specialty hospitals.
The system suffers from the following weaknesses:
Availability of health care services from the public and private sectors taken
together is quantitatively inadequate. This is starkly evident from the data on
doctors or nurses per lakh of the population.
At the start of the Eleventh Plan, the number of doctors per lakh of the population
was only 45, whereas, the desirable number is 85 per lakh population. Similarly,
the number of Nurses and Auxiliary Nurse and Midwives (ANMs) available was
only 75 per lakh population whereas the desirable number is 255. Rural areas are
especially poorly served.
The quality of healthcare services varies considerably in both the public and the
private sector. Many practitioners in the private sector are actually not qualified
doctors. Regulatory standards for public and private hospitals are not adequately
defined and, in any case, are ineffectively enforced.
Affordability of health care is a serious problem for the clear majority of the
population, especially in tertiary care. The lack of extensive and adequately funded
public health services pushes large numbers of people to incur heavy out of pocket
expenditures on services purchased from the private sector. Out of pocket
expenditures arise even in public sector hospitals since the lack of medicines means
that patients have to buy them. This results in a very high financial burden on
families in case of severe illness. A large fraction of the out of pocket expenditure

72
arises from outpatient care and purchase of medicines, which are mostly not
covered even by the existing insurance schemes. In any case, the percentage of
population covered by health insurance is small.
The problems outlined above are likely to worsen in future. Health care costs are expected
to rise because, with rising life expectancy, a larger proportion of our population will
become vulnerable to chronic Non-Communicable Diseases (NCDs), which typically
require expensive treatment. The public awareness of treatment possibilities is also
increasing and which, in turn, increases the demand for medical care. In the years ahead,
India will have to cope with health problems reflecting the dual burden of disease, that is,
dealing with the rising cost of managing NCDs and injuries while still battling
communicable diseases that remain a major public health challenge, both in terms of
mortality and disability (Figures 20.1 and 20.2).
The public expenditure on health needs to increase much more over the next decade.
As per the 12th five-year plan, Government should increase public expenditure on health
from the current level of 1.2 percent of GDP to at least 2.5 percent by the end of the Twelfth
Plan, and to at least 3 percent of GDP by 2022.
Rashtriya Swasthya Bima Yojana (RSBY)
Rashtriya Swasthya Bima Yojana (RSBY) is a scheme to provide insurance which covers
a family and is a direct method by which the government wishes to reduce the burden of
medical consumption shocks amongst the poor. It was launched by the Government of
India in 2007, to provide BPL families with access, choice and financial-risk protection for
in-patient health care services. The average medical expenditure for hospitalized treatment
in India over 365 days is ₹ 5,695 in rural areas, and ₹ 8,851 in urban areas (NSSO, 2006).
RSBY has two main objectives:
1) To provide financial protection against catastrophic health costs by reducing out.
2) To improve access to quality health care for below poverty line households of
pocket expenditure for hospitalization and other vulnerable groups in the
unorganized sector.
73
Rashtriya Swasthya Bima Yojana (RSBY) was launched in early 2008 and was initially
designed to target only the Below Poverty Line (BPL) households, but has been expanded
to cover other defined categories of unorganized workers, covering:
1. Building and other construction workers registered with the Welfare Boards
2. Licensed Railway Porters
3. Street Vendors
4. MNREGA workers who have worked for more than 15 days during the preceding
financial year
5. Beedi Workers
6. Domestic Workers
7. Sanitation Workers
8. Mine Workers
9. Rickshaw pullers
10. Rag pickers
11. Auto/Taxi Driver
The premium cost for enrolled beneficiaries under the scheme is shared by Government of
India and the State Governments. The program has the target to cover 70 million
households by the end of the Twelfth Five-Year Plan (2012-17). The beneficiaries need to
pay only ₹ 30/- as registration fee for a year while Central and State Government pays the
premium as per their sharing ratio to the insurer selected by the State Government based
on a competitive bidding. By paying only a maximum sum up to ₹ 750/- per family per
year, the Government can provide access to quality health care to the below poverty line
population.
The problems with the RSBY are as mentioned(Moving Toward Universal Health
Coverage.)
1. Enrolment is done at the family level and covers up to 5 members: head, spouse,
and 3 dependents. Only BPL households are eligible.

74
2. Inpatient care, restricted by package limits (700 procedures, 5 days post
hospitalization drugs and transportation costs of ₹100) and subject to an annual
ceiling of ₹ 30,000 per family, are covered on a cash-less basis.
The scheme has restrictions based on the category of population and the size of the family
which surely hampers the objective of providing health to the weaker sections. The above
restrictions and limitation calls for consideration of the universal coverage to the whole
population and also with a more realistic amount instead of a fixed one. So, we are going
to try and do this calculation to arrive at any conclusion.
Universal Health Insurance Scheme (UHIS)
The four-public sector general insurance companies offer Universal Health Insurance
Scheme for improving the access of health care to poor families. The scheme provides for
reimbursement of medical expenses up to ₹30,000 towards hospitalization floated amongst
the entire family, death cover due to an accident @ ₹25,000 to the earning head of the
family and compensation due to loss of earning of the earning member @ ₹50 per day up
to maximum of 15 days. The Universal Health Insurance Scheme (UHIS) has been
redesigned targeting only the BPL families. The premium subsidy is ₹200 for an individual,
₹300 for a family of five and ₹400 for a family of seven. This scheme has not become very
popular and the population coverage remains restricted for lack of incentive to the
insurance providers to expand the scheme coverage and high costs.
These experiences show the government’s failure in serving and providing the adequate
health services to the population. India, despite its low health outcomes, no major lesson
has been learnt from the past. The results show that even the Primary Health Care approach
never been implemented effectively; the goals for ‘Health for All by 2000ʹ were not met
and the spending commitments have not been fulfilled. This reflects that governments (both
center and states) have given less priority to health sector in India. In the proposal, the
Universal Health Coverage, 2012 proposed to increase government (central and state
combined) spending in health from the then level of 1.2 per cent of GDP to at least 2.5 per
cent by the end of the 12th Plan and to at least 3 per cent of GDP by 2022. (Hooda, 2013)
75
The health insurance in India gives a fragmented picture with number of different schemes
for various occupations, questions regarding inefficient implantation of RSBY, very low
penetration of health insurance in overall population. This leads to almost 70 % of the total
spending from private sector 87 % of the private sector health expenditure from out of
pocket expenditure.
On this background we moot that the issue of financial feasibility of providing health
insurance for all must be considered in India. The following sections present the product
design and fiscal feasibility of Government financing of universal health insurance in India.
3.2.3 Social Security schemes in Maternity Benefit
India has been longing to achieve the status of an economic super power for years. That
mandates an all-round development of the country – encompassing all the sectors of society
irrespective of cast, creed, economic status and gender. While there have been many
attempts to make development immune to the first three criterion, the last one i.e. gender-
bias is still a problem in India. Women have been always being under suppression and
neglected as a part of the Indian society. We have been talking of women empowerment in
this era – but the objective is far from achieved.
Gender, apart from economic, social and political factors, plays a major role in determining
food security and nutritional status in India. Women tend to eat last and the least in many
families. It is often believed that boys/men require more nutrition because they are
physically more active. But women’s needs are greater, especially during adolescence,
pregnancy and breastfeeding. Women were the only players won medals for India in recent
Rio Olympics-2016! Contradicting the long-standing beliefs, even in physical activities
women are leading.
Gender discrimination has always been a problem in India. The data shows that 60% of
women in their child bearing years are adversely affected due to inadequate nutrition during
their own childhood; 80% of pregnant women ail from iron deficiency (anemia). The birth
weight of infants exhibits a pronounced relationship with the nutritional status of the
mothers therefore a malnourished and anemic woman is more likely to deliver an
underweight baby (National Family Health Survey (NFHS III) 2005-06)

76
Women being the bearers and nurturers provide the foundation for generating future
citizens for the country and actors for the economy. In addition, women also contribute as
workers to the nation’s gross national product, though in the labor market, women’s
reproductive role limits their full participation and acts as a basis of gender discrimination.
Maternity Benefit is a tool that enables them to participate in the labor force even while
pregnant and provides employment security and reimbursement for loss of wages while on
maternity leave. Poverty and vulnerability provide additional arguments for state facility
of social security including maternity protection and childcare in India. The Indian state is
bound to the provision of Maternity Benefit by the Constitution and by being a signatory
of the ILO Convention 1919. Maternal mortality is defined by National Family Health
Survey-III (NFHS-III) as the death of a woman during pregnancy or delivery or within 42
days of the end of pregnancy from a pregnancy - related cause.(Ministry of Women and
Child development, 2010)
According to Indian express May 7, 2014, newspaper report, India accounts for the
maximum number of maternal deaths in the world - nearly 17% or nearly 50000 of the 2.89
Lacs pregnant mothers who died because of complications due to pregnancy or
childbearing in 2013. India stands at 190th Rank worldwide in 2013, which though
progressed from the 220th Rank in 2010 but still abysmal, as per the World Bank data.
According to the World Health Organization (WHO) report, India’s Maternal Mortality
Rate(MMR), which was 560 in 1990, reduced to 178 in 2010-2012. As per the
Millennium Development Goal (MDG) mandate, however, India had to decrease its MMR
further down to 103. Though India’s MMR is reducing at an average of 4.5 per cent
annually, it had to decrease the MMR at the annual rate of 5.5% to meet the
MDG.(Mohapatra & Nanda, 2015)
Infant mortality declined marginally to 42 deaths per 1,000 live births in 2012 from 44
deaths in 2011 according to the latest data released by the Registrar General of India,
Annual Health Survey.One in every 24 infants at the national level, one in every 22 infants
in rural areas, and one in every 36 infants in urban areas still die inside one year of life, the
report said. Next is the Infant Mortality Rate(IMR) of India for various years.

77
FIGURE 3-1 : IMR (Infant Mortality Rate) Of India
Infant Mortality Rate
150 100 50 0
Source: https://data.gov.in/
The National Rural Health Mission (NRHM) aimed to reduce the Infant Mortality Rate
(IMR) to 28/1000 live births, the Maternal Mortality Rate (MMR) to 100/ 100000 live
births and the Total Fertility Rate (TFR) to 2.1 by 2012. With IMR at 40 and MMR at 167
in 2013, only TFR seems anywhere near the goal set with 24 of the 29 states and 9 UTs
achieving replacement levels of fertility. This achievement however is an indication of the
focused attention that fertility control has received across the country, often resulting in
tragic human rights violations in mass sterilization camps, targeting the poor. With IMR
and MMR still lagging behind, the success of family planning programmes is often at the
cost of quality and access improvements in healthcare in general.(Annual Report To The
People On Health, 2011)
The persistently high infant and maternal mortality rates make a strong case for the
universalization of maternity protection. That is, maternity protection/support should be
demand-driven and based on self-selection.
In Mexico, a national health insurance program called Seguro Popular, introduced in 2003,
provides access to a package of comprehensive health services with financial protection
for more than 50 million people previously excluded from insurance. Since its inception,
there is evidence that Seguro Popular has improved access to health services and reduced
the prevalence of catastrophic and impoverishing health expenditure, especially for the
poor(Rai & Singh, 2012) .The reduction of maternal and child deaths, and coverage of

78
maternal and child healthcare services, have been improved. These efforts can be emulated
by countries seeking to provide universal health coverage the individuals and populations.
Learning from this experience will help to improve health conditions and financial
protection and will also contribute to the global movement towards universal health
coverage.
The High-Level Expert Group(HLEG) Report on Universal Health Coverage for India,
instituted by the Planning Commission, Government of India, suggested that the ‘National
Health Package’ cover essential health at primary, secondary, as well as tertiary level care
for all citizens of India by 2022.It suggested a comprehensive “package” for maternal
healthcare to control maternal deaths in India. NRHM since its launch in 2005, has
provided the key strategy to India’s current public health system, has influenced the
development of new guidelines to strengthening prenatal, natal and postnatal service
delivery, and promoted the extended use of available health infrastructure, particularly
human resources, at facility and non-facility levels.
Limitations of the employment linked maternity benefit scheme
The data has shown that only around 38.4 per cent of rural and 19.6 per cent of urban
women aged 15–49 is in the workforce. In the prime childbearing age interval (20–29
years), even smaller percentages (34.2% of rural and 17.8% of urban) women are
workers.(Lingam & Kanchi, 2015). This suggests that the major share of women (61.6%
of rural and 80.4% or urban) are left out of any employment-linked Maternity Benefit
cover.
The only maternal support available to women out of the workforce, in the form of cash
compensation through the Janani Suraksha Yojana (JSY) and similar schemes including
support in kind through the Integrated Child Development Services Scheme (ICDS), is
insignificant and available only to below poverty line (BPL) women. One of the most
important limitations of the schemes - is the exclusion of the poorest due to lack of
awareness and high transaction costs. Although it is true that in terms of vulnerability, rural
scheduled tribe and scheduled caste women with no or low levels of education form the

79
primary group of women requiring maternity protection, especially because they are also
among the poorest.
The level of women’s work participation in rural areas and in agriculture is around (64.8%)
and their preponderance in certain sectors (agriculture in rural and service sector in urban
areas), occupations (low end jobs, domestic workers, migrant labor, vendors etc.,) and type
of work (unpaid work or self-employment as opposed to paid work that is, regular/salaried
or casual work) implies that the majority of women are in the unorganized sector and are
informal workers – without any kind of social security.
Maternity Benefit cover is provided to a narrow segment of formal workers in the
organized sector by the Employees State Insurance Act (ESIA) and the Maternity Benefit
Act (MBA).
So, there is a need to have a universal maternity benefit for women irrespective of the social
group they belong to, cast, creed and the employment status.
Constitutional Provisions
Just to show that the maternity benefit in principle, has a backing from Indian constitution
and hence the government is liable to facilitate the same:
Article 47 requires that the State should, as its primary duty, raise the level of
nutrition and the standard of living of its people and improve public health.
Article 42 requires that the State should make provision for securing just and
humane conditions of work and for maternity relief.
Article 43 mentions that the State shall endeavor to secure to all workers
agricultural, industrial, or otherwise, a living wage, such conditions of work that
ensure a decent standard of life.
Maternity benefit and Women Workers: Existing Scenario
In India early marriage and childbearing in the early age is common. According to the
National Family Health Survey 2005-06 (NFHS-3), the median age at marriages for women
is 17.2 years and the median age at first birth is 20 years. Going by the median age at

80
sterilization for women, 50 per cent of women complete their family size by age 25.5 years
and 81 per cent by age 30, implying that prime childbearing age is 20-29 years.
In 2009-10, only 38.4 per cent of rural and 19.6 per cent of urban women in the
reproductive age bracket (15 to 49 years) were in the workforce. And in the prime
reproductive age (20-29) only 34.2 per cent of rural and 17.8 per cent of urban women
were workers. Peak participation is achieved by rural women (49%) aged 35 to 49 and
urban women (27%) aged 35-39 years (Fig 3.2).
Further, there has been a decline in the Workforce Participation Rate (WPR) of women in
the reproductive cohort since 1993-94. The decline was sharpest (15.5 percentage points)
for women 24 to 29 years in rural and 45 to 49 years (8.8 points) in urban India.(Lingam
& Kanchi, 2015)
FIGURE 3-2: Age-specific Work Participation Rate
Source:(Lingam & Kanchi, 2015)
So, the data on prime childbearing age and the peak work participation age (34 plus years)
suggests that most of the women complete their family before joining the labour force. This
is a clear indicator that the women are deprived of the essential maternity cover when they
need it the most and the industry is deprived of a large section of workers especially when
they are in their active stage of life.
In the forthcoming sections we will delve into the kinds of benefits women can have
depending on the type of sector they are employed into.

81
Organized Sector and Maternity Benefit
Female workers in the organized sector form small fraction—less than 4 per cent of the
total female workforce. This Maternity Benefit Act in India enshrines that a woman shall
be entitled to the maternity benefit for a maximum period of 12 weeks of which not more
than six weeks shall precede the date of her expected delivery. If a woman could not avail
of six weeks leave preceding the date of her delivery, this could be availed after delivery.
This leave can be availed of as need arises, whether for rearing the children or looking after
any of their needs like examination, sickness, etc. until the child reaches 18 years of age.
A leave of 45 days is also granted in case of miscarriage (GoI 2008). While the recent
propose Maternity Benefit amendment act 2016 (Maternity Benefit Amendment.),
proposes the following:
Increase Maternity Benefit from 12 weeks to 26 weeks for two surviving children
and 12 weeks for more than two children.
12 weeks Maternity Benefit to a ‘Commissioning mother’ and ‘Adopting mother’.
Facilitate ‘Work from home’. Mandatory provision of Creche in respect of
establishment having 50 or more employees.
Private sector employees are covered under either Employee State Insurance (ESI) or the
MB Acts. The ESI Act (1948) covers employees earning less than ₹15000 per month, of
power using factories (other than seasonal factories) with over 10 and non-power using
establishments with over 20 workers. The MB Act (1961) basically meant to cover all those
not covered by the ESI, seeks to apply to factories, mines, plantations, including those
belonging to the government; to circus and to shops and commercial establishment in
which 10 or more persons are employed. The Acts are clearly designed to cover workers
in the organized sector only despite the constitutional guarantee extended to all women
workers.
Unorganized Sector/Informal Workers and Maternity Benefit
Most workers (more than 95%), as the foregoing analysis has revealed, are informal
workers with no maternity benefit cover under the ESI or MB Acts. All workers in the
agricultural sector are informal workers. In addition, according to the NSSO -66th Round,

82
only 0.10 per cent of non-agricultural female workers aged 15–49 years have access to
health care and maternity benefits (Table below). Those who are not eligible by this
estimate account for 99.9 per cent of the non-agricultural workforce.
Table 3-9 : Percentage of Female Non-Agricultural Workers 15-49 years of age,
eligible for various levels of social security.
Availability of Social Security Benefits Percentage (%) of female workers
Only PF/pension 0.3
(GPF, CPF, PPF, pension etc.)
Only gratuity 0
Only health care and maternity benefits 0.1
Only PF/pension and gratuity 0.1
Only PF/pension and health care and
maternity benefits 0.1
Only gratuity and health care and maternity
benefits 0.1
PF, pension, gratuity, health care and
maternity benefits 0.8
Source: Computed from Unit level data of NSSO 66 round
Given the abject poverty of these workers and the poor state of the access to the medical
care, such workers are likely to be deprived of the necessary care during pregnancy and
lactation but may also be forced to get back to work earlier than advised without maternity
support, with implications for the health and welfare of children and the household. Hence
this group is in need of the public provision of the maternity protection.
Summarizing, the defining characteristics of women of the reproductive cohort – their low
work participation, especially in prime childbearing age and almost complete dependence
on informal employment together with alarming rates of infant and maternal death - argue
for, first, a universal system of maternal support to all women, workers and non-workers
alike, on the basis of self-selection; and second , the expansion and modification of present
arrangements for Maternity Benefit to cover all workers. In the absence of such a scheme,
the costs to the economy of a failure to provide maternity cover to all are bound to be high.
Existing schemes in India
Below are the details of the existing maternity benefit schemes in India.

83
National Maternity Benefit Scheme (NMBS)
This scheme was introduced in 2001 to provide nutrition support to pregnant BPL women
through a onetime payment of ₹ 500/- eight to twelve weeks prior to delivery.
Under this Scheme, benefit was provided in the form of lump-sum cash assistance to
pregnant women of households below the poverty line subject to the following conditions:
1. The benefit was restricted to pregnant women for up to the first two live births to
women of 19 years of age and above.
2. The beneficiary belongs to a household below the poverty line as per the criteria
prescribed by the Government of India.
3. The amount of benefit is ₹500.The maternity benefit was disbursed in one
instalment 12–8 weeks prior to the delivery. In case of delay, it could be disbursed
to the beneficiary even after the birth of the child.
One of the review study conducted by Planning Commission (1999), states that, NMBS
was one of the landmark schemes in targeting women across country but the beneficiaries
had observed that the amount was not adequate for them. Based on cross-survey the
investigators of the Planning Commission had confirmed that:
Assistance should be given in two parts, 50% in pre-natal period and 50% in post-natal
period.
Higher post-natal assistance should be given in case of female child.
Amount should be given through cheque to avoid corruption.
According to the Government of India, Second Labour Commission’s Report (Sharma,
2005), the number of women who received cash payments under NMBS in 2003–2004 was
as low as 4.3 lakh—less than 2% of the total number of births in that year. In the year 2005,
the Government of India launched the Janani Suraksha Yojana under the National Rural
Health Mission to provide cash incentives for women to have an institutional delivery. The
NMBS was merged into the JSY, in 2006, and with the intervention of the Supreme Court
the benefits under the NMBS retained, irrespective of place of delivery.
84
Janani Suraksha Yojana (JSY)
The Government of India in 2005 launched the National Rural Health Mission (NRHM)
recognizing the need for marked improvements in provision of basic health care services
to rural people in the country. It seeks to provide effective, equitable, and affordable quality
health care services particularly focusing on the needs of women and children, the poorest
and most vulnerable segments of society. The Janani Suraksha Yojana (JSY) is one of the
schemes implemented as part of NRHM with a financial outlay of over ₹ 1,000 Cr. It is a
Cash-Conditional Transfer (CCT) mechanism and is a demand-side safe motherhood
intervention aimed at promoting institutional deliveries. Janani Suraksha Yojana (JSY)
under the overall umbrella of National Rural Health Mission (NRHM) has been proposed
by way of modifying the existing National Maternity Benefit Scheme (NMBS).
Its main objective was to increase institutional deliveries. Under the scheme, the
government provides a cash incentive for pregnant mothers to have institutional births as
well as pre- and ante-natal care. Under JSY, below poverty line pregnant women above 19
years of age are covered. So, the JSY primarily aims at promoting institutional delivery
while NMBS component (payment of ₹ 500) within the Scheme is limited. According to
the October 2006 JSY guidelines, all women in Low Performing States (LPS) receive cash
assistance if they have their baby in a government health Centre or accredited private
institution. In rural areas they receive ₹ 1400 and in urban areas ₹ 1000. The money is to
be dispersed at the time of delivery in the institution. The cash assistance to the mother is
mainly to meet the cost of delivery. They receive ₹ 500 cash assistance for their first two
births if these deliveries are at home. The cash is to be given at birth or around 7 days
before for “care during delivery or to meet incidental expenses of delivery.”
While NMBS is linked to provision of better diet for pregnant women from BPL families,
JSY integrates the cash assistance with antenatal care during the pregnancy period,
institutional care during delivery and immediate post-partum period in a health centre by
establishing a system of coordinated care by field level health worker. The Janani Suraksha
Yojana (JSY) is an incentive based programme for the promotion of institutional deliveries.
The main objective of this programme is to ensure that each delivery is conducted in an
institution and is attended to by a skilled birth attendant (SBA) to minimize/prevent
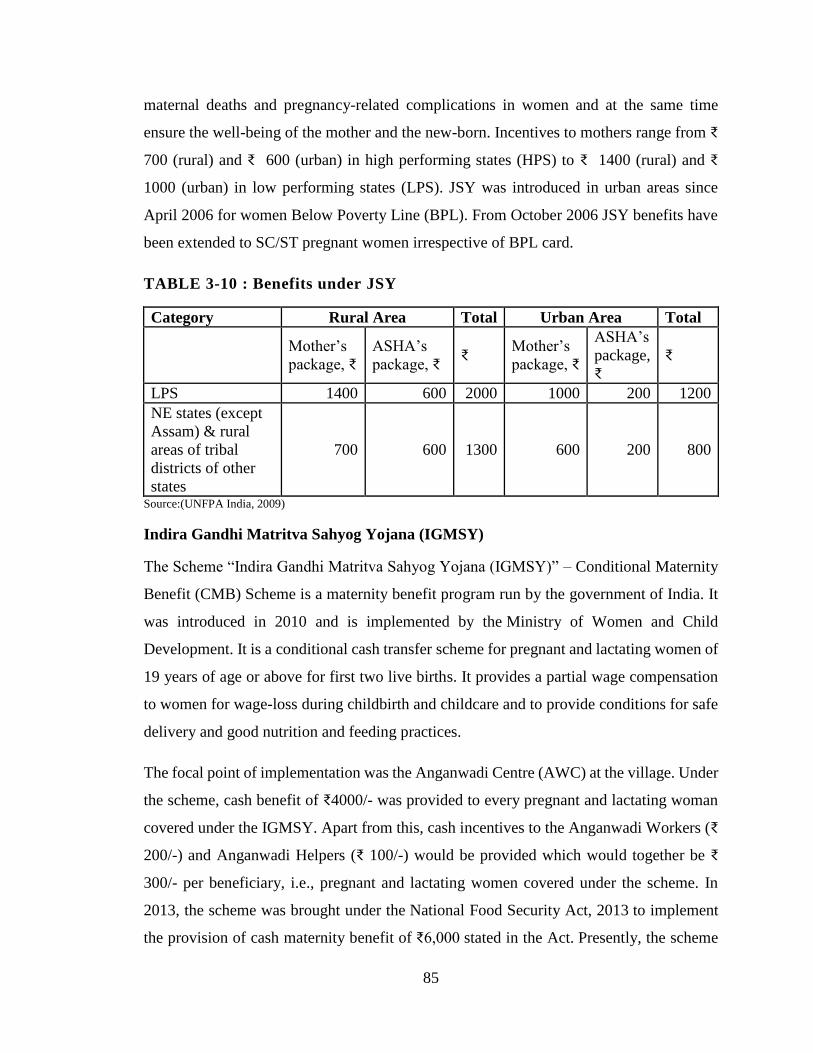
85
maternal deaths and pregnancy-related complications in women and at the same time
ensure the well-being of the mother and the new-born. Incentives to mothers range from ₹
700 (rural) and ₹ 600 (urban) in high performing states (HPS) to ₹ 1400 (rural) and ₹
1000 (urban) in low performing states (LPS). JSY was introduced in urban areas since
April 2006 for women Below Poverty Line (BPL). From October 2006 JSY benefits have
been extended to SC/ST pregnant women irrespective of BPL card.
TABLE 3-10 : Benefits under JSY
Category Rural Area Total Urban Area Total
Mother’s
package, ₹
ASHA’s
package, ₹ ₹
Mother’s
package, ₹
ASHA’s
package,
₹
₹
LPS 1400 600 2000 1000 200 1200
NE states (except
Assam) & rural
areas of tribal
districts of other
states
700 600 1300 600 200 800
Source:(UNFPA India, 2009)
Indira Gandhi Matritva Sahyog Yojana (IGMSY)
The Scheme “Indira Gandhi Matritva Sahyog Yojana (IGMSY)” – Conditional Maternity
Benefit (CMB) Scheme is a maternity benefit program run by the government of India. It
was introduced in 2010 and is implemented by the Ministry of Women and Child
Development. It is a conditional cash transfer scheme for pregnant and lactating women of
19 years of age or above for first two live births. It provides a partial wage compensation
to women for wage-loss during childbirth and childcare and to provide conditions for safe
delivery and good nutrition and feeding practices.
The focal point of implementation was the Anganwadi Centre (AWC) at the village. Under
the scheme, cash benefit of ₹4000/- was provided to every pregnant and lactating woman
covered under the IGMSY. Apart from this, cash incentives to the Anganwadi Workers (₹
200/-) and Anganwadi Helpers (₹ 100/-) would be provided which would together be ₹
300/- per beneficiary, i.e., pregnant and lactating women covered under the scheme. In
2013, the scheme was brought under the National Food Security Act, 2013 to implement
the provision of cash maternity benefit of ₹6,000 stated in the Act. Presently, the scheme

86
is implemented on a pilot basis in 53 selected districts and proposals are under
consideration to scale it up to 200 additional 'high burden districts' in 2015-16.
Critical evaluation of JSY and Others
JSY is a Conditional Cash Transfer (CCT) mechanism for a safe motherhood aimed at
promoting institutional deliveries. The per-capita expenditure on women also varies across
the states.
One of biggest of such programs in the world, the JSY has stimulated extraordinary
attention and curiosity by public health stakeholders worldwide because of its scale,
coverage, and budget. In just 4 years, its beneficiaries multiplied from 0·74 million in
2005–06 to 10.9 million in 2011-12 (GoI2013). The number of institutional deliveries
increased form 10.8 million in 2005-06 to 17.5 million in 2011-12. In addition, Janani
Shishu Suraksha Karyakram (JSSK), a new initiative which entitles all pregnant women
delivering in public health institutions to an absolutely no expenses delivery covering free
delivery including Caesarean, free drugs, diagnostics, blood and diet, and free transport
from home to institution including in a referral institution, is operation.
Budgetary allocation for the JSY increased from a mere US$8·5 million to $275 million
between 2005 and 2009.
But the nationally demonstrative District Level Household and Facility Survey 2007–2008
(DLHS-3) revealed that in India, almost 50% of women aged between 15–49 years had at
least three prenatal care visits; the lowest performance being 22% in Uttar Pradesh. Only
47% of women said that they underwent institutional delivery, and only 13% of eligible
women had received JSY assistance.
The poor quality of maternal-neonatal care facilities despite substantial inputs under the
National Rural Health Mission is a cause for concern.
Most public-sector facilities continue to be understaffed, and do not meet the desired
functional
Standards (DLHS-3, IIPS, 2009). Deliveries are often carried out by unskilled support staff
rather than by skilled nurses or doctors. The system of referral to a higher level for
87
emergencies is inadequate (Mohapatra, et al., 2008). Most mothers and babies are
discharged within hours after delivery because the hospitals lack amenities, and families
want to return home having got the cash incentive (MoHFW, 2008) although at least 48-
hour care is recommended under JSY. As a result, there is inadequate time for newborn-
care counseling, stabilization of the post-partum mother, and detection of danger signs in
the mother and the infant. There is an urgent need to ensure continuing postnatal care to
neonates and mothers at home, where they spend the rest of the at-risk postnatal period. It
has been recommended that the incentive to the ASHA for this function be increased.
There are other problems in the scheme too. Payments to families and the health workers
are delayed in places, and there are instances of corruption. Another serious issue is the
overshadowing effect of the JSY on other initiatives for maternal, newborn, and child
health. The results for JSY uptake indicate the central part that state authorities play in the
implementation of national health programmes in India.
The study (Stephen, et al., 2010) finds that the poorest and the least educated women do
not consistently have the highest odds of being JSY recipients indicates that an
improvement of the targeting of this program is required. There are several possible
explanations for why JSY uptake was not the highest in the poorest and least educated
women.
First, a common challenge seen in other large national social programmes that have
expanded in a short period is to reach the most disadvantaged population.
Second, physical access might be a substantial barrier for women in the lowest socio-
economic status groups since JSY payments can only be made in accredited health
facilities. Noteworthy is that Madhya Pradesh, which has made special efforts to accredit
remote health facilities; also has one of the highest levels of participation in JSY.
Third, cultural barriers against in-facility births are also prevalent among women of low
socioeconomic status in India, and these barriers must be addressed. Lower uptake by
Muslims

88
and Christians than by women of other faiths that might suggest poor reach of ASHAs in
these communities or poor access of these minorities to accredited health facilities.
Finally, the previous national maternity benefit scheme included a payment of 500 rupees
($11) to poor women for deliveries at home. In LPS, all births delivered in government
health center are eligible; in HPS assistance is available only up to two live births.
The experiment of introducing enticements for physicians to perform delivery to reduce
maternal mortality was believed fruitless. For instance, a public–private partnership
scheme called ‘Chiranjeevi Yojana’ or “plan for a long life” was launched by the
Government of Gujarat (western India) to bridge the gap in the availability of quality
maternal health-care services for Below-the-poverty-line families in rural areas by
collaborating with private practitioners in small towns. The state government paid private
gynecologists Rs 1795 per delivery – as well as Rs 200 to the patient for transportation
costs to the place of delivery and Rs 50 to the person accompanying the patient to
compensate for loss of wages. But, differing from expectation, there was no considerable
progress in the overall reduction of MMR in Gujarat in 2004–2006 (160/100 000 live
births) or 2007–2009 (148/100 000 live births). In contrast, the reduction was more
substantial in Uttarakhand/Uttar Pradesh, and even in Bihar/Jharkhand, which are
considered as underdeveloped states. The argument for this is that the promotion of
institutional delivery through JSY is not the only way to reduce maternal deaths;
The latest central maternity support program, namely the Indira Gandhi Matritva Sahayog
Yojana shackled by conditionalities which result in the exclusion of a considerable segment
of women (Lingam and Yelamanchili 2011). It also deliberately excludes those covered by
the ESIC. So, there is a need to make this scheme universal.
Additionally, there is thus a great deal of confusion and lack of uniformity as to the sections
of workers to which the current maternity benefit legislations apply. Coverage is partial,
fragmented and patchy.
89
3.2.4 Social Security schemes in Old Age Pension Benefit
In his election speech in 1935, Franklin Delano Roosevelt said, “it is the more obligations
to honor the right of citizen to live with dignity even in the retired life”.
“By providing financial protection against the major 18th and 19th century risk of dying
too soon, life insurance became the biggest financial industry of the century. Providing
financial protection against the new risk of not dying soon enough may well become the
next century’s major and most profitable financial industry,” said Peter Drucker the modern
age management and economics guru. He not only highlighted the importance and need of
an old age security system but also envisaged it to be a profitable venture of future.
India and the world at large are currently grappling with the problems of supporting old
age people. This problem is of typical in nature by itself. Society has advanced rather still
striving to increase the life of mankind. That’s a welcome move but that causes an increase
in aged population who can’t afford themselves on their own. They need a support system
at physical, psychological and economical level. Another set of problem is more applicable
for India – which already suffers from a population explosion which brings in, apart from
other problems, the problem of unemployment which in turn is the root cause of many
other problems like the crime rate. To address the unemployment issue Indian government
has fixed the age of retirement as sixty. This is to make way for the young in different jobs.
But that needs the retired person, if he doesn’t retire with a fortune, to be supported for the
rest of life, dependent – a tag itself lowers the self-esteem.
There was little in the way of public welfare system, to support or assist people in
difficulties. As mentioned in chapter 1, social security began to develop in the latter part
of the 19th century, initiated by Bismarck’s social insurance plan in Germany. In 20th
century social security schemes developed rapidly in different countries giving emphasis
on public provision on protection against different contingencies - sickness, industrial
injury, widowhood, retirement.
The paper named “The Future of Social Security “(Schalow,1968) projects that the
retirement costs of the baby-boom generation in the twenty-first century may be too great
a burden for future workers to bear. The paper highlights that there are cases in various
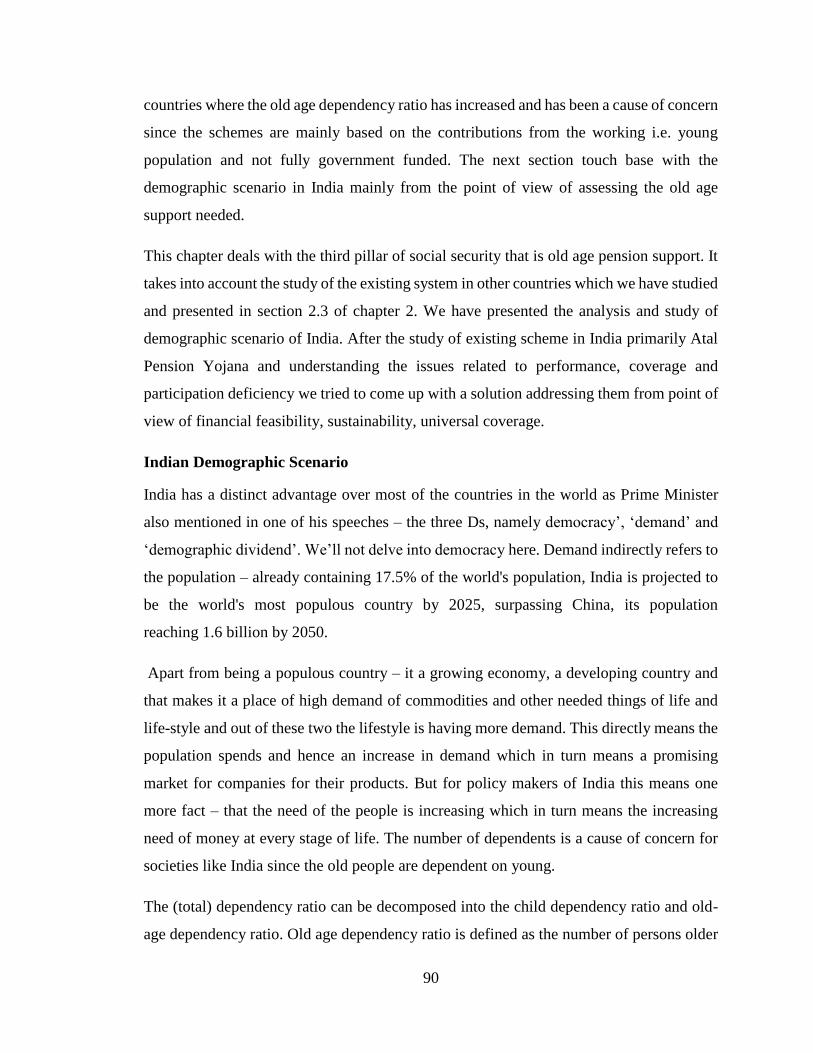
90
countries where the old age dependency ratio has increased and has been a cause of concern
since the schemes are mainly based on the contributions from the working i.e. young
population and not fully government funded. The next section touch base with the
demographic scenario in India mainly from the point of view of assessing the old age
support needed.
This chapter deals with the third pillar of social security that is old age pension support. It
takes into account the study of the existing system in other countries which we have studied
and presented in section 2.3 of chapter 2. We have presented the analysis and study of
demographic scenario of India. After the study of existing scheme in India primarily Atal
Pension Yojana and understanding the issues related to performance, coverage and
participation deficiency we tried to come up with a solution addressing them from point of
view of financial feasibility, sustainability, universal coverage.
Indian Demographic Scenario
India has a distinct advantage over most of the countries in the world as Prime Minister
also mentioned in one of his speeches – the three Ds, namely democracy’, ‘demand’ and
‘demographic dividend’. We’ll not delve into democracy here. Demand indirectly refers to
the population – already containing 17.5% of the world's population, India is projected to
be the world's most populous country by 2025, surpassing China, its population
reaching 1.6 billion by 2050.
Apart from being a populous country – it a growing economy, a developing country and
that makes it a place of high demand of commodities and other needed things of life and
life-style and out of these two the lifestyle is having more demand. This directly means the
population spends and hence an increase in demand which in turn means a promising
market for companies for their products. But for policy makers of India this means one
more fact – that the need of the people is increasing which in turn means the increasing
need of money at every stage of life. The number of dependents is a cause of concern for
societies like India since the old people are dependent on young.
The (total) dependency ratio can be decomposed into the child dependency ratio and old-
age dependency ratio. Old age dependency ratio is defined as the number of persons older
91
than 64 per 100 persons to the people in the age-group 15-64 years. Child dependency ratio
is the ratio of younger dependents--people younger than 15-to the working-age population-
those ages 15-64. The Old age dependency ratio in India was last reported at 7.71 in 2011,
according to a World Bank report published in 2012.
FIGURE 3-3:Old age dependency ratio of India
Source : (World Data Bank - Old Age Dependency Ratio of India)
Today more than fifty percent of aged persons in India are surviving below the poverty line
and more than 80 percent of the elderly are depending on others especially children for
their day today activities. The increasing dependency ratio brings more economic pressure
on working population. As the ratio increases there may be an increased burden on the
productive part of the population to maintain the means of livelihood of economically
dependent.
Over time, the huge bulge in the working force – which is being considered as an economic
windfall -- is expected to retire. A larger number of older and retired people, in the absence
of a dependable pension system, will pose a danger to the old age income security in the
country and need a dedicated effort from the government to route expenditure towards
providing for health and pension spending. This causes a drain on the state of the fiscal
and, subsequently, on the economy.
The situation could become like that of China where the working population is shrinking
(Macauley, 2016) and as one of the measures, China announced that it would end its

92
decades-old “one-child” policy, a tacit acknowledgement that the country’s aging
population threatens its economic rise.
In India, the proportion of those aged 60 and above is expected to climb from 4.6% in 2000
to 9% in 2030. In absolute numbers, the number of people above the age of 60 will increase
from 87.5 million in 2005 to 100.8 million in 2010 and this is expected to jump to 200
million by 2030. By 2050, it is expected to be over 320 million (World Population Ageing:
1950-2050, United Nations). What causes the problem is the fact that improved economic
development is bound to lead to a higher life span. The inability to implement a properly
functioning pension system now is likely to affect a larger number of people in the future.
What further complicates matters is that only about 12% of the working population
participates – and is eligible to participate -- in the mandatory, formal programmes
designed for providing income security during the non-earning years. These employees are
largely part of the formal sector (private sector and the government). The rest is either part
of the informal sector (which goes unreported in the broader economic scheme) or does
not enjoy adequate income streams that can be accommodated in the existing pension
schemes.
Having a greater proportion of people in the working age group can mean faster per capita
economic growth, but only if their full potential is realized. A look at the state of
employment in the country shows that India is still far from deriving any real advantage
from its demographic dividend.
Data on employment in India is provided by three different agencies - the National Sample
Survey Organization (NSSO), the Labour Bureau and the decadal Census.
The census, which counts those not working (even part time) but “seeking or available for
work”, shows up a far higher level of unemployment than both the NSSO and the Labour
Bureau sample surveys of contiguous years
In 2011, over 56 million people aged 15 and above who were not working were either
seeking or available for work, putting the unemployment rate at 10.7 percent. This,
however, did not capture the full force of job seekers. Just short of a quarter of the work

93
force was comprised of “marginal workers” – workers who were able to find work for less
than 6 months. Nearly half of the marginal workers were also “seeking or available for
work” taking the count of job seekers to nearly 21 percent of the labour force. So, the policy
of having only the working population involved in contributing towards future pension
may not work.
So, considering the points mentioned above we need an inclusive old age pension system
in place in our country which takes care of the ageing population which is not in the earning
stage of their life and till the time the unemployment problems is fully addressed, the old
age pension schemes need to be supported by the government, to an extent.
Categories of Pension Schemes
Any pension system in the world can be said to broadly conform to any one, or a
combination of the categories mentioned below(C.D.Daykin, 1996)
First type can essentially comprise all the state-funded pension plans, which in theory
should ideally cater to every citizen in the country. This is also the category under which
the government launches some of its poverty alleviation programmes aimed specifically at
the aged. The system is publicly managed, the liabilities are not actuarially funded, and the
scheme works on what is termed as Pay-As-You-Go. This means that current revenues are
used to meet current expenditures. But, in fiscal terms, the consequences need a slightly
more detailed look – the current generation’s tax payments are used to pay the pension
liabilities of an earlier generation. The World Bank’s famous report on pensions, called
Averting the Old Age Crisis (1994), defines this one thus: “a publicly managed system
with mandatory participation and the limited goal of reducing poverty among the old”. In
India, the defined benefit pension system in vogue for the civil services at both the Centre
and the state level – including in the railways, defense and telecommunication services –
fall under this category, where the system is essentially non-contributory in nature and any
year’s pension liabilities are met from the government’s annual revenue expenditure
account for that year.
Second one typically comprises a mandatory savings programmes at the employment level
which is either privately or publicly managed. In simple terms, it is a forced savings
94
category that provides benefits only to contributors, and in general, incorporates a direct
linkage between the volume of contribution and the extent of benefits received. In India,
the Employees Provident Fund, which is India’s largest defined contribution and publicly
managed plan, is an example of this. In addition, there is the Employees’ Pension Scheme,
a publicly managed scheme carved out of the EPF scheme with the objective of paying a
monthly pension to workers after their retirement.
The third type includes all kinds of voluntary savings, available to everyone including those
looking to supplement their type 1 and 2 pension provisions. In India, the Public Provident
Fund scheme fits the definition.(D. Swarup.2008)
The Need to Focus on Pension Benefit
Below are the reasons mandating the need to overhaul or design a comprehensive pension
benefit for the old age population.
Population aging
As mentioned above in India, the proportion of those aged 60 and above is expected
to climb from 4.6% in 2000 to 9% in 2030 including the absolute number 200
million by 2030. (World Population Ageing: 1950-2050, United Nations).
Skewed coverage - focus on the organized sector
Existing pension schemes in India predominantly cover mainly the organized sector
workers, constituting about 10 percent of the aggregate workforce. While the
number of workers in the unorganized sector, covered under the schemes are merely
2 million - less than 10 percent of the covered organized sector workers and just 1
percent of the total unorganized sector working population.
Disparities in the pension benefits
Fragmentation of the current pension system has occurred due to the disparate
benefit levels within the organized sector where public sector employees are treated
rather generously vis-à-vis the private organized workers. A striking characteristic
of the current system is the varying range and level of benefits within the organized
sector.

95
Problems with provident funds
In a provident fund system, the income replacement, investment and inflation risks
are borne by the plan participants. It does not provide protection against the whole
length of the contingency. The inability to ensure that lump sum payments are used
to provide old age protection is a serious draw back of the current system. Majority
of the workers being low wage earners have little additional savings and much of
the lump sum amount is spent in meeting essential needs after retirement. Second,
the provision of liberal non-refundable withdrawal facility from provident funds to
meet various contingencies during the employment period significantly reduces the
quantum of benefit at retirement. To address this issue to an extent the current
finance minister in the budget of 2016-2017 proposed some of the measures to
encourage that including the restrictions on early withdrawal, taxing the maturity
lump-sum amount if it’s not invested in a pension fund. The proposals have been
backed out later in the wake of public resistance.
Rising financial burden of public pension schemes
The rising number of retirees and the increasing generosity of the public pension
programs are rapidly jeopardizing their long-term financial sustainability. Pension
schemes of the central as well as various state governments are facing acute
financial crisis due to lavish benefit provisions.
Government control
The current pension system is heavily regulated by government agencies. State
control and interference in administration and supervision has only hindered the
growth of the pension system. There has been widespread recognition that the
current regulations are impeding the growth of the pension system. Many claim that
greater autonomy for the provident and pension funds, supported by an
environment of prudential regulations, is essential.(Goswami.)
96
Initiatives from the past
Recently in the Budget of 2016-2017 the finance minister expressed the desire of
the government to make India a ‘Pensioned Society’ but the initiatives in this area
have been started long back.
Notwithstanding the limited size and scope, India has a long tradition of pension and other
forms of formal old age income support system. The history of the Indian pension system
dates to the colonial period of British-India. The Royal Commission on Civil
Establishments, in 1881, first awarded pension benefits to the government employees. The
Government of India Acts of 1919 and 1935 made further provisions. These schemes were
later consolidated and expanded to provide retirement benefits to the entire public sector
working population. Post-independence, several provident funds were set up to extend
coverage among the private sector workers.
But recently the government began to take note of the looming pension crises necessitated
by an existing anachronism in the civil service pension scheme – a defined benefit scheme
inherited from the British administration, which was showing all signs of being
fiscally unsustainable and, secondly, by an important event in the mid-nineties in which a
part of the age-old defined contribution scheme, the Employees Provident Fund Scheme,
was converted into a defined benefit scheme in the form of the Employees’ Pension
Scheme, 1995. This marked a curious move by the Indian government, particularly at a
time when the rest of the world was moving away from Defined Benefit (DB) to Defined
Contribution (DC). However, the introduction of NPS a few years later might be seen as
an attempt to make course corrections.
The Ministry of Social Justice and Empowerment (earlier called the Ministry of Welfare),
in 1998, commissioned the first comprehensive study of India’s pension sector under the
chairmanship of former UTI Chairman Dr. S A Dave, under the name of Oasis (Old Age
Social and Income Security) Project. As part of its overall recommendations, the Oasis
committee (which submitted its final report in January 2000) suggested a completely new
and completely different architecture through portable individual retirement accounts,
across-the-counter service delivery platforms, centralized record keeping, competing

97
pension fund managers, extensive use of information technology, freedom to choose
investment menus, among other things.
The turning point came on February 28, 2001, when former Finance Minister, Mr.
Yashwant Sinha, announced this in his Budget speech for 2001-2002 that the Central
Government pension liability has reached unsustainable proportions: as a percentage of
GDP, it has risen from about 0.5 per cent in 1993-94 to 1 per cent in 2000-2001. As such
it is envisaged that those who enter central government services after October 1, 2001
would receive pension through a new pension program based on defined contributions. A
High-level expert group was formed to review the existing pension system and to provide
a roadmap for the next steps to be taken by the Government and to give its
recommendations.
The next Finance Minister Jaswant Singh took this forward in his Budget speech of
February 2003 and announced the restructured pension scheme for new Central
Government employees, a scheme for the public. The scheme was declared to be applicable
to Government service, except to the armed forces, and upon finalization, offer a basket of
pension choices. The scheme was made available, on a voluntary basis, to all employers
for their employees, as well as to the self-employed. This new pension system was based
on defined contribution, shared equally in the case of Government employees between the
Government and the employees. There would, of course, be no contribution from the
Government in respect of individuals who are not Government employees.
The new pension scheme would be portable, allowing transfer of the benefits in case of
change of employment, and will go into ‘individual pension accounts’ with Pension Funds.
The Ministry of Finance will oversee and supervise the Pension Funds through a new and
independent Pension Fund Regulatory and Development Authority. Thus, began the
transition from the age-old defined benefit scheme to the fiscally prudent defined
contribution scheme as part of the National Pension System. In December 2003, the Interim
Pension Fund Regulatory and Development Authority were created as the watchdog and
promoter for the pension sector. Simultaneously, all government employees joining service
on or after January 1, 2004, was compulsorily brought under the coverage of the New
Pension System (NPS).

98
Existing Schemes in India
This section lists the two main existing schemes available for the common person in India.
These schemes are open to everyone irrespective.
National Pension Scheme
National Pension Scheme NPS is a defined contribution (DC) scheme replacing the defined
benefit scheme(DB) available to the Government employees until then. Most of the states
have also migrated to the DC system under NPS, except three states. Only one category of
government employees has been exempted from mandatorily moving to NPS: personnel
from Armed Services. NPS was introduced for all citizens from May 2009.
Each government employee contributes 10% of his salary (basic+ DA+DP) to the pension
account, which is then matched by a government contribution of an equal amount.
However, non-government employees do not get the benefit of a matching government
contribution. In both the cases, investors are free to contribute higher than what has been
mandated. All these contributions are accrued in a pension account called Tier-I from
which funds cannot be withdrawn. Once the account-holder reaches the proper exit age (60
years, relaxed to 50 years for Swavalamban beneficiaries in Budget 2011-12,), he/she can
withdraw only up to 60% from the accrued savings corpus. The balance 40% in the savings
corpus must be used to compulsorily purchase annuities sold by any life insurance
company. This annuity then provides for regular pension streams over the non-working life
of the investor. In addition, there is a tax issue at work here as well. The contributions to
this account and the savings accrued are exempt from income tax, as per Section 80CCD.
However, when the investor withdraws the amount on maturity, it is taxable.
To encourage the people from the unorganized sector to voluntarily save for their
retirement and to lower the cost of operations of the New Pension Scheme (NPS) for such
subscribers, the Government decided to contribute ₹ 1000 per year to each NPS account
opened in the year 2010-11. This initiative, “Swavalamban” (which is now part of Jan-
Dhan Yojana) is available for persons who join NPS, with a minimum contribution of ₹
1000 and a maximum contribution of ₹ 12000 per annum during a financial year.

99
This scheme is open to those citizens of India who are not part of any pension/provident
scheme. The per capital Incentive payable to Aggregators has been revised from ₹ 50 to ₹
100/-.
"NPS -Swavalamban Model" is designed to ensure ultra-low administrative and
transactional costs, to make small investments viable. Government is to contribute ₹ 1000
per year to each NPS – Swavalamban account opened in year 2010-2011,2011-2012 ,2012-
2013 for five years as under.
Account opened in 2010-2011 will get the benefit till 2014-2015
Account opened in 2011-2012 will get the benefit till 2015-2016
Account opened in 2012-2013 will get the benefit till 2016-2017
NPS – Swavalamban account opened in the period 2013-2014 to 2016-2017 will get the
Swavalamban benefit up to 2016-17.
Distinguishing Features of NPS -Swavalamban
Voluntary - Open to eligible citizens of India, in the age group of 18–60 years.
Subscriber is free to choose the amount he/she wants to invest every year.
Simple – Eligible individuals in the unorganized sector can open an account
through their Aggregator and get an Individual subscriber (NPS - Swavalamban)
Account.
Safe - Regulated by PFRDA, with transparent investment norms, regular
monitoring and performance review of fund managers by NPS Trust.
Economical – Ultra-low-cost structure with no minimum amount required per
annum or per contribution.
Till year 2016 around 10 million people have been registered with NPS. However,
when weighed against the fact that it has been more than twelve years since NPS
was first made mandatory for government employees, the enrolments do seem to
be on the lower side. In May 2009, NPS was thrown open to the public. The
subscription levels so far remained rather tepid and did not seem to reflect any
investor interest in the product, given that the scheme architecture was designed to

100
make it attractive to the public. In terms of money managed by the PFMs, as of Aug
31, 2016, the total assets under management by all PFMs amounted to Rs 1.44 Lacs
Cr. Of this, the contribution from the nongovernment sector does not exceed Rs
13449 Cr. This reflects the sluggish growth of NPS.
TABLE 3-11 : Number of Subscribers Registered under NPS (As on 31st
August 2016)
FY 2016-17 up to
31/Aug/2016
(cumulative)
No. of Subscribers Total Contribution
M&B (₹ Cr)* AUM (₹ Cr)
Central Government 1,723,203 40,477.18 56,760.58
State Government 3,110,200 56,306.77 71,329.08
Corporate Sector 514,411 9,841.19 11,752.91
Unorganized Sector 254,677 1,586.73 1,763.87
NPS Swavalamban 4,459,049 2,022.71 2,508.71
Total 10,061,540 110,234.58 144,115.15 Source:(Assets Under Management and Number of Subscribers - NPS, 2016)
Weaknesses of NPS
As reflected above the subscription levels have been pretty low for NPS. They could be
attributed to the below factors:
The scheme is available to the working population only.
Non-government employees do not get the benefit of a matching government
contribution.
On maturity withdrawal is allowed up to 60% from the accrued savings corpus but
that will reduce the fund available to pay the pension and hence reduce the pension
amount to the unreasonable levels which anyway is not inflation immune.
Financial literacy required to be in the NPS that is also inadequate.
The NPS does not even guarantee a minimum pension, thus defeating its objective
of a certain old age support.
Owing to these reasons NPS has been unsuccessful to reach those people who do
not have the capacity to save for future long term consumption and has not served
the best interest of workers and has seen a lukewarm response so far, with a majority

101
of subscribers being central and state government employees, for whom the scheme
is mandatory (Sanyal, 2013). Thus, there is a necessity for a different pension
scheme in India which not only ensures a minimum pension and tries to cover
majority of the working force but also is feasible from the point of fiscal cost of the
country.
Atal Pension Yojana
In his Budget Speech for 2015-16, the Finance Minister has, announced a new initiative
called Atal Pension Yojana (APY). The APY will be focused on all citizens in the
unorganized sector, who join the National Pension System (NPS) administered by the
Pension Fund Regulatory and Development Authority (PFRDA) and who are not members
of any statutory social security scheme. Under the APY, the subscribers would receive the
fixed pension of ₹ 1000/2000/3000/4000/5000 per month, at the age of 60 years,
depending on their contributions, which itself would vary on the age of joining the APY.
The minimum age of joining APY is 18 years and maximum age is 40 years. Therefore,
minimum period of contribution by the subscriber under APY would be 20 years or more.
The benefit of fixed pension would be guaranteed by the Government. The Central
Government would also co-contribute 50% of the subscriber’s contribution or ₹1000 per
annum, whichever is lower, to each eligible subscriber account, for a period of 5 years, i.e.,
from 2015-16 to 2019-20, who join the NPS before 31st December 2015 and who are not
income tax payers. The existing subscribers of Swavalamban Scheme would be
automatically migrated to APY unless they opt out.
Table of contribution levels, fixed monthly pension of ₹ 1,000 per month to subscribers
and his spouse and return of corpus to nominees of subscribers and the contribution period
under Atal Pension Yojana has been presented in section#3 in the Appendix.
This has been a revolutionary scheme compared against the ones India has had in the past
that has clearly laid the plan with a crystal-clear contribution and the pension amount
against the specific age. The amount of pension is guaranteed by the government hence it
alleviates any uncertainty and doubts from the mind of beneficiaries.

102
Moreover, in this scheme the government has got the best of both the worlds ‘Defined
Contribution’(DC) and ‘Defined Benefit’(DB). The main benefit of DC is that the
contribution is fixed and hence the commitment from the beneficiary and encourages
him/her to save something for his future. The benefit of DB is it guarantees the benefit and
hence relieves the subscriber of any uncertainties of the benefit he/she expects.
The APY has a prominent gap associated with it with respect to universalization. The
people above forty years of age have been excluded from the scheme. This age group in
fact is more vulnerable and hence need the support, the most.
The main purpose of pensions is smoothening of consumption and mitigating longevity
risks, poverty and inter-intra generation inequality. Universal pension scheme is found to
do this successfully for each and every person of this country. An introduction of such a
scheme will therefore enhance the welfare of the working cohorts of India majority of
whose future lies in uncertainty.
As mentioned in the previous sections, there have been plenty of schemes initiated by the
government of India as well as state governments but as can be seen, couple of those have
been dedicated to the specific occupational groups or social groups and hence are not
universal in nature and probably the cause of insufficient coverage of the social protection.
The report (“ILO social security and other labour standards,”.) Report on social security
status at an International level) .Some areas are identified as well as evaluated in relation
to financing of the schemes for example
Is social security marred by ageing?
Is social security faces threat from globalization?
Has social security reached the limits of its affordability?
Social protection programmes must be available to all individuals without discrimination
of any kind. Universal social protection systems – those which provide benefits to all
residents without conditions – are the best way for States to meet their human rights
obligations to ensure that there is no discrimination in the selection of beneficiaries(ILO
social security and other labour standards)

103
The study suggests the universalization of the schemes instead of each one concentrating
on one individual or separate sector of the population. Secondly the state should play a
major role in financing the schemes instead of making them contributory.
104
Chapter 4
Proposed Product Design for Comprehensive Social
Security
This chapter explains the comprehensive social security scheme. The discussion in the
earlier chapter’s reveals that the social security schemes in India are facing various issues.
The targeted beneficiaries approach is not being very effective. Mainly because the success
of the schemes is measured in terms of the number of beneficiaries targeted. However, the
use of benefits, the profile of the bencificiaries, the actual benefit amount claimed and its
composition among various economic and strata and regions are crucial factors deciding
the quality of these schemes. The main argument behind the universal comprehensive
social security program is that there are no inefficiencies arising due to selection bias, moral
hazard, leakages and gaps.
The design of this universal comprehensive social security product is elaborated in the
following sections. As mentioned earlier the social security as defined for this study is four
pillars viz. Life Insurance, Health Insurance, Maternity Benefit and Pensions (based on
ILO and the chapter explains each of the components of the proposed social security with
respect to: Assumptions, Calculations of costs/premiums, age group of beneficiaries, data
and methodology used for calculation of total cost to the exchequer. The fiscal implications
of this product are discussed in the next chapter number 5.
4.1 Life Insurance
4.1.1 Objective of new scheme
A single non-ambiguous universal life insurance scheme that is applicable for the whole
population.
4.1.2 Data used for calculation of costs
Population sourced from Census of India-2011.
Age wise mortality rate sourced from Sample Registration Survey 2011.

105
Present value calculated based on assumption of 6% rate of Interest. v=1/(1+0.06) =
1/1.06=0.94
4.1.3 Assumptions
The proposed schemes are applicable only for the population of eighteen years to fifty-
nine.
For calculation, population distribution data is taken from Census 2011.
The proposal is based on mortality tables which directly affects the calculations. In this
calculation Mortality tables (2006-07) has been used which can vary based on actuals.
The specific present value tables of 6% rate of Interest have been used from actuarial
tables for calculating the fund value for the insurance proposal schemes. The Reserve
Bank of India keeps its benchmark interest rate average at 6 percent.
With respect to budget requirement to implement the proposals in our study, we have
excluded the administrative and miscellaneous expenses.
4.1.4 Methodology
The present section describes single non-ambiguous Life insurance scheme for the whole
population;
4.1.5 Annual Premium Calculation
While deriving the level annual premium, the basic principle followed is that the present
value of the cost benefits paid must be exactly equal to the premium charged for the benefit.
Pₓ = C*v
Where Pₓ = Individual Level Annual Premium.
C= Death benefit amount in ₹
v=1/ (1+i) i.e. the present value of death benefit, i being the interest rate.
For calculations here, we have taken i=6%.
v=1/ (1+0.06) = 1/1.06=0.94

106
Mortality Table
The calculation of premium of a life insurance policy primarily determined by the risk
attached with assuring the person. The chances of having the person of that age die.
Probabilities of deaths and survivors are needed to enable to make a reasonably accurate
estimate of liabilities under the insurance contracts.
No man or machine in this world can project the death of a living being on this earth so the
risk assessment is based on certain factors that in turn give the chances of the death of the
person at a time. These factors have been developed overtime based on the historical
experiences and the correlation between them and a person’s life and developed based on
various researches. Various life insurance companies and institutions broadly use a table
compiled, listing the death (or mortality) rate for an age group. In India, such a table is
published by Insurance Regulatory and Development Authority and is being used by
almost all the insurance companies operating in India. Of course, the table is updated
regularly after a certain period to take care of the change in life expectancy due to various
reasons. The mortality table published by IRDA, in 2004-2006 is pasted in the section#8
in the Appendix.
Going into the specifics for what is mentioned above, we can take that out of 10,000 lives
(in a sample) all aged 35, 18 dies within one year i.e. before attaining age 36, the observed
mortality rate at age 35 works out to 18/10,000=0.0018.
Estimation of Total cost of Providing Universal Life Insurance:
Total Budget (Bₓ) needed to pay the premiums of the x-aged population is given by:
Bₓ = pₓ*C*v*qₓ (Ref: Mathematical Basis of Life Assurance, published by Insurance
Institute of India)
Where pₓ = population of age x years taken from Census 2011.
qₓ = death rate for age x taken from Sample Registration Survey 2011.
Total Budget (Btotal) needed to pay the premiums of the whole population is given by:
1. 𝐵𝑡𝑜𝑡𝑎𝑙 = ∑ 𝐵𝑥59𝑥=18
Btotal = B18+B19+……B59

107
Premium is calculated based on the above-mentioned formula and also calculated the total
budgetary requirement to pay the premium for the whole population in the table presented
below.
Based on this formula we have calculated the budget needed to pay the premium for the
whole population for the sum assured of 200000 and presented in the table below. The
benefit amount of ₹ 2, 00,000 is same as that of (Pradhan Mantri Jeevan Jyoti Bima Yojana
(PMJJBY).
4.1.6 Detailed Results
The following table presents the age wise premium expenditure for the proposed universal
life insurance for the entire population of India according to 2011 census
TABLE 4-1: Life Insurance Premium Expenditure Age-wise
Age
Total pₓ
Sum Assured
(in ₹), C
Death Rate for age
x, qₓ
Total premium
Expenditure(in Cr
₹) Bₓ = pₓ*C*v*qₓ
18 27958147 200000 0.0008 422.01
19 20859088 200000 0.000848 333.75
20 28882735 200000 0.000888 483.92
21 19978972 200000 0.000919 346.43
22 23528225 200000 0.000943 418.62
23 19154055 200000 0.000961 347.30
24 19880235 200000 0.000974 365.35
25 27768078 200000 0.000984 515.54
26 20076997 200000 0.000994 376.54
27 16709350 200000 0.001004 316.53
28 22127016 200000 0.001017 424.59
29 14732524 200000 0.001034 287.42
30 30399029 200000 0.001056 605.69
31 13823245 200000 0.001084 282.72
32 17613544 200000 0.001119 371.88
33 12764541 200000 0.001164 280.34
34 13994592 200000 0.001218 321.61
35 28422631 200000 0.001282 687.51
36 15827717 200000 0.001358 405.55
37 11692231 200000 0.001447 319.22
38 17471758 200000 0.001549 510.64
39 11726347 200000 0.001667 368.83

108
Age
Total pₓ
Sum Assured
(in ₹), C
Death Rate for age
x, qₓ
Total premium
Expenditure(in Cr
₹) Bₓ = pₓ*C*v*qₓ
40 28528992 200000 0.001803 970.52
41 11567894 200000 0.001959 427.58
42 13380642 200000 0.00214 540.27
43 9334352 200000 0.00235 413.88
44 9626232 200000 0.002593 470.96
45 23872961 200000 0.002874 1,294.55
46 10992678 200000 0.003197 663.09
47 7951297 200000 0.003567 535.14
48 11649592 200000 0.003983 875.48
49 7851799 200000 0.004444 658.37
50 21462422 200000 0.004946 2,002.89
51 7885966 200000 0.005483 815.83
52 7735164 200000 0.006051 883.12
53 5590790 200000 0.006643 700.75
54 6394912 200000 0.007256 875.50
55 15607546 200000 0.007888 2,322.87
56 7071837 200000 0.008543 1,139.90
57 4599026 200000 0.009225 800.49
58 6718934 200000 0.009944 1,260.62
59 5148712 200000 0.010709 1,040.33
Sum of
Premiums
27,484.11
Source: (Calculated by the author)
4.1.7 Conclusions drawn from evaluation of existing schemes
Until recently, the initiation of most of these schemes was being done in a segmented
manner based on the initiatives taken by individual Ministries. Identification of population
groups for the purpose of insurance schemes was primarily based on occupation. Almost
all life insurance schemes and health insurance schemes with varying financial support
from the Government of India have been initiated for specific occupational groups.
Although earlier attempts have been made to provide life and health insurance for the BPL
population, these schemes have been rather ineffective in terms of coverage.
An analysis of the extent of expenditure on insurance schemes by the Government of India
indicates that the total budget expenditure on Aam Admi Bima Yojana(AABY) by
Government of India in 2016-17 is about ₹ 450 crore which is minuscule as a percent of
109
total expenditure. For most schemes, financial support was primarily in the form of
premium contribution. For life insurance schemes, support was also provided through an
indirect premium contribution by way of subsidization from the social security fund placed
with Life Insurance Corporation (LIC). Indirect support to life insurance schemes through
contributions from social security fund was only about ₹ 340 Cr. in 2014-15 and did not
add significantly to the expenditure by the Government of India. See the table in section#6
in the Appendix.
The coverage of beneficiaries under most of the insurance schemes appears to be low. In
several schemes, the share of beneficiaries covered in the targeted population is not much.
This fact points to the low reach of these insurance schemes in the targeted population.
Also, in many schemes, a few States account for the bulk of the beneficiaries. The share of
the top three States in total beneficiaries is significantly higher than the share of the target
group in those States for many of the schemes. The time taken for the settlement of claims
is also relatively high in many schemes. The bulk of the delay in settlement of claims is
often in the process of submission of relevant documents, and not after the submission of
claims. In some schemes, the claim to premium ratio is also low. In life insurance schemes
where claims ratio is relatively high, a significant portion of the claims is in the form of
scholarships, which is not the primary objective of the insurance scheme.
The performance of the schemes is affected by several factors Bulk of the targeted
population is not affiliated with any organized group through which these insurance
schemes are operated. This adversely affects the coverage. Also, illiteracy and lack of basic
schooling lead to problems in carrying out the operational modalities of the schemes in
terms of premium requirements and submission of claims with the relevant documents.
Also, in life insurance schemes, as the benefits obtained in the event of occurrence of deaths
or disability is not frequently visible, there is a lack of incentive to contribute premium
annually. The only incentive for the workers to join the scheme is when death is anticipated,
or workers have children studying in standard IX to XII and are assured of a scholarship
of ₹ 1200 per annum.

110
In general, it may be helpful to consolidate the individual life insurance schemes for
different occupational groups (and groups like the rural landless households) and provide
a universal common life insurance scheme for the entire population.
Consolidating the schemes for the entire population is likely to be advantageous in two
ways. First, it increases pooling of individuals and diversifies the risk associated with the
insurance schemes. Secondly, the costs associated with identifying individual members in
each of the targeted groups separately are likely to be reduced substantially. It may also be
important to note that the Government of India has identified 45 occupational groups as
‘weak and vulnerable’ and whose workers are mostly either below or marginally above the
poverty line (to be considered for insurance support). The inclusion of non-BPL workers
belonging to these occupational groups further, may not only help in increasing pooling
and diversification of the risk associated with these schemes, but also to ensure that the
workers belonging to these occupational groups who are marginally above the poverty line
do not fall below the poverty line in the event of unforeseen adverse circumstances. Also,
implementing the common scheme through a single agency like a single Ministry of
Government of India or a public trust as in the case of Aarogyasri in Andhra Pradesh will
reduce the administrative and operational costs associated with these individual schemes.
The common insurance scheme may also be universal in nature and not voluntary as is the
case in most of the schemes currently. This will reduce the adverse selection problems
associated with the voluntary nature of these schemes. Besides, a universal scheme is also
likely to generate more awareness about the scheme and make the benefits of the scheme
more visible. The need for such universal life insurance schemes for the population has
been felt at the policy level for long and is reflected in the fact that the National Family
Benefit Scheme (now transferred to the State Governments) was introduced as in early as
1995 to provide compensation to Below Poverty Line(BPL) families on death of the
primary earning member. Several State Governments are already implementing life
insurance schemes for the Below Poverty Line(BPL) population of their State. Recently,
the Insurance Regulatory and Development Agency(IRDA) has also suggested the
formulation of a comprehensive life and health insurance scheme for the Below Poverty
Line(BPL) population. The need for such a universal life and health insurance scheme for
unorganized workers

111
(about a third of whom are Below Poverty Line(BPL)) in India has also been argued by
other studies (Mehrotra 2008). There are also other implementation issues that need to be
looked into in the context of life insurance schemes. Experience from Aam Aadmi Bima
Yojana(AABY) in Andhra Pradesh, indicate that the coverage of rural landless households
under the scheme far exceeds the total number of rural landless households declared by the
Central Government (based on figures from the National Sample Survey
Organization(NSSO). With earlier studies indicating that the number of landless
households reported by the National Sample Survey is significantly lower than the actual
number of landless households, the stated commitment of Government of India of covering
1.5 crore rural landless households may need to be reconsidered.
4.1.8 Total Cost and Burden on the State Exchequer
Based on the proposal the total budget needed to pay the premium (age-wise) for the whole
population comes to approximately ₹27484 Cr.
Below is the table shows the cost needed to cover the entire working population of India
that is from 18-59 years of age with respect to the proposal.
TABLE 4-2: Life Insurance proposal’s cost as a percent of government
figures.
% of Total Expenditure of all the states of India 0.82
% of GDP of India 0.24 Source: Based on the figure obtained and presented above and the Total Expenditure of India in 2014-15 and GDP of
2015.
4.2 Health Insurance
4.2.1 Objective of the new scheme
A universal health insurance supported by the government based on the anticipated
claims.
4.2.2 Data used for calculation of costs
For modeling the cost calculation for Health insurance for all, we have taken the secondary
sources of data published by various government organizations as well as individuals who
have already undertaken the related research work related to this field.
112
The claim data has been sourced from “Review of Mediclaim Policy and Design of Long
Term Health Insurance Products for United India Insurance Co. Ltd. (Parchure, Joshi. May
2006)”, the study of Claim Probability for each age. Age wise distribution of the population
is taken from Census 2011.
Average claim amount for each age is taken from 60th round (January - June 2004)
National Sample Survey Office, M/o Statistics and Programme
Implementation(MOSPI),Government of India (GOI) . The aim of these surveys was to
evolve an appropriate data collection method for studying morbidity profile in India.
‘Morbidity and Health care’ at the request of Ministry of Health and Family Welfare,
during the period January to June 2004. This survey covered the curative aspects of the
general health care system in India and also the utilization of health care services provided
by the public and private sector, together with the expenditure incurred by the households
for availing these services.
4.2.3 Assumptions
The proposed scheme in the study is applicable only for the population of 18 years
and above.
For calculation, population distribution data is taken from Census 2011.
The specific present value tables of 6% rate of Interest have been used from
actuarial tables for calculating the fund value for the insurance proposal schemes.
Average claim amount and average claim probability may lead to some variation
when compared with the actuals.
With respect to budget requirement to implement the proposals in our study, we have
excluded the administrative and miscellaneous expenses.
4.2.4 Methodology
How do the insurers calculate the health insurance Premiums, what do they consider while
calculating the risk?

113
1. Some private health insurance schemes calculate flat premiums for specified age
groups and have a limitation on entry age into the schemes.
2. Some calculate premiums according to detailed schedules by age and sex.
3. Some private health insurance schemes build up reserves, to avoid high
premiums for the elderly members of the scheme.
4. Others charge premiums that change each year in accordance with the age of the
insured person.
Normally, in addition to the calculation of the premium itself, there are some elements in
private health insurance schemes, such as co-payments, exclusions of risks by not covering
pre-existing illnesses, and health examination upon entry into the scheme, which
sometimes forms part of any individual insurance policy.
Some health insurance schemes reserve the right to cancel the contract when an individual
fall ill, or annually renew individual contracts, while other insurance schemes guarantee
life-long, full service as long as the premium is paid. In this context, national insurance
legislation and the nature of public insurance supervision play an important role.
4.2.5 Calculation of the Risk Premium
The risk premium is the average amount of claims per person in a particular age group is
covered by the premium every year.
One of the main determining factors of health insurance premiums is the average amount
of claim per capita. The per capita claim is the expected value of insurance payments for a
single risk during a certain period, normally for a calendar year. If the group of insured
persons is large enough, according to the law of large numbers, the expected value can be
estimated as the average per capita claim:
C= P/L
Where:
C = average per capita claim

114
P = total payments in a period
L = number of insured persons
The above formula could be interpreted as the overall risk premium for the entire insured
population of a specific health insurance scheme. However, premiums are, in practice, set
for each subgroup of insured persons. The level of disaggregation is based on an analysis
of the claim structure for various subgroups of insured persons. General patterns may be
observed, such as a significant correlation between per capita claims and age of the insured
person, or the type and nature of the specific benefit (for example ambulatory care or
impatient care). Another determinant of utilization may be the profession of a beneficiary,
especially for daily sickness cash benefits.(Cichon et al., 1999)
The general trend of increase in health care costs is also very important, especially for
tariffs without upper ceilings on total annual reimbursement.
Pre-existing illnesses are another factor that influences personal risk. Although it may be
important, in theory, to distinguish as many influencing factors as possible, in practice there
is a limitation on the depth of differentiation of risks, because the law of large numbers is
only applicable for a certain number of samples of each risk group. A compromise should
be made, taking the limited number of insured persons into consideration.
Thus, the various risk groups should be determined, so that on the one hand each group is
large enough, while on the other hand the differentiation according to risk is sufficient to
allow prudent future premium calculations. Individual risks to a large extent are usually
related to the age and sex of the insured persons, directly or directly. Hence, average per
capita claim amounts must be determined according to the age and sex.
Taking in to account special effects in the starting period of every insurance policy (for
example: any waiting period, or savings due to selection), per capita claims are usually
computed using data that exclude new contracts- for example, those with a duration of less
than one year.
The structures of claims may vary according to the type of benefits, age, and sex. For
example, in many countries, although there is no great difference between the development

115
of costs according to age and sex in ambulatory care, the cost patterns of men and woman
by age in hospital care normally quite different, because of deliveries in hospitals and lower
health costs for women aged 60 and more.
The risk premium necessary to cover a subscribed risk in the short term is equivalent to the
average per capita claim amount. It is composed of a series of average per capita claim
amounts, classified by type of benefits, age, and sex.
In the case of pre-existing illnesses, the normal premium may be adjusted by risk-related
surcharges. More detailed, differentiated statistics are necessary in order to calculate these
surcharges. If a private insurance company were to work on a risk premium basis, it would
also multiply the above net risk premium by a certain factor to cover administrative
expenditure.
To calculate the present value of income and expenditure, an actuarial interest rate is
assumed. Since actual interest rates change remarkably over time, the actuarial rate should
be assumed prudently, and with a margin of safety.
To calculate the net premium, we need the present value of the benefit premium. The claim
amounts increase due to the ageing of the group, as well as any general increase in the cost
of medical care.
For this study, the premium can be calculated considering the following factors in addition
to what's conventionally considered:
1. Age wise distribution of the population.
2. Claim Probability for each age.
3. Average claim amount for each age.
Below is the analytical framework based these considerations.
4.2.6 Analytical framework
Traditionally the premium is calculated as below:

116
Let us assume constant premium of a person who enters the scheme at age x as Pₓ. We
assume, for simplicity of argument, that the flow of money, such as for benefit or premium
payments, occurs at the beginning of each period. The present value of the series of
premiums is
Vᵖₓ=Pₓ*aₓ
Which should be equal to the present value of the benefit i.e.:
Vᵖₓ = vⁿ* Vᵦₓ
In case of single premium, the formula could be:
The present value of benefit should be equal to the premium.
Pₓ = vⁿ*Vᵦₓ
Where n denotes the number of years the policy in force.
4.2.7 Premium Calculation for providing Health Insurance to every individual of
the country
Instead of going the traditional way let us calculate the amount (P) needed to pay the
claimed benefit to the population based on the below:
- Age wise distribution of the population (DPage) (Source: Census 2011)
- Claim Probability for each age, P(Cage) (Source: Dr. Rajas Parchure, Medha Joshi,
2006)
- Average claim amounts for each age. (Aage) (Source: (Insurance Information
Bureau, 2012)
So, with the help of this data, we can calculate claim amount and hence the budget needed
to pay the same for the whole population of the informal sector workers.
P = DPage* P (Cage)* Aage
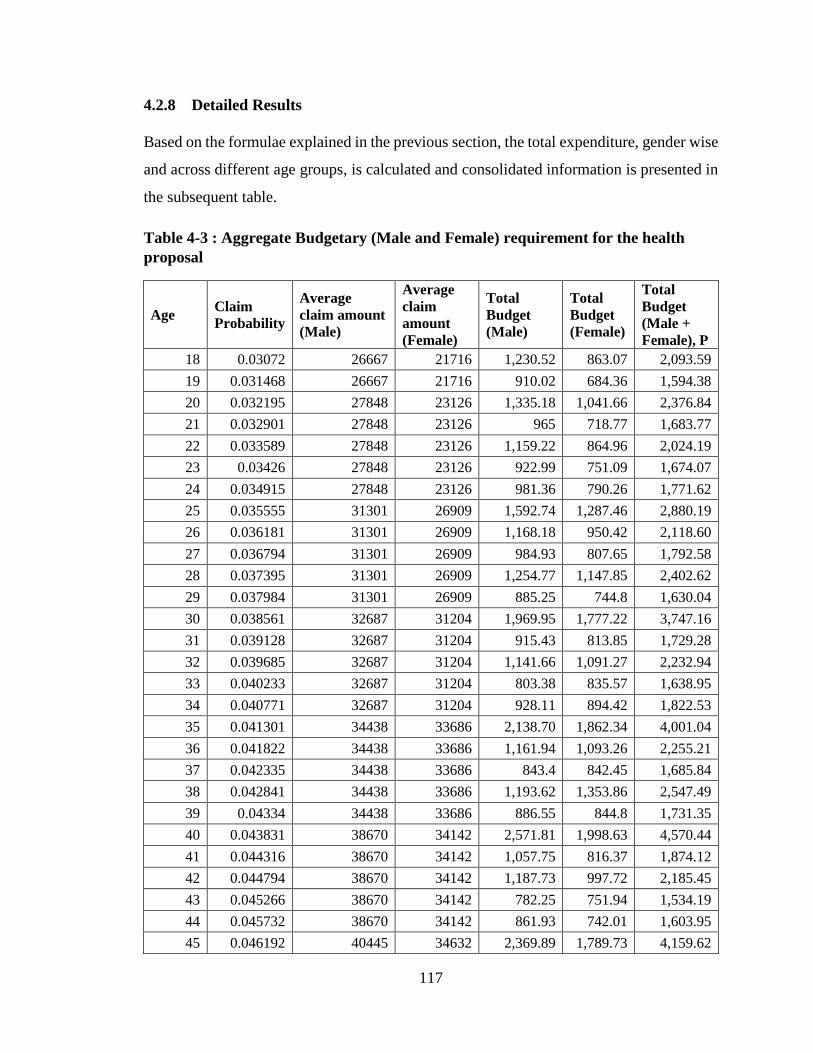
117
4.2.8 Detailed Results
Based on the formulae explained in the previous section, the total expenditure, gender wise
and across different age groups, is calculated and consolidated information is presented in
the subsequent table.
Table 4-3 : Aggregate Budgetary (Male and Female) requirement for the health
proposal
Age Claim
Probability
Average
claim amount
(Male)
Average
claim
amount
(Female)
Total
Budget
(Male)
Total
Budget
(Female)
Total
Budget
(Male +
Female), P
18 0.03072 26667 21716 1,230.52 863.07 2,093.59
19 0.031468 26667 21716 910.02 684.36 1,594.38
20 0.032195 27848 23126 1,335.18 1,041.66 2,376.84
21 0.032901 27848 23126 965 718.77 1,683.77
22 0.033589 27848 23126 1,159.22 864.96 2,024.19
23 0.03426 27848 23126 922.99 751.09 1,674.07
24 0.034915 27848 23126 981.36 790.26 1,771.62
25 0.035555 31301 26909 1,592.74 1,287.46 2,880.19
26 0.036181 31301 26909 1,168.18 950.42 2,118.60
27 0.036794 31301 26909 984.93 807.65 1,792.58
28 0.037395 31301 26909 1,254.77 1,147.85 2,402.62
29 0.037984 31301 26909 885.25 744.8 1,630.04
30 0.038561 32687 31204 1,969.95 1,777.22 3,747.16
31 0.039128 32687 31204 915.43 813.85 1,729.28
32 0.039685 32687 31204 1,141.66 1,091.27 2,232.94
33 0.040233 32687 31204 803.38 835.57 1,638.95
34 0.040771 32687 31204 928.11 894.42 1,822.53
35 0.041301 34438 33686 2,138.70 1,862.34 4,001.04
36 0.041822 34438 33686 1,161.94 1,093.26 2,255.21
37 0.042335 34438 33686 843.4 842.45 1,685.84
38 0.042841 34438 33686 1,193.62 1,353.86 2,547.49
39 0.04334 34438 33686 886.55 844.8 1,731.35
40 0.043831 38670 34142 2,571.81 1,998.63 4,570.44
41 0.044316 38670 34142 1,057.75 816.37 1,874.12
42 0.044794 38670 34142 1,187.73 997.72 2,185.45
43 0.045266 38670 34142 782.25 751.94 1,534.19
44 0.045732 38670 34142 861.93 742.01 1,603.95
45 0.046192 40445 34632 2,369.89 1,789.73 4,159.62

118
Age Claim
Probability
Average
claim amount
(Male)
Average
claim
amount
(Female)
Total
Budget
(Male)
Total
Budget
(Female)
Total
Budget
(Male +
Female), P
46 0.046647 40445 34632 1,082.09 849.28 1,931.37
47 0.047096 40445 34632 770.13 637.43 1,407.57
48 0.04754 40445 34632 1,070.70 1,001.19 2,071.88
49 0.047978 40445 34632 796.7 622.44 1,419.14
50 0.048412 41648 35779 2,294.37 1,746.53 4,040.90
51 0.049633 41648 35779 893.74 632.62 1,526.36
52 0.050179 41648 35779 850.3 658.26 1,508.56
53 0.050725 41648 35779 593.22 505.03 1,098.26
54 0.05127 41648 35779 696.88 574.41 1,271.29
55 0.051816 42664 34943 1,717.55 1,419.19 3,136.74
56 0.052362 42664 34943 819.15 623.01 1,442.16
57 0.052907 42664 34943 528.06 417.75 945.8
58 0.053453 42664 34943 700.69 681.08 1,381.77
59 0.053999 42664 34943 600.82 479.41 1,080.23
60 0.054544 42865 41702 2,028.73 2,077.54 4,106.27
61 0.05509 42865 41702 730.97 673.44 1,404.41
62 0.055636 42865 41702 689.69 661.96 1,351.65
63 0.056181 42865 41702 476.15 472.53 948.69
64 0.056727 42865 41702 500.92 479.49 980.41
65 0.057273 44866 43994 1,612.64 1,699.88 3,312.52
66 0.057818 44866 43994 591.1 568.07 1,159.17
67 0.058364 44866 43994 354.48 321.31 675.79
68 0.05891 44866 43994 433.47 494.58 928.05
69 0.059455 44866 43994 372.4 358.65 731.06
70 0.060001 46699 47186 1,511.31 1,583.37 3,094.68
71 0.060547 46699 47186 448.12 428.35 876.46
72 0.061092 46699 47186 335.71 309.66 645.37
73 0.061638 46699 47186 203.9 191.42 395.32
74 0.062184 46699 47186 228.77 215.11 443.88
75 0.062729 52111 48713 744.88 761.99 1,506.87
76 0.063275 52111 48713 274.42 257.34 531.76
77 0.063821 52111 48713 145.8 123.32 269.11
78 0.064366 52111 48713 170.04 176.04 346.09
79 0.064912 52111 48713 146.91 143.96 290.86
80 0.065458 51730 62584 584.17 843.79 1,427.97
81 0.066003 51730 62584 167.82 221.53 389.35

119
Age Claim
Probability
Average
claim amount
(Male)
Average
claim
amount
(Female)
Total
Budget
(Male)
Total
Budget
(Female)
Total
Budget
(Male +
Female), P
82 0.066549 51730 62584 105.47 123.87 229.34
83 0.067095 51730 62584 66.97 78.62 145.59
84 0.06764 51730 62584 73.83 89.96 163.78
85 0.068186 54691 39792 216.49 185.66 402.15
86 0.068732 54691 39792 81.14 63.46 144.6
87 0.069277 54691 39792 42.57 30.07 72.63
88 0.069823 54691 39792 42.91 34.25 77.16
89 0.070369 54691 39792 38.1 32.04 70.14
90 0.070914 54691 39792 139.71 133.43 273.14
91 0.07146 54691 39792 46.35 39.72 86.08
92 0.072006 54691 39792 29.7 22.39 52.09
93 0.072551 54691 39792 18.34 13.98 32.32
94 0.073097 54691 39792 20.78 16 36.78
95 0.073643 54691 39792 50.32 43.25 93.57
96 0.074188 54691 39792 23.49 18.41 41.9
97 0.074734 54691 39792 14.4 10.76 25.16
98 0.07528 54691 39792 19.92 16.81 36.73
99 0.075825 54691 39792 11.73 10.95 22.68
100 0.076371 54691 39792 120.85 96.17 217.01
Based on the framework we have worked out the state-wise budget needed to support the
entire population of that state and presented in the table below.
We have calculated the expenditure for the health insurance proposal need to pay the
claim for the people of 18 to 100 years of age.
TABLE 4-4: Health insurance proposal claim expenditure
State Population Total Health Expense (in Rs Cr.)
India 658362805 1,15,445.67
Andaman & Nicobar Islands 242480 39.55
Andhra Pradesh 49045702 8,724.24
Arunachal Pradesh 729023 111.48
Assam 17030487 2,800.33
Bihar 48485740 8,423.75
Chandigarh 663906 105.86
Chhattisgarh 13769737 2,362.83

120
State Population Total Health Expense (in Rs Cr.)
Dadra & Nagar Haveli 204237 29.26
Daman & Diu 164608 23.37
Goa 910859 105.86
Gujarat 34497721 5,913.29
Haryana 14006464 2,428.88
Himachal Pradesh 3997672 735.15
Jammu & Kashmir 6607165 1,119.13
Jharkhand 16678561 2,824.71
Karnataka 35910215 6,340.10
Kerala 19773024 3,945.47
Lakshadweep 39187 6.8
Madhya Pradesh 38070713 6,561.83
Maharashtra 64748245 11,639.54
Manipur 1614468 267.56
Meghalaya 1442045 221.73
Mizoram 605651 98
Nagaland 1053997 163.52
Nct Of Delhi 10086616 1,638.44
Odisha 23457493 4,226.98
Puducherry 768115 137.82
Punjab 16096238 105.86
Rajasthan 35029919 5,968.70
Sikkim 362817 58.41
Tamil Nadu 43908716 8,044.40
Tripura 2154750 365.4
Uttar Pradesh 97415590 16,803.19
Uttarakhand 5368765 948.31
4.2.9 Total Cost and Burden on the State Exchequer
The cost of the health insurance scheme, proposed in our study, that can cover the people
from 18-100 years of age, comes to around ₹115445 Cr. which is 1.02% of GDP and 6.94%
of the total expenditure of Government of India.
Table 4-5: Health Insurance Proposal’s Cost As A Percent Of Government Figures.
% of Total Expenditure of all the states of India (2014-15) 6.94
% of GDP of India (2015). 1.02 Source: Based on the figure obtained and presented above

121
As per the 12th five-year plan, Government planned to increase public expenditure on
health from the current level of 1.2 per cent of GDP to at least 2.5 per cent by the end of
the Twelfth Plan, and to at least 3 per cent of GDP by 2022.
4.3 Old Age Pension
4.3.1 Objective of the new scheme
Extend the Atal Pension Yojana to accommodate the people of up to 59 years of age.
4.3.2 Data used for calculation of costs
Population sourced from Census of India-2011.
Present value calculated based on assumption of 6% rate of Interest.
v=1/ (1+0.06) = 1/1.06=0.94
The amount of contributions and pension for different categories in Atal Pension
Yojana.
4.3.3 Assumptions
1. For calculation, population distribution data is taken from Census 2011.
2. The specific present value tables of 6% rate of Interest have been used from actuarial
tables for calculating the fund value for the insurance proposal schemes.
3. The basis of old age pension scheme is the number of years, the accumulated amount
is, sufficient to pay the premium has been kept constant.
4. With respect to budget requirement to implement the proposals in our study, we have
excluded the administrative and miscellaneous expenses.
4.3.4 Methodology
To accommodate the people above forty years of age, there is a need to find out the fund
accumulated vs the pension paid over the years, for how many years will that fund be
sufficient. The actuarial calculations as needed are also mentioned.
The various abbreviations used in this section are as follows:
Cind: Individual contributions of premium

122
Cgov: Government contributions of premium
Find: Total fund (future) value of accumulated annuity due to individual contributions
Fgov: Total fund (future) value of accumulated annuity due to government contributions
syears: Actuarial accumulated annuity for unit fund value at the time of last payment
syears: Actuarial accumulated annuity for unit fund value after the last payment
Tyears: Number of years the pension can be paid based on the fund accumulated.
1. Analyze the existing policy of people below forty years.
1.1. Calculate the total fund Find (future) value of accumulated annuity (syears) due
to the series of individual contributions of premium, Cind
Find = 12*Cind*syears
1.2. Calculate the total future value of the government contributions, Cgov , in the
premium based on the guidelines mentioned above under section Atal Pension
Yojana.
This will be based on the future value of accumulated annuity (syears) due to the
series of (maximum five) payments by government at the end of the tenure that
is, at the attainment of 60 years of the person insured.
Fgov = 12*Cgov*syears*(1+i)years
1.3. Add the above two values (1.1+1.2) to get the total fund available at the
individual’s 60 years of age.
Ftotal = Find + Fgov
1.4. Using actuarial calculations find out the number of years (Tyears) the fund
calculated in step1.3 will be exhausted by paying the guaranteed and fixed
pension amount. This will be based on present value of the series of pension
payments and finding the number of years this amount is equal to the total fund
accumulated (Ftotal)
2. Taking the number of pension years (Tyears) calculated in step 1.4 as a standard yardstick
do the reverse calculations for the people above forty years and arrive at the amount

123
2.1. Take the number of years as calculated in 1.4 (Tyears)
2.2. Individual contribution can be fixed at Rs1000. As government pension, since
anyway the individual contribution would be more, so it’d come as Rs1000
following the guidelines under section Atal Pension Yojana.
2.3. Find out the amount (Ftotal) needed to make the series of pension payments for
the number of years (Tyears) in 2.1
Ftotal = 1000*ayears‾
2.4. Deduct the accumulated fund due to the government contribution (Fgov) from
the amount got from Ftotal.This will serve as an amount accumulated due to
individual contributions (Find)
Find = Ftotal – Fgov
2.5. Find out the actuarial series of payments which would sum up to the amount
(Find) arrived at in 2.4 in Tyears based on fixed rate of interest. This will be through
actuarial calculations using some extrapolations/interpolations of the table values.
This will be the regular contribution from the individual.
Cind = Find /12
2.6. The government contribution can be multiplied by the Census figure of that
age to get financial burden on state exchequer.
4.3.5 Detailed Results
TABLE 4-6 : Proposed Contributions for ₹1000 Monthly Pension
Age Number of years of
contribution, Tyears
Monthly contribution
(in ₹), Cind
Government
contribution (in ₹),
Cgov
18 42 42 252
19 41 42 252
20 40 50 300

124
Age Number of years of
contribution, Tyears
Monthly contribution
(in ₹), Cind
Government
contribution (in ₹),
Cgov
21 39 50 300
22 38 50 300
23 37 50 300
24 36 50 300
25 35 76 456
26 34 76 456
27 33 76 456
28 32 76 456
29 31 76 456
30 30 116 696
31 29 116 696
32 28 116 696
33 27 116 696
34 26 116 696
35 25 181 1000
36 24 181 1000
37 23 181 1000
38 22 181 1000
39 21 181 1000
40 20 291 1000
41 19 291 1000
42 18 291 1000
43 17 291 1000
44 16 291 1000
45 15 400 1000
46 14 400 1000
47 13 400 1000
48 12 400 1000
49 11 450 2000
50 10 500 3250
51 9 600 4500
52 8 700 6000
53 7 850 7600
54 6 1000 9350

125
Age Number of years of
contribution, Tyears
Monthly contribution
(in ₹), Cind
Government
contribution (in ₹),
Cgov
55 5 1300 11225
56 4 1700 16500
57 3 2500 20000
58 2 3700 27500
59 1 8000 50000
The above exercise can be done for the all the pension amounts i.e. Rs2000, Rs3000,
Rs4000 and Rs5000 as the APY mentions.
The subsequent table presents the budgetary requirement for supporting the pension
proposal for the whole population i.e. from eighteen to fifty-nine years of age.
TABLE 4-7: Aggregate expenditure for pension proposal
Age Monthly pension guaranteed Expenditure of Government in ₹Cr.
18 1000 3,522.73
19 1000 2,628.25
20 1000 4,332.41
21 1000 2,996.85
22 1000 3,529.23
23 1000 2,873.11
24 1000 2,982.04
25 1000 6,331.12
26 1000 4,577.56
27 1000 3,809.73
28 1000 5,044.96
29 1000 3,359.02
30 1000 10,578.86
31 1000 4,810.49
32 1000 6,129.51
33 1000 4,442.06
34 1000 4,870.12
35 1000 14,211.32
36 1000 7,913.86
37 1000 5,846.12
38 1000 8,735.88
39 1000 5,863.17
40 1000 14,264.50

126
Age Monthly pension guaranteed Expenditure of Government in ₹Cr.
41 1000 5,783.95
42 1000 6,690.32
43 1000 4,667.18
44 1000 4,813.12
45 1000 11,936.48
46 1000 5,496.34
47 1000 3,975.65
48 1000 5,824.80
49 1000 3,925.90
50 1000 10,731.21
51 1000 3,942.98
52 1000 3,867.58
53 1000 2,795.40
54 1000 3,197.46
55 1000 7,803.77
56 1000 2,828.73
57 1000 1,379.71
58 1000 1,343.79
59 1000 514.87
4.3.6 Total Cost and Burden on the State Exchequer
The cost of the Pension scheme, proposed in our study, that can cover the people from 18-
59 years of age, comes to around ₹ 225172 Cr. which is 2% of GDP and 13.5% of the total
expenditure of Government of India.
TABLE 4-8: Pension Proposal’s cost as a percent of government’s Total
Expenditure and GDP of India.
% of Total Expenditure of all the states of India (2014-15) 3.15
% of GDP of India of (2015) 2 Source: Based on the figure obtained and presented above
4.4 Maternity Benefit
4.4.1 Objective of the new scheme
Universalization of the maternity benefit. Make it available to the whole fertile population
between 18-45 years of age.

127
4.4.2 Data used for calculation of costs
To come up with a universal maternity benefit cost for all the states of India for the entire
child bearing women population we would like to understand in terms of number of
pregnant women to be covered every year and for that it is important to know the figures
of pregnant and lactating women. The National Family Health Survey – Round 3 conducted
in 2005–06 deals with the same. It covers the women of age 15–45 of which 73 percent of
women are in the prime childbearing ages of 15–35 years.
The survey found the crude birth rate (CBR) to be 23.1 births per 1,000 populations and
the total fertility rate (TFR) (the average number of children a woman will have in her
lifetime) was 2.7 children per woman. In addition, some of the other findings of the survey
are as below
Seventy percent of urban total fertility and 63 percent of rural total fertility is
concentrated in the prime childbearing ages 20–29.
There is also a moderate amount of early childbearing at age 15–19.
Fertility at age 15–19 accounts for 14 percent of total fertility in urban areas and 18
percent in rural areas.
Fertility at ages 35 and older accounts for only 4 percent of total fertility in urban
areas and 7 percent in rural areas.
Using the information below we have taken the age group of 18 to 45 years. Starting age
is chosen as 18 since that’s the minimum legal age for a girl to get married under Indian
constitution. The upper age is 45, the same limit as chosen by the survey just for the simple
reason of not missing out any eligible child bearing mother.
Secondly the benefit amount has been borrowed from the JSY scheme since the scheme
fares reasonably well in most of the states. Please refer to the table 6-4 above.
Thirdly the benefit will be extended to only the two children in line with the government’s
policy to encourage couples to have two children.
Population data sourced from Census of India-2011

128
4.4.3 Methodology
The cost of providing the maternity benefit for the whole population, C is given by
C=P*B*N where
P= Population of eligible women
B=Benefit amount per child per women
N=Number of children
4.4.4 Detailed Results
The expenditure to be incurred on the maternity benefit proposal is presented in the table
below.
TABLE 4-9: Aggregate Expenditure for Maternity Proposal
Age Total
Popn
Rural
Popn
Urban
Popn
Total
Rural
Exp.(in ₹
Cr.)
Total
Urban
Exp. (in ₹
Cr.)
Total Exp.
(Rural +
Urban) in ₹
Cr.
18 12937296 9040991 3896305 1,808.20 467.56 2,275.75
19 10014673 6696436 3318237 1,339.29 398.19 1,737.48
20 13990570 9693167 4297403 1,938.63 515.69 2,454.32
21 9446694 6096606 3350088 1,219.32 402.01 1,621.33
22 11135249 7408211 3727038 1,481.64 447.24 1,928.89
23 9479866 6189724 3290142 1,237.94 394.82 1,632.76
24 9787150 6308676 3478474 1,261.74 417.42 1,679.15
25 13456554 9030764 4425790 1,806.15 531.09 2,337.25
26 9761967 6265512 3496455 1,253.10 419.57 1,672.68
27 8157318 5121099 3036219 1,024.22 364.35 1,388.57
28 11407090 7733432 3673658 1,546.69 440.84 1,987.53
29 7286828 4541474 2745354 908.29 329.44 1,237.74
30 14770033 10083015 4687018 2,016.60 562.44 2,579.05
31 6665743 4124163 2541580 824.83 304.99 1,129.82
32 8812439 5877203 2935236 1,175.44 352.23 1,527.67
33 6655662 4396858 2258804 879.37 271.06 1,150.43
34 7030400 4496348 2534052 899.27 304.09 1,203.36

129
Age Total
Popn
Rural
Popn
Urban
Popn
Total
Rural
Exp.(in ₹
Cr.)
Total
Urban
Exp. (in ₹
Cr.)
Total Exp.
(Rural +
Urban) in ₹
Cr.
35 13385965 9032106 4353859 1,806.42 522.46 2,328.88
36 7760149 5044464 2715685 1,008.89 325.88 1,334.78
37 5907352 3752001 2155351 750.4 258.64 1,009.04
38 9381357 6458100 2923257 1,291.62 350.79 1,642.41
39 5786480 3650475 2136005 730.1 256.32 986.42
40 13355581 9201211 4154370 1,840.24 498.52 2,338.77
41 5395597 3353583 2042014 670.72 245.04 915.76
42 6523816 4293776 2230040 858.76 267.6 1,126.36
43 4865438 3174426 1691012 634.89 202.92 837.81
44 4752294 2992777 1759517 598.56 211.14 809.7
45 11187786 7581010 3606776 1,516.20 432.81 1,949.02
44,822.69
4.4.5 Total Cost and Burden on the State Exchequer
The cost of the Maternity Benefit, proposed in our study that can cover the female from
18-45 years of age, for birth of two children comes to around ₹ 44822 Cr. which is 0.76%
of GDP and 2.6% of the total expenditure of Government of India.
TABLE 4-10: Maternity proposal’s cost as a percent of government’s Total
Expenditure and GDP of India.
% of Total Expenditure of all the states of India (2014-15) 2.57
% of GDP of India (2015) 0.39 Source: Based on the Results obtained and presented above by the author

130
Chapter 5
Financial Feasibility and Sustainability of
Universalization of Proposed Comprehensive Social
Security Programme
The objectives adopted for the study included the analysis and evaluation of the existing
schemes under Life insurance, Health insurance, Old age pension and maternity benefits.
The recent and most relevant schemes have been evaluated for example AABY and
PMJJBY for Life insurance, RSBY for Health insurance, APY for Old Age Pension and
JSSY for Maternity Benefit. As discussed in Chapter 2, Review of Literature, the schemes
have been revolutionary and have seen reasonable success but there have been some gaps
that were some of the motivations behind the study. We have listed the gaps in the
respective sections of the study that dealt with the corresponding schemes. In the due
course of the evaluation and study we have come up with the proposed changes in the
existing ones or new proposals in some cases, to overcome the gaps.
The current chapter examines the financial feasibility and sustainability of the proposed
universal comprehensive social security scheme. The financial feasibility rests upon the
current expenditure required if the scheme is to be implemented, the burden on the
exchequer given the present number of beneficiaries. The financial sustainability of the
product would mean the estimated future costs of continuing the scheme in future and its
share in the fiscal expenditure given the estimated growth of public revenue and public
expenditure. The chapter is divided into five sections. The each of the first four sections
deals with the financial feasibility, fiscal sustainability and burden on exchequer of each of
the four pillars of social security. The last section sums up the chapter with the concluding
remarks on financial feasibility and fiscal sustainability of the proposed scheme.
5.1 Life Insurance Proposal
As encountered in the various sources during the review of literature, there have been
schemes started at various points of time in India to provide the life insurance to the
citizens. The schemes have worked well within the contexts they have been conceptualized
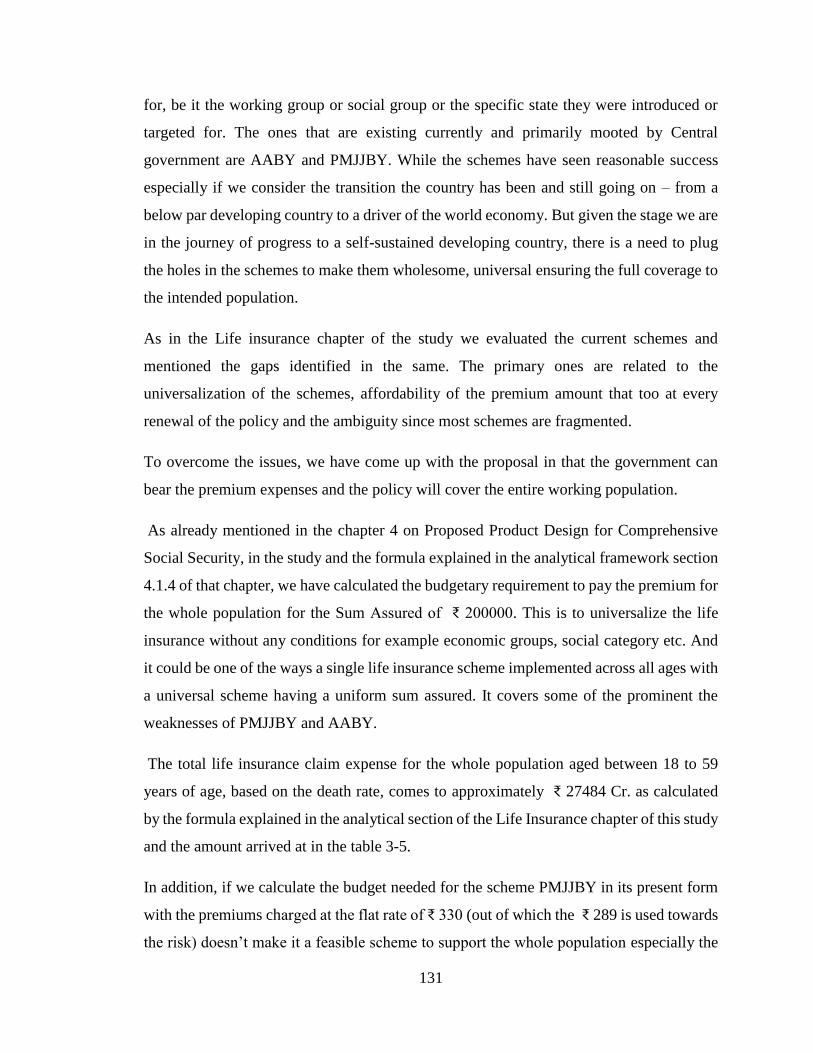
131
for, be it the working group or social group or the specific state they were introduced or
targeted for. The ones that are existing currently and primarily mooted by Central
government are AABY and PMJJBY. While the schemes have seen reasonable success
especially if we consider the transition the country has been and still going on – from a
below par developing country to a driver of the world economy. But given the stage we are
in the journey of progress to a self-sustained developing country, there is a need to plug
the holes in the schemes to make them wholesome, universal ensuring the full coverage to
the intended population.
As in the Life insurance chapter of the study we evaluated the current schemes and
mentioned the gaps identified in the same. The primary ones are related to the
universalization of the schemes, affordability of the premium amount that too at every
renewal of the policy and the ambiguity since most schemes are fragmented.
To overcome the issues, we have come up with the proposal in that the government can
bear the premium expenses and the policy will cover the entire working population.
As already mentioned in the chapter 4 on Proposed Product Design for Comprehensive
Social Security, in the study and the formula explained in the analytical framework section
4.1.4 of that chapter, we have calculated the budgetary requirement to pay the premium for
the whole population for the Sum Assured of ₹ 200000. This is to universalize the life
insurance without any conditions for example economic groups, social category etc. And
it could be one of the ways a single life insurance scheme implemented across all ages with
a universal scheme having a uniform sum assured. It covers some of the prominent the
weaknesses of PMJJBY and AABY.
The total life insurance claim expense for the whole population aged between 18 to 59
years of age, based on the death rate, comes to approximately ₹ 27484 Cr. as calculated
by the formula explained in the analytical section of the Life Insurance chapter of this study
and the amount arrived at in the table 3-5.
In addition, if we calculate the budget needed for the scheme PMJJBY in its present form
with the premiums charged at the flat rate of ₹ 330 (out of which the ₹ 289 is used towards
the risk) doesn’t make it a feasible scheme to support the whole population especially the
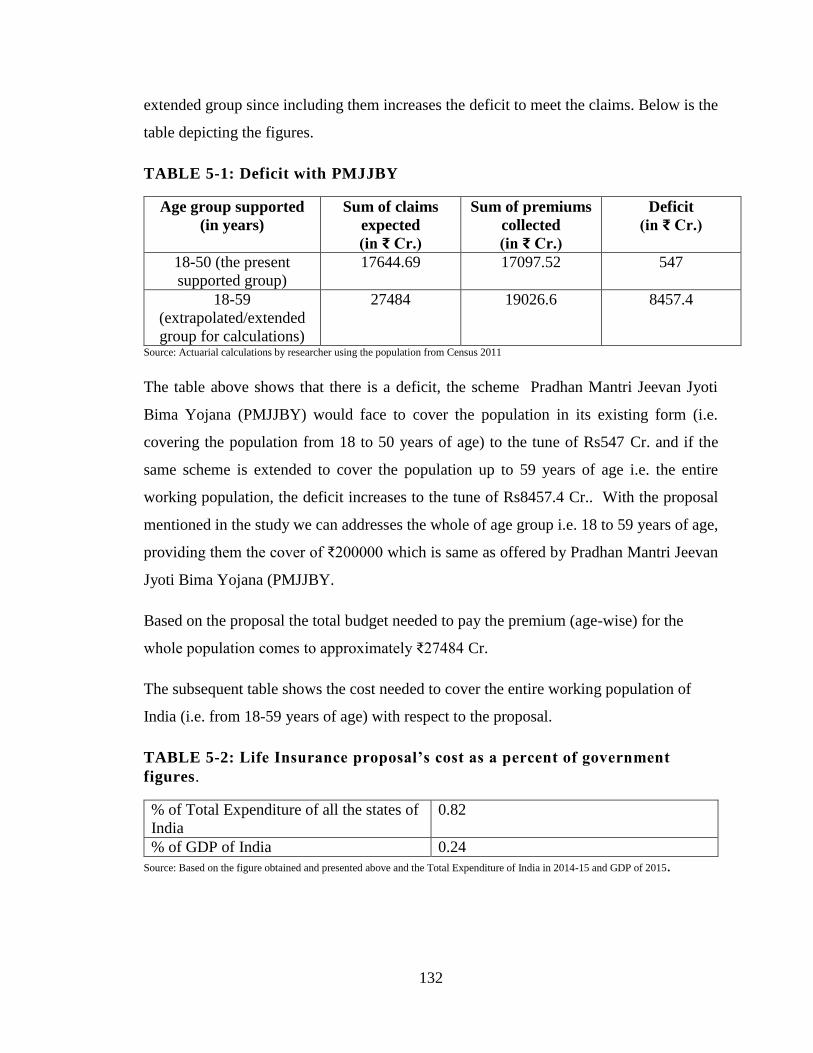
132
extended group since including them increases the deficit to meet the claims. Below is the
table depicting the figures.
TABLE 5-1: Deficit with PMJJBY
Age group supported
(in years)
Sum of claims
expected
(in ₹ Cr.)
Sum of premiums
collected
(in ₹ Cr.)
Deficit
(in ₹ Cr.)
18-50 (the present
supported group)
17644.69 17097.52 547
18-59
(extrapolated/extended
group for calculations)
27484 19026.6 8457.4
Source: Actuarial calculations by researcher using the population from Census 2011
The table above shows that there is a deficit, the scheme Pradhan Mantri Jeevan Jyoti
Bima Yojana (PMJJBY) would face to cover the population in its existing form (i.e.
covering the population from 18 to 50 years of age) to the tune of Rs547 Cr. and if the
same scheme is extended to cover the population up to 59 years of age i.e. the entire
working population, the deficit increases to the tune of Rs8457.4 Cr.. With the proposal
mentioned in the study we can addresses the whole of age group i.e. 18 to 59 years of age,
providing them the cover of ₹200000 which is same as offered by Pradhan Mantri Jeevan
Jyoti Bima Yojana (PMJJBY.
Based on the proposal the total budget needed to pay the premium (age-wise) for the
whole population comes to approximately ₹27484 Cr.
The subsequent table shows the cost needed to cover the entire working population of
India (i.e. from 18-59 years of age) with respect to the proposal.
TABLE 5-2: Life Insurance proposal’s cost as a percent of government
figures.
% of Total Expenditure of all the states of
India
0.82
% of GDP of India 0.24
Source: Based on the figure obtained and presented above and the Total Expenditure of India in 2014-15 and GDP of 2015.
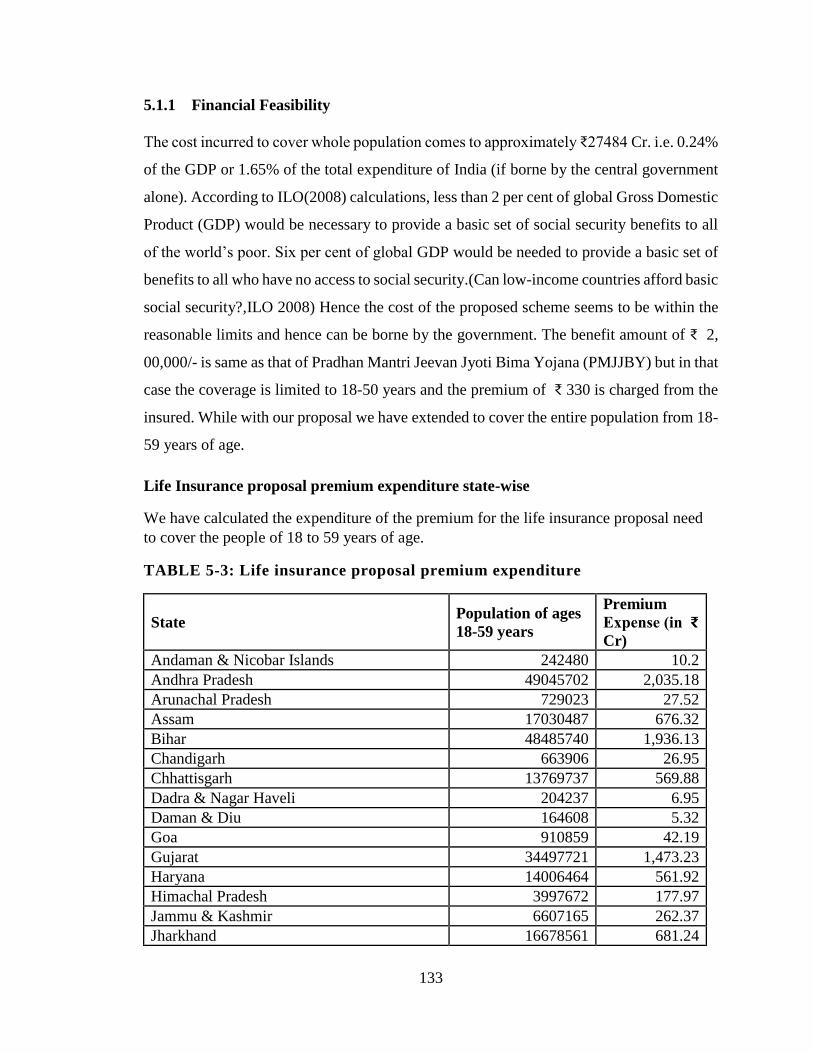
133
5.1.1 Financial Feasibility
The cost incurred to cover whole population comes to approximately ₹27484 Cr. i.e. 0.24%
of the GDP or 1.65% of the total expenditure of India (if borne by the central government
alone). According to ILO(2008) calculations, less than 2 per cent of global Gross Domestic
Product (GDP) would be necessary to provide a basic set of social security benefits to all
of the world’s poor. Six per cent of global GDP would be needed to provide a basic set of
benefits to all who have no access to social security.(Can low-income countries afford basic
social security?,ILO 2008) Hence the cost of the proposed scheme seems to be within the
reasonable limits and hence can be borne by the government. The benefit amount of ₹ 2,
00,000/- is same as that of Pradhan Mantri Jeevan Jyoti Bima Yojana (PMJJBY) but in that
case the coverage is limited to 18-50 years and the premium of ₹ 330 is charged from the
insured. While with our proposal we have extended to cover the entire population from 18-
59 years of age.
Life Insurance proposal premium expenditure state-wise
We have calculated the expenditure of the premium for the life insurance proposal need
to cover the people of 18 to 59 years of age.
TABLE 5-3: Life insurance proposal premium expenditure
State Population of ages
18-59 years
Premium
Expense (in ₹
Cr)
Andaman & Nicobar Islands 242480 10.2
Andhra Pradesh 49045702 2,035.18
Arunachal Pradesh 729023 27.52
Assam 17030487 676.32
Bihar 48485740 1,936.13
Chandigarh 663906 26.95
Chhattisgarh 13769737 569.88
Dadra & Nagar Haveli 204237 6.95
Daman & Diu 164608 5.32
Goa 910859 42.19
Gujarat 34497721 1,473.23
Haryana 14006464 561.92
Himachal Pradesh 3997672 177.97
Jammu & Kashmir 6607165 262.37
Jharkhand 16678561 681.24

134
Karnataka 35910215 1,503.29
Kerala 19773024 1,007.30
Lakshadweep 39187 1.8
Madhya Pradesh 38070713 1,539.55
Maharashtra 64748245 2,727.96
Manipur 1614468 67
Meghalaya 1442045 54.41
Mizoram 605651 24.69
Nagaland 1053997 39.64
Nct Of Delhi 10086616 403.16
Odisha 23457493 1,008.78
Puducherry 768115 34.25
Punjab 16096238 682.71
Rajasthan 35029919 1,406.26
Sikkim 362817 14.29
Tamil Nadu 43908716 1,994.31
Tripura 2154750 89.43
Uttar Pradesh 97415590 3,882.53
Uttarakhand 5368765 222.83
West Bengal 53421879 2,286.54
India 658362805 27,484.11
5.1.2 Sustainability
The proposed life insurance of ₹ 200000 for all the people of aged 18-59 seems to be
sustainable. The present scheme Pradhan Mantri Jeevan Jyoti Bima Yojana(PMJJBY)
requires renewal every year with ₹330, which is same for all ages. It is difficult to
administer and increases the chances of lapse and hence it increases the load on managing
and administrating agencies of the scheme. The proposal in the study overcomes the
problems in that the scheme will be funded by the government solely and that makes it
easier to manage and ensures it to be long lasting and since the beneficiary does not have
to pay premium for getting coverage, the chances of lapses are dim.
For financial sustainability in future, we have calculated the projected cost of the proposed
expenditure for year 2021.
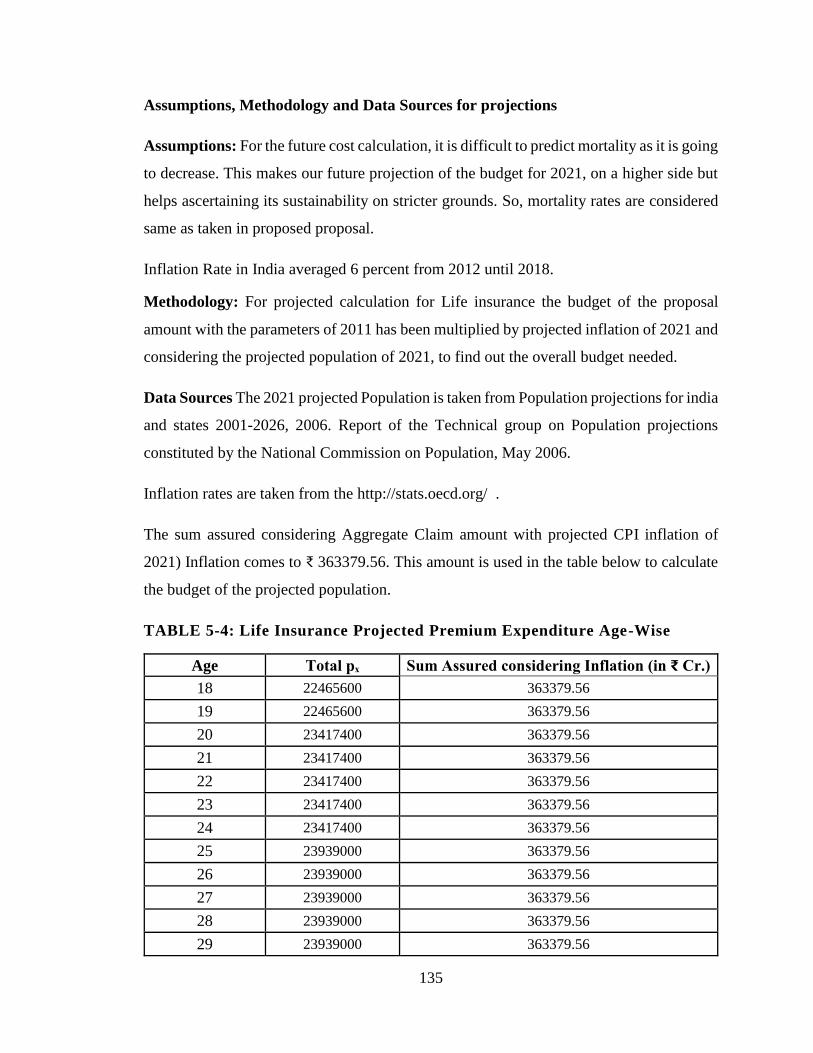
135
Assumptions, Methodology and Data Sources for projections
Assumptions: For the future cost calculation, it is difficult to predict mortality as it is going
to decrease. This makes our future projection of the budget for 2021, on a higher side but
helps ascertaining its sustainability on stricter grounds. So, mortality rates are considered
same as taken in proposed proposal.
Inflation Rate in India averaged 6 percent from 2012 until 2018.
Methodology: For projected calculation for Life insurance the budget of the proposal
amount with the parameters of 2011 has been multiplied by projected inflation of 2021 and
considering the projected population of 2021, to find out the overall budget needed.
Data Sources The 2021 projected Population is taken from Population projections for india
and states 2001-2026, 2006. Report of the Technical group on Population projections
constituted by the National Commission on Population, May 2006.
Inflation rates are taken from the http://stats.oecd.org/ .
The sum assured considering Aggregate Claim amount with projected CPI inflation of
2021) Inflation comes to ₹ 363379.56. This amount is used in the table below to calculate
the budget of the projected population.
TABLE 5-4: Life Insurance Projected Premium Expenditure Age-Wise
Age Total pₓ Sum Assured considering Inflation (in ₹ Cr.)
18 22465600 363379.56
19 22465600 363379.56
20 23417400 363379.56
21 23417400 363379.56
22 23417400 363379.56
23 23417400 363379.56
24 23417400 363379.56
25 23939000 363379.56
26 23939000 363379.56
27 23939000 363379.56
28 23939000 363379.56
29 23939000 363379.56

136
30 23147000 363379.56
31 23147000 363379.56
32 23147000 363379.56
33 23147000 363379.56
34 23147000 363379.56
35 19944600 363379.56
36 19944600 363379.56
37 19944600 363379.56
38 19944600 363379.56
39 19944600 363379.56
40 17318800 363379.56
41 17318800 363379.56
42 17318800 363379.56
43 17318800 363379.56
44 17318800 363379.56
45 15608200 363379.56
46 15608200 363379.56
47 15608200 363379.56
48 15608200 363379.56
49 15608200 363379.56
50 13984800 363379.56
51 13984800 363379.56
52 13984800 363379.56
Source: (Calculated by the author)
Presented below is the comparison of cost of Life Insurance proposal in 2011 and its
projected cost in 2021 as calculated above.
Table 5-5: Comparison of the Current Cost of Life Insurance Proposal with
Projected One
Population Year Premium Expenditure for the whole population (Cr.) % of
GDP
2011 27484 0.31
2021 684960 0.4 Source: The data used for 2011 population is ‘2001 Census’ and 2021 population is 'Population Projections For India And States
2001-2026, 2006’ and the projected budget is taken from http://stats.oecd.org/

137
The mortality values have been taken same as for year 2011 calculations even for the
projections of 2021.This is the latest mortality table available.
5.1.3 Universalization
In Pradhan Mantri Jeevan Jyoti Bima Yojana(PMJJBY), the coverage is restricted to 18-
50 years only and annually renewable. While this proposal envisages to cover the whole
population of aged 18-59 till pension benefit doesn't get started.
5.2 Health Insurance
As discussed at length in the Health Insurance chapter of this study, the framework
proposed is based on ascertaining the claims that can arise based on the probability of the
claim and the average claim amount. Based on the framework we have worked out the
state-wise budget needed to support the entire population of that state and presented in the
table below.
5.2.1 Financial Feasibility
The cost of the health insurance proposal comes to around ₹ 115445 Cr. which is 1% of
GDP and 6.9% of the total expenditure of Government of India. As per the 12th five-year
plan, Government planned to increase public expenditure on health from the current level
of 1.2 per cent of GDP to at least 2.5 per cent by the end of the Twelfth Plan, and to at least
3 per cent of GDP by 2022.So the proposal’s expenditure seems still within the limits.
Health Insurance Proposal Claim expenditure state-wise
We have calculated the expenditure for the health insurance proposal need to pay the
claim for the people of 18 to 100 years of age.
Table 5-6: Health insurance proposal claim expenditure
State Population Total Health Expense in ₹
Cr.
India 658362805 1,15,662.69
Andaman & Nicobar Islands 242480 39.55
Andhra Pradesh 49045702 8,724.24
Arunachal Pradesh 729023 111.48
Assam 17030487 2,800.33

138
Bihar 48485740 8,423.75
Chandigarh 663906 105.86
Chhattisgarh 13769737 2,362.83
Dadra & Nagar Haveli 204237 29.26
Daman & Diu 164608 23.37
Goa 910859 105.86
Gujarat 34497721 5,913.29
Haryana 14006464 2,428.88
Himachal Pradesh 3997672 735.15
Jammu & Kashmir 6607165 1,119.13
Jharkhand 16678561 2,824.71
Karnataka 35910215 6,340.10
Kerala 19773024 3,945.47
Lakshadweep 39187 6.8
Madhya Pradesh 38070713 6,561.83
Maharashtra 64748245 11,639.54
Manipur 1614468 267.56
Meghalaya 1442045 221.73
Mizoram 605651 98
Nagaland 1053997 163.52
Nct Of Delhi 10086616 1,638.44
Odisha 23457493 4,226.98
Puducherry 768115 137.82
Punjab 16096238 2,926.64
Rajasthan 35029919 5,968.70
Sikkim 362817 58.41
Tamil Nadu 43908716 8,044.40
Tripura 2154750 365.4
Uttar Pradesh 97415590 16,803.19
Uttarakhand 5368765 948.31
West Bengal 53421879 9,271.09
TABLE 5-7: Health Insurance proposal’s cost as a percent of government
figures.
% of Total Expenditure of all the states of India
(2014-15) 6.94
% of GDP of India (2015). 1.02 Source: Based on the figure obtained and presented above

139
As per the 12th five-year plan, Government planned to increase public expenditure on
health from the current level of 1.2 per cent of GDP to at least 2.5 per cent by the end of
the Twelfth Plan, and to at least 3 per cent of GDP by 2022.
5.2.2 Sustainability
The article (Ahuja.2016) related to the lessons learned from Thailand’s universal health
social security scheme reflects that to make any social security scheme successful – the
provider of the service and the funding agency has to be different and that will help in
making it sustainable. This is one of the characteristics of the proposal we have presented
in our study with respect to all the schemes.
In addition, our health insurance related proposal is based on actuals. It considers is the
average amount of claims per person in age group needed every year. That is the average
amount of claim per capita. If the group of insured persons is large enough, according to
the law of large numbers, the expected value can be estimated as the average per capita
claim. In addition to the average claim amount it takes in the average claim probability of
that age to calculate the health insurance budget for the proposal. Presented below is the
comparison of cost of Health Insurance proposal in 2011 and its projected cost in 2021.
For financial sustainability in future, we have calculated the projected cost of the proposed
expenditure for year 2021.
Assumptions, Methodology and Data Sources for projections
Assumptions: The claims probability has been considered same as in proposed Health
Insurance
Methodology: For projected calculation of health insurance, the average claim amount of
every age has been multiplied by projected inflation of 2021 and considering the projected
population of 2021, aggregated to find out the overall budget needed.
Data Sources: The 2021 projected population is taken from the report (Population
projections for India and states 2001-2026, 2006.).This report was prepared by the

140
Technical group on Population projections constituted by the National Commission on
Population, May 2006.
Inflation rates represents the real increase in cost. (In 2013, the consumer price
index(CPI) replaced the wholesale price index (WPI) as a main measure of inflation) are
taken from OECD ( http://stats.oecd.org/ ).
Below is presented the budgetary requirement for the health insurance proposal, based on
the framework provided earlier.
Table 5-8: Projected Aggregate Budgetary requirement (Male and Female)
for 2021 for the health proposal
Age Claim
Probability
Average
claim
amount
(Male)
considering
inflation
Average
claim
amount
Total Total Total
Budget
(Female)
considering
inflation
Budget
(Male) in
₹ Cr.
Budget
(Female)
in ₹ Cr.
(Male +
Female)
in ₹ Cr.
18 0.0307 48451.2 39455.8 1,772.38 1,279.69 3,052.07
19 0.0315 48451.2 39455.8 1,815.54 1,310.85 3,126.39
20 0.0322 50597 42017.6 1,974.86 1,527.80 3,502.67
21 0.0329 50597 42017.6 2,018.17 1,561.31 3,579.48
22 0.0336 50597 42017.6 2,060.37 1,593.95 3,654.33
23 0.0343 50597 42017.6 2,101.53 1,625.80 3,727.33
24 0.0349 50597 42017.6 2,141.71 1,656.88 3,798.59
25 0.0356 56870.7 48890.9 2,526.50 1,989.36 4,515.86
26 0.0362 56870.7 48890.9 2,570.98 2,024.39 4,595.37
27 0.0368 56870.7 48890.9 2,614.54 2,058.69 4,673.23
28 0.0374 56870.7 48890.9 2,657.24 2,092.31 4,749.56
29 0.038 56870.7 48890.9 2,699.10 2,125.27 4,824.37
30 0.0386 59388.9 56694.5 2,795.75 2,391.48 5,187.23
31 0.0391 59388.9 56694.5 2,836.86 2,426.64 5,263.50
32 0.0397 59388.9 56694.5 2,877.24 2,461.19 5,338.43
33 0.0402 59388.9 56694.5 2,916.97 2,495.17 5,412.15
34 0.0408 59388.9 56694.5 2,955.98 2,528.54 5,484.52
35 0.0413 62570.3 61204 2,727.59 2,373.54 5,101.13

141
Age Claim
Probability
Average
claim
amount
(Male)
considering
inflation
Average
claim
amount
Total Total Total
Budget
(Female)
considering
inflation
Budget
(Male) in
₹ Cr.
Budget
(Female)
in ₹ Cr.
(Male +
Female)
in ₹ Cr.
36 0.0418 62570.3 61204 2,762.00 2,403.48 5,165.48
37 0.0423 62570.3 61204 2,795.88 2,432.96 5,228.84
38 0.0428 62570.3 61204 2,829.29 2,462.04 5,291.34
39 0.0433 62570.3 61204 2,862.25 2,490.72 5,352.97
40 0.0438 70259.4 62032.5 2,750.15 2,280.76 5,030.92
41 0.0443 70259.4 62032.5 2,780.58 2,306.00 5,086.58
42 0.0448 70259.4 62032.5 2,810.58 2,330.87 5,141.45
43 0.0453 70259.4 62032.5 2,840.19 2,355.43 5,195.62
44 0.0457 70259.4 62032.5 2,869.43 2,379.68 5,249.11
45 0.0462 73484.4 62922.8 2,644.44 2,272.21 4,916.64
46 0.0466 73484.4 62922.8 2,670.48 2,294.59 4,965.07
47 0.0471 73484.4 62922.8 2,696.19 2,316.68 5,012.87
48 0.0475 73484.4 62922.8 2,721.61 2,338.52 5,060.12
49 0.048 73484.4 62922.8 2,746.68 2,360.06 5,106.75
50 0.0484 75670.2 65006.8 2,537.82 2,221.04 4,758.86
51 0.0496 75670.2 65006.8 2,601.84 2,277.07 4,878.91
52 0.0502 75670.2 65006.8 2,630.44 2,302.10 4,932.55
53 0.0507 75670.2 65006.8 2,659.05 2,327.14 4,986.19
54 0.0513 75670.2 65006.8 2,687.65 2,352.17 5,039.83
55 0.0518 77516.1 63487.9 2,438.38 1,981.05 4,419.43
56 0.0524 77516.1 63487.9 2,464.06 2,001.91 4,465.97
57 0.0529 77516.1 63487.9 2,489.74 2,022.77 4,512.51
58 0.0535 77516.1 63487.9 2,515.42 2,043.63 4,559.05
59 0.054 77516.1 63487.9 2,541.09 2,064.50 4,605.59
60 0.0545 77881.3 75768.3 2,094.09 1,961.23 4,055.31
61 0.0551 77881.3 75768.3 2,115.03 1,980.85 4,095.88
62 0.0556 77881.3 75768.3 2,135.98 2,000.47 4,136.45
63 0.0562 77881.3 75768.3 2,156.93 2,020.09 4,177.02
64 0.0567 77881.3 75768.3 2,177.88 2,039.71 4,217.59
65 0.0573 81516.9 79932.6 1,719.95 1,624.81 3,344.75

142
Age Claim
Probability
Average
claim
amount
(Male)
considering
inflation
Average
claim
amount
Total Total Total
Budget
(Female)
considering
inflation
Budget
(Male) in
₹ Cr.
Budget
(Female)
in ₹ Cr.
(Male +
Female)
in ₹ Cr.
66 0.0578 81516.9 79932.6 1,736.33 1,640.29 3,376.62
67 0.0584 81516.9 79932.6 1,752.72 1,655.77 3,408.49
68 0.0589 81516.9 79932.6 1,769.11 1,671.25 3,440.35
69 0.0595 81516.9 79932.6 1,785.49 1,686.73 3,472.22
70 0.06 84847.3 85732.1 1,278.64 1,301.85 2,580.48
71 0.0605 84847.3 85732.1 1,290.26 1,313.69 2,603.95
72 0.0611 84847.3 85732.1 1,301.89 1,325.53 2,627.42
73 0.0616 84847.3 85732.1 1,313.52 1,337.37 2,650.89
74 0.0622 84847.3 85732.1 1,325.15 1,349.20 2,674.35
75 0.0627 94680.4 88506.5 934.48 995.47 1,929.95
76 0.0633 94680.4 88506.5 942.61 1,004.13 1,946.73
77 0.0638 94680.4 88506.5 950.74 1,012.78 1,963.52
78 0.0644 94680.4 88506.5 958.87 1,021.44 1,980.31
79 0.0649 94680.4 88506.5 966.99 1,030.10 1,997.10
80 0.0655 93988.1 113709 873.86 1,422.82 2,296.69
81 0.066 93988.1 113709 881.15 1,434.69 2,315.84
82 0.0665 93988.1 113709 888.43 1,446.55 2,334.98
83 0.0671 93988.1 113709 895.72 1,458.41 2,354.13
84 0.0676 93988.1 113709 903 1,470.27 2,373.27
85 0.0682 99368 72298 962.39 942.36 1,904.76
86 0.0687 99368 72298 970.09 949.91 1,920.00
87 0.0693 99368 72298 977.8 957.45 1,935.24
88 0.0698 99368 72298 985.5 964.99 1,950.49
89 0.0704 99368 72298 993.2 972.53 1,965.73
90 0.0709 99368 72298 1,000.90 980.07 1,980.97
91 0.0715 99368 72298 1,008.60 987.61 1,996.22
92 0.072 99368 72298 1,016.30 995.15 2,011.46
93 0.0726 99368 72298 1,024.01 1,002.70 2,026.70
94 0.0731 99368 72298 1,031.71 1,010.24 2,041.94
95 0.0736 99368 72298 1,039.41 1,017.78 2,057.19

143
Age Claim
Probability
Average
claim
amount
(Male)
considering
inflation
Average
claim
amount
Total Total Total
Budget
(Female)
considering
inflation
Budget
(Male) in
₹ Cr.
Budget
(Female)
in ₹ Cr.
(Male +
Female)
in ₹ Cr.
96 0.0742 99368 72298 1,047.11 1,025.32 2,072.43
97 0.0747 99368 72298 1,054.81 1,032.86 2,087.67
98 0.0753 99368 72298 1,062.51 1,040.40 2,102.92
99 0.0758 99368 72298 1,070.22 1,047.94 2,118.16
100 0.0764 99368 72298 1,077.92 1,055.48 2,133.40
Presented below is the comparison of cost of Life Insurance proposal in 2011 and its
projected cost in 2021 as calculated above.
Table 5-9 : Comparison of The Current Cost of Health Insurance Proposal with
Projected One
Population
Year
Expenditure for all
Male (in ₹ Cr.)
Expenditure
for all Female
Total Aggregate
Expenditure(P)=1+2
(in ₹ Cr.)
% of GDP
2011 61,534 54,129 115,663 1.3
2021 159,879 143,329 303,208 1.8 Source: The data used for 2011 population is ‘2001 Census’ and 2021 population is 'Population Projections For India
And States 2001-2026, 2006’ and the projected budget is taken from http://stats.oecd.org/
5.2.3 Universalization
The health insurance proposal proposes to cover the whole population from 18-100 years
of age irrespective of the occupational groups, social group or the gender they belong to.
This way the prime objective of universalization can be achieved.
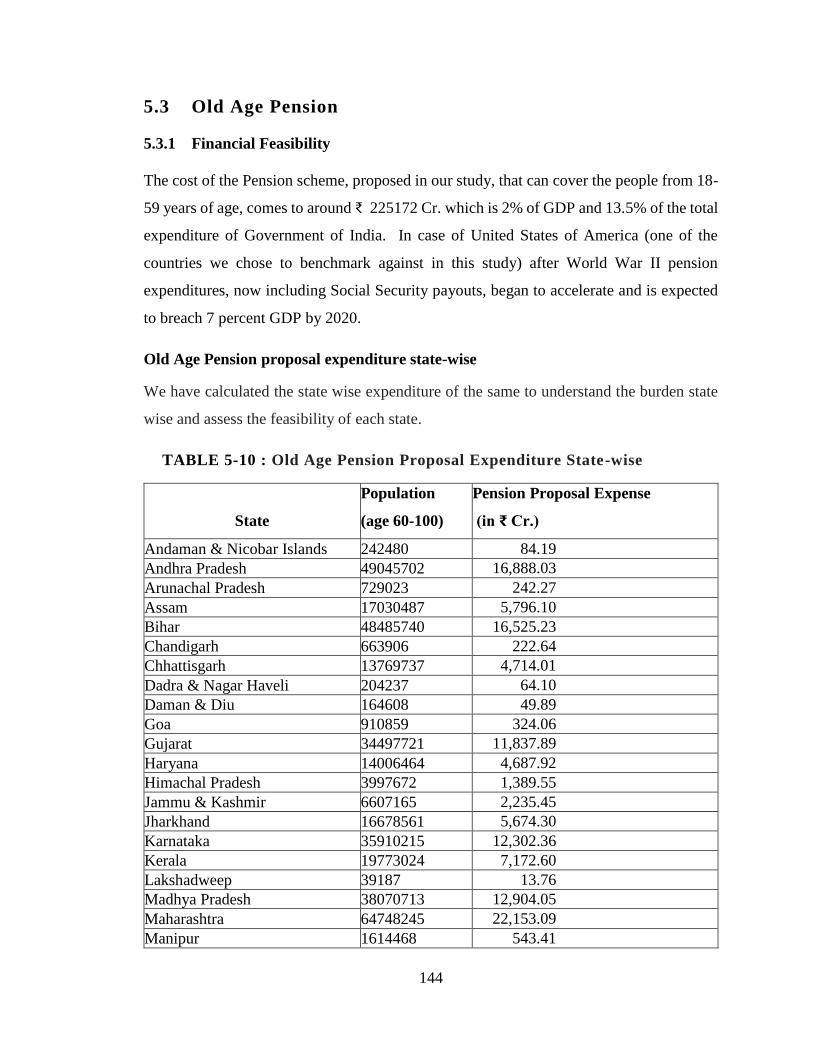
144
5.3 Old Age Pension
5.3.1 Financial Feasibility
The cost of the Pension scheme, proposed in our study, that can cover the people from 18-
59 years of age, comes to around ₹ 225172 Cr. which is 2% of GDP and 13.5% of the total
expenditure of Government of India. In case of United States of America (one of the
countries we chose to benchmark against in this study) after World War II pension
expenditures, now including Social Security payouts, began to accelerate and is expected
to breach 7 percent GDP by 2020.
Old Age Pension proposal expenditure state-wise
We have calculated the state wise expenditure of the same to understand the burden state
wise and assess the feasibility of each state.
TABLE 5-10 : Old Age Pension Proposal Expenditure State-wise
State
Population
(age 60-100)
Pension Proposal Expense
(in ₹ Cr.)
Andaman & Nicobar Islands 242480 84.19
Andhra Pradesh 49045702 16,888.03
Arunachal Pradesh 729023 242.27
Assam 17030487 5,796.10
Bihar 48485740 16,525.23
Chandigarh 663906 222.64
Chhattisgarh 13769737 4,714.01
Dadra & Nagar Haveli 204237 64.10
Daman & Diu 164608 49.89
Goa 910859 324.06
Gujarat 34497721 11,837.89
Haryana 14006464 4,687.92
Himachal Pradesh 3997672 1,389.55
Jammu & Kashmir 6607165 2,235.45
Jharkhand 16678561 5,674.30
Karnataka 35910215 12,302.36
Kerala 19773024 7,172.60
Lakshadweep 39187 13.76
Madhya Pradesh 38070713 12,904.05
Maharashtra 64748245 22,153.09
Manipur 1614468 543.41

145
State
Population
(age 60-100)
Pension Proposal Expense
(in ₹ Cr.)
Meghalaya 1442045 467.31
Mizoram 605651 200.35
Nagaland 1053997 344.27
NCT Of Delhi 10086616 3,413.83
Odisha 23457493 8,155.32
Puducherry 768115 272.84
Punjab 16096238 5,504.73
Rajasthan 35029919 11,747.24
Sikkim 362817 119.19
Tamil Nadu 43908716 15,573.93
Tripura 2154750 736.29
Uttar Pradesh 97415590 32,455.76
Uttarakhand 5368765 1,800.27
West Bengal 53421879 18,555.86
India 658362805 2,25,172.09
If we compare this with what’s spent in United States of America (USA), one of the
prominent country, implemented the social security on a larger basis, the figure seems
within the reasonable limits. Look at the table compiled and presented below for the
corresponding percentage from US spending on pension.
TABLE 5-11: Pension Spending in United States of America (USA) from
1990-2015
Year Pension expenditures (now including Social Security payouts)
in USA as a percent of GDP
1953 1
1958 2
1971 3
1974 4
1980 5
1990 5.1
2000 5.3
2009 6
2015 6.8 Source:(Chantrill) Kandil, M. (2001). Asymmetry in the effects of US government spending shocks: Evidence and
implications. The Quarterly Review of Economics and Finance, 41(2), 137-165.

146
5.3.2 Sustainability
In case of Atal Pension Yojana(APY), policy enrollment is available up to age 40years
while as obvious that the need of protection and support increases with age and hence the
people above this age group require more protection as well as have the capacity to
contribute. We have proposed the enrollment age up to 59 years with increased premium
in our proposal.
For financial sustainability in future, we have calculated the projected cost of the
proposed expenditure for year 2021.
Assumptions, Methodology and Data Sources for projections
Assumptions Inflation Rate in India averaged 6 percent from 2012 until 2018.
Methodology For projected calculation for Old age pension the budget of the pension
amount with the parameters of 2011 has been multiplied by projected inflation of 2021
and considering the projected population of 2021, to find out the overall budget needed.
Data Sources The 2021 projected Population is taken from Population projections for india
and states 2001-2026, 2006. Report of the Technical group on Population projections
constituted by the National Commission on Population, May 2006.
Inflation rates are taken from the http://stats.oecd.org/ .
TABLE 5-12 : Projected Aggregate Budgetary Requirement Old age
Pension for 2021 for the health proposal
Age Monthly pension
guaranteed Expenditure of Government in ₹ Cr.
18 1817 9,360.31
19 1817 9,360.31
20 1817 11,615.34
21 1817 11,615.34
22 1817 11,615.34
23 1817 11,615.34
24 1817 11,615.34
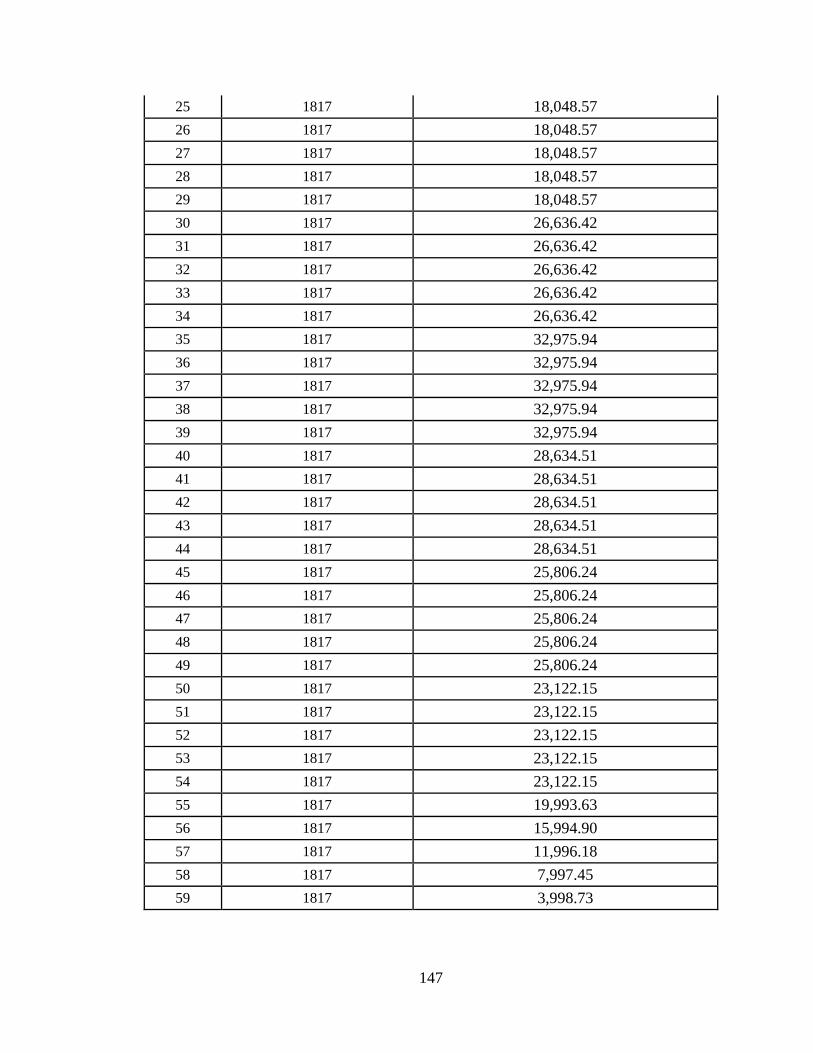
147
25 1817 18,048.57
26 1817 18,048.57
27 1817 18,048.57
28 1817 18,048.57
29 1817 18,048.57
30 1817 26,636.42
31 1817 26,636.42
32 1817 26,636.42
33 1817 26,636.42
34 1817 26,636.42
35 1817 32,975.94
36 1817 32,975.94
37 1817 32,975.94
38 1817 32,975.94
39 1817 32,975.94
40 1817 28,634.51
41 1817 28,634.51
42 1817 28,634.51
43 1817 28,634.51
44 1817 28,634.51
45 1817 25,806.24
46 1817 25,806.24
47 1817 25,806.24
48 1817 25,806.24
49 1817 25,806.24
50 1817 23,122.15
51 1817 23,122.15
52 1817 23,122.15
53 1817 23,122.15
54 1817 23,122.15
55 1817 19,993.63
56 1817 15,994.90
57 1817 11,996.18
58 1817 7,997.45
59 1817 3,998.73

148
Presented below is the comparison of cost of Old age pension proposal in 2011 and its
projected cost in 2021.
TABLE 5-13: Comparison of the current cost of Old age pension proposal
with projected one
Population
Year
Premium Expenditure for the whole population (₹
Cr.)
% of
GDP
2011 225172 2.54
2021 912897 5.42 Source: The data used for 2011 population is ‘2001 Census’ and 2021 population is 'Population Projections For India
And States 2001-2026, 2006’ and the projected budget is taken from http://stats.oecd.org/
5.3.3 Universalization
The people above forty years of age are not included in Atal Pension Yojana (APY);
those are more vulnerable and hence need the support, most. Our proposal extends the
coverage to 59 years of age.
5.4 Maternity Benefit
The expenditure to be incurred on the maternity benefit proposal is presented in the table
below.
5.4.1 Financially Feasibility
The cost of the Maternity Benefit, proposed in our study that can cover the female from
18-45 years of age, for birth of two children comes to around ₹ 44822 Cr. which is 0.76%
of GDP and 2.6% of the total expenditure of Government of India.
The International Labor Organization (ILO) paper on maternity benefit cost concludes that
looking at a sample of 57 low- and lower middle-income countries and show that
introducing a basic universal maternity cash benefit would require, on average, 0.41 per
cent of national gross domestic product (GDP). (Social protection for maternity : Key
policy trends and statistics.)

149
So, considering the above the proposal cost which comes to around 0.76% of GDP seems
to be within a reasonable range.
Maternity proposal expenditure state-wise
To be able to adjudge and assess the granular impact of the maternity proposal we have
calculated the state wise expenditure of the same.
TABLE 5-14: Maternity Proposal’s expenditure state-wise
State Name Population (age 15-45) Total cost ₹ Cr.
Andaman & Nicobar 90867 15.32
Andhra Pradesh 19937905 3,428.26
Arunachal Pradesh 296346 53.27
Assam 6960629 1,304.01
Bihar 19333773 3,675.82
Chandigarh 240453 29.34
Chhattisgarh 5535301 994.77
Dadra & Nagar Haveli 71229 11.44
Daman & Diu 47872 6.79
Goa 339299 51.05
Gujarat 13104870 2,150.24
Haryana 5417723 923.52
Himachal Pradesh 1561890 299.52
Jammu & Kashmir 2555351 451.5
Jharkhand 6653043 1,190.81
Karnataka 14288127 2,390.29
Kerala 7624041 1,231.00
Lakshadweep 14490 1.99
Madhya Pradesh 14900427 2,617.57
Maharashtra 24999946 4,044.85
Manipur 654653 115.04
Meghalaya 605154 109.6
Mizoram 243146 37.73
Nagaland 431623 75.52
Nct Of Delhi 3850715 469.57
Odisha 9317513 1,728.60

150
State Name Population (age 15-45) Total cost ₹ Cr.
Puducherry 309825 44.98
Punjab 6172255 1,044.76
Rajasthan 13846747 2,464.97
Sikkim 139087 24.68
Tamil Nadu 17234161 2,763.46
Tripura 854641 151.87
Uttar Pradesh 38377264 6,913.93
Uttarakhand 2168640 378.67
West Bengal 20918341 3,627.97
India 259097347 44,822.69 Source: Based on the calculations by the author.
TABLE 5-15: Maternity proposal’s cost as a percent of government’s Total
Expenditure and GDP of India.
% of Total Expenditure of all
the states of India (2014-15)
2.57
% of GDP of India (2015) 0.39
Source: Based on the Results obtained and presented above by the author
5.4.2 Sustainability
As the International Labor Organization (ILO) report says, "Without cash and health
benefits, many women could not afford to take maternity leave, or might be forced to return
to work before their health allowed”. A 1996 report to the United States Congress on family
and medical leave policies found that 100 per cent of the women eligible for leave who did
not take it said that they could not afford to.(Norton et al., 2001)
So, a cash benefit is a must for any maternity benefit scheme which corroborates the fact
manifests out of our proposal and this very fact makes the proposed scheme sustainable.
For financial sustainability in future, we have calculated the projected cost of the proposed
expenditure for year 2021.

151
Assumptions, Methodology and Data Sources for projections
Assumptions Inflation Rate in India averaged 6 percent from 2012 until 2018.
Methodology For projected calculation for maternity benefit the amount has been
multiplied by projected inflation of 2021 and considered the projected population of 2021,
to find out the overall budget needed.
Data Sources The 2021 projected Population is taken from Population projections for
india and states 2001-2026, 2006. Report of the Technical group on Population
projections constituted by the National Commission on Population, May 2006.
Inflation rates are taken from the http://stats.oecd.org/ .
TABLE 5-16: Projected Aggregate Expenditure for Maternity Proposal for
2021
Age Total projected female
population in 2021
Total projected
Expenditure (in ₹ Cr.)
considering the inflation.
18 10557800 3,836.49
19 10557800 3,836.49
20 11294000 4,104.01
21 11294000 4,104.01
22 11294000 4,104.01
23 11294000 4,104.01
24 11294000 4,104.01
25 11444200 4,158.59
26 11444200 4,158.59
27 11444200 4,158.59
28 11444200 4,158.59
29 11444200 4,158.59
30 10939000 3,975.01
31 10939000 3,975.01
32 10939000 3,975.01
33 10939000 3,975.01
34 10939000 3,975.01
35 9389800 3,412.06

152
Age Total projected female
population in 2021
Total projected
Expenditure (in ₹ Cr.)
considering the inflation.
36 9389800 3,412.06
37 9389800 3,412.06
38 9389800 3,412.06
39 9389800 3,412.06
40 8388400 3,048.17
41 8388400 3,048.17
42 8388400 3,048.17
43 8388400 3,048.17
44 8388400 3,048.17
45 7817600 2,840.76
1,04,002.94
Presented below is the comparison of cost of Maternity benefit proposal in 2011 and its
projected cost in 2021 as calculated above.
TABLE 5-17 : Comparison of the current cost of Maternity benefit proposal
with projected one
Population
Year
Premium Expenditure for the whole population (in ₹
Cr.)
% of
GDP
2011 44822 0.39
2021 104003 0.61 Source: The data used for 2011 population is ‘2001 Census’ and 2021 population is 'Population Projections For India
And States 2001-2026, 2006’ and the projected budget is taken from http://stats.oecd.org/
It was not possible to get the projected population of 2021 with the rural and urban
classification so we have taken the current urban benefit under maternity benefit ie, Rs
2000 and multiplied the same with the projected inflation of 2021.This way the total budget
arrived at may be higher side though it may also suit the situation if there is more migration
from rural to urban area in the country.
153
5.4.3 Universalization
The proposal covers all the women from 18-45 years of age which is a reasonably large
fertile female population. In addition, the proposal doesn’t differentiate between the
recipient of the maternity benefit based on any social group, employment status or the area
of residence, this is going to be the most universal in nature.
5.5 Comprehensive Social Security
Comprehensive social security i.e. a social security program that comprises of all the
schemes like Life insurance, Health insurance, Old age pension and Maternity benefit so
as to give a holistic approach towards social security. So, in addition to presenting the
individual schemes we also present the comprehensive view of the proposals to assess and
evaluate its financial feasibility.
The plan outlay for 2015-16 (Budget 2015-2016) reflects a major compositional shift in
the expenditure estimates. These changes are because of long standing demand of the States
for greater devolution and greater flexibility in design of Centrally Sponsored Schemes. In
the spirit of "Cooperative federalism", Government has accepted the recommendation of
the Fourteenth Finance Commission (FFC) and will be devolving 42% of the divisible pool
of Union Taxes. This will be much higher than the 32% devolved to States in 2014-15 as
per the Thirteenth Finance Commission Award. So, the states may also be in the position
to bear, at least in part, the cost of financing the social security schemes.
We are presenting a different angle as an alternate to aid in the feasibility of the proposal
-the expenses of a state can be equally shared between state and center. We have worked
out the calculations and presented as a percent of the total budget (capital + revenue) of the
state and Centre. This could be one of the ways to implement the universal scheme and
have the shared responsibility between center and state and have the onus of its success
divided between them. This is presented in the table in subsequent section in this chapter.
One more alternative way of implementing the comprehensive social security is by
considering the state’s total expenditure budget combined with the center’s total
expenditure budget for every state. That way the individual state’s requirement can be

154
fulfilled with the pool from center combined instead of the center’s contribution equal to
the state’s contribution for every state. The idea is to have a flexible amount from the center
for the state and hence considering the total budget available to every state. An illustration
of the proposal is presented in the table in the subsequent section of this chapter.
Providing the holistic view of the expenditure encompassing all the proposals ie. Life,
Health, Old age Pension and Maternity insurance, presented the tables below with the
details.
TABLE 5-18: Comprehensive Social Security Proposal Expenditure as a
percentage of Revenue Expenditure
State
Revenue
expenditure
of the state
(2014-15) in
₹ Cr.
Comprehensive
Social Security (Life
+ Health + Pension +
Maternity) as a % of
State revenue
expenditure
Comprehensive
Social Security (Life
+ Health + Pension +
Maternity) as a % of
Central and state
revenue expenditure
India 14,66,992 30.94 14.05
Andaman &
Nicobar 2,903 5.63 0.01
Andhra Pradesh 98,142 34.8 1.06
Arunachal Pradesh 7,179 6.74 0.01
Assam 48,631 24.2 0.36
Bihar 91,765 36.94 1.05
Chandigarh 2,743 15.03 0.01
Chhattisgarh 46,191 20.68 0.3
Dadra & Nagar H 506 24.22 0
Daman & Diu 379 24.24 0
Goa 8,099 7.04 0.02
Gujarat 96,217 24.28 0.72
Haryana 52,703 17.94 0.29
Himachal Pradesh 19,784 14.55 0.09
Jammu & Kashmir 32,461 13.81 0.14
Jharkhand 39,488 29 0.35
Karnataka 1,10,757 22.28 0.76
Kerala 71,974 20.13 0.45
Aggregate of Comprehensive Social Security cost = Cost of Life Insurance + Cost of
Health Insurance + Cost of Pension Benefits + Cost of Maternity Benefits

155
State
Revenue
expenditure
of the state
(2014-15) in
₹ Cr.
Comprehensive
Social Security (Life
+ Health + Pension +
Maternity) as a % of
State revenue
expenditure
Comprehensive
Social Security (Life
+ Health + Pension +
Maternity) as a % of
Central and state
revenue expenditure
Lakshadweep 784 3.35 0
Madhya Pradesh 99,014 26.3 0.81
Maharashtra 1,84,423 23.99 1.37
Manipur 7,628 14.43 0.03
Meghalaya 9,903 9.66 0.03
Mizoram 5,764 6.88 0.01
Nagaland 7,911 8.77 0.02
Nct Of Delhi 27,541 23.1 0.2
Odisha 62,881 26.54 0.52
Puducherry 5,183 10.25 0.02
Punjab 49,146 16.88 0.26
Rajasthan 1,05,387 22.64 0.74
Sikkim 4,839 4.96 0.01
Tamil Nadu 1,27,100 24.28 0.96
Tripura 8,117 18.28 0.05
Uttar Pradesh 1,97,425 33.66 2.06
Uttarakhand 23,792 15.54 0.11
West Bengal 1,05,978 34.95 1.15
0
0.2
0.4
0.6
0.8
Ind
iaA
ND
AM
AN
&…
AN
DH
RA
…A
RU
NA
CH
AL…
ASS
AM
BIH
AR
CH
AN
DIG
AR
HC
HH
ATT
ISG
AR
HD
AD
RA
&…
DA
MA
N &
DIU
GO
AG
UJA
RA
TH
AR
YAN
AH
IMA
CH
AL…
JAM
MU
&…
JHA
RK
HA
ND
KA
RN
ATA
KA
KER
ALA
LAK
SHA
DW
EEP
MA
DH
YA…
MA
HA
RA
SHTR
AM
AN
IPU
RM
EGH
ALA
YAM
IZO
RA
MN
AG
ALA
ND
NC
T O
F D
ELH
IO
DIS
HA
PU
DU
CH
ERR
YP
UN
JAB
RA
JAST
HA
NSI
KK
IMTA
MIL
NA
DU
TRIP
UR
AU
TTA
R P
RA
DES
HU
TTA
RA
KH
AN
DW
EST
BEN
GA
L
Percentage of total budget(capital+revenue) Shared equally between centre and state
Percentage of total budget(capital+revenue) Shared equally between centre and state
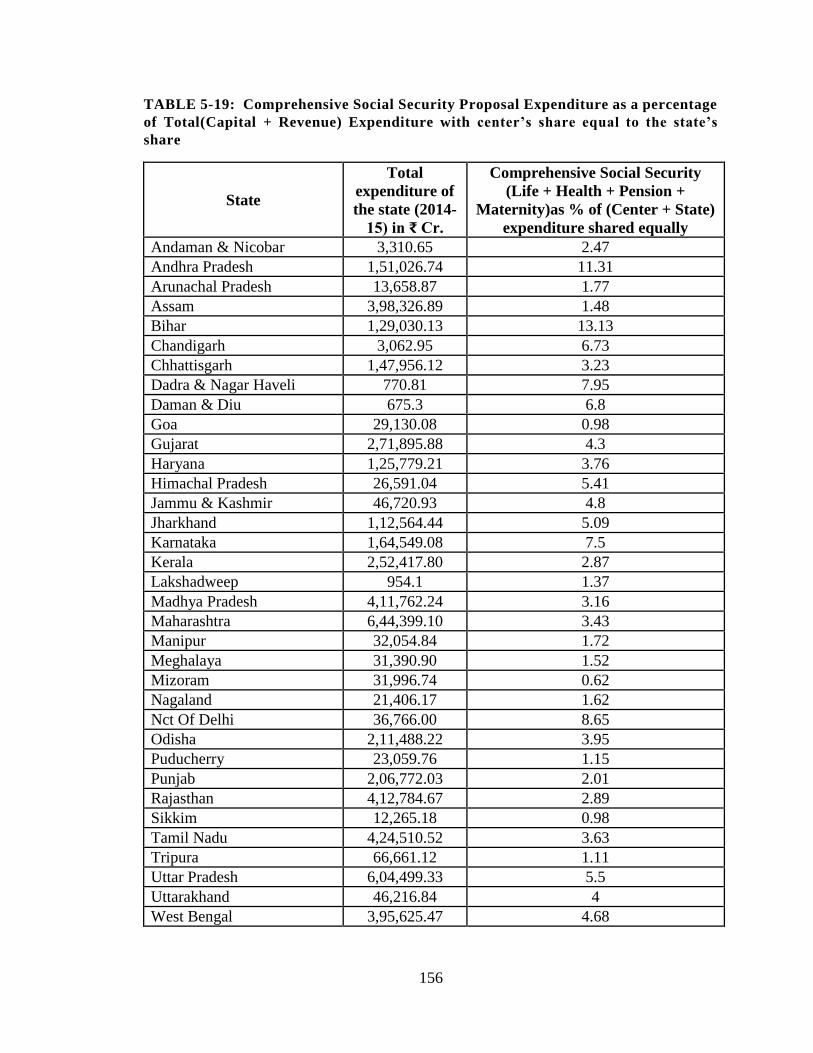
156
TABLE 5-19: Comprehensive Social Security Proposal Expenditure as a percentage
of Total(Capital + Revenue) Expenditure with center’s share equal to the state’s
share
State
Total
expenditure of
the state (2014-
15) in ₹ Cr.
Comprehensive Social Security
(Life + Health + Pension +
Maternity)as % of (Center + State)
expenditure shared equally
Andaman & Nicobar 3,310.65 2.47
Andhra Pradesh 1,51,026.74 11.31
Arunachal Pradesh 13,658.87 1.77
Assam 3,98,326.89 1.48
Bihar 1,29,030.13 13.13
Chandigarh 3,062.95 6.73
Chhattisgarh 1,47,956.12 3.23
Dadra & Nagar Haveli 770.81 7.95
Daman & Diu 675.3 6.8
Goa 29,130.08 0.98
Gujarat 2,71,895.88 4.3
Haryana 1,25,779.21 3.76
Himachal Pradesh 26,591.04 5.41
Jammu & Kashmir 46,720.93 4.8
Jharkhand 1,12,564.44 5.09
Karnataka 1,64,549.08 7.5
Kerala 2,52,417.80 2.87
Lakshadweep 954.1 1.37
Madhya Pradesh 4,11,762.24 3.16
Maharashtra 6,44,399.10 3.43
Manipur 32,054.84 1.72
Meghalaya 31,390.90 1.52
Mizoram 31,996.74 0.62
Nagaland 21,406.17 1.62
Nct Of Delhi 36,766.00 8.65
Odisha 2,11,488.22 3.95
Puducherry 23,059.76 1.15
Punjab 2,06,772.03 2.01
Rajasthan 4,12,784.67 2.89
Sikkim 12,265.18 0.98
Tamil Nadu 4,24,510.52 3.63
Tripura 66,661.12 1.11
Uttar Pradesh 6,04,499.33 5.5
Uttarakhand 46,216.84 4
West Bengal 3,95,625.47 4.68

157
TABLE 5-20: Comprehensive Social Security Proposal Expenditure as a percentage
of Total (Capital Revenue) Expenditure, with center’s budget added in every state’s
budget
State
Comprehensive SS (Life + Health +
Pension + Maternity) as % of Total of
Centre and State expenditure
Andaman & Nicobar 0.01
Andhra Pradesh 1.882
Arunachal Pradesh 0.029
Assam 0.571
Bihar 1.891
Chandigarh 0.025
Chhattisgarh 0.527
Dadra & Nagar Haveli 0.007
Daman & Diu 0.006
Goa 0.034
Gujarat 1.207
Haryana 0.528
Himachal Pradesh 0.17
Jammu & Kashmir 0.262
Jharkhand 0.645
Karnataka 1.35
Kerala 0.756
Lakshadweep 0.002
Madhya Pradesh 1.255
Maharashtra 1.917

158
State
Comprehensive SS (Life + Health +
Pension + Maternity) as % of Total of
Centre and State expenditure
Manipur 0.065
Meghalaya 0.056
Mizoram 0.023
Nagaland 0.041
Nct Of Delhi 0.374
Odisha 0.89
Puducherry 0.032
Punjab 0.443
Rajasthan 1.149
Sikkim 0.014
Tamil Nadu 1.478
Tripura 0.086
Uttar Pradesh 2.93
Uttarakhand 0.216
West Bengal 1.798
As following the objective, we have identified the issue with social security scheme
currently existing in India, primarily promoted by the government. As we have mentioned
that we would be considering Life Insurance, Health Insurance, Pension Benefit and
Maternity Benefit. So, in each of these areas, based on the requirement triggered by the
identified gaps, we have come up with different proposal, changes with the intension of
providing the comprehensive social security to the whole population. This will have a
significant impact on the lives of the poor as well.

159
This way we propose to make the scheme universal which was most important requirement
and the prime contributory to the success of any social security seeking country.
We have not limited our self at just coming up with analytical framework of those proposal,
but we have also compared the results with the nations we have identified for
benchmarking viz. Brazil, China, Germany, United Kingdom, United States. One of the
parameter in the comparison is the cost of the social security scheme as percentage of the
Gross Domestic Product (GDP) of countries.
Europe, spend over 25% of its GDP (for the year 2005) on social security of which one-
third is on healthcare. The global average is 8.39% of GDP (2.67% on healthcare) and
ranges from 4.05% (0.95% healthcare) in India to 12-13% in South Africa, Brazil and
Russia (3-4% healthcare) and 29.40% (6.8% healthcare) in Sweden.(Duggal, 2013)
Many developed economies already expend a sizable share of their GDP on these
programs. For example, public expenditures on pensions and health care currently consume
about 13% of GDP in the U.S. and more than 20% in France. For these economies, the
pressing question is whether population aging will push public pensions and health care
programs to consume ever-rising proportions of national income.
TABLE 5-21: Comparison of Public social protection expenditure as
percentage of GDP
Country Total Public Social Protection Expenditure & Health
Expenditure (% of GDP)
Brazil 21.29(2010)
China 6.83(2010)
Germany 25.89(2011)
India 2.39(2012)
United Kingdom 23.84(2010)
United States 19.92(2010) Source:(ILO Social Security Expenditures Database.)
The above table shows that India’s existing expenditure on social security is lowest
compared to the other countries taken up.
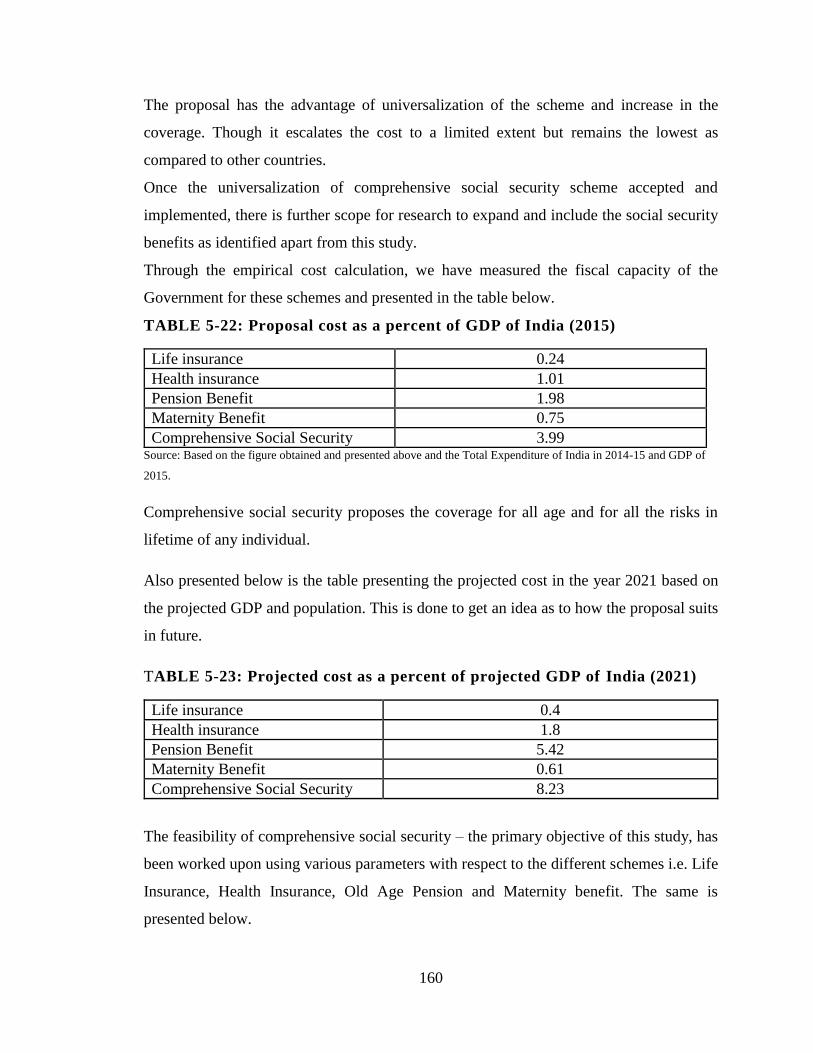
160
The proposal has the advantage of universalization of the scheme and increase in the
coverage. Though it escalates the cost to a limited extent but remains the lowest as
compared to other countries.
Once the universalization of comprehensive social security scheme accepted and
implemented, there is further scope for research to expand and include the social security
benefits as identified apart from this study.
Through the empirical cost calculation, we have measured the fiscal capacity of the
Government for these schemes and presented in the table below.
TABLE 5-22: Proposal cost as a percent of GDP of India (2015)
Life insurance 0.24
Health insurance 1.01
Pension Benefit 1.98
Maternity Benefit 0.75
Comprehensive Social Security 3.99 Source: Based on the figure obtained and presented above and the Total Expenditure of India in 2014-15 and GDP of
2015.
Comprehensive social security proposes the coverage for all age and for all the risks in
lifetime of any individual.
Also presented below is the table presenting the projected cost in the year 2021 based on
the projected GDP and population. This is done to get an idea as to how the proposal suits
in future.
TABLE 5-23: Projected cost as a percent of projected GDP of India (2021)
Life insurance 0.4
Health insurance 1.8
Pension Benefit 5.42
Maternity Benefit 0.61
Comprehensive Social Security 8.23
The feasibility of comprehensive social security – the primary objective of this study, has
been worked upon using various parameters with respect to the different schemes i.e. Life
Insurance, Health Insurance, Old Age Pension and Maternity benefit. The same is
presented below.

161
With respect to the proposed schemes in Life, Health, Pension and Maternity the eligible
age ranges as presented in the table next.
TABLE 5-24 : Age groups covered under the proposals
Proposal Scheme Universalization (eligible age ranges)
Life Insurance 18-59 years of age
Health Insurance 18-100 years of age
Pension Benefit 18-59 years of age
Maternity Benefit 18-45 years of age
This discussed the financial feasibility and fiscal sustainability of the proposed scheme.
The present chapter summarizes the thesis and presents the limitations, scope for further
research and concludes the study.
162
Chapter 6
Financial Feasibility and Sustainability of Universal
Comprehensive Social Security in India
The primary objective of this study is to propose the comprehensive universal social
security programme for India and to evaluate its financial feasibility and fiscal
sustainability for India. The definition of social security for this purpose has been
benchmarked upon the concept of social security put forward by ILO and the four pillars
of social security recommended by the Arjun Sengupta Committee report (2007) to include
Life insurance, Health insurance, Pensions, and Maternity benefit.The chapter wise
summary of the study and its findings are presented next.
6.1 Chapter wise Summary
Chapter 1 provided background, objectives, definition of social security, outline of the
study and data and methodology. The chapter explored various definitions of social
security and arrived at the definition by ILO. The concept of social security by National
Commission for Enterprises in the Unorganized sector (Arjun Sengupta report (2007) of
the term Social security is applied. The chapter also discussed the evolution and
chronological historical background.
Chapter 2 provided the literature review. The definition of universalization in the literature,
the desirability of universalization in the extant literature and the recommendations of
various committees. The literature review focuses on universalization from the perspective
of public policy. These references have helped in various aspects of our research for
example understanding the components of social security, benefits and gaps of such
schemes in India and the provisions of social security have some justification from the
viewpoint of democracy.
Chapter 3 provided the experiences of existing social security programmes of selected five
countries and India. The review of relevant existing security schemes in India with respect
to Life Insurance, Health Insurance, Old Age Pension and Maternity Benefit and critically
evaluates the schemes and identifies the gaps thereof. In India there are several social

163
security schemes of different kinds exist, covering different groups of people mainly
workers in the organized sector. These schemes provide insurance against different kinds
of risks mainly related to employment. These schemes have been framed piecemeal. They
are overlapping in some respects while there are large gaps in their coverage. They need to
be integrated.
Chapter 4 presents the comprehensive universal social security product modeled by the
researcher. This chapter explains the assumptions, design, premium and cost calculation of
each of the component of this product viz. life insurance, health insurance, pensions and
maternity benefit.
Chapter 5 discussed the financial feasibility and fiscal sustainability of the proposed
scheme. Sustainability of comprehensive social security can be determined from its
financial analysis which is decided by number of beneficiaries and level of benefits. The
scope of study is limited to its financial feasibility and the issues in regulation and
administration are beyond its scope.
Chapter 6 The present chapter summarizes the thesis and presents the limitations, scope for
further research and concludes the study.
6.2 Findings of the Study
The literature shows that publicly funded universal social security schemes are one of the
powerful policies to alleviate poverty in developing countries. Various committee reports
also support this argument and recommend universal comprehensive provision of
affordable social security cover for the entire population of the country.
The study models the comprehensive social security product for India and estimates its
costs for the exchequer.
1. The life insurance element of the proposed product costs 0.48% to the exchequer.
2. The health insurance element of the product costs 2.00 % to the exchequer.
3. The pension’s component costs 3.91% to the exchequer.
4. The maternity benefit component costs 0.78 % to the exchequer.

164
5. The comprehensive product thus costs 7.16 % of the Union Government Budget at
current level of population.
6. The sustainability of comprehensive social security will depend on its financial
affordability. The expenditure on Social security is expressed as percentage either
of GDP or of Government expenditure, which is 410899 cr. that is 4% of GDP and
27.28% of total expenditure.
7. The expenditure on social security can also be shared by the states. These estimates
are also calculated in the study based on the state wise population under certain
assumptions.
8. The data shows that the public expenditure on social security is less in India as
compared to the other countries. Though the public spending will be higher than
the current level of public spending on social security in India, as compared to the
other countries this burden on the exchequer seems reasonable and justifiable.
9. In India the level of poverty and size of vulnerable population calls for the
implementation of comprehensive social security program. The improved tax
effort, tax efficiency and fiscal reforms like GST would make the cost of this
product are not only feasible but also desirable as it will channel the tax revenue in
proper direction.
6.3 Limitations of the Study
1. The proposed schemes in the study are helpful only for the population of 18 years and
above.
2. For calculation, population distribution data is taken from Census 2011.
3. Life Insurance proposal is based on mortality tables which directly affects the
calculations. In this calculation Mortality tables (2006-07) has been used which can
vary based on actuals.

165
4. The specific present value tables of 6% rate of Interest have been used from actuarial
tables for calculating the fund value for the insurance proposal schemes.
5. The basis of old age pension scheme is the number of years, the accumulated amount
is, sufficient to pay the premium has been kept constant.
6. Average claim amount and average claim probability may lead to some variation when
compare with the actuals.
7. With respect to budget requirement to implement the proposals in our study, we have
excluded the administrative and miscellaneous expenses.
6.4 Scope for Further Research
The sustainability of publicly financed social security especially pensions is much debated
issue in developed countries of Western Europe and USA. The region wise, age group wise
and gender wise population projections can be used for the estimate of future costs, if the
data is available.
The administrative and implementation expenses can be estimated with the finalization of
operational framework of the scheme.
6.5 Concluding Remarks
Is social security good or bad for the economy? Various economic studies argue about how
the system affects saving, labor supply, and income distribution. The issue of publicly
financed comprehensive social security is not free from debate. Not every economist agrees
to the utopian idea of state providing for the social security needs of the population. The
literature provides little evidence to support or refute assertions that social security has
reduced saving, but they do indicate that it has contributed to the trend toward early
retirement. Some studies have shown that the social security has played a considerable role
in bringing about equality (Aaron, 2010).
The economic arguments for and against social security are:
The arguments by the “Against” social security -camp:
Adverse effect on savings Although there are debates on the adverse effect of social;
security on incentive to save, the empirical evidence is not found due to the shortcomings
of available data. As a result, the effects of social security on saving and labor supply are

166
difficult to measure, and how such a complex system influences behavior is not at all well
understood.
The social security provisions would be ultimately financed by taxes and the effect of these
taxes on income distributions, labour supply, are non-specified.
Adverse effect on production due to disincentive to work, and early retirement
Macroeconomic effects on income distribution: In India the inter- sectoral disparities in
wages will complicate the problem of redistribution of income. Given the narrow tax base
low level of employment in the organized sector, the per capita burden of social security
will be high on the working population.
Intergenerational Transfers: In general, a transfer from the young to the old is a transfer
from people who are relatively rich to people who are relatively poor. That is because of
the phenomenon of economic growth, which makes each generation better off than the
previous generation. At any point in time, the working-age population is being taxed to
support retirees. (Diamond, 1998) The “for” -social security- camp also has strong
arguments:
The economists like Sala-i-Martin (1996) argue that the social security and pensions have
positive effects on the economy and growth because it incentivizes replacement of less
productive labor force by the more productive labor force. The main idea is that pensions
are a means to induce retirement that is, to buy the elderly out of the labor force because
aggregate output is higher if the elderly do not work. This is modeled
through positive externalities in the average stock of human capital: because skills
depreciate with age, the elderly have lower-than-average skill and, as a result, have a
negative effect on the productivity of the young. When the difference between the skill
level of the young and that of the old is large enough, aggregate output in an economy
where the elderly do not work is higher. This argument is applicable to India given the vast
armies of unemployed youth!
The perennial economic issue who will be responsible to remove poverty? This comes out
from a great recent paper by van Oorschot, Reeskens & Meueleman (2013), Gelissen &
Ooorschot (2013) bring out that people’s perceptions regarding the positive effects of
167
social security in removing poverty and role of welfare state is positive. The countries
spending high amount on social security people perceive negative consequences strain on
economy, less incentive to work as well as positive consequences (removal of poverty) of
social security.
The debate on social security has been more of ideological nature focusing on whether it
is desirable to tax working population to pay for the removal of poverty and benefit of the
non-working population. However, no concrete evidence is found to prove the negative
effects on savings and productivity.
The question is not whether social security per se is bad or good. The question is whether
the overall macro environment is resilient to bear the burden of social security. Ultimately
as for any issue related to public funding and taxation the perception depends on how
efficient the Government is as a service provider and what the overall economic
environment is. In recessionary times the pinch of social security is felt more.
For countries like India with a perennial problem of poverty dragging the entire economy
away from propelling into higher level of growth it is worthwhile to adopt a comprehensive
social security programme with a prerequisite of its efficient implementation.

168
References http://wcd.nic.in/
http://indianexpress.com/
http://infochangeindia.org/
http://www.livemint.com/
http://mohfw.nic.in
http://www.socialsecuritynow.org
http://www.ifmr.co.in/
http://financialservices.gov.in/insurance/
http://www.edac.eu/
http://doi.org/
http://npstrust.org.in/
http://www.Reviewjournal.Com/
http://biblehub.com/nasb/genesis/
http://shodhganga.inflibnet.ac.in/
http://www.usgovernmentspending.com/pensions_spending/
http://hdr.undp.org/en/data/
https://www.ssa.gov/policy/
http://icrier.org/
http://socialprotection-humanrights.org/
https://assets.publishing.service.gov.uk/government/uploads/system/uploads/attachment_
data/file/305371/social-security-spending-in-UK-including-scotland.pd0)
https://data.oecd.org/socialexp/social-spending.htm
https://www.theguardian.com/politics/2016/aug/31/uk-social-security-system-unfit-
purpose-benefits-fabian-society-study
https://data.oecd.org/socialexp/social-spending.htm
https://www.howtogermany.com/pages/working.html
http://www.previdencia.gov.br/arquivos/office/3_091113-150152-707.pdf
https://www.itau.com.br/_arquivosestaticos/itauBBA/contents/common/docs

169
https://stats.oecd.org/Index.aspx?DataSet
https://data.oecd.org/socialexp/social-spending.htm
https://www.ssa.gov/policy/docs/progdesc/ssptw/2016-2017/americas/united-states.pdf
http://financialservices.gov.in/pensionreforms/PRstatistics.asp
http://arvindkumar-ias.blogspot.in/2011/11/brief-history-of-pension-system-in.html
http://indiatogether.org/youth-unemployment-and-education-trends-india-economy
http://population-hs6110.blogspot.in/2013/03/dependency-ratio.html
http://www.academia.edu/6473706/Awarness_of_pension_scheme_among_unorganized_
sector_-_An_empricial_study
http://www.npstrust.org.in/images/FAQSwavalamban.pdf
http://pib.nic.in/newsite/PrintRelease.aspx?relid=116208
http://www.ifmr.co.in/blog/2015/03/09/an-initial-analysis-of-the-atal-pension-yojana/
http://www.livemint.com/Money/p97HzmWFlTrEY8TaChxNKJ/Atal-Pension-Yojna-is-
a-bad-deal.html
https://www.ons.gov.uk/peoplepopulationandcommunity/wellbeing/articles/socialprotecti
on/europeancomparisonsofexpenditure2007to2014

170
Aam Aadmi Bima Yojana(AABY). (2014). Retrieved from
http://financialservices.gov.in/insurance/gssois/aaby.asp
Ageing and Employment Policies: United States 2018. (2018). OECD.
https://doi.org/10.1787/9789264190115-en
Ahmad, E. (1991). SOCIAL SECURITY AND THE POOR: Choices for Developing
Countries. The World Bank Research Observer , 6(1), 105–127.
https://doi.org/10.1093/wbro/6.1.105
Ahmad, E. (2015). Choices for Developing Countries, 6(1), 105–127.
Ahmad, E., Drèze, J., Hills, J., & Sen, A. (1991). Social Security in Developing
Countries. Social Security in Developing Countries (Vol. Caepr Work).
Ahuja, R. (n.d.). Lessons for India in Thailand’s experience on universal healthcare.
Indian Express. Retrieved from
http://indianexpress.com/article/opinion/columns/thailand-pm-meet-modi-
healthcare-relations-column-2869921/
ANNUAL REPORT to the PEOPLE on Health. (2011).
Assets Under Management and Number of Subscribers - NPS. (2016). Retrieved from
http://npstrust.org.in/index.php/finstat/aumsubs
Balamurugan, P. (2015). Social security for workers in unorganised sector with special
reference to women workers problems and perspectives. Tamil Nadu Dr. Ambedkar
Law University. Retrieved from http://hdl.handle.net/10603/76677
Bureau, I. I. (2012). Health Insurance ( Non-Life ) Data Analysis Report.
C.D.Daykin. (1996). DEVELOPMENTS IN SOCIAL SECURITY AND PENSIONS
WORLD-WIDE, 2(1), 207–226.
Can low-income countries afford basic social security? (2008). Retrieved from
https://www.unicef.org/socialpolicy/files/Can_low_income_countries_afford_basic_
171
social_protection.pdf
Carrin, G., & James, C. (2005). Social health insurance: Key factors affecting the
transition towards universal coverage. International Social Security Review, 58(1),
15–22. https://doi.org/10.2165/00148365-200504010-00004
Cerda, R. a. (2005). On social security financial crisis. Journal of Population Economics,
18(3), 509–517. https://doi.org/10.1007/s00148-005-0233-6
Chantrill, C. (n.d.). US Pensions Spending History from 1900. Retrieved from
http://www.usgovernmentspending.com/pensions_spending
China’s Pension Gap Is Growing as Aging Becomes Economic Risk - Bloomberg. (n.d.).
Retrieved July 1, 2018, from https://www.bloomberg.com/news/articles/2017-06-
26/china-s-pension-gap-is-growing-and-nobody-wants-to-talk-about-it
Choudhury, M., & Srinivasan, R. (2011). A Study on Insurance Schemes of Government
of India (Final Report).
Cichon, M., Newbrander, W., Yamabana, H., Weber, A., Normand, C., Dror, D., &
Preker, A. (1999). Modelling in health care finance: A compendium ofquantitative
techniques for health care financing.
Cohen, W. J. (1953). Social Security in India, (May), 11–16.
Comprehensive Social Security for the Indian Unorganized Sector Recommendations on
Design and Implementation For submission to The Ministry of Finance ,
Government of India. (2013).
Cox, D., & Jimenez, E. (1992). Social security and private transfers in developing
countries: The case of Peru. World Bank Economic Review, 6(1), 155–169.
D. Swarup. (n.d.). Pension Reform in India – A Social Security Need, 1–16.
Dev, M., Subbarao, K., Galab, S., & Ravi, C. (2007). Safety Net Programmes: Outreach
and Effectiveness. Economic and Political Weekly, 42(35), 3555–3565.
https://doi.org/10.2307/40276501
Dror, D. M., & Vellakkal, S. (2012). Is RSBY India’s platform to implementing universal

172
hospital insurance? Indian Journal of Medical Research, 135(1), 56–63.
https://doi.org/10.4103/0971-5916.93425
Duggal, R. (2006). Need to Universalise Social Security. Economic and Political Weekly,
41(32), 3495–3497. https://doi.org/10.2307/4418561
Duggal, R. (2013). Social Security Budgets in India – A Critical Assessment, 53(9),
1689–1699. https://doi.org/10.1017/CBO9781107415324.004
Ehtisham Ahmad, Jean Drèze, John Hills, and A. Sen. (2014). Social Security in
Developing Countries. Disputatio (Vol. 6). https://doi.org/10.1093/acprof
Fact sheet Social security US. (n.d.). Retrieved from
https://www.ssa.gov/news/press/factsheets/basicfact-alt.pdf
FAQ on Human Development Index,United Nations Development Programme. (2014).
Retrieved from http://hdr.undp.org/en/data
Goswami, R. (n.d.). INDIAN PENSION SYSTEM : PROBLEMS AND PROGNOSIS,
(2).
Government Budget 2016. (2016). Union Government Budget 2016.
GOVERNMENT OF INDIA MINISTRY OF STATISTICS AND PROGRAMME
IMPLEMENTATION NATIONAL SAMPLE SURVEY OFFICE. (2015).
Gumber, A. (2002). Health Insurance for the informal sector: Problems and prospects.
(Vol. 90). Retrieved from http://icrier.org/pdf/WP-90.pdf
Gupta, A. (2011). Universal Access to Healthcare: Threats and Opportunities. Economic
and Political Weekly, 46(26), 27–30.
Hooda, S. K. (2013). Changing Pattern of Public Expenditure on Health in India: Issues
and Challenges.
ILO social security and other labour standards. (n.d.). Retrieved from
http://socialprotection-humanrights.org/legal-depository/legal-instruments/ilo-
social-security-and-other-labour-standards/
ILO Social Security Expenditures Database. (n.d.). Retrieved from
173
http://www.edac.eu/indicators_desc.cfm?v_id=116
IndianConstitution. (2007). The constitution of India (pp. 1–268). Retrieved from
https://india.gov.in/sites/upload_files/npi/files/coi_part_full.pdf
International Covenant on Economic, Social and Cultural Rights. (n.d.). Retrieved from
http://www.ohchr.org/EN/ProfessionalInterest/Pages/CESCR.aspx
Jhabvala, R. (1998). Social Security for Unorganised Sector. Economic and Political
Weekly, 33(22), L7–L11. Retrieved from http://www.jstor.org/stable/4406828
Kalyani, M. (2016). Indian Informal Sector : an Analysis. International Journal of
Managerial Studies and Research (IJMSR), 4(1), 78–85.
Kothari, J. (2014). A Social Rights Model for Social Security : Learnings from India.
Thematic Issue: Innovation in Social Security Legislation: Comparative
Perspectives, 47(1), 5–21.
Kurian, O. (2014). Financing Healthcare for all in India : Towards a Common Goal,
(December), 1–28.
Laaser, U. (1967). Challenging Developments in Universal Insurance Coverage. Indian
Journal of Public Health, 11(3), 129–130.
https://doi.org/10.1057/palgrave.jphp.3200054
Lingam, L., & Kanchi, A. (2015). Women ’ S Work , Maternity and Public Policy in
India, (July).
Macauley, R. (2016). China’s rapidly shrinking working-age population. Retrieved from
http://qz.com/599508/charted-chinas-rapidly-shrinking-working-age-population/
Maternity Benefit Amendment. (n.d.). Retrieved from
http://www.pmindia.gov.in/en/news_updates/amendments-to-the-maternity-benefit-
act-1961/
Mills, A., Amoako, K. Y., & Kato, T. (2002). The work of the commission on
macroeconomics and health. Bulletin of the World Health Organization (Vol. 80).
Mini, S. (2009). Social security of labour in the new Indian economy. Cochin University

174
of Science and Technology. Retrieved from http://hdl.handle.net/10603/70842
Ministry of Finance. (2015). Highlights of Plan 2016-2017. Retrieved from
http://indiabudget.nic.in/ub2016-17/bag/bag5.pdf
Ministry of Women and Child development. (2010). Indira Gandhi Matritva Sahyog
Yojana (IGMSY)- A Conditional Maternity Benefit Scheme (pp. 1–26). Retrieved
from http://wcd.nic.in/schemes/igmsyscheme.pdf
Mohapatra, C. K., & Nanda, H. (2015). Commerce Law Maternal Mortality and
Morbidity in India, (9), 292–293.
Mor, N., & Ananth, B. (2007). Inclusive Financial Systems,Some Design Principles and a
Case Study. Economic And Political Weekly, 1121–1126.
Moving Toward Universal Health Coverage.
Norton, A., Conway, T., Foster, M., & Expenditure, P. (2001). Working Paper 143
SOCIAL PROTECTION CONCEPTS AND APPROACHES : IMPLICATIONS FOR
POLICY AND PRACTICE IN INTERNATIONAL DEVELOPMENT Centre for Aid
and Public Expenditure February 2001 Overseas Development Institute 111
Westminster Bridge Road.
OECD Economic Surveys: Brazil 2018. (2018). OECD.
https://doi.org/10.1787/eco_surveys-bra-2018-en
Outcome Budget 2014-2015 (i) Executive Summary. (2015) (Vol. 2015). Retrieved from
http://finmin.nic.in/reports/OutcomeBudget2015_16.pdf
OVERVIEW OF BRAZILIAN SOCIAL WELFARE 2 Edition nd. (2013). Retrieved
from http://www.previdencia.gov.br/arquivos/office/3_091113-150152-707.pdf
Ozawa, M. N. (2015). Income Social Redistribution and Security, 50(2), 209–223.
Part-Iii Plan Outlay 2015-2016. (2016). Retrieved from http://indiabudget.nic.in/ub2015-
16/eb/po.pdf
PFRDA. (2015). Atal Pension Yojana ( APY ). Retrieved from
http://www.pfrda.org.in/WriteReadData/Links/Flyer 1009201502c9ba7d-7d6a-4f4b-

175
958e-1958b1ca9c0a.pdf
Pillai, S. (2011). 2011-Social-Protection-Floor-in-India.
Planning Commission. (2012). Twelfth Five Year Plan (2012–2017): Social sectors (Vol.
III).
POPULATION PROJECTIONS FOR INDIA AND STATES 2001-2026. (2006).
Pradhan mantri jeevan jyoti bima yojana. (n.d.). Retrieved from
http://www.pmjdy.gov.in/JanSuraksha/pdf/English/Pradhan Mantri Jeevan Jyoti
Bima Yojana/Final PMJJBY consent form.pdf
Pradhan Mantri Jeevan Jyoti Bima Yojana website. (n.d.). Retrieved from
http://www.pmjeevanjyotibimayojana.in/drawbacks-of-pm-jeevan-jyoti-bima-
yojana/
PressInformationBureau_AABY. (n.d.). Retrieved from
http://pib.nic.in/newsite/PrintRelease.aspx?relid=124604
Rai, R. K., & Singh, P. K. (2012). Janani Suraksha Yojana : the conditional cash transfer
scheme to reduce maternal mortality in India – a need for reassessment. WHO
South-East Asia Journal of Public Health, 1(4), 362–368. Retrieved from
http://www.searo.who.int/publications/journals/seajph/whoseajphv1n4p362.pdf
Rema Nagarajan | TNN. (n.d.). No Title. Retrieved from
http://timesofindia.indiatimes.com/pre-budget/Health-allocation-must-double-to-
keep-12th-plan-promise/articleshow/18710452.cms
Report on conditions of work and promotion of livelihoods in the unorganized sector.
(2007).
S OCIAL P ROTECTION P OLICY P APERS Paper 15 Social protection for maternity :
Key policy trends and statistics. (2015).
Sanyal, A. (2013). WORKING PAPER NO : 420 Universal Pension Scheme in India.
Ssrn Id2310453, working pa(August), 1–22.
Saul, B., Kinley, D., & Mowbray, J. (n.d.). The International Covenant on Economic,

176
Social and Cultural Rights ...
Security Administration, S. (n.d.). Snapshot of a Month: December 2017 Beneficiary
Data. Retrieved from https://www.ssa.gov/news/press/factsheets/basicfact-alt.pdf
Sharma, D. (n.d.). Social Security for Upliftment of Unorganized Sector: A Relook,
1(12), 193–200.
Social Security and Employee Benefits in Germany. (2017). Retrieved from
https://www.howtogermany.com/pages/working.html
Social Security Deptt, ILO. (n.d.). Retrieved from
http://www.ilo.org/dyn/ilossi/ssiindic.viewMultiIndic?p_lang=en&p_indicator_code
=E-1c&p_geoaid=156
Social security expenditure in Scotland and the UK Social security expenditure in the
United Kingdom, including Scotland. (2014). Retrieved from
https://assets.publishing.service.gov.uk/government/uploads/system/uploads/attachm
ent_data/file/305371/social-security-spending-in-UK-including-scotland.pdf
Social Security in Germany. (n.d.). Retrieved from
https://www.internations.org/germany-expats/guide/29458-social-security-
taxation/social-security-in-germany-15970
Social security system fast becoming unfit for purpose, says study | Politics | The
Guardian. (n.d.). Retrieved July 1, 2018, from
https://www.theguardian.com/politics/2016/aug/31/uk-social-security-system-unfit-
purpose-benefits-fabian-society-study
Social spending is falling in some countries, but in many others it remains at historically
high levels. (2014). Retrieved from http://www.oecd.org/els/soc/OECD2014-Social-
Expenditure-Update-Nov2014-8pages.pdf
Society at a Glance 2016. (2016). OECD Publishing.
https://doi.org/10.1787/9789264261488-en
Spending, O. S. (2016). Social spending. Retrieved from
https://data.oecd.org/socialexp/social-spending.htm

177
Tangcharoensathien, V., Patcharanarumol, W., Ir, P., Aljunid, S. M., Mukti, A. G.,
Akkhavong, K., … Mills, A. (2010). Health-financing reforms in southeast Asia:
Challenges in achieving universal coverage. The Lancet.
https://doi.org/10.1016/S0140-6736(10)61890-9
The Organisation for Economic Co-operation and Development (OECD). (n.d.).
Retrieved from http://www.oecd.org/India/
TRANSFORMING OUR WORLD : THE 2030 AGENDA FOR SUSTAINABLE
DEVELOPMENT. (n.d.). Retrieved from
https://sustainabledevelopment.un.org/content/documents/7891Transforming Our
World.pdf
UNFPA India. (2009). Concurrent Assessment of JSY in Select States, 1–68. Retrieved
from http://countryoffice.unfpa.org/india/drive/JSYConcurrentAssessment.pdf
van Ginneken, W. (2003). Extending Social Security: Policies for Developing Countries.
International Labour Review. https://doi.org/10.2139/ssrn.673121
World Data Bank - Old Age Dependency Ratio of India. (n.d.).
World Health Statistics 2015. (2015).
Pryor, Frederick L. 1968. Public Expenditures in Communist and Capitalist Nations
(Homewood, III.: Irwin)
Breyer F (2001) Why Funding is not a Solution to the Social Security Crisis. Discussion
Paper DIW Berlin 254, Berlin
Cigno A (1992) Children and Pensions. Journal Economics of Population 5(3):175?183
Cigno A (1995) Public Pensions with Endogenous Fertility: Comment on Nishimura and
Zhang. Journal of Public Economics 57(1): 169-173
Ehrlich and Zhong J (1998) Social Security and the Real Economy: An Inquiry into Some
Neglected Issues. American Economic Review 88(2):

178
Coughlin, Richard M., and Philip K. Armour. 1980. "Methodological Issues in the
Comparative Study of Social Security Spending: Qualitative vs. Quantitative Analysis
and the Appropriate Uses of Data, International Review of Modern Sociology
Economic research has focused on determining the best solution to the financial crisis -
Breyer (2001), Feldstein and Sam wick (2000). Rather than focusing on how to solve
the PAYG financial crisis.
“Employment and Unemployment situation in India”, NSS report 554, NSSO, Jan 2014
“Report on third annual employment and unemployment survey (2012-13)”, Labor
Bureau, Sept 2013
“Employment and Unemployment situation in India”, NSS report 551, NSSO, Sept 2006
Data on workers (tables B1 and B13) from Census 2011 and Census 2001
Annual Report to the people on Health – Ministry of Health and Family Welfare.
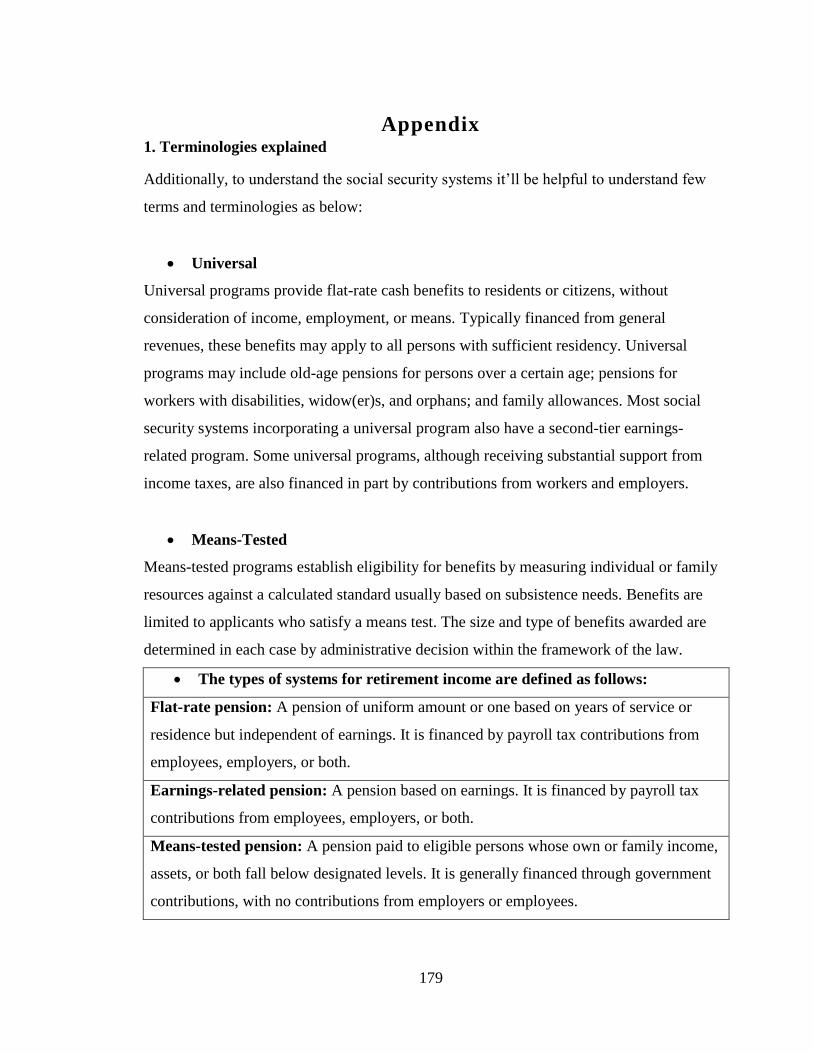
179
Appendix 1. Terminologies explained
Additionally, to understand the social security systems it’ll be helpful to understand few
terms and terminologies as below:
Universal
Universal programs provide flat-rate cash benefits to residents or citizens, without
consideration of income, employment, or means. Typically financed from general
revenues, these benefits may apply to all persons with sufficient residency. Universal
programs may include old-age pensions for persons over a certain age; pensions for
workers with disabilities, widow(er)s, and orphans; and family allowances. Most social
security systems incorporating a universal program also have a second-tier earnings-
related program. Some universal programs, although receiving substantial support from
income taxes, are also financed in part by contributions from workers and employers.
Means-Tested
Means-tested programs establish eligibility for benefits by measuring individual or family
resources against a calculated standard usually based on subsistence needs. Benefits are
limited to applicants who satisfy a means test. The size and type of benefits awarded are
determined in each case by administrative decision within the framework of the law.
The types of systems for retirement income are defined as follows:
Flat-rate pension: A pension of uniform amount or one based on years of service or
residence but independent of earnings. It is financed by payroll tax contributions from
employees, employers, or both.
Earnings-related pension: A pension based on earnings. It is financed by payroll tax
contributions from employees, employers, or both.
Means-tested pension: A pension paid to eligible persons whose own or family income,
assets, or both fall below designated levels. It is generally financed through government
contributions, with no contributions from employers or employees.

180
Flat-rate universal pension: A pension of uniform amount normally based on residence
but independent of earnings. It is generally financed through government contributions,
with no contributions from employers or employees.
Provident funds: Employee and employer contributions are set aside for each employee
in publicly managed special funds. Benefits are generally paid as a lump sum with
accrued interest.
Occupational retirement schemes: Employers are required by law to provide private
occupational retirement schemes financed by employer and, in some cases, employee
contributions. Benefits are paid as a lump sum, annuity, or pension.
Individual retirement schemes: Employees and, in some cases, employers must
contribute a certain percentage of earnings to an individual account managed by a public
or private fund manager chosen by the employee. The accumulated capital in the
individual account is used to purchase an annuity, make programmed withdrawals, or a
combination of the two and may be paid as a lump sum.
a. No country in the Americas has a provident fund.
b. The benefit increases with the length of the contribution period.
c. The government provides a guaranteed minimum pension.
d. The universal pension is increased by an income-tested supplement.
e. The earnings-related social insurance system is closed to new entrants and is
being phased out.
f. The pension formula contains a flat-rate component and an earnings-related
element
2. National Social Assistance Programme
The National Social Assistance Programme (NSAP), which came into effect from 15th
August 1995, represents a significant step towards the fulfilment of the Directive
Principles in Article 41 and 42 of the Constitution. It introduces a National Policy for
Social Assistance benefit to poor households in the case of old age, death of primary
bread-winner and maternity.
The Programme has three components, namely: -
1. National Old Age Pension Scheme (NOAPS),

181
2. National Family Benefit Scheme (NFBS),
3. National Maternity Benefit Scheme (NMBS).
These Schemes were partially modified in 1998 based on the suggestions received from
various corners and on the basis of the feedback received from the State Governments.
The NSAP provides opportunities for linking social assistance packages to the schemes
for poverty alleviation and provision of basic needs. Its major effectiveness lies in
linking maternity to maternal and child care programmes which provide inclusive
coverage for all. At the Districts, there are District Level Committees on NSAP. The
States/UTs have notified the constitution of the District level implementing authorities
under the Chairmanship of the respective District Magistrate/District Collector to
implement the Schemes under NSAP in their respective areas. The Gram
Panchayats/Municipalities are expected to play an active role in the identification of
beneficiaries under the three NSAP Schemes.
3. Atal Pension Yojana(APY)
In his Budget Speech for 2015-16, the Finance Minister has, announced a new initiative
called Atal Pension Yojana (APY). The APY will be focused on all citizens in the
unorganized sector, who join the National Pension System (NPS) administered by the
Pension Fund Regulatory and Development Authority (PFRDA) and who are not
members of any statutory social security scheme. Under the APY, the subscribers
would receive the fixed pension of 1000/2000/3000/4000/5000 per month, at the age
of 60 years, depending on their contributions, which itself would vary on the age of
joining the APY. The minimum age of joining APY is 18 years and maximum age is
40 years. Therefore, minimum period of contribution by the subscriber under APY
would be 20 years or more. The benefit of fixed pension would be guaranteed by the
Government. The Central Government would also co-contribute 50% of the
subscriber’s contribution or 1000 per annum, whichever is lower, to each eligible
subscriber account, for a period of 5 years, i.e., from 2015-16 to 2019-20, who join
the NPS before 31st December, 2015 and who are not income tax payers. The existing
subscribers of Swavalamban Scheme would be automatically migrated to APY, unless
they opt out.

182
Table of contribution levels, fixed monthly pension of 1,000 per month to subscribers
and his spouse and return of corpus to nominees of subscribers and the contribution
period under Atal Pension Yojana has been presented below.
Details of APY for monthly pension of Rs1000/-
Age of
Joining
Years of
Contribution
Indicative
Monthly
Contribution
Monthly
Pension to the
subscribers and
his spouse
Indicative
Return of
Corpus to the
nominee of the
subscribers (in
₹ ) (in ₹) (in ₹)
18 42 42 1,000 1.7 Lakh
20 40 50 1,000 1.7 Lakh
25 35 76 1,000 1.7 Lakh
30 30 116 1,000 1.7 Lakh
35 25 181 1,000 1.7 Lakh
40 20 291 1,000 1.7 Lakh Source:(PFRDA, 2015)
4. Pradhan Mantri Jeevan Jyoti Bima Yojana(PMJJBY) Premium Expenses(based
on Census 2011)
Age Population PMJJBY Premium Expenses
in ₹
PMJJBY Claim Expenses in
₹
18 27958147 8079904483 4220097660
19 20859088 6028276432 3337454080
20 28882735 8347110415 4839220506
21 19978972 5773922908 3464278352
22 23528225 6799657025 4186248335
23 19154055 5535521895 3473027708
24 19880235 5745387915 3653462055
25 27768078 8024974542 5155431840
26 20076997 5802252133 3765383966
27 16709350 4829002150 3165318377
28 22127016 6394707624 4245882127
29 14732524 4257699436 2874232041
30 30399029 8785319381 6056863137
31 13823245 3994917805 2827244826
32 17613544 5090314216 3718784101
33 12764541 3688952349 2803382212
34 13994592 4044437088 3216115671
35 28422631 8214140359 6875059046
36 15827717 4574210213 4055479186

183
37 11692231 3379054759 3192199671
38 17471758 5049338062 5106368517
39 11726347 3388914283 3688268009
40 28528992 8244878688 9705240109
41 11567894 3343121366 4275755537
42 13380642 3867005538 5402749789
43 9334352 2697627728 4138816453
44 9626232 2781981048 4709588599
45 23872961 6899285729 12945450927
46 10992678 3176883942 6630866333
47 7951297 2297924833 5351372905
48 11649592 3366732088 8754778290
49 7851799 2269169911 6583659388
50 21462422 6202639958 20028894191
51 7885966 2279044174 8158255015
52 7735164 2235462396 8831222144
53 5590790 1615738310 7007475089
54 6394912 1848129568 8754996504
55 15607546 4510580794 23228740160
56 7071837 2043760893 11399000659
57 4599026 1329118514 8004908462
58 6718934 1941771926 12606241452
59 5148712 1487977768 10403312605
5. PMJJBY Expenses, Age wise
Age Total Population as per Census 2011 PMJJBY Expenses in ₹
18 2377052 686968028
19 2055973 594176197
20 2592525 749239725
21 2118952 612377128
22 2330053 673385317
23 1996850 577089650
24 2052586 593197354
25 2588930 748200770
26 2062553 596077817
27 1826531 527867459
28 2067222 597427158
29 1601877 462942453
30 2757064 796791496
31 1548794 447601466
32 1714660 495536740
33 1287968 372222752

184
Age Total Population as per Census 2011 PMJJBY Expenses in ₹
34 1487821 429980269
35 2591092 748825588
36 1585038 458075982
37 1211057 349995473
38 1632934 471917926
39 1227039 354614271
40 2560132 739878148
41 1280248 369991672
42 1368558 395513262
43 974530 281639170
44 1012621 292647469
45 2175250 628647250
46 1126118 325448102
47 865431 250109559
48 1047648 302770272
49 818007 236404023
50 1927821 557140269
Total 16724700215
6. Expenditure of GOI on various social security schemes in India.
Schemes Expenditure by Government of India (₹ Crore)
Rashtriya Swasthya Bima Yojana 929(2012)
Aam Aadmi Bima Yojana 175(2014-15) Source:(Outcome Budget 2014-2015 (i) Executive Summary, 2015),(Dror & Vellakkal, 2012)
7. Mortality Table
Age qₓ(Mortalit
y rate)
Ag
e
qₓ(Mortalit
y rate)
Ag
e
qₓ(Mortalit
y rate)
Ag
e
qₓ(Mortalit
y rate)
0 0.00445 26 0.00099 52 0.00605 78 0.05115
1 0.0039 27 0.001 53 0.00664 79 0.05566
2 0.00294 28 0.00102 54 0.00726 80 0.06056
3 0.00221 29 0.00103 55 0.00789 81 0.06587
4 0.00167 30 0.00106 56 0.00854 82 0.07163
5 0.00127 31 0.00108 57 0.00923 83 0.07788
6 0.00096 32 0.00112 58 0.00994 84 0.08465
7 0.00074 33 0.00116 59 0.01071 85 0.09198
8 0.00059 34 0.00122 60 0.01153 86 0.09993
9 0.00049 35 0.00128 61 0.01243 87 0.10854
10 0.00044 36 0.00136 62 0.01341 88 0.11787
11 0.00043 37 0.00145 63 0.0145 89 0.12796
12 0.00045 38 0.00155 64 0.01569 90 0.1389

185
Age qₓ(Mortalit
y rate)
Ag
e
qₓ(Mortalit
y rate)
Ag
e
qₓ(Mortalit
y rate)
Ag
e
qₓ(Mortalit
y rate)
13 0.00049 39 0.00167 65 0.01701 91 0.15073
14 0.00055 40 0.0018 66 0.01846 92 0.16353
15 0.00061 41 0.00196 67 0.02006 93 0.17739
16 0.00068 42 0.00214 68 0.02182 94 0.19237
17 0.00074 43 0.00235 69 0.02375 95 0.20859
18 0.0008 44 0.00259 70 0.02586 96 0.22611
19 0.00085 45 0.00287 71 0.02816 97 0.24507
20 0.00089 46 0.0032 72 0.03067 98 0.26556
21 0.00092 47 0.00357 73 0.03341 99 0.2877
22 0.00094 48 0.00398 74 0.03639 100 0.31163
23 0.00096 49 0.00444 75 0.03964
24 0.00097 50 0.00495 76 0.04316
25 0.00098 51 0.00548 77 0.04699 Source: Indian Assured Lives Mortality (2006-08) Published with the concurrence of IRDA vide it’s letter dated 20th
February 2013
7. Sources of the fund on health care expenditure.
Source : (Hooda, 2013)

186
8. Coverage of the different social security schemes in India

187
10. India’s overall and state wise statistics of the Institutional Deliveries

188
11. Schemes started by Government of India
The table below highlights some of the policies initiated by government of India in the
last two decades. These are categorized based on the ministries they are started by.
Schemes Started by Central Government
Implemented by Ministry Name of the Scheme Year
Ministry of agriculture National Agriculture Insurance
scheme 1999-00
Weather Based Crop Insurance 2007-08
Livestock Insurance 2005-06
Group Accident Insurance for Active
Fisherman
Ministry of Textile Handloom weavers comprehensive
Welfare scheme 2007-08
1. Mahatma Gandhi Bunkar Yojana 2005-06
2. Health Insurance Scheme 2005-06
Handicraft artisans comprehensive
Welfare scheme 2007-08
1.Bima Yojana for Handicraft
Artisans 2003-04
2.Rajiv Gandhi Shilpi Swasytha
Yojana 2006-07
Wool Sector
1.Sheep breeders insurance scheme 2007-08
2.Sheep Insurance 2007-08
Powerloom
1.Group Insurance scheme for
Powerloom workers 2003-04
Ministry of micro, small and
Medium Enterprises
Khadi Karigar Janshree Bima
Yojana 2003-04
Coir Workers Group Personal
Accident Insurance Scheme 2005-06
Ministry of Women and Child
Development Anganwadi Karyakarti Bima Yojana 2004-05
Ministry of Health and Family
Welfare
Family Welfare linked health
Insurance Plan 2005-06
Ministry of Labor and
Employment
Rashtriya Swasthya Bima
Yojana(RSBY) 2007-08
Ministry Of Finance Aam Admi Bima Yojana(AABY) 2007-08
Universal Health Insurance
Scheme(UHIS) 2003-04
Janshree Bima Yojana(JBY) 2000-01
Source: Compiled by the researcher.
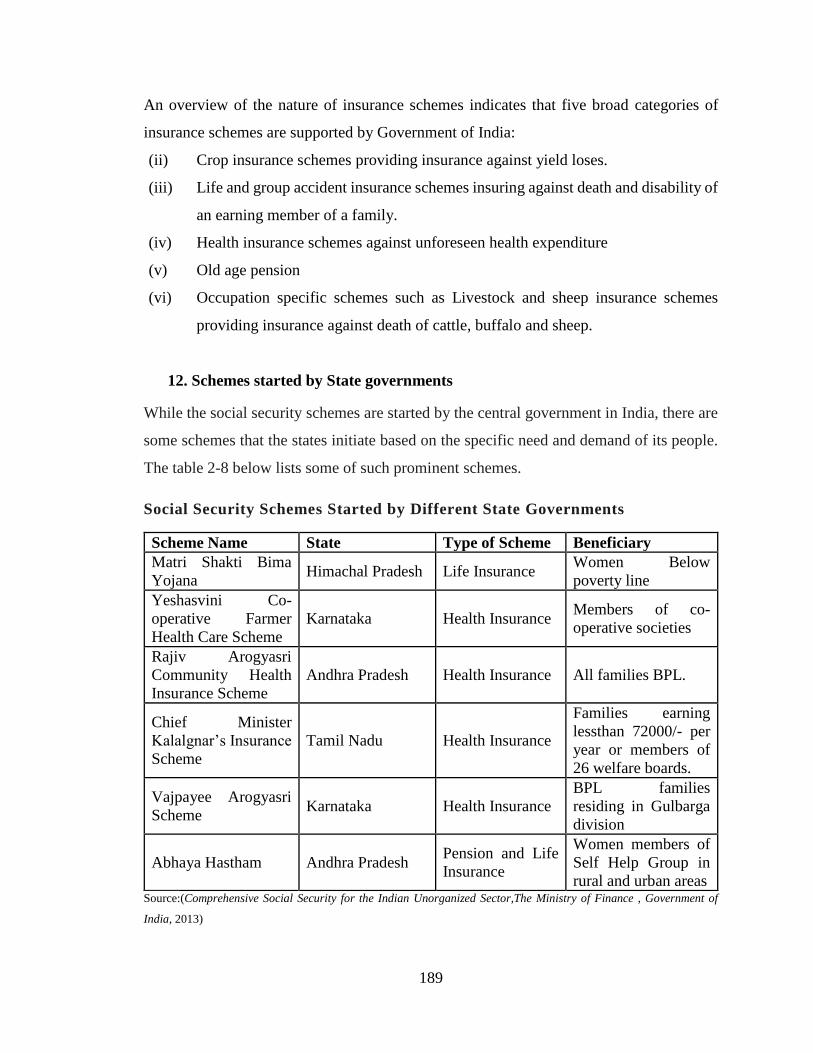
189
An overview of the nature of insurance schemes indicates that five broad categories of
insurance schemes are supported by Government of India:
(ii) Crop insurance schemes providing insurance against yield loses.
(iii) Life and group accident insurance schemes insuring against death and disability of
an earning member of a family.
(iv) Health insurance schemes against unforeseen health expenditure
(v) Old age pension
(vi) Occupation specific schemes such as Livestock and sheep insurance schemes
providing insurance against death of cattle, buffalo and sheep.
12. Schemes started by State governments
While the social security schemes are started by the central government in India, there are
some schemes that the states initiate based on the specific need and demand of its people.
The table 2-8 below lists some of such prominent schemes.
Social Security Schemes Started by Different State Governments
Scheme Name State Type of Scheme Beneficiary
Matri Shakti Bima
Yojana Himachal Pradesh Life Insurance
Women Below
poverty line
Yeshasvini Co-
operative Farmer
Health Care Scheme
Karnataka Health Insurance Members of co-
operative societies
Rajiv Arogyasri
Community Health
Insurance Scheme
Andhra Pradesh Health Insurance All families BPL.
Chief Minister
Kalalgnar’s Insurance
Scheme
Tamil Nadu Health Insurance
Families earning
lessthan 72000/- per
year or members of
26 welfare boards.
Vajpayee Arogyasri
Scheme Karnataka Health Insurance
BPL families
residing in Gulbarga
division
Abhaya Hastham Andhra Pradesh Pension and Life
Insurance
Women members of
Self Help Group in
rural and urban areas Source:(Comprehensive Social Security for the Indian Unorganized Sector,The Ministry of Finance , Government of
India, 2013)

190
NUMBER OF SUBSCRIBERS REGISTERED UNDER NPS (AS ON 31ST
AUGUST, 2016)
FY 2016-17 up to
31/Aug/2016
(cumulative)
No. of
Subscribers
Total
Contribution
M&B ( Crs)* AUM ( Crs)
Central Government 1,723,203 40,477.18 56,760.58
State Government 3,110,200 56,306.77 71,329.08
Corporate Sector 514,411 9,841.19 11,752.91
Unorganized Sector 254,677 1,586.73 1,763.87
NPS Swavalamban 4,459,049 2,022.71 2,508.71
Total 10,061,540 110,234.58 144,115.15 Source:(Assets Under Management and Number of Subscribers - NPS, 2016)
Related Documents
![111,:::::f n::::::::::::::.::;::]:;;:i](https://static.cupdf.com/doc/110x72/6169c7aa11a7b741a34b4660/111f-ni.jpg)