1 DesignCon 2005 Eye Patterns in Scopes Peter J. Pupalaikis, LeCroy Corporation [email protected] Eric Yudin, LeCroy Corporation [email protected]

Welcome message from author
This document is posted to help you gain knowledge. Please leave a comment to let me know what you think about it! Share it to your friends and learn new things together.
Transcript
1
DesignCon 2005
Eye Patterns in Scopes Peter J. Pupalaikis, LeCroy Corporation [email protected]
Eric Yudin, LeCroy Corporation [email protected]
2
Abstract There is much industry confusion regarding how eye patterns look when measured by scopes. This confusion is related to the characteristics of serial data and the characteristics of scopes. This paper and an accompanying software tool called IRIS is presented to provide education on the interaction of serial data and scope characteristics in measurements. The paper looks at how each individual scope characteristic interacts with the serial data characteristic in both frequency domain and time domain, specifically attempting to provide insight into how one characteristic affects the eye pattern. Additionally, we try to build up rules-of-thumb that an engineer can safely employ to better utilize his measurement system. Serial data and scope characteristics interact collectively to provide often puzzling results. Therefore, we also provide a software tool that allows for simulation of the effects described with various serial data signals. This simulation shows excellent correlation with empirical measurements made on various scopes. Authors Biographies Pete Pupalaikis is Principal Technologist at LeCroy working on new technology development. Previously he was Product Marketing Manager for high-end scopes. He has six patents in the design of measurement instruments. He holds a BSEE from Rutgers University and is a member of Tau Beta Pi, Eta Kappa Nu and the IEEE Signal Processing and Communications Societies. Eric Yudin is a Development Engineer working in the signal integrity group at LeCroy. He has been instrumental in the digital compensation of probes and is the principal author of the IRIS simulator. He holds a BS in Computer Engineering from Columbia University.
1
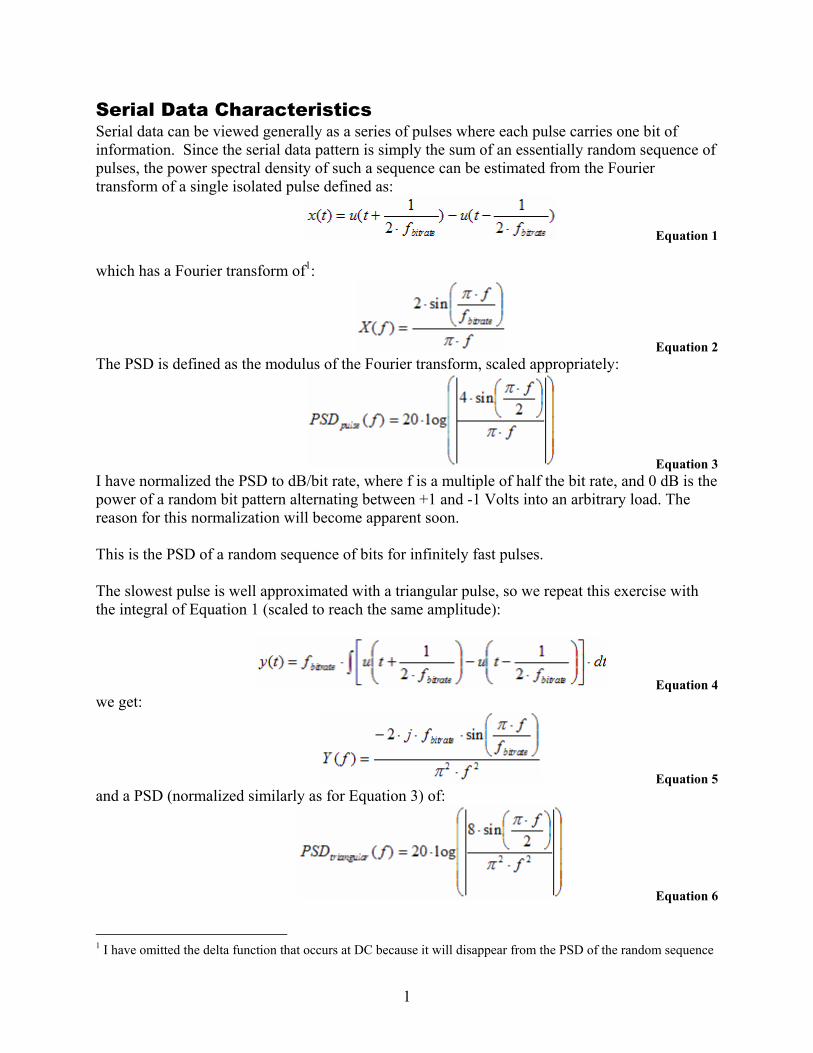
Serial Data Characteristics Serial data can be viewed generally as a series of pulses where each pulse carries one bit of information. Since the serial data pattern is simply the sum of an essentially random sequence of pulses, the power spectral density of such a sequence can be estimated from the Fourier transform of a single isolated pulse defined as:
Equation 1
which has a Fourier transform of1:
Equation 2 The PSD is defined as the modulus of the Fourier transform, scaled appropriately:
Equation 3 I have normalized the PSD to dB/bit rate, where f is a multiple of half the bit rate, and 0 dB is the power of a random bit pattern alternating between +1 and -1 Volts into an arbitrary load. The reason for this normalization will become apparent soon. This is the PSD of a random sequence of bits for infinitely fast pulses. The slowest pulse is well approximated with a triangular pulse, so we repeat this exercise with the integral of Equation 1 (scaled to reach the same amplitude):
Equation 4 we get:
Equation 5 and a PSD (normalized similarly as for Equation 3) of:
Equation 6
1 I have omitted the delta function that occurs at DC because it will disappear from the PSD of the random sequence
2
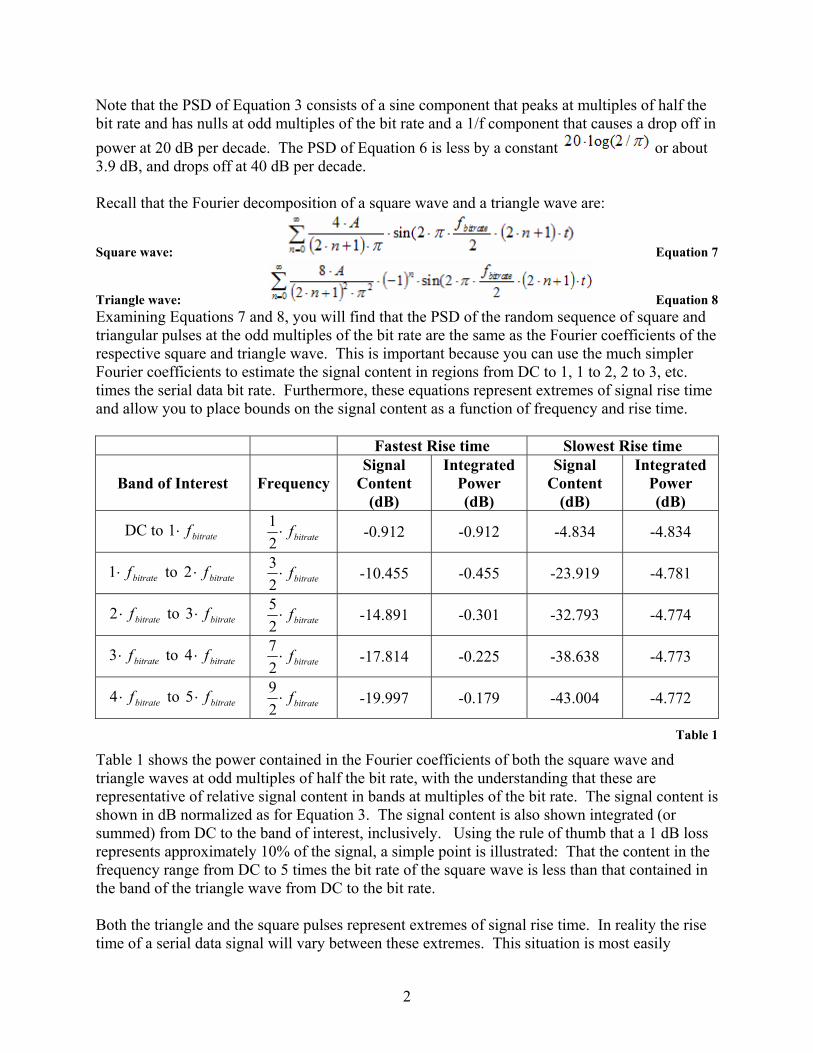
Note that the PSD of Equation 3 consists of a sine component that peaks at multiples of half the bit rate and has nulls at odd multiples of the bit rate and a 1/f component that causes a drop off in power at 20 dB per decade. The PSD of Equation 6 is less by a constant or about 3.9 dB, and drops off at 40 dB per decade. Recall that the Fourier decomposition of a square wave and a triangle wave are:
Square wave: Equation 7
Triangle wave: Equation 8 Examining Equations 7 and 8, you will find that the PSD of the random sequence of square and triangular pulses at the odd multiples of the bit rate are the same as the Fourier coefficients of the respective square and triangle wave. This is important because you can use the much simpler Fourier coefficients to estimate the signal content in regions from DC to 1, 1 to 2, 2 to 3, etc. times the serial data bit rate. Furthermore, these equations represent extremes of signal rise time and allow you to place bounds on the signal content as a function of frequency and rise time.
Fastest Rise time Slowest Rise time
Band of Interest FrequencySignal
Content (dB)
Integrated Power (dB)
Signal Content
(dB)
Integrated Power (dB)
DC to bitratef⋅1 bitratef⋅21 -0.912 -0.912 -4.834 -4.834
bitratef⋅1 to bitratef⋅2 bitratef⋅23 -10.455 -0.455 -23.919 -4.781
bitratef⋅2 to bitratef⋅3 bitratef⋅25 -14.891 -0.301 -32.793 -4.774
bitratef⋅3 to bitratef⋅4 bitratef⋅27 -17.814 -0.225 -38.638 -4.773
bitratef⋅4 to bitratef⋅5 bitratef⋅29 -19.997 -0.179 -43.004 -4.772
Table 1
Table 1 shows the power contained in the Fourier coefficients of both the square wave and triangle waves at odd multiples of half the bit rate, with the understanding that these are representative of relative signal content in bands at multiples of the bit rate. The signal content is shown in dB normalized as for Equation 3. The signal content is also shown integrated (or summed) from DC to the band of interest, inclusively. Using the rule of thumb that a 1 dB loss represents approximately 10% of the signal, a simple point is illustrated: That the content in the frequency range from DC to 5 times the bit rate of the square wave is less than that contained in the band of the triangle wave from DC to the bit rate. Both the triangle and the square pulses represent extremes of signal rise time. In reality the rise time of a serial data signal will vary between these extremes. This situation is most easily
3
described by thinking as if the serial data passes through a channel with limited bandwidth. This channel limits the rise time. We can view this channel simply as a system with a step response
specified as: where τ is the time constant of the system and is defined as:
Equation 9 The Fourier transform of this system, which we will call the channel (not to be confused with the scope channel, but rather the channel through which the serial data is transmitted) is:
Equation 10 This means that the channel is a simple low-pass filter. The channel has a bandwidth of:
Equation 11 which leads to the popular equation
Equation 12 The channel can be viewed as multiplying the PSD of Equation 3 by:
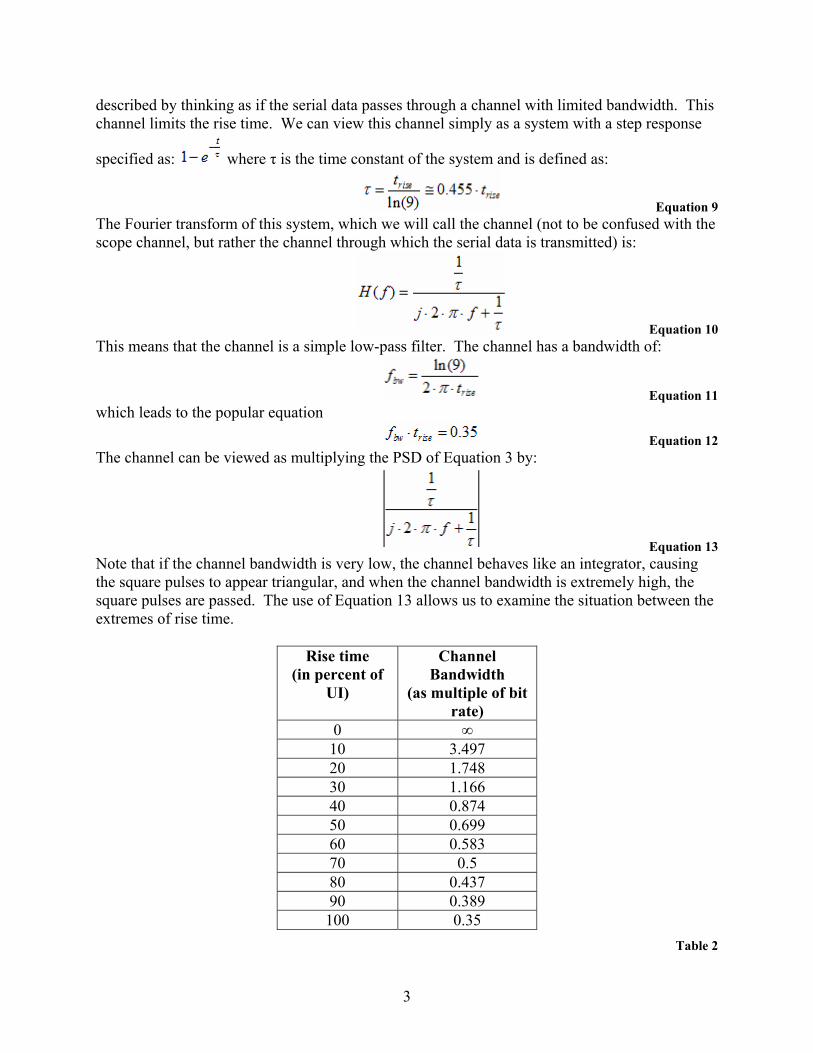
Equation 13 Note that if the channel bandwidth is very low, the channel behaves like an integrator, causing the square pulses to appear triangular, and when the channel bandwidth is extremely high, the square pulses are passed. The use of Equation 13 allows us to examine the situation between the extremes of rise time.
Rise time (in percent of
UI)
Channel Bandwidth
(as multiple of bit rate)
0 ∞ 10 3.497 20 1.748 30 1.166 40 0.874 50 0.699 60 0.583 70 0.5 80 0.437 90 0.389 100 0.35
Table 2
4
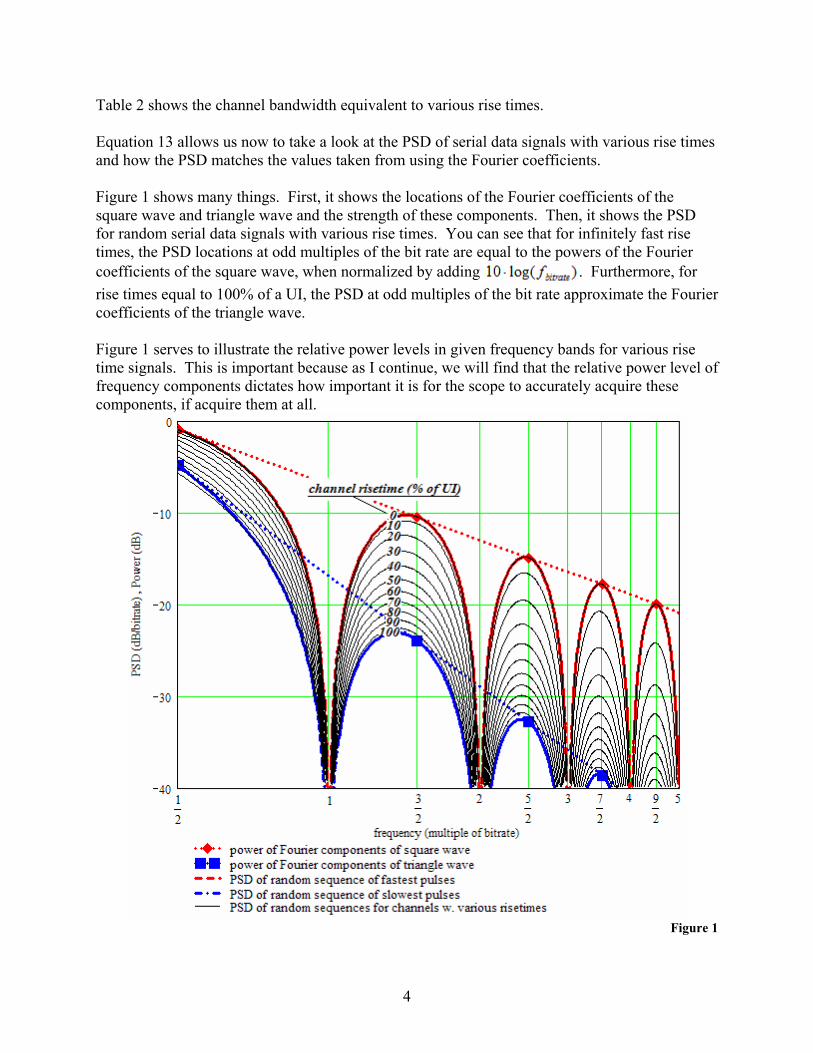
Table 2 shows the channel bandwidth equivalent to various rise times. Equation 13 allows us now to take a look at the PSD of serial data signals with various rise times and how the PSD matches the values taken from using the Fourier coefficients. Figure 1 shows many things. First, it shows the locations of the Fourier coefficients of the square wave and triangle wave and the strength of these components. Then, it shows the PSD for random serial data signals with various rise times. You can see that for infinitely fast rise times, the PSD locations at odd multiples of the bit rate are equal to the powers of the Fourier coefficients of the square wave, when normalized by adding . Furthermore, for rise times equal to 100% of a UI, the PSD at odd multiples of the bit rate approximate the Fourier coefficients of the triangle wave. Figure 1 serves to illustrate the relative power levels in given frequency bands for various rise time signals. This is important because as I continue, we will find that the relative power level of frequency components dictates how important it is for the scope to accurately acquire these components, if acquire them at all.
Figure 1
5
Summary • Serial data signals consist of trains of bits. It is sufficient to examine isolated bits to
understand the serial data characteristics in the frequency domain. • The Fourier coefficients of the square wave and triangle wave place bounds on the
relative signal content in serial data waveforms. • The two key characteristics of a serial data signal are the bit rate, which is the reciprocal
of the unit interval, and the rise time of the edges. • The bit rate determines the frequency locations of peaks (at odd multiples of half the bit
rate) and nulls (at multiples of the bit rate) in the magnitude response. • The rise time determines the magnitude of the peaks in the magnitude response. • The magnitude at 1.5 times the bit rate will be between 9.5 and 18 dB below the
magnitude at 0.5 times the bit rate, depending on the rise time. • The magnitude at 2.5 times the bit rate will be between 14 and 28 dB below the
magnitude at 0.5 times the bit rate, depending on the rise time.
6
Scope Bandwidth We know the effects of limited scope bandwidth on the acquired serial data signal:
• It will slow down the edges in the waveform • It will attenuate frequency content in the signal • It will distort the phase characteristics of the signal
All of these effects go hand in hand. The first effect can be viewed as the time domain side-effect of the latter two frequency-domain effects. The slowdown of the edge is generally calculated by assuming that the scope rise time and the serial data signal rise time adds in quadrature. This is a reasonable assumption:
Equation 14 In addition, generally the assumption is made that the scope has the following relationship of bandwidth and rise time:
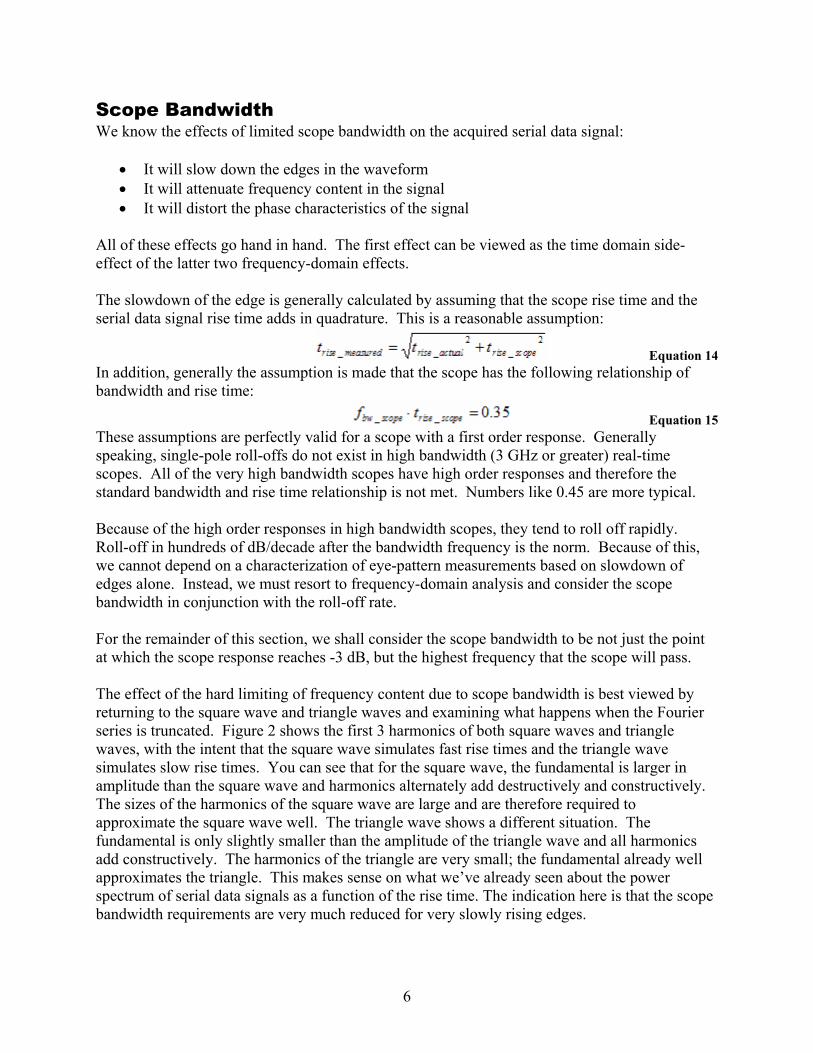
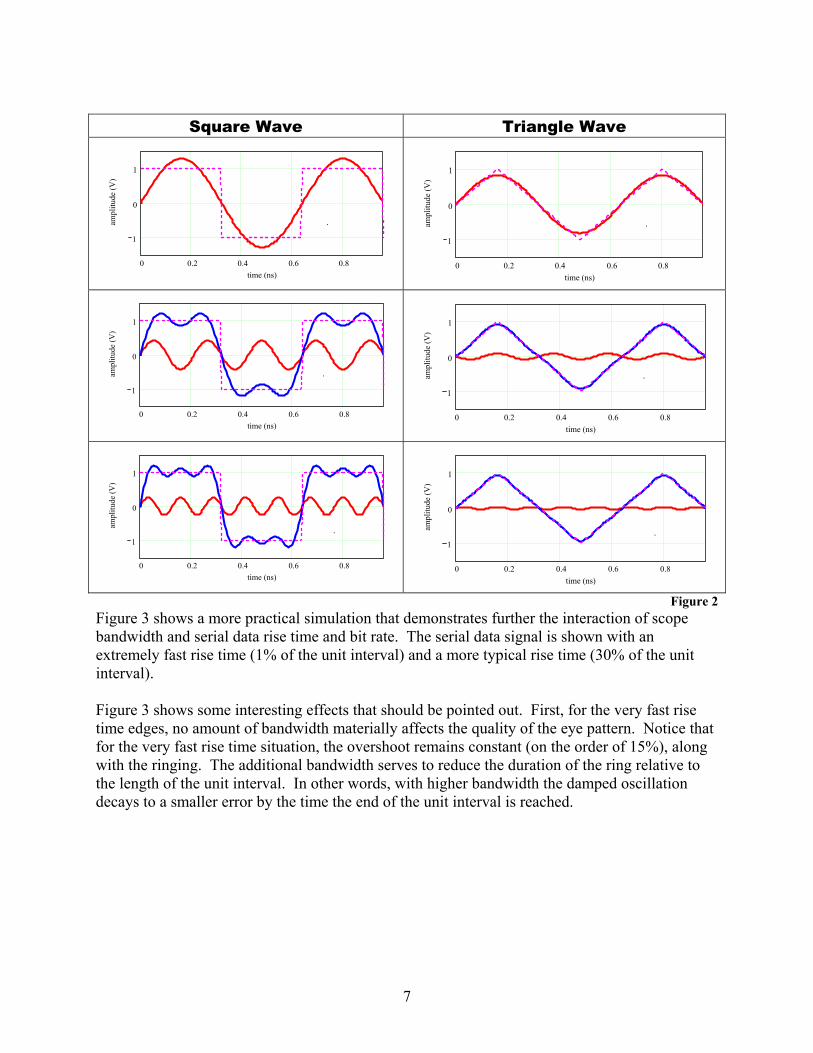
Equation 15 These assumptions are perfectly valid for a scope with a first order response. Generally speaking, single-pole roll-offs do not exist in high bandwidth (3 GHz or greater) real-time scopes. All of the very high bandwidth scopes have high order responses and therefore the standard bandwidth and rise time relationship is not met. Numbers like 0.45 are more typical. Because of the high order responses in high bandwidth scopes, they tend to roll off rapidly. Roll-off in hundreds of dB/decade after the bandwidth frequency is the norm. Because of this, we cannot depend on a characterization of eye-pattern measurements based on slowdown of edges alone. Instead, we must resort to frequency-domain analysis and consider the scope bandwidth in conjunction with the roll-off rate. For the remainder of this section, we shall consider the scope bandwidth to be not just the point at which the scope response reaches -3 dB, but the highest frequency that the scope will pass. The effect of the hard limiting of frequency content due to scope bandwidth is best viewed by returning to the square wave and triangle waves and examining what happens when the Fourier series is truncated. Figure 2 shows the first 3 harmonics of both square waves and triangle waves, with the intent that the square wave simulates fast rise times and the triangle wave simulates slow rise times. You can see that for the square wave, the fundamental is larger in amplitude than the square wave and harmonics alternately add destructively and constructively. The sizes of the harmonics of the square wave are large and are therefore required to approximate the square wave well. The triangle wave shows a different situation. The fundamental is only slightly smaller than the amplitude of the triangle wave and all harmonics add constructively. The harmonics of the triangle are very small; the fundamental already well approximates the triangle. This makes sense on what we’ve already seen about the power spectrum of serial data signals as a function of the rise time. The indication here is that the scope bandwidth requirements are very much reduced for very slowly rising edges.
7
Square Wave Triangle Wave
0 0.2 0.4 0.6 0.8
1
0
1
time (ns)
ampl
itude
(V)
.
0 0.2 0.4 0.6 0.8
1
0
1
time (ns)
ampl
itude
(V)
.
0 0.2 0.4 0.6 0.8
1
0
1
time (ns)
ampl
itude
(V)
.
0 0.2 0.4 0.6 0.8
1
0
1
time (ns)am
plitu
de (V
)
.
0 0.2 0.4 0.6 0.8
1
0
1
time (ns)
ampl
itude
(V)
.
0 0.2 0.4 0.6 0.8
1
0
1
time (ns)
ampl
itude
(V)
.
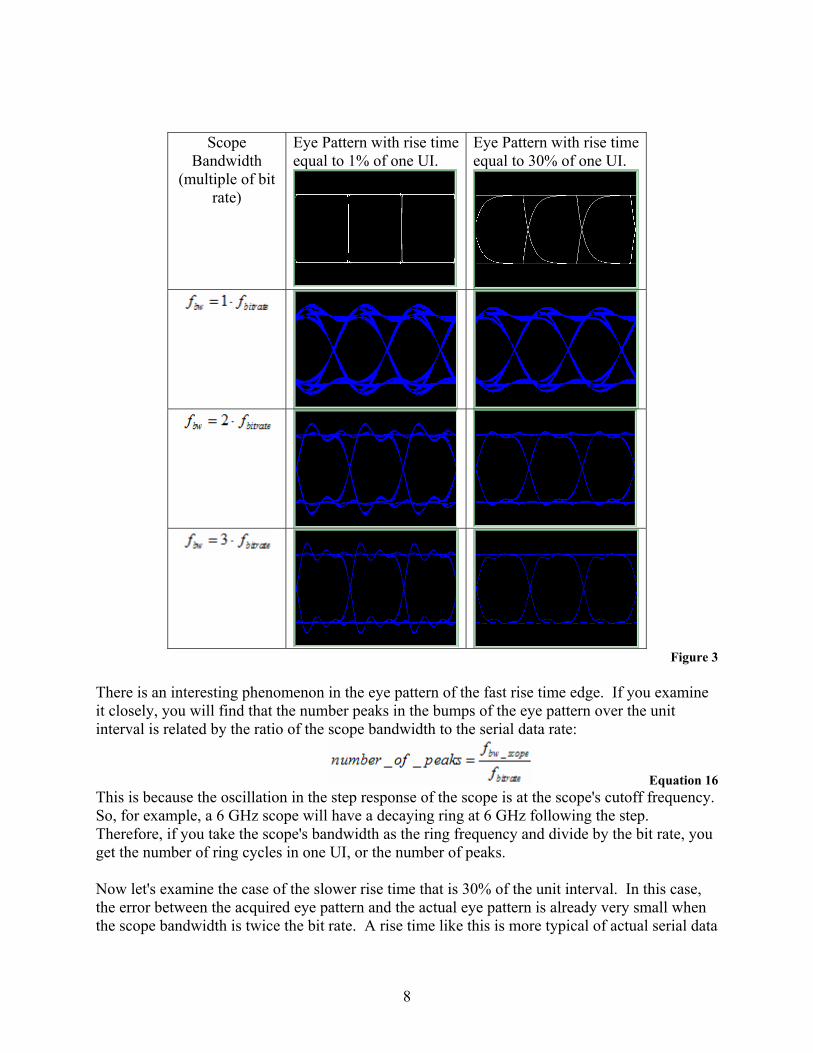
Figure 2 Figure 3 shows a more practical simulation that demonstrates further the interaction of scope bandwidth and serial data rise time and bit rate. The serial data signal is shown with an extremely fast rise time (1% of the unit interval) and a more typical rise time (30% of the unit interval). Figure 3 shows some interesting effects that should be pointed out. First, for the very fast rise time edges, no amount of bandwidth materially affects the quality of the eye pattern. Notice that for the very fast rise time situation, the overshoot remains constant (on the order of 15%), along with the ringing. The additional bandwidth serves to reduce the duration of the ring relative to the length of the unit interval. In other words, with higher bandwidth the damped oscillation decays to a smaller error by the time the end of the unit interval is reached.
8
Scope Bandwidth
(multiple of bit rate)
Eye Pattern with rise time equal to 1% of one UI.
Eye Pattern with rise time equal to 30% of one UI.
Figure 3
There is an interesting phenomenon in the eye pattern of the fast rise time edge. If you examine it closely, you will find that the number peaks in the bumps of the eye pattern over the unit interval is related by the ratio of the scope bandwidth to the serial data rate:
Equation 16 This is because the oscillation in the step response of the scope is at the scope's cutoff frequency. So, for example, a 6 GHz scope will have a decaying ring at 6 GHz following the step. Therefore, if you take the scope's bandwidth as the ring frequency and divide by the bit rate, you get the number of ring cycles in one UI, or the number of peaks. Now let's examine the case of the slower rise time that is 30% of the unit interval. In this case, the error between the acquired eye pattern and the actual eye pattern is already very small when the scope bandwidth is twice the bit rate. A rise time like this is more typical of actual serial data

9
applications and therefore a commonly used rule-of-thumb that relates the scope bandwidth requirements to the serial data rate is:
Equation 17 with the understanding that, while the high bandwidth scope roll-off is sharp, it does not typically begin immediately at the pass band edge of the scope. Examining Figure 1 from the previous section, this means that the minimum scope requirement is to be able to capture the first two lobes in the power spectrum. Figure 4 shows the data from Figure 1 integrated over frequency for various rise times. Here you can see clearly that the acquisition of signal content up to twice the bit rate is sufficient to acquire the vast majority of the signal when the rise time of the serial data signal is reasonable.
Figure 4
The key takeaway here is that is that the bandwidth requirements of the scope depend not only on the bit rate, but on the rise time of the edges in the serial data signal. Summary
• Scopes with very slow roll-off have a relationship where the bandwidth multiplied by the rise time equals 0.35.
10
• If the scope magnitude response has a very slow roll-off, the only effect of the scope is to increase the rise time of the edges in the serial data signal, with the rise time of the scope and the rise time of the signal adding in quadrature to form the rise time of the serial data signal acquired.
• If the scope magnitude response has a very fast roll-off, the effect of the scope is to truncate the response of the serial data signal.
• Truncation of the response causes overshoot and ringing. • The truncation of the response creates higher distortion when the rise times of the edges
in the serial data signal are very fast. • The number of peaks in the eye pattern is the scope bandwidth divided by the bit rate. • The rule of thumb for required scope bandwidth is 2 (or 1.8) times the bit rate. • Higher scope bandwidth leads to less distortion in the eye when the rise time of the serial
data edges is very fast.
11
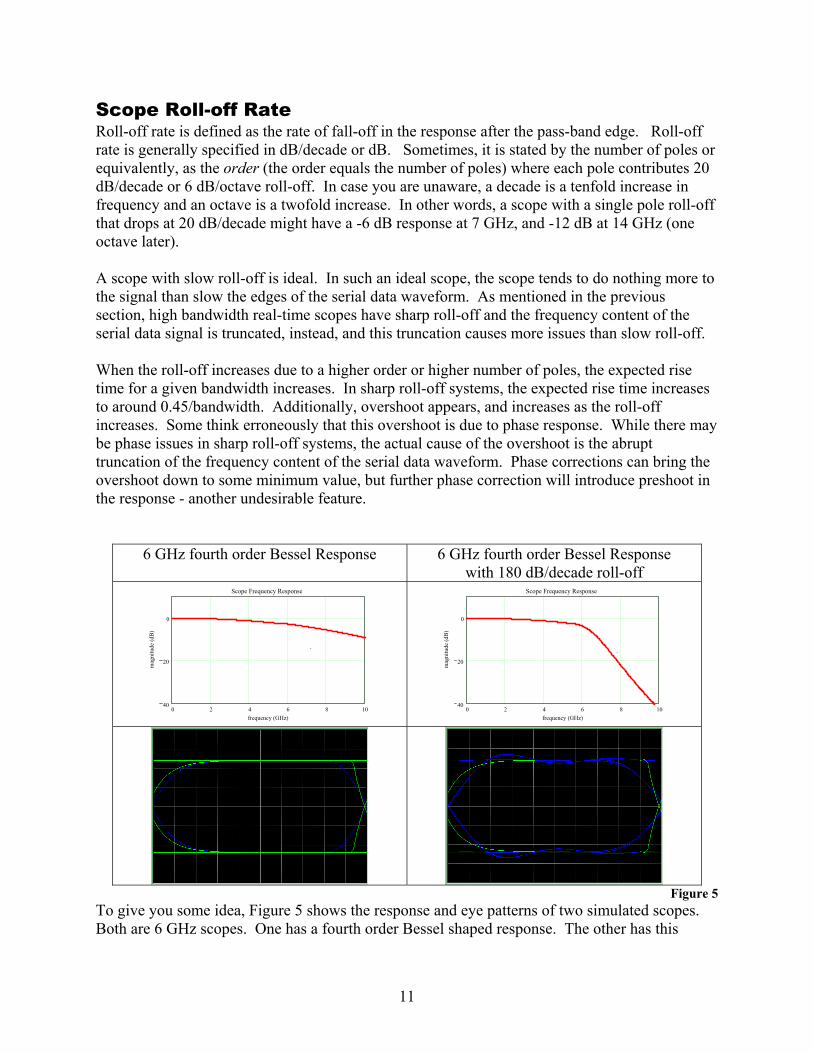
Scope Roll-off Rate Roll-off rate is defined as the rate of fall-off in the response after the pass-band edge. Roll-off rate is generally specified in dB/decade or dB. Sometimes, it is stated by the number of poles or equivalently, as the order (the order equals the number of poles) where each pole contributes 20 dB/decade or 6 dB/octave roll-off. In case you are unaware, a decade is a tenfold increase in frequency and an octave is a twofold increase. In other words, a scope with a single pole roll-off that drops at 20 dB/decade might have a -6 dB response at 7 GHz, and -12 dB at 14 GHz (one octave later). A scope with slow roll-off is ideal. In such an ideal scope, the scope tends to do nothing more to the signal than slow the edges of the serial data waveform. As mentioned in the previous section, high bandwidth real-time scopes have sharp roll-off and the frequency content of the serial data signal is truncated, instead, and this truncation causes more issues than slow roll-off. When the roll-off increases due to a higher order or higher number of poles, the expected rise time for a given bandwidth increases. In sharp roll-off systems, the expected rise time increases to around 0.45/bandwidth. Additionally, overshoot appears, and increases as the roll-off increases. Some think erroneously that this overshoot is due to phase response. While there may be phase issues in sharp roll-off systems, the actual cause of the overshoot is the abrupt truncation of the frequency content of the serial data waveform. Phase corrections can bring the overshoot down to some minimum value, but further phase correction will introduce preshoot in the response - another undesirable feature.
6 GHz fourth order Bessel Response 6 GHz fourth order Bessel Response with 180 dB/decade roll-off
0 2 4 6 8 1040
20
0
Scope Frequency Response
frequency (GHz)
mag
nitu
de (d
B)
.
0 2 4 6 8 10
40
20
0
Scope Frequency Response
frequency (GHz)
mag
nitu
de (d
B)
.
Figure 5
To give you some idea, Figure 5 shows the response and eye patterns of two simulated scopes. Both are 6 GHz scopes. One has a fourth order Bessel shaped response. The other has this
12
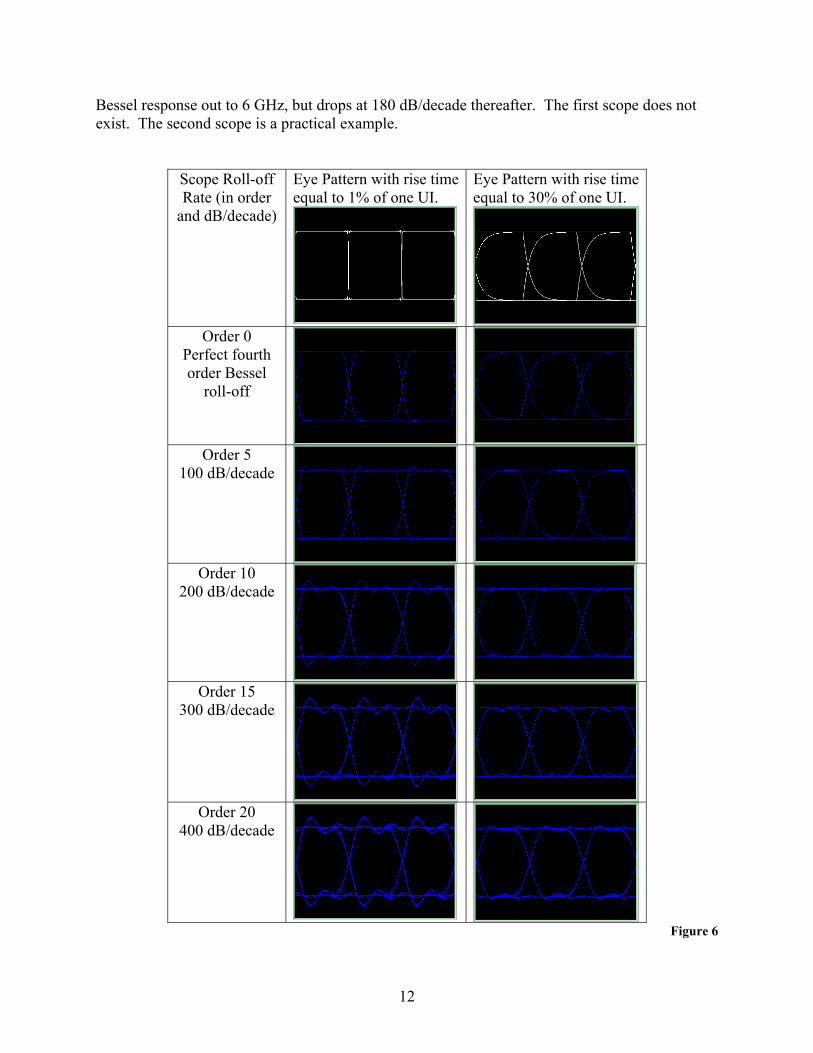
Bessel response out to 6 GHz, but drops at 180 dB/decade thereafter. The first scope does not exist. The second scope is a practical example.
Scope Roll-off Rate (in order
and dB/decade)
Eye Pattern with rise time equal to 1% of one UI.
Eye Pattern with rise time equal to 30% of one UI.
Order 0
Perfect fourth order Bessel
roll-off
Order 5
100 dB/decade
Order 10
200 dB/decade
Order 15
300 dB/decade
Order 20
400 dB/decade
Figure 6
13
Figure 6 shows how a serial data signal looks like when acquired on a scope with bandwidth equal to twice the bit rate, but with various roll-off rates. The serial data signal is shown with an extremely fast rise time (1% of the unit interval) and a more typical rise time (30% of the unit interval). Note that the roll-off is specified in addition to an ideal Bessel roll-off. Figure 6 shows the interaction of scope roll-off and serial data rise time. You can see that when there is no additional roll-off to the ideal Bessel response, the only effect of the scope is to increase the rise time. Since the rise time adds in quadrature, this means that the slowing of the rise time is much less when the scope is measuring serial data signals with slower rise times. When the rise time is 30% of the unit interval, this increase in rise time is only about 10% of the UI. In the case of the very fast rise time, the rise time of the acquired signal is the rise time of the scope itself. With additional roll-off, overshoot and ring is present that worsens as the roll-off rate increases for very fast rise times. In the case where the rise time of the signal is slower, the effect of the scope roll-off is much less pronounced.
1 2 3 4 5 6 7 820
15
10
5
0
LeCroy 86xx Scope Frequency Response
frequency (GHz)
mag
nitu
de (d
B)
.
1 2 3 4 5 6 7 8
20
15
10
5
0
Competing 20 GS/s 6 GHz scope
frequency (GHz)
mag
nitu
de (d
B) .
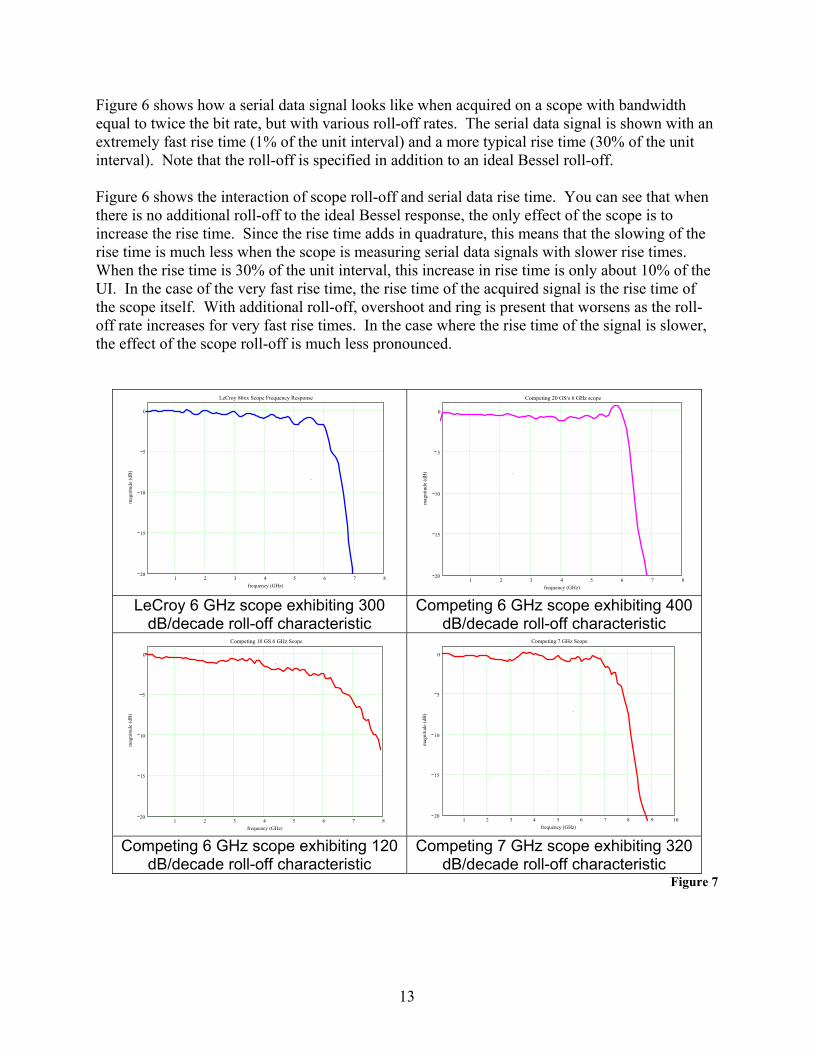
LeCroy 6 GHz scope exhibiting 300 dB/decade roll-off characteristic
Competing 6 GHz scope exhibiting 400 dB/decade roll-off characteristic
1 2 3 4 5 6 7 820
15
10
5
0
Competing 10 GS 6 GHz Scope
frequency (GHz)
mag
nitu
de (d
B)
.
1 2 3 4 5 6 7 8 9 10
20
15
10
5
0
Competing 7 GHz Scope
frequency (GHz)
mag
nitu
de (d
B) .
.
Competing 6 GHz scope exhibiting 120
dB/decade roll-off characteristic Competing 7 GHz scope exhibiting 320
dB/decade roll-off characteristic Figure 7
14
Because of the overshoot and ring, scopes with sharp roll-off can introduce intersymbol interference (ISI) in the eye pattern and can cause problems in mask testing when the rise time of the edges is very low. Today's real-time scopes will have the bandwidth specified, but the roll-off rate remains unspecified. In practice, the roll-off of actual real-time scopes varies from 120 dB/decade to 400 dB/decade. The bandwidth times rise time number is between 0.4 and 0.5. All of these scopes have significant overshoot and ringing in the step response when very fast edges are applied. Figure 7 demonstrates measured scope roll-off rates for various models. The grids on these plots are at 5 dB increments vertically and 1 GHz increments horizontally. Summary
• Practical, high-bandwidth real-time scopes have high roll-off rates in their magnitude response after the bandwidth point.
• Fast roll-off leads to a relationship of scope rise time and bandwidth such that the bandwidth multiplied by the rise time is greater than 0.35 - like 0.45.
• Fast roll-off means that the scope produces overshoot and ringing in the step response, and therefore, the eye pattern.
• Overshoot and ringing can lead to intersymbol interference • Fast roll-off produces significantly lower distortion when the rise time of the serial data
signal is higher.
15
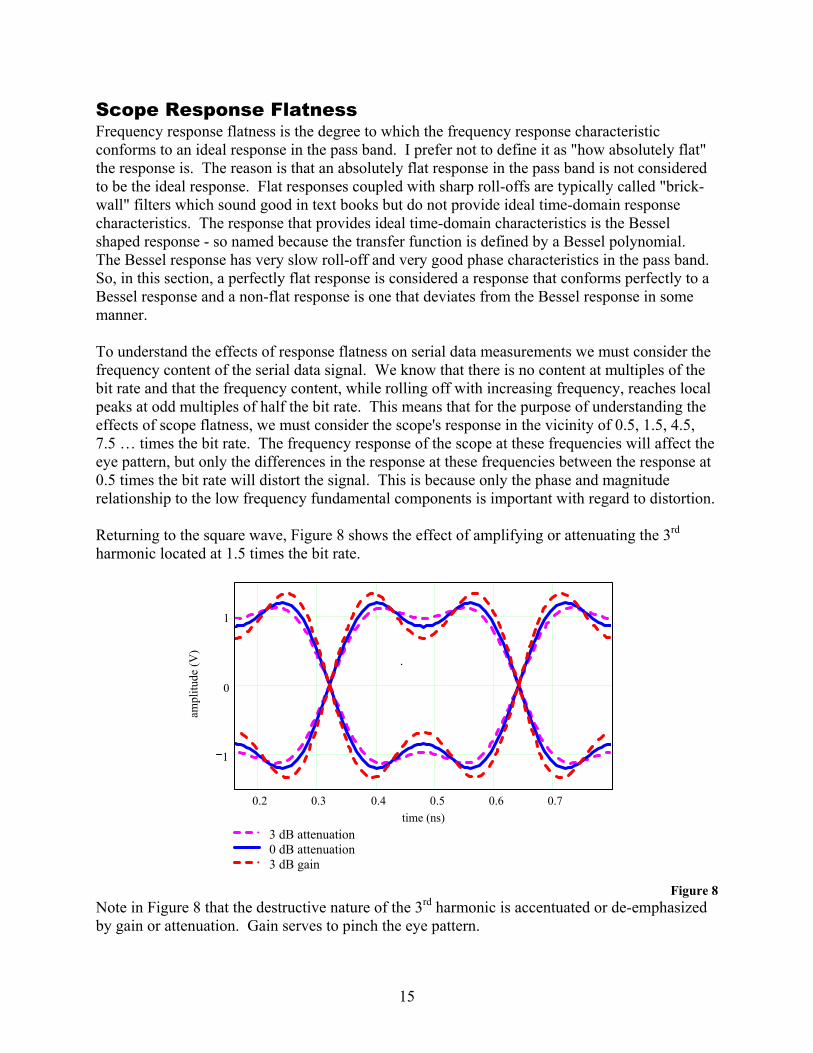
Scope Response Flatness Frequency response flatness is the degree to which the frequency response characteristic conforms to an ideal response in the pass band. I prefer not to define it as "how absolutely flat" the response is. The reason is that an absolutely flat response in the pass band is not considered to be the ideal response. Flat responses coupled with sharp roll-offs are typically called "brick-wall" filters which sound good in text books but do not provide ideal time-domain response characteristics. The response that provides ideal time-domain characteristics is the Bessel shaped response - so named because the transfer function is defined by a Bessel polynomial. The Bessel response has very slow roll-off and very good phase characteristics in the pass band. So, in this section, a perfectly flat response is considered a response that conforms perfectly to a Bessel response and a non-flat response is one that deviates from the Bessel response in some manner. To understand the effects of response flatness on serial data measurements we must consider the frequency content of the serial data signal. We know that there is no content at multiples of the bit rate and that the frequency content, while rolling off with increasing frequency, reaches local peaks at odd multiples of half the bit rate. This means that for the purpose of understanding the effects of scope flatness, we must consider the scope's response in the vicinity of 0.5, 1.5, 4.5, 7.5 … times the bit rate. The frequency response of the scope at these frequencies will affect the eye pattern, but only the differences in the response at these frequencies between the response at 0.5 times the bit rate will distort the signal. This is because only the phase and magnitude relationship to the low frequency fundamental components is important with regard to distortion. Returning to the square wave, Figure 8 shows the effect of amplifying or attenuating the 3rd harmonic located at 1.5 times the bit rate.
0.2 0.3 0.4 0.5 0.6 0.7
1
0
1
3 dB attenuation0 dB attenuation3 dB gain
time (ns)
ampl
itude
(V)
.
Figure 8
Note in Figure 8 that the destructive nature of the 3rd harmonic is accentuated or de-emphasized by gain or attenuation. Gain serves to pinch the eye pattern.
16
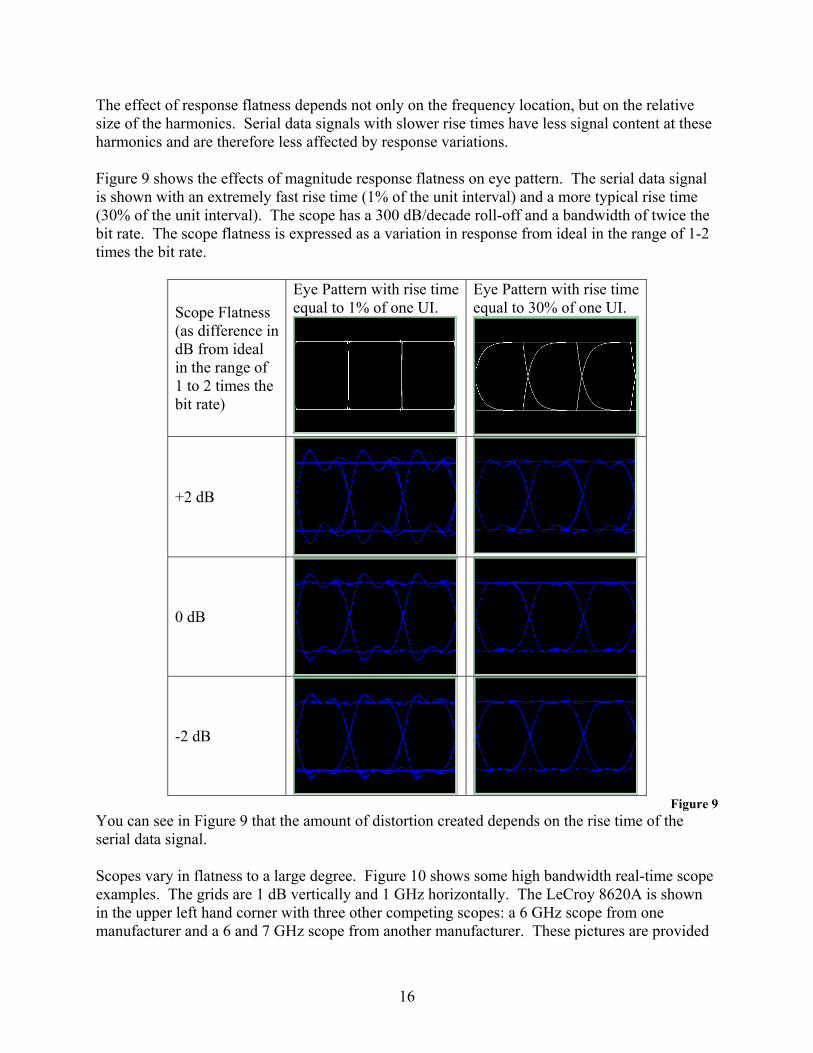
The effect of response flatness depends not only on the frequency location, but on the relative size of the harmonics. Serial data signals with slower rise times have less signal content at these harmonics and are therefore less affected by response variations. Figure 9 shows the effects of magnitude response flatness on eye pattern. The serial data signal is shown with an extremely fast rise time (1% of the unit interval) and a more typical rise time (30% of the unit interval). The scope has a 300 dB/decade roll-off and a bandwidth of twice the bit rate. The scope flatness is expressed as a variation in response from ideal in the range of 1-2 times the bit rate.
Scope Flatness (as difference in dB from ideal in the range of 1 to 2 times the bit rate)
Eye Pattern with rise time equal to 1% of one UI.
Eye Pattern with rise time equal to 30% of one UI.
+2 dB
0 dB
-2 dB
Figure 9
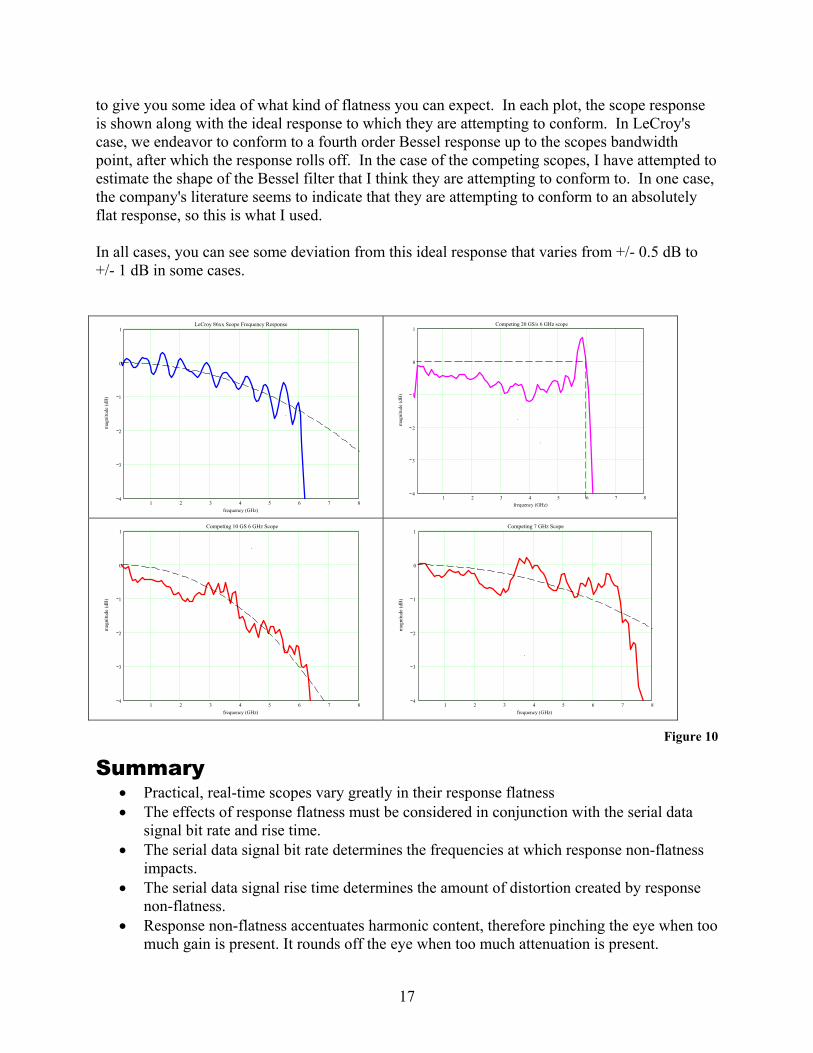
You can see in Figure 9 that the amount of distortion created depends on the rise time of the serial data signal. Scopes vary in flatness to a large degree. Figure 10 shows some high bandwidth real-time scope examples. The grids are 1 dB vertically and 1 GHz horizontally. The LeCroy 8620A is shown in the upper left hand corner with three other competing scopes: a 6 GHz scope from one manufacturer and a 6 and 7 GHz scope from another manufacturer. These pictures are provided
17
to give you some idea of what kind of flatness you can expect. In each plot, the scope response is shown along with the ideal response to which they are attempting to conform. In LeCroy's case, we endeavor to conform to a fourth order Bessel response up to the scopes bandwidth point, after which the response rolls off. In the case of the competing scopes, I have attempted to estimate the shape of the Bessel filter that I think they are attempting to conform to. In one case, the company's literature seems to indicate that they are attempting to conform to an absolutely flat response, so this is what I used. In all cases, you can see some deviation from this ideal response that varies from +/- 0.5 dB to +/- 1 dB in some cases.
1 2 3 4 5 6 7 84
3
2
1
0
1LeCroy 86xx Scope Frequency Response
frequency (GHz)
mag
nitu
de (d
B)
.
1 2 3 4 5 6 7 8
4
3
2
1
0
1Competing 20 GS/s 6 GHz scope
frequency (GHz)
mag
nitu
de (d
B)
.
.
1 2 3 4 5 6 7 84
3
2
1
0
1Competing 10 GS 6 GHz Scope
frequency (GHz)
mag
nitu
de (d
B)
.
1 2 3 4 5 6 7 8
4
3
2
1
0
1Competing 7 GHz Scope
frequency (GHz)
mag
nitu
de (d
B)
.
Figure 10
Summary • Practical, real-time scopes vary greatly in their response flatness • The effects of response flatness must be considered in conjunction with the serial data
signal bit rate and rise time. • The serial data signal bit rate determines the frequencies at which response non-flatness
impacts. • The serial data signal rise time determines the amount of distortion created by response
non-flatness. • Response non-flatness accentuates harmonic content, therefore pinching the eye when too
much gain is present. It rounds off the eye when too much attenuation is present.
18
Scope Phase Response Phase response is the most ill-understood of all scope characteristics. Despite this situation, phase response is extremely important in the performance of the scope relative to eye pattern measurements. When looking at a bode plot of scope response, we know that this plot tells how much gain or attenuation is applied to a component of a signal at various frequencies. Phase tells us how much advance or delay is applied to that component. Common sense tells us that there should never be any advance of a component because that would imply a non-causal system - a system that is capable of reacting prior to the arrival of a signal. The amount of delay or advance can be expressed is in radians or degrees. The time delay or advance can be calculated by dividing the phase (in degrees) by 360 and multiplying by the period (the reciprocal of the frequency). This amount is often called the phase delay.
(φ in degrees) or (φ in radians)Equation 18
The phase response is the angular component of the scope’s response and is added to the phase of the input signal. The absolute phase is not as important as the phase relative to other frequencies. In other words, it is important that a system preserves the phase relationship of the components of a signal. The correct phase relationship is maintained when the phase delay is constant over all frequencies. This means that:
Equation 19 This condition is called linear phase because the phase is a linear function of frequency. A related, but different measure is that of group delay. Group delay is defined as:
or Equation 20
Group delay is sometimes called envelope delay and is the true delay of the envelope of a data signal. You can see that when a system has linear phase, the group delay is:
and Equation 21
So, the phase delay and time delay is equal and constant over frequency in the case of linear phase. Phase is generally not interesting to look at. For one, it tends to flip back and forth between +180 and -180 degrees, especially if the absolute delay has not been taken care of. Secondly, phase can look linear and hide the group delay variations. Phase response is interrelated with bandwidth, roll-off and flatness. In an ideal scope with a very slow roll-off Bessel response, the phase remains essentially linear forever. As the roll-off rate increases, the phase is essentially linear until the frequency approaches the knee or point where the roll-off starts, where it usually bends downwards causing delay of high frequency components. Any contributors to non-flatness usually affect phase, as well and there are possibilities, like flatness, where the group delay can also be non-flat. The phase response is only important where the scope has significant magnitude response. Once the magnitude response drops sufficiently low, the phase response can be ignored. Similarly, the effect of phase response is minimal when the signal content is small.
19
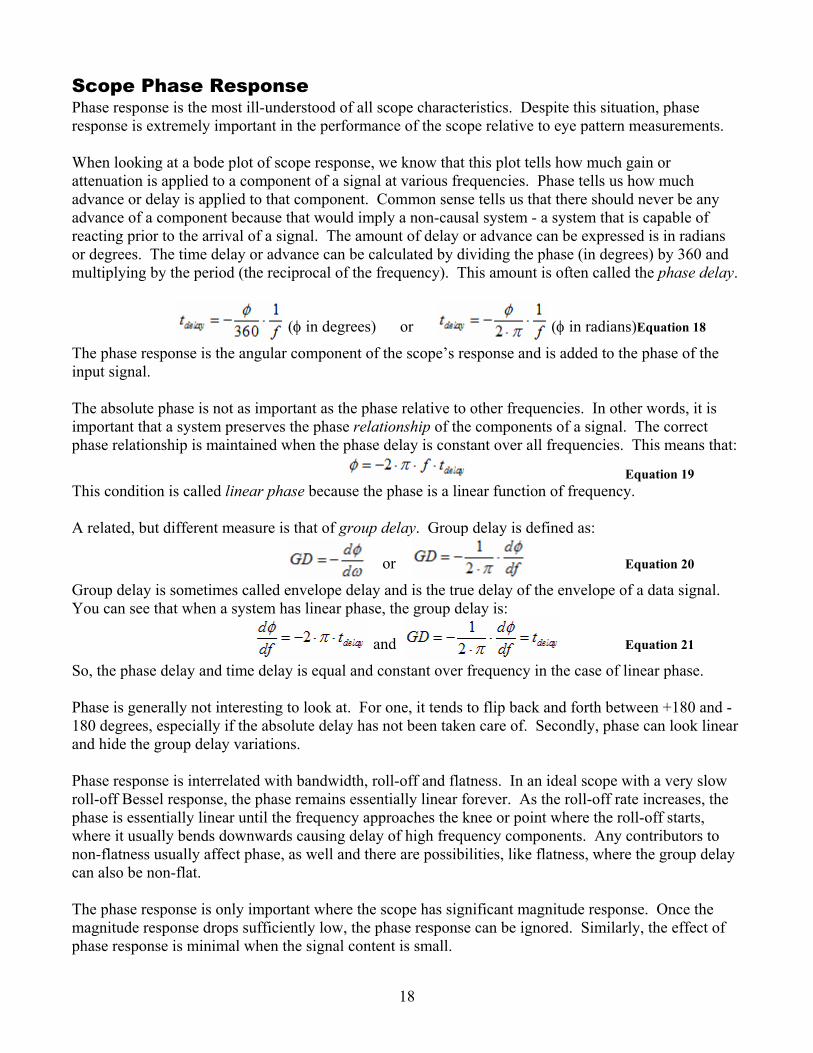
Non-ideal phase response effects on eye patterns are most easily understood by again returning to the Fourier coefficients of the square wave. Figure 11 shows the effect of advancing or delaying the 3rd harmonic relative to the fundamental. Only the fundamental and 3rd harmonic is shown.
0.2 0.3 0.4 0.5 0.6 0.7
1
0
1
50 ps delayno delay50 ps advance
time (ns)
ampl
itude
(V)
.
Figure 11
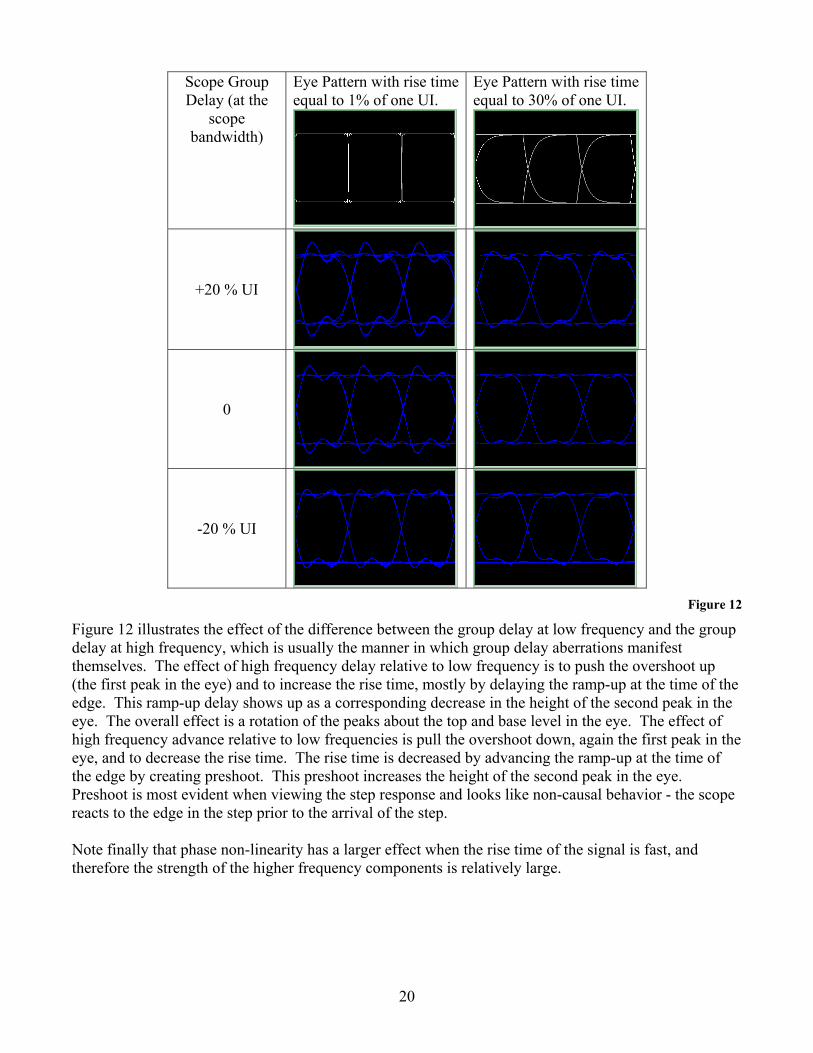
For a square wave, with a large 3rd harmonic, the effect is to create a lot of distortion by shifting the relative heights of the peaks. In the advance case, you can see that the effect is to emphasize the second peak. In a scope with such a characteristic, the step response would exhibit significant preshoot. Now, you should understand that the group delay cannot be perfectly flat in an actual system. This is because it is impossible to roll-off the magnitude response in any manner that does not cause some increase in group delay at higher frequency. The sharper the roll-off, the higher the increase in group delay at the pass band edge. While LeCroy is a pioneer in this area, all scope manufacturers now utilize digital signal processing to compensate the phase response. Some manufacturers believe that the phase should be completely flat. In such cases, preshoot is generated because the compensation does not produce a minimum phase response. Figure 12 shows the effects of phase response on the eye pattern. The serial data signal is shown with an extremely fast rise time (1% of the unit interval) and a more typical rise time (30% of the unit interval). The scope has a 300 dB/decade roll-off and a bandwidth of twice the bit rate. The scope phase response is expressed as the group delay at the bandwidth point (in percent of the unit interval) and the group delay curve follows a power curve that is 1/3rd the specified group delay at half the bandwidth. Note that this group delay characteristic is added to the group delay characteristic of the scope due to its magnitude response roll-off. Figure 12 illustrates several points. The main point is that phase nonlinearity changes the shape of the eye pattern dramatically. Increasing group delay at high frequencies emphasizes the first peak. Decreasing the group delay at high frequencies emphasizes the second peak. In the fast rise time case, the first peak is emphasized even when there are no group delay irregularities. This is because the sharp roll-off of the scope causes some phase non-linearity.
20
Scope Group Delay (at the
scope bandwidth)
Eye Pattern with rise time equal to 1% of one UI.
Eye Pattern with rise time equal to 30% of one UI.
+20 % UI
0
-20 % UI
Figure 12
Figure 12 illustrates the effect of the difference between the group delay at low frequency and the group delay at high frequency, which is usually the manner in which group delay aberrations manifest themselves. The effect of high frequency delay relative to low frequency is to push the overshoot up (the first peak in the eye) and to increase the rise time, mostly by delaying the ramp-up at the time of the edge. This ramp-up delay shows up as a corresponding decrease in the height of the second peak in the eye. The overall effect is a rotation of the peaks about the top and base level in the eye. The effect of high frequency advance relative to low frequencies is pull the overshoot down, again the first peak in the eye, and to decrease the rise time. The rise time is decreased by advancing the ramp-up at the time of the edge by creating preshoot. This preshoot increases the height of the second peak in the eye. Preshoot is most evident when viewing the step response and looks like non-causal behavior - the scope reacts to the edge in the step prior to the arrival of the step. Note finally that phase non-linearity has a larger effect when the rise time of the signal is fast, and therefore the strength of the higher frequency components is relatively large.
21
Summary • Phase response is an often ill-understood, but very important concept • Good phase response is linear phase, or constant group delay with frequency. • The phase is not important beyond the point at which the scope's magnitude response is
providing significant attenuation. • In real systems, the phase must become non-linear as the roll-off rate of the magnitude response
increases. • Delay of high frequencies relative to low frequencies pushes up early peaks in the eye and
suppresses trailing peaks. • Advance of high frequencies relative to low frequencies pushes down early peaks in the eye and
accentuates trailing peaks. • Phase correction, when over-applied, causes preshoot in the step response.
22
Probes, Loading, Return Loss and Noise There are a few more scope characteristics that affect the eye pattern displayed, but space does not permit explaining these in any detail. The first is return loss. Up to now, we have examined scope characteristics that involve the “through” response of the scope: the way that the scope affects the signal that appears on the screen. We have not looked at how the scope affects the actual signal being measured. When signals are connected directly to the scope inputs, the scope provides the load. Scope designers try to make the scope inputs appear as best as possible as a 50 Ohm load uniformly over all frequencies. When a perfect 50 Ohm load is provided, the entire signal entering the scope absorbed. When an imperfect termination is provided, an impedance mismatch is created. An impedance mismatch causes some of the signal sent into the scope to be sent back to the transmitter. The amount of signal sent back is called the return loss and is expressed as the amount of gain applied in decibels to the input signal that is returned. The return loss of the scope input and the effect of the returned signal on the device under test should always be considered. Probes are designed to have the opposite effect. A probe is designed to be as non-intrusive as possible and as such is designed to provide no load, or as high impedance as possible. This is because unlike the scope inputs, the probe is connected in the middle of a signal trace that is already terminated. The intrusiveness of a probe is expressed usually as probe loading. Often it is only specified at DC (to provide better seeming specifications to the user) but it is becoming increasing popular for scope manufacturers to provide probe loading as a function of frequency, or an equivalent probe loading circuit. Probe loading tends to attenuate the signal being measured at frequencies where the impedance is small and also tends to set up reflections in the circuit under test due to any impedance mismatches created. Finally, scopes and probes can introduce noise. Some scope users are surprised to know that high-end scopes have noise floors only 35-40 dB below full-scale (i.e. the SNR is 35 to 40 dB reference to a signal filling the screen vertically). Noise and other distortion effects of the scope can fill another paper entirely and is therefore beyond the scope of this paper.
23
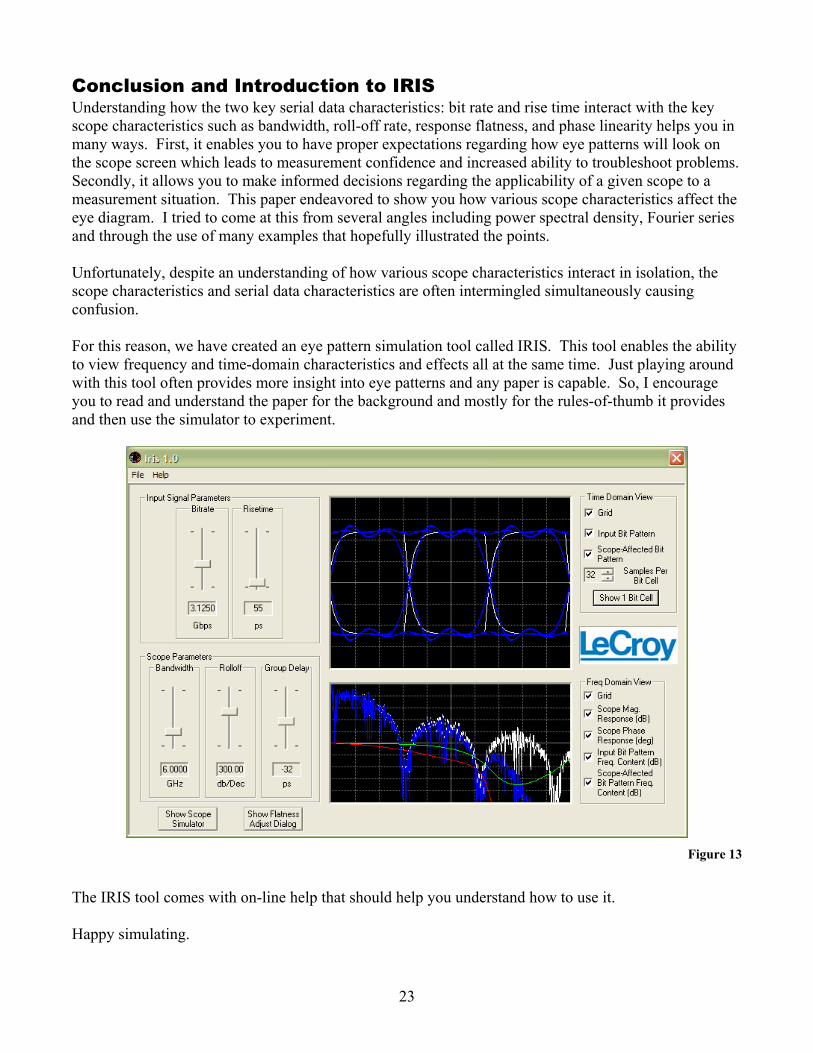
Conclusion and Introduction to IRIS Understanding how the two key serial data characteristics: bit rate and rise time interact with the key scope characteristics such as bandwidth, roll-off rate, response flatness, and phase linearity helps you in many ways. First, it enables you to have proper expectations regarding how eye patterns will look on the scope screen which leads to measurement confidence and increased ability to troubleshoot problems. Secondly, it allows you to make informed decisions regarding the applicability of a given scope to a measurement situation. This paper endeavored to show you how various scope characteristics affect the eye diagram. I tried to come at this from several angles including power spectral density, Fourier series and through the use of many examples that hopefully illustrated the points. Unfortunately, despite an understanding of how various scope characteristics interact in isolation, the scope characteristics and serial data characteristics are often intermingled simultaneously causing confusion. For this reason, we have created an eye pattern simulation tool called IRIS. This tool enables the ability to view frequency and time-domain characteristics and effects all at the same time. Just playing around with this tool often provides more insight into eye patterns and any paper is capable. So, I encourage you to read and understand the paper for the background and mostly for the rules-of-thumb it provides and then use the simulator to experiment.
Figure 13
The IRIS tool comes with on-line help that should help you understand how to use it. Happy simulating.
Related Documents