1 Introduction The limited capacity of visual attention has often been related to accidents that occur during driving (eg Staughton and Storie 1977). A recent analysis of accidents catego- rised by perceptual failures revealed that inattention, failure to look, and ‘looked but failed to see’ errors were among the most frequent causal factors involved in the accidents, as identified by investigating police officers (Brown 2002). These perceptual errors occur because attention must be selective. When the context becomes too demanding, however, the priorities of selective attention change according to the nature of the demand. For instance, negotiating curves (eg Shinar et al 1977) places a greater demand on visual attention, as does increased traffic density (Rahimi et al 1990), increased speed (Cohen 1981), proximity to other vehicles (Hella et al 1996), and increasingly complex driving manoeuvres (Muira 1979). In all of these instances, fixation durations are decreased as the drivers attempt to sample more of the visual scene in order to maintain their situational awareness in an increas- ingly demanding situation. An increase in the sampling rate of visual search limits the amount of processing that can be done during any single fixation. It may be these occasions that are primarily responsible for ‘looked but failed to see’errors. Drivers may know that they must check for cross-traffic at a junction, though a cursory glance in the appropriate direction may not be enough to verify that a manoeuvre is safe. Other increases in demand can have the opposite effect upon visual search. The appearance of abrupt hazards, such as the car ahead suddenly braking, or a pedestrian stepping into the road, tend to capture attention, resulting in increased fixation dura- tions and a reduced spread of search (Chapman and Underwood 1998; Velichkovsky et al 2002). These events may contribute to accidents where the driver has failed to look, or has been distracted. The current study is concerned with one specific instance in which the context leads to an increase in demand on the attentional system: intentional car following. There has been considerable interest in engineering models of car-following behaviour (for a review, Eye movements during intentional car following Perception, 2004, volume 33, pages 975 ^ 986 David Crundall, Claire Shenton, Geoffrey Underwood School of Psychology, University of Nottingham, Nottingham NG7 2RD, UK; e-mail: [email protected] Received 9 June 2003, in revised form 1 March 2004 Abstract. Does intentional car following capture visual attention to the extent that driving may be impaired? We tested fifteen participants on a rudimentary driving simulator. Participants were either instructed to follow a vehicle ahead through a simulated version of London, or were given verbal instructions on where to turn during the route. The presence or absence of pedestrians, and the simulated time of the drive (day or night) were varied across the trials. Eye movements were recorded along with behavioural measures including give-way violations, give-way accidents, and kerb impacts. The results revealed that intentional car following reduced the spread of search and increased fixation durations, with a dramatic increase in the time spent processing the vehicle ahead (controlled for exposure). The effects were most pronounced during nighttime drives. During the car-following trials participants were also less aware of pedestrians, produced more give-way violations, and were involved in more give-way accidents. The results draw attention to the problems encountered during car following, and we relate this to the cognitive demands placed on drivers, especially police drivers who often engage in intentional car following and pursuits. DOI:10.1068/p5105

Welcome message from author
This document is posted to help you gain knowledge. Please leave a comment to let me know what you think about it! Share it to your friends and learn new things together.
Transcript
1 IntroductionThe limited capacity of visual attention has often been related to accidents that occurduring driving (eg Staughton and Storie 1977). A recent analysis of accidents catego-rised by perceptual failures revealed that inattention, failure to look, and `looked butfailed to see' errors were among the most frequent causal factors involved in theaccidents, as identified by investigating police officers (Brown 2002). These perceptualerrors occur because attention must be selective.
When the context becomes too demanding, however, the priorities of selectiveattention change according to the nature of the demand. For instance, negotiating curves(eg Shinar et al 1977) places a greater demand on visual attention, as does increasedtraffic density (Rahimi et al 1990), increased speed (Cohen 1981), proximity to othervehicles (Hella et al 1996), and increasingly complex driving manoeuvres (Muira 1979).In all of these instances, fixation durations are decreased as the drivers attempt to samplemore of the visual scene in order to maintain their situational awareness in an increas-ingly demanding situation. An increase in the sampling rate of visual search limitsthe amount of processing that can be done during any single fixation. It may be theseoccasions that are primarily responsible for `looked but failed to see' errors. Drivers mayknow that they must check for cross-traffic at a junction, though a cursory glance inthe appropriate direction may not be enough to verify that a manoeuvre is safe.
Other increases in demand can have the opposite effect upon visual search. Theappearance of abrupt hazards, such as the car ahead suddenly braking, or a pedestrianstepping into the road, tend to capture attention, resulting in increased fixation dura-tions and a reduced spread of search (Chapman and Underwood 1998; Velichkovskyet al 2002). These events may contribute to accidents where the driver has failed tolook, or has been distracted.
The current study is concerned with one specific instance in which the context leadsto an increase in demand on the attentional system: intentional car following. There hasbeen considerable interest in engineering models of car-following behaviour (for a review,
Eye movements during intentional car following
Perception, 2004, volume 33, pages 975 ^ 986
David Crundall, Claire Shenton, Geoffrey UnderwoodSchool of Psychology, University of Nottingham, Nottingham NG7 2RD, UK;e-mail: [email protected] 9 June 2003, in revised form 1 March 2004
Abstract. Does intentional car following capture visual attention to the extent that driving maybe impaired? We tested fifteen participants on a rudimentary driving simulator. Participants wereeither instructed to follow a vehicle ahead through a simulated version of London, or were givenverbal instructions on where to turn during the route. The presence or absence of pedestrians, andthe simulated time of the drive (day or night) were varied across the trials. Eye movements wererecorded along with behavioural measures including give-way violations, give-way accidents, andkerb impacts. The results revealed that intentional car following reduced the spread of searchand increased fixation durations, with a dramatic increase in the time spent processing the vehicleahead (controlled for exposure). The effects were most pronounced during nighttime drives. Duringthe car-following trials participants were also less aware of pedestrians, produced more give-wayviolations, and were involved in more give-way accidents. The results draw attention to the problemsencountered during car following, and we relate this to the cognitive demands placed on drivers,especially police drivers who often engage in intentional car following and pursuits.
DOI:10.1068/p5105

see Brackstone and McDonald 1999). All such models, however, view car following asa passive activity, where car following is incidental to the task of getting from A to B.Here, we are concerned with a more active definition of car following, where it is thedriver's intention to follow another vehicle rather than merely to travel to a newdestination in a line of traffic. The impetus for this research has developed fromcurrent concerns in police pursuit driving, and therefore we focus upon how the driversdeploy visual attention in a driving scenario when they are required to follow a vehiclethrough a complex series of streets.
The UK Police Complaints Authority (PCA) recently reported a marked increase inserious injuries or fatal road-traffic incidents involving police vehicles. Of the 85 casesinvestigated between 1998 and 2001, over 75% were classified as `pursuits' or `follows'and 73 involved a total of 91 fatalities. The majority of incidents occurred at night,in an urban area with a 30 miles hÿ1 speed limit and when the road was either quietor deserted. `Pursuits' and `follows' involve following another vehicle containing asuspected law violator. The typical differences between the two are that `pursuits' havea higher average speed, involve active attempts to stop the fleeing vehicle, and themean distance between the vehicles is generally lower during `safe follows' (PCA 2002).The most frequent source of collision during pursuits (in incidents referred to thePCA between 1998 and 2001) was that of the target car colliding with a fixed object(such as a tree) or with another vehicle or pedestrian. In contrast, the majority ofcollisions occurring during `follows' involved the police vehicle. Though differencesbetween `follows' and `pursuits' may lead to somewhat different search patterns, bothsituations are dominated by the necessity to attend to a lead vehicle.
On the basis of attentional focusing with abrupt hazards (Chapman and Underwood1998; Crundall et al 1999, 2002), Crundall et al (2003) suggested that the prolongedhazard associated with chasing or following a suspect vehicle may also capture attention.If fixation durations are increased on a fleeing vehicle, and spread of search is corre-spondingly decreased, then the driver may be more prone to inattentional blindness toperipheral stimuli, which may contribute to an increased accident liability. Alternatively,though a lead vehicle may increase fixation durations, the driver may attempt to com-pensate for the increased demand, by prioritising other important peripheral stimulithat may otherwise be missed. Mourant and Rockwell (1970) found both attentionalcapture and compensation (with increased glances to road markings) when driverswere instructed to maintain a specific headway between themselves and an incidentallead vehicle. Would such results occur under intentional following conditions?
Crundall et al (2003) asked police and normal drivers to watch video clips of policepursuits and found that, although police drivers did have a wider spread of search thannormal drivers, all participants showed evidence of focusing, though this mainlyoccurred during nighttime clips. Daytime clips actually showed increased scanningduring pursuits compared with control clips, as if participants were using a compensatorystrategy (Mourant and Rockwell 1970).
A number of questions were raised by this study. First, it was questioned whetherthe basic results would be upheld if drivers had some motor interaction with the clips.It is known that certain steering actions require specific eye movements (eg Land andLee 1994) and it is possible that the lack of interaction removed the need for certainvisual strategies (such as strategies associated with car positioning relative to the laneand other road users).
A second issue was whether the level of information in each clip systematicallyaffected search strategy. For instance, the nighttime clips in the Crundall et al (2003)study had fewer pedestrians and less traffic. This was a consequence of filming undernatural conditions, and reflected the diurnal pattern of roadway activity. It is possiblethat drivers invest more attention in the suspect vehicle when they know there are
976 D Crundall, C Shenton, G Underwood

fewer other potential hazards. This has different safety implications compared withthe possible explanation that the fleeing vehicle attracts more attention at night owingto the increased salience of the vehicle against the surroundings. The former explanationsuggests that drivers could reallocate attention away from the suspect vehicle if theythought that the presence of other potential hazards required it. The latter explanationsuggests that the drivers would not have this option. Though the use of real-world stimulidoes provide fidelity and realism, the inherent nature of the experimental conditionsmeans that it can be hard to tease apart such competing explanations.
In the current study, we address these issues using a non-police cohort in simulatedcar-following and control drives, in daytime and nighttime settings, with and withoutpedestrians. The use of a rudimentary driving simulator allowed the experimentersto include motor interaction whilst retaining a high degree of consistency across theparticipants' trials. It also allowed the manipulation of the number of peripheral dis-tractors (in this case, the presence or absence of pedestrians) independently of the timeof day. Two extra sources of information have also been added that were not availablein the video clips used by Crundall et al (2003): a rear-view mirror and a speedometer.
On the basis of previous studies it was predicted that drivers would devote moreattention to the car ahead in the car-following conditions compared with the controlconditions (where participants were given verbal instructions on which route to take).This focusing should be apparent in the amount of time spent looking at the car ahead,longer fixation durations, and a decreased spread of visual search, and according toCrundall et al (2003) will vary according to the time of day.
There is evidence that mirror checking is generally reduced as the mental loadduring driving increases (Recarte and Nunes 2000; Robinson et al 1972). Schweigertand Bubb (2001) have additionally reported fewer fixations upon other non-essentialobjects during this time. The total duration of fixations upon the rear-view mirror andthe speedometer are therefore expected to reduce during car following.
The presence of pedestrians is predicted to lead to an increase in visual search, atleast in the control trials when the driver is not required to actively follow another car.If focusing does occur and is primarily due to a reduction in distractor stimuli ratherthan the increased salience or priority of the suspect vehicle, then the presence ofpedestrians should reduce any focusing effect.
If focusing is prompted by a reduction of attentional requirements elsewhere inthe scene (ie drivers only focus on the car ahead when it is safe to do so), then focus-ing should not occur at the expense of safety. Give-way violations, rear-end collisions,give-way collisions, and kerb impacts were all recorded to test this hypothesis. Itwas predicted that any focusing that occurs will be unavoidable and will thereforeproduce an increase in violations and accidents that are linked to inattention. Kerbimpacts were included as a measure of lane maintenance, which is considered to bea peripherally monitored task (Land and Horwood 1995), and is therefore susceptibleto reduced peripheral attention caused by focusing on a demanding central stimulus(Crundall et al 1999, 2002).
2 Method2.1 ParticipantsFifteen na|« ve participants (seven female, eight male) took part in this investigation.All participants held a full UK driving licence, and had normal or corrected-to-normalvision. Participants ranged in age from 19.3 to 31.3 years with a mean of 21.7 years.Driving experience ranged from 1 to 12.2 years from gaining a driving licence, with amean of 3.8 years. None of the participants had any prior experience of the drivingsimulation used in this study.
Eye movements and car following 977

2.2 DesignA 26262 within-groups design was employed. The first independent variable wasdriving type: participants were either required to follow a lead vehicle or were givenverbal directions. The second factor split the drives according to whether they occurredwithin a midday or nighttime setting (which included streetlamps). The third factormanipulated the complexity of peripheral stimuli through the presence or absence ofpedestrians during the drives.
A number of measures were recorded. Eye-movement recordings provided fixationdurations, spread of horizontal and vertical search, and gaze durations within certaincategories of stimuli (car ahead, speedometer, and rear-view mirror). As the amount oftime there was a car ahead varied for each drive (especially when comparing car-follow-ing versus verbal-direction drives), gaze durations within the category of car ahead werecalculated as a percentage of the amount of exposure to such stimuli. For the purposeof this study, a car ahead' is defined as any vehicle available to view directly throughthe windscreen and that is travelling in the same direction as the participant.
Driving violations and accidents were also recorded. Violations were restricted toobvious failures to give way at appropriate junctions. Three types of `accidents' wererecorded: rear-end shunts, give-way collisions, and kerb impacts. Each accident was givena number of points based on the severity of the incident. They were either classifiedas minor (1 point), moderate (2 points), or severe (3 points) accidents. Severity forrear-end shunts and give-way collisions was defined according to the speed at whichcollision occurs: 20 miles hÿ1 or below is classified as minor, since a pedestrian hit atthis speed has over 95% chance of survival; between 21 and 30 miles hÿ1 is rated asmoderate, when survival chances reduce to 55%; and 31 miles hÿ1 or more is regardedas severe as survival chances decrease further and this is also breaking the speed limitfor the roads in the simulator (Department of Transport 1997). Kerb impacts are ratedas minor for a clip, moderate if mounting the kerb with 2 or more tyres, and severe if alsoendangering pedestrians and/or crashing into pavement furniture (such as a lamppost).
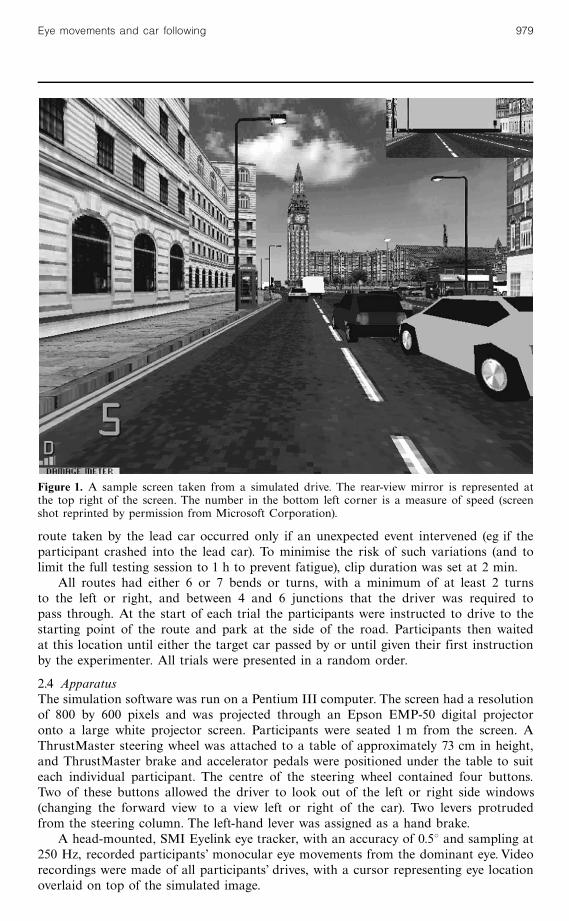
2.3 StimuliThe stimuli consisted of eight 2 min simulated periods of driving through the city ofLondon using the cruise' option of Midtown Madness 22, a driving simulator producedby Microsoft. This provided a free-roaming driving simulation without any specificgoals (see figure 1 for an example screen shot).
Participants were presented with a driver's viewpoint of the simulation (subtending60 deg by 45 deg of visual angle). Mirror information was also available from a smallsection at the top-right of the screen (subtending 18 deg by 7.5 deg; mirror locationwas restricted by software limitations), and a digital speed display was available in thebottom left corner of the screen (subtending 5 deg by 3.3 deg). Drivers had the optionof looking out of the left and right side windows of their car by pressing two buttonson the steering wheel. When either button was depressed, the view from the front ofthe car would change to a side view.
The simulated environment was urban and included junctions, traffic lights, stopsigns, dual and single carriageways, hills, and parked cars. The cars that were followeddrove relatively normally, abiding by traffic lights, etc, although they frequently brokethe 30 miles hÿ1 speed limit.
Four routes were chosen around London. Each route was used twice, once duringthe daytime and once during the night. Two of the routes were used for car followingand two were used for verbal instructions. The car-following routes had at least two leadvehicles which kept to the same route, providing a consistent drive for all participants.One of the vehicles was used as the lead car in the nighttime drive and the other wasused in the daytime drive (counterbalanced across participants). Slight variations in the
978 D Crundall, C Shenton, G Underwood
route taken by the lead car occurred only if an unexpected event intervened (eg if theparticipant crashed into the lead car). To minimise the risk of such variations (and tolimit the full testing session to 1 h to prevent fatigue), clip duration was set at 2 min.
All routes had either 6 or 7 bends or turns, with a minimum of at least 2 turnsto the left or right, and between 4 and 6 junctions that the driver was required topass through. At the start of each trial the participants were instructed to drive to thestarting point of the route and park at the side of the road. Participants then waitedat this location until either the target car passed by or until given their first instructionby the experimenter. All trials were presented in a random order.
2.4 ApparatusThe simulation software was run on a Pentium III computer. The screen had a resolutionof 800 by 600 pixels and was projected through an Epson EMP-50 digital projectoronto a large white projector screen. Participants were seated 1 m from the screen. AThrustMaster steering wheel was attached to a table of approximately 73 cm in height,and ThrustMaster brake and accelerator pedals were positioned under the table to suiteach individual participant. The centre of the steering wheel contained four buttons.Two of these buttons allowed the driver to look out of the left or right side windows(changing the forward view to a view left or right of the car). Two levers protrudedfrom the steering column. The left-hand lever was assigned as a hand brake.
A head-mounted, SMI Eyelink eye tracker, with an accuracy of 0.58 and sampling at250 Hz, recorded participants' monocular eye movements from the dominant eye. Videorecordings were made of all participants' drives, with a cursor representing eye locationoverlaid on top of the simulated image.
Figure 1. A sample screen taken from a simulated drive. The rear-view mirror is represented atthe top right of the screen. The number in the bottom left corner is a measure of speed (screenshot reprinted by permission from Microsoft Corporation).
Eye movements and car following 979

2.5 ProcedureBefore beginning the experiment, participants were required to fill in a short question-naire regarding biographical information and their exposure to driving simulators ingeneral, and specifically to the simulator used in this study.
Participants were then seated 1 m from the screen, and were acquainted with thesteering wheel and the foot pedals. They then completed an initial practice driveinvolving various tasks, including an emergency stop, reversing, looking left and rightat a junction, driving at 30 miles hÿ1 and following another vehicle for a short period.The practice drive was self-paced but lasted no more than 10 min. Participants werethen fitted with the eye tracker and completed calibration using markers on the projectorscreen.
Participants received standard instructions to drive as they would in reality andcompleted eight drives of 2 min duration. In the car-following scenario, trials wereaborted early if participants lost the car-to-be-followed. Participants were informed ofa 30 miles hÿ1 speed limit and were instructed to drive normally on control drives.During the car-following drives they were told to drive as if they were a police vehiclefollowing a suspect. The verbal directions given during the former conditions weredelivered by the experimenter at appropriate times so that participants knew where toturn on a similar time scale as during car following.
3 ResultsThe results are divided into three sections. The first section reports participant'sfixation durations and spread of search. The second section is concerned with gazedurations within the three categories of car ahead, rear-view mirror, and speedometer.The third section reports measures of driving behaviour including speed, violations,and accidents. Eye movement means can be viewed in table 1, while accident andviolation means are recorded in table 2.
Unless otherwise stated, data were analysed with a 26262 within-groups analysisof variance (ANOVA). These analyses were conducted across the two types of driving(control and car following), two times of day (night and midday), and two levels of
Table 1. Condition means for all eye-movement measures (with standard errors, in italics).Spread of search is calculated as the standard deviations of fixation locations in the horizontaland vertical meridians.
Control Car following
no pedestrians pedestrians no pedestrians pedestrians
day night day night day night day night
Fixation durations=ms 385 379 382 377 417 403 422 428(19) (21) (17) (19) (24) (31) (22) (26)
Horizontal spread of 10.70 10.10 10.96 10.87 9.10 10.52 9.29 9.84search=8 (0.41) (0.27) (0.42) (0.38) (0.35) (0.60) (0.35) (0.46)
Vertical spread of 4.47 4.19 5.14 4.68 4.27 4.26 4.68 3.59search=8 (0.38) (0.30) (0.80) (0.84) (0.55) (0.54) (0.44) (0.35)
Gaze duration on car 39.81 39.18 76.81 80.81ahead=% of exposure (4.18) (3.40)
n/a n/a(2.84) (2.04)
n/a n/a
Gaze duration on the 3259 2472 2251 1685 1621 1832 3485 2195rear-view mirror=ms (738) (612) (532) (522) (500) (565) (1386) (813)
Gaze duration on the 3803 3632 2699 3080 1341 923 1312 677speedometer=ms (669) (1003) (511) (606) (651) (530) (385) (258)
980 D Crundall, C Shenton, G Underwood

peripheral stimuli (with and without pedestrians). Prior to each ANOVA, data were testedwith the Kolmogorov ^ Smirnov test of normality and Mauchly's test of sphericity. If datawere not normally distributed, transformations were applied where appropriate; wheresphericity was of concern, the degrees of freedom were modified with the Greenhouse ^Geisser epsilon. The latter modifications did not affect any of the observed p values.Effect sizes were calculated by means of Cohen's f and are reported where they aidinterpretation.
3.1 Fixation analysesPrior to analysis, all fixations below 50 ms and above 3 standard deviations from eachparticipant's mean were removed from the data.
A main effect of drive type was found for fixation durations (F1 14 � 5:75,MSE � 7131, f � 0:64, p 5 0:05), with longer fixation durations during the car-followingtrials compared with the control trials. No other effects were found.
A similar ANOVA was conducted on the standard deviations of fixation locationsin the horizontal axis, to compare a measure of horizontal search across conditions.A main effect of drive type was noted, with a smaller spread of search in the car-following conditions (F1 14 � 12:2, MSE � 410:0, f � 0:93, p 5 0:01). Two interactionswere also noted. The first interaction was found with drive type and time of day(F1 14 � 4:4, MSE � 174:7, f � 0:56, p � 0:05). The interaction reveals that the reduc-tion in horizontal spread of search in the car-following trials is primarily due to lesshorizontal search during daytime drives. The reduction in horizontal search in thenighttime clips was minimal. The second interaction was found with drive type andthe presence or absence of pedestrians (F1 14 � 6:2, MSE � 372:7, f � 0:67, p 5 0:05).During control trials participants increased their horizontal search when pedestrianswere present. During car-following trials, the presence or absence of pedestrians didnot influence horizontal search, with both conditions showing reduced spread of searchcompared with control trials. It appears that the car-following task either demandedthe resources that participants would normally allocate to monitoring the pedestrians(foveal attention), or removed the resources that made the drivers aware of the pedes-trians in the first instance (peripheral attention).
It should be noted that the influence of car following on horizontal spread of searchis an underestimate, as the analysis does not take into account the number of timesthe drivers looked out of the left-hand-side and right-hand-side car windows (usingbuttons on the steering wheel to momentarily change the view). Drivers made anaverage of 2.2 switches of view during control drives, compared with a much reduced0.84 switches during car following. This further illustrates the decrement in horizontalsearch evident during car following.
A similar analysis conducted on the standard deviations of fixation locations inthe vertical meridian showed no significant effects.
,
,
,
,
Table 2. The mean number of violation and accident occurrences for control and car-followingtrials (with standard errors, in italics).
Violation/accident Control Car following
Give-way violations 1.07 (0.28) 2.13 (0.35)
Rear-end shunts 0.40 (0.24) 6.67 (1.48)
Give-way collisions 0.40 (0.16) 1.47 (0.43)
Kerb impacts 0.87 (0.29) 3.87 (1.12)
Eye movements and car following 981

3.2 Gaze durations within categoriesThe durations of gaze within three key categories (car ahead, speedometer, and rear-viewmirror) were taken from video recordings of each participant's drives. The videos hada cursor overlaid on the simulator display indicating what the participant was lookingat during the drive. Gaze durations were calculated in milliseconds on the basis ofthe number of frames of video (25 Hz) in each drive when the cursor fell within theboundaries of one of the three categories.
The availability of a car ahead varied greatly between trials (especially when com-paring car-following with control trials). To enable comparisons, the total number offrames in which a car ahead was present was summed for each drive for each participant.This provided a baseline measure of exposure to the category of car ahead for every trial.Gaze durations within the category of car ahead were then calculated as a percentageof the amount of time each driver was exposed to a car ahead in each trial.
Though the target cars used in the following conditions followed reasonablyconsistent routes, the other traffic on the road was less consistent in the routes taken.This resulted in less than half of the participants having a car ahead present for anyof the control drives with pedestrians present. On this basis, analysis of the gazedurations on the category car ahead was conducted only upon the trials that did notcontain pedestrians, requiring a 262 ANOVA across the two levels of driving (carfollowing and control) and the two times of day (daytime and nighttime).
A significant main effect of drive type (F1 14 � 200:4, MSE � 115:7, f � 3:78,p 5 0:01) was found. As predicted, total gaze duration upon the car ahead was greaterduring car following. When intentionally following a car, participants remained focusedupon the vehicle for 79% of the time that it was available, compared with only 39.5%in the control condition.
A 26262 ANOVA was conducted on the gaze durations on the rear-view mirror.No differences were found, even after a square-root transform to correct slight deviationsfrom normality.
The same analysis was conducted upon the speedometer by using a square-roottransform to correct for deviations from normality. A significant main effect of drivetype (F1 14 � 29:3, MSE � 816:6, f � 1:45, p 5 0:01) was found with shorter gazedurations upon the speedometer during car-following trials. After transformation, thedata fell short of suggesting an interaction between drive type and the presence orabsence of pedestrians (F1 14 � 4:3, MSE � 119:7, f � 0:55, p 5 0:06), though the trendwas in the predicted direction, with lower gaze durations on the speedometer in thepresence of pedestrians, but in control trials only. In the car-following trials, the gazedurations on the speedometer were reduced, and no distinction was apparent betweenthe pedestrians-present and pedestrians-absent conditions.
3.3 Measures of driving performanceIn addition to eye-movement measures and gaze durations within key categories, certainbehavioural measures were also analysed. These included speed, give-way violations,rear-end shunts, give-way accidents, and kerb impacts (where the vehicle mounted thekerb).
Speed was recorded every 10 s throughout each trial and averaged to give an approx-imate mean speed. These mean speeds were analysed with a 26262 ANOVA. A maineffect of drive type upon mean speed was found (F1 14 � 56:3, MSE � 17:7, f � 2:01,p 5 0:01). As expected, mean speed was significantly higher during car-following(mean � 19:9 miles hÿ1) than during control conditions (mean � 14:1 miles hÿ1). Speedrange was also analysed, with greater speed ranges occurring in the following conditions(44.6 miles hÿ1) compared with control drives (29.4 miles hÿ1, F1 14 � 82:9, MSE � 83:6,f � 2:43, p 5 0:01).
,
,
,
,
,
982 D Crundall, C Shenton, G Underwood

Give-way violations, and the three different types of accident could not be analysedwith ANOVAs because of the relatively low rate of occurrence. As such, violation andaccident data were pooled across the conditions of daytime and nighttime, and thepresence or absence of pedestrians, producing a series of within-groups t-tests compar-ing accidents and violations between the car-following and control conditions.
A give-way violation was defined as a failure to check for other vehicles at ajunction where the participant did not have right of way. The number of give-wayviolations while intentionally following a car was greater than that during control trials(2.13 and 1.06, respectively; t14 � 3:4, p 5 0:05).
Participants also had a higher accident rating for rear-end shunts (t14 � 4:176,p 5 0:01, one-tailed), give-way collisions (t14 � 2:694, p 5 0:05), and kerb impacts(t14 � 2:728, p 5 0:05) when following a car compared with normal (control) driving.Accident ratings were calculated on the basis of frequency and severity (see section 2).The mean number of violations and accidents can be viewed in table 2.
4 DiscussionThe results have revealed a clear focusing of overt attention during car-followingcompared with control trials during the simulated drives. When participants wereinstructed to follow a specific vehicle, fixation durations increased, spread of hori-zontal search decreased, and the proportion of time spent looking at a vehicle aheadwas doubled. This suggests that attention was reallocated from a wider visual-searchstrategy to a narrower strategy that paid specific attention to the car in front.
The effects of the presence or absence of pedestrians upon visual-search strategiessuggests that the focusing effect did not occur as the result of reduced peripheralstimuli (as could be argued in the case of the focusing noted in nighttime pursuits inCrundall et al 2003). During the control drives, the presence of pedestrians tended toincrease visual search along the horizontal axis. When following the car ahead, however,horizontal search was reduced to such an extent that no distinction remained betweenthe presence or absence of pedestrians. This suggests that in the control condition thelack of a central focus allowed participants to become aware of the pedestrians andthen respond to their presence by fixating them. When following another car, however,participants were either less aware of the pedestrians, or they at least made fewerattempts to foveate these potential hazards.
Horizontal search was also influenced by the time of day. During the daytime clips,horizontal search was slightly greater than during the nighttime scanning. However,during car-following trials, horizontal search decreased dramatically in the daytimeclips, with little decrement occurring during the nighttime drives. This result contrastswith the results of Crundall et al (2003) who found that nighttime clips produced thegreatest reduction in scanning, while daytime clips actually produced a greater degreeof horizontal scanning compared with the control clips. This surprising result will bereturned to later in the discussion.
It was not surprising that vertical search was unaffected by car following, as thereis very little variance in fixation locations in the vertical axis. As drivers develop theirvisual skills they quickly realise that the majority of the information that they need toattend to is distributed in the horizontal axis.
Gaze durations upon the categories of car ahead, rear-view mirror, and speedometerproduced mixed results. As expected, participants spent longer looking at the car aheadif they were required to follow it, reducing the amount of time available to attend to otherrelevant stimuli. Gaze durations on the speedometer were found to decrease in thecar-following trials suggesting that drivers were less aware of the speed that they weretravelling at. Though this could be explained in terms of reallocating attention fromthe speedometer to the fleeing vehicle, it is also likely that the prioritisation of speed
Eye movements and car following 983
regulation between car-following and control tasks may have had an effect. In the controltrials participants were instructed to drive normally, whereas in the car-following trialsparticipants were given the cover story that they were police officers following a suspectin a crime. Participants were made aware of the speed limit in both types of trial,though in the car-following trials their speed was regulated by the speed of the suspectvehicle. Thus, drivers may have had less reason to check the speedometer in the car-following trials, for if they were over the speed limit they would not be able to slowdown without losing their target. Gaze durations upon the rear-view mirror did notreveal any reductions in a comparison of the car-following and control trials. Previousresearch suggested that increased mental load should reduce mirror checks (Recarteand Nunes 2000; Robinson et al 1972), though these studies used a secondary task thatdid not relate to the driving task. It is possible that the increased load produced bycar following is not sufficient to induce a degradation in gaze durations upon themirror. It seems unlikely, however, that the demand of car following reduced the abilityof drivers to look at peripheral stimuli, such as pedestrians or cross-traffic at junctions,yet was not great enough to reduce mirror checks. It is possible, however, that theemphasis placed on mirrors while learning to drive results in mirror checking remain-ing a key activity long after search strategies out of the front of the car have degraded.There is a question how useful gaze durations on the mirror were during the car-followingcondition. If the mirror checks were simply the repetition of a highly practised patternunder conditions of high demand, then it is possible that very little of the informationavailable in the rear-view mirror was actually processed. This could be another potentialsource of a `looked but failed to see' error. The mirror data are supported by a pre-vious study that demonstrated increased, and inappropriate, use of the rear-view mirrorby novices in demanding driving conditions (Underwood et al 2002b).
The results of the car following upon other driving behaviours were quite apparent.Rear-end collisions were greatly increased, with misjudgments of speed in the car-following trials leading to the accidents (though it should be noted that rear-endcollisions were not corrected for exposure to vehicles ahead). Give-way violations weregreatly increased during car following, as were the number and severity of give-waycollisions and kerb impacts. One cannot attribute the increase in these accidents solelyto the attentional demands of car following, as a proportion of the increased accidentliability may be due to an increase in the average speed of car-following trialscompared with the control trials (a difference of nearly 5 miles hÿ1). Additionally,when viewing these statistics, one should bear in mind all simulators will suffer fromcomparisons with real-world driving. For example, rear-end shunts may be affectedby the particular braking and deceleration models used in the simulator. However,the fact that all behavioural measures tend to the same direction suggests a patternthat is distinct from any confounds caused by the simulator itself.
The increase in give-way violations is more directly linked to attentional demands,however, as they were defined by the driver failing to look for cross-traffic at junctions.These violations played a large part in the increased number of give-way collisionsduring car-following trials.
Overall the results suggest that car following does capture attention. The focusingeffect cannot be explained by a reduction in the level of distracting stimuli competingfor attention as drivers seem to be less aware of the pedestrians during the car-followingtrials. It is possible that automated routines to predictable locations, such as glancesto the rear-view mirror, may continue despite the degradation of visual search for otherhazards out of the front of the vehicle. The impact of car following on a number ofviolations and collisions is detrimental, and while kerb impacts and rear-end collisionsmay be partially explained by increased speed and exposure, give-way violations andcollisions are directly linked to inadequate visual search.
984 D Crundall, C Shenton, G Underwood
The contradiction between the current research and that of Crundall et al (2003)regarding the narrowing of search either during the daytime (as found in the currentstudy) or the nighttime (as noted in Crundall et al 2003) is difficult to solve. Thereare a considerable number of differences between the two studies. The previous studyused real video clips of driving, whereas the current study used an interactive simula-tion. Thus, while the crisp delineation of objects in a simulator may overestimate thevisibility of the visual scene during nighttime drives (which would reduce the contrastof a fleeing vehicle compared with the surroundings during the night), the inclusion ofa motor component may place specific demands upon driving that interact with theincreased sensitivity of peripheral vision during the night. There is no reason to believethat the difference between these two studies is due to one method being inherentlymore accurate than the other. Underwood et al (2002a) showed that actively viewingvideo clips of driving can produce similar eye-movement patterns to those noted onthe real road, while other researchers working with simulators have reported that,though absolute measures of behaviour may not translate perfectly to the real world,relative measures of driving behaviour with a simulator study have greater validity(eg Toernros 1998). Though many conclusions from this study are readily apparent, thefiner issue whether focusing occurs most during daytime or nighttime drives may onlybe solved by future on-road testing.
ReferencesBrackstone M, McDonald M, 1999 ` Car-following: a historical review'' Transportation Research,
Part F: Psychology and Behaviour 2 181 ^ 196Brown I D, 2002 `A review of the `looked but failed to see' accident causation factor'' Behavioural
Research in Road Safety 11 116 ^ 124Chapman P R, Underwood G, 1998 ` Visual search of driving situations: Danger and experience''
Perception 27 951 ^ 964Crundall D, Chapman P, Phelps N, Underwood G, 2003 ` Eye movements and hazard perception
in police pursuit and emergency response driving'' Journal of Experimental Psychology:Applied 9 163 ^ 174
Crundall D, Underwood G, Chapman P, 1999 ` Driving experience and the functional field ofview'' Perception 28 1075 ^ 1087
Crundall D, Underwood G, Chapman P, 2002 `Attending to the peripheral world while driving''Applied Cognitive Psychology 16 459 ^ 475
Cohen A S, 1981 ``Car drivers' pattern of eye fixations on the road and in the laboratory''Perceptual and Motor Skills 52 515 ^ 522
Department of Transport, 1997 Killing Speed and Saving Lives (London: The Stationery Office)Hella F, Neboit M, Laya O, 1996 ` Perceptual demand and eye movements in driving'', paper
presented at the International Conference on Traffic and Transport Psychology Valencia, Spain,May 22 ^ 25
Land M F, Horwood J, 1995 ` Which parts of the road guide steering?'' Nature 377 339 ^ 340Land M F, Lee D N, 1994 ` Where we look when we steer'' Nature 369 742 ^ 744Mourant R R, Rockwell T H, 1970 ` Mapping eye-movement patterns to the visual scene in
driving: an exploratory study'' Human Factors 12 81 ^ 87MuiraT, 1979 ` Visual behaviour in driving''Bulletin of the Faculty of Human Sciences, Osaka University
5 253 ^ 289Police Complaints Authority, 2002 Investigation of Road Traffic Incidents (RTI's) Involving Police
Vehicles, 1998 ^ 2001: Identifying Common Factors and the Lessons to be Learned (London:The Stationery Office)
Rahimi M, Briggs R P, Thom D R, 1990 `A field evaluation of driver eye and head movementstrategies toward environmental targets and distracters''Applied Ergonomics 21 267 ^ 274
Recarte M A, Nunes L M, 2000 ``Effects of verbal and spatial-imagery tasks on eye fixationswhile driving'' Journal of Experimental Psychology: Applied 6 31 ^ 43
Robinson G H, Erickson D J, Thurston G L, Clark R L, 1972 ` Visual search by automobile drivers''Human Factors 14 315 ^ 323
Schweigert M, Bubb H, 2001 ` Eye movements, performance and interference when driving acar and performing secondary tasks'', paper presented at the Vision in Vehicles 9 ConferenceBrisbane, August 19 ^ 22
Eye movements and car following 985

Shinar D, McDowell E D, Rockwell T H, 1977 ` Eye movements in curve negotiation'' HumanFactors 19 63 ^ 71
Staughton G C, Storie V J, 1977 Methodology of an In-depth Accident Investigation Survey Transpor-tation and Road Research Laboratory Report LR761 (Crowthorne, Berkshire: Transportationand Road Research Laboratory)
Toernros J, 1998 ` Driving behaviour in a real and a simulated road-tunnel: a validation study''Accident Analysis and Prevention 30 497 ^ 503
Underwood G, Chapman P, Bowden K, Crundall D, 2002a ` Visual search while driving: skilland awareness during inspection of the scene'' Transportation Research, Part F: Psychology andBehaviour 5 87 ^ 97
Underwood G, Crundall D, Chapman P, 2002b ``Selective searching while driving: the role ofexperience in hazard detection and general surveillance'' Ergonomics 45 1 ^ 12
Velichkovsky B M, Rothert A, Kopf M, Dornho« fer S M, Joos M, 2002 ` Towards an express-diagnostics for level of processing and hazard perception'' Transportation Research, Part F:Psychology and Behaviour 5 145 ^ 156
ß 2004 a Pion publication
986 D Crundall, C Shenton, G Underwood

ISSN 0301-0066 (print)
Conditions of use. This article may be downloaded from the Perception website for personal researchby members of subscribing organisations. Authors are entitled to distribute their own article (in printedform or by e-mail) to up to 50 people. This PDF may not be placed on any website (or other onlinedistribution system) without permission of the publisher.
www.perceptionweb.com
ISSN 1468-4233 (electronic)
Related Documents