Click to edit Master title style The better the question. The better the answer. EY Oil and Gas – PE perspective March 2017

Welcome message from author
This document is posted to help you gain knowledge. Please leave a comment to let me know what you think about it! Share it to your friends and learn new things together.
Transcript
Click to edit Master title style
The better the question. The better the answer.
The better the world works.
EY Oil and Gas – PE perspective
March 2017

Click to edit Master title style
Contents
1. PE investment in the context of industry capital raising 2
2. PE as a finance ‘multiplier’ 7
3. PE as a driver of the unconventional industry 11
4. PE as a driver of behavior and change 15

Click to edit Master title style Industry structure
PE investment in the context of industry capital raising
Oil & Gas — EY’s global perspective 3
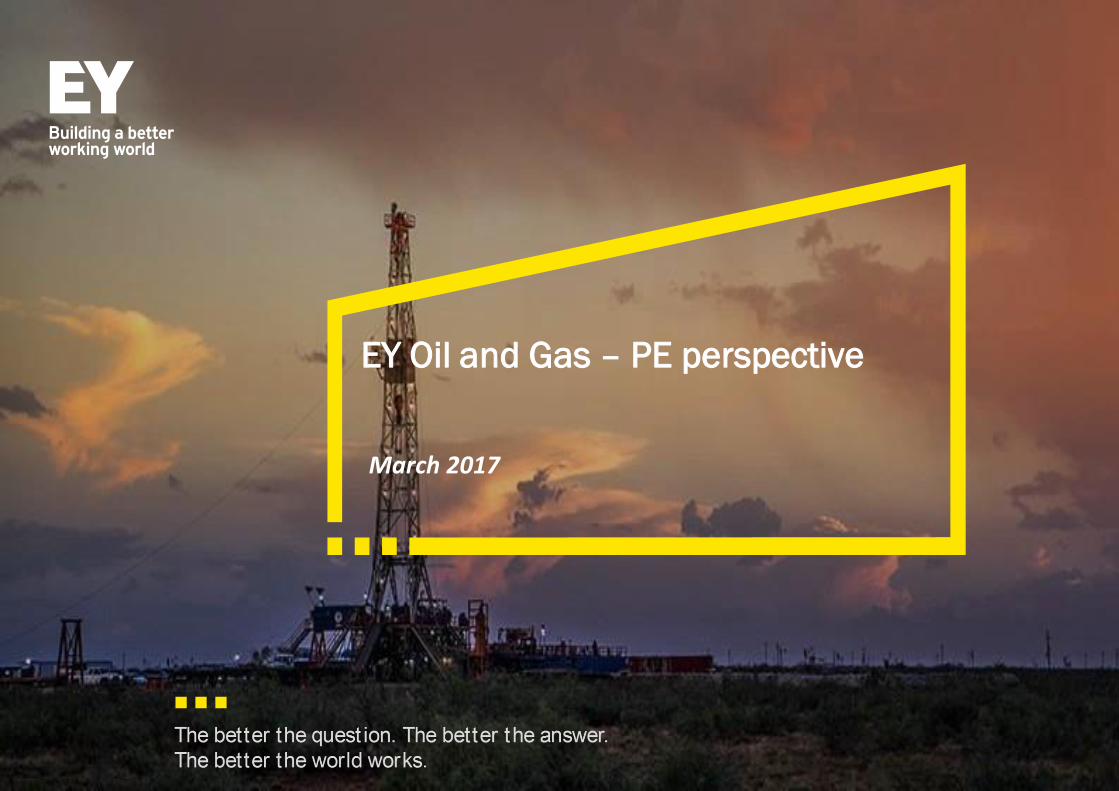
Private equity is a small proportion of the total capital invested in the industry
Source: EY Global Oil and Gas transactions review 2016, 1Derrick
62 74 63 81
248 237 246 209
362
461
366
241
28.4
19.6
19.4
15.9
4%
2% 3% 3%
2013 2014 2015 2016
PE investments
Loans
Bonds
Equity
PE as a % of overall capitalraised
Capital raised (US$b) • Capital raised by oil and gas
companies during 2016
continued to remain under
pressure
• Equity markets received a
boost, mainly from a few
sizeable new IPOs and several
follow-on offerings from US
shale companies.
• Debt market for investment-
grade bonds remained relatively
robust, albeit at lower levels
than 2015
• Surge in activity in Q4 2016
Post oil price decline, PE firms have followed a “wait-and-watch” approach for investing in the sector, accounting for approximately 2-4% of the total capital raised globally (between 2013-2016)
Note: To analyse yearly trends in deal value, mega 2016 PE deals considered as outliers and excluded from analysis, which includes PE investment in Rosneft, Petrobras (NTS), NGGD and Essar Oil.
Oil & Gas — EY’s global perspective 4
Industry structure
PE as a finance ‘multiplier’
Oil & Gas — EY’s global perspective 5
PE has the capacity to invest a great deal more than it has recently
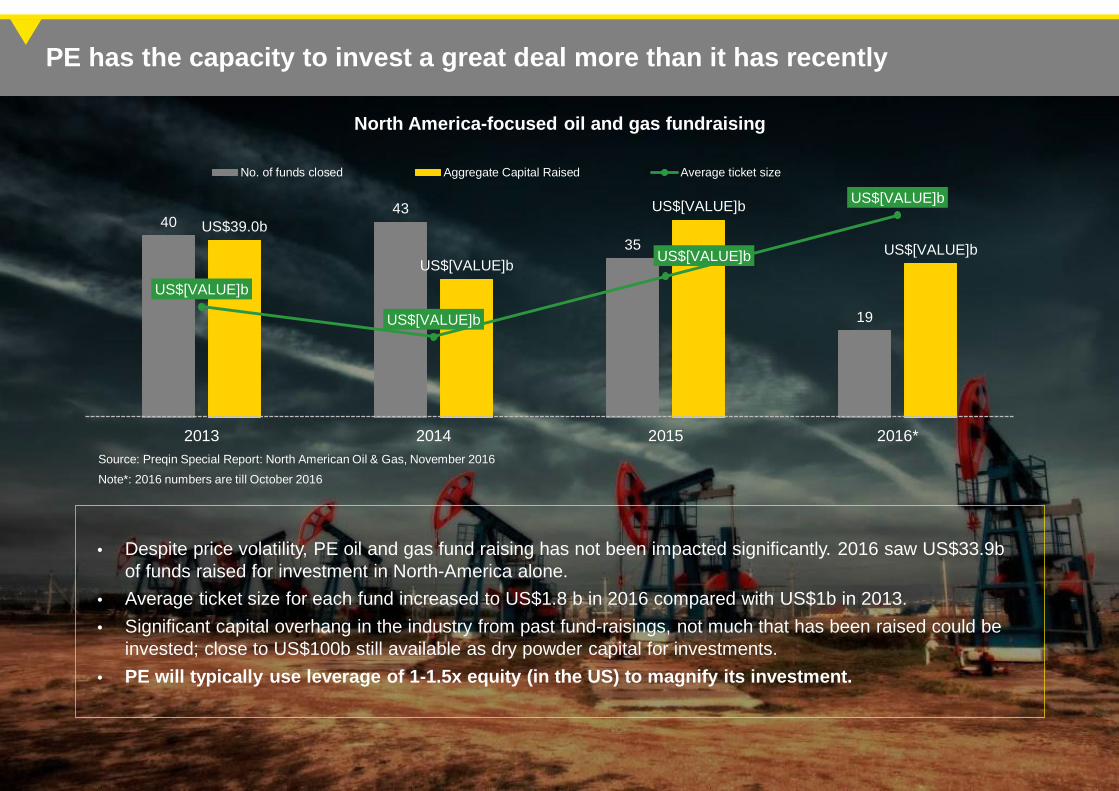
Source: Preqin Special Report: North American Oil & Gas, November 2016
Note*: 2016 numbers are till October 2016
North America-focused oil and gas fundraising
40 43
35
19
US$39.0b
US$[VALUE]b
US$[VALUE]b
US$[VALUE]b
US$[VALUE]b
US$[VALUE]b
US$[VALUE]b
US$[VALUE]b
2013 2014 2015 2016*
No. of funds closed Aggregate Capital Raised Average ticket size
• Despite price volatility, PE oil and gas fund raising has not been impacted significantly. 2016 saw US$33.9b
of funds raised for investment in North-America alone.
• Average ticket size for each fund increased to US$1.8 b in 2016 compared with US$1b in 2013.
• Significant capital overhang in the industry from past fund-raisings, not much that has been raised could be
invested; close to US$100b still available as dry powder capital for investments.
• PE will typically use leverage of 1-1.5x equity (in the US) to magnify its investment.

Oil & Gas — EY’s global perspective 6
Industry structure
PE as a driver of the unconventional industry
Oil & Gas — EY’s global perspective 7
US$[VALUE]b
US$[VALUE]b US$[VALU
E]b
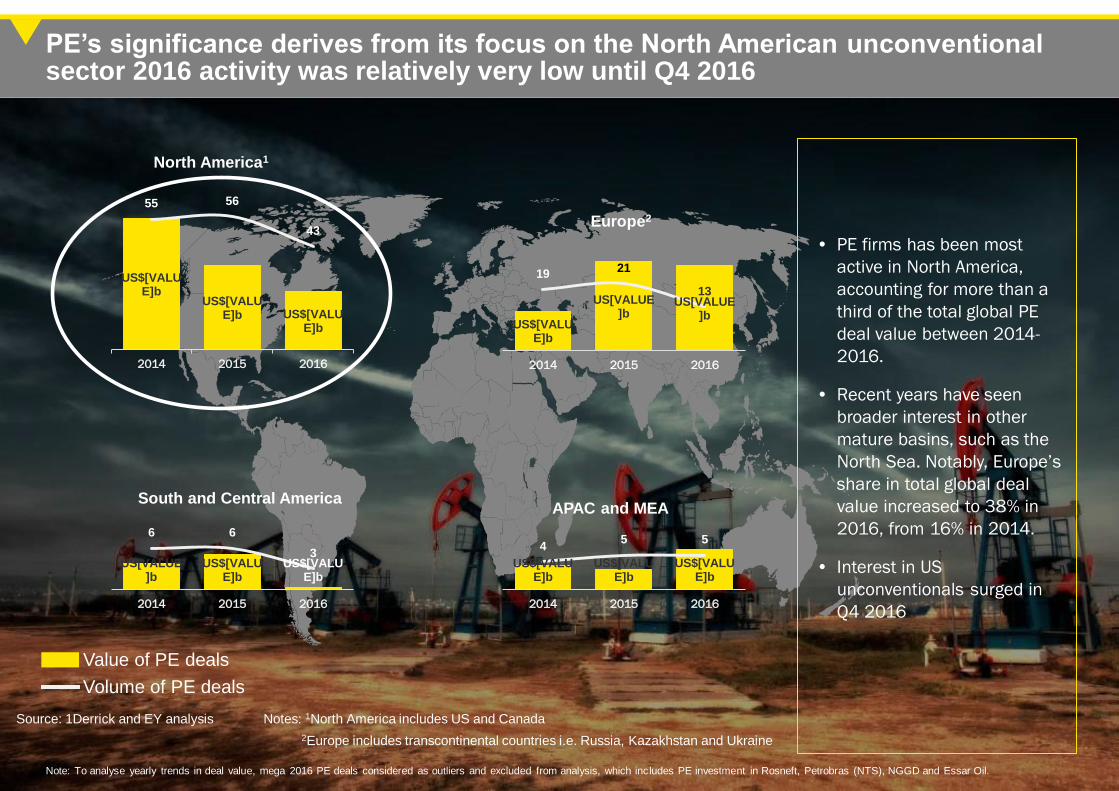
55 56
43
2014 2015 2016
US[VALUE]b
US$[VALUE]b
US$[VALUE]b
6 6
3
2014 2015 2016
US$[VALUE]b
US[VALUE]b
US[VALUE]b
19 21
13
2014 2015 2016
US$[VALUE]b
US$[VALUE]b
US$[VALUE]b
4 5 5
2014 2015 2016
South and Central America
Europe2
APAC and MEA
• PE firms has been most
active in North America,
accounting for more than a
third of the total global PE
deal value between 2014-
2016.
• Recent years have seen
broader interest in other
mature basins, such as the
North Sea. Notably, Europe’s
share in total global deal
value increased to 38% in
2016, from 16% in 2014.
• Interest in US
unconventionals surged in
Q4 2016
Value of PE deals
Volume of PE deals
Source: 1Derrick and EY analysis Notes: 1North America includes US and Canada
2Europe includes transcontinental countries i.e. Russia, Kazakhstan and Ukraine
PE’s significance derives from its focus on the North American unconventional sector 2016 activity was relatively very low until Q4 2016
North America1
Note: To analyse yearly trends in deal value, mega 2016 PE deals considered as outliers and excluded from analysis, which includes PE investment in Rosneft, Petrobras (NTS), NGGD and Essar Oil.
Oil & Gas — EY’s global perspective 8
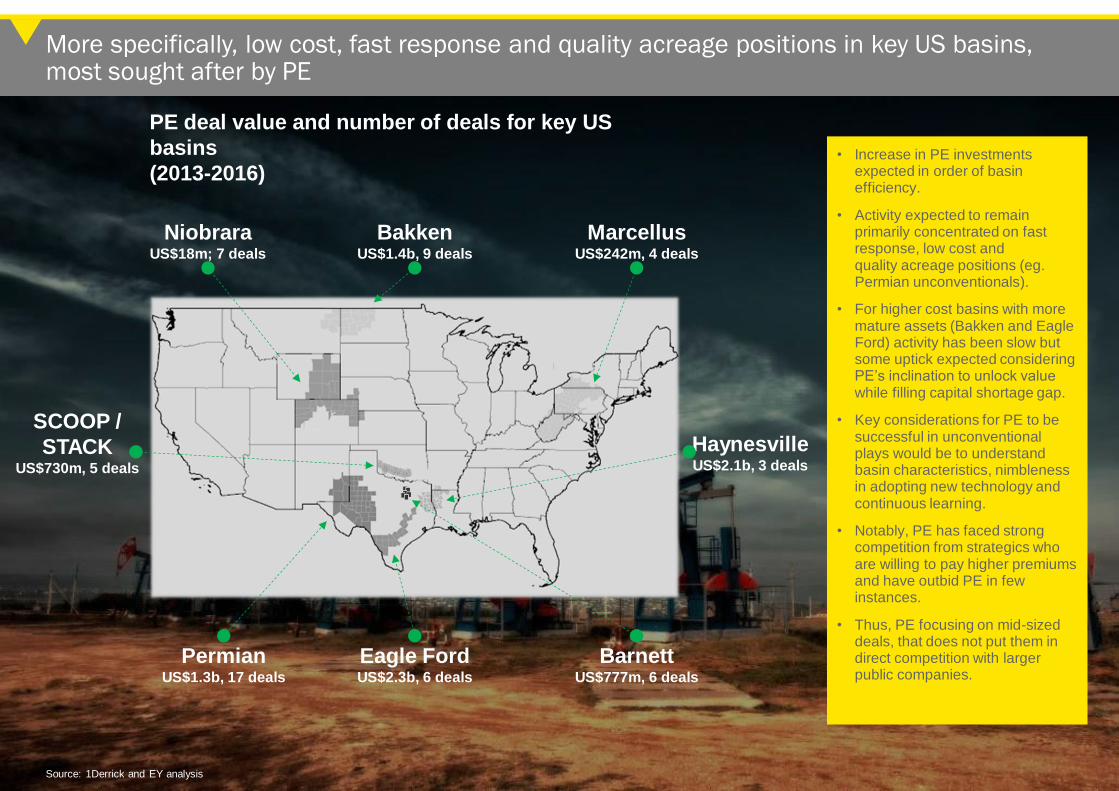
More specifically, low cost, fast response and quality acreage positions in key US basins, most sought after by PE
• Increase in PE investments expected in order of basin efficiency.
• Activity expected to remain primarily concentrated on fast response, low cost and quality acreage positions (eg. Permian unconventionals).
• For higher cost basins with more mature assets (Bakken and Eagle Ford) activity has been slow but some uptick expected considering PE’s inclination to unlock value while filling capital shortage gap.
• Key considerations for PE to be successful in unconventional plays would be to understand basin characteristics, nimbleness in adopting new technology and continuous learning.
• Notably, PE has faced strong competition from strategics who are willing to pay higher premiums and have outbid PE in few instances.
• Thus, PE focusing on mid-sized deals, that does not put them in direct competition with larger public companies.
Eagle Ford US$2.3b, 6 deals
Barnett US$777m, 6 deals
Haynesville US$2.1b, 3 deals
Marcellus US$242m, 4 deals
SCOOP /
STACK US$730m, 5 deals
Bakken US$1.4b, 9 deals
Niobrara US$18m; 7 deals
Permian US$1.3b, 17 deals
PE deal value and number of deals for key US
basins
(2013-2016)
Source: 1Derrick and EY analysis
Oil & Gas — EY’s global perspective 9
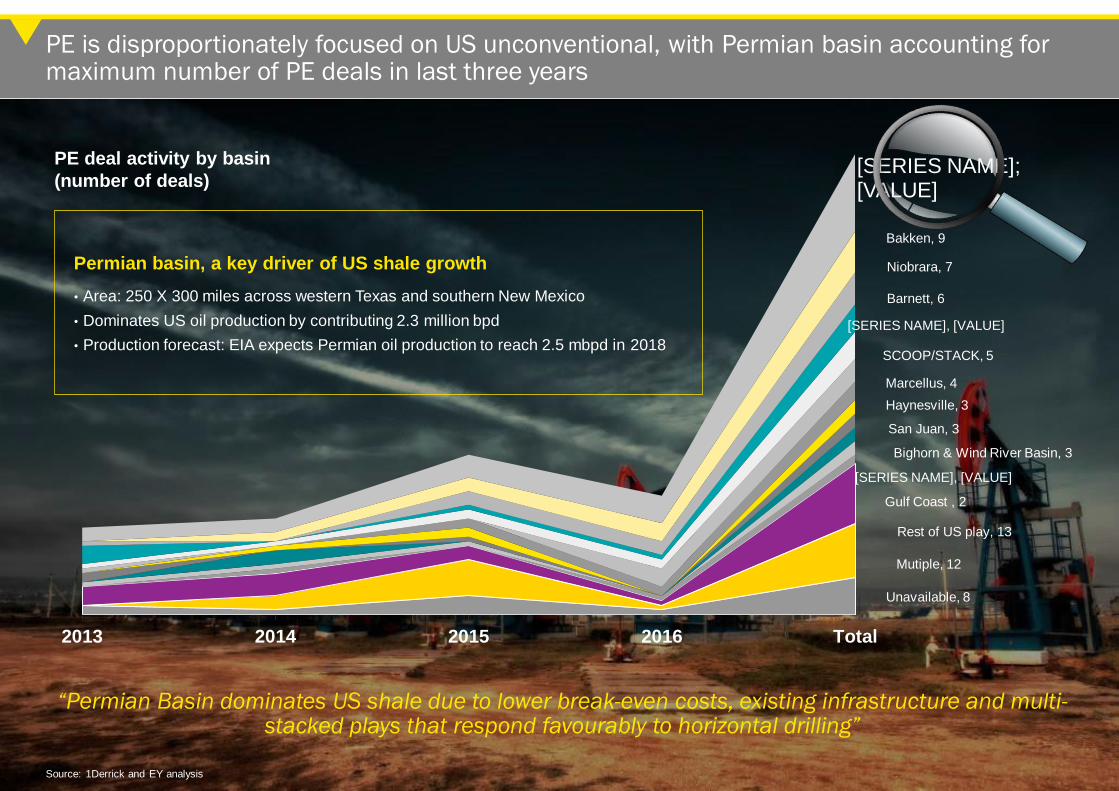
PE is disproportionately focused on US unconventional, with Permian basin accounting for maximum number of PE deals in last three years
Unavailable, 8
Mutiple, 12
Rest of US play, 13
Gulf Coast , 2
[SERIES NAME], [VALUE]
Bighorn & Wind River Basin, 3
San Juan, 3
Haynesville, 3
Marcellus, 4
SCOOP/STACK, 5
[SERIES NAME], [VALUE]
Barnett, 6
Niobrara, 7
Bakken, 9
[SERIES NAME]; [VALUE]
2013 2014 2015 2016 Total
Permian basin, a key driver of US shale growth
• Area: 250 X 300 miles across western Texas and southern New Mexico
• Dominates US oil production by contributing 2.3 million bpd
• Production forecast: EIA expects Permian oil production to reach 2.5 mbpd in 2018
PE deal activity by basin
(number of deals)
Source: 1Derrick and EY analysis
“Permian Basin dominates US shale due to lower break-even costs, existing infrastructure and multi-stacked plays that respond favourably to horizontal drilling”

Oil & Gas — EY’s global perspective 10
Asset level deals, specifically producing assets/ development asset, remain favorite with PE firms
0.2
2.9 1.9
4.9
3.7
0.9
0.1
0.5
0.1
1.6
2013 2014 2015 2016
Breakup of deal type by value (US$b)
Corporate deals Producing assets Developing assets
1
6 2 2
15
12 20
14
3 3
12
10
2013 2014 2015 2016
Breakup of deal type by number
Corporate deals Producing assets Developing assets
Key points
Asset type deals dominate PE transaction landscape. Key drivers include:
► Majors and independents coring down their portfolio of assets (not necessarily bad assets)
► Either they need capital to shore up their balance sheets, or
► Drill down to focus on one or two areas (basins or offshore/onshore) resulting in divestiture of the assets in
other regions/ segment
► Distressed asset deals from operators in need to boost liquidity and pay down debt.
► Relatively lesser technical/ exploration risk in producing assets compared with developing or underdevelopment
assets.
US$2.3b
US$8.2b
US$3.8b
US$2.6b
19 21
34
26
Source: 1Derrick and EY analysis
Note: To analyse yearly trends in deal value, mega 2016 PE deals considered as outliers and excluded from analysis, which includes PE investment in Rosneft, Petrobras (NTS), NGGD and Essar Oil.

Oil & Gas — EY’s global perspective 11
Industry structure
PE as a driver of behavior and change
Oil & Gas — EY’s global perspective 12
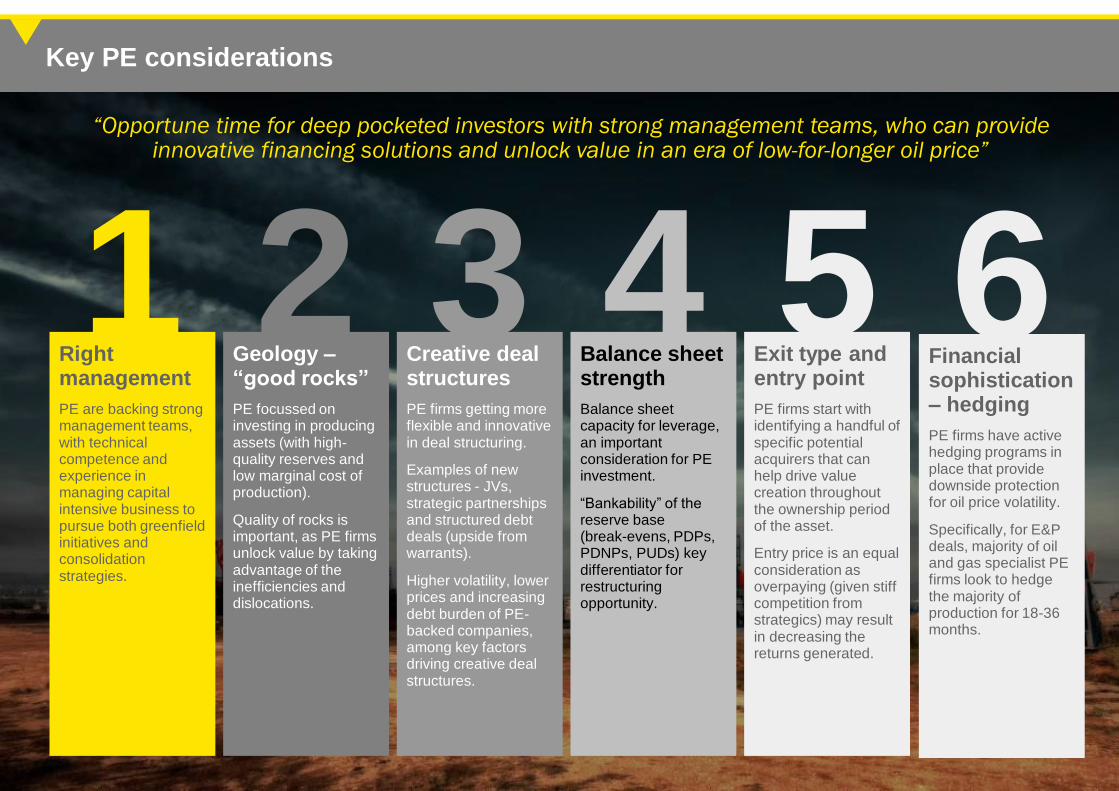
“Opportune time for deep pocketed investors with strong management teams, who can provide innovative financing solutions and unlock value in an era of low-for-longer oil price”
Right management
PE are backing strong management teams, with technical competence and experience in managing capital intensive business to pursue both greenfield initiatives and consolidation strategies.
1 Geology – “good rocks”
PE focussed on investing in producing assets (with high-quality reserves and low marginal cost of production).
Quality of rocks is important, as PE firms unlock value by taking advantage of the inefficiencies and dislocations.
2 Creative deal structures
PE firms getting more flexible and innovative in deal structuring.
Examples of new structures - JVs, strategic partnerships and structured debt deals (upside from warrants).
Higher volatility, lower prices and increasing debt burden of PE-backed companies, among key factors driving creative deal structures.
3 Balance sheet strength
Balance sheet capacity for leverage, an important consideration for PE investment.
“Bankability” of the reserve base (break-evens, PDPs, PDNPs, PUDs) key differentiator for restructuring opportunity.
Exit type and entry point
PE firms start with identifying a handful of specific potential acquirers that can help drive value creation throughout the ownership period of the asset.
Entry price is an equal consideration as overpaying (given stiff competition from strategics) may result in decreasing the returns generated.
5 4 Financial sophistication – hedging
PE firms have active hedging programs in place that provide downside protection for oil price volatility.
Specifically, for E&P deals, majority of oil and gas specialist PE firms look to hedge the majority of production for 18-36 months.
6
Key PE considerations
Oil & Gas — EY’s global perspective 13
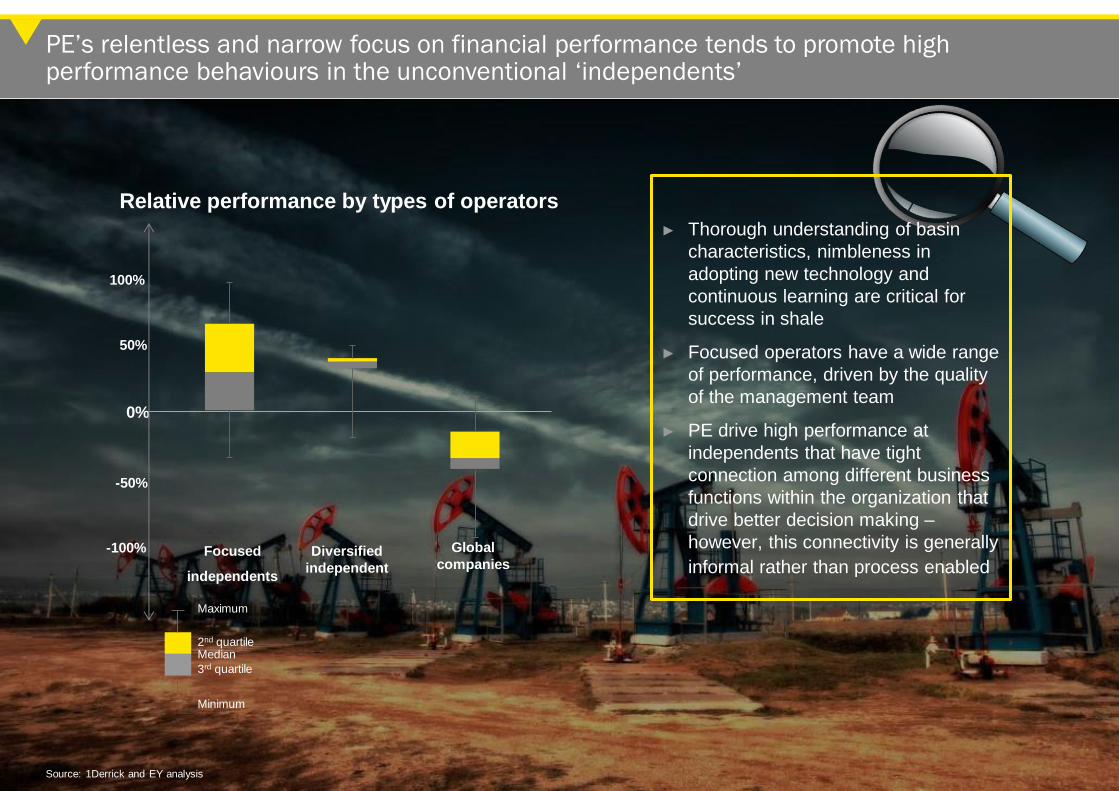
PE’s relentless and narrow focus on financial performance tends to promote high performance behaviours in the unconventional ‘independents’
Source: 1Derrick and EY analysis
0%
Diversified
independent
100%
-100%
-50%
50%
Focused
independents
Global
companies
2nd quartile
3rd quartile
Median
Maximum
Minimum
Relative performance by types of operators
► Thorough understanding of basin
characteristics, nimbleness in
adopting new technology and
continuous learning are critical for
success in shale
► Focused operators have a wide range
of performance, driven by the quality
of the management team
► PE drive high performance at
independents that have tight
connection among different business
functions within the organization that
drive better decision making –
however, this connectivity is generally
informal rather than process enabled

Oil & Gas — EY’s global perspective 14
EY
Assurance | Tax | Transactions | Advisory
About EY
EY is a global leader in assurance, tax, transaction and advisory services. Worldwide, our
230,000 people are united by our shared values and an unwavering commitment to quality.
We make a difference by helping our people, our clients and our wider communities achieve
their potential.
For more information, please visit
www.ey.com.
EY refers to the global organization of
member firms of EY Global Limited, each of
which is a separate legal entity. EY Global
Limited, a UK company limited by guarantee, does not
provide services to clients. For more information about
our organization.
EY LLP is a client-serving member firm of
EY Global and of EY Americas
operating in the US.
© 2017 EYGM Limited. All Rights Reserved.
This publication contains information in summary form and is therefore intended for general guidance only. It is not
intended to be a substitute for detailed research or the exercise of professional judgment. Neither EYGM Limited nor
any other member of the global EY organization can accept any responsibility for loss occasioned to any person acting
or refraining from action as a result of any material in this publication. On any specific matter, reference should be
made to the appropriate advisor.
Related Documents


![Oil and Gas Markets- A Consultants Perspective [Compatibility Mode]](https://static.cupdf.com/doc/110x72/577d357f1a28ab3a6b90993b/oil-and-gas-markets-a-consultants-perspective-compatibility-mode.jpg)