Vol.:(0123456789) 1 3 Climate Dynamics https://doi.org/10.1007/s00382-021-05975-7 Extreme storms in Southwest Asia (Northern Arabian Peninsula) under current and future climates Alexandre Tuel 1,3 · Yeon‑Woo Choi 1 · Duaij AlRukaibi 2 · Elfatih A. B. Eltahir 1 Received: 20 February 2021 / Accepted: 18 September 2021 © The Author(s), under exclusive licence to Springer-Verlag GmbH Germany, part of Springer Nature 2021 Abstract Precipitation extremes will generally intensify in response to a warming climate. This robust fingerprint of climate change is of particular concern, resulting in heavy rainfall and devastating floods. Often this intensification is explained as a con- sequence of the Clausius–Clapeyron law in a warmer world, under constant relative humidity. Here, based on an ensemble of CMIP5 global climate models and high-resolution regional climate simulations, we take the example of Southwest Asia, where extreme storms will intensify beyond the Clausius- Clapeyron scaling, and propose an additional novel mechanism for this region: the unique increase in atmospheric relative humidity over the Arabian Sea and associated deep northward penetration of moisture. This increase in humidity is dictated by changes in circulation over the Indian Ocean. Our proposed mechanism is consistent with the recent, most extreme storm ever observed in the region. Our findings advance a new understanding of natural climate variability in this region, with substantial implications for climate change adaptation of the region’s critical infrastructure. Keywords Extreme storms · CMIP5 · Cut-off low · Super-Clausius–Clapeyron · Indian Ocean dipole · Southwest Asia 1 Introduction The enhancement of precipitation extremes under climate change has received much attention in recent years as a robust fingerprint of a warming climate and because of its impacts on human societies (Trenberth 1999; Kharin et al. 2007; O’Gorman and Schneider 2009; O’Gorman 2015). Global climate models (GCMs) indeed project an intensi- fication of extreme precipitation events in the coming dec- ades, consistent with observed trends in the historical record (Min et al. 2011; Westra et al. 2013), although with signifi- cant regional differences. At first order, this intensification can be understood as a thermodynamic response to increases in water vapor saturation pressure with temperature follow- ing the Clausius–Clapeyron relationship (Trenberth 1999; Allen and Ingram 2002). A dynamical contribution from large-scale change in vertical velocity (Trenberth 1998; Pfahl et al. 2017) has also been found to contribute to this enhancement and may explain why precipitation extremes are more sensitive to climate warming in the tropics than in the extratropics (O’Gorman 2015). Local increases in ascent associated with increased latent heating may also play an important role at the regional scale and explain why some events exhibit super-Clausius–Clapeyron scaling (Nie et al. 2018). Other factors like changes in the temperature lapse- rate and in the vertical structure of moisture and diabatic heating are also believed to modulate trends in extreme pre- cipitation (O’Gorman and Schneider 2009; Sugiyama et al. 2010). Still, one aspect of precipitation extremes that has attracted little interest is the potential role of increases in relative humidity (RH) in certain regions of the world. Gen- erally, lower-tropospheric RH is expected to remain con- stant, or decline (Sherwood and Meyer 2006), particularly over the subtropics and mid-latitudes (Sherwood et al. 2010). Robust increases are however projected in the equatorial Alexandre Tuel and Yeon-Woo Choi contributed equally to this work. * Alexandre Tuel [email protected] 1 Ralph M. Parsons Laboratory, Massachusetts Institute of Technology, Cambridge, USA 2 Department of Civil Engineering, University of Kuwait, Kuwait City, Kuwait 3 Institute of Geography, Oeschger Centre for Climate Change Research, University of Bern, Bern, Switzerland Content courtesy of Springer Nature, terms of use apply. Rights reserved.

Welcome message from author
This document is posted to help you gain knowledge. Please leave a comment to let me know what you think about it! Share it to your friends and learn new things together.
Transcript

Vol.:(0123456789)1 3
Climate Dynamics https://doi.org/10.1007/s00382-021-05975-7
Extreme storms in Southwest Asia (Northern Arabian Peninsula) under current and future climates
Alexandre Tuel1,3 · Yeon‑Woo Choi1 · Duaij AlRukaibi2 · Elfatih A. B. Eltahir1
Received: 20 February 2021 / Accepted: 18 September 2021 © The Author(s), under exclusive licence to Springer-Verlag GmbH Germany, part of Springer Nature 2021
AbstractPrecipitation extremes will generally intensify in response to a warming climate. This robust fingerprint of climate change is of particular concern, resulting in heavy rainfall and devastating floods. Often this intensification is explained as a con-sequence of the Clausius–Clapeyron law in a warmer world, under constant relative humidity. Here, based on an ensemble of CMIP5 global climate models and high-resolution regional climate simulations, we take the example of Southwest Asia, where extreme storms will intensify beyond the Clausius- Clapeyron scaling, and propose an additional novel mechanism for this region: the unique increase in atmospheric relative humidity over the Arabian Sea and associated deep northward penetration of moisture. This increase in humidity is dictated by changes in circulation over the Indian Ocean. Our proposed mechanism is consistent with the recent, most extreme storm ever observed in the region. Our findings advance a new understanding of natural climate variability in this region, with substantial implications for climate change adaptation of the region’s critical infrastructure.
Keywords Extreme storms · CMIP5 · Cut-off low · Super-Clausius–Clapeyron · Indian Ocean dipole · Southwest Asia
1 Introduction
The enhancement of precipitation extremes under climate change has received much attention in recent years as a robust fingerprint of a warming climate and because of its impacts on human societies (Trenberth 1999; Kharin et al. 2007; O’Gorman and Schneider 2009; O’Gorman 2015). Global climate models (GCMs) indeed project an intensi-fication of extreme precipitation events in the coming dec-ades, consistent with observed trends in the historical record (Min et al. 2011; Westra et al. 2013), although with signifi-cant regional differences. At first order, this intensification
can be understood as a thermodynamic response to increases in water vapor saturation pressure with temperature follow-ing the Clausius–Clapeyron relationship (Trenberth 1999; Allen and Ingram 2002). A dynamical contribution from large-scale change in vertical velocity (Trenberth 1998; Pfahl et al. 2017) has also been found to contribute to this enhancement and may explain why precipitation extremes are more sensitive to climate warming in the tropics than in the extratropics (O’Gorman 2015). Local increases in ascent associated with increased latent heating may also play an important role at the regional scale and explain why some events exhibit super-Clausius–Clapeyron scaling (Nie et al. 2018). Other factors like changes in the temperature lapse-rate and in the vertical structure of moisture and diabatic heating are also believed to modulate trends in extreme pre-cipitation (O’Gorman and Schneider 2009; Sugiyama et al. 2010).
Still, one aspect of precipitation extremes that has attracted little interest is the potential role of increases in relative humidity (RH) in certain regions of the world. Gen-erally, lower-tropospheric RH is expected to remain con-stant, or decline (Sherwood and Meyer 2006), particularly over the subtropics and mid-latitudes (Sherwood et al. 2010). Robust increases are however projected in the equatorial
Alexandre Tuel and Yeon-Woo Choi contributed equally to this work.
* Alexandre Tuel [email protected]
1 Ralph M. Parsons Laboratory, Massachusetts Institute of Technology, Cambridge, USA
2 Department of Civil Engineering, University of Kuwait, Kuwait City, Kuwait
3 Institute of Geography, Oeschger Centre for Climate Change Research, University of Bern, Bern, Switzerland
Content courtesy of Springer Nature, terms of use apply. Rights reserved.
A. Tuel et al.
1 3
mid-troposphere, connected to changes in the Hadley cir-culation (Lau and Kim 2015). While predicted RH trends are generally small (Sherwood et al. 2010), they can be very important for precipitation extremes due to positive feedbacks like latent heating (Nie et al. 2018, 2020). Most analyses have focused on zonal-mean trends, however, and to our knowledge no study has looked at possible regional RH increases outside the tropics and their link to super-Clau-sius–Clapeyron changes in extreme precipitation.
Southwest Asia, in particular, is one of the few areas outside the tropics where robust increases in RH and in extreme precipitation (Kharin et al. 2007; Pfahl et al. 2017) are projected by GCMs. The increase is concentrated over
the Arabian Sea, and extends to the neighboring coastlines, but the sea in this region is a major source of moisture for storm events over much of Southwest Asia (Kumar et al. 2015; De Vries et al. 2018; Tabari and Willems 2018). In addition, Southwest Asia includes vast desert areas, espe-cially vulnerable to extreme rainfall due to their lack of veg-etation cover and generally poor drainage systems. Among these, the Northern Arabia Peninsula (NAP; Fig. 1a) stands out due to its higher rainfall maxima compared to sur-roundings (Almazroui et al. 2012; Fig. 1a, b). Indeed, while most of the Arabian Peninsula is characterized by severe dryness (Fig. 1a), with an average annual rainfall of less than 100 mm, the NAP features relatively wetter conditions
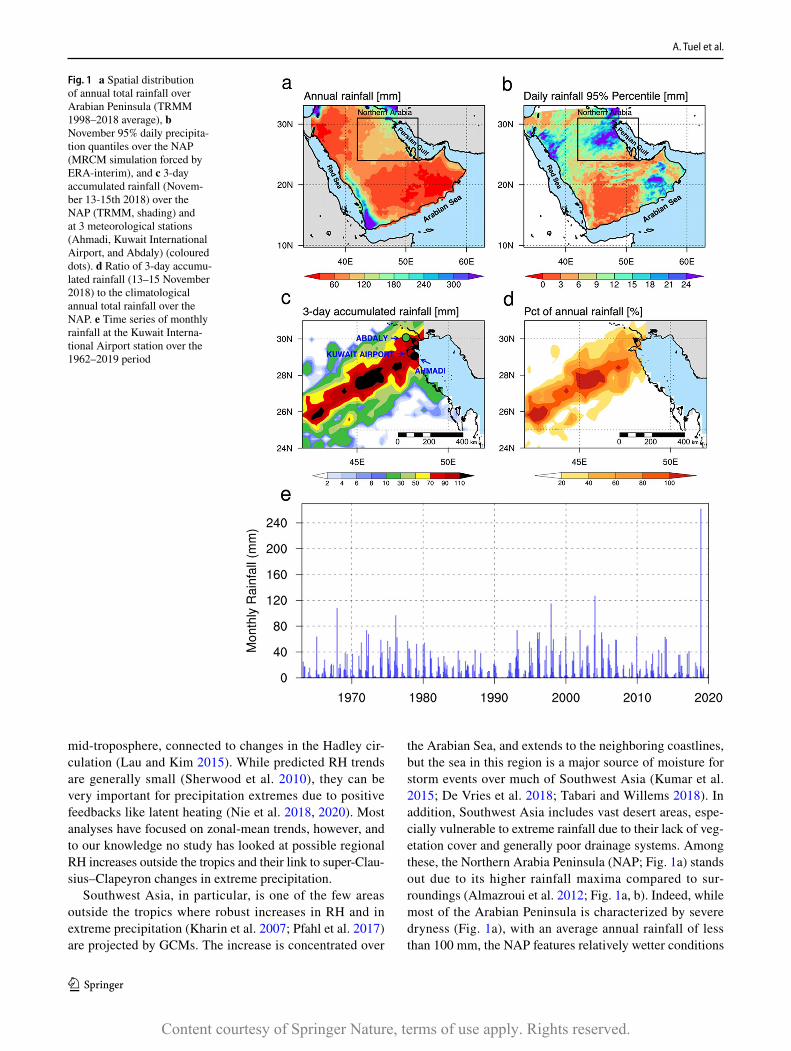
Fig. 1 a Spatial distribution of annual total rainfall over Arabian Peninsula (TRMM 1998–2018 average), b November 95% daily precipita-tion quantiles over the NAP (MRCM simulation forced by ERA-interim), and c 3-day accumulated rainfall (Novem-ber 13-15th 2018) over the NAP (TRMM, shading) and at 3 meteorological stations (Ahmadi, Kuwait International Airport, and Abdaly) (coloured dots). d Ratio of 3-day accumu-lated rainfall (13–15 November 2018) to the climatological annual total rainfall over the NAP. e Time series of monthly rainfall at the Kuwait Interna-tional Airport station over the 1962–2019 period
Content courtesy of Springer Nature, terms of use apply. Rights reserved.

Extreme storms in Southwest Asia (Northern Arabian Peninsula) under current and future climates
1 3
(150 mm/year), mainly because of more intense rainfall extremes that generally occur in November and December, at the beginning of the rainy season (Fig. 1b; Marcella and Eltahir 2008; Al‐Nassar et al. 2020; Atif et al. 2020). With its valuable infrastructure, including busy urban hubs and critical oil and gas extraction sites and pipelines (Salimi and Al-Ghamdi 2020), the NAP is already under substantial risk from extreme rainfall. This risk is likely to increase should rainfall extremes intensify in the future. Yet, because the Arabian Peninsula is also a transition region between the subtropics and mid-latitudes, one should see coarse-resolu-tion GCM projections of heavy precipitation with a critical eye. A detailed understanding of the mechanisms driving observed heavy precipitation events is necessary to make informed projections and risk assessments in the Arabian Peninsula for the upcoming century.
In this paper, we show how extreme storms and rain-fall over the Arabian Peninsula in late fall and early winter result from the rare combination of the passage of a mid-latitude perturbation and concurrent deep penetration of moisture from the Arabian Sea. Rainfall intensity evolves non-linearly with the intensity of the perturbation and the amount of lower-tropospheric moisture. We further argue that enhanced relative humidity (RH) over the Arabian Sea in the future will cause extreme rainfall in the Arabian Pen-insula to intensify beyond the Clausius–Clapeyron scaling. We base our analysis on the physical understanding of a recently observed heavy storm in November 2018, and high-resolution regional climate simulations. These allow for a better representation of processes relevant to heavy rainfall compared to GCMs. The impact of higher RH is reinforced by the latent heat feedback, evidence for which is given in observations and regional simulations (Table 1). We also propose a novel explanation for the increase in Arabian Sea
RH, which we connect to SST trends and changes in circula-tion over the Indian Ocean.
2 Data and experimental design
2.1 Data
Gridded observed precipitation data is taken from the Tropi-cal Rainfall Measuring Mission (TRMM) 3B42 product (Huffman et al. 2007) with a daily temporal and 0.25° spatial resolution for the period 1998–2018, and available at http:// daac. gsfc. nasa. gov/. Daily rainfall data is also available at ten meteorological stations within Kuwait (Abdaly, Jal Ali-yah, Kuwait City, Managish, Mitribah, Salmy, Wafra, Salmi-yah, Kuwait International Airport, and Ahmadi; see Fig. 1c and Fig. S1). ERA-Interim reanalysis data were obtained from the European Centre for Medium-Range Weather Fore-casts (ECMWF), from their website at http:// www. ecmwf. int/ en/ resea rch/ clima te- reana lysis/ era- inter im (Uppala et al. 2008). We compute daily potential vorticity (PV) on pres-sure levels from ERA-Interim data following Holton (1992). Intrusions of high-PV stratospheric air are known to cause cyclonic circulation, affecting storm development (Hoskins and Berrisford 1988; Holton 1992). Previous studies have indeed linked high-PV intrusions over the Red Sea to rain-fall extremes over Arabia (Al‐Nassar et al. 2020; Kumar et al. 2015; De Vries et al. 2018). Accordingly, we compute a daily regional PV index for the month of November by averaging PV at 300 hPa over the Red Sea region (21°–35° N / 28.5°–47° E). We then define “storm events” as peri-ods when the PV index remains higher than 0.5 standard deviation above its mean (with standard deviation and mean calculated over the 1998–2018 period) for at least two con-secutive days. 38 events are thus identified (Table 2).
Table 1 Summary of the control and sensitivity experiment with varying levels of specific humidity (hus)
Integration period Boundary forcing Spin-up time
CTL 10/01/2018–11/30/2018 ERA-Interim hus 1 monthEXP120 10/01/2018–11/30/2018 1.2 × ERA-Interim hus 1 monthEXP110 10/01/2018–11/30/2018 1.1 × ERA-Interim hus 1 monthEXP90 10/01/2018–11/30/2018 0.9 × ERA-Interim hus 1 monthEXP80 10/01/2018–11/30/2018 0.8 × ERA-Interim hus 1 monthEXP70 10/01/2018–11/30/2018 0.7 × ERA-Interim hus 1 monthEXP60 10/01/2018–11/30/2018 0.6 × ERA-Interim hus 1 monthEXP50 10/01/2018–11/30/2018 0.5 × ERA-Interim hus 1 monthEXP50_RS 10/01/2018–11/30/2018 0.5 × ERA-Interim hus (above 20° north, including Red Sea and the
Persian Gulf)1 month
EXP50_AS 10/01/2018–11/30/2018 0.5 × ERA-Interim hus (below 20° north, including Arabian Sea) 1 monthEXP75 10/01–11/30 for the period 1982–
2018 (time slice simulation)0.75 × ERA-Interim hus 1 month every year
Content courtesy of Springer Nature, terms of use apply. Rights reserved.

A. Tuel et al.
1 3
For future climate projections, we use regional simula-tions (described in Sect. 2.2), as well as the output from 30 GCMs of the CMIP5 archive (Taylor et al. 2012), under the historical (1976–2005) and (2071–2100) RCP8.5 scenarios. The list of selected GCMs is given in Table 3. All GCM data are interpolated prior to analysis to a common 1.5° × 1.5° grid.
Finally, in the analysis of current sea-surface temperature (SST) variability and future trends over the Indian Ocean, we rely on the Indian Ocean Dipole (IOD) index, defined as the anomalous difference between western equatorial Indian Ocean (50°–70° E and 10° S–10° N) and south east-ern equatorial Indian Ocean SSTs (90°–110° E and 10° S–0° N) (Saji et al. 1999). The time series of the IOD index can be downloaded from https:// www. esrl. noaa. gov/ psd/ gcos_ wgsp/ Times eries/ DMI/.
2.2 Model description and experimental design
The MIT Regional Climate Model (MRCM) is based on the Abdus Salam International Centre for Theoretical Physics Regional Climate Model Version 3 (RegCM3; Pal et al. 2007), but with significant enhancements of
Table 2 Selected storm events defined based on PV index (see Sect. 2)
Event # Year Begin date Length (days)
1 1998 11-04 22 1998 11-10 23 2000 11-14 84 2000 11-29 25 2001 11-18 26 2002 11-17 47 2002 11-24 28 2002 11-29 29 2004 11-10 310 2004 11-19 211 2004 11-22 212 2005 11-15 213 2006 11-16 614 2006 11-23 615 2007 11-21 616 2008 11-01 617 2009 11-17 218 2009 11-26 319 2010 11-01 320 2010 11-07 821 2010 11-16 722 2011 11-04 323 2011 11-14 224 2011 11-19 425 2011 11-24 726 2012 11-07 827 2012 11-25 428 2013 11-01 229 2013 11-08 330 2013 11-16 531 2014 11-15 232 2014 11-21 833 2015 11-23 234 2016 11-23 635 2017 11-22 236 2018 11-02 937 2018 11-13 338 2018 11-23 3
Table 3 List of CMIP5 models used in this study
Resolution is in grid cells (latitude by longitude)
Name Resolution
Atmosphere Ocean
ACCESS1-0 144 × 192 300 × 360ACCESS1-3 144 × 192 300 × 360BCC-CSM1-1-m 160 × 320 232 × 360BNU-ESM 64 × 128 –CanESM2 64 × 128 192 × 256CCSM4 192 × 288 384 × 320CESM1-CAM5 192 × 288 384 × 320CMCC-CESM 48 × 96 149 × 182CMCC-CM 240 × 480 149 × 182CMCC-CMS 92 × 192 149 × 182CNRM-CM5 128 × 256 292 × 362CSIRO-Mk3-6–0 96 × 192 189 × 192FGOALS-gs 60 × 128 360 × 196GFDL-ESM2G 90 × 144 210 × 360GFDL-ESM2M 90 × 144 200 × 360GISS-E2-R 90 × 144 144 × 90GISS-ES-R-CC 90 × 144 144 × 90HadGEM2-AO 144 × 192 216 × 360HadGEM2-CC 144 × 192 216 × 360HadGEM2-ES 144 × 192 216 × 360INM-CM4 120 × 180 340 × 360IPSL-CM5A-LR 96 × 96 149 × 182IPSL-CM5A-MR 143 × 144 149 × 182MIROC-ESM 64 × 128 192 × 256MIROC-ESM-CHEM 64 × 128 192 × 256MPI-ESM-LR 96 × 192 220 × 256MPI-ESM-MR 96 × 192 404 × 802MRI-CGCM3 160 × 320 368 × 360NorESM1-M 96 × 144 384 × 320NorESM1-ME 96 × 144 384 × 320
Content courtesy of Springer Nature, terms of use apply. Rights reserved.
Extreme storms in Southwest Asia (Northern Arabian Peninsula) under current and future climates
1 3
model physics (Gianotti et al. 2012; Gianotti and Eltahir 2014a,b), and notably a coupling with the Integrated BIo-sphere Simulator land surface scheme (IBIS; Winter et al. 2009). MRCM has been rigorously tested against observa-tions, in its ability to simulate key observed climate fea-tures, across several regions [e.g., North America (Winter and Eltahir 2012), West Africa (Im and Eltahir 2018a), the Maritime Continent (Im and Eltahir 2018b) and Southwest Asia (Pal and Eltahir 2016)].
We use high-resolution regional projections conducted with MRCM by Pal and Eltahir (2016). They downscaled three carefully-selected CMIP5 GCMs (CCSM4, MPI-ESM-MR, and NorESM1-M) to a 25 km resolution over Southwest Asia (Fig. 1b), and produced three reference simulations for the period 1976–2005 and three time-slice simulations under the business-as-usual anthropo-genic emissions scenario (i.e., RCP8.5) for the period 2071–2100. Their study demonstrated the performance of MRCM in simulating relative humidity over the Ara-bian Peninsula as well as surrounding coastal regions. A detailed description of the experimental design is given by Pal and Eltahir (2016).
To identify the sensitivity of NAP extreme rainfall to atmospheric moisture, we carry out a suite of numeri-cal simulations using MRCM. Our simulation domain, centered at 24° N and 47° E, covers Southwest Asia and consists of 144 × 130 grid cells with 18 vertical levels (Fig. 1b). The model configuration, including domain, spatiotemporal resolution, and physical parameterizations, is the same as in Pal and Eltahir (2016). Our sensitiv-ity experiments are driven at the boundaries by 6-hourly ERA-Interim (1.5° × 1.5°) and weekly NOAA OISST v2 (1° × 1°, Reynolds et al. 2007), with certain modifications described below. First, we carry out a suite of simulations for the month of November 2018 which include a control run (CTL, forced by unchanged ERA-Interim data) and seven sensitivity experiments (EXP50, EXP60, EXP70, EXP80, EXP90, EXP110, and EXP120) in which specific humidity at the boundaries is modified with respect to the CLT run. “EXPNN” indicates that specific humidity was set to NN% of its original value. A one-month spin-up time is used in each case. Second, we run similar experi-ments for all November months over 1982–2018, includ-ing a control run and a run in which specific humidity is decreased by 25% (EXP75). Third, to distinguish the role of moisture advection from the surrounding water bodies (the Red Sea and the Arabian Sea) in shaping the mag-nitude of the November 2018 extreme rainfall event in the NAP, we conduct two more idealized model experi-ments where specific humidity is set to 50% of its origi-nal value for the regions above 20° north (including the Red Sea; EXP50_RS) and below 20° north (including the Arabian Sea; EXP50_AS) (see Supplementary Materials
for more details). We use a time-slice technique with each time slice starting on October 1st of each year, including a one-month spin-up time as well. The overall sensitivity experimental design is summarized in Table 1.
3 Results
3.1 November 2018 heavy rainfall event
Between November 13th and 15th 2018, the NAP expe-rienced an extreme storm, the largest on record, which brought in many places a year’s worth of rain in just a few days (Fig. 1c, d). Large population centers in Kuwait experienced severe flooding, forcing Kuwait City to shut down for three days as the country slowly recovered. The rainfall was very localized: the highest amounts were con-centrated along a narrow line extending southwest from Kuwait into central Saudi Arabia, with satellite-based TRMM data showing maximum three-day totals above 110 mm around 27° N/46° E (Fig. 1c). Station data also highlights the exceptional magnitude of this event: daily rainfall at Al Ahmadi, where Kuwait’s major refinery is located, topped 100 mm on November 14, 2018, while Kuwait International Airport saw a record 79 mm of rain that same day (Fig. 1c; Figs. S1 and S2). Total accumu-lated rain during November 2018 was more than twice as large as all previously recorded monthly totals at Kuwait International Airport in the last 58 years (Fig. 1e). Many other stations in Kuwait also experienced heavy rainfall at this time, with significant variability in space well-cap-tured by TRMM estimates (Fig. S1).
This heavy rainfall event over the NAP was preceded by well above-average atmospheric humidity in the lower troposphere for a whole week, and by anomalous south-erlies over most of the Arabian Peninsula that persisted for several days leading up to the event (Fig. 2a, b). The prevailing southerlies were directed against the mean north–south moisture gradient and consequently advected anomalously large amounts of moisture from the Arabian Sea towards the densely populated Persian Gulf coast. Substantial moisture advection from the Red Sea also occurred at the same time, but mostly towards the western parts of the Arabian Peninsula (Fig. 2a). It did not con-tribute much directly to moisture anomalies over the NAP (Fig. S3; see Supplementary Materials for more details). High-humidity conditions persisted for much of November 2018, making it the second most humid for the region in the 40-year ERA-Interim record (Fig. 2c), when precipita-tion was the largest recorded over that same period. In fact, inter-annual variability in November monthly precipitation over the NAP closely follows that in monthly-mean spe-cific humidity at 850 hPa (Fig. 2c).
Content courtesy of Springer Nature, terms of use apply. Rights reserved.

A. Tuel et al.
1 3
Low-level humidity leads to conditional instability of the lower troposphere, but for extreme rainfall to occur, a perturbation is required to lift the lower tropospheric lay-ers and to trigger condensation and precipitation (Fig. S4). For the November 2018 event, this perturbation was the result of a PV streamer that formed around November 10 over the Central Mediterranean and which evolved into a cut-off low as it reached the Red Sea (Fig. 3a–c; Fig. S4). As it advanced towards the NAP, it led to strong quasi-geostrophic lifting of the anomalously moist lower atmos-pheric layer on its downstream (eastern) side (Fig. 3f). This in turn resulted in extreme rainfall over the NAP.
3.2 Sensitivity of rainfall extremes to background moisture
For the November 2018 event, high humidity conditions preceded the PV intrusion by several days (Figs. 2, 3). They were caused by circulation anomalies to the south of the region, independent from the PV intrusion itself. Looking now at all high-PV intrusions that occurred in November between 1998 and 2018, we find that the magnitude of low-level specific humidity before the intrusion strongly
modulates the rainfall amount triggered by the perturba-tion (Fig. 4). High-PV intrusions that occurred at times of low 850 hPa humidity (< 5 g/kg) did not trigger particu-larly heavy rainfall over the NAP, in contrast to the ones that occurred against a background of high humidity levels (Fig. 4a). The remaining spread may be related to the mag-nitude and extent of the PV intrusion, which is also related to rainfall intensity (Fig. S5), or to the geographical charac-teristics of the moisture anomaly field. It is important to note that we refer here to humidity levels preceding the PV intru-sion, and therefore independent of the characteristics of the PV intrusion itself. MRCM shows reasonable performance in reproducing the main features (e.g., spatial pattern, rain-fall magnitude and PV field) of the November 2018 heavy rainfall event over the NAP (Figs. S6 and S7). Additionally, MRCM also correctly simulates mean rainfall over the NAP for all identified storm events as evidenced by an r2 value of 0.71 (p value < 0.01; Fig. S6c).
The results of sensitivity experiments confirm the sub-stantial nonlinear (exponential) sensitivity of NAP rainfall intensity to background humidity conditions (Fig. 4b, d). For the November 2018 event, reducing total column humidity by 50% brings total precipitation down by a factor of 3. The
Fig. 2 a Spatial distribution of specific humidity (shading) and hori-zontal wind anomalies (vectors) at 850 hPa (ERA-Interim, 1979–2018) on 14 November 2018. Anomalies are defined with respect to daily climatological-mean values (1979–2018). b Time series of the 7-day moving average of NAP specific humidity during November
2018. c Time series of November-mean NAP total rainfall (TRMM, 1998–2018, mm/day) and 850 hPa specific humidity (ERA-Interim, 1979–2018). The blue vertical bar in b highlights the period of intense rainfall (November 13-15th 2018)
Content courtesy of Springer Nature, terms of use apply. Rights reserved.

Extreme storms in Southwest Asia (Northern Arabian Peninsula) under current and future climates
1 3
rate of increase becomes clearly exponential when humid-ity increases beyond the CTL value. In parallel, vertical velocity over the NAP increases roughly exponentially with background humidity (Fig. 4c). This points to a latent heat feedback between low-level humidity and storm intensity. For the simulations that include all November storm events, a sharp decline of the likelihood of extreme rainfall with reduced humidity is evident, while more moderate rainfall intensities are less affected, consistent with the proposed nonlinear response (Fig. 4d).
3.3 Sources and variability of atmospheric moisture
At the scale of individual storm events, observational evi-dence suggests a significant nonlinear relationship between the average humidity in the week preceding a storm event and the total rainfall during that event (Fig. 4a). Abundant moisture over the NAP seems to significantly increase the likelihood of extreme rainfall, as was the case during the November 2018 event. At the interannual time scale, November mean rainfall and specific humidity are also sig-nificantly correlated (r = 0.82 over the 1998–2018 period).
The Indian Ocean is known to be a major source of mois-ture for Southwest Asia, and the NAP in particular (Kumar et al. 2015; De Vries et al. 2016). Water vapor transport
depends to a large extent on the distribution of winds, which over the Indian Ocean is largely influenced by the Indian Ocean Dipole (IOD). This basin-scale mode of variability consists of a sea-surface temperature (SST) dipole pattern along the equator (Saji et al. 1999). The Pearson correla-tion coefficient between monthly-mean 850 hPa atmospheric humidity over the NAP and concurrent IOD values indicates a strong connection between the two variables during the months of October and November (Fig. 5a). The positive IOD phase is indeed characterized by warmer than average SSTs over the western Indian Ocean and cooler than aver-age near Indonesia. This pattern triggers strong anomalous south-easterlies over Arabia along with anomalous subsid-ence motion (i.e., decreased rainfall) over the equatorial eastern Indian Ocean (Fig. 5b, c, e). Southeasterlies bring large amounts of moisture across the sharp gradient sepa-rating the warm ocean and the dry land (Fig. 5b, d), thus causing anomalously humid seasons during which bursts of extreme humidity are common over the Arabian Peninsula, reaching up to the NAP. If these coincide with a passing storm (i.e., high-PV intrusion), extreme rainfall is likely to occur. Later, during winter, the connection to the IOD is absent (Fig. 5a), and the lack of this moisture source makes rainfall extremes less frequent.
Fig. 3 Spatial distribution of potential vorticity at 300-hPa (ERA-Interim) on a November 10th, b 12th, and c 14th. Spatial distribu-tion of vertical velocity at 500-hPa (ERA-Interim) on d November
10th, e 12th, and f 14th. Black rectangles in a–f denote the region (21°-35°N/28.5°-47°E) used to define the potential vorticity index
Content courtesy of Springer Nature, terms of use apply. Rights reserved.

A. Tuel et al.
1 3
Average November-mean humidity over the NAP has significantly increased over the last few decades, along-side average rainfall (Fig. 2c) and IOD index (Fig. 6). One expects a steady NAP moistening from the shift of the IOD towards positive anomalies. The extremely humid 2018 episode was tied to the 5th largest November-mean IOD value on record. Still, monthly-mean humidity was compa-rable to 1997, when the IOD was twice as high. To account for the potential recent increase in humidity unrelated to IOD variability, we fit a simple regression of NAP-average November 850 hPa humidity against the IOD index using 1900–1930 November humidity values from the ERA-20C reanalysis (Poli et al. 2016), bias-corrected (at the daily time scale) with ERA-Interim over their overlapping period (1979–2010). 1979–2018 humidity is then predicted based on observed IOD index values during this period. Results suggests that only about half of the recent increase can be attributed to the upward IOD trend, with the remainder highly consistent with recent trends simulated by CMIP5 models under observed GHG forcing (Fig. 6).
3.4 Looking ahead: future heavy rainfall risk in the NAP
Future climate model projections exhibit further increases in specific humidity as the atmosphere warms (IPCC 2014), which may substantially impact heavy rainfall events over the NAP. To predict changes in future NAP rainfall extremes under climate change, we rely on regional climate simula-tions using MRCM under the Representative Concentration Pathways (RCP) 4.5 (RCP4.5), a mitigation scenario, and 8.5 (RCP8.5), a “business-as-usual” emissions scenario (Riahi et al. 2011). While the total number of wet days between October and December is projected to remain about constant by the end of this century, daily rainfall extremes, on the other hand, increase sharply in both October and November in RCP8.5 simulations (Fig. 7c, d), with the 100-year return level shifting from 45 to 65 mm, an almost 50% increase. Results in RCP4.5 are more mixed: while there appears to be a slight shift of the distribution of precipitation to larger values, changes are not significant (Fig. 7a, b). That is, moderate mitigation efforts to lower greenhouse gas emis-sions could reduce the risk of severe flood significantly. The clear relative enhancement of rainfall extremes in RCP8.5
Fig. 4 a Average 850 hPa NAP humidity in the week preceding a storm event (defined based on PV index, see Sect. 2.1) against total rainfall during that event. The red line indicates a best sec-ond-order polynomial fit, along with the corresponding r-square. MRCM-simulated NAP b 3-day accumulated rainfall (Novem-ber 13-15th 2018) and c daily vertical velocity (reversed sign) on November 14th 2018 for the various sensitivity experiments in which atmospheric humid-ity is modified relative to the control run (CTL, see Sect. 2.2). d Probability distribution of MRCM-simulated November daily rainfall over the NAP (1982–2018) derived from our long-term CTL and EXP75 simulations. All the values used in the figure are NAP area-averaged values (24°-31°N and 42°-52°E)
Content courtesy of Springer Nature, terms of use apply. Rights reserved.

Extreme storms in Southwest Asia (Northern Arabian Peninsula) under current and future climates
1 3
simulations is most pronounced during October, when heavy rainfall events are much rarer in the current climate than dur-ing November. This suggests that the future seasonality of heavy rainfall may extend to earlier in the year, along with the associated flood risk.
The projected changes in rainfall extremes appear particularly large, especially compared against the
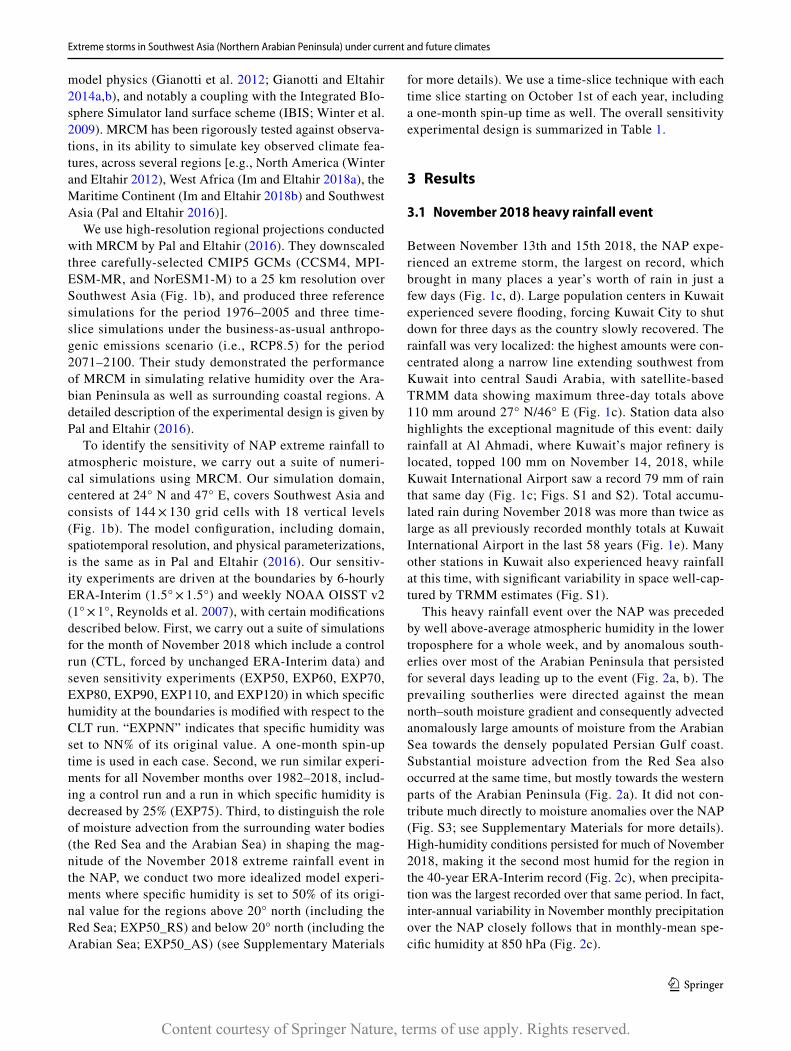
Clausius–Clapeyron scaling. Under constant relative humid-ity, one would expect from the 4 K warming projected by the average of RCP8.5 simulations a 33% rise in atmospheric moisture. This is roughly what we observe for the bottom half of the humidity distribution; however, above that the increase is much sharper, particularly for extreme values (Figs. 8a, 9a). To understand this trend, we consider regional
Fig. 5 a Monthly Pearson correlation coefficient of NAP-average precipitable water (from ERA-Interim) to concurrent IOD index (1979–2019), and 95% confidence intervals (gray shading). 5% and 1% signifi-cance levels are indicated by the bold gray dashed and dotted lines, respectively. Linear regression slopes of November b 850 hPa geopotential height and wind, c 700 hPa pressure–velocity, d 850 hPa specific humidity (normalised by its mean November value) and e precipitation (from GPCP), against concurrent IOD index values (1979–2019). Dots indi-cate 5% significance
Content courtesy of Springer Nature, terms of use apply. Rights reserved.

A. Tuel et al.
1 3
projections by 30 GCMs from the CMIP5 model archive. Extremely humid days over the NAP tend to be associated with south-easterly moisture advection from the Arabian Sea (Fig. 8b, c; for one specific example Fig. 2a), favored by the very sharp humidity gradient between the Arabian Penin-sula and the neighboring Indian Ocean (Figs. 8d, 9c). The Arabian Sea stands out in projections by a large expected increase in low-to mid-tropospheric relative humidity of up to 5%, in absolute magnitude, extending from the horn of Africa to north-western India, quite a unique feature outside the equatorial area (Figs. 8d, 9b). This increase is consist-ent with enhanced moisture convergence in the region, fol-lowing the development of a cyclonic anomaly over Yemen (Fig. 9c), also evident in a decline of SLP over the Arabian Peninsula (Fig. S8). The winds associated with this anoma-lous circulation blow, in part, along the steep humidity gra-dient stretching from Somalia to Pakistan, leading to large changes in the moisture flux and shifting the humidity gradi-ent northward. The development of the cyclonic anomaly, a robust feature of CMIP5 model projections, can be under-stood as the response to enhanced diabatic heating of the lower troposphere (Fig. S8-a), the consequence of a robust increase of precipitation just north of the equator (Fig. 9d,
Fig. S8; Gill 1980). The increase in precipitation in turn is linked to a well-documented amplified SST warming over the western Indian Ocean in response to greenhouse forc-ing (Cai et al. 2013; Zheng et al. 2013). The robust recent increase in western Indian Ocean SSTs (Roxy et al. 2014) may also have contributed to the shift toward more positive IOD values and the rapid rise in atmospheric humidity over the Arabian Sea (Figs. 2c, 6), consistently with our proposed mechanism.
4 Discussion
We find that two main independent phenomena are required to co-occur to cause an extreme rainfall event in the NAP: (1) high values of low-level humidity and (2) the passage of a mid-latitude storm, characterized by a high-PV intru-sion, over the NAP (Fig. 3, Figs. S4, S5; De Vries et al., 2018; Al‐Nassar et al. 2020). These conditions are rare and at times one may occur without the other, not leading to extreme storms (Fig. 4a and Fig. S5). This scenario appears typical of extreme rainfall events in the Arabian Peninsula, as previously shown on individual cases (Atif et al. 2020;
Fig. 6 a October IOD index, 1900–2018. The least-squares regression line (dashed) is shown for the 1979–2018 period. b 850 hPa Octo-ber specific humidity trends (1979–2018, ERA-Interim). c Same as b, but with effect of IOD removed. d Boxplot of 1979–2018 CMIP5 850 hPa specific humidity trends over the NAP (historical run until
2005 and RCP8.5 afterwards). The horizontal dashed blue (respec-tively red) line indicates the corresponding raw (respectively IOD-corrected) ERA-Interim value. Vertical confidence intervals are also shown to the right. e–h Same as a–d, but for November
Content courtesy of Springer Nature, terms of use apply. Rights reserved.

Extreme storms in Southwest Asia (Northern Arabian Peninsula) under current and future climates
1 3
Kumar et al. 2015; Almazroui et al. 2016; De Vries et al. 2018). Rainfall extremes over the NAP are thus common around November due to the particular dynamical and ther-modynamical conditions that prevail at that time of the year. First, storm events become more common over NAP as the mid-latitude jet intensifies and shifts southward as winter approaches (Marcella and Eltahir 2008). Regular high-PV intrusions over the Eastern Mediterranean, associated with small-scale blocking patterns in the jet stream, lead to storm development (Hoskins and Berrisford 1988; Holton 1992; see Sect. 2 for more details), typically linked to heavy rain-fall over the NAP (Al‐Nassar et al. 2020; Atif et al. 2020; Kumar et al. 2015; Almazroui et al. 2016; De Vries et al. 2018). Second, high humidity conditions are more frequent in Arabia in October and November through the IOD tel-econnection. Even if the Red Sea and Arabian Gulf are also important moisture sources for extreme rainfall events in the Arabian Peninsula (De Vries et al. 2013; Kumar and Ouarda 2014; Kumar et al. 2015; Sandeep and Ajaymohan 2018; Al‐Nassar et al. 2020), rainfall extremes in the NAP are dominantly associated with south-easterly moisture advec-tion from the Arabian Sea (Kumar et al. 2015; Al‐Nassar et al. 2020; Fig. S3; see Supplementary Materials for more details). The circulation anomalies triggered by the Indian
Ocean Dipole also strengthen moisture advection from the Arabian Gulf towards the NAP.
In future climate projections, while average humidity trends over the NAP remain close to the Clausius–Clap-eyron scaling, occasional south-easterlies will blow from a significantly more humid region over the Arabian Sea and consequently advect air towards the NAP with significantly more moisture than they do currently. This explains why northward penetration of moisture becomes more frequent and why humidity extremes tend to intensify relatively much more than the average, thus creating explosive conditions that can lead to rainfall more extreme than anything seen in recent history.
From the perspective of annual-mean rainfall, the NAP is projected to see little change (Fig. 10). A drying trend during spring will compensate for the enhanced rainfall of the autumn season, and the seasonality of rainfall will shift towards wetter conditions earlier in the season (Tabari and Willems 2018). However, the enhancement of relative humidity over Southern Arabia does lead to a substantial increase in wet day frequency and total rainfall over the south-eastern “empty corner” and southern coast of the Arabian Peninsula. Extremes there will remain much below
Fig. 7 a Historical (solid blue 1976–2005) and change (red) under RCP4.5 of NAP-average 95% daily precipitation quantiles from September to December. For comparison, the corresponding TRMM values (1998–2019) are shown by the blue dashed line. b Historical (blue, 1976–2005) and future (red, 2071–2100, RCP4.5) probability distribution of NAP daily precipitation on wet days across the MRCM ensemble. A 0.1 mm/day threshold is used to define wet days. c, d same as a, b, but for RCP8.5 scenario
Content courtesy of Springer Nature, terms of use apply. Rights reserved.

A. Tuel et al.
1 3
NAP levels, but annual-mean rainfall may increase locally by more than 100%.
The analysis of future storm activity in CMIP5 simula-tions appears to indicate a slight decrease in the frequency of high PV intrusions over the NAP (Fig. S9), consistent with a northward shift of the subtropical jet and the storm track, and with reduced blocking frequency over Europe and the Mediterranean identified at this time of the year (Yin 2005;
Seidel et al. 2008; Masato et al. 2013; Peleg et al. 2015). However, changes are overall not significant, in particular due to a rather large noise-to-signal ratio. Atmospheric tel-econnections associated with the El Niño Southern Oscilla-tion (ENSO) and the North Atlantic Oscillation (NAO) are also known to affect the position of the subtropical jet stream over the Arabian Peninsula (Sandeep and Ajaymohan 2018; Kumar et al. 2016; Kumar and Ouarda 2014). They may thus
Fig. 8 a MRCM 3-model relative change (2071–2100 with respect to 1976–2005) in October–November NAP daily 850 hPa specific humidity percentiles. Boxes indicate con-fidence interval for the median and whiskers show the inter-model range. The horizontal grey dashed line indicates the relative change expected from Clausius–Clapeyron scaling under constant relative humid-ity and a 4 K warming (33%). Average 850 hPa wind during days when NAP specific humid-ity is in its b first and c tenth decile. d CMIP5 multi-model mean change (2071–2100 minus 1976–2005) in October–November 700–850 hPa relative humidity under RCP8.5. Dots indicate 80% inter-model agree-ment on the sign of the change
Content courtesy of Springer Nature, terms of use apply. Rights reserved.
Extreme storms in Southwest Asia (Northern Arabian Peninsula) under current and future climates
1 3
modulate the frequency of high-PV intrusions in this region. Non-robust trends in these teleconnection indices add to the uncertainty in future storm frequency over the NAP.
Additionally, different storm activity metrics yield differ-ent results: changes in the frequency of blocking conditions over the region, based on daily geopotential fields, exhibit non-significant or even increasing trends from October to November. High PV events over the NAP typically occur once or twice every November (Table 2), and GCMs do not simulate their absolute frequency very well. The analysis of the downscaled MRCM experiments is also inconclusive on that aspect. A decline in the likelihood of such weather systems over the NAP would certainly compensate for part of the increase in the risk of heavy rainfall events; in any case, however, autumnal storms systems will most likely still occur in this region, and, due to enhanced atmospheric humidity, the magnitude of the associated rainfall extremes will increase.
Finally, while the three-model MRCM projections show little to no change in the frequency and magnitude of southerlies over the Arabian Peninsula (Fig. S10), there is
evidence, based on a more comprehensive analysis of the CMIP5 archive, that extreme IOD events will become much more frequent in the future (Cai et al. 2014), along with the moisture flux over Arabia in their positive phase. Our projec-tions might be therefore underestimating future risk of heavy rainfall over the NAP.
Our analysis of regional circulation and moisture trans-port projections relies on 30 CMIP5 GCMs, though only three of them (CCSM4, MPI-ESM-MR, and NorESM1-M) are downscaled at higher resolution with MRCM. Still, we find that the ensemble of the three carefully selected GCMs yields similar conclusions as those obtained from the full 30-GCM ensemble (Figs. S11 and S12). Some difference in spatial distribution and magnitude can be seen but they do not affect our conclusions.
The projected future of extreme storms over Arabia point to a significant hazard due to increasing intensity of what is currently regarded as extreme rainfall events. As discussed earlier, the NAP region is home to several countries (Kuwait, Eastern Saudi Arabia, Bahrain, and Qatar) where large investments were made during the
Fig. 9 a MRCM 3-model den-sity of NAP October–November daily 850 hPa humidity anoma-lies under historical (black, 1976–2005) and RCP8.5 (red, 2071–2100) scenarios. Anoma-lies are defined with respect to each model’s 1976–2005 mean. b–d October–November CMIP5 multi-model b change in 850–700 hPa relative humid-ity (shading) and moisture flux (arrows), c change in 850–700 hPa winds (arrows) and historical 850–700 hPa specific humidity (shading), and d change in precipitation. Changes are defined as the 2071–2100 average under the RCP8.5 scenario minus the historical 1976–2005 average. Dots in b and d indicate at least 80% inter-model agreement on the sign of the change
Content courtesy of Springer Nature, terms of use apply. Rights reserved.

A. Tuel et al.
1 3
last 50 years in infrastructure development. New infra-structure systems (buildings, highways, air and sea ports, pipelines, oil wells, and factories) were designed assum-ing characteristics of storms that were estimated based on observed records in the past. Just like many similar systems around the world, these infrastructure systems are vulnerable since historical rainfall extremes may not be representative of future climates. The combined haz-ard from the projected change in the climate of extreme rainfall events over Arabia, and the vulnerability of these critical infrastructures shape a significant risk to infra-structures in Arabia under climate change. One thing is clear from the November 2018 event: inter-annual cli-mate variability, even with the current level of humid-ity, is significant to bring about record-shattering rainfall and infrastructure is currently not designed to withstand such events. Significant efforts will be needed to revise
existing designs and to upgrade existing infrastructure in order for the region to adapt to future climate change.
5 Summary and conclusion
In this study, we analyzed the physical mechanisms behind extreme storms in the Arabian Peninsula, and dis-cussed how climate change may impact their magnitude and frequency. We found that record-shattering rainfall with potential for severe flooding occurring in the NAP is caused by the unique combination of two independent phe-nomena: passage of mid-latitude perturbations in the form of high-PV intrusions from the Eastern Mediterranean, and deep northward penetration of moist air from the tropi-cal Indian Ocean, modulated by the Indian Ocean Dipole. Observational evidence from the November 2018 extreme rainfall event and idealized sensitivity experiments using
Fig. 10 MRCM 3-model aver-age a historical (1976–2005) total annual rainfall and b change in annual rainfall under RCP8.5 (2071–2100 minus 1976–2005). c, d Same as a, b, but for annual number of wet days (≥ 0.5 mm). Dots indicate agreement on the sign of the change by the three models
Content courtesy of Springer Nature, terms of use apply. Rights reserved.
Extreme storms in Southwest Asia (Northern Arabian Peninsula) under current and future climates
1 3
MRCM indicate a substantial nonlinear response of NAP rainfall intensity to background humidity conditions. The most extreme rainfall occurs at times of abundant avail-able moisture in the lower troposphere. Future climate trends are assessed based on an ensemble of 30 CMIP5 GCMs under the RCP4.5 and RCP8.5 scenarios and three high-resolution regional simulations with MRCM, which is capable of reproducing extreme rainfall events over the NAP. Enhanced relative humidity over the Arabian Sea (i.e., quite a unique feature outside the equatorial region) induced by circulation forced by Indian Ocean SST trends will cause extreme precipitation in the NAP to intensify beyond the Clausius–Clapeyron scaling. Although we did not find a statistically significant change in the frequency of storms originating in the Mediterranean and pass-ing through the Arabian Peninsula, such storms are still expected to occur in the warmer climate, and will likely lead to more intense extreme rainfall. As exemplified by the recent November 2018 event, increased magnitude of rainfall extremes in the future climate will require urgent climate change adaptation strategies (i.e., infrastructure planning) in Southwest Asia.
Supplementary Information The online version contains supplemen-tary material available at https:// doi. org/ 10. 1007/ s00382- 021- 05975-7.
Acknowledgements Research performed under Research Collabo-ration Agreement between Kuwait University and Massachusetts Institute of Technology (MIT), and funded by Kuwait Foundation for the advancement of science under project code: P216-45EV01. We acknowledge the World Climate Research Programme’s Working Group on Coupled Modelling, which is responsible for CMIP, and we thank the climate modeling groups for producing and making available their model output.
References
Allen MR, Ingram WJ (2002) Constraints on future changes in climate and the hydrologic cycle. Nature 419(6903):224. https:// doi. org/ 10. 1038/ natur e01092
Almazroui M, Islam MN, Athar H, Jones PD, Rahman MA (2012) Recent climate change in the Arabian Peninsula: annual rainfall and temperature analysis of Saudi Arabia for 1978–2009. Int J Climatol 32:953–966
Almazroui M, Kamil S, Ammar K, Keay K, Alamoudi AO (2016) Climatology of the 500-hPa Mediterranean storms associated with Saudi Arabia wet season precipitation. Clim Dyn 47:3029–3042. https:// doi. org/ 10. 1007/ s00382- 016- 3011-0
Al-Nassar AR, Pelegrí JL, Sangrà P et al (2020) Cut-off low systems over Iraq: contribution to annual precipitation and synoptic analy-sis of extreme events. Int J Climatol 40(2):908–926. https:// doi. org/ 10. 1002/ joc. 6247
Atif RM, Almazroui M, Saeed S et al (2020) Extreme precipitation events over Saudi Arabia during the wet season and their associ-ated teleconnections. Atmos Res 231:104655. https:// doi. org/ 10. 1016/j. atmos res. 2019. 104655
Cai W, Zheng X-T, Weller E, Collins M, Cowan T, Lengaigne W, Yu W-D, Yamagata T (2013) Projected response of the Indian Ocean Dipole to greenhouse warming. Nat Geosci 6:999–1007
Cai W, Santoso A, Wang G, Weller E, Wu L, Ashok K et al (2014) Increased frequency of extreme Indian Ocean Dipole events due to greenhouse warming. Nature 510:254–258
De Vries AJ, Tyrlis E, Edry D, Krichak SO, Steil B, Lelieveld J (2013) Extreme precipitation events in the Middle East: dynamics of the active Red Sea trough. J Geophys Res Atmos 118:7087–7108
De Vries AJ, Feldstein SB, Riemer M et al (2016) Dynamics of tropi-cal–extratropical interactions and extreme precipitation events in Saudi Arabia in autumn, winter and spring. Q J R Meteorol Soc 142(697):1862–1880
De Vries AJ, Ouwersloot HG, Feldstein SB et al (2018) identification of tropical-extratropical interactions and extreme precipitation events in the Middle East based on potential vorticity and mois-ture transport. J Geophys Res Atmos 123(2):861–881. https:// doi. org/ 10. 1002/ 2017J D0275 87
Gianotti RL, Eltahir EAB (2014a) Regional climate modeling over the Maritime Continent. Part I: New parameterization for convective cloud fraction. J Clim 27:1488–1503
Gianotti RL, Eltahir EAB (2014b) Regional climate modeling over the Maritime Continent. Part II: New parameterization for autocon-version of convective rainfall. J Clim 27:1504–1523
Gianotti RL, Zhang DF, Eltahir EAB (2012) Assessment of the regional climate model version 3 over the maritime continent using differ-ent cumulus parameterization and land surface schemes. J Clim 25:638–656. https:// doi. org/ 10. 1175/ jcli-d- 11- 00025.1
Gill AE (1980) Some simple solutions for heat-induced tropical circu-lation. Q J R Meteor Soc 106:447–462
Holton JR (1992) An introduction to dynamic meteorology, 3rd edn. Academic Press, San Diego
Hoskins B, Berrisford P (1988) A potential vorticity perspective of the storm of 15–16 October 1987. Weather 43(3):122–129
Huffman G et al (2007) The TRMM multisatellite precipitation analysis (TMPA): quasi-global, multiyear, combined-sensor precipitation estimates at fine scales. J Hydrometeorol 8(1):38–55. https:// doi. org/ 10. 1175/ JHM560.1
Im ES, Eltahir EAB (2018a) Simulations of the observed ‘jump’ in the West African monsoon and its underlying dynamics using the MIT regional climate model. Int J Climatol 38:841–852. https:// doi. org/ 10. 1002/ joc. 5214
Im ES, Eltahir EAB (2018b) Simulation of the diurnal variation of rainfall over the western Maritime Continent using a regional climate model. Clim Dyn 51:73–88. https:// doi. org/ 10. 1007/ s00382- 017- 3907-3
IPCC (2014) Climate change 2013: the physical science basis. In: Stocker TF, Qin D, Plattner G-K, Tignor M, Allen SK, Boschung J, Nauels A, Xia Y, Bex V, Midgley PM (eds) Contribution of working group I to the fifth assessment report of the intergov-ernmental panel on climate change. Cambridge University Press, Cambridge
Kharin VV, Zwiers FW, Zhang X, Hegerl GC (2007) Changes in tem-perature and precipitation extremes in the IPCC ensemble of global coupled model simulations. J Clim 20:1419–1444
Kumar KN, Ouarda TBMJ (2014) Precipitation variability over UAE and global SST teleconnections. J Geophys Res Atmos 119:10313–10322. https:// doi. org/ 10. 1002/ 2014J D0217 24
Kumar KN, Entekhabi D, Molini A (2015) Hydrological extremes in hyperarid regions: a diagnostic characterization of intense precipi-tation over the Central Arabian Peninsula. J Geophys Res Atmos 120:1637–1650. https:// doi. org/ 10. 1002/ 2014J D0223 41
Kumar KN, Ouarda TBMJ, Sandeep S, Ajayamohan RS (2016) Win-tertime precipitation variability over the Arabian Peninsula and
Content courtesy of Springer Nature, terms of use apply. Rights reserved.

A. Tuel et al.
1 3
its relationship with ENSO in the CAM4 simulations. Clim Dyn 47:1–12
Lau WK, Kim KM (2015) Robust Hadley circulation changes and increasing global dryness due to CO2 warming from CMIP5 model projections. Proc Natl Acad Sci 112(12):3630–3635
Marcella MP, Eltahir EAB (2008) The hydroclimatology of Kuwait: Explaining the variability of rainfall at seasonal and interannual time scales. J Hydrometeorol 9:1095–1105. https:// doi. org/ 10. 1175/ 2008J HM952.1
Masato G, Hoskins BJ, Woollings T (2013) Winter and summer North-ern hemisphere blocking in CMIP5 models. J Clim 26:7044–7059. https:// doi. org/ 10. 1175/ JCLI-D- 12- 00466.1
Min SK, Zhang X, Zwiers FW, Hegerl GC (2011) Human contribu-tion to more-intense precipitation extremes. Nature 470:378–381
Nie J, Sobel AH, Shaevitz DA, Wang S (2018) Dynamic amplifica-tion of extreme precipitation sensitivity. Proc Natl Acad Sci USA 115(38):9467–9472. https:// doi. org/ 10. 1073/ pnas. 18003 57115
Nie J, Dai P, Sobel AH (2020) Dry and moist dynamics shape regional patterns of extreme precipitation sensitivity. Proc Natl Acad Sci 117(16):8757–8763
O’Gorman PA (2015) Precipitation extremes under climate change. Curr Clim Change Rep 1:49–59
O’Gorman PA, Schneider T (2009) The physical basis for increases in precipitation extremes in simulations of 21st-century climate change. Proc Natl Acad Sci 106:14773–14777
Pal JS, Eltahir EAB (2016) Future temperature in southwest Asia pro-jected to exceed a threshold for human adaptability. Nat Clim Change 6:197–200
Pal JS, Giorgi F, Bi X et al (2007) Regional climate modeling for the developing world: the ICTP RegCM3 and RegCNET. Bull Am Meteorol Soc 88(9):1395–1409
Peleg N, Bartov M, Morin E (2015) CMIP5-predicted climate shifts over the East Mediterranean: implications for the transition region between Mediterranean and semi-arid climates. Int J Climatol 35(8):2144–2153
Pfahl S, O’Gorman PA, Fischer EM (2017) Understanding the regional pattern of projected future changes in extreme precipitation. Nat Clim Change 7:423–427. https:// doi. org/ 10. 1038/ nclim ate32 87
Poli P, Hersbach H, Dee DP, Berrisford P, Simmons AJ, Vitart F, Laloyaux P, Tan DG, Peubey C, Thépaut JN, Trémolet Y (2016) ERA-20C: an atmospheric reanalysis of the twentieth century. J Clim 29(11):4083–4097
Reynolds RW, Smith TM, Liu C, Chelton DB, Casey KS, Schlax MG (2007) Daily high-resolution-blended analyses for sea surface temperature. J Clim 20:5473–5496
Riahi K, Rao S, Krey V, Cho C, Chirkov V, Fischer G, Rafaj P (2011) RCP 8.5—a scenario of comparatively high greenhouse gas emissions. Clim Change 109(1–2):33. https:// doi. org/ 10. 1007/ s10584- 011- 0149-y
Roxy MK, Ritika K, Terray P, Masson S (2014) The curious case of Indian Ocean warming. J Clim 27(22):8501–8509. https:// doi. org/ 10. 1175/ JCLI-D- 14- 00471.1
Saji NH, Goswami BN, Vinayachandran PN, Yamagata T (1999) A dipole mode in the tropical Indian Ocean. Nature 401:360–363
Salimi M, Al-Ghamdi SG (2020) Climate change impacts on critical urban infrastructure and urban resiliency strategies for the Middle East. Sustain Cities Soc 54:101948
Sandeep S, Ajayamohan RS (2018) Modulation of winter precipitation dynamics over the Arabian Gulf by ENSO. J Geophys Res Atmos 123(1):198–210
Seidel DJ, Fu Q, Randel WJ, Reichler TJ (2008) Widening of the tropi-cal belt in a changing climate. Nat Geosci 1(1):21–24
Sherwood SC, Meyer CL (2006) The general circulation and robust relative humidity. J Clim 19:6278–6290
Sherwood SC, Ingram W, Tsushima Y, Satoh M, Roberts M, Vidale PL, O’Gorman PA (2010) Relative humidity changes in a warmer climate. J Geophys Res Atmos. https:// doi. org/ 10. 1029/ 2009J D0125 85
Sugiyama M, Shiogama H, Emori S (2010) Precipitation extreme changes exceeding moisture content increases in MIROC and IPCC climate models. Proc Natl Acad Sci USA 107:571–575. https:// doi. org/ 10. 1073/ pnas. 09031 86107
Tabari H, Willems P (2018) Seasonally varying footprint of climate change on precipitation in the Middle East. Sci Rep 8:4435. https:// doi. org/ 10. 1038/ s41598- 018- 22795-8
Taylor KE, Stouffer RJ, Meehl GA (2012) An overview of CMIP5 and the experimental design. Bull Am Meteorol Soc 93:485–498. https:// doi. org/ 10. 1175/ BAMS-D- 00094.1
Trenberth KE (1998) Atmospheric moisture residence times and cycling: Implications for rainfall rates with climate change. Clim Change 39:667–694
Trenberth KE (1999) Conceptual framework for changes of extremes of the hydrological cycle with climate change. Clim Change 42:327–339
Uppala S, Dee D, Kobayashi S, Berrisford P, Simmons A (2008) Towards a climate data assimilation system: status update of ERA-Interim. ECMWF Newslett 115:12–18
Westra S, Alexander LV, Zwiers FW (2013) Global increasing trends in annual maximum daily precipitation. J Clim 26(11):3904–3918
Winter JM, Eltahir EAB (2012) Modeling the hydroclimatology of the midwestern United States. Part 2: Future climate. Clim Dyn 38:573–593. https:// doi. org/ 10. 1007/ s00382- 011- 1183-1
Winter JM, Pal JS, Eltahir EAB (2009) Coupling of integrated bio-sphere simulator to regional climate model version 3. J Clim 22:2743–2756
Yin JH (2005) A consistent poleward shift of the storm tracks in simu-lations of 21st century climate. Geophys Res Lett 32:L18701. https:// doi. org/ 10. 1029/ 2005G L0236 84
Zheng X-T, Xie S-P, Du Y, Liu L, Huang G, Liu Q-Y (2013) Indian Ocean Dipole response to global warming in the CMIP5 multi-model ensemble. J Clim 26:6067–6080
Publisher's Note Springer Nature remains neutral with regard to jurisdictional claims in published maps and institutional affiliations.
Content courtesy of Springer Nature, terms of use apply. Rights reserved.

1.
2.
3.
4.
5.
6.
Terms and Conditions Springer Nature journal content, brought to you courtesy of Springer Nature Customer Service Center GmbH (“Springer Nature”). Springer Nature supports a reasonable amount of sharing of research papers by authors, subscribers and authorised users (“Users”), for small-scale personal, non-commercial use provided that all copyright, trade and service marks and other proprietary notices are maintained. Byaccessing, sharing, receiving or otherwise using the Springer Nature journal content you agree to these terms of use (“Terms”). For thesepurposes, Springer Nature considers academic use (by researchers and students) to be non-commercial. These Terms are supplementary and will apply in addition to any applicable website terms and conditions, a relevant site licence or a personalsubscription. These Terms will prevail over any conflict or ambiguity with regards to the relevant terms, a site licence or a personal subscription(to the extent of the conflict or ambiguity only). For Creative Commons-licensed articles, the terms of the Creative Commons license used willapply. We collect and use personal data to provide access to the Springer Nature journal content. We may also use these personal data internally withinResearchGate and Springer Nature and as agreed share it, in an anonymised way, for purposes of tracking, analysis and reporting. We will nototherwise disclose your personal data outside the ResearchGate or the Springer Nature group of companies unless we have your permission asdetailed in the Privacy Policy. While Users may use the Springer Nature journal content for small scale, personal non-commercial use, it is important to note that Users maynot:
use such content for the purpose of providing other users with access on a regular or large scale basis or as a means to circumvent access
control;
use such content where to do so would be considered a criminal or statutory offence in any jurisdiction, or gives rise to civil liability, or is
otherwise unlawful;
falsely or misleadingly imply or suggest endorsement, approval , sponsorship, or association unless explicitly agreed to by Springer Nature in
writing;
use bots or other automated methods to access the content or redirect messages
override any security feature or exclusionary protocol; or
share the content in order to create substitute for Springer Nature products or services or a systematic database of Springer Nature journal
content. In line with the restriction against commercial use, Springer Nature does not permit the creation of a product or service that creates revenue,royalties, rent or income from our content or its inclusion as part of a paid for service or for other commercial gain. Springer Nature journalcontent cannot be used for inter-library loans and librarians may not upload Springer Nature journal content on a large scale into their, or anyother, institutional repository. These terms of use are reviewed regularly and may be amended at any time. Springer Nature is not obligated to publish any information orcontent on this website and may remove it or features or functionality at our sole discretion, at any time with or without notice. Springer Naturemay revoke this licence to you at any time and remove access to any copies of the Springer Nature journal content which have been saved. To the fullest extent permitted by law, Springer Nature makes no warranties, representations or guarantees to Users, either express or impliedwith respect to the Springer nature journal content and all parties disclaim and waive any implied warranties or warranties imposed by law,including merchantability or fitness for any particular purpose. Please note that these rights do not automatically extend to content, data or other material published by Springer Nature that may be licensedfrom third parties. If you would like to use or distribute our Springer Nature journal content to a wider audience or on a regular basis or in any other manner notexpressly permitted by these Terms, please contact Springer Nature at
Related Documents