Open Journal of Modern Hydrology, 2014, 4, 10-26 Published Online January 2014 (http://www.scirp.org/journal/ojmh ) http://dx.doi.org/10.4236/ojmh.2014.41002 Extreme Rainfall Indices in the Hydrographic Basins of Brazil María C. Valverde 1 , José A. Marengo 2 1 Urban and Environmental Engineering, Federal University of ABC (UFABC), Santo André, Brazil; 2 Center for Earth System Science, National Institute for Space Research (INPE), São José dos Campos, Brazil. Email: [email protected] Received July 24 th , 2013; revised August 26 th , 2013; accepted September 2 nd , 2013 Copyright © 2014 María C. Valverde, José A. Marengo. This is an open access article distributed under the Creative Commons At- tribution License, which permits unrestricted use, distribution, and reproduction in any medium, provided the original work is prop- erly cited. In accordance of the Creative Commons Attribution License all Copyrights © 2014 are reserved for SCIRP and the owner of the intellectual property María C. Valverde, José A. Marengo. All Copyright © 2014 are guarded by law and by SCIRP as a guar- dian. ABSTRACT The authors analyze climate extremes indices (CEI) of rainfall over the largest basins of the Brazilian territory: Amazon (AMA), São Francisco (SF), Tocantins (TO) and Paraná (PAR) rivers. The CEI represent the frequency of heavy precipitation events (R30mm and R95p) and short duration extreme rainfall (RX5day and RX1day). Droughts (CDDd) are identified based on two indicators: The longest dry period (CDD) and the annual cycle. The results demonstrate that CDDd, RX1day and RX5day occurred with more frequency and intensity in SF basin during El Niño events. CDDd was of greater magnitude in the TO basin during La Niña events, while an increase of RX1day occurred in El Niño. The strong El Niño events (1983 and 1997) caused more intense and frequent RX1day and R30mm over the PAR basin. Amazon droughts occurred in two out of the six El Niño events. Moreover, the relationship between the positive (negative) sea superficial temperatures anomalies in North (South) Tropical Atlantic and drought in AMA basin was corroborated. A gradual warming of SST was observed at the start of 2003 until it achieved a maximum in 2005 associated with the southwestern Amazon drought. The second highest anomaly of SST was in 2010 linked with drought that was more spatially extensive than the 2005 drought. The spatial distribution of annual trends showed a significant increase of CDD in south- eastern AMA, Upper SF, northern PAR and throughout the TO basins. R20mm, RX1day and RX5day tend to increase significantly in southwestern (northeast) PAR (AMA) and northwestern TO basins. Comparisons be- tween CEI derived from daily precipitation data from Climate Prediction Center (CPCp) and of the ETA_HadCM3 model showed that the model overestimated RX1day, RX5day and CDD, in the four basins. Fu- ture scenarios show that dry periods will occur with greatest magnitude in all the basins until 2071-2099 time slice, while RX1day will be more intense in the TO and SF basins. KEYWORDS Climate Extreme Indices; Future Scenarios of Climate; Hydrological Basins of Brazil; ETA_HadCM3 Model 1. Introduction Brazil holds the largest hydrological basins of the planet; one of them is the Amazon basin (AMA), which repre- sents the 2.17% of the total fresh water of the planet. Other basins such as the San Francisco (SF), Tocantins (TO) and Paraná (PA) basins are no less important. They are the reservoirs that furnish and sustain the water and energy resources on Brazilian territory [1]. Rainfall is derived from atmosphere water. Its form and quantity is influenced by climatic factors such as wind, temperature, and atmospheric pressure. It is well known that rainfalls with large intensity, at short time intervals, cause large surface runoffs, even in unsaturated soils, and this could cause flooding, landslides and floods. This occurs because in these cases, the volume of water on the surface could exceed its own infiltration rate [2]. On the other hand, the lack of rainfall has caused great damages that have affected different economic sectors in OPEN ACCESS OJMH

Welcome message from author
This document is posted to help you gain knowledge. Please leave a comment to let me know what you think about it! Share it to your friends and learn new things together.
Transcript
Open Journal of Modern Hydrology, 2014, 4, 10-26 Published Online January 2014 (http://www.scirp.org/journal/ojmh) http://dx.doi.org/10.4236/ojmh.2014.41002
Extreme Rainfall Indices in the Hydrographic Basins of Brazil
María C. Valverde1, José A. Marengo2
1Urban and Environmental Engineering, Federal University of ABC (UFABC), Santo André, Brazil; 2Center for Earth System Science, National Institute for Space Research (INPE), São José dos Campos, Brazil. Email: [email protected] Received July 24th, 2013; revised August 26th, 2013; accepted September 2nd, 2013 Copyright © 2014 María C. Valverde, José A. Marengo. This is an open access article distributed under the Creative Commons At- tribution License, which permits unrestricted use, distribution, and reproduction in any medium, provided the original work is prop- erly cited. In accordance of the Creative Commons Attribution License all Copyrights © 2014 are reserved for SCIRP and the owner of the intellectual property María C. Valverde, José A. Marengo. All Copyright © 2014 are guarded by law and by SCIRP as a guar- dian.
ABSTRACT The authors analyze climate extremes indices (CEI) of rainfall over the largest basins of the Brazilian territory: Amazon (AMA), São Francisco (SF), Tocantins (TO) and Paraná (PAR) rivers. The CEI represent the frequency of heavy precipitation events (R30mm and R95p) and short duration extreme rainfall (RX5day and RX1day). Droughts (CDDd) are identified based on two indicators: The longest dry period (CDD) and the annual cycle. The results demonstrate that CDDd, RX1day and RX5day occurred with more frequency and intensity in SF basin during El Niño events. CDDd was of greater magnitude in the TO basin during La Niña events, while an increase of RX1day occurred in El Niño. The strong El Niño events (1983 and 1997) caused more intense and frequent RX1day and R30mm over the PAR basin. Amazon droughts occurred in two out of the six El Niño events. Moreover, the relationship between the positive (negative) sea superficial temperatures anomalies in North (South) Tropical Atlantic and drought in AMA basin was corroborated. A gradual warming of SST was observed at the start of 2003 until it achieved a maximum in 2005 associated with the southwestern Amazon drought. The second highest anomaly of SST was in 2010 linked with drought that was more spatially extensive than the 2005 drought. The spatial distribution of annual trends showed a significant increase of CDD in south-eastern AMA, Upper SF, northern PAR and throughout the TO basins. R20mm, RX1day and RX5day tend to increase significantly in southwestern (northeast) PAR (AMA) and northwestern TO basins. Comparisons be-tween CEI derived from daily precipitation data from Climate Prediction Center (CPCp) and of the ETA_HadCM3 model showed that the model overestimated RX1day, RX5day and CDD, in the four basins. Fu-ture scenarios show that dry periods will occur with greatest magnitude in all the basins until 2071-2099 time slice, while RX1day will be more intense in the TO and SF basins. KEYWORDS Climate Extreme Indices; Future Scenarios of Climate; Hydrological Basins of Brazil; ETA_HadCM3 Model
1. Introduction Brazil holds the largest hydrological basins of the planet; one of them is the Amazon basin (AMA), which repre- sents the 2.17% of the total fresh water of the planet. Other basins such as the San Francisco (SF), Tocantins (TO) and Paraná (PA) basins are no less important. They are the reservoirs that furnish and sustain the water and energy resources on Brazilian territory [1].
Rainfall is derived from atmosphere water. Its form
and quantity is influenced by climatic factors such as wind, temperature, and atmospheric pressure. It is well known that rainfalls with large intensity, at short time intervals, cause large surface runoffs, even in unsaturated soils, and this could cause flooding, landslides and floods. This occurs because in these cases, the volume of water on the surface could exceed its own infiltration rate [2].
On the other hand, the lack of rainfall has caused great damages that have affected different economic sectors in
OPEN ACCESS OJMH
Extreme Rainfall Indices in the Hydrographic Basins of Brazil 11
Brazil. Hydroelectric plants are affected with prolonged dry periods and have caused blackout crises. The ration- ing that occurred in Brazil during 2001-2002 that af- fected the supply and distribution of electricity was caused by lack of rainfall. A combination of increased energy demand and droughts caused a virtual breakdown of hydroelectric power supply in most of Brazil in 2001 and contributed to a reduction in gross domestic product (GDP). The crisis was the direct result of a sequence of a few drier than average years in a country with over 80% of hydroelectric generation capacity. Almost 90% of the energy in Brazil is produced in hydroelectric plants, which depend on adequate levels of water in their reser- voirs to generate power [3].
Extremes include heavy rainfall events and periods of droughts that may affect the availability and volume of water in the basin. The distribution of water resources is unequal in Brazil, because 68% of the Brazilian water is in the north region, where only 7% of the population lives. On the other hand, the Southeast (SE) and North-east (NE) regions of Brazil concentrate 43% and 29% of the population, respectively, but have only 7% (SE) and 3% (NE) of total water availability [4].
The purpose of this work is to describe spatial distri- bution of the rainfall extremes using climate extreme indices of four hydrographic basins: Amazon (only Bra- zilian side), São Francisco, Tocantins and Paraná. The four river basins under study are considered the major ones and cover more than 80% of the surface of the Bra- zilian territory. The study focuses on the Brazilian Ama- zon because limited rainfall data are available for the other Amazon countries.
The Amazon basin is the largest hydrographical basin in the world, with the largest extent of hot and humid forests of the globe. Of its total area, around 3.8 million square kilometers are in Brazil. The basin of Tocan- tins—Araguaia with an area of over 800,000 km2, con- stitutes the largest basin entirely within Brazilian territo- ry. The main affluent is the Tocantins River, whose source is located in Goias, north of the city of Brasilia. On the other hand, the basin of San Francisco occupies 8% of the country, and is considered the second largest basin located entirely within the national territory (Figure 1). Within the same are installed a series of hydroelectric dams and irrigation projects that sustain the energy and economy in the Northeast region of Brazil. The São Francisco River is also the main source to maintain the levels of water reservoirs in the Northeast region that may vary according to the proportion of rainfalls, evapo- ration and the increase or decrease of daily energy con- sumption. The Paraná Basin is essentially a plateau, tak- ing the first place in Brazil´s hydroelectric energy pro- duction. In the Paraná River are located the Ilha Solteira and Jupiá power plants (Urubupunga complex), Engen-
heiro Sérgio Motta (Porto Primavera) and Itaipu (Bra-zil-Paraguay binational power plant) [5].
The seasonal precipitation over the basins is mainly influenced by the positioning of the Inter-Tropical Con- vergence Zone (ITCZ), Upper tropospheric cyclonic vor- tices, cold fronts, and South Atlantic Convergence Zone (SACZ). In the climate scale, the variability of the ano- malies of SST in the Atlantic and Pacific, known as the Atlantic dipole and El Niño-Southern Oscillation affect the variability of precipitation over the basins, and in general all over the Brazilian territory [6,7].
Most of the studies made of the rainfall resource in the hydrographical basin focused on the trends for increase or decrease in rainfall, on an inter-annual and inter-de- cade scale, with more emphasis on the Amazon basin [8-11]. This work includes the analysis of the three other basins, and evaluates also the trend of short duration ex- treme rainfall events, as well as their frequency, besides establishing relationships with indices of atmospheric and oceanographic circulation.
2. Data and Methodology 2.1. Data Monthly precipitation data in grid point (0.25 × 0.25 km) were obtained from Brazilian Weather Forecast and Cli- mate Studies Center (CPTEC). Additionally, the gridded daily precipitation data were used, provided by the Cli- mate Prediction Center (CPCp) of the National Oceanic and Atmospheric Administration (NOAA) for the Bra- zilian territory. The spatial resolution of the data is 1˚ × 1˚, and its spatial domain covers an area of 80˚W - 30˚W, 40˚S - 10˚N. The data series starts on January 1, 1948 until December 31, 2005. The interpolation analysis scheme uses a modified Cressman scheme [12]. In this study, the 1979-2005 period was used, as in this period we had the greatest number of reporting stations over the western and central Amazon region of Brazil [13].
Daily precipitations records from the 29 rain gauge stations in the areas of the four basins (Figure 1(a)) were also used (Table 1). These data were obtained from The National Water Authority [Agencia Nacional de Aguas (ANA)], which are available for download from http://hidroweb.aneel.gov.br.
The ETA_HadCM3 regional climate model [14,15] outputs of precipitation every 6 hours, at 06, 12, 18 and 00 GTM were used. This model was originated from the ETA/CPTEC modified climate version to generate future projections, and regionalized with the global model HadCM3 Hadley Centre, UK. The ETA_HadCM3 model has a resolution of 0.40 × 0.40 lat/long, 38 vertical layers and the time step was 90 seconds. This study used the first member of ETA_HadCM3 model for the 1961_1990 control period and for the future projections of 2011 to 2100, under the SRES A1B greenhouse gas
OPEN ACCESS OJMH
Extreme Rainfall Indices in the Hydrographic Basins of Brazil 12
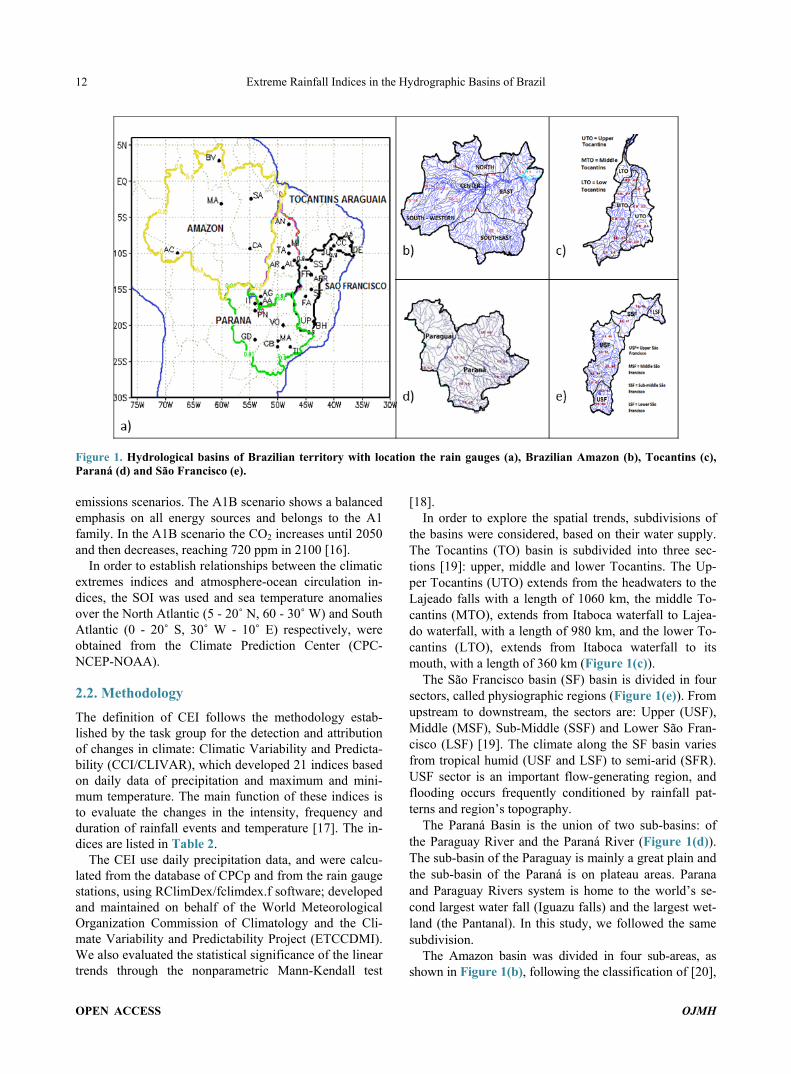
Figure 1. Hydrological basins of Brazilian territory with location the rain gauges (a), Brazilian Amazon (b), Tocantins (c), Paraná (d) and São Francisco (e). emissions scenarios. The A1B scenario shows a balanced emphasis on all energy sources and belongs to the A1 family. In the A1B scenario the CO2 increases until 2050 and then decreases, reaching 720 ppm in 2100 [16].
In order to establish relationships between the climatic extremes indices and atmosphere-ocean circulation in- dices, the SOI was used and sea temperature anomalies over the North Atlantic (5 - 20˚ N, 60 - 30˚ W) and South Atlantic (0 - 20˚ S, 30˚ W - 10˚ E) respectively, were obtained from the Climate Prediction Center (CPC- NCEP-NOAA).
2.2. Methodology The definition of CEI follows the methodology estab- lished by the task group for the detection and attribution of changes in climate: Climatic Variability and Predicta- bility (CCI/CLIVAR), which developed 21 indices based on daily data of precipitation and maximum and mini- mum temperature. The main function of these indices is to evaluate the changes in the intensity, frequency and duration of rainfall events and temperature [17]. The in- dices are listed in Table 2.
The CEI use daily precipitation data, and were calcu- lated from the database of CPCp and from the rain gauge stations, using RClimDex/fclimdex.f software; developed and maintained on behalf of the World Meteorological Organization Commission of Climatology and the Cli- mate Variability and Predictability Project (ETCCDMI). We also evaluated the statistical significance of the linear trends through the nonparametric Mann-Kendall test
[18]. In order to explore the spatial trends, subdivisions of
the basins were considered, based on their water supply. The Tocantins (TO) basin is subdivided into three sec- tions [19]: upper, middle and lower Tocantins. The Up- per Tocantins (UTO) extends from the headwaters to the Lajeado falls with a length of 1060 km, the middle To- cantins (MTO), extends from Itaboca waterfall to Lajea- do waterfall, with a length of 980 km, and the lower To- cantins (LTO), extends from Itaboca waterfall to its mouth, with a length of 360 km (Figure 1(c)).
The São Francisco basin (SF) basin is divided in four sectors, called physiographic regions (Figure 1(e)). From upstream to downstream, the sectors are: Upper (USF), Middle (MSF), Sub-Middle (SSF) and Lower São Fran- cisco (LSF) [19]. The climate along the SF basin varies from tropical humid (USF and LSF) to semi-arid (SFR). USF sector is an important flow-generating region, and flooding occurs frequently conditioned by rainfall pat- terns and region’s topography.
The Paraná Basin is the union of two sub-basins: of the Paraguay River and the Paraná River (Figure 1(d)). The sub-basin of the Paraguay is mainly a great plain and the sub-basin of the Paraná is on plateau areas. Parana and Paraguay Rivers system is home to the world’s se- cond largest water fall (Iguazu falls) and the largest wet- land (the Pantanal). In this study, we followed the same subdivision.
The Amazon basin was divided in four sub-areas, as shown in Figure 1(b), following the classification of [20],
OPEN ACCESS OJMH
Extreme Rainfall Indices in the Hydrographic Basins of Brazil 13
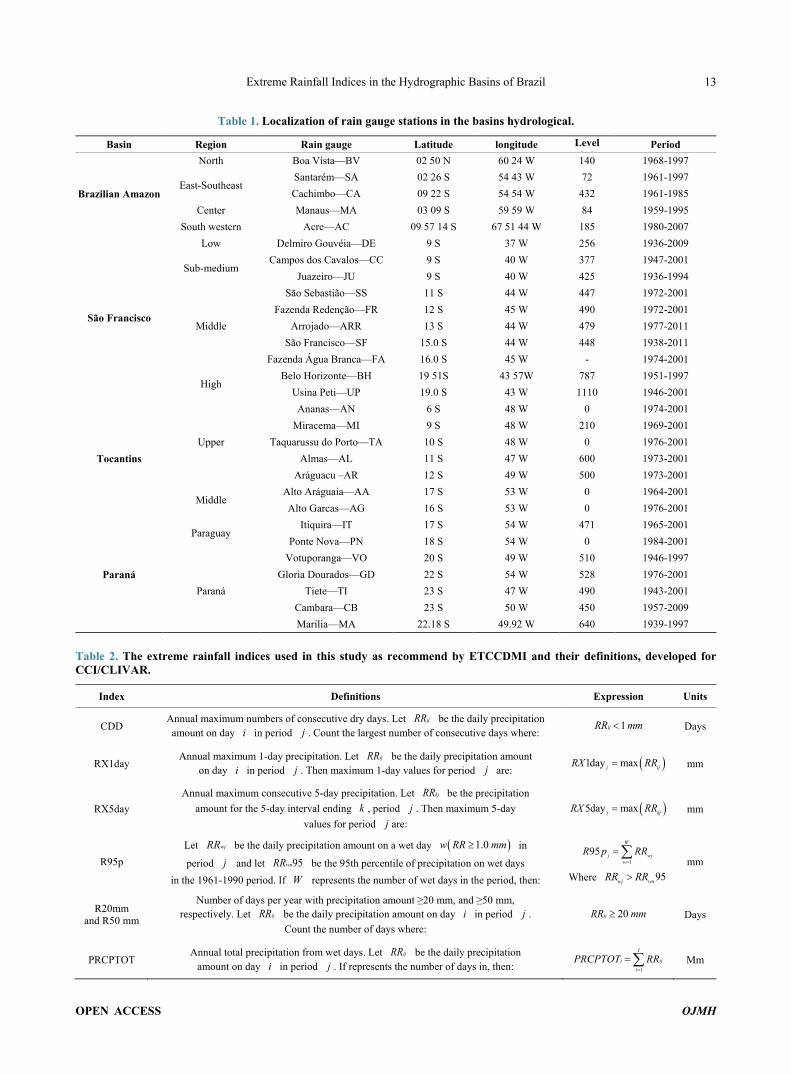
Table 1. Localization of rain gauge stations in the basins hydrological.
Basin Region Rain gauge Latitude longitude Level ( )
Period
Brazilian Amazon
North Boa Vista—BV 02 50 N 60 24 W 140 1968-1997
East-Southeast Santarém—SA 02 26 S 54 43 W 72 1961-1997 Cachimbo—CA 09 22 S 54 54 W 432 1961-1985
Center Manaus—MA 03 09 S 59 59 W 84 1959-1995 South western Acre—AC 09 57 14 S 67 51 44 W 185 1980-2007
São Francisco
Low Delmiro Gouvéia—DE 9 S 37 W 256 1936-2009
Sub-medium Campos dos Cavalos—CC 9 S 40 W 377 1947-2001
Juazeiro—JU 9 S 40 W 425 1936-1994
Middle
São Sebastião—SS 11 S 44 W 447 1972-2001 Fazenda Redenção—FR 12 S 45 W 490 1972-2001
Arrojado—ARR 13 S 44 W 479 1977-2011 São Francisco—SF 15.0 S 44 W 448 1938-2011
Fazenda Água Branca—FA 16.0 S 45 W - 1974-2001
High Belo Horizonte—BH 19 51S 43 57W 787 1951-1997
Usina Peti—UP 19.0 S 43 W 1110 1946-2001
Tocantins Upper
Ananas—AN 6 S 48 W 0 1974-2001 Miracema—MI 9 S 48 W 210 1969-2001
Taquarussu do Porto—TA 10 S 48 W 0 1976-2001 Almas—AL 11 S 47 W 600 1973-2001
Aráguacu –AR 12 S 49 W 500 1973-2001
Middle Alto Aráguaia—AA 17 S 53 W 0 1964-2001 Alto Garcas—AG 16 S 53 W 0 1976-2001
Paraná
Paraguay Itiquira—IT 17 S 54 W 471 1965-2001
Ponte Nova—PN 18 S 54 W 0 1984-2001
Paraná
Votuporanga—VO 20 S 49 W 510 1946-1997 Gloria Dourados—GD 22 S 54 W 528 1976-2001
Tiete—TI 23 S 47 W 490 1943-2001 Cambara—CB 23 S 50 W 450 1957-2009 Marília—MA 22.18 S 49.92 W 640 1939-1997
Table 2. The extreme rainfall indices used in this study as recommend by ETCCDMI and their definitions, developed for CCI/CLIVAR.
Index Definitions Expression Units
CDD Annual maximum numbers of consecutive dry days. Let ijRR be the daily precipitation amount on day i in period j . Count the largest number of consecutive days where:
1ijRR mm< Days
RX1day Annual maximum 1-day precipitation. Let ijRR be the daily precipitation amount
on day i in period j . Then maximum 1-day values for period j are: ( )1day maxj ijRX RR= mm
RX5day Annual maximum consecutive 5-day precipitation. Let kjRR be the precipitation
amount for the 5-day interval ending k , period j . Then maximum 5-day values for period j are:
( )5day maxj kjRX RR= mm
R95p Let wjRR be the daily precipitation amount on a wet day ( )1.0w RR mm≥ in
period j and let 95wnRR be the 95th percentile of precipitation on wet days in the 1961-1990 period. If W represents the number of wet days in the period, then:
1
95W
j wjw
R p RR=
= ∑
Where 95wj wnRR RR> mm
R20mm and R50 mm
Number of days per year with precipitation amount ≥20 mm, and ≥50 mm, respectively. Let ijRR be the daily precipitation amount on day i in period j .
Count the number of days where: 20ijRR mm≥ Days
PRCPTOT Annual total precipitation from wet days. Let ijRR be the daily precipitation
amount on day i in period j . If represents the number of days in, then: 1
I
j ij
i
PRCPTOT RR=
= ∑ Mm
OPEN ACCESS OJMH
Extreme Rainfall Indices in the Hydrographic Basins of Brazil 14
which through a hierarchical clustering method, found well-defined zones and homogeneous distribution of rainfall over the Amazon basin.
CPCp was compared with monthly observed precipita- tion data in grid point and differences were described in terms of error. To demonstrate the performance of the ETA_HadCM3 model and its ability to recognize the spatial and temporal pattern of rainfall, we used rain gauge data in grid point obtained by CPTEC. Simulation errors were described in terms of bias error.
Additionally, the CEI derived from the ETA_HadCM3 model were compared with indices derived from the CPCp (1979 to 1990) using box plot diagrams. Box plot provides information on position, dispersion, asymmetry, tails and outliers, therefore they are a great help to ana- lyze differences between several sets of data, in this case, between the ETA_HadCM3 and CPCp.
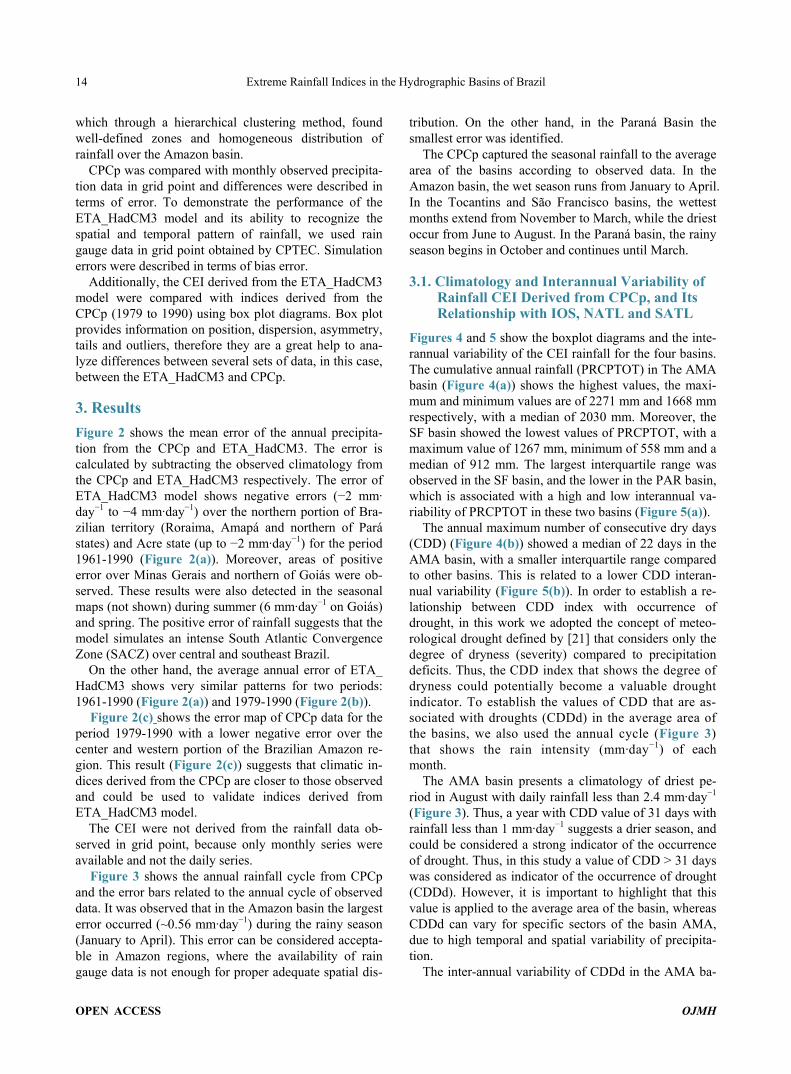
3. Results Figure 2 shows the mean error of the annual precipita- tion from the CPCp and ETA_HadCM3. The error is calculated by subtracting the observed climatology from the CPCp and ETA_HadCM3 respectively. The error of ETA_HadCM3 model shows negative errors (−2 mm∙ day−1 to −4 mm∙day−1) over the northern portion of Bra- zilian territory (Roraima, Amapá and northern of Pará states) and Acre state (up to −2 mm∙day−1) for the period 1961-1990 (Figure 2(a)). Moreover, areas of positive error over Minas Gerais and northern of Goiás were ob- served. These results were also detected in the seasonal maps (not shown) during summer (6 mm∙day−1 on Goiás) and spring. The positive error of rainfall suggests that the model simulates an intense South Atlantic Convergence Zone (SACZ) over central and southeast Brazil.
On the other hand, the average annual error of ETA_ HadCM3 shows very similar patterns for two periods: 1961-1990 (Figure 2(a)) and 1979-1990 (Figure 2(b)).
Figure 2(c) shows the error map of CPCp data for the period 1979-1990 with a lower negative error over the center and western portion of the Brazilian Amazon re- gion. This result (Figure 2(c)) suggests that climatic in- dices derived from the CPCp are closer to those observed and could be used to validate indices derived from ETA_HadCM3 model.
The CEI were not derived from the rainfall data ob- served in grid point, because only monthly series were available and not the daily series.
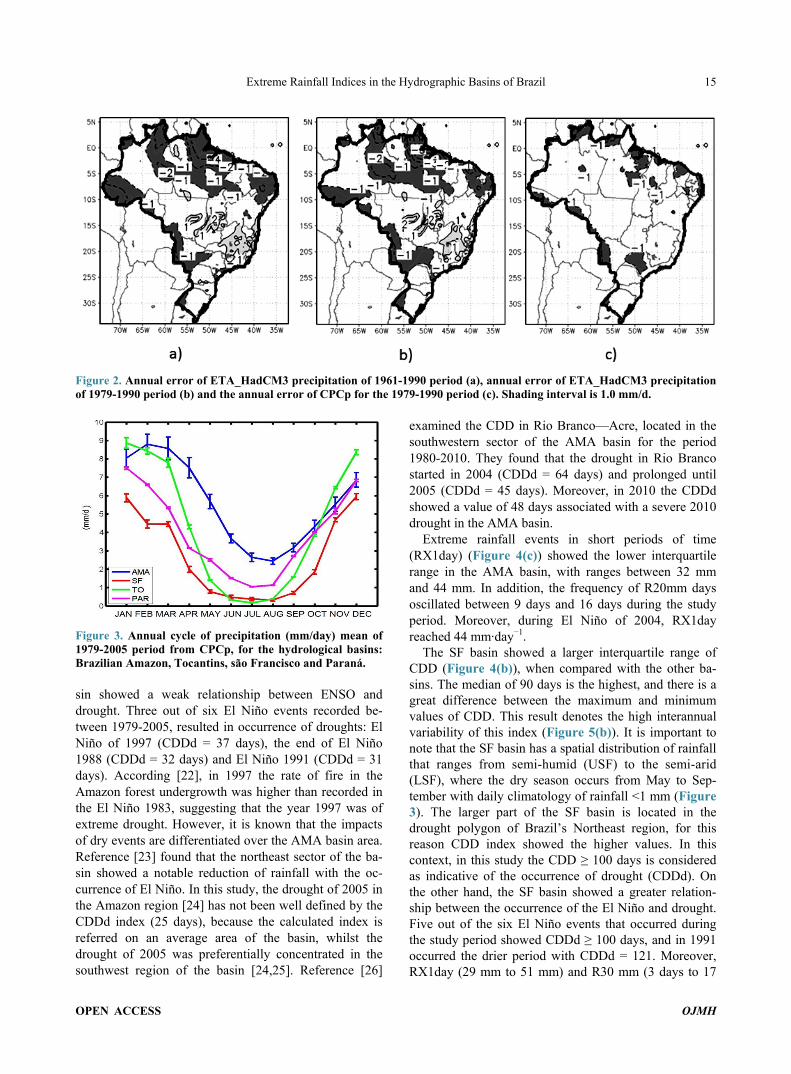
Figure 3 shows the annual rainfall cycle from CPCp and the error bars related to the annual cycle of observed data. It was observed that in the Amazon basin the largest error occurred (~0.56 mm∙day−1) during the rainy season (January to April). This error can be considered accepta- ble in Amazon regions, where the availability of rain gauge data is not enough for proper adequate spatial dis-
tribution. On the other hand, in the Paraná Basin the smallest error was identified.
The CPCp captured the seasonal rainfall to the average area of the basins according to observed data. In the Amazon basin, the wet season runs from January to April. In the Tocantins and São Francisco basins, the wettest months extend from November to March, while the driest occur from June to August. In the Paraná basin, the rainy season begins in October and continues until March.
3.1. Climatology and Interannual Variability of Rainfall CEI Derived from CPCp, and Its Relationship with IOS, NATL and SATL
Figures 4 and 5 show the boxplot diagrams and the inte- rannual variability of the CEI rainfall for the four basins. The cumulative annual rainfall (PRCPTOT) in The AMA basin (Figure 4(a)) shows the highest values, the maxi- mum and minimum values are of 2271 mm and 1668 mm respectively, with a median of 2030 mm. Moreover, the SF basin showed the lowest values of PRCPTOT, with a maximum value of 1267 mm, minimum of 558 mm and a median of 912 mm. The largest interquartile range was observed in the SF basin, and the lower in the PAR basin, which is associated with a high and low interannual va- riability of PRCPTOT in these two basins (Figure 5(a)).
The annual maximum number of consecutive dry days (CDD) (Figure 4(b)) showed a median of 22 days in the AMA basin, with a smaller interquartile range compared to other basins. This is related to a lower CDD interan- nual variability (Figure 5(b)). In order to establish a re- lationship between CDD index with occurrence of drought, in this work we adopted the concept of meteo- rological drought defined by [21] that considers only the degree of dryness (severity) compared to precipitation deficits. Thus, the CDD index that shows the degree of dryness could potentially become a valuable drought indicator. To establish the values of CDD that are as- sociated with droughts (CDDd) in the average area of the basins, we also used the annual cycle (Figure 3) that shows the rain intensity (mm∙day−1) of each month.
The AMA basin presents a climatology of driest pe- riod in August with daily rainfall less than 2.4 mm∙day−1 (Figure 3). Thus, a year with CDD value of 31 days with rainfall less than 1 mm∙day−1 suggests a drier season, and could be considered a strong indicator of the occurrence of drought. Thus, in this study a value of CDD > 31 days was considered as indicator of the occurrence of drought (CDDd). However, it is important to highlight that this value is applied to the average area of the basin, whereas CDDd can vary for specific sectors of the basin AMA, due to high temporal and spatial variability of precipita- tion.
The inter-annual variability of CDDd in the AMA ba-
OPEN ACCESS OJMH
Extreme Rainfall Indices in the Hydrographic Basins of Brazil 15
Figure 2. Annual error of ETA_HadCM3 precipitation of 1961-1990 period (a), annual error of ETA_HadCM3 precipitation of 1979-1990 period (b) and the annual error of CPCp for the 1979-1990 period (c). Shading interval is 1.0 mm/d.
Figure 3. Annual cycle of precipitation (mm/day) mean of 1979-2005 period from CPCp, for the hydrological basins: Brazilian Amazon, Tocantins, são Francisco and Paraná. sin showed a weak relationship between ENSO and drought. Three out of six El Niño events recorded be- tween 1979-2005, resulted in occurrence of droughts: El Niño of 1997 (CDDd = 37 days), the end of El Niño 1988 (CDDd = 32 days) and El Niño 1991 (CDDd = 31 days). According [22], in 1997 the rate of fire in the Amazon forest undergrowth was higher than recorded in the El Niño 1983, suggesting that the year 1997 was of extreme drought. However, it is known that the impacts of dry events are differentiated over the AMA basin area. Reference [23] found that the northeast sector of the ba- sin showed a notable reduction of rainfall with the oc- currence of El Niño. In this study, the drought of 2005 in the Amazon region [24] has not been well defined by the CDDd index (25 days), because the calculated index is referred on an average area of the basin, whilst the drought of 2005 was preferentially concentrated in the southwest region of the basin [24,25]. Reference [26]
examined the CDD in Rio Branco—Acre, located in the southwestern sector of the AMA basin for the period 1980-2010. They found that the drought in Rio Branco started in 2004 (CDDd = 64 days) and prolonged until 2005 (CDDd = 45 days). Moreover, in 2010 the CDDd showed a value of 48 days associated with a severe 2010 drought in the AMA basin.
Extreme rainfall events in short periods of time (RX1day) (Figure 4(c)) showed the lower interquartile range in the AMA basin, with ranges between 32 mm and 44 mm. In addition, the frequency of R20mm days oscillated between 9 days and 16 days during the study period. Moreover, during El Niño of 2004, RX1day reached 44 mm∙day−1.
The SF basin showed a larger interquartile range of CDD (Figure 4(b)), when compared with the other ba-sins. The median of 90 days is the highest, and there is a great difference between the maximum and minimum values of CDD. This result denotes the high interannual variability of this index (Figure 5(b)). It is important to note that the SF basin has a spatial distribution of rainfall that ranges from semi-humid (USF) to the semi-arid (LSF), where the dry season occurs from May to Sep- tember with daily climatology of rainfall <1 mm (Figure 3). The larger part of the SF basin is located in the drought polygon of Brazil’s Northeast region, for this reason CDD index showed the higher values. In this context, in this study the CDD ≥ 100 days is considered as indicative of the occurrence of drought (CDDd). On the other hand, the SF basin showed a greater relation- ship between the occurrence of the El Niño and drought. Five out of the six El Niño events that occurred during the study period showed CDDd ≥ 100 days, and in 1991 occurred the drier period with CDDd = 121. Moreover, RX1day (29 mm to 51 mm) and R30 mm (3 days to 17
OPEN ACCESS OJMH

Extreme Rainfall Indices in the Hydrographic Basins of Brazil 16
Figure 4. The box plots of the PRCPTOT (a), CDD (b), RX1day(c) and R20mm (d) indices for the 1979-2005 period and for the Amazon, Tocantins, São Francisco and Paraná basins. The box plot diagram shows the median, first and third quartile (25%-75%). The caps the end of the boxes show the extremes values, and * outliers.
Figure 5. Interannual variations of PRCPTOT (a), CDD (b), RX1day (c) and R30 mm (d) indices for the Amazon, Tocantins, São Francisco and Paraná basins. The bars are for SOI value for the period 1979-2005. The bars in (e) and (f) represent the SOI values (blue) and NATL and SATL (red) respectively for the period 1979-2010.
OPEN ACCESS OJMH
Extreme Rainfall Indices in the Hydrographic Basins of Brazil 17
days) showed the greatest variability, in SF basin (Fig- ures 4(c) and (d)).
On the other hand, the relationship between ENSO and RX1day and R30mm showed that the higher values (> 46 mm) occurred in years of the El Niño (1979, 1992, 1997, 2004 and 2005). These results show that intense dryness periods should not necessarily decrease the frequency or intensity of extreme rainfall events of short duration.
Reference [27] analyzed the flood events of 1943, 1946, 1949, 1979, 1983, 1992 and 2004, and highlighted the 2004 event as the most intense recorded so far. In this study, PRCPTOT, RX1day and R30 mm (Figures 5(a)- (d)), also captured these extreme years (1979, 1983, 1985, 1992 and 2004), being 1992 and 2004 the years that rec- orded the highest value of RX1day and the highest fre- quency of R30 mm. Reference [28] studied the heavy rainfall in January 2004 for the northeast region of Brazil (NEB), where the SF basin is located. The authors showed that in this month the northeast trade winds were more intense than the southeast trade winds, driving the Intertropical Convergence Zone (ITCZ) to reach the nor- thern sector of NEB. An anomalous transport of moisture coming from the Amazon and the Atlantic Ocean in the lower troposphere was also detected. This flow pattern intensified at lower levels the SACZ, enabling greater penetration of cold fronts coming from the south to re- main in the NEB.
In the TO basin, the amplitude between maximum and minimum CDD values (Figure 4(b)) also shows a high variability (Figure 5(b)). On the other hand, the dry sea- son from June to August (92 days) in TO basin showed daily rainfall less than 1 mm (Figure 3). Thus, years with the CDD values higher than 92 days were attributed as indicative of drought (CDDd). CDDd occurred in El Niño events (1986-1988 and 1990-1994) and La Niña (1995-1996 and 1998-2001) events, but in 1995 and 1999 (La Niña), the CDDd’s (103 days) were higher than in El Niño. Moreover, RX1day was higher in two El Niño events (1980 and 2004) and in the 1999 La Niña event, with an annual maximum daily precipitation of 52 mm (Figure 5(c)).
The PAR basin also showed the small interquartile in- terval of CDD (Figure 4(b)), suggesting a lower varia- bility during the study period. The RX1day and R20mm showed the highest median (Figures 4(c),(d)) and RX1- day shows highest values, with a minimum and maximum value of 40 mm and 58 mm respectively. In relation to their dry period (Figure 3), it was observed that July (31 days) had the lowest climatology daily rainfall (1 mm). Thus, as an indicator of the occurrence of drought (CDDd), CDD with values higher than 40 days were considered. In this context, it was observed that La Niña events of 1988 (82 days), 1984 (58 days) and 1999 (61 days) registered the highest values of CDDd, suggesting
that in La Niña the dry periods are more prolonged. On the other hand, the strong El Niño events (1982-1983 and 1997-1998) showed highest values of RX1day and R30mm. RX1day ranged between 56 mm (1983) to 58 mm (1997). Usually, in El Niño events, the SACZ tends to move southeastward of Brazil (where most of the Pa-rana Basin is located), and influences in the occurrence of extreme rainfall events. Reference [29] investigated the rainfall in the Paraná River sub-basin, for the period 1976-2005, and identified the year 1983 (1985) as the wettest (driest). The current study showed that the wet-test year was 1983 (Figure 5(b)), with the highest values of PRCTOT reported. On the other hand, the year 1988 was the driest year, with the highest CDDd. The differ-ence between the Zandonadi’s results and the current study's can be due to our having considered the Parana basin as being formed by two sub-basins: Parana River and Paraguay River.
Studies on the recent droughts of 2005 and 2010 oc- curred in the Amazon basin have drawn attention to posi- tive anomalies of SST in the North Atlantic (NATL) as the primary factor triggering the lack of rainfall over the Amazon [24,25,30]. However, the causes of drought are still highly debatable. Figure 5(e) shows the SOI and NATL indexes, for the period 1979 to 2010, that include the two last droughts (2005 and 2010), it was observed that the warming of the sea started in 2003, and was gradually increasing until it reached a positive peak as- sociated with the drought of 2005. Later there was a de- cline during the period 2006 to 2009, but still with posi- tive values (Figure 5(e)), until reaching another maxi- mum more intense in 2010 that was associated with the 2010 Amazon drought. On the other hand, over the Tro- pical South Pacific (TSP), positive anomalies were ob-served in the 2010 event, and negative anomalies in the 2005 event (Figure 5(f)). Results of observational stu- dies have shown that the drought of 2010 [30] had a larger spatial coverage than the one in 2005. Moreover, the southeast and southwestern Amazon region, and Ma- to Grosso state also were affected. Standardized anoma- lies of rainfall in the dry season indicated that 57% of the Amazon showed a deficit of rain, compared with 37% in the 2005 drought [30].
The warming of the waters of the Tropical North At- lantic generates an intensification of the Hadley cell, which causes increased upward movement of air in the North Atlantic and increased downward movement in the Amazon basin. This could be the cause of inhibition of cloud formation. Reference [31] points out that a warm tropical North Atlantic Ocean generates a seesaw-like modification of the Hadley circulation, corresponding to reduced moisture transport into the Amazon basin. On the other hand, the Tropical South Atlantic also had dif- ferent contributions in both episodes of drought. In the
OPEN ACCESS OJMH
Extreme Rainfall Indices in the Hydrographic Basins of Brazil 18
2005 drought negative anomalies of SATL was observed (Figure 5(f)), which influenced the pattern of winds and pressure. The negative anomalies of SATL may be con- nected with intensification of the South Atlantic semi- permanent high pressure system extending into the inte- rior of Brazil generating atmospheric stability in the southern Amazon region, and contributing to the lack of rain over this region. In the 2010 drought, the SATL re- mained positive, and apparently the South Atlantic high was less intense so the conclusion was reached that there was another dynamic factor that influenced the intensity of the drought.
For the strong 1998 El Niño, the NATL and SATL al- so were positive, but not intensive how in the drought 2010 (Figure 5(e)). In that year (1998) the CDDd was higher than the 2005 drought. On the other hand, the highest CDDd was reported in 1997 (El Niño), and par- ticularly impacted the average area of the AMA basin with a prolonged dry period.
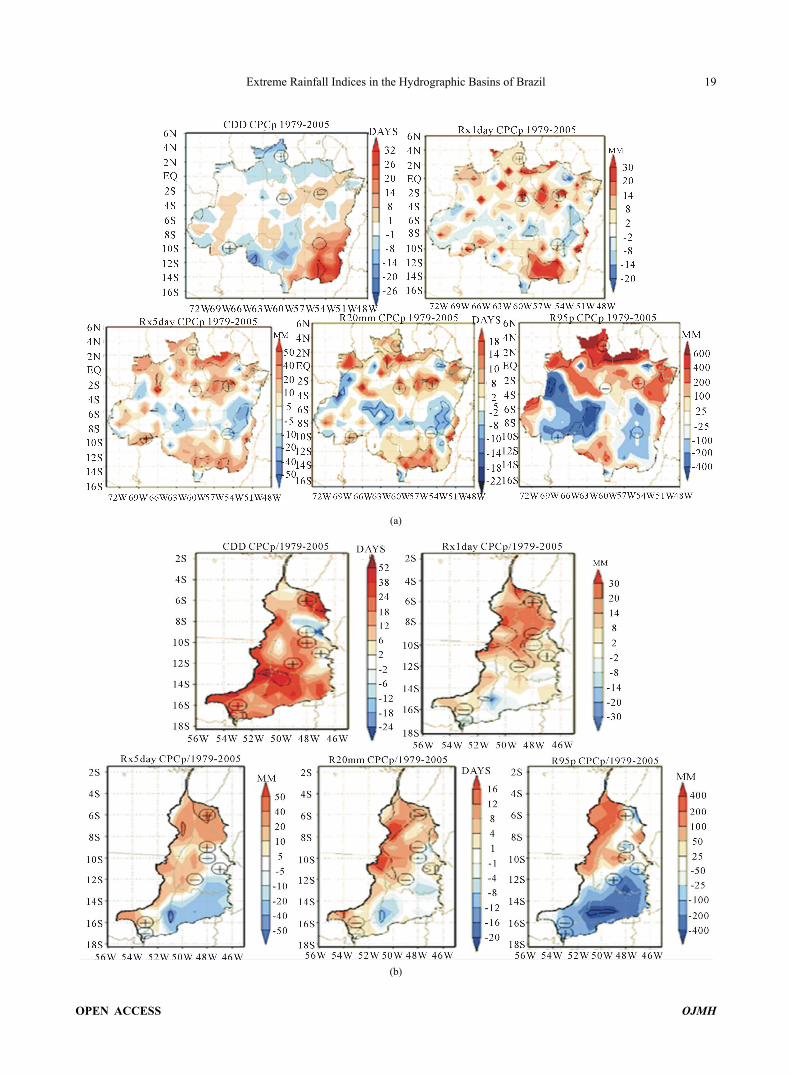
3.2. Spatial Trend Patterns of CEI 3.2.1. The Brasilian Amazon Basin The CDD (Figure 6(a)) showed a negative trend (>−14 days/year) in the northern sector (north of Roraima and Pará), and in the southern sector of the basin (parts of Rondonia and Acre). However, a positive significant trend (20 days/year) was observed in the southeastern sector of the basin (Mato Grosso). On the other hand, the rain gauge showed an opposite trend when compared with the CDD derived from CPCp. It is important to note that one rain gauge represents a small area of the basin, but this result also suggests a high spatial variability of the local rainfall in the AMA basin that the CPCp cannot capture.
RX1day, RX5day and R20mm showed significant in- creasing trends in the north, northeast and south sectors and a decreasing trend over the west-east-central basin. On the other hand, 2 out of the 5 rain gauge stations showed decreasing trend of RX1day (Manaus and Rio Branco) and R20mm (Boa Vista and Rio Branco). The R95p tends to increase significantly in the north of the basin (Roraima, north and northeast of Pará and northern of Amazonas). A decreasing trend of R95p over the midwest and southeast sectors of the basin was observed. In contrast, 1 (Rio Branco) out of the 5 rain gauge sta-tions showed an increasing trend of R95p. Reference [11] studied the interannual variability of rainfall in the Amazon basin since the end of 80’s, and the results showed an increasing (decreasing) rainfall over north- west (southwest and south) sector of basin. Increasing (decreasing) trend of RX1day, RX5day, R20mm and R95p (CDD) over northwest of the basin compares well with the results of [11]. Additionally, heavy rains on monthly and daily time-scale in southeastern Amazon
region are associated to anomalously strong convection over the SACZ, a weak subtropical jet stream and rela- tively weak Chaco Low [32,10].
3.2.2. The Tocantins Basin CDD (Figure 6(b)) tends to increase in large parts of the basin; with significantly stronger increases (up to 38 days/year) in MTO sector. The positive trends of the rain gauge stations confirm this idea, which would suggest a decrease of precipitation during the dry season. On the other hand, most of the rainfall indices (R95p, RX1day, RX5day and R20mm) have shown increasing signifi-cantly trends in most parts of the basin (LTO, MTO, and northern UTO). Decreasing trends of RX5day (−20 mm/ year) and R95p were observed in southern UTO. The rain gauge stations (Ananás, Miracema and Taquarussu) located in the UTO and the rain gauge (Alto Araguaia) in southern MTO also showed decreasing trends of RX5day. On the other hand, decreasing trends of R20mm and R95p were observed in Taquarussu and Alto Garça in agreement with the trends from CPCp.
Reference [33] examined the discharges for the 1974- 2006 period in the Marabá sub-basin and Southeast of Pará (LTO) and found that extreme rainfall and high riv- er discharges occurred during La Niña event. These re- sults compare well with the higher frequency of R30 mm occurred during La Niña events (Figure 5(d)).
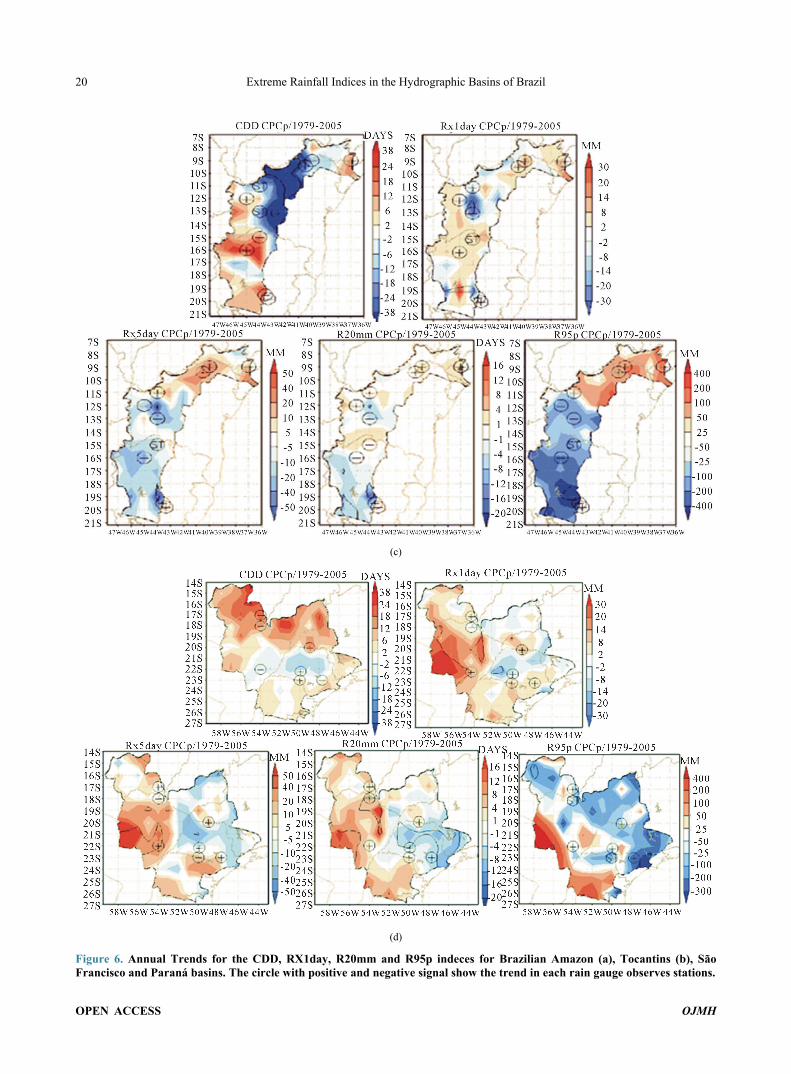
3.2.3. San Francisco Basin CDD tends to increase in LSF, USF (up to 18 days/year), and center west of MSF (38 days/year) (Figure 6(c)) in agreement with rain gauge stations of Fazenda Redenção and Fazenda Água Branca (MSF). Moreover, R20mm, RX1day, RX5day and R95p also tend to increase in LSF. This result may suggest that despite to tend increase the dry period, the frequency and intensity of rainfall in short periods during the rainy season also could increase. On the other hand, a significant decrease (increase) in the trend of CDD (RX1day and RX5day) was observed in SSF. Additionally, the rain gauge stations of Juazeiro and Campos dos Cavalos located in SSF also showed in- creasing trends of RX1day and RX5day. The SSF and LSF (USF and MSF) showed increasing (decreasing) trend of RX5day and R95p in agreement with the rain gauge station of Campos dos Cavalos and Juazeiro (Fa- zenda Redenção and Arrojado).
Reference [27] analyzed the extreme flood that oc- curred in 2004 on the SSF (Sobradinho dam and the city of Belo Monte, Alagoas) and found that the damage was related to the full occupation of the drainage areas. They also showed that floods are more recurrent in the USF, particularly in the metropolitan region of Belo Horizonte, and are linked to urbanization and the leakage of water for flood plain, having a significant impact in the af-
OPEN ACCESS OJMH
Extreme Rainfall Indices in the Hydrographic Basins of Brazil 19
(a)
(b)
OPEN ACCESS OJMH
Extreme Rainfall Indices in the Hydrographic Basins of Brazil 20
(c)
(d)
Figure 6. Annual Trends for the CDD, RX1day, R20mm and R95p indeces for Brazilian Amazon (a), Tocantins (b), São Francisco and Paraná basins. The circle with positive and negative signal show the trend in each rain gauge observes stations.
OPEN ACCESS OJMH
Extreme Rainfall Indices in the Hydrographic Basins of Brazil 21
fected regions.
In this study, the temporal tendencies of RX1day (Figure 5(c)), in SF basin, showed the maximum value (51 mm) in 2004. Many peak discharges in SSF can oc- cur from intense rainfall events in a short time. Also, the rain gauge station of Belo Horizonte showed an increas- ing trend of RX1day and RX5day, according to [27].
3.2.4. Paraná Basin Significant increase of CDD (38 days/year) was observed in the northern part of the PAR basin (Figure 6(d)). On the other hand, decreasing trends (−12 days/year) were observed on the central region of the sub-basin of Paraná (São Paulo). The rain gauge station of Gloria Dourados located in this region, also showed negative trends of CDD. The positive trends of R20mm, RX1day and RX5day were more significant in the southwestern sector. RX5day showed an increment up to 50 mm in annual maximum 5-day precipitation amount. The Itiquira and Gloria Dourados rain gauge stations located in the Para- guay River sub-basin also showed positive trends in this index. According to [34], who showed that after the year 1970, daily precipitations in the Paraguay River sub- basin increased.
In northern (southern) and central region of the Parana river sub-basin decreasing (increasing) trends of RX1day,
RX5day, R95p and R20mm were observed. Tiete and Cambara rain gauge stations, located in this sub-basin showed opposite trends. These results compare well with the results of [29], who studied the period of 1976-2005, and showed that the southern sector of the sub-basin had the highest cumulative annual rainfall, where the year of 1983 was the wettest. Temporal tendencies of RX1day and R30 mm (Figures 5(c) and (d)) in Paraná basin showed the maximum value in 1983.
3.3. Present Climate and Future Scenarios Derived from the ETA_HadCM3 Model
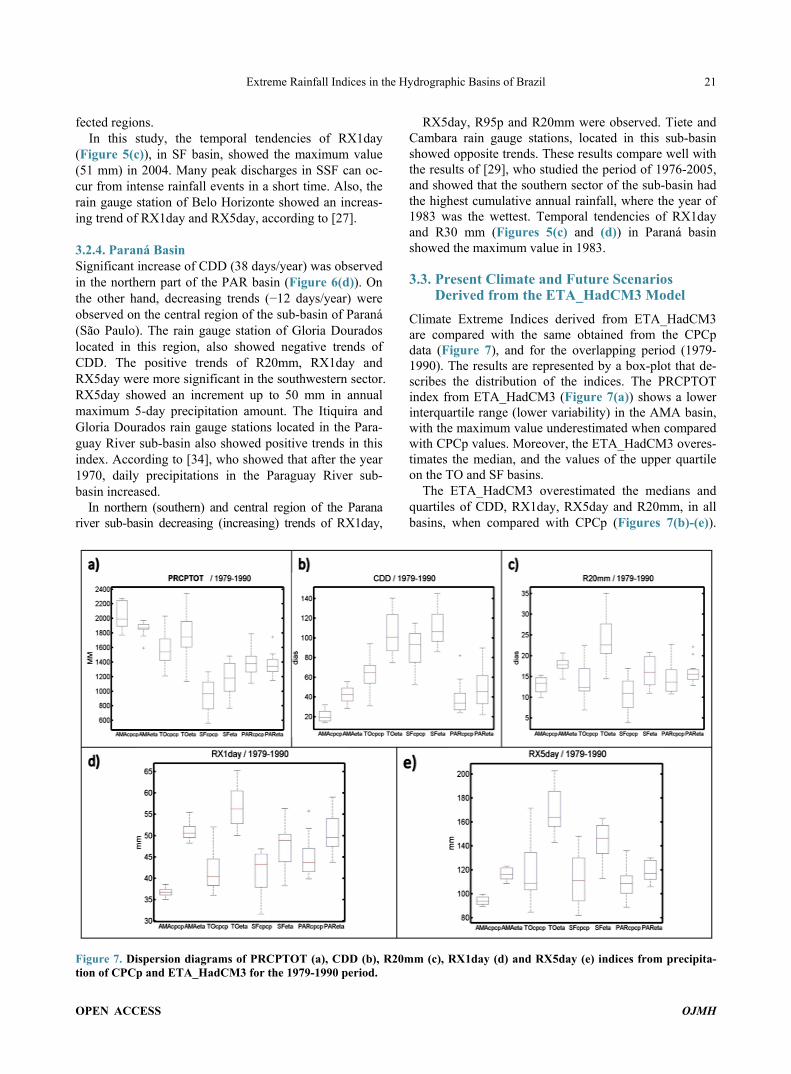
Climate Extreme Indices derived from ETA_HadCM3 are compared with the same obtained from the CPCp data (Figure 7), and for the overlapping period (1979- 1990). The results are represented by a box-plot that de- scribes the distribution of the indices. The PRCPTOT index from ETA_HadCM3 (Figure 7(a)) shows a lower interquartile range (lower variability) in the AMA basin, with the maximum value underestimated when compared with CPCp values. Moreover, the ETA_HadCM3 overes- timates the median, and the values of the upper quartile on the TO and SF basins.
The ETA_HadCM3 overestimated the medians and quartiles of CDD, RX1day, RX5day and R20mm, in all basins, when compared with CPCp (Figures 7(b)-(e)).
Figure 7. Dispersion diagrams of PRCPTOT (a), CDD (b), R20mm (c), RX1day (d) and RX5day (e) indices from precipita-tion of CPCp and ETA_HadCM3 for the 1979-1990 period.
OPEN ACCESS OJMH
Extreme Rainfall Indices in the Hydrographic Basins of Brazil 22
TO basin shows the highest median overestimated and the Parana basin the lowest median.
Besides, the statistical analysis showed for all basins that R20mm has smaller RMSE and lower BIAS when compared with other indices. Secondly, RX1day showed the same behavior. The R20mm shows a BIAS of 1.39 days, and a RMSE of 5.31 mm for the Paraná basin. On the other hand, RX1day shows a BIAS of 5.75 mm and a RMSE of 9.58 mm. This would suggest that the maxi- mum accumulated daily as well as the frequency of mo- derate rain days (rain > 20 mm) are better simulated by the ETA_HadCM3 model.
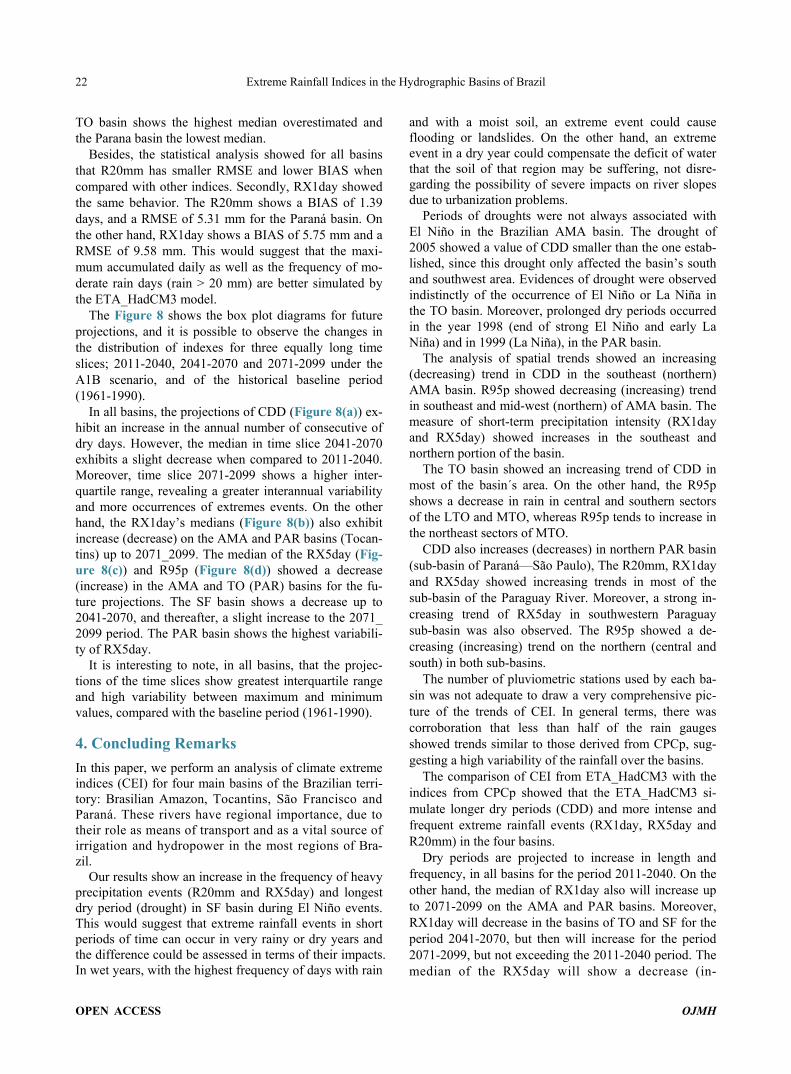
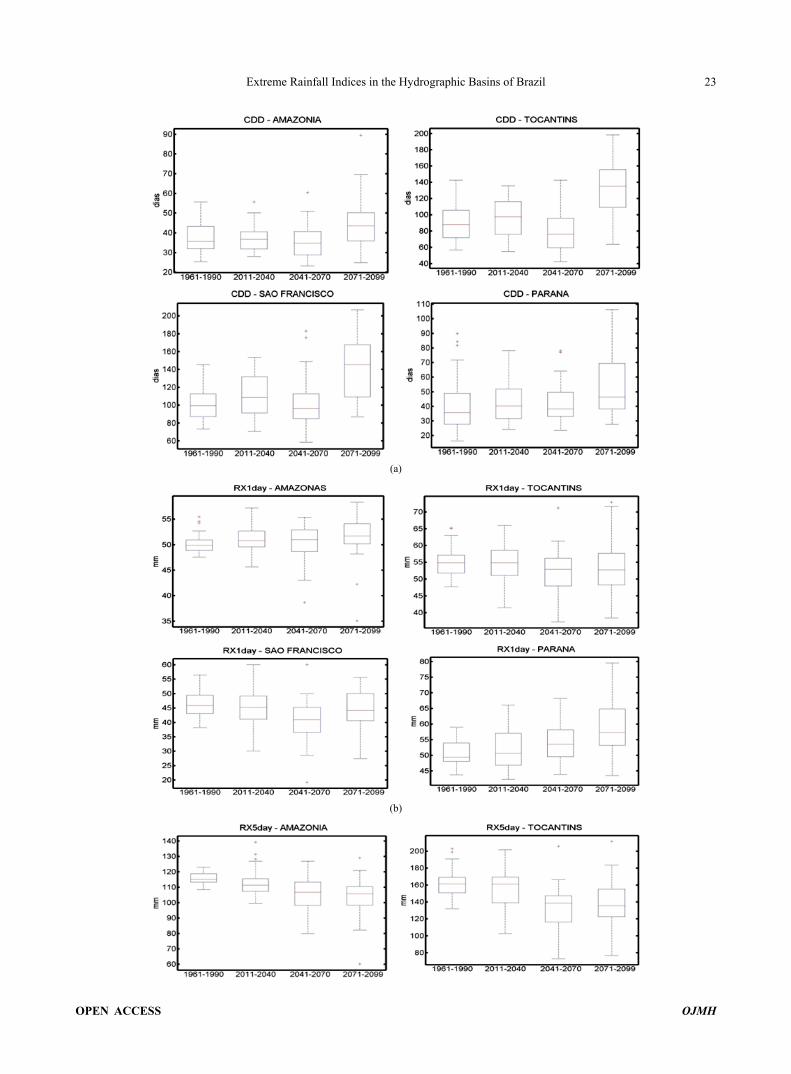
The Figure 8 shows the box plot diagrams for future projections, and it is possible to observe the changes in the distribution of indexes for three equally long time slices; 2011-2040, 2041-2070 and 2071-2099 under the A1B scenario, and of the historical baseline period (1961-1990).
In all basins, the projections of CDD (Figure 8(a)) ex- hibit an increase in the annual number of consecutive of dry days. However, the median in time slice 2041-2070 exhibits a slight decrease when compared to 2011-2040. Moreover, time slice 2071-2099 shows a higher inter-quartile range, revealing a greater interannual variability and more occurrences of extremes events. On the other hand, the RX1day’s medians (Figure 8(b)) also exhibit increase (decrease) on the AMA and PAR basins (Tocan- tins) up to 2071_2099. The median of the RX5day (Fig- ure 8(c)) and R95p (Figure 8(d)) showed a decrease (increase) in the AMA and TO (PAR) basins for the fu- ture projections. The SF basin shows a decrease up to 2041-2070, and thereafter, a slight increase to the 2071_ 2099 period. The PAR basin shows the highest variabili- ty of RX5day.
It is interesting to note, in all basins, that the projec- tions of the time slices show greatest interquartile range and high variability between maximum and minimum values, compared with the baseline period (1961-1990).
4. Concluding Remarks In this paper, we perform an analysis of climate extreme indices (CEI) for four main basins of the Brazilian terri- tory: Brasilian Amazon, Tocantins, São Francisco and Paraná. These rivers have regional importance, due to their role as means of transport and as a vital source of irrigation and hydropower in the most regions of Bra- zil.
Our results show an increase in the frequency of heavy precipitation events (R20mm and RX5day) and longest dry period (drought) in SF basin during El Niño events. This would suggest that extreme rainfall events in short periods of time can occur in very rainy or dry years and the difference could be assessed in terms of their impacts. In wet years, with the highest frequency of days with rain
and with a moist soil, an extreme event could cause flooding or landslides. On the other hand, an extreme event in a dry year could compensate the deficit of water that the soil of that region may be suffering, not disre- garding the possibility of severe impacts on river slopes due to urbanization problems.
Periods of droughts were not always associated with El Niño in the Brazilian AMA basin. The drought of 2005 showed a value of CDD smaller than the one estab- lished, since this drought only affected the basin’s south and southwest area. Evidences of drought were observed indistinctly of the occurrence of El Niño or La Niña in the TO basin. Moreover, prolonged dry periods occurred in the year 1998 (end of strong El Niño and early La Niña) and in 1999 (La Niña), in the PAR basin.
The analysis of spatial trends showed an increasing (decreasing) trend in CDD in the southeast (northern) AMA basin. R95p showed decreasing (increasing) trend in southeast and mid-west (northern) of AMA basin. The measure of short-term precipitation intensity (RX1day and RX5day) showed increases in the southeast and northern portion of the basin.
The TO basin showed an increasing trend of CDD in most of the basin´s area. On the other hand, the R95p shows a decrease in rain in central and southern sectors of the LTO and MTO, whereas R95p tends to increase in the northeast sectors of MTO.
CDD also increases (decreases) in northern PAR basin (sub-basin of Paraná—São Paulo), The R20mm, RX1day and RX5day showed increasing trends in most of the sub-basin of the Paraguay River. Moreover, a strong in- creasing trend of RX5day in southwestern Paraguay sub-basin was also observed. The R95p showed a de- creasing (increasing) trend on the northern (central and south) in both sub-basins.
The number of pluviometric stations used by each ba- sin was not adequate to draw a very comprehensive pic- ture of the trends of CEI. In general terms, there was corroboration that less than half of the rain gauges showed trends similar to those derived from CPCp, sug-gesting a high variability of the rainfall over the basins.
The comparison of CEI from ETA_HadCM3 with the indices from CPCp showed that the ETA_HadCM3 si- mulate longer dry periods (CDD) and more intense and frequent extreme rainfall events (RX1day, RX5day and R20mm) in the four basins.
Dry periods are projected to increase in length and frequency, in all basins for the period 2011-2040. On the other hand, the median of RX1day also will increase up to 2071-2099 on the AMA and PAR basins. Moreover, RX1day will decrease in the basins of TO and SF for the period 2041-2070, but then will increase for the period 2071-2099, but not exceeding the 2011-2040 period. The median of the RX5day will show a decrease (in-
OPEN ACCESS OJMH
Extreme Rainfall Indices in the Hydrographic Basins of Brazil 23
(a)
(b)
OPEN ACCESS OJMH
Extreme Rainfall Indices in the Hydrographic Basins of Brazil
OPEN ACCESS OJMH
24
(c)
(d)
Figure 8. Dispersion diagrams of the CDD (a), RX1day (b), RX5day (c), and R95p (d) indices from ETA_HadCM3 for the 1961-1990 periods and, 2011-2040, 2041-2070, and 2071-2099 time slices, for the Amazon, Tocantins, São Francisco and Pa- raná basins. crease) in the basins of AMA and TO (PAR) in 2071- 2099. Finally, RX5day will decrease until 2041-2070, and a slight increase in the 2071-2099 period will be ob- served in the SF basin.
One must bear in mind, that the projections provide no detailed evaluation of the regional signals, as it would require a more detailed examination of the physics and structure model. Therefore, the results of the projections should be considered more as guidelines for users that wish to have some general appreciation of the climate change projections for the basins, as simulated by ETA_ HadCM3.
Acknowledgements The research leading to these results has received fund- ing from the projects Rede CLIMA, the National Institute of Science and Technology for Climate Change (INCT-
CC), from the FAPESP—Assessment of Impacts and Vulnerability to Climate Change in Brazil and strategies for Adaptation options project (Ref. 2008/58161-1).
REFERENCES [1] Agência Nacional de Águas (ANA), “Caderno de Re-
cursos Hídricos: A Navegação Interior e Sua Interface Com o Setor de Recursos Hídricos,” Agência Nacional de Águas, Brasília, 2005.
[2] J. D. Hewlett, “Principles of Forest Hydrology,” The Uni- versity of Georgia Press, Athens, 1982.
[3] A. Kumar, T. Schei, A. Ahenkorah, R. Caceres Rodriguez, J.-M. Devernay, M. Freitas, D. Hall, Å. Killingtveit and Z. Liu, “Hydropower,” In: O. Edenhofer, R. Pichs-Madruga, Y. Sokona, K. Seyboth, P. Matschoss, S. Kadner, T. Zwickel, P. Eickemeier, G. Hansen, S. Schlömer and C. von Stechow, Eds., IPCC Special Report on Renewable Energy Sources and Climate Change Mitigation, Cam-
Extreme Rainfall Indices in the Hydrographic Basins of Brazil 25
bridge University Press, Cambridge, UK and New York, USA, 2011, pp. 437-496.
[4] D. B. Souza, “Fourth National Report to the Convention on Biological Diversity: Brazil. COP-10 Special Edition,” Ministry of the Environment, Secretary of Biodiversity and Forest, Brasilia, 2010.
[5] Agência Nacional de Águas (ANA), “GEO Brasil—Re- cursos Hídricos: Componente da Série de Relatórios So- bre o Estado e Perspectivas do Meio Ambiente no Brasil,” Programa das Nações Unidas para o Meio Ambiente (PNUMA), Brasília, 2007.
[6] S. Hastenrath and L. Greischar, “Further Work of North- east Brazil Rainfall Anomalies,” Journal of Climate, Vol. 6, 1993, pp. 743-758. http://dx.doi.org/10.1175/1520-0442(1993)006<0743:FWOTPO>2.0.CO;2
[7] A. M. Grimm, “The El Niño Impact on the Summer Monsoon in Brazil: Regional Processes versus Remote Influences,” Journal of Climate, Vol. 16, No. 2, 2003, pp. 263-280. http://dx.doi.org/10.1175/1520-0442(2003)016<0263:TENIOT>2.0.CO;2
[8] J. A. Marengo, “Long Term Trends and Cycles in the Hydrometeorology of the Amazon Basin Since the Late 1920’s,” Hydrological Processes, Vol. 23, No. 22, 2009, pp. 3236-3244. http://dx.doi.org/10.1002/hyp.7396
[9] J. A. Marengo, R. Jones, L. M. Alves and M. C. Valverde, “Future Change of Temperature and Precipitation Ex- tremes in South America as Derived from the PRECIS Regional Climate Modeling System,” International Jour- nal of Climatology, Vol. 29, No. 15, 2009, pp. 2241-2255. http://dx.doi.org/10.1002/joc.1863
[10] J. Ronchail, G. Cochonneau, E. Oliveira and J. L. Guyot, “Summer Rainfall Variability in Southern Amazon,” XII Congresso Brasileiro de Meteorologia, Foz de Iguaçu, 7-9 September 2002, pp. 986-991.
[11] J. C. Espinoza, J. Ronchail, J. L. Guyot, G. Cocheneau, N. Filizola, W. Lavado, E. de Oliveira, R. Pombosa and P. Vauchel, “Spatio—Temporal Rainfall Variability in the Amazon Basin Countries (Brazil, Peru, Bolivia, Colombia and Ecuador),” International Journal of Climatology, Vol. 29, No. 11, 2009, pp. 1574-1594. http://dx.doi.org/10.1002/joc.1791
[12] J. P. Charba, A. W. Harrell III and A. C. Lackner III, “A Monthly Precipitation Amount Climatology Derived from Published Atlas Maps: Development of a Digital Database,” TDL Office Note 92-7, National Weather Service, NOAA, US Department of Commerce, 1992, p. 20.
[13] V. B. Silva, V. Kousky, W. Shi and W. Higgins, “An Improved Gridded Historical Daily Precipitation Analysis for Brazil,” Journal of Hydrometeorology, Vol. 8, No. 4, 2007, pp. 847-861. http://dx.doi.org/10.1175/JHM598.1
[14] S. C. Chou, J. A. Marengo, A. Lyra, G. Sueiro, J. Pes- quero, L. M. Alves, G. Kay, R. Betts, D. Chagas, J. L. Gomês, J. Bustamante and P. Tavares, “Downscaling of South America Present Climate Driven by 4-Member HadCM3 Runs,” Climate Dynamics, Vol. 38, No. 3-4, 2011, pp. 635-653. http://dx.doi.org/10.1007/s00382-011-1002-8
[15] J. A. Marengo, S. C. Chou, G. Kay, L. M. Alves, J. F. Pesquero, W. R. Soares, D. C. Santos, A. A. Lyra, G. Sueiro, R. Betts, D. J. Chagas, J. L. Gomes, J. F. Busta- mante and P. Tavares, “Development of Regional Future Climate Change Scenarios in South America Using the Eta CPTEC/HadCM3 Climate Change Projections: Cli- matology and Regional Analyses for the Amazon, Sao Francisco and the Paraná River Basins,” Climate Dynam- ics, Vol. 38, No. 9-10, 2011, pp. 1829-1848. http://dx.doi.org/10.1007/s00382-011-1155-5
[16] N. Nakicenovic, J. Alcamo, G. Davis, B. de Vries, J. Fenhann, S. Gaffin, K. Gregory, A. Grübler, T. Y. Jung, T. Kram, E. Lebre La Rovere, L. Michaelis, S. Mori, T. Morita, W. Pepper, H. Pitcher, L. Price, K. Riahi, A. Roehrl, H. H. Rogner, A. Sankovski, M. Schlesinger, P. Shukla, S. Smith, R. Swart, S. van Rooijen, N. Victor and Z. Dadi, “Special Report on Emissions Scenarios,” Cam- bridge University Press, Cambridge, 2000.
[17] L. V. Alexander, X. Zhang, T. C. Peterson, J. Caesar, B. Gleason, A. Klein Tank, M. Haylock, D. Collins, B. Tre- winb, F. Rahimzadeha, A. Tagipoura, P. Ambenje, K. Rupa Kumar, J. Revadekar, G. Griffiths, L. Vincent, D. Stephenson, J. Burn, E. Aguilar, M. Brunet, M. Taylor, M. New, P. Zhai, M. Rusticucci and J. L. Vazquez-Aguirre, “Global Observed Changes in Daily Climate Extremes of Temperature and Precipitation,” Journal of Geophysical Research, Vol. 111, No. D5, 2005, Article ID: D05109. http://dx.doi.org/10.1029/2005JD006290
[18] M. G. Kendall, “Rank Correlation Methods,” Charles Grif- fin, London, 1975.
[19] N. R. Innocencio, “Hidrografia,” In: A. C. Duarte, T. N. Filho and P. M. S. Leite, Eds., Geografia do Brasil: Região Centro-Oeste, Vol. 1, IBGE, Rio de Janeiro, 1989, pp. 73-90.
[20] R. Anchayhua, “Climatologia de Eventos Chuvosos e Se- cos Severos, Extremos e Muito Extremos de Precipitação Usando SPI nas Regiões Centro-Oeste, Sudeste e Sul do Brasil,” Dissertação (Mestrado em Meteorologia)—Insti- tuto Nacional de Pesquisas Espaciais, São José dos Cam- pos, 2010.
[21] D. A. Wilhite and M. H. Glantz, “Understanding the Drought Phenomenon: The Role of Definitions,” In: Planning for Drought, toward a Reduction of Societal Vulnerability, Westview Press, Boulder, 1987.
[22] W. B. Nelson, “Fogo em Florestas da Amazônia Central em 1997,” Brazilian Symposiumon Remote Sensing, Pro- ceedings of X SBSR, Foz de Iguaçu, 2001, pp. 1675- 1682.
[23] M. Molinier, J. Ronchail, J. Loup, G. Cochonneau, V. Guimaraes and E. Oliveira, “Hydrological Variability in the Amazon Drainage Basin and African Tropical Basins,” Hydrological Processes, Vol. 23, No. 22, 2009, pp. 3245- 3252. http://dx.doi.org/10.1002/hyp.7400
[24] J. A. Marengo, C. A. Nobre, J. Tomasella, M. Oyama, G. Sampaio, H. Camargo and L. Alves, “The Drought of Amazonia in 2005,” Journal of Climate, Vol. 21, No. 3, 2008, pp. 495-516. http://dx.doi.org/10.1175/2007JCLI1600.1
[25] N. Zeng, et al., “Causes and Impact of the 2005 Amazon
OPEN ACCESS OJMH
Extreme Rainfall Indices in the Hydrographic Basins of Brazil 26
Drought,” Environmental Research Letters, Vol. 3, No. 1, 2008, Article ID: 014002. http://dx.doi.org/10.1088/1748-9326/3/1/014002
[26] M. C. Valverde and J. A. Marengo, “Rainfall Extremes Events Climatology over the Amazon Basin,” Proceed- ings of the Global Conference on Global Warming, Lis- bon, 11-14 July 2011, pp. 1-8.
[27] J. G. Gondin Filho, K. T. Formiga, R. X. Duarte and M. R. Sugai, “Análise da Cheia de 2004 na Bacia do Rio São Francisco,” Simpósio Brasileiro de Desastres Naturais, Florianópolis, Anais, GEDN/UFSC, 2004, pp. 524-538.
[28] J. B. Alves, J. N. Campos and T. M. Studart, “As Chuvas de Janeiro/2004 no Nordeste do Brasil, Suas Carac- terísticas Atmosféricas e Seus Impactos nos Recursos Hídricos da Região,” VII Simpósio de Recursos Hídricos do Nordeste, 30 November-3 December, São Luis, Mar- anhão, 2004, pp. 1-19.
[29] L. Zandonadi, “As Chuvas na Bacia do Paraná: Aspectos Temporais, Espaciais e Rítmicos,” Dissertação de Mes- trado Para o Título de Mestre em Geografia. Instituto de Geociências e Ciências Exatas, Universidade Estadual Paulista, Rio Claro, São Paulo, 2009.
[30] S. L. Lewis, P. M. Brando, O. L. Phillips, M. F. van der Heijden and D. Nepstad, “The 2010 Amazon Drought,”
Science, Vol. 331, No. 6017, 2011, p. 554. http://dx.doi.org/10.1126/science.1200807
[31] N. Zeng, Y. Yoon, J. A. Marengo, A. Subrmanaiam, C. Nobre and A. Mariotti, “Causes and Impacts of the 2005 Amazon Drought,” Environmental Research Letters, Vol. 3, No. 1, 2008, Article ID: 014002. http://dx.doi.org/10.1088/1748-9326/3/1/014002
[32] J. Nogués-Peagle and K. C. Mo, “Alternating Wet and Dry Conditions over South America in Summer,” Monthly Weather Review, Vol. 125, No. 2, 1997, pp. 279-291. http://dx.doi.org/10.1175/1520-0493(1997)125<0279:AWADCO>2.0.CO;2
[33] M. D. Santos, “Análise e Modelagem Hidrometeorológica na Bacia do Rio Tocantins em Marabá—PA,” Dissertação Apresentada ao Programa de Pós-Graduação em Ciências Ambientais do Instituto de Geociências da Universidade Federal do Pará, Belém, 2008.
[34] W. Collischonn, C. Tucci and R. T. Clarke, “Further Evi- dence of Changes in the Hydrological Regime of the River Paraguay: Part of a Wider Phenomenon of Climatic Change?” Journal of Hydrology, Vol. 245, No. 1, 2001, pp. 218-238.
OPEN ACCESS OJMH
Related Documents