HAL Id: hal-01988909 https://hal.archives-ouvertes.fr/hal-01988909 Submitted on 8 Feb 2019 HAL is a multi-disciplinary open access archive for the deposit and dissemination of sci- entific research documents, whether they are pub- lished or not. The documents may come from teaching and research institutions in France or abroad, or from public or private research centers. L’archive ouverte pluridisciplinaire HAL, est destinée au dépôt et à la diffusion de documents scientifiques de niveau recherche, publiés ou non, émanant des établissements d’enseignement et de recherche français ou étrangers, des laboratoires publics ou privés. Extreme Learning Machine Based Prognostics of Battery Life Roozbeh Razavi-Far, Shiladitya Chakrabarti, Mehrdad Saif, Enrico Zio, Vasile Palade To cite this version: Roozbeh Razavi-Far, Shiladitya Chakrabarti, Mehrdad Saif, Enrico Zio, Vasile Palade. Extreme Learning Machine Based Prognostics of Battery Life. International Journal on Artificial Intelligence Tools, World Scientific Publishing, 2018, 27 (08), pp.1850036. 10.1142/s0218213018500367. hal- 01988909

Welcome message from author
This document is posted to help you gain knowledge. Please leave a comment to let me know what you think about it! Share it to your friends and learn new things together.
Transcript
HAL Id: hal-01988909https://hal.archives-ouvertes.fr/hal-01988909
Submitted on 8 Feb 2019
HAL is a multi-disciplinary open accessarchive for the deposit and dissemination of sci-entific research documents, whether they are pub-lished or not. The documents may come fromteaching and research institutions in France orabroad, or from public or private research centers.
L’archive ouverte pluridisciplinaire HAL, estdestinée au dépôt et à la diffusion de documentsscientifiques de niveau recherche, publiés ou non,émanant des établissements d’enseignement et derecherche français ou étrangers, des laboratoirespublics ou privés.
Extreme Learning Machine Based Prognostics ofBattery Life
Roozbeh Razavi-Far, Shiladitya Chakrabarti, Mehrdad Saif, Enrico Zio, VasilePalade
To cite this version:Roozbeh Razavi-Far, Shiladitya Chakrabarti, Mehrdad Saif, Enrico Zio, Vasile Palade. ExtremeLearning Machine Based Prognostics of Battery Life. International Journal on Artificial IntelligenceTools, World Scientific Publishing, 2018, 27 (08), pp.1850036. �10.1142/s0218213018500367�. �hal-01988909�

December 5, 2018 14:20 IJAIT S0218213018500367 page 1
1st Reading
International Journal on Artificial Intelligence ToolsVol. 27, No. 8 (2018) 1850036 (22 pages)c© World Scientific Publishing Company
DOI: 10.1142/S0218213018500367
Extreme Learning Machine Based Prognostics of Battery Life
Roozbeh Razavi-Far∗, Shiladitya Chakrabarti† and Mehrdad Saif‡
Department of Electrical and Computer Engineering, University of WindsorWindsor, Ontario N9B 3P4 Canada
∗[email protected]†[email protected]‡[email protected]
Enrico Zio
Ecole CentraleSupelec, Universite Paris Saclay, FranceDepartment of Energy, Politecnico di Milano, Milano, [email protected]; [email protected]; [email protected]
Vasile Palade
School of Computing, Electronics and MathematicsCoventry University, CV1 5FB Coventry, United Kingdom
Received 13 February 2018Accepted 5 November 2018Published 20 December 2018
This paper presents a prognostic scheme for estimating the remaining useful life ofLithium-ion batteries. The proposed scheme utilizes a prediction module that aims toobtain precise predictions for both short and long prediction horizons. The predictionmodule makes use of extreme learning machines for one-step and multi-step ahead pre-dictions, using various prediction strategies, including iterative, direct and DirRec, whichuse the constant-current experimental capacity data for the estimation of the remaininguseful life. The data-driven prognostic approach is highly dependent on the availability ofhigh quantity of quality observations. Insufficient amount of available data can result inunsatisfactory prognostics. In this paper, the prognostics scheme is utilized to estimatethe remaining useful life of a battery, with insufficient direct data available, but takingadvantage of observations available from a fleet of similar batteries with similar workingconditions. Experimental results show that the proposed prognostic scheme provides afast and efficient estimation of the remaining useful life of the batteries and achievessuperior results when compared with various state-of-the-art prediction techniques.
Keywords: Prognostics; extreme learning machines; one-step prediction; multi-steps pre-diction; Lithium-ion batteries.
1850036-1
Int.
J. A
rtif
. Int
ell.
Too
ls 2
018.
27. D
ownl
oade
d fr
om w
ww
.wor
ldsc
ient
ific
.com
by U
NIV
ER
SIT
Y O
F N
EW
EN
GL
AN
D o
n 01
/08/
19. R
e-us
e an
d di
stri
butio
n is
str
ictly
not
per
mitt
ed, e
xcep
t for
Ope
n A
cces
s ar
ticle
s.
ZENG
Rectangle
ZENG
Rectangle
December 5, 2018 14:20 IJAIT S0218213018500367 page 2
1st Reading
R. Razavi-Far et al.
1. Introduction
Prognostics of Lithium-ion batteries has become of primary importance in the elec-
tronics industry.1–3 In this industry, prognostics and health management (PHM)
techniques are being utilized for improving operation and management, and extend-
ing the lifecycle of systems, machines and batteries, decreasing the risk of failures
and associated unscheduled maintenance costs.4
Quick and accurate estimation of the remaining useful life (RUL) can reduce
the failure occurrences of batteries.5,6 The RUL is a valuable information for the
estimation of a feasible time for battery replacement. The RUL of a battery de-
pends on the battery degradation level and operational conditions.7 The nonlinear
and uncertain degradation profiles of batteries call for nonlinear predictive models.
Monitoring of a battery state during its operational usage has two elements, namely
state of charge (SOC) and state of health (SOH).8 SOC is a measure of remaining
available stored energy9 and SOH is a measure of the battery degradation.10 These
measures provide useful information on the present conditions of a battery.11 The
RUL prediction task can, then, be performed through a wide range of prognostic
methods, that are mainly classified under two major categories of model-based and
data-driven methods.12–17
Model-based approaches account for a majority of the modern RUL estimation
methods, but often in practice it is difficult to have a precise and well-established
model,18 tune its parameters, and update their values during the prediction phase,
for changing operational conditions.19 For example, rapid changes at the final cycles
of usage increase the difficulty to learn the final steps of the degradation profiles.7
Data-driven approaches help address these issues in RUL prediction.5 Data-
driven approaches utilize existing and past observations of the batteries degra-
dation profiles for estimating future values.19 RUL can be estimated by learning
the relationships amongst the degradation features and the degradation trends.19
Informative features, like voltage, capacity, current and impedance have been ex-
tracted and used for battery RUL prediction. The numbers of observations and
informative features play a vital role for achieving an accurate prediction model.20
The data-driven approaches are much faster and easier to implement compared to
model-based approaches,21 even though they require a large number of observations
in the training phase and the prediction model is non-transparent.14
The model-based approaches can be classified into two main categories. The first
group makes use of the degradation modelling strategy.19 The approaches can use
a nonlinear degradation model,22 an adaptive and nonlinear model,22 a hierarchi-
cal model to integrate discharging and degradation processes,23 a sparse Bayeshian
predictive model24 and a degraded Markov model14 to estimate the remaining use
life. Such models are a bit complex and very sensitive to the quality and quantity
of the battery data. The second group makes use of the state/parameter observers,
like extended Kalman filter25 and particle filter.26 These approaches are computa-
tionally expensive and sensitive to the accuracy and robustness of the model. The
data-driven approaches can be classified into three major categories. This group
1850036-2
Int.
J. A
rtif
. Int
ell.
Too
ls 2
018.
27. D
ownl
oade
d fr
om w
ww
.wor
ldsc
ient
ific
.com
by U
NIV
ER
SIT
Y O
F N
EW
EN
GL
AN
D o
n 01
/08/
19. R
e-us
e an
d di
stri
butio
n is
str
ictly
not
per
mitt
ed, e
xcep
t for
Ope
n A
cces
s ar
ticle
s.
December 5, 2018 14:20 IJAIT S0218213018500367 page 3
1st Reading
Extreme Learning Machine Based Prognostics of Battery Life
of approaches makes use of statistical measures.6 These techniques are quite sim-
ple and straightforward. The second group of approaches aim to map from ex-
tracted features or stressing factors to state of health. These include the use of
support vector machine27,28 and neural networks.29,30 These techniques can be eas-
ily implemented and have a good nonlinear mapping capability. The third group
of approaches aim to map directly from aging cycle to state of health.31,32 These
techniques have a good nonlinear mapping capability but are difficult to be imple-
mented. All these techniques are sensitive to the quantity and quality of the battery
data. Several data-driven approaches, including support vector machines,27,28 rel-
evance vector machines,33 and artificial neural networks30 have been implemented
for the prediction of remaining useful life of batteries.34 However, many of such
techniques suffer from computational complexity and higher computational time.34
The work in this paper focuses on the study and comparison of data-driven
techniques for the one-step-ahead prediction (OSP) and the multi-step-ahead pre-
diction (MSP) of batteries RUL. The aim is to develop several predictors based
on extreme learning machines (ELM)35–37 for estimation of the remaining useful
life of batteries. Extreme learning machines (ELM) are known for fast implementa-
tion, low complexity and reliable predictions. The proposed ELM-based predictor
is studied and compared to other state-of-the-art prediction techniques, including
neuro-fuzzy networks (NFs),38–40 group method of data handling (GMDH),41 ran-
dom forests (RF)42 and echo state networks (ESN).43 These predictors are formed
in the nonlinear autoregressive (NAR) structures for OSP and used along within
several MSP structures, namely iterative, direct and DirRec, for the long-term pre-
diction. All these strategies create different training subsets including current and
past observations of the batteries and train several models to predict the future
capacity values in short and long horizons.
The paper also tries to handle the situation of estimating the RUL of a battery,
with insufficient or unusable observations. There is often a situation, particularly
in case of a new equipment, that the available set of observations or data lack the
quantity as well as the quality to be suitable to generate a training subset. The
paper proposes a solution to this problem by utilizing the data available from a
fleet of existing batteries. These batteries are similar and operate under similar
working conditions and degradation processes. The data from the fleet of batteries
are combined to train the prognostic model. Once trained, the model can be utilized
to estimate the RUL of the battery.
The remainder of the paper is structured as follows. Section 2 of the paper briefly
formulates the problem statement. Section 3 presents the proposed techniques to
predict the remaining useful life of the Lithium-ion batteries. Section 4 discusses
and analyses the experimental results. Section 5 presents the conclusion.
2. Problem Statement
The primary goal of the paper is to analyze the degradation process in Lithium-ion
batteries and estimate their remaining useful life over both short and long time
1850036-3
Int.
J. A
rtif
. Int
ell.
Too
ls 2
018.
27. D
ownl
oade
d fr
om w
ww
.wor
ldsc
ient
ific
.com
by U
NIV
ER
SIT
Y O
F N
EW
EN
GL
AN
D o
n 01
/08/
19. R
e-us
e an
d di
stri
butio
n is
str
ictly
not
per
mitt
ed, e
xcep
t for
Ope
n A
cces
s ar
ticle
s.

December 5, 2018 14:20 IJAIT S0218213018500367 page 4
1st Reading
R. Razavi-Far et al.
One-step-ahead Prediction Model (NAR)
Multi-step-ahead Prediction Model - Iterative Strategy
Multi-step-ahead Prediction Model - DirRec Strategy
Multi-step-ahead Prediction Modelc - Direct Strategy
Battery Data
Prediction Module
PredictionsPrognostic Horizon,Alpha-Lambda accuracy,RMSE, ERUL
PredictionsPrognostic Horizon,Alpha-Lambda accuracy,RMSE, ERUL
PredictionsPrognostic Horizon,Alpha-Lambda accuracy,RMSE, ERUL
PredictionsPrognostic Horizon,Alpha-Lambda accuracy,RMSE, ERUL
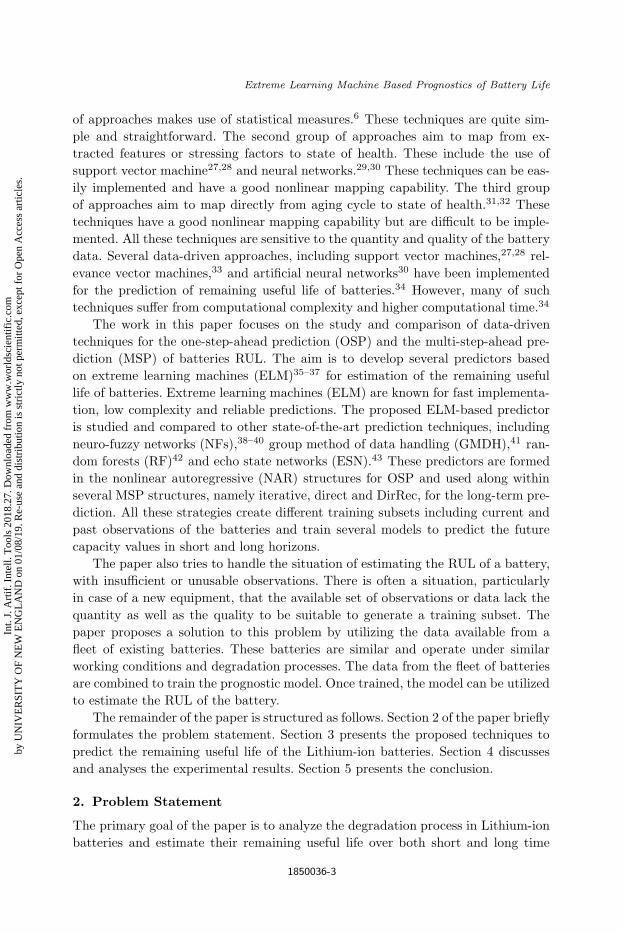
Fig. 1. Block diagram of the prediction system. Battery data are fed into the predictive modelsfor estimating the RUL of the battery.
horizons. Four different battery datasets, namely B5, B6, B7 B18, are used for the
estimation of the remaining useful life in terms of capacity. These datasets were
collected at the Idaho National Lab and can be obtained from the NASA Prog-
nostic Center of Excellence Data Repository.44 The batteries have been charged at
the constant rate of 1.5A, till the voltage reaches 4.2V and, then, the voltage is
sustained at a constant level till the current reduces to 20mA. In discharge cycles,
the batteries maintain a constant current level till the voltage drops below a pre-
set value.14 Batteries B5, B6, B7 and B18 are considered to be fully discharged
when their voltage drops to 2.7V, 2.5V, 2.2V and 2.5V respectively. This charge
and discharge cycles are continued until the rated capacity drops from 2Ahr to
1.4Ahr, a drop of 30%, which is a criteria for battery end-of-life.21 Capacity of
a battery, C(Ahr), is a common index to predict its remaining useful life45 and,
hence, in this paper, capacities from 168 discharge cycles are extracted and uti-
lized to create required inputs for the predictors in order to estimate the RUL of
the batteries.
Figure 1 shows the proposed prediction scheme. The following prediction strate-
gies can be considered to construct various predictors and estimate the useful life
of the Li-ion batteries for short and long-term horizons.
1850036-4
Int.
J. A
rtif
. Int
ell.
Too
ls 2
018.
27. D
ownl
oade
d fr
om w
ww
.wor
ldsc
ient
ific
.com
by U
NIV
ER
SIT
Y O
F N
EW
EN
GL
AN
D o
n 01
/08/
19. R
e-us
e an
d di
stri
butio
n is
str
ictly
not
per
mitt
ed, e
xcep
t for
Ope
n A
cces
s ar
ticle
s.
December 5, 2018 14:20 IJAIT S0218213018500367 page 5
1st Reading
Extreme Learning Machine Based Prognostics of Battery Life
2.1. One-step-ahead prediction (OSP) strategy
One-step-ahead predictions (OSP) are utilized for the estimation of the RUL of a
battery over a short horizon. Nonlinear autoregressive (NAR) structures46 are used
to construct predictive models using the following equation:
ψi+1 = g(ψi, ψi−1, ψi−2, . . . , ψi+1−n) + εi+1 (1)
where ψ symbolizes the battery capacity at discharge cycles, n symbolizes the num-
ber of lags, ε symbolizes the prediction error for each cycle, i symbolizes the cycle
number, and g symbolizes the prediction approximation function during the train-
ing phase.
2.2. Multi-step-ahead prediction (MSP) strategies
(a) Iterative strategy predicts the next future value using OSP method and, then,
uses the predicted value as a known input iteratively to predict the subsequent L
future values. Prediction of the L subsequent values using this technique can be
formulated by the following equation
ψi+l =
⎧⎪⎪⎪⎨⎪⎪⎪⎩
g(ψi, . . . , ψi+1−n) , if l = 1
g(ψi+l−1, . . . , ψi+1, ψi, . . . , ψi+l−n) , if l ∈ {2, . . . , n}g(ψi+l−1, . . . , ψi+l−n) , if l ∈ {d+ 1, . . . , L}
(2)
where ψ symbolizes the battery capacity at discharge cycles, ψ symbolizes the
predicted battery capacity, n symbolizes the number of lags, i symbolizes the cycle
number, g symbolizes the one-step prediction model and L symbolizes the total
number of predictions.47,48
(b) DirRec strategy predicts multi-step-ahead values similar to iterative
strategy, but, generates a new prediction model after each prediction step.48 Predic-
tion of L subsequent values using this technique can be formulated by the following
equation
ψi+l =
⎧⎪⎪⎪⎨⎪⎪⎪⎩
gl(ψi, . . . , ψi+1−n) , if l = 1
gl(ψi+l−1, . . . , ψi+1, ψi, . . . , ψi+l−n) , if l ∈ {2, . . . , n}gl(ψi+l−1, . . . , ψi+l−n) , if l ∈ {n+ 1, . . . , L}
(3)
where gl symbolizes the predictive model constructed at the lth prediction step.49
(c) Direct strategy constructs L distinct models gl to predict L future values
using the following equation49
ψi+l = gl(ψi, ψi−1, . . . , ψi+1−n) , l ∈ [1, L] . (4)
1850036-5
Int.
J. A
rtif
. Int
ell.
Too
ls 2
018.
27. D
ownl
oade
d fr
om w
ww
.wor
ldsc
ient
ific
.com
by U
NIV
ER
SIT
Y O
F N
EW
EN
GL
AN
D o
n 01
/08/
19. R
e-us
e an
d di
stri
butio
n is
str
ictly
not
per
mitt
ed, e
xcep
t for
Ope
n A
cces
s ar
ticle
s.

December 5, 2018 14:20 IJAIT S0218213018500367 page 6
1st Reading
R. Razavi-Far et al.
2.3. Fleet-based predictions
The one-step ahead predictive model for the fleet-based prognostic scheme is gener-
ated using an ensemble of one-step ahead prediction models for all available batter-
ies. For the iterative multi-step ahead predictions, the first future value is estimated
using the one-step model, which is then used as known input iteratively to generate
subsequent future values
ψk,i+1 = gfleet(ψk,i, ψk,i−1, ψk,i−2, . . . , ψk,i+1−n) (5)
where k symbolizes the kth battery in the available fleet and gfleet symbolizes the
one-step ahead predictive models for the various batteries in the fleet.
3. Predictor Models
3.1. Extreme Learning Machine (ELM )
ELM is a generalized, single hidden layer feedforward network (SLFN),35,36 with
the following output function50
fp(x) =
p∑i=1
βihi(x) = h(x)β , x ∈ Rn , βi ∈ R
o (6)
where p is the number of hidden nodes, β = [β1, . . . , βp]T stands for the vec-
tor of output weights linking nodes of the hidden layer to the o ≥ 1 out-
put nodes, h(x)=[h1(x), . . . , hp(x)]T denotes the ELM nonlinear feature mapping.
Hidden nodes may include different output functions. Particularly, hi(x) can be
defined as
hi(x) = f(ωix+ bi) , ωi ∈ Rp , bi ∈ R
p (7)
where f(ωx+b) stands for a nonlinear piecewise continuous function, which satisfies
the universal approximation capability of ELM, in which (ω, b) are the hidden node
parameters.35
Given a set of observations S = {(xj , yj)|xj ∈ Rn, yj ∈ R
o}, a standard SLFN
with p hidden nodes and an arbitrary activation function can be modeled as follows
fp(xj) =
p∑i=1
βihi(xj) =
p∑i=1
βif(ωixj + bi) , j = 1, . . . ,m (8)
where ωi = [ωi1, . . . , ωip]T stands for the weight vector linking the ith hidden node
and the input nodes, bi denotes the threshold of the ith hidden node and f stands
for the activation function. There exist various types of activation functions such
as sigmoid, hyperbolic tangent, Gaussian, hard limit, cosine/Fourier basis, sine and
radial basis function (RBF).35 Here, the sigmoid function has been used, which can
be defined as follows
f(ωixj + bi) =1
1 + exp(−(ωixj + bi)), ωi ∈ R
p , bi ∈ Rp . (9)
1850036-6
Int.
J. A
rtif
. Int
ell.
Too
ls 2
018.
27. D
ownl
oade
d fr
om w
ww
.wor
ldsc
ient
ific
.com
by U
NIV
ER
SIT
Y O
F N
EW
EN
GL
AN
D o
n 01
/08/
19. R
e-us
e an
d di
stri
butio
n is
str
ictly
not
per
mitt
ed, e
xcep
t for
Ope
n A
cces
s ar
ticle
s.

December 5, 2018 14:20 IJAIT S0218213018500367 page 7
1st Reading
Extreme Learning Machine Based Prognostics of Battery Life
ELM randomly generates p hidden nodes (step 1), without the need for tuning,
to approximate the input-output relation among the m pairs of observations with
the minimum training error, εj =∑p
i=1 ‖fp(xj) − yj‖, i.e., it determines (ωi, bi)
and βi such to satisfy the following
p∑i=1
βif(ωixj + bi) = yj + εj , j = 1, . . . ,m (10)
where ε stands for the error or noise and yj denotes the output vector at the jth
row. This can be reformulated as follows
Hβ = Y (11)
where
H =
⎡⎢⎢⎣h(x1)
...
h(xm)
⎤⎥⎥⎦ =
⎡⎢⎢⎣f(ω1x1 + b1) · · · f(ωpx1 + bp)
.... . .
...
f(ω1xm + b1) · · · f(ωpxm + bp)
⎤⎥⎥⎦m×p
(12)
β =
⎡⎢⎢⎢⎣
βT1
...
βTp
⎤⎥⎥⎥⎦p×o
(13)
and
Y =
⎡⎢⎢⎢⎣
yT1...
yTm
⎤⎥⎥⎥⎦ =
⎡⎢⎢⎣y11 . . . y1o...
. . ....
ym1 . . . ymo
⎤⎥⎥⎦m×o
(14)
in which H stands for the randomized matrix of the hidden layer output of the
network and Y stands for the target matrix. ELM computes the matrix of hid-
den layer outputs H (step 2) and, then, computes the vector of output weights
(step 3).
The optimal solution can be found, then, by the smallest least-square solution
of the linear system (see Eq. (11)) as follows
β = H†Y (15)
where H† stands for the Moore-Penrose generalized inverse of matrix H .35
Figure 2 illustrates the ELM training structure, where the output matrix is
generated using the input matrix and the hidden layer matrix. The hidden layer
parameters can be generated randomly, independent of the input matrix and, thus,
decrease considerably the training time of the model.
1850036-7
Int.
J. A
rtif
. Int
ell.
Too
ls 2
018.
27. D
ownl
oade
d fr
om w
ww
.wor
ldsc
ient
ific
.com
by U
NIV
ER
SIT
Y O
F N
EW
EN
GL
AN
D o
n 01
/08/
19. R
e-us
e an
d di
stri
butio
n is
str
ictly
not
per
mitt
ed, e
xcep
t for
Ope
n A
cces
s ar
ticle
s.

December 5, 2018 14:20 IJAIT S0218213018500367 page 8
1st Reading
R. Razavi-Far et al.
1
n
1
ixj ε Rn
yj
β1
βi
βp
n input neurons p hidden neurons
(ω1, b1)
(ωi, bi)
(ωp, bp)
output neurons
p
Fig. 2. Extreme learning machine model topography.
4. Experimental Results
The proposed prognostic scheme uses the ELM predictor and other state-of-the-
art methods, including GMDH, NF, RF and ESN, in a set of experiments for
one-step and multi-steps ahead predictions. Results are compared in terms of root
mean square error (RMSE), prediction error (ERUL), prognostic horizon and alpha-
lambda accuracy. RMSE calculates the difference between the target and predicted
values. ERUL indicates the error in the prediction at the end of life that can be
calculated as the difference between the actual and predicted cycle numbers at
which the battery reaches the end of life, when the value of capacity crosses a
predetermined threshold. For these experiments, the threshold values for batteries
B5, B6 and B7 are 1.299V , 1.424V and 1.41V , respectively. Prognostic horizon
indicates the difference of the battery end of life cycle and the cycle where the
prediction first reaches a specified performance criteria.51 For these experiments,
the alpha for the prognostic horizon is set at 10%. Alpha-lambda accuracy indicates
the quality of estimations by checking if the estimations are within a specified range
at particular cycles.51 For these experiments, the alpha for the accuracy is set at
20%. The fleet-based prognostics scheme utilizes the combined datasets of batteries
B5, B6 and B7 to form the training subset in a set of experiments for one-step
and multi-steps ahead predictions of the battery B18. The threshold value for the
battery B18 is set at 1.4V . Only iterative strategy is used for the multi-steps ahead
predictions using the fleet-based prognostics.
4.1. One-step ahead predictions
Various one-step ahead predictions are performed on all battery datasets by varying
the number of input lags from two to five. Besides, the size of the training set is
also varied between 40%, 60% and 80% of the total set.
1850036-8
Int.
J. A
rtif
. Int
ell.
Too
ls 2
018.
27. D
ownl
oade
d fr
om w
ww
.wor
ldsc
ient
ific
.com
by U
NIV
ER
SIT
Y O
F N
EW
EN
GL
AN
D o
n 01
/08/
19. R
e-us
e an
d di
stri
butio
n is
str
ictly
not
per
mitt
ed, e
xcep
t for
Ope
n A
cces
s ar
ticle
s.

December 5, 2018 14:20 IJAIT S0218213018500367 page 9
1st Reading
Extreme Learning Machine Based Prognostics of Battery Life
Cycles0 20 40 60 80 100 120 140 160 180
Cap
acity
(A
hr)
1.3
1.4
1.5
1.6
1.7
1.8
1.9
TargetRFGMDHNF-FCMELMESN
Threshold40% Training
Fig. 3. Prediction results for the test with two input lags and the use of first 40% of the obser-vations for training.
Figure 3 depicts the prediction result generated by each predictor along with the
target for the test 40% — 2 on the B5 data. This indicates that the first 40% of the
observations are used for training and the input contains two lags. This figure shows
that all methods perform well in predicting the target over a one-step prediction
model, since sufficient samples are available for training.
Our experiments indicate that increasing the number of lags does not improve
the performance of the predictors.
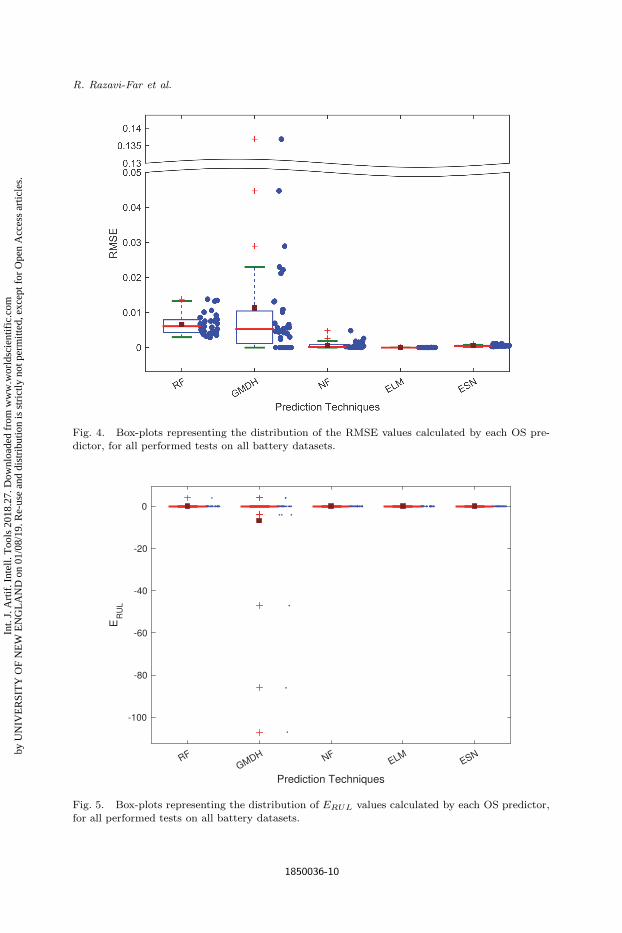
Figure 4 depicts the distribution of the RMSE for each OS predictor for different
tests on all the battery datasets. The boxes represent the distribution range of the
RMSE values (dots) between the first and third quartiles, the solid line represents
the median value of the RMSE for each OS predictor, the dash lines show the
outlier range, the crosses represent the outliers and the solid square represents
the mean of the RMSE values for each OS predictor. Presence of the solid line
in the middle of the box indicates that the values are uniformly distributed. The
predictors are ranked w.r.t. the mean values as ELM, ESN, NF, RF and GMDH.
ELM has the smallest box, which indicates the least variation among the RMSE
values and the most stable predictions. GMDH produces the biggest window and
also has the maximum number of outliers, i.e., the most unstable results.
Figure 5 depicts the distribution of ERUL values for each OS predictor for
different tests on all the batteries’ datasets. A negative (positive) value for ERUL
indicates an early (late) prediction, which means that the prediction profile passes
through the threshold sooner (later) than the actual target profile in terms of cycles.
1850036-9
Int.
J. A
rtif
. Int
ell.
Too
ls 2
018.
27. D
ownl
oade
d fr
om w
ww
.wor
ldsc
ient
ific
.com
by U
NIV
ER
SIT
Y O
F N
EW
EN
GL
AN
D o
n 01
/08/
19. R
e-us
e an
d di
stri
butio
n is
str
ictly
not
per
mitt
ed, e
xcep
t for
Ope
n A
cces
s ar
ticle
s.
December 5, 2018 14:20 IJAIT S0218213018500367 page 10
1st Reading
R. Razavi-Far et al.
Fig. 4. Box-plots representing the distribution of the RMSE values calculated by each OS pre-dictor, for all performed tests on all battery datasets.
Prediction Techniques
RFGMDH NF
ELMESN
ER
UL
-100
-80
-60
-40
-20
0
Fig. 5. Box-plots representing the distribution of ERUL values calculated by each OS predictor,for all performed tests on all battery datasets.
1850036-10
Int.
J. A
rtif
. Int
ell.
Too
ls 2
018.
27. D
ownl
oade
d fr
om w
ww
.wor
ldsc
ient
ific
.com
by U
NIV
ER
SIT
Y O
F N
EW
EN
GL
AN
D o
n 01
/08/
19. R
e-us
e an
d di
stri
butio
n is
str
ictly
not
per
mitt
ed, e
xcep
t for
Ope
n A
cces
s ar
ticle
s.

December 5, 2018 14:20 IJAIT S0218213018500367 page 11
1st Reading
Extreme Learning Machine Based Prognostics of Battery Life
This figure indicates that ELM and NF accurately predict the end of lifecycle.
GMDH has several early predictions. The predictors are ranked in terms of ERUL
as ELM, ESN, NF, RF and GMDH.
The results for the OS predictions show that ELM is the best OS predictor in
terms of RMSE and ERUL, and, thus, it can be selected for OS prediction of the
RUL of the batteries.
4.2. Multi-steps ahead predictions
Various prediction techniques along with the MS prediction strategies (iterative,
DirRec and direct) are used to estimate the RUL of batteries over long horizons.
Figure 6 illustrates the MSP results generated by each predictor for all three
MSP strategies, along with the target for the test 40% — 3 on the B5 data.
Cycles0 20 40 60 80 100 120 140 160
Cap
acity
(A
hr)
0.5
1
1.5
2(a) Iterative Approach: 40% - 3
TargetRFGMDHNFELMESN
Cycles0 20 40 60 80 100 120 140 160
Cap
acity
(A
hr)
0.5
1
1.5
2(b) DirRec Approach: 40% - 3
TargetRFGMDHNFELMESN
Cycles0 20 40 60 80 100 120 140 160
Cap
acity
(A
hr)
0.5
1
1.5
2(c) Direct Approach: 40% - 3
TargetRFGMDHNFELMESN
Threshold40% Training
Threshold40% Training
Threshold40% Training
Fig. 6. Prediction results for three strategies using three input lags and the first 40% of theobservations for training.
1850036-11
Int.
J. A
rtif
. Int
ell.
Too
ls 2
018.
27. D
ownl
oade
d fr
om w
ww
.wor
ldsc
ient
ific
.com
by U
NIV
ER
SIT
Y O
F N
EW
EN
GL
AN
D o
n 01
/08/
19. R
e-us
e an
d di
stri
butio
n is
str
ictly
not
per
mitt
ed, e
xcep
t for
Ope
n A
cces
s ar
ticle
s.

December 5, 2018 14:20 IJAIT S0218213018500367 page 12
1st Reading
R. Razavi-Far et al.
This indicates that the input has three lags and the first 40% of the observations
are used for training. Panels (a) and (b) in the figure show that the iterative and
DirRec strategies achieve large prediction errors for the small sequence of obser-
vations. The error generated at each prediction step propagates through the next
steps and leads to a significant deviation from the target. The direct strategy, on
the other hand, attains better prediction results for small sequences of observations
(see panel c). However, many of the predictors fail to quickly reach the threshold.
Figure 7 illustrates the MSP result generated by each predictor for all three
MSP strategies, along with the target for the test 60% — 3 on the B5 data. This
indicates that the input has three lags and the first 60% of the observations are
used for training. Increasing the length of the sequence of observations improves
Cycles0 50 100 150
Cap
acity
(A
hr)
0.5
1
1.5
2(a) Iterative Approach: 60% - 3
TargetRFGMDHNFELMESN
Cycles0 50 100 150
Cap
acity
(A
hr)
0.5
1
1.5
2(b) DirRec Approach: 60% - 3
TargetRFGMDHNFELMESN
Cycles0 50 100 150
Cap
acity
(A
hr)
0.5
1
1.5
2(c) Direct Approach: 60% - 3
TargetRFGMDHNFELMESN
Threshold60% Training
Threshold60% Training
Threshold60% Training
Fig. 7. Prediction results for three strategies using three input lags and the first 60% of theobservations for training.
1850036-12
Int.
J. A
rtif
. Int
ell.
Too
ls 2
018.
27. D
ownl
oade
d fr
om w
ww
.wor
ldsc
ient
ific
.com
by U
NIV
ER
SIT
Y O
F N
EW
EN
GL
AN
D o
n 01
/08/
19. R
e-us
e an
d di
stri
butio
n is
str
ictly
not
per
mitt
ed, e
xcep
t for
Ope
n A
cces
s ar
ticle
s.
December 5, 2018 14:20 IJAIT S0218213018500367 page 13
1st Reading
Extreme Learning Machine Based Prognostics of Battery Life
RFGMDH NF
ELMESN
RM
SE
00.10.20.3
(a) Iterative Approach
RFGMDH NF
ELMESN
RM
SE
00.10.20.3
(b) DirRec Approach
Prediction Techniques
RFGMDH NF
ELMESN
RM
SE
024
(c) Direct Approach
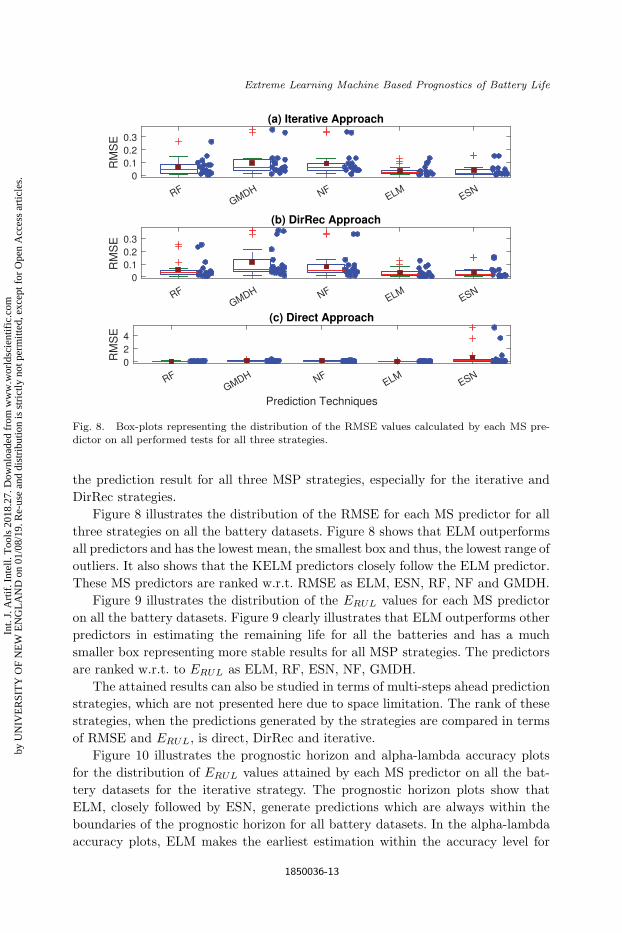
Fig. 8. Box-plots representing the distribution of the RMSE values calculated by each MS pre-dictor on all performed tests for all three strategies.
the prediction result for all three MSP strategies, especially for the iterative and
DirRec strategies.
Figure 8 illustrates the distribution of the RMSE for each MS predictor for all
three strategies on all the battery datasets. Figure 8 shows that ELM outperforms
all predictors and has the lowest mean, the smallest box and thus, the lowest range of
outliers. It also shows that the KELM predictors closely follow the ELM predictor.
These MS predictors are ranked w.r.t. RMSE as ELM, ESN, RF, NF and GMDH.
Figure 9 illustrates the distribution of the ERUL values for each MS predictor
on all the battery datasets. Figure 9 clearly illustrates that ELM outperforms other
predictors in estimating the remaining life for all the batteries and has a much
smaller box representing more stable results for all MSP strategies. The predictors
are ranked w.r.t. to ERUL as ELM, RF, ESN, NF, GMDH.
The attained results can also be studied in terms of multi-steps ahead prediction
strategies, which are not presented here due to space limitation. The rank of these
strategies, when the predictions generated by the strategies are compared in terms
of RMSE and ERUL, is direct, DirRec and iterative.
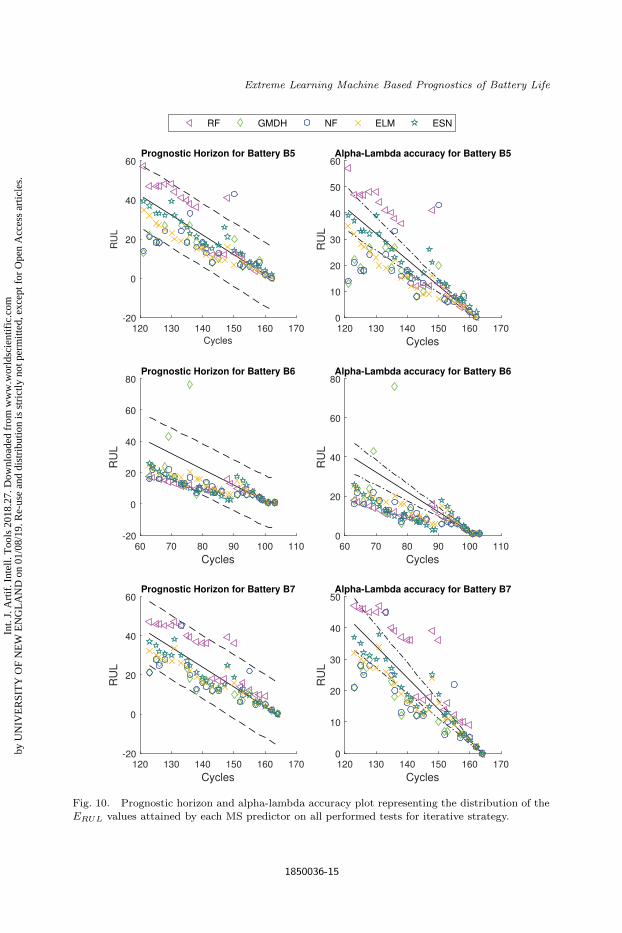
Figure 10 illustrates the prognostic horizon and alpha-lambda accuracy plots
for the distribution of ERUL values attained by each MS predictor on all the bat-
tery datasets for the iterative strategy. The prognostic horizon plots show that
ELM, closely followed by ESN, generate predictions which are always within the
boundaries of the prognostic horizon for all battery datasets. In the alpha-lambda
accuracy plots, ELM makes the earliest estimation within the accuracy level for
1850036-13
Int.
J. A
rtif
. Int
ell.
Too
ls 2
018.
27. D
ownl
oade
d fr
om w
ww
.wor
ldsc
ient
ific
.com
by U
NIV
ER
SIT
Y O
F N
EW
EN
GL
AN
D o
n 01
/08/
19. R
e-us
e an
d di
stri
butio
n is
str
ictly
not
per
mitt
ed, e
xcep
t for
Ope
n A
cces
s ar
ticle
s.

December 5, 2018 14:20 IJAIT S0218213018500367 page 14
1st Reading
R. Razavi-Far et al.
RFGMDH NF
ELMESN
ER
UL
-60-40-20
020
(a) Iterative Approach
RFGMDH NF
ELMESN
ER
UL
-60-40-20
02040
(b) DirRec Approach
Prediction Techniques
RFGMDH NF
ELMESN
ER
UL
-60-40-20
020
(c) Direct Approach
Fig. 9. Box-plots representing the distribution of the ERUL values attained by each MS predictoron all performed tests for all three strategies.
battery datasets and the generated predictions outnumber all other competitors
to fall within the accuracy boundaries. The figure shows that ELM can generate
accurate and reliable predictions, even with a smaller training subset.
The attained results for the MS predictions show that ELM is the best MS
predictor in terms of RMSE, ERUL, prognostic horizon and alpha-lambda accuracy
and thus, it can be selected for MS prediction of the RUL of batteries.
4.3. Fleet-based prognostics
For the purpose of fleet-based prognostics, the combined datasets of the batteries
B5, B6 and B7 are used to generate an overall training subset, which is then used
to estimate the RUL of the battery dataset B18. Both OS and MS predictions
are performed on the battery dataset B18. Only iterative strategy has been used
for the MS predictions, as other techniques are either not suited for a fleet-based
prognostics or computationally challenging.
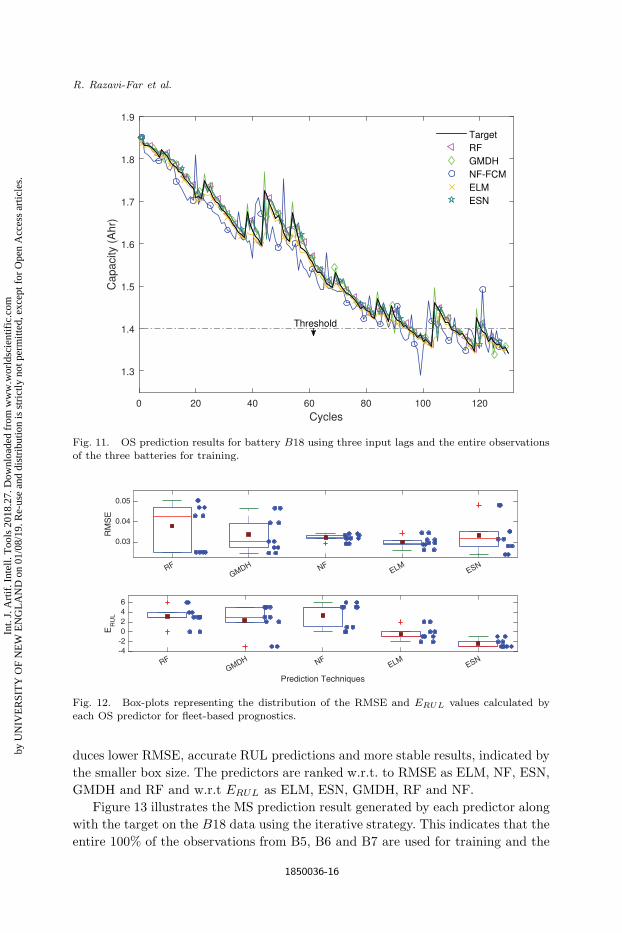
Figure 11 illustrates the OS prediction result generated by each predictor along
with the target on the B18 data. This indicates that the entire 100% of the ob-
servations from B5, B6 and B7 are used for training and the input contains five
lags. This figure shows that the ELM produces predictions close to the target. Both
GMDH and RF show spikes in the predictions, instead.
Figure 12 illustrates the distribution of the RMSE and ERUL values calculated
by each OS predictor for fleet-based prognostics. The figure shows that ELM pro-
1850036-14
Int.
J. A
rtif
. Int
ell.
Too
ls 2
018.
27. D
ownl
oade
d fr
om w
ww
.wor
ldsc
ient
ific
.com
by U
NIV
ER
SIT
Y O
F N
EW
EN
GL
AN
D o
n 01
/08/
19. R
e-us
e an
d di
stri
butio
n is
str
ictly
not
per
mitt
ed, e
xcep
t for
Ope
n A
cces
s ar
ticle
s.
December 5, 2018 14:20 IJAIT S0218213018500367 page 15
1st Reading
Extreme Learning Machine Based Prognostics of Battery Life
Cycles120 130 140 150 160 170
RU
L
-20
0
20
40
60Prognostic Horizon for Battery B5
RF GMDH NF ELM ESN
Cycles120 130 140 150 160 170
RU
L0
10
20
30
40
50
60Alpha-Lambda accuracy for Battery B5
Cycles60 70 80 90 100 110
RU
L
-20
0
20
40
60
80Prognostic Horizon for Battery B6
Cycles60 70 80 90 100 110
RU
L
0
20
40
60
80Alpha-Lambda accuracy for Battery B6
Cycles120 130 140 150 160 170
RU
L
-20
0
20
40
60Prognostic Horizon for Battery B7
Cycles120 130 140 150 160 170
RU
L
0
10
20
30
40
50Alpha-Lambda accuracy for Battery B7
Fig. 10. Prognostic horizon and alpha-lambda accuracy plot representing the distribution of theERUL values attained by each MS predictor on all performed tests for iterative strategy.
1850036-15
Int.
J. A
rtif
. Int
ell.
Too
ls 2
018.
27. D
ownl
oade
d fr
om w
ww
.wor
ldsc
ient
ific
.com
by U
NIV
ER
SIT
Y O
F N
EW
EN
GL
AN
D o
n 01
/08/
19. R
e-us
e an
d di
stri
butio
n is
str
ictly
not
per
mitt
ed, e
xcep
t for
Ope
n A
cces
s ar
ticle
s.
December 5, 2018 14:20 IJAIT S0218213018500367 page 16
1st Reading
R. Razavi-Far et al.
Cycles0 20 40 60 80 100 120
Cap
acity
(A
hr)
1.3
1.4
1.5
1.6
1.7
1.8
1.9
TargetRFGMDHNF-FCMELMESN
Threshold
Fig. 11. OS prediction results for battery B18 using three input lags and the entire observationsof the three batteries for training.
RFGMDH NF
ELMESN
0.03
0.04
0.05
RM
SE
RFGMDH NF
ELMESN
Prediction Techniques
-4-20246
ER
UL
Fig. 12. Box-plots representing the distribution of the RMSE and ERUL values calculated byeach OS predictor for fleet-based prognostics.
duces lower RMSE, accurate RUL predictions and more stable results, indicated by
the smaller box size. The predictors are ranked w.r.t. to RMSE as ELM, NF, ESN,
GMDH and RF and w.r.t ERUL as ELM, ESN, GMDH, RF and NF.
Figure 13 illustrates the MS prediction result generated by each predictor along
with the target on the B18 data using the iterative strategy. This indicates that the
entire 100% of the observations from B5, B6 and B7 are used for training and the
1850036-16
Int.
J. A
rtif
. Int
ell.
Too
ls 2
018.
27. D
ownl
oade
d fr
om w
ww
.wor
ldsc
ient
ific
.com
by U
NIV
ER
SIT
Y O
F N
EW
EN
GL
AN
D o
n 01
/08/
19. R
e-us
e an
d di
stri
butio
n is
str
ictly
not
per
mitt
ed, e
xcep
t for
Ope
n A
cces
s ar
ticle
s.
December 5, 2018 14:20 IJAIT S0218213018500367 page 17
1st Reading
Extreme Learning Machine Based Prognostics of Battery Life
Cycles0 20 40 60 80 100 120
Cap
acity
(A
hr)
1.3
1.4
1.5
1.6
1.7
1.8
1.9
2
TargetRFGMDHNFELMESN
Threshold
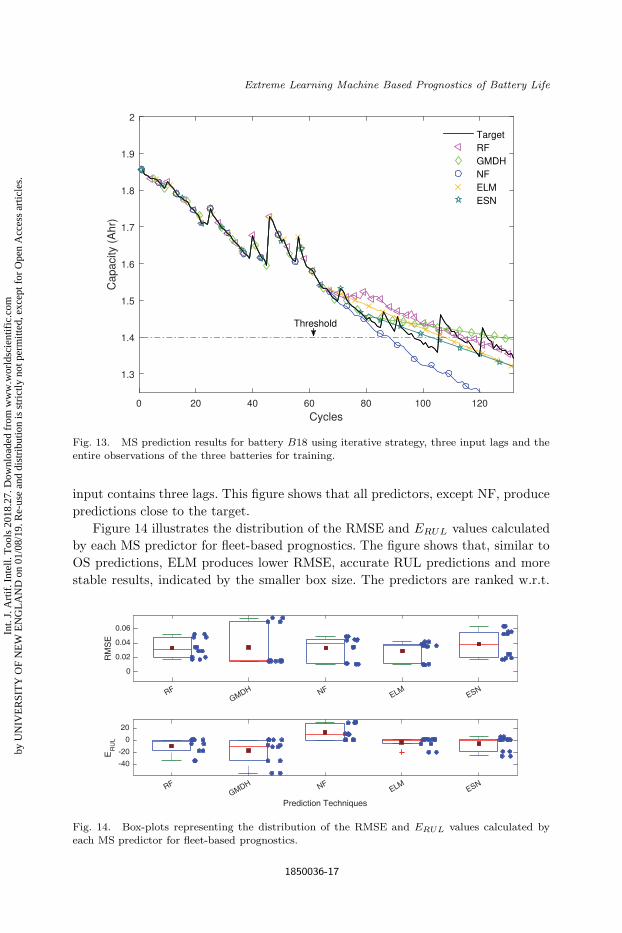
Fig. 13. MS prediction results for battery B18 using iterative strategy, three input lags and theentire observations of the three batteries for training.
input contains three lags. This figure shows that all predictors, except NF, produce
predictions close to the target.
Figure 14 illustrates the distribution of the RMSE and ERUL values calculated
by each MS predictor for fleet-based prognostics. The figure shows that, similar to
OS predictions, ELM produces lower RMSE, accurate RUL predictions and more
stable results, indicated by the smaller box size. The predictors are ranked w.r.t.
RFGMDH NF
ELMESN
0
0.02
0.04
0.06
RM
SE
RFGMDH NF
ELMESN
Prediction Techniques
-40
-20
0
20
ER
UL
Fig. 14. Box-plots representing the distribution of the RMSE and ERUL values calculated byeach MS predictor for fleet-based prognostics.
1850036-17
Int.
J. A
rtif
. Int
ell.
Too
ls 2
018.
27. D
ownl
oade
d fr
om w
ww
.wor
ldsc
ient
ific
.com
by U
NIV
ER
SIT
Y O
F N
EW
EN
GL
AN
D o
n 01
/08/
19. R
e-us
e an
d di
stri
butio
n is
str
ictly
not
per
mitt
ed, e
xcep
t for
Ope
n A
cces
s ar
ticle
s.

December 5, 2018 14:20 IJAIT S0218213018500367 page 18
1st Reading
R. Razavi-Far et al.
Cycles60 70 80 90 100
RU
L
-20
0
20
40
60
80
100Prognostic Horizon for Battery B18
RF GMDH NF ELM ESN
Cycles60 70 80 90 100
RU
L
0
20
40
60
80
100Alpha-Lambda accuracy for Battery B18
Fig. 15. Prognostic horizon and alpha-lambda accuracy plot representing the distribution of theERUL values attained by each MS predictor for iterative strategy.
to RMSE as ELM, NF, ESN, GMDH and RF and w.r.t. ERUL as ELM, ESN, RF,
GMDH and NF.
Figure 15 illustrates the prognostic horizon and alpha-lambda accuracy plots
for the distribution of ERUL values attained by each MS predictor on the battery
B18 dataset for the iterative strategy. The prognostic horizon plots clearly show
that ELM is the only predictor whose predictions are always within the boundaries
of the prognostic horizon for all battery datasets. In the alpha-lambda accuracy
plots, ELM makes the earliest predictions within the accuracy level for battery
datasets and on aggregate, predicts EOL within the accuracy boundaries more than
other predictors. This indicates that ELM is an excellent predictor for fleet-based
prognostics, producing accurate and reliable predictions.
5. Conclusions
This paper proposes an efficient prognostic scheme for one-step and multi-step
ahead predictions of the remaining useful life of Lithium-ion batteries. An Extreme
Learning Machine-based prediction technique has been devised along with various
one-step and multi-step prediction strategies to estimate the RUL of Lithium-ion
batteries. The primary goal of the paper is to deliver a fast and efficient data-
driven prognostic scheme to predict the remaining life of batteries over short and
long time horizons, even when insufficient observations are available. The attained
results show that ELM prediction techniques are fast when compared to other
competitors and generate accurate prediction profiles. The ELM predictive model
outperforms other competitors for the one-step ahead and the multi-step ahead
1850036-18
Int.
J. A
rtif
. Int
ell.
Too
ls 2
018.
27. D
ownl
oade
d fr
om w
ww
.wor
ldsc
ient
ific
.com
by U
NIV
ER
SIT
Y O
F N
EW
EN
GL
AN
D o
n 01
/08/
19. R
e-us
e an
d di
stri
butio
n is
str
ictly
not
per
mitt
ed, e
xcep
t for
Ope
n A
cces
s ar
ticle
s.

December 5, 2018 14:20 IJAIT S0218213018500367 page 19
1st Reading
Extreme Learning Machine Based Prognostics of Battery Life
RUL predictions. The ELM predictive model also outperforms the competitors for
the fleet-based prognostics.
The implementation of an effective prediction model can often be challenging.
The performance of data driven prediction models highly depend on the availability
of observations. However, excessive amount of information can often lead to over-
fitting of data. Observations for a time-series data, similar to the ones used in
this paper, often generates different predictive models for different time intervals.
Hence, using the entire set of observations as a training dataset may not be ideal
to generate a prediction model. The proposed scheme in the paper is designed for a
prediction model in a standard batch environment. It could be easily transformed
into an online just-in-time environment using online variants of the ELM algorithm.
An online prediction model for estimating the remaining useful life of the battery,
where new observations are fed into the system, one at a time or in batches, would be
an interesting direction for the future research in order to improve the prognostics
of battery life.
References
1. J. Zhang and J. Lee, A review on prognostics and health monitoring of li-ion battery,Jour. of Power Sources 196 (2011) 6007–6014.
2. K. Goebel, B. Saha, A. Saxena, J. R. Celaya and J. P. Christophersen, Prognosticsin battery health management, IEEE Instrum. Meas. Mag. 8 (2008) 33–40.
3. T. Benkedjouhb, K. Medjahera, N. Zerhounia and S. Rechakc, Remaining useful lifeestimation based on nonlinear feature reduction and support vector regression, Engi-neering Applications of Artificial Intelligence 26(7) (2013) 1751–1760.
4. Y. Zhang, G. W. Gantt, M. J. Rychlinski, R. M. Edwards, J. J. Correia and C. E.Wolf, Connected vehicle diagnostics and prognostics, concept, and initial practice,IEEE Transactions on Reliability 58(2) (2009) 286–294.
5. G. Vachtsevanos, F. Lewis, M. Roemer, A. Hess and B. Wu, Intelligent Fault Diagnosisand Prognosis for Engineering Systems (John Wiley & Sons, Inc., Hoboken, NJ, USA,2006).
6. A. Widodo, M.-C. Shim, W. Caesarendra and B.-S. Yang, Intelligent prognostics forbattery health monitoring based on sample entropy, Expert Systems with Applications38(9) (2011) 11763 – 11769.
7. Z. Ye, L. Zhao, Z. Wang, P. Ma, X. Su, L. Pang and M. Pecht, A dual-level approach forlithium-ion battery RUL prognosis, in IEEE Conf. Prognostics & Health Management(Beijing, China, 2015), pp. 1–6.
8. D. Liu, J. Pang, J. Zhou, Y. Peng and M. Pecht, Prognostics for state of healthestimation of lithium-ion batteries based on combination Gaussian process functionalregression, Microelectronics Reliability 53 (2013) 832–839.
9. S. Malkhandi, Fuzzy logic-based learning system and estimation of state-of-chargeof lead-acid battery, Engineering Applications of Artificial Intelligence 19 (2006)479–485.
10. K. Chao and J. Chen, State-of-health estimator based-on extension theory witha learning mechanism for lead-acid batteries, Expert Systems with Applications 38(2011) 15183–15193.
1850036-19
Int.
J. A
rtif
. Int
ell.
Too
ls 2
018.
27. D
ownl
oade
d fr
om w
ww
.wor
ldsc
ient
ific
.com
by U
NIV
ER
SIT
Y O
F N
EW
EN
GL
AN
D o
n 01
/08/
19. R
e-us
e an
d di
stri
butio
n is
str
ictly
not
per
mitt
ed, e
xcep
t for
Ope
n A
cces
s ar
ticle
s.

December 5, 2018 14:20 IJAIT S0218213018500367 page 20
1st Reading
R. Razavi-Far et al.
11. D. E. Acuna, M. E. Orchard, J. F. Silva and A. Perez, Multiple-imputation-particle-filtering for uncertainty characterization in battery state-of-charge estimation prob-lems with missing measurement data: Performance analysis and impact on prognosticalgorithms, Int. J. of Prognostics & Health Management 8 (2015) 1–12.
12. L. Liao and F. Kottig, A hybrid framework combining data-driven and model-basedmethods for system remaining useful life prediction, Applied Soft Computing 44 (2016)191–199.
13. B. Saha, K. Goebel and J. Christophersen, Comparison of prognostic algorithms forestimating remaining useful life of batteries, Transactions of the Institute of Measure-ment and Control 31(3-4) (2009) 293–308.
14. Z. Zhao, Q. Quan and K.-Y. Cai, A profust reliability based approach to prognosticsand health management, IEEE Transactions on Reliability 63(1) (2014) 26–41.
15. R. Razavi-Far, S. Chakrabarti and M. Saif, Multi-step parallel-strategy for estimatingthe remaining useful life of batteries, in 2017 IEEE 30th Canadian Conf. on Electricaland Computer Engineering (CCECE) (2017), pp. 1–4.
16. B. Saha, K. Goebel, S. Poll and J. Christophersen, Prognostics methods for batteryhealth monitoring using a bayesian framework, IEEE Trans. on Instrumentation andMeasurement 58 (2009) 291–296.
17. R. Razavi-Far, S. Chakrabarti, M. Saif and E. Zio, An integrated imputation-prediction scheme for prognostics of battery data with missing observations, ExpertSystems with Applications 115 (2019) 709–723.
18. B. Saha and K. Goebel, Modeling li-ion battery capacity depletion in a particle fil-tering framework, in the Annual Conf. of the PHM Society (San Diego, CA, 2009).
19. D. Liu, Y. Luo, J. Liu, Y. Peng, L. Guo and M. Pecht, Lithium-ion battery remaininguseful life estimation based on fusion nonlinear degradation AR model and RPFalgorithm, Neural Computing and Applications 25(3-4) (2013) 557–572.
20. J. Liu, W. Wang and F. Golnaraghi, A multi-step predictor with a variable inputpattern for system state forecasting, Mech. Syst. Signal Process 23 (2009) 1586–1599.
21. A. Saxena, J. Celaya, I. Roychoudhury, S. Saha, B. Saha and K. Goebel, Designingdata-driven battery prognostic approaches for variable loading profiles: Some lessonslearned, in European Conf. of Prognostics & Health Management (Dresden, Germany,2012), pp. 1–11.
22. X. S. Si, An adaptive prognostic approach via nonlinear degradation modeling: Ap-plication to battery data, IEEE Transactions on Industrial Electronics 62(8) (2015)5082–5096.
23. X. Xu, Z. Li and N. Chen, A hierarchical model for lithium-ion battery degradationprediction, IEEE Transactions on Reliability 65(1) (2016) 310–325.
24. X. Hu, J. Jiang, D. Cao and B. Egardt, Battery health prognosis for electric vehiclesusing sample entropy and sparse Bayesian predictive modeling, IEEE Transactionson Industrial Electronics 63(4) (2016) 2645–2656.
25. W. Wang, D. Wang, X. Wang, T. Li, R. Ahmed, S. Habibi and A. Emadi, Comparisonof kalman filter-based state of charge estimation strategies for li-ion batteries, in 2016IEEE Transportation Electrification Conf. and Expo (ITEC ) (Dearborn, MI, 2016),pp. 1–6.
26. M. Jouin, R. Gouriveau, D. Hissel, M. Pera and N. Zerhouni, Particle filter-basedprognostics: Review, discussion and perspectives, Mechanical Systems and Signal Pro-cessing 72-73 (2016) 2–31,
27. C. S. K. Dash, P. Sahoo, S. Dehuri and S.-B. Cho, An empirical analysis of evolvedradial basis function networks and support vector machines with mixture of kernels,International Journal on Artificial Intelligence Tools 24(4) (2015) 1550013.
1850036-20
Int.
J. A
rtif
. Int
ell.
Too
ls 2
018.
27. D
ownl
oade
d fr
om w
ww
.wor
ldsc
ient
ific
.com
by U
NIV
ER
SIT
Y O
F N
EW
EN
GL
AN
D o
n 01
/08/
19. R
e-us
e an
d di
stri
butio
n is
str
ictly
not
per
mitt
ed, e
xcep
t for
Ope
n A
cces
s ar
ticle
s.
December 5, 2018 14:20 IJAIT S0218213018500367 page 21
1st Reading
Extreme Learning Machine Based Prognostics of Battery Life
28. T. Bohm, Remaining useful life prediction for railway switch engines using classi-fication techniques, International Journal of Prognostics and Health Management 8(Special Issue 7) (2017).
29. R. G. Gore, J. Li, M. T. Manry, L. M. Liu, C. Yu and J. Wei, Iterative design of neuralnetwork classifiers through regression, International Journal on Artificial IntelligenceTools 14(1&2) (2005) 281–301.
30. M. Ismail, R. Dlyma, A. Elrakaybi, R. Ahmed and S. Habibi, Battery state of chargeestimation using an artificial neural network, in 2017 IEEE Transportation Electrifi-cation Conf. and Expo (ITEC ) (Chicago, IL, 2017), pp. 342–349.
31. R. Razavi-Far, M. Farajzadeh-Zanjani, S. Chakrabarti and M. Saif, Data-driven prog-nostic techniques for estimation of the remaining useful life of lithium-ion batteries,in 2016 IEEE Int. Conf. on Prognostics and Health Management (ICPHM ) (Ottawa,ON, 2016), pp. 1–8.
32. R. Razavi-Far, S. Chakrabarti and M. Saif, Multi-step-ahead prediction techniquesfor lithium-ion batteries condition prognosis, in 2016 IEEE Int. Conf. on Systems,Man, and Cybernetics (SMC ) (2016), pp. 4675–4680.
33. Y. Liu, G. Zhao and X. Peng, A fusion prognostic approach based on multi-kernelrelevance vector machine and Bayesian model averaging, in Proc. of 2016 Prognos-tics and System Health Management Conf. (PHM-Chengdu 2016 ) (Chengdu, 2016),pp. 1–6.
34. J. Yang, Z. Peng, H. Wang, H. Yuan and L. Wu, The remaining useful life estima-tion of lithium-ion battery based on improved extreme learning machine algorithm,International Journal of Electrochemical Science 13(5) (2018) 4991–5004.
35. G. B. Huang, H. Zhou, X. Ding and R. Zhang, Extreme learning machine for regressionand multiclass classification, IEEE Transactions on Systems, Man, and Cybernetics —Part B: Cybernetics 45(2) (2012) 513–529.
36. J. J. Carrasco, M. Millan-Giraldo, J. Caravaca, P. Escandell-Montero, J. M. Martınez-Martınez and E. Soria-Olivas, ELM regularized method for classification problems,International Journal on Artificial Intelligence Tools 25(1) (2016) 1550026.
37. R. Razavi-Far, E. Hallaji, M. Saif and L. Rueda, A hybrid scheme for fault diagnosiswith partially labeled sets of observations, in 2017 16th IEEE Int. Conf. on MachineLearning and Applications (ICMLA) (2017), pp. 61–67.
38. H. Takagi and I. Hayashi, Artificial neural network driven fuzzy reasoning, Int. J.Approx. Reason. 5(3) (1991) 191–212.
39. A. Hasiloglu, M. Yilmaz, O. Comakli and Ismail Ekmekci, Adaptive neuro-fuzzymodeling of transient heat transfer in circular duct air flow, Int. J. of ThermalSciences 43(11) (2004) 1075–1090.
40. J.-S. Jang, ANFIS: Adaptive-network-based fuzzy inference system, IEEE Transac-tions on Systems, Man, and Cybernetics 23(3) (1993) 665–685.
41. A. Ivakhnenko, The group method of data handling in long-range forecasting, Technol.Forecast. Soc. Change 12(2-3) (1978) 213–217.
42. L. Breiman, Random forests, Machine Learning 45(1) (2001) 5–32.43. H. Jaeger, The echo state approach to analyzing and training recurrent neural net-
works, Technical Report GMD Report 148, German National Research Center forInformation Technology 148 (2001).
44. B. Saha and K. Goebel, Battery data set: Nasa ames prognostics data repository,in http://ti.arc.nasa.gov/project/prognostic-data-repository (NASA Ames, MoffettField, CA, 2007).
45. S. Lee, H. Cui, M. Rezvanizaniani and J. Ni, Battery prognostics: SOC and SOHprediction, in Proc. of the ASME Int. Manufacturing Science and Engineering Conf.(Notre Dame, Indiana, USA, 2012), pp. 1–7.
1850036-21
Int.
J. A
rtif
. Int
ell.
Too
ls 2
018.
27. D
ownl
oade
d fr
om w
ww
.wor
ldsc
ient
ific
.com
by U
NIV
ER
SIT
Y O
F N
EW
EN
GL
AN
D o
n 01
/08/
19. R
e-us
e an
d di
stri
butio
n is
str
ictly
not
per
mitt
ed, e
xcep
t for
Ope
n A
cces
s ar
ticle
s.

December 5, 2018 14:20 IJAIT S0218213018500367 page 22
1st Reading
R. Razavi-Far et al.
46. T. Chow and C. Leung, Nonlinear autoregressive integrated neural network modelfor short-term load forecasting, in IEE Procs. — Generation, Transmission andDistribution 143(5) (1996) 500–506.
47. S. Taieb, A. Sorjamaa and G. Bontempi, Multiple-output modeling for multi-step-ahead time series forecasting, Neurocomputing 73(10-12) (2010) 1950–1957.
48. V. T. Tran, B.-S. Yang and A. C. C. Tan, Multi-step ahead direct prediction for themachine condition prognosis using regression trees and neuro-fuzzy systems, ExpertSystems with Applications 36(5) (2009) 9378–9387.
49. R. Gouriveau and N. Zerhouni, Connexionist-systems-based long term prediction ap-proaches for prognostics, IEEE Transactions on Reliability 61(4) (2012) 909–920.
50. Y. L. He, Z. Q. Geng and Q. X. Zhu, A data-attribute-space-oriented double parallel(DASODP) structure for enhancing extreme learning machine: Applications to re-gression datasets, Engineering Applications of Artificial Intelligence 41 (2015) 65–74.
51. A. Saxena, J. Celaya, B. Saha, S. Saha and K. Goebel, On applying the prognosticperformance metrics, in Int. Conf. on Prognostics and Health Management (PHM )Annual Conf. of the Prognostics and Health Management Society (San Diego, USA,2009).
1850036-22
Int.
J. A
rtif
. Int
ell.
Too
ls 2
018.
27. D
ownl
oade
d fr
om w
ww
.wor
ldsc
ient
ific
.com
by U
NIV
ER
SIT
Y O
F N
EW
EN
GL
AN
D o
n 01
/08/
19. R
e-us
e an
d di
stri
butio
n is
str
ictly
not
per
mitt
ed, e
xcep
t for
Ope
n A
cces
s ar
ticle
s.
Related Documents


![NASA Prognostics[1]](https://static.cupdf.com/doc/110x72/547f2aaab4af9fa5158b5833/nasa-prognostics1.jpg)