Axiom Smart Datalogger for Extreme Environments Operator’s Manual 1.800.548.4264 | www.ftsinc.com 700-Axiom Man Rev.10 15 Jul 2019 EXTREME ENVIRONMENTS. EXTREMELY RELIABLE.

Welcome message from author
This document is posted to help you gain knowledge. Please leave a comment to let me know what you think about it! Share it to your friends and learn new things together.
Transcript

Axiom Smart Datalogger for Extreme Environments
Operator’s Manual
1.800.548.4264 | www.ftsinc.com 700-Axiom Man Rev.10 15 Jul 2019
EXTREME ENVIRONMENTS. EXTREMELY RELIABLE.

Contact Information
Canadian Headquarters:
1065 Henry Eng Place
Victoria, BC | V9B 6B2 | Canada
www.ftsinc.com
Toll-free: 1.800.548.4264
Local: 250.478.5561
Technical support portal: http://support.ftsinc.com
Email: [email protected]
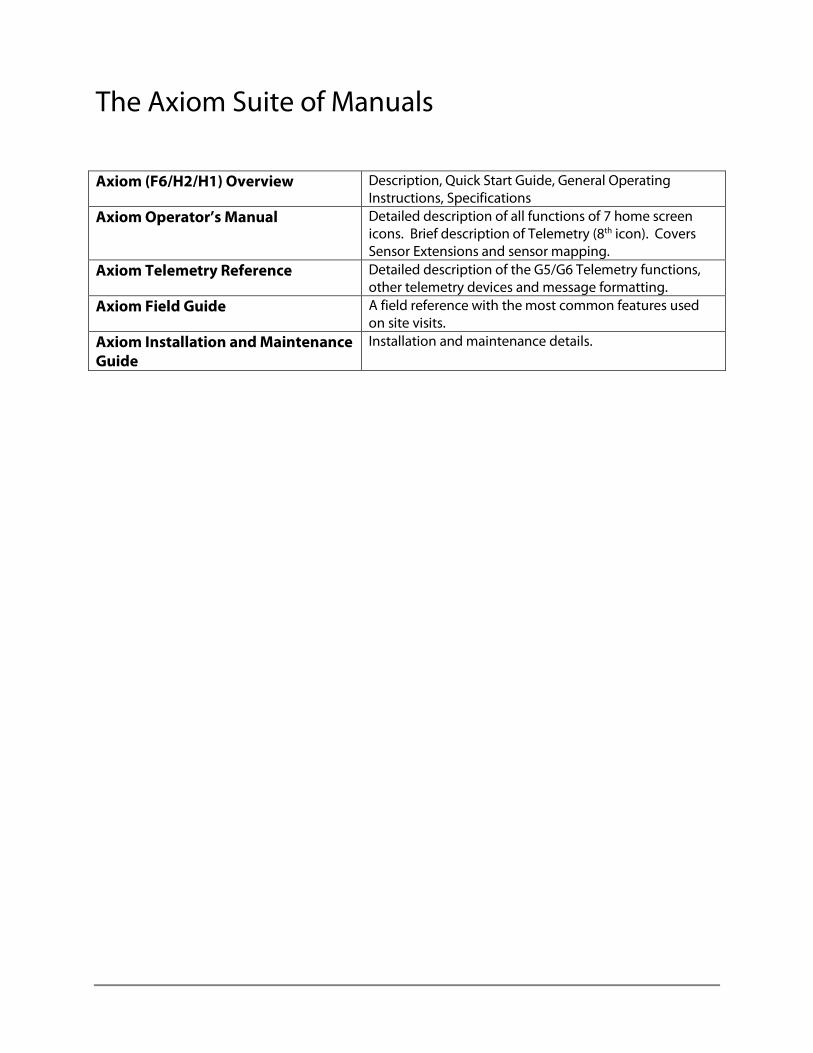
The Axiom Suite of Manuals
Axiom (F6/H2/H1) Overview Description, Quick Start Guide, General Operating Instructions, Specifications
Axiom Operator’s Manual Detailed description of all functions of 7 home screen icons. Brief description of Telemetry (8th icon). Covers Sensor Extensions and sensor mapping.
Axiom Telemetry Reference Detailed description of the G5/G6 Telemetry functions, other telemetry devices and message formatting.
Axiom Field Guide A field reference with the most common features used on site visits.
Axiom Installation and Maintenance Guide
Installation and maintenance details.
i
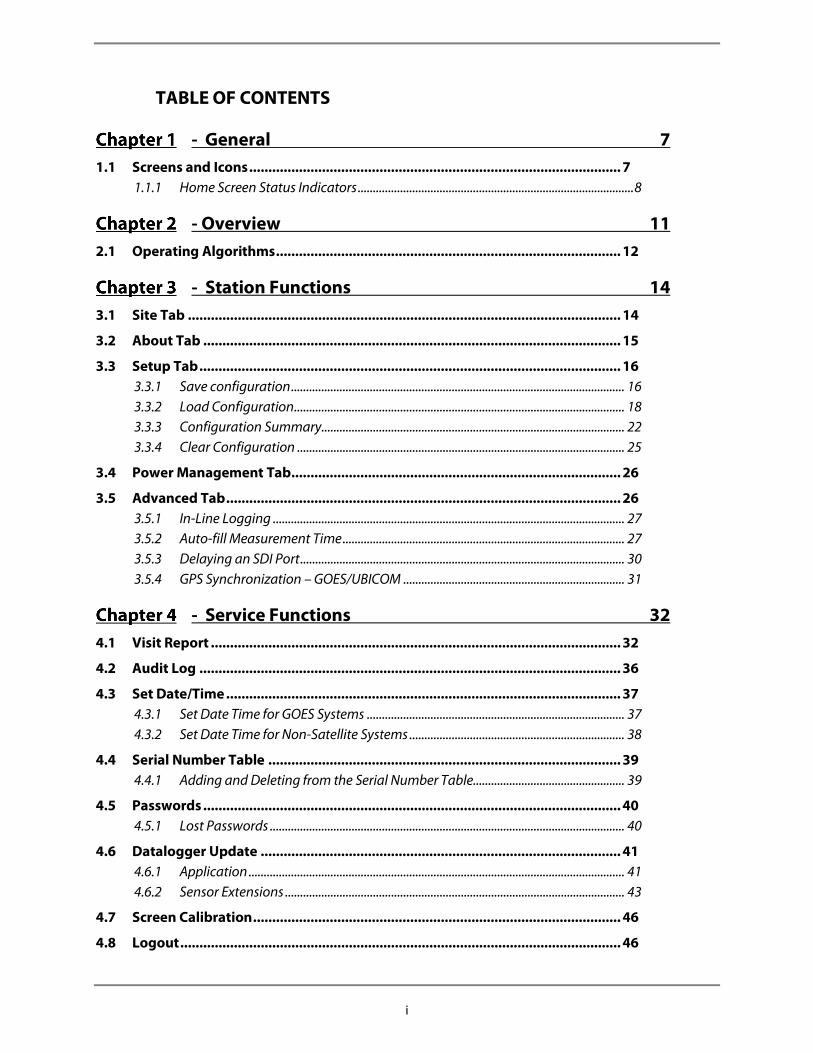
TABLE OF CONTENTS
- General 7
1.1 Screens and Icons ................................................................................................. 7 1.1.1 Home Screen Status Indicators ........................................................................................... 8
- Overview 11
2.1 Operating Algorithms .......................................................................................... 12
- Station Functions 14
3.1 Site Tab ................................................................................................................. 14
3.2 About Tab ............................................................................................................. 15
3.3 Setup Tab .............................................................................................................. 16 3.3.1 Save configuration .............................................................................................................. 16 3.3.2 Load Configuration ............................................................................................................. 18 3.3.3 Configuration Summary .................................................................................................... 22 3.3.4 Clear Configuration ............................................................................................................ 25
3.4 Power Management Tab ...................................................................................... 26
3.5 Advanced Tab ....................................................................................................... 26 3.5.1 In-Line Logging .................................................................................................................... 27 3.5.2 Auto-fill Measurement Time ............................................................................................. 27 3.5.3 Delaying an SDI Port ........................................................................................................... 30 3.5.4 GPS Synchronization – GOES/UBICOM ......................................................................... 31
- Service Functions 32
4.1 Visit Report ........................................................................................................... 32
4.2 Audit Log .............................................................................................................. 36
4.3 Set Date/Time ....................................................................................................... 37 4.3.1 Set Date Time for GOES Systems ..................................................................................... 37 4.3.2 Set Date Time for Non-Satellite Systems ....................................................................... 38
4.4 Serial Number Table ............................................................................................ 39 4.4.1 Adding and Deleting from the Serial Number Table.................................................. 39
4.5 Passwords ............................................................................................................. 40 4.5.1 Lost Passwords ..................................................................................................................... 40
4.6 Datalogger Update .............................................................................................. 41 4.6.1 Application ............................................................................................................................ 41 4.6.2 Sensor Extensions ................................................................................................................ 43
4.7 Screen Calibration ................................................................................................ 46
4.8 Logout ................................................................................................................... 46

ii
- Sensors 47
5.1 Adding a Sensor ................................................................................................... 48
5.2 Sensor Setup - General ........................................................................................ 49 5.2.1 Restrictions on Sensor Variable Names ......................................................................... 50 5.2.2 In-line Logging ..................................................................................................................... 50
5.3 Internal Sensor Setup .......................................................................................... 53 5.3.1 Battery .................................................................................................................................... 53 5.3.2 Solar Panel ............................................................................................................................. 53 5.3.3 Case Temperature(TCase) ................................................................................................. 54
5.4 Dedicated Sensors................................................................................................ 55 5.4.1 Rain (RNIN) ............................................................................................................................ 55 5.4.2 Wind ........................................................................................................................................ 58 5.4.3 Air ............................................................................................................................................. 59 5.4.4 Fuel stick ................................................................................................................................. 60
5.5 Sensor Extensions ................................................................................................ 62
5.6 SDI Generic Sensor Extension ............................................................................. 63 5.6.1 Command Tab ..................................................................................................................... 64 5.6.2 Conditional Measurement Tab ........................................................................................ 66
5.7 Stage sensor extension ........................................................................................ 68 5.7.1 Sensor Tab ............................................................................................................................. 68 5.7.2 Stage Tab ............................................................................................................................... 68 5.7.3 Temp Tab (Temperature) ................................................................................................... 70 5.7.4 Stage Sensor Display Screen ............................................................................................. 71 5.7.5 Set Stage/Clear Offset ......................................................................................................... 71
5.8 Shaft Encoder Sensor Extension ......................................................................... 75 5.8.1 Sensor Tab ............................................................................................................................. 75 5.8.2 Stage Tab ............................................................................................................................... 75 5.8.3 Optional Field Tab ............................................................................................................... 77 5.8.4 Shaft Sensor Display Screen.............................................................................................. 77 5.8.5 Set Stage/Clear Offset ......................................................................................................... 78
5.9 SDI-PT Sensor Extension (FTS Pressure Transducer) ......................................... 82 5.9.1 Sensor Tab ............................................................................................................................. 82 5.9.2 Stage Tab ............................................................................................................................... 82 5.9.3 Temp Tab ............................................................................................................................... 84 5.9.4 Conversion Tab .................................................................................................................... 84 5.9.5 SDI-PT Sensor Display Screen ........................................................................................... 85 5.9.6 Set Stage Values ................................................................................................................... 86
5.10 SDI-AM Sensor Extension .................................................................................... 89 5.10.1 Sensor Tab ............................................................................................................................. 89 5.10.2 Sched Tab............................................................................................................................... 89

iii
5.10.3 Analog Input Settings ......................................................................................................... 90 5.10.4 Power Output Settings ....................................................................................................... 91 5.10.5 Excitation output settings ................................................................................................. 92 5.10.6 Counter Settings .................................................................................................................. 93 5.10.7 Display Screen ...................................................................................................................... 94
5.11 Tavis Sensor Extension ........................................................................................ 95 5.11.1 Sensor Tab ............................................................................................................................. 95 5.11.2 Stage Tab ............................................................................................................................... 95 5.11.3 Temp Tab ............................................................................................................................... 96 5.11.4 Display Screen ...................................................................................................................... 97 5.11.5 Setting Stage Offset Values .............................................................................................. 98
5.12 SDI-RMY Sensor Extension .................................................................................. 101 5.12.1 Sensor Tab ........................................................................................................................... 101 5.12.2 Inst Tab (Instantaneous wind speed and direction) ................................................. 101 5.12.3 Avg Tab (Scalar and/or Vector Averaging Settings) ................................................ 103 5.12.4 PK Read Tab (Peak Reading) ........................................................................................... 104 5.12.5 Pk Reset Tab (Peak Reset Interval Settings) ................................................................ 105 5.12.6 Units Tab .............................................................................................................................. 105 5.12.7 SDI-RMY Sensor Display Screen ..................................................................................... 106
5.13 DigiTemp Sensor Extension ................................................................................ 107 5.13.1 Sensor Tab ........................................................................................................................... 107 5.13.2 Temp Tab (Temperature Tab) ........................................................................................ 107 5.13.3 DigiTemp Sensor Display Screen ................................................................................... 108
5.14 SR50 Sensor Extension ........................................................................................ 109 5.14.1 Sensor Tab ........................................................................................................................... 109 5.14.2 Schedule Tab ....................................................................................................................... 109 5.14.3 Distance Tab ....................................................................................................................... 110 5.14.4 Calcs Tab (Calculations) .................................................................................................. 111 5.14.5 SR Snow Sensor Screen..................................................................................................... 111
5.15 WindSonic Sensor Extension ............................................................................... 112 5.15.1 Sensor Tab ........................................................................................................................... 112 5.15.2 Wind Tab .............................................................................................................................. 113 5.15.3 Units Tab .............................................................................................................................. 114
5.16 Radar Stage Sensor – Sensor Extension ............................................................. 116 5.16.1 Sensor Tab ........................................................................................................................... 116 5.16.2 Stage Tab ............................................................................................................................. 117 5.16.3 Schedule Tab ....................................................................................................................... 117
5.17 Bubbler Sensor Extension ................................................................................... 119 5.17.1 Sensor Tab ........................................................................................................................... 119 5.17.2 Stage Tab ............................................................................................................................. 119 5.17.3 SETUP Tab ............................................................................................................................ 121

iv
5.17.4 Purge Tab ............................................................................................................................. 121 5.17.5 Bubbler Sensor Screen ...................................................................................................... 122 5.17.6 Conduct a Manual Purge................................................................................................. 123 5.17.7 Set Stage and Calculate/Clear Offset ........................................................................... 123
5.18 SDI-THS Sensor Extension ................................................................................... 127 5.18.1 Sensor Tab ........................................................................................................................... 127 5.18.2 Setup Screen ........................................................................................................................ 127 5.18.3 Schedule Screen ................................................................................................................. 128
5.19 Deleting Sensors. ................................................................................................. 129
SDI 12 Functions 130
6.1 Defined Sensors ................................................................................................... 131
6.2 Detecting SDI Sensors .......................................................................................... 131
6.3 SDI Sensor Addresses........................................................................................... 132
6.4 Mapping SDI Sensors ........................................................................................... 132 6.4.1 Mapping a Sensor to a Previously Defined Sensor ................................................... 132 6.4.2 Create a Definition for a NEW Sensor ........................................................................... 133 6.4.3 Add Sensor and Map to it ................................................................................................ 134
6.5 Changing an SDI sensor address ......................................................................... 137
6.6 SDI Transparent Mode ......................................................................................... 138 6.6.1 Notation for SDI commands ........................................................................................... 138 6.6.2 Common SDI commands ................................................................................................ 139
Processes 142
7.1 Ordering Processess............................................................................................. 143
7.2 Built-in Data Points .............................................................................................. 145
7.3 Restrictions on Process (Data Point) Names ...................................................... 146
7.4 Maximum and Minimum Process ........................................................................ 147 7.4.1 General Settings Tab ......................................................................................................... 147 7.4.2 Logging Settings Tab ........................................................................................................ 149
7.5 Peak Wind Processes ............................................................................................ 151
7.6 Timed Peak Wind Process .................................................................................... 152 7.6.1 Example Timed Peak Process Setup ............................................................................. 153
7.7 Running Peak Wind Process ................................................................................ 154 7.7.1 Running Peak Process Example ..................................................................................... 155
7.8 Delta ...................................................................................................................... 156 7.8.1 Delta Process Example ..................................................................................................... 158
7.9 Average Process ................................................................................................... 159 7.9.1 Average Calculations........................................................................................................ 159
v
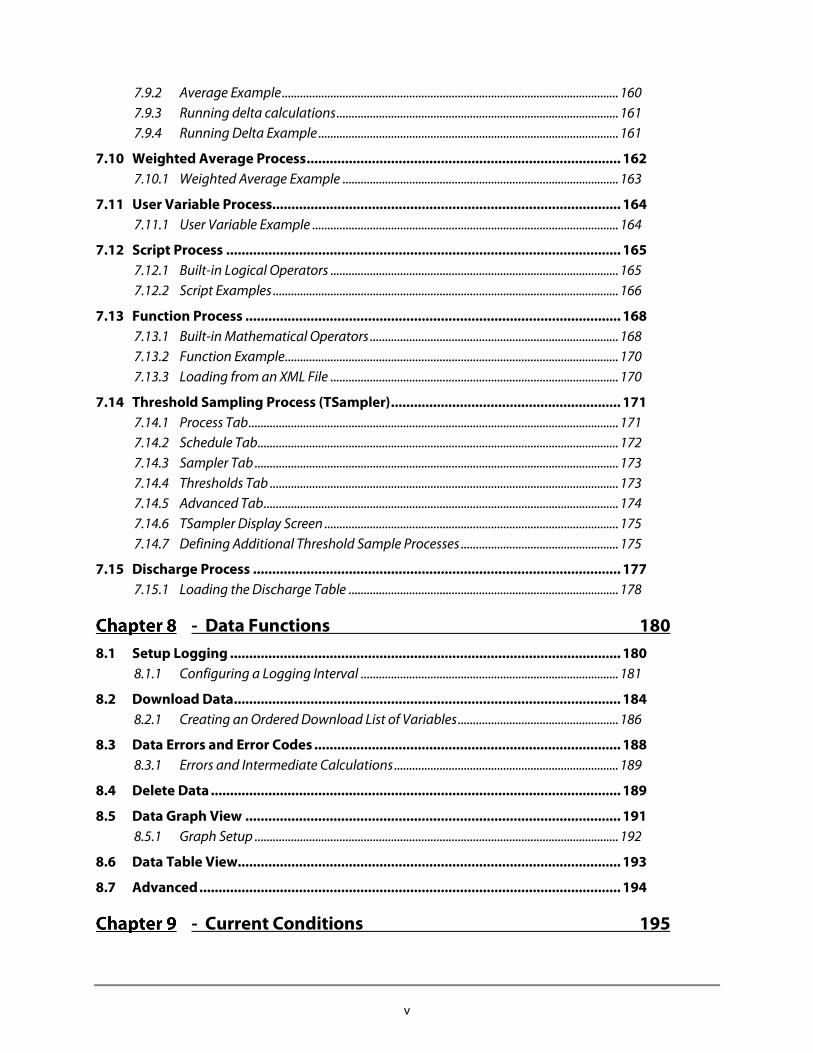
7.9.2 Average Example ............................................................................................................... 160 7.9.3 Running delta calculations ............................................................................................. 161 7.9.4 Running Delta Example ................................................................................................... 161
7.10 Weighted Average Process .................................................................................. 162 7.10.1 Weighted Average Example ........................................................................................... 163
7.11 User Variable Process........................................................................................... 164 7.11.1 User Variable Example ..................................................................................................... 164
7.12 Script Process ....................................................................................................... 165 7.12.1 Built-in Logical Operators ............................................................................................... 165 7.12.2 Script Examples .................................................................................................................. 166
7.13 Function Process .................................................................................................. 168 7.13.1 Built-in Mathematical Operators .................................................................................. 168 7.13.2 Function Example .............................................................................................................. 170 7.13.3 Loading from an XML File ............................................................................................... 170
7.14 Threshold Sampling Process (TSampler) ............................................................ 171 7.14.1 Process Tab .......................................................................................................................... 171 7.14.2 Schedule Tab ....................................................................................................................... 172 7.14.3 Sampler Tab ........................................................................................................................ 173 7.14.4 Thresholds Tab ................................................................................................................... 173 7.14.5 Advanced Tab ..................................................................................................................... 174 7.14.6 TSampler Display Screen ................................................................................................. 175 7.14.7 Defining Additional Threshold Sample Processes .................................................... 175
7.15 Discharge Process ................................................................................................ 177 7.15.1 Loading the Discharge Table ......................................................................................... 178
- Data Functions 180
8.1 Setup Logging ...................................................................................................... 180 8.1.1 Configuring a Logging Interval ..................................................................................... 181
8.2 Download Data ..................................................................................................... 184 8.2.1 Creating an Ordered Download List of Variables ..................................................... 186
8.3 Data Errors and Error Codes ................................................................................ 188 8.3.1 Errors and Intermediate Calculations .......................................................................... 189
8.4 Delete Data ........................................................................................................... 189
8.5 Data Graph View .................................................................................................. 191 8.5.1 Graph Setup ........................................................................................................................ 192
8.6 Data Table View.................................................................................................... 193
8.7 Advanced .............................................................................................................. 194
- Current Conditions 195
vi
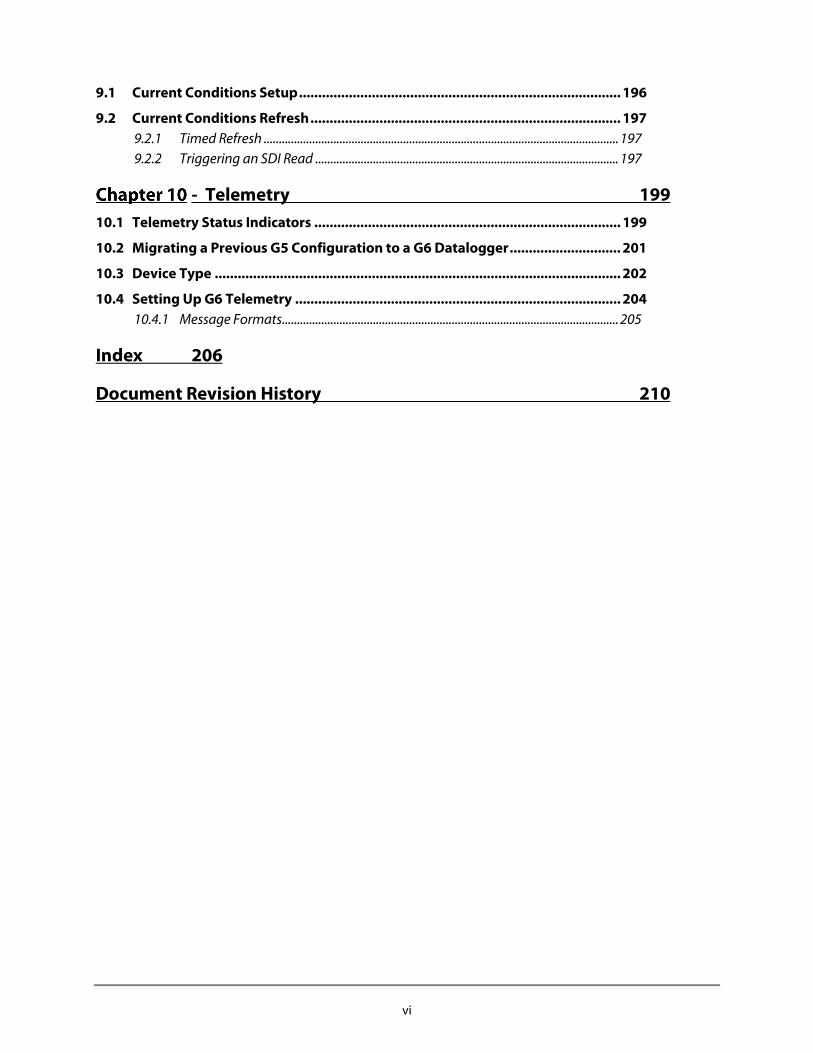
9.1 Current Conditions Setup .................................................................................... 196
9.2 Current Conditions Refresh ................................................................................. 197 9.2.1 Timed Refresh ..................................................................................................................... 197 9.2.2 Triggering an SDI Read .................................................................................................... 197
- Telemetry 199
10.1 Telemetry Status Indicators ................................................................................ 199
10.2 Migrating a Previous G5 Configuration to a G6 Datalogger ............................. 201
10.3 Device Type .......................................................................................................... 202
10.4 Setting Up G6 Telemetry ..................................................................................... 204 10.4.1 Message Formats ............................................................................................................... 205
Index 206
Document Revision History 210

700-Axiom Man Rev. 10 15 Jul 2019 1/210
- GENERAL
This reference manual provides a detailed explanation of configuration options for the Axiom Datalogger provided with a G6 transmitter. This manual is relevant for Dataloggers fitted with a G5 transmitter, except all the transmitter telemetry functions will not be available. The information and screenshots present in this manual are representative of the Application version annotated in the Document Revision history.
1.1 SCREENS AND ICONS
The Axiom Datalogger has a Home screen which consists of eight Main Menu icons. Each icon accesses screens to configure or view information related to a particular subarea of the Datalogger’s functionality. The Datalogger screen will go black after 10 minutes of inactivity but can be reactivated by a touch to the screen. After 20 minutes of inactivity automatic logout from User Level or Tech Level occurs and the Datalogger defaults back to the home screen. If any passwords have been set, they will need to be entered in order to use the Datalogger screen.
When a MAIN MENU icon is selected, the next screen could consist of Sub Icons, Tabs, or Information Fields, depending on the function. A variety of Action buttons are displayed on the bottom of some screens. This selection varies according with the functions available on the screen. See Figure 1-1 for examples of the different screens and functions.
The HOME screen showing the 8 MAIN ICONS The SERVICE screen showing Sub-icons
Screen with several Tabs and Information fields Screen with several Action icons
Figure 1-1: Screen Examples
700-Axiom Man Rev. 10 15 Jul 2019 8/210
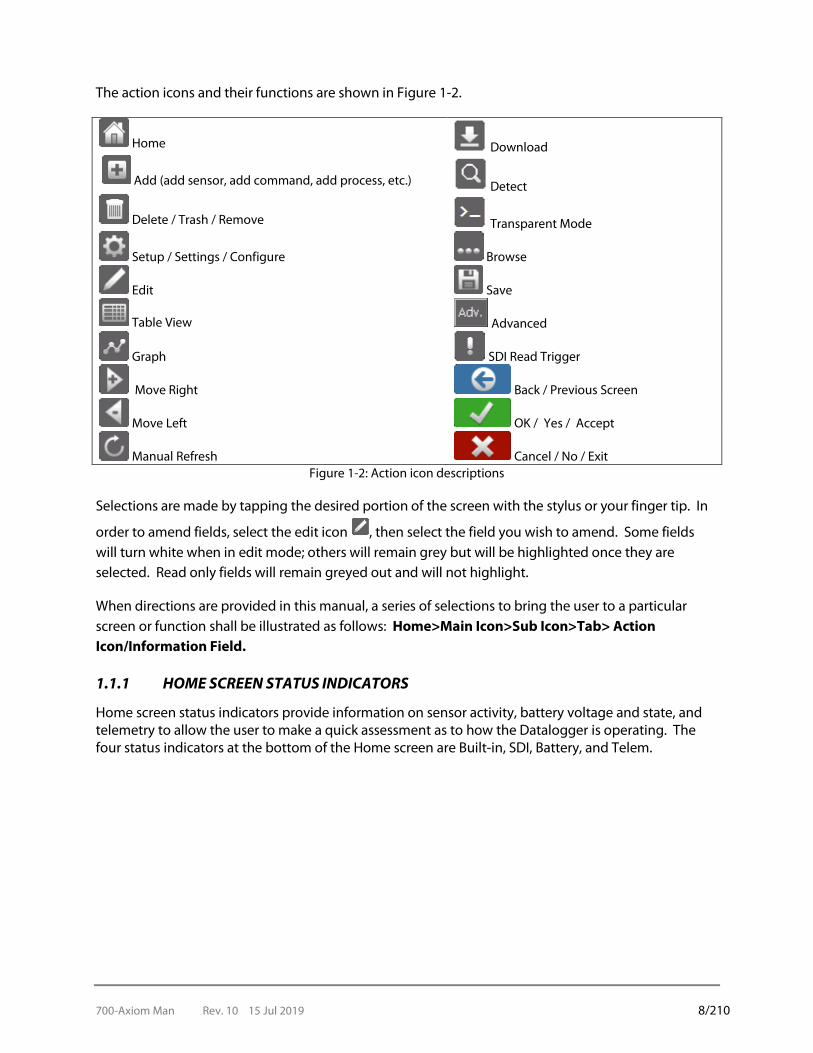
The action icons and their functions are shown in Figure 1-2.
Home Download
Add (add sensor, add command, add process, etc.) Detect
Delete / Trash / Remove Transparent Mode
Setup / Settings / Configure Browse
Edit Save
Table View Advanced
Graph SDI Read Trigger
Move Right Back / Previous Screen
Move Left OK / Yes / Accept
Manual Refresh Cancel / No / Exit Figure 1-2: Action icon descriptions
Selections are made by tapping the desired portion of the screen with the stylus or your finger tip. In
order to amend fields, select the edit icon , then select the field you wish to amend. Some fields will turn white when in edit mode; others will remain grey but will be highlighted once they are selected. Read only fields will remain greyed out and will not highlight.
When directions are provided in this manual, a series of selections to bring the user to a particular screen or function shall be illustrated as follows: Home>Main Icon>Sub Icon>Tab> Action Icon/Information Field.
1.1.1 HOME SCREEN STATUS INDICATORS
Home screen status indicators provide information on sensor activity, battery voltage and state, and telemetry to allow the user to make a quick assessment as to how the Datalogger is operating. The four status indicators at the bottom of the Home screen are Built-in, SDI, Battery, and Telem.

700-Axiom Man Rev. 10 15 Jul 2019 9/210
Figure 1-3: Home Screen Status Indicators
Built-in
This indicates the status of the built-in sensors.
Colour Meaning
Green Dedicated front panel sensors or internal sensors are being read by the Datalogger
Black No sensor activity
SDI
SDI is actually two indicators in one, split left and right, for SDI A and SDI B sensor inputs respectively. Colour Meaning
Green SDI A (left) or SDI B (right) sensors are being read by the Datalogger
Black No sensor reading activity Detailed information on a specific SDI sensor is available through that SDI sensor’s definition screen.
Battery
The Battery status indicator has black text which displays the voltage of the battery connected to the Datalogger’s BATTERY input while the background colour displays the charging status of the battery. Background colours for the Battery indicator are:
Colour Meaning
Black No status available
Yellow The battery is being discharged
Green The battery is being charged Detailed information on the BATTERY and SOLAR PANEL inputs are available through their respective Sensor screens.
700-Axiom Man Rev. 10 15 Jul 2019 10/210
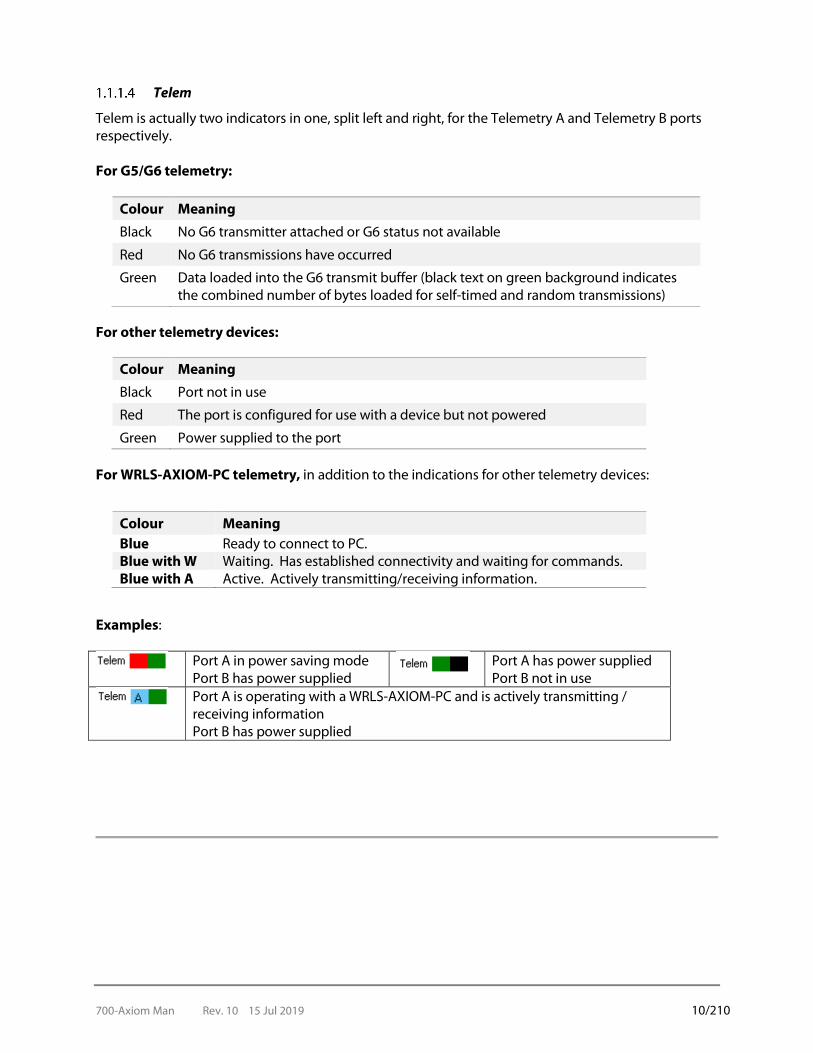
Telem
Telem is actually two indicators in one, split left and right, for the Telemetry A and Telemetry B ports respectively. For G5/G6 telemetry:
Colour Meaning
Black No G6 transmitter attached or G6 status not available
Red No G6 transmissions have occurred
Green Data loaded into the G6 transmit buffer (black text on green background indicates the combined number of bytes loaded for self-timed and random transmissions)
For other telemetry devices:
Colour Meaning
Black Port not in use
Red The port is configured for use with a device but not powered
Green Power supplied to the port For WRLS-AXIOM-PC telemetry, in addition to the indications for other telemetry devices:
Colour Meaning Blue Ready to connect to PC. Blue with W Waiting. Has established connectivity and waiting for commands. Blue with A Active. Actively transmitting/receiving information.
Examples:
Port A in power saving mode Port B has power supplied
Port A has power supplied Port B not in use
Port A is operating with a WRLS-AXIOM-PC and is actively transmitting / receiving information Port B has power supplied
700-Axiom Man Rev. 10 15 Jul 2019 11/210
- OVERVIEW
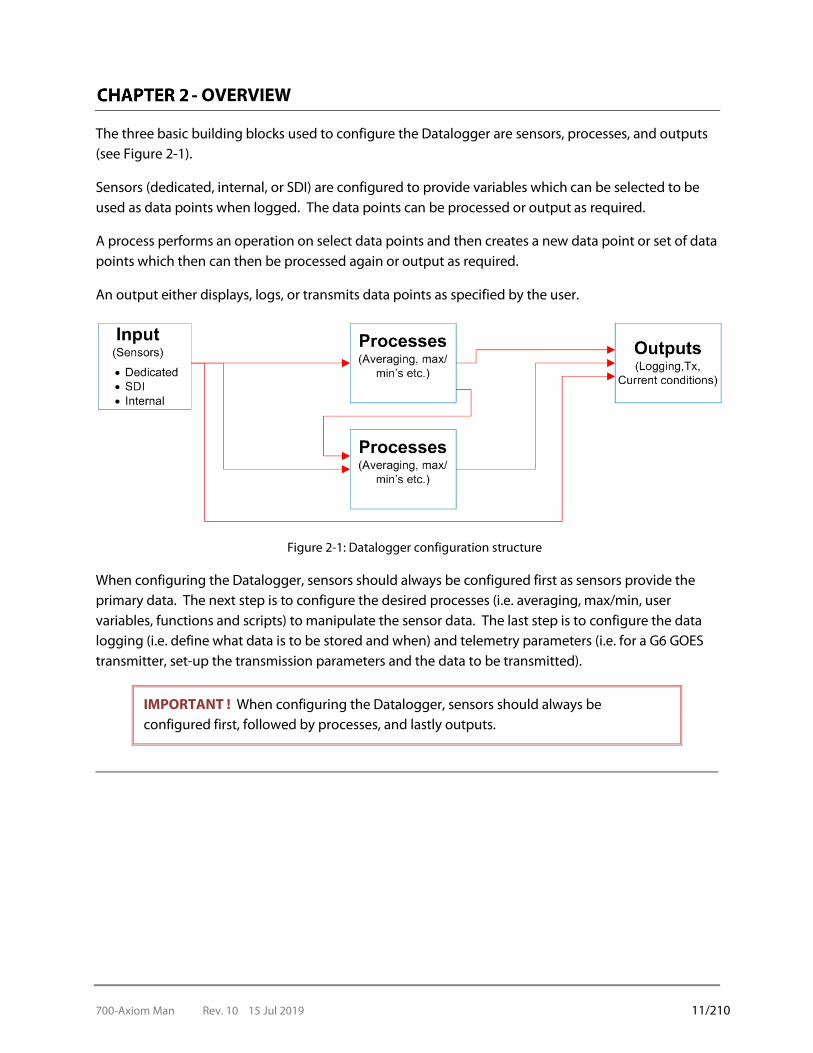
The three basic building blocks used to configure the Datalogger are sensors, processes, and outputs (see Figure 2-1).
Sensors (dedicated, internal, or SDI) are configured to provide variables which can be selected to be used as data points when logged. The data points can be processed or output as required.
A process performs an operation on select data points and then creates a new data point or set of data points which then can then be processed again or output as required.
An output either displays, logs, or transmits data points as specified by the user.
Figure 2-1: Datalogger configuration structure
When configuring the Datalogger, sensors should always be configured first as sensors provide the primary data. The next step is to configure the desired processes (i.e. averaging, max/min, user variables, functions and scripts) to manipulate the sensor data. The last step is to configure the data logging (i.e. define what data is to be stored and when) and telemetry parameters (i.e. for a G6 GOES transmitter, set-up the transmission parameters and the data to be transmitted).
IMPORTANT ! When configuring the Datalogger, sensors should always be configured first, followed by processes, and lastly outputs.
700-Axiom Man Rev. 10 15 Jul 2019 12/210
2.1 OPERATING ALGORITHMS
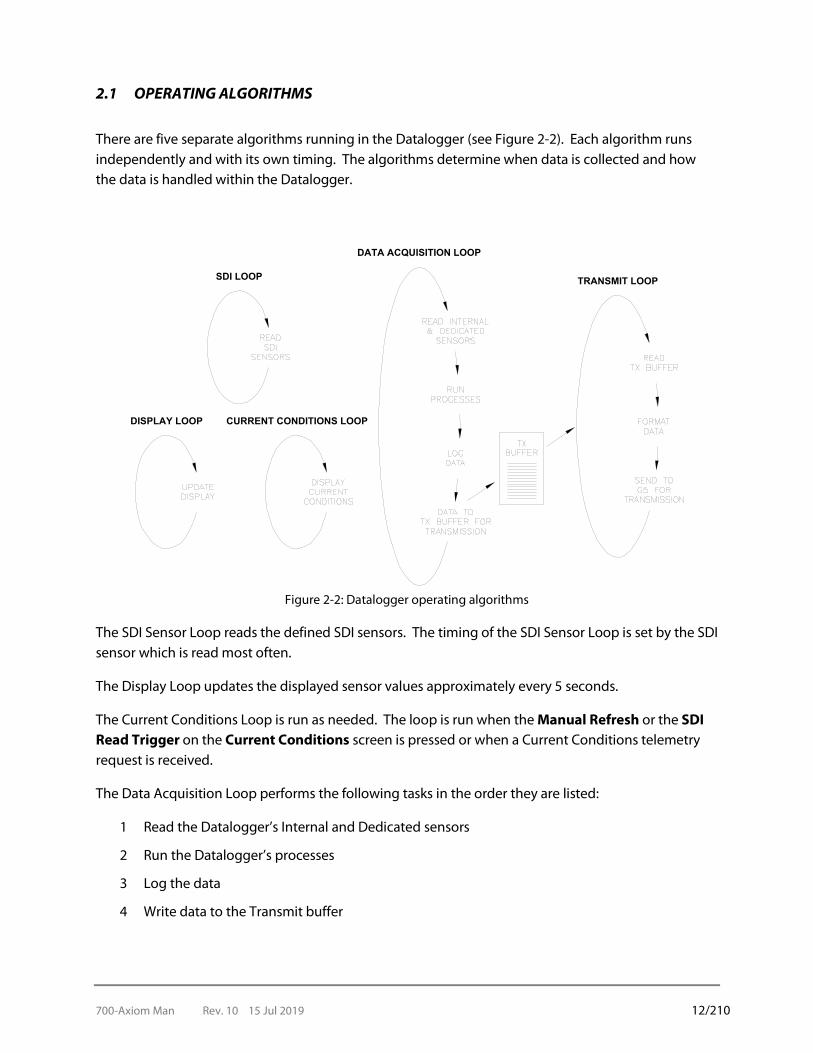
There are five separate algorithms running in the Datalogger (see Figure 2-2). Each algorithm runs independently and with its own timing. The algorithms determine when data is collected and how the data is handled within the Datalogger.
Figure 2-2: Datalogger operating algorithms
The SDI Sensor Loop reads the defined SDI sensors. The timing of the SDI Sensor Loop is set by the SDI sensor which is read most often.
The Display Loop updates the displayed sensor values approximately every 5 seconds.
The Current Conditions Loop is run as needed. The loop is run when the Manual Refresh or the SDI Read Trigger on the Current Conditions screen is pressed or when a Current Conditions telemetry request is received.
The Data Acquisition Loop performs the following tasks in the order they are listed:
1 Read the Datalogger’s Internal and Dedicated sensors
2 Run the Datalogger’s processes
3 Log the data
4 Write data to the Transmit buffer
CURRENT CONDITIONS LOOPDISPLAY LOOP
SDI LOOP TRANSMIT LOOP
DATA ACQUISITION LOOP
700-Axiom Man Rev. 10 15 Jul 2019 13/210
The timing of the Data Acquisition Loop is set by the most frequent process, log interval, or transmit message interval.
The Transmit Loop is responsible for G6 GOES data transmission and its timing is set by the G6 transmission cycle. The Transmit Loop sends the contents of the transmit buffer to the G6 transmitter 90 seconds prior to the G6 transmit time. In order to meet timing requirements for transmission, data should be sent to the transmitted buffer at least two minutes prior to the G6 transmit time.
700-Axiom Man Rev. 10 15 Jul 2019 14/210
- STATION FUNCTIONS
Station information encompasses all of the aspects which are unique to a particular Datalogger. The Station icon on the touchscreen allows the user to view and edit Datalogger site information, to view Datalogger version information, and to load and save Datalogger configuration and template files.
3.1 SITE TAB
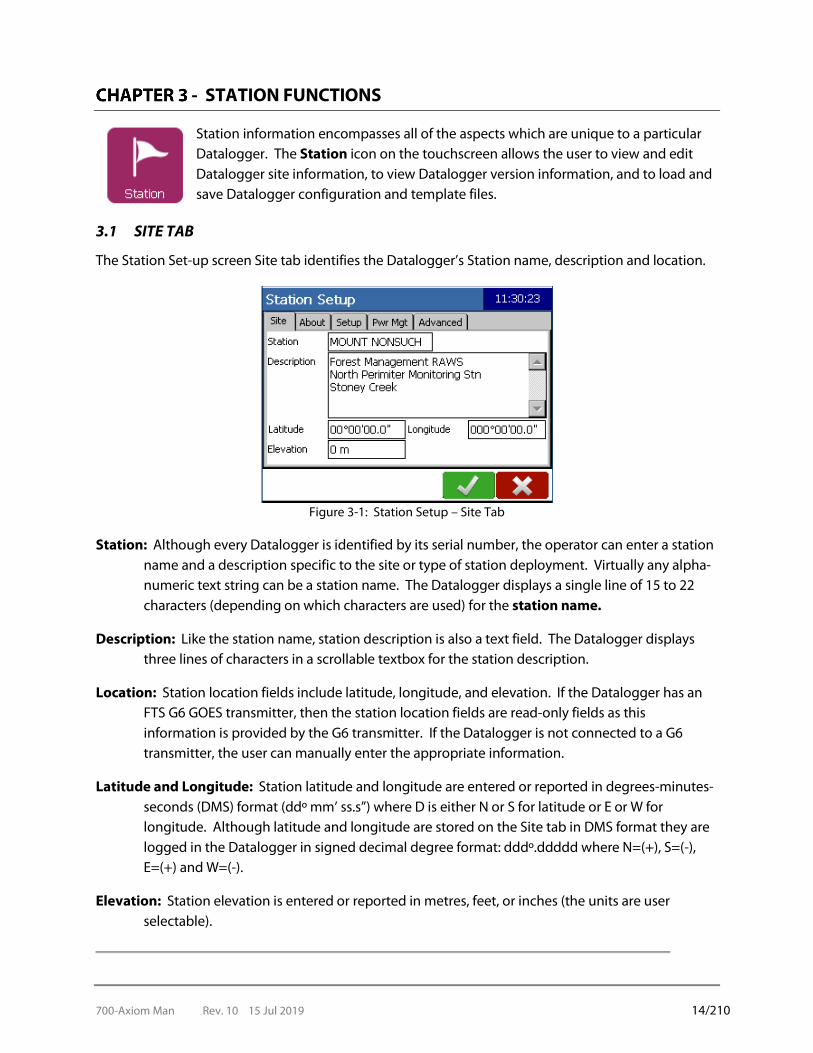
The Station Set-up screen Site tab identifies the Datalogger’s Station name, description and location.
Figure 3-1: Station Setup – Site Tab
Station: Although every Datalogger is identified by its serial number, the operator can enter a station name and a description specific to the site or type of station deployment. Virtually any alpha-numeric text string can be a station name. The Datalogger displays a single line of 15 to 22 characters (depending on which characters are used) for the station name.
Description: Like the station name, station description is also a text field. The Datalogger displays three lines of characters in a scrollable textbox for the station description.
Location: Station location fields include latitude, longitude, and elevation. If the Datalogger has an FTS G6 GOES transmitter, then the station location fields are read-only fields as this information is provided by the G6 transmitter. If the Datalogger is not connected to a G6 transmitter, the user can manually enter the appropriate information.
Latitude and Longitude: Station latitude and longitude are entered or reported in degrees-minutes-seconds (DMS) format (ddº mm’ ss.s”) where D is either N or S for latitude or E or W for longitude. Although latitude and longitude are stored on the Site tab in DMS format they are logged in the Datalogger in signed decimal degree format: dddº.ddddd where N=(+), S=(-), E=(+) and W=(-).
Elevation: Station elevation is entered or reported in metres, feet, or inches (the units are user selectable).
700-Axiom Man Rev. 10 15 Jul 2019 15/210
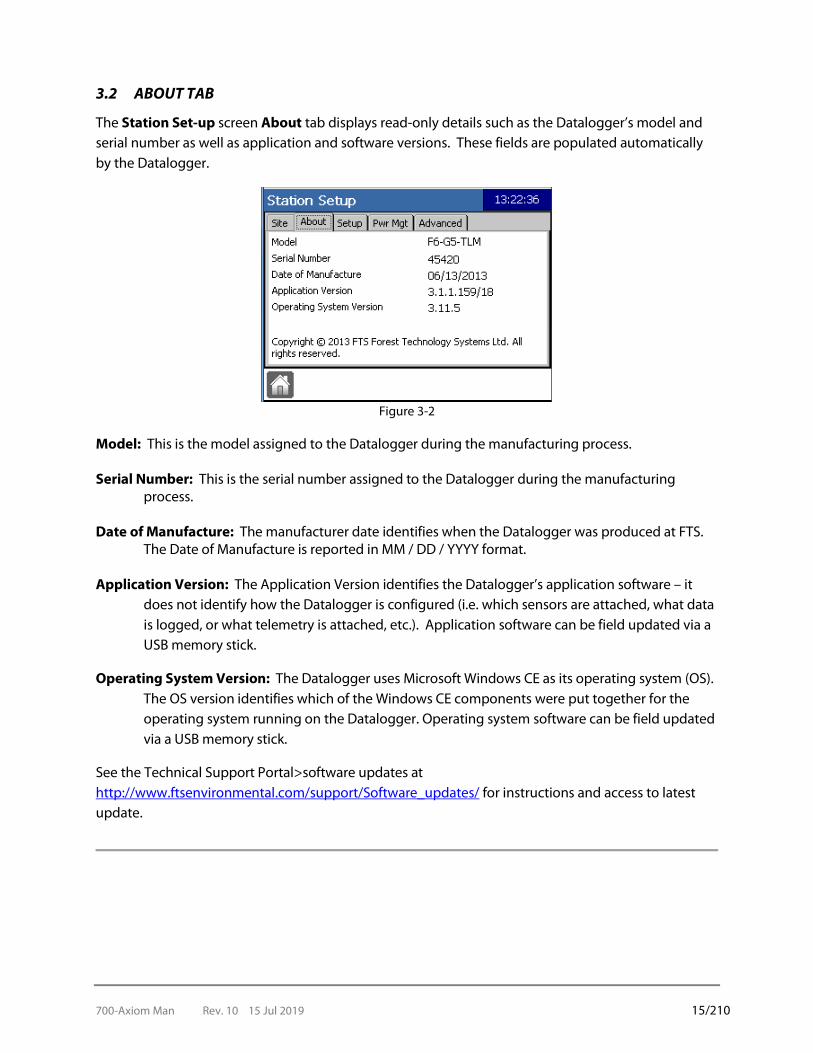
3.2 ABOUT TAB
The Station Set-up screen About tab displays read-only details such as the Datalogger’s model and serial number as well as application and software versions. These fields are populated automatically by the Datalogger.
Figure 3-2
Model: This is the model assigned to the Datalogger during the manufacturing process. Serial Number: This is the serial number assigned to the Datalogger during the manufacturing
process. Date of Manufacture: The manufacturer date identifies when the Datalogger was produced at FTS.
The Date of Manufacture is reported in MM / DD / YYYY format. Application Version: The Application Version identifies the Datalogger’s application software – it
does not identify how the Datalogger is configured (i.e. which sensors are attached, what data is logged, or what telemetry is attached, etc.). Application software can be field updated via a USB memory stick.
Operating System Version: The Datalogger uses Microsoft Windows CE as its operating system (OS). The OS version identifies which of the Windows CE components were put together for the operating system running on the Datalogger. Operating system software can be field updated via a USB memory stick.
See the Technical Support Portal>software updates at http://www.ftsenvironmental.com/support/Software_updates/ for instructions and access to latest update.

700-Axiom Man Rev. 10 15 Jul 2019 16/210
3.3 SETUP TAB
The Station Set-up screen Set-up tab enables the user to save a configuration to a USB memory stick and to load a Datalogger configuration from a USB memory stick. There are two types of set-up files: configurations and templates. The difference between a configuration and a template is that a configuration contains Datalogger site specific information (i.e. a station name and position as well as telemetry specific parameters) along with the general set-up information (i.e. sensor and processing definitions, data logging intervals, transmit message, etc.) while a template only contains the general set-up information. Both file types contain all the information required for data collection but only the configuration file contains the extra information required to uniquely identify the Datalogger and enable GOES transmissions.
IMPORTANT ! We recommend working with configurations as opposed to templates since configurations contain full configuration/site specific details.
The Set-up tab also provides the ability to view a summary of the Datalogger’s configuration and to clear a configuration.
Figure 3-3: Station Setup – Setup Tab
3.3.1 SAVE CONFIGURATION
To save the Datalogger’s active configuration or to save the active configuration as a template, use the Save Configuration File screen (Home > Station > Set-up tab > Save Configuration).
IMPORTANT ! It is recommended to save a configuration as opposed to a template since configurations contain full configuration/site specific details. Select “Save to USB Station Folder” in order to save as a configuration file to a USB memory stick.
700-Axiom Man Rev. 10 15 Jul 2019 17/210
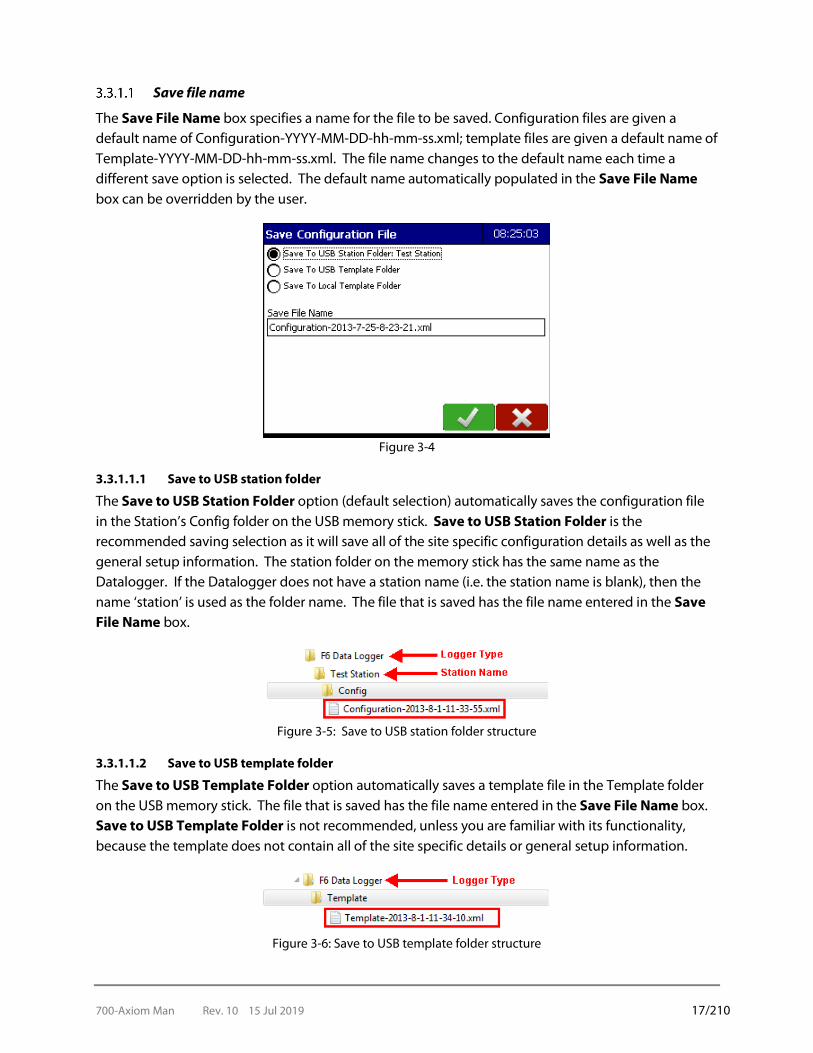
Save file name
The Save File Name box specifies a name for the file to be saved. Configuration files are given a default name of Configuration-YYYY-MM-DD-hh-mm-ss.xml; template files are given a default name of Template-YYYY-MM-DD-hh-mm-ss.xml. The file name changes to the default name each time a different save option is selected. The default name automatically populated in the Save File Name box can be overridden by the user.
Figure 3-4
3.3.1.1.1 Save to USB station folder
The Save to USB Station Folder option (default selection) automatically saves the configuration file in the Station’s Config folder on the USB memory stick. Save to USB Station Folder is the recommended saving selection as it will save all of the site specific configuration details as well as the general setup information. The station folder on the memory stick has the same name as the Datalogger. If the Datalogger does not have a station name (i.e. the station name is blank), then the name ‘station’ is used as the folder name. The file that is saved has the file name entered in the Save File Name box.
Figure 3-5: Save to USB station folder structure
3.3.1.1.2 Save to USB template folder
The Save to USB Template Folder option automatically saves a template file in the Template folder on the USB memory stick. The file that is saved has the file name entered in the Save File Name box. Save to USB Template Folder is not recommended, unless you are familiar with its functionality, because the template does not contain all of the site specific details or general setup information.
Figure 3-6: Save to USB template folder structure

700-Axiom Man Rev. 10 15 Jul 2019 18/210
3.3.1.1.3 Save to local template folder
The Save to Local Template Folder option automatically saves a template file in the Datalogger’s internal template folder. The file that is saved has the file name entered in the Save File Name box. Save to Local Template Folder is not recommended, unless you are familiar with its functionality, because the template does not contain all of the site specific details or general setup information; also, the file will be located on the Datalogger which is less portable than a USB memory stick.
Figure 3-7: Save to local template folder structure
3.3.2 LOAD CONFIGURATION
To load a configuration or template from a USB memory stick, or a template that is stored on the Datalogger, use the Load Configuration File screen (Home > Station > Set-up tab > Load Configuration).
The screen automatically displays the contents of the folder appropriate to the Load From option selected. If your file is located in the appropriate folder it can be loaded by selecting the desired file and then selecting OK.
IMPORTANT ! It is recommended to load a configuration as opposed to a template since configurations contain full configuration/site specific details.
Figure 3-8: Load Configuration showing automatic detection of the configuration file
700-Axiom Man Rev. 10 15 Jul 2019 19/210
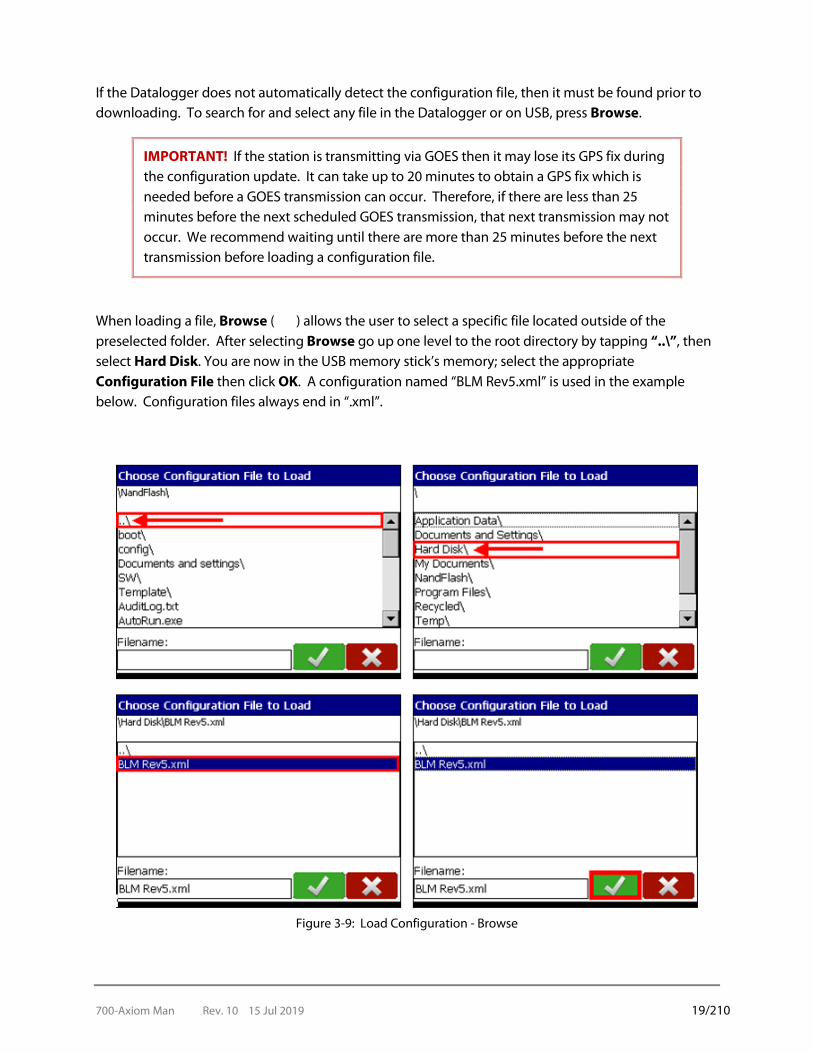
If the Datalogger does not automatically detect the configuration file, then it must be found prior to downloading. To search for and select any file in the Datalogger or on USB, press Browse.
IMPORTANT! If the station is transmitting via GOES then it may lose its GPS fix during the configuration update. It can take up to 20 minutes to obtain a GPS fix which is needed before a GOES transmission can occur. Therefore, if there are less than 25 minutes before the next scheduled GOES transmission, that next transmission may not occur. We recommend waiting until there are more than 25 minutes before the next transmission before loading a configuration file.
When loading a file, Browse ( ) allows the user to select a specific file located outside of the preselected folder. After selecting Browse go up one level to the root directory by tapping “..\”, then select Hard Disk. You are now in the USB memory stick’s memory; select the appropriate Configuration File then click OK. A configuration named “BLM Rev5.xml” is used in the example below. Configuration files always end in “.xml”.
Figure 3-9: Load Configuration - Browse
700-Axiom Man Rev. 10 15 Jul 2019 20/210
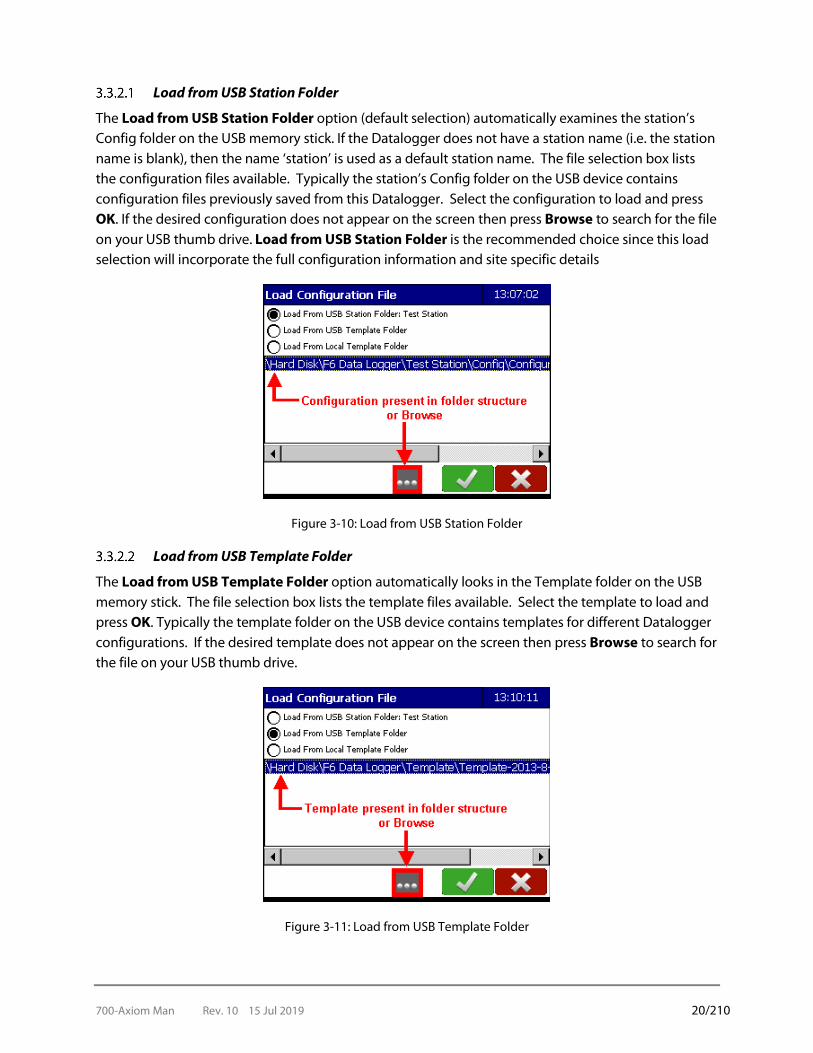
Load from USB Station Folder
The Load from USB Station Folder option (default selection) automatically examines the station’s Config folder on the USB memory stick. If the Datalogger does not have a station name (i.e. the station name is blank), then the name ‘station’ is used as a default station name. The file selection box lists the configuration files available. Typically the station’s Config folder on the USB device contains configuration files previously saved from this Datalogger. Select the configuration to load and press OK. If the desired configuration does not appear on the screen then press Browse to search for the file on your USB thumb drive. Load from USB Station Folder is the recommended choice since this load selection will incorporate the full configuration information and site specific details
Figure 3-10: Load from USB Station Folder
Load from USB Template Folder
The Load from USB Template Folder option automatically looks in the Template folder on the USB memory stick. The file selection box lists the template files available. Select the template to load and press OK. Typically the template folder on the USB device contains templates for different Datalogger configurations. If the desired template does not appear on the screen then press Browse to search for the file on your USB thumb drive.
Figure 3-11: Load from USB Template Folder
700-Axiom Man Rev. 10 15 Jul 2019 21/210
Remember templates do not contain site specific Datalogger information. Loading a template does not affect site specific information already in the Datalogger but, if configuring the Datalogger for the first time, the user must enter the required site specific information. Only use this function if you do not need all of the configuration details/site specific information.
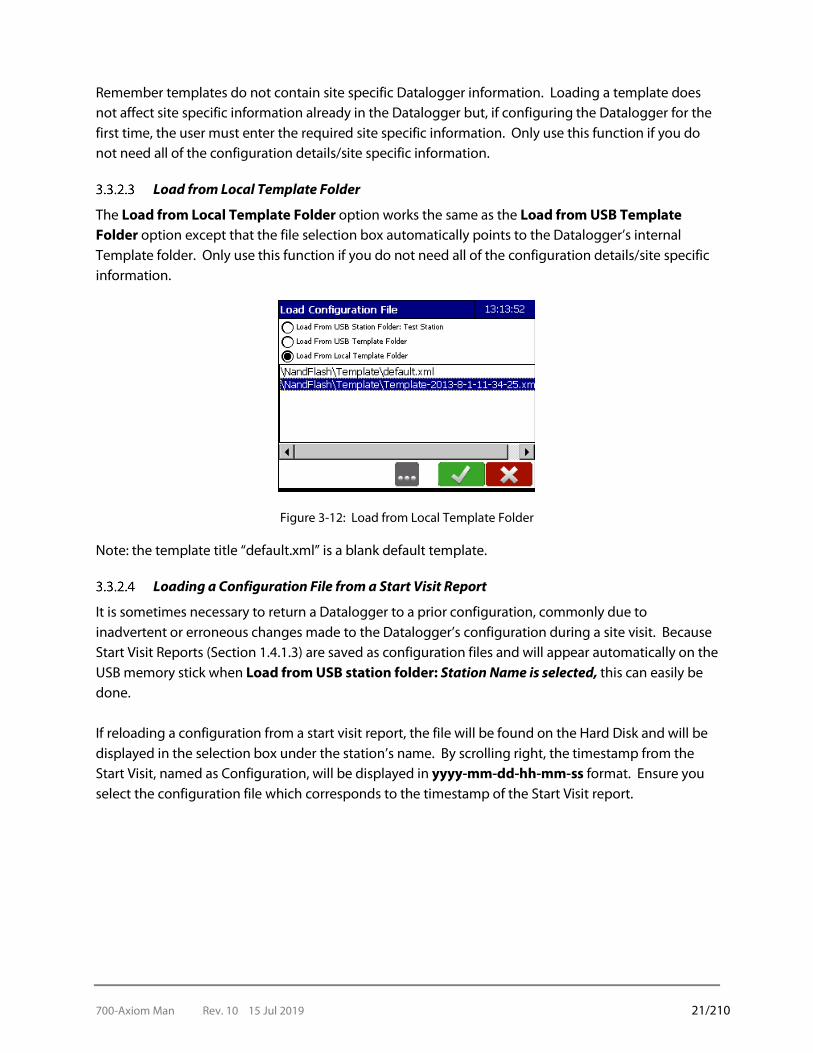
Load from Local Template Folder
The Load from Local Template Folder option works the same as the Load from USB Template Folder option except that the file selection box automatically points to the Datalogger’s internal Template folder. Only use this function if you do not need all of the configuration details/site specific information.
Figure 3-12: Load from Local Template Folder
Note: the template title “default.xml” is a blank default template.
Loading a Configuration File from a Start Visit Report
It is sometimes necessary to return a Datalogger to a prior configuration, commonly due to inadvertent or erroneous changes made to the Datalogger’s configuration during a site visit. Because Start Visit Reports (Section 1.4.1.3) are saved as configuration files and will appear automatically on the USB memory stick when Load from USB station folder: Station Name is selected, this can easily be done. If reloading a configuration from a start visit report, the file will be found on the Hard Disk and will be displayed in the selection box under the station’s name. By scrolling right, the timestamp from the Start Visit, named as Configuration, will be displayed in yyyy-mm-dd-hh-mm-ss format. Ensure you select the configuration file which corresponds to the timestamp of the Start Visit report.

700-Axiom Man Rev. 10 15 Jul 2019 22/210
Figure 3-13
3.3.3 CONFIGURATION SUMMARY
The Configuration Summary screen (Home > Station > Set-up tab > Config Summary) provides the user with a basic configuration summary of the sensors and processes defined in the Datalogger.
Note that when the user performs a site visit, the information displayed on the configuration summary screens is written to a time-stamped .csv file in the station’s folder on the USB memory stick along with the other site visit files.
Set up – Config Summary Sensor Tab
Figure 3-14: Configuration Summary
Sensors Tab
The Configuration Summary screen – Sensors tab provides information on the Datalogger’s dedicated and internal sensors. Sensors and their variable names, values and time they were read are shown. If the variable is being logged as a data point, the logging interval and whether it is being transmitted are also shown.

700-Axiom Man Rev. 10 15 Jul 2019 23/210
Column Heading Contents
Name Sensor Name - an X preceding the sensor name indicates the sensor is Inactive
Var Sensor Variable Name
Value Sensor Variable Reading Value
Time Time of the sensor variable reading*
Log Invl Data logging Time Interval* - a C preceding the log interval time indicates a conditional data log - a D preceding the log interval time indicates a disabled data log
GOES Indicates if the Data point is defined as part of a GOES transmission - a Y indicates the data point is to be transmitted in the GOES message - an N indicates the data point is not transmitted
*Note: times are in hh:mm:ss format
SDI sensors
The Configuration Summary screen – SDI tab provides information on the Datalogger’s SDI sensors. SDI command details are shown in addition to the same headings displayed on the Sensor tab.
Figure 3-15: Configuration Summary – SDI tab

700-Axiom Man Rev. 10 15 Jul 2019 24/210
Column Heading Contents
Name Sensor Name - an X preceding the sensor name indicates the sensor is Inactive
Cmd the SDI command sent to the sensor
Invl SDI Command Time Interval*
Offset SDI Command Time Offset*
Var Sensor Variable Name
Value Sensor Variable Reading Value
Time Time of the sensor variable reading*
Log Invl Data logging Time Interval* - a C preceding the log interval time indicates a conditional data log - a D preceding the log interval time indicates a disabled data log
GOES Indicates if the Data point is defined as part of a GOES transmission - a Y indicates the data point is to be transmitted in the GOES message - an N indicates the data point is not transmitted
*Note: times are in hh:mm:ss format
Processes
The Configuration Summary screen – Process tab provides information on the various processes defined in the Datalogger. Process details are shown in addition to the headings displayed on the Sensor tab.
Figure 3-16
700-Axiom Man Rev. 10 15 Jul 2019 25/210
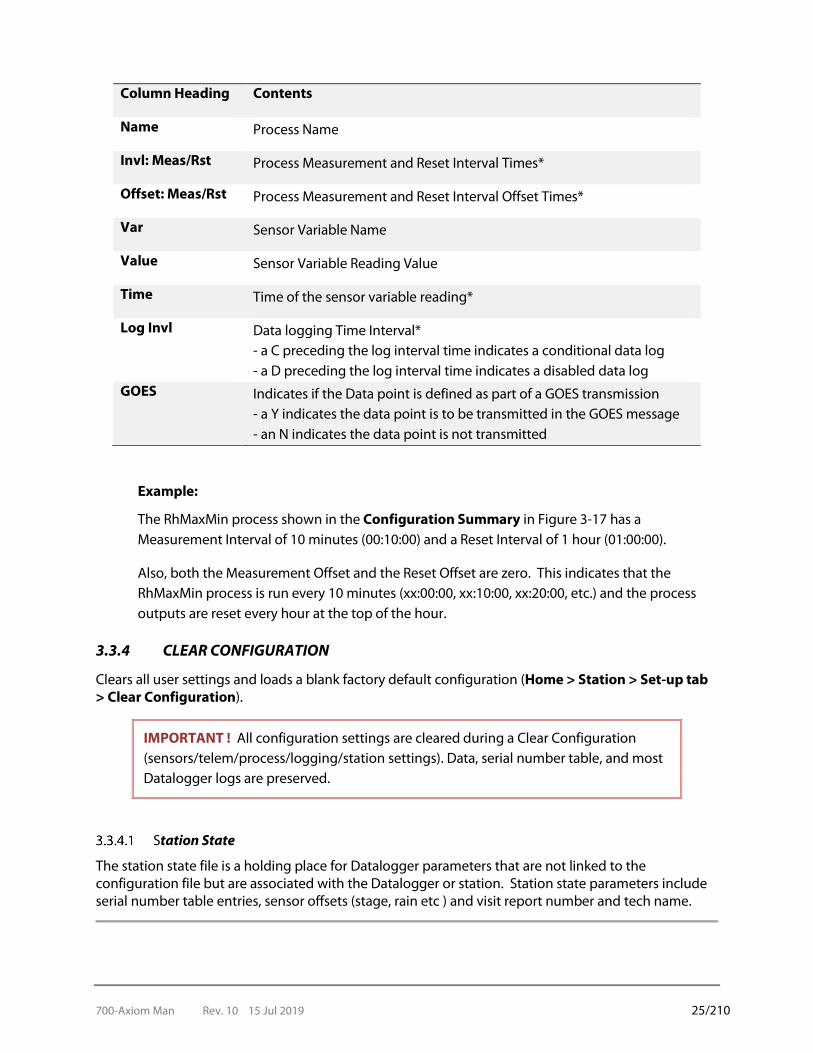
Column Heading Contents
Name Process Name
Invl: Meas/Rst Process Measurement and Reset Interval Times*
Offset: Meas/Rst Process Measurement and Reset Interval Offset Times*
Var Sensor Variable Name
Value Sensor Variable Reading Value
Time Time of the sensor variable reading*
Log Invl Data logging Time Interval* - a C preceding the log interval time indicates a conditional data log - a D preceding the log interval time indicates a disabled data log
GOES Indicates if the Data point is defined as part of a GOES transmission - a Y indicates the data point is to be transmitted in the GOES message - an N indicates the data point is not transmitted
Example:
The RhMaxMin process shown in the Configuration Summary in Figure 3-17 has a Measurement Interval of 10 minutes (00:10:00) and a Reset Interval of 1 hour (01:00:00).
Also, both the Measurement Offset and the Reset Offset are zero. This indicates that the RhMaxMin process is run every 10 minutes (xx:00:00, xx:10:00, xx:20:00, etc.) and the process outputs are reset every hour at the top of the hour.
3.3.4 CLEAR CONFIGURATION
Clears all user settings and loads a blank factory default configuration (Home > Station > Set-up tab > Clear Configuration).
IMPORTANT ! All configuration settings are cleared during a Clear Configuration (sensors/telem/process/logging/station settings). Data, serial number table, and most Datalogger logs are preserved.
Station State
The station state file is a holding place for Datalogger parameters that are not linked to the configuration file but are associated with the Datalogger or station. Station state parameters include serial number table entries, sensor offsets (stage, rain etc ) and visit report number and tech name.
700-Axiom Man Rev. 10 15 Jul 2019 26/210
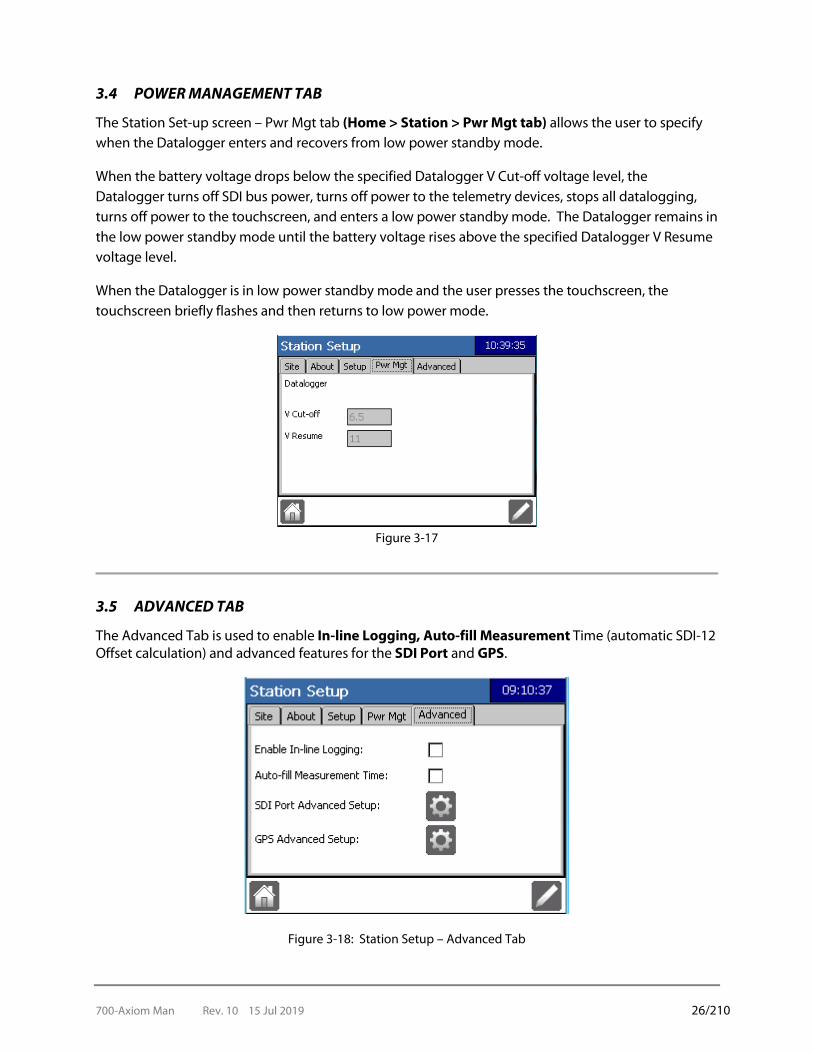
3.4 POWER MANAGEMENT TAB
The Station Set-up screen – Pwr Mgt tab (Home > Station > Pwr Mgt tab) allows the user to specify when the Datalogger enters and recovers from low power standby mode.
When the battery voltage drops below the specified Datalogger V Cut-off voltage level, the Datalogger turns off SDI bus power, turns off power to the telemetry devices, stops all datalogging, turns off power to the touchscreen, and enters a low power standby mode. The Datalogger remains in the low power standby mode until the battery voltage rises above the specified Datalogger V Resume voltage level.
When the Datalogger is in low power standby mode and the user presses the touchscreen, the touchscreen briefly flashes and then returns to low power mode.
Figure 3-17
3.5 ADVANCED TAB
The Advanced Tab is used to enable In-line Logging, Auto-fill Measurement Time (automatic SDI-12 Offset calculation) and advanced features for the SDI Port and GPS.
Figure 3-18: Station Setup – Advanced Tab

700-Axiom Man Rev. 10 15 Jul 2019 27/210
3.5.1 IN-LINE LOGGING
In-line logging permits users to log data points through the Sensor Setup function. To enable in-line logging, select Edit then toggle the Enable In-line Logging checkbox (Figure 3-19).
Once Enable In-line Logging is checked, when adding a new sensor or editing a currently mapped sensor, once the “Sensor Name” Sensor Setup appears, selecting OK will display the In-line logging Setup screen. The Datapoint names will be unique to each type of sensor.
Figure 3-19: Fuel Sensor Setup Example
To setup the In-Line logging, select Edit, then use the arrows to select the desired Interval and Offset. SDI sensors will have the recommended Offset times auto-populated based on the time it takes the sensor to take its readings. These can be edited if desired.
Toggle the appropriate boxes for the datapoints to Enable Logging and Add to Current Conditions options.
3.5.2 AUTO-FILL MEASUREMENT TIME
This feature will automatically calculate and apply the correct offset for the desired interval. This feature is not enabled by default and the user must “opt in” to use it by using this screen (Station Setup<Advanced). However, the Auto-fill Measurement Time is intended for simple operations. It only takes into account the one action to which it is related. If a user sets up the Datalogger to take concurrent readings from a variety of sensors, or creates other complex setups, the Auto-fill offset methodology will not calculate for this. Data processing time is not being factored into the computations If the user wants logging to occur at any other time then that calculated, the offset must be manually input (the Auto-fill Measurement feature must be disabled).
700-Axiom Man Rev. 10 15 Jul 2019 28/210
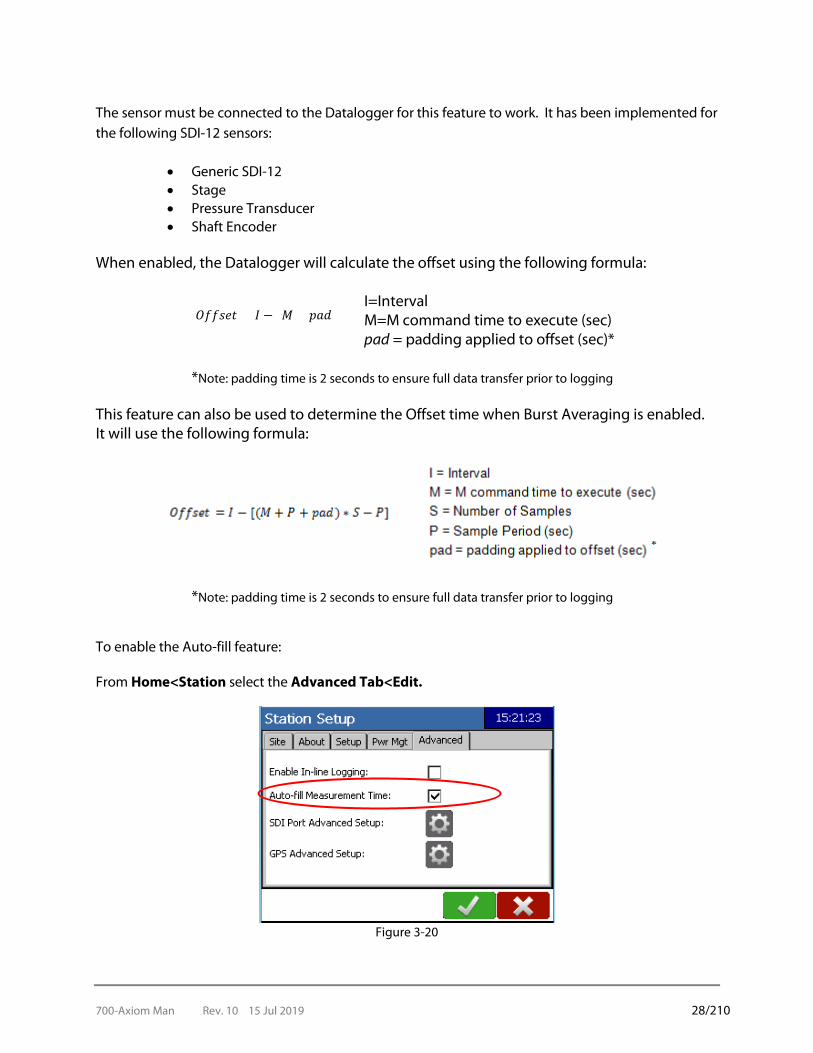
The sensor must be connected to the Datalogger for this feature to work. It has been implemented for the following SDI-12 sensors:
• Generic SDI-12 • Stage • Pressure Transducer • Shaft Encoder
When enabled, the Datalogger will calculate the offset using the following formula:
𝑂𝑂𝑂𝑂𝑂𝑂𝑂𝑂𝑂𝑂𝑂𝑂 = 𝐼𝐼 − (𝑀𝑀 + 𝑝𝑝𝑝𝑝𝑝𝑝)
I=Interval M=M command time to execute (sec) pad = padding applied to offset (sec)*
*Note: padding time is 2 seconds to ensure full data transfer prior to logging
This feature can also be used to determine the Offset time when Burst Averaging is enabled. It will use the following formula:
*Note: padding time is 2 seconds to ensure full data transfer prior to logging
To enable the Auto-fill feature: From Home<Station select the Advanced Tab<Edit.
Figure 3-20
700-Axiom Man Rev. 10 15 Jul 2019 29/210
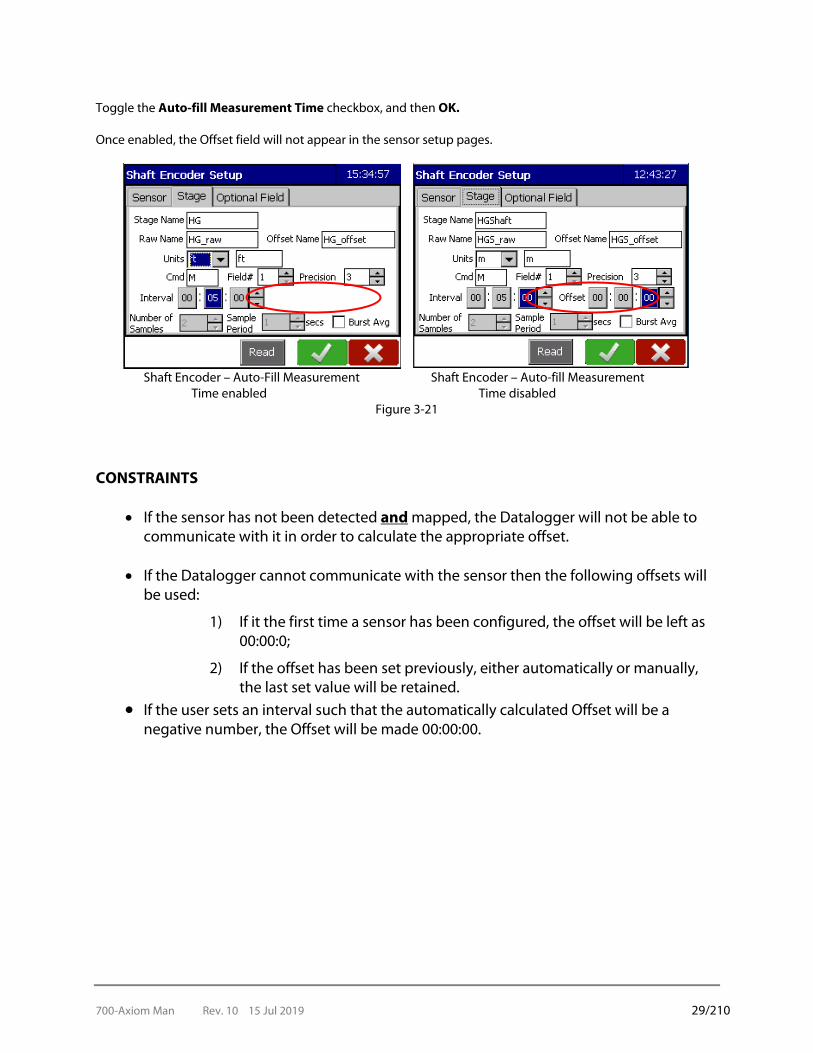
Toggle the Auto-fill Measurement Time checkbox, and then OK. Once enabled, the Offset field will not appear in the sensor setup pages.
Shaft Encoder – Auto-Fill Measurement Shaft Encoder – Auto-fill Measurement
Time enabled Time disabled Figure 3-21
CONSTRAINTS
• If the sensor has not been detected and mapped, the Datalogger will not be able to communicate with it in order to calculate the appropriate offset.
• If the Datalogger cannot communicate with the sensor then the following offsets will be used:
1) If it the first time a sensor has been configured, the offset will be left as 00:00:0;
2) If the offset has been set previously, either automatically or manually, the last set value will be retained.
• If the user sets an interval such that the automatically calculated Offset will be a negative number, the Offset will be made 00:00:00.

700-Axiom Man Rev. 10 15 Jul 2019 30/210
3.5.3 DELAYING AN SDI PORT
Delaying an SDI Port would be used to delay the time between an M and D command on a specific port to accommodate SDI sensors which run older protocols. This prevents the sensors from resetting themselves and reporting zero measurements because they cannot respond when the D command is sent too quickly.
Select Station>Advanced>Setup>Edit.
Figure 3-22: SDI Port Advanced Setup
Toggle the Enable SDI Port Delay for the appropriate port. Input the desired time delay in ms. Select OK.
IMPORTANT! The default time delay is 0 ms so if you fail to input a time, even though the delay is enabled, there will be no increase in time between the M and D commands.

700-Axiom Man Rev. 10 15 Jul 2019 31/210
3.5.4 GPS SYNCHRONIZATION – GOES/UBICOM
Both GOES and Ubicom telemetry have the ability to update GPS fixes and synchronize the Datalogger’s time. GOES is the default synchronization source, set at once a day (interval of 24:00:00). It is possible to assign Ubicom as the GPS synchronization source.
Select Station>Advanced>Setup>Edit. Then select the GPS Advanced Setup cog<Edit.
Figure 3-23: GPS Synchronization Setup
Select the Ubicom radio button and assign the desired synchronization interval. The interval is how often the Ubicom will synchronize GPS information with the Datalogger.
Figure 3-24: Synchronizing GPS to Ubicom
GPS positioning data obtained from the Ubicom will be included in transmitted reports and messages which are formatted for that information.
To return to GOES select the GOES radio button. The Interval will not be editable; however, once OK is selected the GOES interval will automatically return to the 24:00:00 GOES default synchronization interval.

700-Axiom Man Rev. 10 15 Jul 2019 32/210
- SERVICE FUNCTIONS
The Home screen Service icon is used to access maintenance and service utilities available in the Datalogger. The Service screen allows the user to create service reports, view the audit log, set the Datalogger’s date and time, record serial numbers of site equipment, enable password protection, update the Datalogger software, calibrate
the touchscreen, as well as logout.
Figure 4-1: Service Functions
4.1 VISIT REPORT
The Visit Report (Home > Service > Visit Report) provides the user with a convenient tool which saves the station’s current operating state, onto a USB memory stick, at the start and end of each site visit. The Visit Report also ensures consistency in the data that is saved for every site visit.
IMPORTANT! It is highly recommended to save a visit report on every site visit as it contains information on the exact state of the Datalogger upon arrival and departure, any changes made, and the configurations, all of which can be used for trouble shooting without making another trip to the site.
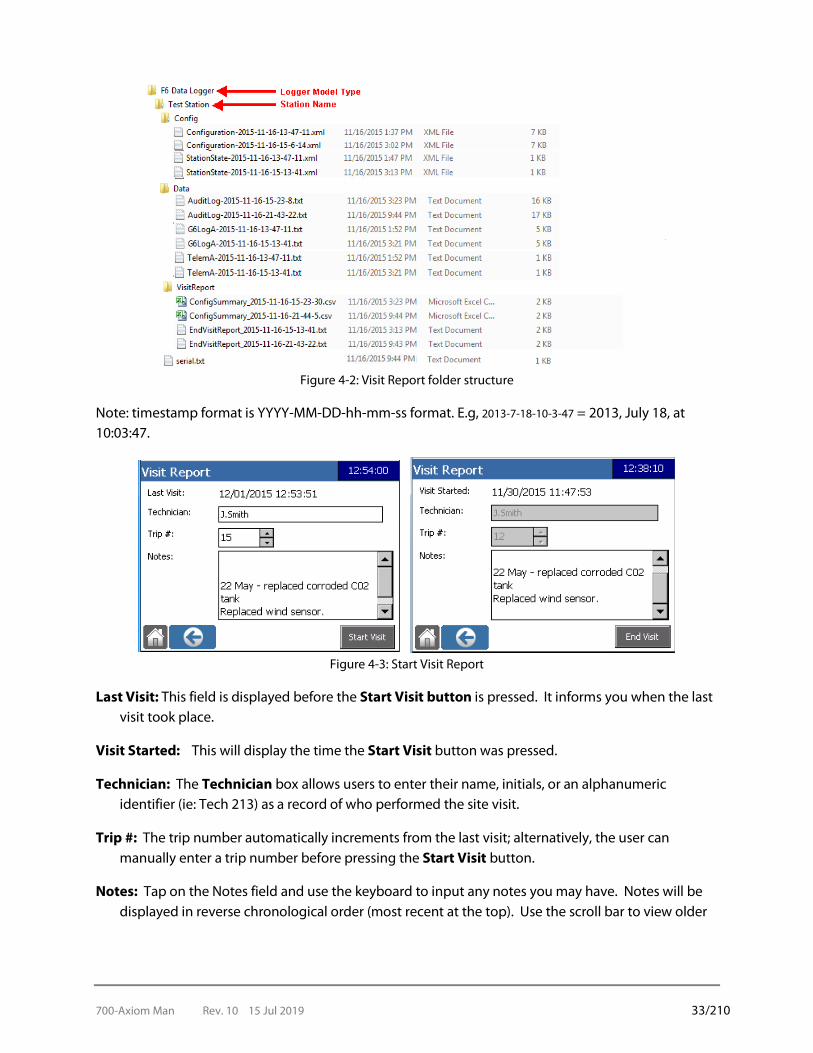
An Axiom folder will be created and named by model type (F6 Data Logger, H2 Data Logger, H1 Data Logger or F6-T Data Logger). The Datalogger folder will have the following Visit Report File Structure. Files present in the data folder may vary depending on the telemetry configuration on the Datalogger. Copies of each file are created at the start and end of the visit.
700-Axiom Man Rev. 10 15 Jul 2019 33/210
Figure 4-2: Visit Report folder structure
Note: timestamp format is YYYY-MM-DD-hh-mm-ss format. E.g, 2013-7-18-10-3-47 = 2013, July 18, at 10:03:47.
Figure 4-3: Start Visit Report
Last Visit: This field is displayed before the Start Visit button is pressed. It informs you when the last visit took place.
Visit Started: This will display the time the Start Visit button was pressed.
Technician: The Technician box allows users to enter their name, initials, or an alphanumeric identifier (ie: Tech 213) as a record of who performed the site visit.
Trip #: The trip number automatically increments from the last visit; alternatively, the user can manually enter a trip number before pressing the Start Visit button.
Notes: Tap on the Notes field and use the keyboard to input any notes you may have. Notes will be displayed in reverse chronological order (most recent at the top). Use the scroll bar to view older
700-Axiom Man Rev. 10 15 Jul 2019 34/210
notes. The notes will also be compiled and displayed in full at the end of the Start and End Visit Reports.
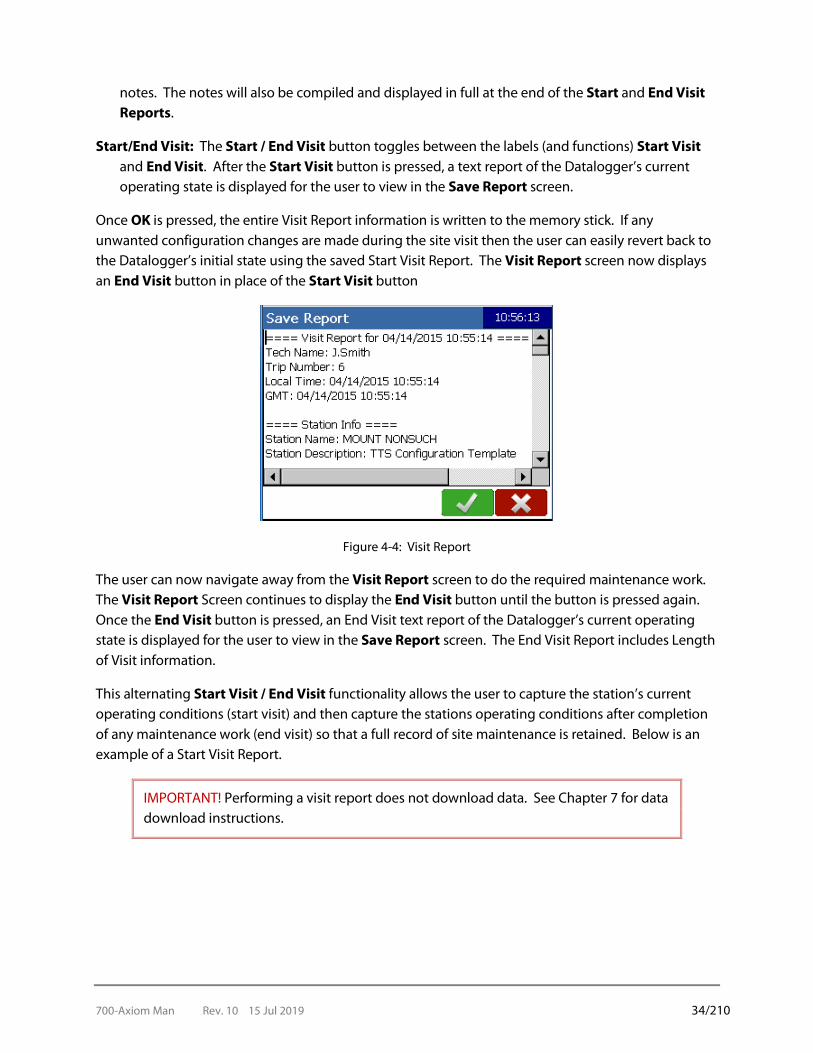
Start/End Visit: The Start / End Visit button toggles between the labels (and functions) Start Visit and End Visit. After the Start Visit button is pressed, a text report of the Datalogger’s current operating state is displayed for the user to view in the Save Report screen.
Once OK is pressed, the entire Visit Report information is written to the memory stick. If any unwanted configuration changes are made during the site visit then the user can easily revert back to the Datalogger’s initial state using the saved Start Visit Report. The Visit Report screen now displays an End Visit button in place of the Start Visit button
Figure 4-4: Visit Report
The user can now navigate away from the Visit Report screen to do the required maintenance work. The Visit Report Screen continues to display the End Visit button until the button is pressed again. Once the End Visit button is pressed, an End Visit text report of the Datalogger’s current operating state is displayed for the user to view in the Save Report screen. The End Visit Report includes Length of Visit information.
This alternating Start Visit / End Visit functionality allows the user to capture the station’s current operating conditions (start visit) and then capture the stations operating conditions after completion of any maintenance work (end visit) so that a full record of site maintenance is retained. Below is an example of a Start Visit Report.
IMPORTANT! Performing a visit report does not download data. See Chapter 7 for data download instructions.

700-Axiom Man Rev. 10 15 Jul 2019 35/210
Figure 4-5

700-Axiom Man Rev. 10 15 Jul 2019 36/210
4.2 AUDIT LOG
To view the Datalogger’s Audit Log, use the Audit Log screen (Home > Service > Audit Log). The Audit Log is a circular text file (maximum size 20 kB) in which the Datalogger stores time-stamped entries of anomalous events or events of importance. On the Audit Log screen, the user can scroll through the log entries as well as clear the file or
save the Audit Log file to a USB memory stick.
Figure 4-6
Save: The Save button allows the user to write the Datalogger’s Audit Log file to the USB memory
stick.
The audit log is automatically saved in the station folder on the memory stick memory stick. The full folder and file name is: Axiom <model> Data Logger\<station name>\Data\AuditLog-YYYY-MM-DD-hh-mm-ss.txt. The Datalogger’s Audit Log file is not altered by writing the file to a memory stick. A copy of the Audit log is also downloaded during either a start or end visit report.
Delete: The Delete button allows the user to erase the Datalogger’s Audit Log file. The user is prompted to confirm the deletion of the log entries as the log entries cannot be recovered once they have been deleted.

700-Axiom Man Rev. 10 15 Jul 2019 37/210
4.3 SET DATE/TIME
To set the Datalogger’s local date and time, open the Set Date Time screen (Home > Service > Set Date Time). This sets the time the Datalogger uses to timestamp its logged data and audit log entries.
To leave the Datalogger’s Date/Time settings unchanged, press Cancel.
Figure 4-7: Setting the Time Zone
4.3.1 SET DATE TIME FOR GOES SYSTEMS
If the Datalogger is connected to a G6 transmitter, the Datalogger has its time synchronized with the transmitter’s high accuracy, GPS based clock; however, the Datalogger’s time zone setting remains unaffected and the Datalogger continues to operate based on its local time. Enable Daylight Savings: Check this box for time zone selection to be converted to Daylight Savings
time. Timezone: Use the drop down menu to select the desired time zone.
G6 Transmitter Time Synchronization
If the Datalogger is connected to a G6 transmitter, then Datalogger time synchronization with the transmitter occurs in the following cases:
1. When the Datalogger is first powered on and the transmitter obtains a GPS fix;
2. After the operator manually sets the Datalogger date, time, or time zone;
3. Prior to each transmission.
The Datalogger’s clock is adjusted if the time difference between the Datalogger and the GOES transmitter is more than 1 second. If the time difference is greater than 20 seconds, then, in addition to the Datalogger’s clock being resynchronized, the contents of the Datalogger’s transmit buffer is cleared to ensure incorrect data is not transmitted.

700-Axiom Man Rev. 10 15 Jul 2019 38/210
4.3.2 SET DATE TIME FOR NON-SATELLITE SYSTEMS
A system without DCP satellite telemetry should have its date and time set by the user upon installation. The time should be checked periodically for any drift. If the displayed Date, Time, and Time Zone values are correct, select OK.
Date: Set the desired date by using the drop-down menu. The left/right arrows in the drop down menu step backwards and forwards through the months. To step through the years, click on the year and then use the up/down arrows which appear to select the desired year.
Figure 4-8: Setting Date and Time
Time: Time elements (hh:mm:ss) can be individually adjusted by tapping on the desired element to highlight it and increasing or decreasing it using the arrows. To set time precisely, enter a time that is slightly ahead of the current time (10 seconds is usually sufficient), then press OK at the precise moment corresponding to the entered time.
Figure 4-9: Setting the Date and Time
Enable Daylight Savings: Check this box for time zone selection to be converted to Daylight Savings time.
Timezone: Use the drop down menu to select the desired time zone. When changing the
Datalogger’s time zone, ensure that the Date and Time fields are also correct as the Datalogger’s Date, Time, and Time zone information are all updated when OK is pressed.
1. Set Time box slightly ahead of the current time displayed in upper right hand corner. 2. When set time corresponds with current time, press OK.
700-Axiom Man Rev. 10 15 Jul 2019 39/210
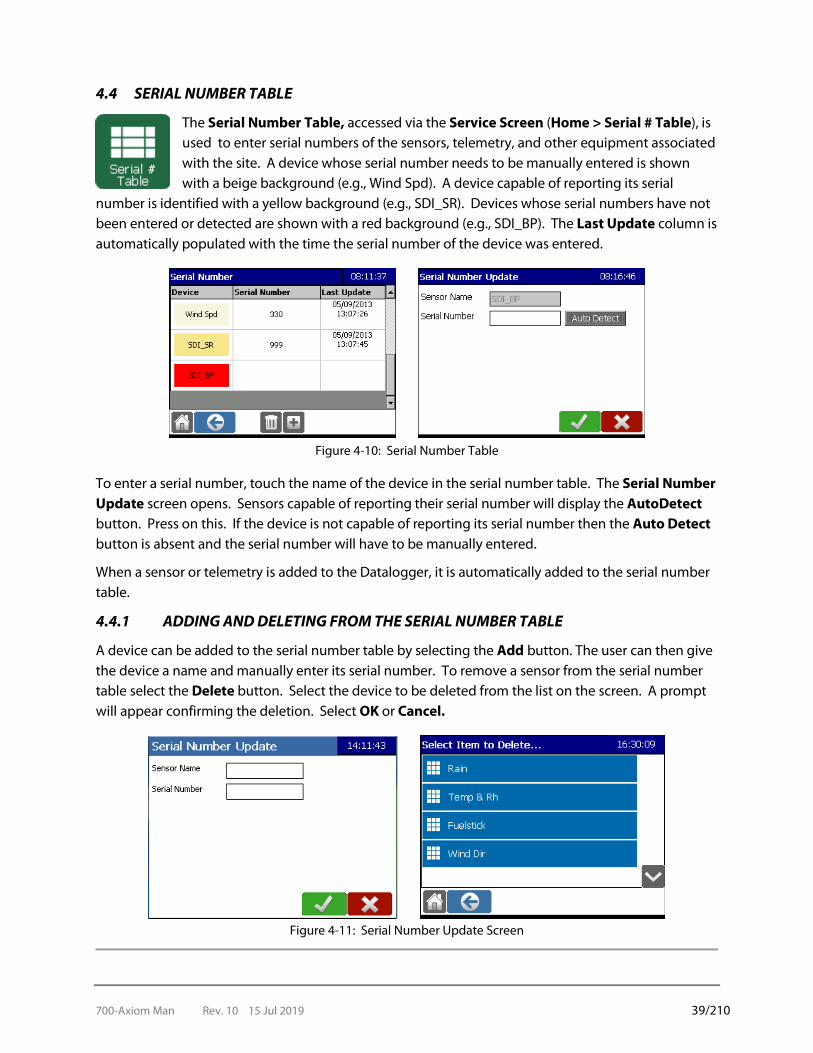
4.4 SERIAL NUMBER TABLE
The Serial Number Table, accessed via the Service Screen (Home > Serial # Table), is used to enter serial numbers of the sensors, telemetry, and other equipment associated with the site. A device whose serial number needs to be manually entered is shown with a beige background (e.g., Wind Spd). A device capable of reporting its serial
number is identified with a yellow background (e.g., SDI_SR). Devices whose serial numbers have not been entered or detected are shown with a red background (e.g., SDI_BP). The Last Update column is automatically populated with the time the serial number of the device was entered.
Figure 4-10: Serial Number Table
To enter a serial number, touch the name of the device in the serial number table. The Serial Number Update screen opens. Sensors capable of reporting their serial number will display the AutoDetect button. Press on this. If the device is not capable of reporting its serial number then the Auto Detect button is absent and the serial number will have to be manually entered.
When a sensor or telemetry is added to the Datalogger, it is automatically added to the serial number table.
4.4.1 ADDING AND DELETING FROM THE SERIAL NUMBER TABLE
A device can be added to the serial number table by selecting the Add button. The user can then give the device a name and manually enter its serial number. To remove a sensor from the serial number table select the Delete button. Select the device to be deleted from the list on the screen. A prompt will appear confirming the deletion. Select OK or Cancel.
Figure 4-11: Serial Number Update Screen
700-Axiom Man Rev. 10 15 Jul 2019 40/210
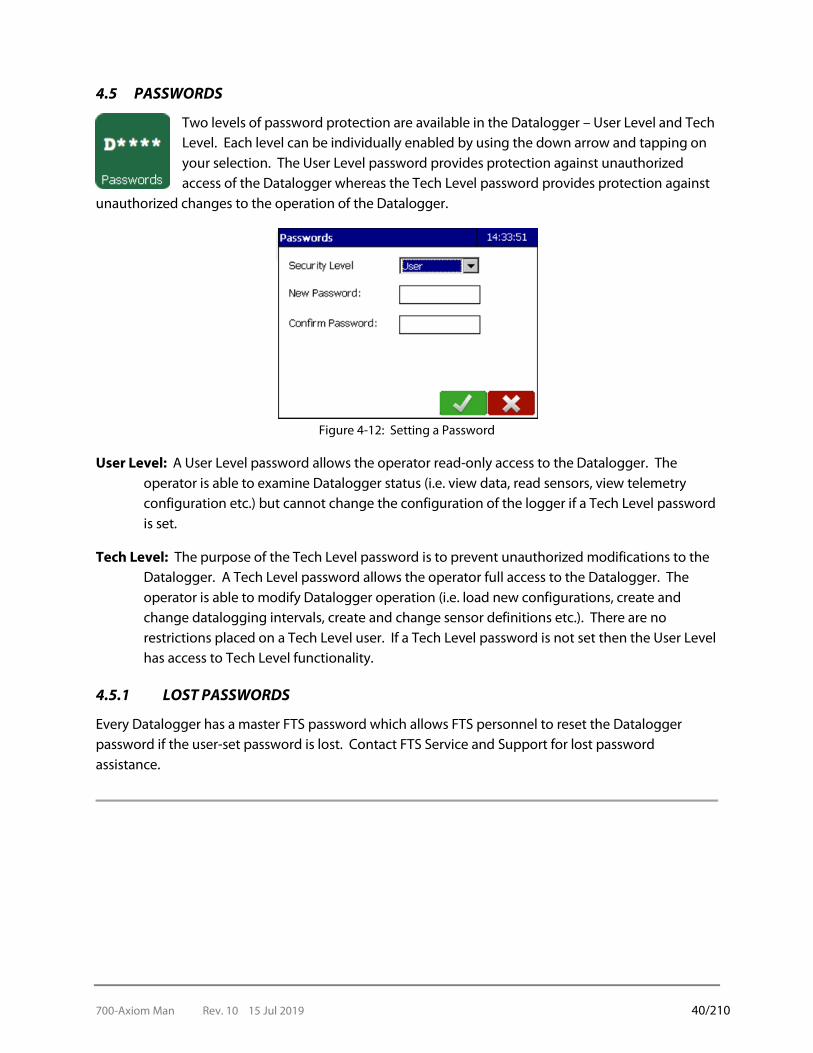
4.5 PASSWORDS
Two levels of password protection are available in the Datalogger – User Level and Tech Level. Each level can be individually enabled by using the down arrow and tapping on your selection. The User Level password provides protection against unauthorized access of the Datalogger whereas the Tech Level password provides protection against
unauthorized changes to the operation of the Datalogger.
Figure 4-12: Setting a Password
User Level: A User Level password allows the operator read-only access to the Datalogger. The operator is able to examine Datalogger status (i.e. view data, read sensors, view telemetry configuration etc.) but cannot change the configuration of the logger if a Tech Level password is set.
Tech Level: The purpose of the Tech Level password is to prevent unauthorized modifications to the Datalogger. A Tech Level password allows the operator full access to the Datalogger. The operator is able to modify Datalogger operation (i.e. load new configurations, create and change datalogging intervals, create and change sensor definitions etc.). There are no restrictions placed on a Tech Level user. If a Tech Level password is not set then the User Level has access to Tech Level functionality.
4.5.1 LOST PASSWORDS
Every Datalogger has a master FTS password which allows FTS personnel to reset the Datalogger password if the user-set password is lost. Contact FTS Service and Support for lost password assistance.

700-Axiom Man Rev. 10 15 Jul 2019 41/210
4.6 DATALOGGER UPDATE
The Datalogger Update icon, found on the Service screen, enables the user to update software in the Datalogger from a USB memory stick (Home > Service > Datalogger Update). Application software, which is used to run the Datalogger, and Sensor Extensions, which provides advanced sensor set-up functionality, both can be
independently updated from the Datalogger Update screen.
Figure 4-13: Datalogger Update
4.6.1 APPLICATION
The Application is the program which runs the Datalogger and provides the GUI and the functionality to configure the Datalogger to specific requirements. The version of the Application currently running the Datalogger is displayed in the About tab of the Station Set-up screen (Home > Station > About Tab). The Application button on the Datalogger Update screen begins the Application update process.
Latest software updates can be downloaded via the Support Portal on the FTS Service and Support web page: http://www.ftsenvironmental.com/
IMPORTANT ! If the station is transmitting via GOES then it will lose its GPS fix during software updates. It can take up to 20 minutes to obtain a GPS fix which is needed before a GOES transmission can occur. Therefore, if there are less than 25 minutes before the next scheduled GOES transmission, that next transmission may not occur. FTS recommends waiting until there are more than 25 minutes before the next transmission.
700-Axiom Man Rev. 10 15 Jul 2019 42/210
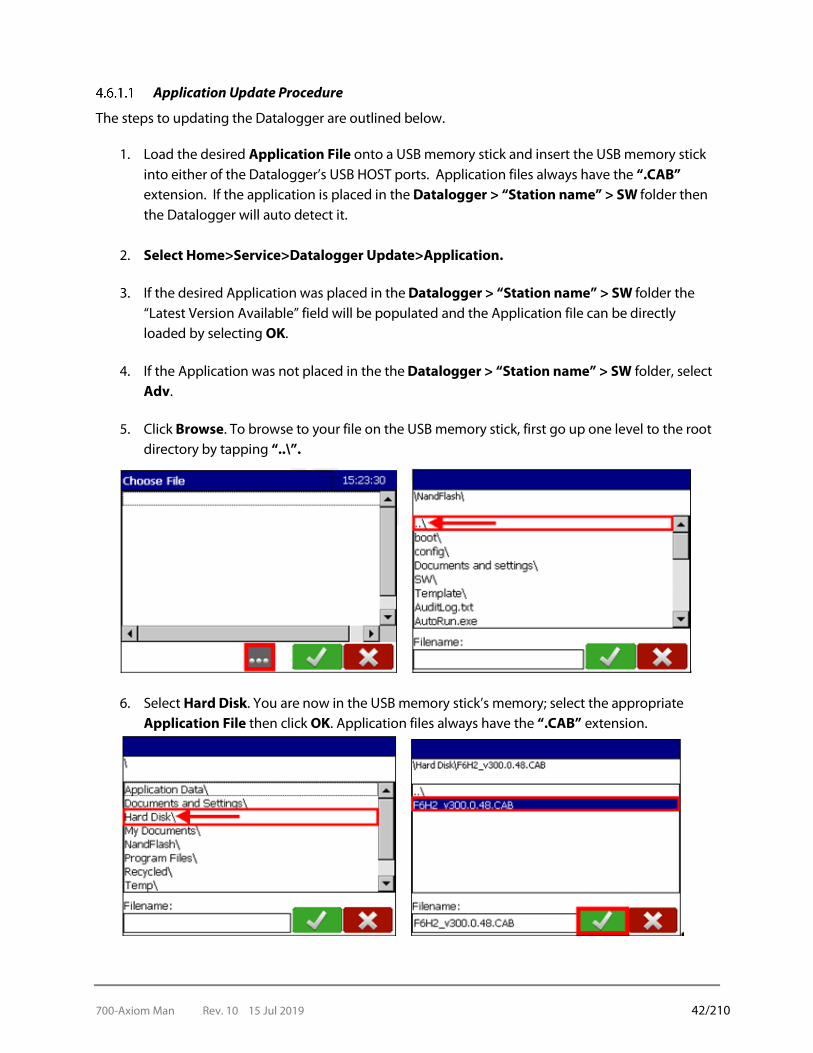
Application Update Procedure
The steps to updating the Datalogger are outlined below.
1. Load the desired Application File onto a USB memory stick and insert the USB memory stick into either of the Datalogger’s USB HOST ports. Application files always have the “.CAB” extension. If the application is placed in the Datalogger > “Station name” > SW folder then the Datalogger will auto detect it.
2. Select Home>Service>Datalogger Update>Application.
3. If the desired Application was placed in the Datalogger > “Station name” > SW folder the “Latest Version Available” field will be populated and the Application file can be directly loaded by selecting OK.
4. If the Application was not placed in the the Datalogger > “Station name” > SW folder, select Adv.
5. Click Browse. To browse to your file on the USB memory stick, first go up one level to the root directory by tapping “..\”.
6. Select Hard Disk. You are now in the USB memory stick’s memory; select the appropriate
Application File then click OK. Application files always have the “.CAB” extension.
700-Axiom Man Rev. 10 15 Jul 2019 43/210
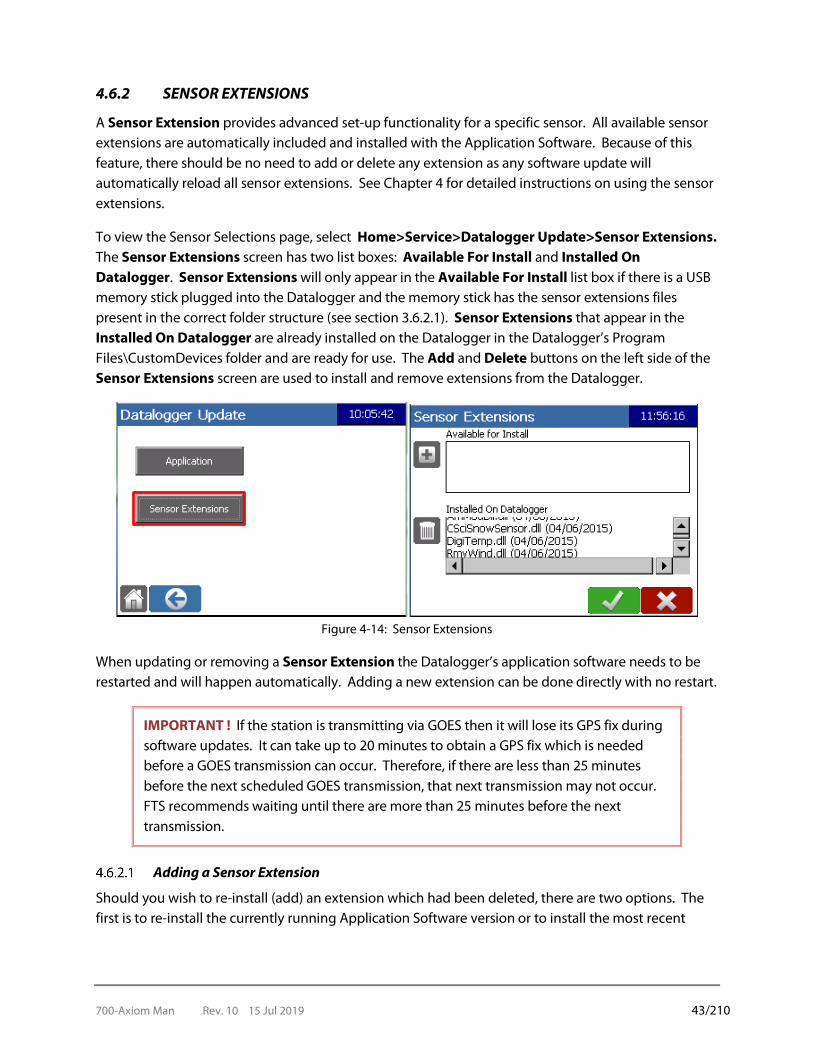
4.6.2 SENSOR EXTENSIONS
A Sensor Extension provides advanced set-up functionality for a specific sensor. All available sensor extensions are automatically included and installed with the Application Software. Because of this feature, there should be no need to add or delete any extension as any software update will automatically reload all sensor extensions. See Chapter 4 for detailed instructions on using the sensor extensions.
To view the Sensor Selections page, select Home>Service>Datalogger Update>Sensor Extensions. The Sensor Extensions screen has two list boxes: Available For Install and Installed On Datalogger. Sensor Extensions will only appear in the Available For Install list box if there is a USB memory stick plugged into the Datalogger and the memory stick has the sensor extensions files present in the correct folder structure (see section 3.6.2.1). Sensor Extensions that appear in the Installed On Datalogger are already installed on the Datalogger in the Datalogger’s Program Files\CustomDevices folder and are ready for use. The Add and Delete buttons on the left side of the Sensor Extensions screen are used to install and remove extensions from the Datalogger.
Figure 4-14: Sensor Extensions
When updating or removing a Sensor Extension the Datalogger’s application software needs to be restarted and will happen automatically. Adding a new extension can be done directly with no restart.
IMPORTANT ! If the station is transmitting via GOES then it will lose its GPS fix during software updates. It can take up to 20 minutes to obtain a GPS fix which is needed before a GOES transmission can occur. Therefore, if there are less than 25 minutes before the next scheduled GOES transmission, that next transmission may not occur. FTS recommends waiting until there are more than 25 minutes before the next transmission.
Adding a Sensor Extension
Should you wish to re-install (add) an extension which had been deleted, there are two options. The first is to re-install the currently running Application Software version or to install the most recent
700-Axiom Man Rev. 10 15 Jul 2019 44/210
version, following the procedure outlined in Section 3.6.1.1. All sensor extensions will be automatically installed.
The second is to use the latest sensor extension from FTS. The Add button is used to install or update Datalogger Sensor Extensions. A new extension can be directly added to the Datalogger; however, when updating an extension, the Datalogger’s application software needs to be restarted. When updating an extension, the existing extension on the Datalogger is overwritten.
To add or update Sensor Extensions on the Datalogger using Sensor Extension files:
1. Obtain the latest sensor extensions from FTS. Sensor Extension filenames have a .dll suffix (i.e. AmModDll.dll for the SDI-AM module extension).
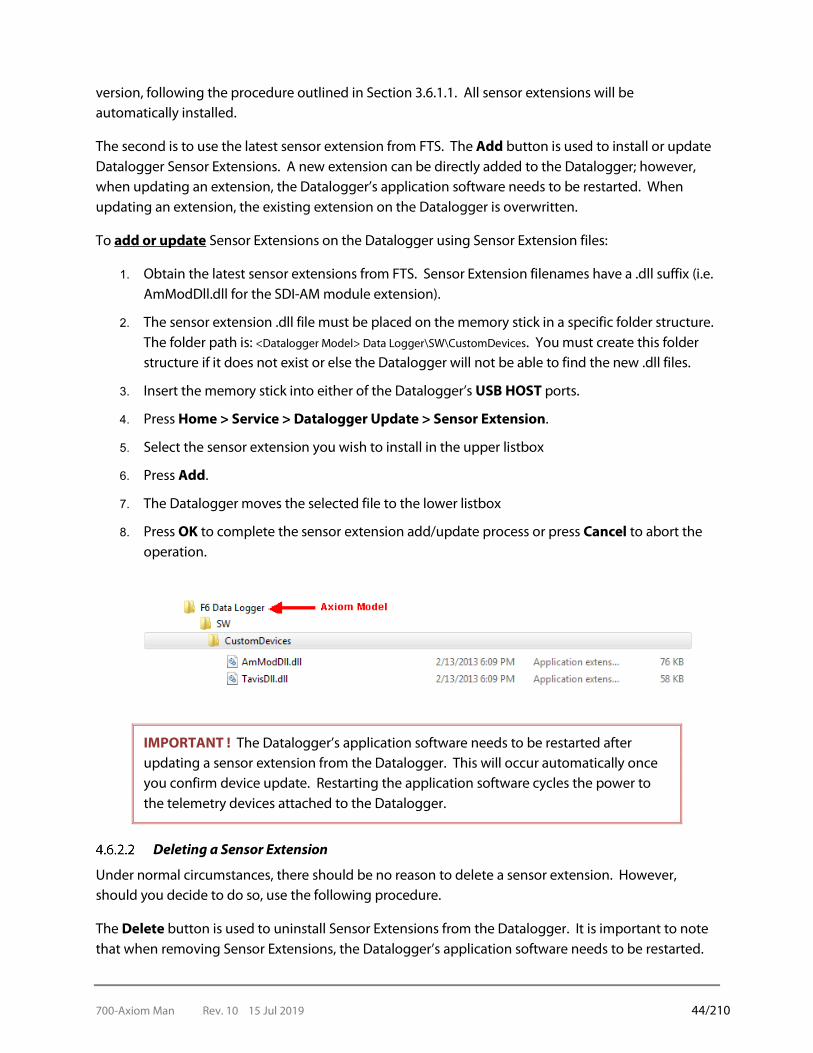
2. The sensor extension .dll file must be placed on the memory stick in a specific folder structure. The folder path is: <Datalogger Model> Data Logger\SW\CustomDevices. You must create this folder structure if it does not exist or else the Datalogger will not be able to find the new .dll files.
3. Insert the memory stick into either of the Datalogger’s USB HOST ports.
4. Press Home > Service > Datalogger Update > Sensor Extension.
5. Select the sensor extension you wish to install in the upper listbox
6. Press Add.
7. The Datalogger moves the selected file to the lower listbox
8. Press OK to complete the sensor extension add/update process or press Cancel to abort the operation.
IMPORTANT ! The Datalogger’s application software needs to be restarted after updating a sensor extension from the Datalogger. This will occur automatically once you confirm device update. Restarting the application software cycles the power to the telemetry devices attached to the Datalogger.
Deleting a Sensor Extension
Under normal circumstances, there should be no reason to delete a sensor extension. However, should you decide to do so, use the following procedure.
The Delete button is used to uninstall Sensor Extensions from the Datalogger. It is important to note that when removing Sensor Extensions, the Datalogger’s application software needs to be restarted.

700-Axiom Man Rev. 10 15 Jul 2019 45/210
To remove a Sensor Extension from the Datalogger:
1. Ensure that there is no memory stick connected to either USB HOST port.
2. Press Home > Service > Datalogger Update > Sensor Extension.
3. The Datalogger will display the sensor extensions currently installed on the Datalogger in the lower list box.
4. Select the sensor extension you wish to remove in the lower list box.
5. Press Delete. The Confirm Device Update screen appears.
6. Press Cancel to abort the operation or press OK to complete the sensor extension removal process. The Datalogger will prompt you for confirmation and then the Datalogger application will automatically restart.
Figure 4-15: Confirm Device Update
IMPORTANT! The Datalogger’s application software needs to be restarted when removing a Sensor Extension from the Datalogger. This will occur automatically once you confirm device update. Restarting the application software cycles the power to the telemetry devices attached to the Datalogger.
Note that with any subsequent Application Software update, all available sensor extensions will be installed as part of the update, including any you may have previously deleted.
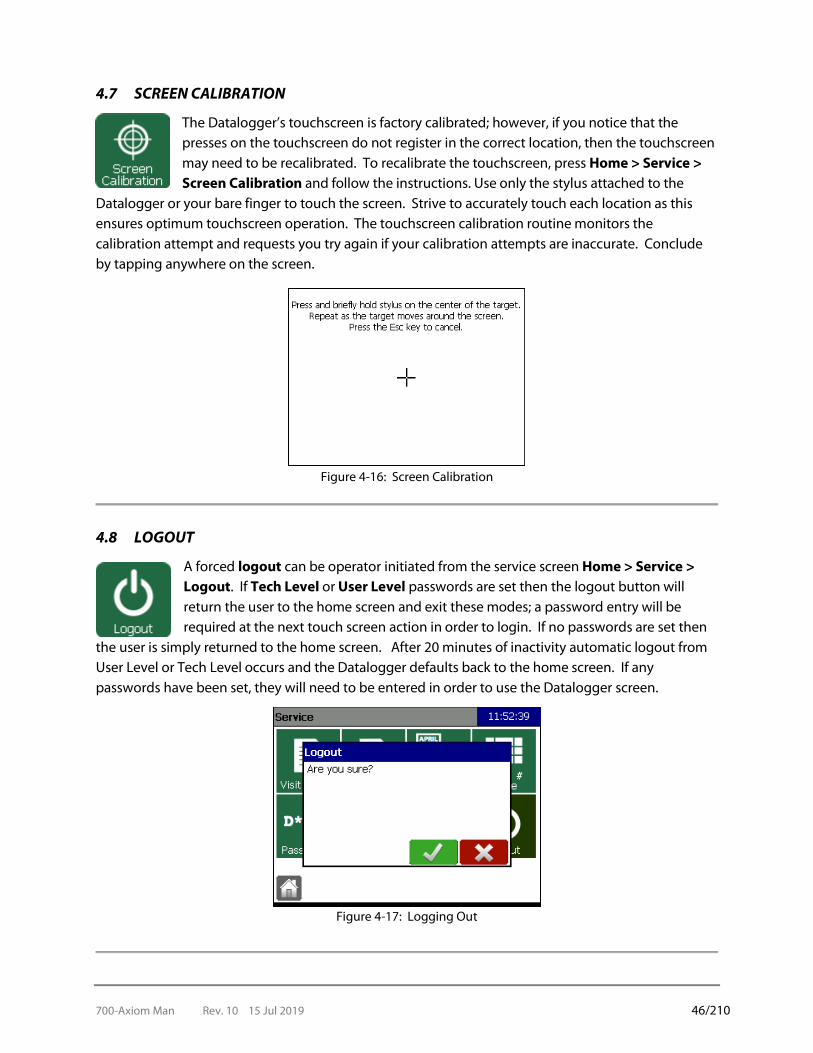
700-Axiom Man Rev. 10 15 Jul 2019 46/210
4.7 SCREEN CALIBRATION
The Datalogger’s touchscreen is factory calibrated; however, if you notice that the presses on the touchscreen do not register in the correct location, then the touchscreen may need to be recalibrated. To recalibrate the touchscreen, press Home > Service > Screen Calibration and follow the instructions. Use only the stylus attached to the
Datalogger or your bare finger to touch the screen. Strive to accurately touch each location as this ensures optimum touchscreen operation. The touchscreen calibration routine monitors the calibration attempt and requests you try again if your calibration attempts are inaccurate. Conclude by tapping anywhere on the screen.
Figure 4-16: Screen Calibration
4.8 LOGOUT
A forced logout can be operator initiated from the service screen Home > Service > Logout. If Tech Level or User Level passwords are set then the logout button will return the user to the home screen and exit these modes; a password entry will be required at the next touch screen action in order to login. If no passwords are set then
the user is simply returned to the home screen. After 20 minutes of inactivity automatic logout from User Level or Tech Level occurs and the Datalogger defaults back to the home screen. If any passwords have been set, they will need to be entered in order to use the Datalogger screen.
Figure 4-17: Logging Out

700-Axiom Man Rev. 10 15 Jul 2019 47/210
- SENSORS
The Sensors icon opens the Sensors screen, which enables the user to configure sensors for the Axiom Datalogger. Figure 5-1 shows the Sensors screen for a blank Datalogger (no sensors configured) and a preconfigured Datalogger. Normally the Datalogger would be preconfigured by FTS and several sensors would be visible on the
Sensor screen.
Datalogger with no sensors configured Datalogger with sensors configured
Figure 5-1: Sensors screen
There are three categories of sensors which are available: Internal Sensors, Dedicated Sensors, and Sensor Extensions.
Internal Sensors
Dedicated Sensors
Sensor Extensions
Figure 5-2: Categories of Sensors and their Icons
700-Axiom Man Rev. 10 15 Jul 2019 48/210
Internal Sensors These sensors measure variables essential to the operation of the Datalogger itself.
Dedicated Sensors These sensors vary by Datalogger model and have individually labelled, unique ports to which they attach.
Sensor Extensions For use with SDI sensors. There are a variety of Extensions that can be used with specific sensors which have options unique to those sensors, making setup easier.
The SDI Generic is for use with an SDI sensor which does not have a specific extension. Additionally, any SDI sensor (whether there is an extension or not) can be setup using the SDI Generic icon.
5.1 ADDING A SENSOR
To add a sensor, press the Add button. This will display all available sensor icons (see Figure 5-1). Scroll through the screen and tap on the icon of the sensor you wish to add. This will automatically bring up that sensor’s setup page. A detailed explanation of how to setup individual sensors is included in this chapter. However, the next section provides general information which is common to setting up all sensors.
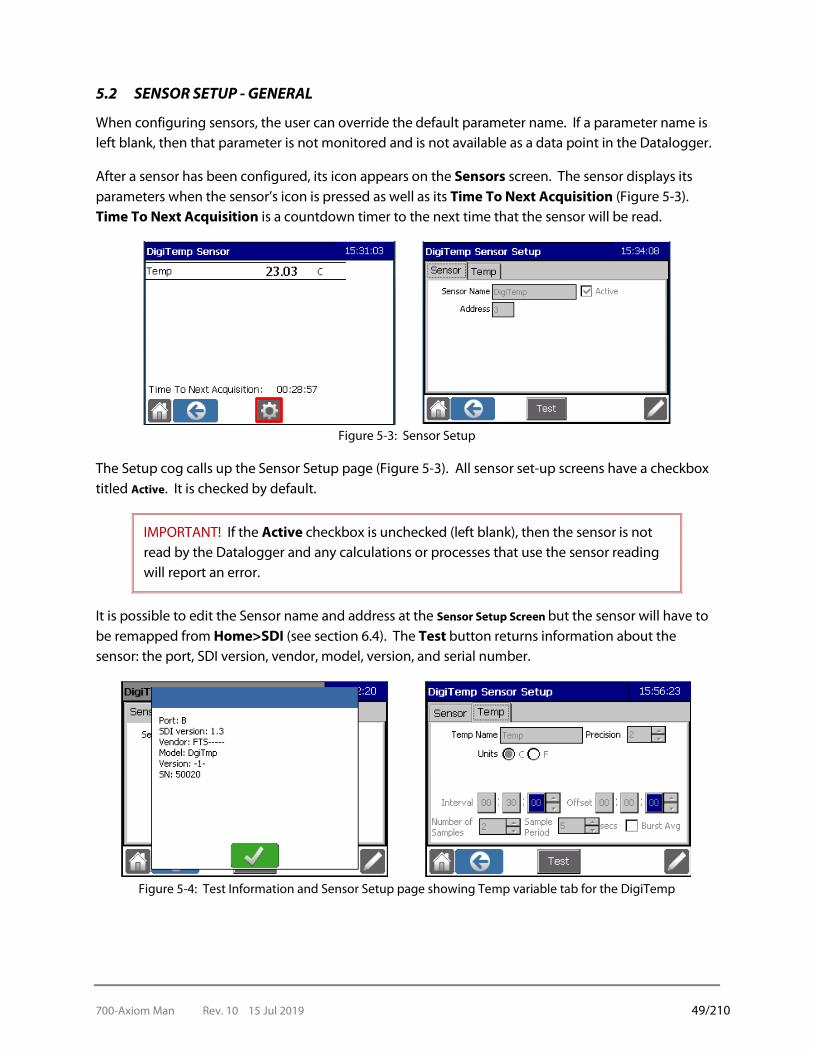
700-Axiom Man Rev. 10 15 Jul 2019 49/210
5.2 SENSOR SETUP - GENERAL
When configuring sensors, the user can override the default parameter name. If a parameter name is left blank, then that parameter is not monitored and is not available as a data point in the Datalogger.
After a sensor has been configured, its icon appears on the Sensors screen. The sensor displays its parameters when the sensor’s icon is pressed as well as its Time To Next Acquisition (Figure 5-3). Time To Next Acquisition is a countdown timer to the next time that the sensor will be read.
Figure 5-3: Sensor Setup
The Setup cog calls up the Sensor Setup page (Figure 5-3). All sensor set-up screens have a checkbox titled Active. It is checked by default.
IMPORTANT! If the Active checkbox is unchecked (left blank), then the sensor is not read by the Datalogger and any calculations or processes that use the sensor reading will report an error.
It is possible to edit the Sensor name and address at the Sensor Setup Screen but the sensor will have to be remapped from Home>SDI (see section 6.4). The Test button returns information about the sensor: the port, SDI version, vendor, model, version, and serial number.
Figure 5-4: Test Information and Sensor Setup page showing Temp variable tab for the DigiTemp

700-Axiom Man Rev. 10 15 Jul 2019 50/210
Each sensor will have additional Tabs identifying a variety of variables. From these tabs the sensor can be configured to read the variables as directed in accordance with the information input in the different fields.
5.2.1 RESTRICTIONS ON SENSOR VARIABLE NAMES
Each sensor defines one or more named variables. These names must conform to the following rules:
• The name must contain only upper or lowercase letters, digits, or the underscore character ("_").
• There can be no spaces. • The name must start with a letter. • The name cannot be any of the following reserved names (reserved names are case sensitive):
o ABS o ACOS o ASIN o AT o ATAN o CMD o COS o Elev o ELSE o ERR o EXP o FRAC o IF o INT o LN o Lat
o Long o MAX o MIN o MOD o PI o POW o SIN o SQRT o SteinhC o SWR o t_DySince o t_DySYr o t_HrSince o t_HrSYr o t_IsLeap
o t_MnSince o t_MnSYr o t_SeSince o TAN o t_dd o t_doy o t_HH o t_mm o t_MM o t_ss o t_TZ o t_yyyy o YB o YF o YR
5.2.2 IN-LINE LOGGING
It is possible to set up a logging function directly from the Sensor Setup page rather than through the Data icon. In order to do so, In-Line Logging has to be enabled (Home>Station>Advanced>Enable In-Line Logging (see Chapter 2.6). From the home page select the Sensors icon. Select the desired Sensor icon from the Sensors page. Select Setup>Edit to display the Sensor Setup page. Select OK to bring up the In-line Logging Setup screen. Enter Edit mode and select the Datapoints you desire to have logged and added to current conditions. Once done select OK. If In-line Logging is selected, and no Enable Logging checkboxes are selected, the In-line Logging Interval will not appear for that sensor.
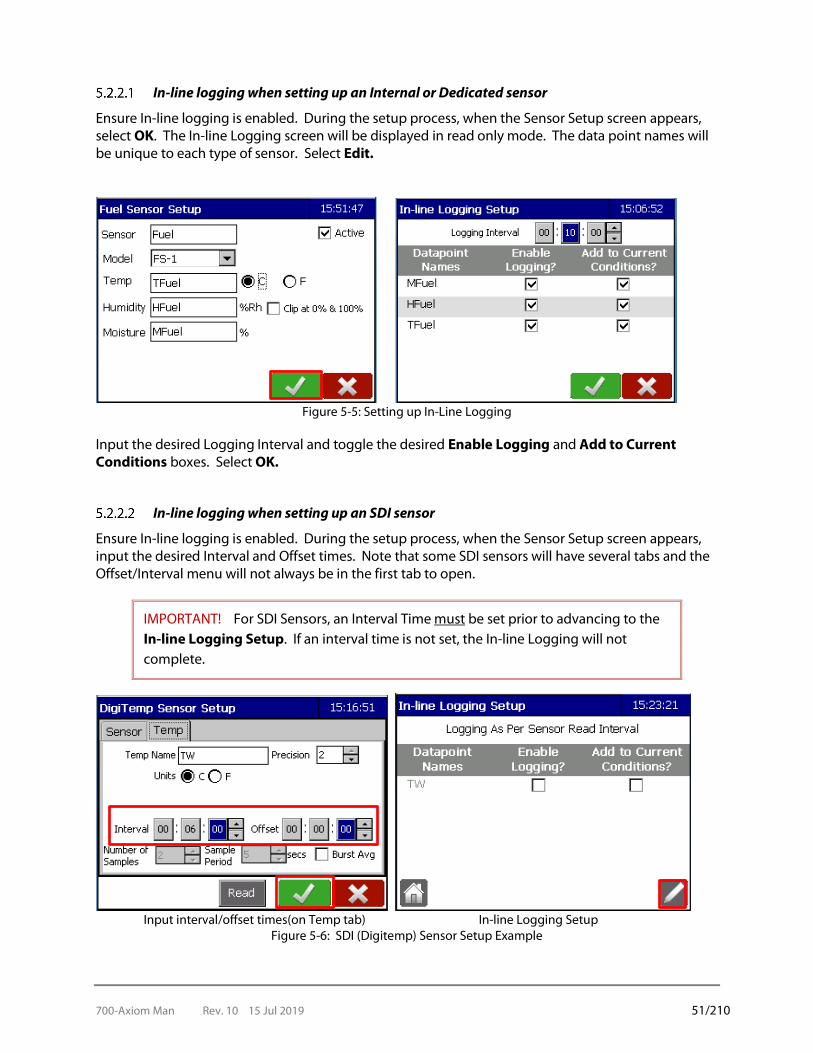
700-Axiom Man Rev. 10 15 Jul 2019 51/210
In-line logging when setting up an Internal or Dedicated sensor
Ensure In-line logging is enabled. During the setup process, when the Sensor Setup screen appears, select OK. The In-line Logging screen will be displayed in read only mode. The data point names will be unique to each type of sensor. Select Edit.
Figure 5-5: Setting up In-Line Logging
Input the desired Logging Interval and toggle the desired Enable Logging and Add to Current Conditions boxes. Select OK.
In-line logging when setting up an SDI sensor
Ensure In-line logging is enabled. During the setup process, when the Sensor Setup screen appears, input the desired Interval and Offset times. Note that some SDI sensors will have several tabs and the Offset/Interval menu will not always be in the first tab to open.
IMPORTANT! For SDI Sensors, an Interval Time must be set prior to advancing to the In-line Logging Setup. If an interval time is not set, the In-line Logging will not complete.
Input interval/offset times(on Temp tab) In-line Logging Setup
Figure 5-6: SDI (Digitemp) Sensor Setup Example
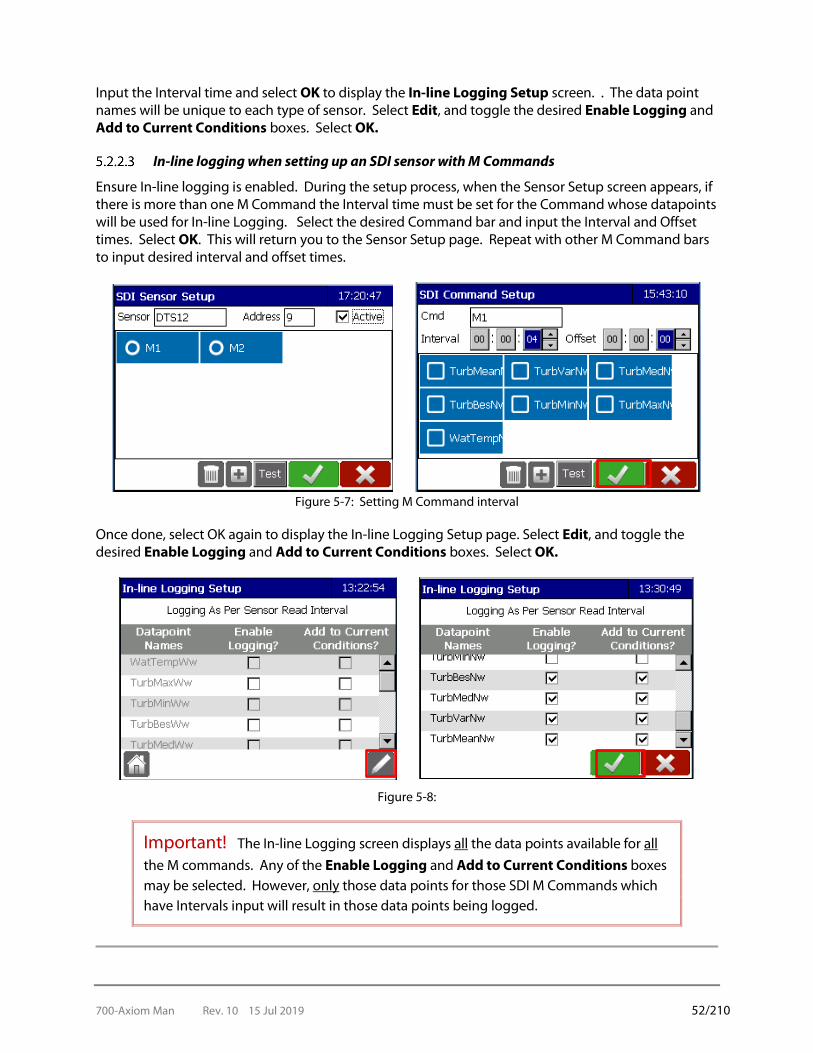
700-Axiom Man Rev. 10 15 Jul 2019 52/210
Input the Interval time and select OK to display the In-line Logging Setup screen. . The data point names will be unique to each type of sensor. Select Edit, and toggle the desired Enable Logging and Add to Current Conditions boxes. Select OK.
In-line logging when setting up an SDI sensor with M Commands
Ensure In-line logging is enabled. During the setup process, when the Sensor Setup screen appears, if there is more than one M Command the Interval time must be set for the Command whose datapoints will be used for In-line Logging. Select the desired Command bar and input the Interval and Offset times. Select OK. This will return you to the Sensor Setup page. Repeat with other M Command bars to input desired interval and offset times.
Figure 5-7: Setting M Command interval
Once done, select OK again to display the In-line Logging Setup page. Select Edit, and toggle the desired Enable Logging and Add to Current Conditions boxes. Select OK.
Figure 5-8:
Important! The In-line Logging screen displays all the data points available for all the M commands. Any of the Enable Logging and Add to Current Conditions boxes may be selected. However, only those data points for those SDI M Commands which have Intervals input will result in those data points being logged.

700-Axiom Man Rev. 10 15 Jul 2019 53/210
5.3 INTERNAL SENSOR SETUP
There are three physical sensors internal to the Axiom Datalogger used to measure solar panel parameters, battery parameters, and Datalogger temperature. The Battery, TCase (case temperature), and Solar Panel icons access screens to configure these measurements.
REMINDER! Available sensors and sensor parameters vary with Datalogger model. Full functionality will be explained in this manual.
5.3.1 BATTERY
The Battery Sensor Setup screen shows measurable parameters for the battery. The parameters include battery voltage, current, temperature as well as the voltage of the optional battery back-up D-cell pack. The default names are shown in Figure 5-9. The names can be changed by pressing on the field and using the keyboard to input the desired name(s). A negative value for battery current indicates that current is being
drawn from the battery (the battery is being discharged) while a positive value indicates that the battery is being charged. The value reported in battery voltage and battery current is an average value from the last 10 seconds.
Voltage is reported in volts (V) and Current in Amperes (A). Temperature is reported in Celsius (C ) or Fahrenheit (F) in accordance with the selected Radio button.
Figure 5-9: Battery Sensor Setup
5.3.2 SOLAR PANEL
The Solar Sensor Setup screen shows measurable parameters for the solar panel. Measurable parameters are the solar panel voltage and current. The default sensor names are shown in Figure 5-10. Voltage is reported in volts (V) and Current in Amperes (A). The value reported in solar panel voltage and solar panel current is an
average value from the last 10 seconds.

700-Axiom Man Rev. 10 15 Jul 2019 54/210
Figure 5-10
5.3.3 CASE TEMPERATURE(TCASE)
The Case Temp Sensor Setup screen shows the measurable parameter for the Datalogger’s internal case temperature sensor. The default parameter name for this sensor is TCase and the temperature is reported in Celsius (C ) or Fahrenheit (F) in accordance with the selected Radio button.
Figure 5-11
Select OK. If In-line Logging is enabled (see section 3.5.1), the In-line Logging Setup screen will be displayed from which you can enable logging and add to Current Conditions.
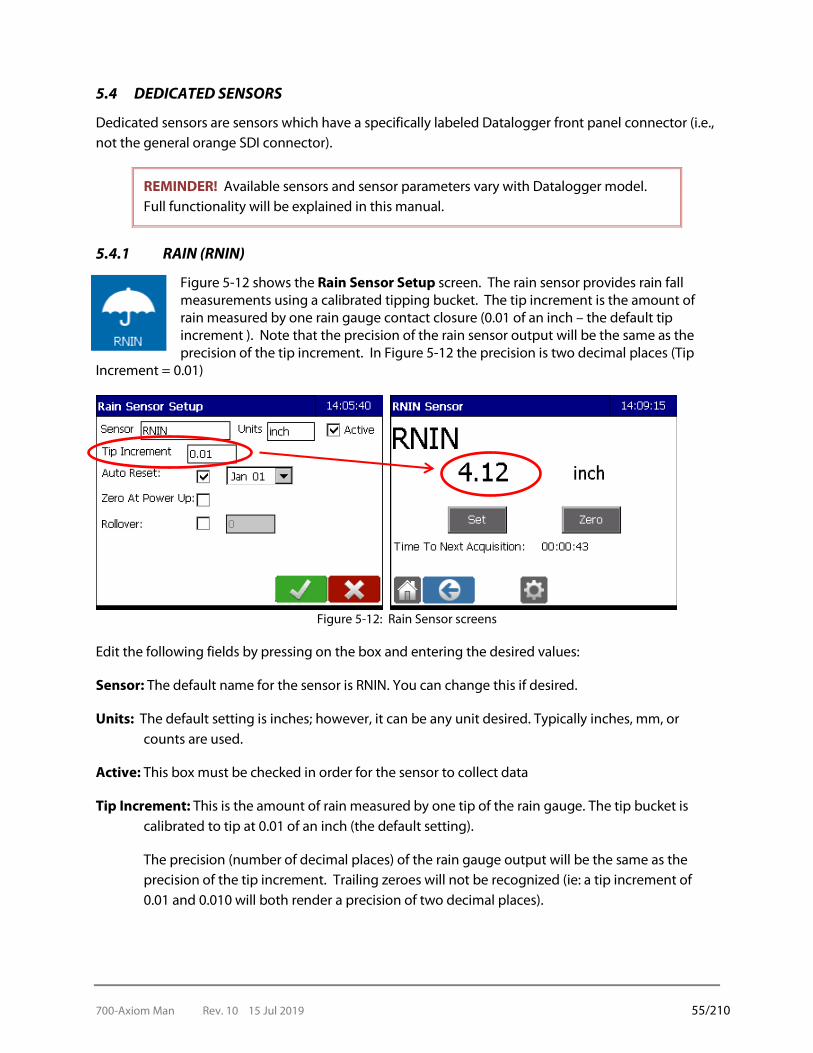
700-Axiom Man Rev. 10 15 Jul 2019 55/210
5.4 DEDICATED SENSORS
Dedicated sensors are sensors which have a specifically labeled Datalogger front panel connector (i.e., not the general orange SDI connector).
REMINDER! Available sensors and sensor parameters vary with Datalogger model. Full functionality will be explained in this manual.
5.4.1 RAIN (RNIN)
Figure 5-12 shows the Rain Sensor Setup screen. The rain sensor provides rain fall measurements using a calibrated tipping bucket. The tip increment is the amount of rain measured by one rain gauge contact closure (0.01 of an inch – the default tip increment ). Note that the precision of the rain sensor output will be the same as the precision of the tip increment. In Figure 5-12 the precision is two decimal places (Tip
Increment = 0.01)
Figure 5-12: Rain Sensor screens
Edit the following fields by pressing on the box and entering the desired values:
Sensor: The default name for the sensor is RNIN. You can change this if desired.
Units: The default setting is inches; however, it can be any unit desired. Typically inches, mm, or counts are used.
Active: This box must be checked in order for the sensor to collect data
Tip Increment: This is the amount of rain measured by one tip of the rain gauge. The tip bucket is calibrated to tip at 0.01 of an inch (the default setting).
The precision (number of decimal places) of the rain gauge output will be the same as the precision of the tip increment. Trailing zeroes will not be recognized (ie: a tip increment of 0.01 and 0.010 will both render a precision of two decimal places).
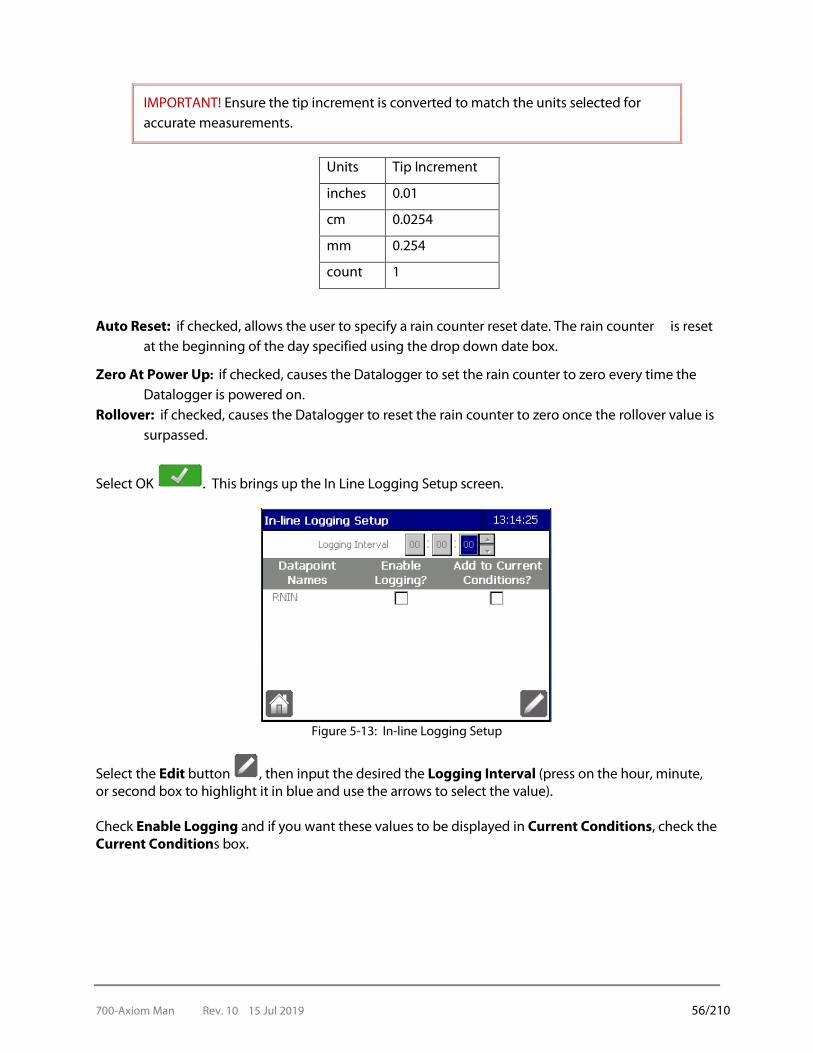
700-Axiom Man Rev. 10 15 Jul 2019 56/210
IMPORTANT! Ensure the tip increment is converted to match the units selected for accurate measurements.
Units Tip Increment
inches 0.01
cm 0.0254
mm 0.254
count 1
Auto Reset: if checked, allows the user to specify a rain counter reset date. The rain counter is reset at the beginning of the day specified using the drop down date box.
Zero At Power Up: if checked, causes the Datalogger to set the rain counter to zero every time the Datalogger is powered on.
Rollover: if checked, causes the Datalogger to reset the rain counter to zero once the rollover value is surpassed.
Select OK . This brings up the In Line Logging Setup screen.
Figure 5-13: In-line Logging Setup
Select the Edit button , then input the desired the Logging Interval (press on the hour, minute, or second box to highlight it in blue and use the arrows to select the value). Check Enable Logging and if you want these values to be displayed in Current Conditions, check the Current Conditions box.
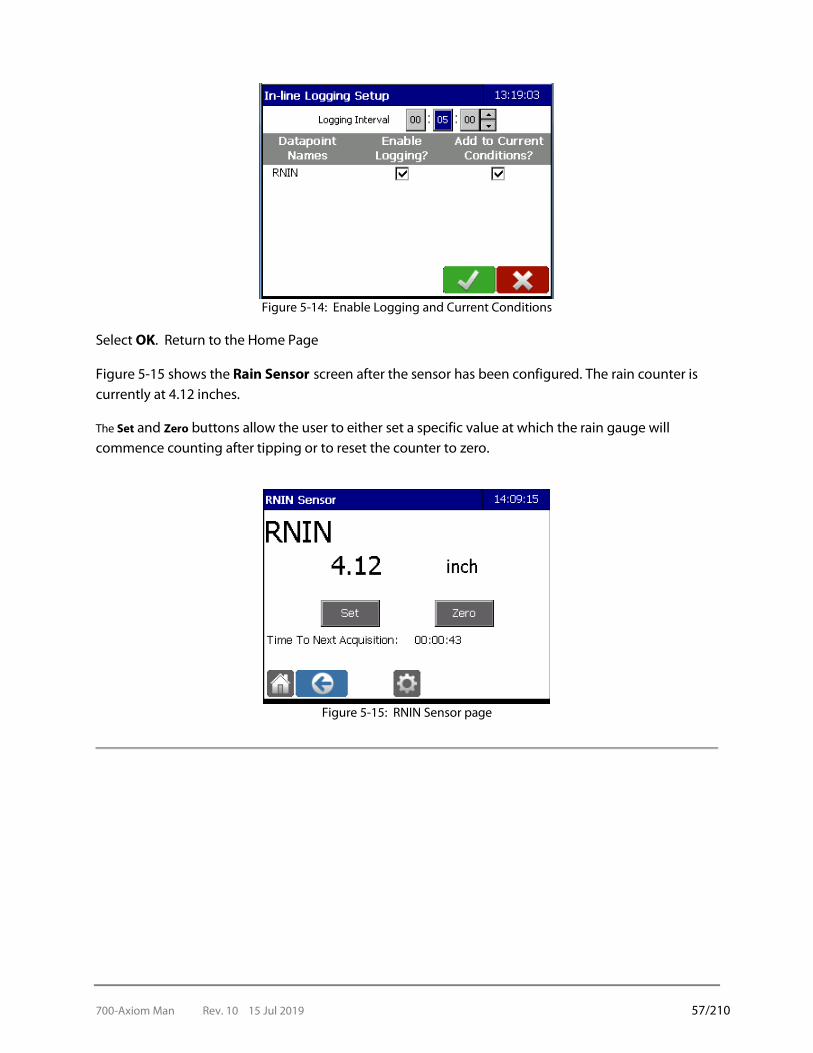
700-Axiom Man Rev. 10 15 Jul 2019 57/210
Figure 5-14: Enable Logging and Current Conditions
Select OK. Return to the Home Page Figure 5-15 shows the Rain Sensor screen after the sensor has been configured. The rain counter is currently at 4.12 inches.
The Set and Zero buttons allow the user to either set a specific value at which the rain gauge will commence counting after tipping or to reset the counter to zero.
Figure 5-15: RNIN Sensor page
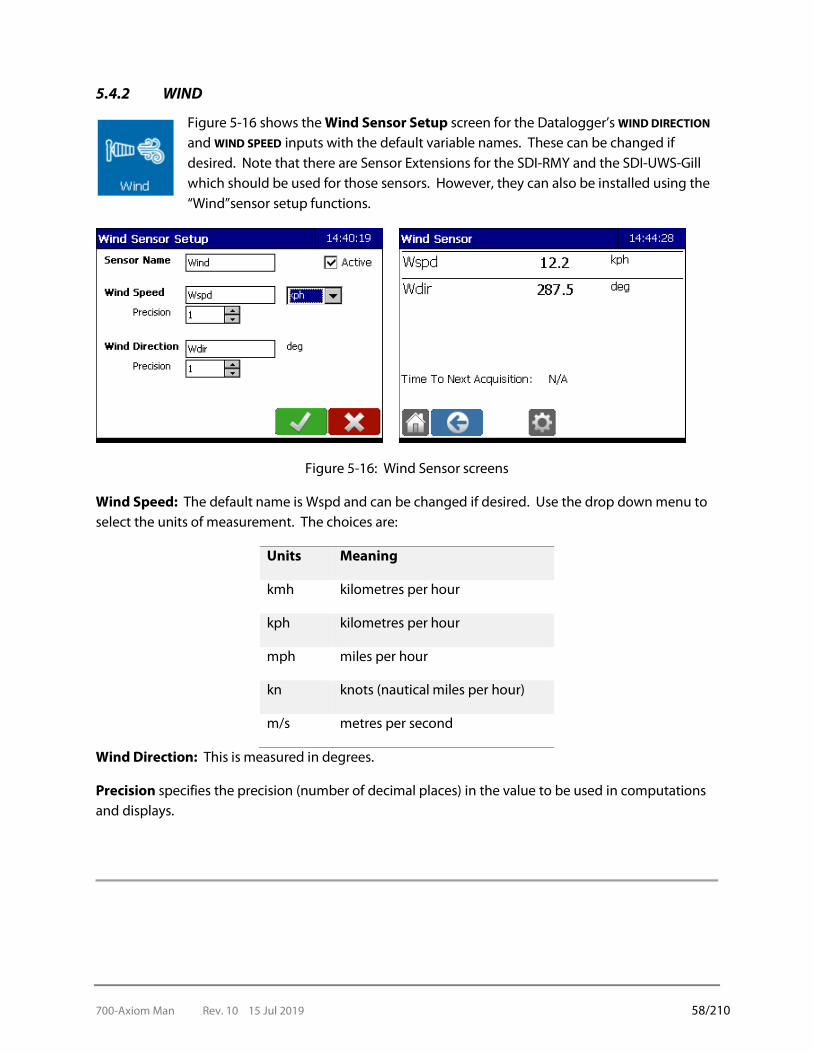
700-Axiom Man Rev. 10 15 Jul 2019 58/210
5.4.2 WIND
Figure 5-16 shows the Wind Sensor Setup screen for the Datalogger’s WIND DIRECTION and WIND SPEED inputs with the default variable names. These can be changed if desired. Note that there are Sensor Extensions for the SDI-RMY and the SDI-UWS-Gill which should be used for those sensors. However, they can also be installed using the “Wind”sensor setup functions.
Figure 5-16: Wind Sensor screens
Wind Speed: The default name is Wspd and can be changed if desired. Use the drop down menu to select the units of measurement. The choices are:
Units Meaning
kmh kilometres per hour
kph kilometres per hour
mph miles per hour
kn knots (nautical miles per hour)
m/s metres per second
Wind Direction: This is measured in degrees.
Precision specifies the precision (number of decimal places) in the value to be used in computations and displays.

700-Axiom Man Rev. 10 15 Jul 2019 59/210
5.4.3 AIR
Figure 5-17 shows the Air Sensor Setup screen for the Datalogger’s Temperature & Humidity (THS) input with the default variable names. These can be changed if desired.
Figure 5-17: Air Sensor screens
Temp: Temperature values can be selected using the radio buttons. Either degrees Celsius (ºC) or degrees Fahrenheit (ºF).
Humidity: This is the Relative Humidity.
Clip at 0% & 100% checkbox: If checked, causes the Datalogger to limit humidity values read from the sensor to the range of 0 to 100%. That is, any air sensor humidity measurements above 100% (sensor output of 1V) are reported as 100% and any measurements less than 0% (sensor output of 0V) are reported as 0%. If the Clip at 0% & 100% is not enabled and the sensor reads outside of its range (higher than 117%) then an error (ERR) will be reported.

700-Axiom Man Rev. 10 15 Jul 2019 60/210
5.4.4 FUEL STICK
Figure 5-18 shows the Fuel Sensor Setup screen for the Datalogger’s FUELSTICK input. The default names are shown but these can be changed as desired by pressing on the screen and using the keyboard to input the new name.
Figure 5-18: Fuel Sensor screens
Model: Use the drop down menu to select the model of the fuel stick in use. Only the default parameters supported by the selected sensor model will be displayed.
Temperature: Select the units - either degrees Celsius (ºC ) or Fahrenheit (ºF ).
Humidity: This is the relative humidity (Rh) of the fuel stick.
Clip at 0% & 100% checkbox: When checked, this causes the Datalogger to limit humidity values read from the sensor to the range of 0 to 100%. That is, any air sensor humidity measurements above 100% (sensor output of 1V) are reported as 100% and any sensor measurements less than 0% (sensor output of 0V) are reported as 0%. Limiting humidity values has the secondary effect of limiting moisture values as fuel humidity is used in the fuel moisture calculation. If the Clip at 0% & 100% is not enabled and the sensor reads outside of its range then an error (ERR) will be reported.
Moisture: This reports the fuel moisture levels. The Fuel moisture calculation for the FTS fuel stick is
as follows:

700-Axiom Man Rev. 10 15 Jul 2019 61/210
For Humidity < 10%:
𝐹𝐹𝐹𝐹𝑂𝑂𝐹𝐹 𝑀𝑀𝑀𝑀𝑀𝑀𝑂𝑂𝑂𝑂𝐹𝐹𝑀𝑀𝑂𝑂 (%) = 0.03229 + (𝐻𝐻𝐹𝐹𝐻𝐻 ∗ 0.281073) − (𝐻𝐻𝐹𝐹𝐻𝐻 ∗ 𝑇𝑇𝑂𝑂𝐻𝐻𝑝𝑝 ∗ 0.000578)
For (10% >= Humidity < 50%):
𝐹𝐹𝐹𝐹𝑂𝑂𝐹𝐹 𝑀𝑀𝑀𝑀𝑀𝑀𝑂𝑂𝑂𝑂𝐹𝐹𝑀𝑀𝑂𝑂 = 2.22749 + (𝐻𝐻𝐹𝐹𝐻𝐻 ∗ 0.160107) − (𝑇𝑇𝑂𝑂𝐻𝐻𝑝𝑝 ∗ 0.014784)
For Humidity >= 50%:
𝐹𝐹𝐹𝐹𝑂𝑂𝐹𝐹 𝑀𝑀𝑀𝑀𝑀𝑀𝑂𝑂𝑂𝑂𝐹𝐹𝑀𝑀𝑂𝑂 = 21.0606 + (𝐻𝐻𝐹𝐹𝐻𝐻 ∗ 𝐻𝐻𝐹𝐹𝐻𝐻 ∗ 0.005565) − (𝐻𝐻𝐹𝐹𝐻𝐻 ∗ 𝑇𝑇𝑂𝑂𝐻𝐻𝑝𝑝 ∗ 0.00035) − (𝐻𝐻𝐹𝐹𝐻𝐻 ∗ 0.483199)
In which:
Hum (humidity) = %Rh, as seen on the Fuel Sensor Results screen Temp (temperature) = Fahrenheit
Once all fields are completed, select OK.
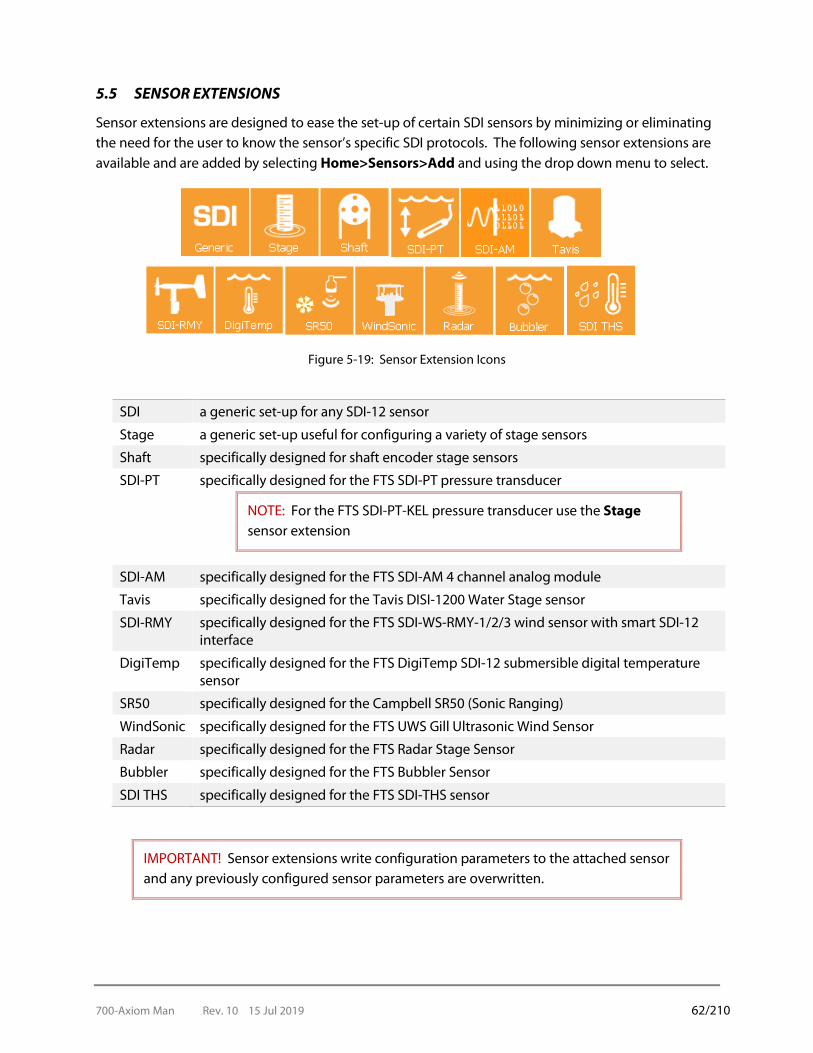
700-Axiom Man Rev. 10 15 Jul 2019 62/210
5.5 SENSOR EXTENSIONS
Sensor extensions are designed to ease the set-up of certain SDI sensors by minimizing or eliminating the need for the user to know the sensor’s specific SDI protocols. The following sensor extensions are available and are added by selecting Home>Sensors>Add and using the drop down menu to select.
Figure 5-19: Sensor Extension Icons
SDI a generic set-up for any SDI-12 sensor
Stage a generic set-up useful for configuring a variety of stage sensors
Shaft specifically designed for shaft encoder stage sensors
SDI-PT specifically designed for the FTS SDI-PT pressure transducer
NOTE: For the FTS SDI-PT-KEL pressure transducer use the Stage sensor extension
SDI-AM specifically designed for the FTS SDI-AM 4 channel analog module
Tavis specifically designed for the Tavis DISI-1200 Water Stage sensor
SDI-RMY specifically designed for the FTS SDI-WS-RMY-1/2/3 wind sensor with smart SDI-12 interface
DigiTemp specifically designed for the FTS DigiTemp SDI-12 submersible digital temperature sensor
SR50 specifically designed for the Campbell SR50 (Sonic Ranging)
WindSonic specifically designed for the FTS UWS Gill Ultrasonic Wind Sensor
Radar specifically designed for the FTS Radar Stage Sensor
Bubbler specifically designed for the FTS Bubbler Sensor
SDI THS specifically designed for the FTS SDI-THS sensor
IMPORTANT! Sensor extensions write configuration parameters to the attached sensor and any previously configured sensor parameters are overwritten.
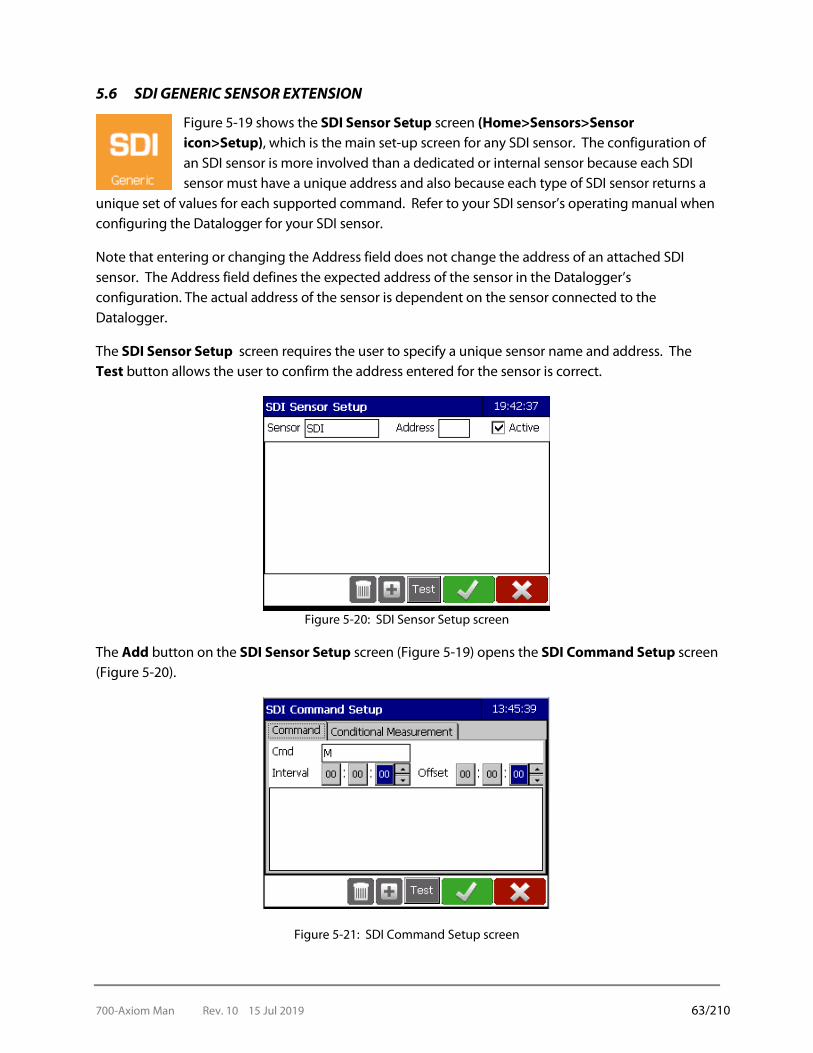
700-Axiom Man Rev. 10 15 Jul 2019 63/210
5.6 SDI GENERIC SENSOR EXTENSION
Figure 5-19 shows the SDI Sensor Setup screen (Home>Sensors>Sensor icon>Setup), which is the main set-up screen for any SDI sensor. The configuration of an SDI sensor is more involved than a dedicated or internal sensor because each SDI sensor must have a unique address and also because each type of SDI sensor returns a
unique set of values for each supported command. Refer to your SDI sensor’s operating manual when configuring the Datalogger for your SDI sensor.
Note that entering or changing the Address field does not change the address of an attached SDI sensor. The Address field defines the expected address of the sensor in the Datalogger’s configuration. The actual address of the sensor is dependent on the sensor connected to the Datalogger.
The SDI Sensor Setup screen requires the user to specify a unique sensor name and address. The Test button allows the user to confirm the address entered for the sensor is correct.
Figure 5-20: SDI Sensor Setup screen
The Add button on the SDI Sensor Setup screen (Figure 5-19) opens the SDI Command Setup screen (Figure 5-20).
Figure 5-21: SDI Command Setup screen

700-Axiom Man Rev. 10 15 Jul 2019 64/210
5.6.1 COMMAND TAB
The SDI Command Setup screen is used to specify the sensor command (default is the M command) and requires the user to set a command interval and offset. The M, MC, C, CC, R, RC and V commands are supported as per the SDI-12 specification (version 1.3). The Datalogger automatically sends D commands if needed to retrieve the measured values.
The Interval is in hh:mm:ss format and specifies how often the specified command is sent to the sensor. The Offset is also in hh:mm:ss format and specifies how long after midnight the first command is sent to the sensor. The specified Offset must be less than the specified Interval.
IMPORTANT ! Interval and Offset specify the time the command to the SDI sensor is initiated. When configuring the sensor, the user must consider the sensor’s measurement response time so that the data returned from the sensor is available to the Datalogger
Example: In this example a DigiTemp will be set-up as a SDI-Generic sensor. The sensor is set to address 7 and connected to SDI-A on the Axiom. Follow the steps in Figure 5-21 to initiate the setup (Sensors > Add > SDI Generic> Set sensor name and address).
Figure 5-22: SDI Sensor Setup
To confirm correct sensor address entry press the Test button. If the sensor address matches the entered address you will be presented with basic sensor information (Figure 5-22). You will receive a Sensor is not responding message if the address does not match, the sensor is not correctly seated, or if there are technical problems with the sensor.

700-Axiom Man Rev. 10 15 Jul 2019 65/210
Successful Test Message Unsuccessful Test Message
Figure 5-23:
Press Add to advance to the SDI Command Setup. An Interval of 01:00:00 and an Offset of 00:59:30 is entered and configures the Datalogger to send the specified command to the sensor every hour at fifty nine minutes and thirty seconds past the hour (00:59:30, 01:59:30, 02:59:30, 03:59:30, etc.). Assuming that this SDI sensor only requires a few seconds to return its data, then the data from this command is available to the Datalogger for logging, processing, or transmission at the top of the hour. Enter the desired command in the Cmd box.
The Test button sends the specified command to the sensor and displays the returned fields (values). It also returns the Measurement Time, which can be used to confirm that the assigned offset time is sufficient to read, log, and process the data before transmission.
IMPORTANT! Remember that information is emptied into the buffer approximately 2 minutes before transmission, so ensure the offset time is calculated to have completed reading, logging and processing at least two minutes before the transmission.
Figure 5-24: Command Setup and Test
The Add button on the SDI Command Setup Screen launches the SDI Field Setup Screen (Figure 5-24) which enables the user to define variables for the values returned by the command (unique field name for the field number, units and precision (number of decimals)). Multiple fields can be defined
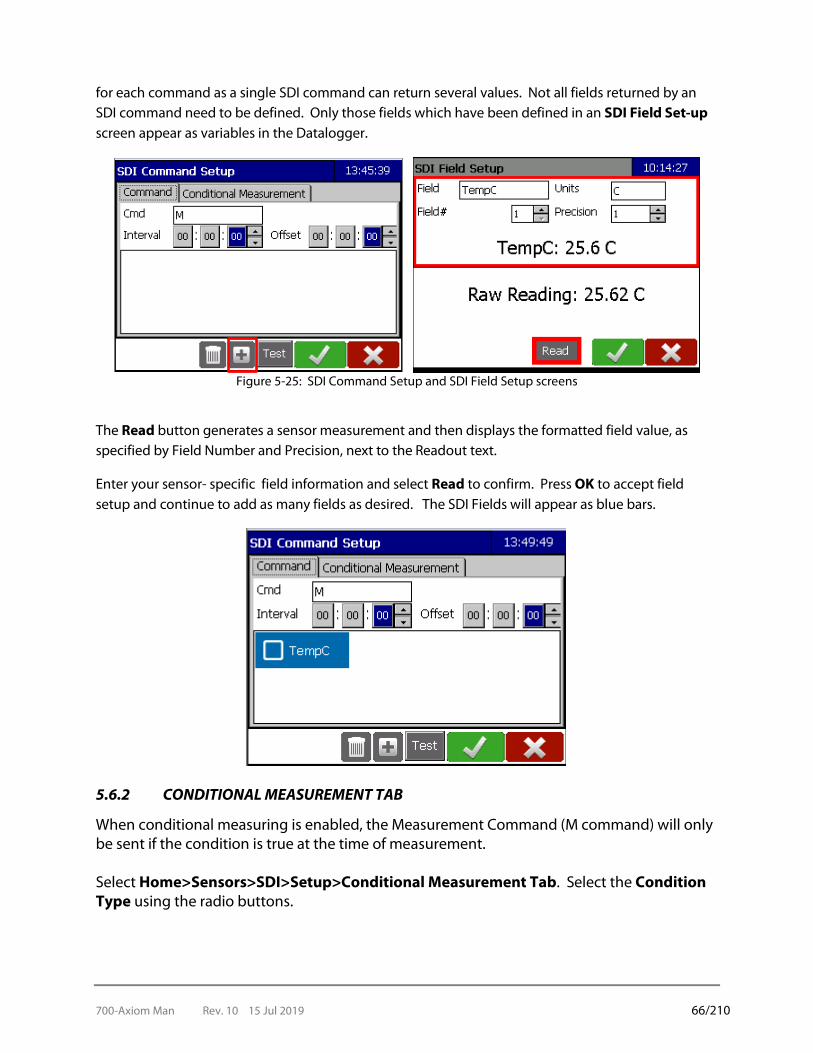
700-Axiom Man Rev. 10 15 Jul 2019 66/210
for each command as a single SDI command can return several values. Not all fields returned by an SDI command need to be defined. Only those fields which have been defined in an SDI Field Set-up screen appear as variables in the Datalogger.
Figure 5-25: SDI Command Setup and SDI Field Setup screens
The Read button generates a sensor measurement and then displays the formatted field value, as specified by Field Number and Precision, next to the Readout text.
Enter your sensor- specific field information and select Read to confirm. Press OK to accept field setup and continue to add as many fields as desired. The SDI Fields will appear as blue bars.
5.6.2 CONDITIONAL MEASUREMENT TAB
When conditional measuring is enabled, the Measurement Command (M command) will only be sent if the condition is true at the time of measurement.
Select Home>Sensors>SDI>Setup>Conditional Measurement Tab. Select the Condition Type using the radio buttons.
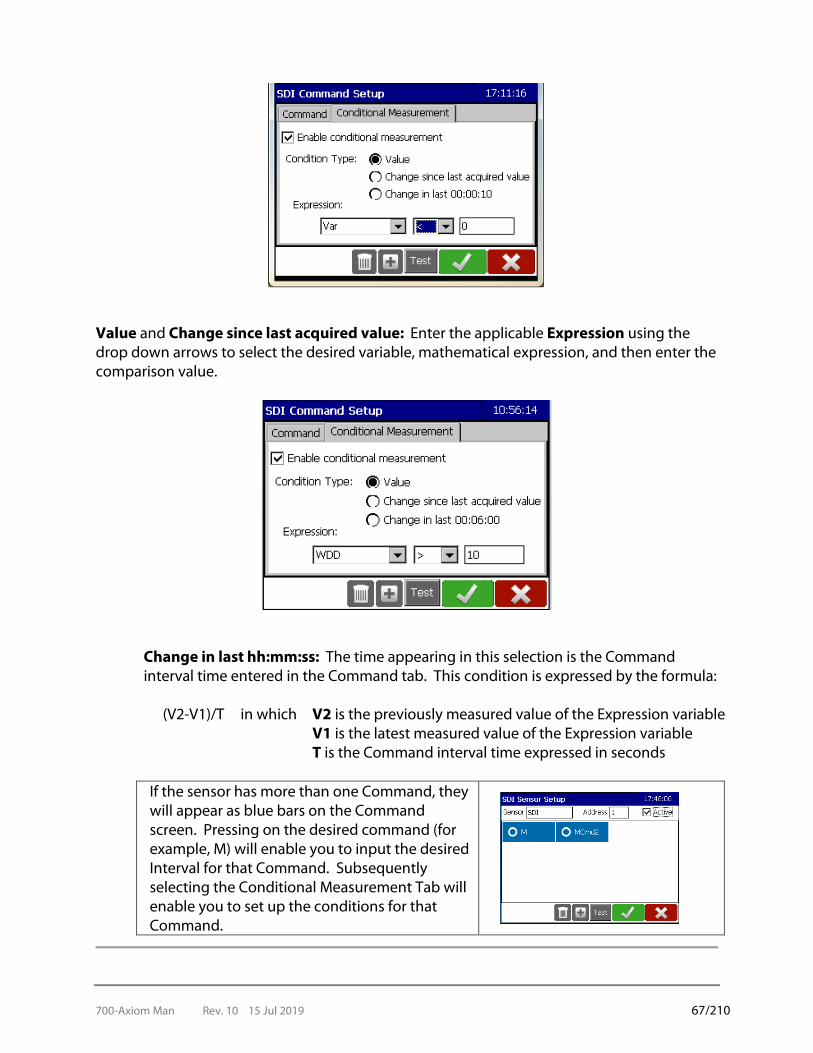
700-Axiom Man Rev. 10 15 Jul 2019 67/210
Value and Change since last acquired value: Enter the applicable Expression using the drop down arrows to select the desired variable, mathematical expression, and then enter the comparison value.
Change in last hh:mm:ss: The time appearing in this selection is the Command interval time entered in the Command tab. This condition is expressed by the formula:
(V2-V1)/T in which
V2 is the previously measured value of the Expression variable V1 is the latest measured value of the Expression variable T is the Command interval time expressed in seconds
If the sensor has more than one Command, they will appear as blue bars on the Command screen. Pressing on the desired command (for example, M) will enable you to input the desired Interval for that Command. Subsequently selecting the Conditional Measurement Tab will enable you to set up the conditions for that Command.

700-Axiom Man Rev. 10 15 Jul 2019 68/210
5.7 STAGE SENSOR EXTENSION
Figure 5-26 shows the Stage Sensor Set-up screen (Sensor tab), with default settings, that is provided by the Stage sensor extension. This extension predefines a stage variable of HG and an auxiliary water temperature variable of TW. The Stage extension is generic so knowledge of the specific attached stage sensor’s SDI commands may be required to appropriately configure it. Refer to the sensor’s operating manual for
sensor command and data details.
Figure 5-26: Stage Sensor Setup screen
5.7.1 SENSOR TAB
Sensor Name: The default name is Stage. This can be changed if desired.
Address: Input the sensor’s address.
Active: The Active box is checked by default. If this is not checked the sensor will not interact with the Datalogger.
Read: Pressing on this will return the fields that will be read by the sensor and the length of time it takes to make a measurement.
5.7.2 STAGE TAB
The Stage tab controls the stage (water depth) function of the sensor.
Initial screen With “Use SDI-PT Calc” checked (SDI-PT Tab present)
Figure 5-27: Stage Sensor Setup screens

700-Axiom Man Rev. 10 15 Jul 2019 69/210
Stage Name: Specifies the variable for the stage value returned by the sensor.
Raw Name: This is the distance from the sensor’s depth to the surface. The combination of the raw measurement plus the offset should equal the actual depth. The default name is HG_Raw which can be changed if desired.
Offset Name: This is the depth below the sensor’s position. The combination of the raw measurement plus the offset should equal the actual depth. The default name is HG_Raw which can be changed if desired
Precision: Specifies the precision (number of decimal places) in the stage value to be used in computations and displays.
Units (drop down): A drop down menu of the units in which the sensor returns the stage values. The choices are m (metres), mm (millimetres), ft (feet), or in (inches).
Units (textbox): Specifies the units label used in displays of the stage values. Must be the equivalent of the units in the drop down menu. For example: The drop down unit is ft and feet is input as the display unit. Note that no conversion will take place so selecting ft from the drop down menu and inputting m (metres) as the display unit, will result in 3 ft being displayed as 3 m.
SDI-PT Calc: Specifies whether or not to enable the SDI-PT calculation which converts stage value from PSI to the units specified. If this is checked the SDI-PT tab (named after the FTS sensor) will become available (Figure 5-28).
SDI-PT Tab: Use this tab to input the water density and gravity for use in the SDI-PT Calc.
NOTE: The Unit Multiplier is based on the selected units in the drop down menu.
Figure 5-28: SDI-PT Tab
Cmd: Specifies the sensor's stage SDI command. (You may need to consult the sensor manual to determine the correct command.)
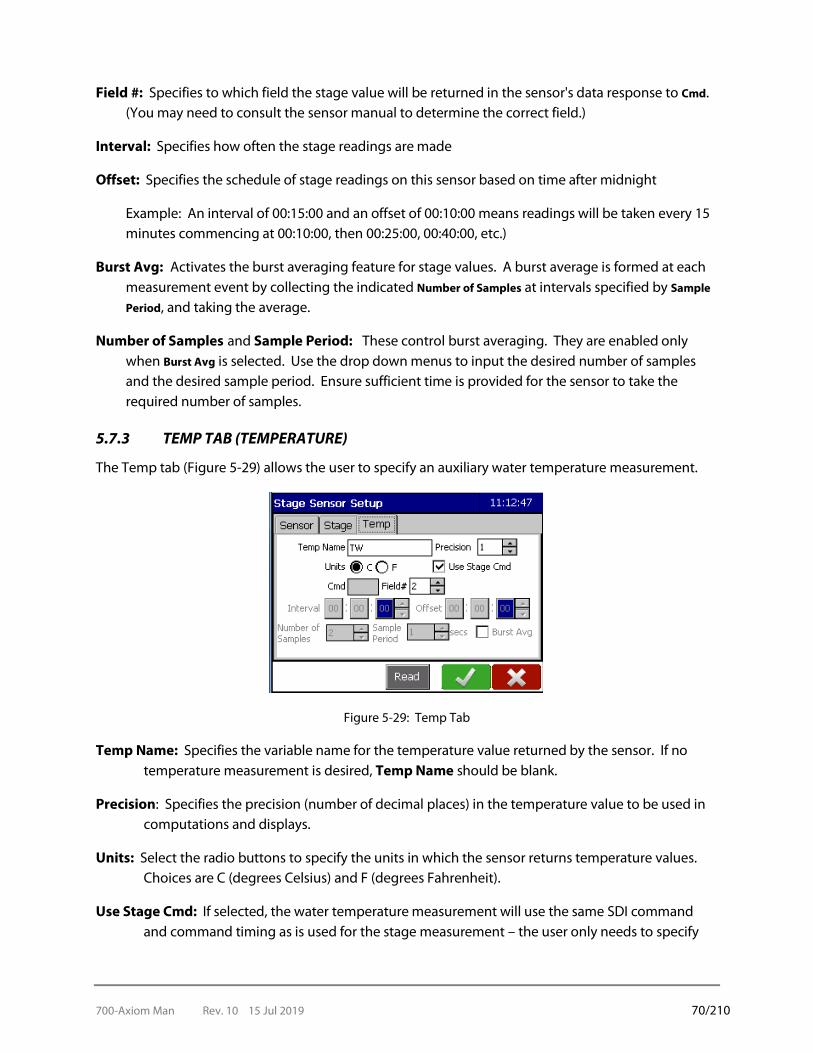
700-Axiom Man Rev. 10 15 Jul 2019 70/210
Field #: Specifies to which field the stage value will be returned in the sensor's data response to Cmd. (You may need to consult the sensor manual to determine the correct field.)
Interval: Specifies how often the stage readings are made
Offset: Specifies the schedule of stage readings on this sensor based on time after midnight
Example: An interval of 00:15:00 and an offset of 00:10:00 means readings will be taken every 15 minutes commencing at 00:10:00, then 00:25:00, 00:40:00, etc.)
Burst Avg: Activates the burst averaging feature for stage values. A burst average is formed at each measurement event by collecting the indicated Number of Samples at intervals specified by Sample
Period, and taking the average.
Number of Samples and Sample Period: These control burst averaging. They are enabled only when Burst Avg is selected. Use the drop down menus to input the desired number of samples and the desired sample period. Ensure sufficient time is provided for the sensor to take the required number of samples.
5.7.3 TEMP TAB (TEMPERATURE)
The Temp tab (Figure 5-29) allows the user to specify an auxiliary water temperature measurement.
Figure 5-29: Temp Tab
Temp Name: Specifies the variable name for the temperature value returned by the sensor. If no temperature measurement is desired, Temp Name should be blank.
Precision: Specifies the precision (number of decimal places) in the temperature value to be used in computations and displays.
Units: Select the radio buttons to specify the units in which the sensor returns temperature values. Choices are C (degrees Celsius) and F (degrees Fahrenheit).
Use Stage Cmd: If selected, the water temperature measurement will use the same SDI command and command timing as is used for the stage measurement – the user only needs to specify
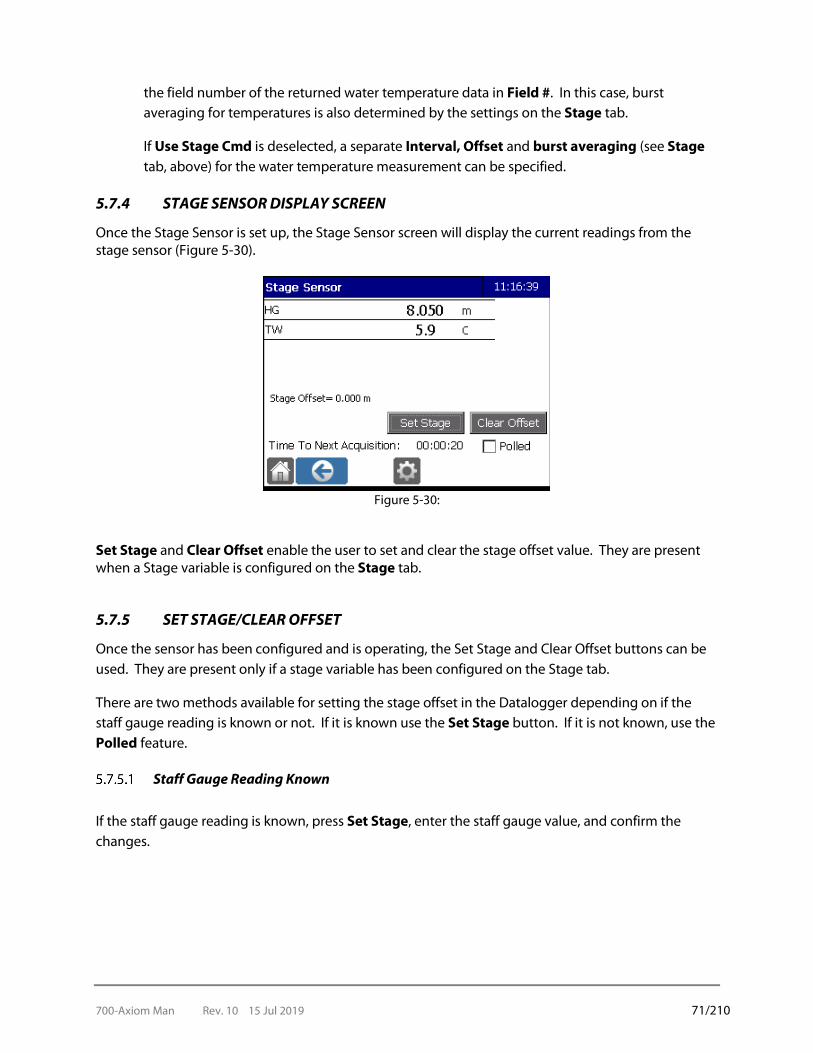
700-Axiom Man Rev. 10 15 Jul 2019 71/210
the field number of the returned water temperature data in Field #. In this case, burst averaging for temperatures is also determined by the settings on the Stage tab.
If Use Stage Cmd is deselected, a separate Interval, Offset and burst averaging (see Stage tab, above) for the water temperature measurement can be specified.
5.7.4 STAGE SENSOR DISPLAY SCREEN
Once the Stage Sensor is set up, the Stage Sensor screen will display the current readings from the stage sensor (Figure 5-30).
Figure 5-30:
Set Stage and Clear Offset enable the user to set and clear the stage offset value. They are present when a Stage variable is configured on the Stage tab.
5.7.5 SET STAGE/CLEAR OFFSET
Once the sensor has been configured and is operating, the Set Stage and Clear Offset buttons can be used. They are present only if a stage variable has been configured on the Stage tab.
There are two methods available for setting the stage offset in the Datalogger depending on if the staff gauge reading is known or not. If it is known use the Set Stage button. If it is not known, use the Polled feature.
Staff Gauge Reading Known
If the staff gauge reading is known, press Set Stage, enter the staff gauge value, and confirm the changes.

700-Axiom Man Rev. 10 15 Jul 2019 72/210
Figure 5-31: Set Stage
The Datalogger calculates the appropriate stage offset from the current stage sensor reading.
Polling Stage Sensors
The polling option is meant as a temporary measure to confirm stage sensor operations and any data collected during the polling will not be recorded by the Datalogger. It will also not affect the Stage Setup values. That is to say, once polling is stopped, interval values will revert to those originally input in the Stage Setup Screen.
The user can select the Polled checkbox and then press Set Stage to begin a series of stage sensor readings while the user checks the staff gauge reading. After checking the staff gauge reading and returning to the Datalogger, the user can select the appropriate time stamped stage sensor reading and then enter the staff gauge value so that the Datalogger can calculate the appropriate stage offset.
The stage reported in on the Display screen and in the Stage Offset Tool screen will use the units that the user has selected during the setup process (SDI-PT calc will be applied if selected).
The steps to set up polling follow.
1. Select Home>SDI-12. From the list of mapped sensors, select the sensor you wish to poll and
tap the Polled box, then select Set Stage.

700-Axiom Man Rev. 10 15 Jul 2019 73/210
2. The Stage Offset Tool screen is displayed. Enter the desired Interval and Timeout times, Interval
being the polling interval and Timeout being the period of time over which polling will take place. The Poll Sample Size refers to how many readings will be averaged per interval.
3. Synchronize your timepiece to the Datalogger and select Start. The screen is displayed in view
only mode and polling commences. Polling values will be displayed until the Stop button is selected.
4. Go read the staff gauge. Note the time and the Staff Gauge value. When you return to the Datalogger select STOP, scroll through the stage sensor readings and tap on the time that corresponds to your reading of the staff gauge. Press Select.

700-Axiom Man Rev. 10 15 Jul 2019 74/210
5. The Enter Staff Gauge Value screen appears. Enter the observed value and confirm. The new Stage Offset will be calculated.
6. De-select the Polled box.
7. Press Clear Offset to return the Stage Offset to zero.
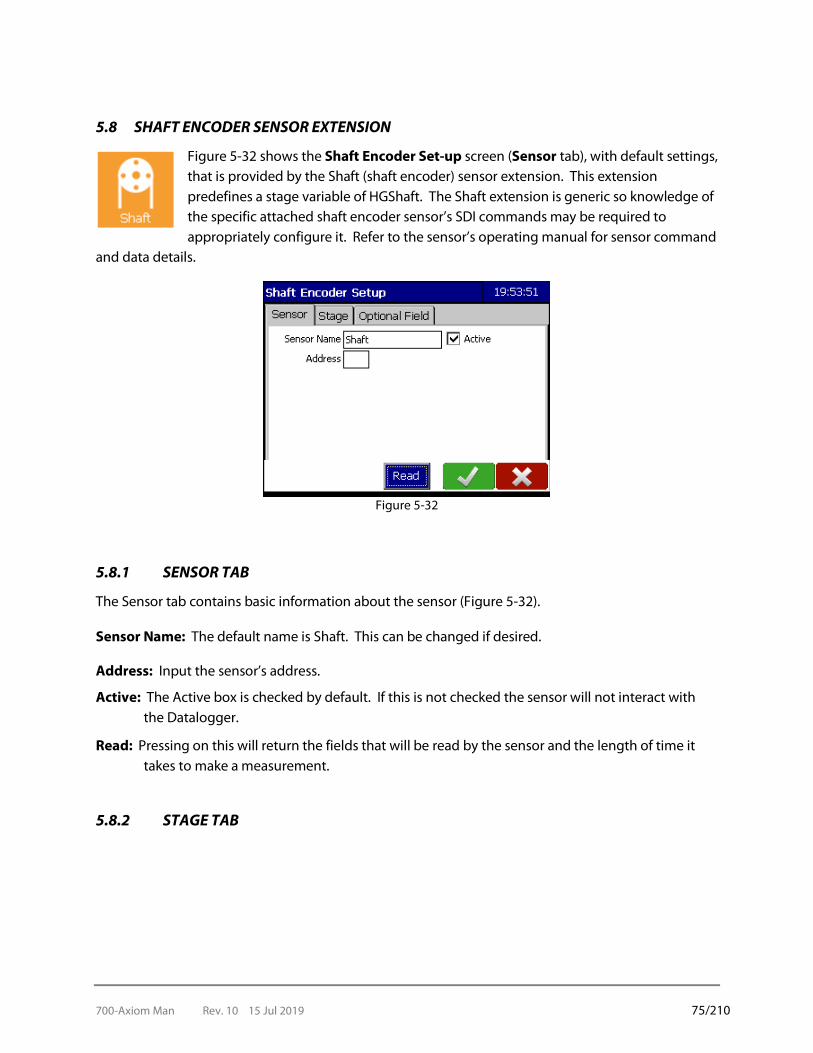
700-Axiom Man Rev. 10 15 Jul 2019 75/210
5.8 SHAFT ENCODER SENSOR EXTENSION
Figure 5-32 shows the Shaft Encoder Set-up screen (Sensor tab), with default settings, that is provided by the Shaft (shaft encoder) sensor extension. This extension predefines a stage variable of HGShaft. The Shaft extension is generic so knowledge of the specific attached shaft encoder sensor’s SDI commands may be required to appropriately configure it. Refer to the sensor’s operating manual for sensor command
and data details.
Figure 5-32
5.8.1 SENSOR TAB
The Sensor tab contains basic information about the sensor (Figure 5-32). Sensor Name: The default name is Shaft. This can be changed if desired.
Address: Input the sensor’s address.
Active: The Active box is checked by default. If this is not checked the sensor will not interact with the Datalogger.
Read: Pressing on this will return the fields that will be read by the sensor and the length of time it takes to make a measurement.
5.8.2 STAGE TAB

700-Axiom Man Rev. 10 15 Jul 2019 76/210
Figure 5-33
Stage Name: Specifies the variable for the stage value returned by the sensor. The default name is
HGShaft. This can be changed if desired.
Raw Name: This is the distance from the sensor’s depth to the surface. The combination of the raw measurement plus the offset should equal the actual depth. The default name is HGS_Raw which can be changed if desired.
Offset Name: This is the depth below the sensor’s position. The combination of the raw measurement plus the offset should equal the actual depth. The default name is HGS_Raw which can be changed if desired
Units (drop down): A drop down menu of the units in which the sensor returns the stage values. The choices are m (metres), mm (millimetres), ft (feet), or in (inches).
Units (textbox): Specifies the units label used in displays of the stage values. Must be the equivalent of the units in the drop down menu. For example: The drop down unit is ft and feet is input as the display unit. Note that no conversion will take place so selecting ft from the drop down menu and inputting m (metres) as the display unit, will result in 3 ft being displayed as 3 m.
Cmd: Specifies the sensor's stage SDI command. Input the Command used by the sensor (M,C, or R) available from the sensor’s manual
Precision: Specifies the precision (number of decimal places) in the stage value to be used in computations and displays.
Field #: Specifies to which field the stage value will be returned in the sensor's data response to Cmd. (You may need to consult the sensor manual to determine the correct field.)
Interval: Specifies how often the stage readings are made
Offset: Specifies the schedule of stage readings on this sensor based on time after midnight

700-Axiom Man Rev. 10 15 Jul 2019 77/210
Example: An interval of 00:15:00 and an offset of 00:10:00 means readings will be taken every 15 minutes commencing at 00:10:00, then 00:25:00, 00:40:00, etc.)
Burst Avg: Activates the burst averaging feature for stage values. A burst average is formed at each measurement event by collecting the indicated Number of Samples at intervals specified by Sample Period, and taking the average.
Number of Samples and Sample Period: These control burst averaging. They are enabled only when Burst Avg is selected. Use the drop down menus to input the desired number of samples and the desired sample period. Ensure sufficient time is provided for the sensor to take the required number of samples.
5.8.3 OPTIONAL FIELD TAB
The Optional Field tab enables the user to define a Datalogger variable for any field returned by the shaft encoder (Figure 5-34). A typical use is to collect the error code from measurement responses.
Figure 5-34
Field Name: Input the desired variable name.
Precision: Specifies the precision (number of decimal places) in the field value to be used in computations and displays. Use the drop down menu to set the precision.
Units: Specify the units in which the sensor returns the field value.
Field #: Specify the field number from which to extract the data returned by the sensor.
5.8.4 SHAFT SENSOR DISPLAY SCREEN
Once the Shaft Sensor is set up, the Shaft Sensor screen will display the current readings from the stage sensor (Figure 5-35).

700-Axiom Man Rev. 10 15 Jul 2019 78/210
Figure 5-35
Set Stage and Clear Offset enable the user to set and clear the stage offset value. They are present when a Stage variable is configured on the Stage tab. There are two methods available for setting the stage offset in the Datalogger depending on if the staff gauge reading is known or not. If it is known use the Set Stage button. If it is not known, use the Polled feature.
5.8.5 SET STAGE/CLEAR OFFSET
Once the sensor has been configured and is operating, the Set Stage and Clear Offset buttons can be used. They are present only if a stage variable has been configured on the Stage tab.
There are two methods available for setting the stage offset in the Datalogger depending on if the staff gauge reading is known or not. If it is known use the Set Stage button. If it is not known, use the Polled feature.
Staff Gauge Reading Known
If the staff gauge reading is known, press Set Stage, enter the staff gauge value, and confirm the changes.
Figure 5-36: Shaft Sensor Display Screen
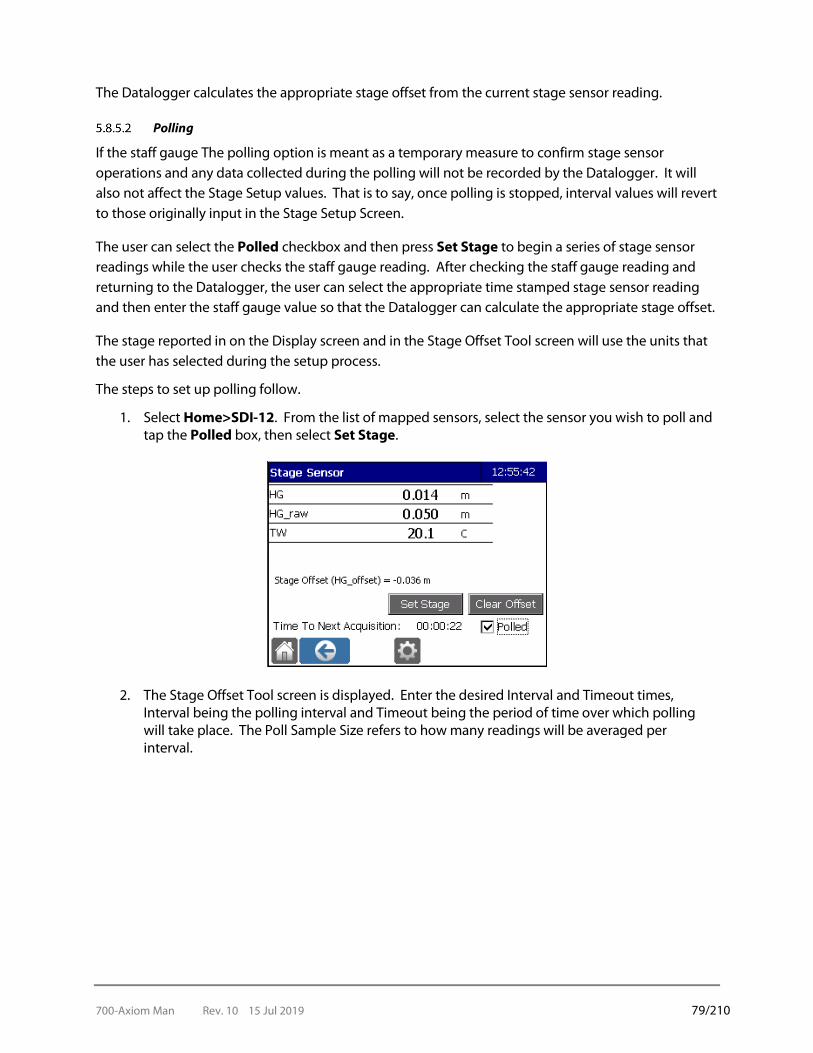
700-Axiom Man Rev. 10 15 Jul 2019 79/210
The Datalogger calculates the appropriate stage offset from the current stage sensor reading.
Polling
If the staff gauge The polling option is meant as a temporary measure to confirm stage sensor operations and any data collected during the polling will not be recorded by the Datalogger. It will also not affect the Stage Setup values. That is to say, once polling is stopped, interval values will revert to those originally input in the Stage Setup Screen.
The user can select the Polled checkbox and then press Set Stage to begin a series of stage sensor readings while the user checks the staff gauge reading. After checking the staff gauge reading and returning to the Datalogger, the user can select the appropriate time stamped stage sensor reading and then enter the staff gauge value so that the Datalogger can calculate the appropriate stage offset.
The stage reported in on the Display screen and in the Stage Offset Tool screen will use the units that the user has selected during the setup process.
The steps to set up polling follow.
1. Select Home>SDI-12. From the list of mapped sensors, select the sensor you wish to poll and tap the Polled box, then select Set Stage.
2. The Stage Offset Tool screen is displayed. Enter the desired Interval and Timeout times, Interval being the polling interval and Timeout being the period of time over which polling will take place. The Poll Sample Size refers to how many readings will be averaged per interval.
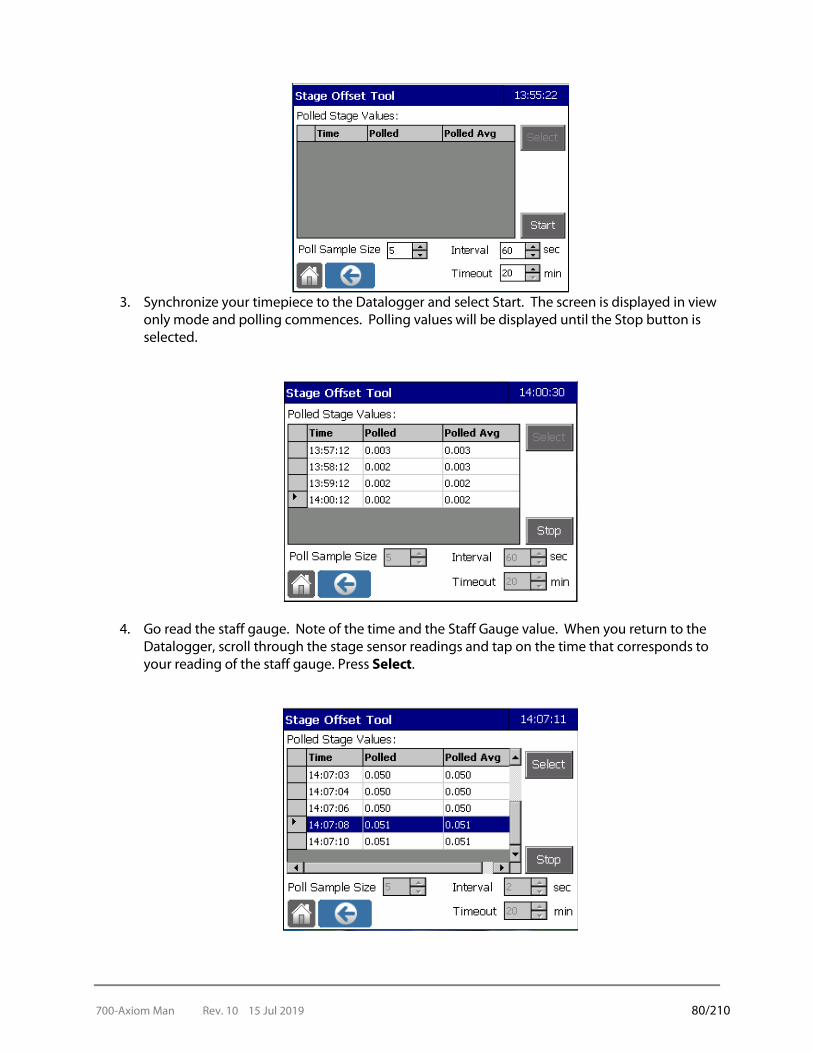
700-Axiom Man Rev. 10 15 Jul 2019 80/210
3. Synchronize your timepiece to the Datalogger and select Start. The screen is displayed in view
only mode and polling commences. Polling values will be displayed until the Stop button is selected.
4. Go read the staff gauge. Note of the time and the Staff Gauge value. When you return to the Datalogger, scroll through the stage sensor readings and tap on the time that corresponds to your reading of the staff gauge. Press Select.
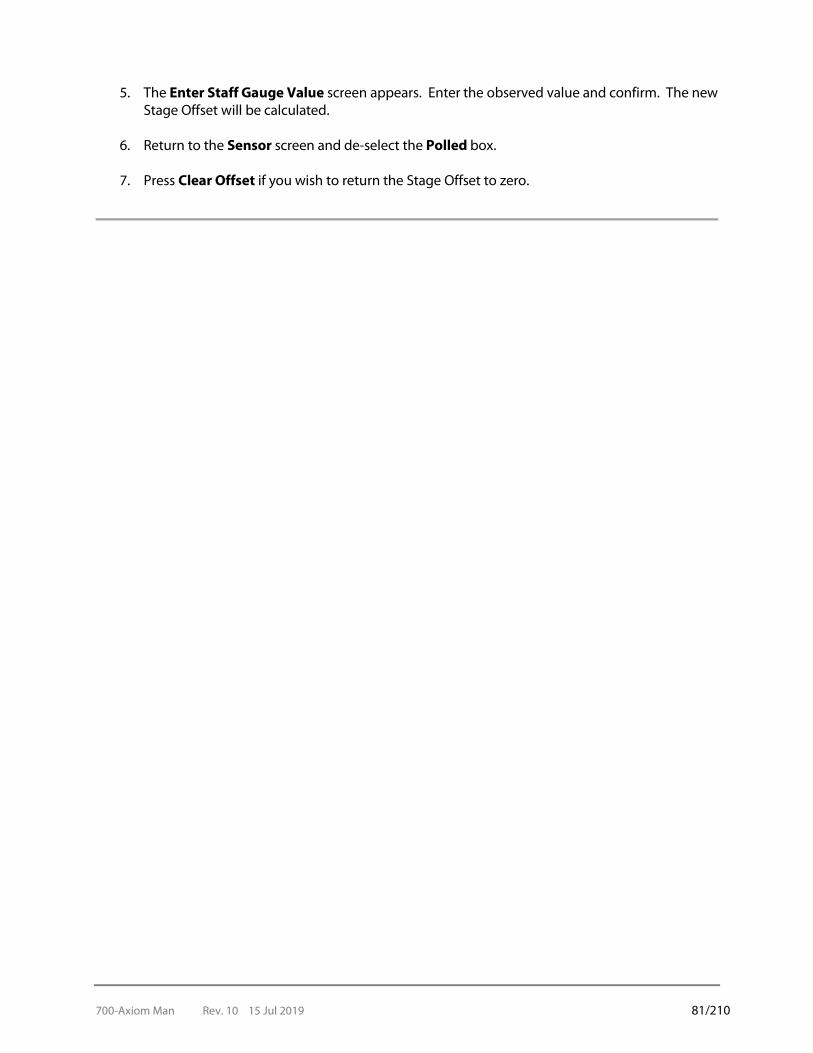
700-Axiom Man Rev. 10 15 Jul 2019 81/210
5. The Enter Staff Gauge Value screen appears. Enter the observed value and confirm. The new Stage Offset will be calculated.
6. Return to the Sensor screen and de-select the Polled box.
7. Press Clear Offset if you wish to return the Stage Offset to zero.
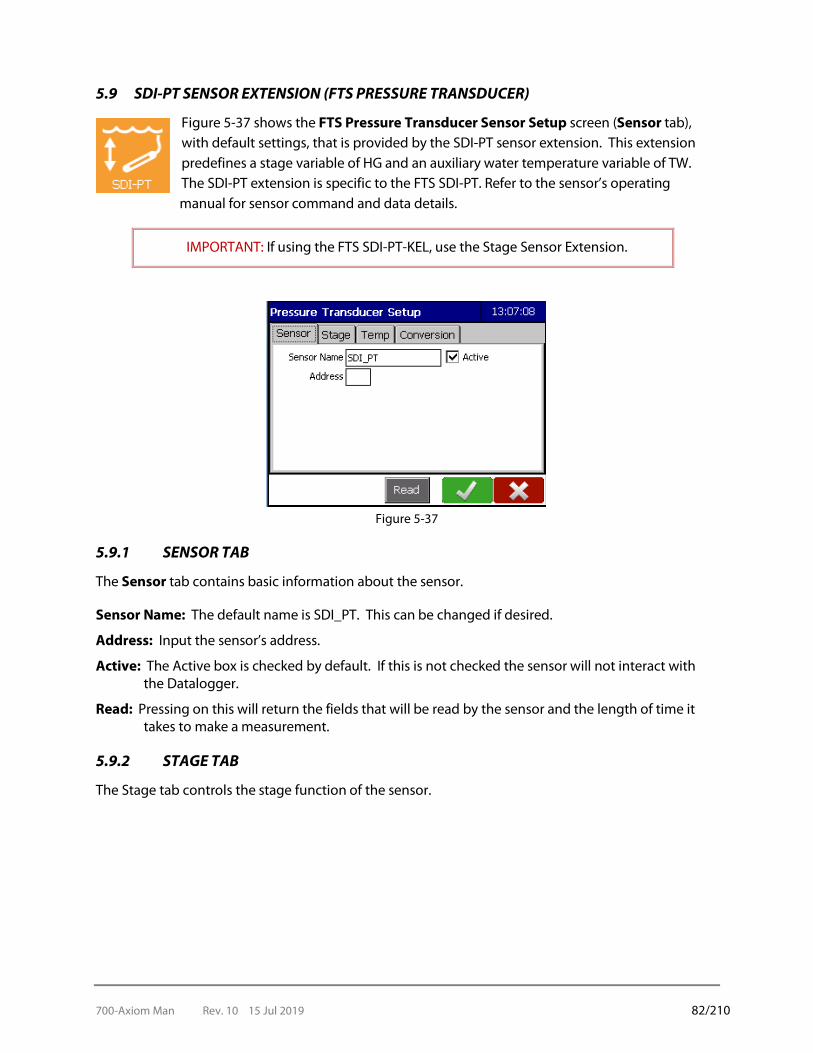
700-Axiom Man Rev. 10 15 Jul 2019 82/210
5.9 SDI-PT SENSOR EXTENSION (FTS PRESSURE TRANSDUCER)
Figure 5-37 shows the FTS Pressure Transducer Sensor Setup screen (Sensor tab), with default settings, that is provided by the SDI-PT sensor extension. This extension predefines a stage variable of HG and an auxiliary water temperature variable of TW. The SDI-PT extension is specific to the FTS SDI-PT. Refer to the sensor’s operating manual for sensor command and data details.
IMPORTANT: If using the FTS SDI-PT-KEL, use the Stage Sensor Extension.
Figure 5-37
5.9.1 SENSOR TAB
The Sensor tab contains basic information about the sensor.
Sensor Name: The default name is SDI_PT. This can be changed if desired.
Address: Input the sensor’s address.
Active: The Active box is checked by default. If this is not checked the sensor will not interact with the Datalogger.
Read: Pressing on this will return the fields that will be read by the sensor and the length of time it takes to make a measurement.
5.9.2 STAGE TAB
The Stage tab controls the stage function of the sensor.
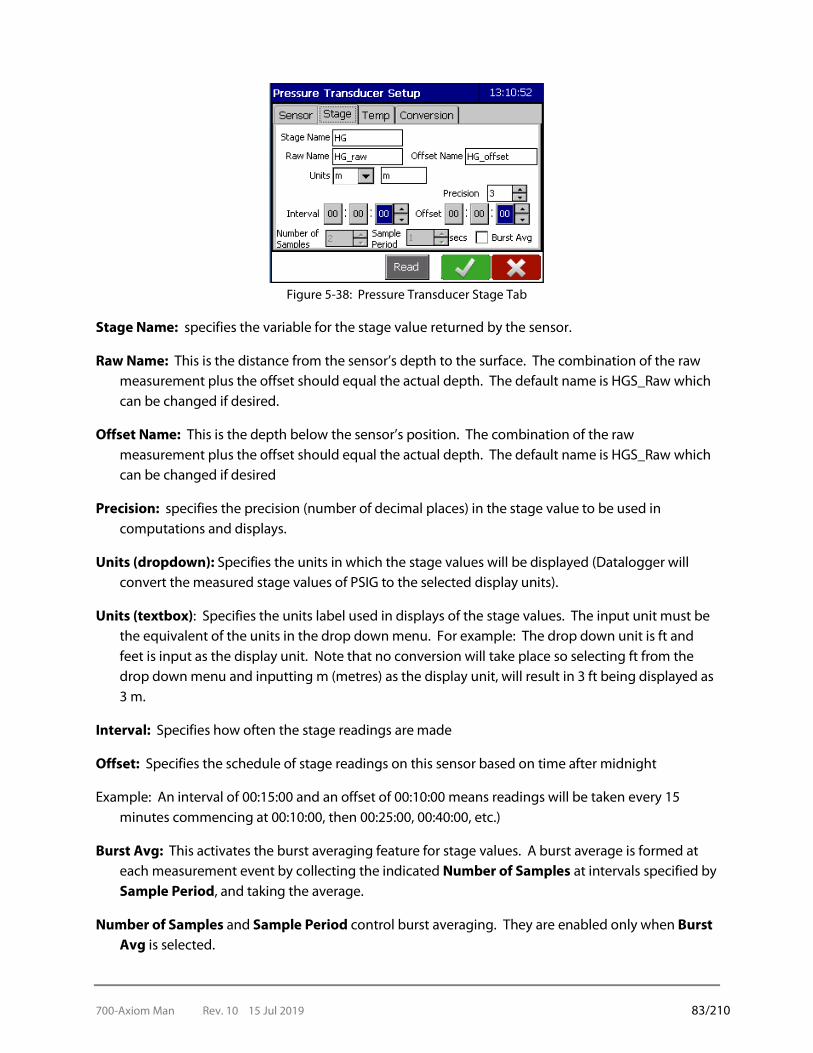
700-Axiom Man Rev. 10 15 Jul 2019 83/210
Figure 5-38: Pressure Transducer Stage Tab
Stage Name: specifies the variable for the stage value returned by the sensor.
Raw Name: This is the distance from the sensor’s depth to the surface. The combination of the raw measurement plus the offset should equal the actual depth. The default name is HGS_Raw which can be changed if desired.
Offset Name: This is the depth below the sensor’s position. The combination of the raw measurement plus the offset should equal the actual depth. The default name is HGS_Raw which can be changed if desired
Precision: specifies the precision (number of decimal places) in the stage value to be used in computations and displays.
Units (dropdown): Specifies the units in which the stage values will be displayed (Datalogger will convert the measured stage values of PSIG to the selected display units).
Units (textbox): Specifies the units label used in displays of the stage values. The input unit must be the equivalent of the units in the drop down menu. For example: The drop down unit is ft and feet is input as the display unit. Note that no conversion will take place so selecting ft from the drop down menu and inputting m (metres) as the display unit, will result in 3 ft being displayed as 3 m.
Interval: Specifies how often the stage readings are made
Offset: Specifies the schedule of stage readings on this sensor based on time after midnight
Example: An interval of 00:15:00 and an offset of 00:10:00 means readings will be taken every 15 minutes commencing at 00:10:00, then 00:25:00, 00:40:00, etc.)
Burst Avg: This activates the burst averaging feature for stage values. A burst average is formed at each measurement event by collecting the indicated Number of Samples at intervals specified by Sample Period, and taking the average.
Number of Samples and Sample Period control burst averaging. They are enabled only when Burst Avg is selected.

700-Axiom Man Rev. 10 15 Jul 2019 84/210
5.9.3 TEMP TAB
The Temp tab allows the user to specify an auxiliary water temperature measurement.
Temp Name specifies the variable name for the temperature value returned by the sensor. If no temperature measurement is desired, Temp Name should be blank.
Precision specifies the precision (number of decimal places) in the temperature value to be used in computations and displays.
Units (radio buttons) specifies the units in which the sensor returns temperature values.
Figure 5-39 Pressure Transducer – Temp Tab
5.9.4 CONVERSION TAB
The Pressure Transducer Set-up screen – Conversion tab sets up the equation used to convert measured water pressure to estimated water depth. This is the value given to the Raw Name measurement variable defined on the Stage tab.
Figure 5-40: Pressure Transducer – Conversion Tab
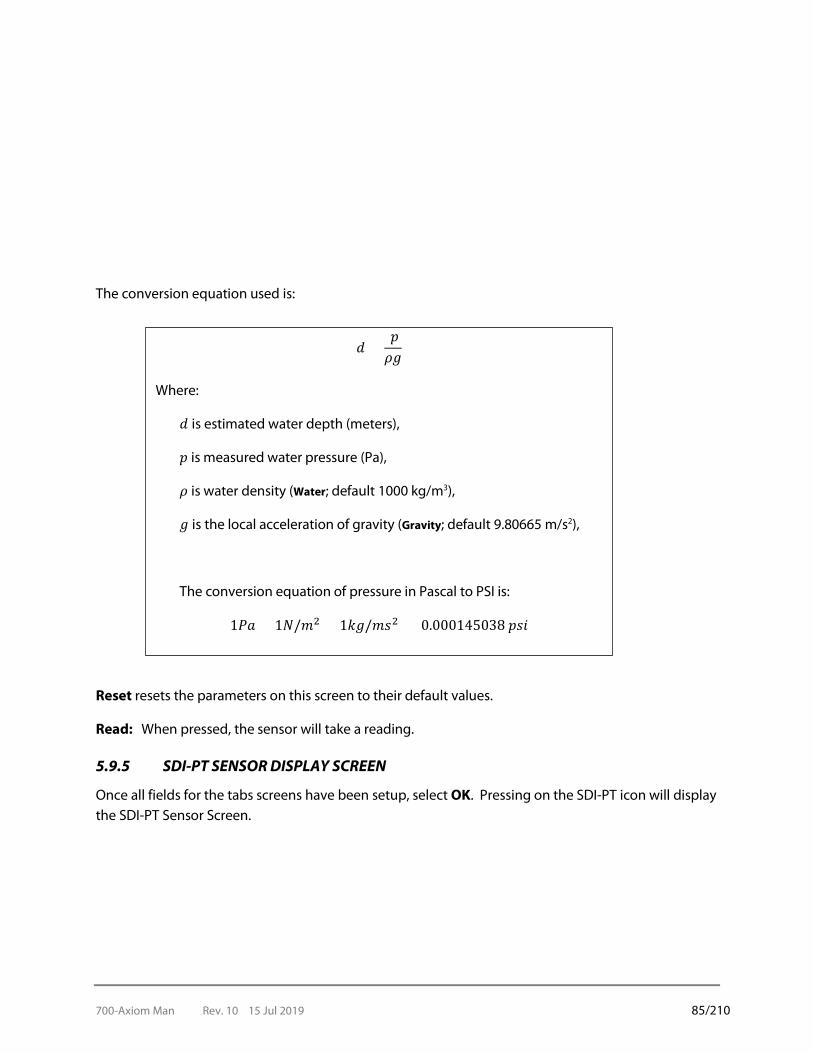
700-Axiom Man Rev. 10 15 Jul 2019 85/210
The conversion equation used is:
Reset resets the parameters on this screen to their default values.
Read: When pressed, the sensor will take a reading.
5.9.5 SDI-PT SENSOR DISPLAY SCREEN
Once all fields for the tabs screens have been setup, select OK. Pressing on the SDI-PT icon will display the SDI-PT Sensor Screen.
𝑝𝑝 = 𝑝𝑝𝜌𝜌𝜌𝜌
Where:
𝑝𝑝 is estimated water depth (meters),
𝑝𝑝 is measured water pressure (Pa),
𝜌𝜌 is water density (Water; default 1000 kg/m3),
𝜌𝜌 is the local acceleration of gravity (Gravity; default 9.80665 m/s2),
The conversion equation of pressure in Pascal to PSI is:
1𝑃𝑃𝑝𝑝 = 1𝑁𝑁/𝐻𝐻2 = 1𝑘𝑘𝜌𝜌/𝐻𝐻𝑂𝑂2 = 0.000145038 𝑝𝑝𝑂𝑂𝑀𝑀
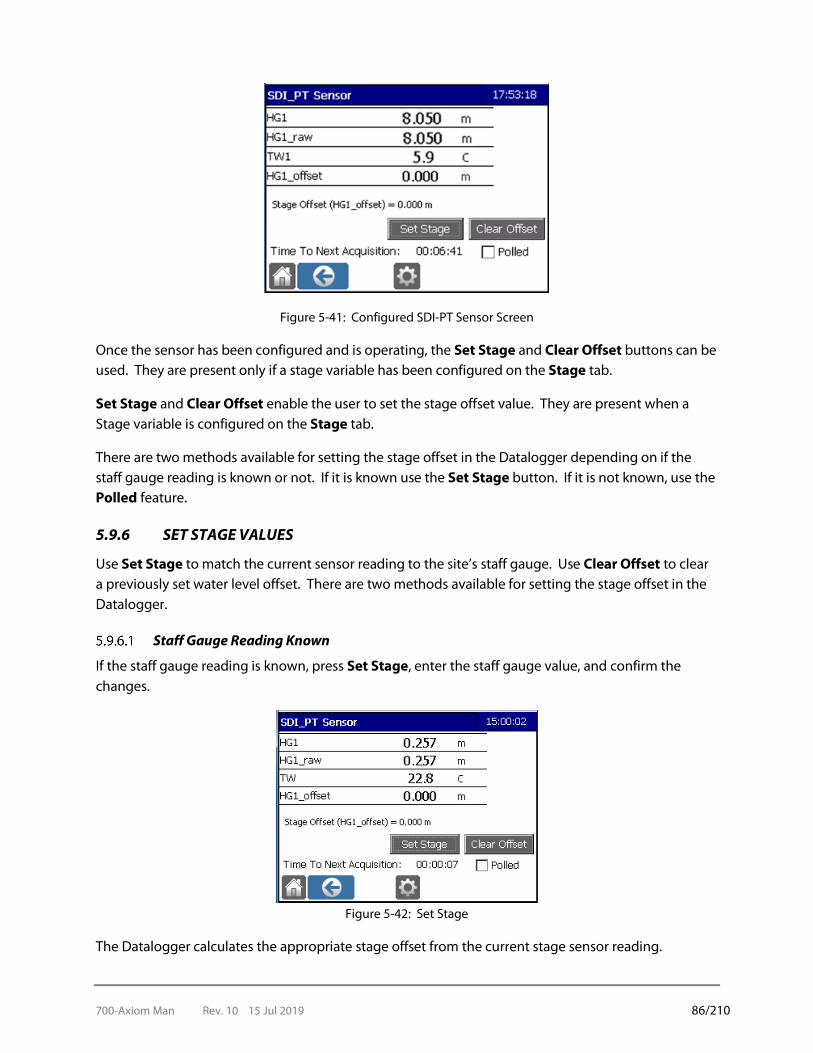
700-Axiom Man Rev. 10 15 Jul 2019 86/210
Figure 5-41: Configured SDI-PT Sensor Screen
Once the sensor has been configured and is operating, the Set Stage and Clear Offset buttons can be used. They are present only if a stage variable has been configured on the Stage tab.
Set Stage and Clear Offset enable the user to set the stage offset value. They are present when a Stage variable is configured on the Stage tab.
There are two methods available for setting the stage offset in the Datalogger depending on if the staff gauge reading is known or not. If it is known use the Set Stage button. If it is not known, use the Polled feature.
5.9.6 SET STAGE VALUES
Use Set Stage to match the current sensor reading to the site’s staff gauge. Use Clear Offset to clear a previously set water level offset. There are two methods available for setting the stage offset in the Datalogger.
Staff Gauge Reading Known
If the staff gauge reading is known, press Set Stage, enter the staff gauge value, and confirm the changes.
Figure 5-42: Set Stage
The Datalogger calculates the appropriate stage offset from the current stage sensor reading.
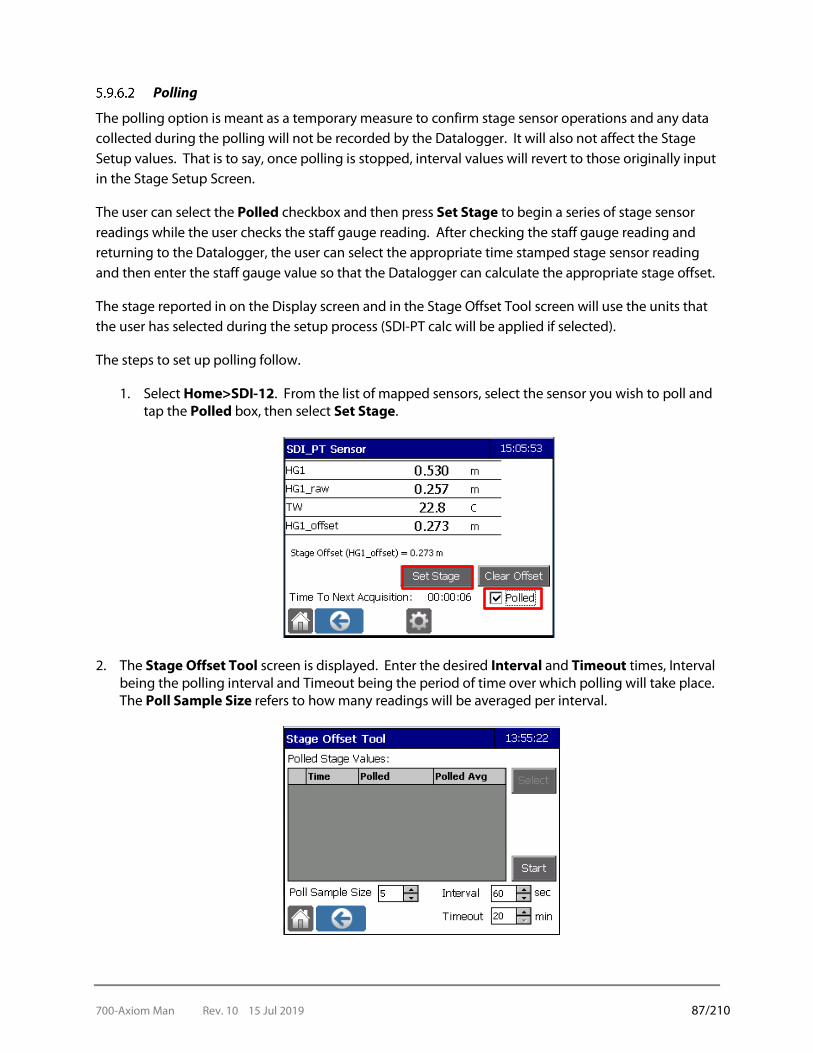
700-Axiom Man Rev. 10 15 Jul 2019 87/210
Polling
The polling option is meant as a temporary measure to confirm stage sensor operations and any data collected during the polling will not be recorded by the Datalogger. It will also not affect the Stage Setup values. That is to say, once polling is stopped, interval values will revert to those originally input in the Stage Setup Screen.
The user can select the Polled checkbox and then press Set Stage to begin a series of stage sensor readings while the user checks the staff gauge reading. After checking the staff gauge reading and returning to the Datalogger, the user can select the appropriate time stamped stage sensor reading and then enter the staff gauge value so that the Datalogger can calculate the appropriate stage offset.
The stage reported in on the Display screen and in the Stage Offset Tool screen will use the units that the user has selected during the setup process (SDI-PT calc will be applied if selected).
The steps to set up polling follow.
1. Select Home>SDI-12. From the list of mapped sensors, select the sensor you wish to poll and tap the Polled box, then select Set Stage.
2. The Stage Offset Tool screen is displayed. Enter the desired Interval and Timeout times, Interval being the polling interval and Timeout being the period of time over which polling will take place. The Poll Sample Size refers to how many readings will be averaged per interval.
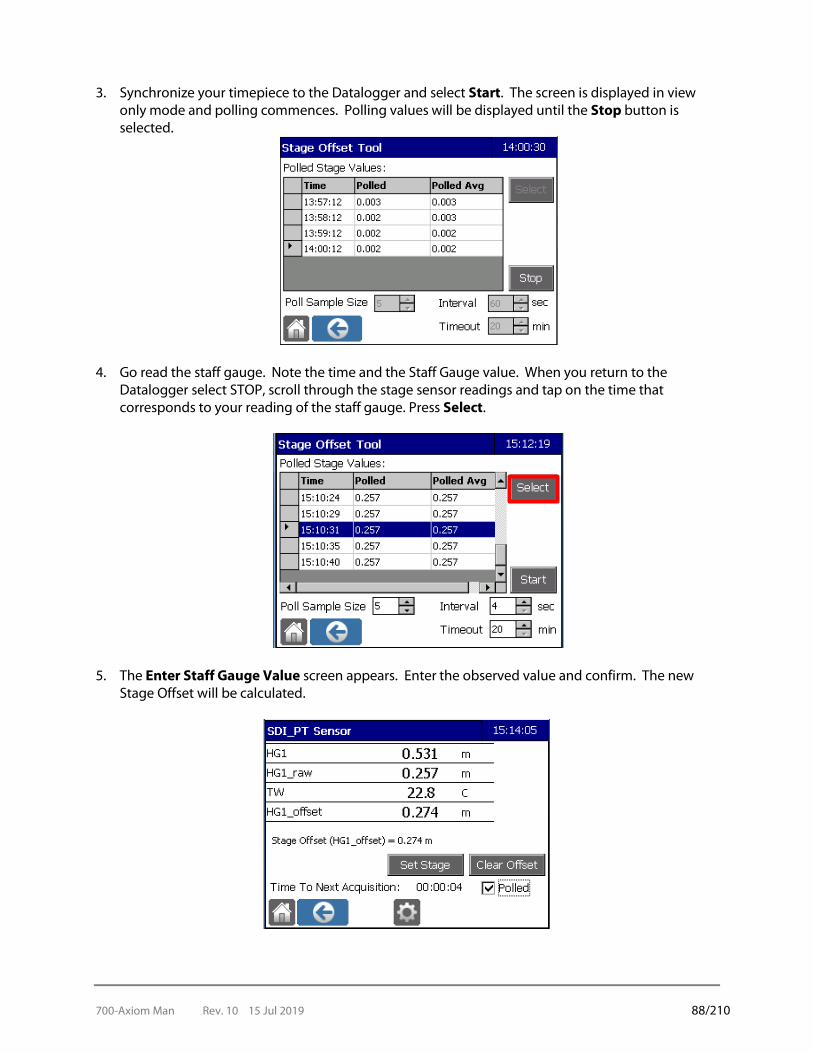
700-Axiom Man Rev. 10 15 Jul 2019 88/210
3. Synchronize your timepiece to the Datalogger and select Start. The screen is displayed in view only mode and polling commences. Polling values will be displayed until the Stop button is selected.
4. Go read the staff gauge. Note the time and the Staff Gauge value. When you return to the Datalogger select STOP, scroll through the stage sensor readings and tap on the time that corresponds to your reading of the staff gauge. Press Select.
5. The Enter Staff Gauge Value screen appears. Enter the observed value and confirm. The new Stage Offset will be calculated.
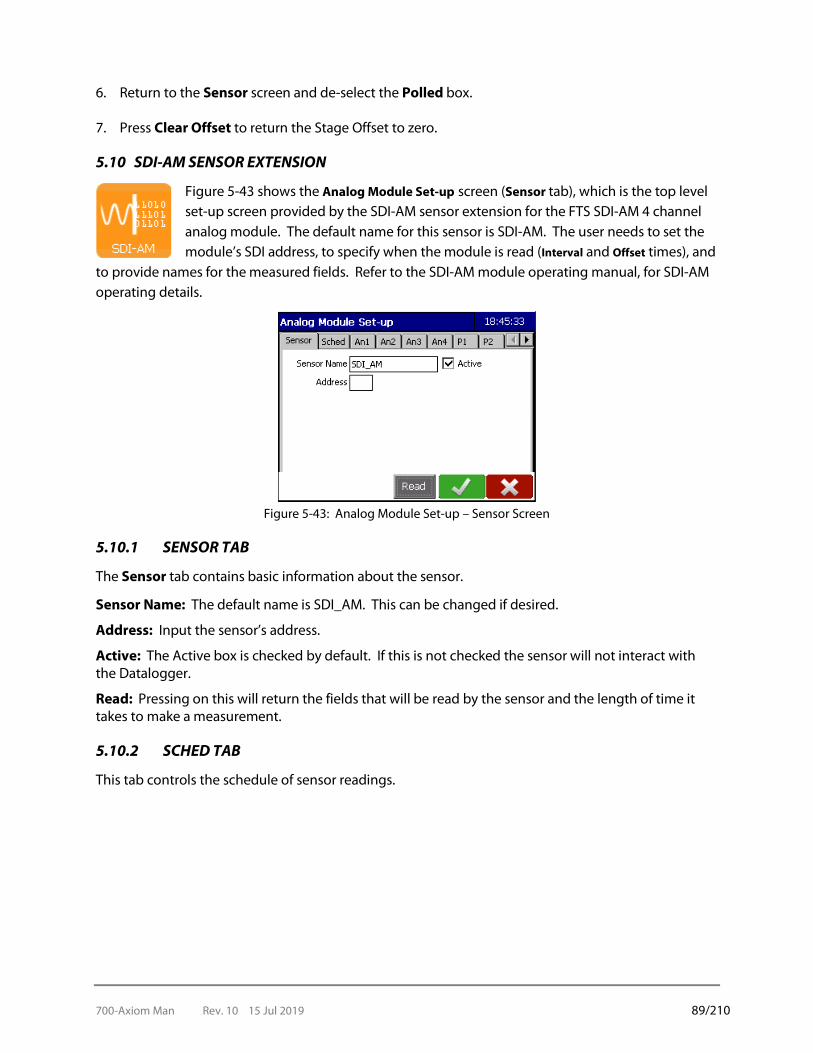
700-Axiom Man Rev. 10 15 Jul 2019 89/210
6. Return to the Sensor screen and de-select the Polled box.
7. Press Clear Offset to return the Stage Offset to zero.
5.10 SDI-AM SENSOR EXTENSION
Figure 5-43 shows the Analog Module Set-up screen (Sensor tab), which is the top level set-up screen provided by the SDI-AM sensor extension for the FTS SDI-AM 4 channel analog module. The default name for this sensor is SDI-AM. The user needs to set the module’s SDI address, to specify when the module is read (Interval and Offset times), and
to provide names for the measured fields. Refer to the SDI-AM module operating manual, for SDI-AM operating details.
Figure 5-43: Analog Module Set-up – Sensor Screen
5.10.1 SENSOR TAB
The Sensor tab contains basic information about the sensor.
Sensor Name: The default name is SDI_AM. This can be changed if desired.
Address: Input the sensor’s address.
Active: The Active box is checked by default. If this is not checked the sensor will not interact with the Datalogger.
Read: Pressing on this will return the fields that will be read by the sensor and the length of time it takes to make a measurement.
5.10.2 SCHED TAB
This tab controls the schedule of sensor readings.

700-Axiom Man Rev. 10 15 Jul 2019 90/210
Figure 5-44: Analog Module Set-up – Sched Tab
Interval: Specifies how often the stage readings are made
Offset: Specifies the schedule of stage readings on this sensor based on time after midnight
Example: An interval of 00:15:00 and an offset of 00:10:00 means readings will be taken every 15 minutes commencing at 00:10:00, then 00:25:00, 00:40:00, etc.)
Burst Avg: This activates the burst averaging feature. A burst average is formed at each measurement event by collecting the indicated Number of Samples at intervals specified by Sample Period, and taking the average.
Number of Samples and Sample Period control burst averaging. They are enabled only when Burst Avg is selected.
5.10.3 ANALOG INPUT SETTINGS
On the Analog Module Set-up screen, four tabs – An1, An2, An3, and An4 – are used to configure the module’s four analog input channels. The name, operating mode, and input voltage range are independently set for each of the four channels. Analog channel values are reported in millivolts (mV) or milliamps (mA) depending on the channel’s Mode setting. The text entered in the Analog Channel Name textbox is used as a variable in the Datalogger.
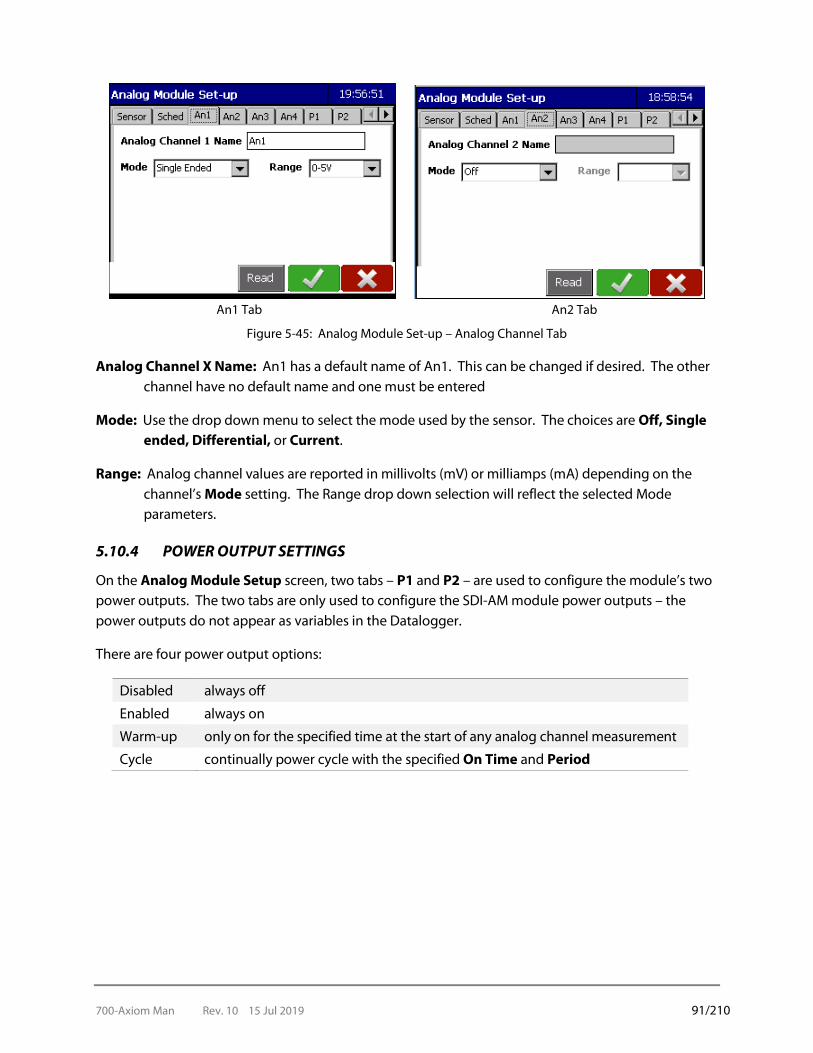
700-Axiom Man Rev. 10 15 Jul 2019 91/210
An1 Tab An2 Tab
Figure 5-45: Analog Module Set-up – Analog Channel Tab
Analog Channel X Name: An1 has a default name of An1. This can be changed if desired. The other channel have no default name and one must be entered
Mode: Use the drop down menu to select the mode used by the sensor. The choices are Off, Single ended, Differential, or Current.
Range: Analog channel values are reported in millivolts (mV) or milliamps (mA) depending on the channel’s Mode setting. The Range drop down selection will reflect the selected Mode parameters.
5.10.4 POWER OUTPUT SETTINGS
On the Analog Module Setup screen, two tabs – P1 and P2 – are used to configure the module’s two power outputs. The two tabs are only used to configure the SDI-AM module power outputs – the power outputs do not appear as variables in the Datalogger.
There are four power output options:
Disabled always off
Enabled always on
Warm-up only on for the specified time at the start of any analog channel measurement
Cycle continually power cycle with the specified On Time and Period

700-Axiom Man Rev. 10 15 Jul 2019 92/210
Figure 5-46: Analog Module Set-up – Power Output Tabs
Warm-up Mode: Input the desired warm up time. This allows the instrument time to warm up before taking a measurement. Ensure sufficient time is given for a full warm-up.
Cycle Mode: Will continually power cycle in accordance with the On Time and Period.
On Time: This is the length of time for which the instrument will be turned. Period: This is how often the power will cycle.
For Example: An On Time of 2 minutes and a Period of 2 hours means the instrument will turn on for 2 minutes every two hours.
5.10.5 EXCITATION OUTPUT SETTINGS
On the Analog Module Setup screen, two tabs – Ex1 and Ex2 – are used to configure the module’s two excitation outputs. The two tabs are only used to control the SDI-AM module excitation outputs – the excitation outputs do not appear as variables in the Datalogger.
The voltage of each excitation output is independently set from the following options:
Disabled always turned-off,
Enabled always turned-on,
Warm-up turned-on the specified time (in seconds) at the start of any analog channel measurement and then turned-off after the measurement is complete

700-Axiom Man Rev. 10 15 Jul 2019 93/210
Figure 5-47: Excitation Output Tab – Warm-up option
Warm-up: When the Warm-up option is selected you must input the warm-up time. SetPoint: Specifies the excitation output voltage (range of 0.000 to 5.000 Volts).
5.10.6 COUNTER SETTINGS
The Count tab is used to configure the module’s counter input.
Figure 5-48: Count Tab
Running Count: Enter a unique name in the text box to enable the running counter as a variable in the Datalogger. Period Count: Enter a unique name in the text box to enable the periodic counter as a variable in the Datalogger. Periodic Reset Enabled Checkbox: When selected, the Periodic Counter will periodically be set back to zero at the specified Reset Interval and Reset Offset times. Reset Interval: The frequency of the Periodic Reset. Input the desired value.

700-Axiom Man Rev. 10 15 Jul 2019 94/210
Reset Offset: Specifies the schedule of the reset interval based on time after midnight
Example: A Reset Interval of 01:00:00 and an offset of 00:10:00 means the Periodic Counter will reset hourly at 10 minutes after the hour (at 00:10:00, then 01:00:00, 02:10:00, etc.)
Switch Name: Enter a unique name in the text box to enable a Counter Input State variable in the data logger.
State: The default units for the “Switch Name” variable are “On” for a high level of ‘1’ (3 V) and “Off”
for a low level of ‘0’ (0 V).
Set Global: This button is used to set the Running Counter to an absolute value.
5.10.7 DISPLAY SCREEN
Once all tabs have been configured, select OK. Pressing on the SDI-AM icon will display its current readings. Note that only configured analog input and count variables are displayed. Power and Excitation configurations are not displayed as they are not Datalogger variables.
Figure 5-49: Configured SDI-AM Sensor Screen
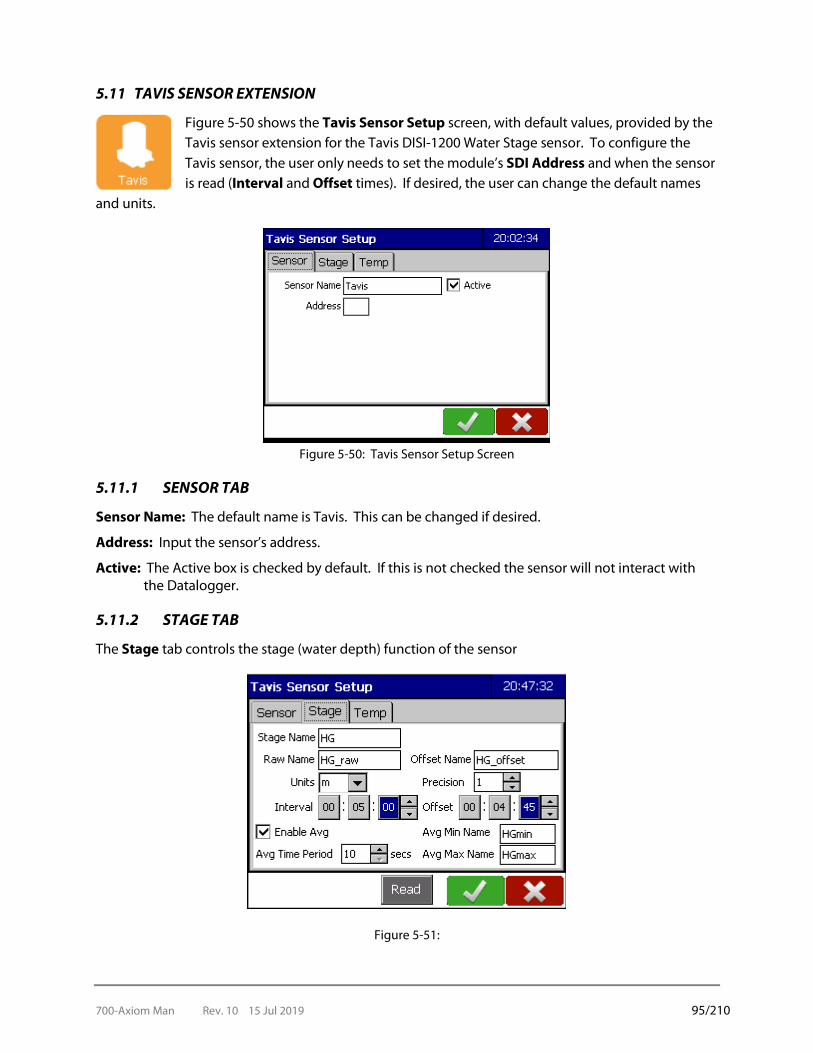
700-Axiom Man Rev. 10 15 Jul 2019 95/210
5.11 TAVIS SENSOR EXTENSION
Figure 5-50 shows the Tavis Sensor Setup screen, with default values, provided by the Tavis sensor extension for the Tavis DISI-1200 Water Stage sensor. To configure the Tavis sensor, the user only needs to set the module’s SDI Address and when the sensor is read (Interval and Offset times). If desired, the user can change the default names
and units.
Figure 5-50: Tavis Sensor Setup Screen
5.11.1 SENSOR TAB
Sensor Name: The default name is Tavis. This can be changed if desired.
Address: Input the sensor’s address.
Active: The Active box is checked by default. If this is not checked the sensor will not interact with the Datalogger.
5.11.2 STAGE TAB
The Stage tab controls the stage (water depth) function of the sensor
Figure 5-51:
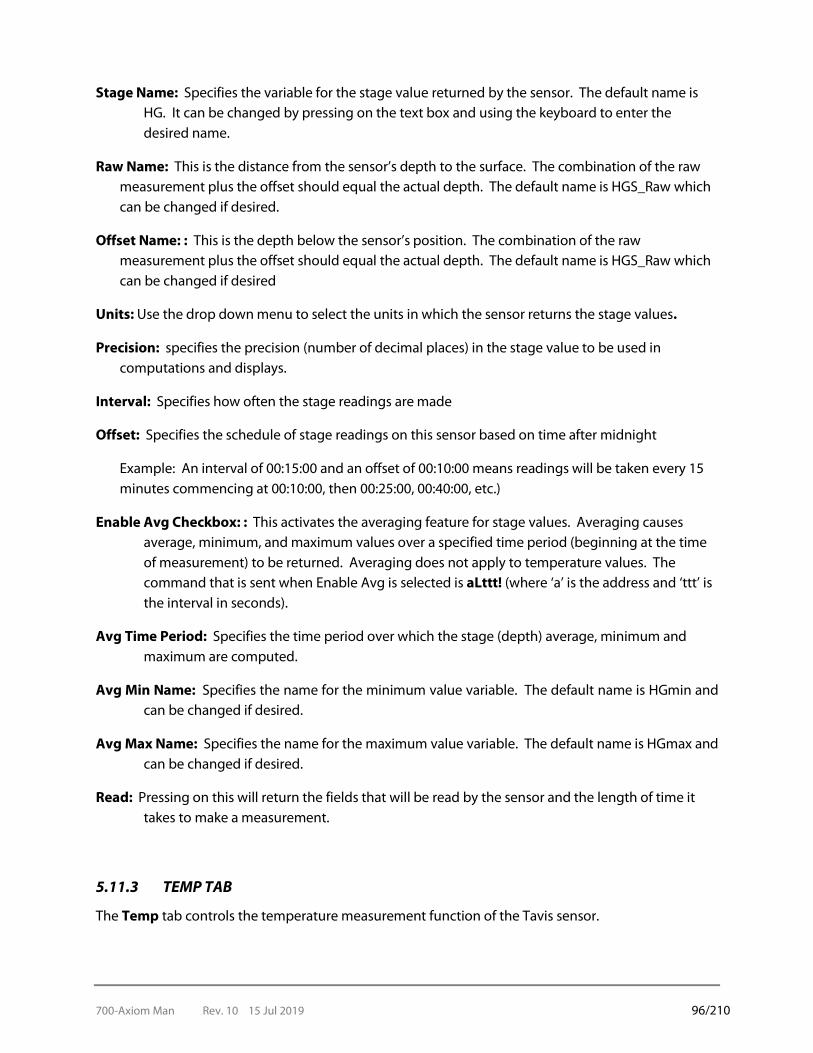
700-Axiom Man Rev. 10 15 Jul 2019 96/210
Stage Name: Specifies the variable for the stage value returned by the sensor. The default name is HG. It can be changed by pressing on the text box and using the keyboard to enter the desired name.
Raw Name: This is the distance from the sensor’s depth to the surface. The combination of the raw measurement plus the offset should equal the actual depth. The default name is HGS_Raw which can be changed if desired.
Offset Name: : This is the depth below the sensor’s position. The combination of the raw measurement plus the offset should equal the actual depth. The default name is HGS_Raw which can be changed if desired
Units: Use the drop down menu to select the units in which the sensor returns the stage values.
Precision: specifies the precision (number of decimal places) in the stage value to be used in computations and displays.
Interval: Specifies how often the stage readings are made
Offset: Specifies the schedule of stage readings on this sensor based on time after midnight
Example: An interval of 00:15:00 and an offset of 00:10:00 means readings will be taken every 15 minutes commencing at 00:10:00, then 00:25:00, 00:40:00, etc.)
Enable Avg Checkbox: : This activates the averaging feature for stage values. Averaging causes average, minimum, and maximum values over a specified time period (beginning at the time of measurement) to be returned. Averaging does not apply to temperature values. The command that is sent when Enable Avg is selected is aLttt! (where ‘a’ is the address and ‘ttt’ is the interval in seconds).
Avg Time Period: Specifies the time period over which the stage (depth) average, minimum and maximum are computed.
Avg Min Name: Specifies the name for the minimum value variable. The default name is HGmin and can be changed if desired.
Avg Max Name: Specifies the name for the maximum value variable. The default name is HGmax and can be changed if desired.
Read: Pressing on this will return the fields that will be read by the sensor and the length of time it takes to make a measurement.
5.11.3 TEMP TAB
The Temp tab controls the temperature measurement function of the Tavis sensor.

700-Axiom Man Rev. 10 15 Jul 2019 97/210
Figure 5-52: Temperature Tab
Temp Name: Specifies the name of the variable for temperature values from the sensor. The default name is TW and can be changed if desired.
Precision: Specifies the number of decimal places used to display temperature values and in calculations and other processes.
Units Specifies the units used to measure temperature values.
5.11.4 DISPLAY SCREEN
Once all tabs are configured, press OK. Pressing on the Tavis con will display its current readings.
Figure 5-53: Tavis Sensor Display Screen
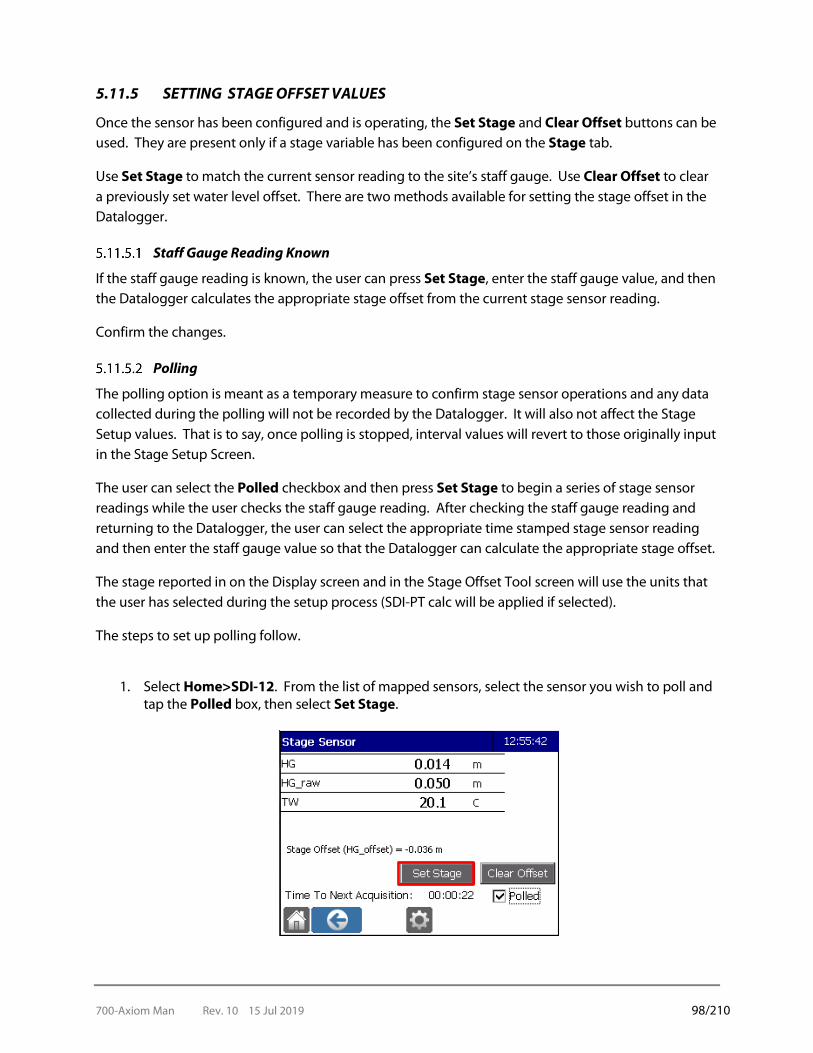
700-Axiom Man Rev. 10 15 Jul 2019 98/210
5.11.5 SETTING STAGE OFFSET VALUES
Once the sensor has been configured and is operating, the Set Stage and Clear Offset buttons can be used. They are present only if a stage variable has been configured on the Stage tab.
Use Set Stage to match the current sensor reading to the site’s staff gauge. Use Clear Offset to clear a previously set water level offset. There are two methods available for setting the stage offset in the Datalogger.
Staff Gauge Reading Known
If the staff gauge reading is known, the user can press Set Stage, enter the staff gauge value, and then the Datalogger calculates the appropriate stage offset from the current stage sensor reading.
Confirm the changes.
Polling
The polling option is meant as a temporary measure to confirm stage sensor operations and any data collected during the polling will not be recorded by the Datalogger. It will also not affect the Stage Setup values. That is to say, once polling is stopped, interval values will revert to those originally input in the Stage Setup Screen.
The user can select the Polled checkbox and then press Set Stage to begin a series of stage sensor readings while the user checks the staff gauge reading. After checking the staff gauge reading and returning to the Datalogger, the user can select the appropriate time stamped stage sensor reading and then enter the staff gauge value so that the Datalogger can calculate the appropriate stage offset.
The stage reported in on the Display screen and in the Stage Offset Tool screen will use the units that the user has selected during the setup process (SDI-PT calc will be applied if selected).
The steps to set up polling follow.
1. Select Home>SDI-12. From the list of mapped sensors, select the sensor you wish to poll and
tap the Polled box, then select Set Stage.
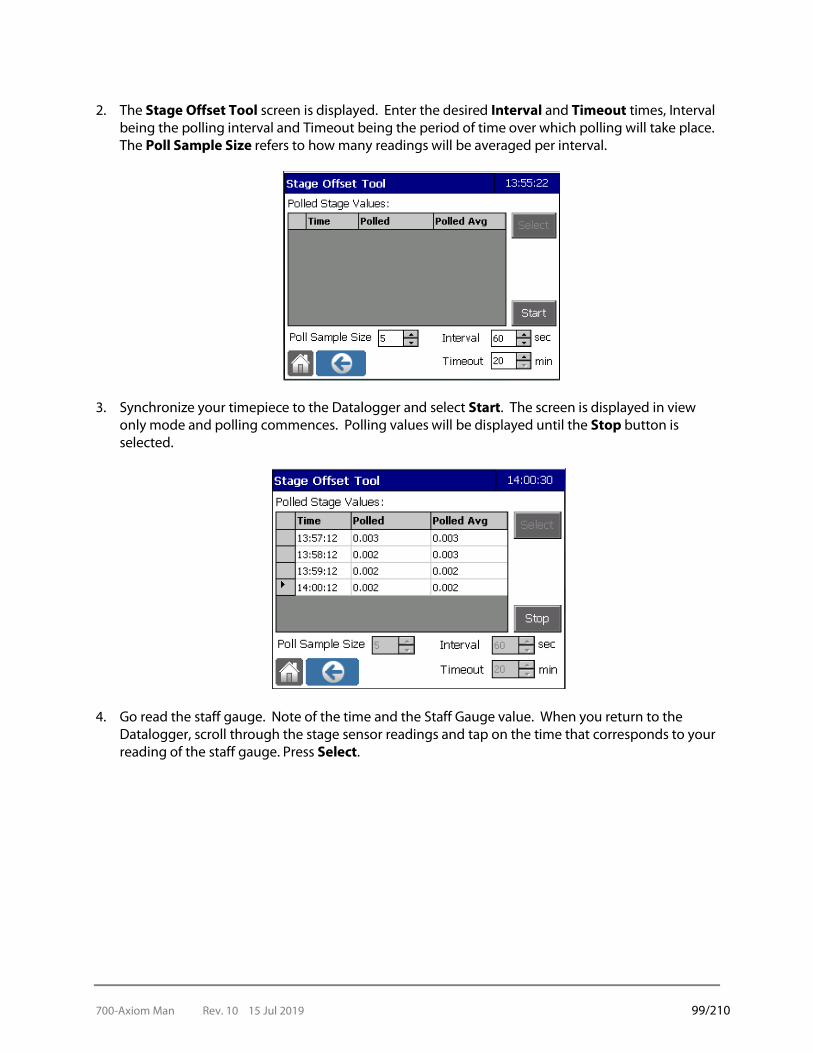
700-Axiom Man Rev. 10 15 Jul 2019 99/210
2. The Stage Offset Tool screen is displayed. Enter the desired Interval and Timeout times, Interval
being the polling interval and Timeout being the period of time over which polling will take place. The Poll Sample Size refers to how many readings will be averaged per interval.
3. Synchronize your timepiece to the Datalogger and select Start. The screen is displayed in view
only mode and polling commences. Polling values will be displayed until the Stop button is selected.
4. Go read the staff gauge. Note of the time and the Staff Gauge value. When you return to the Datalogger, scroll through the stage sensor readings and tap on the time that corresponds to your reading of the staff gauge. Press Select.
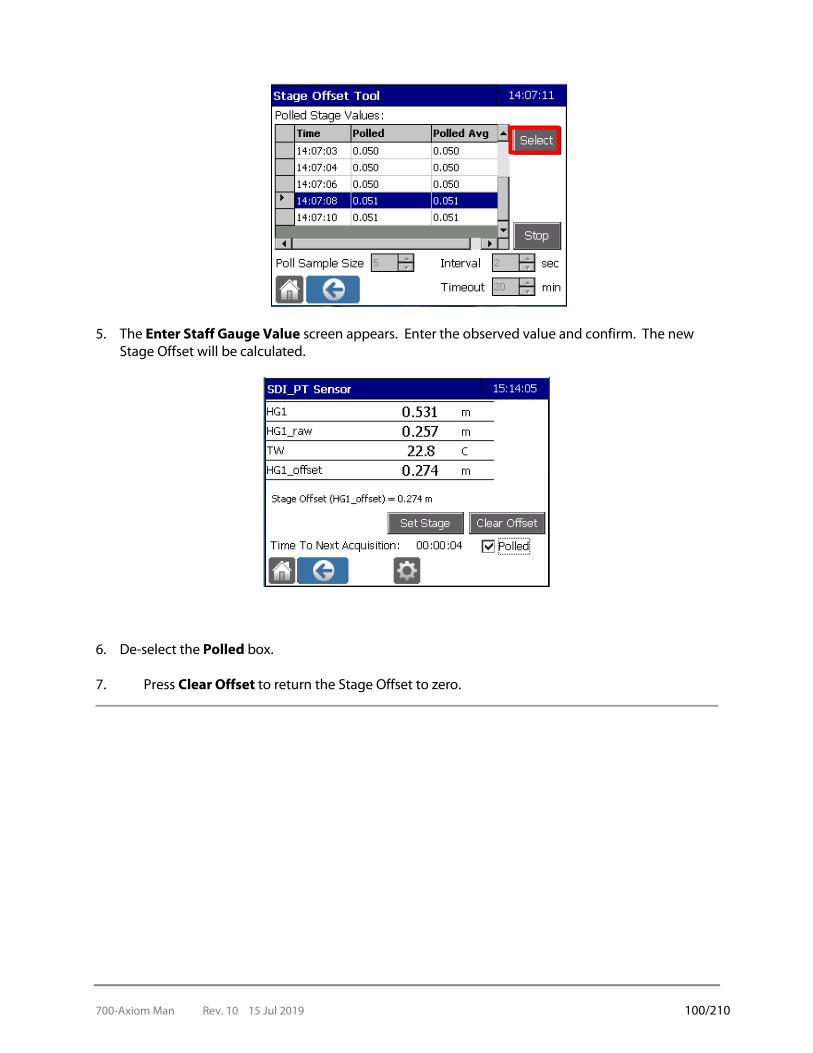
700-Axiom Man Rev. 10 15 Jul 2019 100/210
5. The Enter Staff Gauge Value screen appears. Enter the observed value and confirm. The new Stage Offset will be calculated.
6. De-select the Polled box.
7. Press Clear Offset to return the Stage Offset to zero.
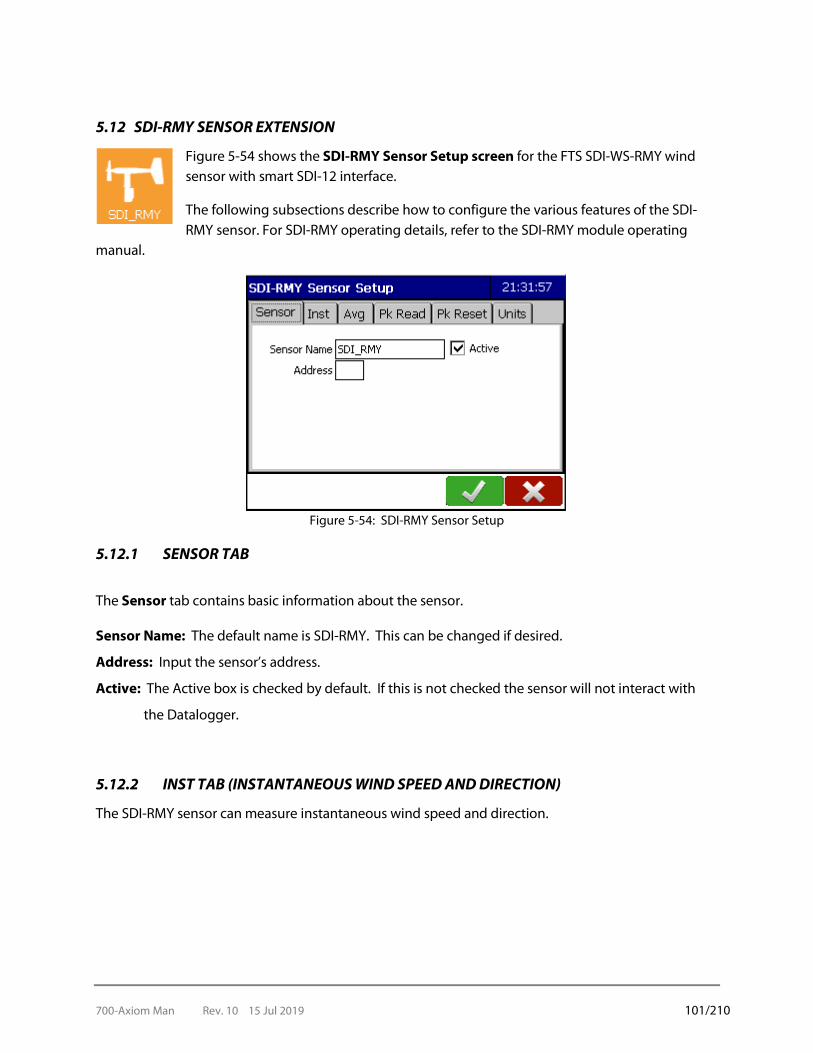
700-Axiom Man Rev. 10 15 Jul 2019 101/210
5.12 SDI-RMY SENSOR EXTENSION
Figure 5-54 shows the SDI-RMY Sensor Setup screen for the FTS SDI-WS-RMY wind sensor with smart SDI-12 interface.
The following subsections describe how to configure the various features of the SDI-RMY sensor. For SDI-RMY operating details, refer to the SDI-RMY module operating
manual.
Figure 5-54: SDI-RMY Sensor Setup
5.12.1 SENSOR TAB
The Sensor tab contains basic information about the sensor. Sensor Name: The default name is SDI-RMY. This can be changed if desired.
Address: Input the sensor’s address.
Active: The Active box is checked by default. If this is not checked the sensor will not interact with
the Datalogger.
5.12.2 INST TAB (INSTANTANEOUS WIND SPEED AND DIRECTION)
The SDI-RMY sensor can measure instantaneous wind speed and direction.

700-Axiom Man Rev. 10 15 Jul 2019 102/210
Figure 5-55: SDI_RMY Sensor Setup Screen
Wind Speed: Specifies the variable name for the current wind speed. The default name is Crnt_Wspd and can be changed if desired.
Wind Direction: Specifies the current wind direction in degrees. The default name is Crnt_Dir and
can be changed if desired. Status: A numerical code which indicates the status of the measurements. The status codes are as
follows:
Status code Meaning
• 0 • Measurement OK
• 1 • Wind direction is suspect
• 2 • RESERVED FOR FUTURE USE (Wind speed is suspect )
• 3 • RESERVED FOR FUTURE USE (Both speed and direction are suspect)
• 128 • Averaging algorithm is still in startup phase. The averaged result has been calculated with less samples than configured.
Interval: Specifies how often the instantaneous wind readings are made. The default setting is 30
seconds. Offset: Specifies the schedule of instantaneous wind readings on this sensor based on time after
midnight. The default setting is 00:00:25. Example: An interval of 00:00:30 and an offset of 00:00:25 means readings will be taken every 30 seconds commencing at 25 seconds after the hour (at 00:00:25, 00:00:50, 00:01:25, 00:01:55 etc.).
Enabled Checkbox: This must be check for Instantaneous wind Readings to be taken.

700-Axiom Man Rev. 10 15 Jul 2019 103/210
5.12.3 AVG TAB (SCALAR AND/OR VECTOR AVERAGING SETTINGS)
The sensor can compute scalar and vector average wind speeds.
Figure 5-56: SDI_RMY Sensor – Avg Tab
Scalar: This specifies the Scalar averagemeasurements for Wind Speed and Wind Direction. The default names are A2mWSM (Scalar Wind Speed) and A2mWDD (Scalar Wind Direction).
Vector: This specifies the vector measurements for Wind Speed and Direction. Input the desired
variable name. Count: This shows the number of samples taken. It will reset to zero once the Samples per Average
value has been reached. Status: A numerical code which indicates the status of the measurements. The status codes are the
same as in the Inst Tab. Samples per Average: Input the desired number. The default is 24. Valid range is from 1-720
samples. Sample Interval: This specifies the period of time over which the samples will be taken. Input the
desired sample interval time. Valid range is from 1-10 seconds. The default setting is 5 seconds. Interval: Specifies how often the samples are made. The default setting is 30 seconds. Offset: Specifies the schedule of samples based on time after midnight. The default setting is
00:00:25.
Example: An interval of 00:00:30 and an offset of 00:00:25 means readings will be taken every 30 seconds commencing at 25 seconds after the hour (at 00:00:25, 00:00:50, 00:01:25, 00:01:55 etc.).
Enabled Checkbox: This must be check for averaging samples to be taken.

700-Axiom Man Rev. 10 15 Jul 2019 104/210
5.12.4 PK READ TAB (PEAK READING)
The sensor can calculate and return two different values for peak wind speed and direction. These two values differ only depending on when they are reset to zero. (A peak is the highest wind speed detected since the last peak reset, together with the corresponding direction).
Figure 5-57: SDI-RMY – Peak Read Tab
Peak 1: This specifies the Wind Speed, Wind Direction and Peak Status. The default names are WSMP (Wind Speed) and WDDP (Wind Speed).
Peak 2: This specifies the second Wind Speed, Wind Direction and Peak Status. The default names are
WSMP2m (Wind Speed) and WDDP2m (Wind Speed). Peak Status: A numerical code which indicates the status of the measurements. The status codes are
the same as in the Inst Tab. Peak Average Time: This specifies the time over which the peak average will be measured. Valid
range is form 0-10 seconds. If a duration of 0 is set any single wind speed sample might be registered as the peak value.
Interval: Specifies how often the readings are made. The default setting is 30 seconds. Offset: Specifies the schedule of readings based on time after midnight. The default setting is
00:00:25. Example: An interval of 00:00:30 and an offset of 00:00:25 means readings will be taken every 30 seconds commencing at 25 seconds after the hour (at 00:00:25, 00:00:50, 00:01:25, 00:01:55 etc.).
Enabled Checkbox: This must be check for averaging samples to be taken.

700-Axiom Man Rev. 10 15 Jul 2019 105/210
5.12.5 PK RESET TAB (PEAK RESET INTERVAL SETTINGS)
Computations for the two peak values can be reset to zero on independent schedules.
Figure 5-58: SDI-RMY – Pk Reset Tab
Peak 1/2 Reset Enabled Checkboxes: This must be selected for the selected Peak Reset to occur. Interval: Specifies how often the peak readings will be reset in hh:mm:ss format . The default setting
for Peak 1 Reset is 1 hour (01:00:00) and for Peak 2 it is 2 minutes (00:02:00).
Offset: Specifies the schedule of peak resets based on time after midnight. The default setting for Peak 1 is 00:59:55 and for Peak 2 it is 00:01:55.
Example: The Peak 1 default settings means Peak 1 will reset every hour at 59 minutes and 55 seconds after the hour (at 00:59:55, 01:59:55, 02:59:55, etc.).
5.12.6 UNITS TAB
The units tab provides the ability to set both the internal and display units for Wind Speed and Direction.
Figure 5-59: SDI-RMY – Units Tab
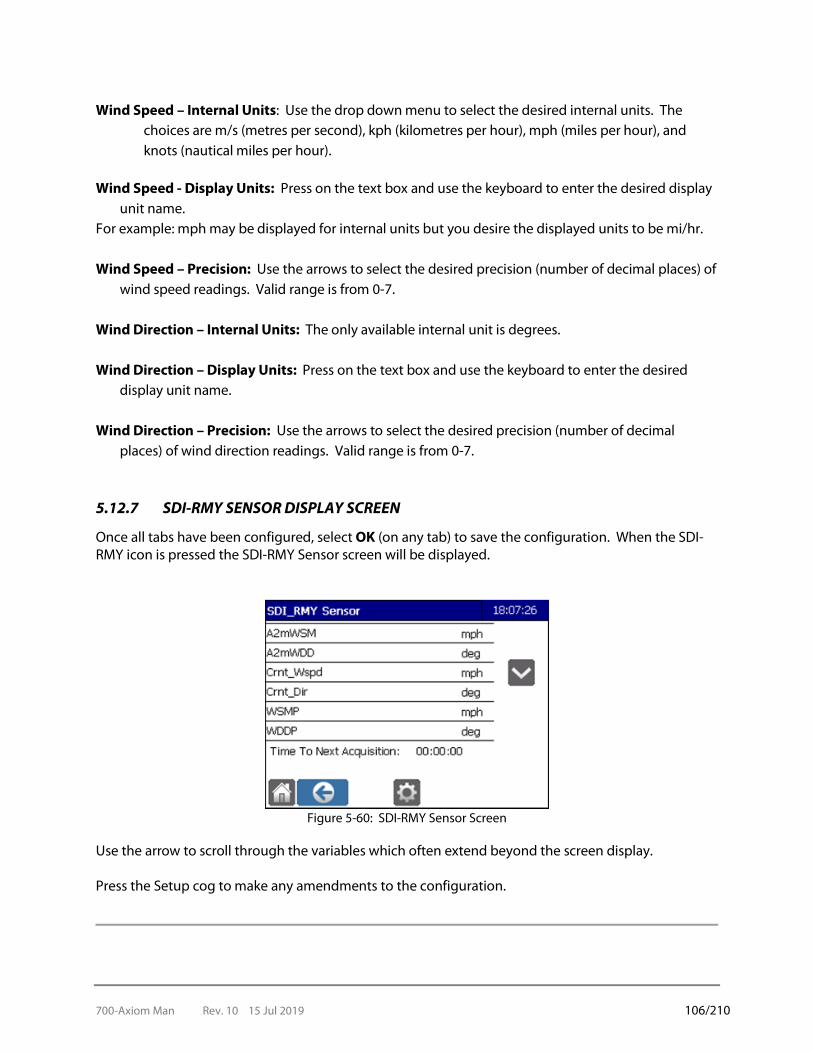
700-Axiom Man Rev. 10 15 Jul 2019 106/210
Wind Speed – Internal Units: Use the drop down menu to select the desired internal units. The
choices are m/s (metres per second), kph (kilometres per hour), mph (miles per hour), and knots (nautical miles per hour).
Wind Speed - Display Units: Press on the text box and use the keyboard to enter the desired display
unit name. For example: mph may be displayed for internal units but you desire the displayed units to be mi/hr. Wind Speed – Precision: Use the arrows to select the desired precision (number of decimal places) of
wind speed readings. Valid range is from 0-7. Wind Direction – Internal Units: The only available internal unit is degrees. Wind Direction – Display Units: Press on the text box and use the keyboard to enter the desired
display unit name. Wind Direction – Precision: Use the arrows to select the desired precision (number of decimal
places) of wind direction readings. Valid range is from 0-7.
5.12.7 SDI-RMY SENSOR DISPLAY SCREEN
Once all tabs have been configured, select OK (on any tab) to save the configuration. When the SDI-RMY icon is pressed the SDI-RMY Sensor screen will be displayed.
Figure 5-60: SDI-RMY Sensor Screen
Use the arrow to scroll through the variables which often extend beyond the screen display. Press the Setup cog to make any amendments to the configuration.

700-Axiom Man Rev. 10 15 Jul 2019 107/210
5.13 DIGITEMP SENSOR EXTENSION
Figure 5-61 shows the DigiTemp Sensor Setup screen (Sensor tab), with default settings, that is provided by the FTS DigiTemp (Digital Temperature Sensor) sensor extension. This extension predefines a water temperature variable of TW. Refer to the sensor’s operating manual for sensor command and data details.
Figure 5-61: DigiTemp Sensor Setup Screen
5.13.1 SENSOR TAB
The Sensor tab contains basic information about the sensor: Sensor Name: The default name is DigiTemp. This can be changed if desired.
Address: Input the sensor’s address.
Active: The Active box is checked by default. If this is not checked the sensor will not interact with the Datalogger.
5.13.2 TEMP TAB (TEMPERATURE TAB)
The Temp tab allows the user to specify a water temperature measurement.
Figure 5-62: DigiTemp – Temp Tab
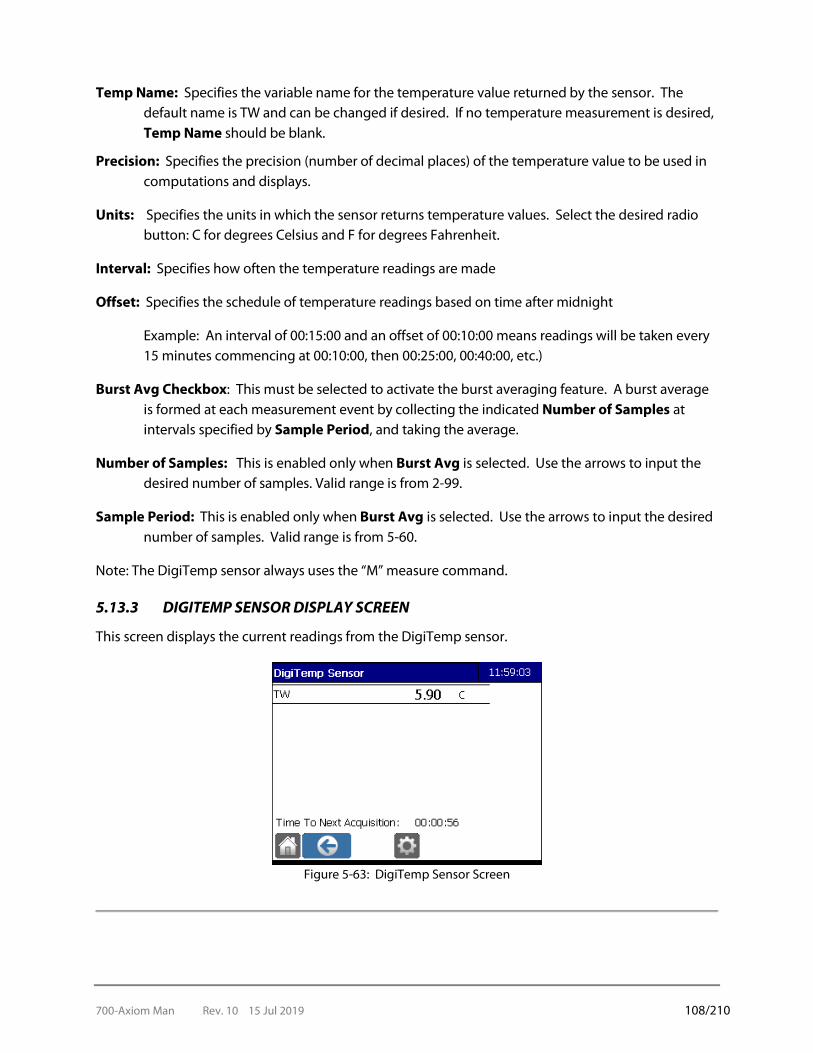
700-Axiom Man Rev. 10 15 Jul 2019 108/210
Temp Name: Specifies the variable name for the temperature value returned by the sensor. The default name is TW and can be changed if desired. If no temperature measurement is desired, Temp Name should be blank.
Precision: Specifies the precision (number of decimal places) of the temperature value to be used in computations and displays.
Units: Specifies the units in which the sensor returns temperature values. Select the desired radio button: C for degrees Celsius and F for degrees Fahrenheit.
Interval: Specifies how often the temperature readings are made
Offset: Specifies the schedule of temperature readings based on time after midnight
Example: An interval of 00:15:00 and an offset of 00:10:00 means readings will be taken every 15 minutes commencing at 00:10:00, then 00:25:00, 00:40:00, etc.)
Burst Avg Checkbox: This must be selected to activate the burst averaging feature. A burst average is formed at each measurement event by collecting the indicated Number of Samples at intervals specified by Sample Period, and taking the average.
Number of Samples: This is enabled only when Burst Avg is selected. Use the arrows to input the desired number of samples. Valid range is from 2-99.
Sample Period: This is enabled only when Burst Avg is selected. Use the arrows to input the desired number of samples. Valid range is from 5-60.
Note: The DigiTemp sensor always uses the “M” measure command.
5.13.3 DIGITEMP SENSOR DISPLAY SCREEN
This screen displays the current readings from the DigiTemp sensor.
Figure 5-63: DigiTemp Sensor Screen

700-Axiom Man Rev. 10 15 Jul 2019 109/210
5.14 SR50 SENSOR EXTENSION
The Campbell SR50 sonic ranging sensor is commonly used to measure snow depth. Figure 5-64 shows the Snow Depth Sensor Setup screen (Sensor tab) with default Sensor Name settings which can be changed if desired. Refer to the sensor’s operating manual for sensor command and data details.
Figure 5-64: Snow Depth Sensor Setup
5.14.1 SENSOR TAB
The Sensor tab contains basic information about the sensor. Sensor Name: The default sensor is the SR50-A and the default name is SRSnow.
Address: Input the sensor’s address.
Active: The Active box is checked by default. If this is not checked the sensor will not interact with the Datalogger.
SR50-AT Checkbox: If the attached sensor is model SR50-AT this box must be checked to ensure the
sensor interacts with the Datalogger.
5.14.2 SCHEDULE TAB
This tab specifies the schedule of the readings and sample details.
Figure 5-65: Snow Depth Sensor – Schedule Tab
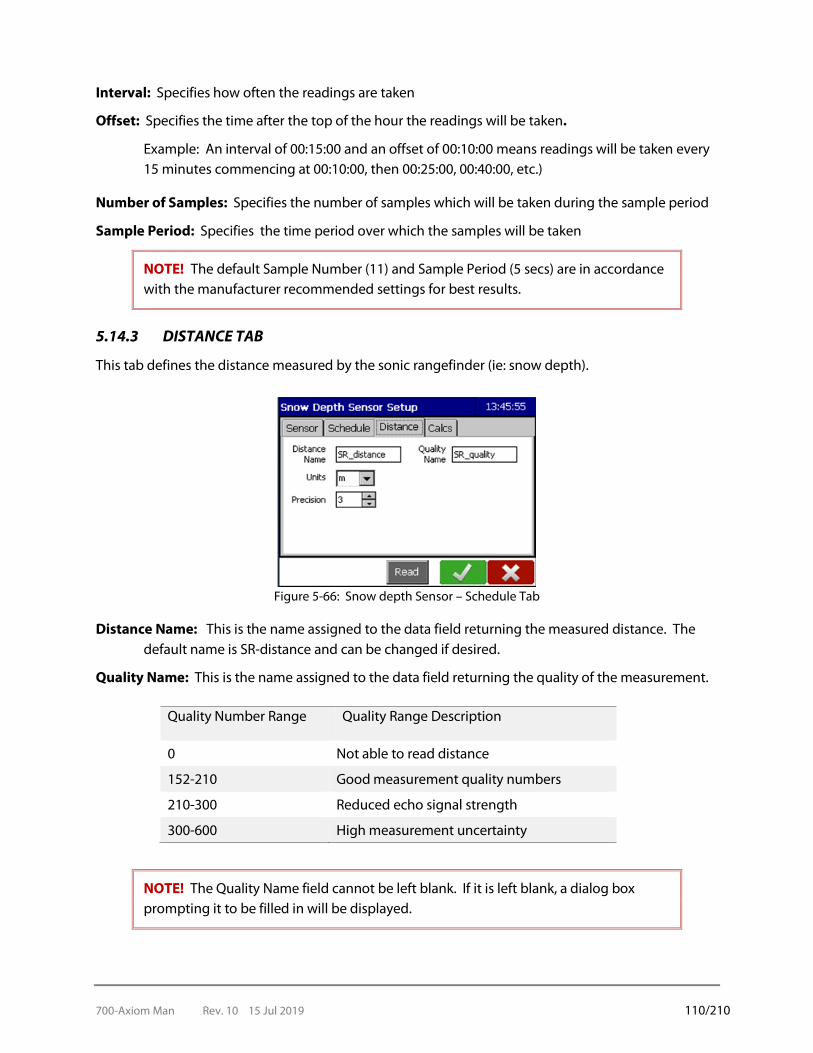
700-Axiom Man Rev. 10 15 Jul 2019 110/210
Interval: Specifies how often the readings are taken
Offset: Specifies the time after the top of the hour the readings will be taken.
Example: An interval of 00:15:00 and an offset of 00:10:00 means readings will be taken every 15 minutes commencing at 00:10:00, then 00:25:00, 00:40:00, etc.)
Number of Samples: Specifies the number of samples which will be taken during the sample period
Sample Period: Specifies the time period over which the samples will be taken
NOTE! The default Sample Number (11) and Sample Period (5 secs) are in accordance with the manufacturer recommended settings for best results.
5.14.3 DISTANCE TAB
This tab defines the distance measured by the sonic rangefinder (ie: snow depth).
Figure 5-66: Snow depth Sensor – Schedule Tab
Distance Name: This is the name assigned to the data field returning the measured distance. The default name is SR-distance and can be changed if desired.
Quality Name: This is the name assigned to the data field returning the quality of the measurement.
NOTE! The Quality Name field cannot be left blank. If it is left blank, a dialog box prompting it to be filled in will be displayed.
Quality Number Range Quality Range Description
0 Not able to read distance
152-210 Good measurement quality numbers
210-300 Reduced echo signal strength
300-600 High measurement uncertainty
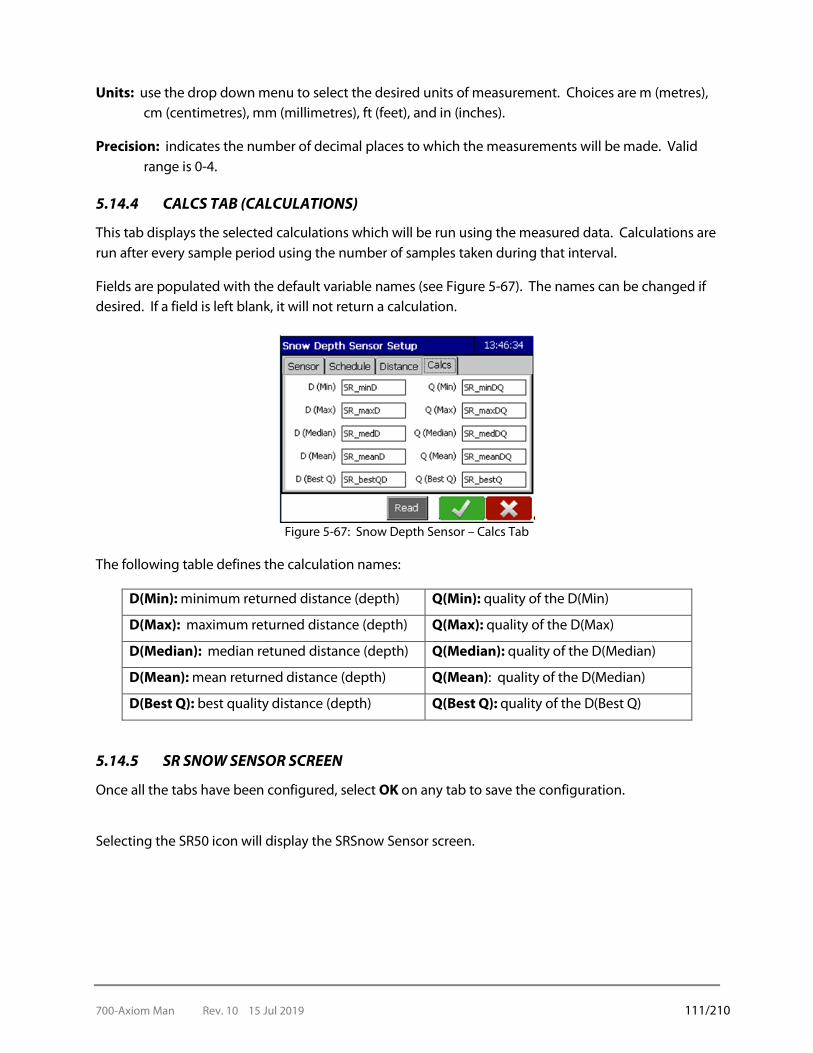
700-Axiom Man Rev. 10 15 Jul 2019 111/210
Units: use the drop down menu to select the desired units of measurement. Choices are m (metres), cm (centimetres), mm (millimetres), ft (feet), and in (inches).
Precision: indicates the number of decimal places to which the measurements will be made. Valid range is 0-4.
5.14.4 CALCS TAB (CALCULATIONS)
This tab displays the selected calculations which will be run using the measured data. Calculations are run after every sample period using the number of samples taken during that interval.
Fields are populated with the default variable names (see Figure 5-67). The names can be changed if desired. If a field is left blank, it will not return a calculation.
Figure 5-67: Snow Depth Sensor – Calcs Tab
The following table defines the calculation names:
D(Min): minimum returned distance (depth) Q(Min): quality of the D(Min)
D(Max): maximum returned distance (depth) Q(Max): quality of the D(Max)
D(Median): median retuned distance (depth) Q(Median): quality of the D(Median)
D(Mean): mean returned distance (depth) Q(Mean): quality of the D(Median)
D(Best Q): best quality distance (depth) Q(Best Q): quality of the D(Best Q)
5.14.5 SR SNOW SENSOR SCREEN
Once all the tabs have been configured, select OK on any tab to save the configuration.
Selecting the SR50 icon will display the SRSnow Sensor screen.
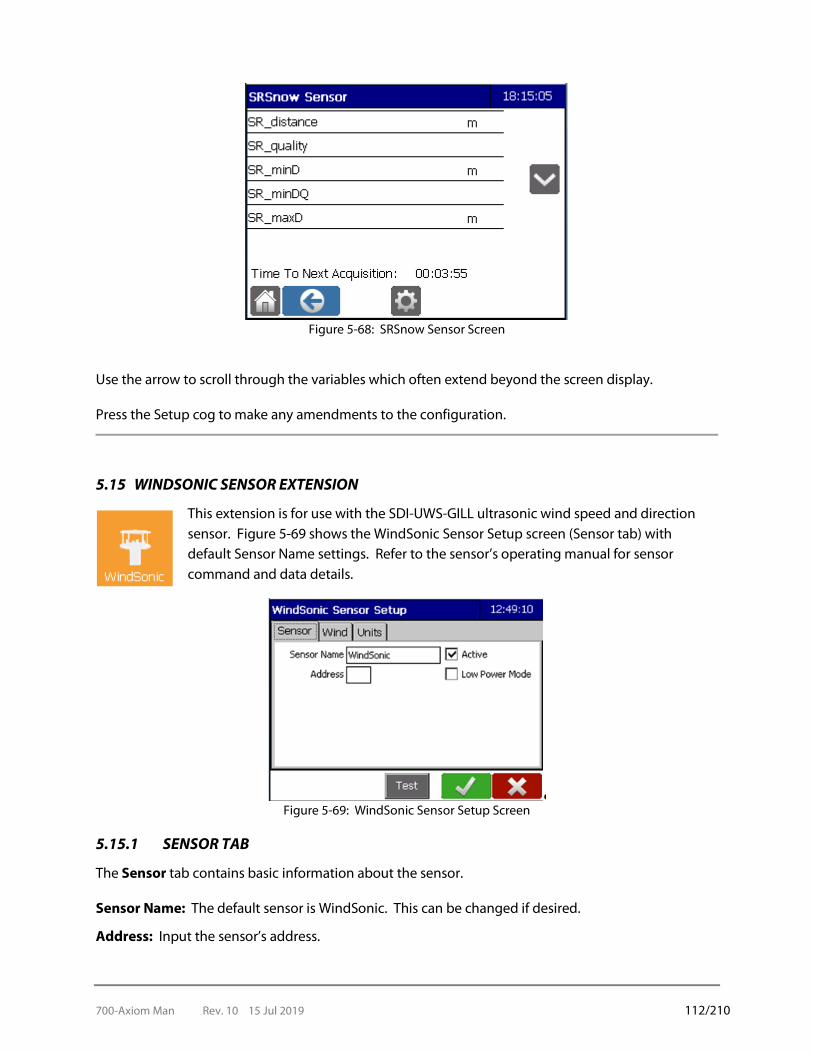
700-Axiom Man Rev. 10 15 Jul 2019 112/210
Figure 5-68: SRSnow Sensor Screen
Use the arrow to scroll through the variables which often extend beyond the screen display. Press the Setup cog to make any amendments to the configuration.
5.15 WINDSONIC SENSOR EXTENSION
This extension is for use with the SDI-UWS-GILL ultrasonic wind speed and direction sensor. Figure 5-69 shows the WindSonic Sensor Setup screen (Sensor tab) with default Sensor Name settings. Refer to the sensor’s operating manual for sensor command and data details.
Figure 5-69: WindSonic Sensor Setup Screen
5.15.1 SENSOR TAB
The Sensor tab contains basic information about the sensor. Sensor Name: The default sensor is WindSonic. This can be changed if desired.
Address: Input the sensor’s address.

700-Axiom Man Rev. 10 15 Jul 2019 113/210
Active: The Active box is checked by default. If this is not checked the sensor will not interact with the Datalogger.
Low Power Mode: Select this check box to use less power. When selected, calculations will take a
few seconds longer to run.
IMPORTANT! Older model WindSonic sensors can lock up when operating in low power mode, so leave the power mode checkbox blank.
WindSonic models with Gill serial numbers 15020045 and higher can be operated in either power mode.
NOTE: If you require low power mode and are unsure if your WindSonic will support this, contact FTS for verification
5.15.2 WIND TAB
The Wind Tab defines the data fields for the raw wind speed and direction. Figure 5-70 shows the Wind Tab variables and their default names. Default names can be changed if desired.
Figure 5-70: WindSonic Sensor Setup – Wind Tab
Speed: This provides the raw wind speed.
Direction: This provides the raw wind direction
Status: This provide the status of the sensor using a numerical code. The codes are outlined below. Refer to the Gill Windsonic User Manual for a detailed explanation of the codes

700-Axiom Man Rev. 10 15 Jul 2019 114/210
Code Status Condition
00 OK Sufficient samples in the average period
01 Axis 1 failed Insufficient samples in average period on U axis
02 Axis 2 failed Insufficient samples in average period on V axis
04 Axis 1 and 2 failed Insufficient samples in average period on both axes
08 Non Volatile Memory (NVM) error
NVM checksum failed
09 Read Only Memory (ROM) error
ROM checksum failed
A - NMEA data acceptable
V - NMEA data void
Filtered Speed: The Datalogger program automatically assigns erroneous wind readings an unrealistic wind speed value of 9999. When this field is named, these values will be filtered and replaced with “Err”. If there is no filter in place, the 9999 value will cause data spikes and a cluttered data plot. Additionally, the 9999 value will be used in calculations which can lead to false positives and warnings being issued for non-existent high winds.
Filtered Direction: As for filtered speed, if this field is named, erroneous wind reading’s directions will not be displayed on the data plot.
Interval: Specifies how often the readings are made.
Offset: Specifies the schedule of readings based on time after midnight
Example: An interval of 00:15:00 and an offset of 00:10:00 means readings will be taken every 15 minutes commencing at 00:10:00, then 00:25:00, 00:40:00, etc.)
5.15.3 UNITS TAB
This tab is used to input the units of measurement and the precision of the measurements.
Figure 5-71: WindSonic Sensor Setup – Units Tab
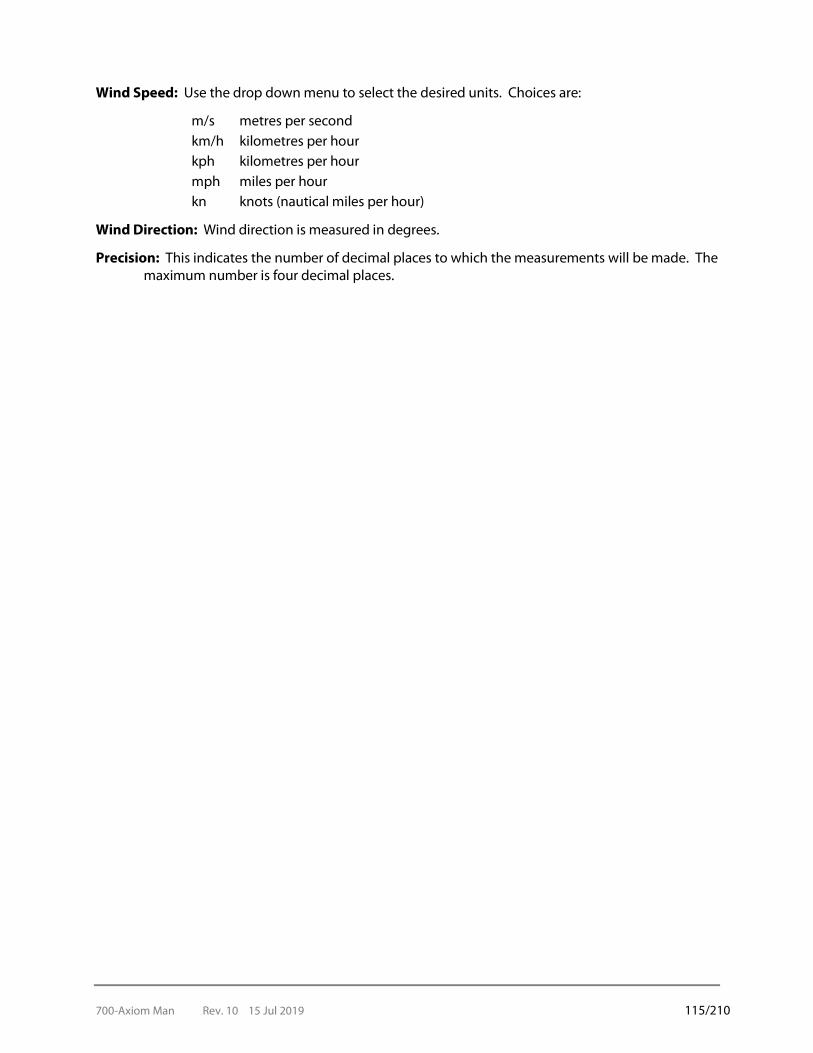
700-Axiom Man Rev. 10 15 Jul 2019 115/210
Wind Speed: Use the drop down menu to select the desired units. Choices are:
m/s metres per second km/h kilometres per hour kph kilometres per hour mph miles per hour kn knots (nautical miles per hour)
Wind Direction: Wind direction is measured in degrees.
Precision: This indicates the number of decimal places to which the measurements will be made. The maximum number is four decimal places.

700-Axiom Man Rev. 10 15 Jul 2019 116/210
5.16 RADAR STAGE SENSOR – SENSOR EXTENSION
This extension is for use with the FTS Radar Stage Sensor. Figure 5-72 shows the Radar Sensor Setup screen (Sensor tab) with default Sensor Name settings. Refer to the sensor’s operating manual for sensor command and data detail
Figure 5-72: Radar Sensor Setup screen
Read: The read button appears on all tabs and will trigger a sensor reading and return the measured values for the fields (sends the “M1” Command – returns Stage, distance, quality metric, and internal temperature in C).
Figure 5-73: “M1” Commands read results
5.16.1 SENSOR TAB
This tab displays basic information about the sensor (Figure 5-72). Sensor Name: The default sensor name is Radar. This can be changed if desired. Address: This displays the sensor’s address.
Active: The Active box is checked by default. If this is not checked the sensor will not interact with the Datalogger.

700-Axiom Man Rev. 10 15 Jul 2019 117/210
5.16.2 STAGE TAB
The Stage Tab defines the data fields for the Stage name and stage details. Figure 5-73 shows the StageTab variables and their default names. Default names can be changed if desired.
Figure 5-74: Radar Sensor Setup – Stage Tab
Stage Name: The default name is Stage. This can be changed as desired. Units: Use the drop down menu to select the desired measurement units. The choices are ft (default
units), m, or mm. Precision: This specifies the precision (number of decimal places) in the value to be used in
computations and displays. The range is from 0-7.
Quality Number: The default name is Stg_Qual. This can be changed as desired. Internal to the sensor is an algorithm which uses specific criteria to determine if a reading is reliable or not. Any reading which does not meet these criteria is discarded. The quality numbers are in decimal format and indicate the percentage of the samples taken within the sampling period which met the criteria. The numbers range from Zero (0 = no samples taken within the sampling period met measuring criteria) to One (1.0 = 100% of the samples taken met measuring criteria).
5.16.3 SCHEDULE TAB
This tab is used to setup how often samples are taken and averaged, and how long the averaging duration lasts.

700-Axiom Man Rev. 10 15 Jul 2019 118/210
Figure 5-75: Radar Sensor Setup – Schedule Tab
Interval: This is how often the radar will take a series of samples to average to determine water depth.
Offset: This is the time after midnight that the measurement (“M1”) command will be sent. The actual measurement will be taken in the amount of time returned by the “Read” button (see Figure 5-73).
Example: Using the example of 4 seconds, an Interval of 15 minutes, and an Offset of 00:14:54, the measurement command is sent at 00:14:54. It takes four seconds to return a value, plus we added 2 second padding to ensure the returned values are available and all logging takes place by the fifteen minute mark. Subsequent measurement commands will be sent at 00:29:54, 00:44:54, etc.
Averaging Duration: Samples taken over this duration will be used in the average. Note whether the
radar is in high or low power mode. Durations of 1 to 60 seconds can be entered with the default being 20 seconds.
Mode: There are two modes:
High Power: In high power mode, one sample is taken every second, continuously. These are stored in the buffer. When the scheduled time arrives (based on the input interval and offset times), the most recent samples taken will be used for the average in accordance with the Averaging Duration (ie: an averaging duration of 20 seconds will use the last 20 samples in the buffer). Low Power: In Low Power mode the radar “wakes up” when it is time to take samples in accordance with the schedule set using the Interval and Offset function. It then starts taking samples at the rate of one sample per second for the prescribed Averaging Duration, and then returns to the dormant state. The warming up cycle takes 65 seconds, so sampling will commence 65 seconds after the Interval/Offset time.
Once all parameters on the three tabs have been input, select OK.
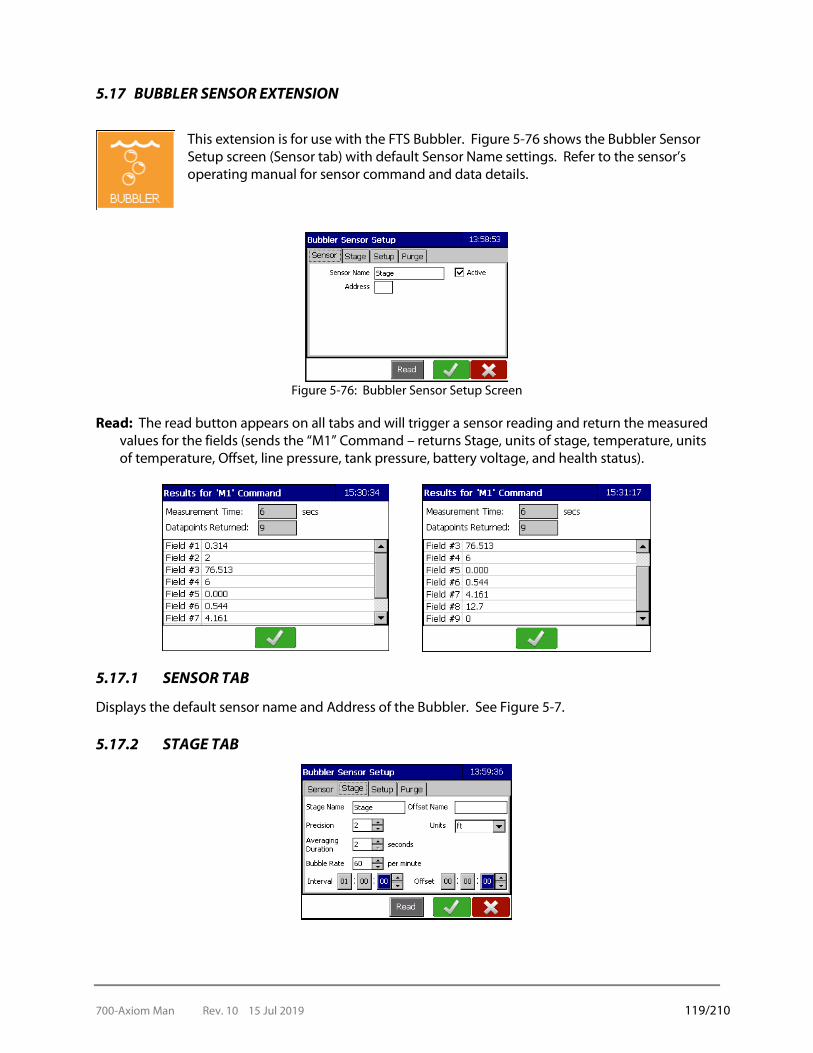
700-Axiom Man Rev. 10 15 Jul 2019 119/210
5.17 BUBBLER SENSOR EXTENSION
This extension is for use with the FTS Bubbler. Figure 5-76 shows the Bubbler Sensor Setup screen (Sensor tab) with default Sensor Name settings. Refer to the sensor’s operating manual for sensor command and data details.
Figure 5-76: Bubbler Sensor Setup Screen
Read: The read button appears on all tabs and will trigger a sensor reading and return the measured values for the fields (sends the “M1” Command – returns Stage, units of stage, temperature, units of temperature, Offset, line pressure, tank pressure, battery voltage, and health status).
5.17.1 SENSOR TAB
Displays the default sensor name and Address of the Bubbler. See Figure 5-7.
5.17.2 STAGE TAB
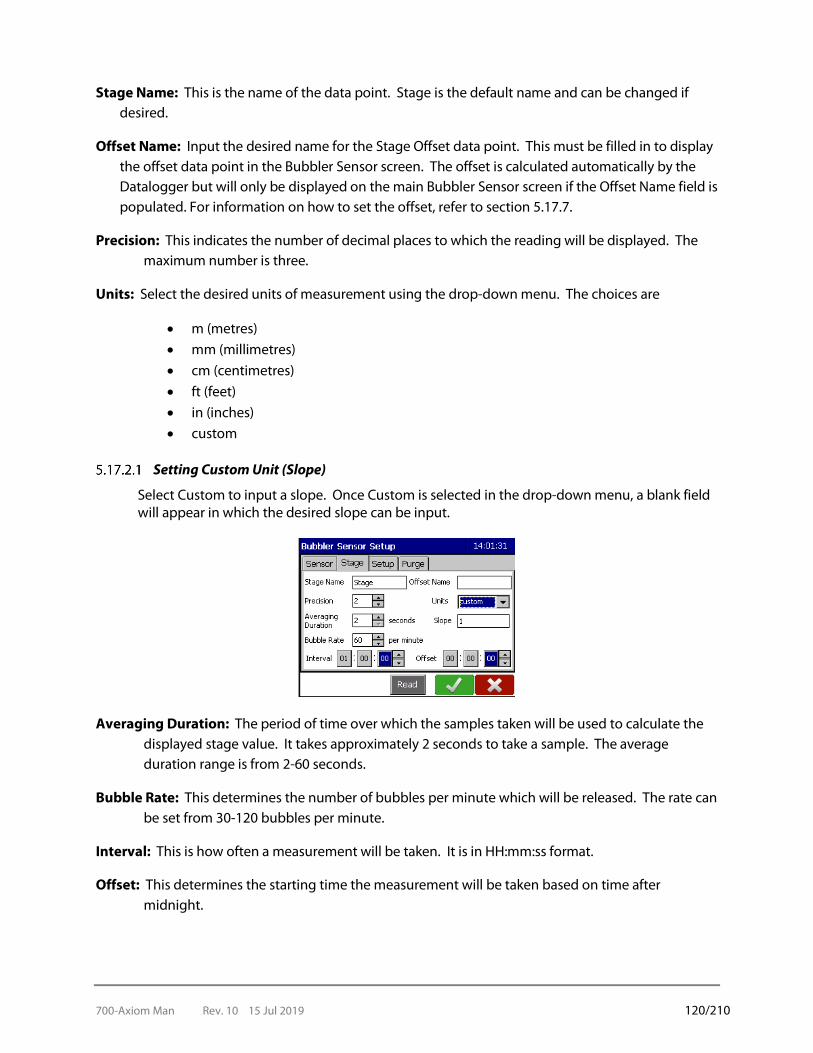
700-Axiom Man Rev. 10 15 Jul 2019 120/210
Stage Name: This is the name of the data point. Stage is the default name and can be changed if desired.
Offset Name: Input the desired name for the Stage Offset data point. This must be filled in to display the offset data point in the Bubbler Sensor screen. The offset is calculated automatically by the Datalogger but will only be displayed on the main Bubbler Sensor screen if the Offset Name field is populated. For information on how to set the offset, refer to section 5.17.7.
Precision: This indicates the number of decimal places to which the reading will be displayed. The maximum number is three.
Units: Select the desired units of measurement using the drop-down menu. The choices are
• m (metres) • mm (millimetres) • cm (centimetres) • ft (feet) • in (inches) • custom
Setting Custom Unit (Slope)
Select Custom to input a slope. Once Custom is selected in the drop-down menu, a blank field will appear in which the desired slope can be input.
Averaging Duration: The period of time over which the samples taken will be used to calculate the displayed stage value. It takes approximately 2 seconds to take a sample. The average duration range is from 2-60 seconds.
Bubble Rate: This determines the number of bubbles per minute which will be released. The rate can be set from 30-120 bubbles per minute.
Interval: This is how often a measurement will be taken. It is in HH:mm:ss format.
Offset: This determines the starting time the measurement will be taken based on time after midnight.

700-Axiom Man Rev. 10 15 Jul 2019 121/210
For example: An interval of 01:00:00 and an offset of 00:15:00 means a measurement will be taken every hour commencing at 15 minutes after midnight (00:15:00, 01:15:00, 02:15:00, etc.).
5.17.3 SETUP TAB
Status Name: The default name is Status and can be changed if desired.
Tank Pressure Name: The default name is TankP and can be changed if desired. Units are in PSI.
Line Pressure Name: The default name is LineP and can be changed if desired. Units are in PSI.
Temperature Name: Insert the desired name for the temperature variable.
Temperature Units: Select either C (Celsius) or F (Fahrenheit).
5.17.4 PURGE TAB
The Datalogger can initiate purges on a regular schedule to clear the hose outlet of silt or debris which may be blocking it. The frequency of the purges and the PSI used to conduct them are dependent on the environment and conditions of the site.
IMPORTANT! Purges will only be initiated by the Datalogger if Enable Scheduled Purge is selected. The default is to have Scheduled Purges disabled.
Purge Tab – default Purge Tab showing Scheduled Purge enabled
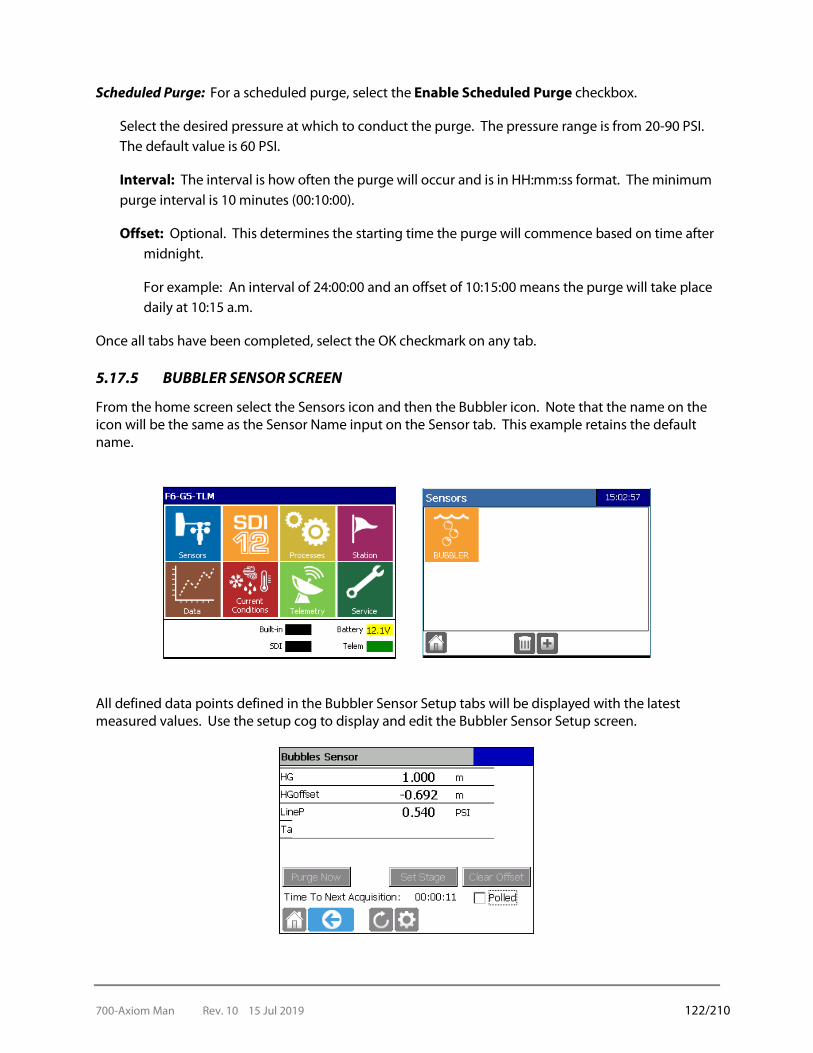
700-Axiom Man Rev. 10 15 Jul 2019 122/210
Scheduled Purge: For a scheduled purge, select the Enable Scheduled Purge checkbox.
Select the desired pressure at which to conduct the purge. The pressure range is from 20-90 PSI. The default value is 60 PSI.
Interval: The interval is how often the purge will occur and is in HH:mm:ss format. The minimum purge interval is 10 minutes (00:10:00).
Offset: Optional. This determines the starting time the purge will commence based on time after midnight.
For example: An interval of 24:00:00 and an offset of 10:15:00 means the purge will take place daily at 10:15 a.m.
Once all tabs have been completed, select the OK checkmark on any tab.
5.17.5 BUBBLER SENSOR SCREEN
From the home screen select the Sensors icon and then the Bubbler icon. Note that the name on the icon will be the same as the Sensor Name input on the Sensor tab. This example retains the default name.
All defined data points defined in the Bubbler Sensor Setup tabs will be displayed with the latest measured values. Use the setup cog to display and edit the Bubbler Sensor Setup screen.
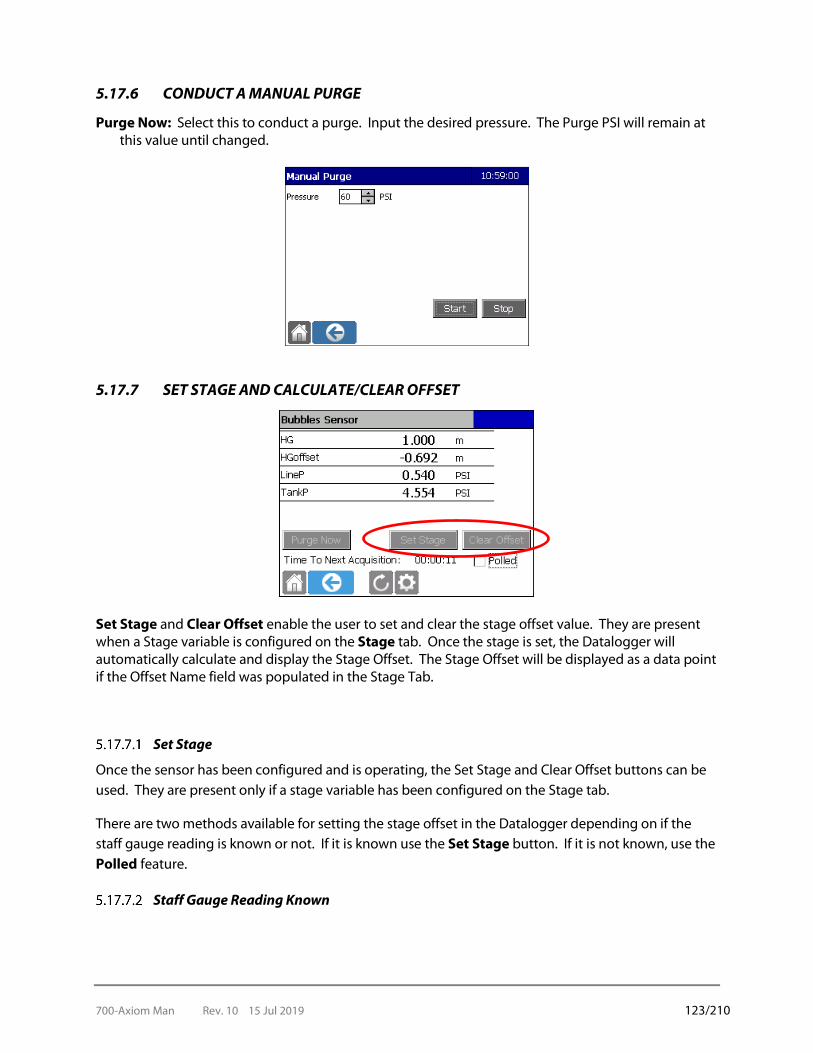
700-Axiom Man Rev. 10 15 Jul 2019 123/210
5.17.6 CONDUCT A MANUAL PURGE
Purge Now: Select this to conduct a purge. Input the desired pressure. The Purge PSI will remain at this value until changed.
5.17.7 SET STAGE AND CALCULATE/CLEAR OFFSET
Set Stage and Clear Offset enable the user to set and clear the stage offset value. They are present when a Stage variable is configured on the Stage tab. Once the stage is set, the Datalogger will automatically calculate and display the Stage Offset. The Stage Offset will be displayed as a data point if the Offset Name field was populated in the Stage Tab.
Set Stage
Once the sensor has been configured and is operating, the Set Stage and Clear Offset buttons can be used. They are present only if a stage variable has been configured on the Stage tab.
There are two methods available for setting the stage offset in the Datalogger depending on if the staff gauge reading is known or not. If it is known use the Set Stage button. If it is not known, use the Polled feature.
Staff Gauge Reading Known
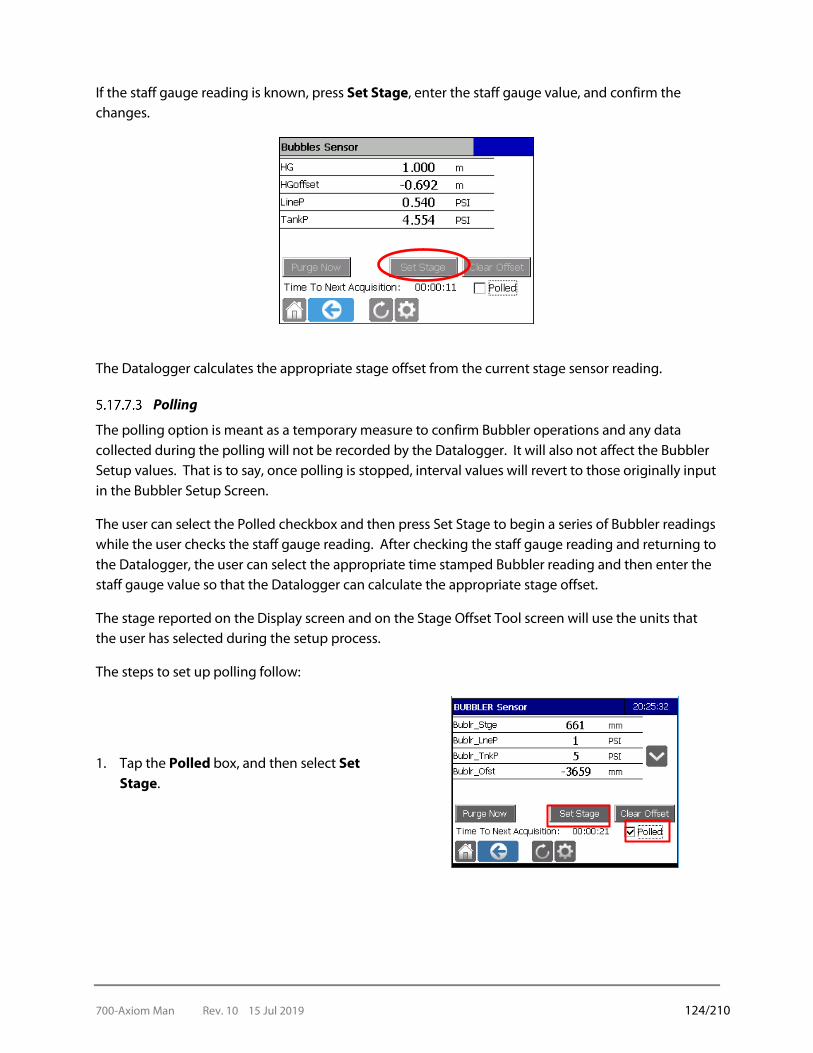
700-Axiom Man Rev. 10 15 Jul 2019 124/210
If the staff gauge reading is known, press Set Stage, enter the staff gauge value, and confirm the changes.
The Datalogger calculates the appropriate stage offset from the current stage sensor reading.
Polling
The polling option is meant as a temporary measure to confirm Bubbler operations and any data collected during the polling will not be recorded by the Datalogger. It will also not affect the Bubbler Setup values. That is to say, once polling is stopped, interval values will revert to those originally input in the Bubbler Setup Screen.
The user can select the Polled checkbox and then press Set Stage to begin a series of Bubbler readings while the user checks the staff gauge reading. After checking the staff gauge reading and returning to the Datalogger, the user can select the appropriate time stamped Bubbler reading and then enter the staff gauge value so that the Datalogger can calculate the appropriate stage offset.
The stage reported on the Display screen and on the Stage Offset Tool screen will use the units that the user has selected during the setup process.
The steps to set up polling follow:
1. Tap the Polled box, and then select Set Stage.
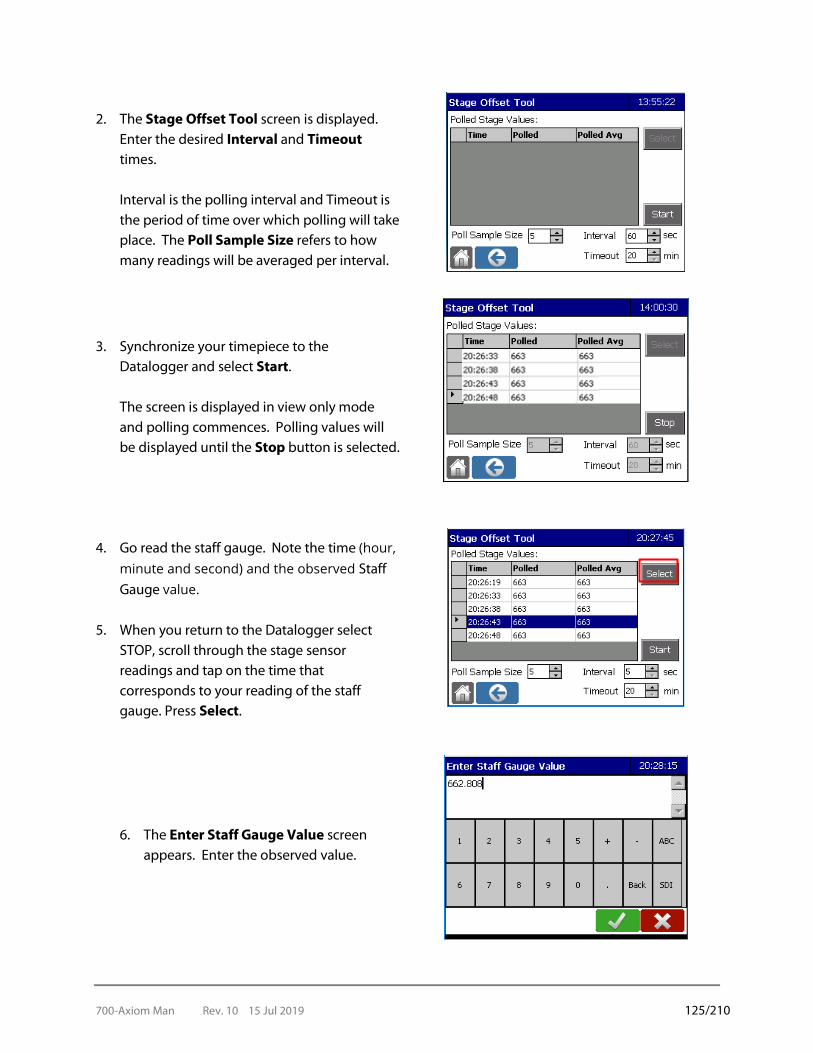
700-Axiom Man Rev. 10 15 Jul 2019 125/210
2. The Stage Offset Tool screen is displayed. Enter the desired Interval and Timeout times. Interval is the polling interval and Timeout is the period of time over which polling will take place. The Poll Sample Size refers to how many readings will be averaged per interval.
3. Synchronize your timepiece to the Datalogger and select Start. The screen is displayed in view only mode and polling commences. Polling values will be displayed until the Stop button is selected.
4. Go read the staff gauge. Note the time (hour, minute and second) and the observed Staff Gauge value.
5. When you return to the Datalogger select STOP, scroll through the stage sensor readings and tap on the time that corresponds to your reading of the staff gauge. Press Select.
6. The Enter Staff Gauge Value screen appears. Enter the observed value.
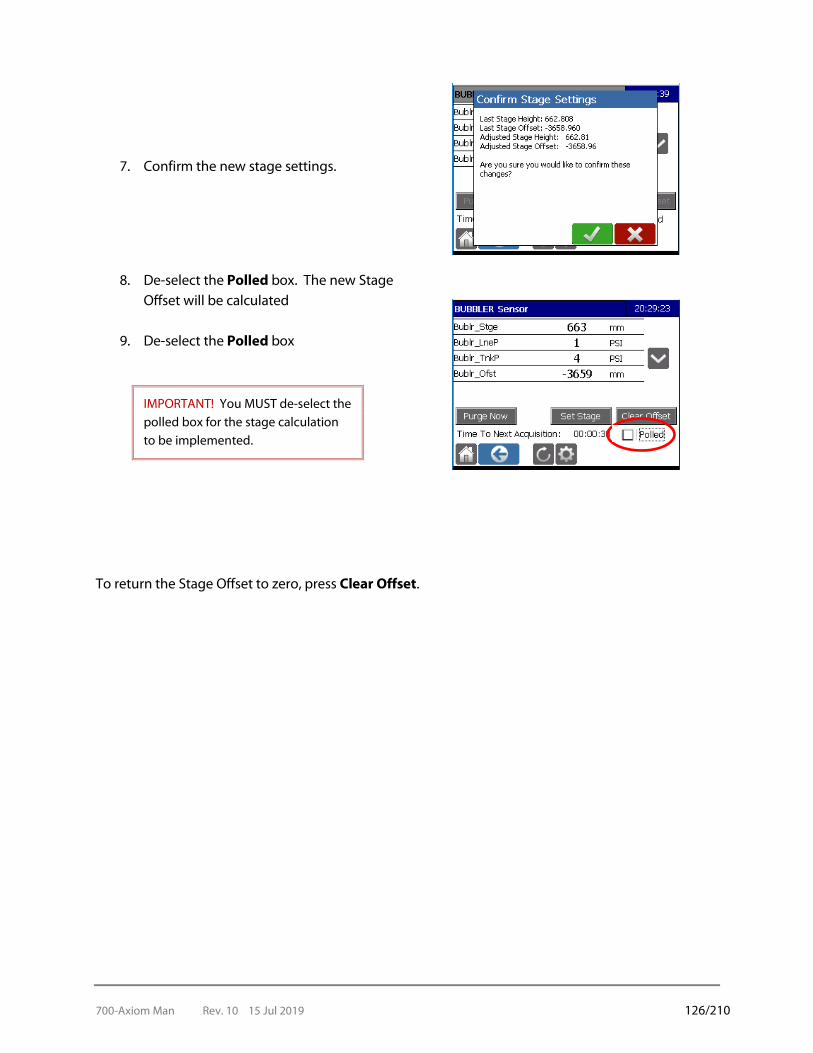
700-Axiom Man Rev. 10 15 Jul 2019 126/210
7. Confirm the new stage settings.
8. De-select the Polled box. The new Stage Offset will be calculated
9. De-select the Polled box
IMPORTANT! You MUST de-select the polled box for the stage calculation to be implemented.
To return the Stage Offset to zero, press Clear Offset.

700-Axiom Man Rev. 10 15 Jul 2019 127/210
5.18 SDI-THS SENSOR EXTENSION
This extension is for use with the FTS SDI-THS (Temperature and Humidity Sensor, Temperature sensor, or Fuel Stick). Figure 5-77 shows the SDI-THS Sensor Setup screen (Sensor tab) with default Sensor Name settings. Refer to the sensor’s operating manual for sensor command and data details.
Figure 5-77
5.18.1 SENSOR TAB
The Sensor tab contains basic information about the sensor. Sensor Name: The default name for the sensor is THS. You can change this if desired.
Active: This box must be checked in order for the sensor to collect data
Address: Displays the sensor’s address once it is defined and mapped
Sensor Model: Select the model from the drop down menu
THS = temperature and humidity sensor
TS = temperature sensor
FS = fuel stick
5.18.2 SETUP SCREEN
This screen displays the three data points measured (Temperature, Dew Point, and Humidity) with their default variable names displayed (ATC,DTC, and RH). The names can be changed if desired.
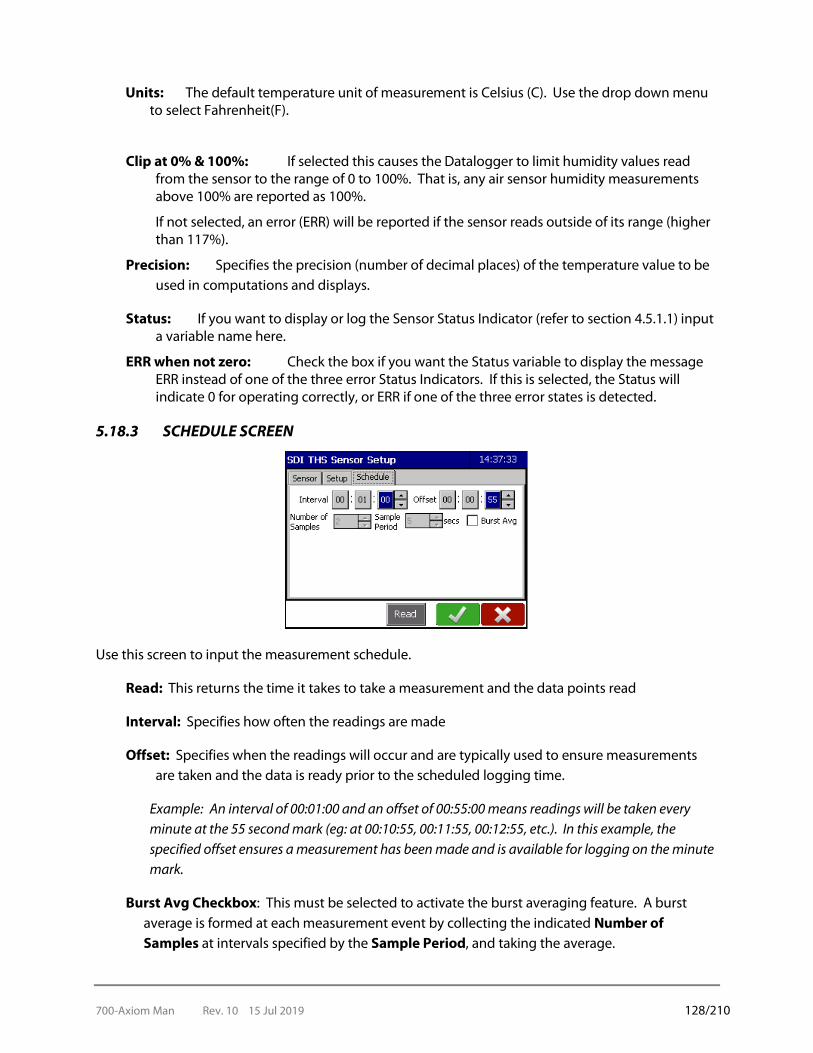
700-Axiom Man Rev. 10 15 Jul 2019 128/210
Units: The default temperature unit of measurement is Celsius (C). Use the drop down menu to select Fahrenheit(F).
Clip at 0% & 100%: If selected this causes the Datalogger to limit humidity values read from the sensor to the range of 0 to 100%. That is, any air sensor humidity measurements above 100% are reported as 100%.
If not selected, an error (ERR) will be reported if the sensor reads outside of its range (higher than 117%).
Precision: Specifies the precision (number of decimal places) of the temperature value to be used in computations and displays.
Status: If you want to display or log the Sensor Status Indicator (refer to section 4.5.1.1) input a variable name here.
ERR when not zero: Check the box if you want the Status variable to display the message ERR instead of one of the three error Status Indicators. If this is selected, the Status will indicate 0 for operating correctly, or ERR if one of the three error states is detected.
5.18.3 SCHEDULE SCREEN
Use this screen to input the measurement schedule.
Read: This returns the time it takes to take a measurement and the data points read
Interval: Specifies how often the readings are made
Offset: Specifies when the readings will occur and are typically used to ensure measurements are taken and the data is ready prior to the scheduled logging time.
Example: An interval of 00:01:00 and an offset of 00:55:00 means readings will be taken every minute at the 55 second mark (eg: at 00:10:55, 00:11:55, 00:12:55, etc.). In this example, the specified offset ensures a measurement has been made and is available for logging on the minute mark.
Burst Avg Checkbox: This must be selected to activate the burst averaging feature. A burst average is formed at each measurement event by collecting the indicated Number of Samples at intervals specified by the Sample Period, and taking the average.
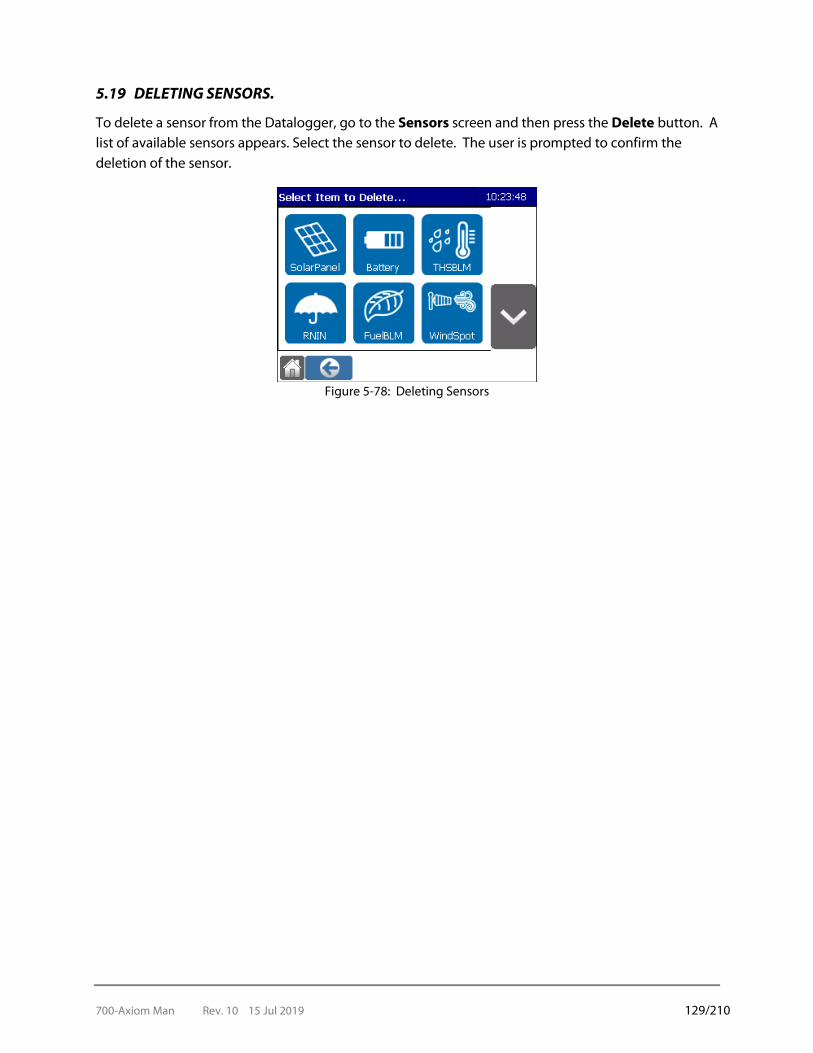
700-Axiom Man Rev. 10 15 Jul 2019 129/210
5.19 DELETING SENSORS.
To delete a sensor from the Datalogger, go to the Sensors screen and then press the Delete button. A list of available sensors appears. Select the sensor to delete. The user is prompted to confirm the deletion of the sensor.
Figure 5-78: Deleting Sensors
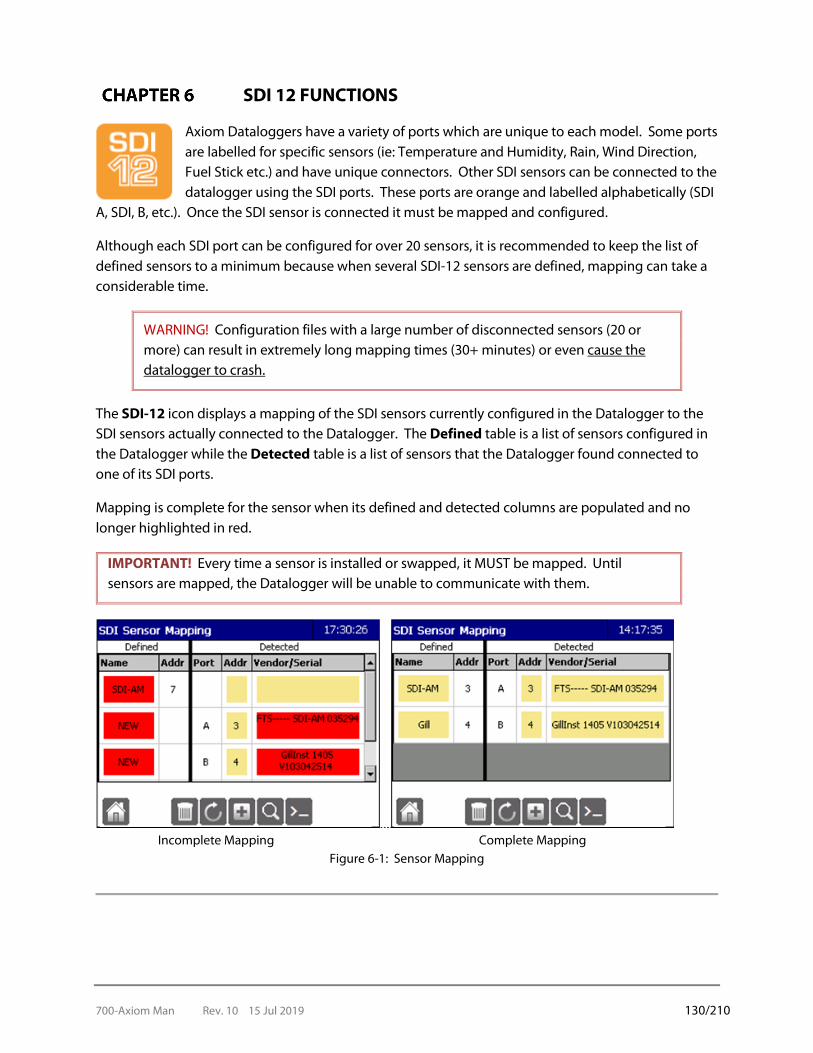
700-Axiom Man Rev. 10 15 Jul 2019 130/210
SDI 12 FUNCTIONS
Axiom Dataloggers have a variety of ports which are unique to each model. Some ports are labelled for specific sensors (ie: Temperature and Humidity, Rain, Wind Direction, Fuel Stick etc.) and have unique connectors. Other SDI sensors can be connected to the datalogger using the SDI ports. These ports are orange and labelled alphabetically (SDI
A, SDI, B, etc.). Once the SDI sensor is connected it must be mapped and configured.
Although each SDI port can be configured for over 20 sensors, it is recommended to keep the list of defined sensors to a minimum because when several SDI-12 sensors are defined, mapping can take a considerable time.
WARNING! Configuration files with a large number of disconnected sensors (20 or more) can result in extremely long mapping times (30+ minutes) or even cause the datalogger to crash.
The SDI-12 icon displays a mapping of the SDI sensors currently configured in the Datalogger to the SDI sensors actually connected to the Datalogger. The Defined table is a list of sensors configured in the Datalogger while the Detected table is a list of sensors that the Datalogger found connected to one of its SDI ports.
Mapping is complete for the sensor when its defined and detected columns are populated and no longer highlighted in red.
IMPORTANT! Every time a sensor is installed or swapped, it MUST be mapped. Until sensors are mapped, the Datalogger will be unable to communicate with them.
Incomplete Mapping Complete Mapping
Figure 6-1: Sensor Mapping

700-Axiom Man Rev. 10 15 Jul 2019 131/210
6.1 DEFINED SENSORS
A sensor is defined once it has been added to the Datalogger, configured and saved. Normally, the sensor is attached and then configured through the Sensors icon (see Chapter 5). A sensor’s configuration can also be saved to the Datalogger without the sensor being attached using the Sensor Setup Screens. A sensor can also be defined through the SDI Sensor Mapping screen. This process is explained in Section 6.4.
IMPORTANT! Each SDI sensor connected to the Datalogger MUST have a unique SDI address.
6.2 DETECTING SDI SENSORS
Once SDI sensors are connected to the Datalogger, press Detect on the SDI Sensor Mapping screen (Home > SDI-12) to begin the sensor mapping process.
Figure 6-2: Detecting Sensors
Detection automatically determines whether SDI sensors are connected. The Datalogger will look for any defined sensor and determine if it is attached or not.
When Detect is pressed, the SDI Detect dialog box appears. Select OK.
Figure 6-3: SDI Detect Dialog
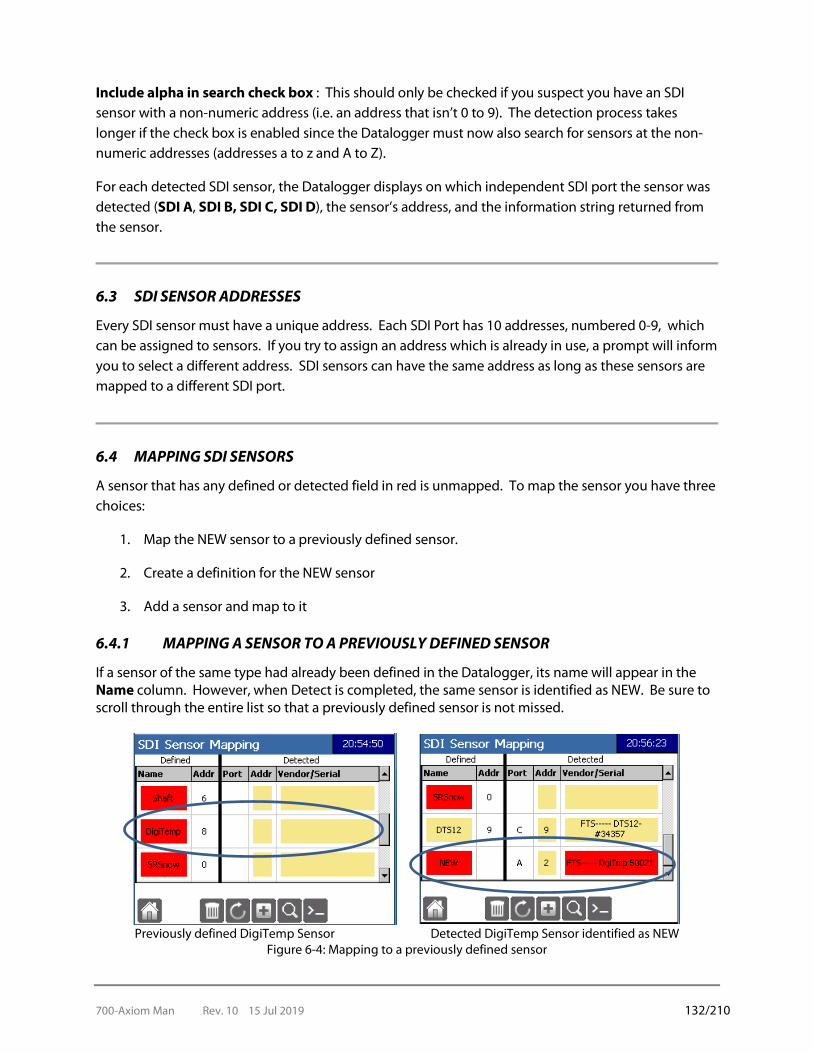
700-Axiom Man Rev. 10 15 Jul 2019 132/210
Include alpha in search check box : This should only be checked if you suspect you have an SDI sensor with a non-numeric address (i.e. an address that isn’t 0 to 9). The detection process takes longer if the check box is enabled since the Datalogger must now also search for sensors at the non-numeric addresses (addresses a to z and A to Z).
For each detected SDI sensor, the Datalogger displays on which independent SDI port the sensor was detected (SDI A, SDI B, SDI C, SDI D), the sensor’s address, and the information string returned from the sensor.
6.3 SDI SENSOR ADDRESSES
Every SDI sensor must have a unique address. Each SDI Port has 10 addresses, numbered 0-9, which can be assigned to sensors. If you try to assign an address which is already in use, a prompt will inform you to select a different address. SDI sensors can have the same address as long as these sensors are mapped to a different SDI port.
6.4 MAPPING SDI SENSORS
A sensor that has any defined or detected field in red is unmapped. To map the sensor you have three choices:
1. Map the NEW sensor to a previously defined sensor.
2. Create a definition for the NEW sensor
3. Add a sensor and map to it
6.4.1 MAPPING A SENSOR TO A PREVIOUSLY DEFINED SENSOR
If a sensor of the same type had already been defined in the Datalogger, its name will appear in the Name column. However, when Detect is completed, the same sensor is identified as NEW. Be sure to scroll through the entire list so that a previously defined sensor is not missed.
Previously defined DigiTemp Sensor Detected DigiTemp Sensor identified as NEW
Figure 6-4: Mapping to a previously defined sensor

700-Axiom Man Rev. 10 15 Jul 2019 133/210
For example, in Figure 6-4, a DigiTemp sensor has been previously defined, and a NEW DigiTemp has been detected.
a. Press on the Vendor/Serial field of the detected sensor. The Sensor Mapping dialogue box will appear.
Figure 6-5: Sensor Mapping dialogue box
b. Use the drop down menu to select the sensor (DigiTemp in the example). Select OK.
c. The sensor is mapped.
Figure 6-6: Mapped Sensor
6.4.2 CREATE A DEFINITION FOR A NEW SENSOR
If the Datalogger detects a sensor that was not previously defined, it will identify it as NEW.

700-Axiom Man Rev. 10 15 Jul 2019 134/210
Figure 6-7: Mapping a NEW sensor
a. Click the red NEW box in the defined column. Pressing NEW causes different responses depending on whether the sensor is ‘recognized’ by the Datalogger.
b. The Sensor Setup Screen appears (unique to each sensor). Define the sensor name, address, schedule and any other sensor specific parameters. See Chapter 4 for details Select OK.
Figure 6-8: NEW sensor mapped
c. The NEW Sensor (re-named DTS 12 in step b) is no longer highlighted in red and is mapped.
6.4.3 ADD SENSOR AND MAP TO IT
When there is no associated detected sensor, create a new sensor by selecting the Add button.
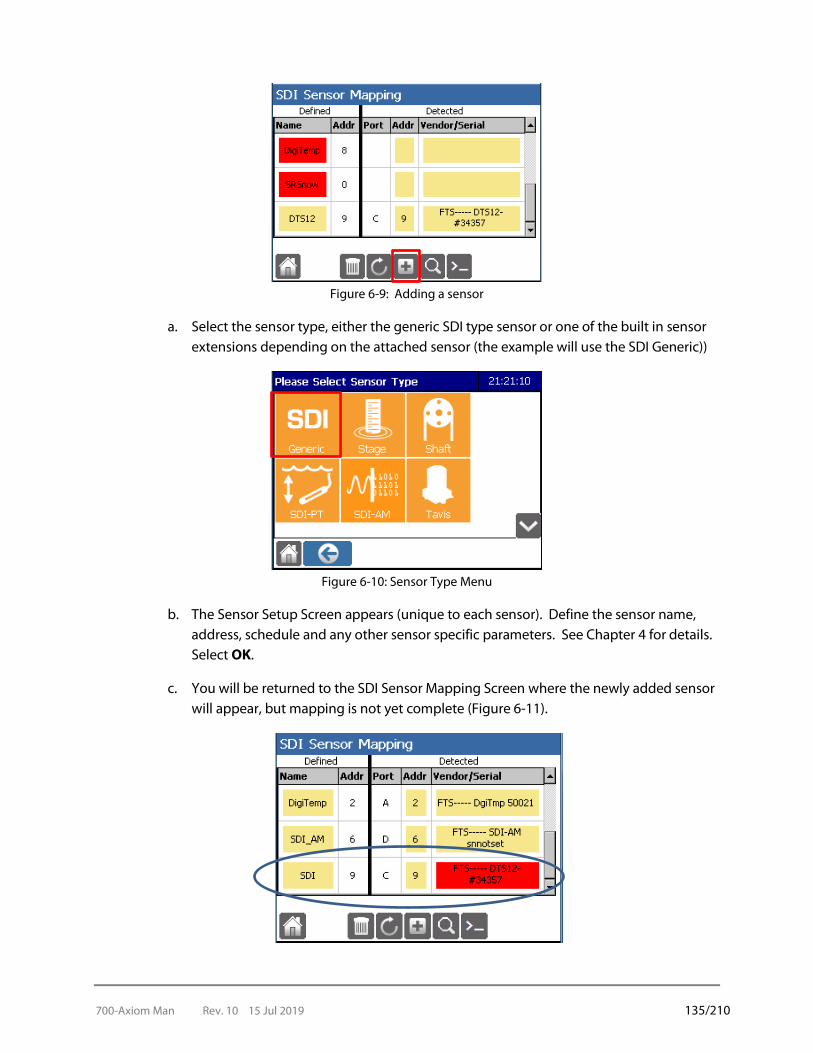
700-Axiom Man Rev. 10 15 Jul 2019 135/210
Figure 6-9: Adding a sensor
a. Select the sensor type, either the generic SDI type sensor or one of the built in sensor extensions depending on the attached sensor (the example will use the SDI Generic))
Figure 6-10: Sensor Type Menu
b. The Sensor Setup Screen appears (unique to each sensor). Define the sensor name, address, schedule and any other sensor specific parameters. See Chapter 4 for details. Select OK.
c. You will be returned to the SDI Sensor Mapping Screen where the newly added sensor will appear, but mapping is not yet complete (Figure 6-11).
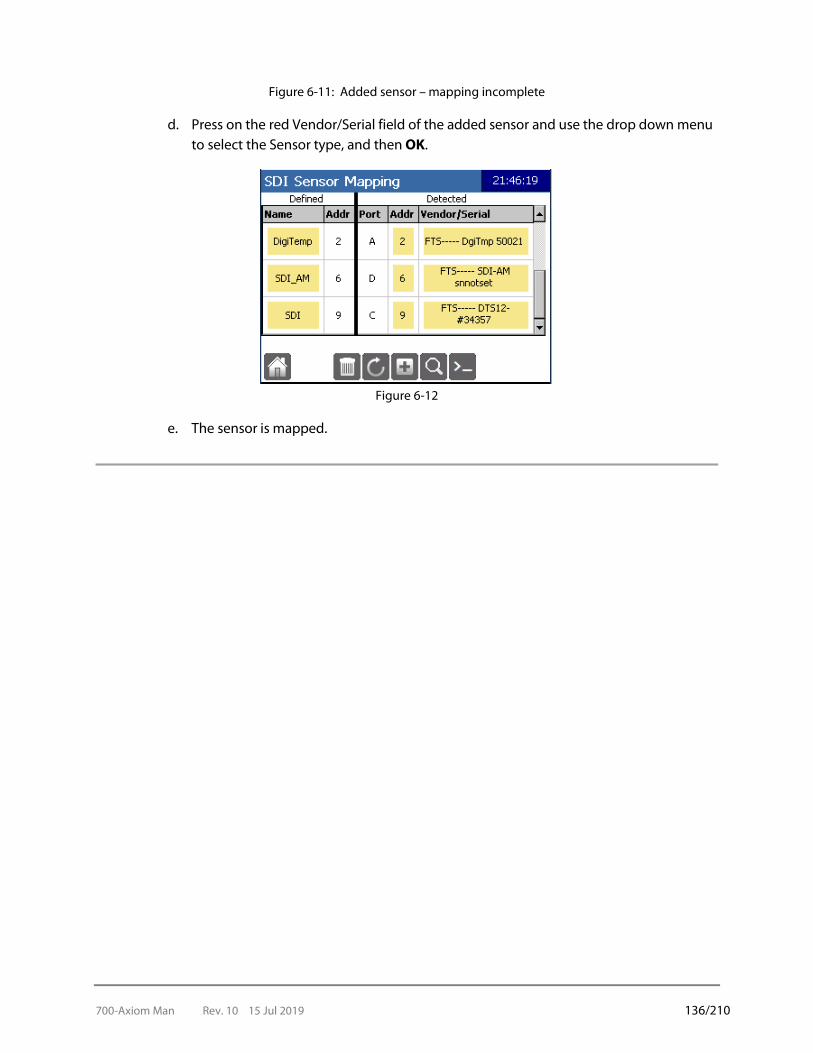
700-Axiom Man Rev. 10 15 Jul 2019 136/210
Figure 6-11: Added sensor – mapping incomplete
d. Press on the red Vendor/Serial field of the added sensor and use the drop down menu to select the Sensor type, and then OK.
Figure 6-12
e. The sensor is mapped.
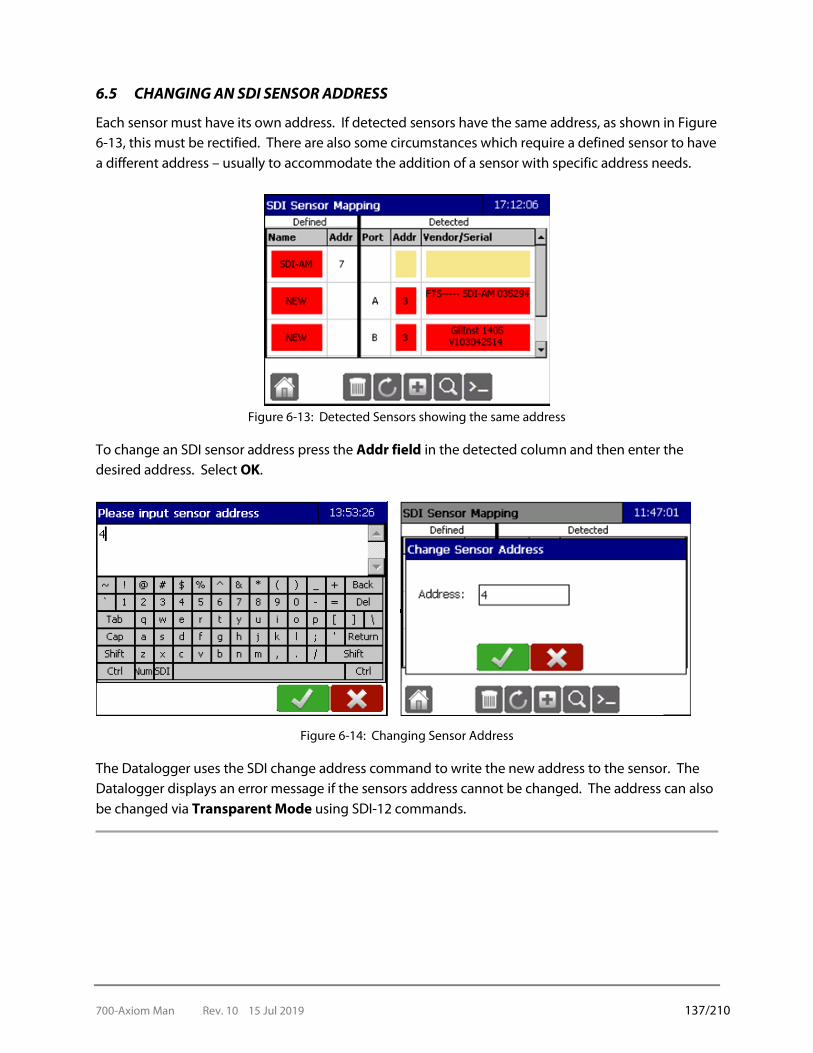
700-Axiom Man Rev. 10 15 Jul 2019 137/210
6.5 CHANGING AN SDI SENSOR ADDRESS
Each sensor must have its own address. If detected sensors have the same address, as shown in Figure 6-13, this must be rectified. There are also some circumstances which require a defined sensor to have a different address – usually to accommodate the addition of a sensor with specific address needs.
Figure 6-13: Detected Sensors showing the same address
To change an SDI sensor address press the Addr field in the detected column and then enter the desired address. Select OK.
Figure 6-14: Changing Sensor Address
The Datalogger uses the SDI change address command to write the new address to the sensor. The Datalogger displays an error message if the sensors address cannot be changed. The address can also be changed via Transparent Mode using SDI-12 commands.
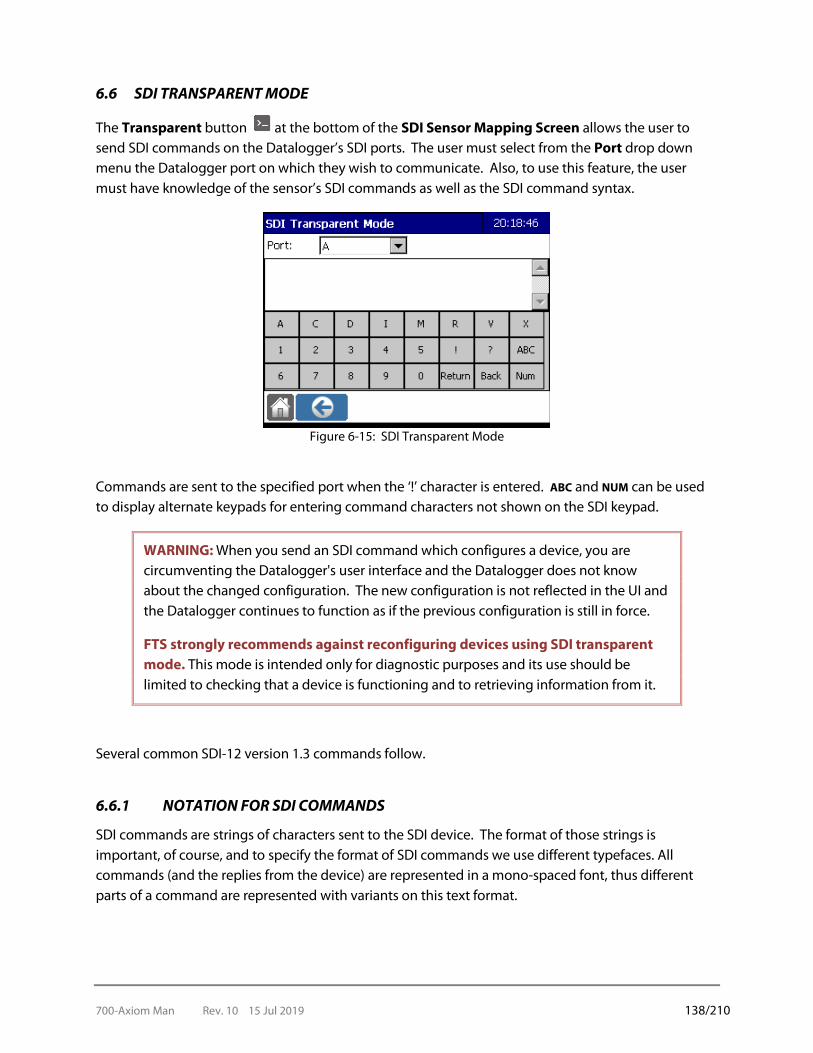
700-Axiom Man Rev. 10 15 Jul 2019 138/210
6.6 SDI TRANSPARENT MODE
The Transparent button at the bottom of the SDI Sensor Mapping Screen allows the user to send SDI commands on the Datalogger’s SDI ports. The user must select from the Port drop down menu the Datalogger port on which they wish to communicate. Also, to use this feature, the user must have knowledge of the sensor’s SDI commands as well as the SDI command syntax.
Figure 6-15: SDI Transparent Mode
Commands are sent to the specified port when the ‘!’ character is entered. ABC and NUM can be used to display alternate keypads for entering command characters not shown on the SDI keypad.
WARNING: When you send an SDI command which configures a device, you are circumventing the Datalogger's user interface and the Datalogger does not know about the changed configuration. The new configuration is not reflected in the UI and the Datalogger continues to function as if the previous configuration is still in force.
FTS strongly recommends against reconfiguring devices using SDI transparent mode. This mode is intended only for diagnostic purposes and its use should be limited to checking that a device is functioning and to retrieving information from it.
Several common SDI-12 version 1.3 commands follow.
6.6.1 NOTATION FOR SDI COMMANDS
SDI commands are strings of characters sent to the SDI device. The format of those strings is important, of course, and to specify the format of SDI commands we use different typefaces. All commands (and the replies from the device) are represented in a mono-spaced font, thus different parts of a command are represented with variants on this text format.
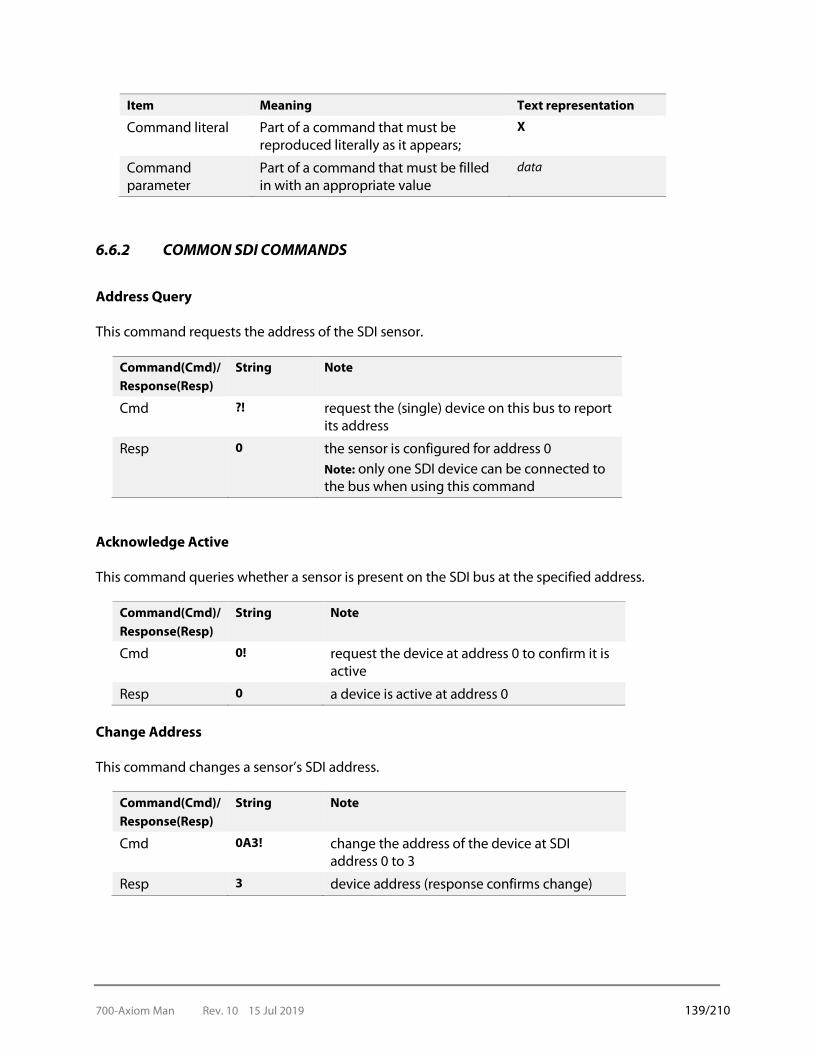
700-Axiom Man Rev. 10 15 Jul 2019 139/210
6.6.2 COMMON SDI COMMANDS
Address Query This command requests the address of the SDI sensor.
Command(Cmd)/ Response(Resp)
String Note
Cmd ?! request the (single) device on this bus to report its address
Resp 0 the sensor is configured for address 0 Note: only one SDI device can be connected to the bus when using this command
Acknowledge Active This command queries whether a sensor is present on the SDI bus at the specified address.
Command(Cmd)/ Response(Resp)
String Note
Cmd 0! request the device at address 0 to confirm it is active
Resp 0 a device is active at address 0 Change Address This command changes a sensor’s SDI address.
Command(Cmd)/ Response(Resp)
String Note
Cmd 0A3! change the address of the device at SDI address 0 to 3
Resp 3 device address (response confirms change)
Item Meaning Text representation
Command literal Part of a command that must be reproduced literally as it appears;
X
Command parameter
Part of a command that must be filled in with an appropriate value
data
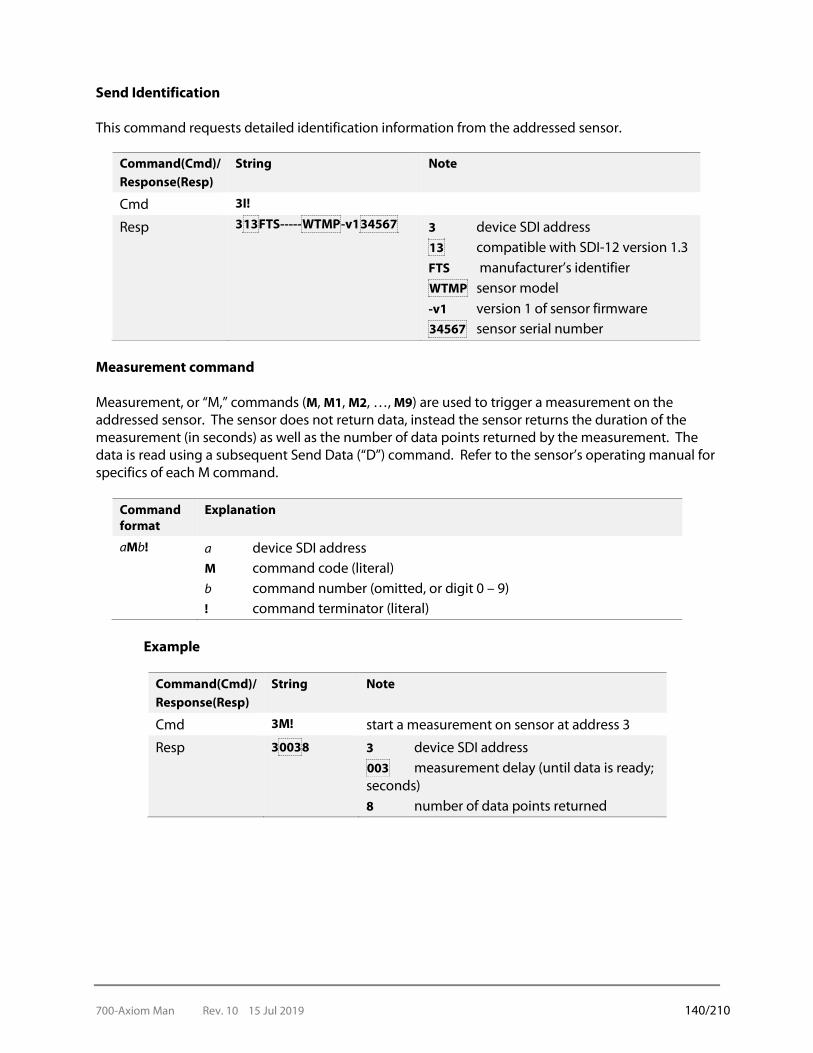
700-Axiom Man Rev. 10 15 Jul 2019 140/210
Send Identification This command requests detailed identification information from the addressed sensor.
Command(Cmd)/ Response(Resp)
String Note
Cmd 3I!
Resp 313FTS-----WTMP-v134567 3 device SDI address 13 compatible with SDI-12 version 1.3 FTS manufacturer’s identifier WTMP sensor model -v1 version 1 of sensor firmware 34567 sensor serial number
Measurement command Measurement, or “M,” commands (M, M1, M2, …, M9) are used to trigger a measurement on the addressed sensor. The sensor does not return data, instead the sensor returns the duration of the measurement (in seconds) as well as the number of data points returned by the measurement. The data is read using a subsequent Send Data (“D”) command. Refer to the sensor’s operating manual for specifics of each M command.
Command format
Explanation
aMb! a device SDI address M command code (literal) b command number (omitted, or digit 0 – 9) ! command terminator (literal)
Example
Command(Cmd)/ Response(Resp)
String Note
Cmd 3M! start a measurement on sensor at address 3
Resp 30038 3 device SDI address 003 measurement delay (until data is ready; seconds) 8 number of data points returned
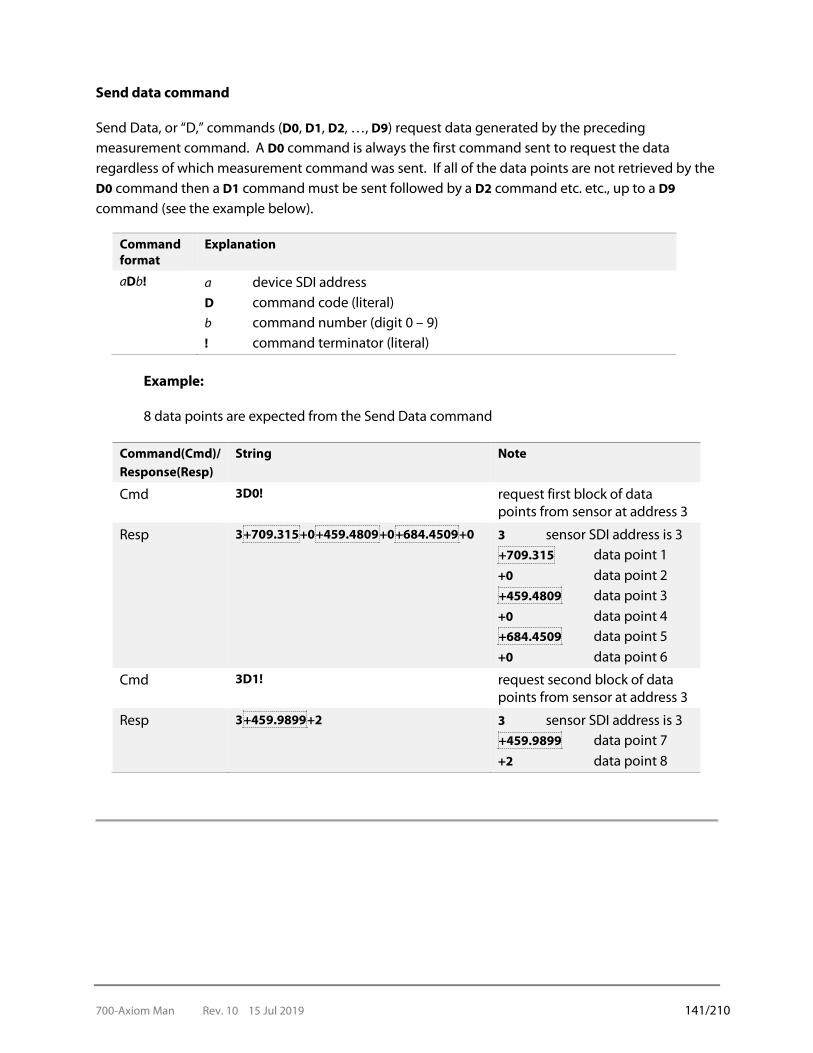
700-Axiom Man Rev. 10 15 Jul 2019 141/210
Send data command Send Data, or “D,” commands (D0, D1, D2, …, D9) request data generated by the preceding measurement command. A D0 command is always the first command sent to request the data regardless of which measurement command was sent. If all of the data points are not retrieved by the D0 command then a D1 command must be sent followed by a D2 command etc. etc., up to a D9 command (see the example below).
Command format
Explanation
aDb! a device SDI address D command code (literal) b command number (digit 0 – 9) ! command terminator (literal)
Example:
8 data points are expected from the Send Data command
Command(Cmd)/ Response(Resp)
String Note
Cmd 3D0! request first block of data points from sensor at address 3
Resp 3+709.315+0+459.4809+0+684.4509+0 3 sensor SDI address is 3 +709.315 data point 1
+0 data point 2 +459.4809 data point 3 +0 data point 4 +684.4509 data point 5 +0 data point 6
Cmd 3D1! request second block of data points from sensor at address 3
Resp 3+459.9899+2 3 sensor SDI address is 3 +459.9899 data point 7
+2 data point 8

700-Axiom Man Rev. 10 15 Jul 2019 142/210
PROCESSES
The Processes icon accesses screens that enable the user to define mathematical calculations and custom scripts to manipulate sensor measurements or other processes. The screenshot below shows the Processes screen for a blank Datalogger (no sensors configured) and the Processes screen for a configured Datalogger. .
Figure 7-1: Processes screens
Pressing the Add button allows the user to configure a new process for the Datalogger. The following Processes are available:
Figure 7-2: Available Processes
The Process icons display the default names. However, once a process is setup, the name will be the same as the name entered Process Name field in the setup screen. Note that all the available processes in Figure 7-2 reflect the default names. A process may have zero, one, or multiple inputs and outputs. In fact, it is possible for a process to have no inputs and no outputs. When configuring a process, the user can override the default output names. If an output name is left blank, then that output will not be available as a data point in the Datalogger.

700-Axiom Man Rev. 10 15 Jul 2019 143/210
When a process is run, the latest available value for a process input is used for the process calculation. Internal and dedicated sensors values are updated every second by the Datalogger so that the last value for these sensors is never more than one second old. However, SDI sensors are only read on their programmed interval.
This means that if an SDI sensor is read less frequently than the process is calculated, the process will be using the same data until a new SDI reading is taken. For example, if an SDI reading is taken every 10 minutes, but the process is calculated every minute, the same input value from that SDI sensor will be used for ten consecutive calcualtions.
7.1 ORDERING PROCESSESS
Processes will be displayed in the screen in the order they were added. However, the order can be arranged as desired.
Press on the Order icon to display the Processes Order screen.
Figure 7-3: Processes Order Screen
Press the Edit Icon then select the Process you wish to move and use the scroll arrows to position it in the list. Do this for all desired Processes. Once the list is ordered as desired, select OK. The Processes and their results will be displayed in that order.
Processes will be ordered as follows:
• Initially, in the same order they are created
• In the order they are assigned by using the Order feature on the Processes screen
• If a new process is added after ordering is complete, it will be added to the top of the Process list and subsequent new processes will be added in sequence after the first new one.
For Example: The Processes Avg, Max Min, and TSampler were created (see picture). Then they were ordered to be Tsampler,Avg, MaxMin,
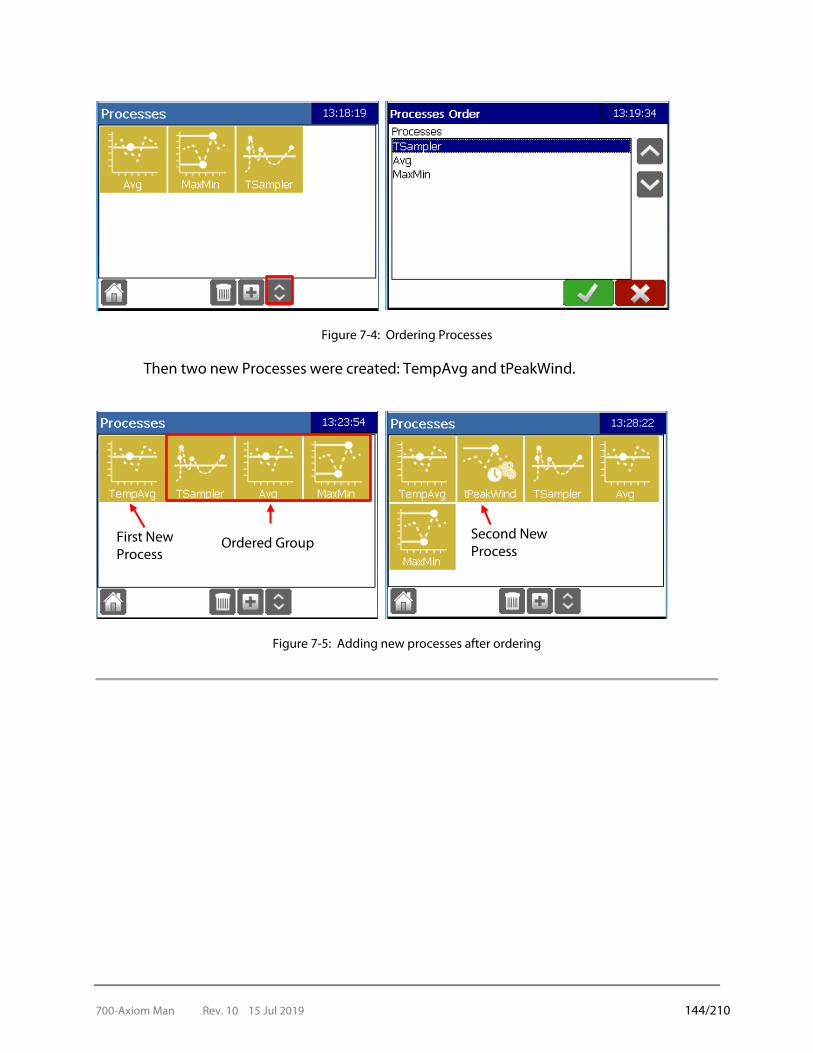
700-Axiom Man Rev. 10 15 Jul 2019 144/210
Figure 7-4: Ordering Processes
Then two new Processes were created: TempAvg and tPeakWind.
Figure 7-5: Adding new processes after ordering
Ordered Group First New Process
Second New Process

700-Axiom Man Rev. 10 15 Jul 2019 145/210
7.2 BUILT-IN DATA POINTS
In addition to data points defined by configuring sensors and processes, Axiom Dataloggers also provide built-in data points that give users access to the current date and time, and geographical information. These can be useful when defining Processes, particularly functions and scripts. These data points are defined as follows:
If the Datalogger is operating with a G6 transmitter, the following additional built-in data points will be available:
M Data point name Description
t_dd Day of month
t_doy Day of year (Julian calendar)
t_HH Hours (24 hour clock)
t_mm Minutes
T_MM Months
t_ss Seconds
t_TZ UTC time offset (eg. Pacific = -8)
t_yyyy Year
Lat Latitude
Long Longitude
Elev Elevation
M Data point name Description
Serial Number G6 serial number
YB Power Supply during transmission
YF Forward Power
YR Reflected Power
SWR Standing Wave Ratio
VLoad

700-Axiom Man Rev. 10 15 Jul 2019 146/210
7.3 RESTRICTIONS ON PROCESS (DATA POINT) NAMES
The same restrictions that apply to sensor data point names apply to process data point names. These names must conform to the following rules:
• The name must contain only upper or lowercase letters, digits, or the underscore character ("_").
• There can be no spaces. • The name must start with a letter. • The name cannot be any of the following reserved names (reserved names are case sensitive):
o ABS o ACOS o ASIN o AT o ATAN o CMD o COS o Elev o ELSE o ERR o EXP o FRAC
o IF o INT o LN o Lat Long o MAX o MIN o MOD o PI o POW o SIN o SQRT
o SteinhC o SWR o t_DySince o t_DySYr o t_HrSince o t_HrSYr o t_IsLeap o t_MnSince o t_MnSYr o t_SeSince o TAN
o t_dd o t_doy o t_HH o t_mm o t_MM o t_ss o t_TZ o t_yyyy o YB o YF o YR
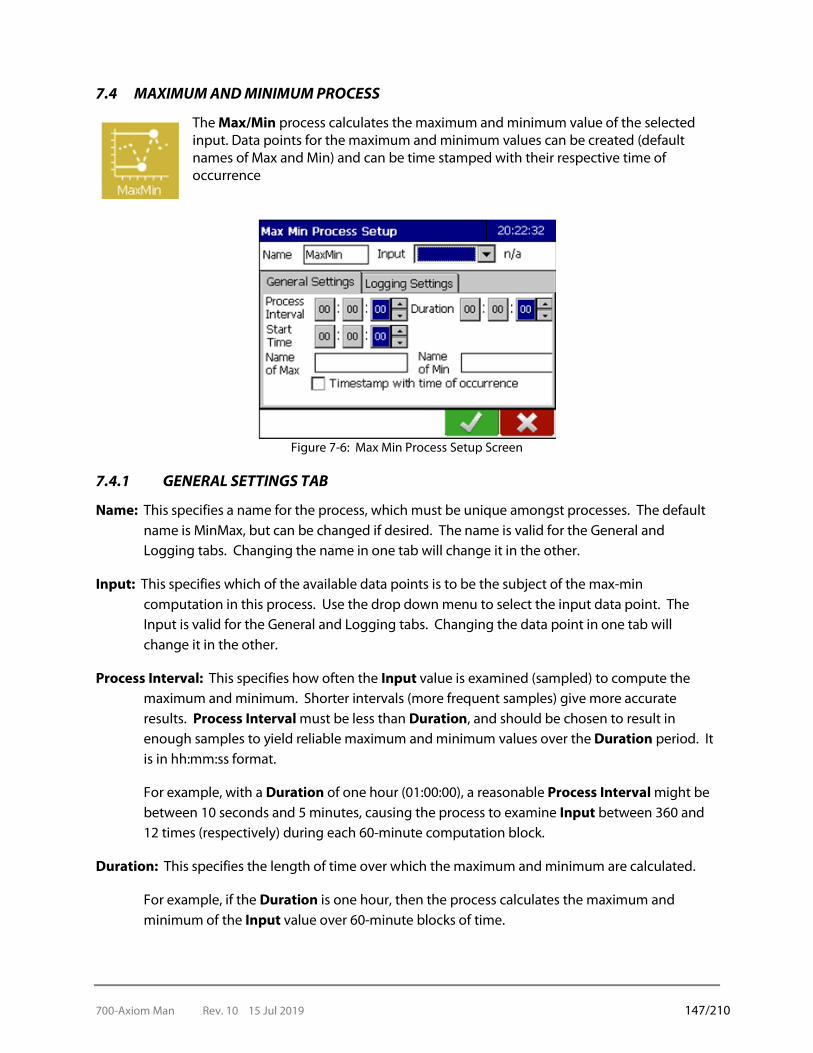
700-Axiom Man Rev. 10 15 Jul 2019 147/210
7.4 MAXIMUM AND MINIMUM PROCESS
The Max/Min process calculates the maximum and minimum value of the selected input. Data points for the maximum and minimum values can be created (default names of Max and Min) and can be time stamped with their respective time of occurrence
Figure 7-6: Max Min Process Setup Screen
7.4.1 GENERAL SETTINGS TAB
Name: This specifies a name for the process, which must be unique amongst processes. The default name is MinMax, but can be changed if desired. The name is valid for the General and Logging tabs. Changing the name in one tab will change it in the other.
Input: This specifies which of the available data points is to be the subject of the max-min computation in this process. Use the drop down menu to select the input data point. The Input is valid for the General and Logging tabs. Changing the data point in one tab will change it in the other.
Process Interval: This specifies how often the Input value is examined (sampled) to compute the maximum and minimum. Shorter intervals (more frequent samples) give more accurate results. Process Interval must be less than Duration, and should be chosen to result in enough samples to yield reliable maximum and minimum values over the Duration period. It is in hh:mm:ss format.
For example, with a Duration of one hour (01:00:00), a reasonable Process Interval might be between 10 seconds and 5 minutes, causing the process to examine Input between 360 and 12 times (respectively) during each 60-minute computation block.
Duration: This specifies the length of time over which the maximum and minimum are calculated.
For example, if the Duration is one hour, then the process calculates the maximum and minimum of the Input value over 60-minute blocks of time.
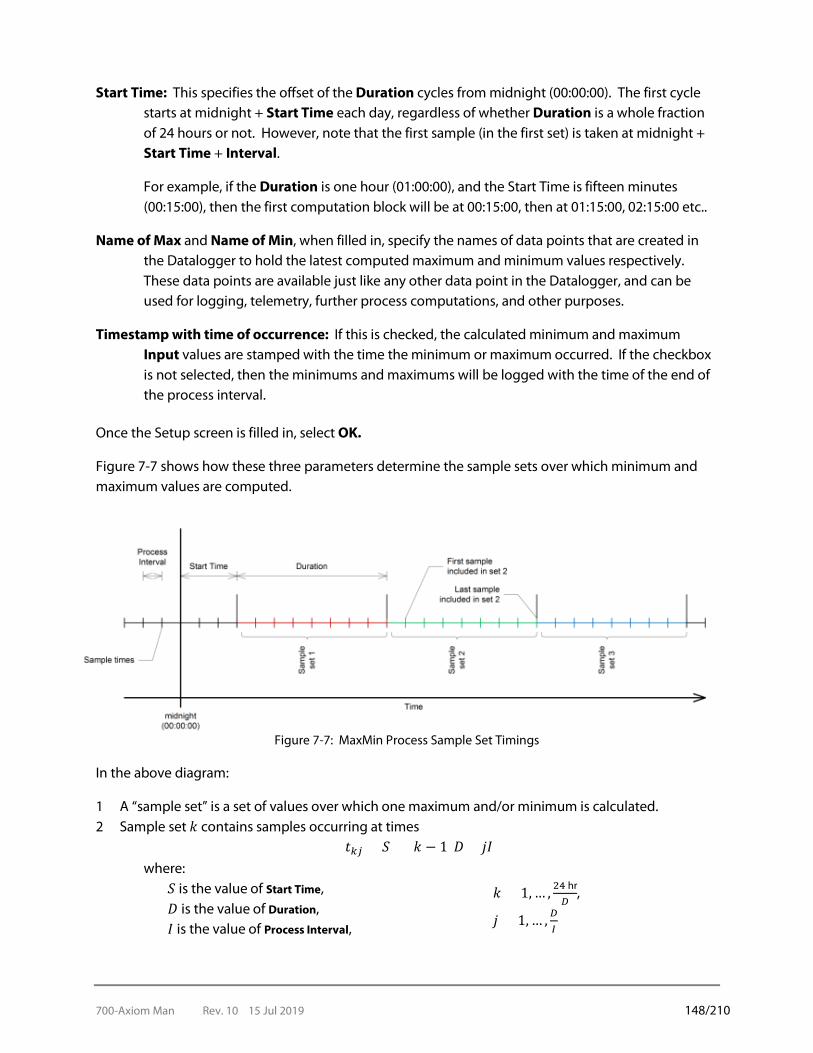
700-Axiom Man Rev. 10 15 Jul 2019 148/210
Start Time: This specifies the offset of the Duration cycles from midnight (00:00:00). The first cycle starts at midnight + Start Time each day, regardless of whether Duration is a whole fraction of 24 hours or not. However, note that the first sample (in the first set) is taken at midnight + Start Time + Interval.
For example, if the Duration is one hour (01:00:00), and the Start Time is fifteen minutes (00:15:00), then the first computation block will be at 00:15:00, then at 01:15:00, 02:15:00 etc..
Name of Max and Name of Min, when filled in, specify the names of data points that are created in the Datalogger to hold the latest computed maximum and minimum values respectively. These data points are available just like any other data point in the Datalogger, and can be used for logging, telemetry, further process computations, and other purposes.
Timestamp with time of occurrence: If this is checked, the calculated minimum and maximum Input values are stamped with the time the minimum or maximum occurred. If the checkbox is not selected, then the minimums and maximums will be logged with the time of the end of the process interval.
Once the Setup screen is filled in, select OK.
Figure 7-7 shows how these three parameters determine the sample sets over which minimum and maximum values are computed.
Figure 7-7: MaxMin Process Sample Set Timings
In the above diagram:
1 A “sample set” is a set of values over which one maximum and/or minimum is calculated. 2 Sample set 𝑘𝑘 contains samples occurring at times
𝑂𝑂𝑘𝑘𝑘𝑘 = 𝑆𝑆 + (𝑘𝑘 − 1)𝐷𝐷 + 𝑗𝑗𝐼𝐼 where:
𝑆𝑆 is the value of Start Time, 𝐷𝐷 is the value of Duration, 𝐼𝐼 is the value of Process Interval,
𝑘𝑘 = 1, … , 24 hr𝐷𝐷
,
𝑗𝑗 = 1, … , 𝐷𝐷𝐼𝐼
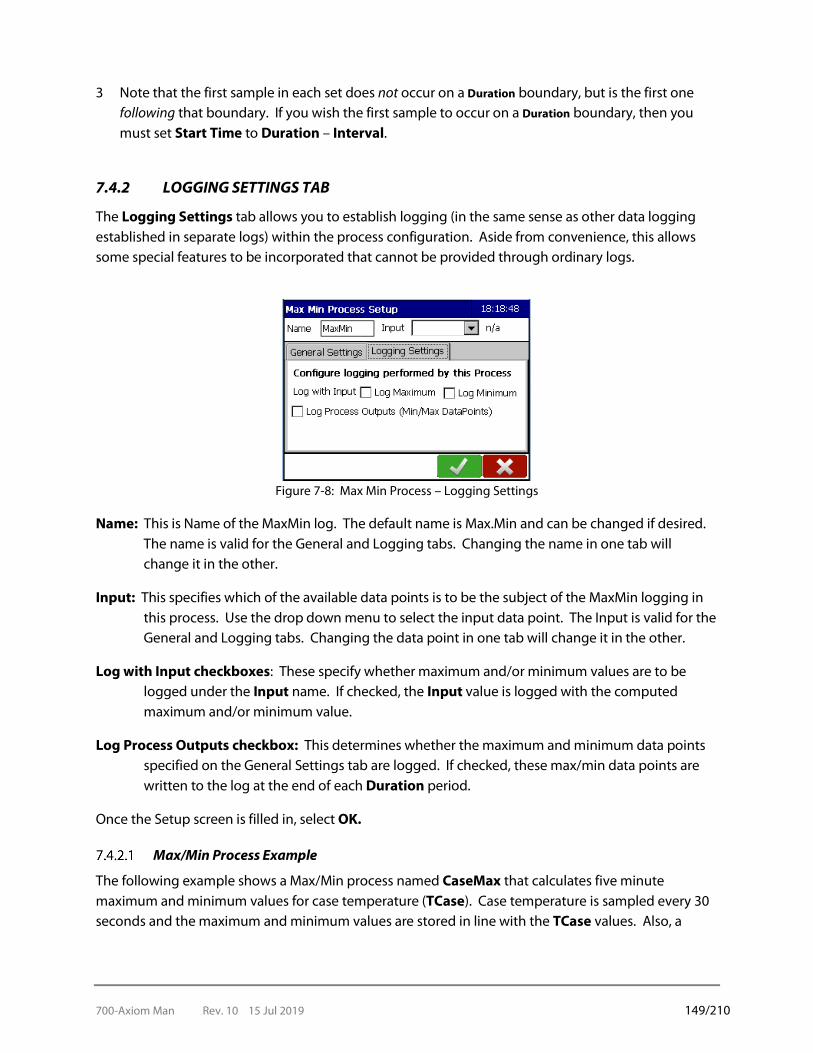
700-Axiom Man Rev. 10 15 Jul 2019 149/210
3 Note that the first sample in each set does not occur on a Duration boundary, but is the first one following that boundary. If you wish the first sample to occur on a Duration boundary, then you must set Start Time to Duration – Interval.
7.4.2 LOGGING SETTINGS TAB
The Logging Settings tab allows you to establish logging (in the same sense as other data logging established in separate logs) within the process configuration. Aside from convenience, this allows some special features to be incorporated that cannot be provided through ordinary logs.
Figure 7-8: Max Min Process – Logging Settings
Name: This is Name of the MaxMin log. The default name is Max.Min and can be changed if desired. The name is valid for the General and Logging tabs. Changing the name in one tab will change it in the other.
Input: This specifies which of the available data points is to be the subject of the MaxMin logging in this process. Use the drop down menu to select the input data point. The Input is valid for the General and Logging tabs. Changing the data point in one tab will change it in the other.
Log with Input checkboxes: These specify whether maximum and/or minimum values are to be logged under the Input name. If checked, the Input value is logged with the computed maximum and/or minimum value.
Log Process Outputs checkbox: This determines whether the maximum and minimum data points specified on the General Settings tab are logged. If checked, these max/min data points are written to the log at the end of each Duration period.
Once the Setup screen is filled in, select OK.
Max/Min Process Example
The following example shows a Max/Min process named CaseMax that calculates five minute maximum and minimum values for case temperature (TCase). Case temperature is sampled every 30 seconds and the maximum and minimum values are stored in line with the TCase values. Also, a

700-Axiom Man Rev. 10 15 Jul 2019 150/210
maximum case temperature data point (TCmax) is created and logged at the time of occurrence during the process interval. TCase is logged every minute for the sample output data shown.
Figure 7-9: Max Min Process Example
Time TCase TCMax 10:05:00 22.4
10:04:30 22.6 22.6 inline logged max & logged at time of occurrence
10:04:00 22.5
10:03:00 22.4
10:02:30 22.2 inline logged min
10:02:00 22.3
10:01:00 22.4

700-Axiom Man Rev. 10 15 Jul 2019 151/210
7.5 PEAK WIND PROCESSES
The Peak Wind processes calculate the maximum wind speed and capture the corresponding wind direction.
There are two types of Peak Wind processes: Timed Peak Wind and Running Peak Wind. The difference between these two is that the
Timed Peak Wind process is reset at the end of every period whereas the Running Peak Wind process uses a running “window” which discards old values to make room for new, but is never reset.
For example:
WS is the current wind speed read from the sensor, TPeak is the Timed Peak Process results and RPeak is the Running Peak Process results. TPeak resets every 20 seconds. RPeak has a window size of five samples. Both processes run every five seconds.
Time WS TPeak RPeak
10:00:00 0.7 0.7 0.7
10:00:05 0.6 0.7 0.7
10:00:10 0.74 0.74 0.74 First Peak
10:00:15 0.5 0.74 0.74
10:00:20 0.63 0.74 0.74 TPeak Reset occurs (after sample is taken )
10:00:25 0.4 0.4 0.74 TPeak is calculated only using 10:00:25; RPeak is now calculated on 10:00:05 to :25
10:00:30 0.44 0.44 0.74 RPeak is now calculated on :10 to :30
10:00:35 0.35 0.44 0.63 RPeak is now calculated on :15 to :35, so :20 is the new Peak.
NOTE: The Average process is a running average (is never reset), so it is recommended that the Running Peak Wind process be used in conjunction with the Average of Wind Speed.

700-Axiom Man Rev. 10 15 Jul 2019 152/210
7.6 TIMED PEAK WIND PROCESS
The Timed Peak Wind process calculates the maximum wind speed direction over a fixed duration of time and captures the corresponding wind.
If desired, data points for the Peak Speed and Peak Direction can be created (default names of tPeakSpeed and tPeakDirection).
The user must select the desired input and specify the input’s Process Interval (i.e., how often the input is read). The user must also specify the Start Time and Duration for the process. The process repeats continuously based on the Start Time and Duration.
Figure 7-10: Peak Process Setup
Process Name: The default name is tPeakWind. This can be changed if desired. Log with Input checkbox: If checked, it enables the peak values to be logged as entries with the
selected input’s data. Speed Input: Use the drop down menu to select the available data point to be used as the speed
input of the Timed PeakWind process. Direction Input: Use the drop down menu to select the available data point to be used in the
direction input of the Timed PeakWind process. Process Interval: This specifies how often the Input value is examined (sampled) to compute the
Peak Wind . Shorter intervals (more frequent samples) give more accurate results. Process Interval must be less than Duration, and should be chosen to result in enough samples to yield reliable maximum and minimum values over the Duration period. It is in hh:mm:ss format.
For example, with a Duration of one hour (01:00:00), a reasonable Process Interval might be between 10 seconds and 5 minutes, causing the process to examine Input between 360 and 12 times (respectively) during each 60-minute computation block.
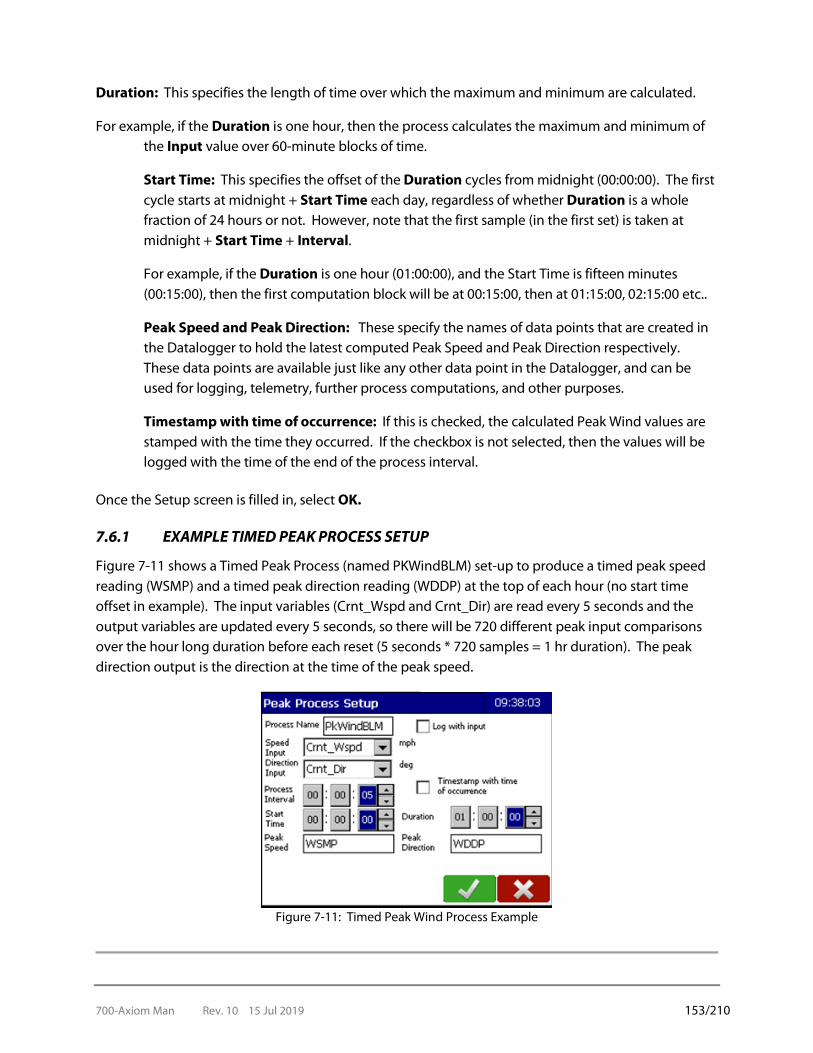
700-Axiom Man Rev. 10 15 Jul 2019 153/210
Duration: This specifies the length of time over which the maximum and minimum are calculated.
For example, if the Duration is one hour, then the process calculates the maximum and minimum of the Input value over 60-minute blocks of time.
Start Time: This specifies the offset of the Duration cycles from midnight (00:00:00). The first cycle starts at midnight + Start Time each day, regardless of whether Duration is a whole fraction of 24 hours or not. However, note that the first sample (in the first set) is taken at midnight + Start Time + Interval.
For example, if the Duration is one hour (01:00:00), and the Start Time is fifteen minutes (00:15:00), then the first computation block will be at 00:15:00, then at 01:15:00, 02:15:00 etc..
Peak Speed and Peak Direction: These specify the names of data points that are created in the Datalogger to hold the latest computed Peak Speed and Peak Direction respectively. These data points are available just like any other data point in the Datalogger, and can be used for logging, telemetry, further process computations, and other purposes.
Timestamp with time of occurrence: If this is checked, the calculated Peak Wind values are stamped with the time they occurred. If the checkbox is not selected, then the values will be logged with the time of the end of the process interval.
Once the Setup screen is filled in, select OK.
7.6.1 EXAMPLE TIMED PEAK PROCESS SETUP
Figure 7-11 shows a Timed Peak Process (named PKWindBLM) set-up to produce a timed peak speed reading (WSMP) and a timed peak direction reading (WDDP) at the top of each hour (no start time offset in example). The input variables (Crnt_Wspd and Crnt_Dir) are read every 5 seconds and the output variables are updated every 5 seconds, so there will be 720 different peak input comparisons over the hour long duration before each reset (5 seconds * 720 samples = 1 hr duration). The peak direction output is the direction at the time of the peak speed.
Figure 7-11: Timed Peak Wind Process Example
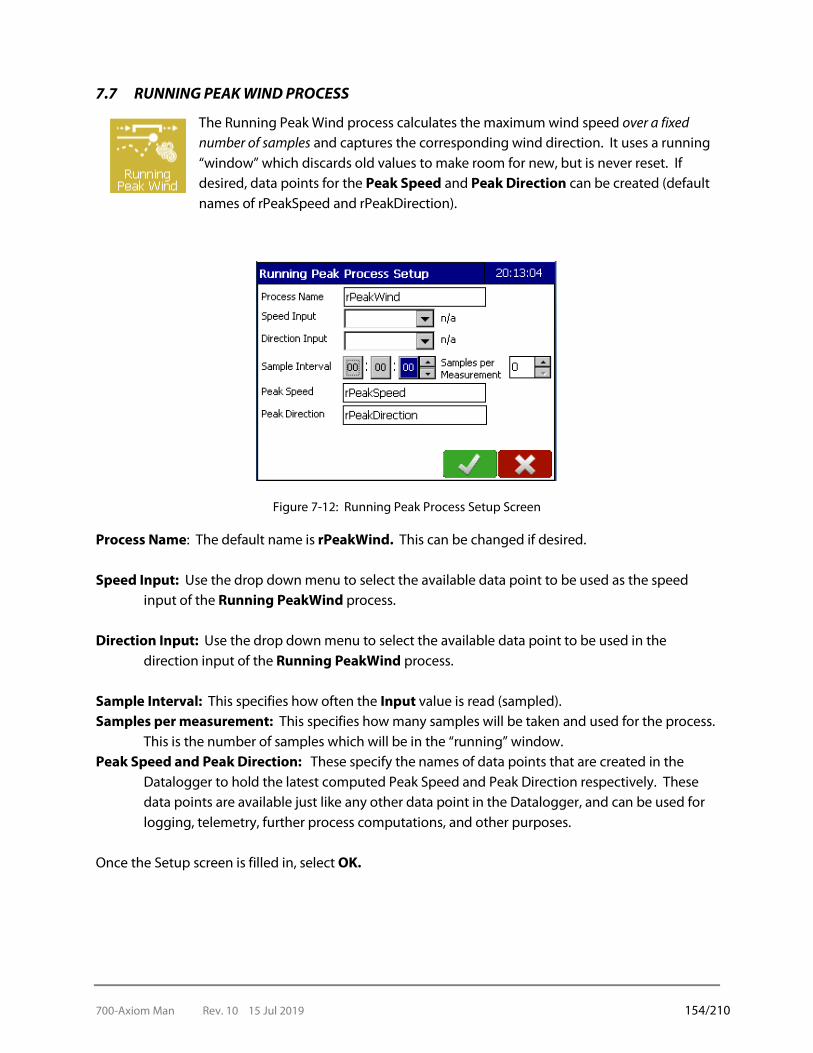
700-Axiom Man Rev. 10 15 Jul 2019 154/210
7.7 RUNNING PEAK WIND PROCESS
The Running Peak Wind process calculates the maximum wind speed over a fixed number of samples and captures the corresponding wind direction. It uses a running “window” which discards old values to make room for new, but is never reset. If desired, data points for the Peak Speed and Peak Direction can be created (default names of rPeakSpeed and rPeakDirection).
Figure 7-12: Running Peak Process Setup Screen
Process Name: The default name is rPeakWind. This can be changed if desired. Speed Input: Use the drop down menu to select the available data point to be used as the speed
input of the Running PeakWind process. Direction Input: Use the drop down menu to select the available data point to be used in the
direction input of the Running PeakWind process. Sample Interval: This specifies how often the Input value is read (sampled). Samples per measurement: This specifies how many samples will be taken and used for the process.
This is the number of samples which will be in the “running” window. Peak Speed and Peak Direction: These specify the names of data points that are created in the
Datalogger to hold the latest computed Peak Speed and Peak Direction respectively. These data points are available just like any other data point in the Datalogger, and can be used for logging, telemetry, further process computations, and other purposes.
Once the Setup screen is filled in, select OK.
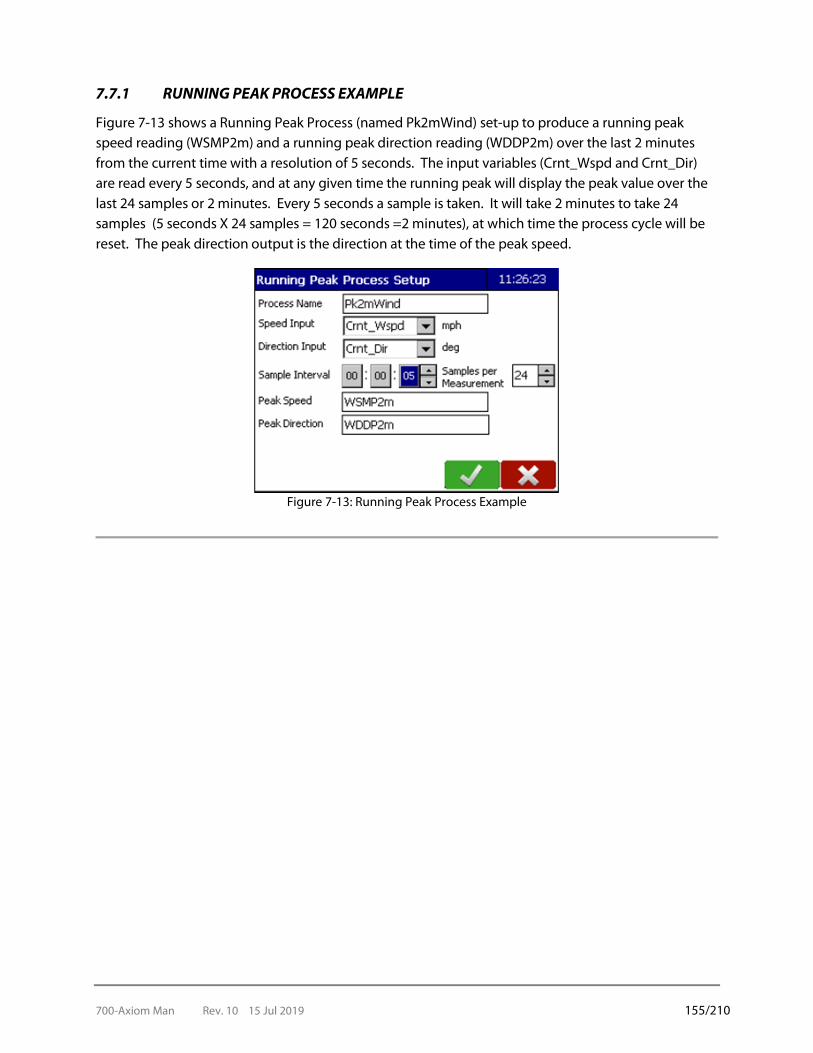
700-Axiom Man Rev. 10 15 Jul 2019 155/210
7.7.1 RUNNING PEAK PROCESS EXAMPLE
Figure 7-13 shows a Running Peak Process (named Pk2mWind) set-up to produce a running peak speed reading (WSMP2m) and a running peak direction reading (WDDP2m) over the last 2 minutes from the current time with a resolution of 5 seconds. The input variables (Crnt_Wspd and Crnt_Dir) are read every 5 seconds, and at any given time the running peak will display the peak value over the last 24 samples or 2 minutes. Every 5 seconds a sample is taken. It will take 2 minutes to take 24 samples (5 seconds X 24 samples = 120 seconds =2 minutes), at which time the process cycle will be reset. The peak direction output is the direction at the time of the peak speed.
Figure 7-13: Running Peak Process Example
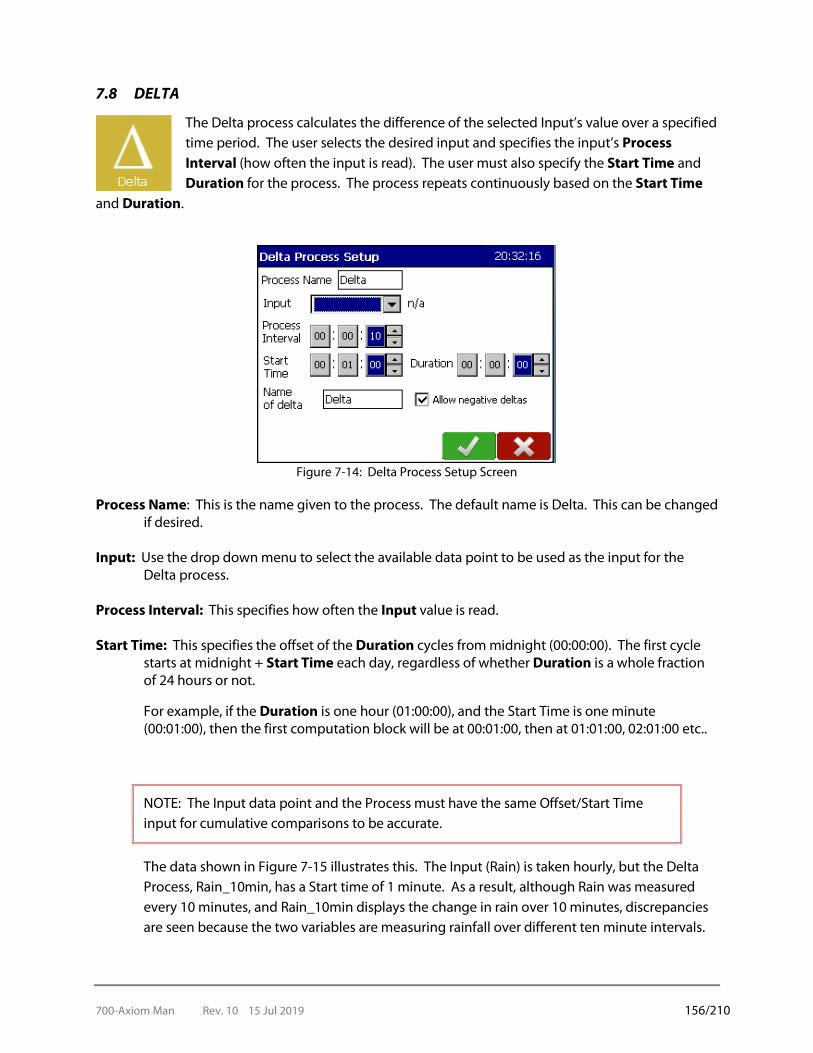
700-Axiom Man Rev. 10 15 Jul 2019 156/210
7.8 DELTA
The Delta process calculates the difference of the selected Input’s value over a specified time period. The user selects the desired input and specifies the input’s Process Interval (how often the input is read). The user must also specify the Start Time and Duration for the process. The process repeats continuously based on the Start Time
and Duration.
Figure 7-14: Delta Process Setup Screen
Process Name: This is the name given to the process. The default name is Delta. This can be changed if desired.
Input: Use the drop down menu to select the available data point to be used as the input for the
Delta process. Process Interval: This specifies how often the Input value is read. Start Time: This specifies the offset of the Duration cycles from midnight (00:00:00). The first cycle
starts at midnight + Start Time each day, regardless of whether Duration is a whole fraction of 24 hours or not.
For example, if the Duration is one hour (01:00:00), and the Start Time is one minute (00:01:00), then the first computation block will be at 00:01:00, then at 01:01:00, 02:01:00 etc..
NOTE: The Input data point and the Process must have the same Offset/Start Time input for cumulative comparisons to be accurate.
The data shown in Figure 7-15 illustrates this. The Input (Rain) is taken hourly, but the Delta Process, Rain_10min, has a Start time of 1 minute. As a result, although Rain was measured every 10 minutes, and Rain_10min displays the change in rain over 10 minutes, discrepancies are seen because the two variables are measuring rainfall over different ten minute intervals.
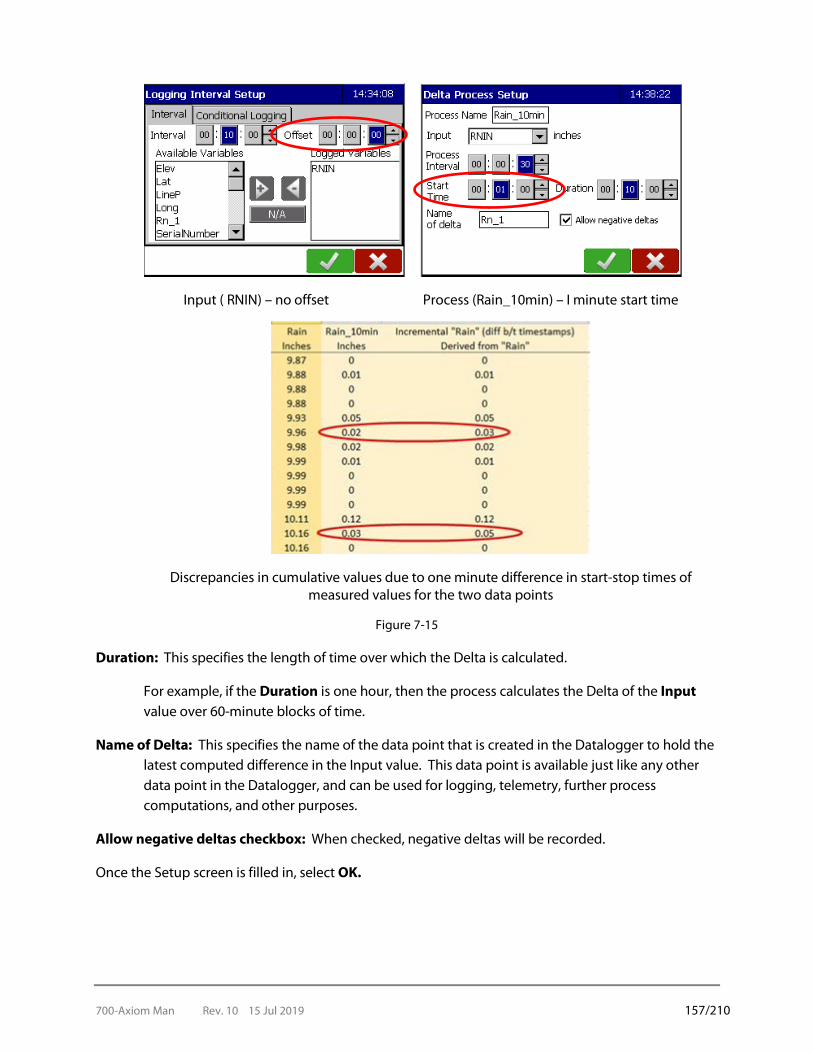
700-Axiom Man Rev. 10 15 Jul 2019 157/210
Input ( RNIN) – no offset Process (Rain_10min) – I minute start time
Discrepancies in cumulative values due to one minute difference in start-stop times of measured values for the two data points
Figure 7-15
Duration: This specifies the length of time over which the Delta is calculated.
For example, if the Duration is one hour, then the process calculates the Delta of the Input value over 60-minute blocks of time.
Name of Delta: This specifies the name of the data point that is created in the Datalogger to hold the latest computed difference in the Input value. This data point is available just like any other data point in the Datalogger, and can be used for logging, telemetry, further process computations, and other purposes.
Allow negative deltas checkbox: When checked, negative deltas will be recorded.
Once the Setup screen is filled in, select OK.
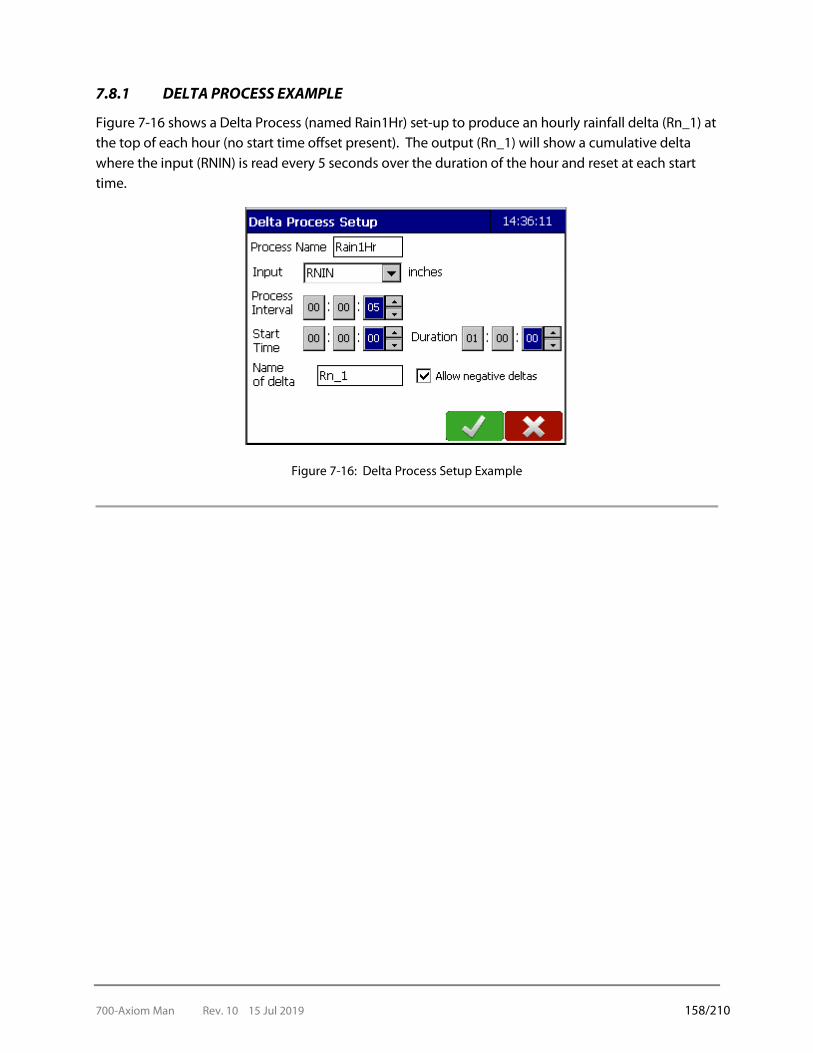
700-Axiom Man Rev. 10 15 Jul 2019 158/210
7.8.1 DELTA PROCESS EXAMPLE
Figure 7-16 shows a Delta Process (named Rain1Hr) set-up to produce an hourly rainfall delta (Rn_1) at the top of each hour (no start time offset present). The output (Rn_1) will show a cumulative delta where the input (RNIN) is read every 5 seconds over the duration of the hour and reset at each start time.
Figure 7-16: Delta Process Setup Example
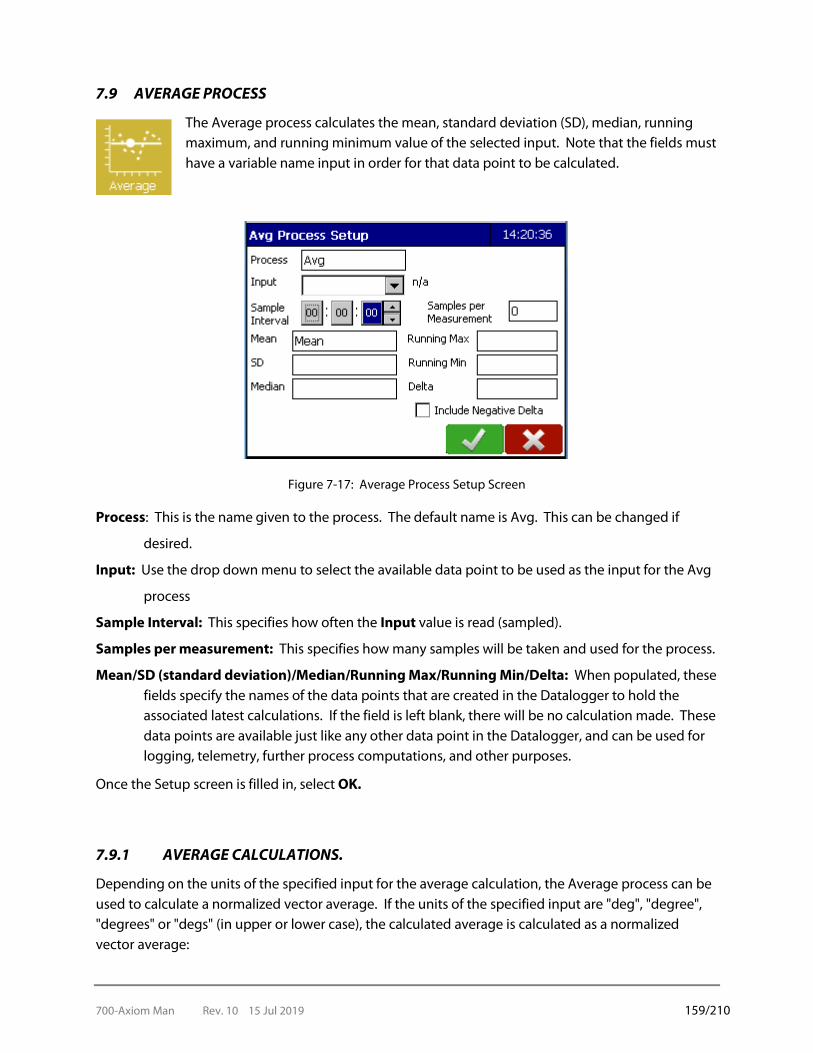
700-Axiom Man Rev. 10 15 Jul 2019 159/210
7.9 AVERAGE PROCESS
The Average process calculates the mean, standard deviation (SD), median, running maximum, and running minimum value of the selected input. Note that the fields must have a variable name input in order for that data point to be calculated.
Figure 7-17: Average Process Setup Screen
Process: This is the name given to the process. The default name is Avg. This can be changed if
desired.
Input: Use the drop down menu to select the available data point to be used as the input for the Avg
process
Sample Interval: This specifies how often the Input value is read (sampled).
Samples per measurement: This specifies how many samples will be taken and used for the process.
Mean/SD (standard deviation)/Median/Running Max/Running Min/Delta: When populated, these fields specify the names of the data points that are created in the Datalogger to hold the associated latest calculations. If the field is left blank, there will be no calculation made. These data points are available just like any other data point in the Datalogger, and can be used for logging, telemetry, further process computations, and other purposes.
Once the Setup screen is filled in, select OK.
7.9.1 AVERAGE CALCULATIONS.
Depending on the units of the specified input for the average calculation, the Average process can be used to calculate a normalized vector average. If the units of the specified input are "deg", "degree", "degrees" or "degs" (in upper or lower case), the calculated average is calculated as a normalized vector average:

700-Axiom Man Rev. 10 15 Jul 2019 160/210
𝑥𝑥𝑖𝑖 = cos�Input𝑖𝑖� , 𝑦𝑦𝑖𝑖 = sin�Input𝑖𝑖� , 𝑀𝑀 = 1, … ,𝑁𝑁
𝑥𝑥� =1𝑁𝑁� 𝑥𝑥𝑖𝑖
𝑁𝑁
1 , 𝑦𝑦� =
1𝑁𝑁� 𝑦𝑦𝑖𝑖
𝑁𝑁
1
normalized vector average = tan−1𝑦𝑦�𝑥𝑥�
This calculation takes the 'north' rollover account if calculating a wind direction average; however, wind speed at the individual wind direction measurements is not accounted for in the average calculation.
To account for wind speed in the vector average, the following definition would be used:
𝑥𝑥𝑖𝑖 = WS𝑖𝑖 cos(WD𝑖𝑖) , 𝑦𝑦𝑖𝑖 = WS𝑖𝑖 sin(WD𝑖𝑖) , 𝑀𝑀 = 1, … ,𝑁𝑁
𝑥𝑥� =1𝑁𝑁� 𝑥𝑥𝑖𝑖
𝑁𝑁
1 , 𝑦𝑦� =
1𝑁𝑁� 𝑦𝑦𝑖𝑖
𝑁𝑁
1
average WS = �𝑥𝑥�2 + 𝑦𝑦�2 , average WD = tan−1𝑦𝑦�𝑥𝑥�
7.9.2 AVERAGE EXAMPLE
Figure 7-17 shows the Average process (named CaseAvg) set-up for a five minute case temperature (TCase) average (TCavg). A TCase sample is taken every 10 seconds. It will take 300 seconds (5 minutes) for 30 samples to be taken (10 seconds X 30 samples = 300 seconds = 5 minutes). Then the process cycle starts again.
Figure 7-18: Average Example
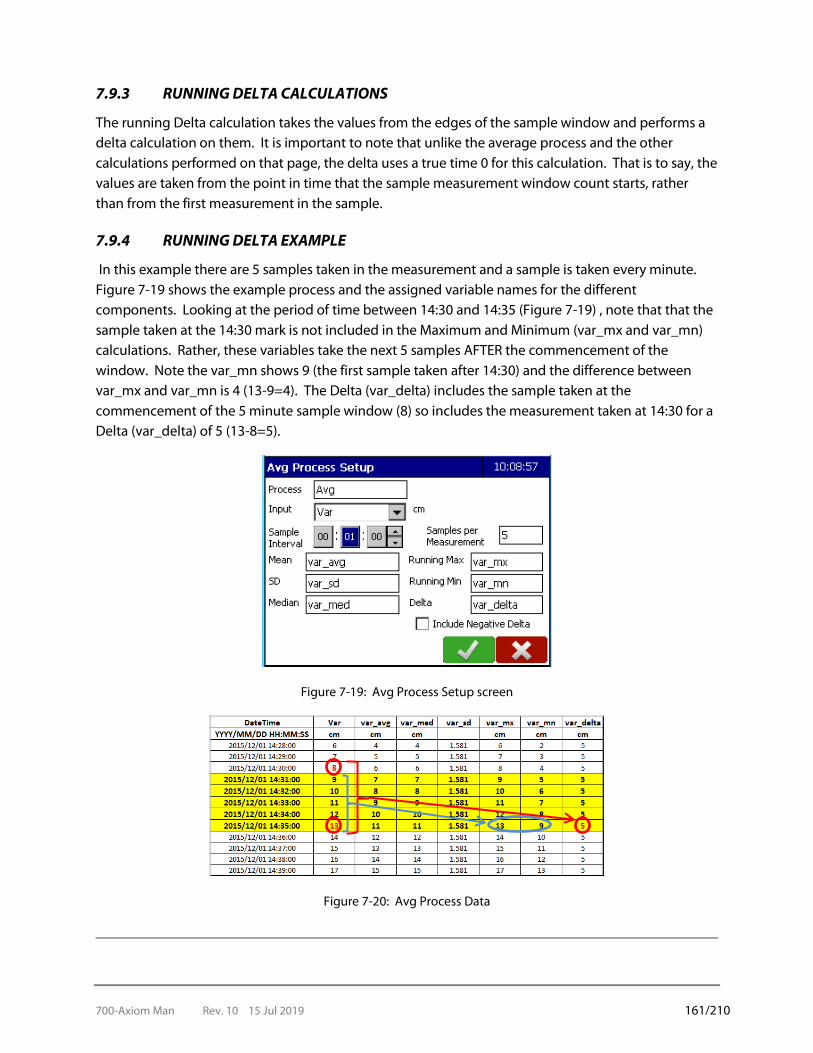
700-Axiom Man Rev. 10 15 Jul 2019 161/210
7.9.3 RUNNING DELTA CALCULATIONS
The running Delta calculation takes the values from the edges of the sample window and performs a delta calculation on them. It is important to note that unlike the average process and the other calculations performed on that page, the delta uses a true time 0 for this calculation. That is to say, the values are taken from the point in time that the sample measurement window count starts, rather than from the first measurement in the sample.
7.9.4 RUNNING DELTA EXAMPLE
In this example there are 5 samples taken in the measurement and a sample is taken every minute. Figure 7-19 shows the example process and the assigned variable names for the different components. Looking at the period of time between 14:30 and 14:35 (Figure 7-19) , note that that the sample taken at the 14:30 mark is not included in the Maximum and Minimum (var_mx and var_mn) calculations. Rather, these variables take the next 5 samples AFTER the commencement of the window. Note the var_mn shows 9 (the first sample taken after 14:30) and the difference between var_mx and var_mn is 4 (13-9=4). The Delta (var_delta) includes the sample taken at the commencement of the 5 minute sample window (8) so includes the measurement taken at 14:30 for a Delta (var_delta) of 5 (13-8=5).
Figure 7-19: Avg Process Setup screen
Figure 7-20: Avg Process Data

700-Axiom Man Rev. 10 15 Jul 2019 162/210
7.10 WEIGHTED AVERAGE PROCESS
The Weighted Average process calculates the sliding average of the selected input.
The weighted average differs from the standard average as follows:
Running Average:
Yn = (yn + yn-1 + … + ym) / N
Where,
- Yn is the next average,
- yn is the new sample,
- yn-1 to ym are previous samples,
- N is the number of samples to be added together.
Weighted Average
Yn = [1 - exp(-3t / T)] x (yn - Ym) + Ym
Where,
- Yn is the next average,
- Ym is the current average,
- t is the sample interval,
- T is the average interval,
- yn is the new sample value.
Figure 7-21: Weighted Average Configuration Form
Process: This is the name given to the process. The default name is WeightedAvg. This can be changed if desired.
Input: Use the drop down menu to select the available data point to be used as the input for the
process. Sample Interval: This specifies how often the Input value is read (sampled).
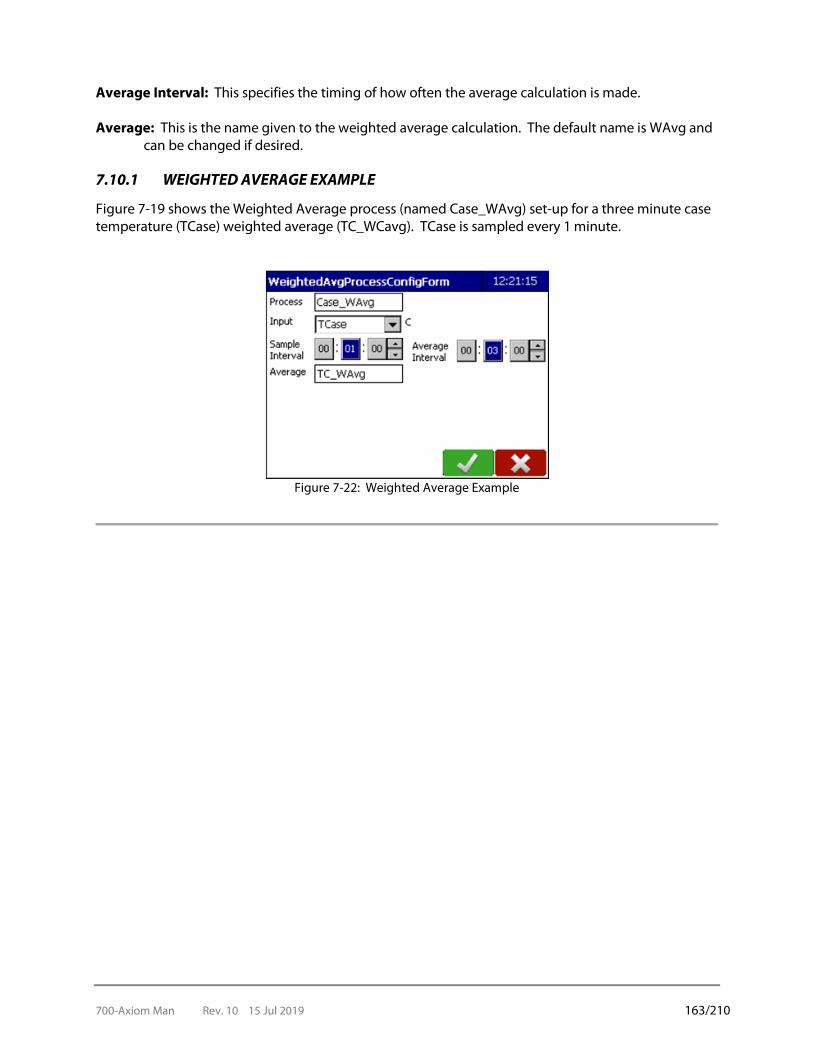
700-Axiom Man Rev. 10 15 Jul 2019 163/210
Average Interval: This specifies the timing of how often the average calculation is made. Average: This is the name given to the weighted average calculation. The default name is WAvg and
can be changed if desired.
7.10.1 WEIGHTED AVERAGE EXAMPLE
Figure 7-19 shows the Weighted Average process (named Case_WAvg) set-up for a three minute case temperature (TCase) weighted average (TC_WCavg). TCase is sampled every 1 minute.
Figure 7-22: Weighted Average Example
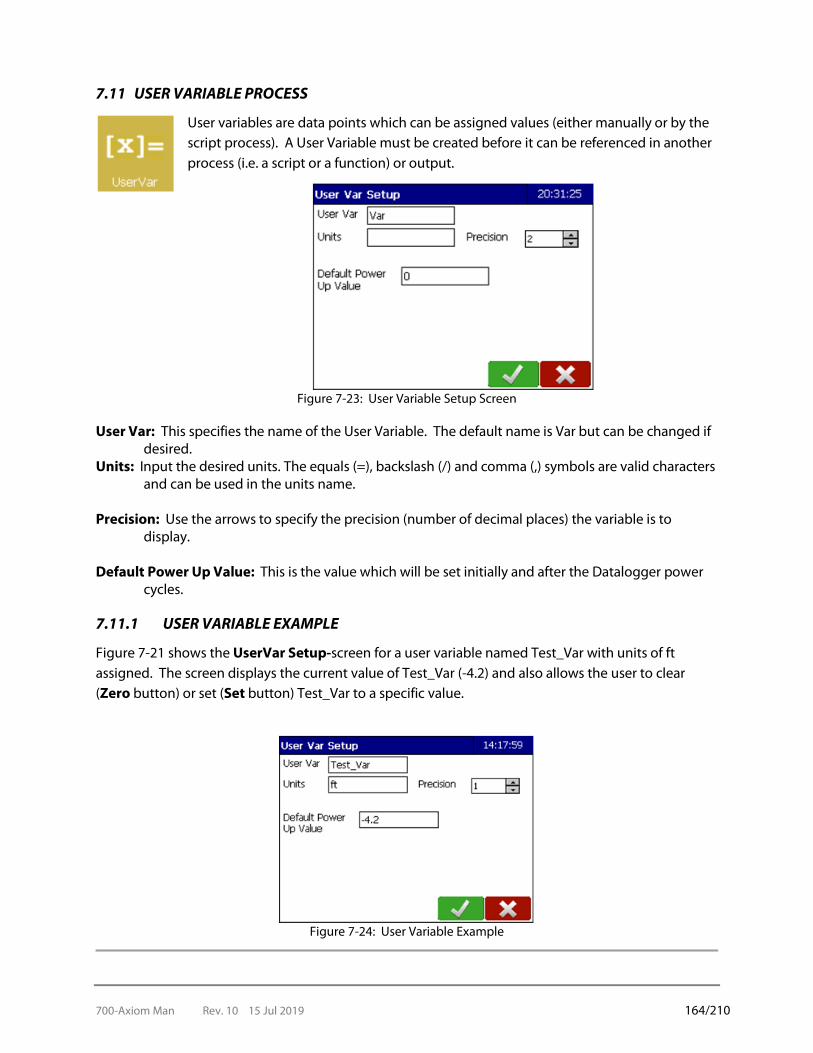
700-Axiom Man Rev. 10 15 Jul 2019 164/210
7.11 USER VARIABLE PROCESS
User variables are data points which can be assigned values (either manually or by the script process). A User Variable must be created before it can be referenced in another process (i.e. a script or a function) or output.
Figure 7-23: User Variable Setup Screen
User Var: This specifies the name of the User Variable. The default name is Var but can be changed if desired.
Units: Input the desired units. The equals (=), backslash (/) and comma (,) symbols are valid characters and can be used in the units name.
Precision: Use the arrows to specify the precision (number of decimal places) the variable is to
display. Default Power Up Value: This is the value which will be set initially and after the Datalogger power
cycles.
7.11.1 USER VARIABLE EXAMPLE
Figure 7-21 shows the UserVar Setup-screen for a user variable named Test_Var with units of ft assigned. The screen displays the current value of Test_Var (-4.2) and also allows the user to clear (Zero button) or set (Set button) Test_Var to a specific value.
Figure 7-24: User Variable Example
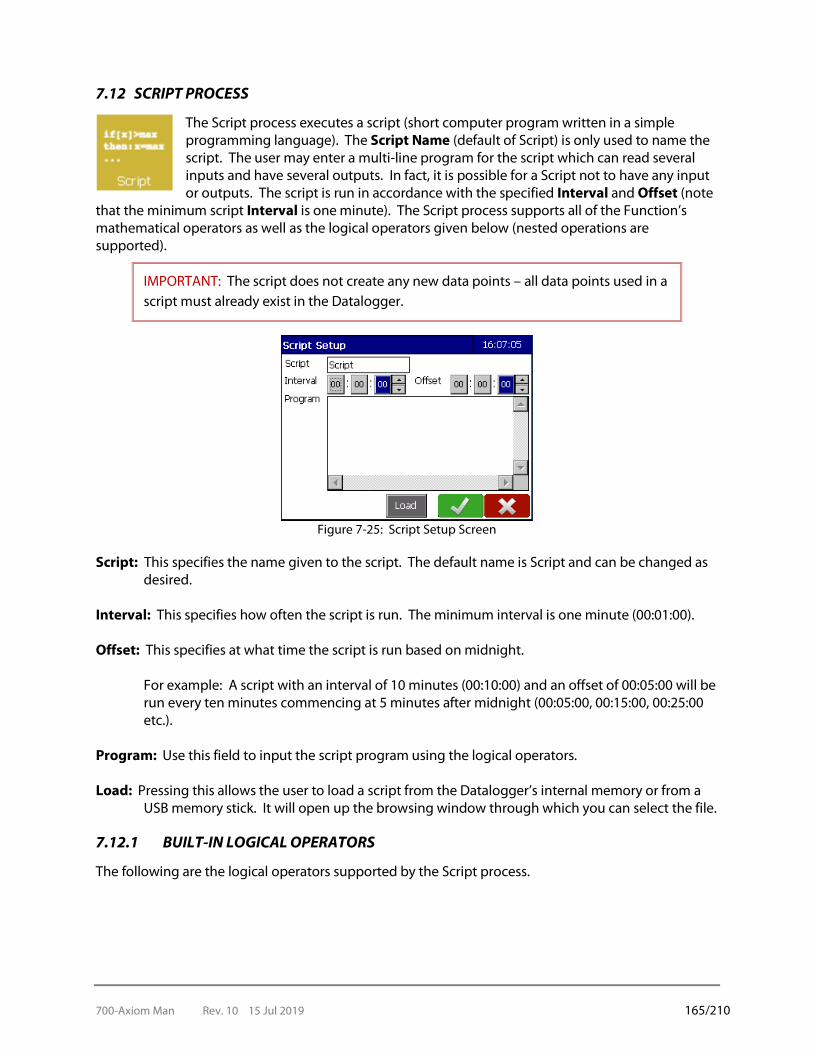
700-Axiom Man Rev. 10 15 Jul 2019 165/210
7.12 SCRIPT PROCESS
The Script process executes a script (short computer program written in a simple programming language). The Script Name (default of Script) is only used to name the script. The user may enter a multi-line program for the script which can read several inputs and have several outputs. In fact, it is possible for a Script not to have any input or outputs. The script is run in accordance with the specified Interval and Offset (note
that the minimum script Interval is one minute). The Script process supports all of the Function’s mathematical operators as well as the logical operators given below (nested operations are supported).
IMPORTANT: The script does not create any new data points – all data points used in a script must already exist in the Datalogger.
Figure 7-25: Script Setup Screen
Script: This specifies the name given to the script. The default name is Script and can be changed as desired.
Interval: This specifies how often the script is run. The minimum interval is one minute (00:01:00). Offset: This specifies at what time the script is run based on midnight.
For example: A script with an interval of 10 minutes (00:10:00) and an offset of 00:05:00 will be run every ten minutes commencing at 5 minutes after midnight (00:05:00, 00:15:00, 00:25:00 etc.).
Program: Use this field to input the script program using the logical operators. Load: Pressing this allows the user to load a script from the Datalogger’s internal memory or from a
USB memory stick. It will open up the browsing window through which you can select the file.
7.12.1 BUILT-IN LOGICAL OPERATORS
The following are the logical operators supported by the Script process.
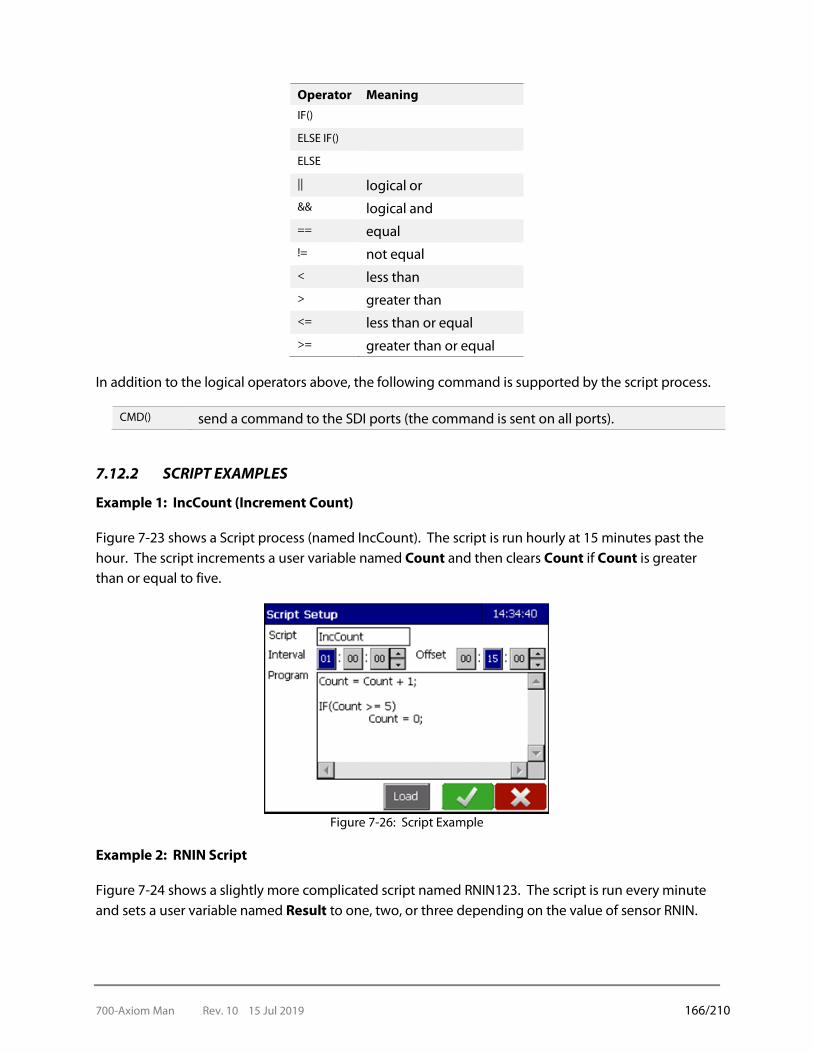
700-Axiom Man Rev. 10 15 Jul 2019 166/210
Operator Meaning IF() ELSE IF() ELSE || logical or && logical and == equal != not equal < less than > greater than <= less than or equal >= greater than or equal
In addition to the logical operators above, the following command is supported by the script process.
CMD() send a command to the SDI ports (the command is sent on all ports).
7.12.2 SCRIPT EXAMPLES
Example 1: IncCount (Increment Count) Figure 7-23 shows a Script process (named IncCount). The script is run hourly at 15 minutes past the hour. The script increments a user variable named Count and then clears Count if Count is greater than or equal to five.
Figure 7-26: Script Example
Example 2: RNIN Script Figure 7-24 shows a slightly more complicated script named RNIN123. The script is run every minute and sets a user variable named Result to one, two, or three depending on the value of sensor RNIN.
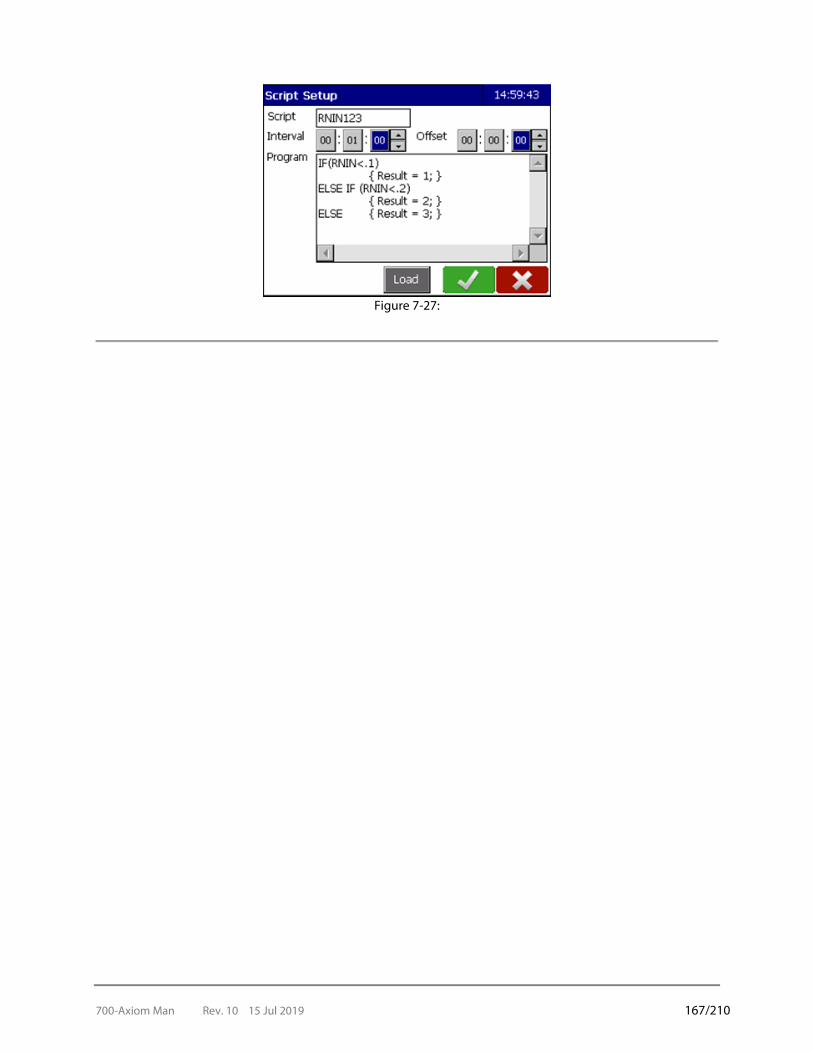
700-Axiom Man Rev. 10 15 Jul 2019 167/210
Figure 7-27:
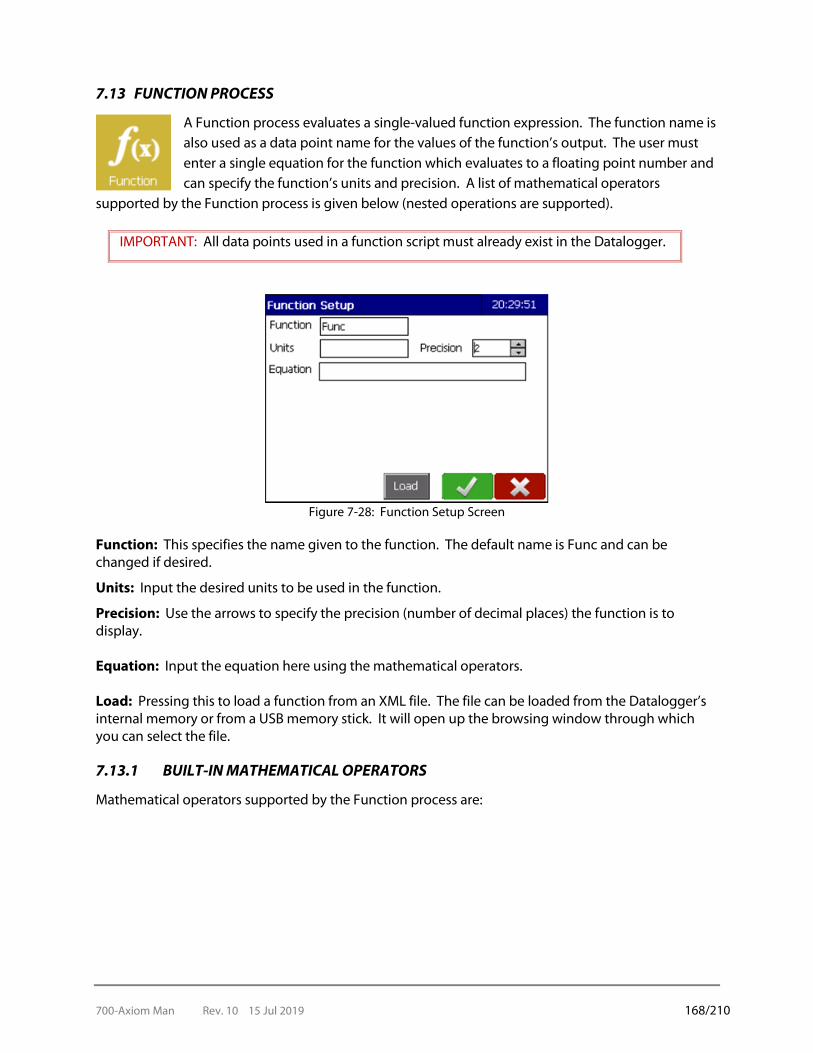
700-Axiom Man Rev. 10 15 Jul 2019 168/210
7.13 FUNCTION PROCESS
A Function process evaluates a single-valued function expression. The function name is also used as a data point name for the values of the function’s output. The user must enter a single equation for the function which evaluates to a floating point number and can specify the function’s units and precision. A list of mathematical operators
supported by the Function process is given below (nested operations are supported).
IMPORTANT: All data points used in a function script must already exist in the Datalogger.
Figure 7-28: Function Setup Screen
Function: This specifies the name given to the function. The default name is Func and can be changed if desired.
Units: Input the desired units to be used in the function.
Precision: Use the arrows to specify the precision (number of decimal places) the function is to display. Equation: Input the equation here using the mathematical operators. Load: Pressing this to load a function from an XML file. The file can be loaded from the Datalogger’s internal memory or from a USB memory stick. It will open up the browsing window through which you can select the file.
7.13.1 BUILT-IN MATHEMATICAL OPERATORS
Mathematical operators supported by the Function process are:

700-Axiom Man Rev. 10 15 Jul 2019 169/210
Operator Meaning + addition - subtraction * multiplication / division = equal to MAX(A,B) maximum of A or B MIN(A,B) minimum of A or B SQRT(x) square root LN(x) natural logarithm EXP(x) natural antilog POW(A,B) A raised to power of B, AB PI pi ABS(x) absolute value FRAC(x) fractional part of x INT(x) integer part of x MOD(A,B) modulus of A / B SIN(x) sine (in radians) COS(x) cosine (in radians) TAN(x) tangent (in radians) ASIN(x) arcsine (in radians) ACOS(x) arcos (in radians) ATAN(x) arctan (in radians) ATAN2(y,x) arctan (in radians), this operator preserves the quadrant of the result. SteinhC(x) calculates the temperature of a thermistor (in Celsius) from its resistance using
the simplified Steinhart - Hart equation (see below). Simplified Steinhart-Hart Equation
𝑇𝑇 = 1
𝐴𝐴 + 𝐵𝐵 ln𝑅𝑅 + 𝐶𝐶(ln𝑅𝑅)3 − 273.15
Symbol Meaning/Value Note
𝑇𝑇 temperature (C)
𝑅𝑅 thermistor resistance (Ω)
𝐴𝐴 1.0295 x 10 -3 coefficient for YSI 44006 thermistor
𝐵𝐵 2.3910 x 10 -4 coefficient for YSI 44006 thermistor
𝐶𝐶 1.5680 x 10 -7 coefficient for YSI 44006 thermistor

700-Axiom Man Rev. 10 15 Jul 2019 170/210
7.13.2 FUNCTION EXAMPLE
Figure 7-26 shows a Function Process (SD_comp) set-up to compensate the SR50A’s (snow depth sensor) distance reading.
The units and precision are set as desired and the equation is entered: SD_raw*SQRT((Tair+273.15)/273.15)). The variables Tair (air temperature in Celsius from defined THS3 sensor) and SD_raw (raw distance reading from snow depth sensor) must already be defined in the Datalogger in order to be used in the equation.
Figure 7-29: Function Example
7.13.3 LOADING FROM AN XML FILE
The Load button is used o load a function from an XML file. The file can be loaded from the Datalogger’s internal memory or from a USB memory stick. All data points used in the function must be defined in the Datalogger prior to loading the function.
In the following example file, the function Temp_F is defined. Temp_F is a formula to convert temperature from Celsius to Fahrenheit. The Temp_C data point must already be defined in the Datalogger in order for the function load to be successful.
<?xml version="1.0" encoding="UTF-8"?> <XMLRoot> <Processes> <Temp_F ProcessType="FuncProcess" Units="F" Equation="32+Temp_C*9/5" Precision="1" /> </Processes> </XMLRoot>
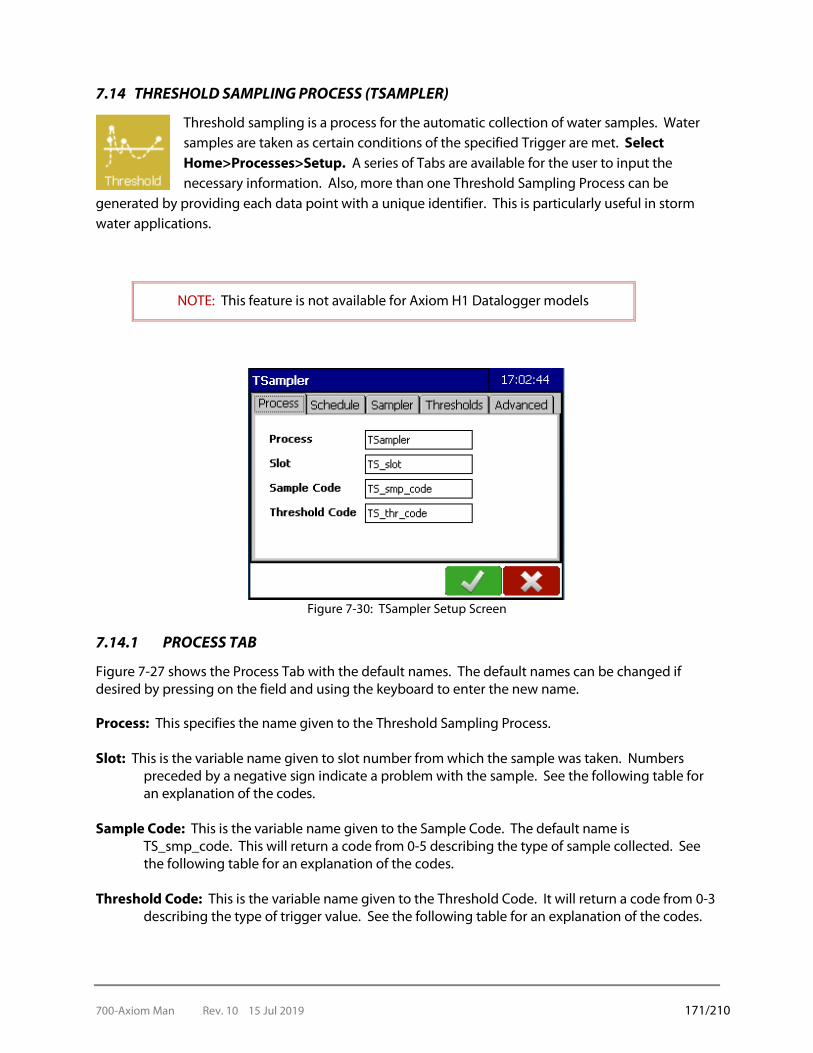
700-Axiom Man Rev. 10 15 Jul 2019 171/210
7.14 THRESHOLD SAMPLING PROCESS (TSAMPLER)
Threshold sampling is a process for the automatic collection of water samples. Water samples are taken as certain conditions of the specified Trigger are met. Select Home>Processes>Setup. A series of Tabs are available for the user to input the necessary information. Also, more than one Threshold Sampling Process can be
generated by providing each data point with a unique identifier. This is particularly useful in storm water applications.
NOTE: This feature is not available for Axiom H1 Datalogger models
Figure 7-30: TSampler Setup Screen
7.14.1 PROCESS TAB
Figure 7-27 shows the Process Tab with the default names. The default names can be changed if desired by pressing on the field and using the keyboard to enter the new name. Process: This specifies the name given to the Threshold Sampling Process. Slot: This is the variable name given to slot number from which the sample was taken. Numbers
preceded by a negative sign indicate a problem with the sample. See the following table for an explanation of the codes.
Sample Code: This is the variable name given to the Sample Code. The default name is
TS_smp_code. This will return a code from 0-5 describing the type of sample collected. See the following table for an explanation of the codes.
Threshold Code: This is the variable name given to the Threshold Code. It will return a code from 0-3
describing the type of trigger value. See the following table for an explanation of the codes.
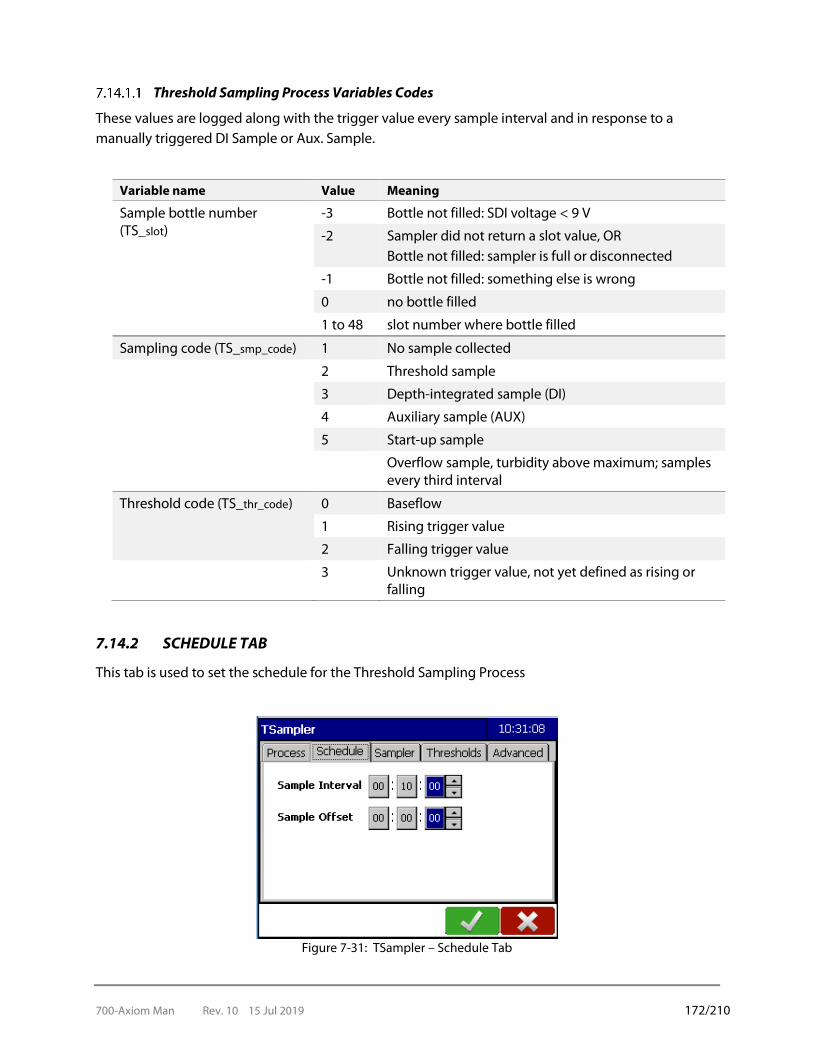
700-Axiom Man Rev. 10 15 Jul 2019 172/210
Threshold Sampling Process Variables Codes
These values are logged along with the trigger value every sample interval and in response to a manually triggered DI Sample or Aux. Sample.
Variable name Value Meaning
Sample bottle number (TS_slot)
-3 Bottle not filled: SDI voltage < 9 V
-2 Sampler did not return a slot value, OR Bottle not filled: sampler is full or disconnected
-1 Bottle not filled: something else is wrong
0 no bottle filled
1 to 48 slot number where bottle filled
Sampling code (TS_smp_code) 1 No sample collected
2 Threshold sample
3 Depth-integrated sample (DI)
4 Auxiliary sample (AUX)
5 Start-up sample
Overflow sample, turbidity above maximum; samples every third interval
Threshold code (TS_thr_code) 0 Baseflow
1 Rising trigger value
2 Falling trigger value
3 Unknown trigger value, not yet defined as rising or falling
7.14.2 SCHEDULE TAB
This tab is used to set the schedule for the Threshold Sampling Process
Figure 7-31: TSampler – Schedule Tab

700-Axiom Man Rev. 10 15 Jul 2019 173/210
Sample Interval: This specifies how often a Threshold Sample is taken. Sample Offset: This specifies at what time the Threshold Sample is taken run based on midnight.
For example: A Threshold Sample with an interval of 10 minutes (00:10:00) and an offset of 00:05:00 will be run every ten minutes commencing at 5 minutes after midnight (00:05:00, 00:15:00, 00:25:00 etc.).
7.14.3 SAMPLER TAB
Use this tab to identify the Trigger input (usually a DTS-12 turbidity sensor) and the appropriate sensors to measure stage and water temperature. Sampler 1 and Sampler 2 specify the water samplers (usually an ISCO 6712 series)
Figure 7-32: TSampler – Sampler Screen
Trigger: Use the drop down menu to select the variable to be used as the Trigger input. The hysteresis values as well as the minimum interval settings for the Trigger sensor can be set using the Advanced Tab.
Stage: Use the drop down menu to select the Stage variable to be used in the process. Temp: Use the drop down menu to select the temperature variable to be used in the process.
Sampler 1: Use the drop down menu to select the sensor which will be used for Sample 1. Sampler 2: Use the drop down menu to select the sensor which will be used for Sample 2.
7.14.4 THRESHOLDS TAB
Samples can be triggered by rising or falling Turbidity Threshold Values. Default settings are shown below.
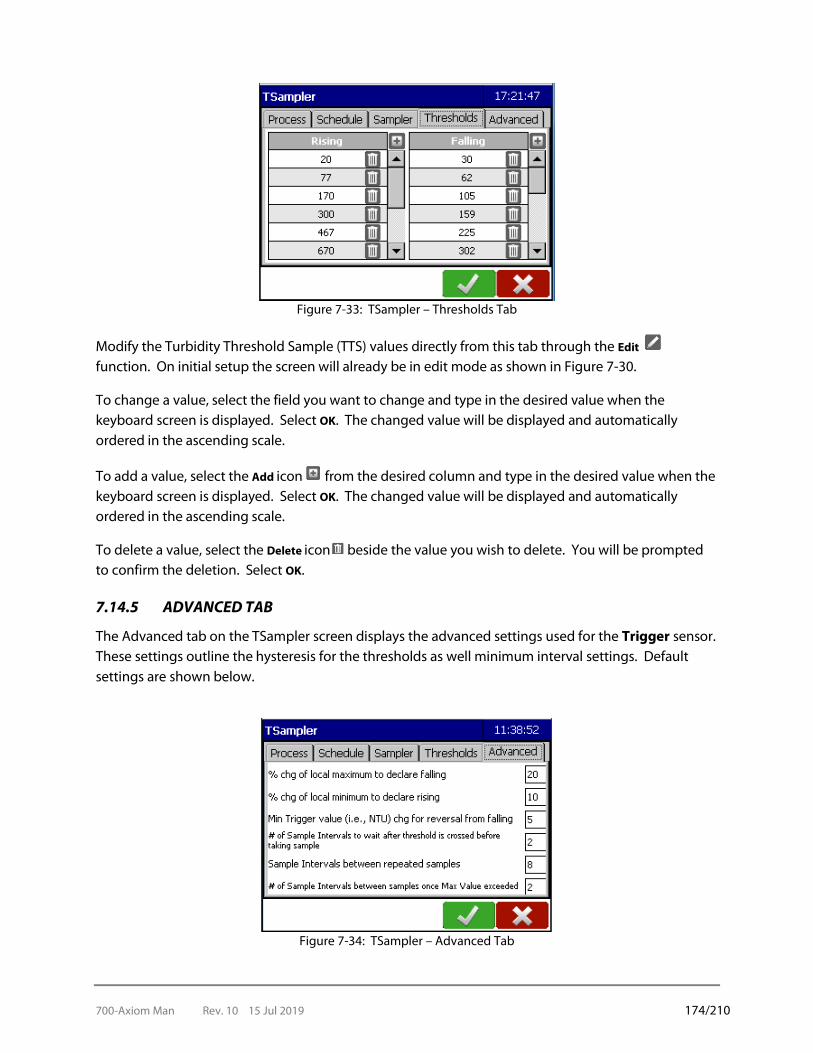
700-Axiom Man Rev. 10 15 Jul 2019 174/210
Figure 7-33: TSampler – Thresholds Tab
Modify the Turbidity Threshold Sample (TTS) values directly from this tab through the Edit function. On initial setup the screen will already be in edit mode as shown in Figure 7-30.
To change a value, select the field you want to change and type in the desired value when the keyboard screen is displayed. Select OK. The changed value will be displayed and automatically ordered in the ascending scale.
To add a value, select the Add icon from the desired column and type in the desired value when the keyboard screen is displayed. Select OK. The changed value will be displayed and automatically ordered in the ascending scale.
To delete a value, select the Delete icon beside the value you wish to delete. You will be prompted to confirm the deletion. Select OK.
7.14.5 ADVANCED TAB
The Advanced tab on the TSampler screen displays the advanced settings used for the Trigger sensor. These settings outline the hysteresis for the thresholds as well minimum interval settings. Default settings are shown below.
Figure 7-34: TSampler – Advanced Tab
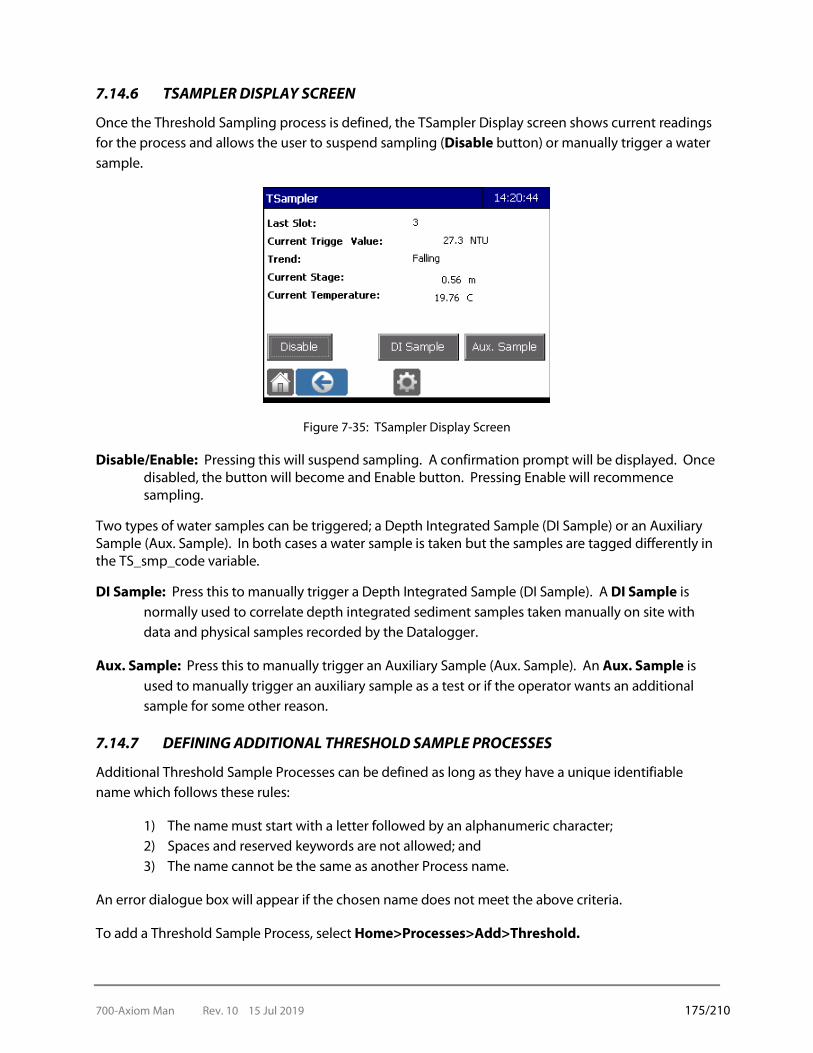
700-Axiom Man Rev. 10 15 Jul 2019 175/210
7.14.6 TSAMPLER DISPLAY SCREEN
Once the Threshold Sampling process is defined, the TSampler Display screen shows current readings for the process and allows the user to suspend sampling (Disable button) or manually trigger a water sample.
Figure 7-35: TSampler Display Screen
Disable/Enable: Pressing this will suspend sampling. A confirmation prompt will be displayed. Once disabled, the button will become and Enable button. Pressing Enable will recommence sampling.
Two types of water samples can be triggered; a Depth Integrated Sample (DI Sample) or an Auxiliary Sample (Aux. Sample). In both cases a water sample is taken but the samples are tagged differently in the TS_smp_code variable.
DI Sample: Press this to manually trigger a Depth Integrated Sample (DI Sample). A DI Sample is normally used to correlate depth integrated sediment samples taken manually on site with data and physical samples recorded by the Datalogger.
Aux. Sample: Press this to manually trigger an Auxiliary Sample (Aux. Sample). An Aux. Sample is used to manually trigger an auxiliary sample as a test or if the operator wants an additional sample for some other reason.
7.14.7 DEFINING ADDITIONAL THRESHOLD SAMPLE PROCESSES
Additional Threshold Sample Processes can be defined as long as they have a unique identifiable name which follows these rules:
1) The name must start with a letter followed by an alphanumeric character; 2) Spaces and reserved keywords are not allowed; and 3) The name cannot be the same as another Process name.
An error dialogue box will appear if the chosen name does not meet the above criteria.
To add a Threshold Sample Process, select Home>Processes>Add>Threshold.
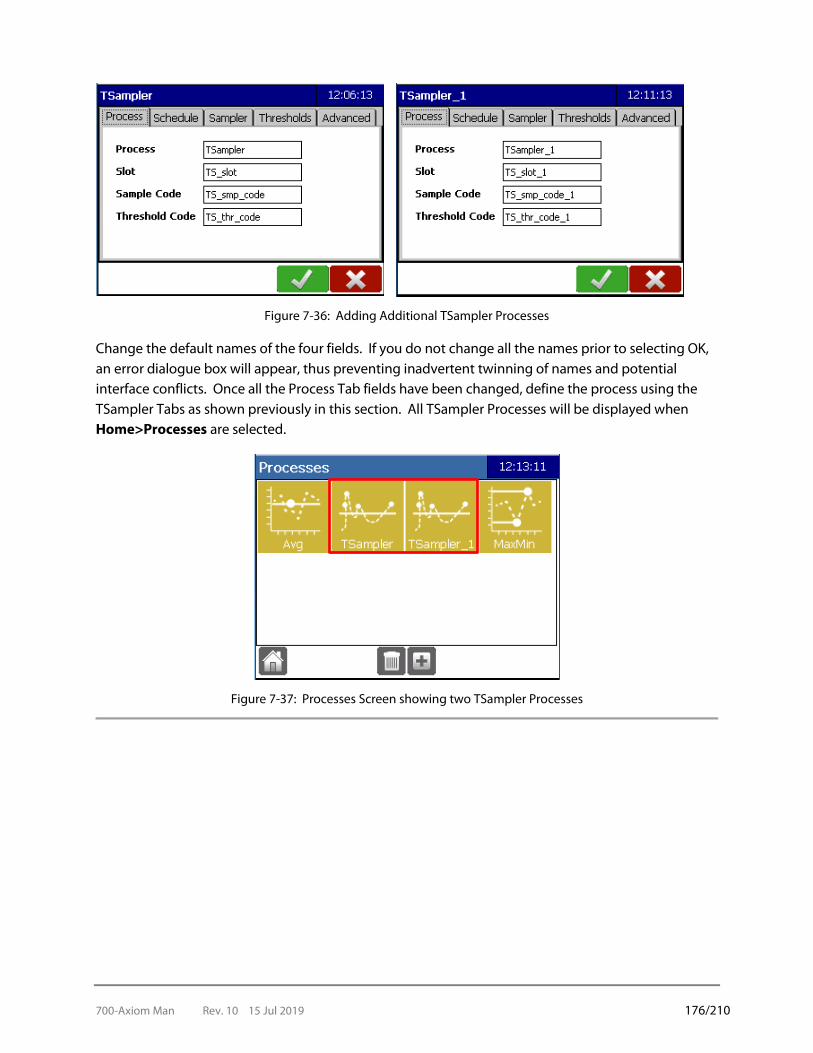
700-Axiom Man Rev. 10 15 Jul 2019 176/210
Figure 7-36: Adding Additional TSampler Processes
Change the default names of the four fields. If you do not change all the names prior to selecting OK, an error dialogue box will appear, thus preventing inadvertent twinning of names and potential interface conflicts. Once all the Process Tab fields have been changed, define the process using the TSampler Tabs as shown previously in this section. All TSampler Processes will be displayed when Home>Processes are selected.
Figure 7-37: Processes Screen showing two TSampler Processes
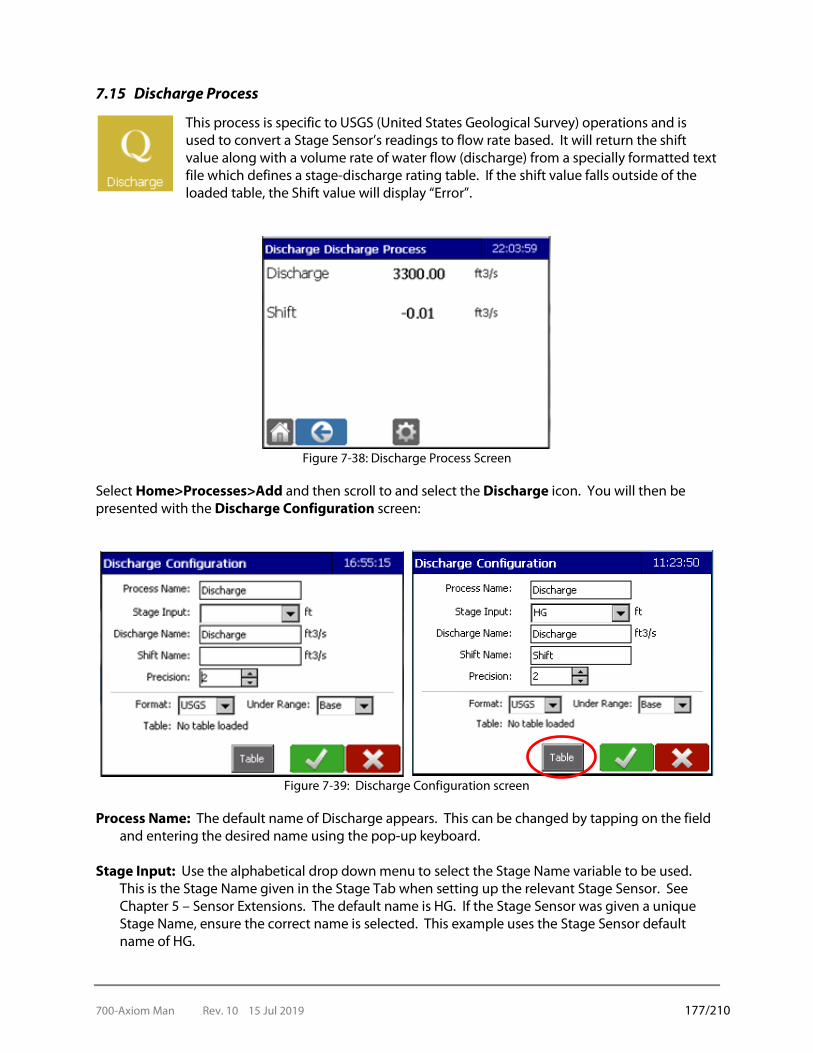
700-Axiom Man Rev. 10 15 Jul 2019 177/210
7.15 Discharge Process
This process is specific to USGS (United States Geological Survey) operations and is used to convert a Stage Sensor’s readings to flow rate based. It will return the shift value along with a volume rate of water flow (discharge) from a specially formatted text file which defines a stage-discharge rating table. If the shift value falls outside of the loaded table, the Shift value will display “Error”.
Figure 7-38: Discharge Process Screen
Select Home>Processes>Add and then scroll to and select the Discharge icon. You will then be presented with the Discharge Configuration screen:
Figure 7-39: Discharge Configuration screen
Process Name: The default name of Discharge appears. This can be changed by tapping on the field and entering the desired name using the pop-up keyboard.
Stage Input: Use the alphabetical drop down menu to select the Stage Name variable to be used.
This is the Stage Name given in the Stage Tab when setting up the relevant Stage Sensor. See Chapter 5 – Sensor Extensions. The default name is HG. If the Stage Sensor was given a unique Stage Name, ensure the correct name is selected. This example uses the Stage Sensor default name of HG.
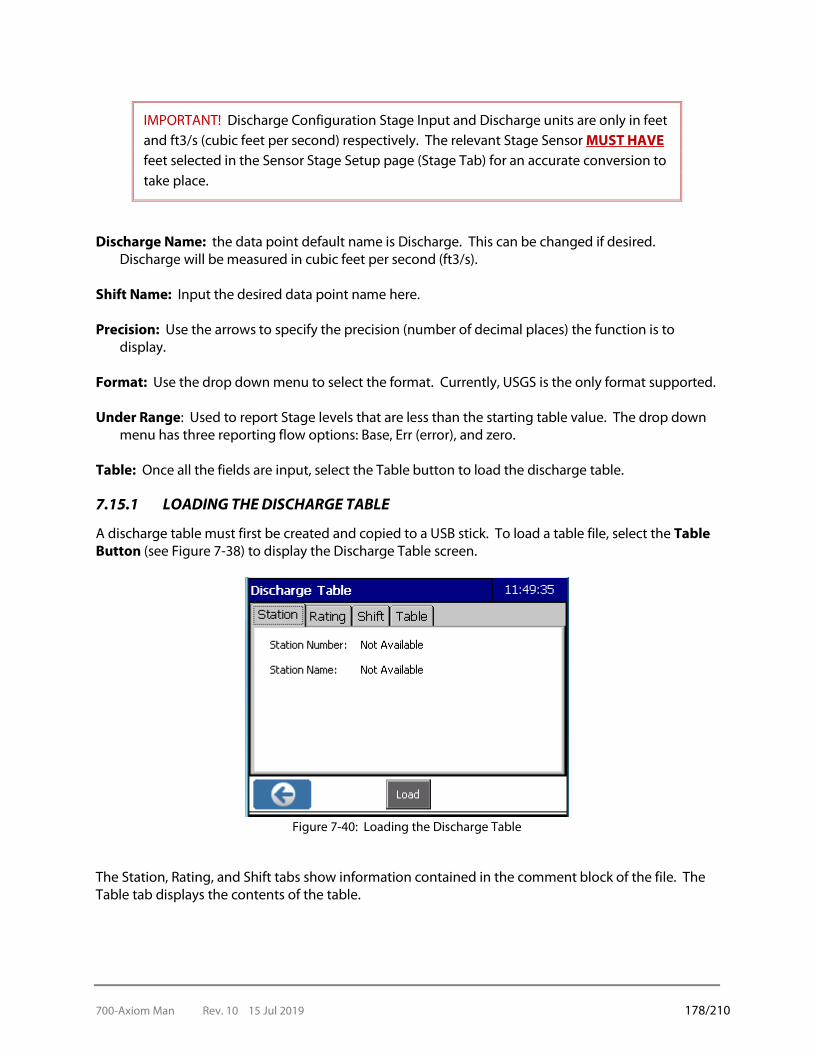
700-Axiom Man Rev. 10 15 Jul 2019 178/210
IMPORTANT! Discharge Configuration Stage Input and Discharge units are only in feet and ft3/s (cubic feet per second) respectively. The relevant Stage Sensor MUST HAVE feet selected in the Sensor Stage Setup page (Stage Tab) for an accurate conversion to take place.
Discharge Name: the data point default name is Discharge. This can be changed if desired.
Discharge will be measured in cubic feet per second (ft3/s). Shift Name: Input the desired data point name here. Precision: Use the arrows to specify the precision (number of decimal places) the function is to
display. Format: Use the drop down menu to select the format. Currently, USGS is the only format supported. Under Range: Used to report Stage levels that are less than the starting table value. The drop down
menu has three reporting flow options: Base, Err (error), and zero. Table: Once all the fields are input, select the Table button to load the discharge table.
7.15.1 LOADING THE DISCHARGE TABLE
A discharge table must first be created and copied to a USB stick. To load a table file, select the Table Button (see Figure 7-38) to display the Discharge Table screen.
Figure 7-40: Loading the Discharge Table
The Station, Rating, and Shift tabs show information contained in the comment block of the file. The Table tab displays the contents of the table.
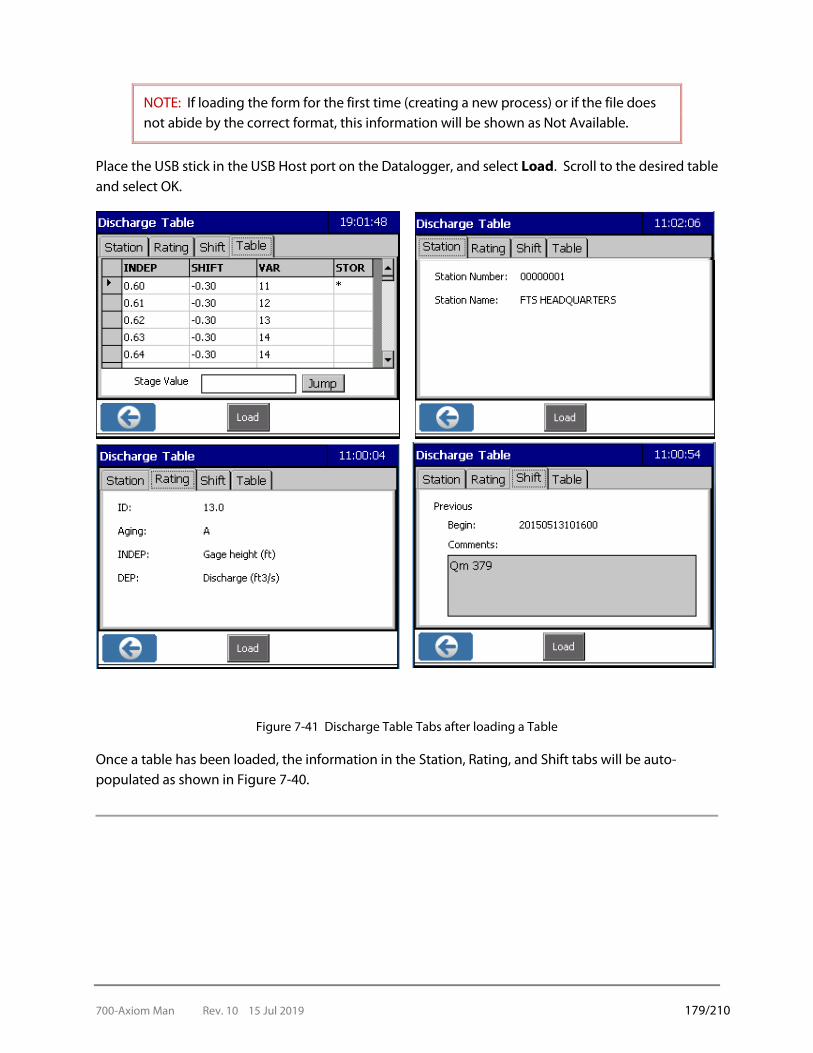
700-Axiom Man Rev. 10 15 Jul 2019 179/210
NOTE: If loading the form for the first time (creating a new process) or if the file does not abide by the correct format, this information will be shown as Not Available.
Place the USB stick in the USB Host port on the Datalogger, and select Load. Scroll to the desired table and select OK.
Figure 7-41 Discharge Table Tabs after loading a Table
Once a table has been loaded, the information in the Station, Rating, and Shift tabs will be auto-populated as shown in Figure 7-40.

700-Axiom Man Rev. 10 15 Jul 2019 180/210
- DATA FUNCTIONS
The Data Status screen displays data storage information and is used to configure data logging, as well as download and delete data, or examine the Datalogger’s recorded data.
Figure 8-1: Data Status Screen
A series of Action Icons appears at the bottom of the screen.
Home Setup Cog Table View Graph View
Delete Download Advanced
8.1 SETUP LOGGING
Data logging is configured through the Setup Cog. Figure 8-2 shows the Logging screen for a blank Datalogger (no data logging intervals configured) and a Datalogger with logging intervals configured. Logging intervals created through the Data functions, as described here, are displayed in blue. Logging intervals created using the In-line Logging feature are displayed in green.
Figure 8-2: Logging Intervals Screens
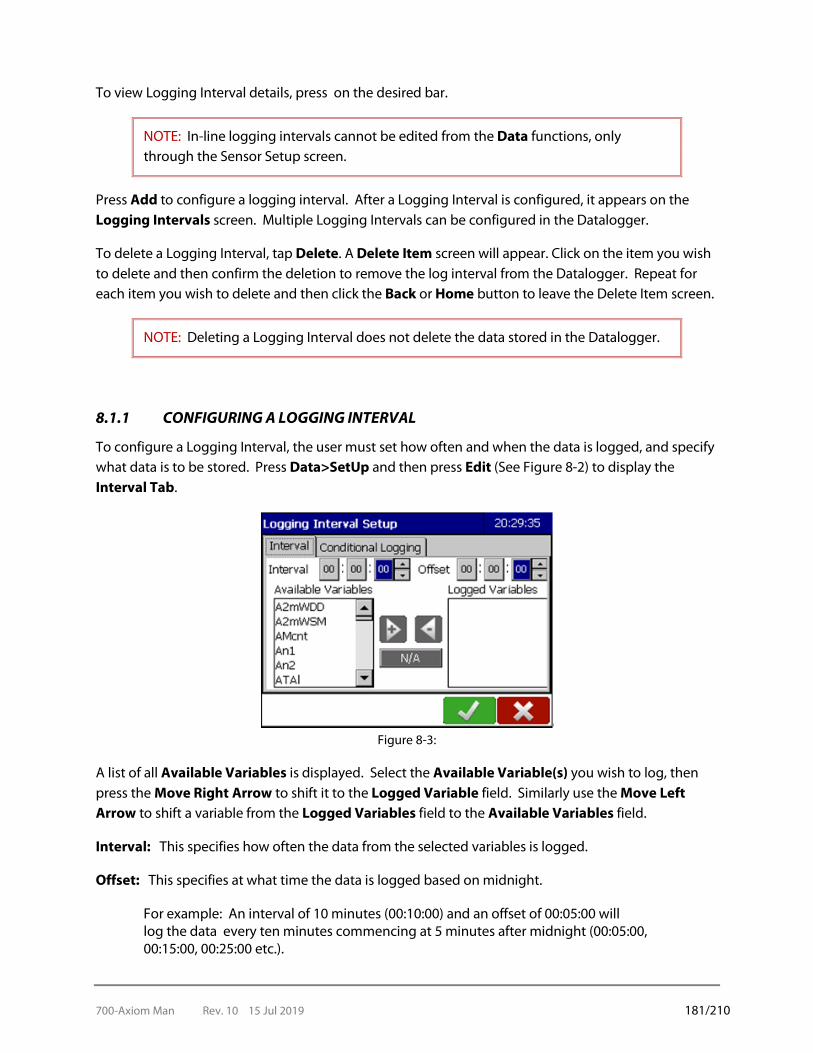
700-Axiom Man Rev. 10 15 Jul 2019 181/210
To view Logging Interval details, press on the desired bar.
NOTE: In-line logging intervals cannot be edited from the Data functions, only through the Sensor Setup screen.
Press Add to configure a logging interval. After a Logging Interval is configured, it appears on the Logging Intervals screen. Multiple Logging Intervals can be configured in the Datalogger.
To delete a Logging Interval, tap Delete. A Delete Item screen will appear. Click on the item you wish to delete and then confirm the deletion to remove the log interval from the Datalogger. Repeat for each item you wish to delete and then click the Back or Home button to leave the Delete Item screen.
NOTE: Deleting a Logging Interval does not delete the data stored in the Datalogger.
8.1.1 CONFIGURING A LOGGING INTERVAL
To configure a Logging Interval, the user must set how often and when the data is logged, and specify what data is to be stored. Press Data>SetUp and then press Edit (See Figure 8-2) to display the Interval Tab.
Figure 8-3:
A list of all Available Variables is displayed. Select the Available Variable(s) you wish to log, then press the Move Right Arrow to shift it to the Logged Variable field. Similarly use the Move Left Arrow to shift a variable from the Logged Variables field to the Available Variables field.
Interval: This specifies how often the data from the selected variables is logged.
Offset: This specifies at what time the data is logged based on midnight.
For example: An interval of 10 minutes (00:10:00) and an offset of 00:05:00 will log the data every ten minutes commencing at 5 minutes after midnight (00:05:00, 00:15:00, 00:25:00 etc.).

700-Axiom Man Rev. 10 15 Jul 2019 182/210
Figure 8-4: Logging Interval Setup – Enable/Disable logging
Once a variable has been selected to be logged as a data point, logging can be disabled. When a data point in the Logged Variables is selected (highlighted in blue), the grey N/A field displays a Disable(D) command. Pressing on the Disable button will disable the selected variable which will then be shown with a (D) preceding its name. The right hand screen in Figure 8-4 shows that the HG variable logging has been disabled.
To enable logging of a disabled variable, press on the variable and the Enable button will be displayed. Pressing on it enables the variable as seen by the (D) no longer appearing before the variable name.
Conditional Logging
Conditional Logging will log the variables selected in the Logging Interval when the defined conditions are met.
Figure 8-5: Conditional Logging Setup
Enable Conditional Logging Checkbox: This must be checked for Conditional Logging to take place.

700-Axiom Man Rev. 10 15 Jul 2019 183/210
Condition Type: Select the type of condition to be defined.
Condition type Meaning
Value Only log if the value of the variable selected in the Expression drop down satisfies the Expression.
Change Since Last Logged Value
Only log if the difference between the value of the variable selected in the Expression drop down and the last logged value of the variable satisfies the Expression.
Change in Last 00:00:00 Only log if the difference of the value of the variable selected in the Expression drop down over the last logging interval satisfies the Expression. Note that once this radio button is selected, the default time of 00:00:00 will change to reflect the Interval time input in the Interval tab.
Expression: 1) Use the drop down menu to select the variable upon which the condition rests. 2) Use the drop down menu to select the mathematical operator. Valid operators are: 3) Input the desired value. Once all Conditional Logging fields have been filled in, select OK.
> greater than >= greater than or equal to < less than <= less than or equal to = equal to

700-Axiom Man Rev. 10 15 Jul 2019 184/210
8.2 DOWNLOAD DATA
The Download button on the Data Status screen is used to export data to a USB memory stick.
Figure 8-6: Download Data
Date Range: Use the down arrows in the Date Range to display and select the options. In the Date Range field, selecting Last Day, Last Week, Last Month, or All will automatically adjust the dates in the From and To fields. The time will reflect the current time. The Date Range selection will remain persistent after restarts and are saved to the configuration file.
Figure 8-7: Date Range Options
Custom: Dates and times can be individually adjusted by selecting the individual elements of the mm/dd/yyyy and hh/mm fields, and using the left and right arrows to adjust accordingly.
Last Visit: When this is selected, it will save the time stamp of when data was downloaded. Subsequent downloads using the Last Visit option will be referenced from that time stamp, preventing duplicate data from being downloaded.
Output Format: There are three formats to export data. Use the radio buttons to specify the desired format.
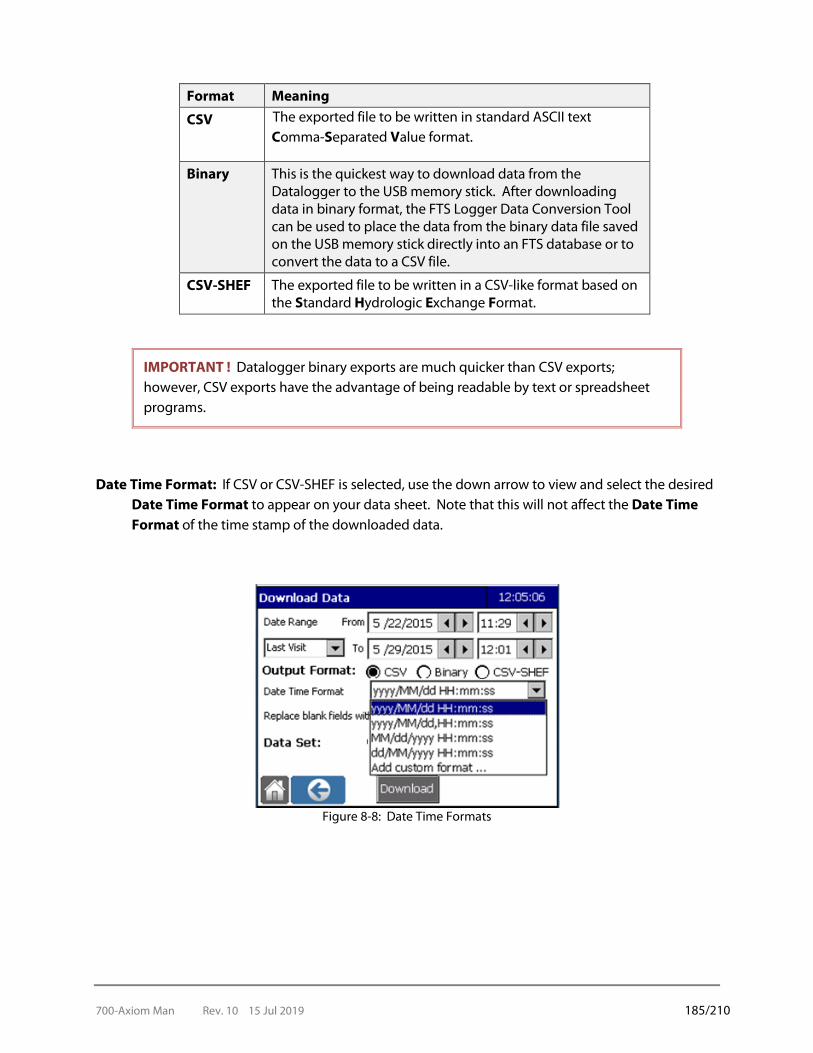
700-Axiom Man Rev. 10 15 Jul 2019 185/210
Format Meaning
CSV The exported file to be written in standard ASCII text Comma-Separated Value format.
Binary This is the quickest way to download data from the Datalogger to the USB memory stick. After downloading data in binary format, the FTS Logger Data Conversion Tool can be used to place the data from the binary data file saved on the USB memory stick directly into an FTS database or to convert the data to a CSV file.
CSV-SHEF The exported file to be written in a CSV-like format based on the Standard Hydrologic Exchange Format.
IMPORTANT ! Datalogger binary exports are much quicker than CSV exports; however, CSV exports have the advantage of being readable by text or spreadsheet programs.
Date Time Format: If CSV or CSV-SHEF is selected, use the down arrow to view and select the desired Date Time Format to appear on your data sheet. Note that this will not affect the Date Time Format of the time stamp of the downloaded data.
Figure 8-8: Date Time Formats
700-Axiom Man Rev. 10 15 Jul 2019 186/210
Format codes for date and time components are detailed in the following table.
Format code Output
yyyy year
MM month in numerical format (e.g., 01 for January)
MMM month in text format (e.g., JAN for January)
dd day
HH hour in 24 hour format
hh hour in 12 hour format
mm minute
ss second
tt am / pm
, commas inserted in the Date Time Format will result in commas inserted in the output data file
Replace blank fields with: Missing data fields will be filled in using the input figure. The default setting is -99999. To change it tap on the field and input the desired value using the keyboard. Select OK.
Include Units Line Checkbox: When checked units will be included in the data sheet. Data Set: This feature is used to select and order the variables to download. The default selection is
All. When selected, the Data Set will consist of all the variables and the data will be downloaded in the order of the data store index unless ordered. To create a smaller Data Set made of specific variables, press on the Selected radio button, then the Variables button. To adjust the download order of the variables in the Data Set, see section 7.2.1. The Data Set choice (whether All or Selected Variables) will remain persistent after restarts and is saved to the configuration file.
Variables: Select the variables to export by pressing the Select radio button and then Variables. Press on the desired variable(s) and use the arrows to build the list. The variables will be downloaded in the order they appear in the list unless ordered (see following section).
8.2.1 CREATING AN ORDERED DOWNLOAD LIST OF VARIABLES
If the variables need to be downloaded, but in a different order than they appear in the data store index, their order can be adjusted. Press on the Selected radio button and then the Variables button to display the Select Variables screen. Select Edit.

700-Axiom Man Rev. 10 15 Jul 2019 187/210
Figure 8-9: Select Variable to Download
Move the desired variables from the Available Variables column to the Variables to Download column using the arrows. All the variables or select variables can be moved.
Figure 8-10: Ordering All Variables
Adjust the order of the download list by pressing on a variable and using the up and down arrows to place it. Once the download variable list is complete, select OK. Download Button: Once all desired options in the Download Data screen have been filled in, press
on the Download button.
The downloaded data will appear in the following file structure on the USB memory stick.
The downloaded data file is time-stamped and has the following naming format: station name-yyyy-mm-dd-hh-ss with either a .csv or .bin extension.
Move all Right
Move one Right
Move all Left
Move one Left

700-Axiom Man Rev. 10 15 Jul 2019 188/210
8.3 DATA ERRORS AND ERROR CODES
The Datalogger recognizes data errors arising from different sources. Should an error state be detected, the data for the affected variable will be replaced with one of the following error codes:
0 no errors
1 sensor error (responded, but incorrectly)
2 missing sensor
3 under range value
4 over range value
5 division by zero
6 other errors
The error codes are organized in order of priority, with 0 being the highest priority. If there are multiple errors, the highest priority error will be used. The Axiom F6 Datalogger can detect a missing sensor for:
• wind direction • air temperature • fuel temperature
• any SDI sensor that is not responding However, the Axiom F6 Datalogger it cannot detect a missing sensor for:
• wind speed • rain • air humidity • fuel humidity
The Axiom H series Dataloggers can detect any SDI sensor that is not responding; however, they cannot detect a missing dedicated rain sensor. In the case of SDI sensors, it is not possible to detect if two sensors are set to the same address and are connected on the same datalogger SDI port. The error returned for each sensor when two sensors are set to the same address and connected on the same port will depend on the operation of the individual sensors. With SDI sensors, some sensors return unusual readings as error indicators. These will often be caught by the Over range and Under range messages. This behavior depends on the sensor manufacturer.

700-Axiom Man Rev. 10 15 Jul 2019 189/210
8.3.1 ERRORS AND INTERMEDIATE CALCULATIONS
Detected data errors are carried through to intermediate calculations which use the affected data point. Example: You have a variable, Temp, from an air temperature sensor which measures in degrees Celsius. You have a calculation to convert the readings from degrees Celsius to degrees Fahrenheit, FTemp=(Temp*9/5)+32. If the air temperature sensor is removed, when the data point FTemp is logged, error code 2 (Missing sensor) will be stored in place of the data. To determine if a datapoint has valid data, the Axiom datalogger has an error operator which can be used in a script to test the validity of a datapoint. The error operator can also be used in a Function to report the error status of the datapoint. The error function has the format: ERR(datapoint) An example of the ERR function used in a script is:
IF(ERR(datapoint)==0) // Checking validity of datapoint { // This code is executed if datapoint has no errors - i.e. is code 0 (zero) } ELSE { // This is executed if datapoint has an error - i.e. is not code 0 (zero) }
The error codes returned are defined as follows:
0 no errors 1 sensor error (responded, but incorrectly) 2 missing sensor 3 under range value 4 over range value 5 division by zero 6 other errors
8.4 DELETE DATA
The Delete Data button on the Data Status screen permanently deletes all data stored in the Datalogger. After the Delete Data button is pressed, the user is prompted to confirm the delete operation.
IMPORTANT! Once deleted, the data cannot be recovered.

700-Axiom Man Rev. 10 15 Jul 2019 190/210
Data is not deleted when loading a new configuration, when updating the Application or when updating the Operating System. The only way to delete data is to push the Delete Data button.
Figure 8-11: Deleting Data Sequence

700-Axiom Man Rev. 10 15 Jul 2019 191/210
8.5 DATA GRAPH VIEW
A graph of logged data can be created and viewed through Graph Data on the Data Status screen. While it is possible to graph a large date range, the user should be aware that there may be a delay to format the graph depending on the number of readings in the selected range. Graphing capability in the Datalogger is intended to show trends over a short time period to help the user determine proper sensor and station operation. Multiple variables can be graphed at the same time. The graph below shows a graph of the RNIN sensor over a two hour period.
The Full Screen button expands the graph to fill the entire display area.
The left and right arrow buttons (< >)scroll forwards and backwards by half the time scale (in this case one hour) for each time the button is pressed.
Pressing the variable button, in this example labeled RNIN, allows the user to toggle through all the variables defined for the graph. The name of the variable currently being displayed (active variable) is shown on the variable button. Data from the active variable is displayed in its selected colour and the y-axis changes to the range defined for the active variable. Data from the non-active variables is displayed in grey.
Figure 8-12: Data Graph Screen

700-Axiom Man Rev. 10 15 Jul 2019 192/210
8.5.1 GRAPH SETUP
Use the Setup cog to bring up the Graph Setup screen.
Figure 8-13: Graph Setup Screens
Date Range: Use the down arrows in the Date Range to display and select the options. In the Date Range field, selecting Last Day, Last Week, Last Month, or All will automatically adjust the dates in the From and To fields. The time will reflect the current time. Dates and times can be individually adjusted by selecting Custom, then selecting the individual elements of the mm/dd/yyyy and hh/mm fields, and using the left and right arrows to adjust accordingly.
Display variables: A list of all Available Variables is displayed. Select the Available Variable(s) you wish to display on the graph, then press the Move Right Arrow to shift it to the Displayed Variable field. Similarly use the Move Left Arrow to shift a variable from the Displayed Variables field to the Available Variables field.
Series Setup: When a variable is moved to the Available Variables column, a Series Setup Screen will appear (see Figure 8-13). Select the colour
Min: This is the minimum value to be displayed on the y-axis. Press on the field and use the keyboard to input the desired value.
Max: This is the maximum value to be displayed on the y-axis. Press on the field and use the keyboard to input the desired value.
Color: Tap on the color field to select the color to be used for the variable. Choices are red, orange, yellow, green, blue, violet and brown.
Select OK.
Edit: Use this to edit the Series Setup of a variable. Select the variable then press Edit.
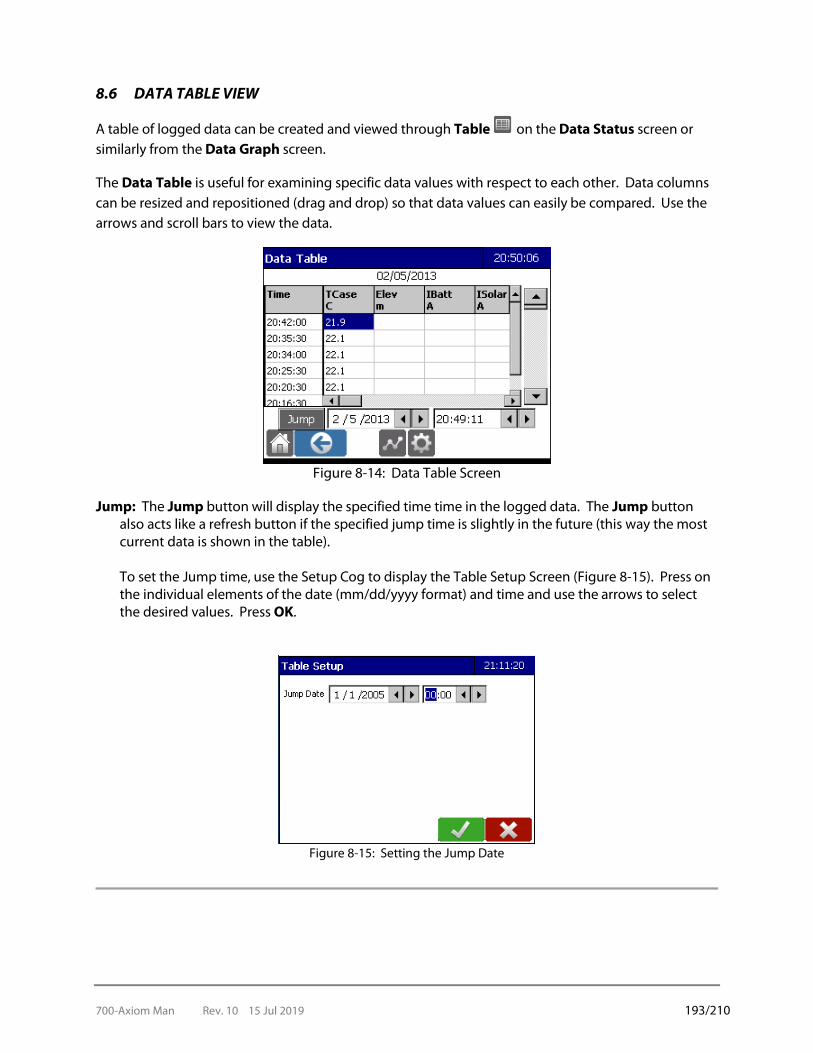
700-Axiom Man Rev. 10 15 Jul 2019 193/210
8.6 DATA TABLE VIEW
A table of logged data can be created and viewed through Table on the Data Status screen or similarly from the Data Graph screen.
The Data Table is useful for examining specific data values with respect to each other. Data columns can be resized and repositioned (drag and drop) so that data values can easily be compared. Use the arrows and scroll bars to view the data.
Figure 8-14: Data Table Screen
Jump: The Jump button will display the specified time time in the logged data. The Jump button also acts like a refresh button if the specified jump time is slightly in the future (this way the most current data is shown in the table).
To set the Jump time, use the Setup Cog to display the Table Setup Screen (Figure 8-15). Press on the individual elements of the date (mm/dd/yyyy format) and time and use the arrows to select the desired values. Press OK.
Figure 8-15: Setting the Jump Date

700-Axiom Man Rev. 10 15 Jul 2019 194/210
8.7 ADVANCED
Advanced logging options are configured through the Adv button on the Data Status screen. To change the advanced data setup, press the Edit button on the screen. The Data Advanced Setup screen allows the user to select the following two options:
Figure 8-16: Data Advanced Setup
Enable 30 Second Caching (10 minute Default): When checked, this decreases the size of the cache used between data logging operations and the NandFlash memory. The default cache size stores about 10 minutes’ worth of data between writes to NandFlash. If this option is selected, the cache stores only about 30 seconds worth of data. The NandFlash is thus written 20 times more often than in the default configuration, which reduces its lifespan by a corresponding factor.
Enable 8 year Log File (2 year default): When checked, this increases the size of file allocated to
storing logged data. The default log file is 13.4 MB, enough for 2 years of data under typical usage. If this option is selected, the log file is expanded to 54 MB, enough for about 8 years of data under typical usage. The consequence is that the time required for indexing and deleting data is increased by a factor of at least 10.

700-Axiom Man Rev. 10 15 Jul 2019 195/210
- CURRENT CONDITIONS
The Current Conditions icon displays a set of user selected variables for easy monitoring of a specified set of data. The Current Condition screen is not automatically updated by the Datalogger. Variables selected for the Current Conditions display can be manually or automatically (timed) refreshed. Built-in and
analog sensors are read every time a manual or automatic refresh event occurs. However, it is important to note that Refresh does not trigger a new set of readings from SDI sensors or process outputs. Refresh only causes the last measured value to be displayed. For example, an SDI sensor that is programmed to be read every 10 minutes displays the same value until the 10 minute rollover occurs and a new SDI measurement is performed. A process returns the current value of the process at the time the refresh was selected. Note that a Current Condition call through a telemetry device or telemetry port connection to a PC operates in a similar manner as the Current Condition screen.
Figure 9-1: Current Conditions Screens
If timed Refresh is not enabled, the time of the last SDI sensor reading is displayed at the bottom of the screen in the following format: “As of: mm/dd/yyyy hh/mm/ss”, and the Refresh message reads “Refresh in: never”. If Timed Refresh is enabled, the time of the last Timed Refresh is displayed in the “As of” message and the count down time until the next refresh will be displayed in the “Refresh in:hh:mm:ss” message.
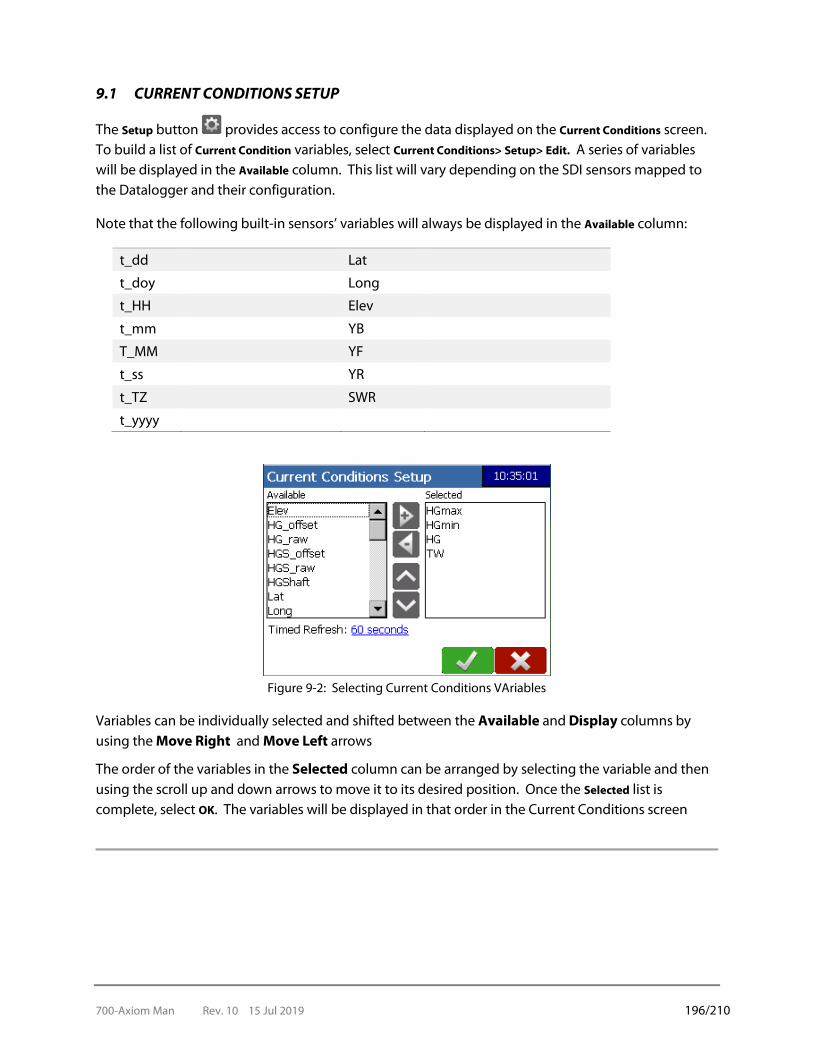
700-Axiom Man Rev. 10 15 Jul 2019 196/210
9.1 CURRENT CONDITIONS SETUP
The Setup button provides access to configure the data displayed on the Current Conditions screen. To build a list of Current Condition variables, select Current Conditions> Setup> Edit. A series of variables will be displayed in the Available column. This list will vary depending on the SDI sensors mapped to the Datalogger and their configuration.
Note that the following built-in sensors’ variables will always be displayed in the Available column:
t_dd Lat
t_doy Long
t_HH Elev
t_mm YB
T_MM YF
t_ss YR
t_TZ SWR
t_yyyy
Figure 9-2: Selecting Current Conditions VAriables
Variables can be individually selected and shifted between the Available and Display columns by using the Move Right and Move Left arrows
The order of the variables in the Selected column can be arranged by selecting the variable and then using the scroll up and down arrows to move it to its desired position. Once the Selected list is complete, select OK. The variables will be displayed in that order in the Current Conditions screen

700-Axiom Man Rev. 10 15 Jul 2019 197/210
9.2 CURRENT CONDITIONS REFRESH
There are two ways to refresh the Current Conditions screen: manually and timed refresh. The Current Conditions screen can be manually updated by selecting the Refresh icon . This will refresh the Current Conditions screen once. If there is a need to continually review Current Conditions over a short period of time, an alternative to manually refreshing the screen is to place the Datalogger in Timed Refresh mode. When in Timed Refresh the Current Conditions screen is refreshed at selected time intervals for a maximum of 60 minutes. The default value is every 60 seconds.
IMPORTANT! Manual and Timed refresh do not trigger a new set of readings from SDI sensors or Process outputs. SDI sensors will continue to display the last value read from the sensor in accordance with its configured reading interval, so it may be several minutes or hours old.
9.2.1 TIMED REFRESH
To enable the Timed Refresh function, select Current Conditions> Setup > Edit. The Timed Refresh indicator is highlighted in blue. Press the blue portion to bring you to the Current Conditions Refresh Settings screen.
Figure 9-3: Current Conditions Refresh Settings
Select the Enabled box, then use the arrows to set the desired refresh interval. Time intervals from 5-120 seconds can be set. Select OK>OK to return to the Current Conditions screen. Timed Refresh information is now displayed in the Current Conditions Setup (Timed Refresh: 30 seconds) and Current Conditions screens (Refresh in: hh:mm:ss). To turn Timed Refresh off, follow the same steps and toggle the Enabled box to remove the check mark.
9.2.2 TRIGGERING AN SDI READ
An SDI Read (Forced Read) differs from the refresh functions in that it will return a read from ALL sensors (including SDI sensors) at the time of the forced read.
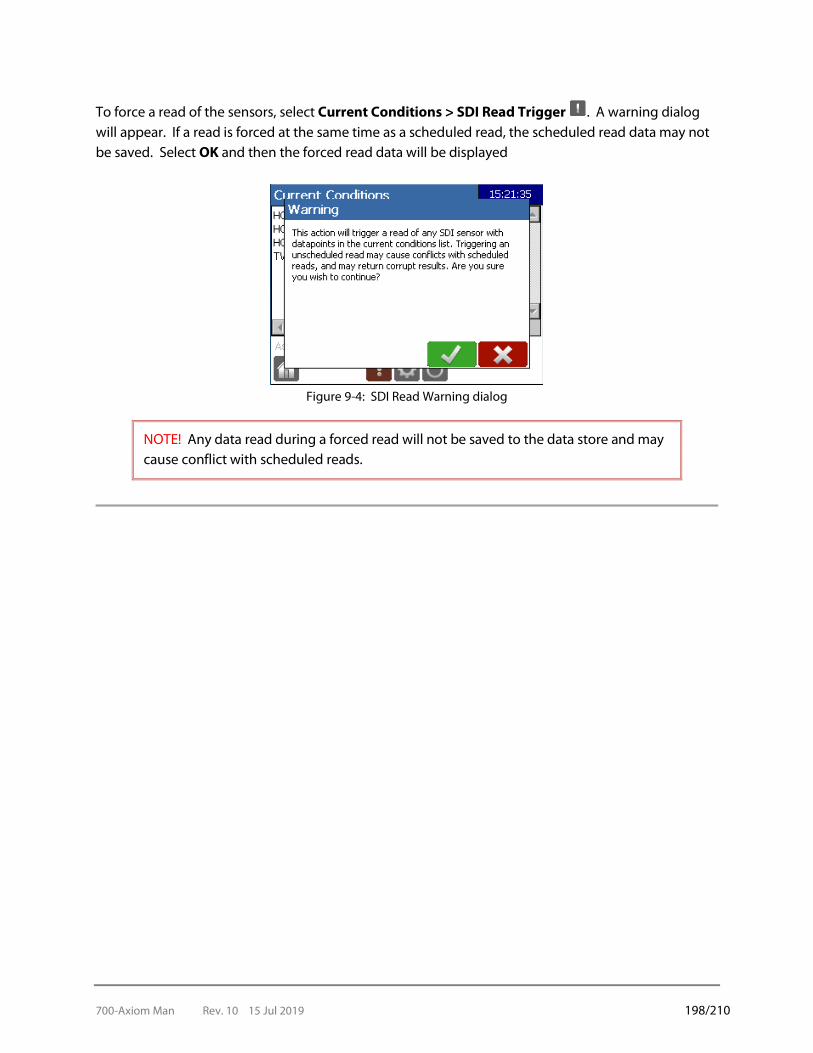
700-Axiom Man Rev. 10 15 Jul 2019 198/210
To force a read of the sensors, select Current Conditions > SDI Read Trigger . A warning dialog will appear. If a read is forced at the same time as a scheduled read, the scheduled read data may not be saved. Select OK and then the forced read data will be displayed
Figure 9-4: SDI Read Warning dialog
NOTE! Any data read during a forced read will not be saved to the data store and may cause conflict with scheduled reads.
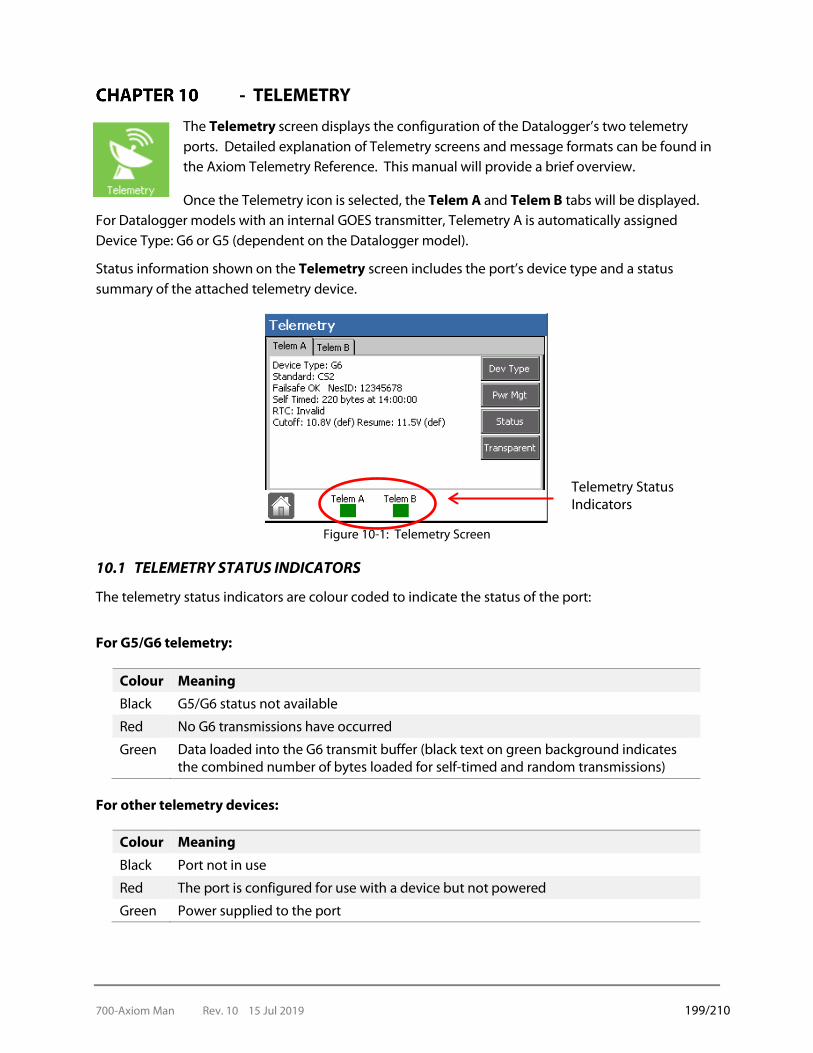
700-Axiom Man Rev. 10 15 Jul 2019 199/210
- TELEMETRY
The Telemetry screen displays the configuration of the Datalogger’s two telemetry ports. Detailed explanation of Telemetry screens and message formats can be found in the Axiom Telemetry Reference. This manual will provide a brief overview.
Once the Telemetry icon is selected, the Telem A and Telem B tabs will be displayed. For Datalogger models with an internal GOES transmitter, Telemetry A is automatically assigned Device Type: G6 or G5 (dependent on the Datalogger model).
Status information shown on the Telemetry screen includes the port’s device type and a status summary of the attached telemetry device.
Figure 10-1: Telemetry Screen
10.1 TELEMETRY STATUS INDICATORS
The telemetry status indicators are colour coded to indicate the status of the port:
For G5/G6 telemetry:
Colour Meaning
Black G5/G6 status not available
Red No G6 transmissions have occurred
Green Data loaded into the G6 transmit buffer (black text on green background indicates the combined number of bytes loaded for self-timed and random transmissions)
For other telemetry devices:
Colour Meaning
Black Port not in use
Red The port is configured for use with a device but not powered
Green Power supplied to the port
Telemetry Status Indicators

700-Axiom Man Rev. 10 15 Jul 2019 200/210
For WRLS-AXIOM-PC telemetry, in addition to the indications for other telemetry devices:
Colour Meaning Blue Ready to connect to PC. Blue with W Waiting. Has established connectivity and waiting for commands. Blue with A Active. Actively transmitting/receiving information.
Examples:
Port A in power saving mode Port B has power supplied
Port A has power supplied Port B not in use
Port A is operating with a WRLS-AXIOM-PC and is actively transmitting / receiving information. Port B has power supplied

700-Axiom Man Rev. 10 15 Jul 2019 201/210
10.2 MIGRATING A PREVIOUS G5 CONFIGURATION TO A G6 DATALOGGER
Upgrading from a Datalogger with an internal G5 Telemetry Port to one with an internal G6 Telemetry Port can be done without re-configuring the new Datalogger. Simply load a configuration containing the previous G5 set up to the new G6 Datalogger (see Chapter 3 Section 3.3 – Load Configuration). The settings from the G5 will be migrated to the G6 with no additional steps.
Customers upgrading from an external G5 device to a new external G6 can also migrate settings, but an additional step is required. The user must choose G6 as their Port Type by selecting it in the Telemetry screen (Telemetry> Telem A or B Tab >Dev Type>G6).
Figure 10-2: Migrating a Datalogger with an external G5 device to one with an external G6 device
NOTES:
1) The new G6 device must be on the same port as the G5 device was, in order for the migration to occur.
2) This fix will only support an upgrade from G5 to G6 and cannot be used to downgrade the G6 to a G5.
3) To use G6 specific features such as METEOSAT and International satellite networks the user must manually select these options from the G6 Configuration screen.
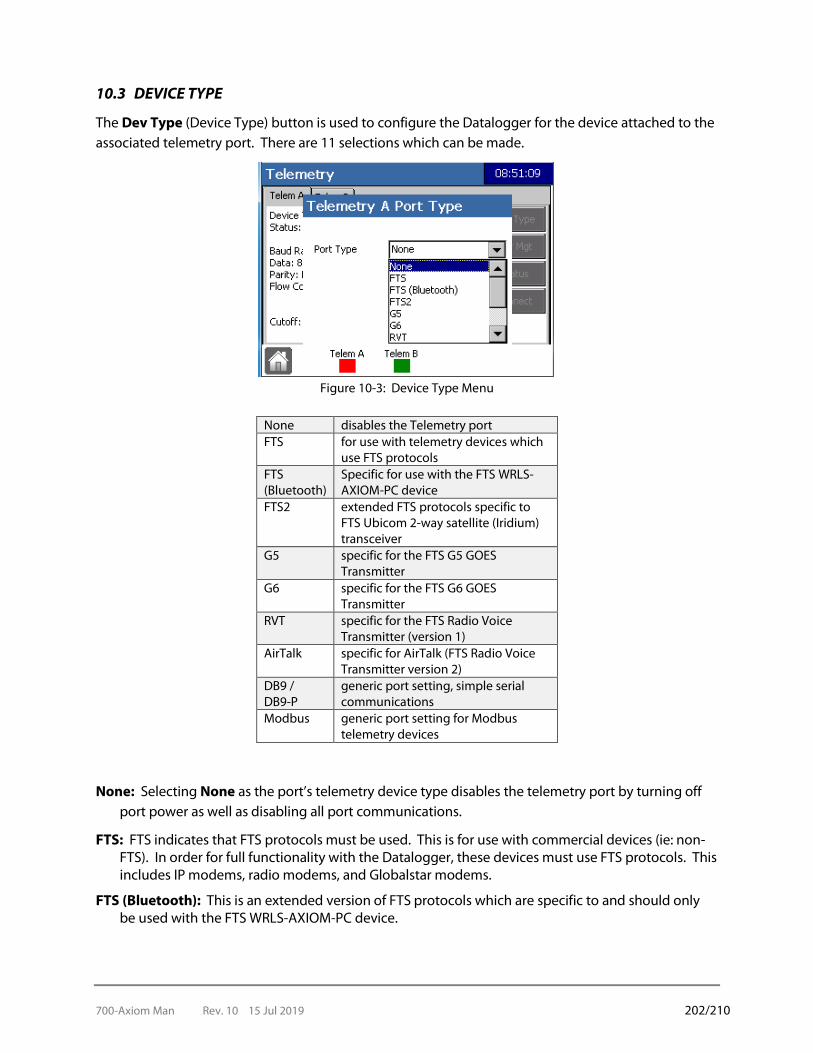
700-Axiom Man Rev. 10 15 Jul 2019 202/210
10.3 DEVICE TYPE
The Dev Type (Device Type) button is used to configure the Datalogger for the device attached to the associated telemetry port. There are 11 selections which can be made.
Figure 10-3: Device Type Menu
None: Selecting None as the port’s telemetry device type disables the telemetry port by turning off port power as well as disabling all port communications.
FTS: FTS indicates that FTS protocols must be used. This is for use with commercial devices (ie: non-FTS). In order for full functionality with the Datalogger, these devices must use FTS protocols. This includes IP modems, radio modems, and Globalstar modems.
FTS (Bluetooth): This is an extended version of FTS protocols which are specific to and should only be used with the FTS WRLS-AXIOM-PC device.
None disables the Telemetry port FTS for use with telemetry devices which
use FTS protocols FTS (Bluetooth)
Specific for use with the FTS WRLS-AXIOM-PC device
FTS2 extended FTS protocols specific to FTS Ubicom 2-way satellite (Iridium) transceiver
G5 specific for the FTS G5 GOES Transmitter
G6 specific for the FTS G6 GOES Transmitter
RVT specific for the FTS Radio Voice Transmitter (version 1)
AirTalk specific for AirTalk (FTS Radio Voice Transmitter version 2)
DB9 / DB9-P
generic port setting, simple serial communications
Modbus generic port setting for Modbus telemetry devices

700-Axiom Man Rev. 10 15 Jul 2019 203/210
FTS2: This is an extended version of FTS protocols which are specific to and should only be used with the FTS Ubicom Transmitter. There are two options from which to select:
Ubicom – this is the option which should be selected by most customers
UbicomDoD - specific to Ubicoms operated by the U.S. Department of Defense.
Refer to the Axiom Telemetry Reference for detailed Ubicom setup instructions.
G5: The G5 device type is specific to and should only be used with the FTS G5 GOES Transmitter.
G6: The G6 device type is specific to and should only be used with the FTS G6 GOES Transmitter. G6 status information reported on the Telemetry screen includes:
Section 10.2 provides a brief look at G6 configuration. Refer to the Axiom Telemetry Reference Manualfor detailed G6 configuration instructions.
RVT: The RVT device type is specific to and should only be used with the FTS RVT Radio Voice Transmitter.
Refer to the RVT Telemetry Reference Manual for detailed RVT configuration and status information provided by Status.
AirTalk: The AirTalk device type is specific to and should only be used with the FTS AirTalk radio voice transmitter.
Refer to the Air Talk Telemetry Reference Manual for detailed configuration instructions and for status information provided by Status.
DB9/DB9-P: The DB9/DB9-P device type is for simple serial communication. The port settings are user configurable.
Refer to the Axiom Telemetry Reference for detailed DB9/DB9-P configuration instructions.
Modbus: The Modbus device type is specific to and should only be used with the Modbus compatible devices.
NesID the G6’s current NESDIS identification number
Failsafe the state of the G6’s failsafe circuit
Timed Tx Info the number of bytes to be sent at the next timed transmission time
RTC the status of the G6’s real time clock
Standard the standard (CS1 or CS2) that the G6 implements
Cut-off/Resume the station power management cut-off and resume voltages
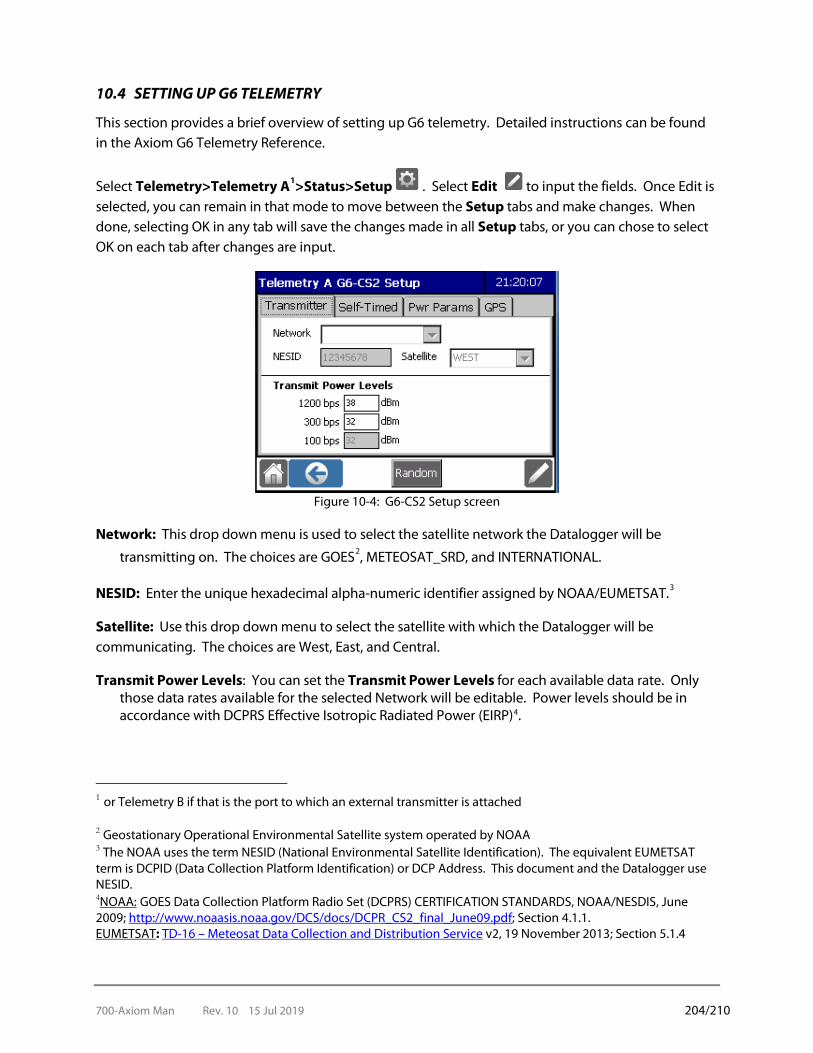
700-Axiom Man Rev. 10 15 Jul 2019 204/210
10.4 SETTING UP G6 TELEMETRY
This section provides a brief overview of setting up G6 telemetry. Detailed instructions can be found in the Axiom G6 Telemetry Reference.
Select Telemetry>Telemetry A1>Status>Setup . Select Edit to input the fields. Once Edit is selected, you can remain in that mode to move between the Setup tabs and make changes. When done, selecting OK in any tab will save the changes made in all Setup tabs, or you can chose to select OK on each tab after changes are input.
Figure 10-4: G6-CS2 Setup screen
Network: This drop down menu is used to select the satellite network the Datalogger will be
transmitting on. The choices are GOES2, METEOSAT_SRD, and INTERNATIONAL.
NESID: Enter the unique hexadecimal alpha-numeric identifier assigned by NOAA/EUMETSAT.3
Satellite: Use this drop down menu to select the satellite with which the Datalogger will be communicating. The choices are West, East, and Central.
Transmit Power Levels: You can set the Transmit Power Levels for each available data rate. Only those data rates available for the selected Network will be editable. Power levels should be in accordance with DCPRS Effective Isotropic Radiated Power (EIRP)4.
1 or Telemetry B if that is the port to which an external transmitter is attached
2 Geostationary Operational Environmental Satellite system operated by NOAA 3 The NOAA uses the term NESID (National Environmental Satellite Identification). The equivalent EUMETSAT term is DCPID (Data Collection Platform Identification) or DCP Address. This document and the Datalogger use NESID. 4NOAA: GOES Data Collection Platform Radio Set (DCPRS) CERTIFICATION STANDARDS, NOAA/NESDIS, June 2009; http://www.noaasis.noaa.gov/DCS/docs/DCPR_CS2_final_June09.pdf; Section 4.1.1. EUMETSAT: TD-16 – Meteosat Data Collection and Distribution Service v2, 19 November 2013; Section 5.1.4

700-Axiom Man Rev. 10 15 Jul 2019 205/210
The G6 is capable of transmitting in the following ranges:
Clear Button: When in edit mode, a Clear button will appear on the bottom of the screen. Pressing the button will set all G6 parameters back to the default settings. This includes the message format.
Random Button: If transmitting in Time Ordered, WSC, Pseudo Binary or USGS-PB message, transmit parameters for random transmissions can be configured from the Transmitter tab by pressing the Random button on the bottom of the screen. Details of setting up random transmissions are found in the Axiom G6 Telemetry Reference.
10.4.1 MESSAGE FORMATS
NOTE: A detailed explanation of each message format can be found in the Axiom Telemetry Reference.
Figure 10-5: G6 setup – Self-Timed Tab
Message format, transmit parameters, and other message determiners are entered from the Self-Timed tab. There are five message format types in the Format drop down menu: BLM, Time Ordered, WSC, Pseudo Binary, and USGS-PB . Transmit Parameters: Input your assigned Transmit Parameters in the following fields:
Channel : Your assigned PRIME CHANNEL
Window : Your assigned TRANSMIT (XMT) WINDOW
Bit Rate : Your assigned platform baud rate
Interval : Your assigned PERIOD (how often transmissions will be made)
First Tx : Your assigned FIRST TRANSMISSION time
100 bps 300 bps 1200 bps Transmit Power Levels (dBm) 26 - 40.5 26-38.5 26-38.5
700-Axiom Man Rev. 10 15 Jul 2019 206/210
Index
A
Acknowledge Active · See SDI Commands Address
Changing · See SDI Sensors:Changing Address Address Query · See SDI Commands Air Sensor · 56 Analog Sensor · See SDI-AM Application
Update procedure · 38 Application Update · 37 Audit log · See Service Auto-Fill Measurement Time · 22 Average Process
Calculations · 157
B
Battery Status Indicators · 4
Binary · 184 BUBBLER · 116 Buffer
Timing · 62 Built-in
Data Points · 141 Function
Mathematical Operators · 166 Logical Operators · 163 Status Indicators · 4
C
Calculations Automatic Offset, Burst Averaging · 22 Automatic Offset, SDI-12 Setup · 22 Average Process · 157 Fuel Moisture · 57 SDI-PT · 66 SR50(Snow Depth) · 108 Weighted Average · 160
Calibration · See Service:screen calibration
Ch
Change Address · See SDI Commands
C
Codes
SDI-RMY Status · 99 SR50 Measurement Quality · 108 Threshold Sampling Codes · 171 WindSonic Status Codes · 111
Commands · See SDI Commands Configuration · 11
Clear · 20 Configuration Summary · 17 Load · 13
Load from local template · 16 Load from USB · 15
Save Configuration · 11 Local Template Folder · 13 USB Station Folder · 12 USB Template Folder · 12
Start Visit Report · 16 CSV · 184 CSV-SHEF · 184 Current Conditions · 193
Refresh · 195 Timed Refresh · 195 Triggering an SDI Read · 196 Variables · 194
D
Data · 180 Advanced · 192 Conditional logging · 182 Data Graph View · 189 Data Table · 191 Delete Data · 188 Download · 184
Variables · 186 Graph Setup · 190 Logging · 180 Logging interval · 181
Data Graph View · See Data Data Points
Built-in · 143 Datalogger update · See Service Date/Time · 32
Formats · 186 Dedicated Sensors · 52
Air · 56 Fuel stick · 57 Rain · 52 Wind · 55
Delete Sensors · 126
Detecting SDI sensors · See SDI Sensors:Detecting DigiTemp · 104
Burst Average · 105 Discharge
Process · 177

700-Axiom Man Rev. 10 15 Jul 2019 207/210
E
Equations Mathematical Operators · See Processes:Function Maximum and Minimum · 146 Running Average · 160 Steinhart - Hart equation (simplified) · 167 Vector Average · 158
wind speed · 158 Water Pressure Conversion · 82 Weighted Average · 160
Excitation · See SDI-AM:Excitation Output Settings
F
Fuel Stick · 57 Calculations
Fuel Moisture · 57 Humidity · 57
G
Graph · See Data
I
Icons · 2 Action Icons · 3 Main · 2
In-Line Logging · 22, 46 Dedicated sensor · 47 Internal sensor · 47 SDI sensor · 47 SDI sensor with M Commands · 48
Internal Sensors Battery · 49 Case temperature · 50 Solar Panel · 50
Interval SDI Command · 61
L
Latitude · 9 Longitude · 9
M
Mapping SDI Sensors · See SDI Sensors:Mapping Measurement command · See SDI Commands
N
Notes Visit Report · 28
O
Offset · 61 Operating Algorithms · 7
Current Conditions Loop · 7 Data Acquisition Loop · 7 Display Loop · 7 SDI Sensor Loop · 7 Transmit Loop · 8
Output · 6 Output Format
Binary · 184 CSV · 184 CSV-SHEF · 184
P
Passwords · 35 Lost Passwords · 36
Polling SDI-PT · 84 Shaft Encoder · 76 Stage Sensor · 69 Tavis Stage Sensor · 95
Port Delay · 25 Power Modes
Radar Sensor · 115 Windsonic · 110
Processes · 140 Adding a process · 140 Average · 157 Definition · 6 Delta · 154
Differences between cumulative and delta values · 154
Discharge · 177 Function · 166
mathematical operators · 166 Maximum and minimum · 145
Logging · 147 Name Restrictions · 144 Ordering · 141 Peak wind · 149
Running Peak Wind · 152 Timed Peak Wind · 150
Script · 163 Logical Operators · 163
Threshold sampling · 170 Trigger input · 172
User variable · 162 Weighted Average · 160
700-Axiom Man Rev. 10 15 Jul 2019 208/210
Q
Quality Numbers Radar Sensor · 114
R
Radar Power Modes · 115 Quality Numbers · 114
Radar Stage · 113 Refresh
Current Conditions · 195
S
Script Logical Operators · 163
SDI 12 · 127 SDI Commands · 135, 136
Acknowledge Active · 136 Address Query · 136 Change Address · 136 Measurement command · 137 Send data command · 138 Send Identification · 137
SDI Port Delay · 25 SDI Read
Triggering · 196 SDI Sensors · 60
Addresses · 129 Changing Address · 134 Command Setup · 61 Detecting SDI sensors · 128 Field Setup · 62 Mapping · 129 Sensor Extensions · See Sensor Extensions Sensor Setup · 60 Transparent Mode · See SDI Sensors:Transparent Mode
SDI-AM · 86 Analog input settings · 88 Burst Average · 88 Counter settings · 90 Excitation output settings · 89 Period Count · 90 Power output settings · 88 Running Count · 90
SDI-PT · 79 Burst Average · 80 Conversion equation · 82 Offset Name · 80 Polling · 84 Pressure-Depth Conversion · 80 Raw Name · 80 Set Stage · 83
SDI-RMY · 98
Averaging Scalar and Vector · 100
Instantaneous Wind Speed · 98 Peak Reading · 101 Peak Reset · 102 Status Codes · 99
SDI-THS · 124 Send data command · See SDI Commands Send Identification · See SDI Commands Sensor Extensions · 39, 59
Adding · 39 BUBBLER · 116 Deleting · 40 DigiTemp · 104, See DigiTemp Radar · 113 SDI-AM · 86, See SDI-AM SDI-PT · 79, See SDI-PT SDI-RMY · 98, See SDI-RMY SDI-THS · 124 Shaft Encoder · 72, See Shaft encoder SR50 · 106, See SR50 Stage · 65, See Stage Sensor Tavis Stage Sensor · 92, See Tavis Stage Sensor WindSonic · 110
Sensor Setup Dedicated · 52 General · 45 In-line Logging · 46 Internal Sensors · 49 SDI Generic · 60
Sensors · 6, 43 Adding a sensor · 44 Dedicated · 43, See Dedicated Sensors Dedicated Sensors · 52 Deleting sensors · 126 Extensions · 43, See Sensor Extension Internal · 43, See Internal Sensors SDI · See SDI Sensors Variable Names, restrictions · 46
Serial Number Table · See Service Service · 27
Audit log · 31 Datalogger update · 37 Logout · 42 Passwords · 35 Screen calibration · 42 Serial Number Table · 34 Set Date/Time · 32
Non-DCP platforms · 33 Time synchronization · 32
Visit Report · 27 Shaft Encoder
Burst Average · 74 Offset Name · 73 Polling · 76 Raw Name · 73 Set Stage · 75
Snow Depth Calculations · See SR50:Calculations Snow Depth Sensor · See SR50
700-Axiom Man Rev. 10 15 Jul 2019 209/210
Sonic Ranging · See SR50 SR50 · 106
Calculations · 108 Measurement Quality Numbers · 108 SR50-AT · 107
Stage Sensor Burst Average · 67 Offset name · 66 Polling · 69 Raw name · 66 SDI-PT Calc · 66 Set Stage · 68 Setup · 65
Stage · 65 Stage Sensors
BUBBLER · 116 Radar · 113
Station · 9 About · 9, 10 Site Tab · 9
Status Indicators · 3 Battery · 4 Built –in · 4 SDI · 4 Telemetry · 5
Steinhart - Hart Equation · 167
T
Tavis Stage Sensor · 92 Averaging · 93 Offset Name · 93 Polling · 95 Raw Name · 93 Set Stage · 95
Telemetry · 197 Device Type
AirTalk · 201 DB9/DB9-P · 201 FTS · 200
Radio modem · 200 FTS Bluetooth · 200 FTS2 · 201
G5 · 201 G6 · 201 Modbus · 201 None · 200 RVT · 201 Ubicom · 201
Status Indicators · 5 Temperature and Humidity · See Dedicated Sensors:Air Templates · 11 THS · See Air Sensor Timed Refresh
Current Conditions · 195 Tip Increment · 52 Transparent Mode · See SDI Sensors:Transparent Mode Trigger input · 172 TTS · See Turbidity Threshold Values Turbidity Threshold Values
Rising/Falling · 173
V
Variables Current Conditions · 194 Name restrictions · 46 Ordered List · 186 User variable (processes) · 162
Visit Report · See Service Notes · 28
W
Weighted Average Calculations · 160
Wind Sensors Dedicated · 55 SDI-RMY · 98 WindSonic (SDI-UWS-Gill) · 110
WindSonic · 110 Filtered Speed · 111 Low Power Mode · 110 Status Code · 111

700-Axiom Man Rev. 10 15 Jul 2019 210/210
DOCUMENT REVISION HISTORY
Revision Date Description
1 17 Jul 2015 Original release based on Rev 6 of G5 Config Ref. AS ver 3.2.2 Renamed to replace the Configuration Reference
2 05 Oct 2015 Updated for AS 3.3.2 and AS 3.4.0.18. Auto-fill measurement time and Radar Sensor Extension added.
3 10 Dec 2015 Updated for AS 3.5.1.1. New Visit Report screens, running delta field in Avg Process.
4 04 Feb 2016 Updated for AS 3.7.0.13. New features in Discharge Process
5 11 Mar 2016 Updated for AS 3.7.2.8. SDI Generic Conditional Measurement Tab.
6 21 Sep 2016 Updated for AS 3.7.3.22. Added Telemetry type FTS (Bluetooth).
7 15 Jun 2017 Updated for AS 3.7.4.3. Added Ubicom DoD Device Type information
8 9 May 2018 Added Bubbler and SDI-THS sensor extensions, error codes, explanation of Delta Processes total differences (DL-2399), p. 150-151.
9 22 Oct 2018 Clarified which sensor extension to use with the SDI-PT-KEL (sections 5.5 and 5.9)(RDG-130). Corrected default sensor names for DigiTemp and SDI-RMY (DL-2203).
10 15 Jul 2019 Updated Bubbler Extension information/screenshots (AS 3.12.0.14)
Related Documents