Article Extranuclear Actions of the Androgen Receptor Enhance Glucose-Stimulated Insulin Secretion in the Male Graphical Abstract Highlights d Male b cell ARKO mice exhibit decreased glucose-stimulated insulin secretion (GSIS) d Testosterone enhances GSIS from cultured male mouse and human b cells via AR d The AR is extranuclear in b cells and enhances GSIS in a cAMP-dependent manner d The activated AR amplifies the insulinotropic effect of glucagon-like peptide-1 Authors Guadalupe Navarro, Weiwei Xu, David A. Jacobson, ..., Guido Verhoeven, John A. Katzenellenbogen, Franck Mauvais-Jarvis Correspondence [email protected] In Brief Men with testosterone deficiency are at increased risk for type 2 diabetes. Navarro et al. reveal that testosterone enhances glucose-stimulated insulin secretion via the interaction between an extranuclear androgen receptor and the GLP-1 receptor in b cells, which increases cellular cAMP levels and amplifies the incretin effect of GLP-1. Navarro et al., 2016, Cell Metabolism 23, 837–851 May 10, 2016 ª 2016 Elsevier Inc. http://dx.doi.org/10.1016/j.cmet.2016.03.015

Welcome message from author
This document is posted to help you gain knowledge. Please leave a comment to let me know what you think about it! Share it to your friends and learn new things together.
Transcript

Article
Extranuclear Actions of th
e Androgen ReceptorEnhance Glucose-Stimulated Insulin Secretion inthe MaleGraphical Abstract
Highlights
d Male b cell ARKOmice exhibit decreased glucose-stimulated
insulin secretion (GSIS)
d Testosterone enhances GSIS from cultured male mouse and
human b cells via AR
d The AR is extranuclear in b cells and enhances GSIS in a
cAMP-dependent manner
d The activated AR amplifies the insulinotropic effect of
glucagon-like peptide-1
Navarro et al., 2016, Cell Metabolism 23, 837–851May 10, 2016 ª 2016 Elsevier Inc.http://dx.doi.org/10.1016/j.cmet.2016.03.015
Authors
Guadalupe Navarro, Weiwei Xu,
David A. Jacobson, ...,
Guido Verhoeven,
John A. Katzenellenbogen,
Franck Mauvais-Jarvis
In Brief
Men with testosterone deficiency are at
increased risk for type 2 diabetes.
Navarro et al. reveal that testosterone
enhances glucose-stimulated insulin
secretion via the interaction between an
extranuclear androgen receptor and the
GLP-1 receptor in b cells, which
increases cellular cAMP levels and
amplifies the incretin effect of GLP-1.

Cell Metabolism
Article
Extranuclear Actions of the AndrogenReceptor Enhance Glucose-StimulatedInsulin Secretion in the MaleGuadalupe Navarro,2,8 Weiwei Xu,1,8 David A. Jacobson,3 Barton Wicksteed,4 Camille Allard,1 Guanyi Zhang,5
Karel De Gendt,6 Sung Hoon Kim,7 Hongju Wu,1 Haitao Zhang,5 Guido Verhoeven,6 John A. Katzenellenbogen,7
and Franck Mauvais-Jarvis1,2,*1Diabetes Discovery Research and Gender Medicine Laboratory, Department of Medicine, Section of Endocrinology and Metabolism,Tulane University Health Sciences Center, New Orleans, LA 70112, USA2Department of Medicine, Division of Endocrinology, Metabolism and Molecular Medicine, Northwestern University, Feinberg School of
Medicine, Chicago, IL 60611, USA3Department of Molecular Physiology and Biophysics, Vanderbilt University, Nashville, TN 37212, USA4Kovler Diabetes Center, Section of Endocrinology, Diabetes and Metabolism, and Department of Medicine, University of Chicago, Chicago,
IL 60637, USA5Department of Pathology and Laboratory Medicine, Tulane Cancer Center, School of Medicine, New Orleans, LA 70112, USA6Laboratory of Clinical and Experimental Endocrinology, Department of Clinical and Experimental Medicine, Gasthuisberg,Catholic University of Leuven, Leuven 3000, Belgium7Department of Chemistry, University of Illinois, Urbana, IL 61801, USA8Co-first author
*Correspondence: [email protected]://dx.doi.org/10.1016/j.cmet.2016.03.015
SUMMARY
Although men with testosterone deficiency are atincreased risk for type 2 diabetes (T2D), previousstudies have ignored the role of testosterone andthe androgen receptor (AR) in pancreatic b cells.We show that male mice lacking AR in b cells(bARKO) exhibit decreased glucose-stimulated insu-lin secretion (GSIS), leading to glucose intolerance.The AR agonist dihydrotestosterone (DHT) enhancesGSIS in cultured male islets, an effect that is abol-ished in bARKO�/y islets and human islets treatedwith an AR antagonist. In b cells, DHT-activatedAR is predominantly extranuclear and enhancesGSIS by increasing islet cAMP and activating theprotein kinase A. In mouse and human islets, the in-sulinotropic effect of DHT depends on activation ofthe glucagon-like peptide-1 (GLP-1) receptor, andaccordingly, DHT amplifies the incretin effect ofGLP-1. This study identifies AR as a novel receptorthat enhances b cell function, a finding with implica-tions for the prevention of T2D in aging men.
INTRODUCTION
Because of the recent dramatic increase in human life expec-
tancy, men will spend a significant proportion of their lives in
a state of testosterone deficiency. Against this backdrop, the
impact of testosterone deficiency on the development of visceral
obesity and insulin resistance (IR) in men is well established (Ba-
saria et al., 2006; Khaw and Barrett-Connor, 1992; Mauvais-Jar-
Ce
vis, 2011; Pitteloud et al., 2005; Zitzmann, 2009; Zitzmann et al.,
2006). However, the role of testosterone deficiency in b cell
dysfunction remains unknown. This remarkable lack of knowl-
edge is particularly intriguing because previous research has
implicated low testosterone levels in the pathogenesis of type
2 diabetes (T2D) (Haffner et al., 1996; Oh et al., 2002; Stellato
et al., 2000). Recently, an observational study from the Veterans
Healthcare Administration showed that among prostate cancer
patients, androgen deprivation therapy with GnRH agonists
was associated with an increased risk for T2D (Keating et al.,
2012). Another study showed marked hyperglycemia and
decreased pancreatic b cell function among prostate cancer pa-
tients after androgen deprivation therapy (Inaba et al., 2005).
Notably, testosterone deficiency has also been associated with
impaired fasting glucose and glucose intolerance independently
of obesity and the metabolic syndrome in men (Ho et al., 2013).
Because the development of hyperglycemia requires some de-
gree of b cell dysfunction, these observations, when considered
together, raise the possibility that testosterone deficiency pre-
disposes to b cell failure in men.
Testosterone action is mediated by the androgen receptor
(AR), a ligand-activated transcription factor. The extent to which
the AR plays a role in b cell failure in testosterone deficient males
is unknown. Remarkably, we currently have no insight on the role
of the AR in b cell function in males. These issues are highly rele-
vant to the health of aging men because novel antidiabetic
androgen therapies that do not increase risk of prostate growth
could have a substantial public health impact.
We investigated the role of the AR in b cell function in the male
using b cell-specific AR knockout (bARKO�/y) mice and cultured
mouse and human islets. We show that the b cell AR is important
for testosterone potentiation of glucose-stimulated insulin secre-
tion (GSIS) in male mice as well as in human islets. This AR-
dependent pathway involves a rise in islet cyclic AMP (cAMP)
ll Metabolism 23, 837–851, May 10, 2016 ª 2016 Elsevier Inc. 837

Figure 1. Characterization of the bARKO–/y
Mouse
(A) PCR showing the recombined 404 bp fragment
of the Ar allele in islets from male bARKO�/y.
(B) Pancreas section showing AR immunofluores-
cent staining (red) in b cells colocalizing with insulin
(green) in control mice and confirming successful
AR deletion in bARKO�/y islets (the scale bar rep-
resents 10 mm).
(C) PCR showing recombination of Ar allele in hy-
pothalamus.
(D–F) Immunohistochemistry staining (D) and
quantification of AR immunoreactivity in (E) the
ARC and (F) VMH of control and bARKO�/y mice.
Results are representative of three to five mice.
and the activation of protein kinase A (PKA), which amplifies the
effect of glucagon-like peptide-1 (GLP-1) on GSIS. We identify
the AR as a physiological enhancer of b cell function via the
cAMP pathway, a finding that has clinical and pharmacological
implications for the prevention of T2D in aging men.
RESULTS
Generation of bARKO–/y MiceTo explore the role of AR in b cell function, we generated a
bARKO�/y mouse using the Cre-loxP strategy and crossing
ARlox/y mice with RIP-Cre transgenic mice. A previous report
showed that mice expressing the RIP-Cre transgene developed
glucose intolerance and impaired insulin secretion (Lee et al.,
2006). It is therefore recommended that studies involving
crosses between floxed mice and RIP-Cre mice use the RIP-
Cre as the control group rather than the littermate floxed or
wild-type (WT) mice. We also observed that RIP-Cre mice were
hyperglycemic compared with littermate ARlox/y mice and to a
lesser extent compared with WT mice (Figures S1A and S1B).
Thus, we used RIP-Cre mice as the control group. We confirmed
recombination of the Ar allele in islets from male bARKO�/y mice
by the presence of the excised 404 bp fragment (Figure 1A).
Immunostaining for AR showed cytosolic AR expression in islet
b cells from control mice and confirmed elimination of the AR
protein in islets from male bARKO�/y (Figure 1B). Because
gene manipulations using RIP-Cre transgenic mice are reported
to promote recombination in nutrient neurons (Lee et al., 2006),
we investigated whether recombination of AR had occurred in
hypothalamic neurons of bARKO�/y mice. We observed recom-
838 Cell Metabolism 23, 837–851, May 10, 2016
bination of the Ar allele in hypothalamus
of male bARKO�/y mice with the pres-
ence of the excised 404 bp fragment
(Figure 1C). Accordingly, male bARKO�/y
mice displayed a significant decrease in
AR protein expression in the arcuate
nucleus (ARC) and ventromedial hypo-
thalamus (VMH) (Figures 1D–1F). We
confirmed the presence of the non-re-
combined 952 bp Ar allele in all other tis-
sues of the bARKO�/y mice (Figure S1C)
in which AR protein expression was not
altered (Figure S1D). Although AR expres-
sion was decreased in hypothalamus, bARKO�/y mice showed
no alteration in food intake or body weight between 12 and
20 weeks of age (Figures S1E–S1G).
Male bARKO–/y Mice Exhibit b Cell Dysfunction andGlucose IntoleranceWeassessed glucose homeostasis inmale control and bARKO�/y
mice at 12 weeks of age. This point is before the development of
late-onset obesity and IR observed in mice globally lacking AR
(Fan et al., 2005) or selectively in neurons (Yu et al., 2013). On
normal chow, bARKO�/y mice showed no alteration in fed or
fasting blood glucose or in fed insulin levels (Figures 2A–2C).
However, they showed decreased fasting insulin concentrations
(Figure 2D). Following an intraperitoneal (i.p.) glucose challenge,
bARKO�/y mice exhibited decreased basal and GSIS (Figure 2E)
that resulted in glucose intolerance compared with controls (Fig-
ure 2F). Despite their deficient insulin secretion, bARKO�/y mice
had similar islet architecture, b cell mass, and pancreatic insulin
concentration as controls (Figures 2G and 2H). Control and
bARKO�/y mice also exhibited similar insulin sensitivity during
an insulin tolerance test (ITT) (Figure S2A) and had similar serum
glucagon concentrations (183 ± 36 and 169 ± 27 pg/ml, controls
and bARKO�/y, respectively, mean ± SE). To investigate whether
AR deficiency in b cells synergizes with a second b cell stress
in vivo to alter b cell function, we induced metabolic stress in
male control and bARKO�/y mice by feeding them a Western
diet for 9 weeks. After this challenge, bARKO�/y mice displayed
reduced fasted and fed serum insulin concentrations compared
with control mice (Figures 2J and 2M) and developed hypergly-
cemia in both the fed and fasted states (Figures 2I and 2L). As

a result, the insulin deficiency index (insulin/glucose) was more
pronounced in bARKO�/y mice (Figures 2K and 2N). It followed
that Western diet-fed bARKO�/y mice showed decreased GSIS
and developed glucose intolerance (Figures 2O and 2P) relative
to controls. However, following Western diet feeding, bARKO�/y
mice still showed no alteration in b cell mass or pancreatic insulin
concentrations (Figures 2Q and 2R). In addition, bARKO�/y and
control mice on Western diets had similar insulin sensitivity
following an ITT (Figure S2B). Note that female islets exhibited
lower AR expression than males (Figures S2C and S2D), and fe-
male bARKO�/� mice showed no alteration in GSIS and glucose
tolerance test (GTT) on either normal chow or Western diet (Fig-
ures S2E–S2P). We then examined whether AR deficiency in
male b cells synergizes with additional b cell stress induced by
streptozotocin (STZ) to alter b cell survival. We observed no
increased predisposition to STZ in male bARKO�/y mice (Figures
S2Q–S2T). Thus, bARKO�/y mice developed altered GSIS, which
was exacerbated following Western diet feeding but without
alteration in b cell mass or increased predisposition to STZ-
induced insulin-deficient diabetes.
AR Deficiency in Neurons Does Not Alter bCell Functionin Male MiceInnervation of islet b cells regulates insulin secretion by afferent
signals arising from the hypothalamus (Ahren, 2000). To deter-
mine whether AR hypothalamic deletion contributes to themeta-
bolic phenotype of male bARKO�/y mice, we generated a
neuronal AR knockout (NARKO�/y) mouse by crossing ARlox/y
mice with synapsin-Cre transgenic mice that selectively express
Cre in neuronal cells (Schoch et al., 1996). We confirmed
decreased AR expression in brains of male NARKO�/y mice
with normal AR expression in other non-neuronal tissues (Fig-
ures S3A and S3B). Male NARKO�/y mice showed no alteration
in fasting and fed blood glucose or in insulin levels, observations
that were similar when the mice were on normal chow (Fig-
ures 3A–3D) or on a Western diet (Figures 3G–3J). Importantly,
unlike male bARKO�/y mice, male NARKO�/y mice showed
no alteration in GSIS and retained similar glucose tolerance
and insulin sensitivity compared to controls on both normal
chow and Western diet (Figures 3E, 3F, 3K, 3L, S3C, and S3D).
To further eliminate the possibility that the defect in GSIS
observed in male bARKO�/y mice derives from the partial AR
hypothalamic deletion, we generated a second b cell-specific
ARKO model (bARKOMIP) by crossing our ARlox mice with the
MIP-CreERT1Lphi (MIP-CreERT) transgenic mouse that lacks
Cre activity in the hypothalamus (Wicksteed et al., 2010). The
MIP-CreERT transgenic mouse, however, has limitations
because of transgene-driven expression of human growth hor-
mone leading to decreased glucagon secretion and improved in-
sulin sensitivity (Oropeza et al., 2015). Therefore, we used ARlox
MIP-CreERTmice (without tamoxifen [Tam] injection) as controls
of bARKOMIP. ARlox (with Tam) and ARlox MIP-CreERT (without
Tam) displayed similar glucose tolerance (Figure S3E). Tam-
induced recombination was induced in adult ARlox MIP-
CreERT mice to obtain bARKOMIP mice. Characterization of the
bARKOMIP confirmed the selective AR deletion in b cells (Fig-
ure S3F), but bARKOMIP b cells exhibited incomplete recombina-
tion, leading to a 60% decrease in AR expression (Figure S3G).
Despite these limitations, upon exposure to a Western diet,
bARKOMIP mice exhibited decreased fasting insulin and blunted
GSIS following an i.p. glucose challenge that resulted in glucose
intolerance, compared with controls (Figures 3M and 3N). The
insulin sensitivity remained similar between the two groups
(Figure S3H). Taken together, these observations confirm that
elimination of AR in b cells in mice produces a defect in GSIS
leading to glucose intolerance.
AR Deficiency in b Cells Alters GSIS from Male IsletsTo determine whether the altered insulin secretion of bARKO�/y
mice was an islet cell autonomous effect, we studied GSIS in
static incubation in cultured islets from male control and
bARKO�/y mice that were fed normal chow. Consistent with
the importance of AR in GSIS observed in vivo, at 16.7 mM
glucose, control islets exposed to the natural AR agonist dihy-
drotestosterone (DHT) showed increased GSIS compared with
those exposed to vehicle. The stimulatory effect of DHT on
GSIS was abolished in bARKO�/y islets (Figure 4A). Notably, in
all groups of mice, only a minor increase in GSIS was observed
when glucose was increased from 2.8 to 16.7 mM, probably as a
consequence of the deleterious effect of the RIP-Cre transgene
on islet function (Lee et al., 2006). Islets from control and
bARKO�/y mice fed a Western diet showed a modest and non-
significant increase in GSIS over basal, which probably resulted
from the combined deleterious effect of the RIP-cre transgene
and Western diet on islet function (Figure 4B). However, at
16.7 mM glucose, control islets exposed to DHT showed
increased GSIS compared with vehicle-exposed islets (Fig-
ure 4B). Importantly, compared with control islets, bARKO�/y
islets exhibited decreased insulin secretion at both 2.8 and
16.7 mM glucose (Figure 4B).
We translated these findings tomale human islets. Exposure of
human islets to a physiological concentration of DHT enhanced
insulin secretion in the presence of 16.7 mM glucose, an effect
that was abolished by antagonizing AR with flutamide (Fig-
ure 4C). DHT, AR genetic elimination, and pharmacological inhi-
bition did not affect islet insulin content in mouse or human islets
(Figures 4D–4F). To study dynamic insulin secretion in vitro, male
control and bARKO�/y islets were placed in a perifusion system.
In this setting, insulin secretion in response to glucose is charac-
terized by a biphasic pattern (Lacy et al., 1972). The first phase is
a rapid and marked, but transient elevation in the secretory rate.
The second phase is characterized by a gradual increase in
secretion that lasts as long as the glucose stimulus is present.
Following DHT stimulation, control islets exhibited enhanced
first- and second-phase insulin secretion compared with vehicle
treatment (Figures 4G and 4I–4K). In contrast, the increased first
phase was not observed in bARKO�/y islets (Figures 4H–4K).
Further, bARKO�/y islets exhibited aberrant early second-phase
insulin secretion (Figure 4H) and lower global insulin secretion
than control islets (Figures 4I–4K).
Extranuclear AR Actions Enhance GSISThe AR is a classical ligand-activated nuclear receptor that
regulates the expression of target genes through binding to
an androgen response element (ARE) on the promoter of
target genes (Chang et al., 1988; Lubahn et al., 1988; Tilley
et al., 1989). Nongenomic actions of AR are thought to ac-
count for rapid, transcription-independent effects of androgens
Cell Metabolism 23, 837–851, May 10, 2016 839

Figure 2. Male bARKO–/y Mice Are Predisposed to b Cell Dysfunction and Glucose Intolerance
(A) Random fed blood glucose.
(B) Random fed serum insulin.
(C) Fasting blood glucose.
(D) Fasting serum insulin.
(E) i.p. GSIS (3 g/kg) with insulin area under the curve (AUC).
(legend continued on next page)
840 Cell Metabolism 23, 837–851, May 10, 2016

(Matsumoto et al., 2013). However, these nongenomic androgen
effects have been observed only in vitro and await functional vali-
dation in animal models. Inmouse prostate, a classical androgen
target tissue, AR immunohistochemical staining showed nuclear
localization (Figure S4A). In male mouse pancreatic islets and
in male human islets, however, AR colocalized with insulin in a
predominant extranuclear localization (Figures 5A, 5C, and
S4B) and was not observed in a cells (Figure 5B). We studied
AR subcellular localization by confocal microscopy following
binding of DHT in human prostate adenocarcinoma LNCaP cells,
a classical model of AR nuclear actions, and in INS-1 rat insulin-
secreting cells. In the absence of DHT, AR signal was predomi-
nantly extranuclear in LNCaP and INS-1 cells. As expected,
upon DHT stimulation, AR underwent nuclear translocation in
LNCaP cells (Figure 5D). In contrast, following DHT stimulation,
AR remained predominantly in the extranuclear compartment
of INS-1 cells (Figure 5E). Similar findings were observed in the
MIN-6 mouse insulin-secreting cells (Figure S4C). We next
studied AR subcellular localization by subcellular fractionation.
Confirming results obtained by microscopy, in LNCaP cells,
DHT produced a robust nuclear translocation of AR starting at
20 min and sustained for at least 8 hr (Figure 5F). In contrast, in
INS-1 cells, DHT produced a weak nuclear translocation of AR,
and the activated AR remained mainly in the cytosolic fraction
(Figure 5G).
Mechanism of AR Potentiation of GSIS in Pancreatic b
CellsHaving established that ligand-activated AR exhibits a prefer-
ential extranuclear location in b cells, we sought to determine
whether this extranuclear location is instrumental in stimulating
GSIS. To this end, we synthesized a novel androgen dendrimer
conjugate (ADC) that selectively activates extranuclear AR
signaling pathways but remains outside the nucleus (Table S1;
Figures S5A–S5D). We successfully used a similar estrogen
dendrimer conjugate to validate the function of extranuclear es-
trogen receptors (ERs) in b cell function and survival (Tiano and
Mauvais-Jarvis, 2012a, 2012b, 2012c; Tiano et al., 2011; Wong
et al., 2010). We confirmed that unlike DHT, ADC (1) cannot in-
crease AR-dependent gene transcription in cells transfected
with a reporter construct containing an ARE (Figure 6A) and (2)
cannot increase the expression of the prostate-specific antigen
(PSA), an AR target gene containing an ARE (Zhu et al., 2003)
(Figure 6B). In contrast, in cultured mouse and human islets, se-
(F) i.p. GTT (2 g/kg) with glucose AUC (n = 12–15).
(G) b Cell mass quantification and representative pictures of islets stained with in
(H) Pancreas insulin content.
(I) Random fed blood glucose following 9 weeks’ Western diet feeding.
(J) Fed insulin levels.
(K) Fed index of insulin deficiency (insulin/glucose).
(L) Fasting blood glucose.
(M) Fasting insulin levels.
(N) Fasting index of insulin deficiency.
(O) i.p. GSIS (3 g/kg) with insulin AUC.
(P) i.p. GTT (2 g/kg) with glucose AUC.
(Q) b Cell mass quantification and representative pictures of islets (the scale bar
(R) Pancreatic insulin content.
Data are frommice fed normal chow (A–H) or aWestern diet for 9 weeks (I–R). Mice
14 weeks of age. Values represent the mean ± SEM. *p < 0.05, **p < 0.01.
lective extranuclear activation of AR using ADC was as efficient
as DHT in enhancing GSIS (Figures 6C and 6D).
The observation that ligand-activated extranuclear AR stimu-
lates GSIS in b cells led us to hypothesize that in these cells,
DHT-activated AR interacts with membrane or cytosolic mole-
cules to enhance GSIS. GSIS is triggered by glucosemetabolism
that leads to increased ATP/ADP ratio, the closure of ATP sensi-
tive K+ channels that is followed by membrane depolarization,
opening of Ca2+ channels, and influx of intracellular calcium
[Ca2+]i (Jones et al., 1985). Using male WT islets exposed to
KCl at low glucose to depolarize the cell membrane, we investi-
gated whether AR acts through KATP channels and membrane
depolarization independently of glucose metabolism. As ex-
pected, KCl-treated islets showed increased insulin secretion
(Figure 6E). However, we observed no further effect of DHT on
insulin secretion, an observation demonstrating that AR does
not potentiate insulin secretion triggered by depolarization alone
(Figure 6E). We next investigated whether AR activation could
stimulate glucose metabolism (and therefore ATP generation)
and subsequent [Ca2+]i influx. Increasing glucose concentration
from 2.8 to 11 and 16.7 mM increased ATP concentration in
male WT mouse islets (Figure 6F). However, exposure to DHT
did not result in a further increase in ATP concentration in these
islets (Figure 6F). Similar results were obtained when we quanti-
fied the ATP/ADP ratio (Figure S5E). Consistent with these find-
ings, at 11mM glucose, DHT did not significantly increase ATP
concentration in control or bARKO�/y islets (Figure 6G). How-
ever, it is important to stress that bARKO�/y islets displayed
decreased ATP concentration compared with control islets
(Figure 6G).
We then explored whether DHT could increase [Ca2+]i influx.
Consistent with results for ATP concentration, raising glucose
concentration increased [Ca2+]i influx in both control and
bARKO�/y islets (Figure 6H). However, consistent with results
for ATP content, DHT did not further increase [Ca2+]i in control
or bARKO�/y islets (Figure 6H). Notably, at high glucose, as
in the case of ATP concentration, bARKO�/y islets exhibited
decreased [Ca2+]i compared with control islets (Figure 6H).
Thus, DHT increased insulin secretion without increasing
glucose metabolism or [Ca2+]i influx. We interpreted the
decreased ATP and [Ca2+]i in bARKO�/y islets as consequences
of glucose desensitization leading to decreased glucose meta-
bolism and ATP production. Indeed, genes involved in dediffer-
entiation of b cells secondary to hyperglycemia (Gck, Glut2)
sulin (green) and glucagon (red) (the scale bar represents 10 mm).
represents 10 mm).
were studied at 12 weeks of age (n = 12–14), and pancreases were removed at
Cell Metabolism 23, 837–851, May 10, 2016 841

(legend on next page)
842 Cell Metabolism 23, 837–851, May 10, 2016

were downregulated in glucose intolerant male bARKO�/y
islets compared with controls. In contrast, these genes were
not decreased in islets from normoglycemic female bARKO�/�
mice (Table S2).
The finding that DHT acting on AR enhanced GSIS without
increasing cellular ATP generation or [Ca2+]i influx suggested to
us that AR activation amplifies GSIS by acting downstream
and augmenting the Ca2+ signal. Incretins such as GLP-1
potentiate GSIS by increasing b cell concentrations of cAMP
(Lin and Haist, 1973). We explored the effect of DHT on cAMP
production in islets from male mice. In control male islets, DHT
increased cAMP production by approximately 2-fold (Figure 7A).
In contrast, the effect of DHT in increasing cAMP levels was not
observed in bARKO�/y islets (Figure 7A) or in WT islets treated
with the AR antagonist flutamide (Figure 7B), an observation
demonstrating its dependence on AR. Note that in these exper-
iments, DHT-induced cAMP production was independent from
phosphodiesterase (PDE) inhibition since DHT increased cAMP
concentration over vehicle in islets preincubated with PDE inhib-
itors. An increase in intracellular cAMP concentration activates
the cAMP-dependent PKA (Nesher et al., 2002). To determine
whether DHT-mediated potentiation of GSIS was dependent
on PKA activation, we used H-89, the PKA inhibitor. Although
DHT potentiated GSIS in cultured WT male islets, the DHT effect
was ablated in the presence of H-89 (Figure 7C). Further, activa-
tion of PKA leads to phosphorylation of the cAMP response
element-binding protein (CREB). In male mouse islets, DHT
exposure produced a rapid phosphorylation ofCREB (Figure 7D).
Thus, AR activation by DHT potentiates GSIS in a cAMP- and
PKA-dependent manner.
Interestingly, the insulinotropic effect of DHT observed in
mouse and human islets was not observed in INS-1 cells (Fig-
ure S6A) despite the fact that INS-1 cells express AR (Figure 5),
suggesting that the insulinotropic effect of DHT requires a
secreted factor, produced by islet non-b cells, that acts on b cells
in a paracrine manner. Therefore, we explored the hypothesis
that AR action in b cells amplifies GLP-1R signaling to increase
cAMP production, thus potentiating the insulinotropic action of
GLP-1. We reasoned that because GLP-1 is produced by
cultured islet a cells (Liu et al., 2011; Marchetti et al., 2012),
DHT enhances GSIS in cultured islets (which produce GLP-1)
but not in cultured INS-1 cells (which do not produce GLP-1).
Consistent with this hypothesis, in mouse and human islets
Figure 3. AR Deficiency in b Cells but Not in Neurons Alters GSIS
(A) Random fed blood glucose.
(B) Random fed serum insulin.
(C) Fasting blood glucose.
(D) Fasting serum insulin.
(E) i.p. GSIS (3 g/kg).
(F) i.p. GTT (2 g/kg) with glucose AUC.
(G) Random fed blood glucose following 9 weeks’ Western diet feeding.
(H) Fed insulin levels.
(I) Fasting blood glucose.
(J) Fasting insulin levels.
(K) GSIS (3 g/kg).
(L) GTT with glucose AUC. Data are from 20-week old bARKOMIP mice fed a We
(M) i.p. GSIS (3 g/kg) with insulin AUC (n = 5–6).
(N) i.p. GTT with glucose AUC (n = 5–6).
Data are from 12 week-old NARKO�/y mice fed normal chow (A–F) or a Western d
(Figure 7E) and in INS-1 cells (Figure S6B), DHT amplified the in-
sulinotropic effect of GLP-1 on GSIS. To explore the possibility
that DHT amplification of GSIS requires a functional GLP1-R,
we studied the effect of DHT in the presence of the selective
GLP1-R antagonist exendin (9-39) and in absence of exogenous
GLP-1 (Goke et al., 1993). The effect of DHT in amplifying GSIS
was abolished in the presence of exendin (9-39) (Figure 7F).
Together, these studies demonstrate that DHT amplifies the in-
sulinotropic effect of exogenous and islet-derived GLP-1, and
this effect requires a functional GLP-1R.
DISCUSSION
To study the role of testosterone in b cells in vivo, we generated a
mouse with conditional elimination of AR in these cells. Although
male bARKO�/y mice also exhibit decreased AR expression in
hypothalamus, the insulin-secretory defect observed in these
mice results from the loss of AR in b cells. This is supported by
the following evidence. First, abnormalities observed in male
bARKO�/y mice are reproduced in isolated male bARKO�/y islets
and in human islets exposed to an AR antagonist, demonstrating
that this defect is secondary to the loss of AR in the islets. Sec-
ond, the insulin-secretory defect observed in male bARKO�/y
mice is not observed in male mice that selectively lack AR in
neurons. Finally, and most important, a second bARKOMIP
mouse exhibiting selective and inducible b cell AR elimination
in adulthood recapitulates the impaired GSIS, leading to glucose
intolerance.
A critical finding of this study is that AR deficiency in b cells of
male mice impairs GSIS, which produces glucose intolerance
because activation of b cell AR is required to enhance both first-
and second-phase GSIS. Importantly, the insulinotropic function
of the AR is present in human islets at physiological concentra-
tions of testosterone. Together, these observations suggest
that (1) testosterone is necessary for normal GSIS in men, and
(2) men with androgen deficiency display a deficit in GSIS that
predisposes them to T2D.
Early studies showing binding of androgen to a nuclear pro-
tein in prostate (Bruchovsky and Wilson, 1968) followed by the
cloning of the AR and analysis of its structure (Chang et al.,
1988; Lubahn et al., 1988; Tilley et al., 1989) led to the establish-
ment of a paradigm in which AR acts as a nuclear ligand-acti-
vated transcription factor. Indeed, in prostate, AR is maintained
stern diet for 8 weeks.
iet for 9 weeks (G–L) (n = 12–15). Values represent the mean ± SEM. *p < 0.05.
Cell Metabolism 23, 837–851, May 10, 2016 843

Figure 4. Testosterone Enhances GSIS via AR in Male Islets
(A) GSIS measured in static incubation in islets from the indicated mice fed a normal chow and treated with vehicle or DHT (10�8 M) in vitro for 48 hr prior to static
incubation.
(B) GSISmeasured in static incubation in islets frommice fed aWestern diet for 9 weeks and treated with vehicle or DHT (10�8 M) in vitro prior to static incubation.
(C) GSIS measured in static incubation in male human islets treated with vehicle, DHT, or flutamide.
(D) Islet insulin content from (A).
(E) Islet insulin content from (B).
(F) Islet insulin content from (C). Data in (A)–(F) are from 10mouse islets or 5 human islet equivalents per condition (n = 6–8 independent wells). Human islet donors
were two Caucasian males under 50 years of age with body mass index (BMI) between 25 and 27 kg/m2.
(G and H) GSIS during islet perifusion from (G) Rip-Cre mice and (H) bARKO�/y mice.
(legend continued on next page)
844 Cell Metabolism 23, 837–851, May 10, 2016

in the cytosol in an inactive complex by heat-shock proteins.
Upon ligand binding, AR homodimerizes and translocates to
the nucleus (Prescott and Coetzee, 2006). In b cells, however,
AR is mostly localized in an extranuclear compartment, where
it remains sequestrated following androgen stimulation. When
male cells are permanently exposed to DHT in vivo, AR is
localized in the nucleus of prostate cells. In contrast, under
the same conditions, AR is observed in the extranuclear
compartment of islet b cells. The nongenomic actions of AR
are thought to account for the rapid, transcription-independent
effects of androgens (Matsumoto et al., 2013). However, to date,
these nongenomic effects of androgens have been observed
only in vitro and therefore await validation in vivo in animal
models.
We previously described novel extranuclear actions for ERs in
b cells (Tiano and Mauvais-Jarvis, 2012a, 2012b, 2012c; Tiano
et al., 2011; Wong et al., 2010). Unlike the nuclear ER that
acts as a ligand-activated transcription factor in breast and
uterine cells, extranuclear ERs protect pancreatic islet b cell
function and survival via cytosolic interactions with kinases
and transcription factors. The present study provides the first
evidence of rapid androgen action via an extranuclear AR
involved in the pathophysiology of insulin secretion. This novel
androgen action is observed at physiological concentration of
the hormone, is validated in vivo, and most important, it is found
in human tissue.
In b cells, GSIS is driven by glucosemetabolism that generates
ATP (Ashcroft, 1980) and triggers [Ca2+]i influx. Testosterone
activation of the AR increases GSIS independently of increases
in glucose metabolism and [Ca2+]i influx. Rather, AR activa-
tion increases GSIS from b cells by producing cAMP and acti-
vating the cAMP-dependent PKA pathway. Consistent with AR
signaling via a PKA pathway, transgenic mice with enhanced
PKA catalytic activity in pancreatic islets (Kaihara et al., 2013;
Song et al., 2011) exhibit increased GSIS but, like male
bARKO�/y mice, show no change in b cell mass or insulin synthe-
sis. A previous study suggested that testosterone stimulates islet
insulin mRNA and content (Morimoto et al., 2001). However, we
found no evidence of AR stimulation of insulin synthesis.
Because the investigators used testosterone (which is converted
into estrogen), the effect they described was likely due to testos-
terone aromatization to estrogen acting on ERs (Wong et al.,
2010).
Incretins, such as GLP-1 and exendin 4, restore first-phase
and enhance second-phase insulin release in humans with T2D
(Egan et al., 2002; Fehse et al., 2005). Most of these incretin ef-
fects in b cells require activation of the cAMP-dependent PKA
pathway via the G protein-coupled receptor (GPCR) of GLP-1
(Drucker and Nauck, 2006), which activates the adenylate
cyclase (AC) to trigger cAMP production. We observe that in
cultured mouse and human islets, the insulinotropic effect of
testosterone is abolished by pharmacological inhibition of the
GLP-1R in absence of exogenous GLP-1, demonstrating that
the AR requires an active GLP-1R to enhance GSIS and en-
(I) Total AUC from GSIS (60–90 min).
(J) AUC from the first-phase GSIS (60–65 min).
(K) AUC from the second-phase GSIS (65–90 min). Islets were isolated from mic
Values represent the mean ± SEM. *p < 0.05, **p = 0.01.
hances the effect of islet-produced GLP-1. Accordingly, AR acti-
vation by testosterone also amplifies the insulinotropic effect of
exogenous GLP-1 in these islets. Therefore, the testosterone-
AR pathway could act as an incretin sensitizer in b cells. In the
future, the effect of testosterone in amplifying the insulinotropic
action of other ligands of Gs-linked GPCR, such as glucagon
or glucagon inhibitory polypeptide, deserves investigation. Inter-
estingly, cultured islets from bARKO�/y mice previously exposed
to aWestern diet secrete less insulin than controls. This suggests
that AR is also necessary for islet adaption to metabolic stress.
Further studies are also needed to address this issue. Themech-
anism through which we propose AR stimulates GSIS in male b
cells is summarized in Figure 7G.
The biological basis for androgen stimulation of insulin secre-
tion and the integration of androgenic and metabolic signals in
males is likely to be anabolic because both testosterone and in-
sulin are anabolic hormones. In contrast to males, AR deficiency
in b cells of female mice does not alter GSIS. Females have lower
AR expression in b cells compared with males, an observation
that likely promotes weaker androgen signaling (Visakorpi
et al., 1995). In addition, females exhibit lower serum and tissue
androgen concentrations than are necessary to activate the AR
(Mauvais-Jarvis, 2011). We therefore interpret the absence of
phenotype of bARKO�/� female mice as a consequence of the
evolution of females’ lower dependence on AR activation and
signaling.
This study has clinical ramifications. Selective AR modulators
(SARMs) are a novel class of AR ligands. The goal of SARMs is to
provide androgen therapy for age-related functional decline with
customized anabolic activity on muscle and bone but without
androgenic action in the prostate (Mohler et al., 2009). Our
work suggests that androgen deficiency-induced T2D is due at
least partially to a loss of androgen stimulation of GSIS in b cells.
Designing SARMs with AR agonistic activity in b cells could
represent a novel strategy to prevent androgen deficiency-
related glucose dysregulation in men.
In conclusion, AR action is required in males’ b cells for GSIS.
This study identifies the AR as a novel b cell receptor and
enhancer of b cell function via the cAMP-dependent pathway
and has important clinical and pharmacological implications for
prevention of T2D in aging men.
EXPERIMENTAL PROCEDURES
Generation of Mutant Mice
The bARKO�/y mouse was generated by crossing mice carrying the AR
gene with floxed exon 2 on their X chromosome (ARlox) with transgenic mice
overexpressing the Cre recombinase under control of the RIP promoter
(RIP-Cre; Jackson Laboratory). Generation and characterization of ARlox�/�
have been described (De Gendt et al., 2004). NARKO�/� mice were generated
by crossing ARlox+/� with the Syn-Cre+/� mice (Jackson Laboratory) as
previously described (Yu et al., 2013). To generate bARKOMIP mice, we
crossed ARflox mice with the Ins1-Cre/ERT (MIP-Cre+/�) transgenic mouse
(Jackson Laboratory). We induced Tam inactivation of AR after puberty and
following a 5 day treatment with Tam (75 mg/kg). All studies were performed
e 12–14 weeks of age and perifused in batches of 60 islets per group.
Cell Metabolism 23, 837–851, May 10, 2016 845

Figure 5. AR Extranuclear Location in Pancreatic b Cells
(A andB)Mouse pancreas section showing an islet with AR immunofluorescent staining (green) in b cells (A and B) colocalizing with insulin (red) (A) and DAPI (blue)
merged images (the scale bar represents 10 mm).
(C) Human islet showing AR (green) expression (the scale bar represents 20 mm).
(D and E) Immunofluorescent staining of AR (green) in (D) LNCaP cell and (E) INS-1 cell treated with vehicle or DHT for 40min and imaged by confocal microscopy
(the scale bar represents 15 mm).
(F and G) LNCaP cells (F) and INS-1 cells (G) treated with DHT at the indicated time points, followed by subcellular fractionation. Top: representative immunoblots
of AR, GAPDH (cytosolic marker), and Histone H3 (nuclear marker) expression. Middle: AR cytosolic and nuclear localizations were quantified by dividing AR
expression by the expression of the respective markers. Bottom: AR relative nuclear translocation was calculated as the ratio of nuclear (N) over cytosolic (C) AR
expression. N = 3 independent experiments.
with the approval of the Northwestern University and Tulane University Animal
Care and Use Committees in accordance with National Institutes of Health
(NIH) guidelines.
846 Cell Metabolism 23, 837–851, May 10, 2016
Western Diet
Mice were weaned onto a customized diet designed to be high in saturated
fat and simple sugars (sucrose and fructose) to mimic a Western diet (30%

Figure 6. AR Amplifies GSIS in b Cells via
cAMP Signaling
(A) Luciferase activity measured in LNCaP cells
following a 6 hr treatment by DHT (10�8 M) and
ADC (10�7 M) (n = 4 independent wells).
(B) PSA protein expression in LNCaP cells after
2 days of DHT and ADC treatment.
(C) GSIS measured in static incubation in WT male
mouse islets treated with vehicle, DHT (10�8 M),
flutamide (10�8 M), ADC (10�7 M), and ADC plus
flutamide, dendrimer (concentration adjusted to
ligand concentration in ADC) in vitro for 40 min.
Results from two experiments (n = 6 independent
wells).
(D) GSIS measured in static incubation in male
human islets treated with vehicle, DHT (10�8 M),
flutamide (10�8 M), ADC (10�7 M), and ADC plus
flutamide, dendrimer in vitro for 40 min. Results
from two experiments (n = 6 independent wells).
Human donors were a male Caucasian aged 28
years with BMI 18.6 kg/m2 and a male Latino aged
61 years with BMI 25.8 kg/m2. The results are the
average from two different donors and experi-
ments.
(E) Effect of DHT on insulin secretion at low
glucose and KCl (30 mM) during a 30 min stimu-
lation (n = 6 independent wells).
(F) ATP concentration measured on lysates from
WT male islets following stimulation with glucose
and DHT for 30 min (n = 10 independent wells, at
least three experiments).
(G) ATP levels measured on islets from male
RIP-Cre and bARKO�/y islets following 30min DHT
stimulation and at 11 mM glucose. In (C)–(G), ten
mouse islets were used per condition.
(H) Intracellular Ca2+ influx in isolated mouse islets
from Rip-Cre and bARKO�/y mice (left) and corre-
sponding AUC (right) from the indicated glucose
concentrations.
AMF; 14.9% kcal protein, 33.2% kcal carbohydrates, 51.9% kcal fat; Harlan
Teklad) for 9 weeks.
Metabolic Studies
Blood glucose was measured from tail vein blood using a One Touch Ultra
glucometer (Lifescan). Insulin (Linco Research) and glucagon (ALPCO) were
Cell M
measured in serum by ELISA. For i.p. GTT (2 g/kg)
and GSIS (3 g/kg), mice were fasted overnight
before glucose injection. For i.p. ITT, mice were
fasted for 6 hr prior to insulin injection (0.75 U/kg).
Pancreas insulin concentration was measured
from acid ethanol extract as previously described
(Tiano et al., 2011).
Immunohistochemistry and b Cell Mass
Quantification
Insulin and glucagon staining aswell as b cell mass
measurement from pancreas sections were per-
formed as previously described (Tiano et al.,
2011). For AR staining of human islets, and islets
from bARKO�/y, bARKOMIP, and their respective
controls, sections were incubated with primary
antibody rabbit anti-AR (PG-21, 1:100; Millipore).
Secondary antibody goat biotinylated anti-rabbit
(1:200; Linco) and Alexa 568 tyramide signal ampli-
fication kit (TSA; Molecular Probes) was used for
signal amplification. For AR staining in the hypothalamus, tissues were fixed
in 10% formalin at 4�C and stored in 30% sucrose until sectioning in 20 mm
sections. Sections were incubated with primary antibody anti-AR (N20,
1:250; Santa Cruz). Secondary goat biotinylated anti-rabbit antibody was
visualized using the VECTASTAIN Elite ABC kit (Vector Laboratories).
Images were captured at 203 magnification using a fluorescent microscope
etabolism 23, 837–851, May 10, 2016 847
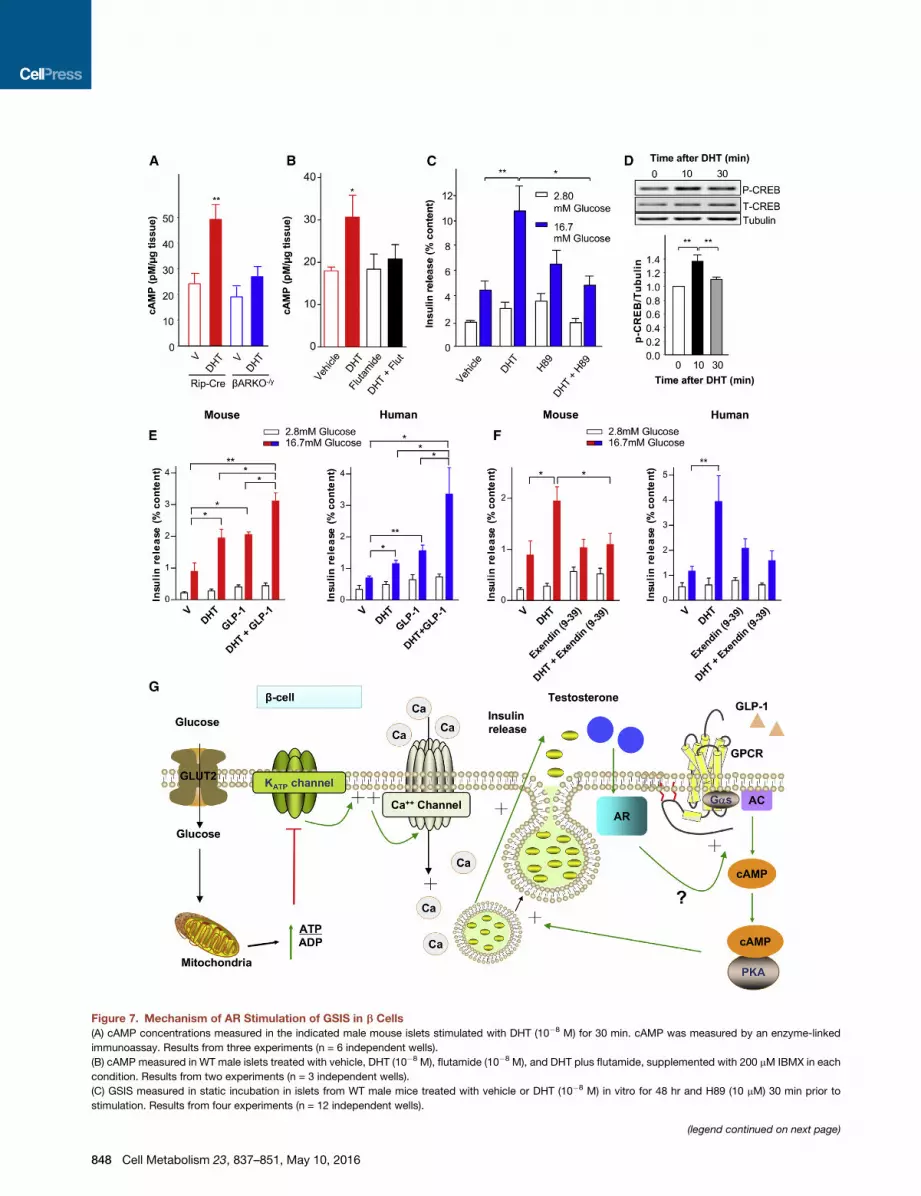
Figure 7. Mechanism of AR Stimulation of GSIS in b Cells
(A) cAMP concentrations measured in the indicated male mouse islets stimulated with DHT (10�8 M) for 30 min. cAMP was measured by an enzyme-linked
immunoassay. Results from three experiments (n = 6 independent wells).
(B) cAMP measured in WT male islets treated with vehicle, DHT (10�8 M), flutamide (10�8 M), and DHT plus flutamide, supplemented with 200 mM IBMX in each
condition. Results from two experiments (n = 3 independent wells).
(C) GSIS measured in static incubation in islets from WT male mice treated with vehicle or DHT (10�8 M) in vitro for 48 hr and H89 (10 mM) 30 min prior to
stimulation. Results from four experiments (n = 12 independent wells).
(legend continued on next page)
848 Cell Metabolism 23, 837–851, May 10, 2016

(Nikon Eclipse E400). LNCaP and INS-1 cells were treated with vehicle or
DHT (10�8 M) for 40 min, followed by fixation in 4% paraformaldehyde.
LNCaP cells were incubated in the anti-AR antibody (N20, 1:200; Santa
Cruz) and then in the goat anti-rabbit secondary antibody (1:400). INS-1 cells
were incubated in the anti-AR antibody (N20, 1:200; Santa Cruz). The signal
was amplified using TSA. The images were taken using a Nikon A1 confocal
microscope.
Subcellular Fractionation
The LNCaP and INS-1 cells were treated with DHT for 20min, 40min, 1 hr, 3 hr,
and 8 hr. Subcellular fractionation was performed by first extracting the cyto-
solic proteins with dilution buffer, followed by extracting the nuclear protein
fractions with lysis buffer. Cytosolic and nuclear protein fractions were normal-
ized to GAPDH and Histone H3, respectively.
Islet Isolation and Insulin Secretion in Static Incubation
Islet isolation was performed following pancreatic duct injection with collage-
nase as described (Tiano et al., 2011). For measurement of insulin secretion,
islets were hand-picked under a dissection microscope and treated with
DHT (10�8 M; Steraloids), or vehicle (95% ethanol) for 48 hr. Insulin release
from islets was measured as previously described (Tiano et al., 2011). For
experiment with inhibitors, islets were treated with flutamide (10�8 M;
Sigma-Aldrich) or H-89 (10 mM; Cell Signaling).
Islet Perifusion
A perifusion system (Biorep Technologies) was used to determine the insulin
biphasic response. Briefly, batches of 60 mouse islets were perifused at
37�C, at a flow of 100 mL/min. Islets were first equilibrated for 60 min with
KRB solution containing 2.8 mM glucose, then stimulated for 30 min with
KRB solution contained either DHT (10�8 M) or vehicle (95% ethanol) and
16.7 mM glucose. Samples were collected in a 96-well plate, and insulin con-
centration was determined by ELISA (Millipore).
Luciferase Assay
LNCaP cells were transfected with ARR3-tk-luciferase reporter, containing
three repeats of AREs in tandem, upstream of the minimal tk enhancer fused
to the luciferase reporter (Snoek et al., 1996), or control plasmids containing
renilla luciferase reporter gene using TurboFect transfection reagent (Thermo
Scientific) and 48 hr prior to the treatment. On the experiment day, cells were
lysed, and dual-luciferase reporter assay system (Promega) was used to mea-
sure firefly and renilla luciferase activity sequentially. The ratio of firefly and
renilla luciferase reading was calculated to indicate the ability of DHT and
ADC to activate ARE-mediated luciferase expression.
ATP and cAMP Measurements
Intracellular ATP concentrations were measured in ten islets per condition
treated with either vehicle or DHT (10�8 M) for 30 min using EnzyLight ATP
assay and ADP assay (BioAssay Systems) according to the manufacturer’s
instructions. Islets were lysed to release ATP and ADP, and luminescence
was measured on a luminometer (BioTek) and quantified to ATP and ADP
standards. cAMP levels were determined in mouse islets pre-treated with
vehicle, DHT (10�8 M), flutamide (10�8M), or DHT plus flutamide for 30 min
in the presence of 200 mM 3-isobutyl-1-methylxanthine (IBMX). Islets were
lysed, and the supernatant was collected to measure the intracellular cAMP
level with the cyclic AMP XP Assay Kit (Cell Signaling) according to the
manufacturer’s instructions.
(D) Phosphorylation of CREB measured by western blotting in WT male islets trea
Islets were isolated from mice 12–14 weeks of age. Values represent the mean ±
(E) GSISmeasured in static incubation inWTmalemouse islets (left) andmale hum
GLP-1. Results from two experiments (n = 6 independent wells). Human donors
aged 53 years with BMI 33 kg/m2. The results are the average from two differen
(F) GSIS measured in static incubation in WT male mouse islets and male human
exendin (9-39). Results from two experiments (n = 6 independent wells). Human d
representative experiment from two different donors.
(G) Proposed mechanism of AR stimulation of GSIS in b cells. Testosterone activa
membrane. This stimulates AC and cAMP production, leading to PKA activation
Measurement of Cytoplasmic Calcium and Perifusion
Islet [Ca2+]i was measured with the Ca2+ sensitive dye fura-2 acetoxymethyl
ester (Molecular Probes) as previously described (Jacobson et al., 2007).
Mouse islets were plated on coverslips and dye-loaded with fura-2. Fluores-
cence imaging was performed using a Nikon Eclipse TE2000-U microscope
equipped with an epifluorescent illuminator (Sutter Instruments), a CoolSNAP
HQ2 camera (Photometrics), and Nikon Elements software (Nikon). The [Ca2+]iratios of emitted fluorescence intensities at excitation wavelengths of 340
and 380 nm (F340/F380) were determined every 5 s with background sub-
traction. A perifusion system (Biorep Technologies) containing DHT (10�8 M)
or vehicle (95% ethanol) 2.8 and 16.7 mM glucose was used to determine
biphasic response.
Statistical Analysis
Results are presented asmean ± SEM, as specified in figures. All statistical an-
alyses were performed using the unpaired Student’s t test. A p value less than
0.05 was considered to indicate statistical significance.
SUPPLEMENTAL INFORMATION
Supplemental Information contains Supplemental Experimental Procedures,
six figures, and two tables and can be found with this article online at http://
dx.doi.org/10.1016/j.cmet.2016.03.015.
AUTHOR CONTRIBUTIONS
F.M.-J. conceived the idea, designed experiments, analyzed the data, and
wrote and edited the manuscript. G.N. and W.X. contributed equally in
designing and performing experiments, analyzing data, and writing the manu-
script. Specifically, G.N. performed experiments related to bARKO�/y and
NARKO�/y mice, islet perifusion experiments and experiments of GSIS in static
incubation in bARKO�/y mouse and human islets, and measurements of ATP
concentration and cAMP in islets. W.X. performed experiments in bARKOMIP
mice, experiments of characterization of ADC extranuclear action in mouse
and human islets, cAMP and ATP measurements in islets, and experiments
of characterization of AR and GLP-1 stimulation of GSIS in mouse and human
islets. D.A.J. performed experiments of intracellular Ca2+ influx in isolated is-
lets. B.W. performed western blotting experiment of CREB phosphorylation.
C.A. performed experiments of bARKOMIP phenotypical characterization.
G.Z. and H.Z. provided technical expertise in performing subcellular fraction-
ation experiments and characterization of ADC extranuclear actions. K.D.G.
andG.V. generated and provided the AR lox/loxmouse. S.H.K. and J.A.K. syn-
thesized and provided ADC. H.W. provided reagents and participated in the
design of in vitro experiments.
ACKNOWLEDGMENTS
Human islets were provided by the Integrated Islet Distribution Program,
funded by the National Institute of Diabetes and Digestive and Kidney
Diseases and with support from the Juvenile Diabetes Research Foundation
International. This work was supported by grants from the NIH (DK074970,
HD044405), the American Heart Association (11IRG5570010), and the Amer-
ican Diabetes Association (7-13-BS-101) to F.M.-J. and in part from LA
CaTS Center grant 1 U54 GM104940. G.N. was supported in part by
NIH training grant T32 DK007169. D.A.J. was supported by NIH grant
ted with DHT for 10 and 30 min. Blots are representative of three experiments.
SEM. *p < 0.05, **p = 0.01.
an islets (right) treated with vehicle, DHT (10�8 M), GLP-1 (10�8 M), or DHT plus
were a male Latino aged 61 years with BMI 25.8 kg/m2 and a male Caucasian
t donors and experiments.
islets treated with vehicle, DHT (10�8 M), exendin (9-39) (10�7 M), or DHT plus
onor was a male Caucasian aged 53 years with BMI 33 kg/m2. The results are a
tion of AR in b cell indirectly activates a GPCR coupled with Gas at the plasma
, thus amplifying the glucose signal on insulin exocytosis.
Cell Metabolism 23, 837–851, May 10, 2016 849
DK097392. B.W. was supported by NIH grant DK085129. J.A.K. and S.H.K.
were supported by NIH grant DK015556.
Received: March 5, 2014
Revised: January 4, 2016
Accepted: March 29, 2016
Published: April 28, 2016
REFERENCES
Ahren, B. (2000). Autonomic regulation of islet hormone secretion–implications
for health and disease. Diabetologia 43, 393–410.
Ashcroft, S.J. (1980). Glucoreceptor mechanisms and the control of insulin
release and biosynthesis. Diabetologia 18, 5–15.
Basaria, S., Muller, D.C., Carducci, M.A., Egan, J., and Dobs, A.S. (2006).
Hyperglycemia and insulin resistance in men with prostate carcinoma who
receive androgen-deprivation therapy. Cancer 106, 581–588.
Bruchovsky, N., and Wilson, J.D. (1968). The intranuclear binding of testos-
terone and 5-alpha-androstan-17-beta-ol-3-one by rat prostate. J. Biol.
Chem. 243, 5953–5960.
Chang, C.S., Kokontis, J., and Liao, S.T. (1988). Molecular cloning of human
and rat complementary DNA encoding androgen receptors. Science 240,
324–326.
De Gendt, K., Swinnen, J.V., Saunders, P.T., Schoonjans, L., Dewerchin, M.,
Devos, A., Tan, K., Atanassova, N., Claessens, F., Lecureuil, C., et al. (2004).
A Sertoli cell-selective knockout of the androgen receptor causes spermato-
genic arrest in meiosis. Proc. Natl. Acad. Sci. U S A 101, 1327–1332.
Drucker, D.J., and Nauck, M.A. (2006). The incretin system: glucagon-like
peptide-1 receptor agonists and dipeptidyl peptidase-4 inhibitors in type 2
diabetes. Lancet 368, 1696–1705.
Egan, J.M., Meneilly, G.S., Habener, J.F., and Elahi, D. (2002). Glucagon-like
peptide-1 augments insulin-mediated glucose uptake in the obese state.
J. Clin. Endocrinol. Metab. 87, 3768–3773.
Fan, W., Yanase, T., Nomura, M., Okabe, T., Goto, K., Sato, T., Kawano, H.,
Kato, S., and Nawata, H. (2005). Androgen receptor null male mice develop
late-onset obesity caused by decreased energy expenditure and lipolytic ac-
tivity but show normal insulin sensitivity with high adiponectin secretion.
Diabetes 54, 1000–1008.
Fehse, F., Trautmann, M., Holst, J.J., Halseth, A.E., Nanayakkara, N., Nielsen,
L.L., Fineman, M.S., Kim, D.D., and Nauck, M.A. (2005). Exenatide augments
first- and second-phase insulin secretion in response to intravenous glucose in
subjects with type 2 diabetes. J. Clin. Endocrinol. Metab. 90, 5991–5997.
Goke, R., Fehmann, H.C., Linn, T., Schmidt, H., Krause, M., Eng, J., and Goke,
B. (1993). Exendin-4 is a high potency agonist and truncated exendin-(9-39)-
amide an antagonist at the glucagon-like peptide 1-(7-36)-amide receptor of
insulin-secreting beta-cells. J. Biol. Chem. 268, 19650–19655.
Haffner, S.M., Laakso, M., Miettinen, H., Mykkanen, L., Karhapaa, P., and
Rainwater, D.L. (1996). Low levels of sex hormone-binding globulin and testos-
terone are associated with smaller, denser low density lipoprotein in normogly-
cemic men. J. Clin. Endocrinol. Metab. 81, 3697–3701.
Ho, C.H., Yu, H.J., Wang, C.Y., Jaw, F.S., Hsieh, J.T., Liao, W.C., Pu, Y.S., and
Liu, S.P. (2013). Prediabetes is associated with an increased risk of testos-
terone deficiency, independent of obesity and metabolic syndrome. PLoS
ONE 8, e74173.
Inaba, M., Otani, Y., Nishimura, K., Takaha, N., Okuyama, A., Koga, M.,
Azuma, J., Kawase, I., and Kasayama, S. (2005). Marked hyperglycemia after
androgen-deprivation therapy for prostate cancer and usefulness of pioglita-
zone for its treatment. Metabolism 54, 55–59.
Jacobson, D.A., Weber, C.R., Bao, S., Turk, J., and Philipson, L.H. (2007).
Modulation of the pancreatic islet beta-cell-delayed rectifier potassium chan-
nel Kv2.1 by the polyunsaturated fatty acid arachidonate. J. Biol. Chem. 282,
7442–7449.
Jones, P.M., Stutchfield, J., and Howell, S.L. (1985). Effects of Ca2+ and a
phorbol ester on insulin secretion from islets of Langerhans permeabilised
by high-voltage discharge. FEBS Lett. 191, 102–106.
850 Cell Metabolism 23, 837–851, May 10, 2016
Kaihara, K.A., Dickson, L.M., Jacobson, D.A., Tamarina, N., Roe, M.W.,
Philipson, L.H., andWicksteed, B. (2013). b-Cell-specific protein kinase A acti-
vation enhances the efficiency of glucose control by increasing acute-phase
insulin secretion. Diabetes 62, 1527–1536.
Keating, N.L., O’Malley, A., Freedland, S.J., and Smith, M.R. (2012). Diabetes
and cardiovascular disease during androgen deprivation therapy: obser-
vational study of veterans with prostate cancer. J. Natl. Cancer Inst. 104,
1518–1523.
Khaw, K.T., and Barrett-Connor, E. (1992). Lower endogenous androgens
predict central adiposity in men. Ann. Epidemiol. 2, 675–682.
Lacy, P.E., Walker, M.M., and Fink, C.J. (1972). Perifusion of isolated rat islets
in vitro. Participation of the microtubular system in the biphasic release of
insulin. Diabetes 21, 987–998.
Lee, J.Y., Ristow,M., Lin, X.,White,M.F.,Magnuson,M.A., andHennighausen,
L. (2006). RIP-Cre revisited, evidence for impairments of pancreatic b-cell
function. J. Biol. Chem. 281, 2649–2653.
Lin, B.J., and Haist, R.E. (1973). Effects of some modifiers of insulin secretion
on insulin biosynthesis. Endocrinology 92, 735–742.
Liu, Z., Stanojevic, V., Avadhani, S., Yano, T., and Habener, J.F. (2011).
Stromal cell-derived factor-1 (SDF-1)/chemokine (C-X-C motif) receptor 4
(CXCR4) axis activation induces intra-islet glucagon-like peptide-1 (GLP-1)
production and enhances beta cell survival. Diabetologia 54, 2067–2076.
Lubahn, D.B., Joseph, D.R., Sullivan, P.M., Willard, H.F., French, F.S., and
Wilson, E.M. (1988). Cloning of human androgen receptor complementary
DNA and localization to the X chromosome. Science 240, 327–330.
Marchetti, P., Lupi, R., Bugliani, M., Kirkpatrick, C.L., Sebastiani, G., Grieco,
F.A., Del Guerra, S., D’Aleo, V., Piro, S., Marselli, L., et al. (2012). A local
glucagon-like peptide 1 (GLP-1) system in human pancreatic islets.
Diabetologia 55, 3262–3272.
Matsumoto, T., Sakari, M., Okada, M., Yokoyama, A., Takahashi, S.,
Kouzmenko, A., and Kato, S. (2013). The androgen receptor in health and dis-
ease. Annu. Rev. Physiol. 75, 201–224.
Mauvais-Jarvis, F. (2011). Estrogen and androgen receptors: regulators of
fuel homeostasis and emerging targets for diabetes and obesity. Trends
Endocrinol. Metab. 22, 24–33.
Mohler, M.L., Bohl, C.E., Jones, A., Coss, C.C., Narayanan, R., He, Y., Hwang,
D.J., Dalton, J.T., and Miller, D.D. (2009). Nonsteroidal selective androgen
receptor modulators (SARMs): dissociating the anabolic and androgenic activ-
ities of the androgen receptor for therapeutic benefit. J. Med. Chem. 52, 3597–
3617.
Morimoto, S., Cerbon, M.A., Alvarez-Alvarez, A., Romero-Navarro, G., and
Dıaz-Sanchez, V. (2001). Insulin gene expression pattern in rat pancreas during
the estrous cycle. Life Sci. 68, 2979–2985.
Nesher, R., Anteby, E., Yedovizky, M., Warwar, N., Kaiser, N., and Cerasi, E.
(2002). Beta-cell protein kinases and the dynamics of the insulin response to
glucose. Diabetes 51 (Suppl 1 ), S68–S73.
Oh, J.Y., Barrett-Connor, E., Wedick, N.M., and Wingard, D.L.; Rancho
Bernardo Study (2002). Endogenous sex hormones and the development of
type 2 diabetes in older men and women: the Rancho Bernardo study.
Diabetes Care 25, 55–60.
Oropeza, D., Jouvet, N., Budry, L., Campbell, J.E., Bouyakdan, K., Lacombe,
J., Perron, G., Bergeron, V., Neuman, J.C., Brar, H.K., et al. (2015). Phenotypic
characterization of MIP-CreERT1Lphi mice with transgene-driven islet expres-
sion of human growth hormone. Diabetes 64, 3798–3807.
Pitteloud, N., Mootha, V.K., Dwyer, A.A., Hardin, M., Lee, H., Eriksson, K.F.,
Tripathy, D., Yialamas, M., Groop, L., Elahi, D., and Hayes, F.J. (2005).
Relationship between testosterone levels, insulin sensitivity, and mitochon-
drial function in men. Diabetes Care 28, 1636–1642.
Prescott, J., and Coetzee, G.A. (2006). Molecular chaperones throughout the
life cycle of the androgen receptor. Cancer Lett. 231, 12–19.
Schoch, S., Cibelli, G., and Thiel, G. (1996). Neuron-specific gene expression
of synapsin I. Major role of a negative regulatory mechanism. J. Biol. Chem.
271, 3317–3323.
Snoek, R., Rennie, P.S., Kasper, S., Matusik, R.J., and Bruchovsky, N. (1996).
Induction of cell-free, in vitro transcription by recombinant androgen receptor
peptides. J. Steroid Biochem. Mol. Biol. 59, 243–250.
Song, W.J., Seshadri, M., Ashraf, U., Mdluli, T., Mondal, P., Keil, M., Azevedo,
M., Kirschner, L.S., Stratakis, C.A., and Hussain, M.A. (2011). Snapin mediates
incretin action and augments glucose-dependent insulin secretion. Cell
Metab. 13, 308–319.
Stellato, R.K., Feldman, H.A., Hamdy, O., Horton, E.S., and McKinlay, J.B.
(2000). Testosterone, sex hormone-binding globulin, and the development
of type 2 diabetes in middle-aged men: prospective results from the
Massachusetts male aging study. Diabetes Care 23, 490–494.
Tiano, J., and Mauvais-Jarvis, F. (2012a). Selective estrogen receptor modu-
lation in pancreatic b-cells and the prevention of type 2 diabetes. Islets 4,
173–176.
Tiano, J.P., and Mauvais-Jarvis, F. (2012b). Importance of oestrogen recep-
tors to preserve functional b-cell mass in diabetes. Nat. Rev. Endocrinol. 8,
342–351.
Tiano, J.P., andMauvais-Jarvis, F. (2012c).Molecularmechanisms of estrogen
receptors’ suppression of lipogenesis in pancreaticb-cells. Endocrinology153,
2997–3005.
Tiano, J.P., Delghingaro-Augusto, V., Le May, C., Liu, S., Kaw, M.K., Khuder,
S.S., Latour, M.G., Bhatt, S.A., Korach, K.S., Najjar, S.M., et al. (2011).
Estrogen receptor activation reduces lipid synthesis in pancreatic islets and
prevents b cell failure in rodent models of type 2 diabetes. J. Clin. Invest.
121, 3331–3342.
Tilley, W.D., Marcelli, M., Wilson, J.D., and McPhaul, M.J. (1989).
Characterization and expression of a cDNA encoding the human androgen
receptor. Proc. Natl. Acad. Sci. U S A 86, 327–331.
Visakorpi, T., Hyytinen, E., Koivisto, P., Tanner, M., Keinanen, R., Palmberg,
C., Palotie, A., Tammela, T., Isola, J., and Kallioniemi, O.P. (1995). In vivo
amplification of the androgen receptor gene and progression of human pros-
tate cancer. Nat. Genet. 9, 401–406.
Wicksteed, B., Brissova, M., Yan, W., Opland, D.M., Plank, J.L., Reinert, R.B.,
Dickson, L.M., Tamarina, N.A., Philipson, L.H., Shostak, A., et al. (2010).
Conditional gene targeting in mouse pancreatic ß-Cells: analysis of ectopic
Cre transgene expression in the brain. Diabetes 59, 3090–3098.
Wong, W.P., Tiano, J.P., Liu, S., Hewitt, S.C., Le May, C., Dalle, S.,
Katzenellenbogen, J.A., Katzenellenbogen, B.S., Korach, K.S., and Mauvais-
Jarvis, F. (2010). Extranuclear estrogen receptor-alpha stimulates NeuroD1
binding to the insulin promoter and favors insulin synthesis. Proc. Natl.
Acad. Sci. U S A 107, 13057–13062.
Yu, I.C., Lin, H.Y., Liu, N.C., Sparks, J.D., Yeh, S., Fang, L.Y., Chen, L., and
Chang, C. (2013). Neuronal androgen receptor regulates insulin sensitivity
via suppression of hypothalamic NF-kB-mediated PTP1B expression.
Diabetes 62, 411–423.
Zhu, Y.S., Cai, L.Q., You, X., Cordero, J.J., Huang, Y., and Imperato-McGinley,
J. (2003). Androgen-induced prostate-specific antigen gene expression is
mediated via dihydrotestosterone in LNCaP cells. J. Androl. 24, 681–687.
Zitzmann, M. (2009). Testosterone deficiency, insulin resistance and the meta-
bolic syndrome. Nat. Rev. Endocrinol. 5, 673–681.
Zitzmann, M., Faber, S., and Nieschlag, E. (2006). Association of specific
symptoms and metabolic risks with serum testosterone in older men. J. Clin.
Endocrinol. Metab. 91, 4335–4343.
Cell Metabolism 23, 837–851, May 10, 2016 851
Cell Metabolism, Volume 23
Supplemental Information
Extranuclear Actions of the Androgen
Receptor Enhance Glucose-Stimulated
Insulin Secretion in the Male
Guadalupe Navarro, Weiwei Xu, David A. Jacobson, Barton Wicksteed, CamilleAllard, Guanyi Zhang, Karel De Gendt, Sung Hoon Kim, Hongju Wu, HaitaoZhang, Guido Verhoeven, John A. Katzenellenbogen, and Franck Mauvais-Jarvis
Supplemental Information
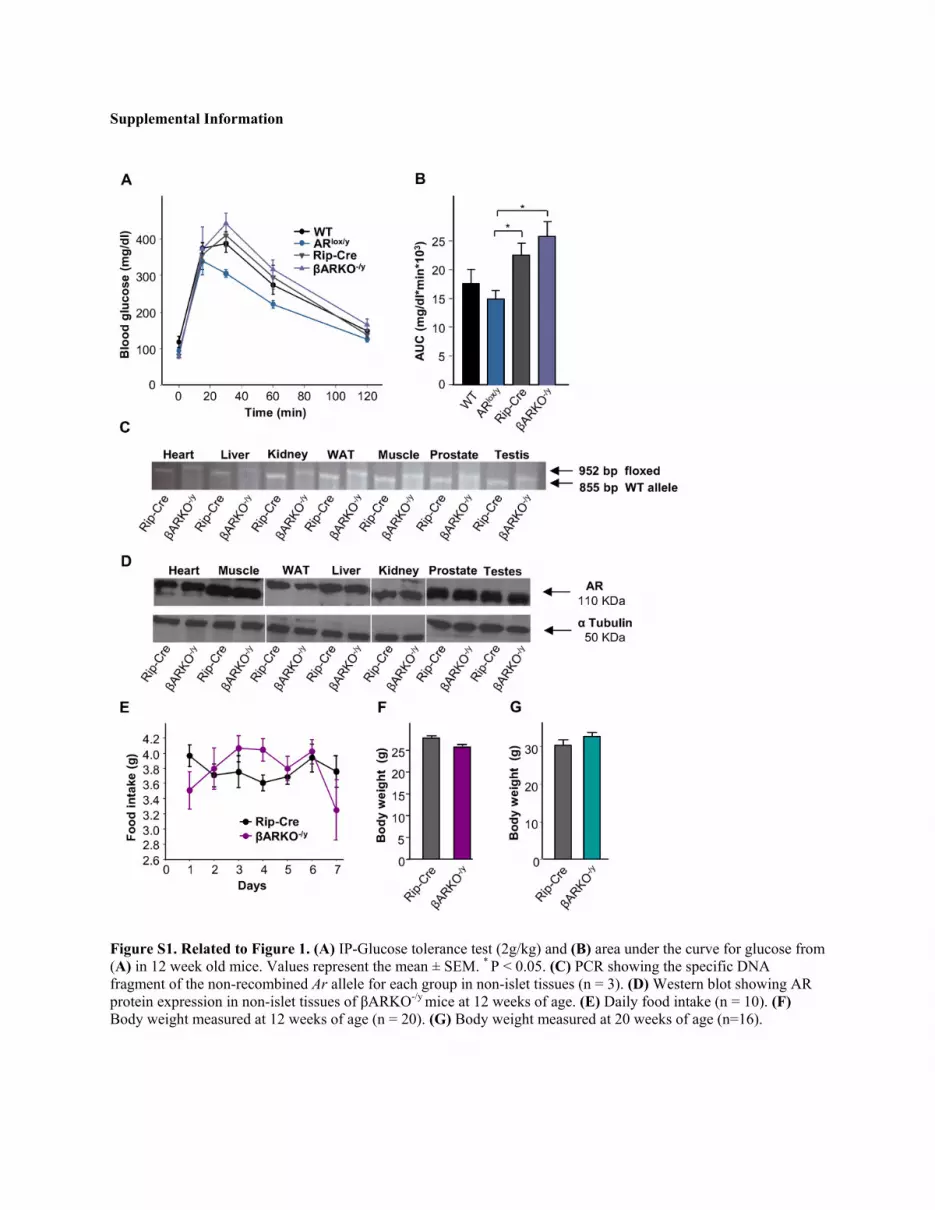
Figure S1. Related to Figure 1. (A) IP-Glucose tolerance test (2g/kg) and (B) area under the curve for glucose from (A) in 12 week old mice. Values represent the mean ± SEM. * P < 0.05. (C) PCR showing the specific DNA fragment of the non-recombined Ar allele for each group in non-islet tissues (n = 3). (D) Western blot showing AR protein expression in non-islet tissues of βARKO-/y mice at 12 weeks of age. (E) Daily food intake (n = 10). (F) Body weight measured at 12 weeks of age (n = 20). (G) Body weight measured at 20 weeks of age (n=16).

Figure S2. Related to Figure 2. (A) IP-insulin tolerance test (ITT) was performed following 6 hr fasting in mice fed a normal chow (n = 12). (B) IP-ITT was performed following 6 hr fast in mice fed a western diet (n = 16-18). (C) Ar mRNA level and (D) AR protein expression level in female and male islets. Data are from female mice fed on a normal chow (E-J) or a western diet (K-P). (E) IP-GSIS (3 g/kg). (F) IP-GTT (2 g/kg) with glucose AUC. (G) Fasting blood glucose. (H) Fasting insulin. (I) Random fed glucose. (J) Random fed insulin. (K) IP-GSIS (3 g/kg). (L) IP-GTT (2 g/kg) with glucose AUC. (M) Fasting blood glucose. (N) Fasting insulin. (O) Random fed glucose. (P) Random fed insulin. (Q) Blood glucose following STZ-induced diabetes (100 mg/kg). (R) Blood glucose at day 8 (post STZ). (S) Serum insulin at day 8 (post STZ). (T) Pancreas insulin concentration.
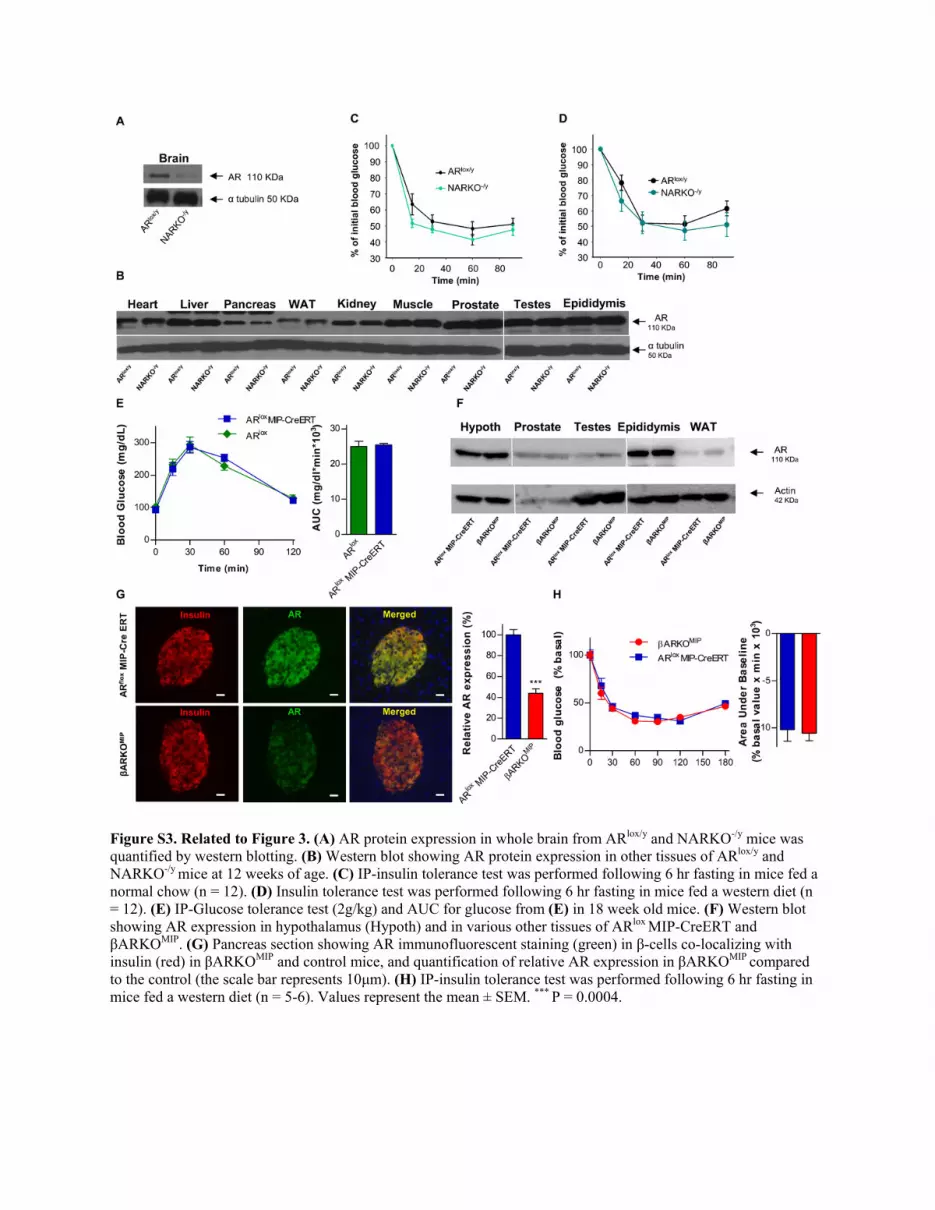
Figure S3. Related to Figure 3. (A) AR protein expression in whole brain from ARlox/y and NARKO-/y mice was quantified by western blotting. (B) Western blot showing AR protein expression in other tissues of ARlox/y and NARKO-/y mice at 12 weeks of age. (C) IP-insulin tolerance test was performed following 6 hr fasting in mice fed a normal chow (n = 12). (D) Insulin tolerance test was performed following 6 hr fasting in mice fed a western diet (n = 12). (E) IP-Glucose tolerance test (2g/kg) and AUC for glucose from (E) in 18 week old mice. (F) Western blot showing AR expression in hypothalamus (Hypoth) and in various other tissues of ARlox MIP-CreERT and βARKOMIP. (G) Pancreas section showing AR immunofluorescent staining (green) in β-cells co-localizing with insulin (red) in βARKOMIP and control mice, and quantification of relative AR expression in βARKOMIP compared to the control (the scale bar represents 10μm). (H) IP-insulin tolerance test was performed following 6 hr fasting in mice fed a western diet (n = 5-6). Values represent the mean ± SEM. *** P = 0.0004.

Figure S4. Related to Figure 5. (A) A mouse prostate depicting AR (green) immunofluorescent staining and DAPI (blue). (B) Male mouse pancreatic islet with immunofluorescent staining with insulin (orange), AR (green), and DAPI (blue). (C) MIN-6 insulin-secreting cell showing immunofluorescent staining of AR (Red) following DHT stimulation.

Figure S5. Related to Figure 6. In (A)-(D), LNCaP cells were treated with the indicated compounds for 4 hours (the scale bar represents10μm). (A) Treatment with 100 nM ADC-Cy5 showed exclusively extranuclear fluorescent signal. (B) Treatment with 30 nM dendrimer-Cy5 showed no fluorescence, indicating there was no uptake of dendrimer without the ligand. (C) Treatment with 100nM ADC non fluorescent control. (D) Treatment with 100 nM ADC-Cy5 in the presence of 50-fold excess of the potent AR ligand R1881 shows a marked decrease in the fluorescent signals, demonstrating specific AR binding of ADC. (E) ATP/ADP measured on WT male islets after treatment with 10 nM DHT for 30 minutes (n = 4 independent wells, and 2 independent experiments). Values represent the mean ± SEM. * P < 0.05.
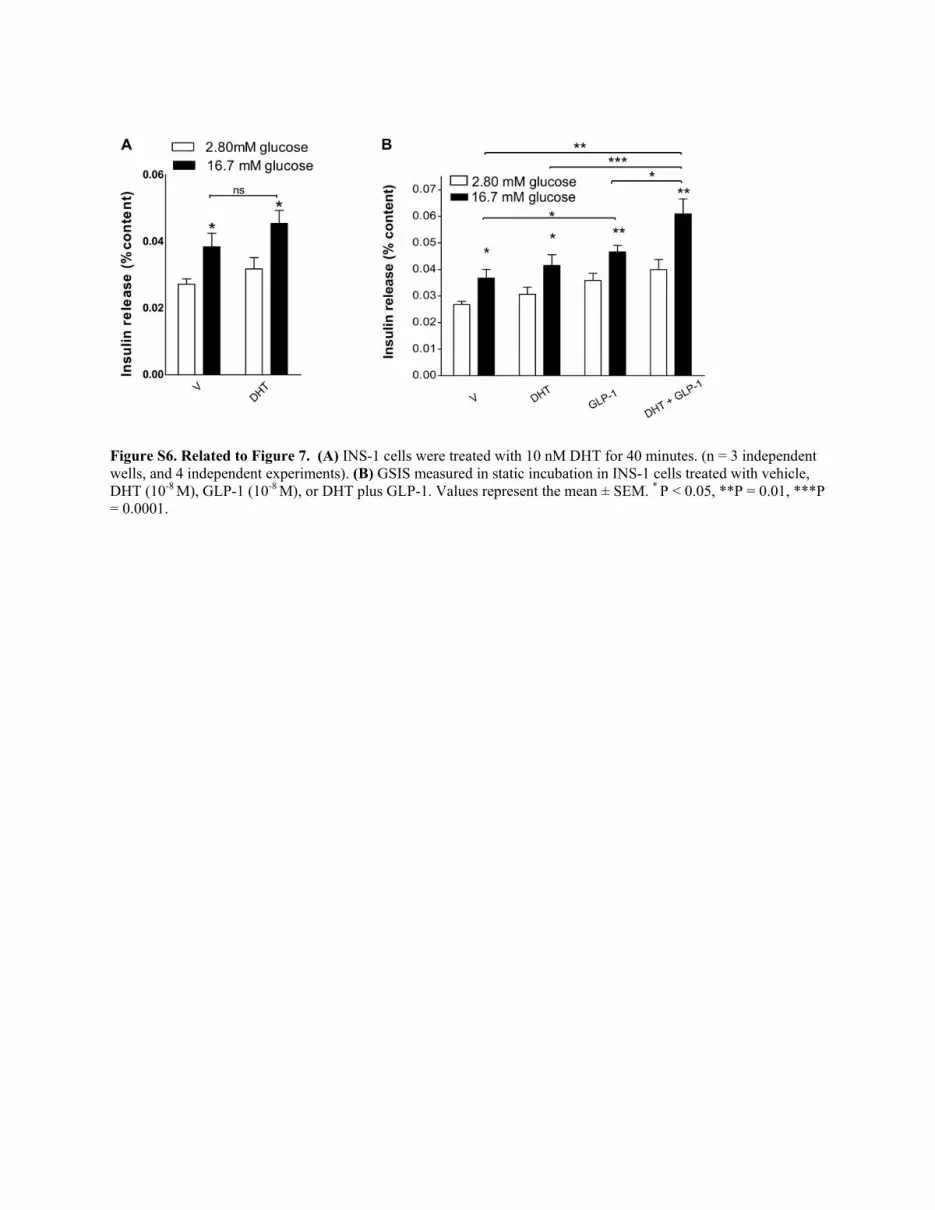
Figure S6. Related to Figure 7. (A) INS-1 cells were treated with 10 nM DHT for 40 minutes. (n = 3 independent wells, and 4 independent experiments). (B) GSIS measured in static incubation in INS-1 cells treated with vehicle, DHT (10-8 M), GLP-1 (10-8 M), or DHT plus GLP-1. Values represent the mean ± SEM. * P < 0.05, **P = 0.01, ***P = 0.0001.

Table S1, related to Figure 6 Name Structure Relative Binding
Affinity to R1881 Androgen Dendrimer Conjugate (ADC)
0.272
Dendrimer
0.813
ADC-Cy5
0.832
Dendrimer-Cy5
0.016
Compound structure and relative binding affinity (RBA) to R1881. AR agonist was conjugated to a PAMAM dendrimer (gray circle) through a tether to create androgen dendrimer conjugate (ADC), and it was then labeled with Cy5 to produce ADC-Cy5. The table shows the structure and RBA of each compound.
NC
F3C
NH
O
OHO N
H
O O
HN G6 NH2
34
222

Table S2, related to Figure 6 Gene M Rip-Cre M βARKO-/y p-value F Rip-Cre F βARKO-/- p-value Ins2 1.0 ±0.32 0.29 ±0.14 0.14 1.0 ±0.12 1.00 ±0.12 0.97 Glut2 1.0 ±0.26 0.26 ±0.06 0.05 1.0 ±0.05 0.92 ±0.08 0.43 Ucp2 1.0 ±0.37 0.63 ±0.34 0.13 1.0 ±0.13 1.00 ±0.23 0.87 Gck 1.0 ±0.49 0.23 ±0.10 0.04 1.0 ±0.07 1.30 ±0.06 0.01 Hk1 1.0 ±0.11 0.97 ±0.08 0.84 1.0 ±0.09 0.90 ±0.11 0.85 Gcg 1.0 ±0.00 0.74 ±0.00 0.21 1.0 ±0.20 0.92 ±0.09 0.69 Differentially expressed genes in βARKO-/y and its control. Islets were isolated from male and female βARKO mice and from their respective controls. The indicated mRNA expression levels were quantified by qPCR.

Supplemental Experimental Procedures Food intake measurement. Animals were housed individually for 1 week to accommodate to the new environment. Food intake was measured daily for 1 week following accommodation. Induction of experimental diabetes. Mice were exposed to a single intraperitoneal (IP) injection of 150 mg/kg of STZ (Sigma Aldrich, St. Louis, MO) to induce diabetes. Blood glucose was measured every 48 h following STZ injection. At day 8 following STZ injection, insulin was assessed and pancreases were processed for measurement of pancreatic insulin concentration. IP-Insulin tolerance test. For ip-ITT, mice were morning fasted for 6 hrs prior to insulin injection (0.75 U/kg). At the completion of treatment (12-13 weeks of age) pancreases were dissected and processed for measurement of pancreatic insulin concentration and β-cell mass. Quantification of relative AR Expression. The images were captured with Nikon Eclipse Ti-S microscope, and the quantification of AR expression was performed using NIS-Elements Advanced Research software. The mean AR intensity was quantified from islets of pancreas sections from 4 BARKOMIP and 3 ARlox MIP-CreERT. All values were normalized to the average of the ARlox MIP-CreERT group (as 100%), and the results were shown as the relative AR expression. ADC synthesis. All reagents were used as purchased. CH3CN, THF, and CH2Cl2 used in reactions were dried using a solvent delivery system (neutral alumina column). Compounds and materials were supplied from the sources indicated: radiolabeled R1881 ([3H]R1881, [17-methyl-3H]methyltrienolone, 17alpha- hydroxy-17-methyl-estra-4,9,11-trien-3-one, 70-87 Ci mmol-1, PerkinElmer) and R1881 for radiometric evaluation of synthesized S-GTx-007 and its analogs (PerkinElmer, MA), LBD (ligand binding domain) of androgen receptor (Invitrogen, Grand Island, NY), 4-cyano-3-(trifluoro)aniline (Lancaster, Ward Hill, MA), (2R)-3-bromo-2-hydroxy-2-methylpropanoic acid (Obiter research, Champaign, IL), PAMAM generation-6 dendrimer (ethylene diamine core), 4-nitro-3-(trifluoro)aniline, glutaric anhydride, 4-aminophenol, N-acetylethylenediamine, thionyl chloride, N,N’-dicylohexylcarbodiimide, N-hydroxysuccinimide (Aldrich, Milwaukee WI), Amicon® Ultra centrifugal filter (Milipore, Bedford, MA). S-GTx-007 (or S-4) and analog of S-GTx-007(agonist to androgen receptor) was prepared according to a modified literature procedure (Gao et al., 2011; Marhefka et al., 2004).
Proton 1H NMR spectra were recorded on a Varian Inova-500 at 500 MHz with the deuterated solvent noted. Carbon 13C NMR spectra were obtained on a Varian Inova-500 at 126 MHz with the deuterated solvent noted. MALDI-TOF (Matrix Assisted Laser Desorption Ionization-Time Of Flight) mass analysis (2,5-dihydroxybenzoic acid, DHB, as a matrix) and High- and low-resolution electron-ionization electrospray ionization mass spectra were obtained using Voyager-DE™ STR and a Q-TOF Ultima API (Waters Co. Ltd), respectively.
(R)-3-Bromo-2-hydroxy-2-methyl-N-(4-cyano-3-(trifluoromethyl)phenyl)propanamide (I): This compound was synthesized according to the literature method: To the (2R)-3-bromo-2-hydroxy-2-methylpropanoic acid (300 mg, 1.64 mmol) in CH3CN (10 mL) was added dropwise thionyl chloride (290 mg, 2.46 mmol) at around -10 °C. After stirring for an additional 2 hr under the same temperature, trimethylamine (414 mg, 4.10 mmol) was added into the resulting mixture for 10 min at -15 to -20 °C. Subsequently a solution of 4-cyano-3-(trifluoro)aniline (270 mg, 1.45 mmol) in acetonitrile (5 mL) was added into the reaction mixture at the same temperature, and the reaction temperature was allowed to warm up to rt to accelerate the reaction. Once the aniline disappeared on SiO2 TLC, the solvent was evaporated. The residue was extracted with EtOAc (20 mL x 3), dried over MgSO4, and loaded onto SiO2 column chromatography. Elution with a mixture of EtOAc and n-hexane (25:75, v/v) provided the title compound as a dark yellowish solid (447 mg, 88%). 1H NMR (500 MHz, CDCl3) 1.64 (s, 3H), 3.41 (s, 1H), 3.58 (d, J = 10.5 Hz, 1H, CHH), 3.98 (d, J = 10.5 Hz, 1H, CHH), 7.80 (d, J = 8.5 Hz, 1H), 8.04 (dd, J = 2.0, 8.5 Hz, 1H), 8.12 (d, J = 8.5 Hz, 1H), 9.11 (s, 1H, NH). [13C NMR (126 MHz, CDCl3) 25.07, 41.06, 75.80, 104.80, 115.76, 117.71 (q, 3JC-F = 4.5 Hz), 122.26, 122.31 (q, 1JC-F = 273.4 Hz), 134.28 (q, 2JC-F = 33.2 Hz), 136.12, 141.61. 172.21]. HRMS (ESI) m/z calcd for C12H11BrF3N2O2 (M
++1) 350.9956, found 350.9968. 4-Propionamidophenol (II): The mixture of p-aminophenol (1.09 g, 10.0 mmol) and glutaric anhydride (1.15
g, 10.0 mmol) in THF-CH2Cl2 (20 mL, 1:1, v/v) at rt was sonicated for 5 min to form a precipitate. The title compound was collected by filtration as an off-white solid (1.8 g, 80.7%) and used without further purification. 1H NMR (500 MHz, CD3OD) 1.96 (quintet, J = 7.5 Hz, 2H), 2.38 (t, J = 7.5 Hz, 2H), 2.39 (t, J = 7.5 Hz, 2H), 6.72 (d,

J = 9.0 Hz, 2H), 7.31 (d, J = 9.0 Hz, 2H). 13C NMR (126 MHz, CDCl3) 21.08, 33.00, 35.56, 115.00, 122.22, 130.45, 154.18, 172.29, 175.74. HRMS (ESI) m/z calcd for C11H14N4O4 (M
++1) 224.0923, found 224.0924. Benzyl 5-((4-hydroxyphenyl)amino)-5-oxopentanoate (III): To the solution of 4-propionamidophenol (223
mg, 1.0 mmol) and K2CO3 (378 mg, 2.7 mmol) in DMF (10 mL) at rt was added benzyl chloride (126 mg, 1.0 mmol). The resulting solution was further stirred 2 hr more and poured into water, followed by extraction with EtOAc (10 mL x 3), dried over MgSO4, and loaded onto a SiO2 column chromatography to separate out the title compound (280 mg, 89%) as an off-white powder with the solvent mixed with EtOAc and n-hexane (40:60, v/v). 1H NMR (500 MHz, CDCl3 + CD3OD) 1.95 (quintet, J = 7.5 Hz, 2H), 2.28 (t, J = 7.5 Hz, 2H), 2.40 (t, J = 7.5 Hz, 2H), 5.05 (s, 2H), 6.68 (d, J = 8.5 Hz, 2H), 7.21 (d, J = 8.5 Hz, 2H), 7.25-7.30 (m, 5H). 13C NMR (126 MHz, CDCl3) 21.10, 33.46, 36.03, 66.65, 115.53, 122.29, 128.36, 128.49, 128.75, 130.23, 135.85, 153.78, 171.40, 173.81. HRMS (ESI) m/z calcd for C18H20NO4 (M
++1) 314.1392, found 314.1392. Benzyl (S)-5-((4-(2-hydroxy-3-((4-cyano-3-(trifluoromethyl)phenyl)amino)-2-methyl-3-
oxopropoxy)phenyl)amino)-5-oxopentanoate (IV): The mixture of I (100 mg, 0.28 mmol), III (135 mg, 0.43 mmol), and K2CO3 (77 mg, 0.56 mmol) in DMF (10 mL) was stirred for 8 hr. To the reaction mixture was added I (48 mg, 0.13 mmol) again. After stirring 4 hr more, deionized water (20 mL) and EtOAc (20 mL) were added into the reaction mixture. The EtOAc layer was separated out and aqueous layer was extracted twice more with EtOAc (20 mL x 2). The EtOAc layer was dried over MgSO4, concentrated under vacuum, and loaded onto SiO2 column for chromatography. Elution with the mixture of EtOAc and n-hexane (60:40, v/v) afforded the title compound (129 mg, 39%) as a colorless powder.
1H NMR (500 MHz, CDCl3 + CD3OD) 1.64 (s, 3H), 2.04 (quintet, J = 8.0 Hz, 2H), 2.36 (t, J = 8.0 Hz, 2H), 2.46 (t, J = 8.0 Hz, 2H), 3.93 (d, J = 9.0 Hz, 1H, CHH), 4.36 (d, J = 9.0 Hz, 1H, CHH), 5.11 (s, 2H), 6.77 (d, J = 9.0, 2H), 7.32 (d, J = 9.0, 2H), 7.75 (d, J = 8.5 Hz, 1H), 7.94 (dd, J = 2.0, 8.5 Hz, 1H), 8.12 (d, J = 2.0 Hz, 1H). HRMS (ESI) m/z calcd for C30H29N3O6F3 (M
++1) 584.2008, found 584.2010. (S)-5-((4-(2-hydroxy-3-((4-cyano-3-(trifluoromethyl)phenyl)amino)-2-methyl-3-
oxopropoxy)phenyl)amino)-5-oxopentanoic acid (V): The methanol solution (5 ml) of IV (40 mg, 0.07 mmol) and catalytic amount of 10% Pd-C was charged with 30 psi hydrogen and shaken for 2 hr at rt. Filtration through Celite and evaporation provided the title compound (31 mg, 92%) as an colorless powder. 1H NMR (500 MHz, CDCl3 + CD3OD) 1.39 (s, 3H), 1.82 (quintet, J = 9.0 Hz, 2H), 2.20 (t, J = 9.0 Hz, 2H), 2.22 (t, J = 9.0 Hz, 2H), 3.82 (d, J = 11.5 Hz, 1H, CHH), 4.16 (d, J = 11.5 Hz, 1H, CHH), 6.70 (d, J = 11.5 Hz, 2H), 7.26 (d, J = 11.5 Hz, 2H), 7.67 (d, J = 10.5 Hz, 1H), 7.88 (dd, J = 2.5, 10.5 Hz, 1H), 8.08 (d, J = 2.5 Hz, 1H). HRMS (ESI) m/z calcd for C23H21N3O6F3 (M+-1) 492.1382, found 492.1383.
2,5-dioxopyrrolidin-1-yl (S)-5-((4-(2-hydroxy-3-((4-isocyano-3-(trifluoromethyl)phenyl)amino)-2-methyl-3-oxopropoxy)phenyl)amino)-5-oxopentanoate (VI). Compound V (9.0 mg, 0.02 mmol), N-hydroxysuccinimide (2.0 mg, 0.02 mmol), and catalytic amount of 4-N,N-dimethylpyridine was suspended in CH2Cl2 (5 mL). To the resulting solution was added DCC (3.7 mg, 0.02 mmol) at rt and stirred for 1 hr. The precipitated N, N’-dicyclohexylurea was filtered off to afford the title compound (11 mg). The obtained compound was used without further purification. 1H NMR (500 MHz, CDCl3) 1.57 (s, 3H), 2.19 (quintet, J = 7.0 Hz, 2H), 2.45 (t, J = 7.0 Hz, 2H), 2.71 (t, J = 7.0 Hz, 2H), 2.89 (brs, 4H, -OC-CH2CH2-CO-), 3.95 (d, J = 10.5 Hz, 1H, CHH), 4.41 (d, J = 10.5 Hz, 1H, CHH), 6.83 (d, J = 10.0 Hz, 2H), 7.43 (d, J = 10.0 Hz, 2H), 7.79 (d, J = 10.0 Hz, 1H), 7.86 (s, 1H), 7.95 (dd, J = 2.5, 10.0 Hz, 1H), 8.11 (d, J = 2.5 Hz, 1H), 9.18 (s, 1H). HRMS (ESI) m/z calcd for C27H26N4O8F3 (M
++1) 591.1703, found 591.1702.
Androgen-dendrimer conjugation (VII): PAMAM dendrimer generation 6 (ethylene diamine core, 5% methanol solution, 400 mg) was diluted with triple the volume of methanol in preparation for a reaction. To the solution of PAMAM G6 (net 20 mg) was added VI (5.0 mg, 8.5 mol) in DMF (100 L). The resulting solution was sonicated for 20 min at rt. Once the NHS ester (VI) disappeared on the SiO2 TLC (EtOAc eluent), the reaction mixture was transferred into Amicon membrane filter (30K MW cutoff) and centrifuged 6 times at ~500 X g with methanol solution, as described elsewhere.(Kim and Katzenellenbogen, 2006). After washing, the residual aliquot was transferred to 3-mL glass vial, dried under a gentle stream of nitrogen, and then prepared as a stock solution with the mixture of methanol and DI water (1:5, v/v). MALDI-TOF (DHA matrix) Mn 62,389, Mw 64,089, PDI 1.03. (Reference PAMAM G6 was measured as Mn 46,167, Mw 47,209, PDI 1.02).
To label the conjugate with Cy5, the conjugate in a mixture of methanol and water (1:5, v/v, net weight 1.25 mg) was diluted with pH 7.0 phosphate buffer (100 L) followed by the addition Cy5-NHS (0.15 mg, 0.19 mol) in DMSO (50 L) and sonication for 20 min at rt. The resulting solution was transferred to the 30K MWCO Amicon membrane filter for purification, centrifuged with pH 7.0 phosphate buffer three time and DI water three times until no more Cy5 was detected in filtrate. The final aliquot was dried under a gentle stream of nitrogen and prepared as a

stock solution with the mixture of methanol and DI water (1:5, v/v). MALDI-TOF (DHA matrix) Mn 67,794, Mw 69346, PDI 1.02.
Androgen receptor binding assays: Relative binding affinities were determined by competitive radiometric
binding assays with 10 nM [3H]R1881 as tracer, as a modification of methods previously described. The source of AR was purified, recombinant rat, ligand binding domain purchased from Invitrogen. Incubations were done at 0 °C for 18–24 h, and hydroxyapatite (Bio-Rad) was used to absorb the purified receptor-ligand complexes. The binding affinities are expressed as relative binding affinity (RBA) values, where the RBA of R1881 is 100%; under these conditions, the Kd of R1881 for AR is ca. 0.6 nM. The determination of these RBA values is reproducible in separate experiments with a CV of 0.3.
Supplemental References Gao, M., Wang, M., Miller, K.D., and Zheng, Q.H. (2011). Facile radiosynthesis of new carbon-11-labeled propanamide derivatives as selective androgen receptor modulator (SARM) radioligands for prostate cancer imaging. Steroids 76, 1505–1512.
Marhefka, C. A., Gao, W., Chung, K., Kim, J., He, Y., Yin, D., Bohl, C., Dalton, J.T., and Miller, D.D. (2004). Design, Synthesis, and Biological Characterization of Metabolically Stable Selective Androgen Receptor Modulators. J. Med. Chem. 47, 993–998.
Kim, S.H., and Katzenellenbogen, J. A. (2006). Hormone-PAMAM dendrimer conjugates: Polymer dynamics and tether structure affect ligand access to receptors. Angew. Chemie - Int. Ed. 45, 7243–7248.
Katzenellenbogen, J.A., Johnson, H.J., Jr., Myers, H.N. (1973). Photoaffinity labels for estrogen binding proteins of rat uterus. Biochemistry. 12, 4085–4092.
Brandes, S.J., Katzenellenbogen, J.A. (1987). Fluorinated androgens and progestins: molecular probes for androgen and progesterone receptors with potential use in positron emission tomography. Mol. Pharmacol. 32, 391–403.
Liu, A, Carlson, K.E., Katzenellenbogen, J.A. (1992). Synthesis of high-affinity fluorine-substituted ligands for the androgen receptor. Potential agents for imaging prostatic cancer by positron emission tomography. J. Med. Chem. 35, 2113–2129.
Related Documents