Photonirvachak Journal of the Indian Society of Remote Sensing, Vol. 35, No. 2, 2007 EXTRACTION AND VALIDATION OF CARTOSAT-1 DEM NADEEM AHMED, ANJUM MAHTAB@, RITESH AGRAWAL, R JAYAPRASAD, S.K. PATHAN, AJAI, D.K. SINGH* ANDA.K. SINGH* Forestry, Landuse planning and Photogrammetry Group Space Applications Center, Indian Space Research Organisation, Ahmedabad-380015 *Water Technology Centre, IARI, Pusa Institute, New Delhi- 110012 @Corresponding author : [email protected] ABSTRACT CARTOSAT-1 satellite, launched in May, 2005 is a dedicated along track stereo mission providing high quality data for topographic and cartographic applications. The present paper describes the evaluation of the Cartosat-1 stereo data, mainly through the generation and validation of DEM for moderately undulating and hilly areas. Photogrammetric techniques have been used for generation of DEM and Orthoimage for two cases i.e. 1) using RPCs (Rational Polynomial Coefficients) and 2) using RPCs along with ground control points. Root Mean Square Error (RMSE) in elevation values for the moderately undulating (Dehradun) and hilly area (Shimla), are found to be 4.38 and 3.69m respectively. Introduction Digital Elevation Model is an important parameter in cartographic and resource management applications. Preparation and updation of topo- graphic and cadastral maps, route alignment, watershed development and infrastructure planning are some of the prominent applications. Indian Remote Sensing satellite, IRS-1C /1D, had the capacity to steer the 5.8m PAN camera in across track direction to provide the stereo coverage. However, the major problem with the across track stereo is the radiometric differences between stereo.pairs. Recently launched Cartosat-1 provides 2.5m along track stereo data with 5~ fore and 26 ~ aft cameras. During the past two decades, a number of satellite missions have provided the opportunity of generating DEM using optical photogrammetric and SAR interferometric techniques. Availability of stereo data started with the launch of SPOT-1, in 1986, which provided high-resolution across-track stereo data for terrain evaluation and topographic mapping. DEM extraction from SPOT stereo pair has Received 18 December, 2006; in final form 10 May, 2007

Welcome message from author
This document is posted to help you gain knowledge. Please leave a comment to let me know what you think about it! Share it to your friends and learn new things together.
Transcript
Photonirvachak
Journal of the Indian Society of Remote Sensing, Vol. 35, No. 2, 2007
E X T R A C T I O N A N D V A L I D A T I O N OF CARTOSAT-1 D E M
NADEEM AHMED, ANJUM MAHTAB@, RITESH AGRAWAL, R JAYAPRASAD, S.K. PATHAN, AJAI, D.K. SINGH* ANDA.K. SINGH*
Forestry, Landuse planning and Photogrammetry Group Space Applications Center, Indian Space Research Organisation, Ahmedabad-380015
*Water Technology Centre, IARI, Pusa Institute, New Delhi- 110012 @Corresponding author : [email protected]
ABSTRACT
CARTOSAT-1 satellite, launched in May, 2005 is a dedicated along track stereo mission providing high quality data for topographic and cartographic applications. The present paper describes the evaluation of the Cartosat-1 stereo data, mainly through the generation and validation of DEM for moderately undulating and hilly areas. Photogrammetric techniques have been used for generation of DEM and Orthoimage for two cases i.e. 1) using RPCs (Rational Polynomial Coefficients) and 2) using RPCs along with ground control points. Root Mean Square Error (RMSE) in elevation values for the moderately undulating (Dehradun) and hilly area (Shimla), are found to be 4.38 and 3.69m respectively.
Introduction
Digital Elevat ion Model is an important parameter in cartographic and resource management applications. Preparation and updation of topo- graphic and cadastral maps, route alignment, watershed development and infrastructure planning are some o f the prominent applications. Indian Remote Sensing satellite, IRS-1C /1D, had the capacity to steer the 5.8m PAN camera in across track direction to provide the stereo coverage. However, the major problem with the across track stereo is the
radiometric differences between stereo.pairs. Recently launched Cartosat-1 provides 2.5m along track stereo data with 5 ~ fore and 26 ~ aft cameras.
During the past two decades, a number of satellite missions have provided the opportunity of generating DEM using optical photogrammetric and SAR interferometric techniques. Availability of stereo data started with the launch of SPOT-1, in 1986, which provided high-resolution across-track stereo data for terrain evaluation and topographic mapping. DEM extraction from SPOT stereo pair has
Received 18 December, 2006; in final form 10 May, 2007
122 Nadeem Ahmed et al.
been attempted by Bolstad and Timothy (1994), AI- Rousan et al. (1997) and Krupnilk (2000). Akira et al. (2003) have validated ASTER stereo derived DEM. IRS-1C/1D PAN stereo data have been used to generate high quality DEM for extraction of terrain parameters required for cartography and natural resources planning and management (Anjum et al., 2003, Jayaprasad et al., 2002 and Ajai, 2004). The concept of Rational Function Model (RFM) carrying the sensor-image-ground relationship in the form of coefficients has been introduced with the launch of IKONOS satellite. Di et al. (2003), Fraser and Hanley (2003), Toutin (2004), Tao et al. (2002b, 2004) have carried out IKONOS stereo data analysis using Rational Function Model (RFM).
The objec t ive o f the presen t s tudy is to generate and validate DEM using high-resolution stereo data f rom Car tosa t -1 . DEM has been generated using Cartosat- 1 stereo data with Rational Polynomial Coefficients (RPC) and using RPC along with ground control points (GCP's). DEM validation has been carried out through differential GPS measurements. It has been found that the accuracy of DEM is improved to a large extent when precise ground control points are used along with the RPCs. For Dehradun, the planimetry RMSE is about 88.8m in easting and 146.4m in northing and is 51.8m in height in the case when only RPCs are used. However these values improve to 1.8m in easting and northing and 4.4m in height when GCPs are used along with RPCs.
Data Used and Study Area
In the present study, two sites falling under different terrain conditions were selected. Parts of Dehradun district, Ut tarakhand State, having moderately undulating terrain and parts of Shimla district, Himachal Pradesh, having high hilly slopes were chosen. The extent of CARTOSAT-1 stereo data of Dehradun and Shimla and relevant information of the study areas are summarized in table 1.
Methodology
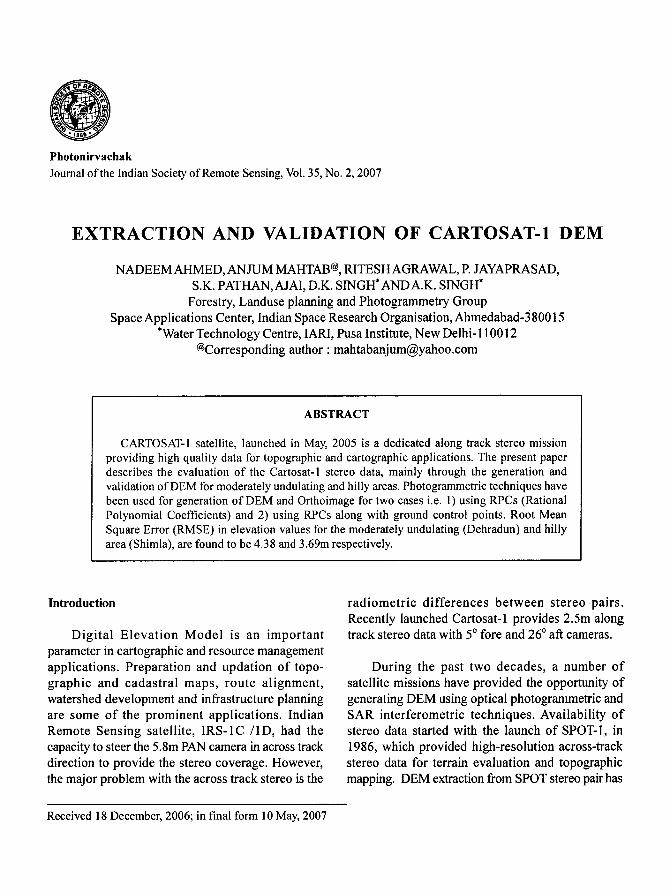
The overal l m e t h o d o l o g y adopted in the analysis o f Cartosat-1 stereo data is given in Figure 1. The details of methodology are as under:
D E M generat ion us ing R P C s
The RFM coefficients, called RPCs, provided along with the cartosat data are essentially a form o f genera l i sed sensor mode l i.e. the model parameters are sensor independent, have high fitting accuracy and are real time calculated (Tao and Hu, 2002). In Earlier satellites like SPOT and IRS 1C/1D rigorous physical sensor models based on the physical meaning of the imaging process, were used. Concept of RPCs started with IKONOS but are now being followed in other satellites including Cartosat-I.
Table 1: Details of study area and Cartosat-1 data used
Dehradun Shimla
Latitude 30 ~ 10'N - 30 ~ 30'N 31 ~ 05'N - 31 ~ 25'N
Longitude 77 ~ 45'E - 78 ~ 05'E 76 ~ 50'E - 77 ~ 10'E
Path 0526 0520
Row 0258 0254
Date of Pass 2 "d October 2005 7 th December 2005
Orbit No. 2224 3202
Extraction and Validation of Cartosat- 1 DEM 12 3
F DGPS
Measurements
Stereo Image
I~
GCPs I
+ + Updation of RPCs ]
Tie Point generation I
Epipolar Generation 1 +
Conjugate Point Generation I I
t
DEM Generation [ I I
k+
Orthoimage Generation [
~"[ DEM / Orthoimage Validation
Fig. 1. Schematic representation of DEM Generation and validation process
Cartosat-1 stereo pairs over Dehradun and Shimla test sites along with the corresponding RPCs were used to generate DEM for the two areas. For a particular area RPCs relate object space to image space and vice versa. The accuracy of the coordinates depends on the RPCs used. The Root mean square errors in planimetry and elevation values at all the checkpoints (10 for Dehradun and 3 for Shimla) have been computed. The checkpoints were established through differential GPS survey of the study area.
DEAl generation through updation o f RPC solution using GCPs
There are various methods to update RPC solutions, given no knowledge o f the sensor model (Hu and Tao, 2002). In this study, a complementary transformation has been used to update the accuracy at the GCPs. It is an indirect method in which an affine t ransformat ion is developed between the scan and pixel values of the control points as observed on the output by the
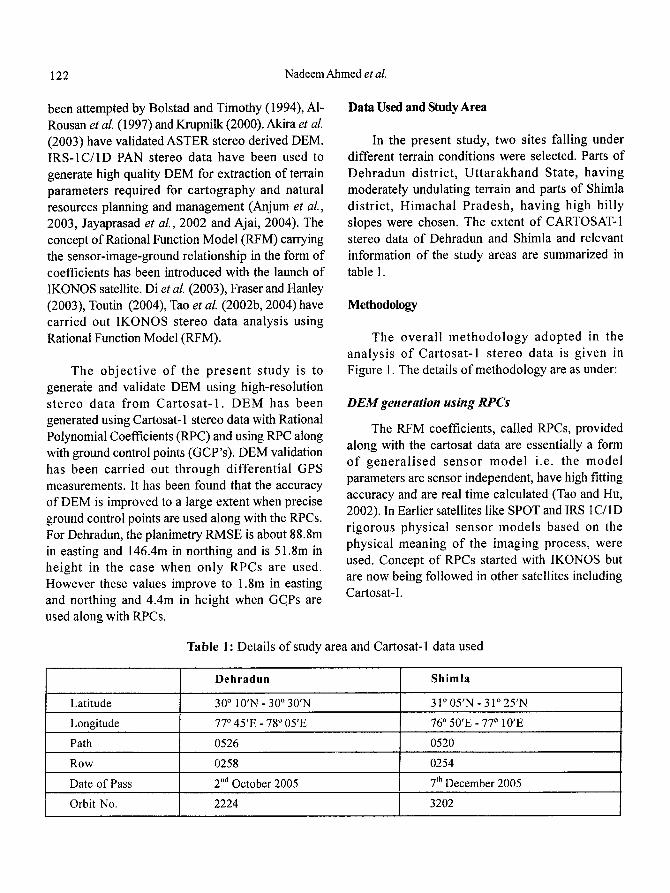
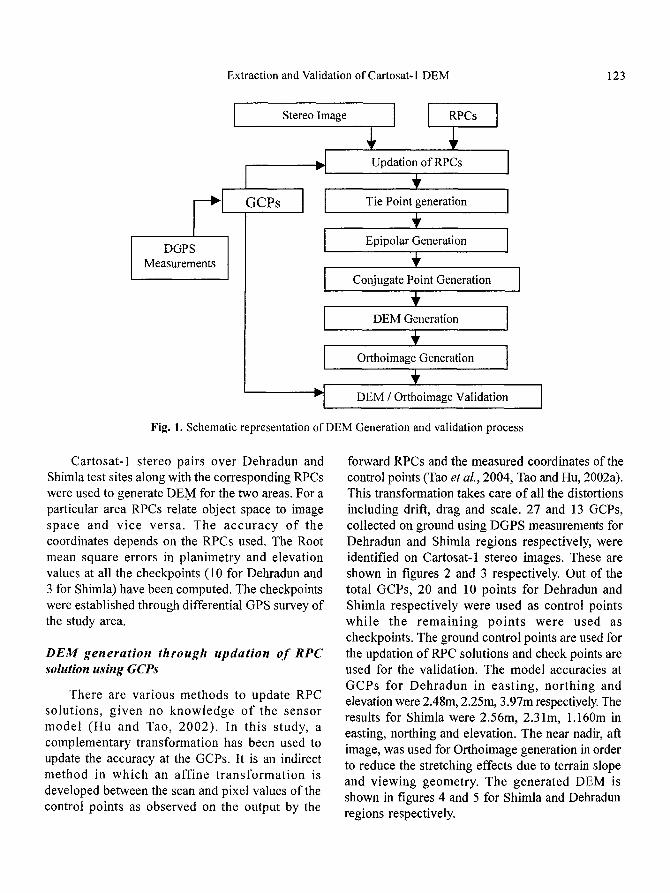
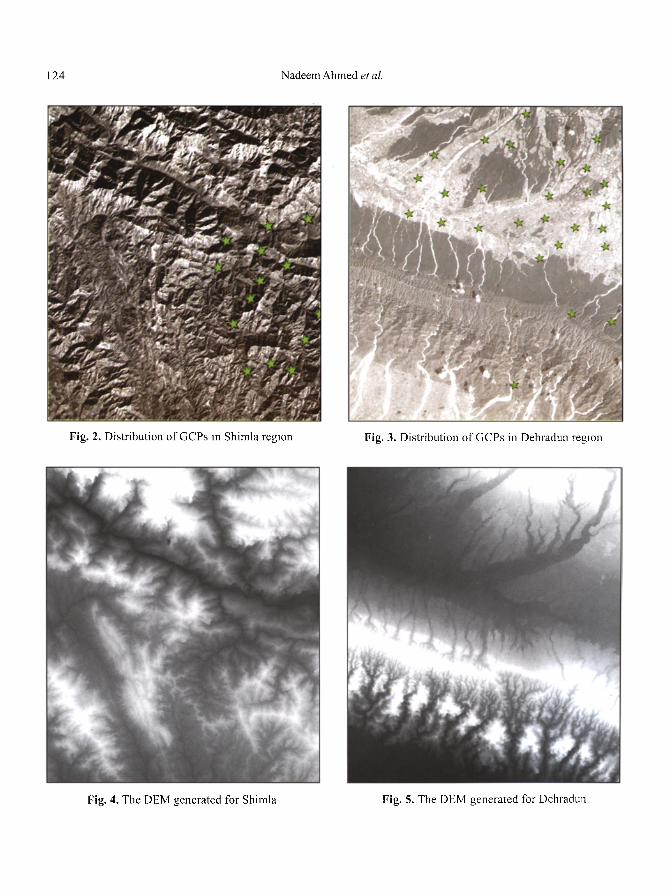
forward RPCs and the measured coordinates of the control points (Tao et al., 2004, Tao and Hu, 2002a). This transformation takes care of all the distortions including drift, drag and scale. 27 and 13 GCPs, collected on ground using DGPS measurements for Dehradun and Shimla regions respectively, were identified on Cartosat-1 stereo images. These are shown in figures 2 and 3 respectively. Out of the total GCPs, 20 and 10 points for Dehradun and Shimla respectively were used as control points while the remaining points were used as checkpoints. The ground control points are used for the updation of RPC solutions and check points are used for the validation. The model accuracies at GCPs for Dehradun in easting, northing and elevation were 2.48m, 2.25m, 3.97m respectiyely. The results for Shimla were 2.56m, 2.31m, 1.160m in casting, northing and elevation. The near nadir, aft image, was used for Orthoimage generation in order to reduce the stretching effects due to terrain slope and viewing geometry. The generated DEM is shown in figures 4 and 5 for Shimla and Dehradun regions respectively.
124 Nadeem Ahmed et al.
Fig. 2. Distribution of GCPs in Shimla region Fig. 3. Distribution of GCPs in Dehradun region
Fig. 4. The DEM generated for Shimla Fig. 5. The DEM generated for Dehradun
Extraction and Validation of Cartosat- l DEM 125
Results and Discussion
RPC only
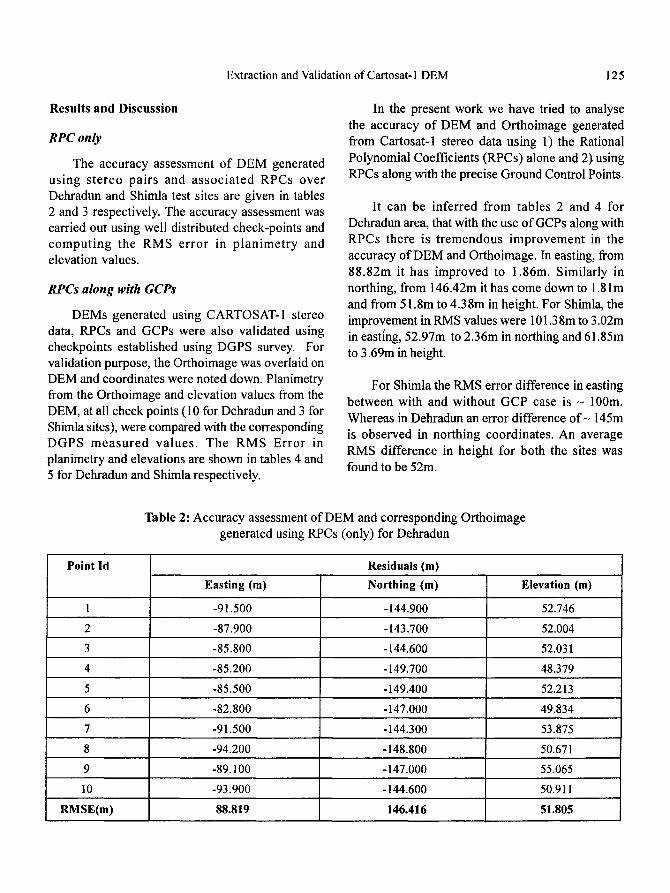
The accuracy assessment of DEM generated using stereo pairs and associa ted RPCs over Dehradun and Shimla test sites are given in tables 2 and 3 respectively. The accuracy assessment was carried out using well distributed check-points and comput ing the RMS error in p lan imet ry and elevation values.
RPCs along with GCPs
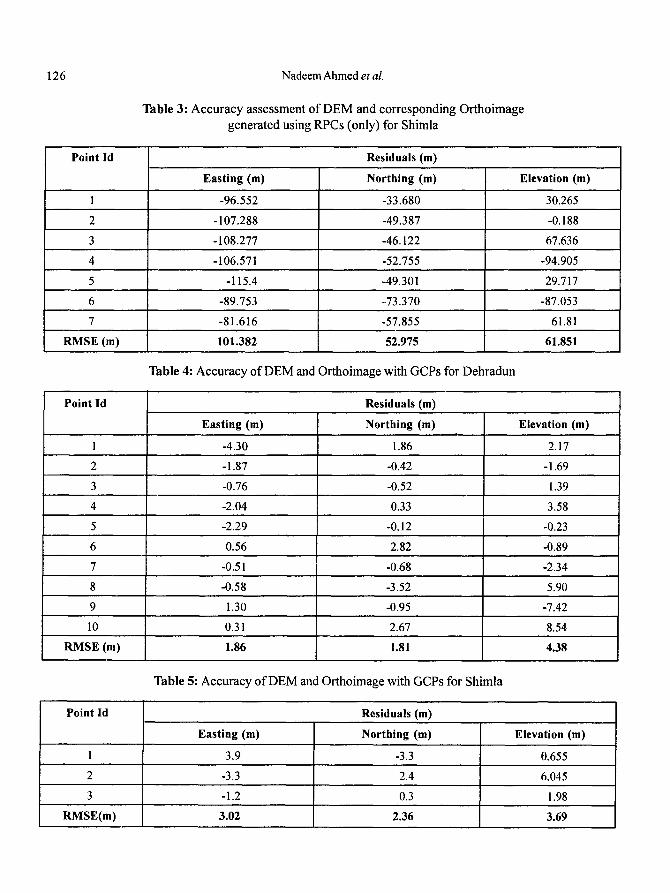
DEMs generated using CARTOSAT-1 stereo data, RPCs and GCPs were also validated using checkpoints established using DGPS survey. For validation purpose, the Orthoimage was overlaid on DEM and coordinates were noted down. Planimetry from the Orthoimage and elevation values from the DEM, at all check points (10 for Dehradun and 3 for Shimla sites), were compared with the corresponding DGPS measu red values. The RMS Error in planimetry and elevations are shown in tables 4 and 5 for Dehradun and Shimla respectively.
In the present work we have tried to analyse the accuracy of DEM and Orthoimage generated from Cartosat-1 stereo data using 1) the Rational Polynomial Coefficients (RPCs) alone and 2) using RPCs along with the precise Ground Control Points.
It can be inferred from tables 2 and 4 for Dehradun area, that with the use of GCPs along with RPCs there is tremendous improvement in the accuracy of DEM and Orthoimage. In easting, from 88.82m it has improved to 1.86m. Similarly in northing, from 146.42m it has come down to 1.81m and from 51.8m to 4.38m in height. For Shimla, the improvement in RMS values were 101.38m to 3.02m in east~ng, 52.97m to 2.36m in northing and 61.85m to 3.69m in height.
For Shimla the RMS error difference in easting between with and without GCP case is - 100m. Whereas in Dehradun an error difference o f - 145m is observed in northing coordinates. An average RMS difference in height for both the sites was found to be 52m.
Table 2: Accuracy assessment of DEM and corresponding Orthoimage generated using RPCs (only) for Dehradun
Pointld Residuals(m)
Easting (m) Northing (m) Elevation (m)
1 -91.500 -144.900 52.746
2 -87.900 -143.700 52.004
3 -85.800 -144.600 52.031
4 -85.200 -149.700 48.379
5 -85.500 -149.400 52.213
6 -82.800 -147.000 49.834
7 -91.500 -144.300 53.875
8 -94.200
9 -89.100
10 -93.900
RMSE(m) 88.819
-148.800 50.671
-147.000 55.065
-144.600 50.911
146.416 51.805
126 Nadeem Ahmed et al.
Table 3: Accuracy assessment of DEM and corresponding Orthoimage generated using RPCs (only) for Shimla
Point Id Residuals (m)
Easting (m) Northing (m) Elevation (m)
1 -96.552 -33.680 30.265
2 - 107.288 -49.387 -0.188
3 - 108.277 -46.122 67.636
4 -106.571 -52.755 -94.905
5 -115.4 -49.301 29.717
6 -89.753 ~73.370 -87.053
7 -81.616 -57.855 61.81
RMSE (m) 101.382 52.975 61.851
Table 4: Accuracy of DEM and Orthoimage with GCPs for Dehradun
Point Id Residuals (m)
Easting (m) Northing (m) Elevation (m)
1 -4.30 1.86 2.17
2 -1.87 -0.42 -1.69
3 -0.76 -0.52 1.39
4 -2.04 0.33 3.58
5 -2.29 -0.12 -0.23
6 0.56 2.82 -0.89
7 -0.51 -0.68 -2.34
8 -0.58 -3.52 5.90
9 1.30 -0.95 -7.42
10 0.31 2.67 8.54
RMSE (m) 1.86 1.81 4.38
Table 5: Accuracy of DEM and Orthoimage with GCPs for Shimla
Point Id Residuals (m)
Easting (m) Northing (m) Elevation (m)
1 3.9 -3.3 0.655
2 -3.3 2.4 6.045
3 -1.2 0.3 1.98
RMSE(m) 3.02 2.36 3.69
Extraction and Validation of Cartosat-1 DEM 127
Conclusions
The study reveals a reasonably accurate DEM having an accuracy of about 4m can be obtained from Cartosat-1 stereo data. Good quality DEMs can be generated using refined RPC with precise ground control points. DEM generation using such high resolution data require distributed ground control points preferably acquired using DGPS measurement. The high accuracy DEM generated from Cartosat-I data will provide large opportunity to resource planners in preparation of development plans at implementation level.
Acknowledgements
We are thankful to R.R, Navalgund, Director and K.L. Majumder, Deputy Director, RESIPA, Space Applications Centre for their encouragement and guidance during this study. We are grateful to Manthira Moorthy for very interesting discussions on RPC. We express our sincere gratitude to V.K. Dadhwal, Dean, Indian Institute of Remote Sensing, Dehradun for his help during the DGPS survey at Dehradun. Our sincere,thanks to our colleagues M.M. Kimothi, R.J. Bhanderi, Shweta Sharma, Rimjhim Bhatnagar and J.A. Vinoth Kumar during DGPS survey.
References
Ajai (2004). Mapping from high resolution satellite images and global positioning systems. Science Letters (Nat Acad), 27: 329-38.
Anjum, M., Narender, B. and Ajai (2003). Satellite derived Digital Elevation Model and terrain parameters - Generation, accuracy assessment and validation. Journal of Indian Society of Remote Sens'ing, 31(1): 19-24.
Akira, H., Welch, Roy and Long, H. (2003). Mapping from ASTER Stereo image data: DEM validation and Accuracy assessment. ISPRS Journal of Photo- grammetry and Remote Sensing, 57: 356-370.
AI-Rousan, Cheng, P., Petrie, G., Toutin, T. and Valadan Zoej, M.J. (1997). Automated DEM Extraction and
Orthoimage Generation from SPOT Level IB Imagery. Photogrammetric Engineering & Remote Sensing, 63(8): 965-974.
Bolstad, P.B. and Timothy, S. (1994). An Evaluation of DEM accuracy: Elevation, Slope and Aspect. Photogrammetric Engineering & Remote Sensing, 60(11): 1327-1332.
Di, K., R. Ma and R. Li (2003). Rational Function and Potential for Rigorous Snsor Model Recovery, Photogrammetric Engineering & Remote Sensing, 69(1): 33-41.
Fraser, C.S. and Hanley, H.B. (2003). Bias Compensation in rational function of IKONOS Satellite imagery, Photogrammetric Engineering & Remote Sensing, 69(1): 53-57.
tlu, Y. and Tao, C.V. (2002). Updating Solutions of the Rational Function Model Using Additional Control Information. Photogrammetric Engineering & Remote Sensing, 68(7): 715-723.
Jayaprasad, P., Narender, B., Arya, A.S. and Ajai (2002). Extraction of terrain parameters from IRS-1C PAN stereo data using photogrammetric technique. Current Science, 82(3): 333-337.
Krupnilk A. (2000). Accuracy Assessment of automatically Derived Digital Elevation Models from SPOT Image. American Society for Photo- grammetry and Remote Sensing, 66(8): 1017-1023.
Tao, C.V. and Hu, Y. (2002a). Updating solutions of the Rational Function Model using additional control information. Photogrammetric Engineering & Remote Sensing, 68(7): 715-723.
Tao, C.V. and Hu, Y. (2002b). 3D Reconstruction Methods based on the Rational Function Model. Photogrammetric Engineering & Remote Sensing, 68(7): 705-714.
Tao, C.V., Hu, Y. and Jiang, W. (2004). Photogrammetric exploitation of IKONOS Imagery for Mapping Application. International Journal of Remote Sensing, 25(14): 2833-2853.
Toutin, T. (2004). Comparison of Stereo-Extracted DTM from Different High-Resolution Sensor: SPOT-5, EROS-A, IKONOS-II, and QuickBird. 1EEE Transactions on Geo Science and'Remote Sensing, 42(10): 2121-2129.
Related Documents