1 Extracting Value from Natural Rubber Trading Markets Optimizing Marketing, Procurement and Hedging for Producers and Consumers

Welcome message from author
This document is posted to help you gain knowledge. Please leave a comment to let me know what you think about it! Share it to your friends and learn new things together.
Transcript
1
Extracting Value from Natural
Rubber Trading Markets
Optimizing Marketing, Procurement and
Hedging for Producers and Consumers
2
Table of Contents
Executive Summary 3
Rubber Market Fundamentals 4
Natural Rubber within Global Rubber Markets 4
Outlook for Natural Rubber Consumption and Production 8
Trade Flows and Global Supply and Demand Balance 14
Natural Rubber Trading Fundamentals 16
Evolution of Market Structure and Price Discovery 18
Market Price Dynamics 24
Strategic Initiatives for Buyers and Sellers 28
Commercial Strategy Development 30
Operational Strategy Development 31
Conclusions 34
2
3
Executive Summary
In 2013, natural rubber constituted a 50 $bn.
global market. Whilst lower prices have seen
that value decline in 2014, the competitive
price of natural rubber compared with
synthetic rubber is expanding its use for
manufacturing tires, medical products and
other consumer goods. Whereas synthetic
rubber producers are under pressure from the
rise in hydro-carbons feedstock prices (given
$100-$110/bbl average Brent price in 2013
and H1 2014) and a recovery of refining
crack-margins, natural rubber producers have
seen their market share expand further
supported by depreciating ASEAN currencies.
Sources of demand are shifting too.
Traditionally dominated by the Organization
for Economic Co-operation and Development
(OECD) block of countries, it is demand from
emerging markets, such as China and India,
which have led over the last decade, achieving
an average annual GDP growth rate of 8.9%
(China) and 7% (India) between 2009 and
2013. The market shifted towards oversupply
in 2014 driven by attractive plantation yields
when the price of rubber peaked at
c.5,400$/ton stimulating new planting.
However, production rationalization in ASEAN
and demand recovery in mature economies
are expected to bring supply and demand into
alignment towards the end of 2016.
To prosper in this evolving market, buyers and
sellers of natural rubber must develop
procurement, trading and marketing strategies
that will enable them to extract the best value
from volatile prices, evolving trade flows and
changing contractual terms. Accordingly, this
report provides an in-depth analysis of the
fundamental structure of the natural rubber
market. We have investigated trading activity
on a spot, bilateral or exchange basis and
assessed the impact of price discovery, price
indexation and other contractual optionalities
on buyers’ and sellers’ P&Ls. [Summary report
structure on Figure 1].
Six and a half Million Tons [Mt] of natural
rubber are estimated to have been traded
bilaterally in 2013. However, this volume was
predominantly indexed on prices from the
main international rubber exchanges, i.e.
Singapore Commodity Exchange (SICOM) and
Tokyo Commodity Exchange (TOCOM), which
represented only c.0.25 Mt or c.4% of
bilateral trades. This highlights the imperative
to understand the price discovery process at
the main exchanges, as well as the level of
liquidity through open interest, trading
volume and churn rate. Doing so will deepen
the understanding of pricing drivers and the
potential for deviation away from supply and
demand fundamentals. For example, the
periodic spreads between TOCOM and SICOM,
which peaked at c.33% in June 2013, created
significant implications for buyers and sellers
indexing long-term contracts on one
exchange versus another. Such evolving
market dynamics are prompting buyers and
sellers to enhance their commercial strategy
for procurement and marketing through four
main activities: participation in the price
discovery process, creating an optimal
portfolio mix, advanced contract structuring,
and hedging.
With an average annual volatility of c.35%,
and limited levels of liquidity on main
international exchanges as reflected in annual
churn rates of c.30x on SICOM for instance,
buyers and sellers will need to develop
procurement and marketing functions that
incorporate superior risk management
capabilities to manage integrated margins. As
market players increasingly rely on a more
diverse mix of spot, exchange and bilateral
contracts within their portfolios, and step-up
their hedging and trading activities, the cost
efficiency of front-to-back processes handling
the end-to-end trade cycle will also be an
important value lever.
In this report, we have summarized the main
dynamics of the natural rubber trading
markets and how they should lead buyers and
sellers to re-engineer their commercial
strategies, invest in procurement, marketing
and risk management capabilities which will,
in turn, allow buyers and sellers to optimize
their manufacturing or production integrated
margins. Our work with industry leaders -
including tire and medical goods
manufacturers as well as plantation owners
and marketers - has demonstrated that these
investments can translate into incremental
earnings, further highlighting the need for
market players to act.
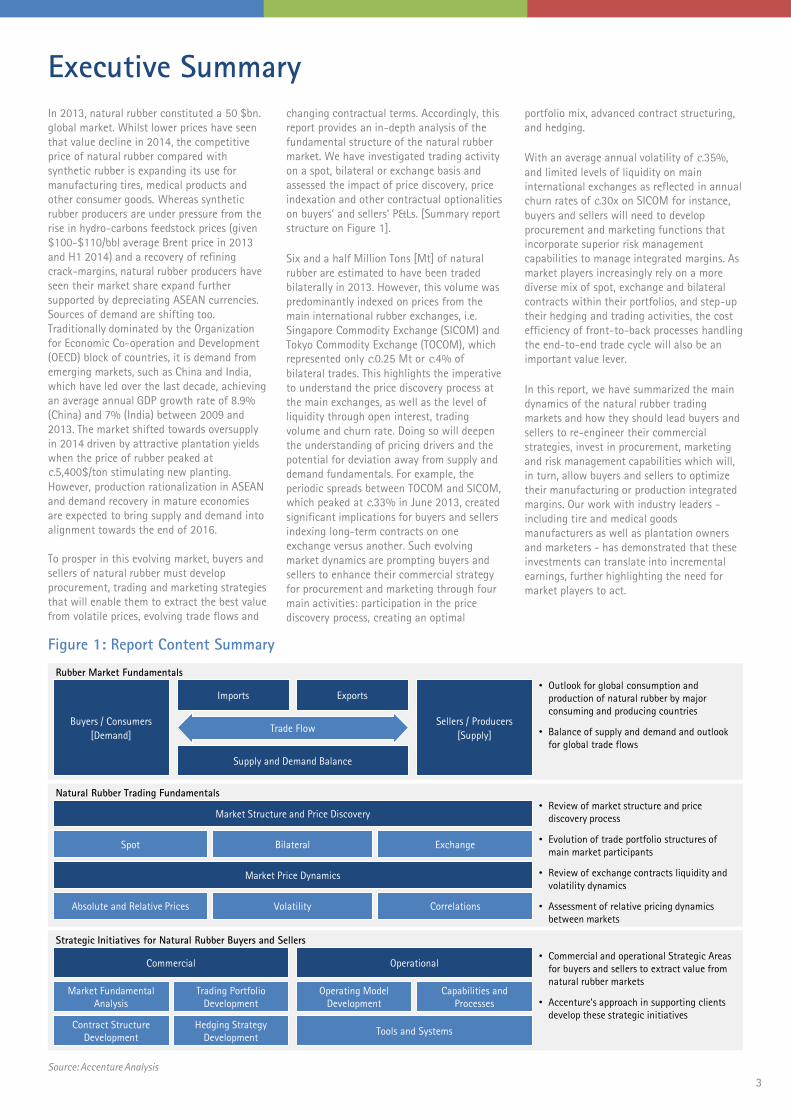
Figure 1: Report Content Summary
• Outlook for global consumption and
production of natural rubber by major
consuming and producing countries
• Balance of supply and demand and outlook
for global trade flows
• Review of market structure and price
discovery process
• Evolution of trade portfolio structures of
main market participants
• Review of exchange contracts liquidity and
volatility dynamics
• Assessment of relative pricing dynamics
between markets
Natural Rubber Trading Fundamentals
• Commercial and operational Strategic Areas
for buyers and sellers to extract value from
natural rubber markets
• Accenture’s approach in supporting clients
develop these strategic initiatives
Rubber Market Fundamentals
Strategic Initiatives for Natural Rubber Buyers and Sellers
Buyers / Consumers
[Demand]
Sellers / Producers
[Supply]
Imports Exports
Market Structure and Price Discovery
Trade Flow
Supply and Demand Balance
Commercial Operational
Market Fundamental
Analysis
Trading Portfolio
Development
Operating Model
Development
Capabilities and
Processes
Contract Structure
Development
Hedging Strategy
DevelopmentTools and Systems
Absolute and Relative Prices Volatility Correlations
Market Price Dynamics
Spot Bilateral Exchange
Source: Accenture Analysis
4
1Data Source: World Bank Development Indicators 2Source: Accenture Analysis. Data Source: UN Comtrade Database, International Rubber Study Group (IRSG).3Data Source: Bloomberg, Thomson Reuters
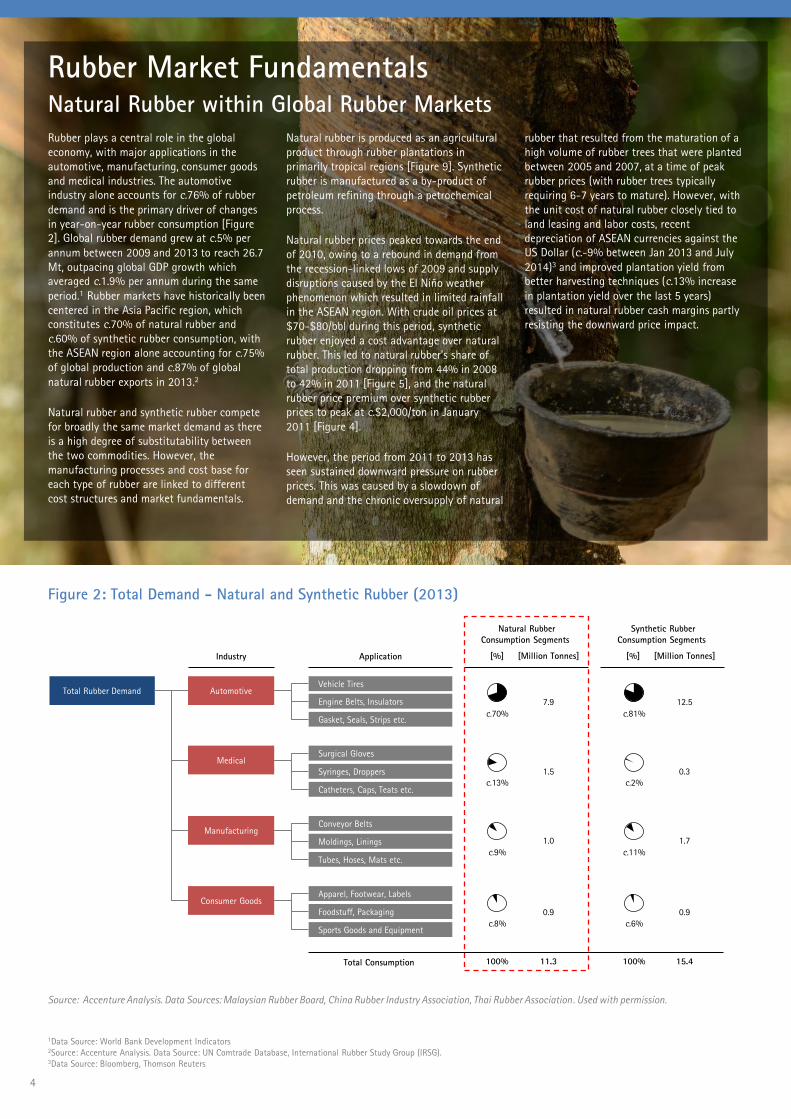
Rubber plays a central role in the global
economy, with major applications in the
automotive, manufacturing, consumer goods
and medical industries. The automotive
industry alone accounts for c.76% of rubber
demand and is the primary driver of changes
in year-on-year rubber consumption [Figure
2]. Global rubber demand grew at c.5% per
annum between 2009 and 2013 to reach 26.7
Mt, outpacing global GDP growth which
averaged c.1.9% per annum during the same
period.1 Rubber markets have historically been
centered in the Asia Pacific region, which
constitutes c.70% of natural rubber and
c.60% of synthetic rubber consumption, with
the ASEAN region alone accounting for c.75%
of global production and c.87% of global
natural rubber exports in 2013.2
Natural rubber and synthetic rubber compete
for broadly the same market demand as there
is a high degree of substitutability between
the two commodities. However, the
manufacturing processes and cost base for
each type of rubber are linked to different
cost structures and market fundamentals.
Natural rubber is produced as an agricultural
product through rubber plantations in
primarily tropical regions [Figure 9]. Synthetic
rubber is manufactured as a by-product of
petroleum refining through a petrochemical
process.
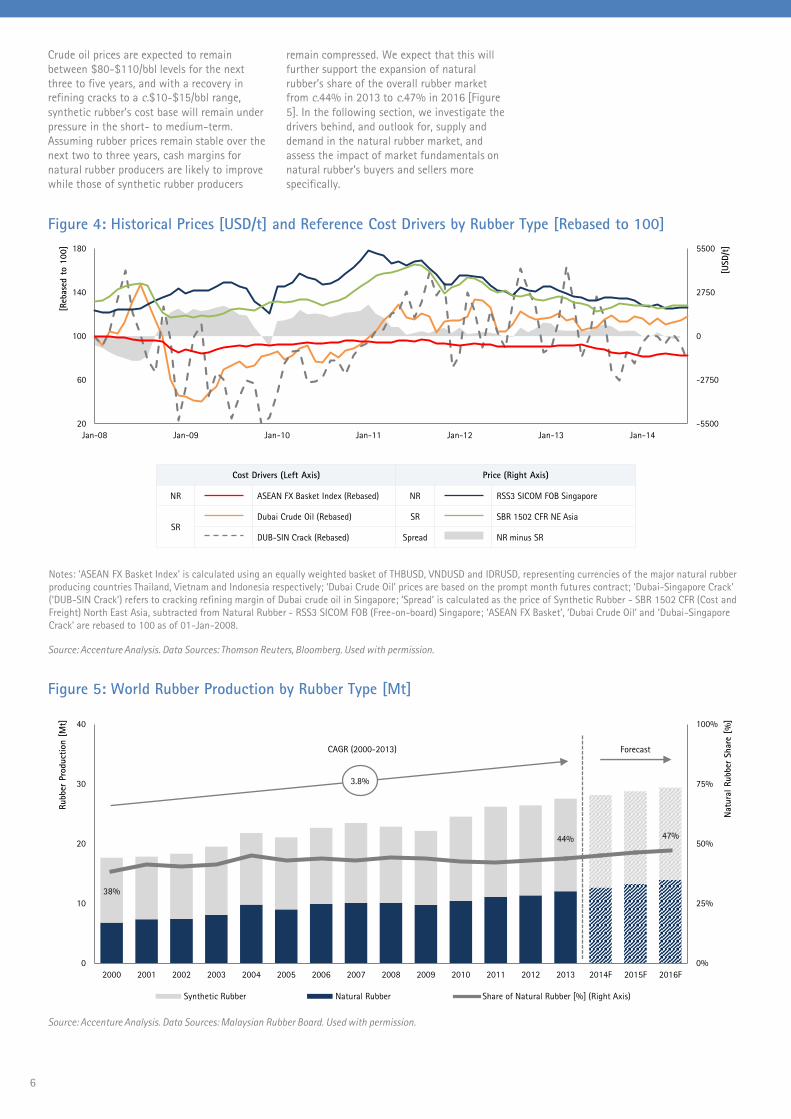
Natural rubber prices peaked towards the end
of 2010, owing to a rebound in demand from
the recession-linked lows of 2009 and supply
disruptions caused by the El Niño weather
phenomenon which resulted in limited rainfall
in the ASEAN region. With crude oil prices at
$70-$80/bbl during this period, synthetic
rubber enjoyed a cost advantage over natural
rubber. This led to natural rubber’s share of
total production dropping from 44% in 2008
to 42% in 2011 [Figure 5], and the natural
rubber price premium over synthetic rubber
prices to peak at c.$2,000/ton in January
2011 [Figure 4].
However, the period from 2011 to 2013 has
seen sustained downward pressure on rubber
prices. This was caused by a slowdown of
demand and the chronic oversupply of natural
rubber that resulted from the maturation of a
high volume of rubber trees that were planted
between 2005 and 2007, at a time of peak
rubber prices (with rubber trees typically
requiring 6-7 years to mature). However, with
the unit cost of natural rubber closely tied to
land leasing and labor costs, recent
depreciation of ASEAN currencies against the
US Dollar (c.-9% between Jan 2013 and July
2014)3 and improved plantation yield from
better harvesting techniques (c.13% increase
in plantation yield over the last 5 years)
resulted in natural rubber cash margins partly
resisting the downward price impact.
Rubber Market Fundamentals
Figure 2: Total Demand - Natural and Synthetic Rubber (2013)
Source: Accenture Analysis. Data Sources: Malaysian Rubber Board, China Rubber Industry Association, Thai Rubber Association. Used with permission.
Natural Rubber within Global Rubber Markets
Synthetic Rubber
Consumption Segments
0.3
12.5
1.7
0.9
15.4
[Million Tonnes]
Natural Rubber
Consumption Segments
1.5
7.9
1.0
0.9
11.3
[Million Tonnes][%]
c.8%
c.70%
c.13%
c.9%
[%]
c.81%
c.2%
c.11%
c.6%
Total Rubber Demand
Medical
Automotive
Consumer Goods
Manufacturing
Industry Application
Total Consumption
Surgical Gloves
Catheters, Caps, Teats etc.
Syringes, Droppers
Gasket, Seals, Strips etc.
Vehicle Tires
Engine Belts, Insulators
Conveyor Belts
Tubes, Hoses, Mats etc.
Moldings, Linings
Apparel, Footwear, Labels
Sports Goods and Equipment
Foodstuff, Packaging
100% 100%
4
5
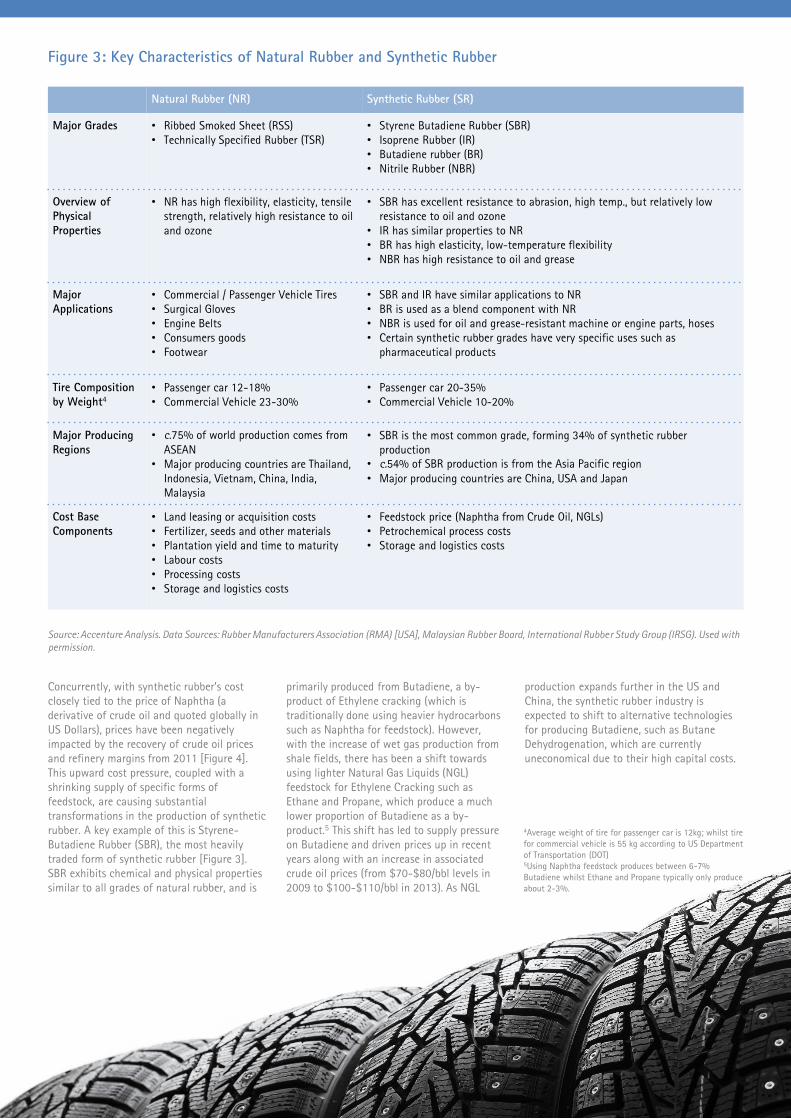
Figure 3: Key Characteristics of Natural Rubber and Synthetic Rubber
Natural Rubber (NR) Synthetic Rubber (SR)
Major Grades • Ribbed Smoked Sheet (RSS)
• Technically Specified Rubber (TSR)
• Styrene Butadiene Rubber (SBR)
• Isoprene Rubber (IR)
• Butadiene rubber (BR)
• Nitrile Rubber (NBR)
Overview of
Physical
Properties
• NR has high flexibility, elasticity, tensile
strength, relatively high resistance to oil
and ozone
• SBR has excellent resistance to abrasion, high temp., but relatively low
resistance to oil and ozone
• IR has similar properties to NR
• BR has high elasticity, low-temperature flexibility
• NBR has high resistance to oil and grease
Major
Applications
• Commercial / Passenger Vehicle Tires
• Surgical Gloves
• Engine Belts
• Consumers goods
• Footwear
• SBR and IR have similar applications to NR
• BR is used as a blend component with NR
• NBR is used for oil and grease-resistant machine or engine parts, hoses
• Certain synthetic rubber grades have very specific uses such as
pharmaceutical products
Tire Composition
by Weight4
• Passenger car 12-18%
• Commercial Vehicle 23-30%
• Passenger car 20-35%
• Commercial Vehicle 10-20%
Major Producing
Regions
• c.75% of world production comes from
ASEAN
• Major producing countries are Thailand,
Indonesia, Vietnam, China, India,
Malaysia
• SBR is the most common grade, forming 34% of synthetic rubber
production
• c.54% of SBR production is from the Asia Pacific region
• Major producing countries are China, USA and Japan
Cost Base
Components
• Land leasing or acquisition costs
• Fertilizer, seeds and other materials
• Plantation yield and time to maturity
• Labour costs
• Processing costs
• Storage and logistics costs
• Feedstock price (Naphtha from Crude Oil, NGLs)
• Petrochemical process costs
• Storage and logistics costs
Source: Accenture Analysis. Data Sources: Rubber Manufacturers Association (RMA) [USA], Malaysian Rubber Board, International Rubber Study Group (IRSG). Used with
permission.
Concurrently, with synthetic rubber’s cost
closely tied to the price of Naphtha (a
derivative of crude oil and quoted globally in
US Dollars), prices have been negatively
impacted by the recovery of crude oil prices
and refinery margins from 2011 [Figure 4].
This upward cost pressure, coupled with a
shrinking supply of specific forms of
feedstock, are causing substantial
transformations in the production of synthetic
rubber. A key example of this is Styrene-
Butadiene Rubber (SBR), the most heavily
traded form of synthetic rubber [Figure 3].
SBR exhibits chemical and physical properties
similar to all grades of natural rubber, and is
primarily produced from Butadiene, a by-
product of Ethylene cracking (which is
traditionally done using heavier hydrocarbons
such as Naphtha for feedstock). However,
with the increase of wet gas production from
shale fields, there has been a shift towards
using lighter Natural Gas Liquids (NGL)
feedstock for Ethylene Cracking such as
Ethane and Propane, which produce a much
lower proportion of Butadiene as a by-
product.5 This shift has led to supply pressure
on Butadiene and driven prices up in recent
years along with an increase in associated
crude oil prices (from $70-$80/bbl levels in
2009 to $100-$110/bbl in 2013). As NGL
production expands further in the US and
China, the synthetic rubber industry is
expected to shift to alternative technologies
for producing Butadiene, such as Butane
Dehydrogenation, which are currently
uneconomical due to their high capital costs.
4Average weight of tire for passenger car is 12kg; whilst tire
for commercial vehicle is 55 kg according to US Department
of Transportation (DOT)5Using Naphtha feedstock produces between 6-7%
Butadiene whilst Ethane and Propane typically only produce
about 2-3%.
6
38%
44% 47%
0%
25%
50%
75%
100%
0
10
20
30
40
2000 2001 2002 2003 2004 2005 2006 2007 2008 2009 2010 2011 2012 2013 2014F 2015F 2016F
Synthetic Rubber Natural Rubber Share of Natural Rubber [%] (Right Axis)
ForecastCAGR (2000-2013)
3.8%
Cost Drivers (Left Axis) Price (Right Axis)
NR ASEAN FX Basket Index (Rebased) NR RSS3 SICOM FOB Singapore
SRDubai Crude Oil (Rebased) SR SBR 1502 CFR NE Asia
DUB-SIN Crack (Rebased) Spread NR minus SR
-5500
-2750
0
2750
5500
20
60
100
140
180
Jan-08 Jan-09 Jan-10 Jan-11 Jan-12 Jan-13 Jan-14
Notes: ‘ASEAN FX Basket Index’ is calculated using an equally weighted basket of THBUSD, VNDUSD and IDRUSD, representing currencies of the major natural rubber
producing countries Thailand, Vietnam and Indonesia respectively; ‘Dubai Crude Oil’ prices are based on the prompt month futures contract; ‘Dubai-Singapore Crack’
(‘DUB-SIN Crack’) refers to cracking refining margin of Dubai crude oil in Singapore; ‘Spread’ is calculated as the price of Synthetic Rubber - SBR 1502 CFR (Cost and
Freight) North East Asia, subtracted from Natural Rubber - RSS3 SICOM FOB (Free-on-board) Singapore; ‘ASEAN FX Basket’, ‘Dubai Crude Oil‘ and ‘Dubai-Singapore
Crack’ are rebased to 100 as of 01-Jan-2008.
Source: Accenture Analysis. Data Sources: Thomson Reuters, Bloomberg. Used with permission.
Figure 5: World Rubber Production by Rubber Type [Mt]
Source: Accenture Analysis. Data Sources: Malaysian Rubber Board. Used with permission.
[Reb
ase
d t
o 1
00]
[USD/t
]
Rubber
Pro
duct
ion [
Mt]
Natu
ral Rubber
Share
[%
]
Crude oil prices are expected to remain
between $80-$110/bbl levels for the next
three to five years, and with a recovery in
refining cracks to a c.$10-$15/bbl range,
synthetic rubber’s cost base will remain under
pressure in the short- to medium-term.
Assuming rubber prices remain stable over the
next two to three years, cash margins for
natural rubber producers are likely to improve
while those of synthetic rubber producers
remain compressed. We expect that this will
further support the expansion of natural
rubber’s share of the overall rubber market
from c.44% in 2013 to c.47% in 2016 [Figure
5]. In the following section, we investigate the
drivers behind, and outlook for, supply and
demand in the natural rubber market, and
assess the impact of market fundamentals on
natural rubber’s buyers and sellers more
specifically.
Figure 4: Historical Prices [USD/t] and Reference Cost Drivers by Rubber Type [Rebased to 100]
6

7
8
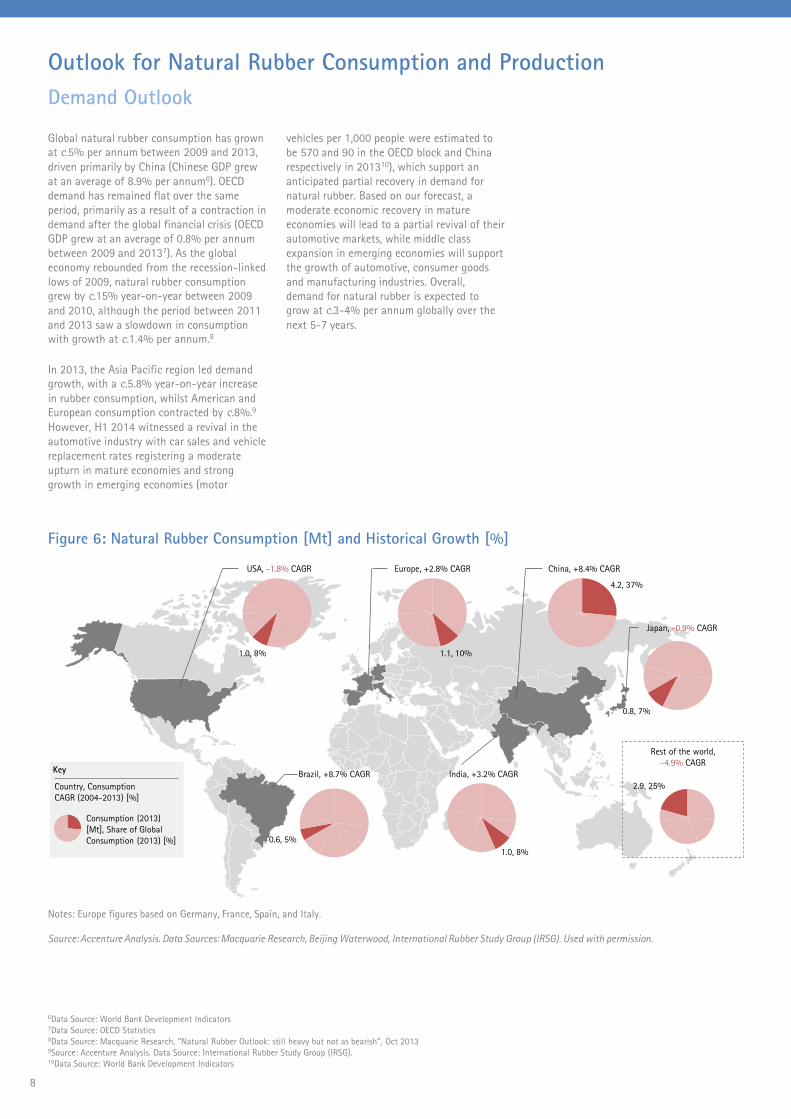
Global natural rubber consumption has grown
at c.5% per annum between 2009 and 2013,
driven primarily by China (Chinese GDP grew
at an average of 8.9% per annum6). OECD
demand has remained flat over the same
period, primarily as a result of a contraction in
demand after the global financial crisis (OECD
GDP grew at an average of 0.8% per annum
between 2009 and 20137). As the global
economy rebounded from the recession-linked
lows of 2009, natural rubber consumption
grew by c.15% year-on-year between 2009
and 2010, although the period between 2011
and 2013 saw a slowdown in consumption
with growth at c.1.4% per annum.8
In 2013, the Asia Pacific region led demand
growth, with a c.5.8% year-on-year increase
in rubber consumption, whilst American and
European consumption contracted by c.8%.9
However, H1 2014 witnessed a revival in the
automotive industry with car sales and vehicle
replacement rates registering a moderate
upturn in mature economies and strong
growth in emerging economies (motor
vehicles per 1,000 people were estimated to
be 570 and 90 in the OECD block and China
respectively in 201310), which support an
anticipated partial recovery in demand for
natural rubber. Based on our forecast, a
moderate economic recovery in mature
economies will lead to a partial revival of their
automotive markets, while middle class
expansion in emerging economies will support
the growth of automotive, consumer goods
and manufacturing industries. Overall,
demand for natural rubber is expected to
grow at c.3-4% per annum globally over the
next 5-7 years.
Outlook for Natural Rubber Consumption and Production
Demand Outlook
Figure 6: Natural Rubber Consumption [Mt] and Historical Growth [%]
Notes: Europe figures based on Germany, France, Spain, and Italy.
Source: Accenture Analysis. Data Sources: Macquarie Research, Beijing Waterwood, International Rubber Study Group (IRSG). Used with permission.
Japan, -0.9% CAGR
India, +3.2% CAGRBrazil, +8.7% CAGR
Rest of the world,
-4.9% CAGR
1.1, 10%
4.2, 37%
0.8, 7%
0.6, 5%
1.0, 8%
2.9, 25%
China, +8.4% CAGREurope, +2.8% CAGRUSA, -1.8% CAGR
1.0, 8%
Key
Country, Consumption
CAGR (2004-2013) [%]
Consumption (2013)
[Mt], Share of Global
Consumption (2013) [%]
6Data Source: World Bank Development Indicators7Data Source: OECD Statistics8Data Source: Macquarie Research, “Natural Rubber Outlook: still heavy but not as bearish”, Oct 20139Source: Accenture Analysis. Data Source: International Rubber Study Group (IRSG).10Data Source: World Bank Development Indicators
8
9
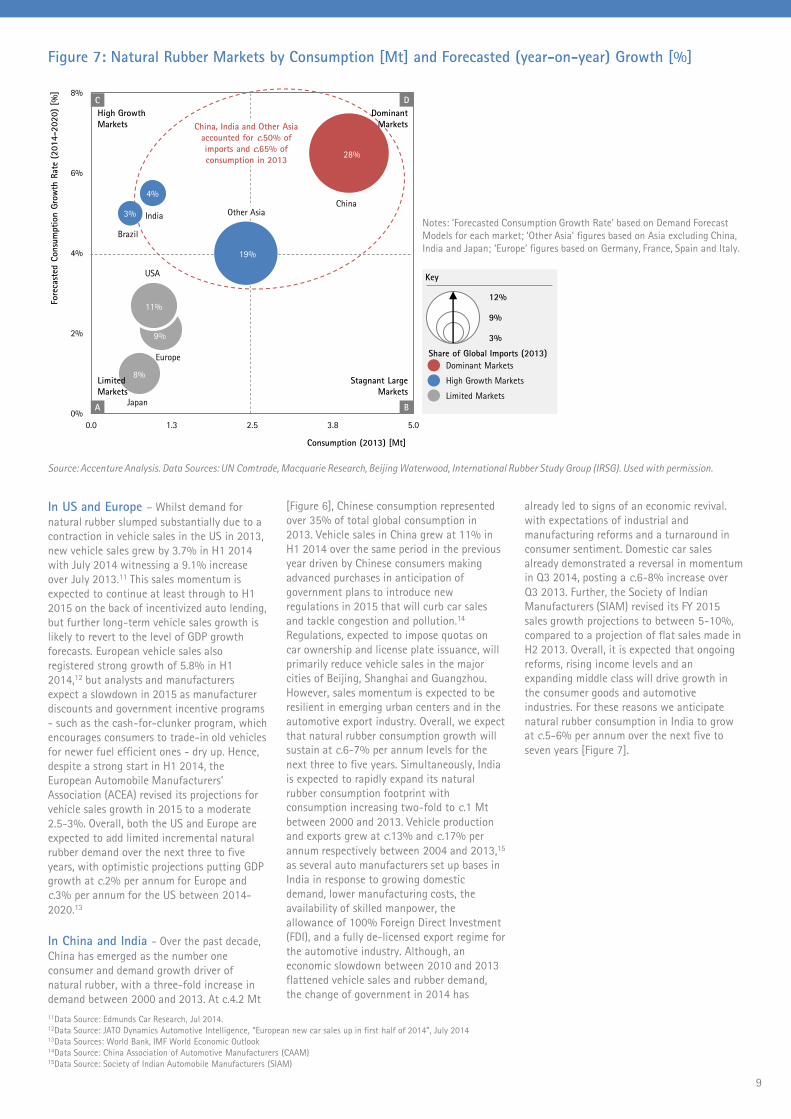
In US and Europe – Whilst demand for
natural rubber slumped substantially due to a
contraction in vehicle sales in the US in 2013,
new vehicle sales grew by 3.7% in H1 2014
with July 2014 witnessing a 9.1% increase
over July 2013.11 This sales momentum is
expected to continue at least through to H1
2015 on the back of incentivized auto lending,
but further long-term vehicle sales growth is
likely to revert to the level of GDP growth
forecasts. European vehicle sales also
registered strong growth of 5.8% in H1
2014,12 but analysts and manufacturers
expect a slowdown in 2015 as manufacturer
discounts and government incentive programs
- such as the cash-for-clunker program, which
encourages consumers to trade-in old vehicles
for newer fuel efficient ones - dry up. Hence,
despite a strong start in H1 2014, the
European Automobile Manufacturers'
Association (ACEA) revised its projections for
vehicle sales growth in 2015 to a moderate
2.5-3%. Overall, both the US and Europe are
expected to add limited incremental natural
rubber demand over the next three to five
years, with optimistic projections putting GDP
growth at c.2% per annum for Europe and
c.3% per annum for the US between 2014-
2020.13
In China and India - Over the past decade,
China has emerged as the number one
consumer and demand growth driver of
natural rubber, with a three-fold increase in
demand between 2000 and 2013. At c.4.2 Mt
[Figure 6], Chinese consumption represented
over 35% of total global consumption in
2013. Vehicle sales in China grew at 11% in
H1 2014 over the same period in the previous
year driven by Chinese consumers making
advanced purchases in anticipation of
government plans to introduce new
regulations in 2015 that will curb car sales
and tackle congestion and pollution.14
Regulations, expected to impose quotas on
car ownership and license plate issuance, will
primarily reduce vehicle sales in the major
cities of Beijing, Shanghai and Guangzhou.
However, sales momentum is expected to be
resilient in emerging urban centers and in the
automotive export industry. Overall, we expect
that natural rubber consumption growth will
sustain at c.6-7% per annum levels for the
next three to five years. Simultaneously, India
is expected to rapidly expand its natural
rubber consumption footprint with
consumption increasing two-fold to c.1 Mt
between 2000 and 2013. Vehicle production
and exports grew at c.13% and c.17% per
annum respectively between 2004 and 2013,15
as several auto manufacturers set up bases in
India in response to growing domestic
demand, lower manufacturing costs, the
availability of skilled manpower, the
allowance of 100% Foreign Direct Investment
(FDI), and a fully de-licensed export regime for
the automotive industry. Although, an
economic slowdown between 2010 and 2013
flattened vehicle sales and rubber demand,
the change of government in 2014 has
already led to signs of an economic revival.
with expectations of industrial and
manufacturing reforms and a turnaround in
consumer sentiment. Domestic car sales
already demonstrated a reversal in momentum
in Q3 2014, posting a c.6-8% increase over
Q3 2013. Further, the Society of Indian
Manufacturers (SIAM) revised its FY 2015
sales growth projections to between 5-10%,
compared to a projection of flat sales made in
H2 2013. Overall, it is expected that ongoing
reforms, rising income levels and an
expanding middle class will drive growth in
the consumer goods and automotive
industries. For these reasons we anticipate
natural rubber consumption in India to grow
at c.5-6% per annum over the next five to
seven years [Figure 7].
Figure 7: Natural Rubber Markets by Consumption [Mt] and Forecasted (year-on-year) Growth [%]
Notes: ‘Forecasted Consumption Growth Rate’ based on Demand Forecast
Models for each market; ‘Other Asia’ figures based on Asia excluding China,
India and Japan; ‘Europe’ figures based on Germany, France, Spain and Italy.
Source: Accenture Analysis. Data Sources: UN Comtrade, Macquarie Research, Beijing Waterwood, International Rubber Study Group (IRSG). Used with permission.
China, India and Other Asia
accounted for c.50% of
imports and c.65% of
consumption in 2013
0%
2%
4%
6%
8%
0.0 1.3 2.5 3.8 5.0
India
Europe
Other Asia
USA
Japan
China
High Growth
Markets
C D
A B
Limited
Markets
Stagnant Large
Markets
Fore
cast
ed C
onsu
mpti
on G
row
th R
ate
(2014-2020)
[%]
Consumption (2013) [Mt]
Brazil
Dominant
Markets
Key
Share of Global Imports (2013)
12%
3%
9%
11Data Source: Edmunds Car Research, Jul 2014.12Data Source: JATO Dynamics Automotive Intelligence, “European new car sales up in first half of 2014”, July 201413Data Sources: World Bank, IMF World Economic Outlook14Data Source: China Association of Automotive Manufacturers (CAAM)15Data Source: Society of Indian Automobile Manufacturers (SIAM)
28%
19%
4%
3%
11%
9%
8%High Growth Markets
Limited Markets
Dominant Markets
10
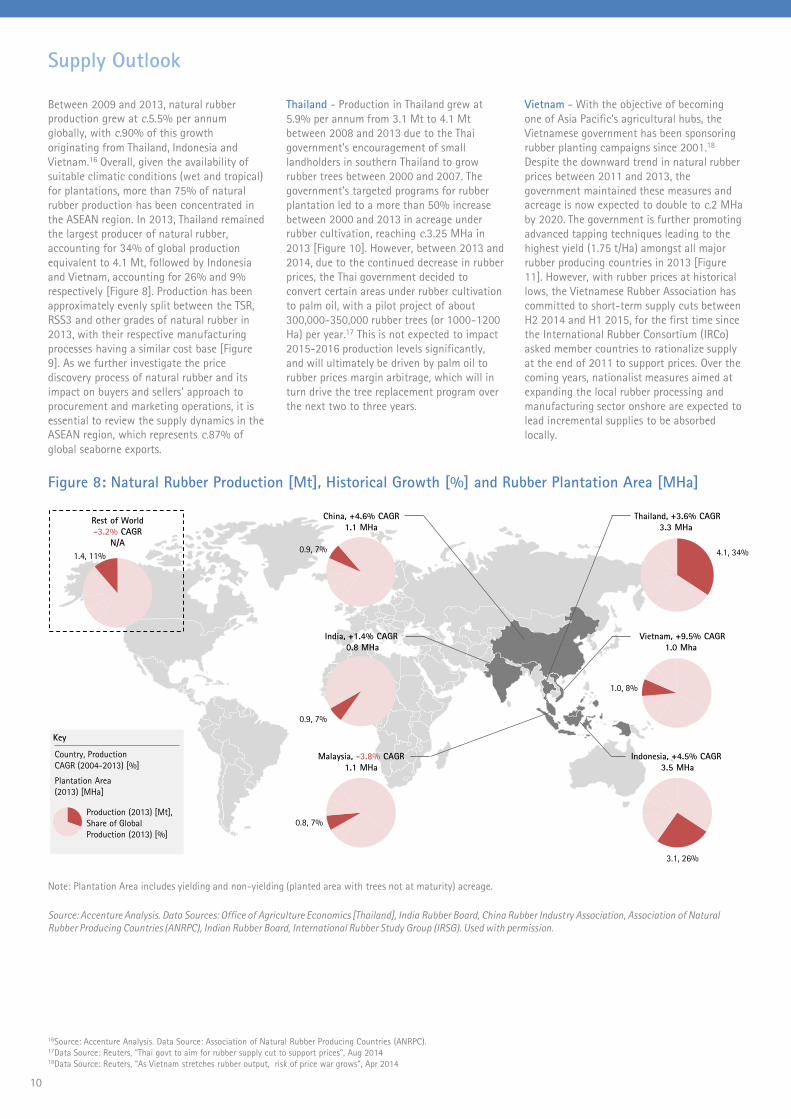
Figure 8: Natural Rubber Production [Mt], Historical Growth [%] and Rubber Plantation Area [MHa]
Note: Plantation Area includes yielding and non-yielding (planted area with trees not at maturity) acreage.
Source: Accenture Analysis. Data Sources: Office of Agriculture Economics [Thailand], India Rubber Board, China Rubber Industry Association, Association of Natural
Rubber Producing Countries (ANRPC), Indian Rubber Board, International Rubber Study Group (IRSG). Used with permission.
Supply Outlook
Between 2009 and 2013, natural rubber
production grew at c.5.5% per annum
globally, with c.90% of this growth
originating from Thailand, Indonesia and
Vietnam.16 Overall, given the availability of
suitable climatic conditions (wet and tropical)
for plantations, more than 75% of natural
rubber production has been concentrated in
the ASEAN region. In 2013, Thailand remained
the largest producer of natural rubber,
accounting for 34% of global production
equivalent to 4.1 Mt, followed by Indonesia
and Vietnam, accounting for 26% and 9%
respectively [Figure 8]. Production has been
approximately evenly split between the TSR,
RSS3 and other grades of natural rubber in
2013, with their respective manufacturing
processes having a similar cost base [Figure
9]. As we further investigate the price
discovery process of natural rubber and its
impact on buyers and sellers’ approach to
procurement and marketing operations, it is
essential to review the supply dynamics in the
ASEAN region, which represents c.87% of
global seaborne exports.
Thailand - Production in Thailand grew at
5.9% per annum from 3.1 Mt to 4.1 Mt
between 2008 and 2013 due to the Thai
government’s encouragement of small
landholders in southern Thailand to grow
rubber trees between 2000 and 2007. The
government’s targeted programs for rubber
plantation led to a more than 50% increase
between 2000 and 2013 in acreage under
rubber cultivation, reaching c.3.25 MHa in
2013 [Figure 10]. However, between 2013 and
2014, due to the continued decrease in rubber
prices, the Thai government decided to
convert certain areas under rubber cultivation
to palm oil, with a pilot project of about
300,000-350,000 rubber trees (or 1000-1200
Ha) per year.17 This is not expected to impact
2015-2016 production levels significantly,
and will ultimately be driven by palm oil to
rubber prices margin arbitrage, which will in
turn drive the tree replacement program over
the next two to three years.
Vietnam - With the objective of becoming
one of Asia Pacific’s agricultural hubs, the
Vietnamese government has been sponsoring
rubber planting campaigns since 2001.18
Despite the downward trend in natural rubber
prices between 2011 and 2013, the
government maintained these measures and
acreage is now expected to double to c.2 MHa
by 2020. The government is further promoting
advanced tapping techniques leading to the
highest yield (1.75 t/Ha) amongst all major
rubber producing countries in 2013 [Figure
11]. However, with rubber prices at historical
lows, the Vietnamese Rubber Association has
committed to short-term supply cuts between
H2 2014 and H1 2015, for the first time since
the International Rubber Consortium (IRCo)
asked member countries to rationalize supply
at the end of 2011 to support prices. Over the
coming years, nationalist measures aimed at
expanding the local rubber processing and
manufacturing sector onshore are expected to
lead incremental supplies to be absorbed
locally.
Rest of World
-3.2% CAGR
N/A
1.4, 11%
Key
Country, Production
CAGR (2004-2013) [%]
Plantation Area
(2013) [MHa]
Production (2013) [Mt],
Share of Global
Production (2013) [%]
Thailand, +3.6% CAGR
3.3 MHa
China, +4.6% CAGR
1.1 MHa
India, +1.4% CAGR
0.8 MHa
Malaysia, -3.8% CAGR
1.1 MHa
Vietnam, +9.5% CAGR
1.0 Mha
4.1, 34%
1.0, 8%
3.1, 26%
0.8, 7%
0.9, 7%
0.9, 7%
Indonesia, +4.5% CAGR
3.5 MHa
16Source: Accenture Analysis. Data Source: Association of Natural Rubber Producing Countries (ANRPC).17Data Source: Reuters, “Thai govt to aim for rubber supply cut to support prices”, Aug 201418Data Source: Reuters, “As Vietnam stretches rubber output, risk of price war grows”, Apr 2014
10
11
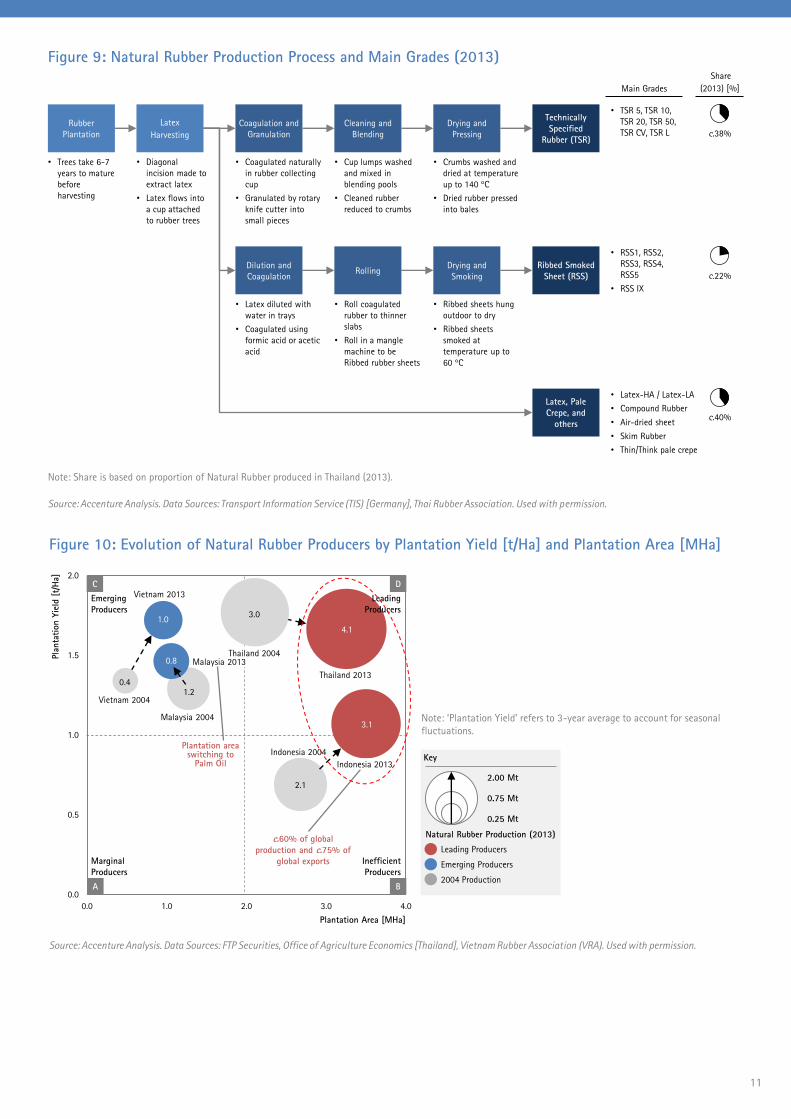
Figure 9: Natural Rubber Production Process and Main Grades (2013) Share
(2013) [%]Main Grades
• RSS1, RSS2,
RSS3, RSS4,
RSS5
• RSS IX
• TSR 5, TSR 10,
TSR 20, TSR 50,
TSR CV, TSR L
• Latex-HA / Latex-LA
• Compound Rubber
• Air-dried sheet
• Skim Rubber
• Thin/Think pale crepe
• Trees take 6-7
years to mature
before
harvesting
• Diagonal
incision made to
extract latex
• Latex flows into
a cup attached
to rubber trees
• Cup lumps washed
and mixed in
blending pools
• Cleaned rubber
reduced to crumbs
• Crumbs washed and
dried at temperature
up to 140 °C
• Dried rubber pressed
into bales
Latex, Pale
Crepe, and
others
Dilution and
Coagulation
Ribbed Smoked
Sheet (RSS)
Drying and
SmokingRolling
Rubber
Plantation
Latex
Harvesting
Technically
Specified
Rubber (TSR)
Drying and
Pressing
Cleaning and
Blending
Coagulation and
Granulation
• Coagulated naturally
in rubber collecting
cup
• Granulated by rotary
knife cutter into
small pieces
• Roll coagulated
rubber to thinner
slabs
• Roll in a mangle
machine to be
Ribbed rubber sheets
• Latex diluted with
water in trays
• Coagulated using
formic acid or acetic
acid
• Ribbed sheets hung
outdoor to dry
• Ribbed sheets
smoked at
temperature up to
60 °C
c.22%
c.40%
c.38%
Note: Share is based on proportion of Natural Rubber produced in Thailand (2013).
Source: Accenture Analysis. Data Sources: Transport Information Service (TIS) [Germany], Thai Rubber Association. Used with permission.
Figure 10: Evolution of Natural Rubber Producers by Plantation Yield [t/Ha] and Plantation Area [MHa]
Source: Accenture Analysis. Data Sources: FTP Securities, Office of Agriculture Economics [Thailand], Vietnam Rubber Association (VRA). Used with permission.
0.0
0.5
1.0
1.5
2.0
0.0 1.0 2.0 3.0 4.0
Pla
nta
tion Y
ield
[t/
Ha]
C D
A B
Emerging
Producers
Leading
Producers
Marginal
Producers
Inefficient
Producers
Vietnam 2013
Vietnam 2004
Malaysia 2004
Malaysia 2013Thailand 2004
Thailand 2013
Indonesia 2004Plantation area switching to
Palm Oil
c.60% of global
production and c.75% of
global exports
Plantation Area [MHa]
Indonesia 2013
Note: ‘Plantation Yield’ refers to 3-year average to account for seasonal
fluctuations.
Key
Natural Rubber Production (2013)
2.00 Mt
0.25 Mt
0.75 Mt
Emerging Producers
2004 Production
Leading Producers
3.0
2.1
1.20.4
4.1
3.1
1.0
0.8
12
2.1 2.3 2.6 2.8 2.8 2.4 2.7 3.0 3.0 3.1
3.0 2.93.1 3.1 3.1
3.23.3
3.6 3.84.1
1.2 1.1
1.3 1.2 1.10.9
0.9
1.00.9
0.8
0.4 0.5
0.6 0.6 0.70.7
0.8
0.8 0.91.0
0.0
5.0
10.0
15.0
2004 2005 2006 2007 2008 2009 2010 2011 2012 2013
0.0
0.4
0.8
1.2
1.6
2.0
Pro
duct
ion [
Mt]
Yie
ld [
Tonnes
/Hec
tare
]
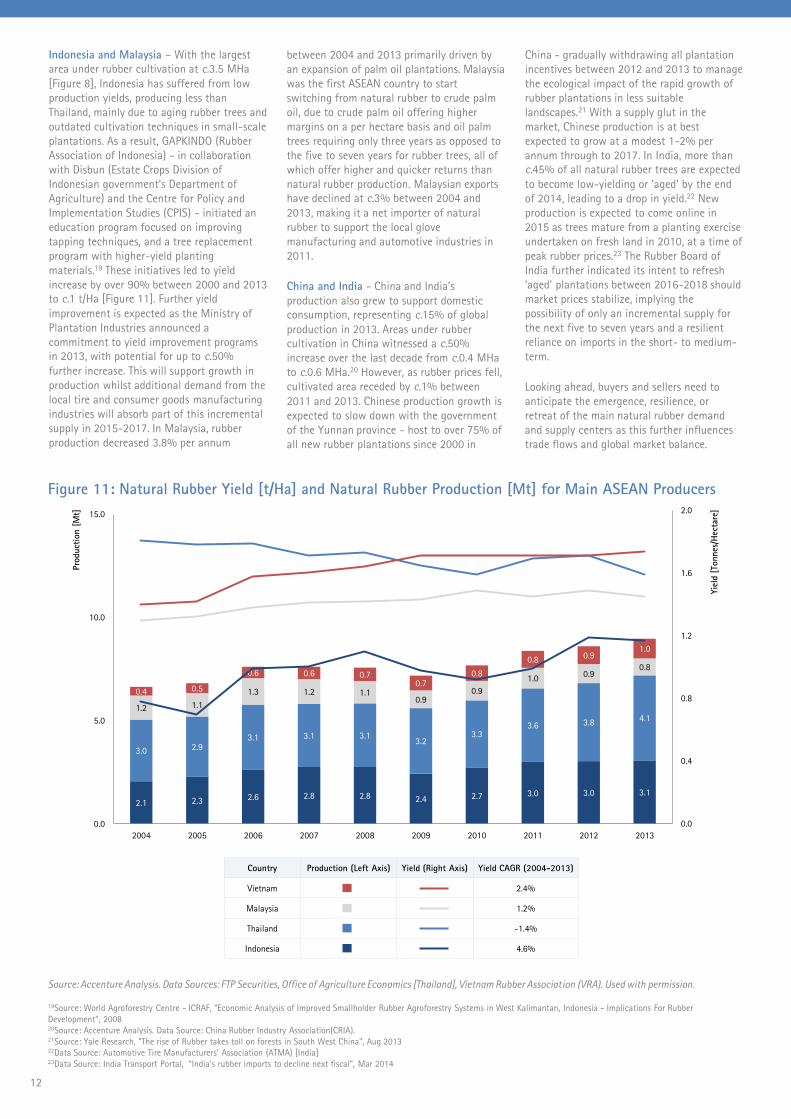
Indonesia and Malaysia – With the largest
area under rubber cultivation at c.3.5 MHa
[Figure 8], Indonesia has suffered from low
production yields, producing less than
Thailand, mainly due to aging rubber trees and
outdated cultivation techniques in small-scale
plantations. As a result, GAPKINDO (Rubber
Association of Indonesia) - in collaboration
with Disbun (Estate Crops Division of
Indonesian government’s Department of
Agriculture) and the Centre for Policy and
Implementation Studies (CPIS) - initiated an
education program focused on improving
tapping techniques, and a tree replacement
program with higher-yield planting
materials.19 These initiatives led to yield
increase by over 90% between 2000 and 2013
to c.1 t/Ha [Figure 11]. Further yield
improvement is expected as the Ministry of
Plantation Industries announced a
commitment to yield improvement programs
in 2013, with potential for up to c.50%
further increase. This will support growth in
production whilst additional demand from the
local tire and consumer goods manufacturing
industries will absorb part of this incremental
supply in 2015-2017. In Malaysia, rubber
production decreased 3.8% per annum
between 2004 and 2013 primarily driven by
an expansion of palm oil plantations. Malaysia
was the first ASEAN country to start
switching from natural rubber to crude palm
oil, due to crude palm oil offering higher
margins on a per hectare basis and oil palm
trees requiring only three years as opposed to
the five to seven years for rubber trees, all of
which offer higher and quicker returns than
natural rubber production. Malaysian exports
have declined at c.3% between 2004 and
2013, making it a net importer of natural
rubber to support the local glove
manufacturing and automotive industries in
2011.
China and India - China and India’s
production also grew to support domestic
consumption, representing c.15% of global
production in 2013. Areas under rubber
cultivation in China witnessed a c.50%
increase over the last decade from c.0.4 MHa
to c.0.6 MHa.20 However, as rubber prices fell,
cultivated area receded by c.1% between
2011 and 2013. Chinese production growth is
expected to slow down with the government
of the Yunnan province - host to over 75% of
all new rubber plantations since 2000 in
China - gradually withdrawing all plantation
incentives between 2012 and 2013 to manage
the ecological impact of the rapid growth of
rubber plantations in less suitable
landscapes.21 With a supply glut in the
market, Chinese production is at best
expected to grow at a modest 1-2% per
annum through to 2017. In India, more than
c.45% of all natural rubber trees are expected
to become low-yielding or ‘aged’ by the end
of 2014, leading to a drop in yield.22 New
production is expected to come online in
2015 as trees mature from a planting exercise
undertaken on fresh land in 2010, at a time of
peak rubber prices.23 The Rubber Board of
India further indicated its intent to refresh
‘aged’ plantations between 2016-2018 should
market prices stabilize, implying the
possibility of only an incremental supply for
the next five to seven years and a resilient
reliance on imports in the short- to medium-
term.
Looking ahead, buyers and sellers need to
anticipate the emergence, resilience, or
retreat of the main natural rubber demand
and supply centers as this further influences
trade flows and global market balance.
Source: Accenture Analysis. Data Sources: FTP Securities, Office of Agriculture Economics [Thailand], Vietnam Rubber Association (VRA). Used with permission.
Figure 11: Natural Rubber Yield [t/Ha] and Natural Rubber Production [Mt] for Main ASEAN Producers
19Source: World Agroforestry Centre - ICRAF, “Economic Analysis of Improved Smallholder Rubber Agroforestry Systems in West Kalimantan, Indonesia - Implications For Rubber
Development”, 200820Source: Accenture Analysis. Data Source: China Rubber Industry Association(CRIA).21Source: Yale Research, "The rise of Rubber takes toll on forests in South West China", Aug 201322Data Source: Automotive Tire Manufacturers’ Association (ATMA) [India]23Data Source: India Transport Portal, “India’s rubber imports to decline next fiscal”, Mar 2014
Country Production (Left Axis) Yield (Right Axis) Yield CAGR (2004-2013)
Vietnam 2.4%
Malaysia 1.2%
Thailand -1.4%
Indonesia 4.6%
12
13
14
Trade Flows and Global Supply and Demand Balance
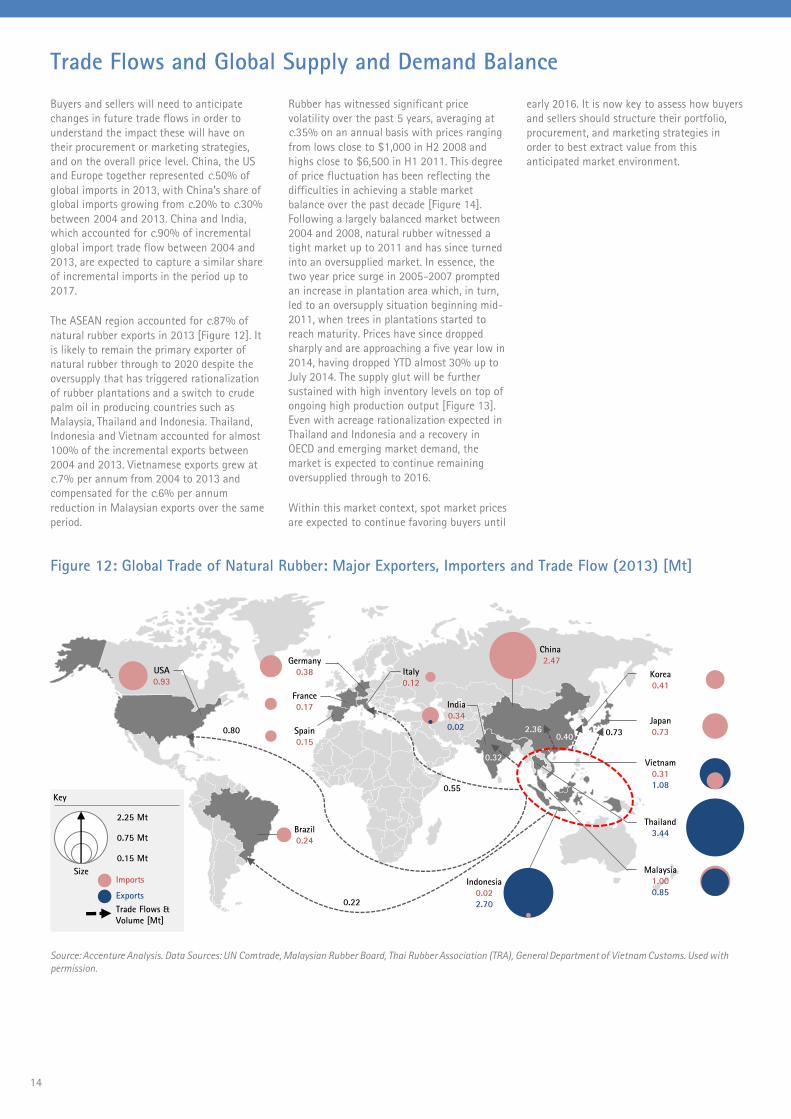
Buyers and sellers will need to anticipate
changes in future trade flows in order to
understand the impact these will have on
their procurement or marketing strategies,
and on the overall price level. China, the US
and Europe together represented c.50% of
global imports in 2013, with China’s share of
global imports growing from c.20% to c.30%
between 2004 and 2013. China and India,
which accounted for c.90% of incremental
global import trade flow between 2004 and
2013, are expected to capture a similar share
of incremental imports in the period up to
2017.
The ASEAN region accounted for c.87% of
natural rubber exports in 2013 [Figure 12]. It
is likely to remain the primary exporter of
natural rubber through to 2020 despite the
oversupply that has triggered rationalization
of rubber plantations and a switch to crude
palm oil in producing countries such as
Malaysia, Thailand and Indonesia. Thailand,
Indonesia and Vietnam accounted for almost
100% of the incremental exports between
2004 and 2013. Vietnamese exports grew at
c.7% per annum from 2004 to 2013 and
compensated for the c.6% per annum
reduction in Malaysian exports over the same
period.
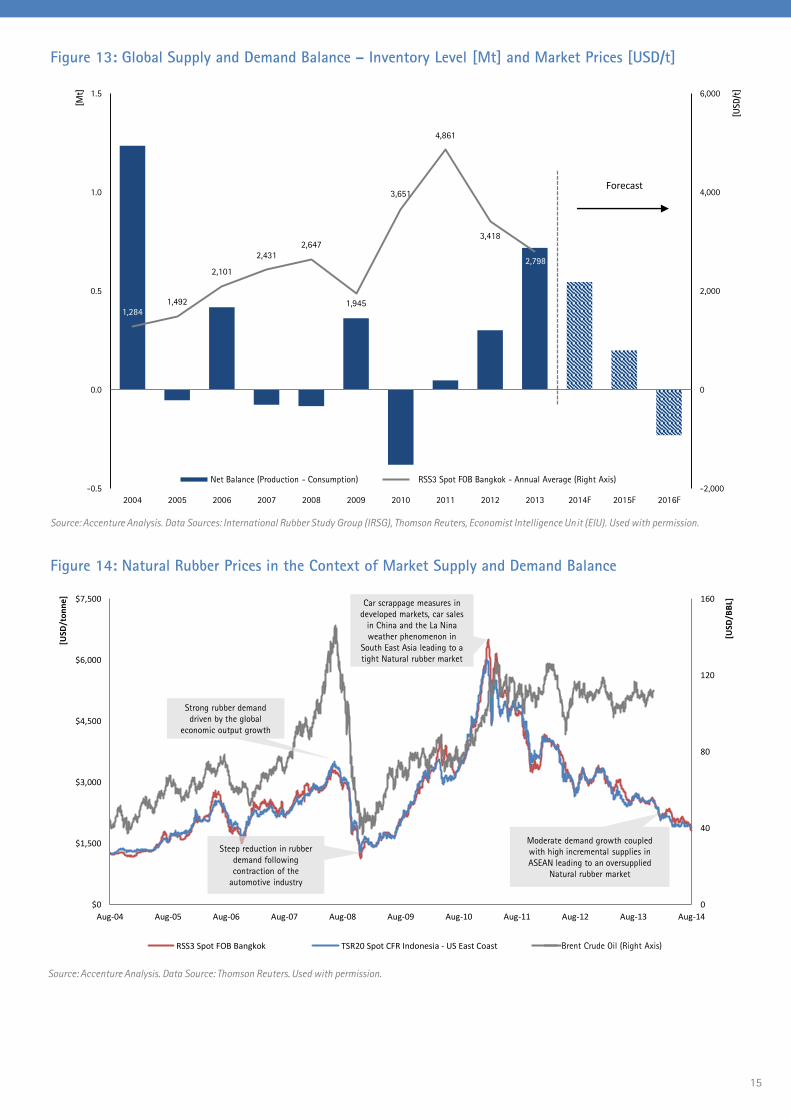
Rubber has witnessed significant price
volatility over the past 5 years, averaging at
c.35% on an annual basis with prices ranging
from lows close to $1,000 in H2 2008 and
highs close to $6,500 in H1 2011. This degree
of price fluctuation has been reflecting the
difficulties in achieving a stable market
balance over the past decade [Figure 14].
Following a largely balanced market between
2004 and 2008, natural rubber witnessed a
tight market up to 2011 and has since turned
into an oversupplied market. In essence, the
two year price surge in 2005-2007 prompted
an increase in plantation area which, in turn,
led to an oversupply situation beginning mid-
2011, when trees in plantations started to
reach maturity. Prices have since dropped
sharply and are approaching a five year low in
2014, having dropped YTD almost 30% up to
July 2014. The supply glut will be further
sustained with high inventory levels on top of
ongoing high production output [Figure 13].
Even with acreage rationalization expected in
Thailand and Indonesia and a recovery in
OECD and emerging market demand, the
market is expected to continue remaining
oversupplied through to 2016.
Within this market context, spot market prices
are expected to continue favoring buyers until
early 2016. It is now key to assess how buyers
and sellers should structure their portfolio,
procurement, and marketing strategies in
order to best extract value from this
anticipated market environment.
Figure 12: Global Trade of Natural Rubber: Major Exporters, Importers and Trade Flow (2013) [Mt]
Source: Accenture Analysis. Data Sources: UN Comtrade, Malaysian Rubber Board, Thai Rubber Association (TRA), General Department of Vietnam Customs. Used with
permission.
USA
0.93
Japan
0.73
Korea
0.41France
0.17
Brazil
0.24
Germany
0.38
India
0.34
0.02
Malaysia
1.00
0.85
Vietnam
0.31
1.08
0.80
0.22
0.55
2.36
0.32
0.730.40
Indonesia
0.02
2.70
Thailand
3.44
China
2.47
Spain
0.15
Italy
0.12
Key
Size
2.25 Mt
0.15 Mt
0.75 Mt
Exports
Imports
Trade Flows &
Volume [Mt]
14
15
1,2841,492
2,101
2,431
2,647
1,945
3,651
4,861
3,418
2,798
-2,000
0
2,000
4,000
6,000
-0.5
0.0
0.5
1.0
1.5
2004 2005 2006 2007 2008 2009 2010 2011 2012 2013 2014F 2015F 2016F
Forecast
RSS3 Spot FOB Bangkok - Annual Average (Right Axis)Net Balance (Production - Consumption)
0
40
80
120
160
$0
$1,500
$3,000
$4,500
$6,000
$7,500
Aug-04 Aug-05 Aug-06 Aug-07 Aug-08 Aug-09 Aug-10 Aug-11 Aug-12 Aug-13 Aug-14
[USD
/BBL]
[USD
/tonne]
RSS3 Spot FOB Bangkok TSR20 Spot CFR Indonesia - US East Coast Brent
Car scrappage measures in
developed markets, car sales
in China and the La Nina
weather phenomenon in
South East Asia leading to a
tight Natural rubber market
Strong rubber demand
driven by the global
economic output growth
Moderate demand growth coupled
with high incremental supplies in
ASEAN leading to an oversupplied
Natural rubber market
Steep reduction in rubber
demand following
contraction of the
automotive industry
Source: Accenture Analysis. Data Source: Thomson Reuters. Used with permission.
Figure 13: Global Supply and Demand Balance – Inventory Level [Mt] and Market Prices [USD/t]
Source: Accenture Analysis. Data Sources: International Rubber Study Group (IRSG), Thomson Reuters, Economist Intelligence Unit (EIU). Used with permission.
[Mt]
[USD/t
]
Figure 14: Natural Rubber Prices in the Context of Market Supply and Demand Balance
Brent Crude Oil (Right Axis)
16
Natural Rubber Trading Fundamentals
Achieving cost-efficient procurement or
revenue-maximizing marketing is a core
strategic objective of buyers and sellers.
Assessing the outlook for the supply and
demand of natural rubber provides an initial
view of the market’s balance, inferring
forecasts for prices and trade flows, which
can subsequently guide the future pricing of
manufactured products or production
planning. In addition, buyers and sellers can
generate additional value by understanding
the spot and term price discovery process and
structuring a trading portfolio that optimizes
price, volumetric optionality and exposure to
market, liquidity and counterparties’ risks. In
this section, we analyze the fundamentals of
the price discovery process, portfolio
structures and market liquidity in order to
derive recommendations for optimal natural
rubber marketing, trading and procurement.
17
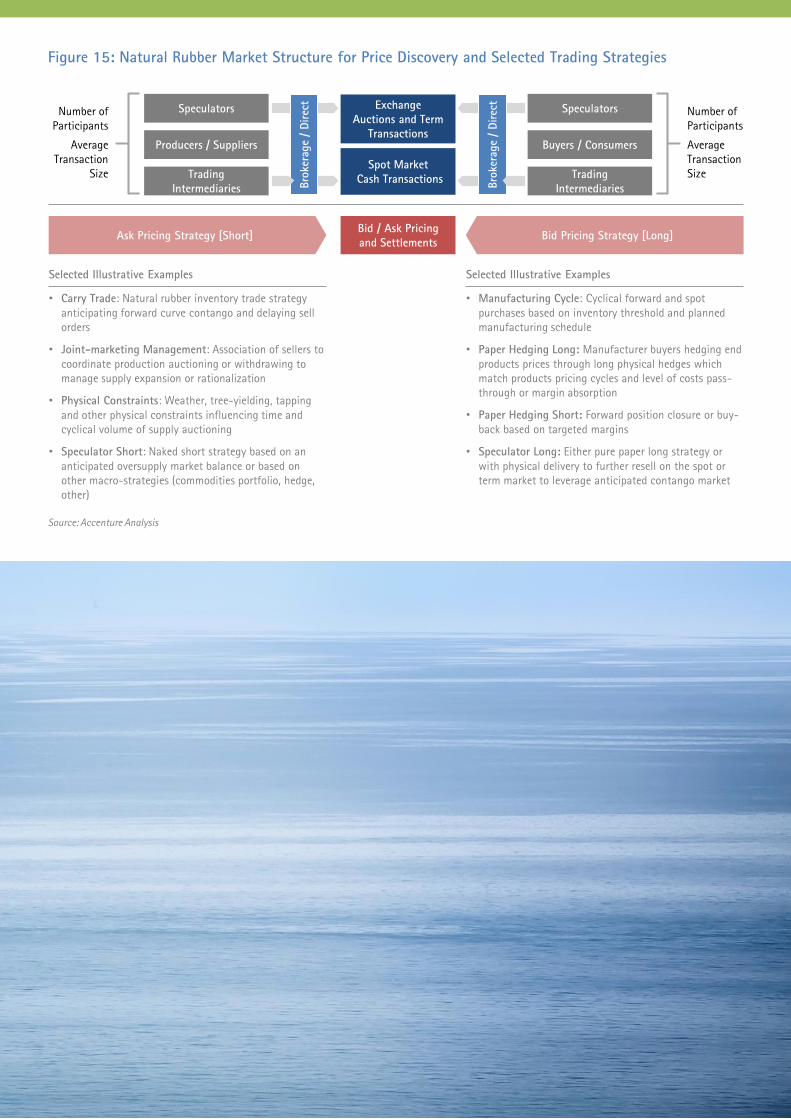
Figure 15: Natural Rubber Market Structure for Price Discovery and Selected Trading Strategies
Source: Accenture Analysis
Exchange
Auctions and Term
Transactions
Spot Market
Cash Transactions
Bid / Ask Pricing
and SettlementsAsk Pricing Strategy [Short] Bid Pricing Strategy [Long]
• Manufacturing Cycle: Cyclical forward and spot
purchases based on inventory threshold and planned
manufacturing schedule
• Paper Hedging Long: Manufacturer buyers hedging end
products prices through long physical hedges which
match products pricing cycles and level of costs pass-
through or margin absorption
• Paper Hedging Short: Forward position closure or buy-
back based on targeted margins
• Speculator Long: Either pure paper long strategy or
with physical delivery to further resell on the spot or
term market to leverage anticipated contango market
Speculators
Buyers / Consumers
Trading
Intermediaries
Number of
Participants
Average
Transaction
Size
Number of
Participants
Average
Transaction
Size
• Carry Trade: Natural rubber inventory trade strategy
anticipating forward curve contango and delaying sell
orders
• Joint-marketing Management: Association of sellers to
coordinate production auctioning or withdrawing to
manage supply expansion or rationalization
• Physical Constraints: Weather, tree-yielding, tapping
and other physical constraints influencing time and
cyclical volume of supply auctioning
• Speculator Short: Naked short strategy based on an
anticipated oversupply market balance or based on
other macro-strategies (commodities portfolio, hedge,
other)
Selected Illustrative Examples Selected Illustrative Examples
Speculators
Producers / Suppliers
Trading
Intermediaries Bro
ker
age
/ Direc
t
Bro
ker
age
/ Direc
t
18
Understanding the level of efficiency and
transparency in the price discovery process is
essential for any market participant seeking to
define an optimal sourcing or marketing
strategy. Similar to other commodities such as
grain, wheat or edible oils, natural rubber
price discovery has been driven by the players’
participation in the spot and term markets,
which, in turn, have been providing a price
reference for bilateral long-term contracts
indexation. A high level of liquidity is essential
to both spot and term markets, and is
reflected by a high volume of transactions
driven by a large number of counterparties
trading directly or indirectly through brokers.
Further analysis of the number of independent
participants can provide an indication of the
true level of market liquidity and the potential
for trading strategies to distort market prices.
Natural rubber has been following the same
evolutionary path of most commodity
markets. The market started with long-term
bilateral contracts for sellers to lock-in long-
term SPAs (Sales and Purchase Agreements) as
a way of backing their upfront investments in
production assets. Later, as production assets
expanded and volumes between buyers and
sellers progressively diverged, imbalances
arose which left excess volumes available for
the spot market. Such transactions provided
the basis for price discovery and portfolio
flexibility, further attracting additional
participants and creating a virtuous circle of
price discovery. At the same time, exchange
products were developed to meet hedging and
risk management requirements that arose
from buyers and sellers needing to lock-in
month- to year-ahead prices. As prices began
to reflect market supply and demand
fundamentals, buyers and sellers progressively
shifted fixed-price long-term contracts to
index-linked prices referencing spot indices or
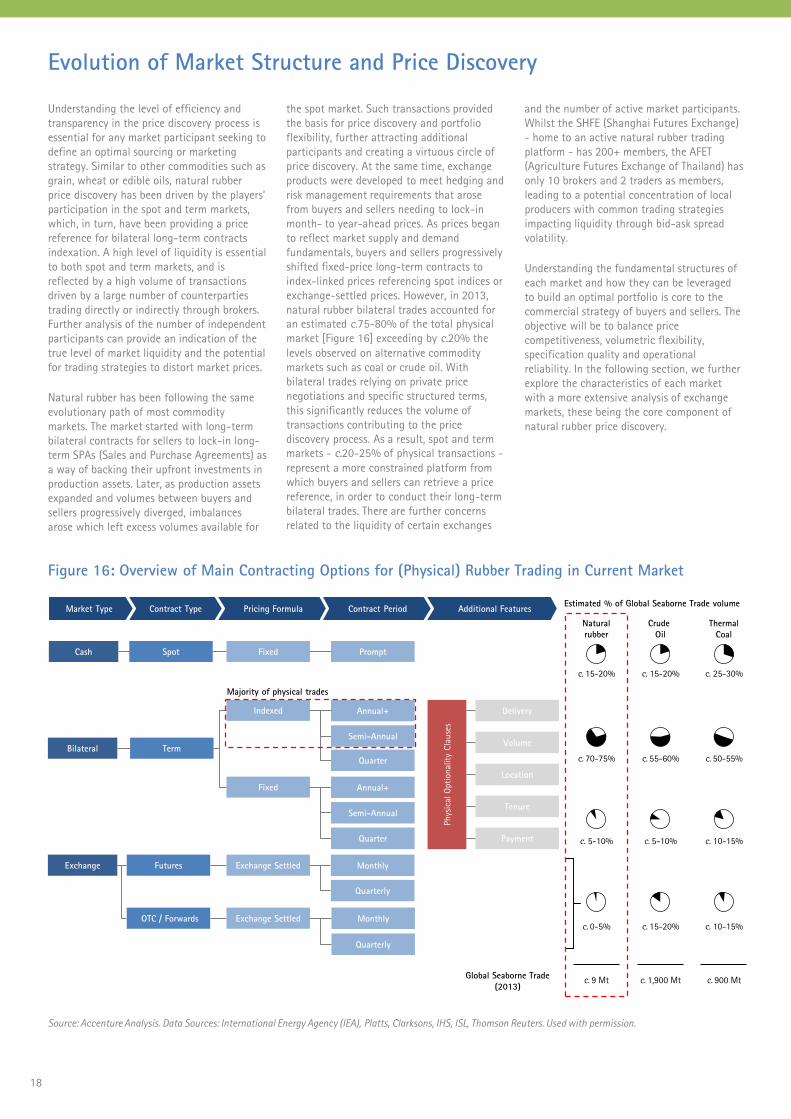
exchange-settled prices. However, in 2013,
natural rubber bilateral trades accounted for
an estimated c.75-80% of the total physical
market [Figure 16] exceeding by c.20% the
levels observed on alternative commodity
markets such as coal or crude oil. With
bilateral trades relying on private price
negotiations and specific structured terms,
this significantly reduces the volume of
transactions contributing to the price
discovery process. As a result, spot and term
markets - c.20-25% of physical transactions -
represent a more constrained platform from
which buyers and sellers can retrieve a price
reference, in order to conduct their long-term
bilateral trades. There are further concerns
related to the liquidity of certain exchanges
and the number of active market participants.
Whilst the SHFE (Shanghai Futures Exchange)
- home to an active natural rubber trading
platform - has 200+ members, the AFET
(Agriculture Futures Exchange of Thailand) has
only 10 brokers and 2 traders as members,
leading to a potential concentration of local
producers with common trading strategies
impacting liquidity through bid-ask spread
volatility.
Understanding the fundamental structures of
each market and how they can be leveraged
to build an optimal portfolio is core to the
commercial strategy of buyers and sellers. The
objective will be to balance price
competitiveness, volumetric flexibility,
specification quality and operational
reliability. In the following section, we further
explore the characteristics of each market
with a more extensive analysis of exchange
markets, these being the core component of
natural rubber price discovery.
Evolution of Market Structure and Price Discovery
Figure 16: Overview of Main Contracting Options for (Physical) Rubber Trading in Current Market
Additional Features
Term
Exchange
Contract PeriodPricing FormulaContract Type
Indexed
Fixed
Annual+
Semi-Annual
Exchange Settled Monthly
Quarterly
Majority of physical trades
Market Type
Prompt
Bilateral
Spot Fixed
Futures
Quarter
Annual+
Semi-Annual
Quarter
Phys
ical
Opti
onality
Cla
use
s
Delivery
Volume
Location
Tenure
Cash
Payment
OTC / Forwards Exchange Settled Monthly
Quarterly
Global Seaborne Trade
(2013)
Estimated % of Global Seaborne Trade volume
Crude
Oil
c. 55-60%
c. 15-20%
c. 15-20%
c. 5-10%
c. 1,900 Mt
Thermal
Coal
c. 25-30%
c. 10-15%
c. 10-15%
c. 50-55%
c. 900 Mt
Natural
rubber
c. 15-20%
c. 70-75%
c. 0-5%
c. 5-10%
c. 9 Mt
Source: Accenture Analysis. Data Sources: International Energy Agency (IEA), Platts, Clarksons, IHS, ISL, Thomson Reuters. Used with permission.
18
19
c.75-80% of natural rubber physical
transactions are executed through bilateral
contracts, and reflect the historically direct
relationship between buyers and producers.
Buyers typically purchase from a selected list
of suppliers whose natural rubber
specifications such as dirt, ash, Nitrogen and
volatile content matter are tested and
approved internally. In the past such contracts
would have been negotiated on a rolling
fixed-price basis, but have since been largely
indexed to exchange prices (e.g. SICOM) using
the average closing price over the month prior
to delivery further adjusted for a premium or
discount based on quality. As such, bilateral
contract volumes add little to the price
discovery process.
Bilateral contracts can, however, be
structured in multiple ways, offering buyers
and sellers the means to optimize value
through pricing, volumetric optionality, time
optionality, quality penalties and other
commercial terms [Figure 17]. Understanding
each contractual option, and having internal
valuation models to quantify its cost or
revenue impact, is becoming the norm for
certain sophisticated buyers aiming to
leverage long-term contract terms to optimize
their portfolios. As bilateral contracts lead to
long-term credit risk exposure, buyers and
sellers need to spread their positions carefully
across different parties and avoid issues such
as supply disruption or income losses.
Examples such as small-scale Chinese buyers,
who had committed to high fixed price
contracts, defaulting on volumes of c.200 kt in
2008-2009 when prices reached close to
$1,000/ton, further demonstrate the need for
active management of counterparty risk.24
Natural rubber spot transactions are expected
to represent c.15-20% of the total physical
market, with trades based on FOB Singapore
or FOB Tokyo mirroring the locations of the
major international exchanges. Whilst natural
rubber has a shelf life of around three to five
years, the trading market considers prime
rubber to be under 12 months old. With
relatively expensive storage costs equivalent
to c.1% of the rubber prices per month,25
inventories have been limited. As a result,
buyers have typically been relying on 7-10 day
natural rubber inventories, creating a strong
need for end-buyers on the spot market to
mitigate potential short-term disruptions in
their supply chain.26 As end-buyers need to
reach out to multiple suppliers to fulfil short-
term purchases, traders and brokers are often
leveraged as intermediaries to aggregate the
supply information flow and provide end-
buyers with natural rubber matching their
technical specifications, further expanding the
number of active counterparties.
As buyers typically rely on bilateral contracts
for the majority of their purchases - which are
based on uncommitted volumes with or
without flexible take-or-pay penalties - sellers
may not be able to provide planned volumes
due to production constraints. The spot
market consequently becomes an important
platform for managing supply security and to
secure incremental supply needed, for
example, from an increase in manufacturing
activity.
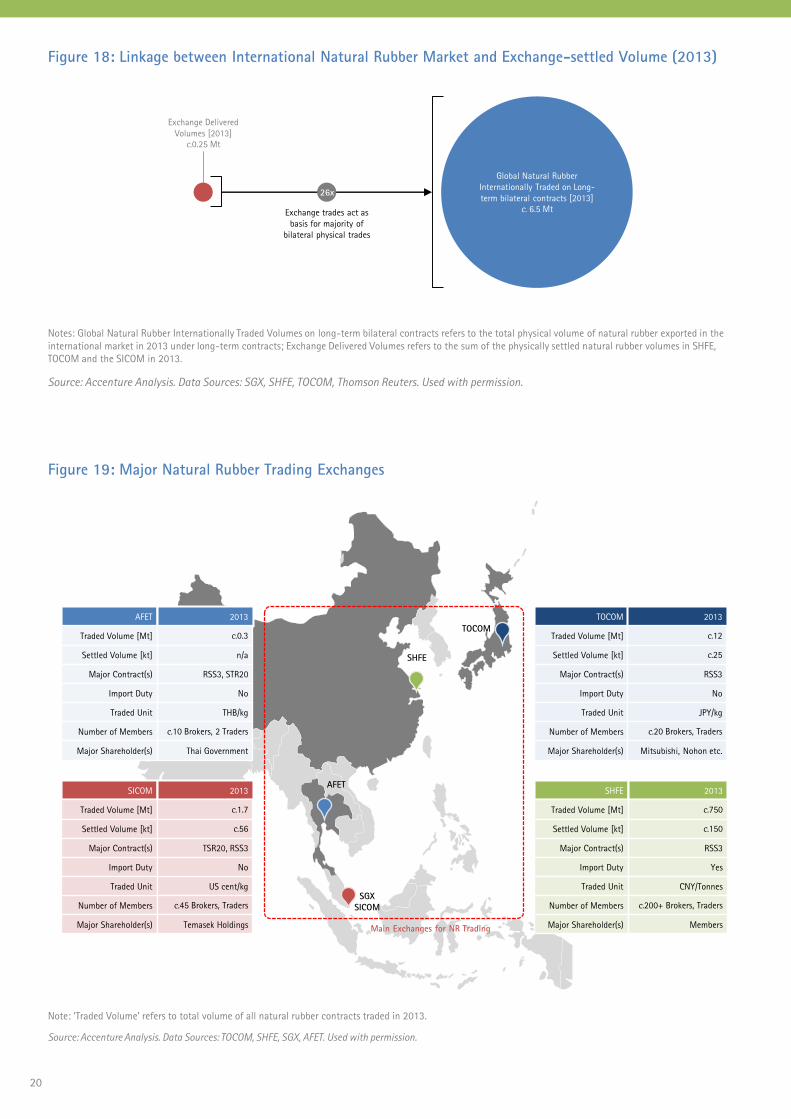
Exchange transactions form the basis of the
natural rubber price discovery process.
However, volumes physically settled and
delivered on exchanges have been low with
only c.0.25 Mt of physical settlements in
2013, while total natural rubber traded on
long-term bilateral contracts were at c.6.5
Mt27, effectively representing 26 times the
former [Figure 18].
Given their core contribution to pricing either
directly or indirectly through long-term
contracts indexation, we have further
investigated the mechanisms of the main
natural rubber exchanges including the
Singapore Commodity Exchange (SICOM)
which is now owned by the Singapore
Exchange (SGX), the Tokyo Commodity
Exchange (TOCOM), the Shanghai Futures
Exchange (SHFE), and the Agriculture Futures
Exchange of Thailand (AFET) [Figure 19].
Whilst traded contracts on TOCOM and SHFE
are limited to the RSS3 grade, SICOM
contracts can be for both RSS3 and TSR20
grades. The TSR20 grade has gradually become
the most heavily traded contract on the
SICOM over the last five years, and is absent
from major competing exchanges [Figure 21].
Bilateral Markets Spot Market Exchange Market
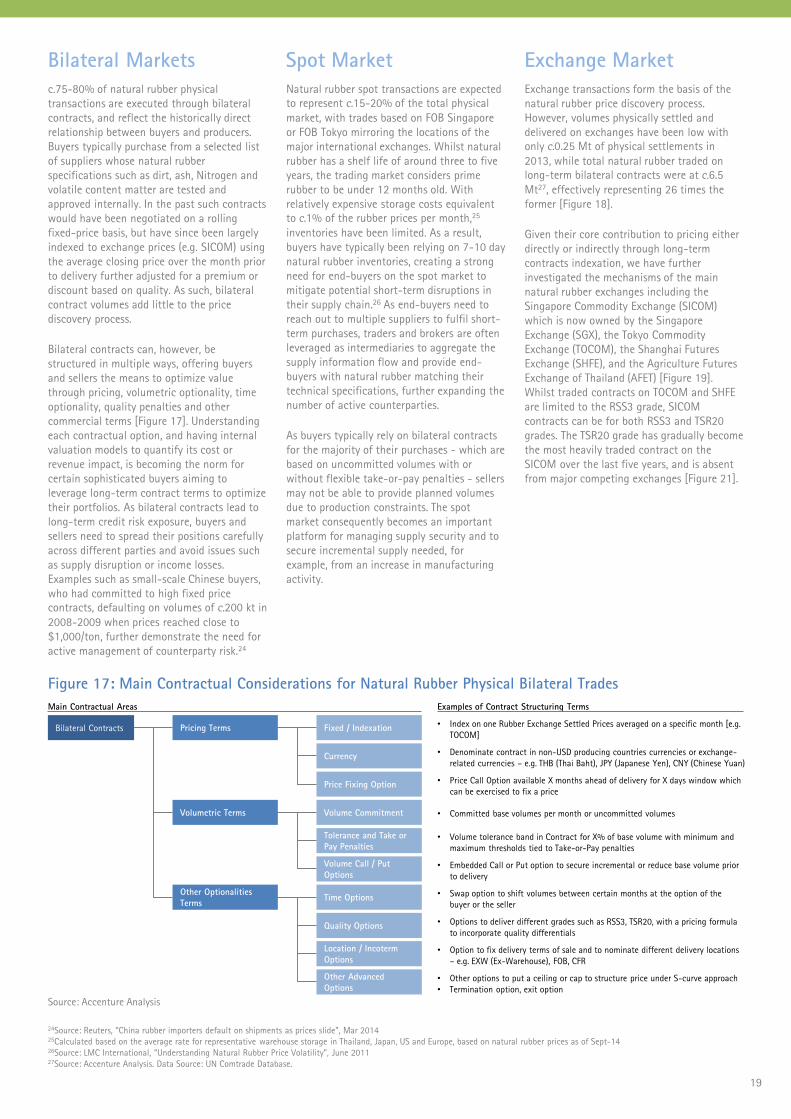
Figure 17: Main Contractual Considerations for Natural Rubber Physical Bilateral Trades
• Index on one Rubber Exchange Settled Prices averaged on a specific month [e.g.
TOCOM]
• Denominate contract in non-USD producing countries currencies or exchange-
related currencies – e.g. THB (Thai Baht), JPY (Japanese Yen), CNY (Chinese Yuan)
• Price Call Option available X months ahead of delivery for X days window which
can be exercised to fix a price
• Committed base volumes per month or uncommitted volumes
• Volume tolerance band in Contract for X% of base volume with minimum and
maximum thresholds tied to Take-or-Pay penalties
• Embedded Call or Put option to secure incremental or reduce base volume prior
to delivery
• Swap option to shift volumes between certain months at the option of the
buyer or the seller
• Options to deliver different grades such as RSS3, TSR20, with a pricing formula
to incorporate quality differentials
• Other options to put a ceiling or cap to structure price under S-curve approach
• Termination option, exit option
Examples of Contract Structuring Terms
• Option to fix delivery terms of sale and to nominate different delivery locations
– e.g. EXW (Ex-Warehouse), FOB, CFR
Bilateral Contracts Pricing Terms
Volumetric Terms
Fixed / Indexation
Currency
Price Fixing Option
Volume Commitment
Tolerance and Take or
Pay Penalties
Volume Call / Put
Options
Other Optionalities
TermsTime Options
Quality Options
Other Advanced
Options
Location / Incoterm
Options
Main Contractual Areas
Source: Accenture Analysis
24Source: Reuters, “China rubber importers default on shipments as prices slide”, Mar 201425Calculated based on the average rate for representative warehouse storage in Thailand, Japan, US and Europe, based on natural rubber prices as of Sept-1426Source: LMC International, “Understanding Natural Rubber Price Volatility”, June 201127Source: Accenture Analysis. Data Source: UN Comtrade Database.
20
Notes: Global Natural Rubber Internationally Traded Volumes on long-term bilateral contracts refers to the total physical volume of natural rubber exported in the
international market in 2013 under long-term contracts; Exchange Delivered Volumes refers to the sum of the physically settled natural rubber volumes in SHFE,
TOCOM and the SICOM in 2013.
Figure 18: Linkage between International Natural Rubber Market and Exchange-settled Volume (2013)
Source: Accenture Analysis. Data Sources: SGX, SHFE, TOCOM, Thomson Reuters. Used with permission.
Figure 19: Major Natural Rubber Trading Exchanges
Note: ‘Traded Volume’ refers to total volume of all natural rubber contracts traded in 2013.
Source: Accenture Analysis. Data Sources: TOCOM, SHFE, SGX, AFET. Used with permission.
TOCOM
SHFE
AFET
SGX
SICOM
Main Exchanges for NR Trading
SHFE
Traded Volume [Mt]
Settled Volume [kt]
Major Contract(s)
Import Duty
Traded Unit
Number of Members
Major Shareholder(s)
2013
c.750
c.150
RSS3
Yes
CNY/Tonnes
c.200+ Brokers, Traders
Members
TOCOM
Traded Volume [Mt]
Settled Volume [kt]
Major Contract(s)
Import Duty
Traded Unit
Number of Members
Major Shareholder(s)
2013
c.12
c.25
RSS3
No
JPY/kg
c.20 Brokers, Traders
Mitsubishi, Nohon etc.
AFET
Traded Volume [Mt]
Settled Volume [kt]
Major Contract(s)
Import Duty
Traded Unit
Number of Members
Major Shareholder(s)
2013
c.0.3
n/a
RSS3, STR20
No
THB/kg
c.10 Brokers, 2 Traders
Thai Government
Number of Members
Major Shareholder(s)
SICOM
Traded Volume [Mt]
Settled Volume [kt]
Major Contract(s)
Import Duty
Traded Unit US cent/kg
c.45 Brokers, Traders
Temasek Holdings
2013
c.1.7
c.56
TSR20, RSS3
No
Global Natural Rubber
Internationally Traded on Long-
term bilateral contracts [2013]
c. 6.5 Mt
Exchange Delivered
Volumes [2013]
c.0.25 Mt
Exchange trades act as
basis for majority of
bilateral physical trades
26x
20
21
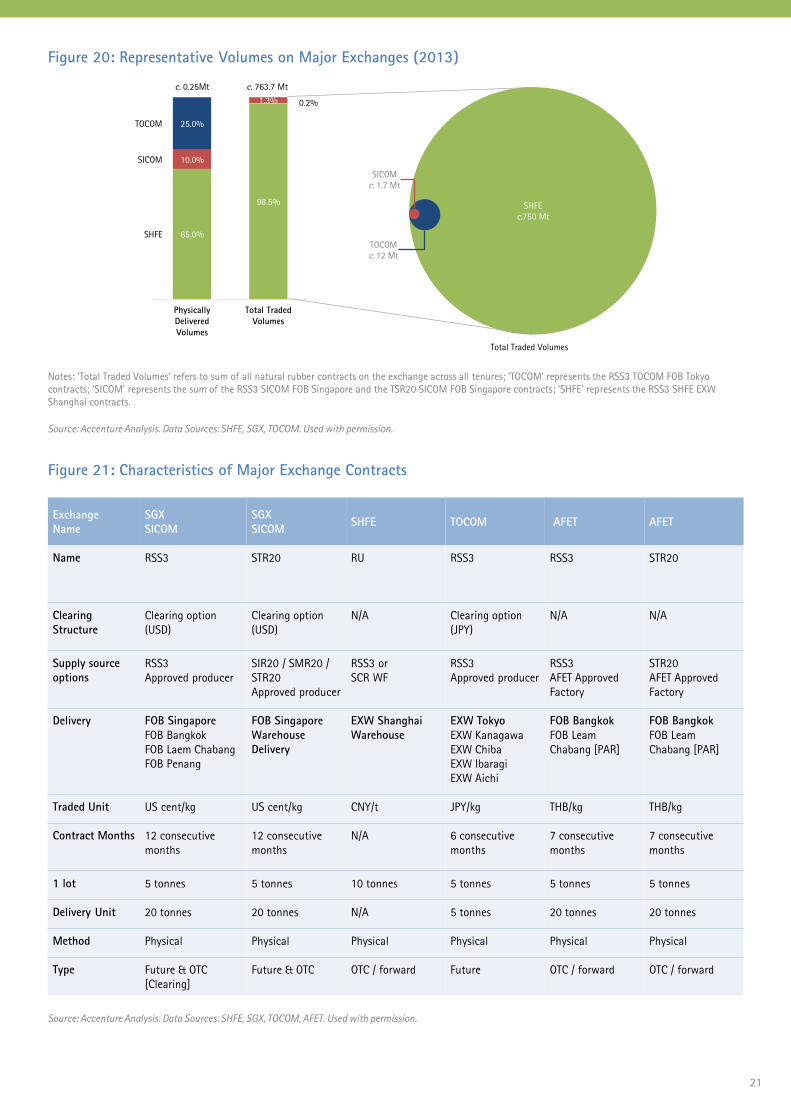
Figure 20: Representative Volumes on Major Exchanges (2013)
Notes: ‘Total Traded Volumes’ refers to sum of all natural rubber contracts on the exchange across all tenures; ‘TOCOM’ represents the RSS3 TOCOM FOB Tokyo
contracts; ‘SICOM’ represents the sum of the RSS3 SICOM FOB Singapore and the TSR20 SICOM FOB Singapore contracts; ‘SHFE’ represents the RSS3 SHFE EXW
Shanghai contracts.
Source: Accenture Analysis. Data Sources: SHFE, SGX, TOCOM. Used with permission.
Figure 21: Characteristics of Major Exchange Contracts
Exchange
Name
SGX
SICOM
SGX
SICOMSHFE TOCOM AFET AFET
Name RSS3 STR20 RU RSS3 RSS3 STR20
Clearing
Structure
Clearing option
(USD)
Clearing option
(USD)
N/A Clearing option
(JPY)
N/A N/A
Supply source
options
RSS3
Approved producer
SIR20 / SMR20 /
STR20
Approved producer
RSS3 or
SCR WF
RSS3
Approved producer
RSS3
AFET Approved
Factory
STR20
AFET Approved
Factory
Delivery FOB Singapore
FOB Bangkok
FOB Laem Chabang
FOB Penang
FOB Singapore
Warehouse
Delivery
EXW Shanghai
Warehouse
EXW Tokyo
EXW Kanagawa
EXW Chiba
EXW Ibaragi
EXW Aichi
FOB Bangkok
FOB Leam
Chabang [PAR]
FOB Bangkok
FOB Leam
Chabang [PAR]
Traded Unit US cent/kg US cent/kg CNY/t JPY/kg THB/kg THB/kg
Contract Months 12 consecutive
months
12 consecutive
months
N/A 6 consecutive
months
7 consecutive
months
7 consecutive
months
1 lot 5 tonnes 5 tonnes 10 tonnes 5 tonnes 5 tonnes 5 tonnes
Delivery Unit 20 tonnes 20 tonnes N/A 5 tonnes 20 tonnes 20 tonnes
Method Physical Physical Physical Physical Physical Physical
Type Future & OTC
[Clearing]
Future & OTC OTC / forward Future OTC / forward OTC / forward
Source: Accenture Analysis. Data Sources: SHFE, SGX, TOCOM, AFET. Used with permission.
SHFE
c.750 Mt
SICOM
c. 1.7 Mt
TOCOM
c. 12 Mt
Total Traded Volumes
65.0%
98.5%
c. 0.25Mt
10.0%
25.0%TOCOM
SICOM
SHFE
c. 763.7 Mt
Physically
Delivered
Volumes
Total Traded
Volumes
1.3% 0.2%
22
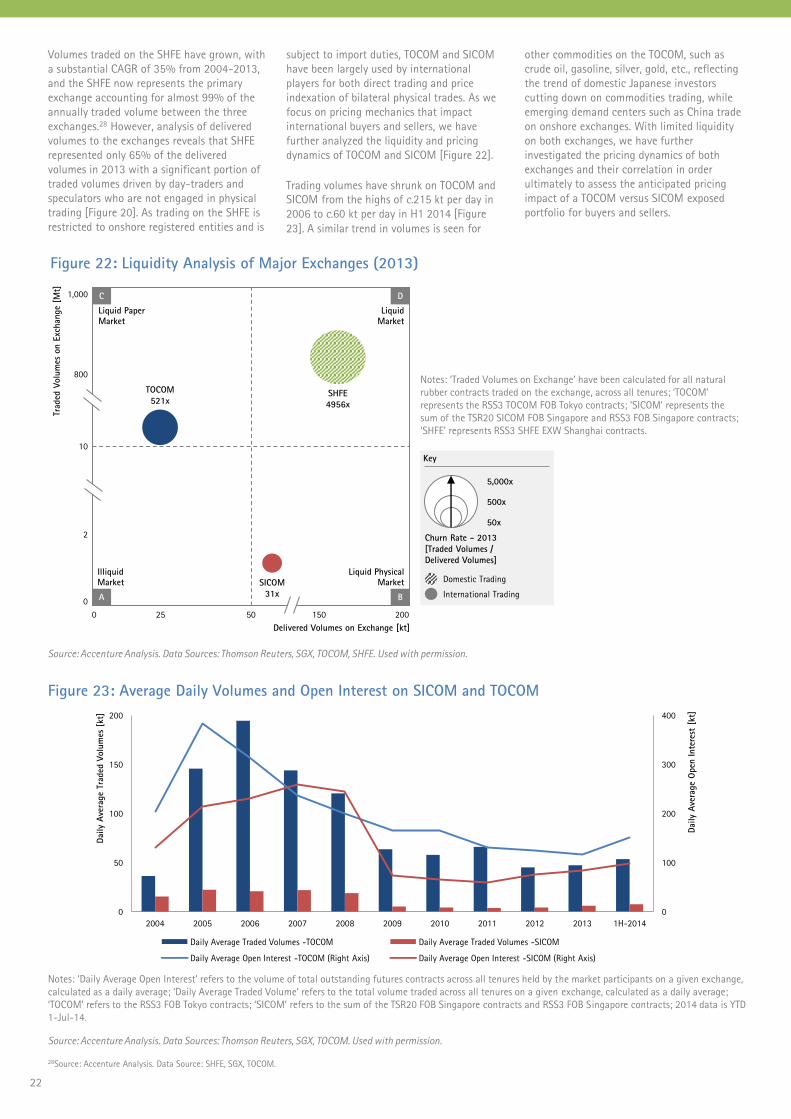
Volumes traded on the SHFE have grown, with
a substantial CAGR of 35% from 2004-2013,
and the SHFE now represents the primary
exchange accounting for almost 99% of the
annually traded volume between the three
exchanges.28 However, analysis of delivered
volumes to the exchanges reveals that SHFE
represented only 65% of the delivered
volumes in 2013 with a significant portion of
traded volumes driven by day-traders and
speculators who are not engaged in physical
trading [Figure 20]. As trading on the SHFE is
restricted to onshore registered entities and is
subject to import duties, TOCOM and SICOM
have been largely used by international
players for both direct trading and price
indexation of bilateral physical trades. As we
focus on pricing mechanics that impact
international buyers and sellers, we have
further analyzed the liquidity and pricing
dynamics of TOCOM and SICOM [Figure 22].
Trading volumes have shrunk on TOCOM and
SICOM from the highs of c.215 kt per day in
2006 to c.60 kt per day in H1 2014 [Figure
23]. A similar trend in volumes is seen for
other commodities on the TOCOM, such as
crude oil, gasoline, silver, gold, etc., reflecting
the trend of domestic Japanese investors
cutting down on commodities trading, while
emerging demand centers such as China trade
on onshore exchanges. With limited liquidity
on both exchanges, we have further
investigated the pricing dynamics of both
exchanges and their correlation in order
ultimately to assess the anticipated pricing
impact of a TOCOM versus SICOM exposed
portfolio for buyers and sellers.
Figure 22: Liquidity Analysis of Major Exchanges (2013)
Notes: ‘Traded Volumes on Exchange’ have been calculated for all natural
rubber contracts traded on the exchange, across all tenures; ‘TOCOM’
represents the RSS3 TOCOM FOB Tokyo contracts; ‘SICOM’ represents the
sum of the TSR20 SICOM FOB Singapore and RSS3 FOB Singapore contracts;
‘SHFE’ represents RSS3 SHFE EXW Shanghai contracts.
Source: Accenture Analysis. Data Sources: Thomson Reuters, SGX, TOCOM, SHFE. Used with permission.
Figure 23: Average Daily Volumes and Open Interest on SICOM and TOCOM
Notes: ‘Daily Average Open Interest’ refers to the volume of total outstanding futures contracts across all tenures held by the market participants on a given exchange,
calculated as a daily average; ‘Daily Average Traded Volume’ refers to the total volume traded across all tenures on a given exchange, calculated as a daily average;
‘TOCOM’ refers to the RSS3 FOB Tokyo contracts; ‘SICOM’ refers to the sum of the TSR20 FOB Singapore contracts and RSS3 FOB Singapore contracts; 2014 data is YTD
1-Jul-14.
Source: Accenture Analysis. Data Sources: Thomson Reuters, SGX, TOCOM. Used with permission.
200500
Delivered Volumes on Exchange [kt]
Traded
Volu
mes
on E
xch
ange
[Mt]
IlliquidMarket
A
2
SICOM
31x
SHFE
4956x
TOCOM
521x
800
10
1,000
Liquid PaperMarket
C
Liquid PhysicalMarket
B
LiquidMarket
D
15025
Key
Churn Rate - 2013
[Traded Volumes /
Delivered Volumes]
5,000x
50x
500x
Domestic Trading
International Trading
28Source: Accenture Analysis. Data Source: SHFE, SGX, TOCOM.
0
0
100
200
300
400
0
50
100
150
200
2004 2005 2006 2007 2008 2009 2010 2011 2012 2013 1H-2014
Daily
Ave
rage
Open
Inte
rest
[kt]
Daily
Ave
rage
Traded
Volu
mes
[kt]
Daily Average Traded Volumes -TOCOM Daily Average Traded Volumes -SICOM
Daily Average Open Interest -TOCOM (Right Axis) Daily Average Open Interest -SICOM (Right Axis)
22
23
24
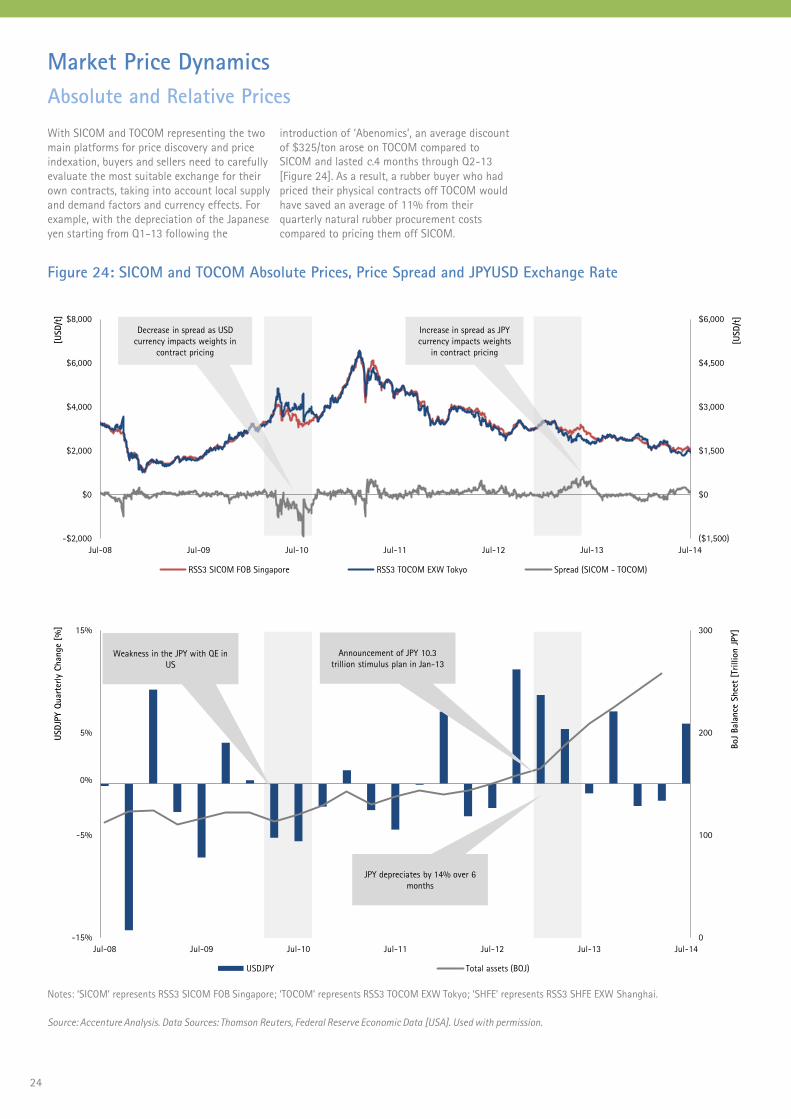
Market Price Dynamics
With SICOM and TOCOM representing the two
main platforms for price discovery and price
indexation, buyers and sellers need to carefully
evaluate the most suitable exchange for their
own contracts, taking into account local supply
and demand factors and currency effects. For
example, with the depreciation of the Japanese
yen starting from Q1-13 following the
introduction of ‘Abenomics’, an average discount
of $325/ton arose on TOCOM compared to
SICOM and lasted c.4 months through Q2-13
[Figure 24]. As a result, a rubber buyer who had
priced their physical contracts off TOCOM would
have saved an average of 11% from their
quarterly natural rubber procurement costs
compared to pricing them off SICOM.
Absolute and Relative Prices
Figure 24: SICOM and TOCOM Absolute Prices, Price Spread and JPYUSD Exchange Rate
($1,500)
$0
$1,500
$3,000
$4,500
$6,000
-$2,000
$0
$2,000
$4,000
$6,000
$8,000
Jul-08 Jul-09 Jul-10 Jul-11 Jul-12 Jul-13 Jul-14
[USD/t
]
[USD/t
]
RSS3 SICOM FOB Singapore RSS3 TOCOM EXW Tokyo Spread (SICOM - TOCOM)
Decrease in spread as USD
currency impacts weights in
contract pricing
Increase in spread as JPY
currency impacts weights
in contract pricing
0
100
200
300
-15%
-5%
5%
15%
Jul-08 Jul-09 Jul-10 Jul-11 Jul-12 Jul-13 Jul-14
BoJ
Bala
nce
Shee
t [T
rillio
n J
PY]
USDJP
Y Q
uart
erly
Change
[%]
USDJPY Total assets (BOJ)
Weakness in the JPY with QE in
US
Announcement of JPY 10.3
trillion stimulus plan in Jan-13
JPY depreciates by 14% over 6
months
Notes: ‘SICOM’ represents RSS3 SICOM FOB Singapore; ‘TOCOM’ represents RSS3 TOCOM EXW Tokyo; ‘SHFE’ represents RSS3 SHFE EXW Shanghai.
Source: Accenture Analysis. Data Sources: Thomson Reuters, Federal Reserve Economic Data [USA]. Used with permission.
0%
24
25
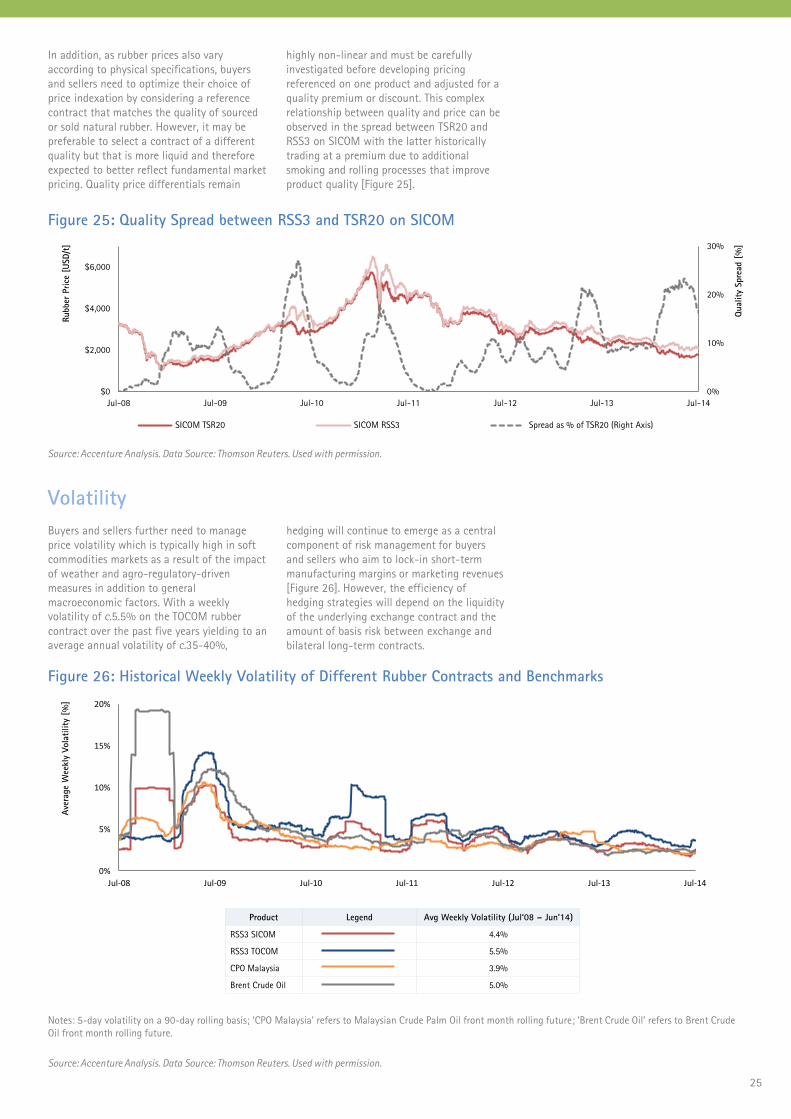
In addition, as rubber prices also vary
according to physical specifications, buyers
and sellers need to optimize their choice of
price indexation by considering a reference
contract that matches the quality of sourced
or sold natural rubber. However, it may be
preferable to select a contract of a different
quality but that is more liquid and therefore
expected to better reflect fundamental market
pricing. Quality price differentials remain
highly non-linear and must be carefully
investigated before developing pricing
referenced on one product and adjusted for a
quality premium or discount. This complex
relationship between quality and price can be
observed in the spread between TSR20 and
RSS3 on SICOM with the latter historically
trading at a premium due to additional
smoking and rolling processes that improve
product quality [Figure 25].
Figure 25: Quality Spread between RSS3 and TSR20 on SICOM
Source: Accenture Analysis. Data Source: Thomson Reuters. Used with permission.
Volatility
Figure 26: Historical Weekly Volatility of Different Rubber Contracts and Benchmarks
0%
5%
10%
15%
20%
Jul-08 Jul-09 Jul-10 Jul-11 Jul-12 Jul-13 Jul-14
Ave
rage
Wee
kly
Vola
tility
[%
]
Notes: 5-day volatility on a 90-day rolling basis; ‘CPO Malaysia’ refers to Malaysian Crude Palm Oil front month rolling future; ‘Brent Crude Oil’ refers to Brent Crude
Oil front month rolling future.
Product Legend Avg Weekly Volatility (Jul‘08 – Jun’14)
RSS3 SICOM 4.4%
RSS3 TOCOM 5.5%
CPO Malaysia 3.9%
Brent Crude Oil 5.0%
Source: Accenture Analysis. Data Source: Thomson Reuters. Used with permission.
Buyers and sellers further need to manage
price volatility which is typically high in soft
commodities markets as a result of the impact
of weather and agro-regulatory-driven
measures in addition to general
macroeconomic factors. With a weekly
volatility of c.5.5% on the TOCOM rubber
contract over the past five years yielding to an
average annual volatility of c.35-40%,
hedging will continue to emerge as a central
component of risk management for buyers
and sellers who aim to lock-in short-term
manufacturing margins or marketing revenues
[Figure 26]. However, the efficiency of
hedging strategies will depend on the liquidity
of the underlying exchange contract and the
amount of basis risk between exchange and
bilateral long-term contracts.
Quality
Spre
ad [
%]
0%
10%
20%
30%
$0
$2,000
$4,000
$6,000
Jul-08 Jul-09 Jul-10 Jul-11 Jul-12 Jul-13 Jul-14
Rubber
Price
[U
SD/t
]
SICOM TSR20 SICOM RSS3 Spread as % ofTSR20(Right Axis)Spread as % of TSR20 (Right Axis)
26
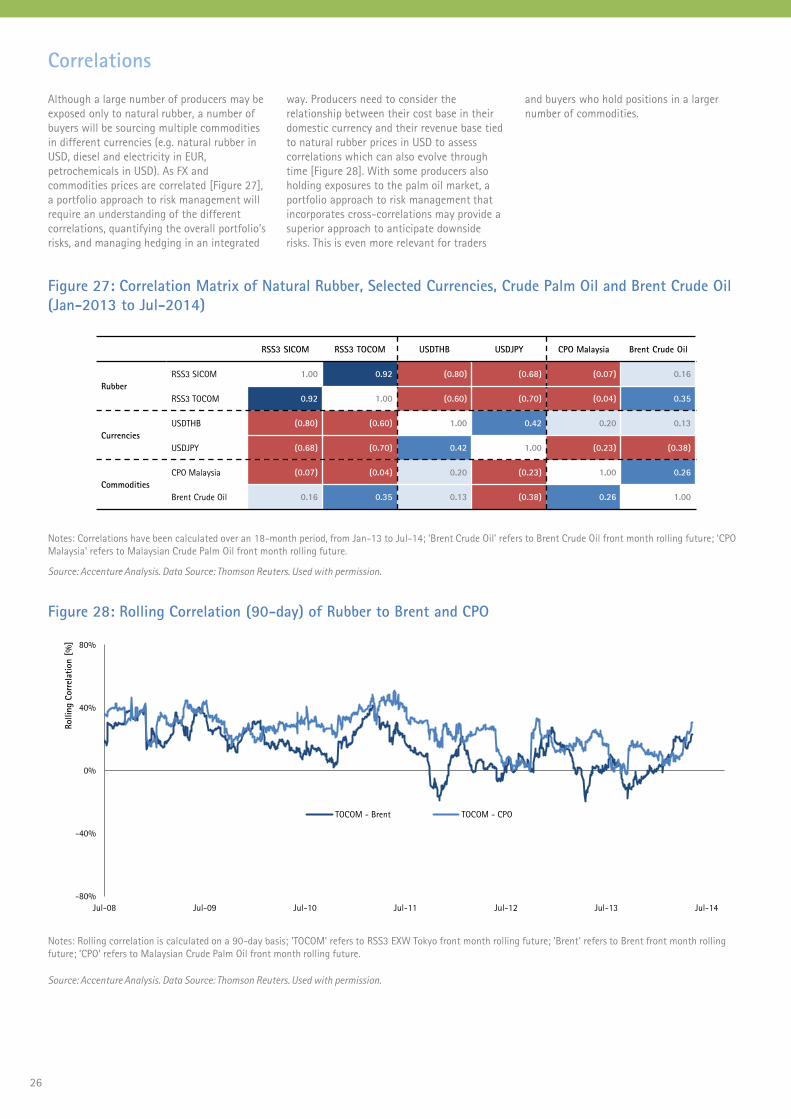
Although a large number of producers may be
exposed only to natural rubber, a number of
buyers will be sourcing multiple commodities
in different currencies (e.g. natural rubber in
USD, diesel and electricity in EUR,
petrochemicals in USD). As FX and
commodities prices are correlated [Figure 27],
a portfolio approach to risk management will
require an understanding of the different
correlations, quantifying the overall portfolio’s
risks, and managing hedging in an integrated
way. Producers need to consider the
relationship between their cost base in their
domestic currency and their revenue base tied
to natural rubber prices in USD to assess
correlations which can also evolve through
time [Figure 28]. With some producers also
holding exposures to the palm oil market, a
portfolio approach to risk management that
incorporates cross-correlations may provide a
superior approach to anticipate downside
risks. This is even more relevant for traders
and buyers who hold positions in a larger
number of commodities.
Correlations
Figure 27: Correlation Matrix of Natural Rubber, Selected Currencies, Crude Palm Oil and Brent Crude Oil
(Jan-2013 to Jul-2014)
RSS3 SICOM RSS3 TOCOM USDTHB USDJPY CPO Malaysia Brent Crude Oil
Rubber
RSS3 SICOM 1.00 0.92 (0.80) (0.68) (0.07) 0.16
RSS3 TOCOM 0.92 1.00 (0.60) (0.70) (0.04) 0.35
Currencies
USDTHB (0.80) (0.60) 1.00 0.42 0.20 0.13
USDJPY (0.68) (0.70) 0.42 1.00 (0.23) (0.38)
Commodities
CPO Malaysia (0.07) (0.04) 0.20 (0.23) 1.00 0.26
Brent Crude Oil 0.16 0.35 0.13 (0.38) 0.26 1.00
Notes: Correlations have been calculated over an 18-month period, from Jan-13 to Jul-14; ‘Brent Crude Oil’ refers to Brent Crude Oil front month rolling future; ‘CPO
Malaysia’ refers to Malaysian Crude Palm Oil front month rolling future.
Figure 28: Rolling Correlation (90-day) of Rubber to Brent and CPO
-80%
-40%
0%
40%
80%
Jul-08 Jul-09 Jul-10 Jul-11 Jul-12 Jul-13 Jul-14
TOCOM - Brent TOCOM - CPO
Notes: Rolling correlation is calculated on a 90-day basis; ‘TOCOM’ refers to RSS3 EXW Tokyo front month rolling future; ‘Brent’ refers to Brent front month rolling
future; ‘CPO’ refers to Malaysian Crude Palm Oil front month rolling future.
Source: Accenture Analysis. Data Source: Thomson Reuters. Used with permission.
Rollin
g C
orr
elati
on [
%]
Source: Accenture Analysis. Data Source: Thomson Reuters. Used with permission.
26
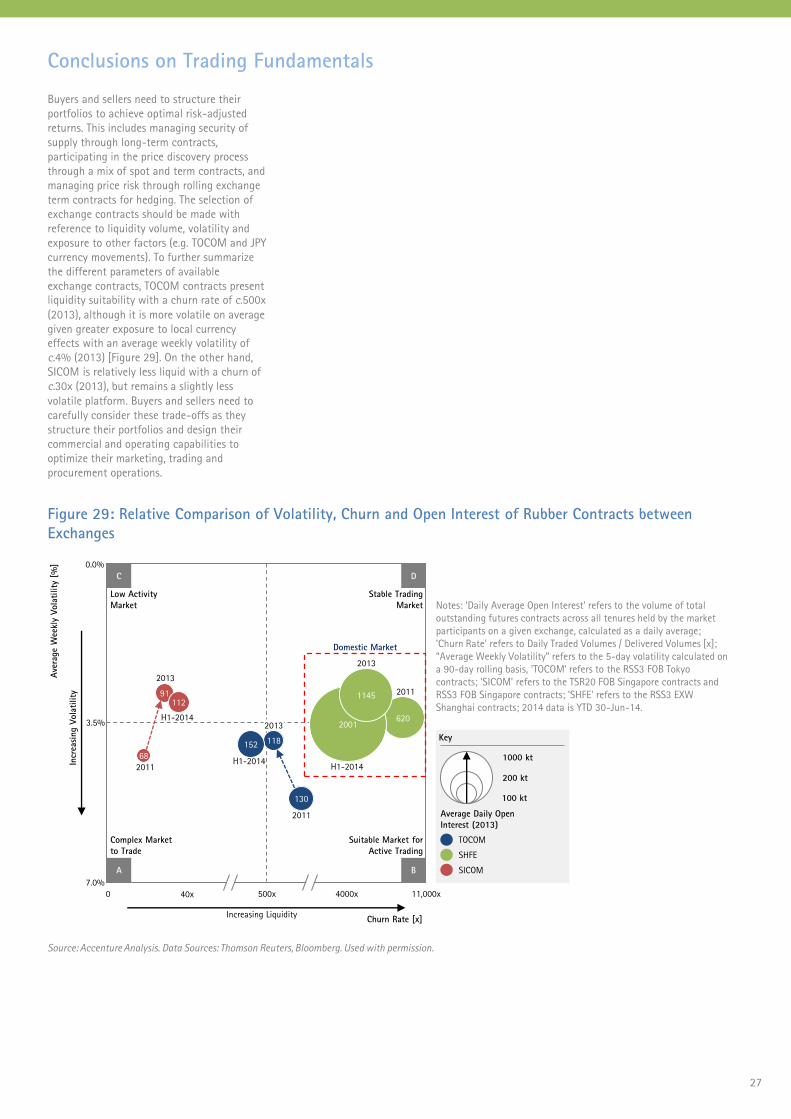
27
Conclusions on Trading Fundamentals
Buyers and sellers need to structure their
portfolios to achieve optimal risk-adjusted
returns. This includes managing security of
supply through long-term contracts,
participating in the price discovery process
through a mix of spot and term contracts, and
managing price risk through rolling exchange
term contracts for hedging. The selection of
exchange contracts should be made with
reference to liquidity volume, volatility and
exposure to other factors (e.g. TOCOM and JPY
currency movements). To further summarize
the different parameters of available
exchange contracts, TOCOM contracts present
liquidity suitability with a churn rate of c.500x
(2013), although it is more volatile on average
given greater exposure to local currency
effects with an average weekly volatility of
c.4% (2013) [Figure 29]. On the other hand,
SICOM is relatively less liquid with a churn of
c.30x (2013), but remains a slightly less
volatile platform. Buyers and sellers need to
carefully consider these trade-offs as they
structure their portfolios and design their
commercial and operating capabilities to
optimize their marketing, trading and
procurement operations.
Figure 29: Relative Comparison of Volatility, Churn and Open Interest of Rubber Contracts between
Exchanges
Notes: ’Daily Average Open Interest’ refers to the volume of total
outstanding futures contracts across all tenures held by the market
participants on a given exchange, calculated as a daily average;
'Churn Rate' refers to Daily Traded Volumes / Delivered Volumes [x];
“Average Weekly Volatility” refers to the 5-day volatility calculated on
a 90-day rolling basis, 'TOCOM‘ refers to the RSS3 FOB Tokyo
contracts; 'SICOM' refers to the TSR20 FOB Singapore contracts and
RSS3 FOB Singapore contracts; 'SHFE' refers to the RSS3 EXW
Shanghai contracts; 2014 data is YTD 30-Jun-14.
Source: Accenture Analysis. Data Sources: Thomson Reuters, Bloomberg. Used with permission.
Churn Rate [x] Increasing Liquidity
Ave
rage
Wee
kly
Vola
tility
[%
]
3.5%
0.0%
0
Low Activity
Market
Complex Market
to Trade
Suitable Market for
Active Trading
Stable Trading
Market
C D
A B
Incr
easi
ng V
ola
tility
130
118152
2011
2013
H1-201468
91
H1-2014
2011
6202001
H1-2014
2013
2011
Domestic Market
2013
7.0%
40x 500x 4000x
112
11,000x
1145
Key
Average Daily Open
Interest (2013)
1000 kt
100 kt
200 kt
SHFE
SICOM
TOCOM

28
Strategic Initiatives for Buyers and Sellers
Buyers and sellers of natural rubber can
improve earnings by enhancing the
sophistication of their procurement, trading,
marketing and hedging practices to best
leverage evolving market dynamics. Achieving
incremental earnings will depend on the
ability to develop a commercial strategy that
can optimize the portfolio structure and
implement operating capabilities that will
support the trading cycle’s processes with
efficiency and adequate risk management.
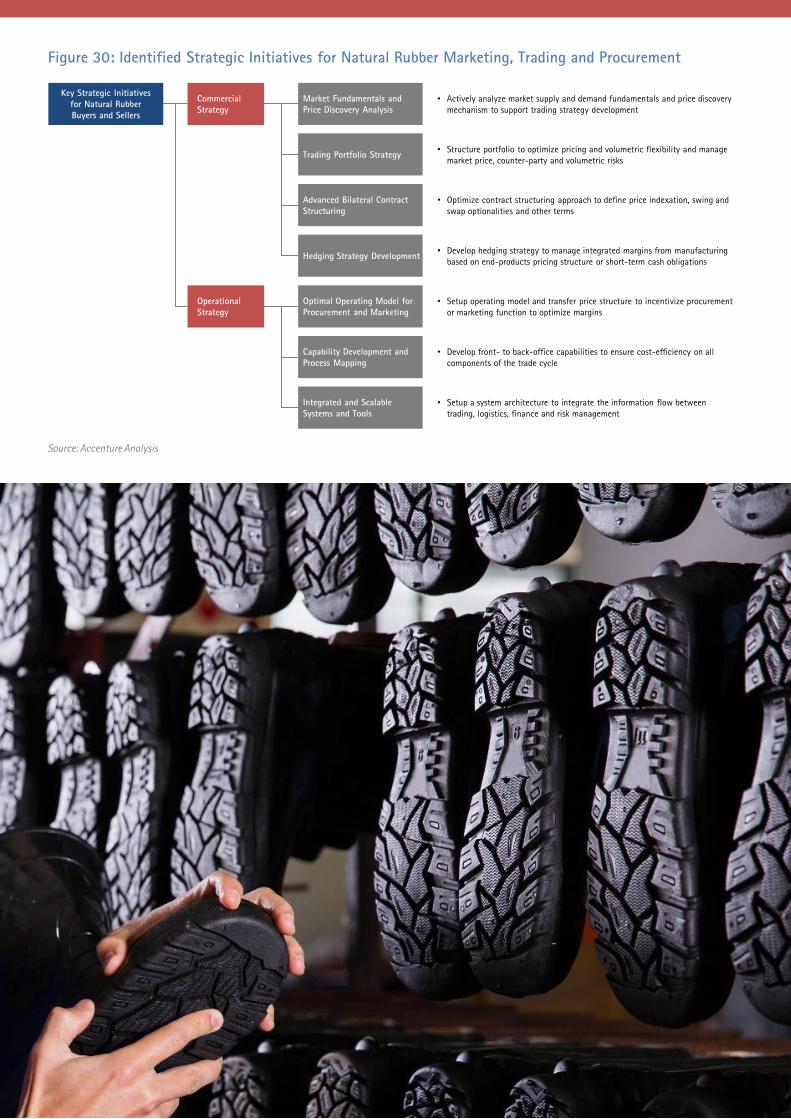
29
Key Strategic Initiatives
for Natural Rubber
Buyers and Sellers
Commercial
Strategy
Operational
Strategy
Trading Portfolio Strategy
Advanced Bilateral Contract
Structuring
Hedging Strategy Development
Optimal Operating Model for
Procurement and Marketing
Capability Development and
Process Mapping
Integrated and Scalable
Systems and Tools
Market Fundamentals and
Price Discovery Analysis
• Actively analyze market supply and demand fundamentals and price discovery
mechanism to support trading strategy development
• Structure portfolio to optimize pricing and volumetric flexibility and manage
market price, counter-party and volumetric risks
• Optimize contract structuring approach to define price indexation, swing and
swap optionalities and other terms
• Develop hedging strategy to manage integrated margins from manufacturing
based on end-products pricing structure or short-term cash obligations
• Setup operating model and transfer price structure to incentivize procurement
or marketing function to optimize margins
• Develop front- to back-office capabilities to ensure cost-efficiency on all
components of the trade cycle
• Setup a system architecture to integrate the information flow between
trading, logistics, finance and risk management
Source: Accenture Analysis
Figure 30: Identified Strategic Initiatives for Natural Rubber Marketing, Trading and Procurement
30
Commercial Strategy Development
Market Fundamentals
and Price Discovery
Whether buyers or sellers, developing an in-
depth understanding of market supply,
demand and pricing outlooks through
fundamental research and price discovery
process participation is core to the
development of a sophisticated trading
strategy. We actively work with our clients to
develop short-to long-term supply and
demand forecast models as well as more
specific trading models that underpin
optimized commercial strategies aimed at
capturing market arbitrage and anticipated
trading behavior. In one example, we were
engaged by a client to help evaluate the
robustness of their price discovery
participation on a regional natural rubber
exchange. One of the client’s primary goals
was to develop an understanding of the bid
and ask submission strategies of other major
participants on the exchange. In order to do
this, we monitored bid and ask quotes and
analyzed the nature of players on two
alternative regional exchanges. This led to the
finding that volume orders submitted on one
of the exchanges were aimed at lifting prices
in anticipation of cyclical orders placed by
buyers and traders. Further analysis helped us
identify that low levels of liquidity at certain
time periods on the exchange provided an
important advantage to sellers, who leveraged
their inventory quasi free-optionality to place
and retrieve ask quotes. Leveraging this
analysis, we worked with the client to shift
price-discovery participation to the alternative
exchange where higher liquidity reduced the
volatility of bid-ask quotes.
Trading Portfolio
Strategy
The trading portfolio needs to be optimized
between spot, bilateral and term contracts
depending on market dynamics, so that it
allows buyers and sellers to benefit from
periods of volatility while also ensuring
security of supply and sales respectively. We
worked with a consumer goods company to
review their natural rubber procurement
portfolio and to suggest alternative structures
that would enhance production gross margin.
Initial findings suggested a mismatch between
product sales volumes and raw material
procurement timing, with limited portfolio
flexibility leading to higher working capital to
manage inventory and further volatility in
monthly gross-margins. Following an analysis
of product manufacturing cycles and
optionalities in long-term bilateral contracts’
volumetric commitments, we proposed
alternative swing and swap options on
contracts to be renewed and a more
integrated procurement execution; these
recommendations ultimately yielded an
attributable c.7% increase in production gross
margin (manufactured product sales proceeds
net of COGS) on the previous year.
Contract Structuring
Once the target portfolio is defined, long-term
contracts need to be structured to create
value from pricing, tenure, volumetric
commitments and all other optionalities. We
worked with a global tire producer who was
historically exposed to SICOM prices through
price indexation formulae and wanted to
assess alternative pricing structures. Based on
back-testing pricing models and forward-
looking scenarios, we recommended a partial
switch to TOCOM price indexation for
contracts pending renewal, in anticipation of
monetary easing in Japan based on historical
SICOM – TOCOM price spreads. We further
recommended a ‘Long SICOM Short TOCOM’
synthetic hedge to partly transfer the price
exposure of existing contracts. As a result, the
client benefited from widening spreads and
saved c.$150-200/ton for their natural rubber
over Q2-2013.
Hedging Strategy
Hedging should be leveraged as an effective
means to protect manufacturing margins for
buyers and short-term margins for producers.
Hedging strategies need to be carefully
developed in order to minimize basis risk
between physical contractual positions which
are price indexed and exchange contracts. As
an example of an effective hedging strategy
rollout, we worked with a medical products
manufacturing company that wanted to
enhance gross margin predictability.
Reviewing its pricing structure identified that
yearly fixed prices were applied to
manufactured products while natural rubber
was 80% sourced spot or on indexed
contracts. We helped the company manage
feedstock prices through an active monthly
rolling hedging strategy that was split across
two exchanges to manage basis risk. The
following year, the company achieved a c.8%
increase in EBITDA (earnings before interest,
taxes, depreciation, and amortization) through
a more stable COGS (cost of goods sold)-to-
products price ratio.
30
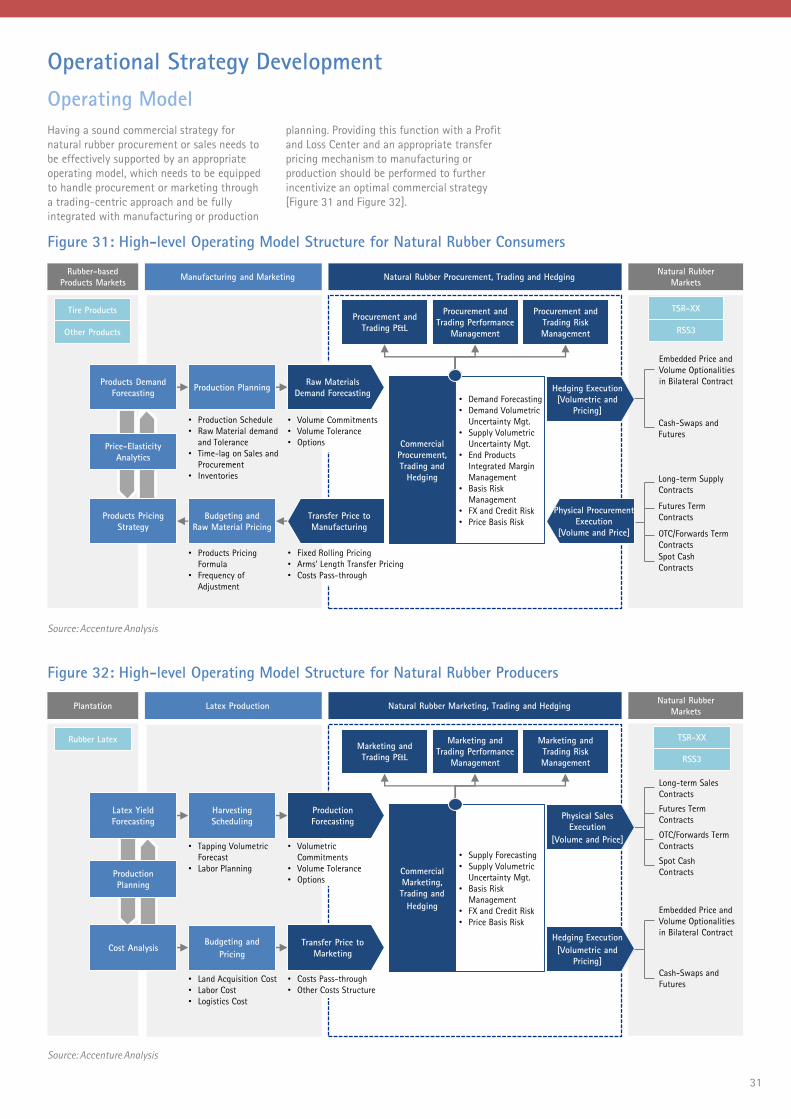
31
Operational Strategy Development
Having a sound commercial strategy for
natural rubber procurement or sales needs to
be effectively supported by an appropriate
operating model, which needs to be equipped
to handle procurement or marketing through
a trading-centric approach and be fully
integrated with manufacturing or production
planning. Providing this function with a Profit
and Loss Center and an appropriate transfer
pricing mechanism to manufacturing or
production should be performed to further
incentivize an optimal commercial strategy
[Figure 31 and Figure 32].
Figure 32: High-level Operating Model Structure for Natural Rubber Producers
Figure 31: High-level Operating Model Structure for Natural Rubber Consumers
Source: Accenture Analysis
Natural Rubber
MarketsNatural Rubber Procurement, Trading and Hedging
Rubber-based
Products Markets
Production Planning
Price-Elasticity
Analytics
Products Demand
Forecasting
RSS3
TSR-XX
• Production Schedule
• Raw Material demand
and Tolerance
• Time-lag on Sales and
Procurement
• Inventories
Budgeting and
Raw Material Pricing
Manufacturing and Marketing
• Products Pricing
Formula
• Frequency of
Adjustment
Commercial
Procurement,
Trading and
Hedging
Products Pricing
StrategyOTC/Forwards Term
Contracts
Futures Term
Contracts
Long-term Supply
Contracts
Spot Cash
Contracts
Physical Procurement
Execution
[Volume and Price]
Embedded Price and
Volume Optionalities
in Bilateral Contract
Cash-Swaps and
Futures
Hedging Execution
[Volumetric and
Pricing]
Tire Products Procurement and
Trading Risk
Management
Procurement and
Trading Performance
Management
Procurement and
Trading P&L
Raw Materials
Demand Forecasting
Transfer Price to
Manufacturing
• Volume Commitments
• Volume Tolerance
• Options
• Fixed Rolling Pricing
• Arms’ Length Transfer Pricing
• Costs Pass-through
• Demand Forecasting
• Demand Volumetric
Uncertainty Mgt.
• Supply Volumetric
Uncertainty Mgt.
• End Products
Integrated Margin
Management
• Basis Risk
Management
• FX and Credit Risk
• Price Basis Risk
Source: Accenture Analysis
Natural Rubber
MarketsPlantation
RSS3
OTC/Forwards Term
Contracts
Futures Term
Contracts
Long-term Sales
Contracts
Spot Cash
Contracts
TSR-XX
Embedded Price and
Volume Optionalities
in Bilateral Contract
Cash-Swaps and
Futures
Rubber Latex
Natural Rubber Marketing, Trading and HedgingLatex Production
• Supply Forecasting
• Supply Volumetric
Uncertainty Mgt.
• Basis Risk
Management
• FX and Credit Risk
• Price Basis Risk
Commercial
Marketing,
Trading and
Hedging
Marketing and
Trading Risk
Management
Marketing and
Trading Performance
Management
Marketing and
Trading P&L
Physical Sales
Execution
[Volume and Price]
Hedging Execution
[Volumetric and
Pricing]
Harvesting
Scheduling
Budgeting and
Pricing
• Land Acquisition Cost
• Labor Cost
• Logistics Cost
Production
Planning
Latex Yield
Forecasting
Cost Analysis
• Tapping Volumetric
Forecast
• Labor Planning
• Volumetric
Commitments
• Volume Tolerance
• Options
Transfer Price to
Marketing
Production
Forecasting
• Costs Pass-through
• Other Costs Structure
Operating Model
Other Products
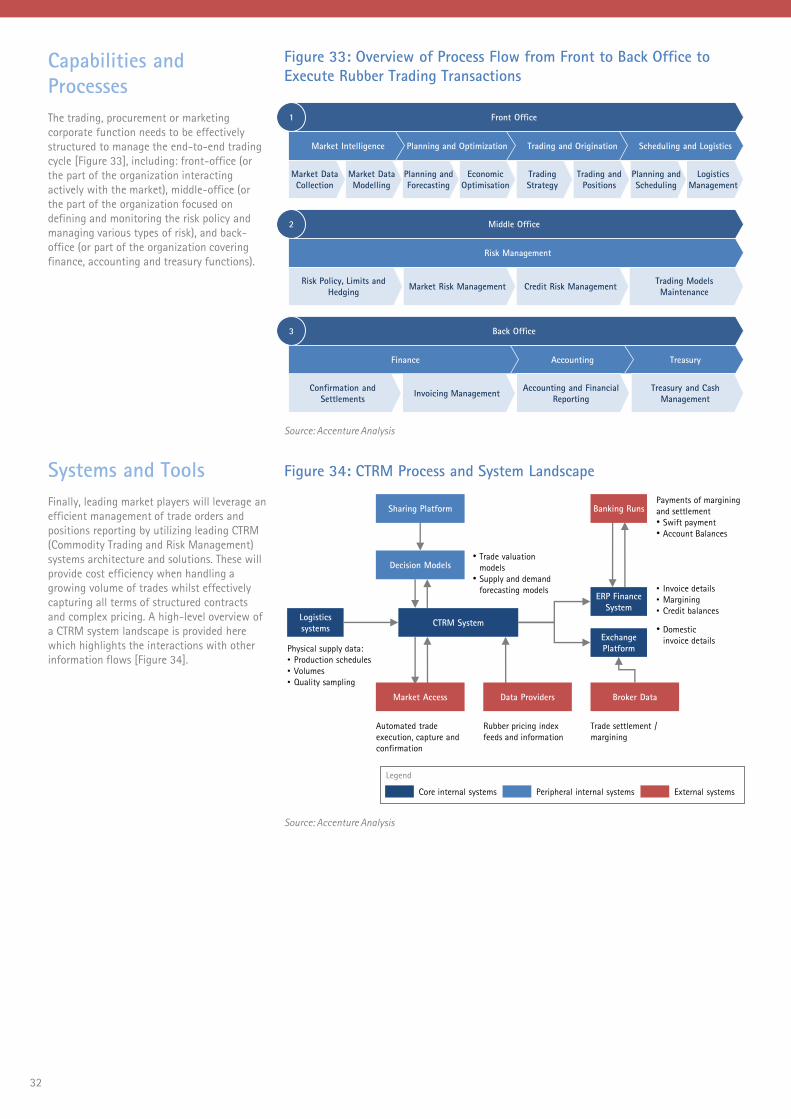
32
Capabilities and
Processes
The trading, procurement or marketing
corporate function needs to be effectively
structured to manage the end-to-end trading
cycle [Figure 33], including: front-office (or
the part of the organization interacting
actively with the market), middle-office (or
the part of the organization focused on
defining and monitoring the risk policy and
managing various types of risk), and back-
office (or part of the organization covering
finance, accounting and treasury functions).
Systems and Tools
Finally, leading market players will leverage an
efficient management of trade orders and
positions reporting by utilizing leading CTRM
(Commodity Trading and Risk Management)
systems architecture and solutions. These will
provide cost efficiency when handling a
growing volume of trades whilst effectively
capturing all terms of structured contracts
and complex pricing. A high-level overview of
a CTRM system landscape is provided here
which highlights the interactions with other
information flows [Figure 34].
Figure 33: Overview of Process Flow from Front to Back Office to
Execute Rubber Trading Transactions
Figure 34: CTRM Process and System Landscape
Legend
External systemsPeripheral internal systemsCore internal systems
Source: Accenture Analysis
Market Data
Collection
Front Office
Planning and Optimization Trading and Origination Scheduling and Logistics
Market Data
Modelling
Planning and
Forecasting
Economic
Optimisation
Trading
Strategy
Trading and
Positions
Planning and
Scheduling
Logistics
Management
Market Intelligence
1
Risk Policy, Limits and
HedgingMarket Risk Management Credit Risk Management
Trading Models
Maintenance
Middle Office2
Risk Management
TreasuryAccounting
Confirmation and
SettlementsInvoicing Management
Accounting and Financial
Reporting
Treasury and Cash
Management
Back Office3
Finance
Trade settlement /
margining
CTRM System
Automated trade
execution, capture and
confirmation
Rubber pricing index
feeds and information
Logistics
systems
Physical supply data:
• Production schedules
• Volumes
• Quality sampling
ERP Finance
System
• Invoice details
• Margining
• Credit balances
Banking RunsPayments of margining
and settlement
• Swift payment
• Account Balances
Decision Models
Exchange
Platform
• Domestic
invoice details
Sharing Platform
Market Access Data Providers Broker Data
• Trade valuation
models
• Supply and demand
forecasting models
Source: Accenture Analysis
32

33
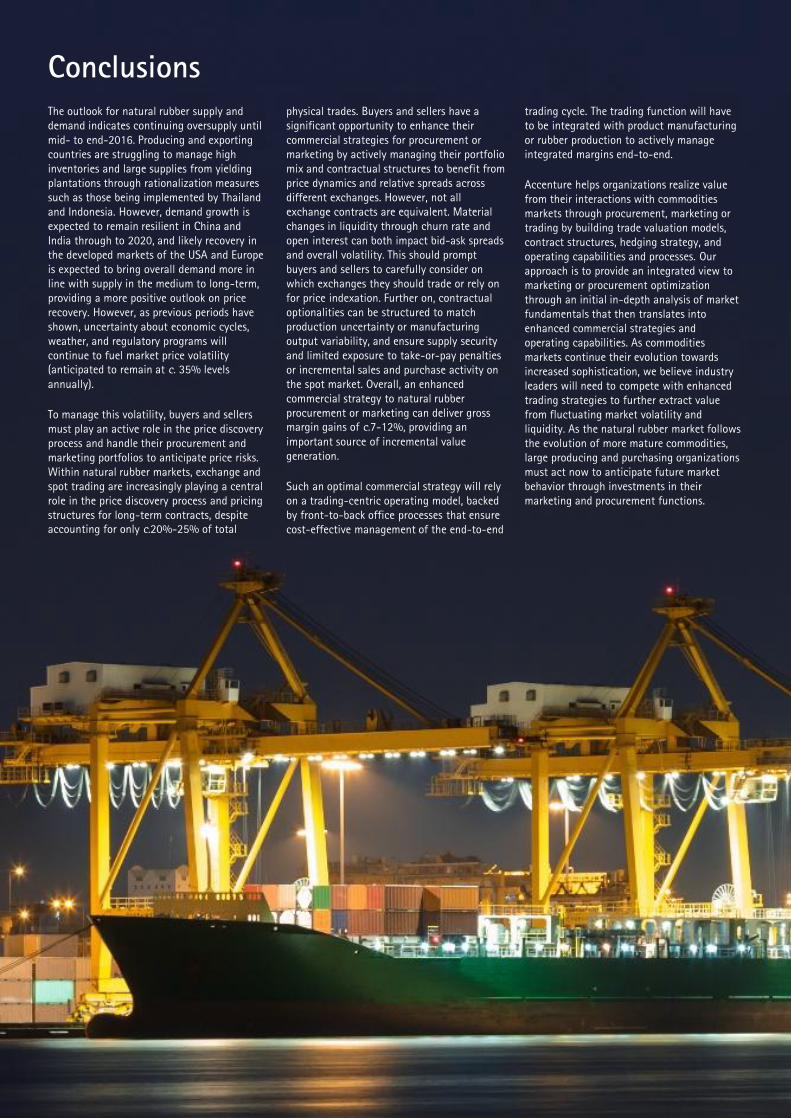
34
Conclusions
The outlook for natural rubber supply and
demand indicates continuing oversupply until
mid- to end-2016. Producing and exporting
countries are struggling to manage high
inventories and large supplies from yielding
plantations through rationalization measures
such as those being implemented by Thailand
and Indonesia. However, demand growth is
expected to remain resilient in China and
India through to 2020, and likely recovery in
the developed markets of the USA and Europe
is expected to bring overall demand more in
line with supply in the medium to long-term,
providing a more positive outlook on price
recovery. However, as previous periods have
shown, uncertainty about economic cycles,
weather, and regulatory programs will
continue to fuel market price volatility
(anticipated to remain at c. 35% levels
annually).
To manage this volatility, buyers and sellers
must play an active role in the price discovery
process and handle their procurement and
marketing portfolios to anticipate price risks.
Within natural rubber markets, exchange and
spot trading are increasingly playing a central
role in the price discovery process and pricing
structures for long-term contracts, despite
accounting for only c.20%-25% of total
physical trades. Buyers and sellers have a
significant opportunity to enhance their
commercial strategies for procurement or
marketing by actively managing their portfolio
mix and contractual structures to benefit from
price dynamics and relative spreads across
different exchanges. However, not all
exchange contracts are equivalent. Material
changes in liquidity through churn rate and
open interest can both impact bid-ask spreads
and overall volatility. This should prompt
buyers and sellers to carefully consider on
which exchanges they should trade or rely on
for price indexation. Further on, contractual
optionalities can be structured to match
production uncertainty or manufacturing
output variability, and ensure supply security
and limited exposure to take-or-pay penalties
or incremental sales and purchase activity on
the spot market. Overall, an enhanced
commercial strategy to natural rubber
procurement or marketing can deliver gross
margin gains of c.7-12%, providing an
important source of incremental value
generation.
Such an optimal commercial strategy will rely
on a trading-centric operating model, backed
by front-to-back office processes that ensure
cost-effective management of the end-to-end
trading cycle. The trading function will have
to be integrated with product manufacturing
or rubber production to actively manage
integrated margins end-to-end.
Accenture helps organizations realize value
from their interactions with commodities
markets through procurement, marketing or
trading by building trade valuation models,
contract structures, hedging strategy, and
operating capabilities and processes. Our
approach is to provide an integrated view to
marketing or procurement optimization
through an initial in-depth analysis of market
fundamentals that then translates into
enhanced commercial strategies and
operating capabilities. As commodities
markets continue their evolution towards
increased sophistication, we believe industry
leaders will need to compete with enhanced
trading strategies to further extract value
from fluctuating market volatility and
liquidity. As the natural rubber market follows
the evolution of more mature commodities,
large producing and purchasing organizations
must act now to anticipate future market
behavior through investments in their
marketing and procurement functions.
35
Contact Us
Ogan Kose
Ogan Kose is the Global Managing Director of
Accenture Trading, Investment & Optimization
Strategy which is part of Accenture Strategy
Group. Overall, he has more than 15 years of
experience helping commodity players with
their earnings and risk management. His
primary focus areas are commodity trading,
risk management, investment evaluation and
financial analysis, pricing, and commodity
contract structuring. At Accenture, Ogan has
worked with Global soft commodities traders
to set up international trading operation
starting from designing market entry strategy,
operating model, business sizing, risk policy,
risk capital and financing requirement for
front, mid, and back office operation. He holds
Bachelor of Science and Master of Science
degrees in chemical engineering (Imperial
College, London) and a Master of Business
Administration from Georgetown University.
He is a member of the Global Association of
Risk Professionals and is a financial risk
manager. He is based in London.
Xavier Veillard
Xavier Veillard is the Asia Pacific Director of
Accenture Trading, Investment and
Optimization Strategy which is part of
Accenture Strategy Group. Xavier’s primary
focus is corporate strategy and restructuring,
financial valuation and commodities trading.
Within the soft-commodities sector, Xavier
has worked with organizations in North
America, Europe, Africa and South East Asia,
supporting the development of advanced
trading and risk management models in
markets such as edible oils, ethanol, grains
and natural rubber. In addition, Xavier has
worked with leading consumer goods
companies in developing integrated margin
optimization models which focused on
advanced commodities pricing structures.
Xavier holds an Honours Bachelor of
Mechanical Engineering from McGill
University in Canada and a Master of Sciences
in Aeronautical Engineering from Imperial
College London. He is based in Singapore.
Aditya Harneja
Aditya Harneja is a Senior Consultant in
Accenture Trading, Investment and
Optimization Strategy which is part of
Accenture Strategy Group. Aditya primarily
focuses on commodities markets and has
experience in corporate strategy and
restructuring, trading strategy development
and operating model transformation across
the commodities value chain in the ASEAN
region. Prior to Accenture, Aditya spent four
years in the financial services industry,
working for a leading global investment bank
focused on commodity derivatives markets.
Aditya holds a Bachelor’s degree in Business
and Information Systems from Singapore
Management University. He is based in
Singapore.
Other Contributors
Anindya Dutta, Consultant
Accenture Trading, Investments and
Optimization Strategy, Singapore
36
About Accenture
Accenture is a global management consulting, technology services and outsourcing
company, with more than 305,000 people serving clients in more than 120 countries.
Combining unparalleled experience, comprehensive capabilities across all industries and
business functions, and extensive research on the world’s most successful companies,
Accenture collaborates with clients to help them become high-performance businesses
and governments. The company generated net revenues of US$30.0 billion for the fiscal
year ended Aug. 31, 2014.
Its home page is www.accenture.com.
Accenture Strategy
Accenture Strategy helps leading organizations shape and drive their plans
for growth and innovation, competitiveness, new operating models, talent and
leadership, and digital transformation. Accenture Strategy integrates business,
technology and function strategies to improve agility and deliver tangible outcomes.
Visit our site to learn more about Accenture Strategy:
www.accenture.com/strategy
or join the conversation via:
@AccentureStrat
www.facebook.com/accenturestrategy
www.linkedin.com/company/accenture-strategy
DISCLAIMER: This document is intended for general informational purposes only and does
not take into account the reader’s specific circumstances, and may not reflect the most
current developments. Accenture disclaims, to the fullest extent permitted by applicable
law, any and all liability for the accuracy and completeness of the information in this
document and for any acts or omissions made based on such information. Accenture does
not provide legal, regulatory, audit, or tax advice. Readers are responsible for obtaining
such advice from their own legal counsel or other licensed professionals.
Copyright © 2014 Accenture
All rights reserved.
Accenture, its logo, and
High Performance Delivered
are trademarks of Accenture.
Related Documents