ARTICLES Extracellular Hypotonicity Increases Na,K-ATPase Cell Surface Expression via Enhanced Na Influx in Cultured Renal Collecting Duct Cells MANLIO VINCIGUERRA,* SERGE ARNAUDEAU, † DAVID MORDASINI,* MARTINE ROUSSELOT,* MARCELLE BENS, ‡ ALAIN VANDEWALLE, ‡ PIERRE-YVES MARTIN,* UDO HASLER,* and ERIC FERAILLE* *Service de Néphrologie, Fondation pour Recherches Médicales, Geneva, Switzerland; † Department of Physiology, University of Geneva Medical Center, Geneva, Switzerland; and ‡ INSERM U478, Faculté de Médecine Xavier Bichat, Paris, France Abstract. In the renal collecting duct (CD), the Na,K-ATPase, which provides the driving force for Na absorption, is under tight multifactorial control. Because CD cells are physiologi- cally exposed to variations of interstitial and tubular fluid osmolarities, the effects of extracellular anisotonicity on Na,K- ATPase cell surface expression were studied. Results show that hypotonic conditions increased, whereas hypertonic conditions had no effect on Na,K-ATPase cell surface expression in confluent mpkCCD cl4 cells. Incubating cells with amphotericin B, which increases [Na ] i , under isotonic or anisotonic condi- tions, revealed that Na,K-ATPase recruitment to the cell sur- face was not directly related to variations of cell volume and osmolarity. The effects of amphotericin B and extracellular hypotonicity were not additive, and both were prevented by protein kinase A and proteasome inhibitors, suggesting a com- mon mechanism of action. In line with this hypothesis, extra- cellular hypotonicity induced a sustained stimulation of the amiloride-sensitive short-circuit current, indicating increased Na influx through the apical epithelial Na channel. More- over, inhibiting apical Na entry by amiloride, a blocker of epithelial Na channel, or incubating cells in Na -free me- dium prevented the cell surface recruitment of Na,K-ATPase in response to extracellular hypotonicity. Altogether, these find- ings strongly suggest that extracellular hypotonicity stimulates apical Na influx leading to increased [Na ] i , protein kinase A activation, and recruitment of Na,K-ATPase units to the cell surface of mpkCCD cl4 cells. In the mammalian kidney, water and solute excretion are tightly controlled to maintain body fluid compartment ho- meostasis. In the collecting duct (CD), which is the site of fine tuning of Na balance, principal cells are responsible for Na reabsorption, whereas intercalated cells are involved in acid- base secretion. In principal cells, Na enters via the luminal epithelial Na channel (ENaC) and is extruded by basolater- ally located Na,K-ATPase, which provides the driving force for vectorial Na transport (1). The Na,K-ATPase is under multifactorial control including hormones, paracrine factors, intracellular Na ([Na] i ), and extracellular osmolarity (1–3). Long-term regulation of the enzyme relies mainly on altered subunit expression, whereas short-term control is mediated by changes in enzymatic turnover and/or redistribution between cell surface and intracellular compartments (1–3). Mammalian CD cells are physiologically exposed to varia- tions in both interstitial and luminal osmolalities, which may alter the Na transport by principal cells. Exposure of renal amphibian A6 cells, a model of mammalian principal cells, to extracellular hypotonicity was shown to stimulate Na influx through ENaC (4 – 6). Hypotonic cell swelling is associated with a stimulation of the Na -pump current in both renal A6 cells (7) and cardiac myocytes (8). In addition, hypotonic conditions recruit active Na,K-ATPase units to the cell surface in isolated rabbit cortical CD (CCD) (9). It remains to be determined whether this process relies on the translocation of an intracellular pool of Na,K-ATPase units or alternatively on the activation of silent plasma membrane Na pumps. We investigated the mechanism of control of Na,K-ATPase by extracellular tonicity using cultured mouse principal col- lecting duct mpkCCD c14 cells, a cell line derived from micro- dissected CCD of an SVPK/Tag transgenic mouse (10). These transgenic mice carry the SV40 large T antigen gene (Tag) under the control of the promoter of the L-type pyruvate kinase (PK) gene and of SV40 early enhancer (SV) (11). The mpkC- CD c14 cells retain expression of Na and water transporters that are specific for CD principal cells, such as ENaC and aquaporin-2, as well as transepithelial Na transport controlled Received April 29, 2004. Accepted July 7, 2004. Correspondence to Dr. Eric Feraille, Service de Néphrologie, Fondation pour Recher- ches Médicales, 64 rue de la Roseraie, CH-1211 Geneva 4, Switzerland. Phone: 41-22-382-38-37; Fax: 41-22-347-59-79; E-mail: [email protected] 1046-6673/1510-2537 Journal of the American Society of Nephrology Copyright © 2004 by the American Society of Nephrology DOI: 10.1097/01.ASN.0000139931.81844.10 J Am Soc Nephrol 15: 2537–2547, 2004

Welcome message from author
This document is posted to help you gain knowledge. Please leave a comment to let me know what you think about it! Share it to your friends and learn new things together.
Transcript

ARTICLES
Extracellular Hypotonicity Increases Na,K-ATPase CellSurface Expression via Enhanced Na� Influx in CulturedRenal Collecting Duct Cells
MANLIO VINCIGUERRA,* SERGE ARNAUDEAU,† DAVID MORDASINI,*MARTINE ROUSSELOT,* MARCELLE BENS,‡ ALAIN VANDEWALLE,‡
PIERRE-YVES MARTIN,* UDO HASLER,* and ERIC FERAILLE**Service de Néphrologie, Fondation pour Recherches Médicales, Geneva, Switzerland; †Department ofPhysiology, University of Geneva Medical Center, Geneva, Switzerland; and ‡INSERM U478, Faculté deMédecine Xavier Bichat, Paris, France
Abstract. In the renal collecting duct (CD), the Na,K-ATPase,which provides the driving force for Na� absorption, is undertight multifactorial control. Because CD cells are physiologi-cally exposed to variations of interstitial and tubular fluidosmolarities, the effects of extracellular anisotonicity on Na,K-ATPase cell surface expression were studied. Results show thathypotonic conditions increased, whereas hypertonic conditionshad no effect on Na,K-ATPase cell surface expression inconfluent mpkCCDcl4 cells. Incubating cells with amphotericinB, which increases [Na�]i, under isotonic or anisotonic condi-tions, revealed that Na,K-ATPase recruitment to the cell sur-face was not directly related to variations of cell volume andosmolarity. The effects of amphotericin B and extracellularhypotonicity were not additive, and both were prevented by
protein kinase A and proteasome inhibitors, suggesting a com-mon mechanism of action. In line with this hypothesis, extra-cellular hypotonicity induced a sustained stimulation of theamiloride-sensitive short-circuit current, indicating increasedNa� influx through the apical epithelial Na� channel. More-over, inhibiting apical Na� entry by amiloride, a blocker ofepithelial Na� channel, or incubating cells in Na�-free me-dium prevented the cell surface recruitment of Na,K-ATPase inresponse to extracellular hypotonicity. Altogether, these find-ings strongly suggest that extracellular hypotonicity stimulatesapical Na� influx leading to increased [Na�]i, protein kinase Aactivation, and recruitment of Na,K-ATPase units to the cellsurface of mpkCCDcl4 cells.
In the mammalian kidney, water and solute excretion aretightly controlled to maintain body fluid compartment ho-meostasis. In the collecting duct (CD), which is the site of finetuning of Na� balance, principal cells are responsible for Na�
reabsorption, whereas intercalated cells are involved in acid-base secretion. In principal cells, Na� enters via the luminalepithelial Na� channel (ENaC) and is extruded by basolater-ally located Na,K-ATPase, which provides the driving forcefor vectorial Na� transport (1). The Na,K-ATPase is undermultifactorial control including hormones, paracrine factors,intracellular Na ([Na]i), and extracellular osmolarity (1–3).Long-term regulation of the enzyme relies mainly on alteredsubunit expression, whereas short-term control is mediated bychanges in enzymatic turnover and/or redistribution betweencell surface and intracellular compartments (1–3).
Mammalian CD cells are physiologically exposed to varia-tions in both interstitial and luminal osmolalities, which mayalter the Na� transport by principal cells. Exposure of renalamphibian A6 cells, a model of mammalian principal cells, toextracellular hypotonicity was shown to stimulate Na� influxthrough ENaC (4–6). Hypotonic cell swelling is associatedwith a stimulation of the Na�-pump current in both renal A6cells (7) and cardiac myocytes (8). In addition, hypotonicconditions recruit active Na,K-ATPase units to the cell surfacein isolated rabbit cortical CD (CCD) (9). It remains to bedetermined whether this process relies on the translocation ofan intracellular pool of Na,K-ATPase units or alternatively onthe activation of silent plasma membrane Na� pumps.
We investigated the mechanism of control of Na,K-ATPaseby extracellular tonicity using cultured mouse principal col-lecting duct mpkCCDc14 cells, a cell line derived from micro-dissected CCD of an SVPK/Tag transgenic mouse (10). Thesetransgenic mice carry the SV40 large T antigen gene (Tag)under the control of the promoter of the L-type pyruvate kinase(PK) gene and of SV40 early enhancer (SV) (11). The mpkC-CDc14 cells retain expression of Na� and water transportersthat are specific for CD principal cells, such as ENaC andaquaporin-2, as well as transepithelial Na� transport controlled
Received April 29, 2004. Accepted July 7, 2004.Correspondence to Dr. Eric Feraille, Service de Néphrologie, Fondation pour Recher-ches Médicales, 64 rue de la Roseraie, CH-1211 Geneva 4, Switzerland. Phone:41-22-382-38-37; Fax: 41-22-347-59-79; E-mail: [email protected]
1046-6673/1510-2537Journal of the American Society of NephrologyCopyright © 2004 by the American Society of Nephrology
DOI: 10.1097/01.ASN.0000139931.81844.10
J Am Soc Nephrol 15: 2537–2547, 2004

by aldosterone and vasopressin, and represent a valuable ex-perimental model (12–14). The results of this study demon-strate that Na,K-ATPase cell surface expression is modulatedby Na� influx independent of cell volume variation in mpkC-CDc14 cells.
Materials and MethodsCell Culture
The mpkCCDc14 cells (passages 20 to 25) were grown in definedmedium (DM; DMEM:Ham’s F12' 1:1 vol/vol, 60 nM sodiumselenate, 5 �g/ml transferrin, 2 mM glutamine, 50 nM dexametha-sone, 1 nM triiodothyronine, 10 ng/ml EGF, 5 �g/ml insulin, 20 mMD-glucose, 2% [vol/vol] FCS, and 20 mM HEPES, pH 7.4) at 37°C in5% CO2/95% air atmosphere. Experiments were performed on con-fluent cells seeded on polycarbonate filters (Transwell, 0.4-�m poresize, 1 cm2 growth area; Corning Costar, Cambridge, MA). Cells werekept for 6 to 8 d in DM and then placed in serum-free, hormone-deprived medium 24 h before experiments. For experiments, cellswere preincubated for 30 min at 37°C with various isotonic incubationsolutions that contained either 140 mM NaCl or 240 mM sucrose,supplemented or not with drugs as described in Results and figurelegends. Afterward, cells were incubated for an additional hour at37°C in the same incubation solutions to which 1 �g/ml amphotericinB was added or after apical and basal replacement of the isotonicincubation medium by an equivalent volume of hypotonic (200mOsm/L) or hypertonic (500 mOsm/L) incubation solution. The finalcomposition of the solutions used is given in Table 1.
Measurement of Cell Surface Na,K-ATPaseCell surface Na,K-ATPase was determined on cultured mpkCCDcl4
cells as described previously (12,13) using EZ-Link sulfossuccinim-idobiotin (Sulfo NHS-S-S-Biotin; Pierce, Rockford, IL) to label cellsurface proteins. After lysis in homogenizing buffer (HB; 2 mMEDTA, 2 mM EGTA, 20 �g/ml leupeptin, 1 �g /ml aprotinin, 30 mM
NaF, 30 mM Na pyrophosphate, 1 mM PMSF, 1 mM AEBSF, 0.1%[wt/vol] SDS, 1% [vol/vol] Triton X-100, and 20 mM Tris HCl [pH7.4]), equal amounts of protein were precipitated with streptavidin-agarose beads (Immunopure immobilized streptavidin; Pierce) dilutedin an antiprotease-supplemented Tris Lysis Buffer (50 mM Tris-HClpH 7.4, 100 mM NaCl, 5 mM EDTA, 20 �g/ml leupeptin, and 1 �g/ml aprotinin). After three washes with TLB and one with 10 mMTris-HCl (pH 7.4), samples were resuspended in Laemmli’s buffer(15) and processed for 7% SDS-PAGE, and proteins were electro-transferred to polyvinylidene difluoride membranes (Immobilion-P;Millipore, Waters, MA). The Na,K-ATPase �-subunit was then de-tected with a polyclonal antibody (dilution 1:10000) raised against therat enzyme (16). The �-transferrin receptor was detected with an mAb(dilution 1:2000; Zymed, San Francisco, CA), and E-cadherin wasdetected with a polyclonal antibody (dilution 1:5000; Sigma, St.Louis, MO). The protein bands revealed by chemiluminescence (Su-per Signal Substrate; Pierce) were quantified using a video densitom-eter and ImageQuant software (Molecular Dynamics, Sunnyvale,CA), and the results were expressed as percentage of control.
Cell Volume AnalysisThe mpkCCDc14 cells, grown on polycarbonate filters or glass
coverslips, were rinsed with PBS and incubated for 30 min at 37°C inculture medium that contained the fluorescent dye calcein-AM (5 �Mdiluted from a 10-mM stock solution in DMSO; Molecular ProbesEurope, Leiden, Netherlands). Dye loading was terminated by rinsingwith PBS; cells were then placed in an open perfusion chamber on astage of an inverted microscope (Zeiss Axiovert 200M; Carl ZeissAG, Feldbach, Switzerland), and prewarmed (37°C) incubation solu-tions were superfused with a peristaltic pump (Dynamax, Emeryville,CA). For improving measurements, fluorescence changes were mon-itored using a spinning disk confocal microscope, which better pre-serves living cells than a laser scanning confocal microscope andallows normalization of the fluorescence with respect to the thickness
Table 1. Experimental solutionsa
Solutions
NaCl Sucrose
Iso Hypo Hyper Iso Iso (Na� free) Hypo Hypo (Na� free) Hyper
NaCl 140 90 240 40 — 40 — 40NaHCO3 4 4 4 4 — 4 — 4KHCO3 — — — — 4 — 4 —NaH2PO3 0.20 0.20 0.20 0.20 — 0.20 — 0.20Na2HPO3 0.15 0.15 0.15 0.15 — 0.15 — 0.15KH2PO3 — — — — 0.20 — 0.20 —K2HPO3 — — — — 0.15 — 0.15 —KCl 5 5 5 5 40 5 40 —MgSO4 1 1 1 1 1 1 1 1Glucose 5 5 5 5 5 5 5 5CaCl2 1 1 1 1 1 1 1 1Sucrose — — — 240 240 120 120 420HEPES 20 20 20 20 20 20 20 20Osmolality 305 215 505 335 345 235 245 535
a Iso, isosmotic; Hypo, hyposmotic; Hyper, hyperosmotic. Final concentrations are given in mmol/L and osmolality in mOsm/kg H2O.The pH of all solutions is 7.4.
2538 Journal of the American Society of Nephrology J Am Soc Nephrol 15: 2537–2547, 2004

of the optical slice, improving the accuracy of single-emission dyes.The 488-nm line from a 2.5-W Kr/Ar water-cooled ion laser inmultiline mode (Innova 70C Spectrum; Coherent, Santa Clara, CA)was selected for calcein excitation by the use of an Acousto-OpticalTunable Filter (AOTF; Visitech International, Sunderland, UK). TheAOTF output was coupled by a single-mode fiber optic (Oz Optics,Ltd., Corp, Ontario, Canada) to a Yokogawa spinning disk confocalscan-head (QLC100; Visitech International) mounted on the invertedmicroscope. Images were collected by a 40 � 0.75 NA Achroplanwater immersion objective (Carl Zeiss AG) and captured with a 12-bitTE/CCD interlined Coolsnap HQ Photometrics camera (Ropper Sci-entific, Trenton, NJ). The green emission from calcein was acquiredusing a D525/50m emission filter (Chroma Technology Corp.,Brattleboro, VT). Wavelength selection with the AOTF, camera con-trol, and all of the motorized functions of the microscope werecontrolled for image acquisition by Metamorph/Metafluor 5.0 soft-ware (Universal Imaging, West Chester, PA). The same software wasused off-line for image analysis, photo-bleaching correction, andcurve fitting. Because recorded fluorescence in a given cytoplasmicarea is proportional to the intracellular concentration of calcein, wedetermined cell volume changes by measurement of variations ofcalcein fluorescence, as described previously (17). The results wereexpressed as a percentage of the control period fluorescence intensity.
Electrophysiologic StudiesConfluent mpkCCDcl4 cells that were grown on Snapwell filters
(0.4-�m pore size, 12-mm diameter; Corning Costar) were transferredto a Ussing chamber, and short-circuit current (Isc) was measuredunder voltage clamp (0 mV) using dual silver-silver chloride elec-trodes connected to a VCC MC6 voltage-clamp apparatus (Physio-logic Instruments, San Diego, CA). Cells were equilibrated at 37°Cfor 30 min in symmetric isotonic (300 mOsm/L) sucrose buffer thatcontained 40 mM Na� (Table 1) and bubbled with 5% CO2. Isotonicsucrose buffer was then replaced by hypotonic sucrose buffer (200mOsm/L and 40 mM Na�) using a peristaltic pump, and cells weremaintained for 60 min under symmetric hypotonic conditions. Then,isotonic conditions were reestablished by exchanging the hypotonicsucrose buffer with isotonic sucrose buffer. After 30 min of equili-bration, 10�6 M amiloride was added to the apical side of the chamberto measure the amiloride-resistant Isc. The amiloride-sensitive Isc
reflecting ENaC-mediated Na� transport was calculated as the totalIsc minus the amiloride-resistant Isc. By convention, positive Isc cor-responded to a flow of positive charges from the basal to the apicalsolution. Results were expressed as �A/cm2.
Statistical AnalysesResults are given as means � SEM from n independent experi-
ments. Each experiment was performed on cultured cells from thesame passage. Statistical analysis of Na,K-ATPase �-subunit immu-noreactivity was done using the Mann-Whitney U test or the Kruskal-Wallis test for comparison of two or more than two groups, respec-tively. Statistical analysis of Isc was done using t test for paired data.P � 0.05 was considered significant.
ResultsEffect of Extracellular Anisotonicity on Na,K-ATPaseCell Surface Expression
We first assessed the influence of extracellular tonicity oncell volume and Na,K-ATPase cell surface expression. Incu-bation of confluent mpkCCDc14 cells in a hypotonic medium
(200 mOsm/L) induced a rapid decrease in fluorescence inten-sity from calcein-loaded cells corresponding to a 24.5 � 5.5%increase in cell volume (Figure 1A). After the hypotonic me-dium was replaced by an isotonic medium (not shown), fluo-rescence intensity returned toward baseline levels, indicatingthat the decrease in fluorescence signal was not due to a dyeleakage but rather to intracellular calcein dilution consecutiveto cell swelling. Incubation of mpkCCDc14 cells for 1 h at 37°Cin hypotonic medium increased Na,K-ATPase cell surface ex-pression by ~30% as compared with cells that were incubatedunder isotonic conditions (Figure 1B). A similar increase ofNa,K-ATPase cell surface expression was observed when ex-tracellular NaCl was replaced by sucrose (Table 1, Figure 1B,right). Therefore, Na,K-ATPase was recruited to the cell sur-face independent of variations of ionic strength. As expected,the fluorescence intensity of calcein-loaded cells increasedafter exposure to a hyperosmotic medium (500 mOsm/L),indicating a 20.1 � 2.0% decrease in cell volume (Figure 1C).In contrast to the observations made in cells that were incu-bated under hypotonic conditions, hypertonic NaCl or sucrosemedium (Table 1) did not significantly alter Na,K-ATPase cellsurface expression (Figure 1D).
The question arises whether cell swelling controls Na,K-ATPase expression to the cell surface. Using mpkCCDcl4 cells,we showed that amphotericin B, which forms artificial poresthat enhance Na� and K� plasma membrane permeabilities(18), increases Na,K-ATPase cell surface expression in thepresence of physiologic concentrations of extracellular Na�
(19). Because amphotericin B induces cell swelling in MDCKcells (17), we tested whether variations of cell volume mayaccount for the Na� ionophore-induced Na,K-ATPase recruit-ment. For this purpose, mpkCCDc14 cells were preincubated inisotonic NaCl medium (Table 1) for 1 h at 37°C and then foran additional hour in isotonic or hypotonic NaCl medium (200mOsm/L) with or without 1 �g/ml amphotericin B. Figure 2Aand 3A show that under isotonic conditions, amphotericin Bdid not alter calcein fluorescence intensity, indicating the ab-sence of a detectable variation of cell volume. In the absence ofamphotericin B, incubation of cells with hypotonic medium(200 mOsm/L) decreased calcein fluorescence, reflecting cellswelling (Figure 1A), whereas calcein fluorescence slightlyincreased in cells that were challenged with both amphotericinB and hypotonic medium (Figure 2B). The latter increase incalcein fluorescence most likely reflected a moderate cellshrinkage (9.9 � 1.5%) consecutive to the diffusion of ions andaccompanying water through amphotericin B pores from thecytosol to the less concentrated extracellular medium (18). Wenext analyzed the combined effects of extracellular hypotonic-ity and amphotericin B permeabilization on Na,K-ATPase cellsurface expression to determine whether they potentially sharea common mechanism of action despite dissimilar effects oncell volume. Amphotericin B and extracellular hypotonicityincreased Na,K-ATPase cell surface expression to a similarextent and in a nonadditive manner (Figure 2C). These resultssuggest that both stimuli activate similar or convergent signal-ing pathways.
To investigate further the relationship between extracellular
J Am Soc Nephrol 15: 2537–2547, 2004 Regulation of Na,K-ATPase by Hypotonicity 2539
tonicity, Na� permeability, and Na,K-ATPase cell surfaceexpression, we examined the effect of extracellular hyperto-nicity on the amphotericin B–induced increase in Na,K-AT-Pase cell surface expression. For this purpose, mpkCCDc14
cells were preincubated in NaCl isotonic medium (Table 1) for1 h at 37°C and incubated for an additional hour in isotonic orhypertonic NaCl medium (500 mOsm/L) with or without 1�g/ml amphotericin B. In the absence of amphotericin B,extracellular hypertonicity induced cell shrinkage (Figure 1C),whereas the addition of amphoterin B to the hypertonic solu-tion induced a slight decrease in calcein fluorescence, reflect-ing a moderate cell swelling (12.2 � 1.2%; Figure 3B). This
latter effect most likely relies on extracellular ion entry andaccompanying water through the membrane pores formed byamphotericin B (18). Adding 200 mOsm/L NaCl or sucrose(corresponding to the 500 mOsm/L hypertonic solution) didnot significantly modify Na,K-ATPase cell surface expression(Figure 3C). However, addition of amphotericin B to bothhypertonic and isotonic solution increased Na,K-ATPase cellsurface expression (Figure 3C). These results indicate thathypertonicity does not modulate the effect of increased Na�
influx caused by amphotericin B on Na,K-ATPase recruitmentto the cell surface. Altogether, our results demonstrate that therecruitment of Na,K-ATPase to the cell surface of mpkCCDcl4
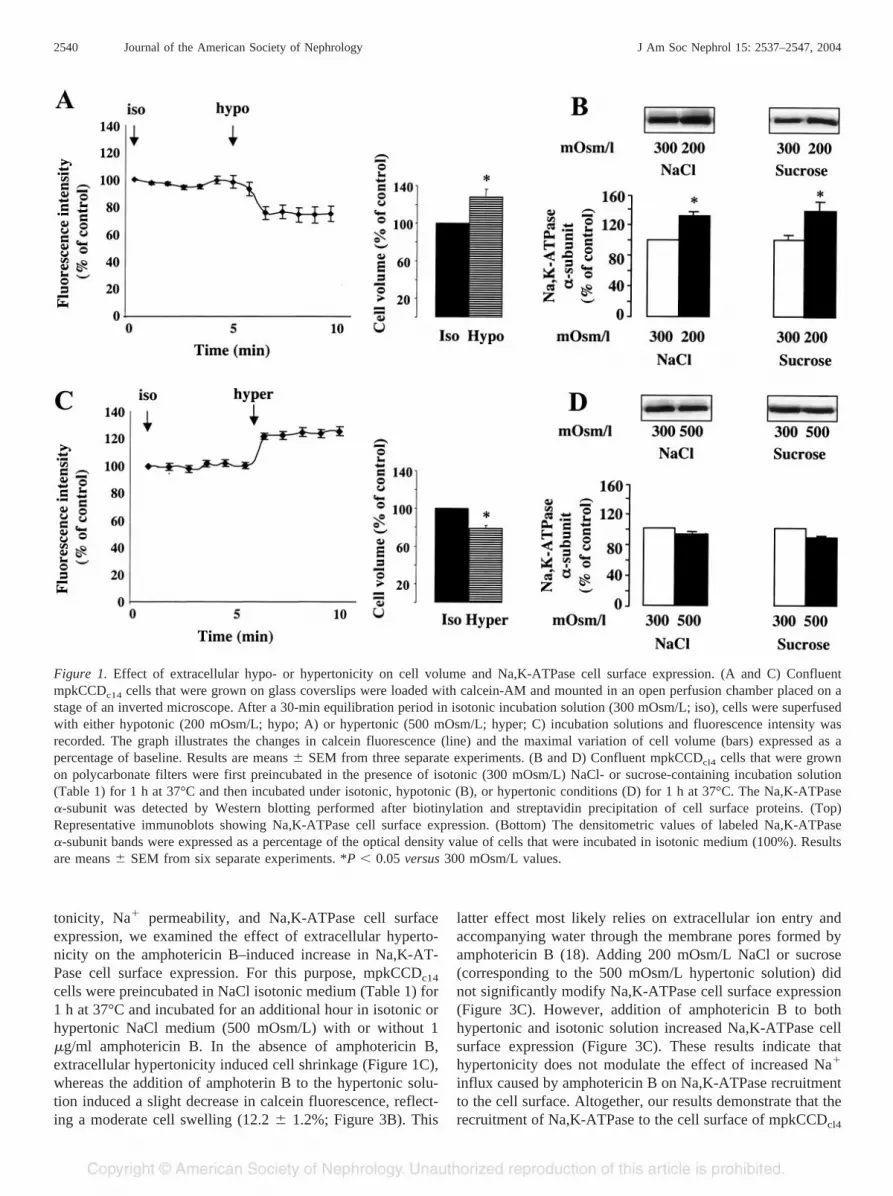
Figure 1. Effect of extracellular hypo- or hypertonicity on cell volume and Na,K-ATPase cell surface expression. (A and C) ConfluentmpkCCDc14 cells that were grown on glass coverslips were loaded with calcein-AM and mounted in an open perfusion chamber placed on astage of an inverted microscope. After a 30-min equilibration period in isotonic incubation solution (300 mOsm/L; iso), cells were superfusedwith either hypotonic (200 mOsm/L; hypo; A) or hypertonic (500 mOsm/L; hyper; C) incubation solutions and fluorescence intensity wasrecorded. The graph illustrates the changes in calcein fluorescence (line) and the maximal variation of cell volume (bars) expressed as apercentage of baseline. Results are means � SEM from three separate experiments. (B and D) Confluent mpkCCDcl4 cells that were grownon polycarbonate filters were first preincubated in the presence of isotonic (300 mOsm/L) NaCl- or sucrose-containing incubation solution(Table 1) for 1 h at 37°C and then incubated under isotonic, hypotonic (B), or hypertonic conditions (D) for 1 h at 37°C. The Na,K-ATPase�-subunit was detected by Western blotting performed after biotinylation and streptavidin precipitation of cell surface proteins. (Top)Representative immunoblots showing Na,K-ATPase cell surface expression. (Bottom) The densitometric values of labeled Na,K-ATPase�-subunit bands were expressed as a percentage of the optical density value of cells that were incubated in isotonic medium (100%). Resultsare means � SEM from six separate experiments. *P � 0.05 versus 300 mOsm/L values.
2540 Journal of the American Society of Nephrology J Am Soc Nephrol 15: 2537–2547, 2004
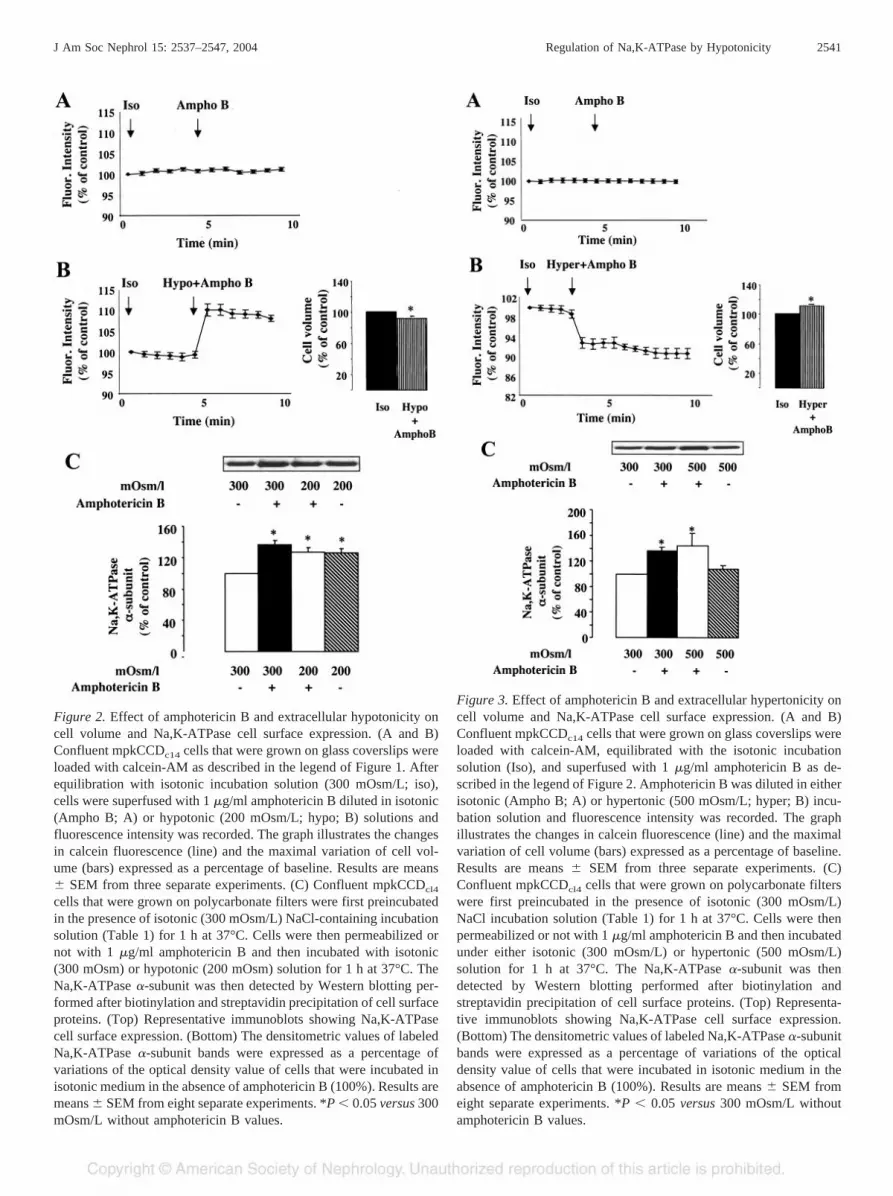
Figure 2. Effect of amphotericin B and extracellular hypotonicity oncell volume and Na,K-ATPase cell surface expression. (A and B)Confluent mpkCCDc14 cells that were grown on glass coverslips wereloaded with calcein-AM as described in the legend of Figure 1. Afterequilibration with isotonic incubation solution (300 mOsm/L; iso),cells were superfused with 1 �g/ml amphotericin B diluted in isotonic(Ampho B; A) or hypotonic (200 mOsm/L; hypo; B) solutions andfluorescence intensity was recorded. The graph illustrates the changesin calcein fluorescence (line) and the maximal variation of cell vol-ume (bars) expressed as a percentage of baseline. Results are means� SEM from three separate experiments. (C) Confluent mpkCCDcl4
cells that were grown on polycarbonate filters were first preincubatedin the presence of isotonic (300 mOsm/L) NaCl-containing incubationsolution (Table 1) for 1 h at 37°C. Cells were then permeabilized ornot with 1 �g/ml amphotericin B and then incubated with isotonic(300 mOsm) or hypotonic (200 mOsm) solution for 1 h at 37°C. TheNa,K-ATPase �-subunit was then detected by Western blotting per-formed after biotinylation and streptavidin precipitation of cell surfaceproteins. (Top) Representative immunoblots showing Na,K-ATPasecell surface expression. (Bottom) The densitometric values of labeledNa,K-ATPase �-subunit bands were expressed as a percentage ofvariations of the optical density value of cells that were incubated inisotonic medium in the absence of amphotericin B (100%). Results aremeans � SEM from eight separate experiments. *P � 0.05 versus 300mOsm/L without amphotericin B values.
Figure 3. Effect of amphotericin B and extracellular hypertonicity oncell volume and Na,K-ATPase cell surface expression. (A and B)Confluent mpkCCDc14 cells that were grown on glass coverslips wereloaded with calcein-AM, equilibrated with the isotonic incubationsolution (Iso), and superfused with 1 �g/ml amphotericin B as de-scribed in the legend of Figure 2. Amphotericin B was diluted in eitherisotonic (Ampho B; A) or hypertonic (500 mOsm/L; hyper; B) incu-bation solution and fluorescence intensity was recorded. The graphillustrates the changes in calcein fluorescence (line) and the maximalvariation of cell volume (bars) expressed as a percentage of baseline.Results are means � SEM from three separate experiments. (C)Confluent mpkCCDcl4 cells that were grown on polycarbonate filterswere first preincubated in the presence of isotonic (300 mOsm/L)NaCl incubation solution (Table 1) for 1 h at 37°C. Cells were thenpermeabilized or not with 1 �g/ml amphotericin B and then incubatedunder either isotonic (300 mOsm/L) or hypertonic (500 mOsm/L)solution for 1 h at 37°C. The Na,K-ATPase �-subunit was thendetected by Western blotting performed after biotinylation andstreptavidin precipitation of cell surface proteins. (Top) Representa-tive immunoblots showing Na,K-ATPase cell surface expression.(Bottom) The densitometric values of labeled Na,K-ATPase �-subunitbands were expressed as a percentage of variations of the opticaldensity value of cells that were incubated in isotonic medium in theabsence of amphotericin B (100%). Results are means � SEM fromeight separate experiments. *P � 0.05 versus 300 mOsm/L withoutamphotericin B values.
J Am Soc Nephrol 15: 2537–2547, 2004 Regulation of Na,K-ATPase by Hypotonicity 2541
cells is not directly correlated to changes in cell volume(Table 2).
Extracellular Hypotonicity Increases Na,K-ATPase CellSurface Expression via a Protein Kinase A– andProteasome-Dependent Pathway
The lack of additive effects of amphotericin B and extracel-lular hypotonicity on Na,K-ATPase membrane recruitmentsuggests that both stimuli activate convergent signaling path-ways. In CD principal cells, Na,K-ATPase cell surface recruit-ment induced by amphotericin B–dependent Na� influx ismediated by cAMP-independent PKA activation that requiresproteasomal activity (19). To determine whether a similarpathway is involved in the observed hypotonicity-induced in-crease in Na,K-ATPase cell surface expression, we preincu-bated mpkCCDcl4 cells in the absence or presence of 10�5 MH89, a protein kinase A (PKA) inhibitor, for 1 h at 37°C beforeexposure or not to a hypotonic (200 mOsm/L) NaCl or sucrosemedium with or without H89 for an additional hour. Inhibitionof PKA by H89 fully prevented the increase in Na,K-ATPasecell surface expression induced by NaCl or sucrose hypotonicsolution (Figure 4). We next investigated whether the hypoto-nicity-induced increase in Na,K-ATPase cell surface expres-sion also requires proteasomal activity. For this purpose, wepreincubated mpkCCDc14 cells for 2 h at 37°C in the absenceor presence of 10�6 M of the proteasomal inhibitor lactacystinbefore exposure or not to hypotonic (200 mOsm/L) NaClmedium with or without lactacystin for an additional hour.Figure 5 shows that lactacystin prevented the hypotonicity-induced Na,K-ATPase recruitment. Similar results wereachieved using 10�5 M MG132, a proteasomal inhibitor that isstructurally unrelated to lactacystin (data not shown). Takentogether, these results indicate that amphotericin B and extra-cellular hypotonicity both increased Na,K-ATPase cell surfaceexpression via the same mechanism.
Hypotonicity Stimulates the Amiloride-Sensitive ISC inmpkCCDcl4 Cells
In renal amphibian A6 cells, a model of CD principal cells,extracellular hypotonicity was shown to stimulate transepithe-lial Na� transport by increasing both the number of ENaC(4–6) present in the apical membrane and Na,K-ATPase ac-tivity (7). We therefore determined whether a hypotonic chal-lenge stimulates the amiloride-sensitive ISC in mpkCCDc14
cells. Cells were first equilibrated in isotonic sucrose solution
(300 mOsm/L) that contained 40 mM Na� (Table 1). Underthese conditions, ISC was stable for at least 120 min. Afterexposure of mpkCCDc14 cells to a hyposmotic sucrose solution(200 mOsm/L) in the continuous presence of 40 mM extracel-lular Na�, the amiloride-sensitive Isc gradually increased from4.8 � 0.4 to 8.7 � 0.6 �A/cm2 (P � 0.01) during the first 20min of incubation. and this stimulation was sustained for atleast 40 min (Figure 6A). The amiloride-sensitive ISC promptlyreturned to a nearly basal levels (5.3 � 0.3 �A/cm2) afterreestablishment of isotonic conditions (Figure 6). However, theamiloride-insensitive ISC was similar under isotonic and hypo-
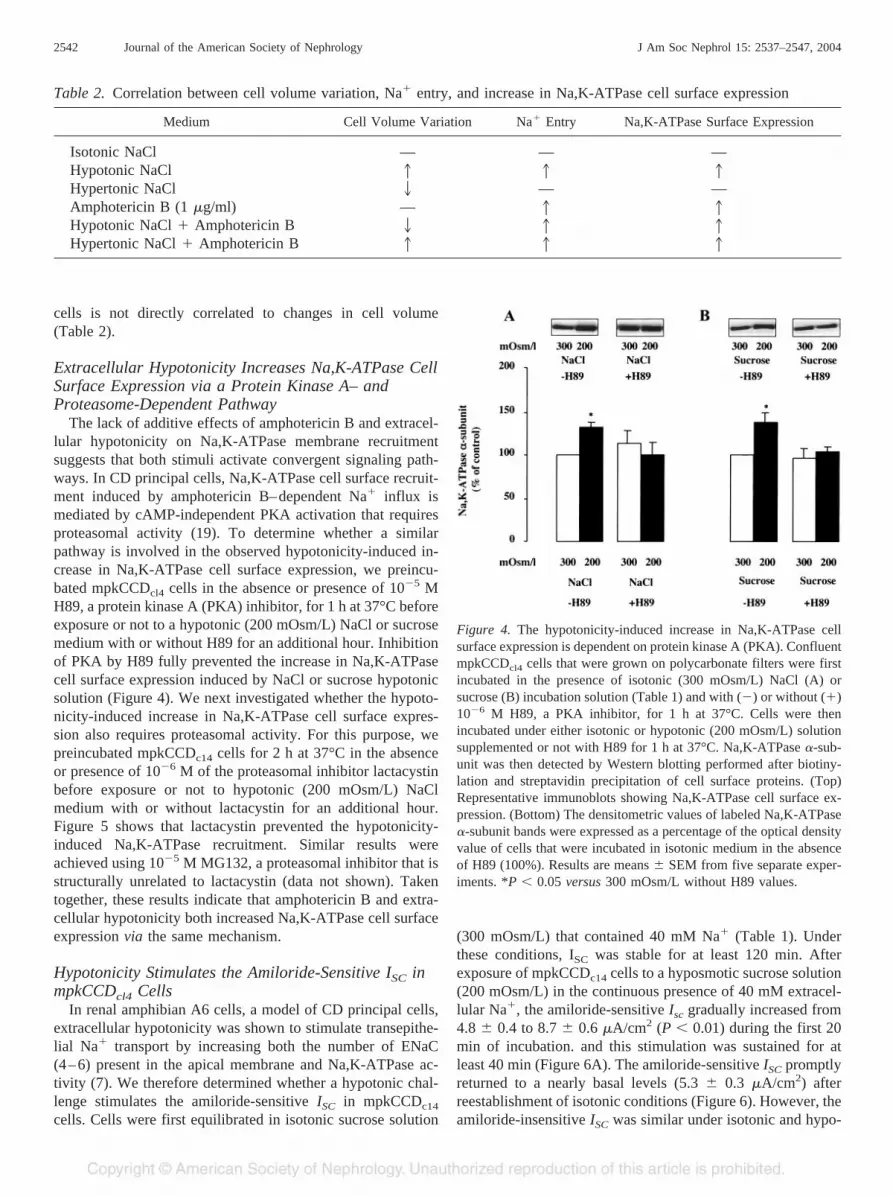
Figure 4. The hypotonicity-induced increase in Na,K-ATPase cellsurface expression is dependent on protein kinase A (PKA). ConfluentmpkCCDcl4 cells that were grown on polycarbonate filters were firstincubated in the presence of isotonic (300 mOsm/L) NaCl (A) orsucrose (B) incubation solution (Table 1) and with (�) or without (�)10�6 M H89, a PKA inhibitor, for 1 h at 37°C. Cells were thenincubated under either isotonic or hypotonic (200 mOsm/L) solutionsupplemented or not with H89 for 1 h at 37°C. Na,K-ATPase �-sub-unit was then detected by Western blotting performed after biotiny-lation and streptavidin precipitation of cell surface proteins. (Top)Representative immunoblots showing Na,K-ATPase cell surface ex-pression. (Bottom) The densitometric values of labeled Na,K-ATPase�-subunit bands were expressed as a percentage of the optical densityvalue of cells that were incubated in isotonic medium in the absenceof H89 (100%). Results are means � SEM from five separate exper-iments. *P � 0.05 versus 300 mOsm/L without H89 values.
Table 2. Correlation between cell volume variation, Na� entry, and increase in Na,K-ATPase cell surface expression
Medium Cell Volume Variation Na� Entry Na,K-ATPase Surface Expression
Isotonic NaCl — — —Hypotonic NaCl 1 1 1Hypertonic NaCl 2 — —Amphotericin B (1 �g/ml) — 1 1Hypotonic NaCl � Amphotericin B 2 1 1Hypertonic NaCl � Amphotericin B 1 1 1
2542 Journal of the American Society of Nephrology J Am Soc Nephrol 15: 2537–2547, 2004

tonic conditions (0.4 � 0.1 �A/cm2). These findings indicatethat extracellular hypotonic challenge enhances the apical Na�
influx through ENaC and therefore may increase [Na�]i inmpkCCDcl4 cells.
Increase in Na,K-ATPase Cell Surface Expression inResponse to Extracellular Hypotonicity Depends onApical Na� Entry
Our results showed that extracellular hypotonicity stimu-lated the amiloride-sensitive Isc in mpkCCDcl4 cells, suggest-ing that increased Na,K-ATPase cell surface expression inresponse to extracellular hypotonic challenge relies on en-hanced Na� influx through ENaC. To test this hypothesis, we
preincubated mpkCCDcl4 cells that were grown on filters underisotonic conditions for 30 min at 37°C with or without 10�6 Mamiloride, an inhibitor of ENaC, before exposure to a hypo-tonic (200 mOsm/L) extracellular solution with or withoutamiloride for an additional hour. Amiloride fully prevented theincrease in Na,K-ATPase cell surface expression induced byextracellular hypotonicity (Figure 7). Experiments were thenperformed using a nominally Na�-free medium (Table 1) toinvestigate further the Na� dependence of the hypotonicity-induced recruitment of Na,K-ATPase to the cell surface. Figure8, A and B, shows that exposure of calcein-loaded cells tohypotonic (200 mOsm/L) sucrose medium induced a similarincrease in cell volume in the presence of a residual 40 mMNa� (23.0 � 2.2%) or in the nominal absence of Na� (21.9 �
Figure 5. The hypotonicity-induced increase in Na,K-ATPase cellsurface expression is dependent on proteasomal activity. ConfluentmpkCCDcl4 cells that were grown on polycarbonate filters were firstpreincubated in the presence of isotonic (300 mOsm/L) NaCl incu-bation solution with (�) or without (�) 10�6 M lactacystin, a pro-teasomal inhibitor, for 1 h at 37°C. Cells were then incubated undereither isotonic or hypotonic (200 mOsm/L) conditions and in thepresence or absence of lactacystin for 1 h at 37°C. Na,K-ATPase�-subunit was then detected by Western blotting performed afterbiotinylation and streptavidin precipitation of cell surface proteins.(Top) Representative immunoblots showing Na,K-ATPase cell sur-face expression. (Bottom) The densitometric values of labeled Na,K-ATPase �-subunit bands were expressed as a percentage of the opticaldensity value of cells that were incubated in isotonic medium and inthe absence of lactacystin (100%). Results are means � SEM fromfive separate experiments. *P � 0.05 versus 300 mOsm/L withoutlactacystin values.
Figure 6. Hypotonicity stimulates the amiloride-sensitive short-circuitcurrent (ISC) in mpkCCDcl4. Confluent mpkCCDcl4 cells that weregrown on polycarbonate filters (Snapwell) were transferred to aUssing chamber, and Isc was measured under voltage clamp (0 mV)as described in Materials and Methods. Cells were first equilibratedfor 30 min at 37°C in the presence of isotonic (300 mOsm/L) sucroseincubation solution and then exposed to hypotonic (200 mOsm/L)sucrose incubation solution for 60 min before reestablishing isotonicconditions. All incubation solutions contained 40 mM Na�. (A)Representative recording showing ISC as a function of time andextracellular osmolarity. (B) Amiloride-sensitive ISC under isosmotic(300 mOsm/L), hyposmotic (200 mOsm/L), and reestablishment ofisosmotic condition. Results from five separate experiments areshown.
J Am Soc Nephrol 15: 2537–2547, 2004 Regulation of Na,K-ATPase by Hypotonicity 2543

2.6%). A significant increase in cell surface Na,K-ATPase wasstill observed when using a hypotonic (200 mOsm/L) solutionin which NaCl was substituted by sucrose but still contained aresidual 40 mM Na� as compared with that measured using anisotonic (300 mOsm/L) sucrose solution that contained thesame concentration of Na� (Figure 8C, left). In contrast, ex-tracellular hypotonicity did not increased Na,K-ATPase cellsurface expression when mpkCCDcl4 cells were incubated in anominally Na�-free solution in which NaCl was substituted bysucrose and in which the remaining 40 mM Na� was substi-tuted by K� (Table 1, Figure 8C, right). The hypotonicity-induced recruitment of Na,K-ATPase was blunted in the ab-sence of Na� despite a similar increase in cell volume andtherefore cell surface area, suggesting that Na,K-ATPase isspecifically targeted to the cell surface in the presence ofextracellular Na�. Figure 8D shows that, in agreement with thefunctional link between Na,K-ATPase and E-cadherin ob-served in epithelial cells, exposure of mpkCCDcl4 cells to NaClhypotonic medium induced a parallel increase of the cell sur-face expression of both proteins (20). In contrast, the cellsurface expression of the ubiquitously expressed and quicklyrecycling �-transferrin receptor (21) remained unchanged.
Figure 7. The hypotonicity-induced increase in Na,K-ATPase cellsurface expression is dependent on epithelial NaCl channel activity.Confluent mpkCCDcl4 cells that were grown on polycarbonate filterswere first incubated in the presence of isotonic (300 mOsm) NaCl (A)or sucrose (B) incubation solution with (�) or without (�) 10�6 Mamiloride for 30 min at 37°C. Cells were then incubated in either anisotonic or a hypotonic (200 mOsm/L) solution and in the presence orabsence of amiloride for 1 h at 37°C. The Na,K-ATPase �-subunitwas detected by Western blotting performed after biotinylation andstreptavidin precipitation of cell surface proteins. (Top) Representa-tive immunoblot showing Na,K-ATPase cell surface expression. (Bot-tom) The densitometric values of labeled Na,K-ATPase �-subunitbands were expressed as a percentage of the optical density value ofcells that were incubated in isotonic medium and in the absence ofamiloride (100%). Results are means � SEM from four separateexperiments. *P � 0.05 versus 300 mOsm/L without amiloridevalues.
Figure 8. The hypotonicity-induced increase of Na,K-ATPase cellsurface expression is dependent on the presence of extracellularsodium. (A and B) Confluent mpkCCDc14 cells that were grown onglass coverslips were loaded with calcein-AM and mounted in anopen perfusion chamber placed on a stage of an inverted microscope.After a 30-min equilibration period in isotonic sucrose incubationsolution (300 mOsm/L; iso), cells were superfused with hypotonicsucrose (200 mOsm/L; hypo) incubation solutions that contained (A)or not (B) 40 mM Na� and fluorescence intensity was recorded. Thegraph illustrates the changes in calcein fluorescence (line) and themaximal variation of cell volume (bars) expressed as a percentage ofbaseline. Results are means � SEM from two separate experiments.(C) Confluent mpkCCDcl4 cells that were grown on polycarbonatefilters were first preincubated in the presence of isotonic (300mOsm/L) sucrose incubation solution that contained (40 mM) or not(0 mM) Na� (Table 1) for 1 h at 37°C. Cells were then incubated ineither an isotonic or a hypotonic (200 mOsm/L) solution and in thepresence or absence of Na� for 1 h at 37°C. The Na,K-ATPase�-subunit was detected by Western blotting performed after biotiny-lation and streptavidin precipitation of cell surface proteins. (Top)Representative immunoblot showing Na,K-ATPase cell surface ex-pression. (Bottom) The densitometric values of labeled Na,K-ATPase�-subunit bands were expressed as a percentage of the optical densityvalue of cells that were incubated in isotonic medium (100%). Resultsare means � SEM from four separate experiments. *P � 0.05 versuscontrol 300 mOsm/L values. (D) Confluent mpkCCDcl4 cells thatwere preincubated in the presence of isotonic (300 mOsm/L) NaClincubation solution were incubated in either an isotonic or a hypotonic(200 mOsm/L) NaCl solution for 1 h at 37°C. The �-transferrinreceptor (top), E-cadherin (middle), and Na,K-ATPase �-subunit (bot-tom) were detected by Western blotting performed on the samemembrane after biotinylation and streptavidin precipitation of cellsurface proteins.
2544 Journal of the American Society of Nephrology J Am Soc Nephrol 15: 2537–2547, 2004
These results demonstrate that extracellular hypotonicity spe-cifically induces the recruitment of Na,K-ATPase and func-tionally linked E-cadherin to the cell surface. Moreover, thiseffect critically depends on apical Na� influx mediated byENaC.
DiscussionThe present study shows that extracellular hypotonicity and
amphotericin B induce the recruitment of Na,K-ATPase unitsto the cell surface of renal CD principal cells independent ofcell volume variation via increased Na� influx, leading to theproteasomal-dependent activation of PKA. Renal CD cells areexposed to physiologic variations in luminal fluid and/or in-terstitial osmolality, which influence cell volume (22) andtrigger adaptive processes aimed at restoring initial cell volume(23,24). Indeed, renal epithelial cells undergo cell swelling orcell shrinkage in response to extracellular hypotonicity orhypertonicity, respectively (25–27). That Na,K-ATPase pro-vides the driving force for vectorial ion transport and plays akey role in the maintenance of a constant composition of theintracellular milieu and cell volume (28) led us to analyze theexisting relationship between cell volume variation and Na,K-ATPase cell surface expression, a major determinant of Na,K-ATPase activity in CD principal cells (3). In agreement with aprevious study on isolated mouse CCD (9), the present findingsdemonstrate that hypotonicity, which induced cell swelling, isassociated with Na,K-ATPase recruitment to the plasma mem-brane but that hypertonicity, which induced cell shrinkage,does not alter Na,K-ATPase cell surface expression. Modifi-cation of the intracellular concentration or activity of solutesmay also lead to variations of cell volume (26,27,29), partic-ularly in secreting or absorptive epithelial cells. For example,apical Na�-alanine and Na�-glucose co-transporter activationinduced a sustained increase in cell volume in isolated rabbitproximal tubules (26). Likewise, inhibition of active Na� ex-trusion by ouabain, which specifically inhibits the Na,K-AT-Pase, increases cell volume in CCD (29). It is interesting thatthe Na� ionophore amphotericin B induces a similar increasein Na,K-ATPase cell surface expression under isotonic condi-tions, i.e., in the absence of cell volume variation, as well asunder hypotonic or hypertonic conditions associated with cellshrinkage or cell swelling, respectively. These results stronglysuggest that the expression levels of cell surface Na,K-ATPaseare not directly controlled by cell volume variation in renal CDprincipal cells (Table 2).
Previous studies performed in renal A6 cells have shownthat a short hypotonic challenge stimulates both Na,K-ATPaseactivity (7) and apical Na� entry via an increase in the numberof conducting ENaC (4–6). Results of the present study con-firm that extracellular hypotonicity stimulates apical Na� in-flux though ENaC (Figure 6) and show that elimination of theapical Na� entry through ENaC either by addition of 10�6 Mamiloride to the apical side of mpkCCDcl4 cells grown onfilters or by incubation of cells in a nominally Na�-free solu-tion fully prevented the increase in Na,K-ATPase cell surfaceexpression induced by extracellular hypoosmolality (Figures 7and 8). Moreover, exposure of mpkCCDcl4 cells to hypotonic
sucrose medium that contained or not 40 mM Na� induced asimilar increase in cell volume. These observations thereforesuggest that the increase in [Na]i consecutive to the stimulationof ENaC-dependent Na� entry and not cell swelling triggersthe increase in Na,K-ATPase cell surface expression in re-sponse to a short-term hypotonic challenge in mpkCCDcl4
cells. However, our results do not rule out the possibility thatcell swelling triggers ENaC activation in response to extracel-lular hypotonicity. This finding is in agreement with the pre-viously described intracellular Na� concentration-dependentrecruitment of Na,K-ATPase in mpkCCDcl4 cells (19). Alto-gether, our observations suggest that CD principal cells exhibitan intracellular Na� sensing mechanism that triggers a signal-ing cascade that leads to Na,K-ATPase recruitment from aninactive intracellular pool to the basolateral plasma membrane,as described previously in response to cAMP (12), aldosterone(13), activation of G protein–coupled receptors (30), or in-creased [Na�]i (19,31).
We have previously shown that a rise in [Na�]i induced byNa� ionophores leads to proteasomal-dependent PKA activa-tion and subsequent increased expression of cell surface Na,K-ATPase in mpkCCDcl4 cells (19). Here we show that bothhypotonicity and the Na� ionophore amphotericin B stimulateto the same extent and in a nonadditive manner the recruitmentof cell surface Na,K-ATPase (Figure 2). Furthermore, Na,K-ATPase cell surface recruitment could be prevented after phar-macologic inhibition of either PKA or proteasomal activity.Altogether, these results strongly suggest that extracellularhypotonicity and amphotericin B share the same signalingpathway. The Na�-induced activation of PKA does not requirecAMP (19), thus excluding the classical pathway involvingdissociation of the PKA holoenzyme induced by cAMP bind-ing to regulatory subunits, which consequently alleviates au-toinhibitory contacts and releases the active PKA catalyticsubunit (PKAc) (32,33). Ferraris et al. (34) recently showedthat, in response to extracellular hypertonicity, PKA can beactivated independent of cAMP after the release of free activePKAc as a result of the dissociation of a protein complex thatcomprises a discrete pool of PKAc associated with the tonicity-responsive enhancer binding protein. However, such a mech-anism of PKA activation caused by increased cellular Na�
influx seems to be very unlikely because extracellular hyper-tonicity, a hallmark of tonicity-responsive enhancer bindingprotein activation (34), does not alter Na,K-ATPase cell sur-face expression (Figure 1). Recently, Zhong et al. (35) dem-onstrated that the transcriptional activity of NF-�B is regulatedby the I�B-associated PKAc subunit activation through acAMP-independent pathway. Inducers such as LPS and IL-1initiate a cytoplasmic signaling cascade that ultimately leads tothe proteasomal degradation of I�B, nuclear translocation ofNF-�B, and transcriptional activation of proinflammatory re-sponse genes. It is interesting that among the cascade of eventsthat control this complex process, the proteasomal degradationof I�B was shown to result in cAMP-independent activation ofPKAc, which forms a multimeric PKAc/I�B�/NF-�B p65complex under inactive state (35,36). The proteasomal depen-dence of both amphotericin B–induced (19) and extracellular
J Am Soc Nephrol 15: 2537–2547, 2004 Regulation of Na,K-ATPase by Hypotonicity 2545

hypotonicity-induced cell surface recruitment of Na,K-ATPase(Figure 5) is compatible with the mechanism reported aboveand requires further investigation. It remains to be determinedwhether PKA directly induces Na,K-ATPase redistribution,e.g., through phosphorylation of the Na,K-ATPase �-subunit(37–39), or requires further downstream signalingintermediate(s).
In conclusion, our results strongly suggest that Na� iono-phores and extracellular hypotonicity induce recruitment ofNa,K-ATPase units to the plasma membrane after similarcAMP-independent activation of PKA, most likely through therelease of active PKAc from a protein complex after protea-somal degradation of a regulatory protein in response to in-creased [Na�]i. This process is not directly dependent of cellvolume variation and most likely relies on the activation of anintracellular Na�-sensing pathway.
AcknowledgmentsThis work was supported in part by Swiss National Foundation
Grant 31-67878.02 and a Carlos and Elsie deReuter Foundation grantto E.F.
We thank Fabio Carrozzino and Michelangelo Foti (Department ofMorphology, University of Geneva, Geneva, Switzerland) for helpfuldiscussion and technical skills.
References1. Feraille E, Doucet A: Sodium-potassium-adenosinetriphos-
phatase-dependent sodium transport in the kidney: Hormonalcontrol. Physiol Rev 81: 345–418, 2001
2. Therien AG, Blostein R: Mechanisms of sodium pump regulationAm J Physiol 279: C541–C566, 2000
3. Feraille E, Mordasini D, Gonin S, Deschenes G, Vinciguerra M,Doucet A, Vandewalle A, Summa V, Verrey F, Martin PY:Mechanism of control of Na,K-ATPase in principal cells of themammalian collecting duct. Ann N Y Acad Sci 986: 570–578,2003
4. Wills NK, Millinoff LP, Crowe WE: Na� channel activity incultured renal (A6) epithelium: Regulation by solution osmolar-ity. J Membrane Biol 121: 79–90, 1991
5. Niisato N, Marunaka Y: Hyposmolality-induced enhancement ofADH action on amiloride-sensitive Isc in renal epithelial A6cells. Jpn J Physiol 47: 131–137, 1997
6. Niisato N, Van Driessche W, Liu M, Marunaka Y: Involvementof protein tyrosine kinase in osmoregulation of Na� transportand membrane capacitance in renal A6 cells. J Membrane Biol175: 63–77, 2000
7. Niisato N, Marunaka Y: Activation of the Na�-K� pump byhyposmolality through tyrosine kinase-dependent Cl� conduc-tance in Xenopus renal epithelial A6 cells. J Physiol 518: 417–432, 1999
8. Bewick NL, Fernandes C, Pitt AD, Rasmussen HH, WhalleyDW: Mechanisms of Na�-K� pump regulation in cardiac myo-cytes during hyposmolar swelling. Am J Physiol 276: C1091–C1099, 1999
9. Coutry N, Farman N, Bonvalet JP, Blot-Chabaud M: Role of cellvolume variations in Na�-K�-ATPase recruitment and/or acti-vation in cortical collecting duct. Am J Physiol 266: C1342–C1349, 1994
10. Bens M, Vallet V, Cluzeaud F, Pascual-Letallec L, Kahn A,Rafestin-Oblin ME, Rossier BC, Vandewalle A: Corticosteroid-
dependent sodium transport in a novel immortalized mouse col-lecting duct principal cell line. J Am Soc Nephrol 10: 923–934,1999
11. Miquerol L, Cluzeaud F, Porteu A, Alexandre Y, Vandewalle A,Kahn A: Tissue specificity of L-pyruvate kinase transgenes re-sults from combinatorial effects of proximal promoter and distalactivator regions. Gene Expression 5: 315–330, 1996
12. Gonin S, Deschenes G, Roger F, Bens M, Martin PY, CarpentierJL, Vandewalle A, Doucet A, Feraille E: Cyclic AMP increasescell surface expression of functional Na,K-ATPase units in mam-malian cortical collecting duct principal cells. Mol Biol Cell 12:255–264, 2001
13. Summa V, Mordasini D, Roger F, Bens M, Martin PY, Vande-walle A, Verrey F, Feraille E: Short term effect of aldosterone onNa,K-ATPase cell surface expression in kidney collecting ductcells. J Biol Chem 276: 47087–47093, 2001
14. Hasler U, Mordasini D, Bens M, Bianchi M, Cluzeaud F, Rous-selot M, Vandewalle A, Feraille E, Martin PY: Long term reg-ulation of aquaporin-2 expression in vasopressin-responsive re-nal collecting duct principal cells. J Biol Chem 277: 10379–10386, 2002
15. Laemmli UK: Cleavage of structural proteins during the assem-bly of the head of bacteriophage T4. Nature 227: 680–685, 1970
16. Carranza ML, Féraille E, Favre H: Protein kinase C-dependentphosphorylation of Na�,K�-ATPase �-subunit in rat kidneycortical tubules to the plasma membrane of rat proximal convo-luted tubule cells. Am J Physiol Cell Physiol 271: C136–C143,1996
17. Zelenina M, Brismar H: Osmotic water permeability measure-ments using confocal laser scanning microscopy. Eur Biophys J29: 165–171, 2000
18. Fournier I, Barwicz J, Tancrede P: The structuring effects ofamphotericin B on pure and ergosterol- or cholesterol-containingdipalmitoylphosphatidylcholine bilayers: A differential scanningcalorimetry study. Biochim Biophys Acta 1373: 76–86, 1998
19. Vinciguerra M, Deschênes G, Hasler U, Mordasini D, RousselotM, Doucet A, Vandewalle A, Martin PY, Féraille E: IntracellularNa� controls cell surface expression of Na,K-ATPase via acAMP-independent PKA pathway in mammalian kidney collect-ing duct cells. Mol Biol Cell 14: 2677–2688, 2003
20. Rajasekaran SA, Palmer LG, Moon SY, Peralta Soler A, Apo-daca GL, Harper JF, Zheng Y, Rajasekaran AK: Na,K-ATPaseactivity is required for formation of tight junctions, desmosomes,and induction of polarity in epithelial cells. Mol Biol Cell 12:3717–3732, 2001
21. Presley JF, Mayor S, McGraw TE, Dunn KW, Maxfield FR:Bafilomycin A1 treatment retards transferring receptor recyclingmore than bulk membrane recycling. J Biol Chem 272: 13929–13936, 1997
22. Montrose-Rafizadeh C, Guggino WB: Cell volume regulation inthe nephron. Annu Rev Physiol 52: 761–772, 1990
23. Lang F, Busch GL, Ritter M, Volk H, Waldegger S, Gulbins E,Haussinger D: Functional significance of cell volume regulatorymechanisms. Physiol Rev 78: 247–306, 1998
24. Jakab M, Furst J, Gschwentner M, Botta G, Garavaglia ML,Bazzini C, Rodighiero S, Meyer G, Eichmueller S, Woll E,Chwatal S, Ritter M, Paulmichl M: Mechanisms sensing andmodulating signals arising from cell swelling. Cell Physiol Bio-chem 12: 235–258, 2002
25. Sun AM, Saltzberg SN, Kikeri D, Hebert SC: Mechanisms of cellvolume regulation by the mouse medullary thick ascending limbof Henle. Kidney Int 38: 1019–1029, 1990
2546 Journal of the American Society of Nephrology J Am Soc Nephrol 15: 2537–2547, 2004
26. Kirk KL, Schafer JA, Di Bona DR: Cell volume regulation inrabbit proximal straight tubule perfused in vitro. Am J Physiol252: F922–F932, 1987
27. Beck JS, Breton S, Laprade R, Giebisch G: Volume regulationand intracellular calcium in the rabbit proximal convoluted tu-bule. Am J Physiol 260: F861–F867, 1991
28. Skou JC: Nobel Lecture. The identification of the sodium pump.Biosci Rep 18: 155–169, 1998
29. Strange K: Volume regulation following Na� pump inhibition inCCT principal cells: apical K� loss. Am J Physiol 258: F732–F740, 1990
30. Bertorello AM, Komarova Y, Smith K, Leibiger IB, Efendiev R,Pedemonte CH, Borisy G, Sznajder JI: Analysis of Na�,K�-ATPase motion and incorporation into the plasma membrane inresponse to G protein-coupled receptor signals in living cells.Mol Biol Cell 14: 1149–1157, 2003
31. Barlet-Bas C, Khadouri C, Marsy S, Doucet A: Enhanced intra-cellular sodium concentration in kidney cells recruits a latentpool of Na-K-ATPase whose size is modulated by corticoste-roids. J Biol Chem 265: 7799–7803, 1990
32. Francis SH, Corbin JD: Structure and function of cyclic nucle-otide-dependent protein kinases. Annu Rev Physiol 56: 237–272,1994
33. Taylor SS, Buechler JA, Yonemoto W: cAMP-dependent proteinkinase: Framework for a diverse family of regulatory enzymes.Annu Rev Biochem 59: 971–1005, 1990
34. Ferraris JD, Persaud P, Williams CK, Chen Y, Burg M: Activityof the TonEBP/OREBP transactivation domain varies directlywith extracellular NaCl concentration. Proc Natl Acad Sci U S A99: 16800–16805, 2002
35. Zhong H, SuYang H, Erdjument-Bromaage H, Tempst P, GhoshZ: The transcriptional activity of NF-�B is regulated by theI�B-associated PKAc subunit through a cyclic AMP-indepen-dent mechanism. Cell 89: 413–424, 1997
36. Dulin NO, Niu J, Browning DD, Ye RD, Voyno-YasenetskayaT: Cyclic AMP-independent activation of protein kinase A byvasoactive peptides: J Biol Chem 24: 20827–20830, 2001
37. Beguin P, Beggah AT, Chibalin AV, Burgener-Kairuz P, JaisserF, Mathews PM, Rossier BC, Cotecchia S, Geering K: Phosphor-ylation of the Na,K-ATPase alpha-subunit by protein kinase Aand C in vitro and in intact cells. Identification of a novel motiffor PKC-mediated phosphorylation. J Biol Chem 269: 24437–24445, 1994
38. Fisone G, Chieng SXJ, Nairn AC, Czernic AJ, Hemmings HC,Höäg JO, Bertorello AM, Kaiser R, Bergman T, Jörnvall H,Aperia A, Greengard P: Identification of the phosphorylation sitefor cAMP-dependent protein kinase on Na�,K�-ATPase andeffects of site-directed mutagenesis. J Biol Chem 269: 9368–9373, 1994
39. Feschenko MS, Sweadner KJ: Structural basis for species-spe-cific differences in the phosphorylation of Na,K-ATPase byprotein kinase C. J Biol Chem 269: 30436–30444, 1994
J Am Soc Nephrol 15: 2537–2547, 2004 Regulation of Na,K-ATPase by Hypotonicity 2547
Related Documents


![Prevention of doxorubicin-induce renal function abnormalities ......ATPase, Mg2+-ATPase and Na+, K+-ATPase activities [15, 16]. Turmeric is a golden spice derived from the rhizome](https://static.cupdf.com/doc/110x72/61385b7c0ad5d20676493447/prevention-of-doxorubicin-induce-renal-function-abnormalities-atpase-mg2-atpase.jpg)
![V-ATPase · From Wiki: Vacuolar-type H+ -ATPase (V-ATPase) is a highly conserved evolutionarily ancient enzyme with remarkably diverse functions in eukaryotic organisms.[1] membranes](https://static.cupdf.com/doc/110x72/5fa3fb056ad5ca477269e2ce/v-atpase-from-wiki-vacuolar-type-h-atpase-v-atpase-is-a-highly-conserved-evolutionarily.jpg)