1 Extinction risk and conservation of the world's sharks and rays Nicholas K. Dulvy 1* , Sarah L. Fowler 2 , John A. Musick 3 , Rachel D. Cavanagh 4 , Peter M. Kyne 5 , Lucy R. Harrison 1 , John K. Carlson 6 , Lindsay N. K. Davidson 1 , Sonja V. Fordham 7 , Malcolm P. Francis 8 , Caroline M. Pollock 9 , Colin A. Simpfendorfer 10 , George H. Burgess 11 , Kent E. Carpenter 12 , Leonard J. V. Compagno 13 , David A. Ebert 14 , Claudine Gibson 2 , Michelle R. Heupel 15 , Suzanne R. Livingstone 16 , Jonnell C. Sanciangco 12 , John D. Stevens 17 , Sarah Valenti 2 , & William T. White 17 1 IUCN Species Survival Commission Shark Specialist Group and Earth to Ocean Research Group, Department of Biological Sciences, Simon Fraser University, Burnaby, British Colombia V5A 1S6, Canada; 2 IUCN Species Survival Commission Shark Specialist Group, NatureBureau International, 36 Kingfisher Court, Hambridge Road, Newbury RG14 5SJ, UK; 3 Virginia Institute of Marine Science, Greate Road, Gloucester Point, VA 23062, USA; 4 British Antarctic Survey, Natural Environment Research Council, Madingley Road, Cambridge CB3 0ET, UK; 5 Research Institute for the Environment and Livelihoods, Charles Darwin University, Darwin, Northern Territory 0909, Australia; 6 NOAA/National Marine Fisheries Service, Southeast Fisheries Science Center, 3500 Delwood Beach Road, Panama City, FL 32408, USA; 7 Shark Advocates International, The Ocean Foundation, 1990 M Street, NW, Suite 250, Washington, DC 20036, USA; 8 National Institute of Water and Atmospheric Research, Private Bag 14901, Wellington, New Zealand; 9 Species Programme, IUCN, 219c Huntingdon Road, Cambridge CB3 0DL, UK; 10 Centre for Sustainable Tropical Fisheries and Aquaculture and School of Earth and Environmental Sciences, James Cook University, Townsville, Queensland 4811, Australia; 11 Florida Program for Shark Research, Florida Museum of Natural History, University of Florida, Gainesville, FL 32611, USA; 12 Species Programme, IUCN, Species Survival Commission and Conservation International Global Marine Species Assessment, Old Dominion University, Norfolk, VA 23529-0266, USA; 13 Shark Research Center, Iziko – South African Museum, P.O. Box 61, Cape Town 8000, South Africa; 14 Pacific Shark Research Center, Moss Landing Marine Laboratories, Moss Landing, CA 95039, USA; 15 Australian Institute of Marine Science, PMB 3, Townsville, Queensland 4810, Australia; 16 Global Marine Species Assessment, Biodiversity Assessment Unit, IUCN Species Programme, Conservation International, 2011 Crystal

Welcome message from author
This document is posted to help you gain knowledge. Please leave a comment to let me know what you think about it! Share it to your friends and learn new things together.
Transcript
1
Extinction risk and conservation of the
world's sharks and rays
Nicholas K. Dulvy1*, Sarah L. Fowler2, John A. Musick3, Rachel D. Cavanagh4, Peter M.
Kyne5, Lucy R. Harrison1, John K. Carlson6, Lindsay N. K. Davidson1, Sonja V.
Fordham7, Malcolm P. Francis8, Caroline M. Pollock9, Colin A. Simpfendorfer10, George
H. Burgess11, Kent E. Carpenter12, Leonard J. V. Compagno13, David A. Ebert14,
Claudine Gibson2, Michelle R. Heupel15, Suzanne R. Livingstone16, Jonnell C.
Sanciangco12, John D. Stevens17, Sarah Valenti2, & William T. White17
1IUCN Species Survival Commission Shark Specialist Group and Earth to Ocean Research Group, Department of
Biological Sciences, Simon Fraser University, Burnaby, British Colombia V5A 1S6, Canada; 2IUCN Species Survival
Commission Shark Specialist Group, NatureBureau International, 36 Kingfisher Court, Hambridge Road, Newbury
RG14 5SJ, UK; 3Virginia Institute of Marine Science, Greate Road, Gloucester Point, VA 23062, USA; 4British
Antarctic Survey, Natural Environment Research Council, Madingley Road, Cambridge CB3 0ET, UK; 5Research
Institute for the Environment and Livelihoods, Charles Darwin University, Darwin, Northern Territory 0909, Australia;
6NOAA/National Marine Fisheries Service, Southeast Fisheries Science Center, 3500 Delwood Beach Road, Panama
City, FL 32408, USA; 7Shark Advocates International, The Ocean Foundation, 1990 M Street, NW, Suite 250,
Washington, DC 20036, USA; 8National Institute of Water and Atmospheric Research, Private Bag 14901,
Wellington, New Zealand; 9Species Programme, IUCN, 219c Huntingdon Road, Cambridge CB3 0DL, UK; 10Centre
for Sustainable Tropical Fisheries and Aquaculture and School of Earth and Environmental Sciences, James Cook
University, Townsville, Queensland 4811, Australia; 11Florida Program for Shark Research, Florida Museum of
Natural History, University of Florida, Gainesville, FL 32611, USA; 12Species Programme, IUCN, Species Survival
Commission and Conservation International Global Marine Species Assessment, Old Dominion University, Norfolk,
VA 23529-0266, USA; 13Shark Research Center, Iziko – South African Museum, P.O. Box 61, Cape Town 8000,
South Africa; 14Pacific Shark Research Center, Moss Landing Marine Laboratories, Moss Landing, CA 95039, USA;
15Australian Institute of Marine Science, PMB 3, Townsville, Queensland 4810, Australia; 16Global Marine Species
Assessment, Biodiversity Assessment Unit, IUCN Species Programme, Conservation International, 2011 Crystal

2
Drive, Suite 500, Arlington, VA 22202, USA; 17CSIRO Marine and Atmospheric Research, GPO Box 1538, Hobart,
Tasmania 7001, Australia.
*For correspondence:
Abstract The rapid expansion of human activities threatens ocean-wide biodiversity loss.
Numerous marine animal populations have declined, yet it remains unclear whether these trends
are symptomatic of a chronic accumulation of global marine extinction risk. We present the first
systematic analysis of threat for a globally-distributed lineage of 1,041 chondrichthyan fishes –
sharks, rays, and chimaeras. We estimate that one-quarter are threatened according to IUCN Red
List criteria due to overfishing (targeted and incidental). Large-bodied, shallow-water species are
at greatest risk and five out of the seven most threatened families are rays. Overall
chondrichthyan extinction risk is substantially higher than for most other vertebrates, and only
one-third of species are considered safe. Population depletion has occurred throughout the
world’s ice-free waters, but is particularly prevalent in the Indo-Pacific Biodiversity Triangle and
Mediterranean Sea. Improved management of fisheries and trade is urgently needed to avoid
extinctions and promote population recovery.
Impact Statement One-quarter of the world’s sharks, rays, and chimaeras, particularly
large-bodied species found in shallow depths that are most accessible to fisheries, have an
elevated risk of extinction, according to IUCN Red List criteria.

3
Introduction Species and populations are the building blocks of the communities and
ecosystems that sustain humanity through a wide range of services (Díaz et al., 2006, Mace et
al., 2005). There is increasing evidence that human impacts over the past ten millennia have
profoundly and permanently altered biodiversity on land, especially of vertebrates (Hoffmann et
al., 2010, Schipper et al., 2008). The oceans encompass some of the earth’s largest habitats
and longest evolutionary history, but there is mounting concern for the increasing human
influence on marine biodiversity that has occurred over the past 500 years (Jackson, 2010). So
far our knowledge of ocean biodiversity change is derived mainly from retrospective analyses
usually limited to biased subsamples of diversity, such as: charismatic species, commercially-
important fisheries, and coral reef ecosystems (Carpenter et al., 2008, Collette et al., 2011,
McClenachan et al., 2012, Ricard et al., 2012). Notwithstanding the limitations of these biased
snapshots, the rapid expansion of fisheries and globalised trade are emerging as the principal
drivers of coastal and ocean threat (Anderson et al., 2011b, McClenachan et al., 2012, Polidoro
et al., 2008). The extent and degree of the global impact of fisheries upon marine biodiversity,
however, remains poorly understood and highly contentious. Recent insights from ecosystem
models and fisheries stock assessments of mainly data-rich northern hemisphere seas, suggest
that the status of a few of the best-studied exploited species and ecosystems may be improving
(Worm et al., 2009). However, this view is based on only 295 populations of 147 fish species
and hence is far from representative of the majority of the world’s fisheries and fished species,
especially in the tropics for which there are few data and often less management (Branch et al.,
2011, Costello et al., 2012, Newton et al., 2007, Ricard et al., 2012, Sadovy, 2005).
Overfishing and habitat degradation have profoundly altered populations of marine
animals (Hutchings, 2000, Lotze et al., 2006, Polidoro et al., 2012), especially sharks and rays
(Dudley and Simpfendorfer, 2006, Ferretti et al., 2010, Simpfendorfer et al., 2002, Stevens et
4
al., 2000). It is not clear, however, whether the population declines of globally distributed
species are locally reversible or symptomatic of an erosion of resilience and chronic
accumulation of global marine extinction risk (Jackson, 2010, Neubauer et al., 2013). In
response, we evaluate the scale and intensity of overfishing through a global systematic
evaluation of the relative extinction risk for an entire lineage of exploited marine fishes – sharks,
rays, and chimaeras (class Chondrichthyes) – using the Red List Categories and Criteria of the
International Union for the Conservation of Nature (IUCN). We go on to identify, (i) the life
history and ecological attributes of species (and taxonomic families) that render them prone to
extinction, and (ii) the geographic locations with the greatest number of species of high
conservation concern.
Chondrichthyans make up one of the oldest and most ecologically diverse vertebrate
lineages: they arose at least 420 million years ago and rapidly radiated out to occupy the upper
tiers of aquatic food webs (Compagno, 1990, Kriwet et al., 2008). Today, this group is one of the
most speciose lineages of predators on earth that play important functional roles in the top-
down control of coastal and oceanic ecosystem structure and function (Ferretti et al., 2010,
Heithaus et al., 2012, Stevens et al., 2000). Sharks and their relatives include some of the latest
maturing and slowest-reproducing of all vertebrates, exhibiting the longest gestation periods and
some of the highest levels of maternal investment in the animal kingdom (Cortés, 2000). The
extreme life histories of many chondrichthyans result in very low population growth rates and
weak density-dependent compensation in juvenile survival, rendering them intrinsically sensitive
to elevated fishing mortality (Cortés, 2002, Dulvy and Forrest, 2010, García et al., 2008, Musick,
1999b).
Chondrichthyans are often caught as incidental, but often retained and valuable, bycatch
of fisheries that focus on more productive teleost fish species, such as tunas or groundfishes
(Stevens et al., 2005). In many cases, fishing pressure on chondrichthyans is increasing as
teleost target species become less accessible (due to depletion or management restrictions)

5
and because of the high, and in some cases rising, value of their meat, fins, livers, and / or gill
rakers (Clarke et al., 2006, Fowler et al., 2002, Lack and Sant, 2009). Fins, in particular, have
become one of the most valuable seafood commodities: it is estimated that the fins of between
26 and 73 million individuals, worth US$400-550 million, are traded each year (Clarke et al.,
2007). The landings of sharks and rays, reported to the Food and Agriculture Organization of
the United Nations (FAO), increased steadily to a peak in 2003 and have declined by 20% since
(Figure 1A). True total catch, however, is likely to be 3-4 times greater than reported (Clarke et
al., 2006, Worm et al., 2013). Most chondrichthyan catches are unregulated and often
misidentified, unrecorded, aggregated or discarded at sea, resulting in a lack of species-specific
landings information (Barker and Schluessel, 2005, Bornatowski et al., 2013, Clarke et al., 2006,
Iglésias et al., 2010). Consequently, FAO could only be “hopeful” that the catch decline is due to
improved management rather than being symptomatic of worldwide overfishing (FAO, 2010).
The reported chondrichthyan catch has been increasingly dominated by rays, which have made
up greater than half of reported taxonomically-differentiated landings for the past four decades
(Figure 1B). Chondrichthyan landings were worth US$1 billion at the peak catch in 2003, since
then the value has dropped to US$800 million as catch has declined (Musick and Musick,
2011). A main driver of shark fishing is the globalized trade to meet Asian demand for shark fin
soup, a traditional and usually expensive Chinese dish. This particularly lucrative trade in fins
(not only from sharks, but also of shark-like rays such as wedgefishes and sawfishes) remains
largely unregulated across the 86 countries and territories that exported >9,500 mt of fins to
Hong Kong (a major fin trade hub) in 2010 (Figure 1C).
Results
Red List status of chondrichthyan species
6
Overall, we estimate that one-quarter of chondrichthyans are threatened worldwide, based on
the observed threat level of assessed species combined with a modelled estimate of the
number of Data Deficient species that are likely to be threatened. Of the 1,041 known species,
181 (17.4%) are classified as threatened: 25 (2.4%) are assessed as Critically Endangered
(CR), 43 (4.1%) Endangered (EN), and 113 (10.9%) Vulnerable (VU) (Table 1). A further 132
species (12.7%) are categorized as Near Threatened (NT). Chondrichthyans have the lowest
percentage (23.2%, n=241 species) of Least Concern (LC) species of all vertebrate groups,
including the marine taxa assessed to date (Hoffmann et al., 2010). Almost half (46.8%, n=487)
are Data Deficient (DD) meaning that information is insufficient to reliably assess their status
(Table 1). DD chondrichthyans are found across all habitats, but particularly on continental
shelves (38.4% of 482 species in the habitat) and deepwater slopes (57.6%, Table 2). Of the
487 DD species for which we had sufficient maximum body size (n=396) and geographic
distribution data (n=378), we were able to predict that at least a further 68 DD species are likely
to be threatened (Table 3, Supplementary file 1). Accounting for the uncertainty in threat levels
due to the number of DD species, we estimate that more than half face some elevated risk: at
least one-quarter of (n=249; 24%) chondrichthyans are threatened and well over one-quarter
are Near Threatened (Table 1). Only 37% are predicted to be Least Concern (Table 1).
Drivers of threat. The main threats to chondrichthyans are overexploitation through targeted
fisheries and incidental catches (bycatch), followed by habitat loss, persecution, and climate
change. While one-third of threatened sharks and rays are subject to targeted fishing, some of
the most threatened species (including sawfishes and large-bodied skates) have declined due
to incidental capture in fisheries targeting other species. Rays, especially sawfishes,
wedgefishes and guitarfishes, have some of the most valuable fins and are highly threatened.
Although the global fin trade is widely recognized as a major driver of shark and ray mortality,
demand for meat, liver oil, and even gillrakers (of manta and other devil rays) also poses

7
substantial threats. Half of the 69 high-volume or high-value sharks and rays in the global fin
trade are threatened (53.6%, n=37), while low-value fins often enter trade as well, even if meat
demand is the main fishery driver (Supplementary file 2A). Coastal species are more exposed
to the combined threats of fishing and habitat degradation than those offshore in pelagic and
deepwater ecosystems. In coastal, estuarine, and riverine habitats, four principal processes of
habitat degradation (residential and commercial development, mangrove destruction, river
engineering, and pollution) jeopardize nearly one-third of threatened sharks and rays (29.8%,
n=54 of 181, Supplementary file 2B). The combined effects of overexploitation and habitat
degradation are most acute in freshwater, where over one-third (36.0%) of the 90 obligate and
euryhaline freshwater chondrichthyans are threatened. Their plight is exacerbated by high
habitat-specificity and restricted geographic ranges (Stevens et al., 2005). Specifically, the
degradation of coastal, estuarine and riverine habitats threatened 14% of sharks and rays:
through residential and commercial development (22 species, including River sharks Glyphis
spp.); mangrove destruction for shrimp farming in Southeast Asia (4 species, including Bleeker's
variegated stingray Himantura undulata); dam construction and water control (8 species,
including Mekong freshwater stingray Dasyatis laosensis) and pollution (20 species). Many
freshwater sharks and rays suffer multiple threats and have narrow geographic distributions, for
example the Endangered Roughnose stingray Pastinachus solocirostris which is found only in
Malaysian Borneo and Indonesia (Kalimantan, Sumatra and Java). Population control of sharks,
in particular due to their perceived risk to people, fishing gear, and other fisheries has
contributed to the threatened status of at least 12 species (Supplementary file 2B). Sharks and
rays are also threatened due to capture in shark control nets (e.g. Dusky shark Carcharhinus
obscurus), and persecution to minimise: damage to fishing nets (e.g. Green sawfish Pristis
zijsron); their predation on aquacultured molluscs (e.g. Estuary stingray Dasyatis fluviorum);
interference with spearfishing activity (e.g. Grey nurse shark Carcharias taurus), and the risk of
shark attack (e.g. White shark Carcharodon carcharias). So far the threatened status of only
8
one species has been linked to climate change (New Caledonia catshark Aulohalaelurus
kanakorum; Supplementary file 2B). While the climate-sensitivity of some sharks has been
recognized (Chin et al., 2010), the status of shark and ray species will change rapidly in climate
cul-de-sacs, such as the Mediterranean Sea (Lasram et al., 2010).
Correlates and predictors of threat. Elevated extinction risk in sharks and rays is a function of
exposure to fishing mortality coupled with their intrinsic life history and ecological sensitivity
(Figures 2-6). Most threatened chondrichthyan species are found in depths of less than 200 m,
especially in the Atlantic and Indian Oceans, and the Western Central Pacific Ocean (79.6%,
n=144 of 181, Figure 2). Extinction risk is greater in larger-bodied species found in shallower
waters with narrower depth distributions, after accounting for phylogenetic non-independence
(Figure 3 and 4). The traits with the greatest relative importance (>0.99) are maximum body
size, minimum depth and depth range. In comparison, geographic range (measured as Extent of
Occurrence) has a much lower relative importance (0.74, Table 4), and in the predictive models
it improved the variance explained by 2% and the prediction accuracy by 1% (Table 3). The
probability that a species is threatened increases by 1.2% for each 10 cm increase in maximum
body length, and decreases by 10.3% for each 50 m deepening in the minimum depth limit of
species. After accounting for maximum body size and minimum depth, species with narrower
depth ranges have a 1.2 % greater threat risk per 100 m narrowing of depth range. There is no
significant interaction between depth range and minimum depth limit. Geographic range,
measured as the Extent of Occurrence, varies over six orders of magnitude, between 354 km2
and 278 million km2 and is positively correlated with body size (Spearman’s = 0.58), and
hence is only marginally positively related to extinction risk over and above the effect of body
size. Accounting for the body size and depth effects, the threat risk increases by only 0.5% for
each 1,000,000 km2 increase in geographic range (Table 4). The explanatory and predictive
power of our life history and geographic distribution models increased with complexity, though

9
geographic range size contributed relatively little additional explanatory power and a high
degree of uncertainty in the parameter estimate (Table 3, 4). The maximum variance explained
was 69% (Table 4) and the predictive models (without controlling for phylogeny) explained 30%
of the variance and prediction accuracy was 77% (Table 3).
By habitat, one quarter of coastal and continental shelf chondrichthyans (26.3%, n=127
of 482) and almost half of neritic and epipelagic species (43.6%, n=17 of 39) are threatened.
Coastal and continental shelf and pelagic species greater than 1 m total length have a more
than 50% chance of being threatened, compared to ~12% risk for a similar-sized deepwater
species (Figure 5). While deepwater chondrichthyans, due to their slow growth and lower
productivity, are intrinsically more sensitive to overfishing than their shallow-water relatives
(García et al., 2008, Simpfendorfer and Kyne, 2009) for a given body size they are less
threatened - largely because they are inaccessible to most fisheries (Figure 5).
As a result of their high exposure to coastal shallow-water fisheries and their large body
size, sawfishes (Pristidae) are the most threatened chondrichthyan family and arguably the
most threatened family of marine fishes (Figure 6). Other highly threatened families include
predominantly coastal and continental shelf-dwelling rays (wedgefishes, numbfishes, stingrays,
and guitarfishes), as well as angel sharks and thresher sharks; five of the seven most
threatened families are rays. Least threatened families are comprised of relatively small-bodied
species occurring in mesopelagic and deepwater habitats (lanternsharks, catsharks, softnose
skates, shortnose chimaeras, and kitefin sharks, Figure 6).
Geographic hotspots of threat and conservation priority by habitat. Local species richness
is greatest in tropical coastal seas, particularly along the Atlantic and Western Pacific shelves
(Figure 7A). The greatest uncertainty, where the number of DD species is highest, is centered
on four areas: (1) Caribbean Sea and Western Central Atlantic Ocean, (2) Eastern Central
Atlantic Ocean, (3) Southwest Indian Ocean, and (4) the China Seas (Figure 7B). The

10
megadiverse China Seas face the triple jeopardy of high threat in shallow waters (Figure 7CD),
high species richness (Figure 7A), and a large number of threatened endemic species (Figure
9), combined with high risk due to high uncertainty in status (large number of DD species,
Figure 7B). Whereas the distribution of threat in coastal and continental shelf chondrichthyans
is similar to the overall threat pattern across tropical and mid-latitudes, the spatial pattern of
threat varies considerably for pelagic and deepwater species. Threatened neritic and epipelagic
oceanic sharks are distributed throughout the world’s oceans, but there are also at least seven
threat hotspots in coastal waters: (1) Gulf of California, (2) southeast U.S. continental shelf, (3)
Patagonian Shelf, (4) West Africa and the western Mediterranean Sea, (5) southeast South
Africa, (6) Australia, and (7) the China Seas (Figure 7D). Hotspots of deepwater threatened
chondrichthyans occur in three areas where fisheries penetrate deepest: (1) Southwest Atlantic
(southeast coast of South America), (2) Eastern Atlantic Ocean, spanning from Norway to
Namibia and into the Mediterranean Sea, and (3) southeast Australia (Figure 7E).
Hottest hotspots of threat and priority. Spatial conservation priority can be assigned using
three criteria: (1) the greatest number of threatened species (Figure 7A), (2) greater than
expected threat (residuals of the relationship between total number of species and total number
of threatened species per cell, Figure 8), and (3) high irreplaceability - high numbers of
threatened endemic species (Figure 9). Most threatened marine chondrichthyans (n=135 of
169) are distributed within, and are often endemic to (n=73), at least seven distinct threat
hotspots (e.g. for neritic and pelagic species Figure 7D). With the notable exception of the U.S.
and Australia, threat hotspots occur in the waters of the most intensive shark and ray fishing
and fin-trading nations (Figure 1C). Accordingly these regions should be afforded high scientific
and conservation priority (Table 5).
11
The greatest number of threatened species coincides with the greatest richness (Figure 7A
versus 7C-E); by controlling for species richness we can reveal the magnitude of threat in the
pelagic ocean and two coastal hotspots that have a greater than expected level of threat: the
Indo-Pacific Biodiversity Triangle and the Red Sea. Throughout much of the pelagic ocean,
threat is greater than expected based on species richness alone, species richness is low (n=30)
and a high percentage (86%) are threatened (n=16) or Near Threatened (n=10). Only four are of
Least Concern (Salmon shark Lamna ditropis, Goblin shark Mitsukurina owstoni, Longnose
pygmy Shark Heteroscymnoides marleyi, and Largetooth cookiecutter shark Isistius plutodus)
(Figure 8). The Indo-Pacific Biodiversity Triangle, particularly the Gulf of Thailand, and the
islands of Sumatra, Java, Borneo, and Sulawesi, is a hotspot of greatest residual threat
especially for coastal sharks and rays with 76 threatened species (Figure 8). Indeed, the Gulf of
Thailand large marine ecosystem has the highest threat density with 48 threatened
chondrichthyans in an area of 0.36 million km2. The Red Sea residual threat hotspot has 29
threatened pelagic and coastal species (Figure 8). There are 15 irreplaceable marine hotspots
that harbor all 66 threatened endemic species (Figure 9, Supplementary file 2C).
Discussion
In a world of limited funding, conservation priorities are often based on immediacy of extinction,
the value of biodiversity and conservation opportunity (Marris, 2007). Here we provide the first
estimates of the threat status and hence risk of extinction of chondrichthyans. Our systematic
global assessment of the status of this lineage that includes many iconic predators reveals a
risky combination of high threat (17% observed and 23.9% estimated), low safety (Least
Concern, 23% observed and >37% estimated), and high uncertainty in their threat status (Data
Deficient, 46% observed and 8.7% estimated). Over half of species are predicted to be
threatened or Near Threatened (n=561, 53.9%, Table 1). While no species has been driven to

12
global extinction - as far as we know - at least 28 populations of sawfishes, skates and angel
sharks are locally or regionally extinct (Dulvy et al., 2003, Dulvy and Forrest, 2010). Several
shark species have not been seen for many decades. The Critically Endangered Pondicherry
shark (Carcharhinus hemiodon) is known only from 20 museum specimens that were captured
in the heavily-fished inshore waters of Southeast Asia: it has not been seen since 1979
(Cavanagh et al., 2003). The now ironically-named and Critically Endangered Common skate
(Dipturus batis) and Common angel shark (Squatina squatina) are regionally extinct from much
of their former geographic range in European waters (Cavanagh and Gibson, 2007, Gibson et
al., 2008, Iglésias et al., 2010). The Largetooth sawfish (Pristis pristis) and Smalltooth sawfish
(Pristis pectinata) are possibly extinct throughout much of the Eastern Atlantic, particularly in
West Africa (Harrison and Dulvy, 2014, Robillard and Séret, 2006).
Our analysis provides an unprecedented understanding of how many chondrichthyan
species are actually or likely to be threatened. A very high percentage of species are DD (46%,
487 species) which is one of the highest rates of Data Deficiency of any taxon to date
(Hoffmann et al., 2010). This high level of uncertainty in status further elevates risk and presents
a key challenge for future assessment efforts. We outline a first step through our estimation that
68 DD species are likely to be threatened based on their life histories and distribution.
Numerous studies have retrospectively explained extinction risk, but few have made a priori
predictions of risk (Davidson et al., 2012, Dulvy and Reynolds, 2002). Across many taxa,
extinction risk has been shown to be a function of an extrinsic driver or threat (Davies et al.,
2006, Jennings et al., 1998) and the corresponding life history and ecological traits: large body
size (low intrinsic rate of population increase, high trophic level), small geographic range size,
and ecological specialization. Maximum body size is an essential predictor of threat status, we
presume because of the close relationship between body size and the intrinsic rate of
population increase in sharks and rays (Frisk et al., 2001, Hutchings et al., 2012, Smith et al.,
1998). Though we note that this proximate link may be mediated ultimately through the time-

13
related traits of growth and mortality (Barnett et al., 2013, Juan-Jordá et al., 2013). Our novel
contribution is to show that depth-related geographic traits are more important for explaining risk
than geographic range per se. The shallowness of species (minimum depth limit) and the
narrowness of their depth range are important risk factors (Figure 3). We hypothesize that this
is so because shallower species are more accessible to fishing gears and those with narrower
depth ranges have lower likelihood that a proportion of the species distribution remains beyond
fishing activity. For example, the Endangered barndoor skate (Dipturus laevis) was eliminated
throughout much of its geographic range and depth distribution due to bycatch in trawl fisheries,
yet may have rebounded because a, previously unknown, deepwater population component lay
beyond the reach of most fisheries (COSEWIC, 2010, Dulvy, 2000, Kulka et al., 2002). We find
that geographic range (measured as Extent of Occurrence), is largely unrelated to extinction
risk. This is in marked contrast to extinction risk patterns on land (Anderson et al., 2011a,
Cardillo et al., 2005, Jones et al., 2003) and in the marine fossil record (Harnik et al., 2012a,
2012b) where small geographic range size is the principal correlate of extinction risk. We
suggest that this is because fishing activity is now widespread throughout the world’s oceans
(Swartz et al., 2010), and even species with the largest ranges are exposed and often entirely
encompassed by the footprint of fishing activity. By contrast, with a few exceptions (mainly
eastern Atlantic slopes; Figure 7E), fishing has a narrow depth penetration and hence species
found at greater depths can still find refuge from exploitation (Lam and Sadovy de Mitcheson,
2010, Morato et al., 2006).
The status of chondrichthyans is arguably among the worst reported for any major
vertebrate lineage considered thus far, apart from amphibians (Hoffmann et al., 2010, Stuart et
al., 2004). The percentage and absolute number of threatened amphibians is high (>30% are
threatened), but a greater percentage are Least Concern (38%), and uncertainty of status is
lower (32% DD) than for chondrichthyans. Our discovery of the high level of threat in freshwater
14
chondrichthyans (36%) is consistent with the emerging picture of the intense and unmanaged
extinction risk faced by many freshwater and estuarine species (Darwall et al., 2011).
Our threat estimate is comparable to other marine biodiversity status assessments, but
our findings caution that “global” fisheries assessments may be underestimating risk. The IUCN
Global Marine Species Assessment is not yet complete, but reveals varying threat levels among
taxa and regions (Polidoro et al., 2008, 2012). The only synoptic summary to-date focused on
charismatic Indo-Pacific coral reef ecosystem species. Of the 1,568 IUCN-assessed marine
species, 16% (range: 12–34% among families) were threatened (McClenachan et al., 2012).
This is a conservative estimate of marine threat level because although they may be more
intrinsically sensitive to extinction drivers, charismatic species are more likely to garner
awareness of their status and support for monitoring and conservation (McClenachan et al.,
2012). The predicted level of chondrichthyan threat (>24%) is distinctly greater than that
provided by global fisheries risk assessments. These studies provide modeled estimates of the
percentage of collapsed bony fish (teleost) stocks in both data-poor unassessed fisheries (18%,
Costello et al., 2012), and data-rich fisheries (7-13%, Branch et al., 2011). This could be
because teleosts are generally more resilient than elasmobranchs (Hutchings et al., 2012), but
in addition may caution that analyses of biased geographic and taxonomic samples may be
underestimating risk of collapse in global fisheries, particularly for species with less-resilient life
histories.
Our work relies on the consensus assessment of the expert opinion of more than 300
scientists. However, given the uncertainty in some of the underlying data that inform our
understanding of threat status, such as fisheries catch landings data, it is worth considering
whether these uncertainties mean our assessments are downplaying the true risk. While there
are methods of propagating uncertainty through the IUCN Red List Assessments (Akcakaya et
al., 2000) in our experience this approach was uninformative for even the best-studied species,
because it generated confidence intervals that spanned all IUCN Categories. Instead it is worth
15
considering whether our estimates of threat are consistent with independent quantitative
estimates of status. The Mediterranean Red List Assessment workshop in 2005 prompted
subsequent quantitative analyses of catch landings, research trawl surveys, and sightings data.
Quantitative trends could be estimated for five species suggesting they had declined by 96 to
>99.9% relative to their former abundance suggesting they would meet the highest IUCN Threat
category of Critically Endangered (Ferretti et al., 2008). By comparison the earlier IUCN regional
assessment for these species, while suggesting they were all threatened was more
conservative for 2 of the 5 species: Hammerhead sharks (Sphyrna spp.) - Critically Endangered,
Porbeagle shark (Lamna nasus) - Critically Endangered, shortfin mako (Isurus oxyrinchus) -
Critically Endangered, Blue shark (Prionace glauca) - Vulnerable, and thresher shark (Alopias
vulpinus) – Vulnerable.
We can also make a complementary comparison to a recent analysis of the status of
112 shark and ray fisheries (Costello et al., 2012). The median biomass relative to the biomass
at Maximum Sustainable Yield (B/BMSY) of these 112 sharks and ray fisheries was 0.37, making
them the most overfished groups of any of the world’s unassessed fisheries. Assuming BMSY
occurs at 0.3 to 0.5 of unexploited biomass then the median biomass of shark and ray fisheries
has declined by between 81 to 89% by 2009. These biomass declines would be sufficient to
qualify all of these 117 shark and ray fisheries for the Endangered IUCN category if they
occurred within a three-generation time span. By comparison our results are considerably more
conservative. Empirical analyses show that an IUCN threatened category listing is triggered only
once teleost fishes (with far higher density-dependent compensation) have been fished down to
below BMSY (Dulvy et al., 2005, Porszt et al., 2012). Hence, our findings are consistent with only
around one quarter of chondrichthyan species having been fished down below the BMSY target
reference point. While there may be concern that expert assessments may overstate declines
and threat, it is more likely that our conservative consensus-based approach has understated
declines and risk in sharks and rays.
16
For marine species, predicting absolute risk of extinction remains highly uncertain
because even with adequate evidence of severe decline, in many instances the absolute
population size remains large (Mace, 2004). There remains considerable uncertainty as to the
relationship between census and effective population size (Reynolds et al., 2005). Therefore,
Red List categorization of chondrichthyans should be interpreted as a comparative measure of
relative extinction risk, in recognition that unmanaged steep declines, even of large populations,
may ultimately lead to ecosystem perturbations and eventually biological extinction. The Red
List serves to raise red flags calling for conservation action, sooner rather than later, while there
is a still chance of recovery and of forestalling permanent biodiversity loss.
Despite more than two decades of rising awareness of chondrichthyan population
declines and collapses, there is still no global mechanism to ensure financing, implementation
and enforcement of chondrichthyan fishery management plans that is likely to rebuild
populations to levels where they would no longer be threatened (Lack and Sant, 2009, Techera
and Klein, 2011). This management shortfall is particularly problematic given the large
geographic range of many species. Threat increased only slightly when geographic range is
measured as the Extent of Occurrence; however, geographic range becomes increasingly
important when it is measured as the number of countries (legal jurisdictions) spanned by each
species. The proportion of species that are threatened increases markedly with geographic size
measured by number of Exclusive Economic Zones (EEZs) spanned; one-quarter of threatened
species span the EEZs of 18 or more countries (Figure 10). Hence, their large geographic
ranges do not confer safety, but instead exacerbates risk because sharks and rays require
coherent, effective international management.
With a few exceptions (e.g. Australia and USA), many governments still lack the
resources, expertise and political will necessary to effectively conserve the vast majority of
shark and rays, and indeed many other exploited organisms (Veitch et al., 2012). More than 50

17
sharks are included in Annex I (Highly Migratory Species) of the 1982 Law of the Sea
Convention, implemented on the high seas under the 1992 Fish Stocks Agreement, but
currently only a handful enjoy species-specific protections under the world’s Regional Fishery
Management Organizations (Table 6), and many of these have yet to be implemented
domestically. The Migratory Sharks Memorandum of Understanding (MoU) adopted by the
Parties to the Convention on Migratory Species (CMS) so far only covers seven sharks, yet
there may be more than 150 chondrichthyans that regularly migrate across national boundaries
(Fowler, 2012). To date, only one of the United Nations Environment Programme’s Regional
Seas Conventions, the Barcelona Convention for the Conservation of the Mediterranean Sea,
includes chondrichthyan fishes and only a few of its Parties have taken concrete domestic
action to implement these listings. Despite two decades of effort, only ten sharks and rays had
been listed by the Convention on International Trade in Endangered Species up to 2013
(Vincent et al., 2013). A further seven species of shark and ray were listed by CITES in 2013 –
the next challenge is to ensure effective implementation of these trade regulations (Mundy-
Taylor and Crook, 2013). Many chondrichthyans qualify for listing under CITES, CMS, and
various regional seas conventions, and should be formally considered for such action as a
complement RFMOs (Table 6).
Bans on “finning” (slicing off a shark’s fins and discarding the body at sea) are the most
widespread shark conservation measures. While these prohibitions, particularly those that
require fins to remain attached through landing, can enhance monitoring, and compliance they
have not significantly reduced shark mortality or risk to threatened species (Clarke et al., 2013).
Steep declines and the high threat levels in migratory oceanic pelagic sharks suggest raising
the priority of improved management of catch and trade through concerted actions by national
governments working through RFMOs as well as CITES, and CMS (Table 7).
A high proportion of catch landings come from nations with a large number of threatened
chondrichthyans and less-than-comprehensive chondrichthyan fishery management plans.
18
Future research is required to down-scale these global Red List assessments and analyses to
provide country-by-country diagnoses of the link between specific fisheries and specific threats
to populations of more broadly distributed species (Wallace et al., 2010). Such information could
be used to focus fisheries management and conservation interventions that are tailored to
specific problems. There is no systematic global monitoring of shark and ray populations and
the national fisheries catch landings statistics provide invaluable data for tracking fisheries
trends in unmanaged fisheries (Newton et al., 2007, Worm et al., 2013). However, the
surveillance power of such data could be greatly improved if collected at greater taxonomic
resolution. While there have been continual improvements, catches are under-reported (Clarke
et al., 2006), and for those that are reported only around one-third is reported at the species
level (Fischer et al., 2012). To complement improved catch landings data we recommend
repeating regional assessments of the Red List Status of chondrichthyans to provide an early
warning of adverse changes in status and to detect and monitor the success of management
initiatives and interventions. Aggregate Red List Threat indices for chondrichthyans, like those
available for mammals, birds, amphibians and hard corals (Carpenter et al., 2008) would
provide one of the few global scale indicators of progress toward international biodiversity goals
(Butchart et al., 2010, Walpole et al., 2009).
Our global status assessment of sharks and rays reveals the principal causes and
severity of global marine biodiversity loss and the threat level they face exposes a serious
shortfall in the conservation management of commercially-exploited aquatic species
(McClenachan et al., 2012). Chondrichthyans have slipped through the jurisdictional cracks of
traditional national and international management authorities. Rather than accept that many
chondrichthyans will inevitably be driven to economic, ecological or biological extinction, we
warn that dramatic changes in the enforcement and implementation of the conservation and
management of threatened chondrichthyans are urgently needed to ensure a healthy future for
these iconic fishes and the ecosystems they support.
19
Methods
IUCN Red List Assessment process and data collection.
We applied the Red List Categories and Criteria developed by the International Union for
Conservation of Nature (IUCN) (IUCN, 2004) to 1,041 species at 17 workshops involving more
than 300 experts who incorporated all available information on distribution, catch, abundance,
population trends, habitat use, life histories, threats, and conservation measures.
Some 105 chondrichthyan fish species had been assessed and published in the 2000
Red List of Threatened Species prior to the initiation of the Global Shark Red List Assessment
(GSRLA). These assessments were undertaken by correspondence and through discussions at
four workshops (1996 - London, UK, and Brisbane, Australia; 1997 - Noumea, New Caledonia,
and 1999 - Pennsylvania, USA). These assessments applied earlier versions of the IUCN Red
List Criteria and where possible were subsequently reviewed and updated according to version
3.1 Categories and Criteria during the GSRLA. The IUCN Shark Specialist Group (SSG)
subsequently held a series of 13 regional and thematic Red List workshops in nine countries
around the world (Table 7). Prior to the workshops, each participant was asked to select
species for assessment based on their expertise and research areas. Where possible, experts
carried out research and preparatory work in advance, thus enabling more synthesis to be
achieved during each workshop. SSG Red List-trained personnel facilitated discussion and
consensus sessions, and coordinated the production of global Red List assessments for species
in each region. For species that had previously been assessed, participants provided updated
information and assisted in revised assessments. Experts completed assessments for some
wide-ranging, globally distributed species over the course of several workshops. In total, 302
national, regional and international experts from 64 countries participated in the GSRLA
workshops and the production of assessments. All Red List assessments were based on the

20
collective knowledge and pooled data from dedicated experts across the world, ensuring global
consultation and consensus to achieve the best assessment for each species with the
knowledge and resources available (see Acknowledgements). Any species assessments not
completed during the workshops were finalized through subsequent correspondence among
experts.
The SSG evaluated the status of all described chondrichthyan species that are
considered to be taxonomically valid up to August 2011 (see below). Experts compiled peer-
reviewed Red List documentation for each species, including data on: systematics, population
trends, geographic range, habitat preferences, ecology, life-history, threats, and conservation
measures. The SSG assessed all species using the IUCN Red List Categories and Criteria
version 3.1 (IUCN, 2001). The categories and their standard abbreviations are: Critically
Endangered (CR), Endangered (EN), Vulnerable (VU), Near Threatened (NT), Least Concern
(LC) and Data Deficient (DD). Experts further coded each species according to the IUCN
Habitats, Threats and Conservation Actions Authority Files, enabling analysis of their habitat
preferences, major threats and conservation action requirements. SSG Program staff entered all
data into the main data fields in the IUCN Species Information Service Data Entry Module (SIS
DEM) and subsequently transferred these data into the IUCN Species Information Service (SIS)
in 2009.
Systematics, missing species and species coverage. The SSG collated data on order, family,
genus, species, taxonomic authority, commonly-used synonyms, English common names, other
common names, and taxonomic notes (where relevant). For taxonomic consistency throughout
the species assessments, the SSG followed Leonard J. V. Compagno’s 2005 Global Checklist
of Living Chondrichthyan Fishes (Compagno, 2005), only deviating from this where there was
21
extensive opposing consensus with a clear and justifiable alternative as adjudicated by the
IUCN SSG’s Vice Chairs of Taxonomy, David E. Ebert and William T. White.
Keeping pace with the total number of chondrichthyans is a challenging task especially
given the need to balance immediacy with taxonomic stability. One third of all species have
been described in the past thirty years. Scientists have described a new chondrichthyan
species, on average, almost every two to three weeks since the 1970s (Last, 2007, White and
Last, 2012). Since Leonard V. J. Compagno completed the global checklist in 2005, scientists
have recognized an additional ~140 species (mostly new) living chondrichthyan species. This
increase in the rate of chondrichthyan descriptions in recent years is primarily associated with
the lead up to the publication of a revised treatment of the entire chondrichthyan fauna of
Australia (Last and Stevens, 2009), requiring formal descriptions of previously undescribed taxa.
In particular, three CSIRO special publications published in 2008 included descriptions of 70
previously undescribed species worldwide (Last et al., 2008a, 2008c, 2008b). The number of
new species described in 2006, 2007 and 2008 was 21, 23, and 81, respectively, with all but
nine occurring in the Indo–West Pacific. Additional nominal species of chondrichthyans are also
included following resurrection of previously unrecognized species such as the resurrection of
Pastinachus atrus for the Indo–Australian region, previously considered a synonym of P.
sephen (Last and Stevens, 1994). Scientists excluded some nominal species of dubious
taxonomic validity from this assessment. Thus, the total number of chondrichthyan species
referred to in this paper (1,041) does not include all recent new or resurrected species, which
require future work for their inclusion in the GSRLA.
Many more as yet undescribed chondrichthyan species exist. The chondrichthyan
faunas in several parts of the world (e.g. the northern Indian Ocean) are poorly known and a
large number of species are likely to represent complexes of several distinct species that
require taxonomic resolution, e.g. some dogfishes, skates, eagle rays and stingrays (Iglésias et
al., 2010, White and Last, 2012). Many areas of the Indian and Pacific Oceans are largely
22
unexplored and, given the level of micro-endemism documented for a number of chondrichthyan
groups, it is likely that many more species will be discovered in the future (Last, 2007, Naylor et
al., 2012). For example, recent surveys of Indonesian fish markets revealed more than 20 new
species of sharks out of the approximately 130 recorded in total (Last, 2007, Ward et al., 2008,
White et al., 2006).
Distribution maps. SSG experts created a shapefile of the geographic distribution for each
chondrichthyan species with GIS software using the standard mapping protocol for marine
species devised by the IUCN GMSA team (http://sci.odu.edu/gmsa/). The map shows the Extent
of Occurrence of the species cut to one of several standardized basemaps depending on the
ecology of the species (i.e. coastal and continental shelf, pelagic and deepwater). The
distribution maps for sharks are based on original maps provided by the FAO and Leonard J.V.
Compagno. Maps for some of the batoids were originally provided by John McEachran. New
maps for recently described species were drafted where necessary. The original maps were
updated, corrected or verified by experts at the Red List workshops or out-of-session assessors
and SSG staff and then sent to the GMSA team who modified the shapefiles and matched them
to the distributional text within the assessment.
Occurrence and habitat preference. SSG assessors assigned countries of occurrence from the
‘geographic range’ section of the Red List documentation and classified species to the FAO
Fishing Areas (http://www.iucnredlist.org/technical-documents/data-organization) in which they
occur (Figure 2--supplement 1). Each species was coded according to the IUCN Habitats
Authority File (see http://www.iucnredlist.org/technical-documents/classification-
schemes/habitats-classification-scheme-ver3). These categorizations are poorly developed and
often irrelevant for coastal and offshore marine animals. For the purposes of analysis presented
here we assigned chondrichthyans to five unique habitat-lifestyle combinations (coastal and
23
continental shelf, pelagic, meso- and bathypelagic, deepwater, and freshwater) mainly
according to depth distribution and, to a lesser degree, position in the water column. The pelagic
group includes both neritic (pelagic on the continental shelf) and epipelagic oceanic (pelagic in
the upper 200 m of water over open ocean) species. Species habitats were classified based on
the findings from the workshops combined with a review of the primary literature, FAO fisheries
guides and field guides (Camhi et al., 2009, Cavanagh et al., 2003, Cavanagh and Gibson,
2007, Cavanagh et al., 2008, Gibson et al., 2008, Kyne et al., 2012). Species habitat
classifications tended to be similar across families, but for some species the depth distributions
often spanned more than one depth category and for these species habitat was assigned
according to the predominant location of each species throughout the majority of its life cycle
(Compagno, 1990). This issue was mainly confined to coastal and continental shelf species that
exhibited distributions extending down the continental slopes (e.g. some Dasyatis, Mustelus,
Rhinobatos, Scyliorhinus, Squalus, and Squatina). We caution that some of the heterogeneity in
depth distribution or unusually large distributions may reflect taxonomic uncertainty and the
existence of species complexes (White and Last, 2012). We defined the deep sea as beyond
the continental and insular shelf edge at depths greater than or equal to 200 m. Coastal and
continental shelf includes predominantly demersal species (those spending most time dwelling
on or near the seabed), and excluded neritic chondrichthyans. Pelagic species included
macrooceanic and tachypelagic ocean-crossing epipelagic sharks with circumglobal
distributions as well as sharks suspected of ocean-crossing because they exhibit circumglobal
but disjunct distributions, e.g. Galapagos shark (Carcharhinus galapagensis).
Our classification resulted in a total of 33 obligate freshwater and 1,008 marine and
euryhaline chondrichthyans of which 482 species were found predominantly in coastal and
continental shelf, 39 in pelagic, 479 in deepwater, and eight in meso- and bathypelagic habitats.
To evaluate whether the geographic patterns of threat are robust to alternate unique or multiple
habitat classifications we considered two alternate classification schemes, one where species
24
were classified in to a single habitat and another where species were classified in one or more
habitats. The alternate unique classification scheme yielded 42 pelagic (Camhi et al., 2009), and
452 deepwater chondrichthyans (Kyne and Simpfendorfer, 2007), leaving 517 coastal and
continental shelf and 33 obligate freshwater species (totaling 1,044). When species were
classified in more than one habitat this resulted in 513 species in the coastal and continental
shelf, 564 in deepwater, 54 in pelagic and 13 meso- and bathypelagic habitats. We found the
geographic pattern of threat was robust to the choice of habitat classification scheme, and we
present only the unique classification (482 coastal and continental shelf, 39 pelagic, 479
deepwater habitat species).
Major threats. SSG assessors coded each species according to the IUCN Major threat Authority
File (see http://www.iucnredlist.org/technical-documents/classification-schemes/habitats-
classification-scheme-ver3). We coded threats that appear to have an important impact, but did
not describe their relative importance for each species.
The term ‘bycatch’ and its usage in the IUCN Major threat Authority File does not
capture the complexity and values of chondrichthyan fisheries. Some chondrichthyans termed
“bycatch” are actually caught as “incidental or secondary catch” as they are used to a similar
extent as the target species or are sometimes highly valued or at least welcome when the target
species is absent. “Unwanted bycatch” refers to cases where the chondrichthyans are not used
and fishers would prefer to avoid catching them (Clarke, S. pers. comm., Sasama Consulting,
Shizuoka, Japan). If the levels of unwanted bycatch are severe enough, chondrichthyans can be
actively persecuted to avoid negative and costly gear interactions – such as caused the near
extirpation of the British Columbian population of Basking shark (Cetorhinus maximus) (Wallace
and Gisborne, 2006).

25
Red List assessment. We assigned a Red List assessment category for each species based on
the information above using the revised 2001 IUCN Red List Categories and Criteria (version
3.1; see http://www.iucnredlist.org/technical-documents/categories-and-criteria). We provided a
rationale for each assessment justifying the classification along with a description of the relevant
criteria used in the designation. Data fields also present the reason for any change in Red List
categories from previous assessments (i.e. genuine change in status of species, new
information on the species available, incorrect data used in previous assessments, change in
taxonomy, or previously incorrect criteria assigned to species); the current population trend (i.e.
increasing, decreasing, stable, unknown); date of assessment; names of assessors and
evaluators (effectively the peer-reviewers); and any notes relevant to the Red List category. The
Red List documentation for each species assessment is supported by references to the primary
and secondary literature cited in the text.
Data entry, review, correction and consistency checking. Draft regional Red List assessments
and supporting data were collated and peer-reviewed during the workshops and through
subsequent correspondence to produce the global assessment for each species. At least one
member of the SSG Red List team was present at each of the workshops to facilitate a
consistent approach throughout the data collection, review and evaluation process. Once
experts had produced draft assessments, SSG staff circulated summaries (comprised of
rationales, Red List Categories and Criteria) to the entire SSG network for comment. As the
workshops took place over a ten-year period, some species assessments were reviewed and
updated at subsequent workshops or by correspondence. Each assessment received a
minimum of two independent evaluations as part of the peer-review process, either during or
subsequent to the consensus sessions (a process involving 65 specialists and experts across
23 participating countries) prior to entry into the database and submission to the IUCN Red List
Unit.

26
SSG Red List-trained personnel undertook further checks of all assessments to ensure
consistent application of the Red List Categories and Criteria to each species, and the then
SSG Co-chair Sarah L. Fowler, thoroughly reviewed every assessment produced from 1996 to
2009. Following the data review and evaluation process, all species assessments were entered
in the Species Information Service database and checked again by SSG Red List Unit staff.
IUCN Red List Program staff made the final check prior to the acceptance of assessments in the
Red List database and publication of assessments and data online (http://www.iucnredlist.org/).
Subpopulation and regional assessments. We included only global species assessments in this
analysis. In many cases, subpopulation and regional assessments were developed for species
before a global assessment could be made. For very wide-ranging species, such as the oceanic
pelagic sharks, a separate workshop was held to combine these subpopulation or regional
assessments (Table 8). A numerical value was assigned to each threat category in each region
where the species was assessed, and where possible these values were then averaged to
calculate a global threat category (Gärdenfors et al., 2001). Hence, the Red List categories of
some species may differ regionally; for example, porbeagle shark (Lamna nasus) is classified as
VU globally, but CR in the Northeast Atlantic and Mediterranean Sea. Often population trends
were not available across the full distribution of a species. In these cases, the degree to which
the qualifying threshold was met was modified according to the degree of certainty with which
the trend could be extrapolated across the full geographic range of a species. The calculation of
the overall Red List category for globally distributed species is challenging, particularly when a
combination of two or more of the following issues occurs: (1) trend data are available only for
part of the geographic range; (2) regional trend data or stock assessments are highly uncertain;
(3) the species is data-poor in some other regions; (4) the species is subject to some form of
management in other regions; and, (5) the species is moderately productive (Dulvy et al., 2008).
This situation is typified by the Blue shark (Prionace glauca) which faces all of these issues. The
27
best abundance trend data come from the Atlantic Ocean, but the different time series available
occasionally yield conflicting results; surveys of some parts of the Atlantic exhibit declines of 53-
80% in less than three generations (Dulvy et al., 2008, Gibson et al., 2008), while a 2008 stock
assessment conducted for the International Commission for the Conservation of Atlantic Tuna
(ICCAT) indicate, albeit with substantial uncertainty, that the North Atlantic Blue shark
population biomass is still larger than that required to generate Maximum Sustainable Yield
(BMSY) (Gibson et al., 2008). The Blue shark is one of the most productive of the oceanic pelagic
sharks, maturing at 4-6 years of age with an annual rate of population increase of ~28% per
year and an approximate BMSY at ~42% of virgin biomass, B0 (Cortés, 2008, Simpfendorfer et al.,
2008). While the available data may support the regional listing of the Atlantic population of this
species in a threatened category, the assessors could not extrapolate this to the global
distribution because the species may be subject to lower fishing mortality in other regions.
Hence the Blue shark was listed as NT globally. Further details on this issue and additional data
requirements to improve the assessment and conservation of such species are considered
elsewhere (Camhi et al., 2009, Gibson et al., 2008).
Red Listing marine fishes. We assessed most threatened chondrichthyans (81%, n=148 of 181)
using the Red List population reduction over time Criterion A. Only one of the threatened
species, the Common Skate (Dipturus batis) was assessed under the higher decline thresholds
of the A1 criterion, where “population reduction in the past, where the causes are clearly
reversible AND understood AND have ceased”. In light of recent taxonomic information, this
species complex is currently being reassessed (Iglésias et al., 2010). The remaining threatened
species were assessed using the IUCN geographic range Criterion B (n=29) or the Small
population size and decline Criterion C (n=4: Borneo shark Carcharhinus borneensis,
Colclough's shark Brachaelurus colcloughi, Northern river shark Glyphis garricki, and
Speartooth shark Glyphis glyphis). The Criterion A decline assessments were based on
28
statistical analyses and critical review of a tapestry of local catch per unit effort trajectories,
fisheries landings trajectories (often at lower taxonomic resolution), combined with an
understanding of fisheries selectivity and development trajectories.
We assessed most chondrichthyans using the Red List criterion based on population
reduction over time (Criterion A). The original decline thresholds triggering a threatened
categorization were Criterion A1: VU, 50%; EN, 70%; and CR, 90% decline over the greater of
10 years or three generations. IUCN added new thresholds in 2000 (A2-4: VU, 30%; EN, 50%;
and CR, 70% decline over the greater of 10 years or three generations), in response to
concerns that the original thresholds were too low for managed populations that are being
deliberately fished down to MSY (typically assumed to be 50% of virgin biomass under
Schaeffer logistic population growth) (Reynolds et al., 2005). This revision was designed to
improve consistency between fisheries limit reference points and IUCN thresholds reducing the
likelihood of false alarms – where a sustainably exploited species incorrectly triggers a threat
listing (Dulvy et al., 2005, Porszt et al., 2012). Empirical testing shows that this has worked and
demonstrates that a species exploited at fishing mortality rates consistent with achieving MSY
(FMSY) would lead to decline rates that would be unlikely to be steep enough to trigger a threat
categorization under these new thresholds (Dulvy et al., 2005).
It is incontrovertible that a species that has declined by 80% over the qualifying time
period is at greater relative risk of extinction than another that declined by 40% (in the same
period). Regardless, there may be a wide gap in the population decline trajectory between the
point at which overfishing occurs and the point where the absolute risk of extinction becomes a
real concern (Musick, 1999a). In addition, fisheries scientists have expressed concern that
decline criteria designed for assessing the extinction risk of a highly productive species may be
inappropriate for species with low productivity and less resilience (Musick, 1999a), although this
was addressed with the use of generation times to rescale decline rates to make productivity
comparable (Mace et al., 2008, Reynolds et al., 2005). In response to concerns that IUCN

29
decline thresholds are too low and risk false alarms, the American Fisheries Society (AFS)
developed alternate decline criteria (Musick, 1999a) to classify North American marine fish
populations (Musick et al., 2000). This approach only categorizes species that have undergone
declines of 70-99% over the greater of three generations or ten years. Nonetheless, most of the
species so listed by AFS also appear on the relevant IUCN Specialist Group lists and vice
versa, although the risk categories are slightly different. The reason for the concordance is that
in most instances the decline had far exceeded 50% over the appropriate timeframe long before
it was detected. Consequently, SSG scientists generally agreed in assigning threat categories to
species that had undergone large declines, but many were reluctant to assign a VU
classification to species that were perceived to be at or near 50% virgin population levels and
presumably near BMSY. In practice, the latter were usually classified as NT unless other
circumstances (highly uncertain data, combined with widespread unregulated fisheries) dictated
a higher level of threat according to the precautionary principle.
Statistical analysis
Modeling correlates of threat. Vulnerability to population decline or extinction is a function of the
combination of the degree to which intrinsic features of a species’ behavior, life history and
ecology (sensitivity) may reduce the capacity of a species to withstand an extrinsic threat or
pressure (exposure). We tested the degree to which intrinsic life histories and extrinsic fishing
activity influenced the probability that a chondrichthyan species was threatened. Threat
category was modeled as a binomial response variable; with LC species assigned a score of 0,
and VU, EN & CR species assigned a 1. We used maximum body length (cm), geographic
range size (Extent of Occurrence, km2), and depth range (maximum–minimum depth, m) as
indices of intrinsic sensitivity, and minimum depth (m) and mean depth (maximum–minimum
depth / 2) as a measure of exposure to fishing activity. All variables were standardized to z-
30
scores by subtracting the mean and dividing by the standard deviation to minimize collinearity
(variance inflation factors were less than 2). Mean depth was not included in model evaluation
as it was computed from, and hence, correlated to minimum depth (Spearman’s = 0.52). We
fitted Generalized Linear Mixed-effect Models with binomial error and a logit link to model the
probability of a species being threatened, using taxonomic structure as a nested random effect
(e. g., order/family/genus) to account for phylogenetic non-independence. The probability of a
species i being threatened was assumed to be binomially distributed with a mean , such that
the linear predictor of was:
log , , , , , (2),
where , and , are the fitted coefficients for life history or geographic range traits j and k, and
, and , are the trait values of j and k for species i (Tables 4 and 9). The effect of a one
standard deviation increase in the coefficient of interest was computed as:
1/ 1 exp 1/ 1 exp 2 , (3),
following (Gelman and Hill, 2006). Models were fitted using the lmer function in the R package
lme4 (Bates et al., 2011). The amount of variance explained by the fixed effects only and the
combined fixed and random effects of the binomial GLMM models was calculated as the
marginal R2GLMM(m) and conditional R2
GLMM(c), respectively, using the methods described by
Nagakawa and Schlielzeth (2012).
Estimating the proportion of potentially threatened DD species. We predicted the number of
Data Deficient species that are potentially threatened based on the maximum body size and
geographic distribution traits (Table 3, Supplementary file 1). Specifically, based on the
explanatory models described above, all variables were log10 transformed and we fitted
Generalized Linear Models of increasing complexity assuming a binomial error and logit link
(equation 2; Table 3). Model performance was evaluated using Receiver Operating

31
Characteristics by comparing the predicted probability that the species was threatened p(THR)
against the true observed status (Least Concern = 0, and threatened [VU, EN & CR] = 1)
(Porszt et al., 2012, Sing et al., 2005). The prediction accuracy was calculated as the Area
Under the Curve (AUC) of the relationship between false positive rates and true positive rates,
where a false positive is a model prediction of ≥ 0.5 and true observed status is 0 (or <0.5 and
1) and a true positive is a prediction of ≥ 0.5 and true observed status is 1 (or <0.5 and 0). True
and false positive rates, and accuracy (AUC) were calculated using the R package ROCR (Sing
et al., 2005). The probability that a DD species was threatened p(THR)DD was predicted based
on the available life history and distributional traits. DD species with p(THR)DD ≥ 0.5 were
classified as threatened and <0.5 as Least Concern. This optimum classification threshold was
confirmed by comparing accuracy across the full range of possible thresholds (from 0 to 1). We
fitted models using the gls function and calculated pseudo-R2 using the package rms.
With these models we can estimate the number and proportion of species in each
category (Table 1). We estimated that 68 of 396 DD species are potentially threatened, and
hence the remainder (396-68 = 328) is likely to be either Least Concern or Near Threatened.
Assuming these species are distributed between these categories according to the observed
ratio of NT:LC species of 0.5477 this results in a total of 312 (29.9%) Near Threatened species
(132 known + 180 estimated) and 389 (37.4%) Least Concern species (241 known + 148
estimated). After apportioning the DD species among threatened (68), NT (312), and LC (389),
only 91 (8.7%; 487-396) are likely to be Data Deficient (Table 1).
Spatial analysis
The SSG and the GMSA created ArcGIS distribution maps as polygons describing the
geographical range of each chondrichthyan depending on the individual species’ point location

32
and depth information. Pelagic species distribution maps were digitized by hand from the
original map sources. For spatial analyses, we merged all species maps into a single shapefile.
We mapped species using a hexagonal grid composed of individual units (cells) that retain their
shape and area (~23,322 km2) throughout the globe. Specifically, we used the geodesic discrete
global grid system, defined on an icosahedron and projected to the sphere using the inverse
Icosahedral Snyder Equal Area (ISEA) (Sahr et al., 2003). A row of cells near longitude
180°E/W was excluded, as these interfered with the spatial analyses (Hoffmann et al., 2010).
Because of the way the marine species range maps are buffered, the map polygons are likely to
extrapolate beyond known distributions, especially for any shallow-water, coastal species,
hence not only will range size itself likely be an overestimate, but so will the number of
hexagons.
We excluded obligate freshwater species from the final analysis as their distribution
maps have yet to be completed. The maps of the numbers of threatened species represent the
sum of species that have been globally assessed as threatened, in IUCN Red List categories
VU, EN or CR, existing in each ~23,322 km2 cell. We caution that this should not be interpreted
to mean that species existing within that grid cell are necessarily threatened in this specific
location, rather that this location included species that are threatened, on average, throughout
their extent of occurrence. The number of threatened species was positively related to the
species richness of cells (F1, 14846 = 1.5 e5, P <0.001, r2 =0.91). To remove this first-order effect
and reveal those cells with greater and lower than expected extinction risk, we calculated the
residuals of a linear regression of the number of threatened species on the number of non-DD
species (referred to as data sufficient species). Cells with positive residuals were mapped to
show areas of greater than expected extinction risk compared to cells with equal or negative
residuals. Hexagonal cell information was converted to point features and smoothed across
neighbouring cells using ordinary kriging using a spherical model in the Spatial Analyst package
of ArcView. Such smoothing can occasionally lead to contouring artefacts, such as the yellow
33
wedge west of southern Africa in Figure 7D, and we caution against over-interpreting marginal
categorization changes.
We identified hotspots of threatened endemic chondrichthyans to guide conservation
priorities. In order to describe the potential cost of losing unique chondrichthyan faunas, we
calculated irreplaceability scores for each cell. Irreplaceability scores were calculated for each
species as the reciprocal of its area of occupancy measured as the number of cells occupied.
For example, for a species with an extent of occurrence spanning 100 hexagons, each hexagon
in its range would have an irreplaceability 1/100 or 0.01 in each of the 100 hexagons of its
extent of occurrence. The irreplaceability of each cell was calculated by averaging log10
transformed irreplaceability scores of each species in each cell. Averaging irreplaceability
scores controls for varying species richness across cells. We calculated irreplaceability both for
all chondrichthyans and for threatened species only. Irreplaceability was also calculated using
only endemic threatened species, whereby endemicity was defined as species having an extent
of occurrence of <50,000, 100,000, 250,000 or 500,000 km2. Different definitions of endemicity
gave similar patterns of irreplaceability and we present the results of only the largest-scale
definition of endemicity. Hence the irreplaceability of threatened species and particularly the
threatened endemic chondrichthyans represents those locations or ‘hotspots’ (Myers et al.,
2000) at greatest risk of losing the most unique chondrichthyan biodiversity.
Fisheries catch landings and shark fin exports to Hong Kong
We extracted chondrichthyan landings reported to FAO by 146 countries and territories from a
total of 128 countries (as some chondrichthyan fishing nations are overseas territories,
unincorporated territories, or British Crown Dependencies) from FishStat (FAO, 2011). We
categorized landings into 153 groupings, comprised of 128 species-specific categories (e.g.
angular roughshark, piked dogfish, porbeagle, Patagonian skate, plownose chimaera, small-
eyed ray, etc.) and 25 broader nei (nei = not elsewhere included) groupings (e.g. such as
34
various sharks nei, threshers sharks nei, ratfishes nei, raja rays nei). For each country, all
chondrichthyan landings in metric tonnes (t) were averaged over the decade 2000-2009.
Landings reported as “<0.5” were assigned a value of 0.5 t. Missing data reported as “.” were
assigned a zero. Total annual chondrichthyan landings are underestimated as data are not
reported for 1,522 out of a total count of 13,990 entries in the dataset. Therefore, 11% of
chondrichthyan landings reported to the FAO over the 10-year period are “data unavailable,
unobtainable”. We mapped FAO chondrichthyan landings as the national percent share of the
average total landings from 2000 to 2009.
For the analysis of landings over time we removed the aggregate category ‘sharks, rays,
skates, etc.’ and all nine of the FAO chimaera reporting categories. The ‘sharks, rays, skates,
etc.’ FAO reported category comprised 15,684,456 tonnes of the reported catch from all
countries during 1950-2009, which is a total of 45% of the total reported catch for this time
period. However, the proportion of catch in this category has declined from around 50% of
global catch to around 35%, presumably due to better reporting of ray catch and as sharks have
declined or come under stronger protection (Figure 1). The nine chimaera categories make up
a small fraction of the global catch, 249,404.5 tonnes from 1950-2009, representing 0.72% of
the total catch.
Hong Kong has long served as one of the world’s largest entry ports for the global shark
fin trade. While fins are increasingly being exported to mainland China where species-specific
trade data is more difficult to obtain, each year (from 1996-2001) Hong Kong handled around
half of all fin imports (Clarke et al., 2006). Data on shark fin exports to Hong Kong were
requested directly from the Hong Kong Census and Statistics Department (Hong Kong Special
Administrative Region Government, 2011). We mapped exports to Hong Kong as the proportion
of the summed total weight of the four categories of shark fin exported to Hong Kong in 2010:
(1) shark fins (with or without skin), with cartilage, dried, whether or not salted but not smoked
(trade code: 3055950), (2) shark fins (with or without skin), without cartilage, dried, whether or
35
not salted but not smoked (3055930), (3) shark fins (with our without skin), without cartilage,
salted or in brine, but not dried or smoked (3056940), and (4) shark fins (with or without skin),
with cartilage, salted or in brine, but not dried or smoked (3056930). We could not correct the
difference in weight due to product type. To identify the threat classification of the
chondrichthyan species in the fin trade, we included records of the most numerous species
used in the Hong Kong fin trade as well as those species with the most-valued fins (Clarke et
al., 2006, Clarke et al., 2007, Clarke, 2008).
Acknowledgments
We thank the UN Food and Agriculture Organization and John McEachran for providing
distribution maps. We thank all SSG staff, interns and volunteers for logistical and technical
support: Sarah Ashworth, Gemma Couzens, Kendal Harrison, Adel Heenan, Catherine
McCormack, Helen Meredith, Kim O’Connor, Rachel Kay, Charlotte Walters, Lindsay
MacFarlane, Lincoln Tasker, Helen Bates and Rachel Walls. We thank Rowan Trebilco, Wendy
Palen, Cheri McCarty, and Roger McManus for their comments on the manuscript, and
Statzbeerz and Shinichi Nagakawa for statistical advice. Opinions expressed herein are of the
authors only and do not imply endorsement by any agency or institution associated with the
authors.
Assessing species for the IUCN Red List relies on the willingness of dedicated experts to
contribute and pool their collective knowledge, thus allowing the most reliable judgments of a
species’ status to be made. Without their enthusiastic commitment to species conservation, this
work would not be possible. We therefore thank all of the SSG members, invited national,
regional and international experts who have attended Regional, Generic and Expert Review
SSG Red List workshops, and all experts who have contributed data and their expertise by
correspondence. A total of 209 SSG members and invited experts participated in regional and

36
thematic workshops and a total of 302 scientists and experts were involved in the process of
assessing and evaluating the species assessments. We express our sincere thanks and
gratitude to the following people who have contributed to the GSRLA since 1996. We ask
forgiveness for any names that may have been inadvertently omitted or misspelled.
Acuña, E., Adams, W., Affronte, M., Aidar, A., Alava, M., Ali, A., Amorim, A., Anderson, C.,
Arauz, R., Arfelli, C., Baker, J., Baker, K., Baranes, A., Barker, A., Barnett, L., Barratt, P.,
Barwick, M., Bates, H., Batson, P., Baum, J., Bell, J., Bennett, M., Bertozzi, M., Bethea, D.,
Bianchi, I., Biscoito, M., Bishop, S., Bizzarro, J., Blackwell, R., Blasdale, T., Bonfil, R., Bradaï,
M.N., Brahim, K., Branstetter, S., Brash, J., Bucal, D., Cailliet, G., Caldas, J.P., Camara, L.,
Camhi, M., Capadan, P., Capuli, E., Carlisle, A., Carocci, F., Casper, B., Castillo-Geniz, L.,
Castro, A., Charvet, P., Chiaramonte, G., Chin, A., Clark, T., Clarke, M., Clarke, S., Cliff, G.,
Clò, S., Coelho, R., Conrath, C., Cook, S., Cooke, A., Correia, J., Cortés, E., Couzens, G.,
Cronin, E., Crozier, P., Dagit, D., Davis, C., de Carvalho, M., Delgery, C., Denham, J., Devine,
J., Dharmadi, Dicken, M., Di Giácomo, E., Diop, M., Dipper, F., Domingo, A., Doumbouya, F.,
Drioli, M., Ducrocq, M., Dudley, S., Duffy, C., Ellis, J., Endicott, M., Everett, B., Fagundes, L.,
Fahmi, Faria, V., Fergusson, I., Ferretti, F., Flaherty, A., Flammang, B., Freitas, M., Furtado, M.,
Gaibor, N., Gaudiano, J., Gedamke, T., Gerber, L., Gledhill, D., Góes de Araújo, M.L., Goldman,
K., Gonzalez, M., Gordon, I., Graham, K., Graham, R., Grubbs, R., Gruber, S., Guallart, J., Ha,
D., Haas, D., Haedrich, R., Haka, F., Hareide, N-R., Haywood, M., Heenan, A., Hemida, F.,
Henderson, A., Herndon, A., Hicham, M., Hilton-Taylor, C., Holtzhausen, H., Horodysky, A.,
Hozbor, N., Hueter, R., Human, B., Huveneers, C., Iglésias, S., Irvine, S., Ishihara, H.,
Jacobsen, I., Jawad, L., Jeong, C-H., Jiddawi, N., Jolón, M., Jones, A., Jones, L., Jorgensen, S.,
Kohin, S., Kotas, J., Krose, M., Kukuev, E., Kulka, D., Lamilla, J., Lamónaca, A., Last, P., Lea,
R., Lemine Ould, S., Leandro, L., Lessa, R., Licandeo, R., Lisney, T., Litvinov, F., Luer, C.,
Lyon, W., Macias, D., MacKenzie, K., Mancini, P., Mancusi, C., Manjaji Matsumoto, M., Marks,
37
M., Márquez-Farias, J., Marshall, A., Marshall, L., Martínez Ortíz, J., Martins, P., Massa, A.,
Mazzoleni, R., McAuley, R., McCord, M., McCormack, C., McEachran, J., Medina, E.,
Megalofonou, P., Mejia-Falla, P., Meliane, I., Mendy, A., Menni, R., Minto, C., Mitchell, L.,
Mogensen, C., Monor, G., Monzini, J., Moore, A., Morales, M.R.J., Morey, G., Morgan, A.,
Mouni, A., Moura, T., Mycock, S., Myers, R., Nader, M., Nakano, H., Nakaya, K., Namora, R.,
Navia, A., Neer, J., Nel, R., Nolan, C., Norman, B., Notarbartolo di Sciara, G., Oetinger, M.,
Orlov, A., Ormond, C., Pasolini, P., Paul, L., Pegado, A., Pek Khiok, A.L., Pérez, M., Pérez-
Jiménez, J.C., Pheeha, S., Phillips, D., Pierce, S., Piercy, A., Pillans, R., Pinho, M., Pinto de
Almeida, M., Pogonoski, J., Pollard, D., Pompert, J., Quaranta, K., Quijano, S., Rasolonjatovo,
H., Reardon, M., Rey, J., Rincón, G., Rivera, F., Robertson, R., Robinson, L., J.R., Romero, M.,
Rosa, R., Ruίz, C., Saine, A., Salvador, N., Samaniego, B., San Martín, J., Santana, F., Santos
Motta, F., Sato, K., Schaaf-DaSilva, J., Schembri, T., Seisay, M., Semesi, S., Serena, F., Séret,
B., Sharp, R., Shepherd, T., Sherrill-Mix, S., Siu, S., Smale, M., Smith, M., Snelson, Jr, F.,
Soldo, A., Soriano-Velásquez, S., Sosa-Nishizaki, O., Soto, J., Stehmann, M., Stenberg, C.,
Stewart, A., Sulikowski, J., Sundström, L., Tanaka, S., Taniuchi, T., Tinti, F., Tous, P., Trejo, T.,
Treloar, M., Trinnie, F., Ungaro, N., Vacchi, M., van der Elst, R., Vidthayanon, C., Villavicencio-
Garayzar, C., Vooren, C., Walker, P., Walsh, J., Wang, Y., Williams, S., Wintner, S., Yahya, S.,
Yano, K., Zebrowski, D. & Zorzi, G.
Additional Files
Source data file Figure 6 supplement 1
Number and IUCN Red List status of chondrichthyan species in IUCN Red List categories by
family (alphabetically within each order).

38
Supplementary file 1.
The Data Deficient chondrichthyan species that are potentially threatened.
Supplementary file 2.
(A) IUCN Red List status of chondrichthyans in the fin trade, including (i) families with the most-
valued fins, and (ii) the most prevalent species utilized in the Hong Kong fin trade. (B)
Chondrichthyan species threatened by (i) control measures, and (ii) habitat destruction and
degradation, pollution or climate change with the corresponding IUCN threat classification
(Salafsky et al., 2008). (C) Irreplaceable: the 66 threatened endemic sharks and rays ordered in
decreasing irreplaceability.

39
References
Akcakaya, H. R., Ferson, S., Burgman, M. A., Keith, D. A., Mace, G. M. and Todd, C. R. (2000)
Making consistent IUCN classifications under uncertainty. Conservation Biology, 14,
1001-1013.
Anderson, S. C., Farmer, R. G., Ferretti, F., Houde, A. L. S. and Hutchings, J. A. (2011a)
Correlates of vertebrate extinction risk in Canada. Bioscience, 61, 538-549.
Anderson, S. C., Flemming, J. M., Watson, R. and Lotze, H. K. (2011b) Serial exploitation of
global sea cucumber fisheries. Fish and Fisheries, 12, 317-339.
Barker, M. J. and Schluessel, V. (2005) Managing global shark fisheries: suggestions for
prioritizing management strategies. Aquatic Conservation: Marine and Freshwater
Ecosystems, 15, 325-347.
Barnett, L. A. K., Winton, M. V., Ainsley, S. M., Cailliet, G. M. and Ebert, D. A. (2013)
Comparative demography of skates: life-history correlates of productivity and
implications for management. PLoS ONE, 8, e65000.
Bates, D., Maechler, M. and Bolker, B. (2011) lme4: linear mixed-effects models using S4
classes. R package version 0.999999-2.
Bornatowski, H., Braga, R. R. and Vitule, J. R. S. (2013) Shark mislabeling threatens
biodiversity. Science, 340, 923.
Branch, T. A., Jensen, O. P., Ricard, D., Ye, Y. and Hilborn, R. (2011) Contrasting global trends
in marine fishery status obtained from catches and from stock assessments.
Conservation Biology, 25, 777-786.
Butchart, S. H. M., Walpole, M., Collen, B., van Strien, A., Scharlemann, J. P. W., Almond, R. E.
A., Baillie, J. E. M., Bomhard, B., Brown, C., Bruno, J., Carpenter, K. E., Carr, G. M.,
Chanson, J., Chenery, A. M., Csirke, J., Davidson, N. C., Dentener, F., Foster, M., Galli,
A., Galloway, J. N., Genovesi, P., Gregory, R. D., Hockings, M., Kapos, V., Lamarque, J.
F., Leverington, F., Loh, J., McGeoch, M. A., McRae, L., Minasyan, A., Morcillo, M. H.,
Oldfield, T. E. E., Pauly, D., Quader, S., Revenga, C., Sauer, J. R., Skolnik, B., Spear,
D., Stanwell-Smith, D., Stuart, S. N., Symes, A., Tierney, M., Tyrrell, T. D., Vie, J. C. and
Watson, R. (2010) Global biodiversity: indicators of recent declines. Science, 328, 1164-
1168.
Camhi, M. D., Valenti, S. V., Fordham, S. V., Fowler, S. L. and Gibson, C. (2009) The
conservation status of pelagic sharks and rays: Report of the IUCN Shark Specialist

40
Group Pelagic Shark Red List Workshop. IUCN Species Survival Commission Shark
Specialist Group, Newbury, UK, pp. 78.
Cardillo, M., Mace, G. M., Jones, K. E., Bielby, J., Binida-Edmonds, O. R. P., Sechrest, W.,
Orme, C. D. L. and Purvis, A. (2005) Multiple causes of high extinction risk in large
mammal species. Science, 309, 1239-1241.
Carpenter, K. E., Abrar, M., Aeby, G., Aronson, R. B., Banks, S., Bruckner, A., Chiriboga, A.,
Cortes, J., Delbeek, J. C., DeVantier, L., Edgar, G. J., Edwards, A. J., Fenner, D.,
Guzman, H. M., Hoeksema, B. W., Hodgson, G., Johan, O., Licuanan, W. Y.,
Livingstone, S. R., Lovell, E. R., Moore, J. A., Obura, D. O., Ochavillo, D., Polidoro, B.
A., Precht, W. F., Quibilan, M. C., Reboton, C., Richards, Z. T., Rogers, A. D.,
Sanciangco, J., Sheppard, A., Sheppard, C., Smith, J., Stuart, S., Turak, E., Veron, J. E.
N., Wallace, C., Weil, E. and Wood, E. (2008) One-third of reef-building corals face
elevated extinction risk from climate change and local impacts. Science, 321, 560-563.
Cavanagh, R. D., Fowler, S. L. and Camhi, M. D. (2008) Pelagic sharks and the FAO
International Plan of Action for the conservation and management of sharks. In Sharks
of the Open Ocean. Biology, Fisheries and Conservation, (Eds, Camhi, M. D., Pikitch, E.
K. and Babcock, E. A.) Blackwell, Oxford, pp. 478-492.
Cavanagh, R. D. and Gibson, C. (2007) Overview of the conservation status of cartilaginous
fishes (Chondrichthyans) in the Mediterranean Sea. IUCN Species Survival Commission
Shark Specialist Group, Gland, Switzerland and Malaga, Spain, pp. 42.
Cavanagh, R. D., Kyne, P. M., Fowler, S. L., Musick, J. A. and Bennett, M. B. (2003) The
conservation status of Australasian chondrichthyans: Report of the IUCN Shark
Specialist Group Australia and Oceania Regional Red List Workshop. The University of
Queensland, School of Biomedical Sciences, Brisbane, Australia, pp. 170.
CCMLR (2011) Conservation Measure 41-10 (2010) Limits on the exploratory fishery for
Dissostichus spp. in Statistical Subarea 88.2 in the 2010/11 season. Commission on the
Conservation of Antarctic Marine Living Resource, Hobart, Tasmania, pp. 3.
Chin, A., Kyne, P. M., Walker, T. I. and McAuley, R. B. (2010) A new integrated risk assessment
for climate change: analysing the vulnerability of sharks and rays on Australia’s Great
Barrier Reef. Global Change Biology, 16, 1936-1953.
Clarke, S. C. (2008) Use of shark fin trade data to estimate historic total shark removals in the
Atlantic Ocean. Aquatic Living Resources, 21, 373-381.
41
Clarke, S. C., Harley, S. J., Hoyle, S. D. and Rice, J. S. (2013) Population trends in Pacific
oceanic sharks and the utility of regulations on shark finning. Conservation Biology, 27,
197-209.
Clarke, S. C., McAllister, M. K., Milner-Gulland, E. J., Kirkwood, G. P., Michielsens, C. G. J.,
Agnew, D. J., Pikitch, E. K., Nakano, H. and Shivji, M. S. (2006) Global estimates of
shark catches using trade records from commercial markets. Ecology Letters, 9, 1115–
1126.
Clarke, S. C., Milner-Gulland, E. J. and Bjørndal, T. (2007) Social, economic and regulatory
drivers of the shark fin trade. Marine Resource Economics, 22, 305-327.
CMS (2010) Memorandum of Understanding on the Conservation of Migratory Sharks. United
Nations Environment Programme, Convention on Migratory Species.
http://www.cms.int/pdf/en/summary_sheets/sharks.pdf.
Collette, B. B., Carpenter, K. E., Polidoro, B. A., Juan Jorda, M. J., Boustany, A., Die, D. J.,
Elfes, C., Fox, W., Graves, J., Harrison, L., McManus, R., Minte-Vera, C. V., Nelson, R.
J., Restrepo, V., Schratwieser, J., Sun, C.-L., Amorim, A., Brick Peres, M., Canales, C.,
Cardenas, G., Chang, S.-K., Chiang, W.-C., de Oliveira Leite, J. N., Harwell, H., Lessa,
R., Fredou, F. L., Oxenford, H. A., Serra, R., Shao, K.-T., Sumaila, R., Wang, S.-P.,
Watson, R. and Yáñez, E. (2011) High value and long-lived - double jeopardy for tunas
and billfishes. Science, 333, 291-292.
Compagno, L. J. V. (1990) Alternative life-history styles of cartilaginous fishes in time and
space. Environmental Biology of Fishes, 28, 33-75.
Compagno, L. J. V. (2005) Checklist of living chondrichthyan fishes. In Sharks, Rays and
Chimaeras: the Status of the Chondrichthyan Fishes, (Eds, Fowler, S. L., Cavanagh, R.,
Camhi, M., Burgess, G. H., Caillet, G. M., Fordham, S., Simpfendorfer, C. A. and
Musick, J. A.) IUCN/SSC Shark Specialist Group, Gland, Switzerland, pp. 401-423.
Cortés, E. (2000) Life history patterns and correlations in sharks. Reviews in Fisheries Science,
8, 299-344.
Cortés, E. (2002) Incorporating uncertainty into demographic modelling: application to shark
populations and their conservation. Conservation Biology, 18, 1048-1062.
Cortés, E. (2008) Comparative life history and demography of pelagic sharks. In Sharks of the
Open Ocean. Biology, Fisheries and Conservation, (Eds, Camhi, M. D., Pikitch, E. K.
and Babcock, E. A.) Blackwell, Oxford, pp. 309-322.

42
COSEWIC (2010) COSEWIC assessment and status report on the Barndoor skate (Dipturus
laevis) in Canada. Committee on the Status of Endangered Wildlife in Canada, Ottawa,
Canada, pp. xiii + 71.
Costello, C., Ovando, D., Hilborn, R., Gaines, S. D., Deschenes, O. and Lester, S. E. (2012)
Status and solutions for the world's unassessed fisheries. Science, 338, 517-520.
Darwall, W. R. T., Holland, R. A., Smith, K. G., Allen, D., Brooks, E. G. E., Katarya, V., Pollock,
C. M., Shi, Y. C., Clausnitzer, V., Cumberlidge, N., Cuttelod, A., Dijkstra, K. D. B., Diop,
M. D., Garcia, N., Seddon, M. B., Skelton, P. H., Snoeks, J., Tweddle, D. and Vie, J. C.
(2011) Implications of bias in conservation research and investment for freshwater
species. Conservation Letters, 4, 474-482.
Davidson, A. D., Boyer, A. G., Kim, H., Pompa-Mansilla, S., Hamilton, M. J., Costa, D. P.,
Ceballos, G. and Brown, J. H. (2012) Drivers and hotspots of extinction risk in marine
mammals. Proceedings Of the National Academy Of Sciences Of the United States Of
America, 109, 3395-3400.
Davies, R. G., Orme, C. D. L., Olson, V., Thomas, G. H., Ross, S. G., Ding, T. S., Rasmussen,
P. C., Stattersfield, A. J., Bennett, P. M., Blackburn, T. M., Owens, I. P. F. and Gaston,
K. J. (2006) Human impacts and the global distribution of extinction risk. Proceedings of
the Royal Society B-Biological Sciences, 273, 2127-2133.
Díaz, S., Fargione, J., Chapin III, F. S. and Tilman, D. (2006) Biodiversity loss threatens human
well-being. PLoS Biology, 4, 1300-1305.
Dudley, S. F. J. and Simpfendorfer, C. A. (2006) Population status of 14 shark species caught in
the protective gillnets off KwaZulu-Natal beaches, South Africa, 1978-2003. Marine and
Freshwater Research, 57, 225-240.
Dulvy, N. K. (2000) Dipturus [Raja] laevis, Mitchill, 1818. IUCN, Gland, Switzerland.
http://www.iucnredlist.org/details/39771/0.
Dulvy, N. K., Baum, J. K., Clarke, S., Compagno, L. J. V., Cortés, E., Domingo, A., Fordham, S.,
Fowler, S., Francis, M. P., Gibson, C., Martínez, J., Musick, J. A., Soldo, A., Stevens, J.
D. and Valenti, S. (2008) You can swim but you can't hide: the global status and
conservation of oceanic pelagic sharks. Aquatic Conservation: Marine and Freshwater
Ecosystems, 18, 459–482.
Dulvy, N. K. and Forrest, R. E. (2010) Life histories, population dynamics, and extinction risks in
chondrichthyans. In Sharks and Their Relatives II: Biodiversity, Adaptive Physiology, and
Conservation, (Eds, Carrier, J. C., Musick, J. A. and Heithaus, M. R.) CRC Press, Boca
Raton, pp. 635-676.

43
Dulvy, N. K., Jennings, S. J., Goodwin, N. B., Grant, A. and Reynolds, J. D. (2005) Comparison
of threat and exploitation status in Northeast Atlantic marine populations. Journal of
Applied Ecology, 42, 883-891.
Dulvy, N. K. and Reynolds, J. D. (2002) Predicting extinction vulnerability in skates.
Conservation Biology, 16, 440-450.
Dulvy, N. K., Sadovy, Y. and Reynolds, J. D. (2003) Extinction vulnerability in marine
populations. Fish and Fisheries, 4, 25-64.
FAO (2010) The State of World Fisheries and Aquaculture 2010. Food and Agriculture
Organization of the United Nations, Rome, pp. 197.
FAO (2011) FishSTAT Capture Production (1950-2009) Database. Food and Agriculture
Organization of the United Nations, Rome.
http://www.fao.org/fishery/statistics/software/fishstat/en.
Ferretti, F., Myers, R. A., Serena, F. and Lotze, H. K. (2008) Loss of large predatory sharks from
the Mediterranean Sea. Conservation Biology, 22, 952-964.
Ferretti, F., Worm, B., Britten, G. L., Heithaus, M. R. and Lotze, H. K. (2010) Patterns and
ecosystem consequences of shark declines in the ocean. Ecology Letters, 13, 1055-
1071.
Fischer, J., Erikstein, K., D‘Offay, B., Barone, M. and Guggisberg, S. (2012) Review of the
Implementation of the International Plan of Action for the Conservation and Management
of Sharks. Food and Agriculture Organization of the United Nations, Rome, C1076, pp.
125.
Fowler, S. and Séret, B. (2010) Shark fins in Europe: Implications for reforming the EU finning
ban. European Elasmobranch Association and IUCN Shark Specialist Group, pp. 27.
Fowler, S. L. (2012) Background Paper on the Conservation Status of Migratory Sharks.
Convention on Migratory Species, Bonn, Germany, pp. 22.
Fowler, S. L., Reed, T. M. and Dipper, F. A. (Eds.) (2002) Elasmobranch Biodiversity,
Conservation and Management, IUCN Species Survival Commission Shark Specialist
Group, Gland, Switzerland and Cambridge, UK.
Frisk, M. G., Miller, T. J. and Fogarty, M. J. (2001) Estimation and analysis of biological
parameters in elasmobranch fishes: a comparative life history study. Canadian Journal
of Fisheries and Aquatic Sciences, 58, 969-981.
García, V. B., Lucifora, L. O. and Myers, R. A. (2008) The importance of habitat and life history
to extinction risk in sharks, skates, rays and chimaeras. Proceedings of the Royal
Society B-Biological Sciences, 275, 83-89.
44
Gärdenfors, U., Hilton-Taylor, C., Mace, G. M. and Rodríguez, J. P. (2001) The application of
IUCN Red List Criteria regional levels. Conservation Biology, 15, 1206-1212.
Gelman, A. and Hill, J. (2006) Data analysis using regression and multilevel / hierarchial
models, Cambridge University Press, Cambridge.
Gibson, C., Valenti, S. V., Fowler, S. L. and Fordham, S. V. (2008) The conservation status of
Northeast Atlantic chondrichthyans. Report of the IUCN Shark Specialist Group
Northeast Atlantic Red List Workshop. IUCN Species Survival Commission Shark
Specialist Group, Newbury, UK, pp. 76.
Harnik, P. G., Lotze, H. K., Anderson, S. C., Finkel, Z. V., Finnegan, S., Lindberg, D. R., Liow, L.
H., Lockwood, R., McClain, C. R., McGuire, J. L., O’Dea, A., Pandolfi, J. M., Simpson, C.
and Tittensor, D. P. (2012a) Extinctions in ancient and modern seas. Trends in Ecology
& Evolution, 27, 608-617.
Harnik, P. G., Simpson, C. and Payne, J. L. (2012b) Long-term differences in extinction risk
among the seven forms of rarity. Proceedings of the Royal Society B-Biological
Sciences, 279, 4969-4976.
Harrison, L. R. and Dulvy, N. K. (2014) Sawfish: A Global Strategy for Conservation.
International Union for the Conservation of Nature Species Survival Commission's Shark
Specialist Group, Vancouver, British Columbia, Canada, ISBN: 978-0-9561063-3-9, pp.
112.
Heithaus, M. R., Wirsing, A. J. and Dill, L. M. (2012) The ecological importance of intact top-
predator populations: a synthesis of 15 years of research in a seagrass ecosystem.
Marine and Freshwater Research, 63, 1039-1050.
Hoffmann, M., Hilton-Taylor, C., Angulo, A., Bohm, M., Brooks, T. M., Butchart, S. H. M.,
Carpenter, K. E., Chanson, J., Collen, B., Cox, N. A., Darwall, W. R. T., Dulvy, N. K.,
Harrison, L. R., Katariya, V., Pollock, C. M., Quader, S., Richman, N. I., Rodrigues, A. S.
L., Tognelli, M. F., Vie, J.-C., Aguiar, J. M., Allen, D. J., Allen, G. R., Amori, G.,
Ananjeva, N. B., Andreone, F., Andrew, P., Ortiz, A. L. A., Baillie, J. E. M., Baldi, R., Bell,
B. D., Biju, S. D., Bird, J. P., Black-Decima, P., Blanc, J. J., Bolanos, F., Bolivar-G, W.,
Burfield, I. J., Burton, J. A., Capper, D. R., Castro, F., Catullo, G., Cavanagh, R. D.,
Channing, A., Chao, N. L., Chenery, A. M., Chiozza, F., Clausnitzer, V., Collar, N. J.,
Collett, L. C., Collette, B. B., Fernandez, C. F. C., Craig, M. T., Crosby, M. J.,
Cumberlidge, N., Cuttelod, A., Derocher, A. E., Diesmos, A. C., Donaldson, J. S.,
Duckworth, J. W., Dutson, G., Dutta, S. K., Emslie, R. H., Farjon, A., Fowler, S., Freyhof,
J., Garshelis, D. L., Gerlach, J., Gower, D. J., Grant, T. D., Hammerson, G. A., Harris, R.
45
B., Heaney, L. R., Hedges, S. B., Hero, J.-M., Hughes, B., Hussain, S. A., Icochea M, J.,
Inger, R. F., Ishii, N., Iskandar, D. T., Jenkins, R. K. B., Kaneko, Y., Kottelat, M., Kovacs,
K. M., Kuzmin, S. L., La Marca, E., Lamoreux, J. F., Lau, M. W. N., Lavilla, E. O., Leus,
K., Lewison, R. L., Lichtenstein, G., Livingstone, S. R., Lukoschek, V., Mallon, D. P.,
McGowan, P. J. K., McIvor, A., Moehlman, P. D., Molur, S., et al. (2010) The impact of
conservation on the status of the world's vertebrates. Science, 33, 1503-1509.
Hong Kong Special Administrative Region Government (2011) Census and Statistics
Department. Hong Kong Special Administrative Region Government, Hong Kong.
http://www.censtatd.gov.hk/home/index.jsp.
Hutchings, J. A. (2000) Collapse and recovery of marine fishes. Nature, 406, 882-885.
Hutchings, J. A., Myers, R. A., Garcia, V. B., Lucifora, L. O. and Kuparinen, A. (2012) Life-
history correlates of extinction risk and recovery potential. Ecological Applications, 22,
1061-1067.
IATTC (2011) Resolution on the conservation of oceanic whitetip sharks caught in association
with fisheries in the Antigua convention area. Inter-American Tropical Tuna Commission
(IATTC), La Jolla, USA, C-11-10, pp. 2.
Iglésias, S. P., Toulhout, L. and Sellos, D. P. (2010) Taxonomic confusion and market
mislabelling of threatened skates: Important consequences for their conservation status.
Aquatic Conservation - Marine and Freshwater Ecosystems, 20, 319-333.
IOTC (2011) Report of the Fourteenth Session of the IOTC Scientific Committee. Indian Ocean
Tuna Commission, Mahé, Seychelles, pp. 33.
IUCN (2001) IUCN Red List Categories and Criteria: version 3.1. IUCN Species Survival
Commission, Gland Switzerland and Cambridge, UK, pp. 38.
IUCN (2004) Guidelines for using the IUCN Red List Categories and Criteria. IUCN Species
Survival Commission, Gland, Switzerland, pp. 87.
Jackson, J. B. C. (2010) The future of the oceans past. Philosophical Transactions of the Royal
Society B: Biological Sciences, 365, 3765-3778.
Jennings, S., Reynolds, J. D. and Mills, S. C. (1998) Life history correlates of responses to
fisheries exploitation. Proceedings of the Royal Society B-Biological Sciences, 265, 333-
339.
Jones, K. E., Purvis, A. and Gittleman, J. L. (2003) Biological correlates of extinction risk in bats.
American Naturalist, 161, 601-614.

46
Juan-Jordá, M. J., Mosqueira, I., Freire, J. and Dulvy, N. K. (2013) Life in 3-D: life history
strategies of tunas, bonitos and mackerels. Reviews in Fish Biology and Fisheries, 23,
135-155.
Kriwet, J., Witzmann, F., Klug, S. and Heidtke, U. H. J. (2008) First direct evidence of a
vertebrate three-level trophic chain in the fossil record. Proceedings of the Royal Society
B-Biological Sciences, 275, 181-186.
Kulka, D. W., Frank, K. T. and Simon, J. E. (2002) Barndoor skate in the northwest Atlantic off
Canada: distribution in relation to temperature and depth based on commercial fisheries
data. Department of Fisheries and Oceans, Canadian Science Advisory Secretariat
Research Document, 2002/073, pp. 17.
Kyne, P. M., Carlson, J. K., Ebert, D. A., Fordham, S. V., Bizzarro, J. J., Graham, R. T., Kulka,
D. W., Tewes, E. E., Harrison, L. R. and Dulvy, N. K. (2012) The Conservation Status of
North American, Central American, and Caribbean Chondrichthyans. IUCN Species
Survival Commission Shark Specialist Group, Vancouver, Canada, pp. 148.
Kyne, P. M. and Simpfendorfer, C. A. (2007) A collation and summarization of available data on
deepwater chondrichthyans: biodiversity, life history and fisheries. IUCN Species
Survival Commission Shark Specialist Group, Newbury, England, pp. 137.
Lack, M. and Sant, G. (2009) Trends in Global Shark Catch and Recent Developments in
Management. TRAFFIC International, Cambridge, pp. 33.
Lam, V. Y. Y. and Sadovy de Mitcheson, Y. (2010) The sharks of South East Asia – unknown,
unmonitored and unmanaged. Fish and Fisheries, 12, 51-74.
Lasram, F. B. R., Guilhaumon, F. O., Albouy, C., Somot, S., Thuiller, W. and Mouillot, D. (2010)
The Mediterranean Sea as a 'cul-de-sac' for endemic fishes facing climate change.
Global Change Biology, 16, 3233-3245.
Last, P. R. (2007) The state of chondrichthyan taxonomy and systematics. Marine and
Freshwater Research, 58, 7-9.
Last, P. R. and Stevens, J. D. (1994) Sharks and Rays of Australia, CSIRO, Division of
Fisheries, Hobart, Australia.
Last, P. R. and Stevens, J. D. (2009) Sharks and Rays of Australia, CSIRO, Division of
Fisheries, Hobart, Australia.
Last, P. R., White, W. T. and Pogonoski, J. (2008a) Descriptions of new Australian
chondrichthyans. CSIRO Marine and Atmospheric Research Paper, Hobart, Australia,
22, pp. 368.

47
Last, P. R., White, W. T. and Pogonoski, J. (2008b) Descriptions of new dogfishes of the genus
Squalus (Squaloidea: Squalidae). CSIRO Marine and Atmospheric Research Paper,
Hobart, Australia, 14, pp. 136.
Last, P. R., White, W. T., Pogonoski, J. and Gledhill, D. C. (2008c) Descriptions of new
Australian skates (Batoidea: Rajoidea). CSIRO Marine and Atmospheric Research
Paper, Hobart, Australia, 21, pp. 187.
Lotze, H. K., Lenihan, H. S., Bourque, B. J., Bradbury, R. H., Cooke, R. G., Kay, M. C., Kidwell,
S. M., Kirby, M. X., Peterson, C. H. and Jackson, J. B. C. (2006) Depletion, degradation,
and recovery potential of estuaries and coastal seas. Science, 312, 1806-1809.
Mace, G., Masundire, H., Baillie, J., Ricketts, T. and Brooks, T. (2005) Biodiversity. In
Ecosystems and Human Well-being: Current State and Trends: Findings of the
Condition and Trends Working Group, (Eds, Hassan, R., Scholes, R. and Ash, N.) Island
Press, Washington D. C., pp. 77-122.
Mace, G. M., Collar, N. J., Gaston, K. J., Hilton-Taylor, C., Akcakaya, H. R., Leader-Williams,
N., Milner-Gulland, E. J. and Stuart, S. N. (2008) Quantification of extinction risk: IUCN's
system for classifying threatened species. Conservation Biology, 22, 1424-1442.
Mace, P. M. (2004) In defence of fisheries scientists, single species models and other
scapegoats: confronting the real problems. Marine Ecology Progress Series, 274, 285-
291.
Marris, E. (2007) Conservation priorities: what to let go. Nature, 450, 152-155
McClenachan, L., Cooper, A. B., Carpenter, K. E. and Dulvy, N. K. (2012) Extinction risk and
bottlenecks in the conservation of charismatic marine species. Conservation Letters, 5,
73-80.
Morato, T., Watson, R., Pitcher, T. J. and Pauly, D. (2006) Fishing down the deep. Fish and
Fisheries, 7, 24-34.
Mundy-Taylor, V. and Crook, V. (2013) Into The Deep: Implementing CITES Measures for
Commercially-valuable Sharks and Manta Rays. TRAFFIC, Cambridge, pp. 106.
Musick, J. A. (1999a) Criteria to define extinction risk in marine fishes. Fisheries, 24, 6-14.
Musick, J. A. (1999b) Ecology and conservation of long-lived marine animals. In Life in the Slow
Lane: Ecology and Conservation of Long-lived Marine Animals, Vol. 23, (Ed, Musick, J.
A.) American Fisheries Society Symposium, Bethesda, Maryland, pp. 1-10.
Musick, J. A., Harbin, M. M., Berkeley, S. A., Burgess, G. H., Eklund, A. M., Findley, L., Gilmore,
R. G., Golden, J. T., Ha, D. S., Huntsman, G. R., McGovern, J. C., Parker, S. J., Poss,
S. G., Sala, E., Schmidt, T. W., Sedberry, G. R., Weeks, H. and Wright, S. G. (2000)

48
Marine, estuarine, and diadromous fish stocks at risk of extinction in North America
(exclusive of Pacific salmonids). Fisheries, 25, 6-30.
Musick, J. A. and Musick, S. (2011) Sharks (Special Topics C3), in Review of the State of the
World Marine Fishery Resources. Food and Agriculture Organization of the United
Nations, Rome, Italy, 569, pp. 245-254.
Myers, N., Mittermeier, R. A., Mittermeier, C. G., da Fonseca, G. A. B. and Kent, J. (2000)
Biodiversity hotspots for conservation priorities. Nature, 403, 853-858.
NAFO (2011) NAFO Conservation and Enforcement Measures. North Atlantic Fisheries
Organisation. http://www.nafo.int/fisheries/frames/regulations.html.
Nakagawa, S. and Schielzeth, H. (2012) A general and simple method for obtaining R2 from
generalized linear mixed-effects models. Methods in Ecology and Evolution, 4, 133–142.
Naylor, G. J. P., Caira, J. N., Jensen, K., Rosana, K. A. M., White, W. T. and Last, P. R. (2012)
A DNA sequence-based approach to the identification of shark and ray species and its
implications for global elasmobranch diversity and parasitology. Bulletin of the American
Museum of Natural History, 367, 1-262.
NEAFC (2009) Fisheries (High Seas Fishing Notifications—North East Atlantic Fisheries
Commission) Notice 2009.
http://www.legislation.govt.nz/regulation/public/2009/0138/latest/DLM3929500.html.
Neubauer, P., Jensen, O. P., Hutchings, J. A. and Baum, J. K. (2013) Resilience and recovery
of overexploited marine populations. Science, 340, 347-349.
Newton, K., Côté, I. M., Pilling, G. M., Jennings, S. and Dulvy, N. K. (2007) Current and future
sustainability of island coral reef fisheries. Current Biology, 17, 655-658.
Polidoro, B. A., Brooks, T., Carpenter, K. E., Edgar, G. J., Henderson, S., Sanciangco, J. and
Robertson, D. R. (2012) Patterns of extinction risk and threat for marine vertebrates and
habitat-forming species in the Tropical Eastern Pacific. Marine Ecology-Progress Series,
448, 93-104.
Polidoro, B. A., Livingstone, S. R., Carpenter, K. E., Hutchinson, B., Mast, R. B., Pilcher, N. J.,
Sadovy de Mitcheson, Y. and Valenti, S. V. (2008) Status of the world’s marine species.
In Wildlife in a changing world: an analysis of the 2008 IUCN Red List of Threatened
Species, (Eds, Vié, J.-C., Hilton-Taylor, C. and Stuart, S. N.) International Union for
Conservation of Nature, Gland, Switzerland, pp. 55-65.
Porszt, E., Peterman, R. M., Dulvy, N. K., Cooper, A. B. and Irvine, J. R. (2012) Reliability of
indicators of declines in abundance. Conservation Biology, 26, 894–904.

49
Reynolds, J. D., Dulvy, N. K., Goodwin, N. B. and Hutchings, J. A. (2005) Biology of extinction
risk in marine fishes. Proceedings of the Royal Society B-Biological Sciences, 272,
2337–2344.
Ricard, D., Minto, C., Jensen, O. P. and Baum, J. K. (2012) Examining the knowledge base and
status of commercially exploited marine species with the RAM Legacy Stock
Assessment Database. Fish and Fisheries, 13, 380-398.
Robillard, M. and Séret, B. (2006) Cultural importance and decline of sawfish (Pristidae)
populations in West Africa. Cybium, 30, 23-30.
Sadovy, Y. (2005) Trouble on the reef: the imperative for managing vulnerable and valuable
fisheries. Fish and Fisheries, 6, 167-185.
Sahr, K., White, D. and Kimerling, A. J. (2003) Geodesic discrete global grid systems.
Cartography and Geographic Information Science, 30, 121-134.
Salafsky, N., Salzer, D., Stattersfield, A. J., Hilton-Taylor, C., Neugarten, R., Butchart, S. H. M.,
Collen, B., Cox, N., Master, L. L., O'Connor, S. and Wilkie, D. (2008) A standard lexicon
for biodiversity conservation: unified classifications of threats and actions. Conservation
Biology, 22, 897-911.
Schipper, J., Chanson, J. S., Chiozza, F., Cox, N. A., Hoffmann, M., Katariya, V., Lamoreux, J.,
Rodrigues, A. S. L., Stuart, S. N., Temple, H. J., Baillie, J., Boitani, L., Lacher, T. E., Jr.,
Mittermeier, R. A., Smith, A. T., Absolon, D., Aguiar, J. M., Amori, G., Bakkour, N., Baldi,
R., Berridge, R. J., Bielby, J., Black, P. A., Blanc, J. J., Brooks, T. M., Burton, J. A.,
Butynski, T. M., Catullo, G., Chapman, R., Cokeliss, Z., Collen, B., Conroy, J., Cooke, J.
G., da Fonseca, G. A. B., Derocher, A. E., Dublin, H. T., Duckworth, J. W., Emmons, L.,
Emslie, R. H., Festa-Bianchet, M., Foster, M., Foster, S., Garshelis, D. L., Gates, C.,
Gimenez-Dixon, M., Gonzalez, S., Gonzalez-Maya, J. F., Good, T. C., Hammerson, G.,
Hammond, P. S., Happold, D., Happold, M., Hare, J., Harris, R. B., Hawkins, C. E.,
Haywood, M., Heaney, L. R., Hedges, S., Helgen, K. M., Hilton-Taylor, C., Hussain, S.
A., Ishii, N., Jefferson, T. A., Jenkins, R. K. B., Johnston, C. H., Keith, M., Kingdon, J.,
Knox, D. H., Kovacs, K. M., Langhammer, P., Leus, K., Lewison, R., Lichtenstein, G.,
Lowry, L. F., Macavoy, Z., Mace, G. M., Mallon, D. P., Masi, M., McKnight, M. W.,
Medellin, R. A., Medici, P., Mills, G., Moehlman, P. D., Molur, S., Mora, A., Nowell, K.,
Oates, J. F., Olech, W., Oliver, W. R. L., Oprea, M., Patterson, B. D., Perrin, W. F.,
Polidoro, B. A., Pollock, C., Powel, A., Protas, Y., Racey, P., Ragle, J., Ramani, P.,
Rathbun, G., et al. (2008) The status of the world's land and marine mammals: diversity,
threat, and knowledge. Science, 322, 225-230.

50
Simpfendorfer, C. A., Cortés, E., Heupel, M. R., Brookes, E., Babcock, E. A., Baum, J. K.,
McAuley, R., Dudley, S. F. J., Stevens, J. D., Fordham, S. and Soldo, A. (2008) An
integrated approach to determining the risk of over-exploitation for data-poor pelagic
Atlantic sharks. International Commission for the Conservation of Atlantic Tunas, Madrid,
2008/138/140, pp. 1-14.
Simpfendorfer, C. A., Hueter, R. E., Bergman, U. and Connett, S. M. H. (2002) Results of a
fishery-independent survey for pelagic sharks in the western North Atlantic, 1977-1994.
Fisheries Research, 55, 175-192.
Simpfendorfer, C. A. and Kyne, P. M. (2009) Limited potential to recover from overfishing raises
concerns for deep-sea sharks, rays and chimaeras. Environmental Conservation, 36, 97-
103.
Sing, T., Sander, O., Beerenwinkel, N. and Lengauer, T. (2005) ROCR: visualizing classifier
performance in R. Bioinformatics, 21, 3940-3941.
Smith, S. E., Au, D. W. and Show, C. (1998) Intrinsic rebound potentials of 26 species of Pacific
sharks. Marine and Freshwater Research, 49, 663-678.
Stevens, J. D., Bonfil, R., Dulvy, N. K. and Walker, P. (2000) The effects of fishing on sharks,
rays and chimaeras (Chondrichthyans), and the implications for marine ecosystems.
ICES Journal of Marine Science, 57, 476-494.
Stevens, J. D., Walker, T. I., Cook, S. F. and Fordham, S. (2005) Threats faced by
chondrichthyan fishes. In Sharks, Rays and Chimaeras: the Status of the
Chondrichthyan Fishes, (Eds, Fowler, S. L., Cavanagh, R., Camhi, M., Burgess, G. H.,
Caillet, G. M., Fordham, S., Simpfendorfer, C. A. and Musick, J. A.) IUCN Species
Survival Commission Shark Specialist Group, Gland, Switzerland and Cambridge, UK,
pp. 48-57.
Stuart, S. N., Chanson, J. S., Cox, N. A., Young, B. E., Rodrigues, A. S. L., Fischman, D. L. and
Waller, R. A. (2004) Status and trends of amphibian declines and extinctions worldwide.
Science, 306, 1783-1786.
Swartz, W., Sala, E., Tracey, S., Watson, R. and Pauly, D. (2010) The spatial expansion and
ecological footprint of fisheries (1950 to Present). PLoS ONE, 5, e15143.
Techera, E. J. and Klein, N. (2011) Fragmented governance: reconciling legal strategies for
shark conservation and management. Marine Policy, 35, 73-78.
Veitch, L., Dulvy, N. K., Koldewey, H., Lieberman, S., Pauly, D., Roberts, C. M., Rogers, A. D.
and Baillie, J. E. M. (2012) Avoiding empty ocean commitments at Rio +20. Science,
336, 1383-1385.
51
Vincent, A. C. J., Sadovy de Mitcheson, Y., Fowler, S. L. and Lieberman, S. (2013) CITES
complements fishery management for sustainable international trade. Fish and
Fisheries.
Wallace, B. P., DiMatteo, A. D., Hurley, B. J., Finkbeiner, E. M., Bolten, A. B., Chaloupka, M. Y.,
Hutchinson, B. J., Abreu-Grobois, F. A., Amorocho, D., Bjorndal, K. A., Bourjea, J.,
Bowen, B. W., Dueñas, R. B., Casale, P., Choudhury, B. C., Costa, A., Dutton, P. H.,
Fallabrino, A., Girard, A., Girondot, M., Godfrey, M. H., Hamann, M., López-
Mendilaharsu, M., Marcovaldi, M. A., Mortimer, J. A., Musick, J. A., Nel, R., Pilcher, N.
J., Seminoff, J. A., Troëng, S., Witherington, B. and Mast, R. B. (2010) Regional
management units for marine turtles: a novel framework for prioritizing conservation and
research across multiple scales. PLoS ONE, 5, e15465.
Wallace, S. and Gisborne, B. (2006) Basking sharks: the slaughter of BC's gentle giants, New
Star Books, Vancouver.
Walpole, M., Almond, R. E. A., Besancon, C., Butchart, S. H. M., Campbell-Lendrum, D., Carr,
G. M., Collen, B., Collette, L., Davidson, N. C., Dulloo, E., Fazel, A. M., Galloway, J. N.,
Gill, M., Goverse, T., Hockings, M., Leaman, D. J., Morgan, D. H. W., Revenga, C.,
Rickwood, C. J., Schutyser, F., Simons, S., Stattersfield, A. J., Tyrrell, T. D., Vie, J. C.
and Zimsky, M. (2009) Tracking progress toward the 2010 biodiversity target and
beyond. Science, 325, 1503-1504.
Ward, R. D., Holmes, B. H., White, W. T. and Last, P. R. (2008) DNA barcoding Australasian
chondrichthyans: results and potential uses in conservation. Marine and Freshwater
Research, 59, 57-71.
White, W. T. and Last, P. R. (2012) A review of the taxonomy of chondrichthyan fishes: a
modern perspective. Journal of Fish Biology, 80, 901-917.
White, W. T., Last, P. R., Stevens, J. D., Yearsley, G. K. and Dharmadi, F. (2006) Economically
Important Sharks and Rays of Indonesia, Australian Centre for International Agricultural
Research, Canberra.
Worm, B., Davis, B., Kettemer, L., Ward-Paige, C. A., Chapman, D., Heithaus, M. R., Kessel, S.
T. and Gruber, S. H. (2013) Global catches, exploitation rates, and rebuilding options for
sharks. Marine Policy, 40, 194-204.
Worm, B., Hilborn, R., Baum, J. K., Branch, T. A., Collie, J. S., Costello, C., Fogarty, M. J.,
Fulton, E. A., Hutchings, J. A., Jennings, S., Jensen, O. P., Lotze, H. K., Mace, P. M.,
McClanahan, T. R., Minto, C., Palumbi, S. R., Parma, A. M., Ricard, D., Rosenberg, A.
A., Watson, R. and Zeller, D. (2009) Rebuilding global fisheries. Science, 325, 578-585.

52
Additional Information
Funding
Funder Author
Conservation International Sarah L. Fowler
Packard Foundation Sarah L. Fowler
Save Our Seas Foundation Nicholas K. Dulvy
UK Department of Environment and Rural
Affairs
Sarah L. Fowler
US State Department Sarah L. Fowler, Nicholas K. Dulvy
US Department of Commerce Nicholas K. Dulvy
Marine Conservation Biology Institute Sarah L. Fowler
Pew Marine Fellowship Sarah L. Fowler
Mohamed bin Zayed Species Conservation
Foundation
Nicholas K. Dulvy
Zoological Society of London Nicholas K. Dulvy
Canada Research Chairs Program Nicholas K. Dulvy
Natural Environment Research Council,
Canada
Nicholas K. Dulvy
Tom Haas and the New Hampshire
Charitable Foundation
Roger McManus, Kent E. Carpenter,
Sarah L. Fowler
Oak Foundation Sarah L. Fowler
Future of Marine Animal Populations,
Census of Marine Life
Sarah L. Fowler
IUCN Centre for Mediterranean Cooperation Sarah L. Fowler
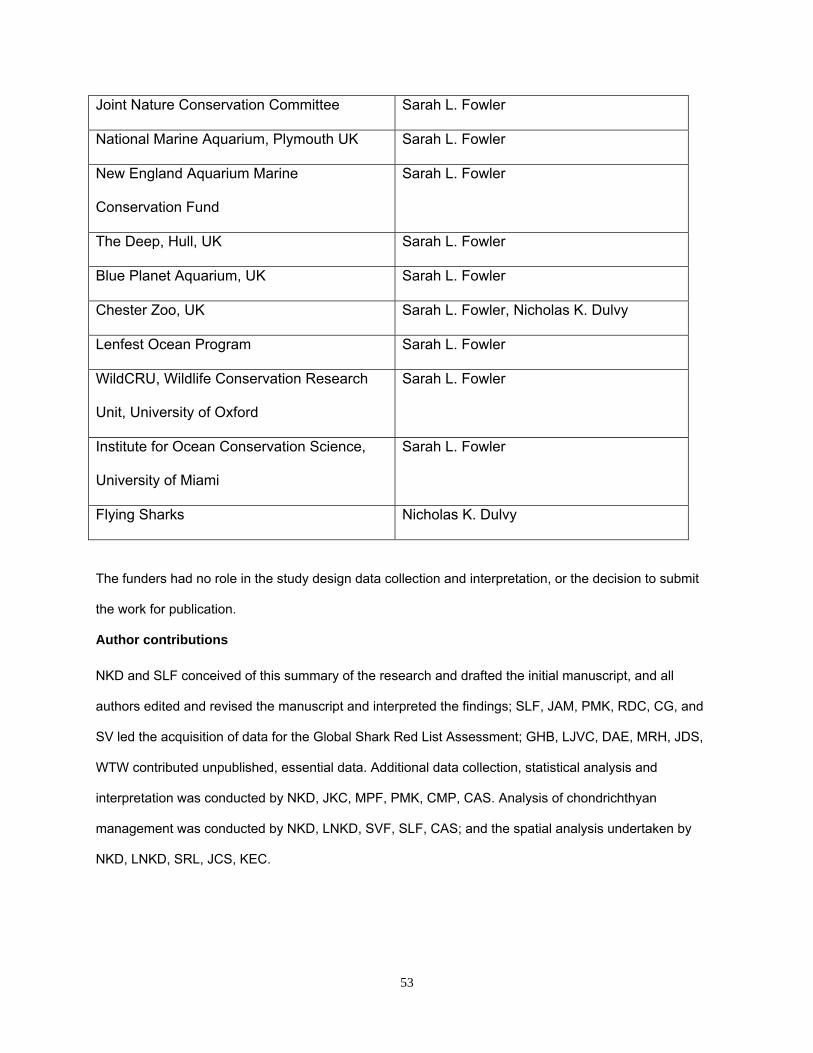
53
Joint Nature Conservation Committee Sarah L. Fowler
National Marine Aquarium, Plymouth UK Sarah L. Fowler
New England Aquarium Marine
Conservation Fund
Sarah L. Fowler
The Deep, Hull, UK Sarah L. Fowler
Blue Planet Aquarium, UK Sarah L. Fowler
Chester Zoo, UK Sarah L. Fowler, Nicholas K. Dulvy
Lenfest Ocean Program Sarah L. Fowler
WildCRU, Wildlife Conservation Research
Unit, University of Oxford
Sarah L. Fowler
Institute for Ocean Conservation Science,
University of Miami
Sarah L. Fowler
Flying Sharks Nicholas K. Dulvy
The funders had no role in the study design data collection and interpretation, or the decision to submit
the work for publication.
Author contributions
NKD and SLF conceived of this summary of the research and drafted the initial manuscript, and all
authors edited and revised the manuscript and interpreted the findings; SLF, JAM, PMK, RDC, CG, and
SV led the acquisition of data for the Global Shark Red List Assessment; GHB, LJVC, DAE, MRH, JDS,
WTW contributed unpublished, essential data. Additional data collection, statistical analysis and
interpretation was conducted by NKD, JKC, MPF, PMK, CMP, CAS. Analysis of chondrichthyan
management was conducted by NKD, LNKD, SVF, SLF, CAS; and the spatial analysis undertaken by
NKD, LNKD, SRL, JCS, KEC.

54
Table 1. 1
Observed and predicted number and percent of chondrichthyan species in IUCN Red List categories. 2
Taxon Species
number
(%)
Threatened species
number (%)
CR EN VU NT LC DD
Skates and rays 539 (51.8) 107 (19.9) 14 (1.3) 28 (2.7) 65 (6.2) 62 (6.0) 114 (11.0) 256 (24.6)
Sharks 465 (44.7) 74 (15.9) 11 (1.1) 15 (1.4) 48 (4.6) 67 (6.4) 115 (11.0) 209 (20.1)
Chimaeras 37 (3.6) 0 0 0 0 3 (0.3) 12 (1.2) 22 (2.1)
All observed 1,041 181 (17.4) 25 (2.4) 43 (4.1) 113 (10.9) 132 (12.7) 241 (23.2) 487 (46.8)
All predicted 249 (23.9) - - - 312 (29.9) 389 (37.4) 91 (8.7)
3
CR, Critically Endangered; EN, Endangered; VU, Vulnerable; NT, Near Threatened; LC, Least Concern; DD, Data Deficient. Number 4
threatened is the sum total of the categories CR, EN and VU. Species number and number threatened are expressed as percentage 5
of the taxon, whereas the percentage of each species in IUCN categories is expressed relative to the total number of species. 6

55
Table 2. 7
Number and percent of chondrichthyans in IUCN Red List categories by their main habitats. 8
Habitat Species
(%)
Threatened
(%)
CR
(%)
EN
(%)
VU
(%)
NT
(%)
LC
(%)
DD
(%)
Coastal and
continental shelf 482 (46.3) 127 (26.3) 20 (4.1) 26 (5.4) 81 (16.8) 73 (15.1) 97 (20.1) 185 (38.4)
Neritic and
epipelagic 39 (3.7) 17 (43.6) 0 3 (7.7) 14 (35.9) 13 (33.3) 5 (12.8) 4 (10.3)
Deepwater 479 (46.0) 25 (5.2) 2 (0.4) 6 (1.3) 17 (3.5) 45 (9.4) 133 (27.8) 276 (57.6)
Mesopelagic 8 (0.8) 0 0 0 0 0 4 (50.0) 4 (50.0)
Freshwater 33 (3.2) 12 (36.4) 3 (9.1) 8 (24.2) 1 (3.0) 1 (3.0) 2 (6.1) 18 (54.5)
Totals 1041 181 (17.4) 25 (2.4) 43 (4.1) 113 (10.9) 132 (12.7) 241 (23.2) 487 (46.8)
9
CR, Critically Endangered; EN, Endangered; VU, Vulnerable; NT, Near Threatened; LC, Least Concern; DD, Data Deficient.10
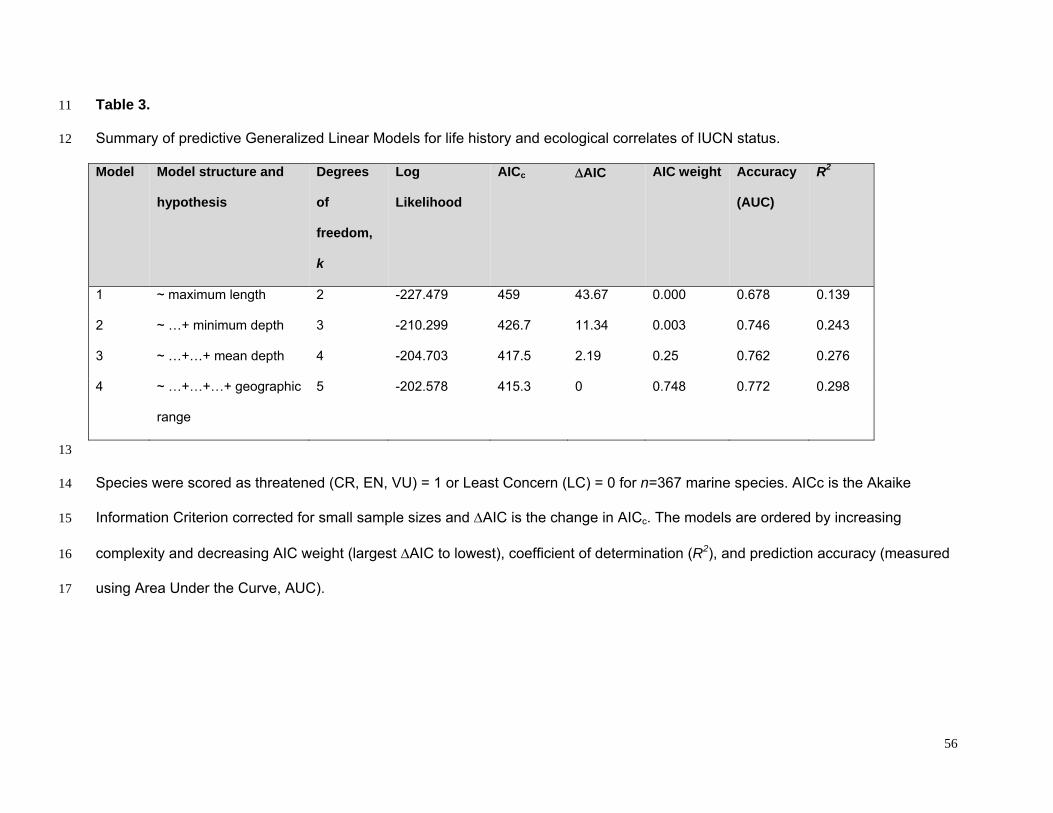
56
Table 3. 11
Summary of predictive Generalized Linear Models for life history and ecological correlates of IUCN status. 12
Model Model structure and
hypothesis
Degrees
of
freedom,
k
Log
Likelihood
AICc
AIC
AIC weight
Accuracy
(AUC)
R2
1 ~ maximum length 2 -227.479 459 43.67 0.000 0.678 0.139
2 ~ …+ minimum depth 3 -210.299 426.7 11.34 0.003 0.746 0.243
3 ~ …+…+ mean depth 4 -204.703 417.5 2.19 0.25 0.762 0.276
4 ~ …+…+…+ geographic
range
5 -202.578 415.3 0 0.748 0.772 0.298
13
Species were scored as threatened (CR, EN, VU) = 1 or Least Concern (LC) = 0 for n=367 marine species. AICc is the Akaike 14
Information Criterion corrected for small sample sizes and AIC is the change in AICc. The models are ordered by increasing 15
complexity and decreasing AIC weight (largest AIC to lowest), coefficient of determination (R2), and prediction accuracy (measured 16
using Area Under the Curve, AUC).17
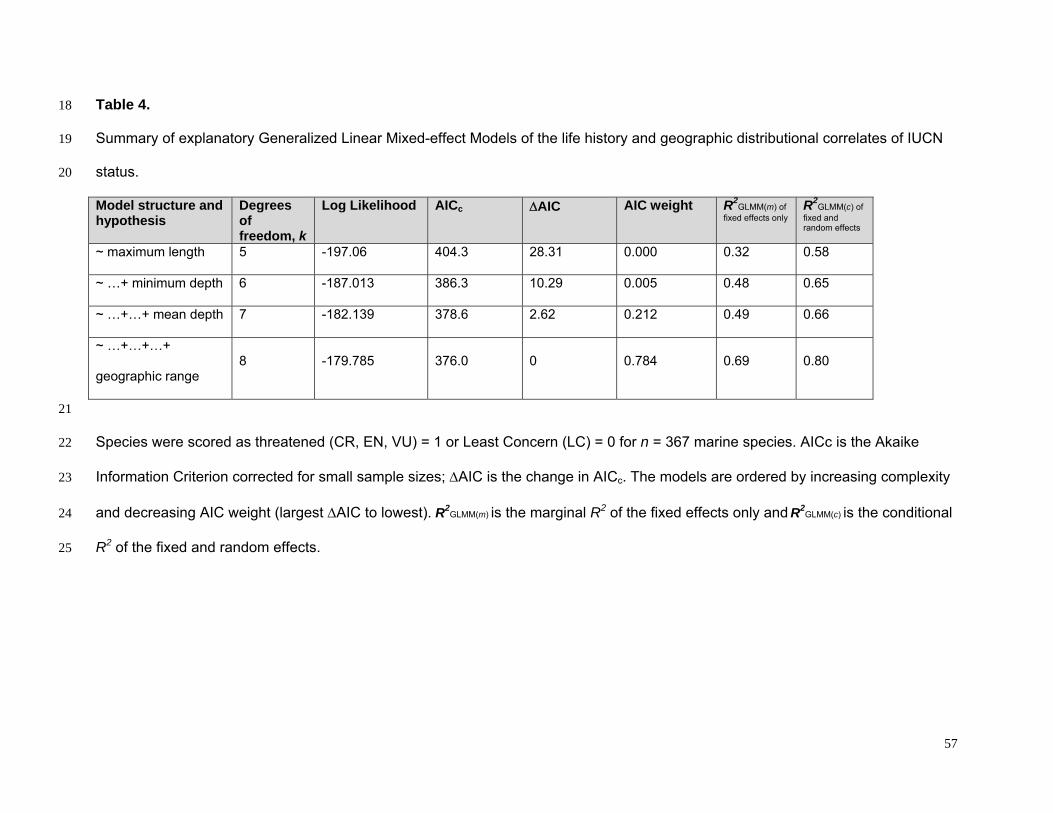
57
Table 4. 18
Summary of explanatory Generalized Linear Mixed-effect Models of the life history and geographic distributional correlates of IUCN 19
status. 20
Model structure and hypothesis
Degrees of freedom, k
Log Likelihood
AICc AIC AIC weight R2GLMM(m) of
fixed effects only R2
GLMM(c) of fixed and random effects
~ maximum length 5 -197.06 404.3 28.31 0.000 0.32 0.58
~ …+ minimum depth 6 -187.013 386.3 10.29 0.005 0.48 0.65
~ …+…+ mean depth 7 -182.139 378.6 2.62 0.212 0.49 0.66
~ …+…+…+
geographic range 8 -179.785 376.0 0 0.784 0.69 0.80
21
Species were scored as threatened (CR, EN, VU) = 1 or Least Concern (LC) = 0 for n = 367 marine species. AICc is the Akaike 22
Information Criterion corrected for small sample sizes; AIC is the change in AICc. The models are ordered by increasing complexity 23
and decreasing AIC weight (largest AIC to lowest). R2GLMM(m) is the marginal R2 of the fixed effects only and R2
GLMM(c) is the conditional 24
R2 of the fixed and random effects.25
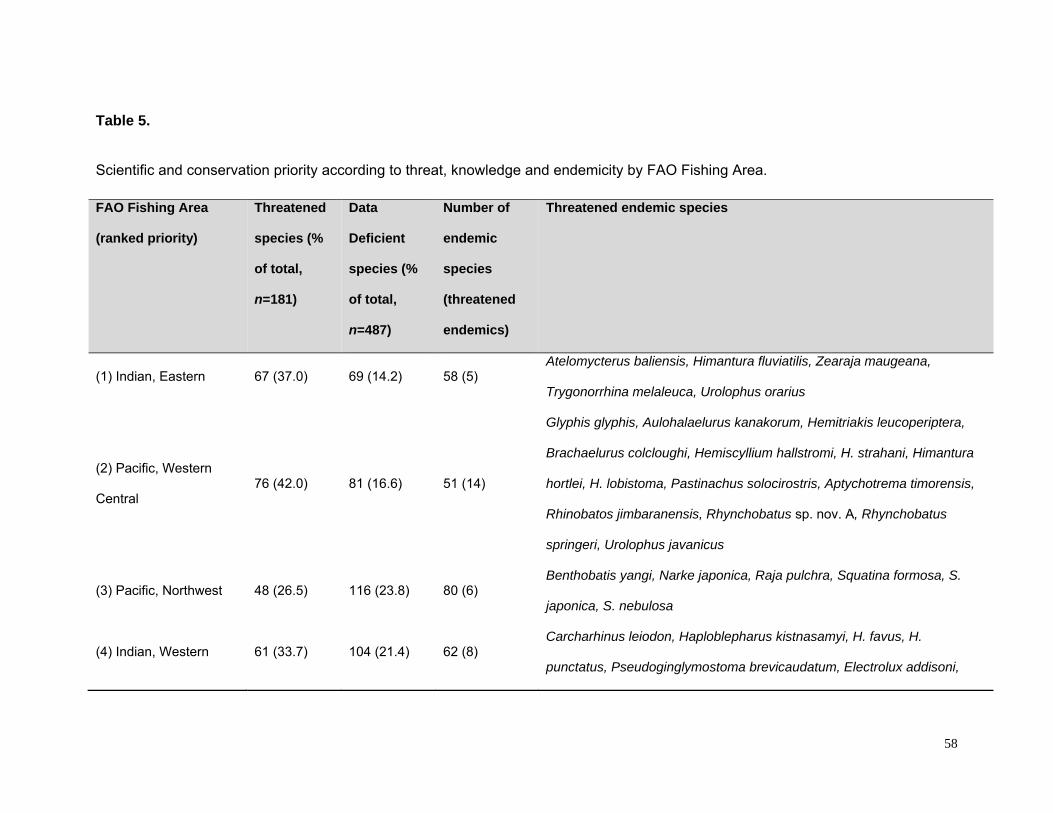
58
Table 5.
Scientific and conservation priority according to threat, knowledge and endemicity by FAO Fishing Area.
FAO Fishing Area
(ranked priority)
Threatened
species (%
of total,
n=181)
Data
Deficient
species (%
of total,
n=487)
Number of
endemic
species
(threatened
endemics)
Threatened endemic species
(1) Indian, Eastern 67 (37.0) 69 (14.2) 58 (5) Atelomycterus baliensis, Himantura fluviatilis, Zearaja maugeana,
Trygonorrhina melaleuca, Urolophus orarius
(2) Pacific, Western
Central 76 (42.0) 81 (16.6) 51 (14)
Glyphis glyphis, Aulohalaelurus kanakorum, Hemitriakis leucoperiptera,
Brachaelurus colcloughi, Hemiscyllium hallstromi, H. strahani, Himantura
hortlei, H. lobistoma, Pastinachus solocirostris, Aptychotrema timorensis,
Rhinobatos jimbaranensis, Rhynchobatus sp. nov. A, Rhynchobatus
springeri, Urolophus javanicus
(3) Pacific, Northwest 48 (26.5) 116 (23.8) 80 (6) Benthobatis yangi, Narke japonica, Raja pulchra, Squatina formosa, S.
japonica, S. nebulosa
(4) Indian, Western 61 (33.7) 104 (21.4) 62 (8) Carcharhinus leiodon, Haploblepharus kistnasamyi, H. favus, H.
punctatus, Pseudoginglymostoma brevicaudatum, Electrolux addisoni,
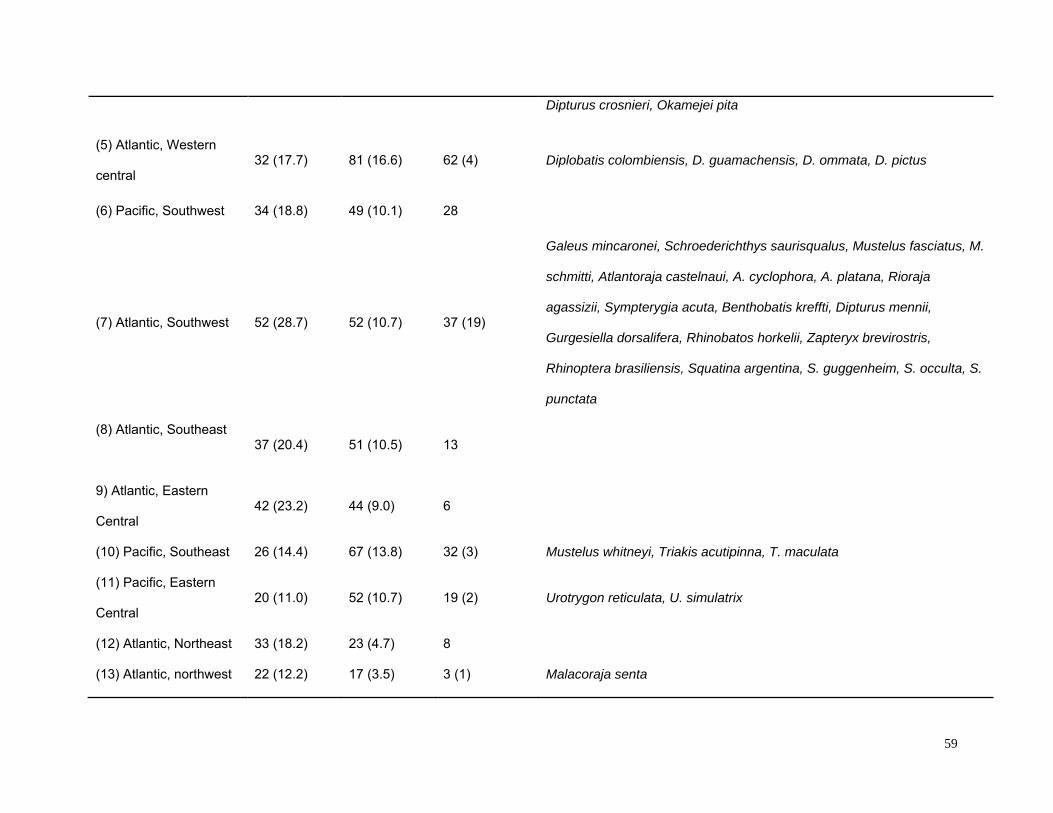
59
Dipturus crosnieri, Okamejei pita
(5) Atlantic, Western
central 32 (17.7) 81 (16.6) 62 (4) Diplobatis colombiensis, D. guamachensis, D. ommata, D. pictus
(6) Pacific, Southwest 34 (18.8) 49 (10.1) 28
(7) Atlantic, Southwest 52 (28.7) 52 (10.7) 37 (19)
Galeus mincaronei, Schroederichthys saurisqualus, Mustelus fasciatus, M.
schmitti, Atlantoraja castelnaui, A. cyclophora, A. platana, Rioraja
agassizii, Sympterygia acuta, Benthobatis kreffti, Dipturus mennii,
Gurgesiella dorsalifera, Rhinobatos horkelii, Zapteryx brevirostris,
Rhinoptera brasiliensis, Squatina argentina, S. guggenheim, S. occulta, S.
punctata
(8) Atlantic, Southeast
37 (20.4) 51 (10.5) 13
9) Atlantic, Eastern
Central 42 (23.2) 44 (9.0) 6
(10) Pacific, Southeast 26 (14.4) 67 (13.8) 32 (3) Mustelus whitneyi, Triakis acutipinna, T. maculata
(11) Pacific, Eastern
Central 20 (11.0) 52 (10.7) 19 (2) Urotrygon reticulata, U. simulatrix
(12) Atlantic, Northeast 33 (18.2) 23 (4.7) 8
(13) Atlantic, northwest 22 (12.2) 17 (3.5) 3 (1) Malacoraja senta

60
(14) Mediterranean &
Black Sea 34 (18.8) 16 (3.3) 3 (1) Leucoraja melitensis
(15) Pacific, Northeast 9 (5.0) 11 (2.3) 0
Indian, Antarctic 1 (0.6) 4 (0.8) 2
Atlantic, Antarctic 1 (0.6) 4 (0.8) 2
Pacific, Antarctic 0 3 (0.6) 0
Arctic Sea 0 0 0
Endemics were defined as those species found only within a single FAO Fishing Area. FAO Fishing Areas were ranked according to
greatest species richness, percent threatened species, percent Data Deficient species, number of endemic species and number of
threatened endemic species.
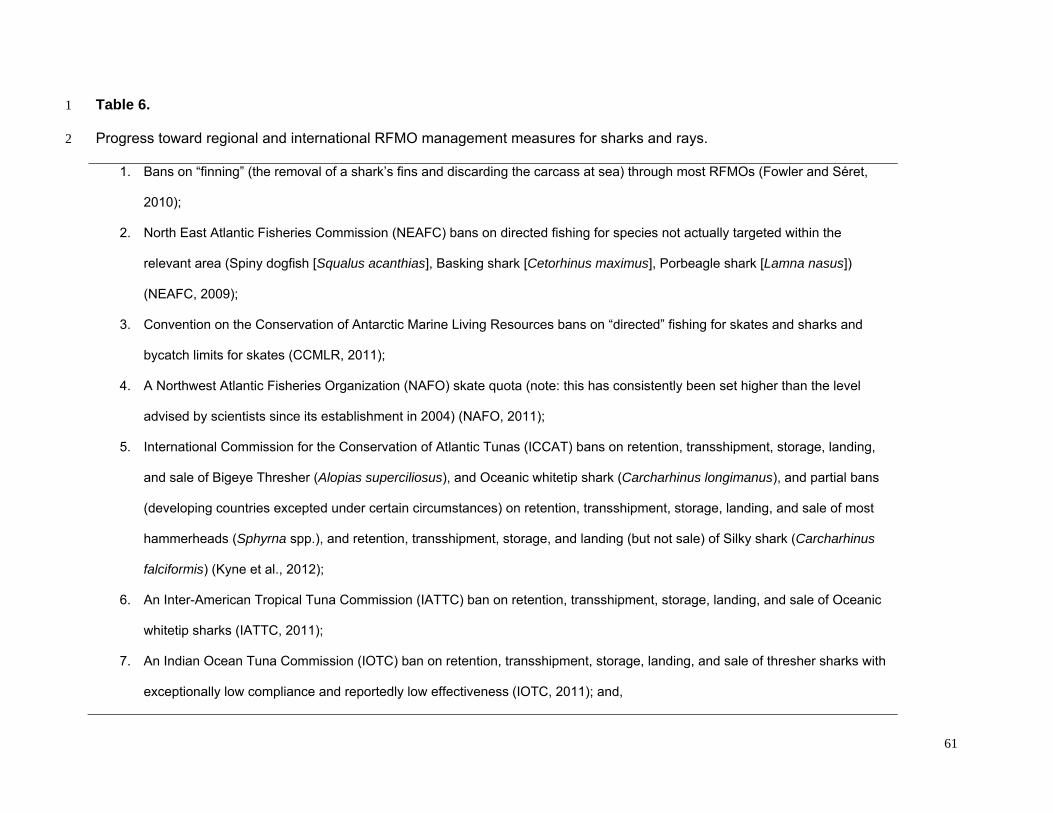
61
Table 6. 1
Progress toward regional and international RFMO management measures for sharks and rays. 2
1. Bans on “finning” (the removal of a shark’s fins and discarding the carcass at sea) through most RFMOs (Fowler and Séret,
2010);
2. North East Atlantic Fisheries Commission (NEAFC) bans on directed fishing for species not actually targeted within the
relevant area (Spiny dogfish [Squalus acanthias], Basking shark [Cetorhinus maximus], Porbeagle shark [Lamna nasus])
(NEAFC, 2009);
3. Convention on the Conservation of Antarctic Marine Living Resources bans on “directed” fishing for skates and sharks and
bycatch limits for skates (CCMLR, 2011);
4. A Northwest Atlantic Fisheries Organization (NAFO) skate quota (note: this has consistently been set higher than the level
advised by scientists since its establishment in 2004) (NAFO, 2011);
5. International Commission for the Conservation of Atlantic Tunas (ICCAT) bans on retention, transshipment, storage, landing,
and sale of Bigeye Thresher (Alopias superciliosus), and Oceanic whitetip shark (Carcharhinus longimanus), and partial bans
(developing countries excepted under certain circumstances) on retention, transshipment, storage, landing, and sale of most
hammerheads (Sphyrna spp.), and retention, transshipment, storage, and landing (but not sale) of Silky shark (Carcharhinus
falciformis) (Kyne et al., 2012);
6. An Inter-American Tropical Tuna Commission (IATTC) ban on retention, transshipment, storage, landing, and sale of Oceanic
whitetip sharks (IATTC, 2011);
7. An Indian Ocean Tuna Commission (IOTC) ban on retention, transshipment, storage, landing, and sale of thresher sharks with
exceptionally low compliance and reportedly low effectiveness (IOTC, 2011); and,
62
8. A Western and Central Pacific Fisheries Commission ban on retention, transshipment, storage, and landing (but not sale) of
Oceanic whitetip sharks (Clarke et al., 2013).
3
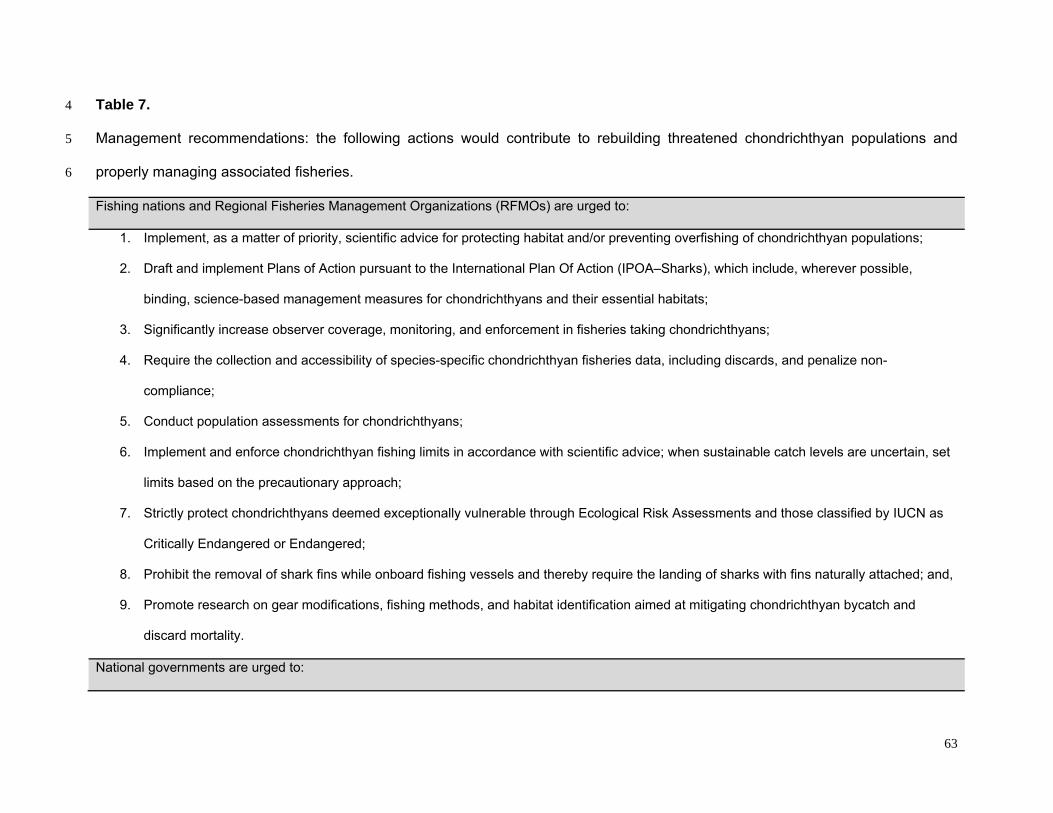
63
Table 7. 4
Management recommendations: the following actions would contribute to rebuilding threatened chondrichthyan populations and 5
properly managing associated fisheries. 6
Fishing nations and Regional Fisheries Management Organizations (RFMOs) are urged to:
1. Implement, as a matter of priority, scientific advice for protecting habitat and/or preventing overfishing of chondrichthyan populations;
2. Draft and implement Plans of Action pursuant to the International Plan Of Action (IPOA–Sharks), which include, wherever possible,
binding, science-based management measures for chondrichthyans and their essential habitats;
3. Significantly increase observer coverage, monitoring, and enforcement in fisheries taking chondrichthyans;
4. Require the collection and accessibility of species-specific chondrichthyan fisheries data, including discards, and penalize non-
compliance;
5. Conduct population assessments for chondrichthyans;
6. Implement and enforce chondrichthyan fishing limits in accordance with scientific advice; when sustainable catch levels are uncertain, set
limits based on the precautionary approach;
7. Strictly protect chondrichthyans deemed exceptionally vulnerable through Ecological Risk Assessments and those classified by IUCN as
Critically Endangered or Endangered;
8. Prohibit the removal of shark fins while onboard fishing vessels and thereby require the landing of sharks with fins naturally attached; and,
9. Promote research on gear modifications, fishing methods, and habitat identification aimed at mitigating chondrichthyan bycatch and
discard mortality.
National governments are urged to:

64
10. Propose and work to secure RFMO management measures based on scientific advice and the precautionary approach;
11. Promptly and accurately report species-specific chondrichthyan landings to relevant national and international authorities;
12. Take unilateral action to implement domestic management for fisheries taking chondrichthyans, including precautionary limits and/or
protective status where necessary, particularly for species classified by IUCN as Vulnerable, Endangered or Critically Endangered, and
encourage similar actions by other Range States;
13. Adopt bilateral fishery management agreements for shared chondrichthyan populations;
14. Ensure active membership in Convention of International Trade in Endangered Species (CITES), Convention of Migratory Species (CMS),
RFMOs, and other relevant regional and international agreements;
15. Fully implement and enforce CITES chondrichthyan listings based on solid non-detriment findings, if trade in listed species is allowed;
16. Propose and support the listing of additional threatened chondrichthyan species under CITES and CMS and other relevant wildlife
conventions;
17. Collaborate on regional agreements and the CMS migratory shark Memorandum of Understanding (CMS, 2010), with a focus on securing
concrete conservation actions; and,
18. Strictly enforce chondrichthyan fishing and protection measures and impose meaningful penalties for violations.

65
Table 8. 7
The locations, dates, number of participants and the number of countries represented at each of 8
the SSG Red List workshops, along with unique totals. 9
Red List Workshop Location Date Participants Countries
Australia and Oceania Queensland, Australia March 2003 26 5
South America Manaus, Brazil June 2003 25 8
Sub-equatorial Africa Durban, South Africa September 2003 28 9
Mediterranean San Marino October 2003 29 15
Deep sea sharks Otago Peninsula, New
Zealand November 2003 32 11
North and Central
America Florida, USA June 2004 55 13
Batoids (skates and
rays)
Cape Town, South
Africa September 2004 24 11
Expert Panel Review Newbury, UK March 2005 12 5
Northeast Atlantic Peterborough, UK February 2006 25 9
West Africa Dakar, Senegal June 2006 25 12
Expert Panel Review Newbury, UK July 2006 9 12
Pelagic sharks Oxford, UK February 2007 18 11
Northwest Pacific/
Southeast Asia Batangas, Philippines June/July 2007 23 13
Totals 227 57
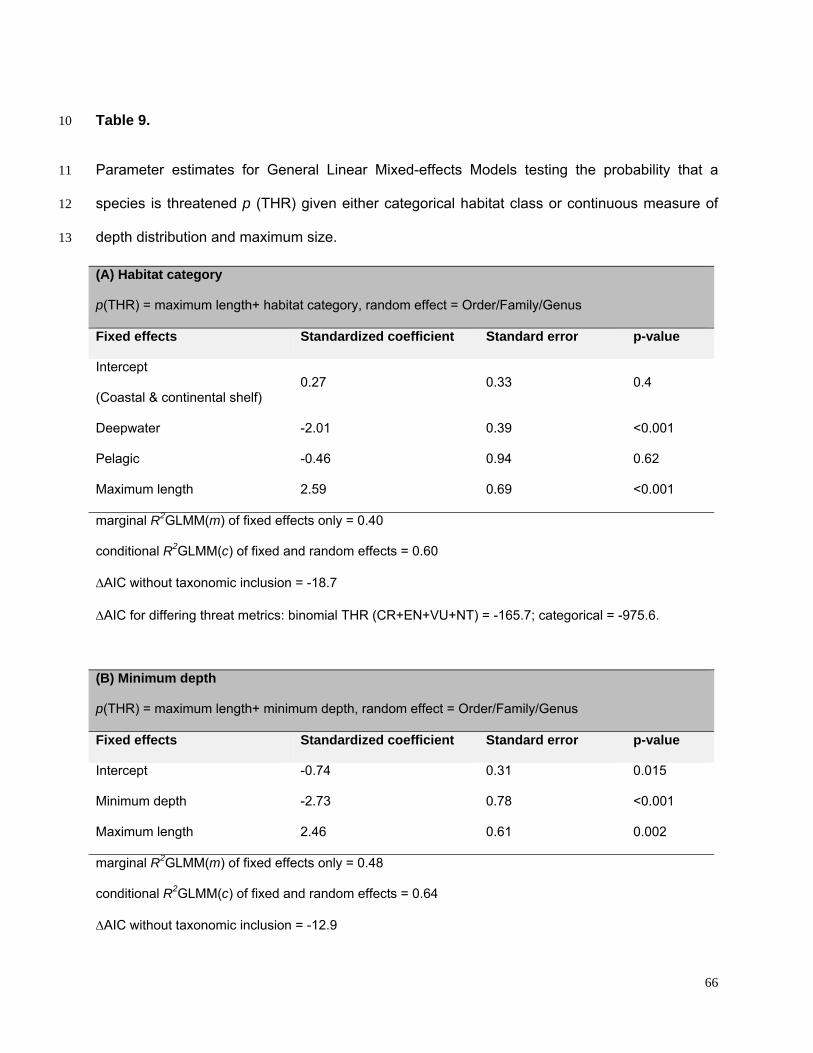
66
Table 9. 10
Parameter estimates for General Linear Mixed-effects Models testing the probability that a 11
species is threatened p (THR) given either categorical habitat class or continuous measure of 12
depth distribution and maximum size. 13
(A) Habitat category
p(THR) = maximum length+ habitat category, random effect = Order/Family/Genus
Fixed effects Standardized coefficient Standard error p-value
Intercept
(Coastal & continental shelf) 0.27 0.33 0.4
Deepwater -2.01 0.39 <0.001
Pelagic -0.46 0.94 0.62
Maximum length 2.59 0.69 <0.001
marginal R2GLMM(m) of fixed effects only = 0.40
conditional R2GLMM(c) of fixed and random effects = 0.60
AIC without taxonomic inclusion = -18.7
AIC for differing threat metrics: binomial THR (CR+EN+VU+NT) = -165.7; categorical = -975.6.
(B) Minimum depth
p(THR) = maximum length+ minimum depth, random effect = Order/Family/Genus
Fixed effects Standardized coefficient Standard error p-value
Intercept -0.74 0.31 0.015
Minimum depth -2.73 0.78 <0.001
Maximum length 2.46 0.61 0.002
marginal R2GLMM(m) of fixed effects only = 0.48
conditional R2GLMM(c) of fixed and random effects = 0.64
AIC without taxonomic inclusion = -12.9
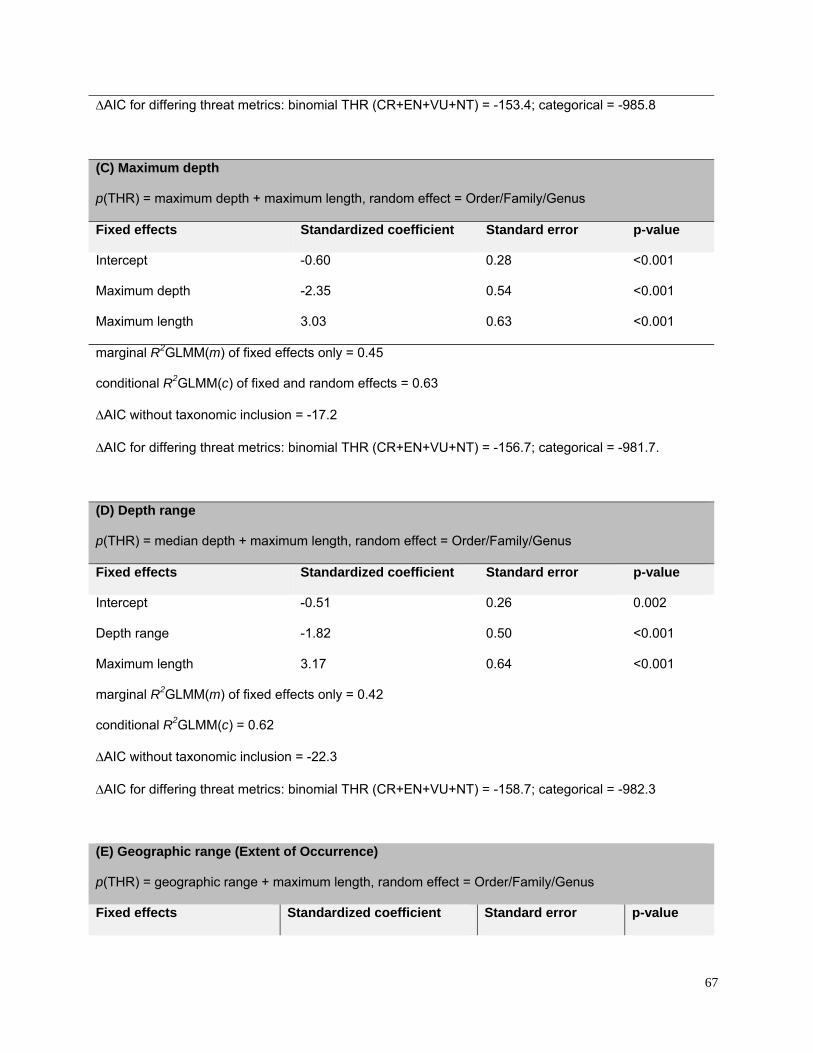
67
AIC for differing threat metrics: binomial THR (CR+EN+VU+NT) = -153.4; categorical = -985.8
(C) Maximum depth
p(THR) = maximum depth + maximum length, random effect = Order/Family/Genus
Fixed effects Standardized coefficient Standard error p-value
Intercept -0.60 0.28 <0.001
Maximum depth -2.35 0.54 <0.001
Maximum length 3.03 0.63 <0.001
marginal R2GLMM(m) of fixed effects only = 0.45
conditional R2GLMM(c) of fixed and random effects = 0.63
AIC without taxonomic inclusion = -17.2
AIC for differing threat metrics: binomial THR (CR+EN+VU+NT) = -156.7; categorical = -981.7.
(D) Depth range
p(THR) = median depth + maximum length, random effect = Order/Family/Genus
Fixed effects Standardized coefficient Standard error p-value
Intercept -0.51 0.26 0.002
Depth range -1.82 0.50 <0.001
Maximum length 3.17 0.64 <0.001
marginal R2GLMM(m) of fixed effects only = 0.42
conditional R2GLMM(c) = 0.62
AIC without taxonomic inclusion = -22.3
AIC for differing threat metrics: binomial THR (CR+EN+VU+NT) = -158.7; categorical = -982.3
(E) Geographic range (Extent of Occurrence)
p(THR) = geographic range + maximum length, random effect = Order/Family/Genus
Fixed effects Standardized coefficient Standard error p-value
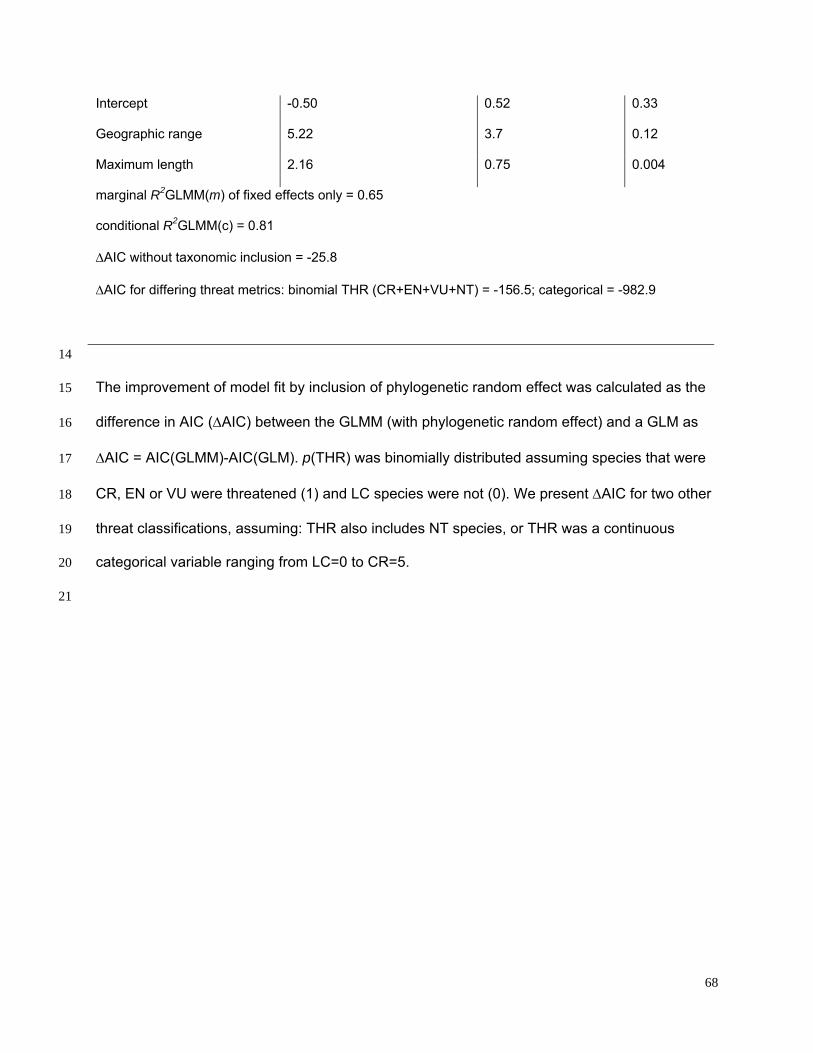
68
Intercept -0.50 0.52 0.33
Geographic range 5.22 3.7 0.12
Maximum length 2.16 0.75 0.004
marginal R2GLMM(m) of fixed effects only = 0.65
conditional R2GLMM(c) = 0.81
AIC without taxonomic inclusion = -25.8
AIC for differing threat metrics: binomial THR (CR+EN+VU+NT) = -156.5; categorical = -982.9
14
The improvement of model fit by inclusion of phylogenetic random effect was calculated as the 15
difference in AIC (AIC) between the GLMM (with phylogenetic random effect) and a GLM as 16
AIC = AIC(GLMM)-AIC(GLM). p(THR) was binomially distributed assuming species that were 17
CR, EN or VU were threatened (1) and LC species were not (0). We present AIC for two other 18
threat classifications, assuming: THR also includes NT species, or THR was a continuous 19
categorical variable ranging from LC=0 to CR=5. 20
21
69
Figure legends 22
23
Figure 1. The trajectory and spatial pattern of chondrichthyan fisheries catch landings and fin exports. (A) 24
The landed catch of chondrichthyans reported to the Food and Agriculture Organization of the United 25
Nations from 1950 to 2009 up to the peak in 2003 (black) and subsequent decline (red). (B) The rising 26
contribution of rays and shark-like rays to the taxonomically-differentiated global reported landed catch 27
Sharks landings, light grey; ray landings, black; log ratio (rays/sharks), red. Log ratios >0 occur when 28
more rays are landed than sharks. The peak catch of taxonomically-differentiated rays and shark like rays 29
peaks at 289,353 tonnes in 2003 (C) The main shark and ray fishing nations are grey-shaded according 30
to their percent share of the total average annual chondrichthyan landings reported to FAO from 1999 to 31
2009. The relative share of shark and ray fin trade exports to Hong Kong in 2010 are represented by fin 32
size. The taxonomically-differentiated proportion excludes the ‘nei’ (not elsewhere included) and generic 33
‘sharks, rays and chimaeras’ category 34
35
Figure 2. IUCN Red List Threat status and the depth distribution of chondrichthyans in the FAO Fishing 36
Areas of the Atlantic, Indian and Pacific Oceans, and Polar Seas. Each vertical line represents the depth 37
range (surface-ward minimum to the maximum reported depth) of each species and is colored according 38
to threat status: CR, red; EN, orange; VU, yellow; NT, pale green; LC, green, and DD, gray. Species are 39
ordered left to right by increasing median depth. The depth limit of the continental shelf is indicated by the 40
horizontal gray line at 200 m. The Polar Seas include the following FAO Fishing Areas: Antarctic – 41
Atlantic (Area 48), Indian (Area 58), Pacific (Area 88), and the Arctic Sea (Area 18). 42
43
Figure 2 supplement 1. Map of Food and Agriculture Organization of the United Nations Fishing 44
Areas and their codes: 18, Arctic Sea; 21, Atlantic, Northwest; 27, Atlantic, Northeast; 31, 45
Atlantic, Western Central; 34, Atlantic, Eastern Central; 37, Mediterranean and Black Sea; 41, 46
Atlantic, Southwest; 47, Atlantic, Southeast; 48, Atlantic, Antarctic; 51, Indian Ocean, Western; 47
57, Indian Ocean, Eastern; 58, Indian Ocean, Antarctic and Southern; 61, Pacific, Northwest; 67, 48

70
Pacific, Northeast; 71, Pacific, Western Central; 77, Pacific, Eastern Central; 81, Pacific, 49
Southwest; 87, Pacific, Southeast; and, 88, Pacific, Antarctic. 50
51
Figure 3. Standardized effect sizes with 95% confidence intervals from the two best explanatory models 52
of life histories, geographic range and extinction risk in chondrichthyans. The data were standardized by 53
subtracting the mean and dividing by one standard deviation to allow for comparison among parameters. 54
The relative importance is calculated as the sum of the Akaike weights of the models containing each 55
variable. Chondrichthyans were scored as threatened (CR, EN, VU) = 1 or Least Concern (LC) = 0 for 56
n=367 marine species. Threat status was modeled using General Linear Mixed-effects Models, with size 57
and geography treated as fixed effects and taxonomy hierarchy as a random effect to account for 58
phylogenetic non-independence. 59
60
Figure 4. Life history sensitivity, accessibility to fisheries and extinction risk. Probability that a species is 61
threatened due to the combination of intrinsic life history sensitivity (maximum body size, cm total length, 62
TL) and accessibility to fisheries which is represented as minimum depth limit, depth range and 63
geographic range size (Extent of Occurrence). The lines represent the variation in body size-dependent 64
risk for the upper quartile, median and lower quartile of each range metric. The examplar species are all 65
of similar maximum body length and the difference in risk is largely due to differences in geographic 66
distribution. Chondrichthyans were scored as threatened (CR, EN, VU) = 1 or Least Concern (LC) = 0 for 67
n=366 marine species. The lines are the best fits from General Linear Mixed-effects Models, with 68
maximum body size and geographic distribution traits treated as fixed effects and taxonomy hierarchy as 69
a random effect to account for phylogenetic non-independence. Each vertical line in each of the ‘rugs’ 70
represents the maximum body size and Red List status of each species: threatened (red) and LC (green). 71
72
Figure 5. Life history, habitat and extinction risk in chondrichthyans. IUCN Red List status as a function of 73
maximum body size (total length, TL cm) and accessibility to fisheries in marine chondrichthyans in three 74
main habitats: coastal and continental shelf <200m (‘Continental shelf’); neritic and oceanic pelagic 75
<200m (‘Pelagic’); and, deepwater >200m (‘Deepwater’), n=367 (threatened n=148; Least Concern 76
71
n=219). The upper and lower ‘rug’ represents the maximum body size and Red List status of each 77
species: threatened (upper rugs) and Least Concern (lower rugs). The lines are best fit using Generalized 78
Linear Mixed-effects Models with 95% confidence intervals (Table 9). 79
80
Figure 6. Evolutionary uniqueness and taxonomic conservation priorities. Threat among marine 81
chondrichthyan families varies with life history sensitivity (maximum length) and exposure to fisheries 82
(depth distribution). (A) Proportion of threatened species and the richness of each taxonomic family. 83
Coloured bands indicate the significance levels of a one-tailed binomial test at p = 0.05, 0.01 and 0.001. 84
Those families with significantly greater (or lower) than expected threat levels at p < 0.05 against a null 85
expectation that extinction risk is equal across families (35.6%). (B) The most and least threatened 86
taxonomic families. (C) Average life history sensitivity and accessibility to fisheries of 56 chondrichthyan 87
families. Significantly greater (or lower) risk than expected is shown in red (green). 88
89
Figure 7. Global patterns of marine chondrichthyan diversity, threat and knowledge. (A) Total 90
chondrichthyan richness, (B) the number of Data Deficient sharks, rays and chimaeras, and threat by 91
major habitat: (C) coastal and continental shelf (<200m depth), (D) neritic and epipelagic (<200m depth), 92
and (E) deepwater slope and abyssal plain (>200m) habitats. Numbers expressed as the total number of 93
species in each 23,322 km2 cell. 94
95
Figure 8. Spatial variation in the relative extinction risk of marine chondrichthyans. Residuals of the 96
relationship between total number of data sufficient chondrichthyans and total number of threatened 97
species per cell, where positive values (orange to red) represent cells with higher threat than expected for 98
their richness alone. 99
100
Figure 9. Irreplaceability hotspots of the endemic threatened marine chondrichthyans. Endemics were 101
defined as species with an Extent of Occurrence of <500,000 km2
(n=66). Irreplaceable cells with the 102
greatest number of small range species are shown in red, with blue cells showing areas of lower, but still 103
significant irreplaceability. Irreplaceability is the sum of the inverse of the geographic range sizes of all 104

72
threatened endemic species in the cell. A value of 0.1 means that on average a single cell represents one 105
tenth of the global range of all the species present in the cell.
106
107
Figure 10. Elevated threat in chondrichthyans with the largest geographic ranges, spanning the greatest 108
number of national jurisdiction. Frequency distribution of number of jurisdictions spanned by all 109
chondrichthyans (black, n=1,041) and threatened species only (red, n=174), for (A) country EEZs, and 110
(B) the overrepresentation of threatened species spanning a large number of country EEZs, shown by the 111
log ratio of proportion of threatened species over the proportion of all species. The proportion of 112
threatened species is greater than the proportion of all species where the log ratio = 0, which corresponds 113
to range spans of 16 and more countries. 114

Figure 1.
raysBA rays
sharks
andi
ngs
(ton
nes)
FAO
la
All chondrichthyans(sharks, rays and chimaeras)
Threat and national share of catch & tradeC
1–5
6–11
12– 9
20-27
28–30
Threatened species
Landings h (%)
0–12 3share (%) 2–34–67–9
10–14
<11-7
10-1222
Fin tradeshare (%)
1
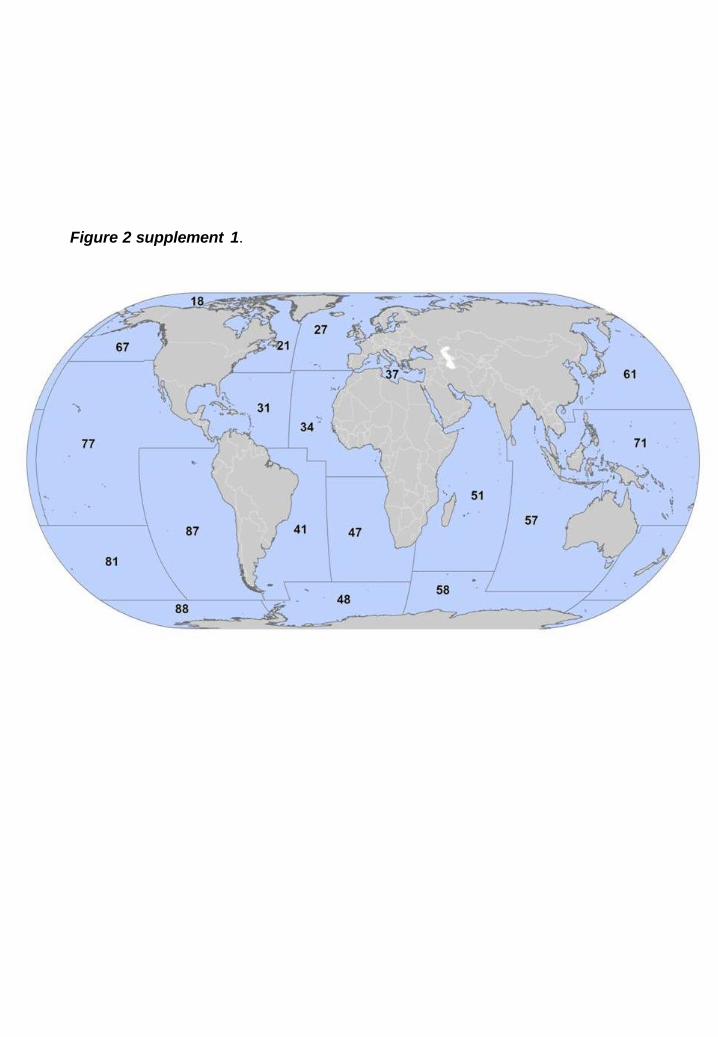
Figure 2 supplement 1.

0.95
0.99
0.98
0.79
-2 -1 0 1 2 3 4
Geographic range
Depth range
Minimum depth
Maximum length
Effect size (standard deviation units)
Relative importance
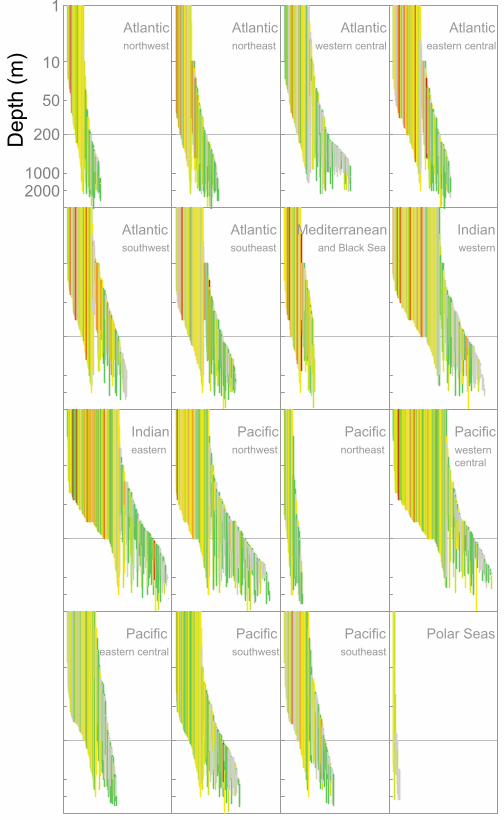
Atlanticnorthwest
Atlanticnortheast
Atlanticwestern central
Atlanticeastern central
Atlanticsouthwest
Atlanticsoutheast
Mediterraneanand Black Sea
Indianwestern
Indianeastern
Pacificnorthwest
Pacificnortheast
Pacificwesterncentral
Pacificeastern central
Pacificsouthwest
Pacificsoutheast
Polar Seas
20001000
200
50
10
1D
epth
(m
)
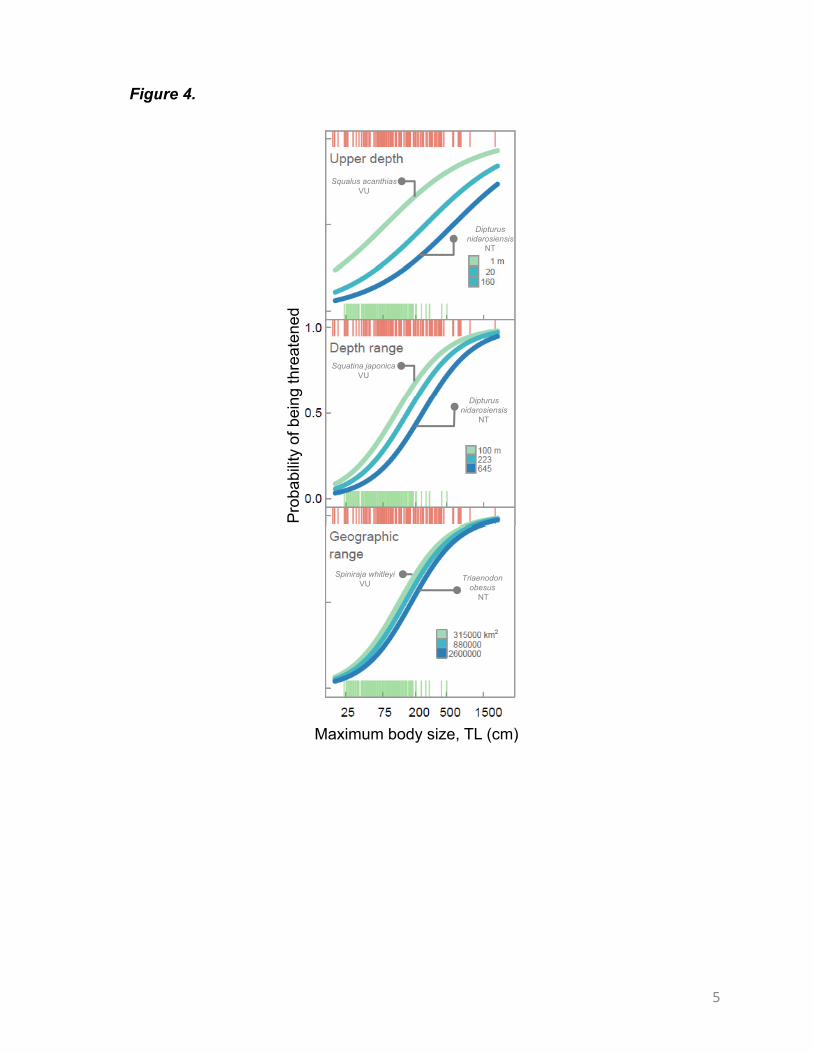
Figure 4.
Squalus acanthias VU
Dipturusnidarosiensis
NT
Squatina japonica VU
g th
reat
ened
Dipturusnidarosiensis
NT
Pro
babi
lity
of b
ein
Triaenodonobesus
NT
Spiniraja whitleyiVU
Maximum body size, TL (cm)
5

0.0
0.5
1.0Three habitats
|||| | ||| | | ||||| |
| |||
Pelagic
| || || ||| || ||| | || |||||| | || |||| |||||| | || | ||| || ||| || | ||| |||||| ||||| || || || | ||| || ||||| ||| | || || ||| |||| ||| | ||||| ||
0.0
0.5
1.0
| ||| || || |||| || || |||||| | || ||| | ||||| |||||| |||||| |||| |||| || || || |||| || ||| ||| ||| || |||||| || |
Continentalshelf
| || | ||||| | | ||| | ||||| |||| |
25 75 200 1500
Deepwater
| | |||| |||| || | ||| | || ||| || | ||||||| || ||||||| | ||||| || | ||| || || |||||| |||| | ||||| | ||| |||||| ||| || |||| |||||| || ||| |||||||||||| ||| |||| ||| ||| |
Pro
babi
lity
of b
eing
thre
aten
ed
500
Maximum body size (cm, TL)
Figure 5.
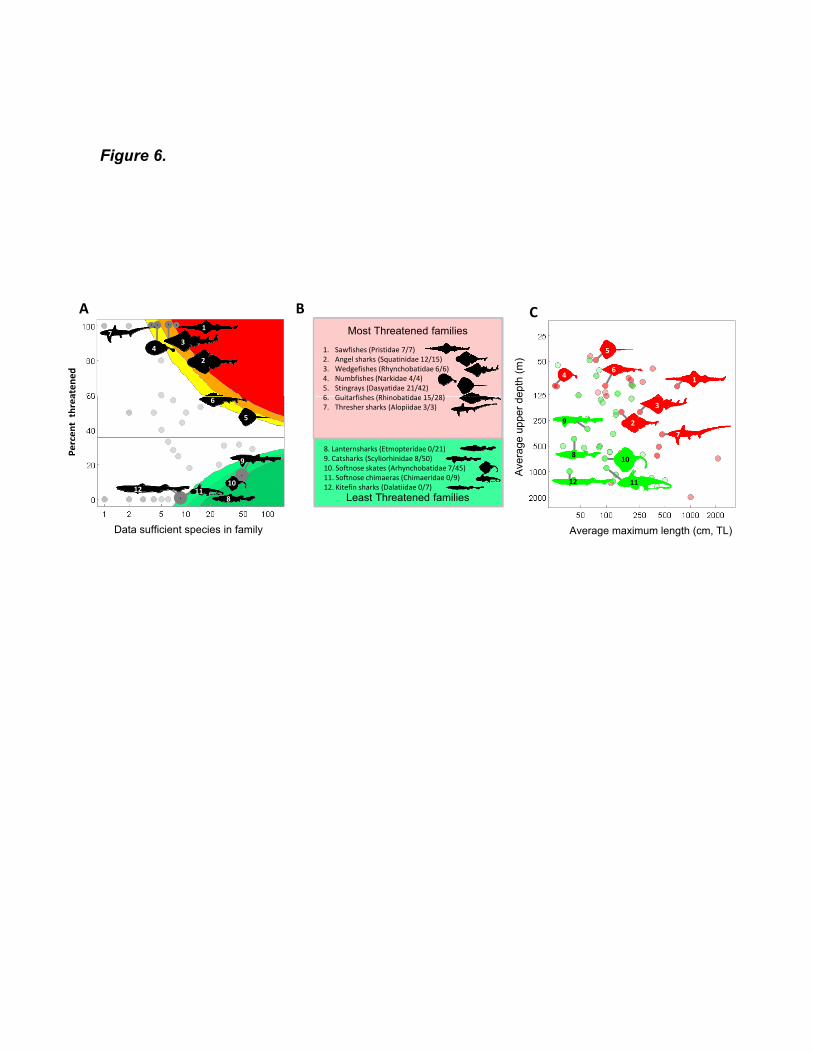
Figure 6.
1. Sawfishes (Pristidae 7/7)2. Angel sharks (Squatinidae 12/15)3. Wedgefishes (Rhynchobatidae 6/6)4. Numbfishes (Narkidae 4/4)5. Stingrays (Dasyatidae 21/42)6 Guitarfishes (Rhinobatidae 15/28)
2
34
17
Perc
ent
thre
aten
ed
A B
14
5
6
Ave
rage
upp
er d
epth
(m
)
Most Threatened families
C
6. Guitarfishes (Rhinobatidae 15/28)7. Thresher sharks (Alopiidae 3/3)
8. Lanternsharks (Etmopteridae 0/21)9. Catsharks (Scyliorhinidae 8/50)10. Softnose skates (Arhynchobatidae 7/45)11. Softnose chimaeras (Chimaeridae 0/9)12. Kitefin sharks (Dalatiidae 0/7)
5
8
9
101112
Data sufficient species in family
6
2
3
7
810
11
9
12
Least Threatened families
Average maximum length (cm, TL)

Chondrichthyan species richness
Figure 7.
A
1 – 9
10 – 30
31 – 50
51 – 75
76 ‐140
# species
1 ‐ 5
6 – 12
13 – 20
21 ‐ 30
31 – 55
Data Deficiency
12 4
B
# species
3
1 ‐ 3
Coastal & continental shelf threatC
# species
4 – 78 – 1314 – 1819 – 30
Neritic & epipelagic threatD
1 – 6
7 – 9
10 – 11
12 – 15
1 2
3
4
57
6
D
# species
1 – 23 – 45 – 6
Deepwater threatE
2
3
# species
1
3
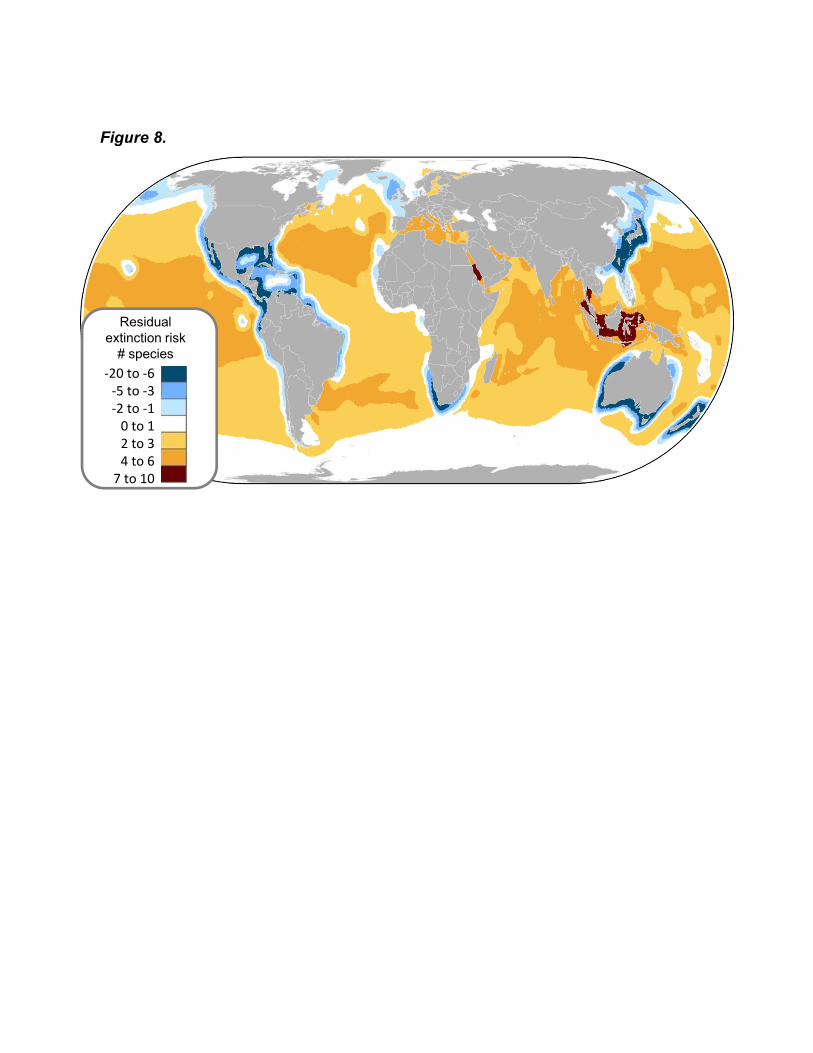
Figure 8Figure 8.
‐20 to ‐6‐5 to ‐3
Residual extinction risk
# species
‐2 to ‐10 to 12 to 34 to 6
7 to 10
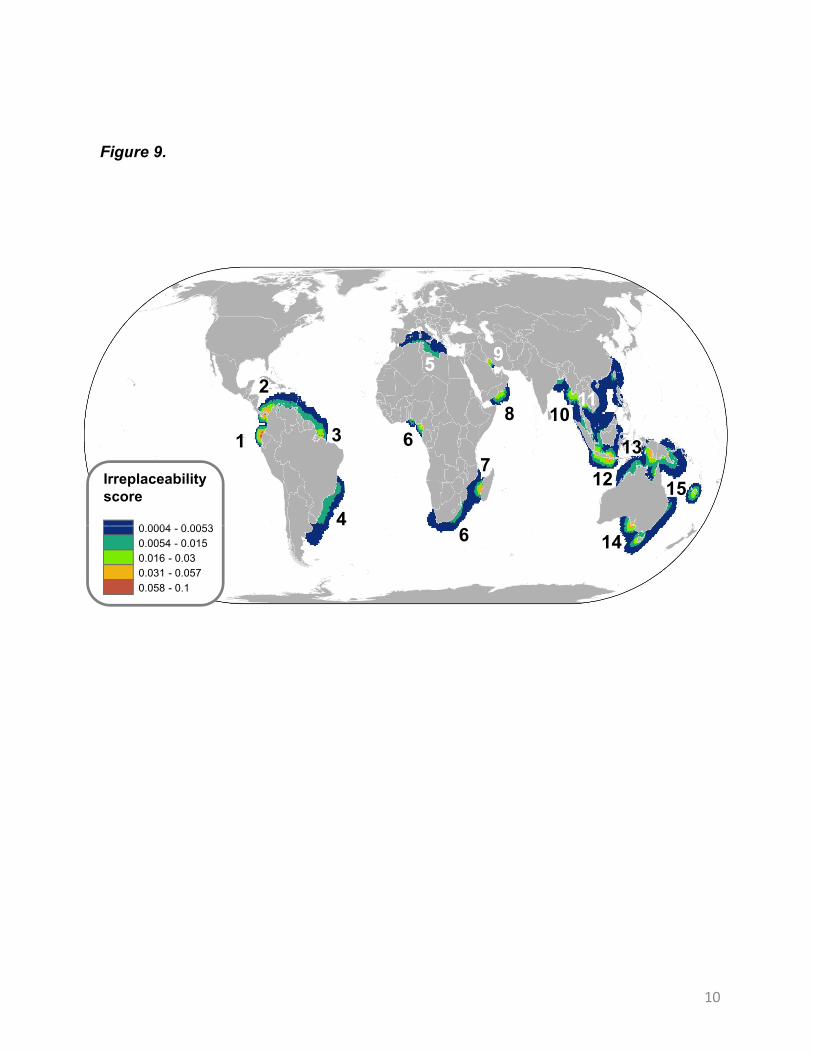
Figure 9.
255 99
11
Irreplaceabilityscore
0 0004 0 0053
1 3
4
68 10
11
12
13
157
0.0004 - 0.0053
0.0054 - 0.015
0.016 - 0.030.031 - 0.057
0.058 - 0.1
6 14
10
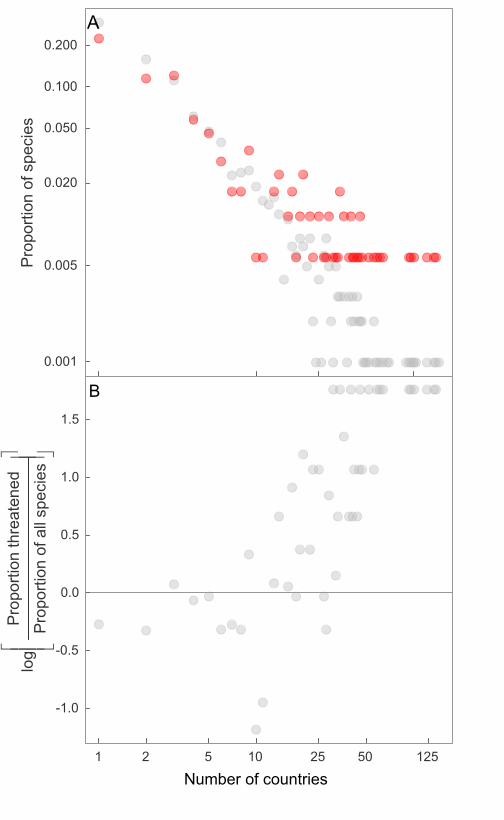
0.001
0.005
0.020
0.050
0.100
0.200
AP
ropo
rtio
n of
spe
cies
1 2 5 10 25 50 125
-1.0
-0.5
0.0
0.5
1.0
1.5
Number of countries
B
logé ëêêê
Pro
port
ion
thre
aten
ed
Pro
port
ion
of a
ll sp
ecie
s
ù ûúúú
Related Documents